BASE 04 Transmission Loss Measurement and Modelling
54
Defence R&D Canada – Atlantic DEFENCE DÉFENSE & BASE 04 Transmission Loss Measurement and Modelling C. Calnan xwave xwave 36 Solutions Drive Halifax, NS B3S 1N2 Project Manager: C. Calnan, 495-2000 Contract Number: W7707-05-3094 Contract Scientific Authority: J. Theriault, 902-426-3100 ext 376 xwave Contract Number: 1010610 Contract Report DRDC Atlantic CR 2006-108 October 2006 Copy No. _____ Defence Research and Development Canada Recherche et développement pour la défense Canada
Transcript of BASE 04 Transmission Loss Measurement and Modelling

Defence R&D Canada – Atlantic
DEFENCE DÉFENSE&
BASE 04 Transmission Loss Measurement
and Modelling
C. Calnanxwave
xwave36 Solutions DriveHalifax, NS B3S 1N2
Project Manager: C. Calnan, 495-2000
Contract Number: W7707-05-3094
Contract Scientific Authority: J. Theriault, 902-426-3100 ext 376
xwave Contract Number: 1010610
Contract Report
DRDC Atlantic CR 2006-108
October 2006
Copy No. _____
Defence Research andDevelopment Canada
Recherche et développementpour la défense Canada

This page intentionally left blank.
BASE 04 Transmission Loss Measurement and Modelling
C. Calnan xwave xwave 36 Solutions Drive Halifax, NS B3S 1N2 Project Manager: C. Calnan, 495-2000
Contract Number: W7707-05-3094
Contract Scientific Authority: J. Theriault 902-426-3100 ext 376
xwave Contract Number: 1010610
Defence R&D Canada - Atlantic Contract Report DRDC Atlantic CR 2006-108 October 2006
DRDC Atlantic CR 2006-108 i
Abstract A previous contract resulted in the addition of the ray theory program Bellhop to the reverberation inversion program BREVER. This was done to allow inversion of reverberation results calculated from acoustic data recorded during the BASE 04 trials. However tests with Bellhop using parameters from the BASE 04 site indicated shortcomings in that program. The current contract began with test runs of CASS, a potential Bellhop replacement for reverberation inversions. The test results indicated that CASS would work properly for the analysis area. Accordingly, BREVER was enhanced to allow it to also use CASS, and reverberation inversion was performed. The inversion results were used to model transmission loss, and these modelled values were compared to transmission loss data calculated from measured data. Because of this contract the BREVER User’s Guide was expanded to describe the use of the CASS-enabled version of the program.
Résumé Dans le cadre d'un contrat antérieur, le programme de théorie des rayons Bellhop a été ajouté au programme d'inversion des réverbérations BREVER. Cet ajout avait pour but de permettre l'inversion des résultats de réverbérations établis à partir des données acoustiques enregistrées durant les essais BASE 04. Les essais effectués avec Bellhop à partir des paramètres de l'emplacement BASE 04 ont toutefois fait ressortir des lacunes de ce programme. La mise en application du contrat actuel a commencé par des essais de CASS, solution possible de remplacement de Bellhop pour les inversions de réverbérations. Les résultats de ces essais ont indiqué que CASS fonctionnerait correctement pour l'analyse. Le programme BREVER a donc été adapté afin de pouvoir aussi utiliser CASS, et l'inversion des réverbérations a été exécutée. Les résultats de l'inversion ont servi à modéliser l'affaiblissement de transmission, et les valeurs modélisées ont été comparées aux données d'affaiblissement de transmission établies à partir des données mesurées. À la suite de ce contrat, on a complété le guide de l'utilisateur de BREVER en décrivant l'utilisation de la version du programme faisant appel à CASS.

ii DRDC Atlantic CR 2006-108
This page intentionally left blank.

DRDC Atlantic CR 2006-108 iii
Executive Summary Introduction The SWAMI suite of programs in use at DRDC Atlantic enables a user to produce modelled reverberation time series data based on a series of input parameters that describe the acoustic parameters of an area of a seabed. The modelled data can be compared to recorded reverberation data and a quantitative measurement can be made that essentially tests the goodness of fit of the modelled data to the measured values. A previous contract resulted in the addition of the ray theory program Bellhop to the reverberation inversion program BREVER. This was done to allow inversion of reverberation results calculated from acoustic data recorded during the BASE 04 trials. However tests with Bellhop using parameters from the BASE 04 site indicated shortcomings in that program. Results The current contract began with tests runs of CASS, a potential Bellhop replacement for reverberation inversions. The test results indicated that CASS would work properly for the analysis area. Accordingly, BREVER was enhanced to allow it to also use CASS, and reverberation inversion was performed. The inversion results were used to model transmission loss, and these modelled values were compared to transmission loss data calculated from measured data. Significance This effort lends itself to two particular applications. The first is Rapid Environmental Assessment (REA) using “through-the-sensor” techniques. The methodology extracts geoacoustic parameters from reverberation time series, one of the many goals of REA. The second application is in the development of Tactical Decision Aids (TDA). Real-time sonar performance estimation using in-situ measurements would provide the sonar operator with the capability to better employ the sensor. Future plans An effort to invert a larger reverberation data set measured by DRDC Atlantic’s Towed Integrated Active-Passive Sonar (TIAPS) is underway. Furthermore, a new energy function will be developed which will be less sensitive to errors in system calibration.
Calnan, C. 2006. BASE 04 Transmission Loss Measurement and Modelling, DRDC Atlantic CR 2006-108. Defence R&D Canada – Atlantic.

iv DRDC Atlantic CR 2006-108
Sommaire Introduction La suite de programmes SWAMI utilisée à RDDC Atlantique permet à un utilisateur de produire des données modélisées de séries temporelles de réverbérations basées sur une série de paramètres d'entrée décrivant les paramètres acoustiques d'une zone du fond marin. Les données modélisées peuvent être comparées aux données de réverbérations enregistrées, et une mesure quantitative peut être effectuée pour évaluer essentiellement la qualité de l'ajustement des données modélisées aux valeurs mesurées. Dans le cadre d'un contrat antérieur, le programme de théorie des rayons Bellhop a été ajouté au programme d'inversion des réverbérations BREVER. Cet ajout avait pour but de permettre l'inversion des résultats de réverbérations établis à partir des données acoustiques enregistrées durant les essais BASE 04. Les essais effectués avec Bellhop à partir des paramètres de l'emplacement BASE 04 ont toutefois fait ressortir des lacunes de ce programme. Résultats La mise en application du contrat actuel a commencé par des essais de CASS, solution possible de remplacement de Bellhop pour les inversions de réverbérations. Les résultats de ces essais ont indiqué que CASS fonctionnerait correctement pour l'analyse. Le programme BREVER a donc été adapté afin de pouvoir aussi utiliser CASS, et l'inversion des réverbérations a été exécutée. Les résultats de l'inversion ont servi à modéliser l'affaiblissement de transmission, et les valeurs modélisées ont été comparées aux données d'affaiblissement de transmission établies à partir des données mesurées. Portée Ces travaux se prêtent à deux applications particulières. La première est celle de l'analyse environnementale rapide (REA) au moyen de techniques de détection. Cette méthode consiste à extraire des paramètres géoacoustiques des séries temporelles de réverbérations, soit l'un des nombreux objectifs de la REA. La seconde application a trait au développement d'aides à la prise de décisions tactiques (TDA). L'évaluation en temps réel du rendement d'un sonar à partir de mesures sur place permettrait à l'opérateur du sonar de faire un meilleur usage du détecteur. Recherches futures Des travaux en cours visent à inverser un plus vaste ensemble de données de réverbérations, mesurées au moyen du sonar actif-passif intégré remorqué (TIAPS) de RDDC Atlantique. Par ailleurs, on mettra au point une nouvelle fonction relative à l'énergie, qui sera moins sensible aux erreurs d'étalonnage du système.
Calnan, C. 2006. BASE 04 Transmission Loss Measurement and Modelling (Mesure et modélisation de l'affaiblissement de transmission de BASE 04) RDDC Atlantique CR 2006-108. R & D pour la défense Canada – Atlantique.

DRDC Atlantic CR 2006-108 v
Table of Contents
Abstract........................................................................................................................................ i
Résumé ........................................................................................................................................ i
Executive Summary................................................................................................................... iii
Sommaire................................................................................................................................... iv
Table of Contents ....................................................................................................................... v
List of Tables............................................................................................................................ vii
List of Figures.......................................................................................................................... viii
List of Listings........................................................................................................................... ix
1. Introduction ................................................................................................................... 1
2. BREVER Expansion ..................................................................................................... 2 2.1 New Program ER_CONV ................................................................................ 3
3. Inversion Run Parameters.............................................................................................. 4 3.1 Fixed Input Parameters..................................................................................... 4 3.2 Varying Input Parameters................................................................................. 8 3.3 Parameters Solved For...................................................................................... 9
4. Reverberation Results.................................................................................................. 10
5. Transmission Loss Modelling ..................................................................................... 12
6. Transmission Loss Results .......................................................................................... 15
7. Conclusions and Discussion ........................................................................................ 18
8. Program File Locations ............................................................................................... 19
Appendix .................................................................................................................................. 21 A.1 Run 4 Main BREVER Output File ................................................................. 21

vi DRDC Atlantic CR 2006-108
A.2 Run 5 Main BREVER Output File ................................................................. 25 A.3 Run 7 Main BREVER Output File ................................................................. 29
Bibliography ............................................................................................................................. 33
Initialisms and Acronyms......................................................................................................... 34
Distribution List........................................................................................................................ 35

DRDC Atlantic CR 2006-108 vii
List of Tables
Table 1. Hard-Coded CASS Parameters................................................................................... 2
Table 2. Ping/DASM Parameters .............................................................................................. 5
Table 3. Ping Source Parameters ............................................................................................... 5
Table 4. Study Angles ............................................................................................................... 5
Table 5. Fixed BREVER Parameters........................................................................................ 8
Table 6. Varying BREVER Parameters.................................................................................... 9
Table 7. Contents of an INTEGRATE Input File ................................................................... 13
viii DRDC Atlantic CR 2006-108
List of Figures
Figure 1. Bathymetry Profiles along Selected Radials .............................................................. 6
Figure 2. Sound Speed Profile................................................................................................... 7
Figure 3. Beam 1 – 057.6º T.................................................................................................... 10
Figure 4. Beam 2 – 090.8º T.................................................................................................... 10
Figure 5. Beam 3 – 119.8º T.................................................................................................... 10
Figure 6. Beam 4 – 276.2º T.................................................................................................... 10
Figure 7. Beam 5 – 305.2º T.................................................................................................... 11
Figure 8. Beam 6 – 338.4º T.................................................................................................... 11
Figure 9. Run 4 Transmission Loss Results ............................................................................ 15
Figure 10. Run 5 Transmission Loss Results .......................................................................... 16
Figure 11. Run 7 Transmission Loss Results .......................................................................... 16

DRDC Atlantic CR 2006-108 ix
List of Listings
Listing 1. EXCESS1 Input File.............................................................................................. 13
Listing 2. Target Description File............................................................................................ 14
Listing 3. Run 4 Main BREVER Output File ......................................................................... 21
Listing 4. Run 5 Main BREVER Output File ......................................................................... 25
Listing 5. Run 7 Main BREVER Output File ......................................................................... 29

x DRDC Atlantic CR 2006-108
This page intentionally left blank.

DRDC Atlantic CR 2006-046 1
1. Introduction
Contractor Report [1] describes the expansion of the reverberation inversion program BREVER to allow it to use the ray theory program Bellhop. More importantly as it relates to the current report, Section 5 of that report describes how Bellhop could not operate properly under the conditions of the BASE 04 trial area. Following that discovery, the program CASS was tested and found to run correctly under the oceanographic conditions that exposed Bellhop deficiencies. (CASS – Comprehensive Acoustic System Simulation – is used at DRDC Atlantic by permission of its owner, the U.S. Navy’s Undersea Warfare Research Center.) The reverberation inversion program BREVER [2] was then modified so it could use CASS, and inversions were performed based on reverberation data obtained by analysing a particular ping. The results of the reverberation inversion were geoacoustic parameters that provided a “best fit” of modelled reverberation results to the data produced by analysis. These inverted geoacoustic parameter values were used to produce modelled transmission loss data, which were then compared to transmission loss results calculated from measured data. Besides common English typographic conventions, the following conventions are used in this document:
- bold text is used for filenames (e.g. test.pro or /local/files/test.pro) - bold italics text is used for directories (e.g. /usr/tmp) - italics text is used for computer and program suite names (e.g. Tessie and
DMOS) - Bold Arial text is used to indicate program names (e.g. BREVER, Bellhop) - Arial text is used to indicate function and subroutine names (e.g. PPR_SETUP) - italic Arial text is used for variables’ names in computer programs or associated
with operating systems (e.g. IDL_PATH) - Courier text is used for text to be typed on the keyboard, code or file
listings, etc. (e.g. enter “idl”)

2 DRDC Atlantic CR 2006-108
2. BREVER Expansion
The requirement to use CASS as an alternative to the DMOS programs PMODES and Bellhop as BREVER’s transmission loss model resulted in modifications to BREVER. And because CASS’s operation was appreciably different from that of both PMODES and Bellhop, a fair amount of the BREVER code had to be rewritten so as to produce CASS input files of the appropriate format and contents. While the code modification was underway, the reverberation analysis results produced by MDA (MacDonald, Dettwiler & Associates Ltd.) personnel became available and were closely examined. It was immediately realized that many, if not all, of the reverberations from the six beams were limited by background noise. This resulted in the decision to further modify BREVER to allow it either solve for an individual background noise for each beam, make use of a user-provided background noise for each beam, or solve for some and use provided values for others. This decision resulted in even more code modifications. In reality the background noise along a beam is a combination of the effects from self noise within the recording hydrophones and environmental noise external to the devices, a combination that may be highly directional. For data analysis purposes, however, the sources of individual components of the noise and their magnitudes are irrelevant and only the sum of the noise in the beams’ directions is important. Because these noises are of importance in each beam’s direction, they are referred to in the BREVER user’s guide [2] and this report as “beam noise.” A number of CASS input options were hard-coded into BREVER. These options were decided upon as being most likely to produce the best results for the cases under which BREVER would be running. The following table lists the options and their values exactly as entered in the CASS input file.
Table 1. Hard-Coded CASS Parameters
CASS Parameter Parameter Value EIGENRAY MODEL GRAB INTERPOLATION ORDER LINEAR RAY MODEL TWO-DIMENSIONAL COHERENCE RANDOM SEA STATE-WIND SPEED CONVERSION NAVOCEANO BOTTOM REFLECTION COEFFICIENT MODEL RAYLEIGH VOLUME ATTENUATION MODEL THORP OCEAN SOUND SPEED MODEL LINEAR BOTTOM SCATTERING STRENGTH MODEL MACKENZIE SURFACE REFLECTION COEFFICIENT MODEL BECHMANN
DRDC Atlantic CR 2006-108 3
2.1 New Program ER_CONV BREVER runs CASS in such a way that it produces eigenray files. These files must be converted to DMOS eigenray format before subsequent programs (MONOGO and EXCESS1, for example) can make use of them. The Fortran 90/95 program ER_CONV (for eigenray conversion) was written to perform this task. The intent for this program is that it will eventually contain code to convert eigenray files (or files containing data that may be easily converted to eigenray files) from any number of sources from one format to another. At present ER_CONV can only convert CASS eigenray files to DMOS format, but the program was written to allow easy expansion as required. BREVER’s CASS-related modifications cause it to:
• create the input files needed by CASS, • run CASS, • create the input files needed by ER_CONV, and • run ER_CONV.
Following the creation of DMOS format eigenray files by ER_CONV, processing continues as it did before.
4 DRDC Atlantic CR 2006-108
3. Inversion Run Parameters
Once the data and the CASS and beam noise enabled version of BREVER was in place a number of reverberation inversion runs were made. The majority of the parameters involved with the inversion runs were identical, but a couple of the parameters were changed for each run. Seven BREVER runs were made in all, but only three provided results quoted in this report: runs 4, 5, and 7. The other runs were either test runs, used incorrect data, or used data determined not to provide optimal results. In this report the runs will be referred to by their numbers as mentioned above and as used on Spray and Pinta, the computers used for the analyses. It would have been simpler to call the runs described in this report 1, 2, and 3, but by keeping the original run numbers it is simpler to locate the data files on the computers used. On these machines the analyses were run in the directory ~calnan/projects/anal-1 (for analysis 1; there turned out not to be a second set of analyses). Input files and results were put into subdirectories off this named run1, run2, etc. In general input files were created on Pinta, analyses performed on the faster computer Spray, and results were later copied to Pinta. The run1, run2, ... subdirectories often have subdirectories themselves named rev and tl. The former hold reverberation related files and the latter contain transmission loss data files.
3.1 Fixed Input Parameters The parameters that are fixed on all inversion runs come under several categories:
• ping parameters, which are defined by the time and location that the ping was emitted and recorded;
• analysis choices pertaining to directions of interest; and • inversion analysis parameters.
After examining the data recorded on June 1, 2004, MDA personnel identified a ping that was to be isolated and studied, and obtained the time it was emitted. This ping was produced by the VP2 and recorded by DASM (Directional Acoustic Sensor Module), both of which were towed by the Quest. The DASM NADAS data, recorded every minute, were examined to locate the position and velocity data that bracketed the ping’s time. Linear interpolation was performed on the bracketing data to obtain the DASM’s position, heading, and speed at the ping time. These values, along with DASM-specific parameters, are presented in the following table.

DRDC Atlantic CR 2006-108 5
Table 2. Ping/DASM Parameters
Ping/DASM Parameter Value Date/Time 2004-06-01 12:26:40.092 Location 36° 18.317’ N, 14° 43.154’ E Heading 018.0° True Speed 2.5 m/s Depth 66 m
Weighting Square Tilt 0 deg
Number of Receivers 94 Receiver Spacing 0.5 m
Weighting Parameter 1.0 Floor -30 dB
Detection Threshold -2.0 System Loss 3.0
The VP2 sound source was assumed to be in the same physical environment as the DASM. The parameters associated with the source are presented in the following table.
Table 3. Ping Source Parameters
Ping Source Parameter Value Source level 217 dB
Ping Frequency 1125 Hz Bandwidth 50 Hz
Ping Length 1.5 s Pulse Type LFM
Based on the bathymetry of the area and the locations of potential targets, six directions were selected for study. These directions are listed in the following table, and it should be noted that the last three directions are mirror angles of the first three based on the heading of 018.0° True.
Table 4. Study Angles
Angle Number Angle Bearing 1 057.6° T 2 090.8° T 3 119.8° T 4 276.2° T 5 305.2° T 6 338.4° T
6 DRDC Atlantic CR 2006-108
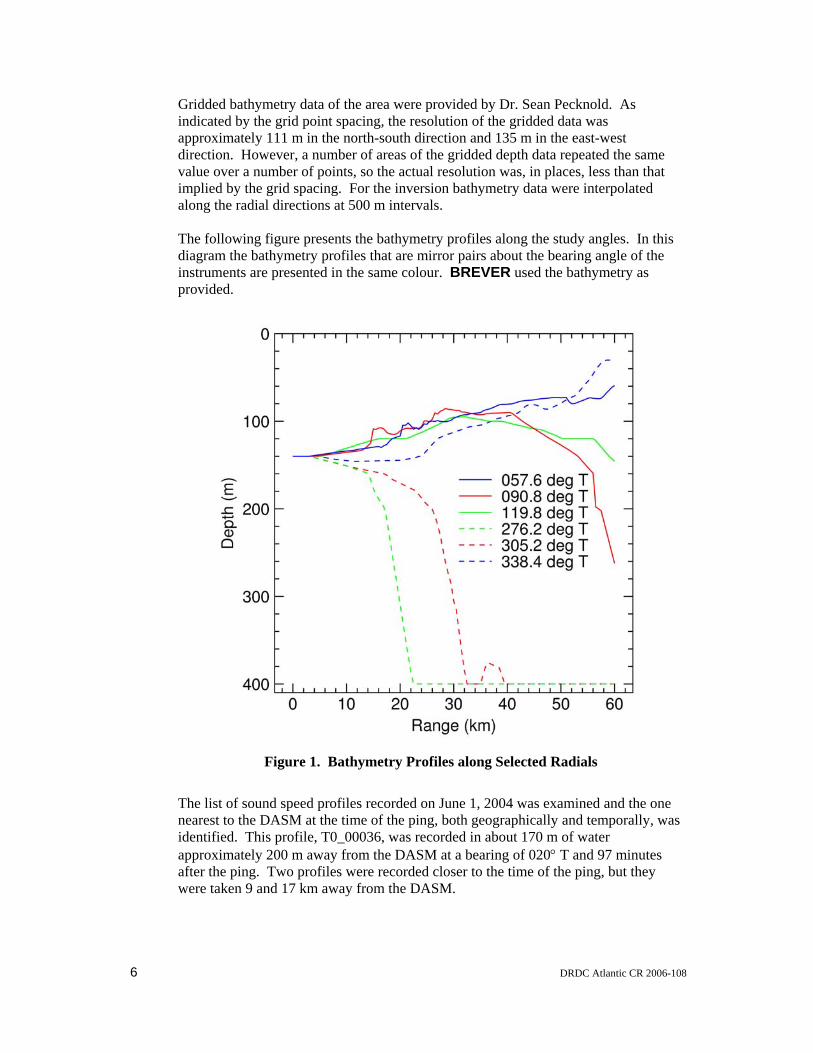
Gridded bathymetry data of the area were provided by Dr. Sean Pecknold. As indicated by the grid point spacing, the resolution of the gridded data was approximately 111 m in the north-south direction and 135 m in the east-west direction. However, a number of areas of the gridded depth data repeated the same value over a number of points, so the actual resolution was, in places, less than that implied by the grid spacing. For the inversion bathymetry data were interpolated along the radial directions at 500 m intervals. The following figure presents the bathymetry profiles along the study angles. In this diagram the bathymetry profiles that are mirror pairs about the bearing angle of the instruments are presented in the same colour. BREVER used the bathymetry as provided.
Figure 1. Bathymetry Profiles along Selected Radials
The list of sound speed profiles recorded on June 1, 2004 was examined and the one nearest to the DASM at the time of the ping, both geographically and temporally, was identified. This profile, T0_00036, was recorded in about 170 m of water approximately 200 m away from the DASM at a bearing of 020° T and 97 minutes after the ping. Two profiles were recorded closer to the time of the ping, but they were taken 9 and 17 km away from the DASM.

DRDC Atlantic CR 2006-108 7
A subset of 20 values was extracted from T0_00036 to provide the sound speed profile to be used in modelling. This subset contained data located at the points where the sound speed changed, ignoring the ranges where the sound speed changed in linearly. The profile data are displayed in the following figure with the extracted points used in the inversion displayed as small dark blue squares. Also presented in the figure is the depth of the transmitter and receiver. To provide for sound speed data at depths greater than 170 m, a data point specifying 1516.5 m/s at 400 m was added to the profile. This value was extrapolated from the recorded data.
Figure 2. Sound Speed Profile
The bathymetry and sound speed profiles were used as input to CASS in order to produce a set of eigenrays for each radial. Portions of all of the above data were used by MDA’s personnel to analyse the recorded data and provide a reverberation time series at a data rate of 4096 Hz. These data were averaged over half-second intervals centred on the second and half-second

8 DRDC Atlantic CR 2006-108
to provide a 2 Hz data set. This averaged time series was created to be the measured data set that BREVER would use for comparison with test data. The final set of fixed parameters is the set of parameters put into BREVER’s input file and left unchanged for all the inversion runs. The following table lists these data, following which are comments on why some of these values were chosen.
Table 5. Fixed BREVER Parameters
Parameter Value ASSA Parameters: T0 Tfact Ntemp NPERT NDHS NAVE NPERTM PVC PVCmult SSA Conv DHS Conv Rev Wt Slope Wt
1.0 0.99 200 5 70 20000 5 1 3.0 0.01 1.0E-4 1.0 0.05
Minimum range step size and delta (km) 0.1 0.05 Eigenray angle range and step size -30º to +30º by 0.05º Wind speed (kt) 7.5 Maximum number of bottom bounces 50 The numbers of temperature and downhill simplex quenching loops (“Ntemp” and “NDHS”) were set, respectively, to 200 and 70. Normally these values are set appreciably larger, for example to 1500 and 500, but the amount of time required for an inversion run is much larger when CASS is used over the other transmission loss models. Therefore, in order to have BREVER complete its runs in reasonable periods of time these numbers were set lower than normal. Despite reducing the size of the loop runs, several inversion runs took over two days to complete. Two other parameters with values are those of the reverberation and reverberation slope weights (“Rev Wt” and “Slope Wt”). The relative values define if the inversion is more sensitive to the magnitude (Rev Wt) or the decay rate (Slope Wt) of the reverberation model-data differences. This feature must be used with caution. If ambient noise is included (as in the BASE ’04 data), the constant level may dominate the time series and result in a meaningless geoacoustic parameterization.
3.2 Varying Input Parameters Other parameters were varied between the three runs in order to see what would happen. The following table shows how the timing and radial parameters were changed from run to run.

DRDC Atlantic CR 2006-108 9
Table 6. Varying BREVER Parameters
Parameter Run 4 Run 5 Run 7 Minimum and maximum time (s) 4 and 39 2 and10 4 and 39
Radial length (km) 30 8 30 Points per radial 11 17 11
Dist between radial points (km) 3.0 0.5 3.0 Beam Noise Solved for Solved for Fixed
Run 4 was set up with timing and distance (as given via radial length) parameters set to match the timing/distance limits of the reverberation results produced by other personnel. An examination of the Run 4 results indicated that the inversion results did not provide a very good fit to the measured data at small times. Consequently, Run 5 was devised to see if using shorter distances between radial points and a maximum time closer to zero would give a better fit for that portion of the data. Run 7 was set up to mimic Run 4 with one important difference: whereas Run 4 solved for beam noise, estimates for these data were read off the plots of measured reverberation and were used as provided. This reduced the number of parameters that BREVER had to solve for and ensured that at least the background of the calculated reverberation would be realistic.
3.3 Parameters Solved For The BREVER runs were set up to always solve for:
• bottom density • bottom sound speed ratio, and • bottom scattering strength.
In addition some runs also solved for beam noise. Of the runs described in this report, Runs 4 and 5 solved for beam noise and Run 7 used fixed beam noise values as input.

10 DRDC Atlantic CR 2006-108
4. Reverberation Results
There are six figures in this section, with each presenting data related to one of the directions of interest, also known as beam angles. The figures display four curves each: the measured reverberation data for the beam along each direction and the inverted Run 4, 5, and 7 reverberations along the same bearings.
Figure 3. Beam 1 – 057.6º T
Figure 4. Beam 2 – 090.8º T
Figure 5. Beam 3 – 119.8º T
Figure 6. Beam 4 – 276.2º T

DRDC Atlantic CR 2006-108 11
Figure 7. Beam 5 – 305.2º T
Figure 8. Beam 6 – 338.4º T
In all figures the shorter duration of the Run 5 inversion is apparent, as is the fact that it produces a better fit to the first 10 seconds of the measured data. As well, Run 7, calculated with beam noise data assigned values read off the measured data curves, resulted in a curve that generally fits the measured data somewhat better than Run 4, which solved for the beam noise. The longer duration runs, 4 and 7, do not match the measured data very well at times up to about 7 seconds, the time range over which the measured results have the greatest drop in reverberation. The reason for this is not known, although some possibilities are:
• the models used in the inversion may simply be unable to model this type of behaviour, regardless of input values,
• the timestep size of 0.5 s may be too large to allow the model to reach a better fit, or, more likely,
• the range step size being used in the inversion may be too large. The latter two possibilities could be tested, either alone or in combination, but the inversion runs would take appreciable time to complete, time that is beyond what is available to the contract at this point.

12 DRDC Atlantic CR 2006-108
5. Transmission Loss Modelling
This section describes how BREVER results were used to model transmission loss. For this data analysis the BREVER runs were made using a directional transmitter and receiver, but the transmission loss files were to be made with omnidirectional equipment. In each run’s subdirectory (e.g. run4) the subdirectory tl was created. All files needed to create the run’s transmission loss data were moved into these directories and all processing was performed in them. The steps that were taken to produce the desired data are as follows.
1. The program INTEGRATE had to be run in order to produce new .sys files, and the first step was to run that program. The INTEGRATE input file was edited to change the transmitter and receiver types to omnidirectional (i.e. Omni.tx and Omni.rx), but the program was allowed to use the same radials file. Using a main input file named integrate.input, INTEGRATE was run with the command:
INTEGRATE < integrate.input > integrate.log
2. CASS had to be run to create new eigenray files. This was necessary because when being run by BREVER, CASS created eigenray files for the seabed, but to produce transmission loss data eigenrays are needed for the target depth. This depth was set ~5 metres off the source depth. In the current case the source was at 66 m, so a target depth of 60 m was chosen. The other files needed by CASS are the bathymetry, BAT*, and BTM* files, all of which contain the correct data at the end of a BREVER run as made during this analysis. However before making the run the file cass_in.DAT had to be edited. The lines that read “TARGET DEPTH = BOTTOM” were changed to contain “TARGET DEPTH = 60 M”. There was one such line per radial. CASS only had to be run once to create eigenray files for all the radials, and this was done via the command:
CASS < cass.in > cass.log
3. ER_CONV had to be run once for each radial in order to convert the CASS eigenray file to DMOS format. There are two main input files for ER_CONV for each radial. The first is

DRDC Atlantic CR 2006-108 13
erc_in.NN (where NN is the radial number) and it simply contains the name of the other main input file. That second file is erc_in.NN-pars, and it contains the parameter data needed by the program. Both files were copied from the BREVER run, which created them when it ran. All filenames were maintained so the files were used as is with one change: erc_in.NN-pars had its last line changed so that the target depth was changed from the default of 0.0 m to the actual target depth of 60. The program was run once for each radial, and the command to run it for radial 2 is:
ER_CONV < erc_in.02 > ER_CONV_02.log
4. Transmission loss files were then created by running EXCESS1 for each radial. This program needed a new main input file, which was created in a text editor. The following is the sample file excess1_r04.input created for radial 4 during Run 5, and it is followed by a listing of its contents by data line.
Listing 1. EXCESS1 Input File
BASE 04 - Run 5 LT !2 options: Long output and tl BR5_2762.des !3 Input Environ. Description BR5_2762.sys !4 Input System File Target.des !5 Input Target File BR5_2762.tls !6 Output TL File 0.5 !7 Range Minimum (km) 0.5 !8 Range Increment (km) 80 !9 Number of Range Points 276.2 !10 Sub-radial Minimum (deg) 0. !11 Sub-radial Increment (deg) 1 !12 Number of Radial Points
Table 7. Contents of an INTEGRATE Input File
Data Line Contents
1 Title (Generally ignored. 2 The necessary options
3-6 The names of the appropriate input and output files. 7-9 Sets the number of points along the radial and their spacing. 10 The bearing of the radial.
11-12 Should be zero and one, unless something more sophisticated than the transmission loss along a specific bearing is desired.
The input file specified the target description file Target.des, which was also created in a text editor. The following listing presents the file that was used. Line 1 is a title and the rest is self-descriptive.

14 DRDC Atlantic CR 2006-108
Listing 2. Target Description File
Example target 10 ! Target strength (dB) 1 ! No. target depths 60 ! Target depth (m)
An EXCESS1 run also requires the presence of:
• the .des files, as named on data line 3 of the EXCESS1 input file • the bottom bathymetry files named in the main BREVER input file, and • the sound speed profile file named in the main BREVER input file.
The EXCESS1 run for the above input file was initiated with the following command:
EXCESS1 < excess1_r04.input > excess1_r04.log Once EXCESS1 had been run for all of the radials, a SAPLOT input file was created for the run using data from the transmission loss files named in data line 6 of the EXCESS1 main input files. These files resulted in curves plotting the transmission loss for all radials. The following section describes other data that were added to the SAPLOT files and presents the resulting plots.

DRDC Atlantic CR 2006-108 15
6. Transmission Loss Results
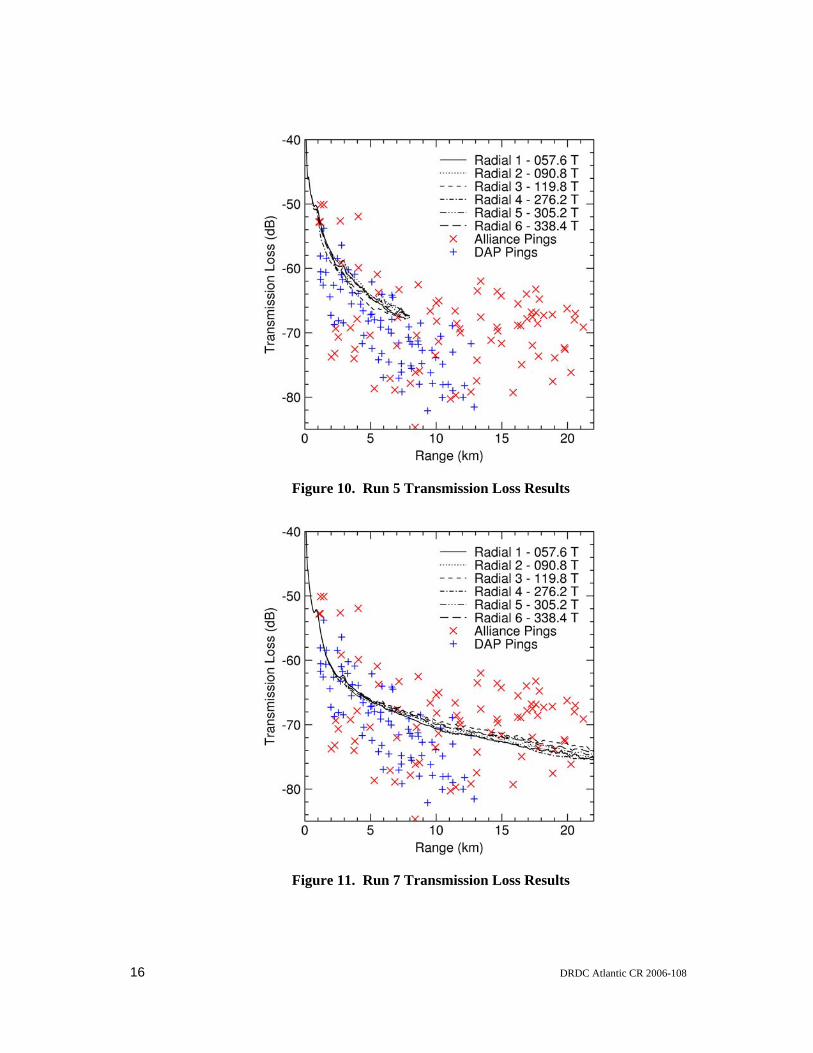
This section contains one figure for each of the three inversion runs described in this report. They present the results of transmission loss modelling, as is described in the previous section, as a series of curves, one for each radial. The plots also contain actual transmission loss data calculated by Dr. Sean Pecknold from data recorded during the period around the time of the ping used. He documents the production of these transmission loss data points in [3]. There are two sources of the data analysed by Dr. Pecknold and each has its own symbol. The first series of pings were produced by equipment being towed by the research vessel Alliance. The setup of the trial involved having the Quest and the Alliance travelling towards each other, passing, and continuing in a straight line. All bypasses occurred near the centre of a petal-shaped pattern. The second set of pings was produced by the DAP (Drifting Acoustic Projector). This device was free-floating near the centre of the petal-shaped pattern that both the Alliance and the Quest were crossing in opposite directions. It must be pointed out that the Alliance and DAP data points each represent one ping while the lines produced by EXCESS1 are based on reverberation data derived from one ping that was produced by another instrument. The Alliance and DAP transmission loss data points are the same in the three figures in this section.
Figure 9. Run 4 Transmission Loss Results
16 DRDC Atlantic CR 2006-108
Figure 10. Run 5 Transmission Loss Results
Figure 11. Run 7 Transmission Loss Results

DRDC Atlantic CR 2006-108 17
The shorter radial length used in Run 4 is apparent in the plot of data from that inversion run. The other two runs were made out to 30 seconds, but the plots were clipped at 22 seconds since no observed values went past that time. A few features can be determined from comparing the transmission loss plots.
• In all cases the modelled data are within the spread of the measured data. • The spread of the Run 4 and 5 curves for the different radials is greater than
that from Run 7. • The Run 7 transmission losses are slightly lower than those of Run 4.
18 DRDC Atlantic CR 2006-108
7. Conclusions and Discussion
The reverberation inversion results of the different runs produce reverberation data that follow the trend of the measured data to varying degrees. It is quite possible that using a higher number of points along the radials would provide a better fitting set of results, but this test was not made because of time limitations. The main drop-off of measured data occurs at about seven seconds, which translates to a distance of about 5.3 km at a sound speed of 1515 m/s. Runs 4 and 7 used a 3 km radial point spacing, which would result in the first two points occurring before the drop-off and the rest of them occurring afterwards. This plateau effect may be difficult to model. The Run 5 case, which used a radial point spacing of 500 m, produced a better fit to the close range measured data, but it’s possible that an even shorter radial point interval would have resulted in a better fit. As well, in all cases the time interval given to MONOGO for calculating the reverberation was 0.5 s, which is roughly equivalent to a spacing of 380 m. It may be that matching time intervals to radial point separations (or vice versa) might produce a more coherent analysis setup and so better results. This parameter matching also was not tested, in part due to time limitations. The entire BREVER inversion process is directed towards to producing results that produce a fit to either measured reverberation data, the slope of these data, or a weighted combination of the two. Modelled transmission losses are calculated using geoacoustical parameter values obtained from the inversion, and as such are, in effect, completely independent of the inversion process. If it were possible to produce curves of transmission losses based on measured data, an analogue of BREVER could be created that performs an inversion that is directly based in transmission loss. This program, however, would not be attempting to fit modelled reverberation data to measured data, and so intermediate reverberation data would not be expected to fit measured reverberation data because none would be needed in this process. However, a further variant of BREVER could be written that calculates a cost function (basically a goodness of fit score) based on weighted sums of reverberation, reverberation slope, and transmission loss. In fact, any other relevant parameter that could have a bearing on the overall fit could be included in the overall cost function.

DRDC Atlantic CR 2006-108 19
8. Program File Locations
This section provides the locations of the main programs used in the course of this project. BREVER
The current version of the BREVER code is located on the computers Tessie, Spray, and Pinta in the directory ~calnan/IDL_code/BREVER. At the time of this writing BREVER consists of about 40 individual IDL routines. Users should be aware that a number of IDL functions in this directory have names that appear in other directories, read_dat_dat32.pro, for example. Some of these routines are identical but others are not. Initially the same routines were copied from directory to directory so that any given directory would contain everything it needs. This is still the case, but some of the routines have been edited according to the requirements of the main program they support. In the majority of cases the changes were enhancements rather than changes in functionality, but these changes occasionally necessitated altering the parameters passed to the functions. The ultimate intent is to have the contents of every same-name function identical regardless of where they appear, but this has not yet been done. The reason for this explanation is to warn users that if they copy BREVER’s code from the location appearing above, they should copy all the files in that directory and not just the ones that they don’t already have. The versions they may already have could have come from a different directory and so be different from the ones used by BREVER.
DMOS
The current versions of the DMOS executables are located on Spray and Pinta in the directory /home/local/models/dmos/bin, and on Tessie in the directory ~calnan/projects/RevInv/dmos/bin. On Tessie, however, the executables will be moved to /local/models/DMOS/bin once sufficient testing has been performed and the author and Scientific Authority are satisfied that DMOS is working properly. Most DMOS executables were produced by the GNU g77 compiler for Intel-based Linux, but if a user needs to compile the programs for a different platform the programs’ source code is located in directories near the executables, with each program’s code in a separate directory. The program BellhopDRDC_S is a Fortran 90/95 routine that may be compiled with the gfortran compiler.

20 DRDC Atlantic CR 2006-108
BellhopDMOS, however, must be compiled with g95 due to binary file format considerations. Speciation has also occurred with some source code files used by multiple DMOS programs, as it has in the IDL code and for the same reasons. Once again the intent is that ultimately the routines will be “rationalized,” but for now if a user copies the source code in order to produce a new executable, care must be taken to use only the code in that program’s subdirectory.
CASS and ER_CONV
A current executables of CASS and ER_CONV may be found on Tessie and Spray in ~calnan/bin and on Pinta in /home/local/models/dmos/bin; in all locations the CASS executable is named CASS. The Pinta location is more for convenience sake than anything else since CASS is not a member of DMOS. Tessie has version 4 of CASS but the other two locations have version 3.
SAPLOT
The current version of SAPLOT is on Tessie in /local/models/IDL-SAPLOT and on both Pinta and Spray in ~calnan/IDL_code/SAPLOT.
DRDC Atlantic CR 2006-108 21
Appendix
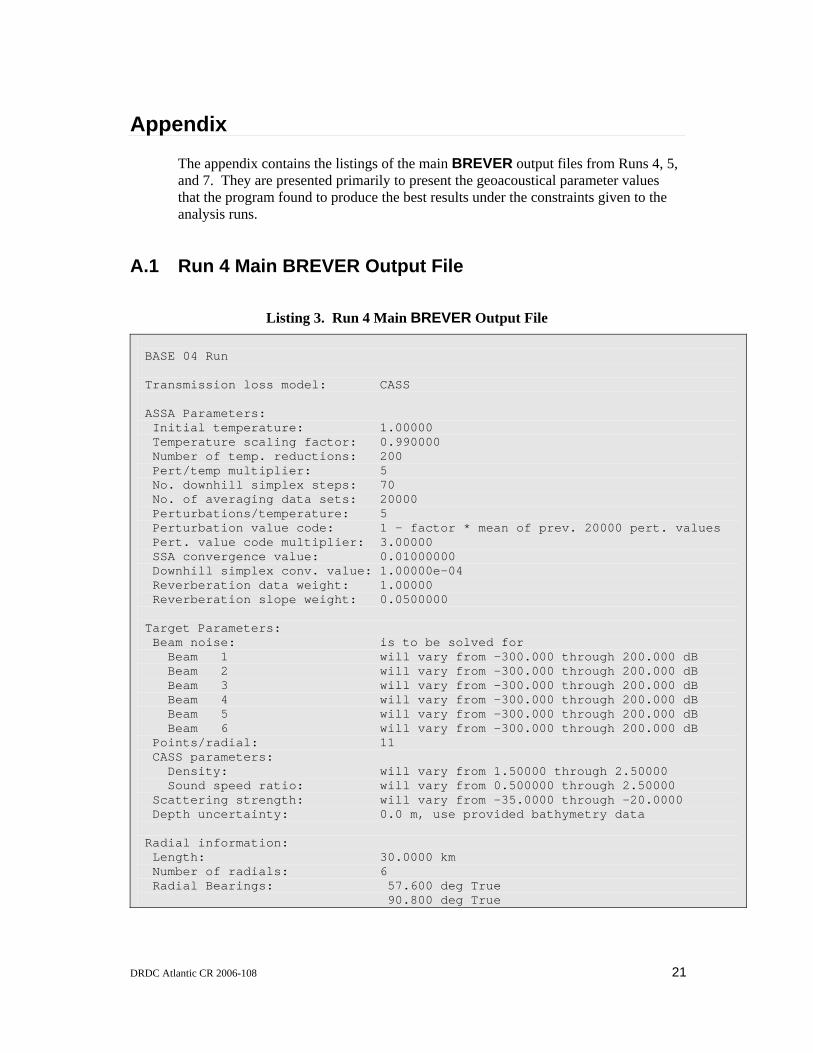
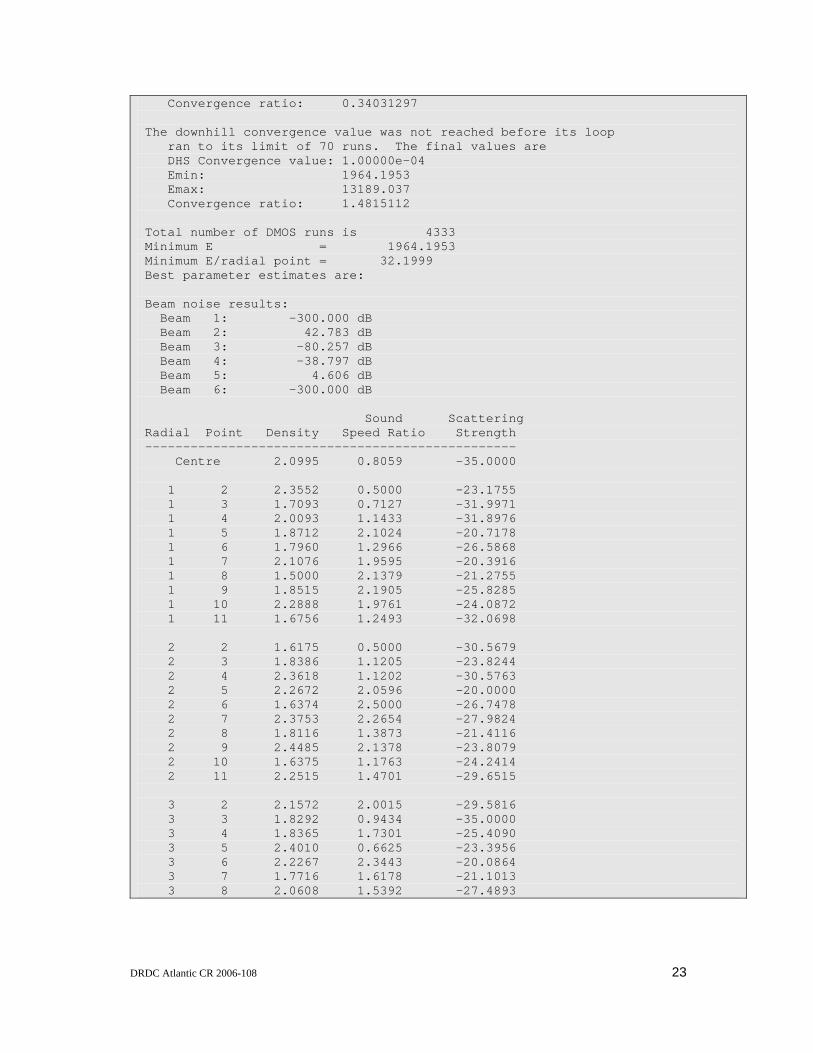
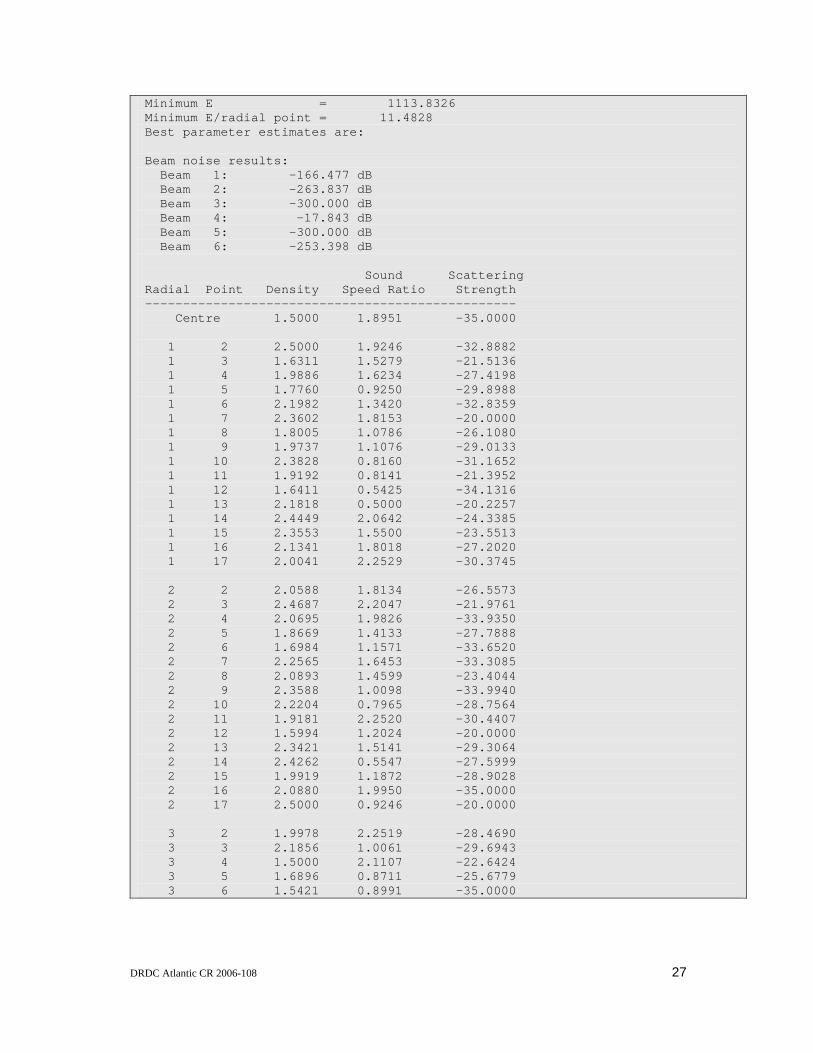
The appendix contains the listings of the main BREVER output files from Runs 4, 5, and 7. They are presented primarily to present the geoacoustical parameter values that the program found to produce the best results under the constraints given to the analysis runs.
A.1 Run 4 Main BREVER Output File
Listing 3. Run 4 Main BREVER Output File BASE 04 Run Transmission loss model: CASS ASSA Parameters: Initial temperature: 1.00000 Temperature scaling factor: 0.990000 Number of temp. reductions: 200 Pert/temp multiplier: 5 No. downhill simplex steps: 70 No. of averaging data sets: 20000 Perturbations/temperature: 5 Perturbation value code: 1 - factor * mean of prev. 20000 pert. values Pert. value code multiplier: 3.00000 SSA convergence value: 0.01000000 Downhill simplex conv. value: 1.00000e-04 Reverberation data weight: 1.00000 Reverberation slope weight: 0.0500000 Target Parameters: Beam noise: is to be solved for Beam 1 will vary from -300.000 through 200.000 dB Beam 2 will vary from -300.000 through 200.000 dB Beam 3 will vary from -300.000 through 200.000 dB Beam 4 will vary from -300.000 through 200.000 dB Beam 5 will vary from -300.000 through 200.000 dB Beam 6 will vary from -300.000 through 200.000 dB Points/radial: 11 CASS parameters: Density: will vary from 1.50000 through 2.50000 Sound speed ratio: will vary from 0.500000 through 2.50000 Scattering strength: will vary from -35.0000 through -20.0000 Depth uncertainty: 0.0 m, use provided bathymetry data Radial information: Length: 30.0000 km Number of radials: 6 Radial Bearings: 57.600 deg True 90.800 deg True

22 DRDC Atlantic CR 2006-108
119.800 deg True 276.200 deg True 305.200 deg True 338.400 deg True Source parameters: Latitude: 36.3053 N Longitude: 14.7192 E Depth: 66.0000 m Heading: 18.0000 deg True Speed: 2.50000 m/s Receiver Parameters: Latitude: 36.3053 N Longitude: 14.7192 E Depth: 66.0000 m Heading: 18.0000 deg True Wind Speed: 7.50000 kt DMOS program input filenames: INTEGRATE: integrate.input MONOGO: R4monogo_0576.input R4monogo_0908.input R4monogo_1198.input R4monogo_2762.input R4monogo_3052.input R4monogo_3384.input CMBRAD: cmbrad.input CASS Control Parameters: Minimum range: 0.100000 km Range step size: 0.0500000 km Start angle for rays: -30.0000 deg End angle for rays: 30.0000 deg Ray angle step size: 0.0500000 deg Max. no. of btm ray bouces: 50 Measured data filename: R4meas_dataB.rev No. of measured data values: 71 Reverberation data time parameters in seconds: Minimum time: 4.0000000 Maximum time: 39.000000 Time Increment size: 0.50000000 ************************************************************************** 11 points/radial 3.00000 km between radial points SSA convergence did not occur before the temperature loop ran to its limit of 200 runs. Final values are SSA convergence value: 0.01000000 Emin: 2175.6054 Emax: 3067.8058
DRDC Atlantic CR 2006-108 23
Convergence ratio: 0.34031297 The downhill convergence value was not reached before its loop ran to its limit of 70 runs. The final values are DHS Convergence value: 1.00000e-04 Emin: 1964.1953 Emax: 13189.037 Convergence ratio: 1.4815112 Total number of DMOS runs is 4333 Minimum E = 1964.1953 Minimum E/radial point = 32.1999 Best parameter estimates are: Beam noise results: Beam 1: -300.000 dB Beam 2: 42.783 dB Beam 3: -80.257 dB Beam 4: -38.797 dB Beam 5: 4.606 dB Beam 6: -300.000 dB Sound Scattering Radial Point Density Speed Ratio Strength ------------------------------------------------- Centre 2.0995 0.8059 -35.0000 1 2 2.3552 0.5000 -23.1755 1 3 1.7093 0.7127 -31.9971 1 4 2.0093 1.1433 -31.8976 1 5 1.8712 2.1024 -20.7178 1 6 1.7960 1.2966 -26.5868 1 7 2.1076 1.9595 -20.3916 1 8 1.5000 2.1379 -21.2755 1 9 1.8515 2.1905 -25.8285 1 10 2.2888 1.9761 -24.0872 1 11 1.6756 1.2493 -32.0698 2 2 1.6175 0.5000 -30.5679 2 3 1.8386 1.1205 -23.8244 2 4 2.3618 1.1202 -30.5763 2 5 2.2672 2.0596 -20.0000 2 6 1.6374 2.5000 -26.7478 2 7 2.3753 2.2654 -27.9824 2 8 1.8116 1.3873 -21.4116 2 9 2.4485 2.1378 -23.8079 2 10 1.6375 1.1763 -24.2414 2 11 2.2515 1.4701 -29.6515 3 2 2.1572 2.0015 -29.5816 3 3 1.8292 0.9434 -35.0000 3 4 1.8365 1.7301 -25.4090 3 5 2.4010 0.6625 -23.3956 3 6 2.2267 2.3443 -20.0864 3 7 1.7716 1.6178 -21.1013 3 8 2.0608 1.5392 -27.4893

24 DRDC Atlantic CR 2006-108
3 9 1.7701 2.3205 -26.3587 3 10 1.6984 1.7046 -23.9942 3 11 2.4651 1.5964 -29.9577 4 2 2.5000 0.9098 -27.6974 4 3 1.8314 0.6642 -33.0910 4 4 1.9959 2.0906 -26.3085 4 5 1.9936 1.8320 -29.5252 4 6 2.4228 1.1389 -24.6336 4 7 2.5000 2.0300 -35.0000 4 8 1.8255 0.5554 -22.2592 4 9 1.7139 0.7415 -21.2093 4 10 1.8281 2.5000 -31.2220 4 11 1.9529 2.1796 -28.2937 5 2 1.6139 1.6818 -33.3726 5 3 1.8978 0.5259 -26.9541 5 4 2.4089 1.5521 -32.7616 5 5 2.3697 0.7096 -32.9960 5 6 1.6452 1.3356 -22.3697 5 7 1.8206 2.4422 -34.4766 5 8 2.3733 1.0369 -31.2321 5 9 1.7294 2.2641 -28.7093 5 10 2.0705 1.2429 -27.7976 5 11 1.5000 2.4204 -28.1904 6 2 1.5695 0.5000 -23.5214 6 3 2.1559 0.5103 -25.4679 6 4 2.0390 1.3646 -34.3783 6 5 1.8226 0.7396 -30.8681 6 6 2.1727 0.9582 -33.6384 6 7 2.0726 2.1762 -32.6578 6 8 2.0471 0.7397 -21.2987 6 9 1.6130 1.3052 -34.1746 6 10 2.4607 2.1368 -22.4587 6 11 2.2741 0.5000 -34.9297 Analysis started: Thu Apr 20 19:10:57 2006 Analysis ended: Sat Apr 22 17:48:14 2006 Duration of analysis run: 1 days 22:37:17

DRDC Atlantic CR 2006-108 25
A.2 Run 5 Main BREVER Output File
Listing 4. Run 5 Main BREVER Output File BASE 04 Run Transmission loss model: CASS ASSA Parameters: Initial temperature: 1.00000 Temperature scaling factor: 0.990000 Number of temp. reductions: 200 Pert/temp multiplier: 5 No. downhill simplex steps: 70 No. of averaging data sets: 20000 Perturbations/temperature: 5 Perturbation value code: 1 - factor * mean of prev. 20000 pert. values Pert. value code multiplier: 3.00000 SSA convergence value: 0.01000000 Downhill simplex conv. value: 1.00000e-04 Reverberation data weight: 1.00000 Reverberation slope weight: 0.0500000 Target Parameters: Beam noise: is to be solved for Beam 1 will vary from -300.000 through 200.000 dB Beam 2 will vary from -300.000 through 200.000 dB Beam 3 will vary from -300.000 through 200.000 dB Beam 4 will vary from -300.000 through 200.000 dB Beam 5 will vary from -300.000 through 200.000 dB Beam 6 will vary from -300.000 through 200.000 dB Points/radial: 17 CASS parameters: Density: will vary from 1.50000 through 2.50000 Sound speed ratio: will vary from 0.500000 through 2.50000 Scattering strength: will vary from -35.0000 through -20.0000 Depth uncertainty: 0.0 m, use provided bathymetry data Radial information: Length: 8.00000 km Number of radials: 6 Radial Bearings: 57.600 deg True 90.800 deg True 119.800 deg True 276.200 deg True 305.200 deg True 338.400 deg True Source parameters: Latitude: 36.3053 N Longitude: 14.7192 E Depth: 66.0000 m Heading: 18.0000 deg True

26 DRDC Atlantic CR 2006-108
Speed: 2.50000 m/s Receiver Parameters: Latitude: 36.3053 N Longitude: 14.7192 E Depth: 66.0000 m Heading: 18.0000 deg True Wind Speed: 7.50000 kt DMOS program input filenames: INTEGRATE: R5integrate.input MONOGO: R5monogo_0576.input R5monogo_0908.input R5monogo_1198.input R5monogo_2762.input R5monogo_3052.input R5monogo_3384.input CMBRAD: R5cmbrad.input CASS Control Parameters: Minimum range: 0.100000 km Range step size: 0.0500000 km Start angle for rays: -30.0000 deg End angle for rays: 30.0000 deg Ray angle step size: 0.0500000 deg Max. no. of btm ray bouces: 50 Measured data filename: R5meas_dataB.rev No. of measured data values: 17 Reverberation data time parameters in seconds: Minimum time: 2.0000000 Maximum time: 10.000000 Time Increment size: 0.50000000 ************************************************************************** 17 points/radial 0.500000 km between radial points SSA convergence did not occur before the temperature loop ran to its limit of 200 runs. Final values are SSA convergence value: 0.01000000 Emin: 1132.6889 Emax: 1233.7845 Convergence ratio: 0.085439878 The downhill convergence value was not reached before its loop ran to its limit of 70 runs. The final values are DHS Convergence value: 1.00000e-04 Emin: 1113.8326 Emax: 3043.4061 Convergence ratio: 0.92829571 Total number of DMOS runs is 2666
DRDC Atlantic CR 2006-108 27
Minimum E = 1113.8326 Minimum E/radial point = 11.4828 Best parameter estimates are: Beam noise results: Beam 1: -166.477 dB Beam 2: -263.837 dB Beam 3: -300.000 dB Beam 4: -17.843 dB Beam 5: -300.000 dB Beam 6: -253.398 dB Sound Scattering Radial Point Density Speed Ratio Strength ------------------------------------------------- Centre 1.5000 1.8951 -35.0000 1 2 2.5000 1.9246 -32.8882 1 3 1.6311 1.5279 -21.5136 1 4 1.9886 1.6234 -27.4198 1 5 1.7760 0.9250 -29.8988 1 6 2.1982 1.3420 -32.8359 1 7 2.3602 1.8153 -20.0000 1 8 1.8005 1.0786 -26.1080 1 9 1.9737 1.1076 -29.0133 1 10 2.3828 0.8160 -31.1652 1 11 1.9192 0.8141 -21.3952 1 12 1.6411 0.5425 -34.1316 1 13 2.1818 0.5000 -20.2257 1 14 2.4449 2.0642 -24.3385 1 15 2.3553 1.5500 -23.5513 1 16 2.1341 1.8018 -27.2020 1 17 2.0041 2.2529 -30.3745 2 2 2.0588 1.8134 -26.5573 2 3 2.4687 2.2047 -21.9761 2 4 2.0695 1.9826 -33.9350 2 5 1.8669 1.4133 -27.7888 2 6 1.6984 1.1571 -33.6520 2 7 2.2565 1.6453 -33.3085 2 8 2.0893 1.4599 -23.4044 2 9 2.3588 1.0098 -33.9940 2 10 2.2204 0.7965 -28.7564 2 11 1.9181 2.2520 -30.4407 2 12 1.5994 1.2024 -20.0000 2 13 2.3421 1.5141 -29.3064 2 14 2.4262 0.5547 -27.5999 2 15 1.9919 1.1872 -28.9028 2 16 2.0880 1.9950 -35.0000 2 17 2.5000 0.9246 -20.0000 3 2 1.9978 2.2519 -28.4690 3 3 2.1856 1.0061 -29.6943 3 4 1.5000 2.1107 -22.6424 3 5 1.6896 0.8711 -25.6779 3 6 1.5421 0.8991 -35.0000
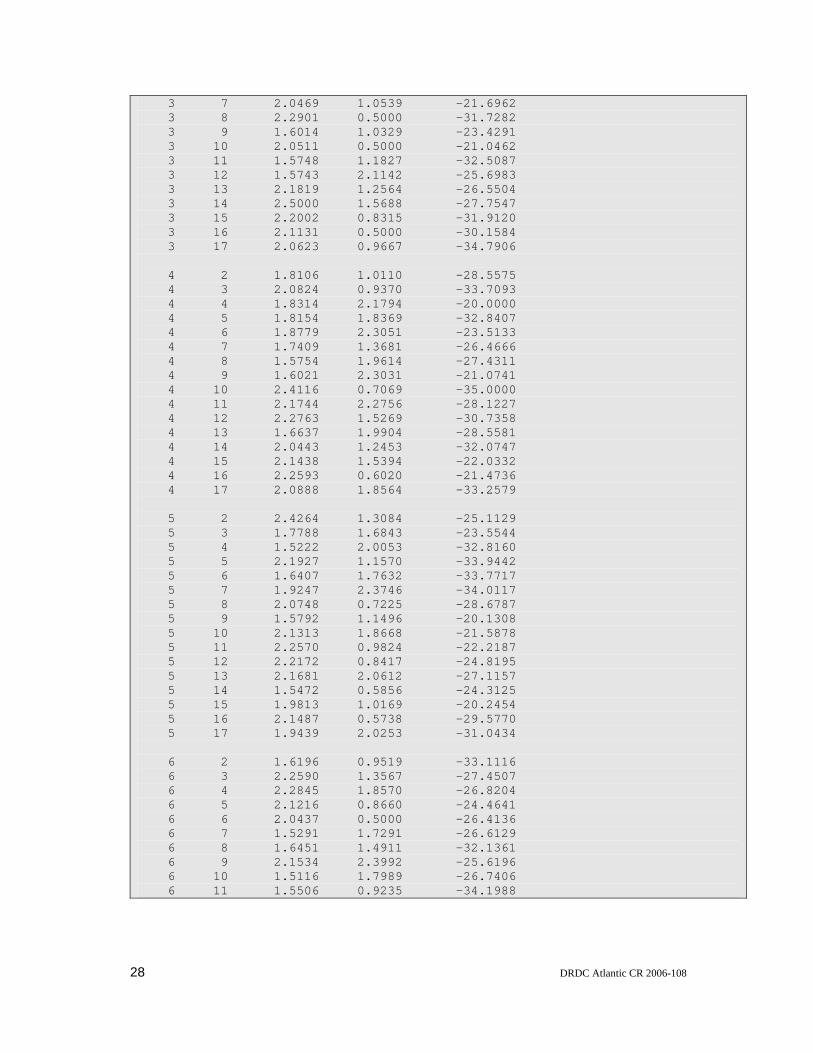
28 DRDC Atlantic CR 2006-108
3 7 2.0469 1.0539 -21.6962 3 8 2.2901 0.5000 -31.7282 3 9 1.6014 1.0329 -23.4291 3 10 2.0511 0.5000 -21.0462 3 11 1.5748 1.1827 -32.5087 3 12 1.5743 2.1142 -25.6983 3 13 2.1819 1.2564 -26.5504 3 14 2.5000 1.5688 -27.7547 3 15 2.2002 0.8315 -31.9120 3 16 2.1131 0.5000 -30.1584 3 17 2.0623 0.9667 -34.7906 4 2 1.8106 1.0110 -28.5575 4 3 2.0824 0.9370 -33.7093 4 4 1.8314 2.1794 -20.0000 4 5 1.8154 1.8369 -32.8407 4 6 1.8779 2.3051 -23.5133 4 7 1.7409 1.3681 -26.4666 4 8 1.5754 1.9614 -27.4311 4 9 1.6021 2.3031 -21.0741 4 10 2.4116 0.7069 -35.0000 4 11 2.1744 2.2756 -28.1227 4 12 2.2763 1.5269 -30.7358 4 13 1.6637 1.9904 -28.5581 4 14 2.0443 1.2453 -32.0747 4 15 2.1438 1.5394 -22.0332 4 16 2.2593 0.6020 -21.4736 4 17 2.0888 1.8564 -33.2579 5 2 2.4264 1.3084 -25.1129 5 3 1.7788 1.6843 -23.5544 5 4 1.5222 2.0053 -32.8160 5 5 2.1927 1.1570 -33.9442 5 6 1.6407 1.7632 -33.7717 5 7 1.9247 2.3746 -34.0117 5 8 2.0748 0.7225 -28.6787 5 9 1.5792 1.1496 -20.1308 5 10 2.1313 1.8668 -21.5878 5 11 2.2570 0.9824 -22.2187 5 12 2.2172 0.8417 -24.8195 5 13 2.1681 2.0612 -27.1157 5 14 1.5472 0.5856 -24.3125 5 15 1.9813 1.0169 -20.2454 5 16 2.1487 0.5738 -29.5770 5 17 1.9439 2.0253 -31.0434 6 2 1.6196 0.9519 -33.1116 6 3 2.2590 1.3567 -27.4507 6 4 2.2845 1.8570 -26.8204 6 5 2.1216 0.8660 -24.4641 6 6 2.0437 0.5000 -26.4136 6 7 1.5291 1.7291 -26.6129 6 8 1.6451 1.4911 -32.1361 6 9 2.1534 2.3992 -25.6196 6 10 1.5116 1.7989 -26.7406 6 11 1.5506 0.9235 -34.1988

DRDC Atlantic CR 2006-108 29
6 12 2.0515 1.5562 -30.2479 6 13 2.3414 1.0338 -27.8832 6 14 2.1872 0.9756 -25.8303 6 15 1.7828 2.1051 -24.2498 6 16 1.8600 2.3470 -32.5012 6 17 1.8507 1.5767 -27.0944 Analysis started: Sat Apr 22 17:48:14 2006 Analysis ended: Sun Apr 23 01:39:37 2006 Duration of analysis run: 07:51:23
A.3 Run 7 Main BREVER Output File
Listing 5. Run 7 Main BREVER Output File BASE 04 Run Transmission loss model: CASS ASSA Parameters: Initial temperature: 1.00000 Temperature scaling factor: 0.990000 Number of temp. reductions: 200 Pert/temp multiplier: 5 No. downhill simplex steps: 70 No. of averaging data sets: 20000 Perturbations/temperature: 5 Perturbation value code: 1 - factor * mean of prev. 20000 pert. values Pert. value code multiplier: 3.00000 SSA convergence value: 0.01000000 Downhill simplex conv. value: 1.00000e-04 Reverberation data weight: 1.00000 Reverberation slope weight: 0.0500000 Target Parameters: Beam noise: is not to be solved for but ".sys" file values are to be replaced Beam 1 fixed at 44.500 dB Beam 2 fixed at 44.500 dB Beam 3 fixed at 47.000 dB Beam 4 fixed at 46.800 dB Beam 5 fixed at 44.800 dB Beam 6 fixed at 47.000 dB Points/radial: 11 CASS parameters: Density: will vary from 1.50000 through 2.50000 Sound speed ratio: will vary from 0.800000 through 2.50000 Scattering strength: will vary from -35.0000 through -20.0000

30 DRDC Atlantic CR 2006-108
Depth uncertainty: 0.0 m, use provided bathymetry data Radial information: Length: 30.0000 km Number of radials: 6 Radial Bearings: 57.600 deg True 90.800 deg True 119.800 deg True 276.200 deg True 305.200 deg True 338.400 deg True Source parameters: Latitude: 36.3053 N Longitude: 14.7192 E Depth: 66.0000 m Heading: 18.0000 deg True Speed: 2.50000 m/s Receiver Parameters: Latitude: 36.3053 N Longitude: 14.7192 E Depth: 66.0000 m Heading: 18.0000 deg True Wind Speed: 7.50000 kt DMOS program input filenames: INTEGRATE: R7integrate.input MONOGO: R7monogo_0576.input R7monogo_0908.input R7monogo_1198.input R7monogo_2762.input R7monogo_3052.input R7monogo_3384.input CMBRAD: R7cmbrad.input CASS Control Parameters: Minimum range: 0.100000 km Range step size: 0.0500000 km Start angle for rays: -30.0000 deg End angle for rays: 30.0000 deg Ray angle step size: 0.0500000 deg Max. no. of btm ray bouces: 50 Measured data filename: R7meas_dataB.rev No. of measured data values: 71 Reverberation data time parameters in seconds: Minimum time: 4.0000000 Maximum time: 39.000000 Time Increment size: 0.50000000 ************************************************************************** 11 points/radial

DRDC Atlantic CR 2006-108 31
3.00000 km between radial points SSA convergence did not occur before the temperature loop ran to its limit of 200 runs. Final values are SSA convergence value: 0.01000000 Emin: 2260.3419 Emax: 3316.8062 Convergence ratio: 0.37885468 The downhill convergence value was not reached before its loop ran to its limit of 70 runs. The final values are DHS Convergence value: 1.00000e-04 Emin: 1668.5939 Emax: 6266.7260 Convergence ratio: 1.1589028 Total number of DMOS runs is 5047 Minimum E = 1668.5939 Minimum E/radial point = 27.3540 Best parameter estimates are: Sound Scattering Radial Point Density Speed Ratio Strength ------------------------------------------------- Centre 2.4358 0.8310 -35.0000 1 2 1.9890 0.8000 -22.4683 1 3 2.1575 0.8000 -30.5989 1 4 2.2498 0.8000 -35.0000 1 5 1.7914 2.1863 -34.2308 1 6 1.8957 1.6344 -20.4219 1 7 1.6121 1.7232 -23.0321 1 8 2.2628 2.2653 -27.2458 1 9 2.2396 1.5599 -29.4492 1 10 1.6652 1.3805 -34.0455 1 11 1.8435 0.8266 -33.8227 2 2 2.1555 0.9342 -31.8116 2 3 2.0854 1.4271 -35.0000 2 4 2.4219 0.8862 -22.5573 2 5 1.6887 2.1262 -29.6914 2 6 2.3660 1.1522 -23.9359 2 7 2.0440 2.1724 -34.4066 2 8 1.6700 1.3169 -33.4822 2 9 1.8108 2.4042 -24.3596 2 10 2.3064 1.4196 -21.8180 2 11 2.1732 1.9448 -35.0000 3 2 1.8706 0.8000 -32.8927 3 3 1.9762 2.1709 -26.2888 3 4 1.6933 2.2524 -32.4720 3 5 2.2385 1.4038 -24.2390 3 6 1.9359 1.9329 -22.0823 3 7 1.9306 1.9552 -33.2108 3 8 2.1140 1.4616 -34.6104 3 9 1.8005 2.0423 -20.8987
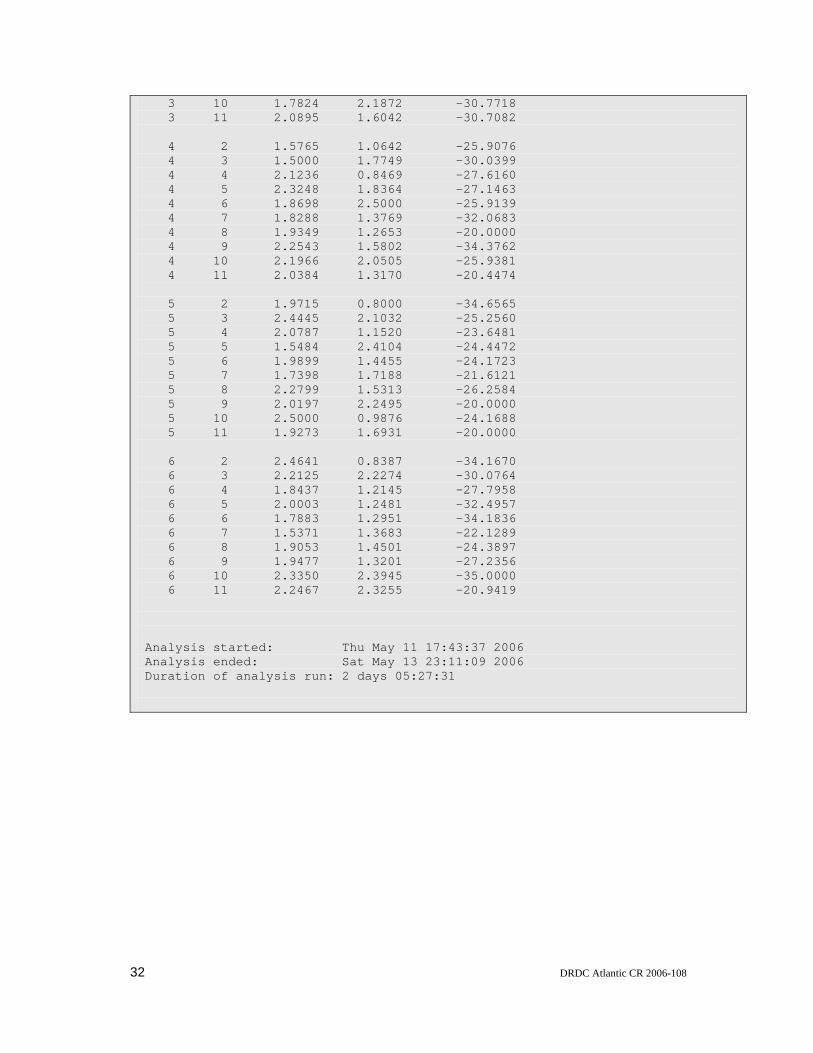
32 DRDC Atlantic CR 2006-108
3 10 1.7824 2.1872 -30.7718 3 11 2.0895 1.6042 -30.7082 4 2 1.5765 1.0642 -25.9076 4 3 1.5000 1.7749 -30.0399 4 4 2.1236 0.8469 -27.6160 4 5 2.3248 1.8364 -27.1463 4 6 1.8698 2.5000 -25.9139 4 7 1.8288 1.3769 -32.0683 4 8 1.9349 1.2653 -20.0000 4 9 2.2543 1.5802 -34.3762 4 10 2.1966 2.0505 -25.9381 4 11 2.0384 1.3170 -20.4474 5 2 1.9715 0.8000 -34.6565 5 3 2.4445 2.1032 -25.2560 5 4 2.0787 1.1520 -23.6481 5 5 1.5484 2.4104 -24.4472 5 6 1.9899 1.4455 -24.1723 5 7 1.7398 1.7188 -21.6121 5 8 2.2799 1.5313 -26.2584 5 9 2.0197 2.2495 -20.0000 5 10 2.5000 0.9876 -24.1688 5 11 1.9273 1.6931 -20.0000 6 2 2.4641 0.8387 -34.1670 6 3 2.2125 2.2274 -30.0764 6 4 1.8437 1.2145 -27.7958 6 5 2.0003 1.2481 -32.4957 6 6 1.7883 1.2951 -34.1836 6 7 1.5371 1.3683 -22.1289 6 8 1.9053 1.4501 -24.3897 6 9 1.9477 1.3201 -27.2356 6 10 2.3350 2.3945 -35.0000 6 11 2.2467 2.3255 -20.9419 Analysis started: Thu May 11 17:43:37 2006 Analysis ended: Sat May 13 23:11:09 2006 Duration of analysis run: 2 days 05:27:31

DRDC Atlantic CR 2006-108 33
Bibliography
[1] Calnan, C. 2006. Reverberation Inversion Enhancements Using BASE 04 Data DRDC Atlantic CR 2006-046. Defence R&D Canada – Atlantic.
[2] Calnan, C. (2006). BREVER User’s Guide, v. 2.0a (In Preparation). [3] Pecknold, S.P., Hines, P.C., Ellis, D.D., Dosso, S., McCammon, D. and Giles, P.
“Effect of Environmental Variability on Transmission Loss During The Base ‘04 Experiment”, in Proc. of the Eighth European Conference on Underwater Acoustics, ECUA 2006. Carvoeiro, Portugal, 12-15 June 2006.

34 DRDC Atlantic CR 2006-108
Initialisms and Acronyms
ASSA Adaptive Simulated Simplex Annealing CASS Comprehensive Acoustic System Simulation DAP Drifting Acoustic Projector DASM Directional Acoustic Sensor Module DMOS DRDC Atlantic Model Operating System DRDC Defence Research and Development Canada GRAB Gaussian Ray Bundle MDA MacDonald, Dettwiler & Associates Ltd.

DRDC Atlantic CR 2006-108 35
Distribution List Internal Distribution 2 DRDC Atlantic LIBRARY FILE COPIES 3 DRDC Atlantic LIBRARY (SPARES) 3 J. Theriault 1 S. Pecknold 1 D. Ellis 1 P. Hines External Distribution 1 C. Calnan xwave 36 Solutions Drive
Halifax, N.S. B3S 1N2
1 LCdr W. Renauld, SSO METOC, MARLANT CFB Halifax
1 M. Prior, NATO Undersea Research Center Anti-Submarine Warfare Department Viale San Bartolomeo 400 I-19138 La Spezia
1 G. Haralabus, NATO Undersea Research Center Anti-Submarine Warfare Department Viale San Bartolomeo 400 I-19138 La Spezia
1 DRDKIM 3 Total 16 copies ___________________

36 DRDC Atlantic CR 2006-108
This page intentionally left blank.

UNCLASSIFIED
DOCUMENT CONTROL DATA(Security classification of the title, body of abstract and indexing annotation must be entered when the overall document is classified)
1. ORIGINATOR (The name and address of the organization preparing the document, Organizationsfor whom the document was prepared, e.g. Centre sponsoring a contractor's document, or taskingagency, are entered in section 8.)
Publishing: DRDC AtlanticPerforming: xwave, 36 Solutions Dr, HalifaxMonitoring:Contracting:
2. SECURITY CLASSIFICATION(Overall security classification of the documentincluding special warning terms if applicable.)
UNCLASSIFIED
3. TITLE (The complete document title as indicated on the title page. Its classification is indicated by the appropriate abbreviation (S, C, R, or U) in parenthesis atthe end of the title)
BASE 04 Transmission Loss Measurement and Modelling (U)4. AUTHORS (First name, middle initial and last name. If military, show rank, e.g. Maj. John E. Doe.)
C. Calnan5. DATE OF PUBLICATION
(Month and year of publication of document.)
October 2006
6a NO. OF PAGES(Total containing information, includingAnnexes, Appendices, etc.)
54
6b. NO. OF REFS(Total cited in document.)
3
7. DESCRIPTIVE NOTES (The category of the document, e.g. technical document, technical note or memorandum. If appropriate, enter the type ofdocument, e.g. interim, progress, summary, annual or final. Give the inclusive dates when a specific reporting period is covered.)
Contract Report
8. SPONSORING ACTIVITY (The names of the department project office or laboratory sponsoring the research and development − include address.)
Sponsoring:Tasking:
9a. PROJECT OR GRANT NO. (If appropriate, the applicableresearch and development project or grant under which the document waswritten. Please specify whether project or grant.)
11cs
9b. CONTRACT NO. (If appropriate, the applicable number under whichthe document was written.)
W7707−05−3094
10a. ORIGINATOR'S DOCUMENT NUMBER (The officialdocument number by which the document is identified by the originatingactivity. This number must be unique to this document)
DRDC Atlantic CR 2006−108
10b. OTHER DOCUMENT NO(s). (Any other numbers under whichmay be assigned this document either by the originator or by thesponsor.)
xwave contract number 1010610
11. DOCUMENT AVAILABILITY (Any limitations on the dissemination of the document, other than those imposed by security classification.)
Unlimited distribution12. DOCUMENT ANNOUNCEMENT (Any limitation to the bibliographic announcement of this document. This will normally correspond to the Document
Availability (11), However, when further distribution (beyond the audience specified in (11) is possible, a wider announcement audience may be selected.))
Unlimited announcement
UNCLASSIFIED

UNCLASSIFIEDDOCUMENT CONTROL DATA
(Security classification of the title, body of abstract and indexing annotation must be entered when the overall document is classified)
13. ABSTRACT (A brief and factual summary of the document. It may also appear elsewhere in the body of the document itself. It is highly desirable that the abstract ofclassified documents be unclassified. Each paragraph of the abstract shall begin with an indication of the security classification of the information in the paragraph(unless the document itself is unclassified) represented as (S), (C), (R), or (U). It is not necessary to include here abstracts in both official languages unless the text isbilingual.)
(U) A previous contract resulted in the addition of the ray theory program Bellhop to the reverberation inversionprogram BREVER. This was done to allow inversion of reverberation results calculated from acoustic datarecorded during the BASE 04 trials. However tests with Bellhop using parameters from the BASE 04 siteindicated shortcomings in that program.
The current contract began with tests runs of CASS, a potential Bellhop replacement for reverberationinversions. The test results indicated that CASS would work properly for the analysis area. Accordingly,BREVER was enhanced to allow it to also use CASS, and reverberation inversion was performed. Theinversion results were used to model transmission loss, and these modelled values were compared totransmission loss data calculated from measured data.
Because of this contract the BREVER User’s Guide was expanded to describe the use of the CASS−enabledversion of the program.
(U) Dans le cadre d'un contrat antérieur, le programme de théorie des rayons Bellhop a été ajouté au programmed'inversion des réverbérations BREVER. Cet ajout avait pour but de permettre l'inversion des résultats deréverbérations établis à partir des données acoustiques enregistrées durant les essais BASE 04. Les essaiseffectués avec Bellhop à partir des paramètres de l'emplacement BASE 04 ont toutefois fait ressortir deslacunes de ce programme.
La mise en application du contrat actuel a commencé par des essais de CASS, solution possible deremplacement de Bellhop pour les inversions de réverbérations. Les résultats de ces essais ont indiqué queCASS fonctionnerait correctement pour l'analyse. Le programme BREVER a donc été adapté afin de pouvoiraussi utiliser CASS, et l'inversion des réverbérations a été exécutée. Les résultats de l'inversion ont servi àmodéliser l'affaiblissement de transmission, et les valeurs modélisées ont été comparées aux donnéesd'affaiblissement de transmission établies à partir des données mesurées.
À la suite de ce contrat, on a complété le guide de l'utilisateur de BREVER en décrivant l'utilisation de laversion du programme faisant appel à CASS.
14. KEYWORDS, DESCRIPTORS or IDENTIFIERS (Technically meaningful terms or short phrases that characterize a document and could be helpful in cataloguing thedocument. They should be selected so that no security classification is required. Identifiers, such as equipment model designation, trade name, military project codename, geographic location may also be included. If possible keywords should be selected from a published thesaurus, e.g. Thesaurus of Engineering and ScientificTerms (TEST) and that thesaurus identified. If it is not possible to select indexing terms which are Unclassified, the classification of each should be indicated as withthe title.)
(U) ReverberationInversionUnderwater AcousticsModelsTowed ArrayTransmission LossReverberation
UNCLASSIFIED

This page intentionally left blank.