Modelling of ultrasound transmission through a solid ...
26
HAL Id: hal-00624858 https://hal.archives-ouvertes.fr/hal-00624858 Submitted on 18 Apr 2018 HAL is a multi-disciplinary open access archive for the deposit and dissemination of sci- entific research documents, whether they are pub- lished or not. The documents may come from teaching and research institutions in France or abroad, or from public or private research centers. L’archive ouverte pluridisciplinaire HAL, est destinée au dépôt et à la diffusion de documents scientifiques de niveau recherche, publiés ou non, émanant des établissements d’enseignement et de recherche français ou étrangers, des laboratoires publics ou privés. Modelling of ultrasound transmission through a solid-liquid interface comprising a network of gas pockets K. Paumel, J. Moysan, D. Chatain, G. Corneloup, F. Baqué To cite this version: K. Paumel, J. Moysan, D. Chatain, G. Corneloup, F. Baqué. Modelling of ultrasound transmission through a solid-liquid interface comprising a network of gas pockets. Journal of Applied Physics, American Institute of Physics, 2011, 110 (4), pp.044910. 10.1063/1.3611422. hal-00624858
Transcript of Modelling of ultrasound transmission through a solid ...
HAL Id: hal-00624858https://hal.archives-ouvertes.fr/hal-00624858
Submitted on 18 Apr 2018
HAL is a multi-disciplinary open accessarchive for the deposit and dissemination of sci-entific research documents, whether they are pub-lished or not. The documents may come fromteaching and research institutions in France orabroad, or from public or private research centers.
L’archive ouverte pluridisciplinaire HAL, estdestinée au dépôt et à la diffusion de documentsscientifiques de niveau recherche, publiés ou non,émanant des établissements d’enseignement et derecherche français ou étrangers, des laboratoirespublics ou privés.
Modelling of ultrasound transmission through asolid-liquid interface comprising a network of gas pockets
K. Paumel, J. Moysan, D. Chatain, G. Corneloup, F. Baqué
To cite this version:K. Paumel, J. Moysan, D. Chatain, G. Corneloup, F. Baqué. Modelling of ultrasound transmissionthrough a solid-liquid interface comprising a network of gas pockets. Journal of Applied Physics,American Institute of Physics, 2011, 110 (4), pp.044910. �10.1063/1.3611422�. �hal-00624858�
1
Modelling of ultrasound transmission through a solid-liquid
interface comprizing a network of gas pockets.
K. Paumel1, J. Moysan2, D. Chatain3, G. Corneloup2, F. Baqué1
1. CEA, DEN, Nuclear Technology Department, F-13108 Saint-Paul-lez-Durance, France.
2. Laboratoire de Caractérisation Non Destructive, Université de la Méditerranée, IUT Aix-en-Provence,
Avenue Gaston Berger, 13625 Aix-en-Provence, France
3. CNRS, Aix-Marseille Université, CINAM-UPR3118, Campus de Luminy, Case 913, 13288 Marseille
cedex 09
Email corresponding author : [email protected]
Abstract
Ultrasonic inspection of sodium-cooled fast reactor requires a good acoustic coupling between the transducer
and the liquid sodium. Ultrasonic transmission through a solid surface in contact with liquid sodium can be
complex due to the presence of microscopic gas pockets entrapped by the surface roughness. Experiments
are run using substrates with controlled roughness consisting of a network of holes and a modelling approach
is then developed. In this model a gas pocket stiffness at a partially solid-liquid interface is defined. This
stiffness is then used to calculate the transmission coefficient of ultrasound at the entire interface. The gas
pocket stiffness has a static, as well as an inertial component, which depends on the ultrasonic frequency and
the radiative mass.
PACS : 43.35.Zc, 81.70.Cv, 68.08.Bc, 28.41.Rc, 81.70.-q, 68.08.-p
Key words: ultrasounds, wetting, interface, spring model, sodium fast reactor, non destructive testing
2
1. Introduction
Fast neutron reactors cooled with liquid sodium (SFR reactors) are envisaged in France in the realm
of fourth generation nuclear systems. Amongst the research and development topics related to this
technology1, the improvement of in-service inspection capabilities was identified as a major issue2. In this
field, ultrasonic techniques are planned for continuous monitoring and periodical examinations of reactor
components3. For example it will be necessary to use ultrasonic telemetry to check if components have not
undergone unacceptable displacements or deformations. One of the techniques consists in using ultrasonic
transducers directly immersed in liquid sodium. Research studies are currently being conducted to
understand the phenomena governing the acoustic coupling of the transducer with liquid sodium, i.e. the
ultrasonic transmission at the interface between the active face of the transducer and the liquid sodium in
contact 4,5.
Ultrasonic transmission through solid surfaces in contact with liquid sodium is sometimes difficult,
when the wetting of the sodium on the solid surface is poor (contact angle larger than 90°). It is thought that
the presence of microscopic gas pockets, trapped in the irregularities (or cavities) of the surface roughness of
the solid (the active face of the transducer) in contact with the liquid sodium, could be responsible for this
poor acoustic coupling 6,7. The aim of our study is to predict the ability of ultrasound waves to traverse a
composite interface, i.e. a solid-liquid interface including gas pockets.
This study has some points in common with numerous other studies modelling the transmission /
reflection of ultrasound at a partial contact interface. Distributed spring models are useful tools for predicting
the reflection or transmission coefficient through such partial contact interface. In this field, Kendall and
Tabor8 introduce the notion of interface stiffness. The concept of a distributed spring at the interface,
describing the contact behaviour, was introduced by Tattersall9 , Baik and Thompson10 developed a quasi-
static model which is an extension of that of Tattersall, since it includes the influence of the interface’s mass.
Baltazar et al.11 extended the spring model, by using normal and transverse springs to predict the reflection
coefficient at a rough interface between two solids, for normal, but also oblique angles of incidence.
The description of partial contact interfaces, based on the spring model, or more generally on the
mass-spring model, are applicable to various domains including the characterisation of a network of cracks,
pores or coplanar inclusions10,12, rough contact between two solids13-17; the strength of adhesive bonds9,18,19;

3
the possible non detection of cracks under compressive load20; or the determination of the thickness of oil
films in roller bearings21. Such models are now developed to take also into account non linear behaviour22,23.
There are also numerous studies on the behaviour of gas pockets under quasi-static or dynamic
pressure where the physical modelling is also based on a spring model. Liquid-vapour surface tension and
pressure are two of the main parameters24,25. Other works in sonochemistry analyse the role of ultrasonic
pressure on the contact angle26.
Our work is at the edge between these two sets of studies. The originality of our study consists in
defining a mass-spring model approach where an equivalent stiffness is calculated to model the behaviour of
gas pockets distributed along a plane interface.
To the best of our knowledge, there is no example in the literature, of an application of this model to
the characterisation of a partial contact interface such as a composite interface, between a solid and a liquid.
The present study thus involves establishing a law to describe the behaviour of a composite interface.
In part 2 we have undertaken a simulated study, using water as the liquid, and hydrophobic silica-silicon
substrates for the solid surfaces, characterized by a network of small calibrated holes, which remain filled
with gas when the surface is brought into contact with water. In a previous study5, it has been demonstrated
that the gas area fraction of the composite interface does not vary under the influence of ultrasound in the
present experimental conditions.
The experimental work is complemented by a theoretical approach intended to start a predictive
approach. In the model the interface is considered to be a partial contact interface between the liquid and the
solid. This assumption allows developing a distributed mass and spring model to determine the transmission
coefficient of the interface. The major idea is to propose a description of the behaviour of a gas pocket under
the influence of ultrasound to determine the stiffness of the distributed equivalent spring of the entire
interface.
2. Experiment
2.1 Objectives and principle

4
The experiment developed is based on an immersion measurement technique. In the present study,
the measurement principle consists in comparing the transmission through a composite interface (a "rough"
hydrophobic sample) with that through a complete solid-liquid interface (reference sample). The aim of this
approach is to eliminate any cause of transmitted signal variation arising from the measurement chain, which
could be induced by any other source than the studied interface. This comparison can be characterized by the
transmission mode Interface Transfer Function, FTI_t, defined as follows:
( )( ) )(
)(
)(
)()(_
ft
ft
fA
fAftFTI
ref
rh
refT
hrT
== (1)
Where |AT(f)| is the modulus of the Fourier transform of the ultrasonic signal, transmitted through
the considered sample at the frequency f, and |t(f)| is the modulus of the transmission coefficient of the
considered interface at the frequency f. The ‘rh’ subscript and exponent terms refer respectively to the
studied sample and the "rough" hydrophobic interfaces, and the ‘ref’ subscript and exponent terms refer
respectively to the reference sample and to the smooth interface. As the temporal signal is not
monochromatic, it is more useful to make use of ultrasonic spectroscopy, i.e. to perform the analyses via the
Fourier transform of the signal.
Thus, for an interface whose FTI_t value is close to 1, the acoustic coupling can be considered to be
very good, whereas if FTI_t is close to zero, it will be considered to be very poor. This parameter is also used
in our model, in order to compare the numerical results with those derived from the experiment.
The method used to measure the transmission coefficients for the samples involves coupling the
measurements carried out with the reference sample with measurements carried out with the "rough"
samples, using the same method. This method involves generating and measuring echoes, which are
transmitted through the sample, first in one direction, then in the other. This allows the influence of the
direction of ultrasound propagation to be studied, with respect to the "rough" side of the samples, without the
need to reverse the sample positioning between two measurements (Fig. 1).

5
Figure 1. Path of ultrasound signals through the reference sample (ref)
and through a hydrophobic "rough" sample (rh).
For the reference sample, and for each "rough" sample, two signals are transmitted through the
sample, and thus need to be measured. The first corresponds to the signal for which transducer A is the
emitter, i.e. the signal comprising the echo AT1B (ref or rh), and the second corresponds to the signal for
which transducer B is the emitter, i.e. the signal comprising the echo AT1A (ref or rh). By expressing the
problem in the form of equations, the transmission coefficients can be derived in the liquid-to-solid direction
(trajectory from A to B), and in the solid-to-liquid direction (trajectory from B to A). The ‘S’ subscripts refer
to the solid, i.e. to silicon, the ‘L’ subscripts refer to the liquid, i.e. water, and the ‘G’ subscripts refer to the
gas, i.e. air.
( )( ) )(
)(
)()(
1
1 ftfA
fAft ref
LSref
TB
hrTBrh
pLS = and ( )( ) )(
)(
)()(
1
1 ftfA
fAft ref
SLref
TA
hrTArh
pSL = (2)
The corresponding FTI_t can thus be expressed as:
( )( ) )(
)()(_
1
1
fA
fAftFTI
refTB
hrTB
LS = and ( )( ) )(
)()(_
1
1
fA
fAftFTI
refTA
hrTA
SL = (3)
6
2.2 The samples
The samples are silicon disks with a [100] crystallographic orientation. Silicon allows being
machined controlled roughness and being treated so that its surface is hydrophobic. Before the experiment,
the samples were subjected to a hydrophobic surface treatment : a liquid coating solution including
octadecyltrichlorosilane (OTS). They have a diameter of 100 mm and a thickness of 10 mm. The thickness
is sufficient to allow the different interface echoes to be separated. The excitation signals applied were
impulses, in order to obtain the shortest possible echo durations, thereby avoiding the problem of
overlapping echoes.
The simulated roughness of the "rough" samples must be as close as possible to the real case, that is,
to the roughness resulting from mechanical machining. Nevertheless, to apprehend the complex phenomena
involved into the gas pocket – ultrasound interaction and in order to establish a modelling, it is necessary to
control the ratio ultrasound wavelength by gas pocket size and to fix a straightforward geometry. The
roughness is thus simulated by means of cylindrical holes distributed over a hexagonal grid. The engraving is
achieved using a RIE (Reactive Ion Etching) lithographic process with masks. Fourteen samples were
produced, of which just one was kept smooth, and was used as the reference sample. When the samples were
immersed in water, the cylindrical holes thus remained filled with gas (mainly air, together with a small
quantity of water vapour) and the interface thus has a composite character.
Two criteria led to the selection of the depth of the cylindrical holes, and of the roughness of the
"rough" surfaces. The hole depth must be greater than the protrusion depth of the liquid-gas interface
curvature, to prevent this meniscus from touching the bottom of the hole. In addition, in order for the sample
to be representative of the roughness resulting from mechanical machining, the hole depth must not be too
large, and remain of the same order of magnitude as its diameter. For all of the samples, the chosen hole
depth was 30 µm, and several diameters were investigated.
2.3 The parameters
2.3.1Parameters governing the roughness

7
The parameters characterising the controlled roughness of the "rough" surface of the samples are: the
diameter d = 2r of the cylindrical holes, and the per unit area fraction of the cylindrical holes, ft .
Although for a given sample, all the cylindrical holes have the same diameter, three different diameters were
used: approximately 10, 20 and 30 µm. They were selected in order to respect two criteria: the first
corresponds to the limits of the cylindrical hole engraving process, i.e. to a lower diameter limit of 10 µm. A
smaller size of the holes would have to be more representative of typical machined surface roughness but
below this value the circularity of the holes cannot be achieved by the machines used for the optical
lithography and RIE engraving processes with thick samples. The second criterion is given by the 30 µm
upper limit of the hole diameter, which corresponds to the maximum diameter (including a safety margin)
able to guarantee the stability of the gas pockets when the surface is hydrophobic, with respect to the
hydrostatic pressure imposed by the experimental conditions.
The fraction of cylindrical holes per unit area ft gives the ratio between the area of the disks
representing the cylindrical hole apertures, and the total apparent area of the sample. The complement with
respect to 1 of ft is noted t. t thus corresponds to the ratio between the area between the holes, and the area
of the whole sample surface. When the sample is immersed in water, ft corresponds to the liquid-gas area
fraction of the interface, i.e. fg = 1 - t, of the composite interface, and t corresponds to the actual solid-liquid
interface area fraction. For example, for the surface of the reference sample, which has no holes, fg = 0 and
t = 1. The range of the parameters e, e’ and r (Fig. 2) allows the factor t to be varied between 0.5 % and
0.9 % (0.5; 0.7; 0.8; 0.9). This choice covers a useful range of values around 0.7 %. The latter value was
identified5 as the boundary between two regimes of ultrasound transmission.
Figure 2. Description of the grid parameters of the holes
8
2.3.2 The parameter related to ultrasound: frequency
The transmission coefficient of the samples’ composite interfaces are studied at two frequencies f =
w/(2p), one and five Megaherthz, each corresponding to the central frequency of two different pairs of
transducers. The aim is to assess the frequency influence in a representative range of ultrasonic techniques
used in sodium fast reactor. These frequencies are greater than the resonant frequencies of the gas pockets
computed with expression (21) (see in a further section).. In order to limit the number of measurements, not
all of the samples are tested with each of the transducers pairs. The transducer pair with a central frequency
of 5 MHz is used with all of the samples, whereas the pair centered at 1 MHz is used only with the samples
having cylindrical holes with a diameter of 30 µm.
2.4 Description of the experimental setup
The transducers and the selected sample are immersed in a tank filled with water at room
temperature (around 20°C). They are positioned and aligned with respect to each other by means of two
independent mechanical systems with several degrees of freedom. The first system allows the mutual
position and orientation of the two transducers to be adjusted, and the second allows the perpendicularity of
the sample surfaces (i.e. normal incidence) to be adjusted with respect to the ultrasonic beam. The
transducers are not focused. The generated ultrasound signals are pulses. The pulse generation and
acquisition system allows one or the other transducers to be used, indifferently, as the transmitter or the
receiver. As shown in Fig. 3, the pulses to be transmitted by a transducer or recorded with the oscilloscope
are controlled by two pulse generator/receivers, each being connected to a transducer on one side and to the
oscilloscope on the other. The pulses transmitted through the sample can be sent and received in both
directions. The experimental setup comprizes two separate signal generation and acquisition systems, in
order to study the effect of the direction of ultrasound propagation with respect to the "rough" face of the
samples, without changing the experimental setup.

9
Figure 3. Drawing of the ultrasound signal generation and transmission system.
The distance between the transducers and the closest surface of the sample is adjusted to be at the
limit of the near field for the 5 MHz frequency. For the 1 MHz pair of transducers, the signals are recorded in
the far field at a distance of 72 mm from the sample, since the length of the near field is too short to be used
with this experimental setup.
3. Model
In the case of the transmission of ultrasonic waves at normal incidence to the interface between two
media, when an incident beam propagating in the first medium reaches the interface, part of this beam is
reflected and the other part is transmitted into the second medium. In the ideal situation of a plane wave at
normal incidence with respect to a smooth and flat interface, the pressure and velocity continuity equations at
the interface allow the transmission coefficients of pressure tp and velocity tv (with tp = 1 + rp et tv = 1 + rv)
to be determined as a function of the acoustic impedances Z of the two media (both of which are considered
here to be elastic and isotropic):
vp tZZ
ZZZt
1
2
21
22=
+= (4)

10
where subscript 1 refers to medium 1 in which the incident and reflected waves propagate, and subscript 2
refers to medium 2, in which the transmitted wave propagates. Z is given by Z = rc with r and c respectively
the density and sound velocity of the medium. It is well known that at a solid-air or a liquid-air interface the
velocity reflection coefficient is nearly equal to 1 (or -1 for the pressure reflection coefficient), and the wave
is almost totally reflected at the interface.
From the acoustic point of view, a composite interface represents an intermediate case between a
purely solid-liquid interface and that of a film of gas separating the solid from the liquid. However, as a
result of the presence of roughness and a dispersed gaseous phase, the interaction between the ultrasonic
wave and the interface becomes more complex, and the transmission coefficient can no longer be computed
using expression (4). The gas pockets distributed in-between the purely solid-liquid contacts lead to
scattering of the incident wave. As a result, the transmitted and reflected acoustic fields are the result of
interactions between the wave and these scatterers. The nature of these interactions is governed by the ratio
between the ultrasonic wavelength and the size of the scatterers, or in all likelihood by the resonant
frequency of the scatterers in the case of gas pockets in contact with water.
The proposed interface stiffness model consists in the use of independent stiffnesses corresponding
to the respective area fractions of the gas and the solid, and then applying an acoustic pressure amplitude
which acts on each fraction. The stiffness of the gas area fraction is calculated from the “dynamic stiffness”
of the gas pocket, which takes into account not only the static stiffness of the latter, but also an “inertial”
component involving the acoustic excitation frequency and a radiative mass.
3.1 Behaviour of the gas pocket
In this section, we define the "dynamic stiffness" of the gas pocket, as a function of its geometry and
the initial wetting conditions. Leighton19 analysed the oscillatory dynamics of a gas pocket by comparing
them with those of an ideal classical undamped mass-spring system. The ideal mass-spring oscillator differs
from the real one, both in terms of stiffness and inertia. Actually, the stiffness is independent of the
displacement when it occurs with very small amplitudes. In the ideal model the inertia is only related to the
mass. However, in the real mass-spring oscillator, the acceleration of the mass also induces an acceleration
of the spring. In addition, in order for the mass to be displaced, and for kinetic energy to be transferred to the
11
mass and the spring, kinetic energy needs to be applied to the volume of gas surrounding the system during
its displacement. The inertial contribution of the surrounding fluid is defined in terms of the so-called
radiative mass mr.
These differences with respect to an ideal mass-spring oscillator are amplified by the gas pocket.
Indeed, we first demonstrate that the stiffness of the gas pocket depends on the displacement of its meniscus.
In addition, for the real mass-spring oscillator, the radiative mass is generally negligible when compared with
the inertia of the mass. On the other hand, for the gas inside a cavity within a liquid, the inertia associated
with the acceleration of the liquid is much larger than that associated with the gas. As a consequence, the
mass of the gas in the pocket will be considered to be negligible when compared to that of the radiative mass.
3.1.1 Geometry of the gas pocket
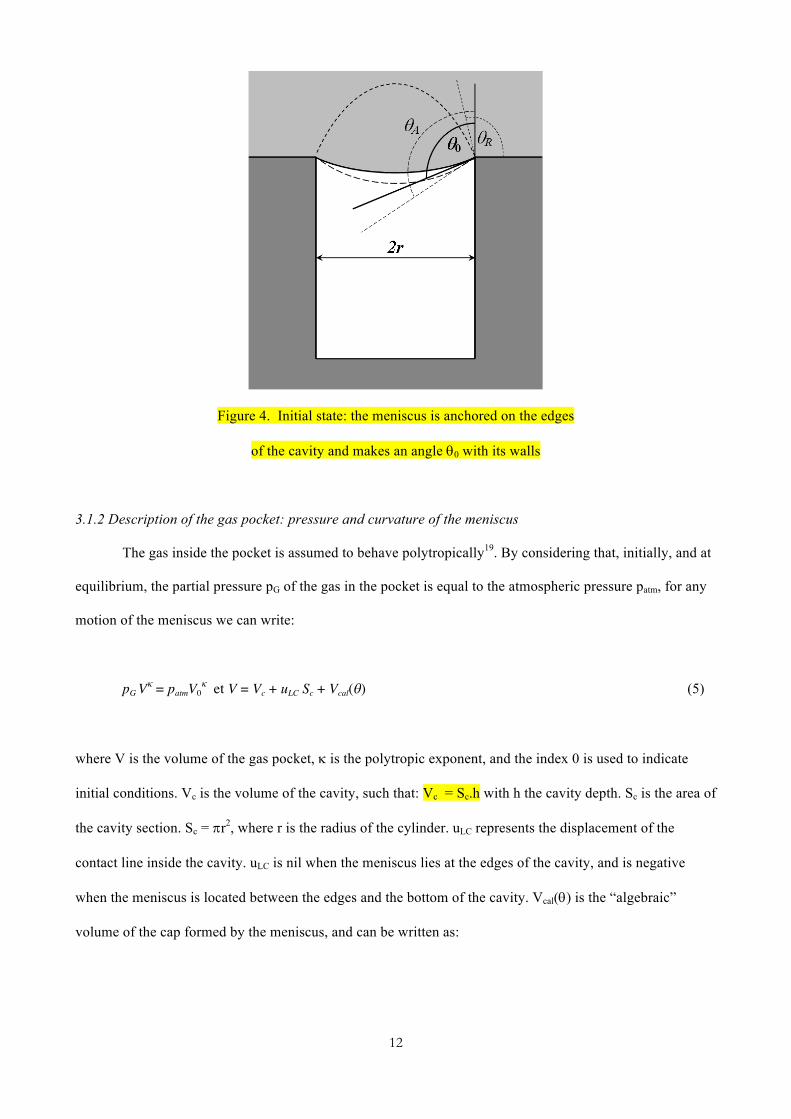
In order to simplify the theoretical problem, as well as the production of samples, the geometry of
the studied gas pocket is approximated by a cylinder. Fig. 4 shows such a gas pocket, closed by a convex (as
seen from the gas) liquid-gas interface, which will be referred to as a meniscus. This flexible interface is
anchored to the edges of the cylindrical cavity and can change its curvature, since the equilibrium contact
angle, noted q, can vary between the maximum advancing qA and the minimum receding qR contact angles,
which depend on the local surface roughness. A 90° corner represents a particular type of local roughness,
which allows the transition from qR with respect to the horizontal surface, to qA with respect to the vertical
surface, when the gas pocket volume decreases, as shown in Fig. 4.
12
Figure 4. Initial state: the meniscus is anchored on the edges
of the cavity and makes an angle q0 with its walls
3.1.2 Description of the gas pocket: pressure and curvature of the meniscus
The gas inside the pocket is assumed to behave polytropically19. By considering that, initially, and at
equilibrium, the partial pressure pG of the gas in the pocket is equal to the atmospheric pressure patm, for any
motion of the meniscus we can write:
pG Vk = patmV0k et V = Vc + uLC Sc + Vcal(q) (5)
where V is the volume of the gas pocket, k is the polytropic exponent, and the index 0 is used to indicate
initial conditions. Vc is the volume of the cavity, such that: Vc = Sc.h with h the cavity depth. Sc is the area of
the cavity section. Sc = pr2, where r is the radius of the cylinder. uLC represents the displacement of the
contact line inside the cavity. uLC is nil when the meniscus lies at the edges of the cavity, and is negative
when the meniscus is located between the edges and the bottom of the cavity. Vcal(q) is the “algebraic”
volume of the cap formed by the meniscus, and can be written as:
13
( ) ( )( )2
3
sin1cossin2
31
qqqpq
+
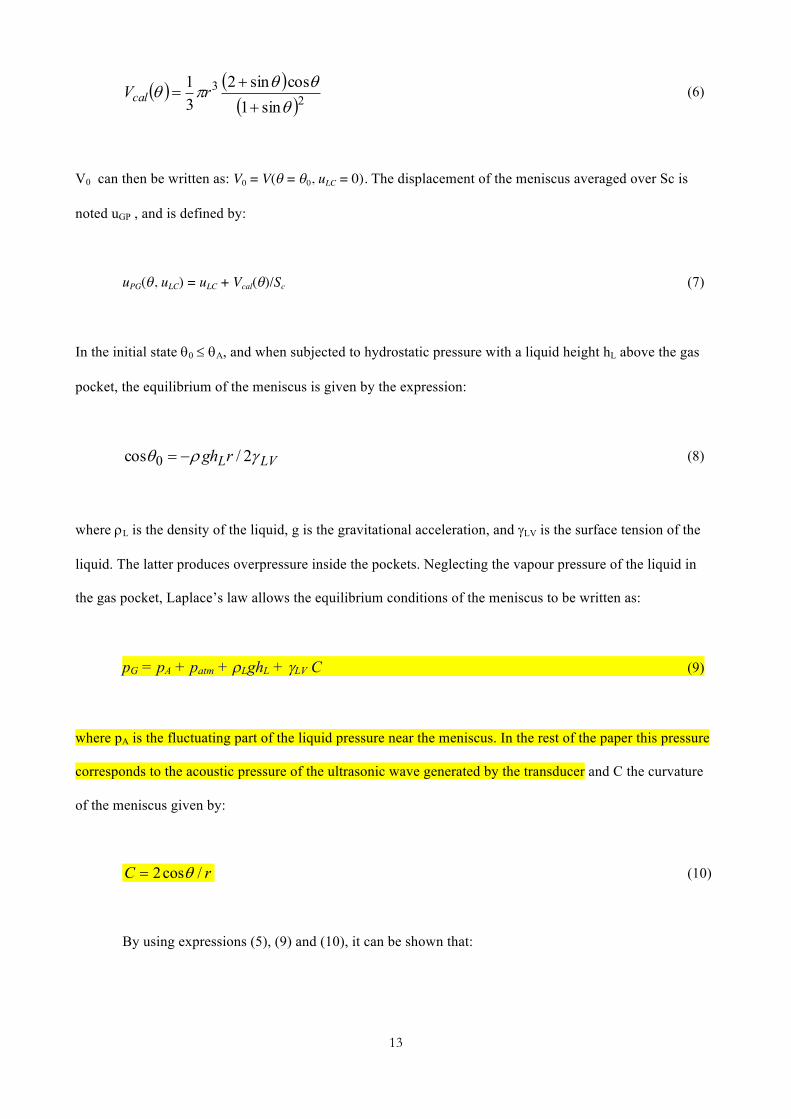
+= rVcal (6)
V0 can then be written as: V0 = V(q = q0, uLC = 0). The displacement of the meniscus averaged over Sc is
noted uGP , and is defined by:
uPG(q, uLC) = uLC + Vcal(q)/Sc (7)
In the initial state q0 £ qA, and when subjected to hydrostatic pressure with a liquid height hL above the gas
pocket, the equilibrium of the meniscus is given by the expression:
LVLrgh grq 2/cos 0 -= (8)
where rL is the density of the liquid, g is the gravitational acceleration, and gLV is the surface tension of the
liquid. The latter produces overpressure inside the pockets. Neglecting the vapour pressure of the liquid in
the gas pocket, Laplace’s law allows the equilibrium conditions of the meniscus to be written as:
pG = pA + patm + rLghL + gLV C (9)
where pA is the fluctuating part of the liquid pressure near the meniscus. In the rest of the paper this pressure
corresponds to the acoustic pressure of the ultrasonic wave generated by the transducer and C the curvature
of the meniscus given by:
rC /cos2 q= (10)
By using expressions (5), (9) and (10), it can be shown that:

14
( ) rghp
VVp LV
LAatmqgr
q
k cos210 ++=÷÷
ø
ö
çç
è
æ-÷÷
ø
öççè
æ (11)
3.1.3 Definition of the static stiffness per unit area KGPs of the gas pocket
Unlike the method used by Leighton27, the static stiffness per unit area KGPs (G stands for Gas, P for
pocket and s for static) is determined by using the Laplace pressure contribution, and taking the curvature of
the meniscus into account, in addition to the resistance to compression and traction contributed by the gas in
the pocket.
If the gas pocket is considered to be a spring with a stiffness per unit area KGPs , then it will respond
to a small displacement duGP of the meniscus by exerting a pressure -KGPs duGP. If dp represents a small
variation in the pressure with which the liquid pushes on the meniscus, such that dp > 0 for overpressure and
dp < 0 for depression, then KGPs can be written as:
GP
GPs dudpK -= . (12)
When at rest, if the meniscus is anchored to the edges of the cylindrical cavity and adopts an
equilibrium angle q, expression (12) can be rewritten as:
( )0
1
00
÷÷ø
öççè
æ÷øö
çèæ
÷øö
çèæ-=
-
GP
AGPs du
dVddV
ddpK
qq qq
q (13)
If we consider the case in which the meniscus is anchored to the edges of the cavity, such that
uLC = 0, from expressions (5) and (7) it follows that:
15
cGP
SdudV
=÷÷ø
öççè
æ
0 (14)
from (11):
rd
dVVp
ddp LVatmA 0
0
sin2
00
qgq
kq qq
+÷øö
çèæ-=÷
ø
öçè
æ (15)
and from (5) and (6):
( )
3
20
1 1sin
0rd
dVpq
q q
+-=÷
øö
çèæ
- (16)
Thus, for the case in question of a gas pocket in a cylindrical cavity, expression (13) lead to:
( )
úúû
ù
êêë
é ++=
rrVpSK LVatm
cGPs0
3
20
0
sin21sin qgpqk
(17)
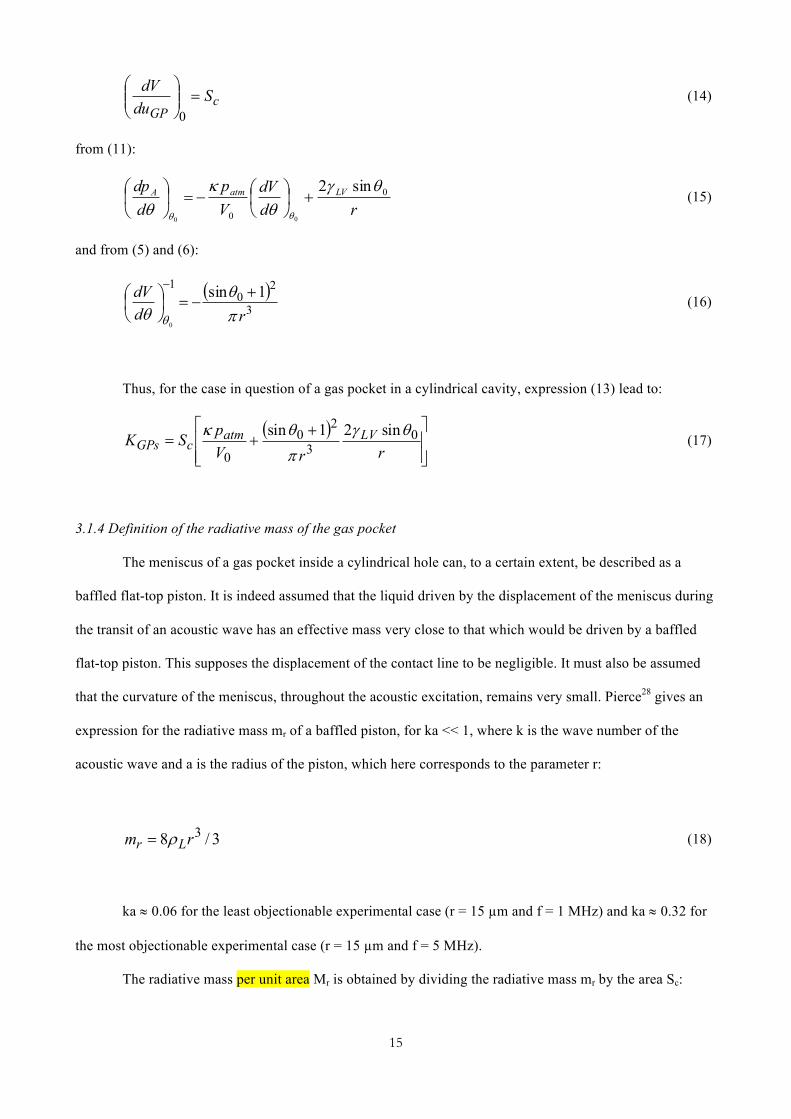
3.1.4 Definition of the radiative mass of the gas pocket
The meniscus of a gas pocket inside a cylindrical hole can, to a certain extent, be described as a
baffled flat-top piston. It is indeed assumed that the liquid driven by the displacement of the meniscus during
the transit of an acoustic wave has an effective mass very close to that which would be driven by a baffled
flat-top piston. This supposes the displacement of the contact line to be negligible. It must also be assumed
that the curvature of the meniscus, throughout the acoustic excitation, remains very small. Pierce28 gives an
expression for the radiative mass mr of a baffled piston, for ka << 1, where k is the wave number of the
acoustic wave and a is the radius of the piston, which here corresponds to the parameter r:
3/8 3rm Lr r= (18)
ka » 0.06 for the least objectionable experimental case (r = 15 µm and f = 1 MHz) and ka » 0.32 for
the most objectionable experimental case (r = 15 µm and f = 5 MHz).
The radiative mass per unit area Mr is obtained by dividing the radiative mass mr by the area Sc:

16
pr 3/8 rM Lr = (19)
3.1.5Definition of the "dynamic stiffness" of the gas pocket
If the gas pocket is considered to be an undamped oscillator with a stiffnes per unit area KGPs and
mass per unit area Mr, the equation governing the displacement of the meniscus is given by:
( ) ( ) ( )tptuKtuM AGPGPsGPr -=+!! (20)
This is a conservative behaviour in which viscous friction losses are neglected. The natural angular
frequency of the gas pocket wGP can then be expressed by:
r
GPsGP M
K=w (21)
If pA is a harmonic function, complex notation can be used to express equation (20) as:
tiAGPsr ePyKyM w-=+!! (22)
where y is the complex equivalent of uPG. The solution to y = Yeiwt, where w is the excitation angular
frequency (of the ultrasound), leads to:
( ) AGPsr PYKM =-2w (23)

17
Here, KGPs - Mrw2 represents the "dynamic stiffness" per unit area of the gas pocket. This “dynamic
stiffness” takes the static stiffness of the gas pocket, as well as an “inertial resistance” into account, the latter
being related to the acoustic excitation frequency and the radiative mass.
The displacement uGP can thus be expressed as:
GPsr
AGP KM
pu-
=2w
. (24)
3.2 Use of a mass-spring model to represent an imperfect interface
The quasi-static mass-spring model, used to describe ultrasound transmission at an imperfect
interface, is based on the description given by Baik and Thompson10 (Fig. 5.a). By assuming the scatterers on
such an imperfect interface, as well as the spaces in-between the scatterers, to be small in comparison with
the wavelength, the transmission and reflection of ultrasound at the interface can be predicted by describing
the latter as the combination of a spring of stiffness per unit area K, and a distributed mass per unit area M.
Figure 5 – (a) Mass-spring model of the imperfect interface separating medium 1 from medium 2, incident,
transmitted, and reflected waves: I, T and R; (b) conceptual system of the effective spring equivalent to two
independent springs: that of the gas area fraction (left) and solid area fraction (right).
With the area fraction of the solid-liquid interface given by t, and the respective densities of the solid
and the gas given by rS and rG, the density rI of a composite interfacial layer can be expressed as:

18
rI = trS + (1 - t)rG (25)
If h is the height of the interface, M is given by [10] :
( ) ( )( )GS
h
SI hdxM rrtrr --=-= ò 10
. (26)
In the proposed model, illustrated in Fig. 5.b, the interfacial stiffness corresponds to that of an
effective spring equivalent to two springs: that corresponding to the solid area fraction, and that
corresponding to the gas area fraction. The stiffness of the latter is calculated on the basis of the “dynamic
stiffness” of the gas pocket.
The sign convention for displacements has arbitrarily been chosen according to the convention
shown in Fig. 5.b. Thus, as shown in the drawing of Fig. 5.b, the pressure pA is positive and the
displacements uGP and uS are negative. When an acoustic pressure is applied, and is represented by a static
constraint, the displacement of the interface uI can be considered to be a variation in thickness of the
composite interfacial layer, i.e.:
GPGSSI uuu ff += (27)
where uGP is the displacement of the meniscus of each gas pocket given by (24), uS is the
displacement, more precisely the variation in thickness of the solid fraction contained in the interfacial layer,
such that it can be expressed as:
S
AS K
pu -= (28)
Since silicon is a cubic crystal with elastic constants such as C11 = C22 = C33 and since the
longitudinal sound wave propagation direction is parallel to one of the crystal symmetrical axis, KS can be
calculated by the relationship:
19
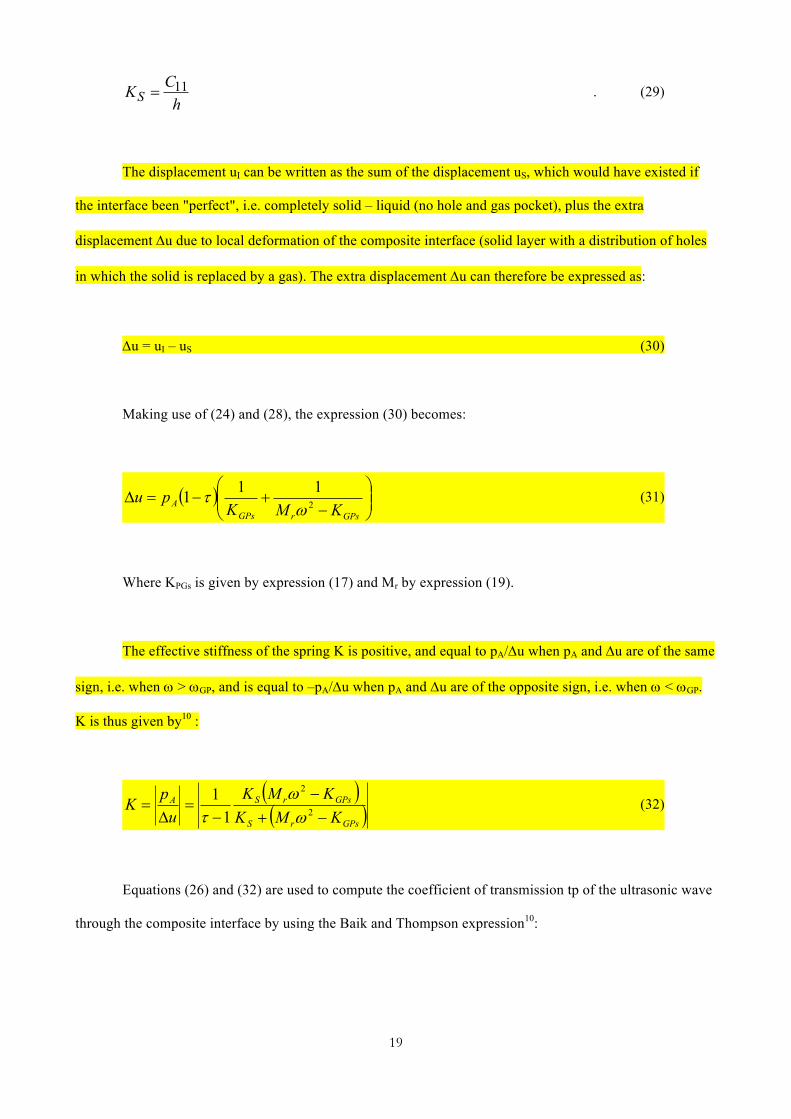
hCKS 11= . (29)
The displacement uI can be written as the sum of the displacement uS, which would have existed if
the interface been "perfect", i.e. completely solid – liquid (no hole and gas pocket), plus the extra
displacement Du due to local deformation of the composite interface (solid layer with a distribution of holes
in which the solid is replaced by a gas). The extra displacement Du can therefore be expressed as:
Du = uI – uS (30)
Making use of (24) and (28), the expression (30) becomes:
( ) ÷÷ø
öççè
æ-
+-=DGPsrGPs
A KMKpu 2
111w
t (31)
Where KPGs is given by expression (17) and Mr by expression (19).
The effective stiffness of the spring K is positive, and equal to pA/Du when pA and Du are of the same
sign, i.e. when w > wGP, and is equal to –pA/Du when pA and Du are of the opposite sign, i.e. when w < wGP.
K is thus given by10 :
( )( )GPsrS
GPsrSA
KMKKMK
upK
-+-
-=
D= 2
2
11
ww
t (32)
Equations (26) and (32) are used to compute the coefficient of transmission tp of the ultrasonic wave
through the composite interface by using the Baik and Thompson expression10:
20
( ) ÷
ø
öçè
æ ++÷÷ø
öççè
æ-+
÷÷ø
öççè
æ+
=
MKZZ
iK
MZZ
KMZ
t p21
2
21
2
2
41
412
ww
w
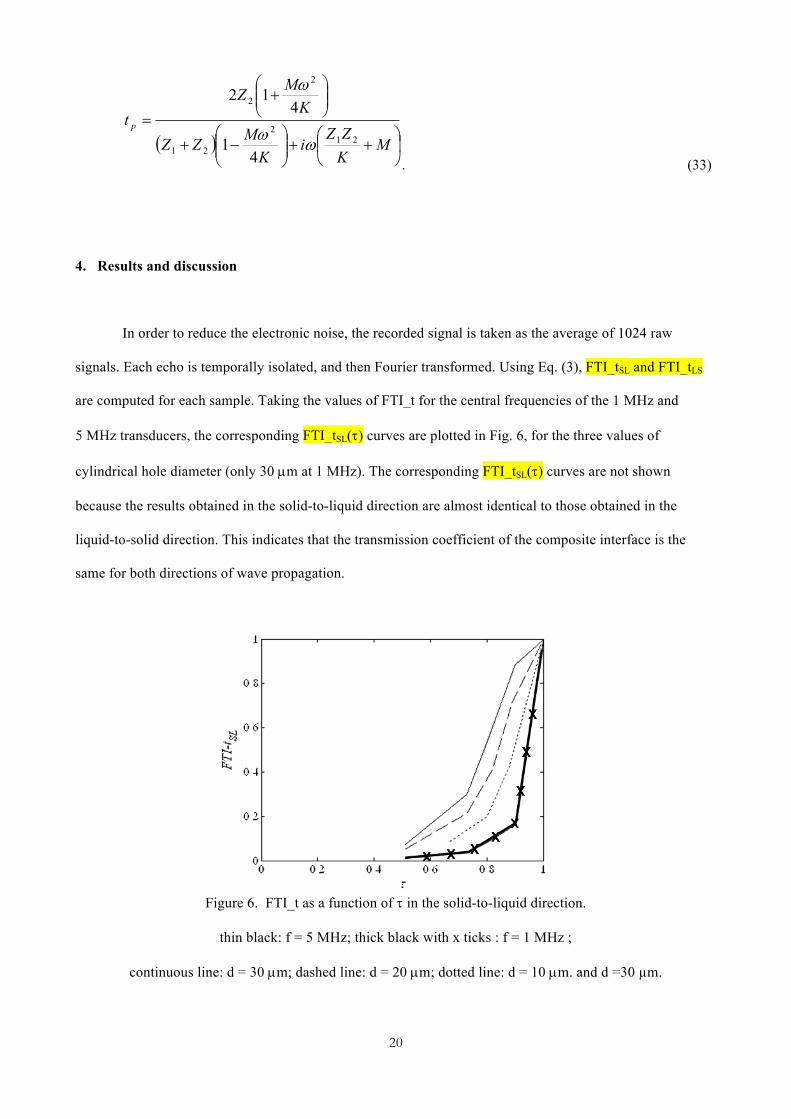
. (33)
4. Results and discussion
In order to reduce the electronic noise, the recorded signal is taken as the average of 1024 raw
signals. Each echo is temporally isolated, and then Fourier transformed. Using Eq. (3), FTI_tSL and FTI_tLS
are computed for each sample. Taking the values of FTI_t for the central frequencies of the 1 MHz and
5 MHz transducers, the corresponding FTI_tSL(t) curves are plotted in Fig. 6, for the three values of
cylindrical hole diameter (only 30 µm at 1 MHz). The corresponding FTI_tSL(t) curves are not shown
because the results obtained in the solid-to-liquid direction are almost identical to those obtained in the
liquid-to-solid direction. This indicates that the transmission coefficient of the composite interface is the
same for both directions of wave propagation.
Figure 6. FTI_t as a function of t in the solid-to-liquid direction.
thin black: f = 5 MHz; thick black with x ticks : f = 1 MHz ;
continuous line: d = 30 µm; dashed line: d = 20 µm; dotted line: d = 10 µm. and d =30 µm.

21
As observed in the previous study7, FTI_t increases with t. In addition, this work shows that, for the
same value of gas area fraction, FTI_t increases with the frequency, and with the diameter of the cylindrical
holes. In other words, it increases with the parameter d/l. This tendency could be explained by the fact that
when d/l increases, the excitation moves away from the resonance frequency of the gas pockets.
The theoretical FTI_tSL(t) curves calculated with our model are presented in Fig. 7 using input data listed in
Table 1. They are plotted using Eq. (1) in which Eqs (4) and (33) have been implemented respectively for the
reference sample and for the "rough" hydrophobic sample replacing subscripts "1" and "2" respectively by
"S" and "L".
Elastic constant of the solid (silicon at 20°C and patm) C11 165.6 GPa Velocity of sound waves in the gas (air at 20°C and patm) cG 344 m/s Velocity of sound waves in the liquid (water at 20°C and patm) cL 1480 m/s 29 Velocity of longitudinal sound waves in the solid (silicium at 20°C and patm)
cS 8430 m/s 30
Gravitational acceleration G 9.81 m/s2 Cavity (or hole) depth H 30 µm Liquid height above the gas pocket hL 100 mm Atmospheric pressure patm 101350 Pa Cylindrical cavity (or hole) radius R 5, 10 and 15 µm Surface tension of the liquid (water at 20°C and patm) gLV 0.07 J/m2 gas (air at 20°C and patm) polytropic exponent k 1 density of the gas (air at 20°C and patm) rG 1.204 kg/m3 density of the liquid (water at 20°C and patm) rL 1000 kg/m3 density of the liquid (silicon at 20°C and patm) rS 2329 kg/m3 Equilibrium contact angle of the meniscus in the initial state (plane meniscus at equilibrium)
q0 90°
Table 1. Input data for the model.

22
Figure 7. Curves for FTI_tSL as a function of t at 1 MHz (black line) and 5 MHz (black line with x
ticks) red line) obtained from our model. Continuous line: d = 30 µm; dashed line: d = 20 µm; dotted line: d
= 10 µm
In the region corresponding to the bold lines, resonance effects are weak, whereas in the region in which fine
lines are used, the errors resulting from the mass-spring model may be significant7.
Figs. 6 and 7 shows that there is a good agreement between the model and the experiment. The drop
in transmission associated with an increase in gas area fraction is rather close to that observed
experimentally. In addition, the predicted trend for variations in transmission as a function of the ultrasound
wave frequency and the diameter of the gas pockets is in good agreement with the experimental results.
However, this model slightly overestimates the ultrasound transmission. One possibility for improving the
model would be to include the effect of viscous dissipation in the form of a damping in the mass-spring
models, as well as the acoustic scattering due to the diffraction of ultrasonic waves on the edges of the holes.
This modelling approach corresponds to a controlled roughness and should be developped in further
works to get closer to the real roughness. It would be possible to obtain a 3D description of a surface to have
a complete roughness mapping. This 3D description should be completed by a modelling approach to obtain
for example an equivalent τ parameter as several parameters should be taken into account (depth but also
slopes). Nevertheless the figure 7 gives yet useful information for industrial use. Using liquid sodium
parameters and with an estimation of t parameter it would be possible to estimate the efficiency of the
transducer in real configurations (transducers immersed in liquid sodium).

23
5. Summary
The aim of the work presented in this paper is to study the ability of ultrasound waves to go through
a composite interface. An experimental study has been undertaken using water as the liquid and hydrophobic
oxidized silicon for the solid surfaces on which a distribution of small calibrated holes have been grooved,
which remain filled with gas when the surface is in contact with water.
The experimental work is complemented by a theoretical approach intended to be predictive. In this
model, the interface has been considered to be a partial contact interface between the liquid and the solid.
Hence a distributed mass and spring model has been used to determine the transmission coefficient of such
an interface. In order to determine the stiffness of the distributed equivalent spring of the entire interface, the
behaviour of a gas pocket under the influence of ultrasound has been predefined.
The experimental and predicted results have been found in semi-quantitative agreement.
Experimental and calculated drop of the ultrasound transmission associated with an increase in gas area
fraction are rather close to each other. In addition, the trend for variations in transmission as a function of
frequency and the diameter of the gas pockets are similar. The overestimation of the ultrasound transmission
by the model could be corrected by taking into account viscous dissipation and scattering effects at the edges
of the cavities.
It has been showed that, in addition to the gas area fraction, the size of the diffusers that are gas
pockets and the ultrasonic frequency excitation have a significant influence on the transmission coefficient at
the interface. Therefore, this simulated study brings new elements of understanding about the transmission
drop at the interface between an ultrasonic transducer and the liquid sodium.
Aknowledgments
The authors express their gratitude to Jean Luc BERTON who contributed
to the modelling approach by his advices and by sharing his great experience in the
use of ultrasound in liquid sodium.

24
References
1 P. Martin, P. Anzieu , J. Rouault, et al., Nucl. Eng. Tech., 39, 237 (2007)
Conf. ANIMMA, F. Baqué, G. Rodriguez, N. Jardin N., J.M. Carpreau, J.M. Augem, J. Sibilo, 1st Int. 2
Marseille (2009)
3 G. Gobillot, F. Baqué, C. Lhuillier, P.H. Brau, M.A. Ploix, J.M. Augem, J.Fr. Saillant, 1st Int. Conf.
ANIMMA, Marseille (2009)
4 K. Paumel, O. Descombin, J. Moysan, G. Corneloup, J.-M. Augem, 1st Int. Conf. ANIMMA, Marseille
(2009)
5 K. Paumel, J. Moysan, M.Autric, C. Gueudré, G. Corneloup, F. Baqué, Nucl. Eng. Des., 239, 2272 (2009 )
6 D. Chatain, C. Lesueur, J.P. Baland, Langmuir, 22, 4230 (2006)
7 C. Lesueur, J. Moysan, G. Corneloup, F. Baqué, NDT&E Int., 41, 155 (2008)
8 K. Kendall, D. Tabor, Proc. Roy. Soc. London, 323, 321 (1971)
9 H.G. Tattersall, J. Appl. Phys., D6, 819 (1973)
10 J.-M. Baik, R.B. Thompson, , J Nondestr Eval, 4, 177 (1984)
11 A. Baltazar, S.I. Rokhlin, C. Pecorari, J. Mech. Phys. Solids, 50, 1397 (2002)
12 F.J. Margetan, R.B. Thompson, J.H. Rose, T.A. Gray, J. Nondestruct. Eval. 11, 109 (1992)
13 N. F. Haines, CEGB Berkeley Nuclear Laboratories, Report RD/B/N4744 (1980)
14 B.W. Drinkwater, R.S. Dwyer Joyce, P. Cawley, Proc R Soc Lond Ser A: Math Phys Eng Sci; 452,1955,
2613 (1996)
15 R.S. Dwyer-Joyce, B.W. Drinkwater, A.M. Quinn, J. Tribol., 123, 9 (2001)
16 A.M. Quinn, B.W. Drinkwater, R.S. Dwyer-Joyce, Ultrasonics, 39, 495 (2002)
17 R. Thomas, B.W. Drinkwater, D. Liaptsis, J. Acoust. Soc. Am., 117, 2 (2005)
18 A.I. Lavrentyev, A. Baltazar, S.I. Rokhlin, Rev. Prog. Quant. Nondestr. Eval., 17, 1379 (1998)
19 C.J. Brotherhood, B.W. Drinkwater, S. Dixon, Ultrasonics, 41, 521 (2003)
20 Y.C. Angel, J.D. Achenbach, J Appl Mech, 52, 33 (1985).
21 R.S. Dwyer-Joyce, T. Reddyhoff, B.W. Drinkwater, Tribol. Trans., 47, 366 (2004)
22 X. Guo, D. Zhang, J. Wu, J. Appl. Phys., 108, 034902 (2010)
23 J.Y. Kim, J.S. Lee, J. Appl. Phys., 101, 043501 (2007)

25
24 P. Attard, S. J. Miklavcic, Langmuir, 17, 8217 (2001)
25 E. Charlaix, H. Gayvallet, Jour. de Phys. II, 2, 2025 (1992)
26 Z. Guo, A. G. Jones,H. Hao, B. Patel, N. Li, J. Appl. Phys., 101, 043501 (2007)
27 T.G. Leighton, P.R. White, M.A. Marsden, Acta Acustica, 3-6, 517 (1995)
28 A.D. Pierce, Acoustical Society of America (1991)
29 V.A. Del Grosso, C.W. Mader, J. Acoust. Soc. Am., 52, 1442 (1972)
30 S.D. Lambade, G.G. Sahasrabudhe, S. Rajagopalan, Phys. Rev. B, 51 (1995).