Barrick Reports Second Quarter 2015 Results SECOND QUARTER 2015 3 PRESS RELEASE assets represent an...
22
BARRICK SECOND QUARTER 2015 1 PRESS RELEASE SECOND QUARTER REPORT 2015 All amounts expressed in US dollars Barrick Reports Second Quarter 2015 Results Company reported a net loss of $9 million ($0.01 per share) in the second quarter; adjusted net earnings were $60 million ($0.05 per share) 1 . Free cash flow was $26 million 1 and operating cash flow was $525 million. Production in the second quarter was 1.45 million ounces of gold at all-in sustaining costs (AISC) of $895 per ounce 1 . Full-year gold production is now expected to be 6.1-6.4 million ounces, reflecting the impact of asset sales. All-in sustaining cost guidance for 2015 has been reduced to $840-$880 per ounce. Total debt reduced by approximately $250 million in first half. $2.45 billion in asset sales and joint ventures announced to date. Targeting $2 billion in reduced expenditures across the company by the end of 2016. Capital and other expenditures reduced by $240 million in the second quarter. Lowered quarterly dividend to two cents per share. Scenario planning completed for gold prices down to $900 per ounce. On track to achieve approximately $50 million in G&A cost savings in 2015, exceeding original $30 million target for the year. Targeting $90 million in annualized savings in 2016, up from original target of $70 million. Completed Preliminary Economic Assessments on projects with the potential to significantly extend mine life at Lagunas Norte and Pueblo Viejo. TORONTO, August 5, 2015 — Barrick Gold Corporation (NYSE:ABX) (TSX:ABX) (Barrick or the "company") reported a net loss of $9 million ($0.01 per share) for the second quarter, with adjusted net earnings of $60 million ($0.05 per share). Free cash flow was $26 million, compared to negative free cash flow of $128 million in the prior year period. Operating cash flow in the second quarter was $525 million. Second quarter adjusted EBITDA was $725 million 1 . On an unadjusted basis, EBITDA was $690 million 1 . Gold production guidance for 2015 has been adjusted to 6.1-6.4 million ounces to reflect the impact of divestments, with production 55 percent weighted to the second half of the year. Costs are expected to be 10 percent lower in the second half of 2015. Full-year all-in sustaining cost guidance is $840-$880 per ounce, down from $860-$895 per ounce. 1 All-in sustaining costs per ounce, adjusted net earnings and adjusted net earnings per share, free cash flow, adjusted EBITDA and EBITDA are non-GAAP financial performance measures with no standardized definition under IFRS. For further information and detailed reconciliations, please see pages 50-56 of Barrick’s Second Quarter 2015 Report.
-
Upload
truongdiep -
Category
Documents
-
view
215 -
download
0
Transcript of Barrick Reports Second Quarter 2015 Results SECOND QUARTER 2015 3 PRESS RELEASE assets represent an...

BARRICK SECOND QUARTER 2015 1 PRESS RELEASE
SECOND QUARTER REPORT 2015 All amounts expressed in US dollars
Barrick Reports Second Quarter 2015 Results
Company reported a net loss of $9 million ($0.01 per share) in the second quarter; adjusted
net earnings were $60 million ($0.05 per share)1.
Free cash flow was $26 million1 and operating cash flow was $525 million.
Production in the second quarter was 1.45 million ounces of gold at all-in sustaining costs
(AISC) of $895 per ounce1.
Full-year gold production is now expected to be 6.1-6.4 million ounces, reflecting the impact of
asset sales.
All-in sustaining cost guidance for 2015 has been reduced to $840-$880 per ounce.
Total debt reduced by approximately $250 million in first half.
$2.45 billion in asset sales and joint ventures announced to date.
Targeting $2 billion in reduced expenditures across the company by the end of 2016.
Capital and other expenditures reduced by $240 million in the second quarter.
Lowered quarterly dividend to two cents per share.
Scenario planning completed for gold prices down to $900 per ounce.
On track to achieve approximately $50 million in G&A cost savings in 2015, exceeding original
$30 million target for the year. Targeting $90 million in annualized savings in 2016, up from
original target of $70 million.
Completed Preliminary Economic Assessments on projects with the potential to significantly
extend mine life at Lagunas Norte and Pueblo Viejo.
TORONTO, August 5, 2015 — Barrick Gold Corporation (NYSE:ABX) (TSX:ABX) (Barrick or the
"company") reported a net loss of $9 million ($0.01 per share) for the second quarter, with adjusted
net earnings of $60 million ($0.05 per share). Free cash flow was $26 million, compared to negative
free cash flow of $128 million in the prior year period. Operating cash flow in the second quarter was
$525 million. Second quarter adjusted EBITDA was $725 million1. On an unadjusted basis, EBITDA was
$690 million1.
Gold production guidance for 2015 has been adjusted to 6.1-6.4 million ounces to reflect the
impact of divestments, with production 55 percent weighted to the second half of the year. Costs are
expected to be 10 percent lower in the second half of 2015. Full-year all-in sustaining cost guidance is
$840-$880 per ounce, down from $860-$895 per ounce.
1 All-in sustaining costs per ounce, adjusted net earnings and adjusted net earnings per share, free cash flow, adjusted EBITDA and EBITDA are non-GAAP financial performance measures with no standardized definition under IFRS. For further information and detailed reconciliations, please see pages 50-56 of Barrick’s Second Quarter 2015 Report.

BARRICK SECOND QUARTER 2015 2 PRESS RELEASE
The implementation of a lean, decentralized operating model designed to maximize free cash flow
and take costs out of the business has helped to mitigate the impact of recent gold price declines. We
have cut $300 million in capital spending so far this year and are on track to achieve $90 million in
reduced general and administrative (G&A) expenditures by 2016. We have also made significant
progress on our debt reduction target. Our current focus is on improving productivity and reducing
operating costs to ensure our business is robust enough to generate a 10-15 percent return on
invested capital through the metal price cycle.
STRENGTHENING THE BALANCE SHEET
Earlier this year, we set a debt reduction target of $3 billion for 2015. Thus far, we have announced
agreements representing $2.45 billion from asset sales, joint ventures and streaming. In addition, we
have also retired approximately $250 million in debt using cash on hand in the first half of this year.
Collectively, these actions represent $2.7 billion, or 90 percent of our target. Transactions
announced to date include:
Sale of 100 percent of the Cowal mine for $550 million in cash, further focusing the
geographic footprint of our portfolio by divesting the last Barrick-operated mine in Australia.
Sale of a 50 percent interest in Barrick (Niugini) Ltd. for $298 million in cash2, establishing a
long-term strategic partnership with China’s Zijin Mining.
Sale of a 50 percent interest in the Zaldívar copper mine for $1.005 billion in cash2, realizing
significant value from a non-core operation while maintaining a sizeable stake in this cash-
generating asset. This transaction has also resulted in a new partnership with Antofagasta Plc,
one of the world’s leading copper companies, with significant opportunities to collaborate on
potential projects in the future.
Streaming agreement on a portion of Barrick’s share of gold and silver production from
Pueblo Viejo for $610 million in cash2, structured to maintain significant exposure to higher
metal prices.
With a $4 billion undrawn credit facility and $2.1 billion in cash on hand at the end of the second
quarter, we will continue to pursue our debt reduction target in a disciplined manner and will take
only those actions that make sense for the business, on terms we consider favorable to our
shareholders.
Additional asset divestments
Over the last several months, Barrick has received a number of proposals and expressions of interest
relating to the proposed acquisition of various non-core assets in Nevada and Montana. Over the next
several weeks, we intend to commence a formal process to sell Bald Mountain, Round Mountain (50
percent interest), Spring Valley (70 percent interest), Ruby Hill, Hilltop and Golden Sunlight. These
2 Barrick has entered into agreements to sell 50 percent of its interests in Barrick (Niugini) Ltd. and Zaldívar, and to sell a gold-silver stream linked to its 60 percent interest in the Pueblo Viejo mine. These transactions are expected close in the third quarter, late 2015, and early in the fourth quarter, respectively.

BARRICK SECOND QUARTER 2015 3 PRESS RELEASE
assets represent an attractive portfolio of producing and development-stage assets in a politically
stable and highly prospective region.
OPERATIONAL FOCUS
Our strategy is focused on maximizing free cash flow per share from a portfolio of high-quality gold
assets in our core regions, underpinned by disciplined capital allocation and operational excellence. In
the past six months, we have taken significant actions to improve our business plans, resulting in
positive free cash flow in the second quarter. We remain focused on improving productivity and
driving down costs to ensure we can continue to generate free cash flow in the current gold price
environment.
Anticipating the potential for weaker gold prices in the second half of 2015, we challenged our
leaders to cut spending by $1 billion. We have now increased this target. By the end of 2016, we are
targeting $2 billion in reduced expenditures across the company. These reductions will come from
operating expenses, capital spending and corporate overhead. We have identified $1.4 billion in
potential opportunities to date. This will strengthen the resilience of our portfolio in a lower gold
price environment, while positioning us to deliver stronger margins when gold prices recover.
These efforts are benefiting from the outcomes of our Value Realization reviews, which have now
been completed for all operations. This process has identified concrete projects to maximize free
cash flow, extend mine lives and lower costs. The reviews also support non-core asset sales by
ensuring we understand the full value of every mine before proceeding with any divestiture. For
details on key Value Realization opportunities identified at Lagunas Norte and Pueblo Viejo, please
see Appendix 1 on page 9. For certain related risk factors, please see the cautionary statement on
forward-looking information at the end of this press release.
We have also carried out a series of scenario planning exercises that detail actions we can take to
optimize mine plans and increase flexibility in a lower gold price environment. These actions include:
Adjust life-of-mine plans to maximize
short-term free cash flow
Place higher-cost operations on
temporary care and maintenance
Defer stripping activities
Close or divest mines that do not meet
capital allocation objectives
Increase cut-off grades
Reduce mining/processing rates
Further reduce G&A and exploration
Further reduce sustaining capital
Process higher-grade stockpiles
Capital Costs
As we continue to review all expenditures for 2015 and 2016, we are cancelling or deferring spending
that does not meet our capital allocation objectives, which include, first and foremost, the ability to
meet a hurdle rate of 15 percent. In the second quarter, we identified $240 million in reductions that
have now been removed from our plans. Total capital expenditures for 2015 are now expected to be
$1.6-$1.9 billion, 20 percent lower than in 2014.
BARRICK SECOND QUARTER 2015 4 PRESS RELEASE
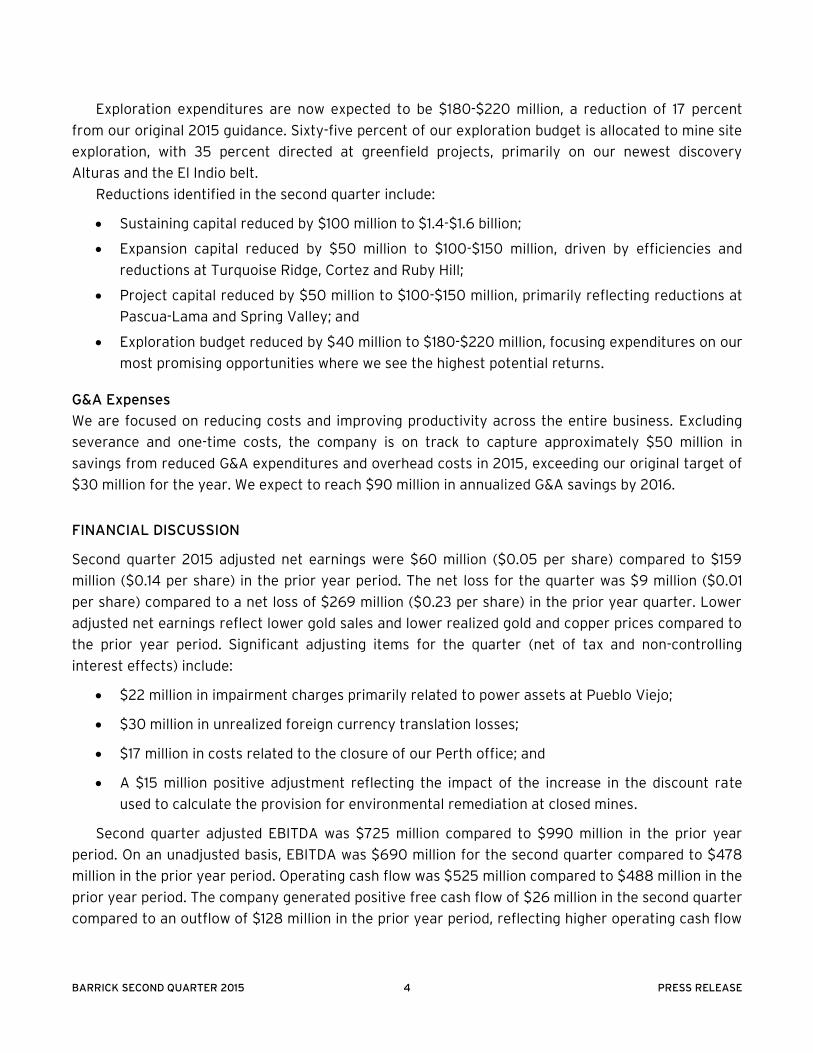
Exploration expenditures are now expected to be $180-$220 million, a reduction of 17 percent
from our original 2015 guidance. Sixty-five percent of our exploration budget is allocated to mine site
exploration, with 35 percent directed at greenfield projects, primarily on our newest discovery
Alturas and the El Indio belt.
Reductions identified in the second quarter include:
Sustaining capital reduced by $100 million to $1.4-$1.6 billion;
Expansion capital reduced by $50 million to $100-$150 million, driven by efficiencies and
reductions at Turquoise Ridge, Cortez and Ruby Hill;
Project capital reduced by $50 million to $100-$150 million, primarily reflecting reductions at
Pascua-Lama and Spring Valley; and
Exploration budget reduced by $40 million to $180-$220 million, focusing expenditures on our
most promising opportunities where we see the highest potential returns.
G&A Expenses
We are focused on reducing costs and improving productivity across the entire business. Excluding
severance and one-time costs, the company is on track to capture approximately $50 million in
savings from reduced G&A expenditures and overhead costs in 2015, exceeding our original target of
$30 million for the year. We expect to reach $90 million in annualized G&A savings by 2016.
FINANCIAL DISCUSSION
Second quarter 2015 adjusted net earnings were $60 million ($0.05 per share) compared to $159
million ($0.14 per share) in the prior year period. The net loss for the quarter was $9 million ($0.01
per share) compared to a net loss of $269 million ($0.23 per share) in the prior year quarter. Lower
adjusted net earnings reflect lower gold sales and lower realized gold and copper prices compared to
the prior year period. Significant adjusting items for the quarter (net of tax and non-controlling
interest effects) include:
$22 million in impairment charges primarily related to power assets at Pueblo Viejo;
$30 million in unrealized foreign currency translation losses;
$17 million in costs related to the closure of our Perth office; and
A $15 million positive adjustment reflecting the impact of the increase in the discount rate
used to calculate the provision for environmental remediation at closed mines.
Second quarter adjusted EBITDA was $725 million compared to $990 million in the prior year
period. On an unadjusted basis, EBITDA was $690 million for the second quarter compared to $478
million in the prior year period. Operating cash flow was $525 million compared to $488 million in the
prior year period. The company generated positive free cash flow of $26 million in the second quarter
compared to an outflow of $128 million in the prior year period, reflecting higher operating cash flow
BARRICK SECOND QUARTER 2015 5 PRESS RELEASE
and lower capital expenditures as a result of the company’s continued emphasis on rigorous capital
discipline.
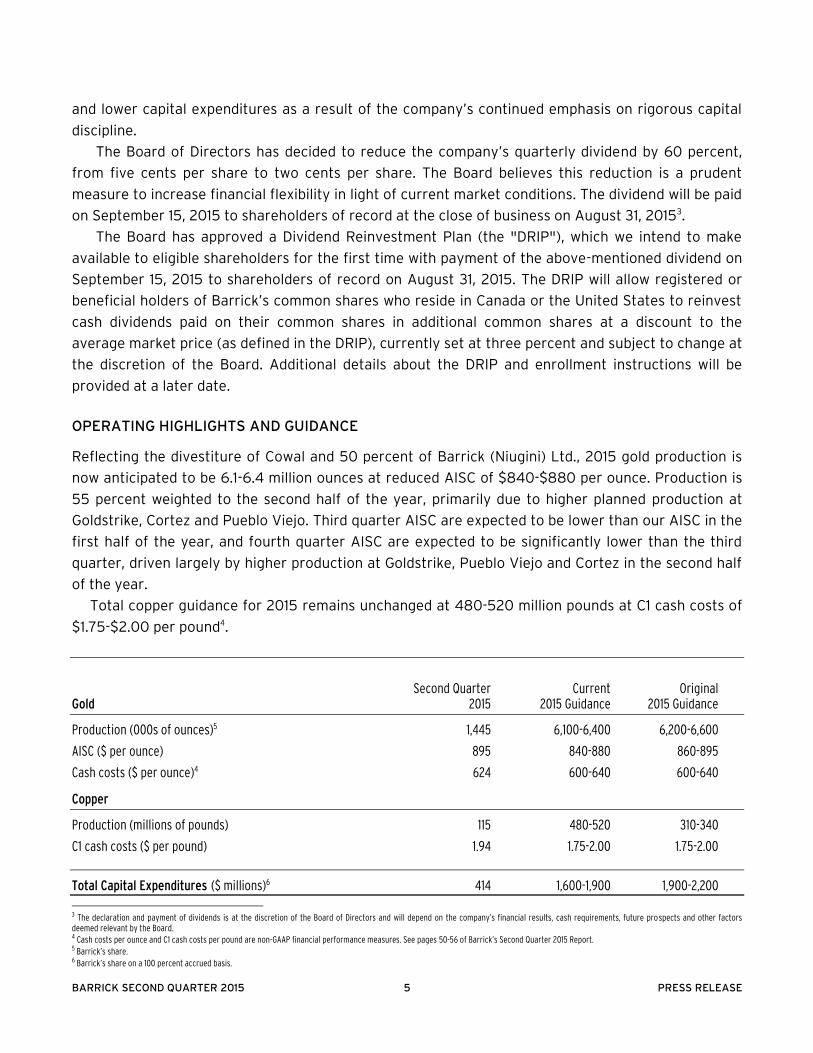
The Board of Directors has decided to reduce the company’s quarterly dividend by 60 percent,
from five cents per share to two cents per share. The Board believes this reduction is a prudent
measure to increase financial flexibility in light of current market conditions. The dividend will be paid
on September 15, 2015 to shareholders of record at the close of business on August 31, 20153.
The Board has approved a Dividend Reinvestment Plan (the "DRIP"), which we intend to make
available to eligible shareholders for the first time with payment of the above-mentioned dividend on
September 15, 2015 to shareholders of record on August 31, 2015. The DRIP will allow registered or
beneficial holders of Barrick’s common shares who reside in Canada or the United States to reinvest
cash dividends paid on their common shares in additional common shares at a discount to the
average market price (as defined in the DRIP), currently set at three percent and subject to change at
the discretion of the Board. Additional details about the DRIP and enrollment instructions will be
provided at a later date.
OPERATING HIGHLIGHTS AND GUIDANCE
Reflecting the divestiture of Cowal and 50 percent of Barrick (Niugini) Ltd., 2015 gold production is
now anticipated to be 6.1-6.4 million ounces at reduced AISC of $840-$880 per ounce. Production is
55 percent weighted to the second half of the year, primarily due to higher planned production at
Goldstrike, Cortez and Pueblo Viejo. Third quarter AISC are expected to be lower than our AISC in the
first half of the year, and fourth quarter AISC are expected to be significantly lower than the third
quarter, driven largely by higher production at Goldstrike, Pueblo Viejo and Cortez in the second half
of the year.
Total copper guidance for 2015 remains unchanged at 480-520 million pounds at C1 cash costs of
$1.75-$2.00 per pound4.
Second Quarter Current Original Gold 2015 2015 Guidance 2015 Guidance
Production (000s of ounces)5 1,445 6,100-6,400 6,200-6,600
AISC ($ per ounce) 895 840-880 860-895
Cash costs ($ per ounce)4 624 600-640 600-640
Copper
Production (millions of pounds) 115 480-520 310-340
C1 cash costs ($ per pound) 1.94 1.75-2.00 1.75-2.00
Total Capital Expenditures ($ millions)6 414 1,600-1,900 1,900-2,200
3 The declaration and payment of dividends is at the discretion of the Board of Directors and will depend on the company’s financial results, cash requirements, future prospects and other factors deemed relevant by the Board. 4 Cash costs per ounce and C1 cash costs per pound are non-GAAP financial performance measures. See pages 50-56 of Barrick’s Second Quarter 2015 Report. 5 Barrick’s share. 6 Barrick’s share on a 100 percent accrued basis.

BARRICK SECOND QUARTER 2015 6 PRESS RELEASE
Cortez
The Cortez mine produced 193,000 ounces at AISC of $811 per ounce in the second quarter.
Production benefited from positive grade reconciliations in the Cortez Hills open pit and improved
underground productivity, as well as from some initial treatment of refractory ore through
Goldstrike’s thiosulfate (TCM) process. AISC were positively impacted by higher production, lower
operating costs and lower sustaining capital. Production in 2015 is forecast to be 825,000-900,000
ounces at AISC of $760-$835 per ounce. Production in the second half is fourth-quarter weighted as
the open pit transitions into higher-grade ore and as the ramp-up of the TCM circuit at Goldstrike
allows for additional processing of refractory ore from Cortez.
Goldstrike
The Goldstrike mine contributed 206,000 ounces in the second quarter, in line with plan. AISC of
$732 per ounce were better than expected on higher tonnes and grades from the underground
operation, as well as lower sustaining capital. Grades and recoveries from the TCM circuit continue to
be consistent with feasibility results. Several adjustments were implemented to improve the
throughput of the circuit during the commissioning phase and the process is expected to ramp up on
schedule this year. Production and AISC guidance for 2015 is 1.00-1.15 million ounces and $700-$800
per ounce. The third quarter is expected to be the stronger of the two remaining quarters on higher
anticipated open pit grades.
Pueblo Viejo
Barrick’s 60 percent share of production from Pueblo Viejo for the second quarter was 131,000
ounces at AISC of $682 per ounce. Production in the quarter was lower than planned due to lower
gold recoveries, largely related to a higher proportion of carbonaceous ore. AISC were also impacted
by lower silver recoveries associated with a temporary shutdown of the lime boil process during
scheduled autoclave maintenance. Recent modifications to the lime boil are showing significantly
improved silver recoveries and the first copper concentrate was shipped in the second quarter.
Attributable production in 2015 is forecast to be 625,000-675,000 ounces at AISC of $540-$590 per
ounce. Production is expected to be higher and costs lower in the fourth quarter compared to the
third quarter on higher-expected grades, improved recoveries and better autoclave availability, as
maintenance shutdowns were weighted to the first half of 2015.
Lagunas Norte
The Lagunas Norte mine contributed 155,000 ounces at AISC of $509 per ounce in the second
quarter. Production was in line with expectations while AISC were better than plan on lower
sustaining capital. Production in 2015 is anticipated to be 600,000–650,000 ounces at AISC of $600-
$650 per ounce.
Veladero
The Veladero mine produced 151,000 ounces of gold in the second quarter, in line with plan. AISC of
$961 per ounce benefited from higher than expected sales and lower sustaining capital. Production

BARRICK SECOND QUARTER 2015 7 PRESS RELEASE
guidance for 2015 is 575,000-625,000 ounces at AISC of $950-$1,035 per ounce, with second half
costs expected to be highest in the third quarter related to capitalized stripping and sustaining
capital, as well as lower byproduct credits.
Turquoise Ridge
The Turquoise Ridge mine contributed 52,000 ounces (75 percent basis), in line with
expectations. AISC of $780 per ounce reflect higher sustaining capital associated with the focus
on growing production and improving ventilation. Costs are expected to be highest in the third
quarter related to these efforts as well as to feasibility and detailed engineering work for the
second shaft project. The mine is forecast to produce 175,000-200,000 ounces (75 percent
basis) in 2015 at AISC of $775-$825 per ounce.
Porgera
The Porgera mine produced 118,000 ounces (95 percent basis), slightly below plan on lower open pit
grades. AISC of $1,128 per ounce were lower than expected as a result of lower capitalized stripping
costs due to fewer waste tonnes mined and lower sustaining capital. Reflecting the partial divestiture,
attributable production in 2015 is now expected to be 400,000-450,000 ounces at AISC of $1,025-
$1,125 per ounce.
Other Mines
Barrick’s other mines — consisting of Bald Mountain, Round Mountain, Golden Sunlight, Ruby
Hill, Hemlo, Cowal, KCGM and Pierina — contributed 320,000 ounces at AISC of $895 per ounce
in the second quarter. An improved closure plan at Pierina is expected to contribute
approximately 270,000 ounces over the next three-and-a-half years for minimal capital.
Acacia Mining
Barrick’s share of second quarter production was 119,000 ounces at AISC of $1,149 per ounce.
Attributable 2015 production from Acacia is anticipated to be 480,000-510,000 ounces at AISC of
$1,050-$1,100 per ounce. Production will be weighted to the second half of 2015, driven by
operational improvements and a planned ramp-up at Bulyanhulu.
Global Copper
Copper production in the second quarter was 115 million pounds at C1 cash costs of $1.94 per pound.
For 2015, copper production is anticipated to be 480-520 million pounds at C1 cash costs of $1.75-
$2.00 per pound.
Lumwana contributed 63 million pounds at C1 cash costs of $2.01 per pound in the second
quarter, in line with expectations. The Zambian government has ratified amendments to the
country’s mining tax regime that replaced the recently-adopted 20 percent gross royalty on open pit
mines with a nine percent royalty, and reintroduced a 30 percent corporate income tax and a 15
percent variable profits tax. Production is anticipated to be 250-270 million pounds at C1 cash costs
of $1.90-$2.15 per pound in 2015.

BARRICK SECOND QUARTER 2015 8 PRESS RELEASE
Production of 52 million pounds at Zaldívar at C1 cash costs of $1.85 per pound in the second
quarter was in line with plan. Production for 2015 is anticipated to be 230-250 million pounds at C1
cash costs of $1.65-$1.95 per pound.
At Jabal Sayid, first shipments of low-cost copper-in-concentrate are anticipated in early 2016.
Once the mine reaches full production, the average annual output is expected to be 100 million
pounds per year with the potential to increase to 130 million pounds.

BARRICK SECOND QUARTER 2015 9 PRESS RELEASE
APPENDIX 1 – Key Value Realization Initiatives at Barrick’s Lagunas Norte and Pueblo Viejo Mines
Lagunas Norte
Refractory Material Mine Life Extension Project: Since it began operations in 2005, Lagunas Norte
has outperformed production expectations and become one of our most profitable mines. In 2014, the
mine produced 582,000 ounces of gold at all-in sustaining costs of $543 per ounce. In its early years,
production peaked at more than one million ounces per year. To date, Lagunas Norte has operated as
an oxide heap leach mine. The mine will transition from oxide ore into mixed oxide/refractory
material as it approaches the end of its current mine life in 2018.
We have now completed a Preliminary Economic Assessment ("PEA") on a plan to extend the life
of Lagunas Norte by approximately 12 years by mining the refractory material below the oxide ore
body in the current pit. The refractory material cannot be economically processed using heap
leaching due to low recoveries. The plan contemplates the installation of a new grinding-flotation-
autoclave processing circuit to treat the refractory material.
Work has begun on a Pre-Feasibility Study ("PFS") to further assess the technical and financial
viability of, and risks associated with, the project, which has the potential to add nearly two million
ounces of measured and indicated gold resources that are not currently included in the mine’s
existing mineral reserves and resources. Based on the preliminary analysis completed to date, Barrick
expects that approximately $500 million would be required to build the facilities necessary to treat
the refractory material. The PEA for this initiative will be incorporated in an updated technical report
prepared by Barrick's independent technical advisor, Roscoe Postle Associates Inc. ("RPA"), which
Barrick intends to file within 45 days. We expect to complete the PFS on this opportunity by the end
of 2015.
The table below summarizes the mineral resources associated with the Refractory Material Mine
Life Extension Project that, except as otherwise noted, are not included in the mine’s mineral
resource statement as at December 31, 2014.
Gold Mineral Resources Associated with the Refractory Material Mine Life Extension Project1, 2, 3, 4, 5
Category
Tonnes
Gold
(000s)
g/t ounces (000s)
Within pit design6
Measured 1,203 2.60 100
Indicated
21,188
2.54 1,732
Measured and
Indicated 22,391 2.55 1,832
Inferred
314
1.92 19
Heap leach stockpile7
Indicated
5,300
2.29 391
Notes:
1. Mineral resources have been estimated as at December 31, 2014 based on a gold price of $1,400 per ounce. All estimates have been made in accordance with the standards of the Canadian Institute of Mining, Metallurgy and Petroleum in National Instrument 43-101.

BARRICK SECOND QUARTER 2015 10 PRESS RELEASE
2. Mineral resources that are not mineral reserves do not have demonstrated economic viability.
3. Gold cut-off grades ranged from 0.48 g/t to 1.00 g/t depending on the material type.
4. Gold recovery as a result of this initiative is expected to reach an average of 90 percent.
5. Numbers may not add due to rounding.
6. Includes 2.013 million tonnes of measured and indicated resources grading 1.15 g/t gold (74 thousand contained ounces of gold) that were previously reported in the mine’s resource statement as at December 31, 2014.
7. This material is expected to be reclaimed from the existing leach facility and reprocessed through the new facility for this initiative.
The PEA for the Refractory Material Mine Life Extension Project is preliminary in nature and is
based in part on inferred resources which are considered too speculative geologically to have
economic considerations applied to them that would enable them to be categorized as mineral
reserves, and there is no certainty that the PEA will be realized.
Pueblo Viejo
Expansion of Tailings Storage Capacity: Pueblo Viejo is one of the world’s largest, lowest-cost gold
mines. In 2014, Barrick’s 60 percent share of production from the Pueblo Viejo mine was
approximately 665,000 ounces of gold at all-in sustaining costs of $588 per ounce. As reported in
the mine’s resource statement as at December 31, 2014, in addition to existing reserves, Pueblo Viejo
has approximately six million ounces of gold and 37 million ounces of silver in the measured and
indicated resource category (Barrick’s 60 percent share). A significant portion of these resources are
not currently included in reserves due to tailings storage constraints. We have completed a PEA
evaluating a plan to remove these constraints to tailings capacity, which if implemented could allow
Barrick to significantly extend the life of the mine. Barrick expects to complete further engineering
work and commission a PFS in the second half of 2016 to refine the technical and financial analysis
for the increase in tailings storage capacity and confirm whether the measured and indicated
resources described above can be brought into reserves.
Conversion of Power Plant and Lime Kilns to Natural Gas Fuel: Energy is one of the biggest cost
drivers at any mining operation. We have completed a PFS on an initiative to reduce energy costs at
Pueblo Viejo by converting the fuel supply for the Quisqueya I power plant that supplies electricity to
the mine to natural gas from more expensive heavy fuel oil, and retrofitting the lime kilns to burn
natural gas instead of diesel. The power plant was originally designed to operate on multiple fuel
types, including natural gas. The PFS evaluated the delivery and use of liquid or compressed natural
gas to the mine and power plant.
Barrick is currently engaged in negotiations regarding the supply of natural gas to the Quisqueya
I power plant and the Pueblo Viejo mine. If a supply agreement is successfully negotiated, this
initiative to transition to natural gas could be implemented as early as 2017. Barrick anticipates that
the conversion of the power plant and lime kilns at the mine site will require only minimal capital
investment by Pueblo Viejo and that all capital costs associated with the construction of the natural
gas infrastructure including the necessary natural gas pipeline to the power plant would be borne by
the natural gas supplier.

BARRICK SECOND QUARTER 2015 11 PRESS RELEASE
Qualified Persons
A Technical Report supporting the PEA for the "Refractory Material Mine Life Extension Project" at
Lagunas Norte will be prepared in accordance with Form 43-101F1 and filed on SEDAR within 45 days
of this news release. For further information with respect to the key assumptions, parameters and
risks associated with the results of the PEA for the "Refractory Material Mine Life Extension Project"
at Lagunas Norte, the mineral resource estimates included therein and other technical information
with respect to that initiative, please refer to the Technical Report to be made available at
www.sedar.com.
The following qualified persons, as that term is defined in National Instrument 43-101 – Standards
of Disclosure for Mineral Projects, have prepared or supervised the preparation of their relevant
portions of the technical information described above and, in the case of the PEA for the "Refractory
Material Mine Life Extension Project" at Lagunas Norte, the related Technical Report to be filed:
Deborah McCombe, P.Geo., Principal Geologist (RPA)
Graham Clow, P.Eng., Principal Mining Engineer (RPA)
Kathleen Altman, P.E., Ph.D., Principal Metallurgist (RPA)
Richard Lambert, P.E., P.Eng., Principal Mining Engineer (RPA)
Rick Sims, Registered Member SME, Senior Director, Resources and Reserves (Barrick)
Steven Haggarty, P.Eng., Senior Director, Metallurgy (Barrick)
Patrick Garretson, Registered Member SME, Director, Life of Mine Planning (Barrick)

BARRICK SECOND QUARTER 2015 12 PRESS RELEASE
APPENDIX 2 — Detailed 2015 Operating and Capital Expenditure Guidance
GOLD PRODUCTION AND COSTS
Production
(millions of ounces) AISC7
($ per ounce) Cash Costs8
($ per ounce)
Cortez 0.825-0.900 760-835 560-610
Goldstrike 1.000-1.150 700-800 540-590
Pueblo Viejo (60%) 0.625-0.675 540-590 390-425
Lagunas Norte 0.600-0.650 600-650 350-400
Veladero 0.575-0.625 950-1,035 580-630
Sub-total 3.800-4.000 700-750 500-540
Porgera (95%)9 0.400-0.450 1,025-1,125 775-825
Acacia (63.9%) 0.480-0.510 1,050-1,100 695-725
KCGM (50%) 0.315-0.330 915-940 775-800
Cowal 0.120-0.150 740-775 630-655
Hemlo 0.200-0.225 940-980 675-715
Turquoise Ridge (75%) 0.175-0.200 775-825 570-600
Round Mountain (50%) 0.170-0.190 1,180-1,205 875-900
Bald Mountain 0.170-0.195 1,060-1,100 560-600
Golden Sunlight 0.090-0.105 1,000-1,025 740-765
Total Gold 6.100-6.40010 840-880 600-640
COPPER PRODUCTION AND COSTS
Production (millions of pounds)
C1 cash costs ($ per pound)
C3 fully allocated costs11 ($ per pound)
Zaldívar 230-250 1.65-1.95 2.00-2.30
Lumwana 250-270 1.90-2.15 2.65-2.95
Total Copper 480-520 1.75-2.00 2.35-2.65
CAPITAL EXPENDITURES
($ millions)
Mine site sustaining 1,400-1,60012
Mine site expansion 100-150
Projects 100-150
Total 1,600-1,90012
7 All-in sustaining costs are calculated in accordance with the standard published by the World Gold Council ("WGC"). See page 52 of Barrick’s Second Quarter 2015 Report for further details. 8 Cash costs reflect our equity share of unit production costs, including the impact of by-product credits, which is calculated in accordance with the standard published by the WGC. See page 52 of Barrick’s Second Quarter 2015 Report for further details. 9 Production range adjusted for expected closing of the sale of 50 percent of Barrick (Niugini) Ltd. to Zijin Mining which is expected to close in Q3 2015. 10 Operating unit guidance ranges reflect expectations at each individual operating unit, but do not add up to corporate-wide guidance range total. 11 C3 fully allocated costs per pound is a non-GAAP financial performance measure. See pages 50-56 of Barrick’s Second Quarter 2015 Report. 12 We now expect minesite sustaining capital expenditures to be in the range of $1,400-$1,600 million and total capital expenditures to be in the range of $1,600-$1,900 million compared to our previous guidance ranges of $1,500-$1,700 million and $1,800-$2,100 million, respectively.

BARRICK SECOND QUARTER 2015 13 PRESS RELEASE
APPENDIX 3 — Outlook Assumptions and Economic Sensitivity Analysis
2015 Guidance
Assumption Hypothetical
Change Impact on
AISC13 EBITDA13
(millions) FCF13
(millions)
Gold revenue, net of royalties $1,100/oz14 +/- $100/oz n/a $330 $218
Copper revenue, net of royalties $2.50/lb +/- $0.50/lb n/a $133 $88
Gold all-in sustaining costs
Gold royalties & production taxes
$1,100/oz $100/oz ($3)/oz $10 $7
WTI crude oil price15, 16 $60/bbl $10/bbl ($2)/oz $7 $5
Australian dollar exchange rate15 0.80 : 1 +10% $1/oz ($3) ($2)
Australian dollar exchange rate15
0.80 : 1 -10% ($1)/oz $3 $2
Canadian dollar exchange rate15
1.25 : 1 +10% ($2)/oz $6 $4
Canadian dollar exchange rate15
1.25 : 1 -10% $3/oz ($10) ($7)
Copper C1 cash costs Impact on C1
WTI crude oil price15,16 $60/bbl $10/bbl ($0.01)/lb $2 $1
Chilean peso exchange rate15 610 : 1 +10% ($0.01)/lb $4 $3 Chilean peso exchange rate15 610 : 1 -10% $0.05/lb ($12) ($8)
13 All-in sustaining costs per ounce, EBITDA and free cash flow are non-GAAP financial performance measures. See pages 50-56 of Barrick’s Second Quarter 2015 Report. 14 Our outlook assumes an average gold price of $1,100 per ounce and a copper price of $2.50 per pound for the remainder of 2015. 15 Due to our hedging activities, which are reflected in these sensitivities, we are partially protected against changes in these factors. 16 Impact on EBITDA only reflects contracts that mature in 2015.

Three months ended June 30, Six months ended June 30,2015 2014 2015 2014
Operating Results
Gold production (thousands of ounces)1 1,445 1,485 2,835 3,073
Gold sold (thousands of ounces)1 1,466 1,516 2,851 3,134
Per ounce data
Average spot gold price 1,192$ 1,288$ 1,206$ 1,291$
Average realized gold price2 1,190 1,289 1,204 1,287
Cash costs2 624 594 640 588
All-in sustaining costs2 895 865 918 849
All-in costs2 954 945 995 940
Cash costs (on a co-product basis) 2 648 615 666 610
All-in sustaining costs (on a co-product basis) 2 919 886 944 871
All-in costs (on a co-product basis) 2 978 966 1,021 962
Copper production (millions of pounds) 115 67 233 171
Copper sold (millions of pounds) 112 73 233 184
Per pound data
Average spot copper price 2.74$ 3.08$ 2.69$ 3.14$
Average realized copper price2 2.66 3.17 2.60 3.08
C1 cash costs2 1.94 2.04 1.89 2.08
Depreciation3 0.24 0.37 0.27 0.37
Other4 0.32 0.11 0.26 0.14
C3 fully allocated costs2 2.50 2.52 2.42 2.59
Financial Results (millions)
Revenues 2,231$ 2,458$ 4,476$ 5,105$
Net income (loss)5 (9) (269) 48 (181)
Adjusted net earnings2 60 159 122 397
Operating cash flow 525 488 841 1,073
Free cash flow2 26 (128) (172) (159)
Per Share Data (dollars)
Net earnings (loss) (basic) (0.01) (0.23) 0.04 (0.16)
Adjusted net earnings (basic)2 0.05 0.14 0.10 0.34
Net earnings (loss) (diluted) (0.01) (0.23) 0.04 (0.16)
Weighted average basic and diluted common shares (millions) 1,165 1,165 1,165 1,165
As at As atJune 30, December 31,
2015 2014
Financial Position (millions)Cash and equivalents 2,122$ 2,699$
Non-cash working capital 3,444 3,621 1 Production includes Acacia on a 73.9% basis until February 28, 2014 and a 63.9% basis thereafter and Pueblo Viejo on a 60% basis, both of which reflect our equity share of production. Also includes production from Plutonic
up to January 31, 2014, Kanowna up to March 1, 2014 and Marigold up to April 4, 2014, the effective dates of sale of these assets. Sales include our equity share of gold sales from Acacia and Pueblo Viejo.2 Realized price, cash costs, all-in sustaining costs, all-in costs, cash costs (on a co-product basis), all-in sustaining costs (on a co-product basis), all-in costs (on a co-product basis), C1 cash costs, C3 fully allocated costs,
adjusted net earnings and free cash flow are non-GAAP financial performance measures with no standard definition under IFRS. Refer to the Non-GAAP Financial Performance Measures section of the Company's MD&A. 3 Represents equity depreciation expense divided by equity pounds of copper sold. 4 For a breakdown, see reconciliation of cost of sales to C1 cash costs and C3 fully allocated costs per pound in the Non-GAAP Financial Performance Measures section of the Company's MD&A. 5 Net income (loss) represents net income (loss) attributable to the equity holders of the Company.
Key StatisticsBarrick Gold Corporation(in United States dollars)
BARRICK SECOND QUARTER 2015 14 SUMMARY INFORMATION

Production and Cost Summary
Three months ended Three months endedJune 30, June 30, June 30, June 30,
2015 2014 2015 2014 2015 2014 2015 2014Gold
Goldstrike 206 214 413 476 732$ 890$ 811$ 812$
Cortez 193 217 326 444 811 759 877 711
Pueblo Viejo3 131 161 266 320 682 601 673 599
Lagunas Norte 155 115 333 249 509 593 483 552
Veladero 151 189 300 347 961 740 978 768
Turquoise Ridge 52 48 101 102 780 687 747 595
Porgera 118 120 236 230 1,128 1,026 1,099 1,019
Kalgoorlie 81 84 140 162 886 958 1,045 987
Acacia2 119 114 235 232 1,149 1,105 1,133 1,118
Other Mines - Gold1 231 221 475 507 883 994 899 982
Other4 8 2 10 4 1,297 2,794 1,627 2,267 Total 1,445 1,485 2,835 3,073 895$ 865$ 918$ 849$
Three months ended Three months endedJune 30, June 30, June 30, June 30,
2015 2014 2015 2014 2015 2014 2015 2014Lumwana 63 13 129 63 2.01$ 2.49$ 1.95$ 2.55$ Zaldívar 52 54 104 108 1.85 1.85 1.81 1.76 Total 115 67 233 171 1.94$ 2.04$ 1.89$ 2.08$
2015 2014 2015 2014Direct mining costs before impact of hedges at market foreign exchange rates 601$ 600$ 618$ 595$
15 (23) 14 (21) By-product credits (24) (21) (26) (22) Royalties 32 38 34 36
Cash costs5 624 594 640 588 Depreciation 231 202 234 199
Total production costs 855$ 796$ 874$ 787$ Cash costs5 624$ 594$ 640$ 588$
General & administrative costs 38 43 39 49 Rehabilitation - accretion and amortization (operating sites) 25 21 25 21 Mine on-site exploration and evaluation costs 10 4 7 3 Mine development expenditures 112 117 116 117 Sustaining capital expenditures 86 86 91 71
All-in sustaining costs 5 895$ 865$ 918$ 849$
All-in costs5 954$ 945$ 995$ 940$
2015 2014 2015 2014
C1 cash costs5 1.94$ 2.04$ 1.89$ 2.08$ Depreciation6 0.24 0.37 0.27 0.37
Other7 0.32 0.11 0.26 0.14
C3 fully allocated costs4 2.50$ 2.52$ 2.42$ 2.59$
1 Includes production from Plutonic up to January 31, 2014, Kanowna up to March 1, 2014 and Marigold up to April 4, 2014, the effective dates of sale of these assets.2 Figures relating to Acacia are presented on a 73.9% basis until February 28, 2014 and a 63.9% basis thereafter, which reflects our equity share of production.3 Reflects production from Pueblo Viejo on a 60% basis, which reflects our equity share of production.4 Production and all-in sustaining costs include Pierina. 5 Cash costs, all-in sustaining costs, all-in costs, C1 cash costs and C3 fully allocated costs are non-GAAP financial performance measures with no standard meaning under IFRS. Refer to the
Non-GAAP Financial Performance Measures section of the Company's MD&A.6 Represents equity depreciation expense divided by equity pounds of copper sold. 7 For a breakdown, see reconciliation of cost of sales to C1 cash costs and C3 fully allocated costs per pound in the Non-GAAP Financial Performance Measures section of the Company's MD&A.
Total Gold Production Costs ($/oz)
Six months ended
June 30,
Losses (gains) realized on currency hedge and commodity hedge/economic hedge contracts
Three months ended
Three months ended Six months ended
Six months ended
Gold Production (attributable ounces) (000's)Six months ended Six months ended
Copper Production (attributable pounds) (millions)
Six months ended
All-in sustaining costs 5 ($/oz)
C1 Cash Costs5 ($/lb)
June 30,
June 30,
Total Copper Production Costs ($/lb)
June 30,
BARRICK SECOND QUARTER 2015 15 SUMMARY INFORMATION

Consolidated Statements of IncomeBarrick Gold Corporation Three months ended Six months ended
(in millions of United States dollars, except per share data) (Unaudited) June 30, June 30,2015 2014 2015 2014
Revenue (notes 5 and 6) 2,231$ 2,458$ 4,476$ 5,105$ Costs and expenses (income)Cost of sales (notes 5 and 7) 1,689 1,631 3,397 3,350 General and administrative expenses 70 82 137 185 Exploration, evaluation and project expenses (note 8) 97 105 183 205 Impairment charges (note 10B) 35 512 40 524 Loss on currency translation 33 31 31 110 Closed mine rehabilitation (19) 27 (11) 49 Loss (gain) on non-hedge derivatives (note 18D) 8 (44) 11 (65) Other expense (note 10A) 32 17 14 36 Income before finance items and income taxes 286$ 97$ 674$ 711$ Finance itemsFinance income 2 3 4 6 Finance costs (note 11) (194) (200) (390) (401) Income (loss) before income taxes 94$ (100)$ 288$ 316$ Income tax expense (note 12) (103) (123) (208) (412) Net income (loss) (9)$ (223)$ 80$ (96)$ Attributable to:Equity holders of Barrick Gold Corporation (9)$ (269)$ 48$ (181)$ Non-controlling interests (note 21) -$ 46$ 32$ 85$
Earnings (loss) per share data attributable to the equity holders of Barrick Gold Corporation (note 9)Net income (loss) Basic (0.01)$ (0.23)$ 0.04$ (0.16)$ Diluted (0.01)$ (0.23)$ 0.04$ (0.16)$
The notes to these unaudited interim financial statements, which are contained in the Second Quarter Report 2015 available on our website are an integral part of these consolidated financial statements.
BARRICK SECOND QUARTER 2015 16 FINANCIAL STATEMENTS (UNAUDITED)

Consolidated Statements of Comprehensive IncomeBarrick Gold Corporation Three months ended
(in millions of United States dollars) (Unaudited) June 30, June 30,2015 2014 2015 2014
Net income (loss) (9)$ (223)$ 80$ (96)$ Other comprehensive income (loss), net of taxes
Movement in equity investments fair value reserve:Net unrealized change on equity investments, net of tax $nil, $nil, $nil and $nil (6) 5 (11) 22 Net realized change on equity investments, net of tax $nil, $nil, $nil and $nil 1 3 18 7 Impairment losses on equity investments, net of tax $nil, $nil, $nil and $nil - 14 - 16
Items that may be reclassified subsequently to profit or loss:Unrealized gains (losses) on derivatives designated as cash flow hedges, net of tax ($13), ($3), $1 and $1 24 13 (33) 28 Realized (gains) losses on derivatives designated as cash flow hedges, net of tax $1, $1, $nil and $1 36 (31) 51 (54) Currency translation adjustments, net of tax $nil, $nil, $nil and $nil 2 4 (30) 7 Total other comprehensive income (loss) 57 8 (5) 26 Total comprehensive income (loss) 48$ (215)$ 75$ (70)$
Attributable to:Equity holders of Barrick Gold Corporation 48$ (261)$ 43$ (155)$ Non-controlling interests -$ 46$ 32$ 85$
The notes to these unaudited interim financial statements, which are contained in the Second Quarter Report 2015 available on our website are an integral part of these consolidated financial statements.
Six months ended
BARRICK SECOND QUARTER 2015 17 FINANCIAL STATEMENTS (UNAUDITED)

Consolidated Statements of Cash FlowBarrick Gold Corporation
(in millions of United States dollars) (Unaudited) June 30, June 30,2015 2014 2015 2014
OPERATING ACTIVITIES Net income (loss) (9)$ (223)$ 80$ (96)$ Adjusted for the following items: Depreciation 419 400 840 802 Finance costs 194 200 390 401 Impairment charges (note 10B) 35 512 40 524 Income tax expense (note 12) 103 123 208 412 (Increase) decrease in inventory (41) (37) (65) 5 Loss (gain) on non-hedge derivatives 8 (44) 11 (65) Gain on sale of long-lived assets (2) (22) (26) (23) Other operating activities (note 13A) 121 16 (88) (225) Operating cash flows before interest and income taxes 828 925 1,390 1,735 Interest paid (274) (276) (349) (352) Income taxes paid (29) (161) (200) (310) Net cash provided by operating activities 525 488 841 1,073 INVESTING ACTIVITIESProperty, plant and equipment Capital expenditures (note 5) (499) (616) (1,013) (1,232) Sales proceeds 7 2 19 37 Divestitures - 86 2 166 Investments sales - 27 33 52 Other investing activities (note 13B) (6) (39) (7) (79) Net cash used in investing activities (498) (540) (966) (1,056) FINANCING ACTIVITIESProceeds from divestment of 10% of issued ordinary share capital of Acacia - - - 186 Debt Proceeds 3 - 5 133 Repayments (88) (18) (272) (93) Dividends (58) (58) (116) (116) Funding from non-controlling interests 21 - 22 2 Disbursements to non-controlling interests (20) - (64) - Net cash (used in) provided by financing activities (142) (76) (425) 112 Effect of exchange rate changes on cash and equivalents (1) 1 (7) (4) Net (decrease) increase in cash and equivalents (116) (127) (557) 125 Cash and equivalents excluding assets classified as held for sale at the beginning of period 2,258 2,672 2,699 2,404 Add: cash and equivalents of assets classified as held for sale at the beginning of period - 4 - 20 Cash and equivalents at the end of period 2,142$ 2,549$ 2,142$ 2,549$ Less: cash and equivalents of assets classified as held for sale at the end of period 20 - 20 - Cash and equivalents excluding assets classified as held for sale at the end of period 2,122$ 2,549$ 2,122$ 2,549$
The notes to these unaudited interim financial statements, which are contained in the Second Quarter Report 2015 available on our website are an integral part of these consolidated financial statements.
Three months ended Six months ended
BARRICK SECOND QUARTER 2015 18 FINANCIAL STATEMENTS (UNAUDITED)

Consolidated Balance SheetsBarrick Gold Corporation
(in millions of United States dollars) (Unaudited)
2015 2014ASSETSCurrent assets Cash and equivalents (note 18A) 2,122$ 2,699$ Accounts receivable 354 418 Inventories (note 15) 2,465 2,722 Other current assets 335 311 Total current assets (excluding assets classified as held for sale) 5,276$ 6,150$ Assets classified as held for sale (note 4A) 1,514 - Total current assets 6,790$ 6,150$
Non-current assets Equity in investees (note 14) 208 206 Other investments 12 35 Property, plant and equipment (note 16) 18,331 19,193 Goodwill 4,291 4,426 Intangible assets 305 308 Deferred income tax assets 687 674 Non-current portion of inventory (note 15) 1,388 1,684 Other assets 1,181 1,203 Total assets 33,193$ 33,879$ LIABILITIES AND EQUITYCurrent liabilities Accounts payable 1,319$ 1,653$ Debt (note 18B) 462 333 Current income tax liabilities 24 84 Other current liabilities 409 490 Total current liabilities (excluding liabilities classified as held for sale) 2,214$ 2,560$ Liabilities classified as held for sale (note 4A) 374 - Total current liabilities 2,588$ 2,560$
Non-current liabilities Debt (note 18B) 12,361 12,748 Provisions 2,347 2,561 Deferred income tax liabilities 2,069 2,036 Other liabilities 1,056 1,112 Total liabilities 20,421$ 21,017$ Equity Capital stock (note 20) 20,865$ 20,864$ Deficit (10,714) (10,739) Accumulated other comprehensive loss (303) (199) Other 321 321 Total equity attributable to Barrick Gold Corporation shareholders 10,169$ 10,247$ Non-controlling interests (note 21) 2,603 2,615 Total equity 12,772$ 12,862$ Contingencies and commitments (notes 15, 16 and 22)Total liabilities and equity 33,193$ 33,879$
As at December 31,As at June 30,
The notes to these unaudited interim financial statements, which are contained in the Second Quarter Report 2015 available on our website are an integral part of these consolidated financial statements.
BARRICK SECOND QUARTER 2015 19 FINANCIAL STATEMENTS (UNAUDITED)

Consolidated Statements of Changes in EquityBarrick Gold Corporation
(in millions of United States dollars) (Unaudited)Common Shares
(in thousands) Capital stockRetained
deficit
Accumulated other
comprehensive
income (loss)1 Other2
Total equity attributable to
shareholdersNon-controlling
interests Total equityAt December 31, 2014 1,164,670 20,864$ (10,739)$ (199)$ 321$ 10,247$ 2,615$ 12,862$
Impact of adopting IFRS 9 on January 1, 2015 (note 2B) - - 99 (99) - - - - At January 1, 2015 (restated) 1,164,670 20,864$ (10,640)$ (298)$ 321$ 10,247$ 2,615$ 12,862$
Net income - - 48 - - 48 32 80 Total other comprehensive loss - - - (5) - (5) - (5) Total comprehensive income (loss) - - 48 (5) - 43 32 75 Transactions with owners
Dividends - - (116) - - (116) - (116) Recognition of stock option expense - 1 - - - 1 - 1 Funding from non-controlling interests - - - - - - 22 22 Other decrease in non-controlling interest - - - - - - (66) (66) Other decreases - - (6) - - (6) - (6)
Total transactions with owners - 1 (122) - - (121) (44) (165) At June 30, 2015 1,164,670 20,865$ (10,714)$ (303)$ 321$ 10,169$ 2,603$ 12,772$
At January 1, 2014 1,164,652 20,869$ (7,581)$ (69)$ 314$ 13,533$ 2,468$ 16,001$ Net income (loss) - - (181) - - (181) 85 (96) Total other comprehensive income - - - 26 - 26 - 26 Total comprehensive income (loss) - - (181) 26 - (155) 85 (70) Transactions with owners Dividends - - (116) - - (116) - (116)
Issued on exercise of stock options 18 - - - - - - - Recognized on divestment of 10% of Acacia - - - - 7 7 177 184 Derecognition of stock option expense - (7) - - - (7) - (7) Funding from non-controlling interests - - - - - - 2 2
Total transactions with owners 18 (7) (116) - 7 (116) 179 63 At June 30, 2014 1,164,670 20,862$ (7,878)$ (43)$ 321$ 13,262$ 2,732$ 15,994$
2 Includes additional paid-in capital as at June 30, 2015: $283 million (December 31, 2014: $283 million; June 30, 2014: $283 million) and convertible borrowings - equity component as at June 30, 2015: $38 million (December 31, 2014: $38 million; June 30, 2014: $38 million).
Attributable to equity holders of the company
The notes to these unaudited interim financial statements, which are contained in the Second Quarter Report 2015 available on our website are an integral part of these consolidated financial statements.
1 Includes cumulative translation losses at June 30, 2015: $152 million (June 30, 2014: losses of $73 million).
BARRICK SECOND QUARTER 2015 20 FINANCIAL STATEMENTS (UNAUDITED)

HEAD OFFICE
Barrick Gold Corporation
Brookfield Place
TD Canada Trust Tower
161 Bay Street, Suite 3700
Toronto, Ontario M5J 2S1
Telephone: +1 416 861-9911
Toll-free: 1-800-720-7415
Fax: +1 416 861-2492
Email: [email protected]
Website: www.barrick.com
SHARES LISTED
ABX – The New York Stock Exchange
The Toronto Stock Exchange
TRANSFER AGENTS AND REGISTRARS
CST Trust Company
P.O. Box 700, Postal Station B
Montreal, Quebec H3B 3K3
or
American Stock Transfer & Trust Company, LLC
6201 – 15 Avenue
Brooklyn, New York 11219
Telephone: 1-800-387-0825
Fax: 1-888-249-6189
Email: [email protected]
Website: www.canstockta.com
INVESTOR CONTACT: MEDIA CONTACT:
Susan Muir
Senior Director
Investor Relations
Telephone: +1 416 307-5107
Email: [email protected]
Andy Lloyd
Senior Vice President
Communications
Telephone: +1 416 307-7414
Email: [email protected]

CAUTIONARY STATEMENT ON FORWARD-LOOKING INFORMATION Certain information contained or incorporated by reference in this Second Quarter 2015 Report, including any information as to our strategy, projects, plans or future financial or operating performance, constitutes "forward-looking statements". All statements, other than statements of historical fact, are forward-looking statements. The words "believe", "expect", "anticipate", "contemplate", "target", "plan", "intend", "project", "continue", "budget", "estimate", "potential", "may", "will", "can", "could" and similar expressions identify forward-looking statements. In particular, this Second Quarter Report 2015 contains forward-looking statements with respect to cash flow forecasts, projected capital, operating and exploration expenditure, targeted cost reductions, mine life and production rates, potential mineralization and metal or mineral recoveries, and information pertaining to Barrick’s Value Realization project (including potential improvements to financial and operating performance and mine life at Barrick’s Lagunas Norte and Pueblo Viejo mines that may result from certain Value Realization initiatives). Forward-looking statements are necessarily based upon a number of estimates and assumptions that, while considered reasonable by the company in light of management’s experience and perception of current conditions and expected developments, are inherently subject to significant business, economic and competitive uncertainties and contingencies. Known and unknown factors could cause actual results to differ materially from those projected in the forward-looking statements. Such factors include, but are not limited to: fluctuations in the spot and forward price of gold, copper or certain other commodities (such as silver, diesel fuel, liquefied natural gas and electricity); the speculative nature of mineral exploration and development; changes in mineral production performance, exploitation and exploration successes; risks associated with the fact that Value Realization initiatives are still in the early stages of evaluation and additional engineering and other analysis is required to fully assess their impact; diminishing quantities or grades of reserves; increased costs, delays, suspensions and technical challenges associated with the construction of capital projects; operating or technical difficulties in connection with mining or development activities, including disruptions in the maintenance or provision of required infrastructure and information technology systems; uncertainty whether some or all of the Value Realization initiatives will meet the company’s capital allocation objectives; the impact of global liquidity and credit availability on the timing of cash flows and the values of assets and liabilities based on projected future cash flows; adverse changes in our credit rating; the impact of inflation; risk of loss due to acts of war, terrorism, sabotage and civil disturbances; fluctuations in the currency markets; changes in U.S. dollar interest rates; risks arising from holding derivative instruments; changes in national and local government legislation, taxation, controls or regulations and/or changes in the administration of laws, policies and practices, expropriation or nationalization of property and political or economic developments in Canada, the United States, Zambia and other jurisdictions in which the company does or may carry on business in the future; failure to comply with environmental and health and safety laws and regulations; timing of receipt of, or failure to comply with, necessary permits and approvals; litigation; contests over title to properties, particularly title to undeveloped properties, or over access to water, power and other required infrastructure; business opportunities that may be presented to, or pursued by, the company; our ability to successfully integrate acquisitions or complete divestitures; increased costs and risks related to the potential impact of climate change; damage to the company’s reputation due to the actual or perceived occurrence of any number of events, including negative publicity with respect to the company’s handling of environmental matters or dealings with community groups, whether true or not; employee relations; availability and increased costs associated with mining inputs and labor; and the organization of our previously held African gold operations and properties under a separate listed company. In addition, there are risks and hazards associated with the business of mineral exploration, development and mining, including environmental hazards, industrial accidents, unusual or unexpected formations, pressures, cave-ins, flooding and gold bullion, copper cathode or gold or copper concentrate losses (and the risk of inadequate insurance, or inability to obtain insurance, to cover these risks). Many of these uncertainties and contingencies can affect our actual results and could cause actual results to differ materially from those expressed or implied in any forward-looking statements made by, or on behalf of, us. Readers are cautioned that forward-looking statements are not guarantees of future performance. All of the forward-looking statements made in this Second Quarter 2015 Report are qualified by these cautionary statements. Specific reference is made to the most recent Form 40-F/Annual Information Form on file with the SEC and Canadian provincial securities regulatory authorities for a discussion of some of the factors underlying forward-looking statements. The company disclaims any intention or obligation to update or revise any forward-looking statements whether as a result of new information, future events or otherwise, except as required by applicable law.