BARC Score Business...
12
BARC Score Business Intelligence Enterprise-Wide BI Platform Deployments Short-Document Authors: Andreas Bitterer, Carsten Bange, Christian Fuchs, Patrick Keller, Larissa Seidler Publication: 19 May 2015 Abstract This BARC short-document is the inaugural version of our new vendor evaluation and ranking methodology, named Score. We selected the business intelligence platform market for the premiere. Based on countless data points from The BI Survey and many analyst interactions, vendors are rated on a variety of criteria, from product capabilities and architecture to sales and marketing strategy, financial performance and customer feedback. This document is not to be shared, distributed or reproduced in any way without prior permission of BARC
Transcript of BARC Score Business...
BARC Score Business Intelligence
Enterprise-Wide BI Platform Deployments
Short-Document
Authors: Andreas Bitterer, Carsten Bange, Christian Fuchs, Patrick Keller, Larissa Seidler
Publication: 19 May 2015
Abstract
This BARC short-document is the inaugural version of our new vendor evaluation and ranking methodology, named Score. We selected the business intelligence platform market for the premiere. Based on countless data points from The BI Survey and many analyst interactions, vendors are rated on a variety of criteria, from product capabilities and architecture to sales and marketing strategy, financial performance and customer feedback.
This document is not to be shared, distributed or reproduced in any way without prior permission of BARC
BARC Score Business Intelligence 2015 Page 2
Table of contents
Overview ............................................................................................................................................. 3 Inclusion Criteria ................................................................................................................................. 3 Evaluation Criteria .............................................................................................................................. 4
Portfolio Capabilities ....................................................................................................................... 4 Market Execution ............................................................................................................................ 6
Score .................................................................................................................................................. 8 Score Regions ................................................................................................................................ 9
Evaluated Products .......................................................................................................................... 10

BARC Score Business Intelligence 2015 Page 3
Overview The market for BI tools is highly competitive, with some large international incumbents, many successful vendors with a track record spanning decades, and countless smaller specialists that approach BI challenges from a niche perspective. This report analyzes the strengths and challenges of all of the leading vendors in the business intelligence market as well as many smaller vendors that often have less visibility, but equally offer outstanding value to their customers.
Business intelligence initiatives always include more than just the front end tools. The technical architecture also includes data warehouses and data marts, data integration and data quality components, dictionaries, repositories, and many other technologies. More importantly, organizations should have a proper BI strategy that goes well beyond an architecture blueprint to include non-technical requirements, alignment with the corporate strategy, organizational models, outcome-based priority settings, and a proper roadmap.
Still, when it comes to kicking off or expanding a business intelligence program, the initial focus lies almost always on the required toolsets. While this may not be the ideal starting point, at some stage a platform or product decision has to be made. This document will help with the selection process by evaluating the most commonly used product sets from the major vendor community.
Inclusion Criteria There are two separate inclusion criteria for this BARC Score: the first is associated with a vendor’s products and the other is linked to the financial results relating to those products. To be evaluated in this Business Intelligence Score, a vendor has to supply four out of five technologies from the following platform portfolio:
• Formatted Reporting
• Dashboarding
• Ad-hoc Query and Reporting
• Analysis
• Data Mining
In addition, the vendor has to generate a minimum of 15 million EUR in license revenue per year with the above product set, spread across at least two separate geographies. As individual geographies we consider:
• Europe, Middle East and Africa
• North America
• Latin America
• Asia/Pacific
Vendors with an open source business model are evaluated by their total revenue because those companies do not charge a license for their products, but an annual subscription fee.

BARC Score Business Intelligence 2015 Page 4
Evaluation Criteria Every vendor is evaluated on two dimensions, Portfolio Capabilities and Market Execution, each representing one axis on the Score and representing the following sub-criteria.
Portfolio Capabilities The portfolio capabilities criteria selected to rank the business intelligence vendors in this Score include the following technologies and their corresponding weighting.
Formatted Reporting
Formatted standard reports are usually page-oriented reports run on regular schedules. These include static reports, which usually appeal to the widest audience in a company because they are simple to use, and prompted reports, which enable users to filter reports based on predefined parameters. Aside from pixel-perfect displays which provide developers with precise control over how they place report objects and images on a screen, formatted reports also support rich printing options, dynamic page sizing and a WYSIWYG (i.e. what you see is what you get) development interface.
Virtually every BI product is able to provide some type of reports. The importance of page orientation, scheduling and other advanced reporting features, however, varies depending on the customer’s requirements.
Dashboarding
Dashboards are also referred to as cockpits, scorecards or BI applications. They provide graphical views of key performance indicators and the ability to drill down to details. Some dashboards offer self-service functions so that end users can create their own layouts without any outside help. Others (especially BI applications with guided navigation) require support from technically savvy business users or programmers. Scorecards often incorporate strategy maps and applications to manage improvement initiatives.
Ad-Hoc Query and Reporting
In many cases, users require more interactivity than they receive from formatted reports. Ad-hoc reporting tools are geared to non-professional report developers and provide basic filtering and navigation features (e.g., drill down, ranking and conditional formatting).
Analysis
Data analysis solutions differ from basic reporting tools in that they are able to probe much more deeply into operational data and generate new information which can be understood and actioned upon by the business. Further analyses can be carried out using mathematical methods. Traditional online analytical processing (OLAP) tools provide dimensional (versus reporting) data views which make it easy for users to drill down, drill across and pivot dimensions as well as apply sophisticated calculations without scripting. Certain analysis tools also offer methods to support set-based, visual or discovery-oriented data analysis.

BARC Score Business Intelligence 2015 Page 5
Data Mining
Data mining represents non-directed, hypothesis-free data analysis. Various algorithms scan the database searching for patterns used for a segmentation, classification or association of data. The methods cover statistical data analysis, neural networks, decision trees, time series and many other algorithms. Users have to be well trained in order to use these methods and to gain the expected insights. Data mining tools often contain data integration and analysis process support functionality.
Architecture
The overall architecture of each vendor’s product portfolio is also evaluated. This includes the integration of the various components, from the perspective of the front end and user experience as well as at the infrastructure levels, including data access, models and metadata. In addition, the support for different platforms as well as the overall solution performance and caching mechanisms are considered in this evaluation.
Product Satisfaction
The results from The BI Survey’s product satisfaction ratings are also included in this BARC Score. The ratings of vendors that provide more than a single product are combined into a single rating.
Criteria Weighting
We don’t consider all components of a BI portfolio equally important in this Score. This is not a reference to the generated value of an individual technology, but indicates the current customer focus and buying pattern.
Criteria Weighting
Dashboarding High
Ad-Hoc Query High
Architecture High
Product Satisfaction High
Analysis Medium
Reporting Low
Data Mining Low
Figure 1: Portfolio Capabilities - Weighting of Criteria

BARC Score Business Intelligence 2015 Page 6
Market Execution On the market execution axis, we rate the business intelligence vendors in this Score using the following criteria and their corresponding weighting.
Product Strategy
This is the most important of all the criteria. Vendors are rated on their product development track record, product roadmap and innovation, as well as the company portfolio’s alignment with current market trends and demands.
Sales Strategy
To rate a vendor’s sales strategy, we look at the various channels through which the company goes to market: with both direct and indirect sales teams, through distributors, value-added resellers (VARs), online channels as well as OEM relationships. We also evaluate the vendor’s product pricing and the various sales models, such as perpetual licensing, support subscription, open source, or freemium.
Marketing Strategy
A vendor’s marketing strategy is evaluated by rating its corporate and product messaging, the company’s presence in printed media, advertising and social networks, as well as its ability to run events, such as conferences, seminar roadshows and webinars.
Organizational Strength
Vendors are rated in their organizational stability, which is influenced by consistency of corporate strategy, continuity of executive leadership, but also staff turnover, reorganization and layoffs.
Financials
This criterion covers the financial position of the vendor, from market capitalization, cash position and EBITDA to profitability, burn rate and investment rounds. For vendors that are private companies or don’t break out the numbers for individual product lines, estimated figures are used.
Geographical Coverage
Vendors are evaluated on their global presence. We look at the various geographic regions and major countries in which the company conducts business with both a sales and marketing presence as well as development and support functions.
Vertical Solutions
While being a low-weighted criterion, we also look at a vendor’s solution portfolio for vertical BI applications (for example, retail, insurance or manufacturing industries).
Ecosystem
In this category, we evaluate the extended ecosystem in which the vendor participates. This includes business partner networks, hardware or cloud infrastructure providers, consulting firms and system integrators, and other technology alliances.
Customer Support
Similar to the product satisfaction score above, vendors are also rated by their customer support score from The BI Survey. This generally takes into account accessibility and quality of the support staff, time-to-resolution scores, and the overall satisfaction with the vendor’s service and support processes.
BARC Score Business Intelligence 2015 Page 7
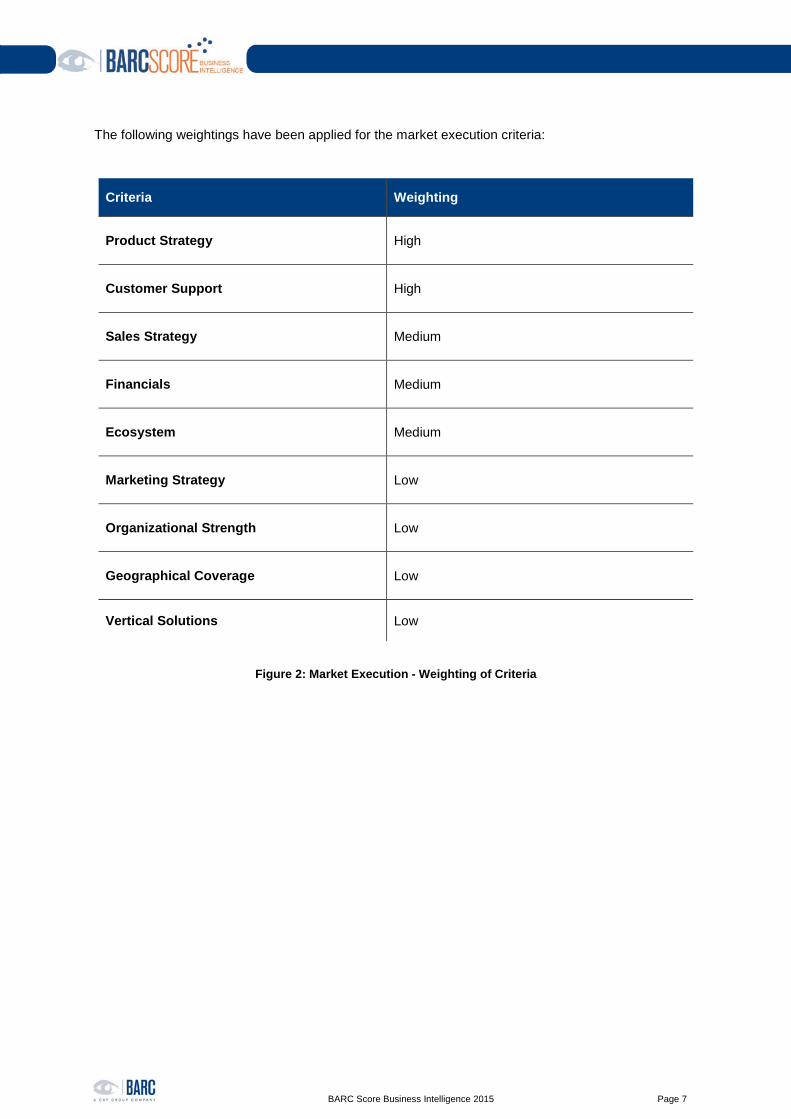
The following weightings have been applied for the market execution criteria:
Criteria Weighting
Product Strategy High
Customer Support High
Sales Strategy Medium
Financials Medium
Ecosystem Medium
Marketing Strategy Low
Organizational Strength Low
Geographical Coverage Low
Vertical Solutions Low
Figure 2: Market Execution - Weighting of Criteria
BARC Score Business Intelligence 2015 Page 8
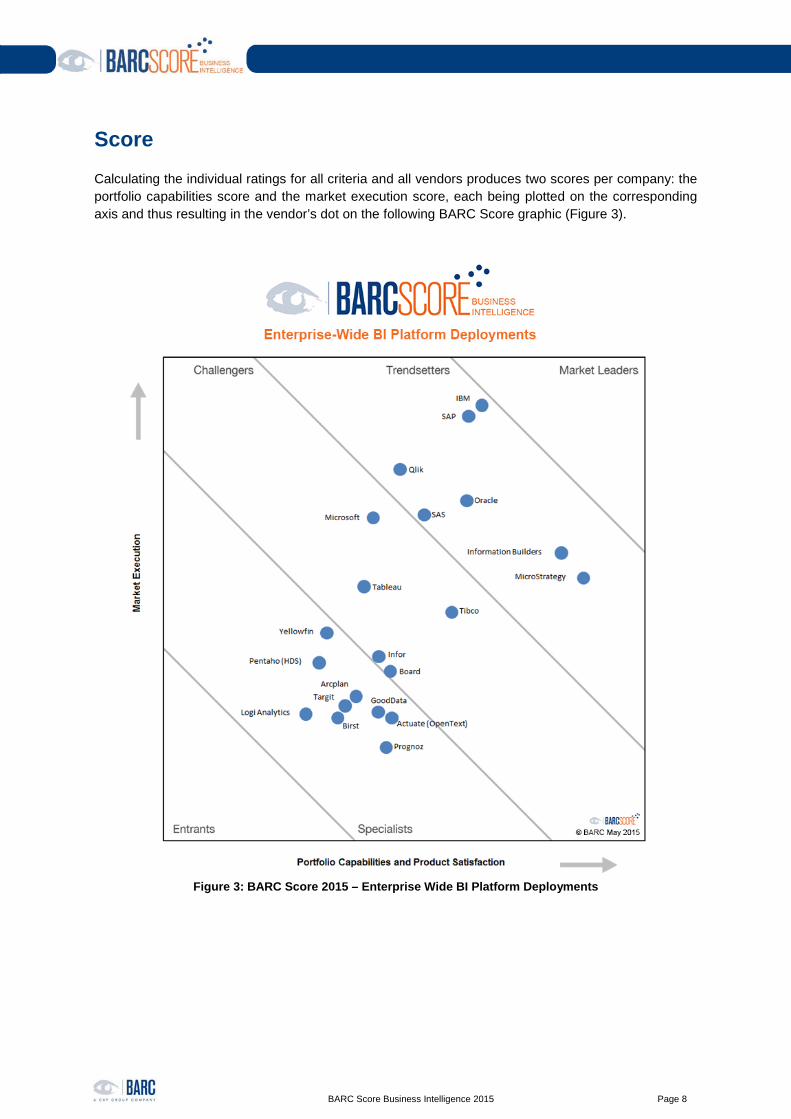
Score Calculating the individual ratings for all criteria and all vendors produces two scores per company: the portfolio capabilities score and the market execution score, each being plotted on the corresponding axis and thus resulting in the vendor’s dot on the following BARC Score graphic (Figure 3).
Figure 3: BARC Score 2015 – Enterprise Wide BI Platform Deployments

BARC Score Business Intelligence 2015 Page 9
Score Regions Vendors can be positioned in one of five regions, depending on their total score on each of the two axes.
Market Leaders
Market leaders are vendors that drive both technology and market adoption in a highly influential manner. They possess both a broad portfolio of market-leading products with a strong brand as well as a robust commercial prowess through best-in-class sales and marketing programs, an extensive ecosystem of business partners and alliances, and a rock-solid financial position. Market leaders are considered a contender in virtually every planned implementation.
Trendsetters
Trendsetters are well established vendors that drive strong market adoption, supported by technology innovation and strategic acquisitions and by leveraging robust account management and a solid track record. Their portfolio enjoys high brand awareness in the market, covers an extensive range of technologies and services with only few gaps. Trendsetters typically have a large market share, making them a viable contender in almost all implementation scenarios.
Challengers
Challengers come in various shapes and sizes. They can be large vendors tapping into a new market by acquisition and pushing their way in with force, small innovative companies with a promising portfolio but limited sales and marketing resources, or vendors that attempt to disrupt a market with a new technology approach or different business model.
Specialists
Specialists are smaller vendors with a portfolio focused on a specific market segment. Vendors can be either limited in their technical capabilities by concentrating on certain features and functions, or the company isn’t a global enterprise and focuses on select geographic regions.
Entrants
Entrants are usually startups that have limited reach and visibility in the market. Their product capabilities are incomplete when compared to the respective competition, and the vendor’s long-term market potential is still unproven.
BARC Score Business Intelligence 2015 Page 10
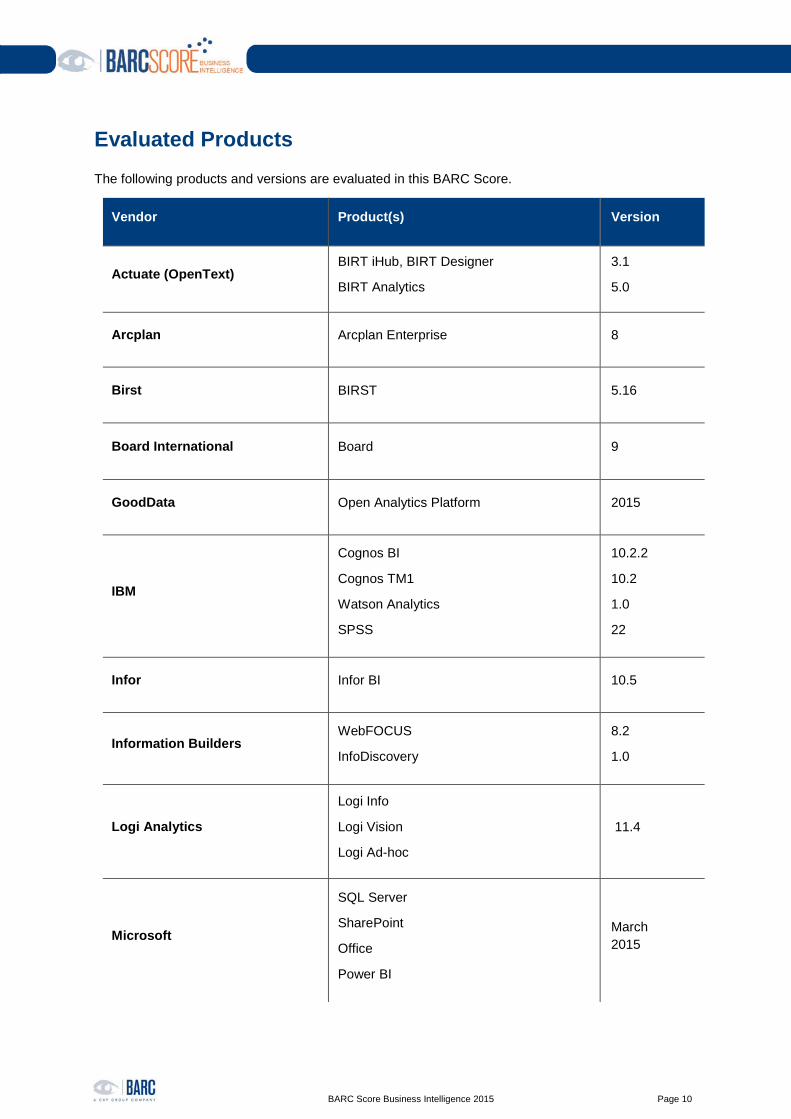
Evaluated Products The following products and versions are evaluated in this BARC Score.
Vendor Product(s) Version
Actuate (OpenText) BIRT iHub, BIRT Designer
BIRT Analytics
3.1
5.0
Arcplan Arcplan Enterprise 8
Birst BIRST 5.16
Board International Board 9
GoodData Open Analytics Platform 2015
IBM
Cognos BI
Cognos TM1
Watson Analytics
SPSS
10.2.2
10.2
1.0
22
Infor Infor BI 10.5
Information Builders WebFOCUS
InfoDiscovery
8.2
1.0
Logi Analytics
Logi Info
Logi Vision
Logi Ad-hoc
11.4
Microsoft
SQL Server
SharePoint
Office
Power BI
March 2015

BARC Score Business Intelligence 2015 Page 11
Vendor Product(s) Version
MicroStrategy Analytics Platform 9s
Oracle
BI Foundation Suite
Advanced Analytics
Endeca Information Discovery
11
12c
3.1
Pentaho (Hitachi Data Systems) Business Analytics 5.3
Prognoz Prognoz Platform 8
Qlik
QlikView
Qlik Sense
QlikView NPrinting
11.2
1.0
16
SAP BusinessObjects BI Platform
Predictive Analytics
4.1
2.0
SAS Enterprise BI Server
Visual Analytics
9.4
7.1
Tableau Tableau Desktop and Tableau Server 8.2
Targit Targit Decision Platform 2014
Tibco Analytics Jaspersoft
Spotfire Platform
6
7
Yellowfin Yellowfin 7.1

Copyright © BARC GmbH 2015. All rights reserved.
Business Application Research Center – BARC GmbH
Central Europe
Berliner Platz 7 97080 Würzburg
Germany
+49 931 880651-0
www.barc.de
Rest of the World
+44 1536 772 451
www.barc-research.com