Justice Statistics Users Day 5.3.12. In the beginning: John Sinclair’s Statistical Accounts.
Upload
hfg-projectCategory
view
64download
0
December 2014
BARBADOS 2012-13 HEALTH ACCOUNTS:
STATISTICAL REPORT

2
CONTENTS
Contents ................................................................................................................... 2
Acronyms.................................................................................................................. 3
1. Introduction .............................................................................................. 4
2. Health Accounts Conceptual Framework and Methodology ............. 5
2.1. Conceptual Framework ..................................................................................................... 5 2.2. Data Sources ......................................................................................................................... 9 2.3. Data Analysis ....................................................................................................................... 11 2.4. Use of HA Production Tool ........................................................................................... 16
3. Limitations............................................................................................... 18
4. General Health Accounts Statistical Tables ....................................... 20
4.1. Financing scheme (HF) x Revenues of health care financing schemes (FS) ....... 20 4.2. Financing scheme (HF) x Institutional Units providing revenues to financing
schemes (FS RI) .................................................................................................................. 21 4.3. Institutional Units providing revenues to financing schemes (FS RI) x Financing
agent (FA) ............................................................................................................................ 22 4.4. Institutional Units providing revenues to financing schemes (FS RI) x Function
(HC)....................................................................................................................................... 23 4.5. Health care provider (HP) x Financing scheme (HF) ............................................... 24 4.6. Health care function (HC) x Financing Scheme (HF) .............................................. 25 4.7. Health care function (HC) x Health care provider (HP) ........................................ 26 4.8. Financing scheme (HF) x Financing agent (FA) .......................................................... 27 4.9. Health care function (HC) x Classification of diseases / conditions (DIS) ........ 28 4.10. Gross fixed capital formation (HK) x Institutional unit providing revenues to
financing scheme (FS RI) .................................................................................................. 29 4.11. Gross fixed capital formation (HK) x Health care provider (HP) ....................... 30
5. HIV Statistical Tables ............................................................................ 31
5.1. Revenues of health care financing schemes (FS) x Financing scheme (HF) ....... 31 5.2. Institutional Units providing revenues to financing schemes (F S RI) x Financing
scheme (HF) ........................................................................................................................ 32 5.3. Institutional Units providing revenues to financing schemes (FS RI) x Health
care function (HC) ............................................................................................................ 33 5.4. Financing scheme (HF) x Health care provider (HP) ............................................... 34 5.5. Health care function (HC) x Financing scheme (HF) ............................................... 35 5.6. Function (HC) x Health care provider (HP) .............................................................. 36
Annex A: Recommended Workshop Participants ............................................ 37
List of Tables Table 1. Functional Allocation Keys ................................................................................................ 12 Table 2. Disease Allocation Keys ..................................................................................................... 14
3
Acronyms
ARV Anti-retroviral
BDS Barbados Drug Service
CHE Total Current Health Expenditure
GDP Gross Domestic Product
HA Health Accounts
HAPT Health Accounts Production Tool
HC Healthcare function
HFG Health Finance and Governance Project
HSA Health Satellite Accounts
ICD International classification of disease
IP Inpatient
LRU Ladymeade Reference Unit
MOH Ministry of Health
NGO Nongovernmental organization
NHA National Health Accounts
NHE National Health Expenditure
OECD Organisation of Economic Cooperation and Development
OOP Out-of-pocket
OP Outpatient
PLHIV People living with HIV
QEH Queen Elizabeth Hospital
SHA System of Health Accounts
THE Total Health Expenditure
USAID United States Agency for International Development
UWI-HEU University of the West Indies, HEU, Centre for Health Economics
VCT Voluntary counselling and testing
WHO World Health Organization
Recommended citation: Government of Barbados. December 2014. Barbados 2012-13 Health
Accounts: Statistical Report.
4
1. Introduction
The lack of solid up-to-date health financing information for evidence-based planning inspired the
Ministry of Health (MOH) to conduct a Health Accounts (HA) exercise. Although the Ministry
completed a Health Satellite Accounts (HSA) exercise in 2013, lack of complete National Accounts data
resulted in incomplete spending captured for key groups such as commercial insurance companies,
private employers, and households. The Ministry of Health (MOH) therefore conducted a HA exercise
complementing the evidence from the HSA to better understand health spending and to inform
resource allocation decisions in order to achieve its UHC objective1. Barbados is currently undergoing
consultations for health financing reforms and the HA data will ensure that reforms are designed based
on sound evidence.
As part of the exercise, the HA analysis also sought to understand the sustainability of financing for
HIV/AIDS and where HIV/AIDS resources are being spent given the increasing competing priorities for
resources from areas such as NCDs.
The analysis sought to answer key policy questions highlighted below.
Scope Policy area Policy question
Overall health system Sustainability of health financing Who funds health spending and how
much do they contribute?
Risk pooling To what extent are funds for health
pooled to minimize risk?
Financial risk protection What level of financial risk protection
is available to households in Barbados
when seeking care?
Primary vs. Secondary vs.
Tertiary care spending
How does health spending compare
at different levels of the health
system?
Relative spending on prevention
/ promotion vs. curative care
How is health spending allocated
among treatment, prevention and
other activities?
Spending on NCDs Which diseases and health conditions
does Barbados spend on?
National HIV response Sustainability of health financing Who is funding the HIV response in
Barbados and how sustainable is it?
Financial risk protection What level of financial risk protection
is available to PLHIV in Barbados
when seeking care?
Relative spending on prevention
/ promotion vs. curative care
How is health spending allocated
among HIV treatment, prevention and
other activities?
1 Barbados is aiming to achieve Universal Health Coverage (UHC) for its population, which will require it to
ensure a basic package of goods and services to its population, without impoverishing its population when they
need to seek care.
5
This Barbados 2012-13 HA was conducted between June and December 2014. Following the launch
workshop in June 2014, the HA team, with representation from the Government of Barbados and the
Health Finance and Governance (HFG) Project, began primary and secondary data collection. Collected
data were then compiled, cleaned, triangulated, and reviewed. Data was imported into the HA
Production Tool and mapped to each of the SHA 2011 classifications. The results of the analysis were
verified with MOH stakeholders in November and with a wider group of country stakeholders in
December 2014. The official dissemination workshop took place December 18th, 2014. Participants
who were invited to these workshops, and who are recommended for participation in future HAs, are
listed in Annex A.
This report provides the detailed statistical tables depicting the magnitude and flow of the resources
from the source (such as government, households, donors) to end-use (defined by type of activity and
disease / health condition) as well as methodological details. The report is divided into three chapters.
The first chapter provides a brief introduction of the purpose and overall approach of the health
accounts exercise in Barbados. The second chapter provides an overview of the health accounts
conceptual framework and a summary of the methodology namely: data sources, data collection,
assumptions made as well as limitations. The third section discusses the limitations of the HA estimation.
Finally, sections 4 and 5 provide a series of two dimensional tables showing the flow of health and HIV
spending.
This statistical report is intended for HA practitioners and researchers who desire the detailed
expenditure flow information for additional operational and scientific research as well as an
understanding of how the figures are generated. This is complementary to the analytical report prepared
which provides responses to key policy questions, their implications and recommendations2.
2. Health Accounts Conceptual Framework and Methodology
2.1. Conceptual Framework HA is an internationally recognized methodology used to track expenditures in a health system for a
specified period of time. It follows the flow of funding for health from its origins to end use, answering
questions such as: how are health care goods and services financed? Who provided the health care
goods and services consumed by the population? What goods and services are financed? By breaking
down health spending by different classifications, HA provide insight into issues such as whether
resources are being allocated to national priorities and health spending is sufficient relative to need; the
sustainability of health financing and the extent to which there is financial risk protection for households.
HA is designed to be used as a policy tool to facilitate health sector performance management and to
assess how well resources are targeted to health system goals and priority areas. It provides a sound
evidence base for decision making and is a useful tool in informing health financing reforms.
HA is based on the System of Health Accounts (SHA) framework, which has been developed and
revised by key international stakeholders over the past two decades. First published in 2000 by OECD,
EUROSTAT, and WHO, the framework was updated in 2011 (OECD et al. 2011). The SHA 2011
methodology (producing “HA”) improves upon the earlier version by strengthening the classifications to
2 Government of Barbados. December 2014. Barbados 2012-13 Health Accounts

6
support production of a more comprehensive picture of health expenditure flows. SHA 2011 is now the
international standard for national-level health accounts estimations.
The SHA 2011 methodology was used to complete Barbados’ first full health accounts estimation. In
order to enrich results related to HIV spending, the HA team also conducted HIV specific data
collection on non-health HIV spending and out-of-pocket (OOP) spending by people living with HIV
(PLHIV).
2.1.1. Boundary definitions
Boundaries defining HA estimation based on SHA 2011, which articulate expenditure included and
excluded, are presented below.
Health boundary: The boundary of “health” in the HA is “functional” in that it refers to activities
whose primary purpose is disease prevention, health promotion, treatment, rehabilitation, and long-
term care. This boundary includes services provided directly to individual persons and collective health
care services covering traditional tasks of public health. Examples of personal health care services
include facility-based care (curative, rehabilitative, and preventive treatments involving day time or
overnight visits to health care facilities); ancillary services to health care such as laboratory tests and
imaging services; and medical goods dispensed to patients. Examples of collective health care services
include health promotion and disease prevention campaigns as well as government and insurance health
administration that target large populations. Services that fall outside of the functional definition of
health are not counted.
Health care related and capital formation spending is tracked separately in SHA 2011. Health care
related activities are intended to improve the health status of the population, but their primary purpose
lies elsewhere. Examples of health care related activities include food, hygiene, and drinking water
control and the social component of long term care for the elderly or care for People Living with HIV
(PLHIV). Capital formation of health care providers covers investment lasting more than a year such as
infrastructure or machinery investment as well as education and training of health personnel, research
and development in health. Capital formation contrasts with “current health expenditure” which is
completely consumed within the annual period of analysis.
HIV Boundary: HA according to SHA 2011 methodology focuses on the HIV spending whose primary
purpose is prevention, health promotion, treatment, rehabilitation, and long term care. This boundary of
HIV spending does not include spending on other activities comprising the HIV response such as care
for orphans and vulnerable children (e.g. education, community support and institutional care), enabling
environment programs (e.g. advocacy, human rights programs, and programs focused on women and
gender-based violence), and social protection and social services (e.g. monetary benefits, social services,
and income-generation projects). Spending data on non-health HIV services are provided in the 2012-13
HA report3.
Time Boundary: The HA time boundary specifies that each analysis covers a one-year period and
includes the value of the goods and services that were consumed during that period. HA includes
expenditure according to accrual accounting, by which expenditures are classified within the year they
create economic value rather than when the cash was received.
3 Ibid.

7
Space Boundary: HA “focuses on the consumption of health care goods and services of the resident
population irrespective of where this takes place” (OECD et al. 2011). This means that goods and
services consumed by residents (citizens and non-citizens) are included while non-residents in Barbados
(e.g. tourists) are excluded.
Exports/ imports: The inclusion of exports and imports for health care goods and services follow the
functional definition of health. All health care goods and services imported in order to serve residents of
Barbados are included in the Health Accounts. In these cases, imports are included whether they relate
to either the provider of service or the financer. For example, spending by a Barbados resident travelling
overseas to seek care is included (import of a provider); a non-Barbados insurance company reimbursing
a Barbados provider for services to a Barbados resident is equally included. Since exports relate to
spending incurred by non-residents, they are excluded from the Health Accounts.
2.1.2. Definitions of the Classifications The HA exercise involves analyzing data on health expenditure according to a set of classifications,
defined below. For additional details on the SHA 2011, please refer to the SHA 2011 Brief4 or the SHA
2011 manual5.
Financing schemes (HF): the main funding mechanisms by which people obtain health services,
answering the question “how are health resources managed and organized?” Financing schemes
categorizes spending according to criteria such as: mode of participation in the scheme (compulsory vs.
voluntary), the basis for entitlements (contributory vs. non-contributory), the method for fund-raising
(taxes/ compulsory pre-payments vs. voluntary payments) and the extent of risk pooling. Examples
include: government programs; voluntary private insurance; and direct (i.e. out-of-pocket (OOP))
payments by households for goods and services.
Revenue of financing schemes (FS): the types of transactions through which funding schemes
mobilize their income. Examples include: transfers from the ministry of finance to governmental
agencies, direct foreign financial transfers (e.g. external donors providing funds to NGOs); and voluntary
prepayment from employers.
Financing agents (FA): the institutional units that manage one or more health financing schemes.
Examples include: Ministry of Health, commercial insurance companies, NGOs and international
organizations.
Health care providers (HP): organizations and health professionals who provide medical goods and
services as their main activity, as well as those for whom the provision of health care is only one activity
among many others. Examples include: Hospitals, clinics, health centers, pharmacies.
Health care functions (HC): the goods and services consumed by health end-users. Examples
include: Curative care, information, education, and counseling programs, medical goods such as supplies
and pharmaceuticals, and governance and health system administration.
Factors of Provision (FP): the inputs to the production of health care goods and services by health
care providers. Examples include: compensation of employees, health care goods and services (e.g.
4 Cogswell, Heather, Catherine Connor, Tesfaye Dereje, Avril Kaplan, and Sharon Nakhimovsky. September 2013. System of Health Accounts 2011
What is SHA 2011 and How Are SHA 2011 Data Produced and Used?. Bethesda, MD: Health Finance & Governance project, Abt Associates Inc. 5 OECD, European Union, and the World Health Organization. 2011. A System of Health Accounts. OECD Publishing

8
pharmaceuticals, syringes, or lab tests used up as part of a curative or preventive contact with the health
system) and non-health care goods and services (e.g. electricity and training).
Beneficiary Characteristics: the groups that consume, or benefit from, the health care goods and
services. Several classifications can group beneficiaries, including disease, gender and age classifications.
2.1.3. Health Accounts Aggregates and Indicators There are two key aggregates that are generated by Health Accounts and that are used for comparisons
across countries.
Total Current Health Expenditure (CHE): Total current expenditure on health quantifies the
economic resources spent on health functions and represents final consumption on health goods and
services by residents of the country within the year of estimation. A related indicator is CHE-HIV, which
includes all current spending on HIV specifically.
Gross capital formation: Gross capital formation on health is measured as the total value of assets
that providers have acquired during the estimation year (less the value of sales of similar assets) and that
are used for longer than one year in the provision of health services.
Additional indicators that are usually generated by countries for policy and planning purposes include:
Total Health Expenditure (THE):6 The sum of current health spending and gross capital formation.
National Health Expenditure (NHE)7: The sum of current health spending, health care related
spending, and gross capital formation.
Government spending on health as percentage of general government expenditure: health
expenditure financed by government agencies as a percentage of total government expenditure. The
estimate of general government expenditure for 2012-13 came from the 2013-14 Government Estimates
of Revenue and Expenditure8.
Total current health expenditure as percentage of gross domestic product (GDP): CHE as a
percentage of GDP. The estimate of GDP for 2012-13 is sourced from the World Bank’s DataBank9.
Total Current Health Expenditure per capita (CHE per capita): CHE divided by the population.
The estimation of population for 2012-13 is sourced from the World Bank’s DataBank10.
6 This aggregate is comparable to NHA and SHA 1.0 estimations. 7 This aggregate is not an internationally standardized indicator as part of the SHA 2011 methodology, but can have
relevance for national level policy making in Barbados. 8 http://www.barbadosparliament.com/uploads/estimates/44a64e31bf71ca9b9a02346b2b1fa3a6.pdf. Accessed
November 2014. 9 http://databank.worldbank.org/data/home.aspx. Accessed November 2014. 10 Ibid.
9
2.2. Data Sources
2.2.1. Institutional data The HA team conducted primary and secondary data collection from the institutions listed below. For
the former, the HA team provided each institution with a HA survey instrument covering health
spending and, when appropriate, non-health HIV expenditure. The Health Accounts team also
conducted general household and PLHIV spending surveys, which are discussed in Sections 2.2.2 and
2.2.3.
Donors. (both bilateral and multilateral donors) A list of all donors involved in the health
sector was compiled through consultation with the MOH and other key stakeholders and a
survey was sent to each of them. Three donors were identified; one completed the HA survey
and data for one other was obtained via the Ministry of Health.
Nongovernmental organizations (NGOs) A complete list of NGOs involved in the health
sector was compiled through consultation with the MOH and other key stakeholders.
Seventeen NGOs were identified and all were sent a survey; nine responded to the
questionnaire.
Employers. Using the Chamber of Commerce’s Business Directory, a complete list of formal
sector employers was developed. A total of 209 employers were identified and a sample of 72
was surveyed. In order to obtain the sample frame, employers were stratified into four groups
based on size: large (500+ employees), medium (201-500 employees), small (51-200 employees),
micro (50 employees or less). Due to the small number of medium and large employers, all
were included in the sample. 75% of small and 10% of micro employers were randomly sampled
and included in the list. In total, 36 employers responded to the questionnaire.
Private insurance companies: A list of insurance companies providing medical coverage
through health, motor and other insurance policies was compiled through consultation with the
MOH and other key stakeholders. All 14 insurance companies identified were sent a survey and
data was received from 7. Of those companies which responded, four incurred health
expenditures through their health insurance policies and three through car insurance.
Secondary data collection comprised of information on health spending as well as service utilization and
unit cost data. Service utilization and unit cost data were used in order to calculate allocation keys (see
below for more detail), which seek to break down spending aggregates to the level of detail required by
the SHA 2011 framework.
Spending data
o Barbados Drug Service. Barbados pharmaceutical sales by individual drug, broken down
by pharmacy. April 2012 – March 2013.
o Government Appropriation Accounts for 2012-13. This included
MOH spending broken down by inputs (e.g., staff costs, utilities, rent, etc.) for
each of the departments: Direction & Policy Formulation Services, Primary
Healthcare, Hospital Services, Care of the Disabled, Pharmaceutical Program
(BDS), Care of the Elderly, HIV/AIDS Prevention & Control Unit and
Environmental Health Services.

10
Spending for the HIV Prevention and Control Program by all other ministries.
o Barbados National Insurance medical spending for the period 2012-2013 (these
expenses were not disaggregated by type of provider or type of service)
o Defense Force. Medical expenses for the period 2012-2013.
Utilization Data
o Queen Elizabeth Hospital 2012-13: Inpatient utilization (e.g., number of bed-days by
service); outpatient utilization (number of visits by service); and accident and emergency
utilization by diagnosis.
o Utilization data by diagnosis at the eight polyclinics.
o Inpatient and outpatient utilization by type of clinic for 2012-13 at Bayview Hospital.
Unit Cost Data
o Stephen Musau, Josef Tayag and Abigail Vogus. May 2013. Saint Lucia: Health Service
Delivery Costing and Other Economic Analyses. Bethesda, MD: Health Systems 20/20
Caribbean project, Abt Associates Inc: estimates of unit costs for inpatient and
outpatient care were used as a proxy for inpatient and outpatient unit costs for QEH
o WHO CHOICE database was consulted to triangulate allocation keys between inpatient
and outpatient care at hospitals. World Health Organization.
http://www.who.int/choice/country/country_specific/en/. Accessed September 2014.
Other Secondary Sources
o MOH’s HIV/AIDS Program provided the number of people living with HIV (PLHIV) as at
March 2013, the number of PLHIV on anti-retroviral (ARV) treatment in the public and
private sectors, and the total number of HIV tests conducted at polyclinics.
2.2.2. Health Expenditure Survey of Households
Data collected in the general household survey informs the estimates of household out-of-pocket
spending in Barbados. The household survey covered a range of topics, including whether the
respondent was sick or injured in the last four weeks and whether s/he received outpatient care in the
last four weeks. Similar questions were asked about inpatient admissions occurring in the six months
preceding the interview. If outpatient or inpatient care was paid for, the respondent was asked to
answer additional questions that cover diagnosis, choice of provider, the amount of out of pocket
spending and the type of service paid for. In order to calculate spending for 2012-13, the survey data
was adjusted for the population growth and the consumer price index for medical goods between 2012
and 2014.
Field supervisors and interview teams were recruited and trained during a workshop held in Barbados in
November 2014. The survey instrument was pre-tested in order to ensure quality and logical flow of
questioning.
From the period of November 11th to December 5th, 2014, a total of 1,429 households were surveyed
via a representative population sample survey. 972 households completed the survey and there were
317 non-responses resulting in a 68% completion rate. The HA team worked in collaboration with
Barbados Statistical Services during the planning phase in order to avoid duplication of interviews with
the ongoing Labour Force Survey. Using the most recent census survey data, Barbados Statistics Service

11
supported the team to construct the sample frame11. Sampling weights were used to account for any
bias that may be related to unequal probabilities of selection, non-response and unequal coverage of
population groups.
2.2.3. Health Expenditure Survey of People Living with HIV In order to estimate OOP spending on HIV, the HA team conducted a health expenditure survey of
people living with HIV (PLHIV). The data collection instrument used in this health expenditure survey
covered a range of issues including whether the PLHIV was sick or injured in the last four weeks and
whether s/he received outpatient care in the last four weeks. Similar questions were asked about
inpatient admissions occurring in the six months preceding the interview. In order to reduce some of
the bias caused by the location of the interview, PLHIV were asked about their last visit other than that
at LRU. If outpatient or inpatient care was paid for, the respondent was asked to answer additional
questions that cover diagnosis, choice of provider, the amount of out of pocket spending and the type of
service paid for. In order to calculate spending for 2012-13, the survey data was adjusted for the
population growth and the consumer price index for medical goods between 2012 and 2014.
The PLHIV survey was implemented by the MOH and the University of the West Indies, HEU, Centre
for Health Economics (UWI-HEU), in conjunction with the Barbados Statistical Service. Field supervisors
and interviewers were recruited and trained in November 2014. The PLHIV survey was pre-tested and
data collection took place over a three week period from November 17th to December 5th, 2014. A
purposive sample of the PLHIV population was chosen from patients visiting the Ladymeade Reference
Unit (LRU), based on recommendations of local health officials. The sample size was 135 out of an
estimated population of 1,595 PLHIVs.
2.3. Data Analysis
2.3.1. Weighting Weights are used in the HA to inflate the survey responses to account for entities that were either not
surveyed or did not return a survey. In the absence of a 100% response rate, weighting expenditure
gathered through institutional surveys can minimize underestimation of health expenditure.
In this exercise, all employers were first categorized by the sector of operation, using the Barbados
Business Directory as a reference. Within each sector, health spending by organizations was weighted
based on the number of full time employees in each company. This method of weighting is in line with
SHA 2011 recommendations and has been used by many countries conducting HAs: it assumes that,
within a particular sector, health spending of organizations is proportional to their number of
employees. This weighting allowed for the estimation of health spending from employers who did not
respond to the survey.
For insurance spending, an average spending amount was calculated per health insurance policy holder.
Average spending was multiplied by the number of policy holders in Barbados who were not part of the
11 Survey sample selection involved a two-step process. First, all districts in Barbados were listed with their corresponding
number of households. This process ensured that the sample selected was representative of the entire population. The second
step involved the selection of households within districts to be sampled, using a systematic random selection process.

12
insurance surveys received. The latter figure was calculated from the total number of policy holders in
Barbados (sourced from the household survey) subtracted by the number of policy holders covered by
HA surveys received from 4 health insurance companies.
The HA team however did not apply any weights to NGO. Given the variability in NGO spending and
the limited knowledge about health and HIV related NGOs in Barbados, the HA team decided to err on
the side of underestimating NGO spending rather than introduce baseless assumptions about the
spending of the eight NGOs which did not respond.
2.3.2. Double counting HA analysis includes careful compilation from all data sources, and identification and management of
instances when two data sources cover the same spending. For example, spending on donor-funded
health and HIV programs administered by NGOs were reported both in donor surveys as well as NGO
surveys. In these cases, the HA team selected the spending as reported by NGOs, as they were closer
to the actual consumption of health care services than donors. Since they are closer to the spending,
they are therefore likely to have more precise information about real spending, not planned spending or
disbursements.
Similarly, double-counting exists at the employer and insurance level since employers reporting spending
for health insurance is equally reported as revenue used by insurance companies to pay claims. As with
the previous example, the data of the organization closest to the spending, in this case the insurance
companies, took precedence and employer spending on health insurance was excluded.
While donor and employer data were excluded, this does not preclude the importance of collecting
their spending information as a useful source of triangulation.
2.3.3. Estimation and application of allocation splits In some cases, health and HIV spending as reported in secondary sources or in surveys required
additional breakdowns in order to allocate spending to classifications of the SHA framework. Part of the
HA therefore involved estimating “allocation keys” to break down spending for the provider, functional
and disease classifications. This section lists the allocations keys developed for this HA along with the
data sources and assumptions made for each one.
TABLE 1. FUNCTIONAL ALLOCATION KEYS
Allocation
Key
Methodological Approach and Assumptions
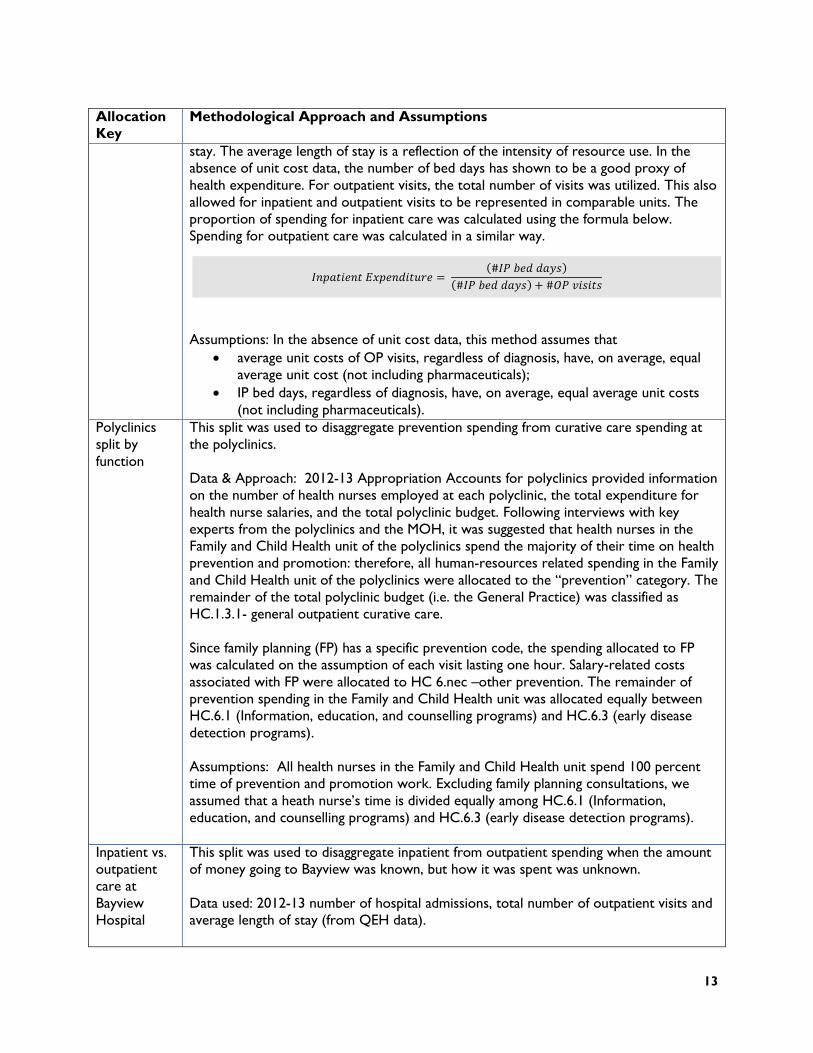
Inpatient vs.
outpatient
care at QEH
This split was used to disaggregate total QEH spending by inpatient and outpatient care.
Expenditures on accident and emergencies were included as part of outpatient care.
Data used: 2012-13 patient days from inpatient wards and number of visits in outpatient
clinics (from QEH Medical Records).
Approach: Inpatient days combines the number of admissions with the average length of
13
Allocation
Key
Methodological Approach and Assumptions
stay. The average length of stay is a reflection of the intensity of resource use. In the
absence of unit cost data, the number of bed days has shown to be a good proxy of
health expenditure. For outpatient visits, the total number of visits was utilized. This also
allowed for inpatient and outpatient visits to be represented in comparable units. The
proportion of spending for inpatient care was calculated using the formula below.
Spending for outpatient care was calculated in a similar way.
Assumptions: In the absence of unit cost data, this method assumes that
average unit costs of OP visits, regardless of diagnosis, have, on average, equal
average unit cost (not including pharmaceuticals);
IP bed days, regardless of diagnosis, have, on average, equal average unit costs
(not including pharmaceuticals).
Polyclinics
split by
function
This split was used to disaggregate prevention spending from curative care spending at
the polyclinics.
Data & Approach: 2012-13 Appropriation Accounts for polyclinics provided information
on the number of health nurses employed at each polyclinic, the total expenditure for
health nurse salaries, and the total polyclinic budget. Following interviews with key
experts from the polyclinics and the MOH, it was suggested that health nurses in the
Family and Child Health unit of the polyclinics spend the majority of their time on health
prevention and promotion: therefore, all human-resources related spending in the Family
and Child Health unit of the polyclinics were allocated to the “prevention” category. The
remainder of the total polyclinic budget (i.e. the General Practice) was classified as
HC.1.3.1- general outpatient curative care.
Since family planning (FP) has a specific prevention code, the spending allocated to FP
was calculated on the assumption of each visit lasting one hour. Salary-related costs
associated with FP were allocated to HC 6.nec –other prevention. The remainder of
prevention spending in the Family and Child Health unit was allocated equally between
HC.6.1 (Information, education, and counselling programs) and HC.6.3 (early disease
detection programs).
Assumptions: All health nurses in the Family and Child Health unit spend 100 percent
time of prevention and promotion work. Excluding family planning consultations, we
assumed that a heath nurse’s time is divided equally among HC.6.1 (Information,
education, and counselling programs) and HC.6.3 (early disease detection programs).
Inpatient vs.
outpatient
care at
Bayview
Hospital
This split was used to disaggregate inpatient from outpatient spending when the amount
of money going to Bayview was known, but how it was spent was unknown.
Data used: 2012-13 number of hospital admissions, total number of outpatient visits and
average length of stay (from QEH data).
𝐼𝑛𝑝𝑎𝑡𝑖𝑒𝑛𝑡 𝐸𝑥𝑝𝑒𝑛𝑑𝑖𝑡𝑢𝑟𝑒 = (#𝐼𝑃 𝑏𝑒𝑑 𝑑𝑎𝑦𝑠)
(#𝐼𝑃 𝑏𝑒𝑑 𝑑𝑎𝑦𝑠) + #𝑂𝑃 𝑣𝑖𝑠𝑖𝑡𝑠

14
Allocation
Key
Methodological Approach and Assumptions
Approach: The team converted all IP data into “hospitalization bed days” by multiplying
the number of inpatient admissions by the average length of stay of those admissions
from QEH (average length of stay was calculated by dividing the number of discharge
days by the number of admissions at QEH). The average length of stay is a reflection of
the intensity of resource use. In the absence of unit cost data, the number of bed days
has shown to be a good proxy of health expenditure. This conversion allowed for
inpatient and outpatient visits to be represented in comparable units. The proportion of
spending for inpatient care was calculated using the formula below. Spending for
outpatient care was calculated in a similar way.
Assumptions: In the absence of unit cost data, this method assumes that
average unit costs of OP visits, regardless of diagnosis, have, on average, equal
average unit cost (not including pharmaceuticals);
IP bed days, regardless of disease, have, on average, equal average unit costs (not
including pharmaceuticals);
The average length of stay at Bayview hospital is similar to that of QEH.
Curative vs.
prevention
spending at
Ladymeade
Reference
Unit (LRU)
This split was used to disaggregate curative and prevention spending at LRU.
Approach: LRU provides outpatient curative care services as well as prevention services
including Voluntary Counselling and Testing and the distribution of condoms. In the
absence of disaggregated data an equal split of spending between curative outpatient
care and prevention care was assumed. Prevention spending was further broken down
equally between HC.6.1- Information, education, and counselling programs and HC.6.3 –
Early disease detection programs (which includes testing). For this purpose the provision
of ARVs was considered under outpatient curative care services.
TABLE 2. DISEASE ALLOCATION KEYS
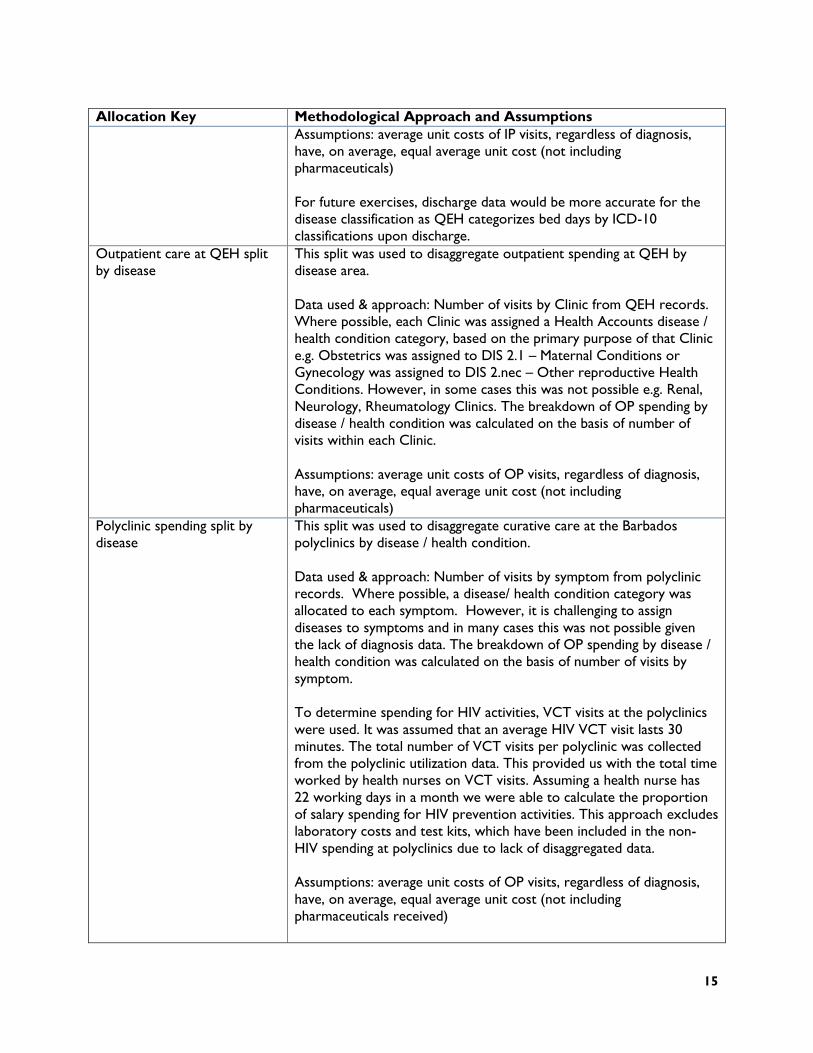
Allocation Key Methodological Approach and Assumptions
Inpatient care at QEH split by
disease
This split was used to disaggregate inpatient spending at QEH by
disease area.
Data used & approach: Discharge days by Service from QEH records.
Where possible, a disease/ health condition category was allocated to
each Service based on the primary purpose of that Service e.g.
Radiotherapy service was assigned to DIS 4.1 – Neoplasms or
Psychiatry service was assigned to DIS 4.4 – Mental disorders. The
breakdown of IP spending by disease / health condition was calculated
on the basis of bed days within each Service.
𝐼𝑛𝑝𝑎𝑡𝑖𝑒𝑛𝑡 𝐸𝑥𝑝𝑒𝑛𝑑𝑖𝑡𝑢𝑟𝑒 = (#𝐼𝑃 𝑏𝑒𝑑 𝑑𝑎𝑦𝑠)
(#𝐼𝑃 𝑏𝑒𝑑 𝑑𝑎𝑦𝑠) + #𝑂𝑃 𝑣𝑖𝑠𝑖𝑡𝑠
15
Allocation Key Methodological Approach and Assumptions
Assumptions: average unit costs of IP visits, regardless of diagnosis,
have, on average, equal average unit cost (not including
pharmaceuticals)
For future exercises, discharge data would be more accurate for the
disease classification as QEH categorizes bed days by ICD-10
classifications upon discharge.
Outpatient care at QEH split
by disease
This split was used to disaggregate outpatient spending at QEH by
disease area.
Data used & approach: Number of visits by Clinic from QEH records.
Where possible, each Clinic was assigned a Health Accounts disease /
health condition category, based on the primary purpose of that Clinic
e.g. Obstetrics was assigned to DIS 2.1 – Maternal Conditions or
Gynecology was assigned to DIS 2.nec – Other reproductive Health
Conditions. However, in some cases this was not possible e.g. Renal,
Neurology, Rheumatology Clinics. The breakdown of OP spending by
disease / health condition was calculated on the basis of number of
visits within each Clinic.
Assumptions: average unit costs of OP visits, regardless of diagnosis,
have, on average, equal average unit cost (not including
pharmaceuticals)
Polyclinic spending split by
disease
This split was used to disaggregate curative care at the Barbados
polyclinics by disease / health condition.
Data used & approach: Number of visits by symptom from polyclinic
records. Where possible, a disease/ health condition category was
allocated to each symptom. However, it is challenging to assign
diseases to symptoms and in many cases this was not possible given
the lack of diagnosis data. The breakdown of OP spending by disease /
health condition was calculated on the basis of number of visits by
symptom.
To determine spending for HIV activities, VCT visits at the polyclinics
were used. It was assumed that an average HIV VCT visit lasts 30
minutes. The total number of VCT visits per polyclinic was collected
from the polyclinic utilization data. This provided us with the total time
worked by health nurses on VCT visits. Assuming a health nurse has
22 working days in a month we were able to calculate the proportion
of salary spending for HIV prevention activities. This approach excludes
laboratory costs and test kits, which have been included in the non-
HIV spending at polyclinics due to lack of disaggregated data.
Assumptions: average unit costs of OP visits, regardless of diagnosis,
have, on average, equal average unit cost (not including
pharmaceuticals received)

16
Allocation Key Methodological Approach and Assumptions
Government pharmaceutical
program (BDS)
This split was used to disaggregate pharmaceutical spending by disease
area.
Data used and approach: The Barbados Drug Service provided a list of
drug expenditures for the year 2012-13 broken down by public and
private providers and by individual drug. Using medical experts, drugs
were assigned to one of 19 possible disease classifications using the
“main condition method” i.e. where possible, drug spending was
assigned to the primary disease/ condition that the drug is used to
treat. The ratio of spending was applied to total drug spending by BDS.
For some drugs, it was not possible to assign a disease code; spending
on these drugs were classified as “Non disease specific”.
Inpatient and outpatient care
at Bayview Hospital split by
disease
This split was used to disaggregate inpatient and outpatient spending at
Bayview Hospital by disease area.
Data used & approach:
IP split by disease: Data on the 2012-13 IP admissions (from Bayview
records) by clinic area were obtained. Expert opinion was used to
classify the clinic areas by disease categories, to the extent possible. A
ratio of IP admissions per disease category versus total IP admissions
for the year was used to split expenditures by disease.
OP split by disease: Data on the 2012-13 OP visits (from Bayview
records) by clinic area were obtained. Expert opinion was used to
classify the clinic areas by disease categories, to the extent possible. A
ratio of OP visits per disease category versus total OP visits for the
year was used to split expenditures by disease.
Assumptions: The IP and OP allocation keys for disease at QEH was
considered for Bayview but was rejected since QEH treats a wider
range of diseases than Bayview hospital. The approach above assumes
that OP visits and IP admissions across all diagnoses have, on average,
equal average unit cost.
In addition to the allocation splits provided above, a split was also used to disaggregate insurance
spending by provider. In its survey, one insurance company specified the providers to which it paid
medical expenses. In cases where other insurance companies did not specify the providers through
which they incurred health spending, the provider breakdown from the complete survey was used. This
approach assumes that insurance companies use similar providers in similar proportions.
2.4. Use of HA Production Tool Throughout the HA process, the technical team utilized the HA Production Tool (HAPT), a software
developed by WHO. The HAPT is a tool that facilitates the planning and production of Health Accounts.
It automates several previously time-consuming procedures e.g. repeat mapping, and incorporates
automatic quality checks. Its advantage also lies in providing a repository for HA data and HA tables

17
which can be easily accessed by team members years after the production of Health Accounts. In
addition, allocation keys and mapping decisions from previous years can be used to facilitate data analysis
in subsequent years.
A list of all institutions to be surveyed was entered into the HAPT. All data collected was imported into
the HAPT and was mapped to the SHA 2011’s key classifications. The team utilized the Data Validation
module in the Tool to verify the final data and check for any errors, before automatically generating the
HA tables.

18
3. Limitations A significant challenge encountered by the Health Accounts team is the lack of disaggregated
government data e.g. by type of activity or disease/ health condition. Government data is largely tracked
through inputs and not by outputs or results. This led to several consequences. Spending for prevention
activities was not complete at the polyclinic level. Given information provided by interviews with several
health experts, all spending in the Family and Child Health clinics of the polyclinics were considered
health prevention work. It is acknowledged that much prevention work also takes place at the General
Practice of the polyclinics. However, due to lack of detailed data, it was not possible to break down
spending at General Practice between prevention and curative care.
Response rate from NGOs was lower than expected which led to an underestimation of health
spending. Several NGOs expressed not having the time or human resources to provide data in the
format required and within the deadline set. A significant amount of NGO funding is sourced from
corporate and individual donations; the contributions made by corporations and households to NGOs
were not captured by the employer or household surveys and therefore could not be used as a proxy
for NGO spending. However, absolute response rates do not give an indication as to the percentage of
total health expenditure which has been captured. The majority of large NGOs operating in Barbados
did respond to the survey and therefore most of NGO spending has been captured. Many NGOs
conduct important work in health prevention and promotion. Again, this spending was underestimated
at the NGO level due to response rates.
Breakdown of health spending by disease was only possible for 48% of health spending (excluding
general management costs). Lack of data led the HA team to estimate “distribution keys” which were
used to break down spending by disease and by type of activity. These distribution keys were calculated
using SHA 2011 recommendations and were triangulated with other sources, such as WHO CHOICE,
wherever possible. Details of the distribution keys used can be found in the Statistical Report12.
The Health Accounts provide the first ever breakdown of out-of-pocket spending by households on
health. The data collected by the Health Accounts team enables the government to understand where
households are spending out-of-pocket and for what types of services. However, due to time
constraints and the ongoing Labor Force Survey, the sample size and the response rate of the general
household survey was not as large as anticipated. Confidence intervals for the health expenditure
estimates are provided in the table below. Working with the Barbados Statistical Service, the Health
Accounts team did however ensure that the household survey was nationally representative.
Health Accounts
estimation (BBD)
90% confidence
interval (BBD) -
minimum
90% confidence
interval (BBD) -
maximum
Total outpatient spending
(excluding medications)
195,911,224 120,288,323 279,419,751
Total inpatient spending
(excluding medications)
23, 547,709 1,246,456 29,159,512
Please note that a 90% confidence interval would be considered ambitious for a survey of this sample
size.
12 Ibid.

19
The sample for HIV survey is similarly low. Despite the low sample sizes, we believe that the approach
used for recruiting interviewees and the structure of the survey instrument minimized any significant
bias associated with conducting the survey at the LRU. According to the MOH’s HIV/AIDS Program, the
vast majority of the PLHIV population receives care at LRU. Those consulting private health providers
also utilize LRU for their ARVs. In addition, the survey instrument was designed to capture spending
during the respondent’s last two visits with the aim of capturing any visits at providers other than LRU.
Therefore, the sole potential bias introduced by the above approach is that PLHIV who have never
utilized LRU would have been excluded from the survey. We were informed by the HIV/AIDS Program
that this is extremely unlikely.

20
4. General Health Accounts Statistical Tables
The statistical tables provided in this section summarize the HA data through a series of two dimensional tables. Each table cross-tabulates
spending for two HA classifications. Unless otherwise specified, these tables summarize recurring health spending only.
4.1. Financing scheme (HF) x Revenues of health care financing schemes (FS)
FS.1 FS.2 FS.3 FS.5 FS.6 FS.7 All FS
FS.1.1 FS.1.3 FS.1.4 FS.3.2 FS.5.1 FS.5.2 FS.6.1 FS.6.2 FS.6.3 FS.7.1 FS.7.2
FS.7.1.1 FS.7.2.1
FS.7.2.1.2 FS.7.2.1.3
Barbados Dollars
(BBD), Million
Inte
rnal t
ransfe
rs a
nd g
rants
Subsid
ies
Oth
er
transfe
rs fro
m
govern
ment dom
estic
revenue
So
cia
l in
su
ran
ce
co
ntr
ibu
tio
ns
Vo
lun
tary
pre
paym
en
t
Volu
nta
ry p
repaym
ent fr
om
indiv
iduals
/household
s
Volu
nta
ry p
repaym
ent fr
om
em
plo
yers
Oth
er
do
mesti
c r
even
ues
n.e
.c.
Oth
er
revenues fro
m
household
s n
.e.c
.
Oth
er
revenues fro
m
corp
ora
tions n
.e.c
.
Oth
er
revenues fro
m N
PIS
H
n.e
.c.
Direct fo
reig
n fin
ancia
l
transfe
rs
Direct bila
tera
l fin
ancia
l
transfe
rs
Direct fo
reig
n a
id in
kin
d
Direct fo
reig
n a
id in
goods
Direct m
ulti
late
ral a
id in
goods
Oth
er
direct fo
reig
n a
id in
goods
HF.1 390.47 389.14 1.34 1.86 0.48 0.48 0.08 0.08 392.90
HF.1.1 390.47 389.14 1.34 1.86 0.08 0.08 392.42
HF.1.2 0.48 0.48 0.48
HF.2 5.87 5.25 0.61 37.21 3.18 34.04 3.50 1.38 2.12 0.80 0.76 0.76 0.05 0.05 0.01 0.03 47.38
HF.2.1 5.25 5.25 37.21 3.18 34.04 42.47
HF.2.1.1 5.25 5.25 37.21 3.18 34.04 42.47
HF.2.1.1.1 Employer-based
insurance (other than
enterprises
schemes)
5.25 5.25 34.87 0.84 34.04 40.13
HF.2.1.1.3 Other primary
coverage schemes
2.34 2.34 2.34
HF.2.2 0.61 0.61 2.12 2.12 0.80 0.76 0.76 0.05 0.05 0.01 0.03 3.53
HF.2.3 1.38 1.38 1.38
HF.3 276.87 276.87 276.87
HF.3.1 276.87 276.87 276.87
396.34 389.14 5.25 1.95 1.86 0.48 0.48 37.21 3.18 34.04 280.45 276.87 1.38 2.20 0.80 0.76 0.76 0.05 0.05 0.01 0.03 717.14All HF
Revenues of
health care
financing
schemesT
ran
sfe
rs f
rom
go
vern
men
t
do
mesti
c r
even
ue (
allo
cate
d t
o
healt
h p
urp
oses)
Tra
nsfe
rs d
istr
ibu
ted
by
go
vern
men
t fr
om
fo
reig
n o
rig
in
Dir
ect
fore
ign
tra
nsfe
rs
Socia
l insura
nce c
ontr
ibutio
ns fro
m
em
plo
yers
Government schemes and compulsory
contributory health care financing schemes
Financing schemes
Voluntary health care payment schemes
Household out-of-pocket payment
Primary/substitutory health
insurance schemes
NPISH financing schemes
(including development agencies)
Enterprise f inancing schemes
Government schemes
Compulsory contributory health
insurance schemes
Voluntary health insurance
schemes
Out-of-pocket excluding cost-
sharing

21
4.2. Financing scheme (HF) x Institutional Units providing revenues to financing schemes (FS RI)
Memorandum items
FS.RI.1
FS.RI.1.1 FS.RI.1.2 FS.RI.1.3 FS.RI.1.4 FS.RI.1.5
Barbados Dollars
(BBD), Million
Govern
ment
Corp
ora
tions
Household
s
NP
ISH
Rest of th
e w
orld
HF.1 392.90 390.47 0.48 0.08 1.86
HF.1.1 392.42 390.47 0.08 1.86
HF.1.2 0.48 0.48
HF.2 47.38 5.87 35.42 3.18 2.12 0.80
HF.2.1 42.47 5.25 34.04 3.18
HF.2.1.1 42.47 5.25 34.04 3.18
HF.2.1.1.1 Employer-based
insurance (other than
enterprises
schemes)
40.13 5.25 34.04 0.84
HF.2.1.1.3 Other primary
coverage schemes
2.34 2.34
HF.2.2 3.53 0.61 2.12 0.80
HF.2.3 1.38 1.38
HF.3 276.87 276.87
HF.3.1 276.87 276.87
717.14 396.34 35.89 280.04 2.20 2.67
Instit
utio
nal u
nits
pro
vid
ing
revenues to fin
ancin
g
schem
es
Revenues b
y in
stit
utio
nal u
nits
All HF
Revenues of
health care
financing
schemes
Government schemes and compulsory
contributory health care financing schemes
Financing schemes
Voluntary health care payment schemes
Household out-of-pocket payment
Primary/substitutory health
insurance schemes
NPISH financing schemes
(including development agencies)
Enterprise f inancing schemes
Government schemes
Compulsory contributory health
insurance schemes
Voluntary health insurance
schemes
Out-of-pocket excluding cost-
sharing
22
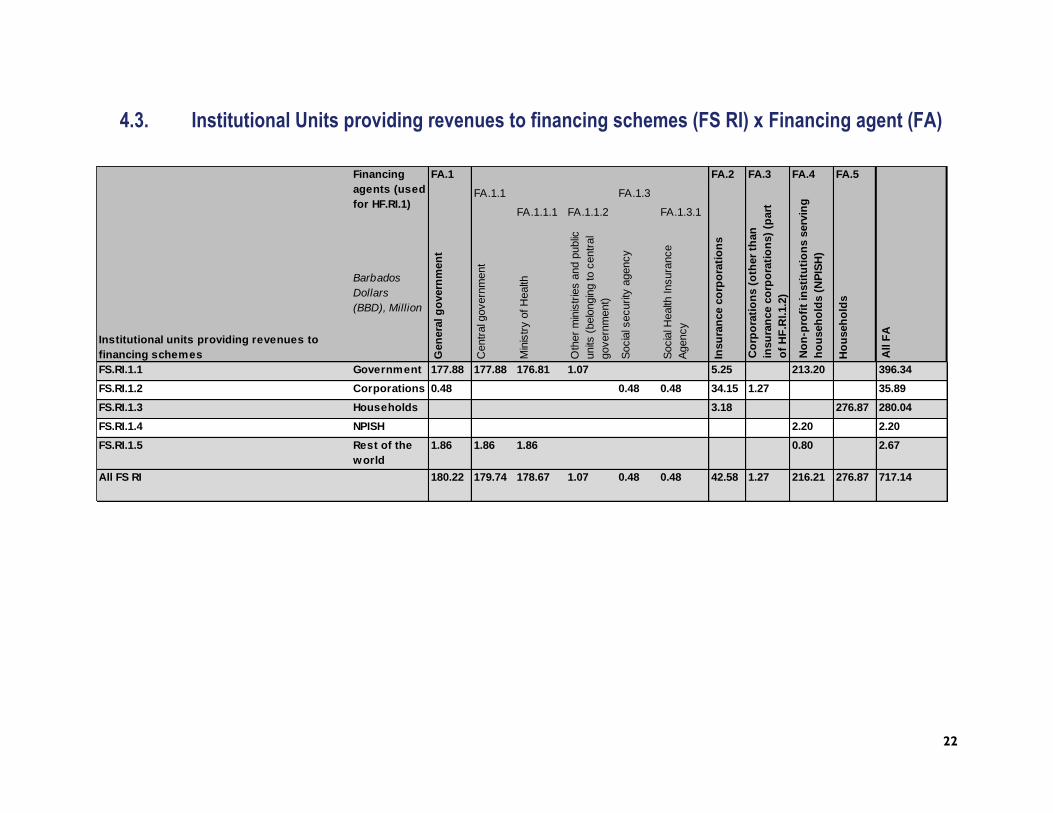
4.3. Institutional Units providing revenues to financing schemes (FS RI) x Financing agent (FA)
FA.1 FA.2 FA.3 FA.4 FA.5
FA.1.1 FA.1.3
FA.1.1.1 FA.1.1.2 FA.1.3.1
Barbados
Dollars
(BBD), Million
Gen
era
l g
overn
men
t
Centr
al g
overn
ment
Min
istr
y o
f H
ealth
Oth
er
min
istr
ies a
nd p
ublic
units
(belo
ngin
g to c
entr
al
govern
ment)
Socia
l security
agency
Socia
l Health
Insura
nce
Agency
Insu
ran
ce c
orp
ora
tio
ns
Ho
useh
old
s
FS.RI.1.1 Government 177.88 177.88 176.81 1.07 5.25 213.20 396.34
FS.RI.1.2 Corporations 0.48 0.48 0.48 34.15 1.27 35.89
FS.RI.1.3 Households 3.18 276.87 280.04
FS.RI.1.4 NPISH 2.20 2.20
FS.RI.1.5 Rest of the
world
1.86 1.86 1.86 0.80 2.67
180.22 179.74 178.67 1.07 0.48 0.48 42.58 1.27 216.21 276.87 717.14All FS RI
All F
A
Co
rpo
rati
on
s (
oth
er
than
insu
ran
ce c
orp
ora
tio
ns)
(part
of
HF
.RI.1.2
)
No
n-p
rofi
t in
sti
tuti
on
s s
erv
ing
ho
useh
old
s (
NP
ISH
)
Financing
agents (used
for HF.RI.1)
Institutional units providing revenues to
financing schemes

23
4.4. Institutional Units providing revenues to financing schemes (FS RI) x Function (HC)
HC.1 HC.2 HC.3 HC.4 HC.5 HC.6 HC.7
HC.1.1 HC.1.3 HC.4.1 HC.4.3 HC.4.nec HC.5.1 HC.5.2 HC.6.1 HC.6.3 HC.6.4 HC.6.5 HC.6.nec
Barbados
Dollars
(BBD), Million
Cu
rati
ve c
are
Inpatient cura
tive c
are
Outp
atient cura
tive c
are
Reh
ab
ilit
ati
ve c
are
Lo
ng
-term
care
(h
ealt
h)
An
cilla
ry s
erv
ices (
no
n-
sp
ecif
ied
by f
un
cti
on
)
Labora
tory
serv
ices
Patient tr
ansport
ation
Oth
er
ancillary
serv
ices
(n.e
.c.)
Med
ical g
oo
ds (
no
n-
sp
ecif
ied
by f
un
cti
on
)
Pharm
aceuticals
and o
ther
medic
al non-d
ura
ble
goods
Thera
peutic a
pplia
nces a
nd
oth
er
medic
al goods
Pre
ven
tive c
are
Info
rmation, education a
nd
counselin
g p
rogra
mm
es
Early d
isease d
ete
ction
pro
gra
mm
es
Healthy c
onditio
n m
onitoring
pro
gra
mm
es
Epid
em
iolo
gic
al surv
eillance
and r
isk a
nd d
isease c
ontr
ol
pro
gra
mm
es
Oth
er
pre
ventive c
are
(n.e
.c.)
All H
C
FS.RI.1.1 Government 267.08 138.48 128.60 2.10 74.48 0.35 0.06 0.29 13.76 13.70 0.06 16.28 7.54 4.21 4.53 0.01 22.30 396.34
FS.RI.1.2 Corporations 31.83 12.46 19.38 0.29 1.45 1.45 0.91 0.91 1.41 0.09 0.05 1.27 35.89
FS.RI.1.3 Households 218.97 29.74 189.23 0.02 0.09 0.09 60.96 60.96 0.01 0.00 0.00 280.04
FS.RI.1.4 NPISH 0.15 0.08 0.07 1.70 0.05 0.04 0.04 0.04 0.03 0.01 0.24 0.22 0.02 2.20
FS.RI.1.5 Rest of the
world
0.68 0.20 0.48 1.83 0.58 0.59 0.20 0.46 0.16 2.67
All FS RI 518.71 180.96 337.75 4.11 74.53 1.92 0.06 0.04 1.83 75.66 75.59 0.07 19.76 8.43 4.87 1.27 4.73 0.47 22.46 717.14
Go
vern
an
ce, an
d h
ealt
h s
yste
m
an
d f
inan
cin
g a
dm
inis
trati
on
Health care
functions
Institutional units providing revenues to
financing schemes

24
4.5. Health care provider (HP) x Financing scheme (HF)
HF.1 HF.2 HF.3 All HF
HF.1.1 HF.1.2 HF.2.1 HF.2.2 HF.2.3
HF.2.1.1
HF.2.1.1.1 HF.2.1.1.3
Barbados Dollars
(BBD), Million
Govern
ment schem
es
Com
puls
ory
contr
ibuto
ry
health
insura
nce s
chem
es
Vo
lun
tary
healt
h c
are
paym
en
t sch
em
es
Volu
nta
ry h
ealth
insura
nce
schem
es
Prim
ary
/substit
uto
ry h
ealth
insura
nce s
chem
es
Em
plo
yer-
based in
sura
nce
(oth
er
than e
nte
rprises
schem
es)
Oth
er
prim
ary
covera
ge
schem
es
NP
ISH
fin
ancin
g s
chem
es
(inclu
din
g d
evelo
pm
ent
agencie
s)
Ente
rprise fin
ancin
g s
chem
es
Ho
useh
old
ou
t-o
f-p
ocket
paym
en
t
HP.1 Hospitals 275.15 275.06 0.09 8.45 8.40 8.40 7.94 0.46 0.05 77.48 360.68
HP.1.1 General hospitals 240.52 240.43 0.09 8.45 8.40 8.40 7.94 0.46 0.05 77.48 326.06
HP.1.1.1 240.44 240.43 0.01 2.84 2.84 2.84 2.69 0.15 0.00 19.63 262.91
HP.1.1.1.1 Private Wing (QEH) 0.01 0.01 2.84 2.84 2.84 2.69 0.15 0.00 17.38 20.23
HP.1.1.1.nec Other General Public
Hospital (QEH)
240.43 240.43 2.25 242.68
HP.1.1.2 0.08 0.08 5.62 5.56 5.56 5.26 0.31 0.05 57.04 62.73
HP.1.1.n
ec
0.02 0.02
HP.1.2 34.63 34.63 34.63
HP.2 19.88 19.88 2.26 2.26 22.14
HP.3 52.71 52.37 0.34 23.44 23.22 23.22 21.91 1.31 0.15 0.06 154.10 230.24
HP.3.1 0.45 0.16 0.29 22.19 22.13 22.13 20.89 1.24 0.06 153.87 176.51
HP.3.2 0.05 0.05 1.09 1.09 1.09 1.02 0.07 0.00 1.15
HP.3.4 52.21 52.21 0.10 0.10 0.23 52.54
HP.3.4.6 42.27 42.27 0.00 0.00 0.23 42.50
HP.3.4.7 7.61 7.61 7.61
HP.3.4.9 2.33 2.33 0.10 0.10 2.43
HP.3.5 0.05 0.05 0.05
HP.4 0.06 0.06 1.87 1.83 1.83 1.74 0.09 0.04 1.92
HP.5 13.61 13.59 0.01 1.19 1.16 1.16 1.08 0.07 0.04 0.00 45.07 59.87
HP.5.1 13.55 13.53 0.01 1.19 1.16 1.16 1.08 0.07 0.03 0.00 45.07 59.80
HP.5.2 0.06 0.06 0.01 0.01 0.07
HP.6 0.87 0.87 2.44 0.13 0.13 0.12 0.01 1.03 1.26 3.30
HP.7 30.59 30.59 30.59
HP.9 0.04 0.04 7.74 7.73 7.73 7.32 0.40 0.01 0.00 0.62 8.40
All HP 392.90 392.42 0.48 47.39 42.47 42.47 40.13 2.34 3.53 1.38 276.87 717.14
General Public Hospital
Financing schemes
Health care providers
Retailers and other providers of medical goods
Providers of preventive care
Providers of health care system administration and
financingRest of the world
Ambulatory health care centres
Ladymeade Reference Unit
All other ambulatory centres
Providers of home health care services
Providers of ancillary services
Retail sellers and other suppliers of durable
medical goods and medical appliances
Mental health hospitals
Other General hospitals
Private Hospital
Go
vern
men
t sch
em
es a
nd
co
mp
uls
ory
co
ntr
ibu
tory
healt
h
care
fin
an
cin
g s
ch
em
es
Pharmacies
Polyclinics
Dental practice
Medical practices
Providers of ambulatory health care
Residential long-term care facilities

25
4.6. Health care function (HC) x Financing Scheme (HF)
HF.1 HF.2 HF.3 All HF
HF.1.1 HF.1.2 HF.2.1 HF.2.2 HF.2.3 HF.3.1
HF.2.1.1
HF.2.1.1.1 HF.2.1.1.3
Barbados
Dollars (BBD),
Million
Gov
ernm
ent s
chem
es
Com
puls
ory
cont
ribut
ory
heal
th in
sura
nce
sche
mes
Volu
ntar
y he
alth
car
e
paym
ent s
chem
es
Volu
ntar
y he
alth
insu
ranc
e
sche
mes
Prim
ary/
subs
titut
ory
heal
th
insu
ranc
e sc
hem
es
Empl
oyer
-bas
ed in
sura
nce
(oth
er th
an e
nter
pris
es
sche
mes
)
Oth
er p
rimar
y co
vera
ge
sche
mes
NPI
SH fi
nanc
ing
sche
mes
(incl
udin
g de
velo
pmen
t
agen
cies
)
Ente
rpris
e fin
anci
ng s
chem
es
Hou
seho
ld o
ut-o
f-po
cket
paym
ent
Out
-of-p
ocke
t exc
ludi
ng c
ost-
shar
ing
HC.1 Curative care 263.59 263.12 0.46 39.11 38.98 38.98 36.83 2.15 0.06 0.07 216.01 216.01 518.71
HC.1.1 136.78 136.66 0.12 15.46 15.46 15.46 14.64 0.82 0.00 28.72 28.72 180.96
HC.1.3 126.81 126.46 0.35 23.65 23.52 23.52 22.19 1.33 0.06 0.07 187.29 187.29 337.75
HC.2 1.43 1.43 2.68 0.37 0.37 0.35 0.02 2.31 4.11
HC.3 74.48 74.48 0.05 0.05 74.53
HC.4 0.06 0.06 1.87 1.83 1.83 1.74 0.09 0.04 1.92
HC.5 13.61 13.59 0.01 1.19 1.16 1.16 1.08 0.07 0.04 0.00 60.86 60.86 75.66
HC.5.1 13.55 13.53 0.01 1.19 1.16 1.16 1.08 0.07 0.03 0.00 60.86 60.86 75.59
HC.5.2 0.06 0.06 0.01 0.01 0.07
HC.6 Preventive care 17.29 17.29 2.48 0.13 0.13 0.12 0.01 1.04 1.31 19.76
HC.6.1 7.86 7.86 0.57 0.07 0.07 0.06 0.00 0.47 0.04 8.43
HC.6.3 4.53 4.53 0.34 0.07 0.07 0.06 0.00 0.27 4.87
HC.6.4 1.27 1.27 1.27
HC.6.5 4.73 4.73 4.73
HC.6.5.nec Other
epidemiological
surveillance and
risk and disease
control
programmes
(n.e.c.)
4.73 4.73 4.73
HC.6.nec 0.17 0.17 0.30 0.30 0.47
HC.7 22.46 22.46 22.46
392.90 392.42 0.48 47.38 42.47 42.47 40.13 2.34 3.53 1.38 276.87 276.87 717.14
Governance, and health system and
financing administration
Health care functions Gov
ernm
ent s
chem
es a
nd
com
puls
ory
cont
ribu
tory
hea
lth
care
fina
ncin
g sc
hem
es
Inpatient curative care
Outpatient curative care
Rehabilitative care
Long-term care (health)
Ancillary services (non-
specified by function)
Medical goods (non-
specified by function)
Pharmaceuticals and other
medical non-durable goods
All HC
Financing
schemes
Therapeutic appliances and
other medical goods
Information, education and
counseling programmes
Early disease detection
programmes
Healthy condition monitoring
programmes
Epidemiological surveillance
and risk and disease control
programmes
Other preventive care (n.e.c.)

26
4.7. Health care function (HC) x Health care provider (HP)
HP.1 HP.2 HP.3 HP.4 HP.5 HP.6 HP.7 HP.9 All HP
HP.1.1 HP.1.2 HP.3.1 HP.3.2 HP.3.4 HP.3.5
HP.1.1.1 HP.1.1.2 HP.1.1.nec HP.3.1.1 HP.3.1.2 HP.3.4.6 HP.3.4.7 HP.3.4.9
HP.1.1.1.1 HP.1.1.1.nec
Barbados Dollars (BBD),
Million
Ho
sp
itals
Genera
l hospita
ls
Genera
l Public
Hospita
l
Private
Win
g (
QE
H)
Oth
er
Genera
l Public
Hospita
l
(QE
H)
Private
Hospita
l
Oth
er
Genera
l hospita
ls
Menta
l health
hospita
ls
Medic
al p
ractic
es
Offic
es o
f genera
l medic
al
pra
ctit
ioners
Offic
es o
f m
enta
l medic
al
specia
lists
Denta
l pra
ctic
e
Am
bula
tory
health
care
centr
es
Poly
clin
ics
Ladym
eade R
efe
rence U
nit
All
oth
er
am
bula
tory
centr
es
Pro
vid
ers
of hom
e h
ealth
care
serv
ices
Rest
of
the w
orl
d
HC.1 Curative care 290.46 290.46 239.39 19.11 220.28 51.06 219.99 176.12 175.48 0.64 1.15 42.73 35.31 6.47 0.96 8.26 518.71
HC.1.1 173.10 173.10 155.69 19.11 136.57 17.42 0.09 0.09 0.09 7.77 180.96
HC.1.3 117.35 117.35 83.71 83.71 33.65 219.91 176.12 175.48 0.64 1.15 42.64 35.22 6.47 0.96 0.49 337.75
HC.2 2.26 1.84 0.37 0.37 1.48 1.48 4.11
HC.2.1 2.26 2.26
HC.2.3 1.84 0.37 0.37 1.48 1.48 1.84
HC.3 54.60 19.97 19.97 19.97 34.63 19.88 0.05 0.05 74.53
HC.4 1.92 1.92
HC.5 15.42 15.42 3.76 1.51 2.25 11.64 0.02 0.23 0.23 0.23 59.87 0.14 75.66
HC.5.1 15.42 15.42 3.76 1.51 2.25 11.64 0.02 0.23 0.23 0.23 59.80 0.14 75.59
HC.5.2 0.07 0.07
HC.6 Preventive care 0.20 0.20 0.18 0.18 0.02 0.00 8.13 0.02 0.02 8.10 6.96 1.14 3.30 8.13 19.76
HC.6.1 0.07 0.07 0.07 0.07 0.00 3.88 3.88 3.45 0.43 1.00 3.47 8.43
HC.6.3 0.07 0.07 0.07 0.07 3.88 3.88 3.45 0.43 0.77 0.14 4.87
HC.6.4 0.02 0.02 0.02 0.02 0.02 0.02 1.23 1.27
HC.6.5 0.20 0.20 0.20 4.53 4.73
HC.6
.5.ne
c
Other epidemiological
surveillance and risk and
disease control
programmes (n.e.c.)
0.20 0.20 0.20 4.53 4.73
HC.6.nec 0.03 0.03 0.03 0.03 0.14 0.14 0.06 0.08 0.30 0.47
HC.7 22.46 22.46
360.68 326.06 263.30 20.62 242.68 62.73 0.02 34.63 22.14 230.24 176.51 175.87 0.64 1.15 52.54 42.50 7.61 2.43 0.05 1.92 59.87 3.30 30.59 8.40 717.14
Resid
en
tial lo
ng
-term
care
facilit
ies
Pro
vid
ers
of
am
bu
lato
ry h
ealt
h
care
Pro
vid
ers
of
healt
h c
are
syste
m
ad
min
istr
ati
on
an
d f
inan
cin
g
Pro
vid
ers
of
an
cilla
ry s
erv
ices
Reta
ilers
an
d o
ther
pro
vid
ers
of
med
ical g
oo
ds
Pro
vid
ers
of
pre
ven
tive c
are
Long-term care (health)
Outpatient rehabilitative care
Inpatient rehabilitative care
Rehabilitative care
Inpatient curative care
Outpatient curative care
Governance, and health system and
financing administration
Other preventive care (n.e.c.)
Information, education and
counseling programmes
Early disease detection
programmes
Healthy condition monitoring
programmes
Epidemiological surveillance and
risk and disease control
programmes
Health care providers
Health care functions
All HC
Therapeutic appliances and other
medical goods
Pharmaceuticals and other
medical non-durable goods
Medical goods (non-specified by function)
Ancillary services (non-specified by function)

27
4.8. Financing scheme (HF) x Financing agent (FA)
FA.1 FA.2 FA.3 FA.4 FA.5 All FA
FA.1.1 FA.1.3
FA.1.1.1 FA.1.1.2
Barbados Dollars
(BBD), Million
Gen
era
l g
overn
men
t
Centr
al g
overn
ment
Min
istr
y o
f H
ealth
Oth
er
min
istr
ies a
nd p
ublic
units
(belo
ngin
g to c
entr
al
govern
ment)
Socia
l security
agency
Insu
ran
ce c
orp
ora
tio
ns
Ho
useh
old
s
HF.1 180.22 179.74 178.67 1.07 0.48 212.68 392.90
HF.1.1 179.74 179.74 178.67 1.07 212.68 392.42
HF.1.2 0.48 0.48 0.48
HF.2 42.58 1.27 3.55 47.39
HF.2.1 42.47 42.47
HF.2.1.1 42.47 42.47
HF.2.1.1.1 Employer-based
insurance (other than
enterprises
schemes)
40.13 40.13
HF.2.1.1.3 Other primary
coverage schemes
2.34 2.34
HF.2.2 3.53 3.53
HF.2.3 0.11 1.27 1.38
HF.3 276.87 276.87
180.22 179.74 178.67 1.07 0.48 42.58 1.27 216.21 276.87 717.14
Financing agents
(used for HF.RI.1)
All HF
Primary/substitutory health
insurance schemes
NPISH financing schemes (including
development agencies)Enterprise f inancing schemes
Household out-of-pocket payment
Co
rpo
rati
on
s (
oth
er
than
insu
ran
ce c
orp
ora
tio
ns)
(part
of
HF
.RI.1.2
)
No
n-p
rofi
t in
sti
tuti
on
s s
erv
ing
ho
useh
old
s (
NP
ISH
)
Financing schemes
Government schemes and compulsory contributory health
care financing schemes
Government schemes
Compulsory contributory health
insurance schemesVoluntary health care payment schemes
Voluntary health insurance schemes

28
4.9. Health care function (HC) x Classification of diseases / conditions (DIS)
DIS.1 DIS.2 DIS.3 DIS.4 DIS.5 DIS.6 DIS.nec
DIS.1.1 DIS.1.3 DIS.1.4 DIS.1.5 DIS.1.6 DIS.1.7 DIS.1.nec DIS.4.1 DIS.4.2 DIS.4.3 DIS.4.4 DIS.4.5 DIS.4.6 DIS.4.8 DIS.4.9
DIS.4.1.nec
Barbados
Dollars (BBD),
Million
Infe
cti
ou
s a
nd
para
sit
ic d
iseases
HIV
/AID
S
Mala
ria
Respirato
ry
infe
ctions
Dia
rrheal dis
eases
Negle
cte
d tro
pic
al
dis
eases
Vaccin
e p
reventa
ble
dis
eases
Oth
er
infe
ctious a
nd
para
sitic
dis
eases
(n.e
.c.)
Rep
rod
ucti
ve
healt
h
Nu
trit
ion
al
defi
cie
ncie
s
No
nco
mm
un
icab
le
dis
eases
Neopla
sm
s
Oth
er
Neopla
sm
s
Endocrine d
isord
ers
Card
iovascula
r
dis
eases
Menta
l dis
ord
ers
Dia
bete
s M
ellitu
s
Hypert
ensio
n
Asth
ma
Oth
er
noncom
munic
able
dis
eases (
n.e
.c.)
Inju
ries
No
n-d
isease
sp
ecif
ic
Oth
er
dis
eases /
co
nd
itio
ns (
n.e
.c.)
All D
IS
HC.1 Curative care 21.44 12.12 0.00 3.26 0.69 0.32 0.02 5.02 54.69 0.29 170.06 74.66 74.66 0.30 16.71 7.12 18.04 9.70 9.65 33.88 13.52 119.76 138.95 518.71
HC.1.1 4.31 3.29 0.64 0.07 0.06 0.24 36.70 0.05 19.00 5.86 5.86 5.62 2.76 1.34 0.83 0.14 2.43 0.21 88.17 32.53 180.96
HC.1.3 17.13 8.83 0.00 2.62 0.63 0.25 0.02 4.77 18.00 0.24 151.07 68.80 68.80 0.30 11.09 4.36 16.70 8.87 9.50 31.45 13.31 31.59 106.42 337.75
HC.2 1.43 2.31 0.05 0.05 2.26 0.37 4.11
HC.3 34.68 0.05 0.05 34.63 39.85 74.53
HC.4 0.04 0.04 0.04 1.89 1.92
HC.5 2.12 0.45 1.17 0.24 0.01 0.26 0.08 0.02 30.67 15.54 15.54 0.28 1.54 0.75 5.90 3.01 3.14 0.51 1.61 4.35 36.79 75.66
HC.5.1 2.12 0.45 1.17 0.24 0.01 0.26 0.08 0.02 30.66 15.53 15.53 0.28 1.54 0.75 5.90 3.01 3.14 0.51 1.61 4.29 36.79 75.59
HC.5.2 0.01 0.01 0.01 0.06 0.07
HC.6 Preventive care 9.21 4.68 4.53 0.05 1.14 0.37 0.05 0.05 0.12 0.03 0.01 0.15 8.99 19.76
HC.6.1 3.20 3.20 0.57 0.28 0.03 0.03 0.12 0.03 0.01 0.09 4.38 8.43
HC.6.3 0.87 0.87 0.57 0.08 0.01 0.01 0.01 0.07 3.34 4.87
HC.6.4 1.27 1.27
HC.6.5 4.73 0.20 4.53 4.73
HC.6.5.nec Other
epidemiological
surveillance and
risk and disease
control
programmes
(n.e.c.)
4.73 0.20 4.53 4.73
HC.6.nec 0.42 0.42 0.05 0.47
HC.7 3.80 3.80 1.34 1.34 17.32 22.46
All HC 36.57 21.05 0.00 4.43 0.94 0.32 0.03 9.80 56.25 1.46 239.46 90.38 90.38 0.58 18.25 44.88 23.97 12.71 12.80 35.88 15.50 192.16 175.74 717.14
Classification
of diseases /
conditions
Inpatient curative care
Outpatient curative care
Rehabilitative care
Long-term care (health)
Ancillary services (non-specified by
function)
Medical goods (non-specified by
function)
Pharmaceuticals and other
medical non-durable goods
Therapeutic appliances and
other medical goods
Information, education and
counseling programmes
Early disease detection
programmes
Healthy condition monitoring
programmes
Health care functions
Epidemiological surveillance
and risk and disease control
programmes
Other preventive care (n.e.c.)
Governance, and health system and
financing administration

29
4.10. Gross fixed capital formation (HK) x Institutional unit providing revenues to financing scheme (FS RI)
Institutional units providing revenues to financing
schemes
FS.RI.1.1 FS.RI.1.4 All FS.RI
Barbados Dollars (BBD), Million
Go
vern
men
t
NP
ISH
HK.1 Gross capital formation 15.25 0.04 15.29
HK.1.1 Gross f ixed capital formation 15.16 0.04 15.20
HK.1.1.1 Infrastructure 12.13 0.01 12.14
HK.1.1.1.1 Residential and non-residential buildings 12.13 0.01 12.14
HK.1.1.2 Machinery and equipment 2.66 0.03 2.68
HK.1.1.2.1 Medical equipment 0.07 0.07
HK.1.1.2.2 Transport equipment 0.66 0.66
HK.1.1.2.4 Machinery and equipment n.e.c. 1.93 0.03 1.96
HK.1.1.3 Intellectual property products 0.38 0.00 0.38
HK.1.1.3.1 Computer softw are and databases 0.38 0.38
HK.1.1.3.2 Intellectual property products n.e.c. 0.00 0.00 0.00
HK.1.nec Other gross capital formation (n.e.c.) 0.09 0.09
HK.2 Non-produced non-financial assets 0.07 0.19 0.25
HK.2.1 Land 0.07 0.19 0.25
All HK 15.32 0.22 15.55
Gross fixed capital formation
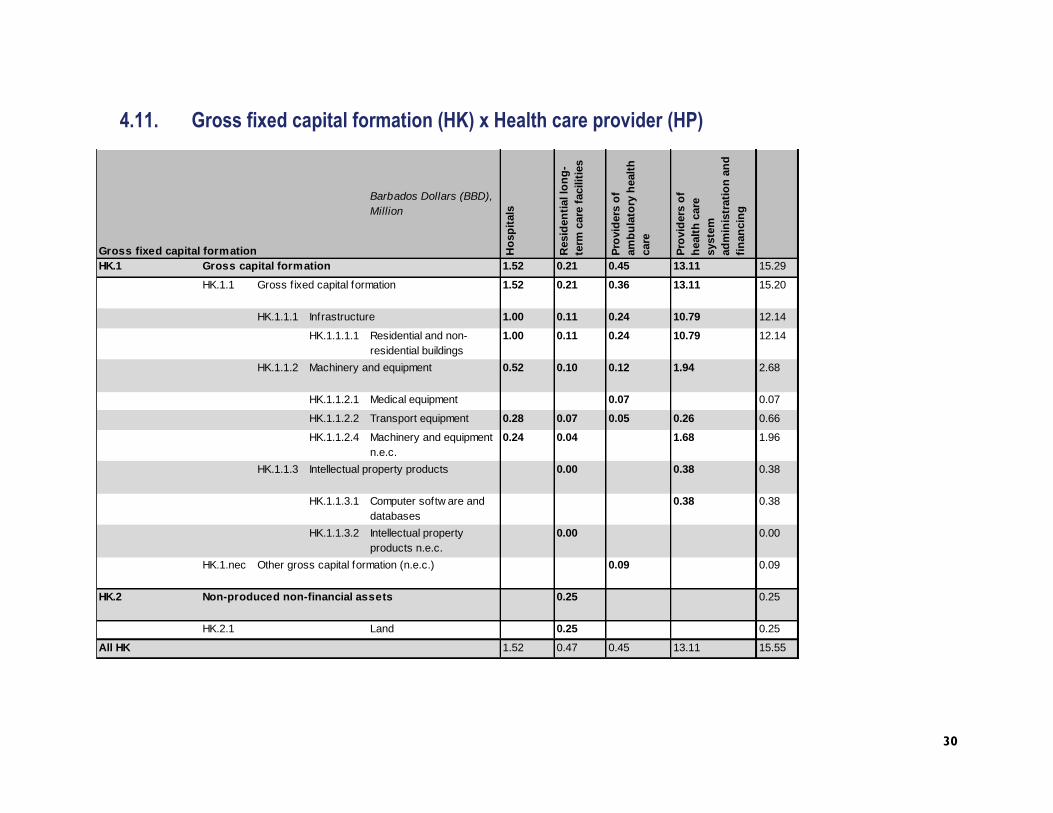
30
4.11. Gross fixed capital formation (HK) x Health care provider (HP)
Barbados Dollars (BBD),
Million
Ho
sp
itals
Resid
en
tial lo
ng
-
term
care
facilit
ies
Pro
vid
ers
of
am
bu
lato
ry h
ealt
h
care
Pro
vid
ers
of
healt
h c
are
syste
m
ad
min
istr
ati
on
an
d
fin
an
cin
g
HK.1 1.52 0.21 0.45 13.11 15.29
HK.1.1 1.52 0.21 0.36 13.11 15.20
HK.1.1.1 1.00 0.11 0.24 10.79 12.14
HK.1.1.1.1 Residential and non-
residential buildings
1.00 0.11 0.24 10.79 12.14
HK.1.1.2 0.52 0.10 0.12 1.94 2.68
HK.1.1.2.1 Medical equipment 0.07 0.07
HK.1.1.2.2 Transport equipment 0.28 0.07 0.05 0.26 0.66
HK.1.1.2.4 Machinery and equipment
n.e.c.
0.24 0.04 1.68 1.96
HK.1.1.3 0.00 0.38 0.38
HK.1.1.3.1 Computer softw are and
databases
0.38 0.38
HK.1.1.3.2 Intellectual property
products n.e.c.
0.00 0.00
HK.1.nec 0.09 0.09
HK.2 0.25 0.25
HK.2.1 Land 0.25 0.25
All HK 1.52 0.47 0.45 13.11 15.55
Intellectual property products
Other gross capital formation (n.e.c.)
Non-produced non-financial assets
Gross fixed capital formation
Gross capital formation
Gross f ixed capital formation
Machinery and equipment
Infrastructure
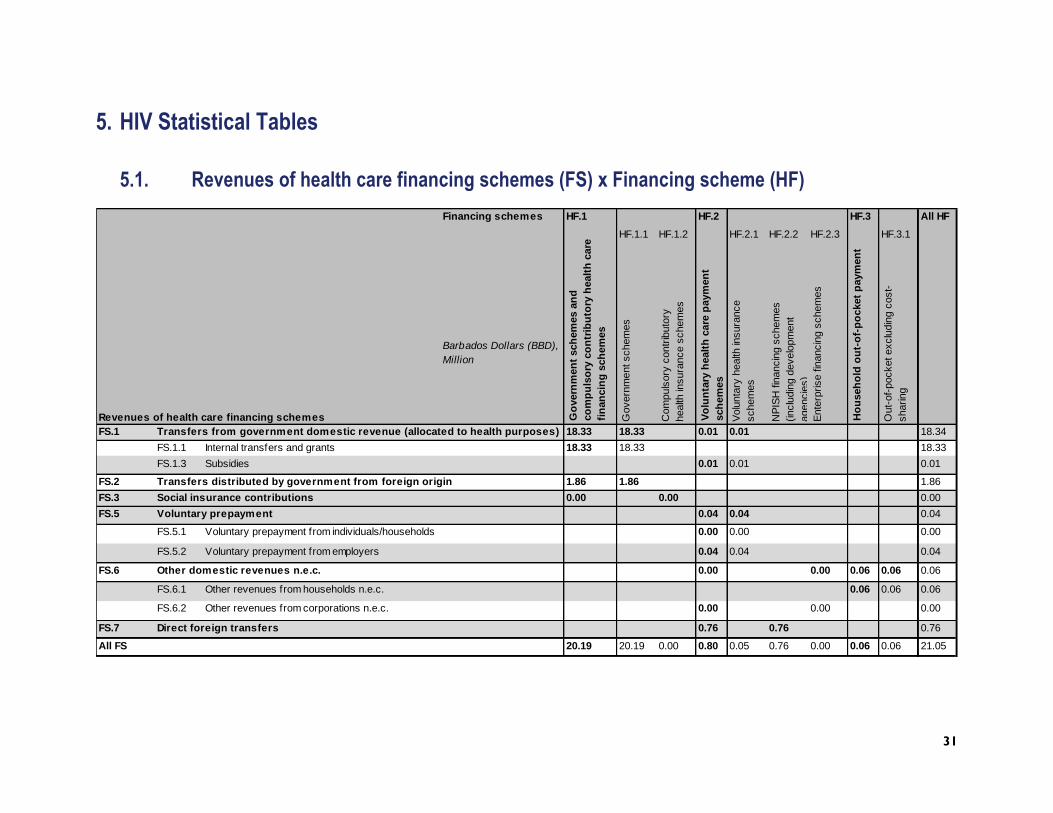
31
5. HIV Statistical Tables
5.1. Revenues of health care financing schemes (FS) x Financing scheme (HF)
HF.1 HF.2 HF.3 All HF
HF.1.1 HF.1.2 HF.2.1 HF.2.2 HF.2.3 HF.3.1
Barbados Dollars (BBD),
Million
Govern
ment schem
es
Com
puls
ory
contr
ibuto
ry
health
insura
nce s
chem
es
Volu
nta
ry h
ealth
insura
nce
schem
es
NP
ISH
fin
ancin
g s
chem
es
(inclu
din
g d
evelo
pm
ent
agencie
s)
Ente
rprise fin
ancin
g s
chem
es
Out-
of-
pocket exclu
din
g c
ost-
sharing
FS.1 18.33 18.33 0.01 0.01 18.34
FS.1.1 18.33 18.33 18.33
FS.1.3 0.01 0.01 0.01
FS.2 1.86 1.86 1.86
FS.3 0.00 0.00 0.00
FS.5 0.04 0.04 0.04
FS.5.1 0.00 0.00 0.00
FS.5.2 0.04 0.04 0.04
FS.6 0.00 0.00 0.06 0.06 0.06
FS.6.1 0.06 0.06 0.06
FS.6.2 0.00 0.00 0.00
FS.7 0.76 0.76 0.76
20.19 20.19 0.00 0.80 0.05 0.76 0.00 0.06 0.06 21.05
Ho
useh
old
ou
t-o
f-p
ocket
paym
en
t
Other revenues from households n.e.c.
Other revenues from corporations n.e.c.
Go
vern
men
t sch
em
es a
nd
co
mp
uls
ory
co
ntr
ibu
tory
healt
h c
are
fin
an
cin
g s
ch
em
es
Vo
lun
tary
healt
h c
are
paym
en
t
sch
em
es
Transfers from government domestic revenue (allocated to health purposes)
Internal transfers and grants
Subsidies
Transfers distributed by government from foreign origin
Social insurance contributions
Voluntary prepayment
Other domestic revenues n.e.c.
Financing schemes
Revenues of health care financing schemes
All FS
Direct foreign transfers
Voluntary prepayment from individuals/households
Voluntary prepayment from employers

32
5.2. Institutional Units providing revenues to financing schemes (F S RI) x Financing scheme (HF)
HF.1 HF.2 HF.3 All HF
HF.1.1 HF.1.2 HF.2.1 HF.2.2 HF.2.3 HF.3.1
Barbados Dollars (BBD),
Million
Govern
ment schem
es
Com
puls
ory
contr
ibuto
ry
health
insura
nce s
chem
es
Volu
nta
ry h
ealth
insura
nce
schem
es
NP
ISH
fin
ancin
g s
chem
es
(inclu
din
g d
evelo
pm
ent
agencie
s)
Ente
rprise fin
ancin
g s
chem
es
Out-
of-
pocket exclu
din
g c
ost-
sharing
FS.RI.1 20.19 20.19 0.00 0.80 0.05 0.76 0.00 0.06 0.06 21.05
FS.RI.1.1 Government 18.33 18.33 0.01 0.01 18.34
FS.RI.1.2 Corporations 0.00 0.00 0.04 0.04 0.00 0.04
FS.RI.1.3 Households 0.00 0.00 0.06 0.06 0.06
FS.RI.1.5 Rest of the w orld 1.86 1.86 0.76 0.76 2.62
Ho
useh
old
ou
t-o
f-p
ocket
paym
en
t
Institutional units providing revenues to f inancing schemes
Go
vern
men
t sch
em
es a
nd
co
mp
uls
ory
co
ntr
ibu
tory
healt
h c
are
fin
an
cin
g s
ch
em
es
Vo
lun
tary
healt
h c
are
paym
en
t
sch
em
es
Revenues by institutional units
Financing schemes
Revenues of health care financing schemes
Memorandum items
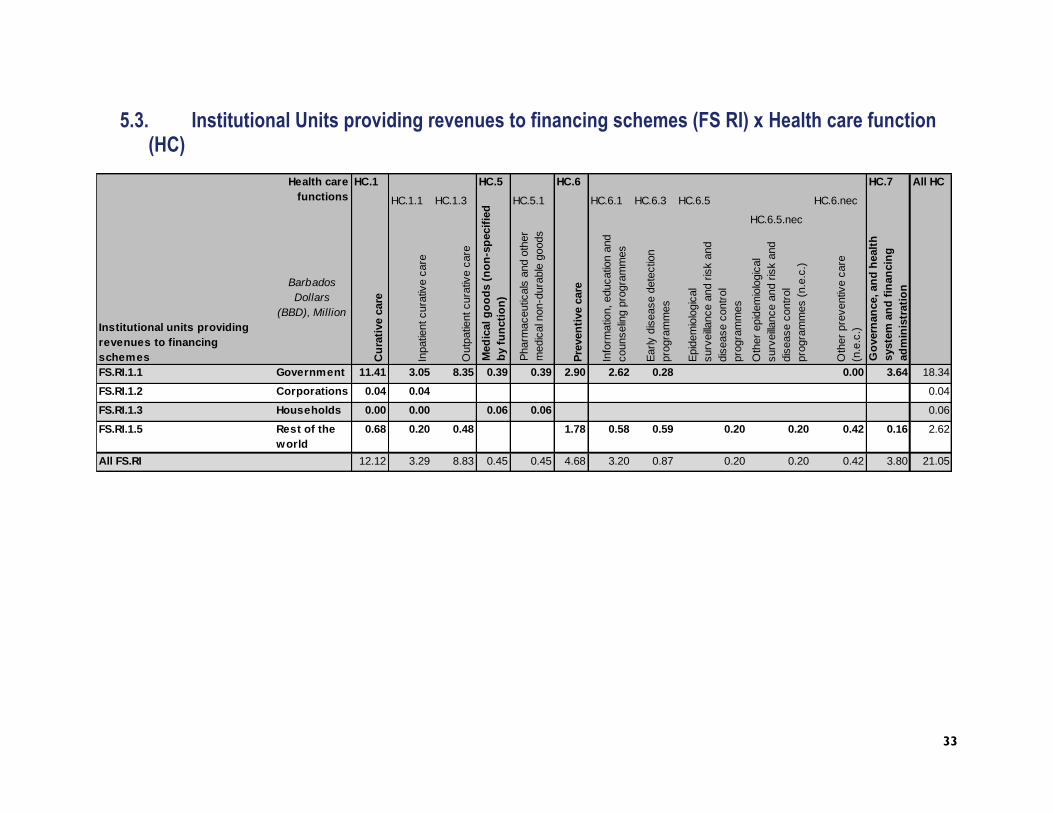
33
5.3. Institutional Units providing revenues to financing schemes (FS RI) x Health care function (HC)
HC.1 HC.5 HC.6 HC.7 All HC
HC.1.1 HC.1.3 HC.5.1 HC.6.1 HC.6.3 HC.6.5 HC.6.nec
HC.6.5.nec
Barbados
Dollars
(BBD), Million
Cu
rati
ve c
are
Inpatie
nt cura
tive c
are
Outp
atie
nt cura
tive c
are
Pre
ven
tive c
are
Info
rmatio
n, educatio
n a
nd
counselin
g p
rogra
mm
es
Early d
isease d
ete
ctio
n
pro
gra
mm
es
Epid
em
iolo
gic
al
surv
eillance a
nd r
isk a
nd
dis
ease c
ontr
ol
pro
gra
mm
es
Oth
er
epid
em
iolo
gic
al
surv
eillance a
nd r
isk a
nd
dis
ease c
ontr
ol
pro
gra
mm
es (
n.e
.c.)
Oth
er
pre
ventiv
e c
are
(n.e
.c.)
FS.RI.1.1 Government 11.41 3.05 8.35 0.39 0.39 2.90 2.62 0.28 0.00 3.64 18.34
FS.RI.1.2 Corporations 0.04 0.04 0.04
FS.RI.1.3 Households 0.00 0.00 0.06 0.06 0.06
FS.RI.1.5 Rest of the
world
0.68 0.20 0.48 1.78 0.58 0.59 0.20 0.20 0.42 0.16 2.62
All FS.RI 12.12 3.29 8.83 0.45 0.45 4.68 3.20 0.87 0.20 0.20 0.42 3.80 21.05
Health care
functions
Institutional units providing
revenues to financing
schemes Go
vern
an
ce, an
d h
ealt
h
syste
m a
nd
fin
an
cin
g
ad
min
istr
ati
on
Pharm
aceutic
als
and o
ther
medic
al n
on-d
ura
ble
goods
Med
ical g
oo
ds (
no
n-s
pecif
ied
by f
un
cti
on
)

34
5.4. Financing scheme (HF) x Health care provider (HP)
HP.1 HP.3 HP.5 HP.6 HP.7 HP.9 All HP
HP.1.1 HP.3.4
HP.1.1.1 HP.3.4.6 HP.3.4.7 HP.3.4.9
HP.1.1.1.1 HP.1.1.1.nec
Barbados Dollars
(BBD), Million
Ho
sp
itals
Genera
l hospita
ls
Genera
l Public
Hospita
l
Private
Win
g (
QE
H)
Oth
er
Genera
l Public
Hospita
l (Q
EH
)
Pro
vid
ers
of
am
bu
lato
ry h
ealt
h c
are
Am
bula
tory
health
care
centr
es
Poly
clin
ics
Ladym
eade R
efe
rence U
nit
All
oth
er
am
bula
tory
centr
es
HF.1 4.78 4.78 4.78 0.00 4.78 8.89 8.89 1.25 7.61 0.03 0.39 6.14 0.00 20.19
HF.1.1 4.78 4.78 4.78 4.78 8.89 8.89 1.25 7.61 0.03 0.39 6.14 20.19
HF.1.2 0.00 0.00 0.00 0.00 0.00 0.00
HF.2 0.05 0.05 0.05 0.05 0.76 0.00 0.80
HF.2.1 0.05 0.05 0.05 0.05 0.00 0.05
HF.2.2 0.76 0.76
HF.2.3 0.00 0.00 0.00 0.00 0.00 0.00
HF.3 0.06 0.06
All HF 4.83 4.83 4.83 0.05 4.78 8.89 8.89 1.25 7.61 0.03 0.45 0.76 6.14 0.00 21.05
Government schemes
Household out-of-pocket payment
Reta
ilers
an
d o
ther
pro
vid
ers
of
med
ical g
oo
ds
Pro
vid
ers
of
pre
ven
tive c
are
Pro
vid
ers
of
healt
h c
are
syste
m
ad
min
istr
ati
on
an
d f
inan
cin
g
Rest
of
the w
orl
d
NPISH financing schemes (including
development agencies)
Enterprise f inancing schemes
Health care
providers
Financing schemes
Government schemes and compulsory
contributory health care financing schemes
Voluntary health care payment schemes
Voluntary health insurance schemes
Compulsory contributory health insurance
schemes
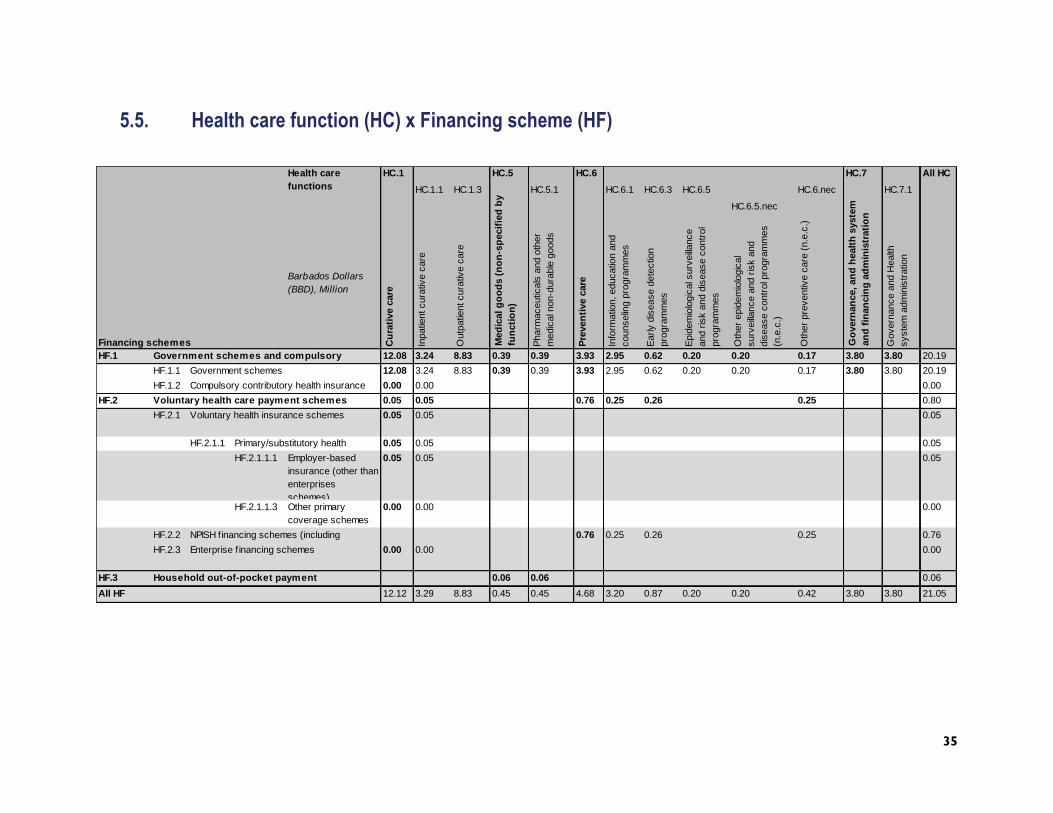
35
5.5. Health care function (HC) x Financing scheme (HF)
HC.1 HC.5 HC.6 HC.7 All HC
HC.1.1 HC.1.3 HC.5.1 HC.6.1 HC.6.3 HC.6.5 HC.6.nec HC.7.1
HC.6.5.nec
Barbados Dollars
(BBD), Million
Cu
rati
ve c
are
Inpatie
nt cura
tive c
are
Outp
atie
nt cura
tive c
are
Pharm
aceutic
als
and o
ther
medic
al n
on-d
ura
ble
goods
Pre
ven
tive c
are
Info
rmatio
n, educatio
n a
nd
counselin
g p
rogra
mm
es
Early d
isease d
ete
ctio
n
pro
gra
mm
es
Epid
em
iolo
gic
al s
urv
eillance
and r
isk a
nd d
isease c
ontr
ol
pro
gra
mm
es
Oth
er
epid
em
iolo
gic
al
surv
eillance a
nd r
isk a
nd
dis
ease c
ontr
ol p
rogra
mm
es
(n.e
.c.)
Oth
er
pre
ventiv
e c
are
(n.e
.c.)
Govern
ance a
nd H
ealth
syste
m a
dm
inis
tratio
n
HF.1 12.08 3.24 8.83 0.39 0.39 3.93 2.95 0.62 0.20 0.20 0.17 3.80 3.80 20.19
HF.1.1 12.08 3.24 8.83 0.39 0.39 3.93 2.95 0.62 0.20 0.20 0.17 3.80 3.80 20.19
HF.1.2 0.00 0.00 0.00
HF.2 0.05 0.05 0.76 0.25 0.26 0.25 0.80
HF.2.1 0.05 0.05 0.05
HF.2.1.1 0.05 0.05 0.05
HF.2.1.1.1 Employer-based
insurance (other than
enterprises
schemes)
0.05 0.05 0.05
HF.2.1.1.3 Other primary
coverage schemes
0.00 0.00 0.00
HF.2.2 0.76 0.25 0.26 0.25 0.76
HF.2.3 0.00 0.00 0.00
HF.3 0.06 0.06 0.06
All HF 12.12 3.29 8.83 0.45 0.45 4.68 3.20 0.87 0.20 0.20 0.42 3.80 3.80 21.05
Go
vern
an
ce, an
d h
ealt
h s
yste
m
an
d f
inan
cin
g a
dm
inis
trati
on
Voluntary health insurance schemes
Primary/substitutory health
insurance schemes
NPISH financing schemes (including
development agencies)Enterprise f inancing schemes
Household out-of-pocket payment
Med
ical g
oo
ds (
no
n-s
pecif
ied
by
fun
cti
on
)
Health care
functions
Financing schemes
Government schemes and compulsory
contributory health care financing schemesGovernment schemes
Compulsory contributory health insurance
schemesVoluntary health care payment schemes
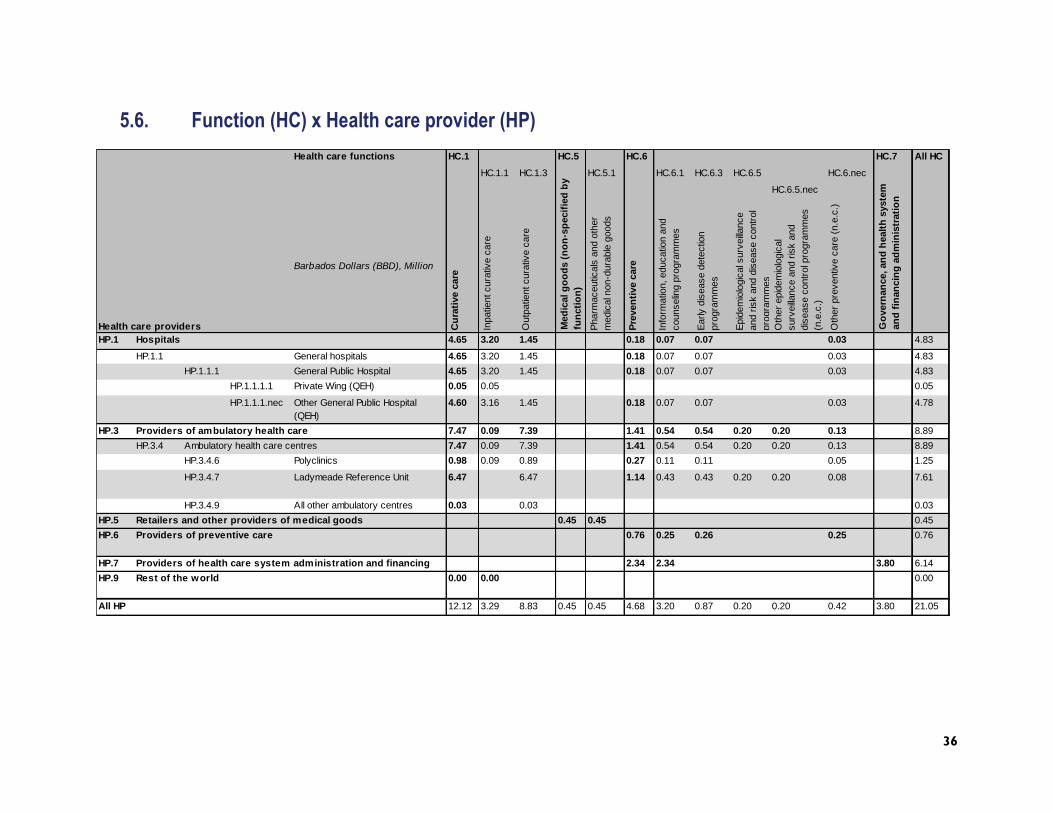
36
5.6. Function (HC) x Health care provider (HP)
HC.1 HC.5 HC.6 HC.7 All HC
HC.1.1 HC.1.3 HC.5.1 HC.6.1 HC.6.3 HC.6.5 HC.6.nec
HC.6.5.nec
Barbados Dollars (BBD), Million
Cu
rati
ve c
are
Inpatie
nt cura
tive c
are
Outp
atie
nt cura
tive c
are
Pharm
aceutic
als
and o
ther
medic
al n
on-d
ura
ble
goods
Pre
ven
tive c
are
Info
rmatio
n, educatio
n a
nd
counselin
g p
rogra
mm
es
Early d
isease d
ete
ctio
n
pro
gra
mm
es
Epid
em
iolo
gic
al s
urv
eillance
and r
isk a
nd d
isease c
ontr
ol
pro
gra
mm
es
Oth
er
epid
em
iolo
gic
al
surv
eillance a
nd r
isk a
nd
dis
ease c
ontr
ol p
rogra
mm
es
(n.e
.c.)
Oth
er
pre
ventiv
e c
are
(n.e
.c.)
HP.1 4.65 3.20 1.45 0.18 0.07 0.07 0.03 4.83
HP.1.1 General hospitals 4.65 3.20 1.45 0.18 0.07 0.07 0.03 4.83
HP.1.1.1 General Public Hospital 4.65 3.20 1.45 0.18 0.07 0.07 0.03 4.83
HP.1.1.1.1 Private Wing (QEH) 0.05 0.05 0.05
HP.1.1.1.nec Other General Public Hospital
(QEH)
4.60 3.16 1.45 0.18 0.07 0.07 0.03 4.78
HP.3 7.47 0.09 7.39 1.41 0.54 0.54 0.20 0.20 0.13 8.89
HP.3.4 7.47 0.09 7.39 1.41 0.54 0.54 0.20 0.20 0.13 8.89
HP.3.4.6 Polyclinics 0.98 0.09 0.89 0.27 0.11 0.11 0.05 1.25
HP.3.4.7 Ladymeade Reference Unit 6.47 6.47 1.14 0.43 0.43 0.20 0.20 0.08 7.61
HP.3.4.9 All other ambulatory centres 0.03 0.03 0.03
HP.5 0.45 0.45 0.45
HP.6 0.76 0.25 0.26 0.25 0.76
HP.7 2.34 2.34 3.80 6.14
HP.9 0.00 0.00 0.00
All HP 12.12 3.29 8.83 0.45 0.45 4.68 3.20 0.87 0.20 0.20 0.42 3.80 21.05
Ambulatory health care centres
Retailers and other providers of medical goods
Providers of preventive care
Providers of health care system administration and financing
Rest of the world
Health care functions
Health care providers Go
vern
an
ce, an
d h
ealt
h s
yste
m
an
d f
inan
cin
g a
dm
inis
trati
on
Med
ical g
oo
ds (
no
n-s
pecif
ied
by
fun
cti
on
)
Providers of ambulatory health care
Hospitals

37
Annex A: Recommended Workshop Participants These representatives were invited to the launch and dissemination of the HA estimation. At the launch,
these representatives participated in discussion about the key questions of the analysis as well as the
scope and process. At the dissemination event, these representatives responded to the findings and
discussed their policy implications. These stakeholders are recommended as minimum participants for
the launch and dissemination of HA results.
Ministry of Health: Permanent Secretary; Chief Medical Officer; Health Planning Unit;
HIV/AIDS Program and other relevant staff as appropriate
Barbados Statistical Services
Ministry of Finance representatives
Representatives from other ministries active in the HIV response and health programs
Representatives of HIV/AIDS Commission
Barbados National Insurance Scheme
Representatives of Queen Elizabeth Hospital
Representatives of Ladymeade Reference Unit (particularly staff involved in any PLHIV
surveys)
Representatives from other key facilities
Barbados Association of Medical Practitioners, or other private provider representatives
PAHO Country Program Specialist
PEPFAR, UNAIDS, USAID, and other donor representatives
Representative from the Financial Services Commission
Representatives from the Insurance Association of the Caribbean and from private
insurance companies on island
Large non-governmental organizations active in health e.g. Diabetes Foundation, Cancer
Society, Planned Parenthood, Red Cross
Barbados Chamber of Commerce
Representatives of several large employers that provide health care benefits to employees


![IB - Barbados International Finance & Business Magazine 2010 [Barbados]](https://static.fdocuments.in/doc/165x107/5553d3efb4c905c4048b4c4b/ib-barbados-international-finance-business-magazine-2010-barbados.jpg)