BANK SAINT PETERSBURG 1Q 2010 IFRS Results · Bank Saint Petersburg at a glance 2 Regional...
15
BANK SAINT PETERSBURG 1Q 2010 IFRS Results June 10, 2010
Transcript of BANK SAINT PETERSBURG 1Q 2010 IFRS Results · Bank Saint Petersburg at a glance 2 Regional...

BANK SAINT PETERSBURG1Q 2010 IFRS Results
June 10, 2010

Образец заголовка
• Образец текста• Второй уровень• Третий уровень• Четвертый уровень• Пятый уровень
2
Summary –Bank Saint Petersburg at a glance
22
Regional leaderRegional leader
Focused on North-West
Focused on North-West
Selected financial and operational
results
Selected financial and operational
results
� A leading private universal bank in St. Petersburg and the Leningrad region� St. Petersburg market share as at April 1, 2010*:
• Assets: 13.0%• Loans: 16.3% - corporate, 6.0% - retail• Deposits: 11.5% - corporate, 9.7% - retail
As at April 1, 2010� Client base: over 950,000 retail and 34,600 corporate customers� 36 branches and outlets (primarily in St. Petersburg), 441 ATMs
As at April 1, 2010:
�17th largest bank by assets and 13th by retail deposits among the Russian banks**� Ratings: Moody’s Ba3 (Negative outlook)� Total assets: RUB 232.1 bn (USD 7.9 bn)� Total capital: RUB 33.1 bn (USD 1.1 bn)� Net income: RUB 349.8 mln (USD 11.9 mln)� Gross loans: RUB 178.1 bn (USD 6.0 bn)� Customer accounts: RUB 172.9 bn (USD 5.9 bn)� Cost/Income ratio: 19.9%� Total capital adequacy: 14.4%� 2,284 employees
* Association of North-West banks, Bank Saint Petersburg own estimates** Interfax

Образец заголовка
• Образец текста• Второй уровень• Третий уровень• Четвертый уровень• Пятый уровень
3
RUB 349.8 mln (USD 11.9 mln)+ 45.5% compared with 1Q 2009- 4.6% compared with 4Q 2009
April 1, 2010 – January 1, 2010 April 1, 2010 – April 1, 2009
Net IncomeNet Income
AssetsAssets
Total capitalTotal capital
Loan portfolioLoan portfolio
Customer accounts*Customer accounts*
Cost/Income Ratio – 19.9%
Capital Adequacy – 14.4%Key ratiosKey ratios
RUB 178.1 bn (USD 6.0 bn)+ 2.3% compared with Jan 1, 2009 + 18.7% compared with Apr 1, 2009
RUB 172.9 bn (USD 5.9 bn)- 4.5% compared with Jan 1, 2009 + 21.3% compared with Apr 1, 2009
* Customer accounts are calculated as a sum of customer deposits and promissory notes and bills of exchange (other debt securities in issue)
RUB 232.1 bn (USD 7.9 bn)- 1.5% compared with Jan 1, 2009 + 5.9% compared with Apr 1, 2009
RUB 31.1 bn (USD 1.1 bn)- 0.2% compared with Jan 1, 2009 + 33.5% compared with Apr 1, 2009
Key indicators
33

Образец заголовка
• Образец текста• Второй уровень• Третий уровень• Четвертый уровень• Пятый уровень
4
Table of contents
44
I. Bank’s market position
II. Financial highlights and business overview
III. Recent developments

Образец заголовка
• Образец текста• Второй уровень• Третий уровень• Четвертый уровень• Пятый уровень
5
Strong Franchise
Client baseClient base Market share in St. Petersburg: Retail banking*Market share in St. Petersburg: Retail banking*
Market share in St. Petersburg: Corporate banking*Market share in St. Petersburg: Corporate banking*
* Central Bank of Russia, Association of North-West banks, Bank Saint Petersburg own estimates55
9,7%
12,9%
15,7% 16,3%
13,9%
11,5%11,5%11,9%11,8%
8,9%
YE 2006 YE 2007 YE 2008 YE 2009 April 1, 2010
Corporate loans Corporate deposits
3,5%
6,3%7,1%
6,1% 6,0%6,0%
7,8%
9,5% 9,7% 9,7%
YE 2006 YE 2007 YE 2008 YE 2009 April 1, 2010
Retail loans Retail deposits
451581
774900
26
31
35
35
953
34,5
2006 2007 2008 2009 April 1, 2010
Retail Corporate
Loans: (market share as at April 1, 2010)*Loans: (market share as at April 1, 2010)*
Sberbank21,1%
VTB Group14,3%
Others38,2%
KIT Finance6,0%
Bank Saint Petersburg
13,7%Bank "Russia"
6,7%

Образец заголовка
• Образец текста• Второй уровень• Третий уровень• Четвертый уровень• Пятый уровень
6
Table of contents
66
I. Bank’s market position
II. Financial highlights and business overview
III. Recent developments

Образец заголовка
• Образец текста• Второй уровень• Третий уровень• Четвертый уровень• Пятый уровень
7
Financial Highlights, QoQ, 2009 – 1Q 2010
Assets, RUB, bnAssets, RUB, bn
Income dynamics, RUB mlnIncome dynamics, RUB mln Income and expenses data, RUB mlnIncome and expenses data, RUB mln
Capital, RUB bnCapital, RUB bn
77
219,2
214,0217,5
235,6232,1
1Q 2009 2Q 2009 3Q 2009 4Q 2009 1Q 2010
4 360
2 997
3 657
4 594 4 405
823 847 9091194
859
3 086
2 384 2 3052 737 2 780
1Q 2009 2Q 2009 3Q 2009 4Q 2009 1Q 2010
Income before tax, provisions and operating expenses Operating expenses Provisions
3 085
326 373 359 430 337
1 275
189
641 705887
2 305 2 285
2 7743 057
1Q 2009 2Q 2009 3Q 2009 4Q 2009 1Q 2010
Net Interest Income Net Fee and Commision Income Net Trading Income
24,826,4 27,4
33,2 33,1
1Q 2009 2Q 2009 3Q 2009 4Q 2009 1Q 2010
Образец заголовка
• Образец текста• Второй уровень• Третий уровень• Четвертый уровень• Пятый уровень
8
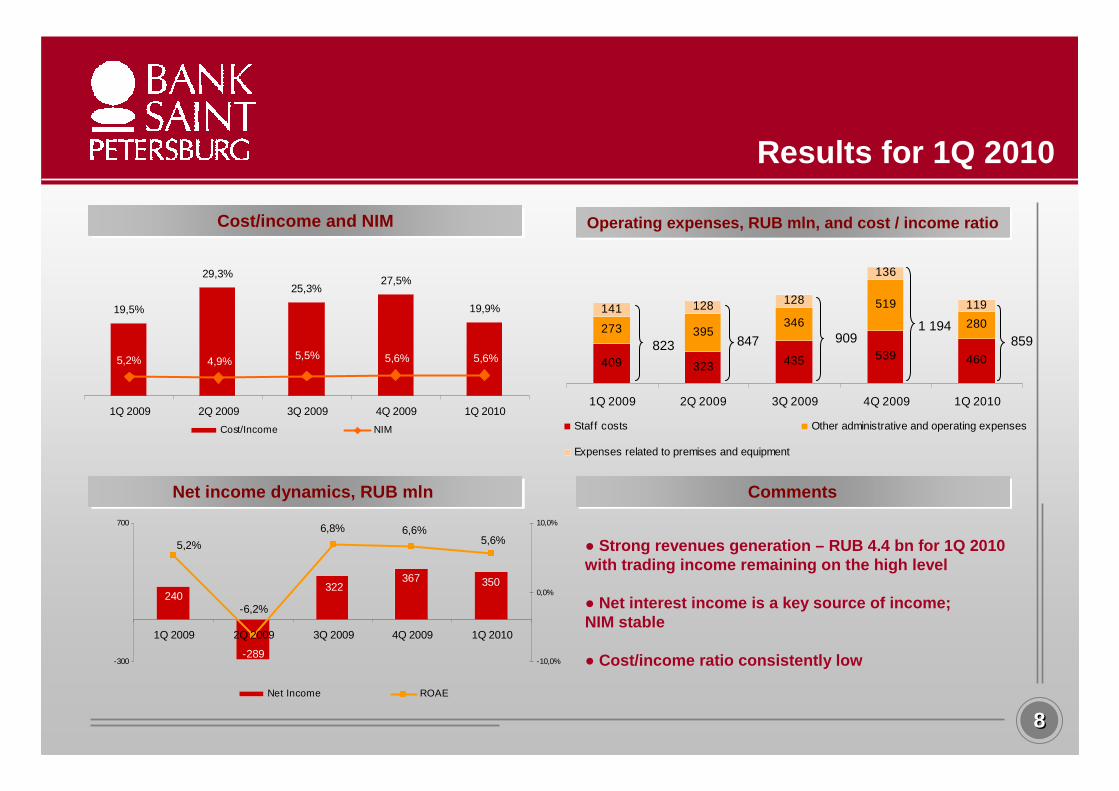
Results for 1Q 2010
Cost/income and NIMCost/income and NIM Operating expenses, RUB mln, and cost / income rati oOperating expenses, RUB mln, and cost / income rati o
CommentsCommentsNet income dynamics, RUB mlnNet income dynamics, RUB mln
88
● Strong revenues generation – RUB 4.4 bn for 1Q 2010 with trading income remaining on the high level
● Net interest income is a key source of income; NIM stable
● Cost/income ratio consistently low
823 847 9091 194
859
409 323 435 539 460
273 395346
519
280141 128 119
136
128
1Q 2009 2Q 2009 3Q 2009 4Q 2009 1Q 2010
Staff costs Other administrative and operating expenses
Expenses related to premises and equipment
322 350367
240
-289
5,6%6,6%6,8%
-6,2%
5,2%
-300
700
1Q 2009 2Q 2009 3Q 2009 4Q 2009 1Q 2010
-10,0%
0,0%
10,0%
Net Income ROAE
19,5%
29,3%25,3%
27,5%
19,9%
5,6%5,6%5,5%4,9%5,2%
1Q 2009 2Q 2009 3Q 2009 4Q 2009 1Q 2010
Cost/Income NIM

Образец заголовка
• Образец текста• Второй уровень• Третий уровень• Четвертый уровень• Пятый уровень
9
Financial Summary (RUB), q-o-q, 2009 – 1Q 2010
5.57%
0.61%
92.29%
10.37%
19.86%
14.35%
5.57%
0.35
33.15
25.63
206.44
172.95
232.08
159.61
1Q 2010RUB bn 1Q 2009 2Q 2009 3Q 2009 4Q 2009
Loans and Advances to Customers 141.04 143.90 145.77 158.20
Total Assets 219.19 214.00 217.47 235.61
Customer Accounts* 142.47 145.22 146.23 181.14
Total Liabilities 200.12 195.43 198.53 210.32
Total Shareholders’ Equity 19.07 18.61 18.93 25.28
Total Capital 24.78 26.39 27.35 33.22
Net profit 0.24 -0.29 0.32 0.37
Net Interest margin 5.23% 4.90% 5.45% 5.61%
Capital Adequacy 14.11% 13.83% 14.08% 15.19%
Cost-to-Income ratio 19.49% 29.31% 25.33% 27.49%
Provisions / Gross loans 5.96% 7.29% 8.54% 9.14%
Loans / Deposits 98.99% 99.16% 99.69% 87.36%
ROAA 0.45% -0.54% 0.59% 0.64%
ROAE 5.15% -6.16% 6.81% 6.58%
99* Customer accounts are calculated as a sum of customer deposits and promissory notes and bills of exchange (other debt securities in issue)

Образец заголовка
• Образец текста• Второй уровень• Третий уровень• Четвертый уровень• Пятый уровень
10
Loan portfolio and quality
Loan portfolio and provisionsLoan portfolio and provisions Loan portfolio by sector, April 1, 2010Loan portfolio by sector, April 1, 2010
CommentsCommentsProblem loans, %Problem loans, %
1010
� Loan portfolio growth in 1Q 2010:Before provisions: +2.3% compared with January 1, 2010After provisions: +0.9% compared with January 1, 2010
� As at April 1, 2010:- Corporate overdue loans – 8.39% (7.11% as at January 1, 2010)- Retail overdue loans – 10.60% (10.07% as at January 1, 2010)
� 0.13% (RUB 230 mln) of the loan portfolio written off in 1Q 2010
* Ratios for all dates except Jan 1, and Apr 1, 201 0 are ratios for restructured loans
Other5,2%
Energy0,7%
Telecom0,9%Sports and health
2,7%
Transport3,2%
Government financed
3,3%
Chemical industry3,9%
Oil and gas4,4%
Food industry6,2%
Financial services7,4%
Individuals8,0%
Real estate9,6%
Trade13,0%
Construction13,4%
Heavy machinery and ship-building
18,1%
178,1174,1159,4155,2150,0 10,4
9,18,5
7,3
6,0
0,00
30,00
60,00
90,00
120,00
150,00
180,00
1Q 2009 2Q 2009 3Q 2009 4Q 2009 1Q 2010
RU
B b
ln
0,0
2,0
4,0
6,0
8,0
10,0
(%)
Loan portfolio Provisions / Gross loans
8,6
7,4
6,9
7,5
4,5
6,3
7,1
7,9
6,6
6,7
0
2
4
6
8
10
1Q 2009 2Q 2009 3Q 2009 4Q 2010 1Q 2010
Overdue loans / Gross loans Impaired not past due* / Gross loans

Образец заголовка
• Образец текста• Второй уровень• Третий уровень• Четвертый уровень• Пятый уровень
11
Assets and liabilities structure
Assets structure, April 1, 2010Assets structure, April 1, 2010 Liabilities structure, April 1, 2010Liabilities structure, April 1, 2010
1111
Comments Comments
Due to other banks; 8%
Capital markets; 6%
Shareholders' equity; 11%
Customer accounts
(individuals); 27%
Customer accounts
(corporates); 48%
Loans and advances to
customers; 69%
Securities portfolio; 14%
Fixed and other assets; 7%
Cash & cash equivalents; 6%
Amounts receivable under reverse
repurchase agreements; 3%
� Balance sheet structure back to pre-crisis form
� Loans to deposit ratio - 92%
� CBR funding fully repaid as at April 1, 2010
(RUB 8.7 bn as at January 1, 2010)

Образец заголовка
• Образец текста• Второй уровень• Третий уровень• Четвертый уровень• Пятый уровень
12
Capital and funding
Capital adequacy, %Capital adequacy, % Repayment schedule for 2010-2013, USD mlnRepayment schedule for 2010-2013, USD mln
CommentsComments
1212
� April, 2010 – RUB 5 bn bonds issue (coupon rate – 8.1% annually)
12,8%
16,4%14,1%
15,2% 14,4%
10,2%10,7%9,7%
12,3%
7,9%
YE 2006 YE 2007 YE 2008 YE 2009 April 1, 2010
Total Capital ratio Tier 1 Capital ratio
8,638,5
199,1
68,4
2010 2011 2012 2013

Образец заголовка
• Образец текста• Второй уровень• Третий уровень• Четвертый уровень• Пятый уровень
13
Table of contents
1313
I. Bank’s market position
II. Financial highlights and business overview
III. Recent developments

Образец заголовка
• Образец текста• Второй уровень• Третий уровень• Четвертый уровень• Пятый уровень
14
Recent developments
1414
� April 29, 2010 – Annual Shareholders Meeting
- Changes in the Supervisory Board composition:- Andrey Bychkov, representative of Vnesheconombank, joined the Board- Sergey Eganov left the Board
- Dividends for 2009:- dividends on the ordinary and preferred stock – in line with the previous periods (RUB 33.2 mln);- dividends on the type A preferred stock - according to the Bank’s Charter (RUB 829 mln)
� April, 2010 – RUB 5 bn bonds issue (coupon rate – 8.1% annually)
� Partnership with IFC through its Global Trade Finance Pr ogram(agreement on the USD 40 mln guarantee facility)

Образец заголовка
• Образец текста• Второй уровень• Третий уровень• Четвертый уровень• Пятый уровень
15
Presentation team
Konstantin BalandinDeputy Chairman of the Management Board
Konstantin NoskovDirector, International Finance and Financial Institutions
1515
All information for the investors is available on the Bank’s web site: http://en.bspb.ru/194/Contact information:E-mail: [email protected]: +7 (812) 332 78 36
Tatiana OreshkinaHead of IR