BANK OF GREECEthe good, the bad and the ugly 19 Karl Whelan Discussion: Thomas Moutos BANK OF GREECE...
53
BANK OF GREECE EUROSYSTEM Special Conference Paper Special Conference Paper JULY 2013 The crisis in the euro area, May 23-24, 2013 Ireland’s economic crisis: the good, the bad and the ugly 19 Karl Whelan Discussion: Thomas Moutos
Transcript of BANK OF GREECEthe good, the bad and the ugly 19 Karl Whelan Discussion: Thomas Moutos BANK OF GREECE...

BANK OF GREECE
EUROSYSTEM
Economic Research Department
BANK OF GREECE
EUROSYSTEM
GR - 102 50, Athens
Special Studies Division21, E. Venizelos Avenue
Tel.:+30 210 320 3610Fax:+30 210 320 2432www.bankofgreece.gr
Special Conference Paper
ISSN: 1792-6564
Special Conference Paper
JULY 2013
The crisis in the euro area, May 23-24, 2013
Ireland’s economic crisis: the good, the bad and the ugly
19
Karl Whelan
Discussion:Thomas Moutos
BANK OF GREECE Economic Research Department – Special Studies Division 21, Ε. Venizelos Avenue GR-102 50 Athens Τel:+30210-320 3610 Fax:+30210-320 2432 www.bankofgreece.gr Printed in Athens, Greece at the Bank of Greece Printing Works. All rights reserved. Reproduction for educational and non-commercial purposes is permitted provided that the source is acknowledged. ISSN 1792-6564

Editorial
On 23-24 May 2013, the Bank of Greece organised a conference on “The Crisis in
the Euro Area”, in Athens.
The papers and commentaries presented at the conference addressed many
important issues related to the functioning of the euro area. Our hope is that these
contributions will help improve understanding of the nature of Europe’s monetary union,
the underpinnings of its crisis, and the changes that are needed so that crises will be
prevented in the future.
The papers examined two main sets of issues. One group of papers, adopting a
union-wide perspective, assessed the aspects of the euro area’s institutional architecture
that, with the benefit of hindsight, may have contributed to the crisis, and the policy
responses to the crisis at the union level. A second group of papers focused on
developments in three crisis countries -- Greece, Ireland, and Portugal.
The papers presented at the conference, with their discussions, will be published in
the Journal of Macroeconomics.
Here we present the paper by Karl Whelan (University College Dublin) with its
discussion by Thomas Moutos (Athens University of Economics and Business and
CESifo).
IRELAND’S ECONOMIC CRISIS
THE GOOD, THE BAD AND THE UGLY
Karl Whelan University College Dublin
Abstract
This paper provides an overview of Ireland’s macroeconomic performance over the past decade. In addition, to presenting the underlying facts about the boom, bust and (currently limited) recovery, the paper also discusses some common fallacies and misrepresentations of economic events in Ireland. The paper concludes with some broader lessons from the Irish experience for Eurozone economic policy and some observations on the role that EMU and the ECB have played in Ireland’s crisis.
Keywords: Ireland, Euro Area, Euro Crisis, Banking
JEL Classifications: E52,E62, G01
Correspondence: Karl Whelan University College Dublin UCD School of Economics Newman Building, Belfield, Dublin 4, Ireland Tel.: + 353 1 716 8239 Email: [email protected]
3
1. Introduction
The turnaround in Ireland’s economic fortunes in recent years is perhaps the most
dramatic of any country in the euro area. As recently as 2007, Ireland was seen by many
as top of the European class in its economic achievements. A long period of high rates of
economic growth and low unemployment had been combined with budget surpluses. The
country appeared well placed to cope with any economic slowdown as it had a gross
debt-GDP ratio in 2007 of 25% and a sovereign wealth fund worth about €5,000 a head.
However, the subsequent crash – involving a housing market collapse, soaring
unemployment and a full-scale banking crisis – proved too difficult for the Irish
government to manage on its own. In 2010, Ireland agreed to an adjustment program
with the EU and IMF. Today, Ireland is poised to exit this program and, while economic
conditions remain poor and unemployment elevated, the country is again being cited
regularly as an example for other countries in severe economic difficulties.
Taken together, then, Ireland’s recent macroeconomic history provides interesting
examples of both success (the good …) and failure (the bad and ugly …) within the
Eurozone. Not surprisingly, events in Ireland have commonly been used by in
international debates among economists, politicians and international organizations to
illustrate various preferred policy positions. However, often these arguments are based on
a weak understanding of the underlying macroeconomic facts about Ireland’s economy.
This paper provides an overview of Ireland’s macroeconomic performance over the
past decade. In addition, to presenting the underlying facts about the boom, bust and
(currently limited) recovery, the paper also discusses some common fallacies and
misrepresentations of economic events in Ireland. The paper is organized as follows.
Section 2 focuses on the so-called Celtic Tiger boom, which occurred from the
early 1990s through to 2007. It emphasizes that this period saw both good and bad
developments. The important role played by cheap credit and lax banking regulation is
highlighted as is the skewed construction-focused nature of the economy on the eve of
the crash. However, it also stresses that much of the pre-crash growth in Ireland was
4
based on sound economic fundamentals with steady improvements in productivity and
employment accounting for most of the increase in output over this period.
Sections 3 and 4 discuss Ireland’s crash, examining the popping of the housing
bubble, its fiscal implications and the banking crisis. In contrast to some discussions of
this crisis, I emphasize that Ireland’s huge build-up of debt was not predominantly due to
its banking crisis. However, banking-related costs played a key role in making the debt
burden appear unsustainable to financial markets and thus triggering an EU-IMF bailout.
Section 5 of the paper discusses Ireland’s performance during the EU-IMF program
and the economy’s future prospects. It emphasizes that while Ireland’s relatively flexible
labor market has helped it to perform better than some other Eurozone countries
undergoing austerity, the austerity program has seen very few substantive structural
reforms. Future economic prospects are dampened by a serious debt hangover problem
and the weak outlook for growth in Europe.
Finally, Section 6 discusses some broader lessons from the Irish experience for
Eurozone economic policy and some observations on the role that EMU and the ECB
have played in Ireland’s crisis.
2. Ireland’s economic boom
This section discusses Ireland’s long economic boom that ended in 2007. The first
part focuses on the positive fundamental aspects of the economic growth of this period
while the second part describes the impact of the housing boom that dominated the later
part of this expansion.
2.1. The Celtic Tiger
It is now well known that Ireland’s famed “Celtic Tiger” era ended with the
collapse of a housing bubble and a banking crisis. Many have thus been tempted to
interpret the preceding boom as largely built on an unstable credit splurge. However, this
would underestimate the true progress made by the Irish economy during the two decades
prior to 2007.
5
Before the “Celtic Tiger” became a well-known phrase during the 1990s, the Irish
government had implemented a wide range of policies that helped to foster improvements
in productivity. The 1960s saw a move away from protectionist trade policies and set
Ireland on the path to EU membership in 1973. Industrial policies focused successfully
on encouraging export-oriented foreign direct investment. There was also a gradual
improvement in educational standards as policies to provide universal secondary
education in the 1960s were subsequently followed by a large expansion of the third-level
sector. As a result of these policies, Irish productivity growth consistently outpaced other
advanced economies from the early 1970s onwards. By the mid-2000s, Irish labor
productivity was very close to US levels (see Figure 1).1
While Ireland’s pre-Tiger supply-side policies may have been good ones, its
macroeconomic stabilization policies were not always so good. Ireland reacted to the
global slowdown of the 1970s by running very large fiscal deficits, which cumulated in a
debt crisis in the 1980s. At the same time, the traditional currency link with sterling was
dropped in 1979 in favor of membership of the European Monetary System, which
provided an unstable monetary regime featuring regular devaluations.
By the mid-1980s, Ireland had a public debt-GDP ratio over 110 percent and was
paying out almost 10 percent of GDP per year in interest payments on this debt. Tax rates
had been raised to punitive levels in a series of failed attempts to stabilize the deficit and
growth had stagnated.
It was at the depths of this previous crisis that the birth of the Celtic Tiger took
place. The period from 1987 onwards saw fiscal problems dealt with via a program that
focused on restraining spending and by 1989, Ireland’s debt dynamics had clearly moved
in direction of sustainability. At the same time, the EMS finally also delivered a period of
monetary stability. With macroeconomic stability restored and good fundamental policies
in place, the Irish economy began to grow at an impressive rate.
1 These data come from the US Bureau of Labor Statistics International Comparisons website. www.bls.gov/fls/intl_gdp_capita_gdp_hour.htm. One caveat worth noting is that Ireland’s low corporate tax regime has encouraged businesses to declare high profits in Ireland, perhaps via mis-pricing of inputs via transfer pricing. This pattern likely over-states the full extent of Irish GDP and thus of underlying productivity. However, even adjusting for this factor, productivity growth has been strong and room for catch-up is far lower than previously.
6
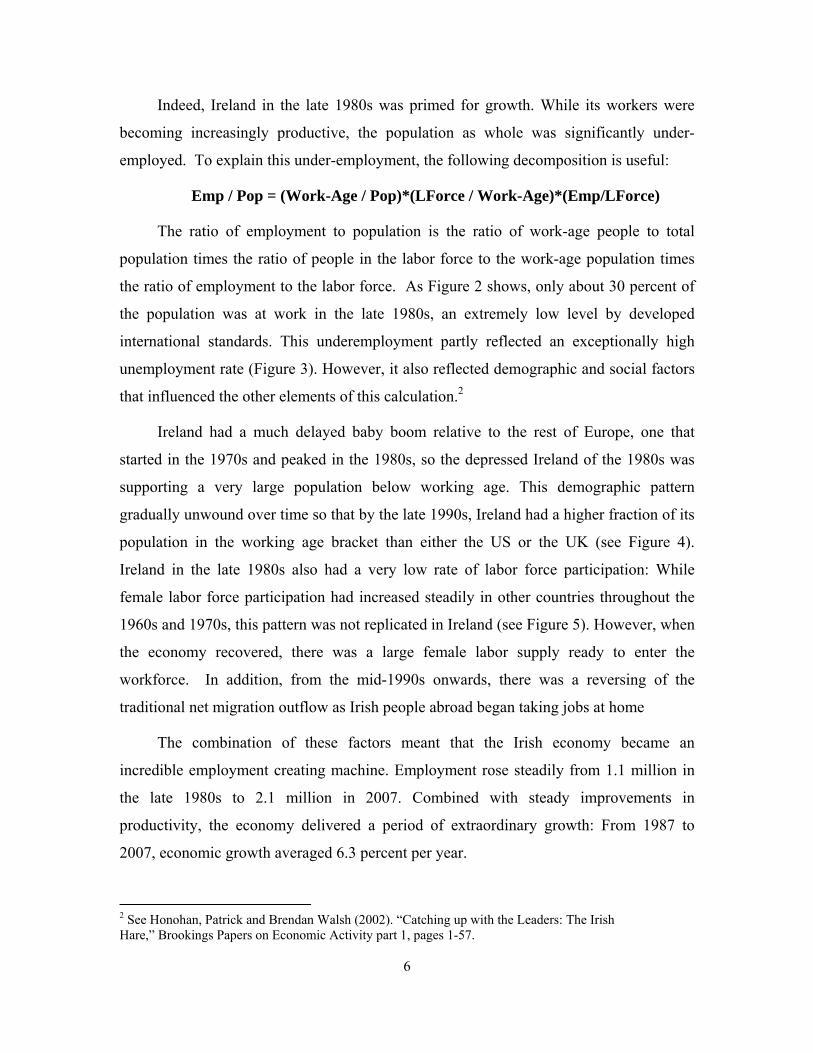
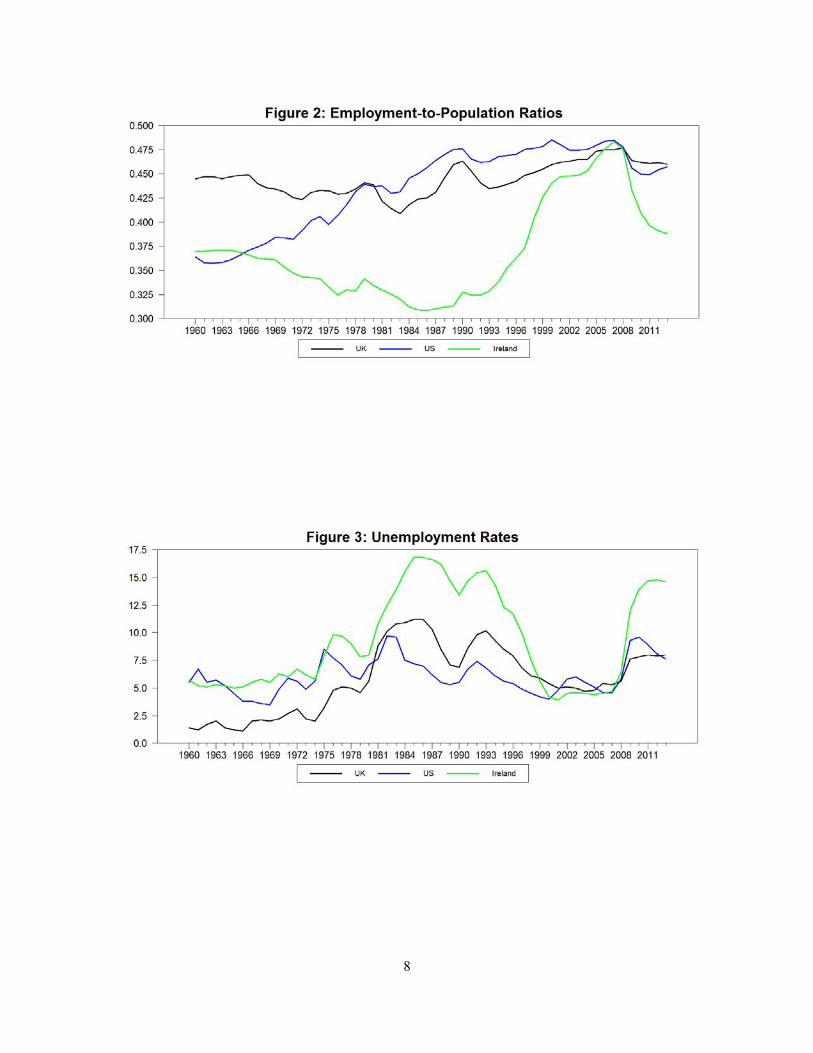
Indeed, Ireland in the late 1980s was primed for growth. While its workers were
becoming increasingly productive, the population as whole was significantly under-
employed. To explain this under-employment, the following decomposition is useful:
Emp / Pop = (Work-Age / Pop)*(LForce / Work-Age)*(Emp/LForce)
The ratio of employment to population is the ratio of work-age people to total
population times the ratio of people in the labor force to the work-age population times
the ratio of employment to the labor force. As Figure 2 shows, only about 30 percent of
the population was at work in the late 1980s, an extremely low level by developed
international standards. This underemployment partly reflected an exceptionally high
unemployment rate (Figure 3). However, it also reflected demographic and social factors
that influenced the other elements of this calculation.2
Ireland had a much delayed baby boom relative to the rest of Europe, one that
started in the 1970s and peaked in the 1980s, so the depressed Ireland of the 1980s was
supporting a very large population below working age. This demographic pattern
gradually unwound over time so that by the late 1990s, Ireland had a higher fraction of its
population in the working age bracket than either the US or the UK (see Figure 4).
Ireland in the late 1980s also had a very low rate of labor force participation: While
female labor force participation had increased steadily in other countries throughout the
1960s and 1970s, this pattern was not replicated in Ireland (see Figure 5). However, when
the economy recovered, there was a large female labor supply ready to enter the
workforce. In addition, from the mid-1990s onwards, there was a reversing of the
traditional net migration outflow as Irish people abroad began taking jobs at home
The combination of these factors meant that the Irish economy became an
incredible employment creating machine. Employment rose steadily from 1.1 million in
the late 1980s to 2.1 million in 2007. Combined with steady improvements in
productivity, the economy delivered a period of extraordinary growth: From 1987 to
2007, economic growth averaged 6.3 percent per year.
2 See Honohan, Patrick and Brendan Walsh (2002). “Catching up with the Leaders: The Irish Hare,” Brookings Papers on Economic Activity part 1, pages 1-57.
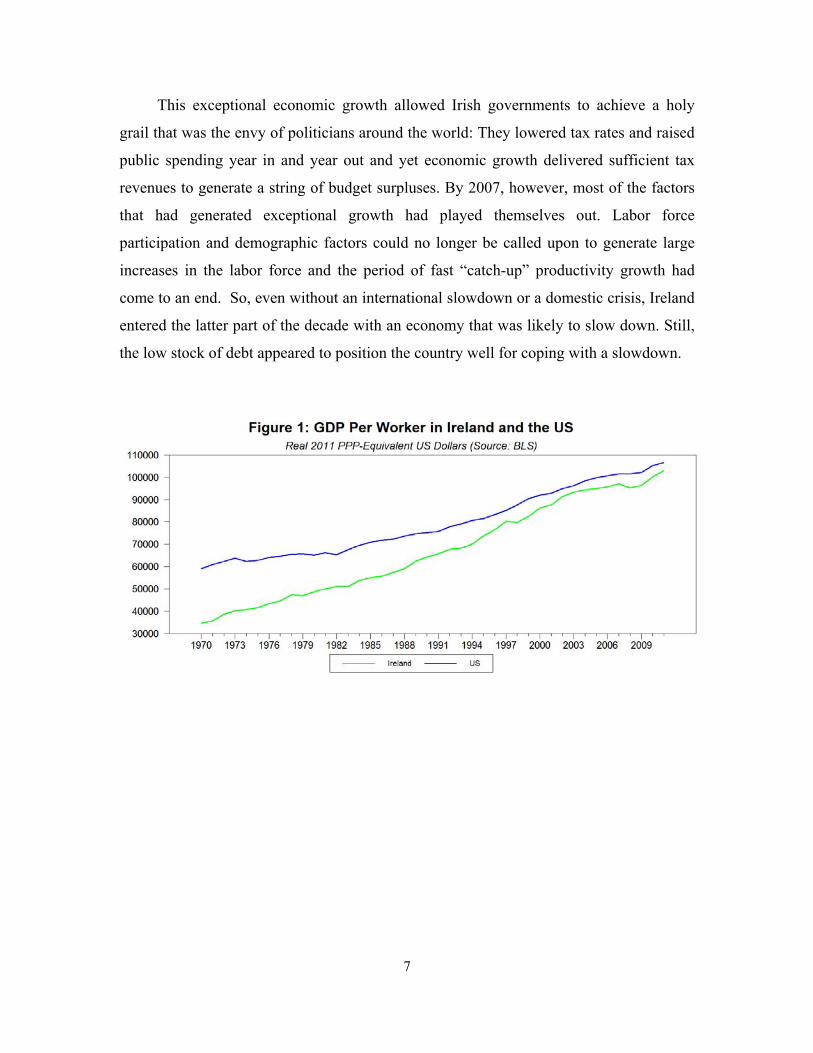
This exceptional economic growth allowed Irish governments to achieve a holy
grail that was the envy of politicians around the world: They lowered tax rates and raised
public spending year in and year out and yet economic growth delivered sufficient tax
revenues to generate a string of budget surpluses. By 2007, however, most of the factors
that had generated exceptional growth had played themselves out. Labor force
participation and demographic factors could no longer be called upon to generate large
increases in the labor force and the period of fast “catch-up” productivity growth had
come to an end. So, even without an international slowdown or a domestic crisis, Ireland
entered the latter part of the decade with an economy that was likely to slow down. Still,
the low stock of debt appeared to position the country well for coping with a slowdown.
7
8

9
10
2.2. The housing boom
Unfortunately, Ireland’s position in 2007 was not as strong as it appeared to many outsiders
or to its government of the time. Despite high levels of labor productivity, the later years of the
Irish boom saw the build-up of dangerous imbalances. At the heart of these imbalances was an
extraordinary housing boom.
At the turn of the millennium, Ireland still had a relatively small housing stock. Indeed,
Somerville (2007) estimated that Ireland had the smallest per capita housing stock in the
European Union. With population growing and incomes expanding rapidly, there were strong
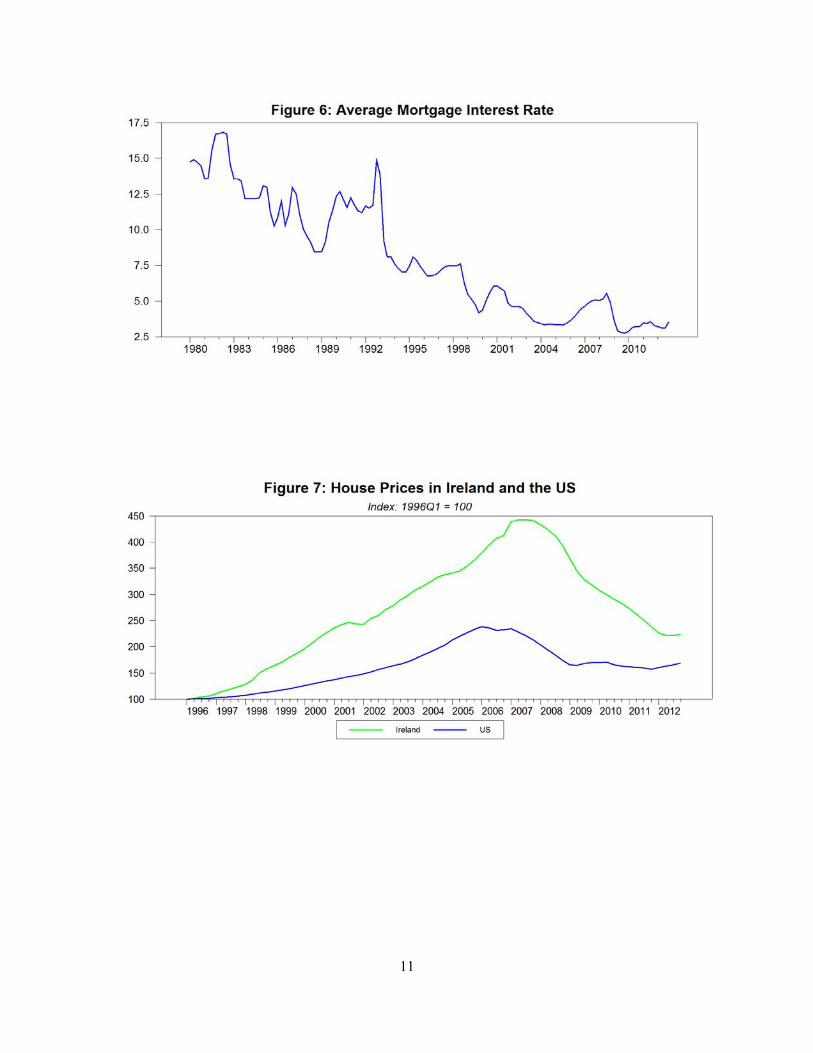
fundamental factors underlying housing demand. In addition, EMU allowed Irish financial
institutions to provide access to mortgage finance at historically low rates. Mortgage rates, which
had traditionally been over ten percent, collapsed to below five percent. As a result, house prices
in Ireland quadrupled in price between 1996 and 2007, a pace of increase double that seen in the
United States over a similar period (see Figure 7).
The response to this increase in housing demand was an extraordinary construction boom.
The total stock of dwellings—which had stood at 1.2 million homes in 1991 and had gradually
increased to 1.4 million homes in 2000—exploded to 1.9 million homes in 2008. House
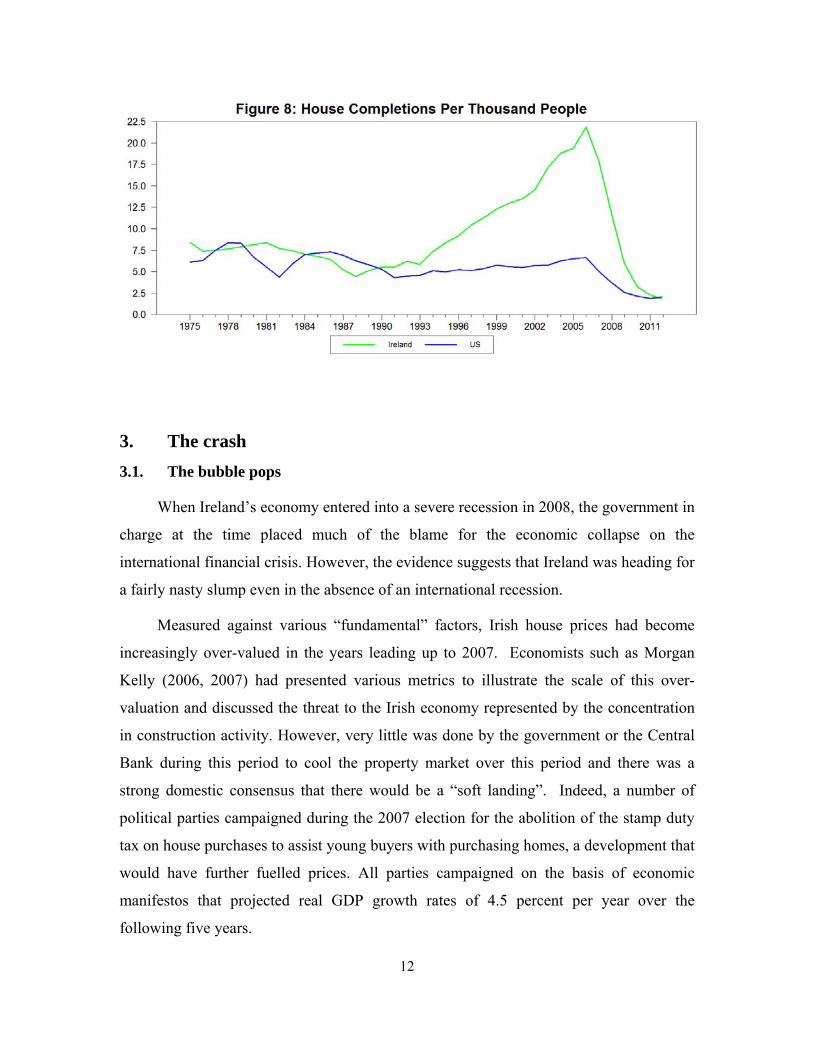
completions went from 19,000 in 1990 to 50,000 in 2000 to a whopping 93,000 in 2006. Figure 8
puts this in context by comparing house completions per capita with their equivalent in the United
States. It shows that while Ireland’s rate of housing completions during the 1970s and 1980s had
been comparable to the rates seen in the US, housing activity gradually increased in Ireland—
particularly after 2002—to the point where per capita completions were four times as high in
Ireland as in the US.
Construction became a dominant factor in the Irish economy. With the economy already
effectively at full employment, much of the labor employed in the construction boom came from
the new EU member states in Eastern Europe, and this inward migration itself further fuelled the
demand for housing. By 2007, construction accounted for 13.3 percent of all employment, the
highest share in the OECD. Indeed, with the exception of Spain and Portugal, Ireland’s share of
construction employment exceeded all other OECD member states by almost five percentage
points. This excessive economic concentration on housing construction was to prove disastrous.
11
3. The crash 3.1. The bubble pops
When Ireland’s economy entered into a severe recession in 2008, the government in
charge at the time placed much of the blame for the economic collapse on the
international financial crisis. However, the evidence suggests that Ireland was heading for
a fairly nasty slump even in the absence of an international recession.
Measured against various “fundamental” factors, Irish house prices had become
increasingly over-valued in the years leading up to 2007. Economists such as Morgan
Kelly (2006, 2007) had presented various metrics to illustrate the scale of this over-
valuation and discussed the threat to the Irish economy represented by the concentration
in construction activity. However, very little was done by the government or the Central
Bank during this period to cool the property market over this period and there was a
strong domestic consensus that there would be a “soft landing”. Indeed, a number of
political parties campaigned during the 2007 election for the abolition of the stamp duty
tax on house purchases to assist young buyers with purchasing homes, a development that
would have further fuelled prices. All parties campaigned on the basis of economic
manifestos that projected real GDP growth rates of 4.5 percent per year over the
following five years.
12
It turned out to be a good election to lose. By late 2007, well before the
international financial crisis had gotten into full swing, Irish house prices began to fall
from the peak levels. As house prices fell, the demand for new houses collapsed with the
attitude of potential buyers changing swiftly from being desperate to “get on the property
ladder” to deciding to wait to get a better price later. In mid-2008, the new Minister for
Finance, Brian Lenihan, noted that the housing market had “come to a shuddering halt”.
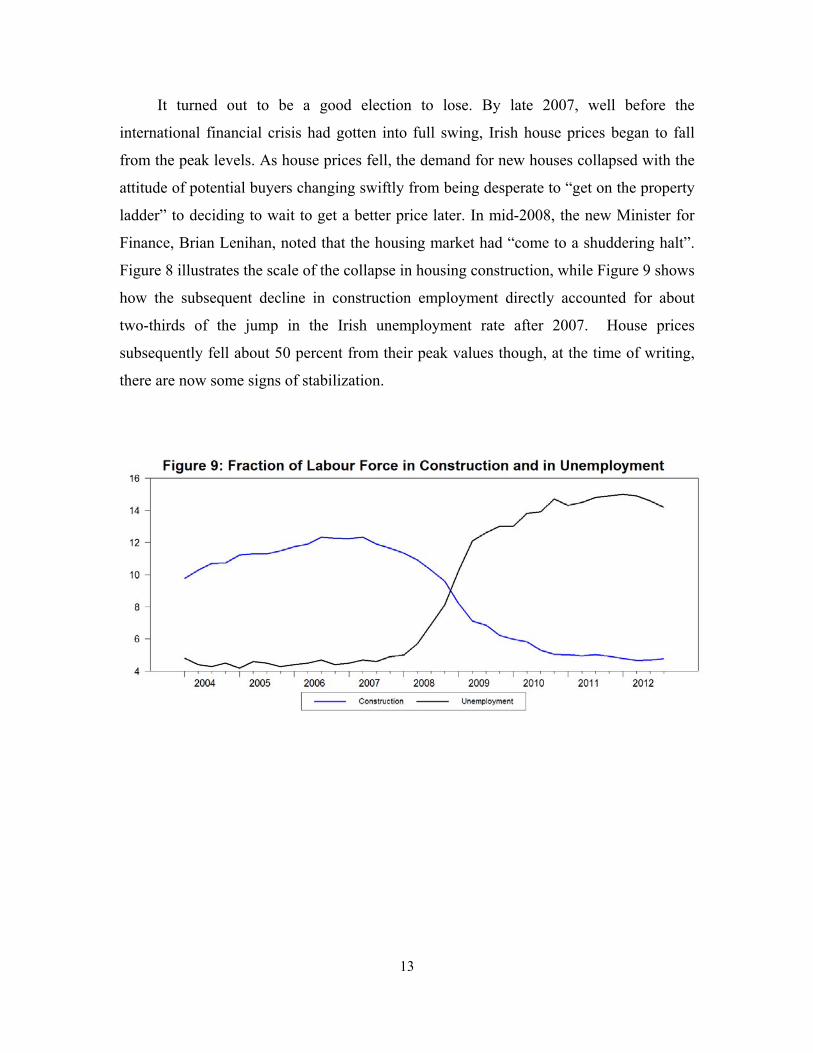
Figure 8 illustrates the scale of the collapse in housing construction, while Figure 9 shows
how the subsequent decline in construction employment directly accounted for about
two-thirds of the jump in the Irish unemployment rate after 2007. House prices
subsequently fell about 50 percent from their peak values though, at the time of writing,
there are now some signs of stabilization.
13

3.2. The fiscal crisis With the Irish economy having placed so many of its eggs in the construction
basket, one might have hoped that the authorities would have prepared carefully for what
was going to be an inevitable slowdown. Certainly, the long period of growth had left the
public finances in good shape. Ireland’s ratio of gross government debt to GDP in 2007
was only 25 percent and a sovereign wealth fund intended to cover future public sector
pensions had built up to about 20 percent of GDP. However, despite these positive
elements, Ireland’s apparently strong fiscal situation turned out to be heavily dependent
on the health of its property sector.
The collapse in construction activity, and the corresponding jump in
unemployment, resulted in a huge loss in income tax revenues and a big increase in social
welfare payments. Furthermore, Ireland’s tax base had been altered during the later
periods of the boom to collect more and more tax revenue from construction activity.
Figure 10 shows the share of total tax revenue due to income taxes (the black line on the
left scale) and due to asset-based taxes such as stamp duties, capital gains tax and capital
acquisition tax.3 Thanks to booming housing activity and surging house prices, the share
3 Ireland did not have a standard property tax during this period. Instead, the government levied a stamp duty tax that was paid in full when a house was purchased. With high levels of housing activity, this collected a lot of revenue during the boom and very little in recent years.
14
15
of tax revenue due to these asset-based taxes rose steadily during the 1990s and then
rapidly after 2002. At the same time, there was a corresponding reduction of a similar
magnitude in the share of revenues collected from income taxation. When construction
activity collapsed, this substantial source of government revenue disappeared almost
overnight.
With domestic construction activity collapsing and the world economy entering a
severe recession, Irish real GDP declined by ten percent over 2008 and 2009. Prices fell,
so nominal GDP contracted even more sharply, from €190 billion in 2007 to €161 billion
in 2009. Despite having had years of budget surpluses, Ireland was suddenly facing a
yawning fiscal gap. Indeed, it was apparent by early 2009 that, without fiscal
adjustments, Ireland was heading for annual deficits of as large as 20 percent of GDP.
The scale of these potential deficits meant that, despite the low starting level of
debt, the Irish government realized quickly there was no room for discretionary fiscal
stimulus to ease the effects of the severe downturn. Instead, from late 2008 onwards,
there has been a series of contractionary budgets. Public sector pay has been cut by
significant amounts, income taxes and VAT rates have been raised, non-welfare current
spending has been cut back and capital spending has been slashed. Taken together, these
budgets have implemented a total amount of discretionary tax increases and spending
cuts of €28.8 billion. These adjustments are the equivalent of 18 percent of 2012’s level
of GDP or €6,270 per person and represent one of the largest budgetary adjustments seen
anywhere in the advanced economic world in modern times.4
4. The banking crisis
Ireland’s economic slump would have been bad enough even if it had only featured
the collapse of the construction sector and its effects on employment and the budget
deficit. However, Ireland’s recession became a crisis due to the collapse of its banks.
4 The IMF’s October 2010 World Economic Outlook examined historical episodes of fiscal consolidation in fifteen advanced economies over 1980-2009. As a percentage of GDP, Ireland’s 2009 consolidation was the biggest the IMF researchers could find. The subsequent adjustments for 2010 and 2011 were of similar size.
16
4.1. The start of the banking crisis The acceleration in housing activity after 2002 was largely financed by the Irish
banks. As shown in Figure 11, the total stock of mortgage loans in Ireland exploded from
€16 billion in 2003:Q1 to a peak of €106 billion in 2008:Q3, about 60 percent of that
year’s GDP. In addition to rapidly expanding their mortgage lending, the Irish banks also
built up huge exposures to property development projects. Property-related loans to
construction businesses went from €45 billion in 2003:Q1 to a peak of €125 billion in
2008:Q1.
Many of the development loans on the books of the Irish banks in 2008 were made
to businessmen that had made fortunes during the boom and were “doubling down” on
property with ever more extravagant investments. Most of these loans were used for
investments that could only have paid off if property prices continued to rise. In addition,
these loans were largely concentrated in a small number of banks.
Leading the way was the now-notorious Anglo Irish Bank, which specialized in
property development. Anglo expanded its loan book at over 20 percent per year, with
assets growing from €26 billion in 2003 to €97 billion in 2007. In addition to its risky
property loan book, it is now known that Anglo had a series of what can euphemistically
be termed “serious corporate governance problems”.
Anglo, however, was not alone in its enthusiasm for property development loans.
The smaller Irish Nationwide Building Society, later merged with Anglo, grew over a
short period from a tiny mortgage lender to a €14 billion property development specialist
with half of its funding from international bond markets. Allied Irish Bank, one of
Ireland’s two principal “high street” retail banks invested heavily in in property-related
loans with its portfolio of such loans building up from €16 billion in 2004 to €47 billion
in 2007. This represented over one-quarter of its total assets, and over half of the €81
billion that it had in the form of customer deposits.
Another risk factor was the significant change in the funding model employed by
the Irish banks during the later years of the boom. Prior to 2003, these banks had operated
in a very traditional manner, with loans being roughly equal to deposits. After 2003, the
17
rapid expansion of property lending was largely financed with bonds issued to
international investors. From less than €15 billion in 2003, international bond
borrowings of the six main Irish banks rose to almost €100 billion (well over half of
GDP) by 2007. This source of funding proved to be less stable than deposit funding once
the property market crashed.
The huge build-up of risks at the Irish banks during this period raises questions
about why the Central Bank of Ireland, which was in charge of banking regulation, did
not intervene and why external bodies such as the IMF and European Commission did
not express concerns. One explanation is that regulators and other agencies focused too
much on the apparently strong capital adequacy ratios. For example, the 2007 IMF
Article 4 report on Ireland has a heading summarizing the position of the banking sector
as “Banks Have Large Exposures to Property, But Big Cushions Too.” This was
consistent with the government’s belief that the profitable Irish banks were going to be
safe even if the economy hit a serious downturn.
The focus on capital adequacy, Pillar One of the Basle framework, appears to have
come at the expense of a lack of emphasis on the second pillar, which relates to the
supervisory process. In particular, the Basle 2 guidelines contain an extensive section on
the importance of dealing with “credit concentration risk”, i.e. banks having too much
exposure to one source of risk.5 The severe exposure of the Irish banks to any downturn
in the property market was plain to see for anyone who read their annual reports. For
example, Morgan Kelly (2007) used these reports to calculate the size of the Irish banks’
exposure to the property sector and the potential for insolvency after a property bust.
However, as discussed by Honohan (2010) the “principles based” supervisory
culture at the Central Bank during this period meant there was very little supervisory
interference in bank operations. Indeed, the Central Bank had been tasked during this
period with a role in promoting Ireland’s financial services industry and presentations
from this period to international investors highlighted the “user-friendly” nature of the
regulatory approach. Whether because of this role or because of other failings, the
5 See pages 179-180 of Bank of International Settlements (2006)

outcome was a supervisory policy of not-so-benign neglect that left the banks totally
unprepared for a slowdown in the property market.
4.2. The banking crisis from September 2008 to EU-IMF bailout
During 2008, as evidence built up of the scale of the Irish construction collapse,
international investors became concerned about the exposure to property investment
loans of the Irish banks. These banks found it increasingly difficult to raise funds on bond
markets and on September 29, 2008, two weeks after the collapse of Lehman Brothers,
the senior management of the largest Irish banks turned up at government buildings
looking for help. Anglo Irish was losing funds and running out of eligible collateral to be
used to borrow from the ECB. Anglo was possibly days away from defaulting on its
liabilities and the other banks were extremely concerned about the impact on their
operations if such a default was to occur.
The guarantee
What exactly happened during the meetings that took place between the bankers,
the politicians and staff from the Department of Finance and Central Bank, is still
18
19
unclear. Indeed, there are ongoing calls in Ireland for an official investigation into the
details of these meetings. What we do know is that on the morning of September 30,
2008, the Irish public awoke to find out that the government had provided a guarantee for
almost all of the existing and future liabilities of the domestic Irish banks. The guarantee
was to run for two years, meaning any default on bank liabilities that occurred during that
period would be covered for by the Irish government.
Those involved in the government that made this decision have often pointed to the
fact that many other European governments also provided guarantees to bank creditors in
the months after the Lehman bankruptcy. However, as documented by ECB (2009), most
of these guarantees were limited in nature, generally applying only to newly-issued
securities and often having specified limits. While the guarantee provided in September
2008 was technically never called on, the fact that the liabilities of the banks were
guaranteed by the government played a key role in limiting options to restructure
insolvent banks in a way that would have seen losses shared with private creditors.
Why did the government provide such a broad guarantee given that alternative
arrangements could have protected Anglo and the other banks at the time? For example,
the Central Bank could have arranged to provide Anglo with Emergency Liquidity
Assistance, something that it did in large quantities at later points in the crisis.
Ultimately, the answer appears to be that the government believed the assurances of the
Irish Central Bank that the banks were fundamentally sound and were merely suffering
from a short-term liquidity problem. They appear to have believed that the guarantee
would not have consequences for the state finances and that the blanket approach was the
best way to signal to financial markets that the Irish banks were sound. Whether this was
a reasonable belief can be questioned. There is evidence that senior civil servants, as well
as Merrill Lynch (who had been recruited as advisors in the weeks prior to the decision)
warned against the dangers of a blanket guarantee.
20
From denial to disaster
As is commonly the case with banking crises, the Irish government continued to
adopt a policy of denial for some time after the emergence of problems. At first, the
government steadfastly denied any solvency problem existed at the Irish banks.
Consultants Price Waterhouse Coopers (PWC) were hired to “go deep into the banks” by
analyzing their loan books. PWC reported back that the banks had no solvency problems.
Remarkably, they reported that under their “highest stress scenario, Anglo’s core equity
and tier 1 ratios are projected to exceed regulatory minima (Tier 1 – 4%) at 30 September
2010 after taking account of operating profits and stressed impairments.”6
Still, with the property market crumbling and outside investors showing no interest
in investing in equity in Irish banks, the implications of bailing out bank creditors for
taxpayers began to gradually emerge. In December 2008, the government announced
plans to provide state capital of €2 billion each to Bank of Ireland and Allied and €1.5
billion to Anglo.7 In January, with evidence of various wrong-doings becoming public,
the government nationalized Anglo and replaced its senior management. By February, the
government had raised its capital injection plans for Bank of Ireland and Allied to €3.5
billion each. In May 2009, Anglo’s new management announced that the bank had lost
all of its €4 billion capital and predicted a further €4 billion in losses.
With concerns about property-related losses at the Irish banks spooking
international bond investors and foreign depositors and Ireland’s banks becoming
increasingly reliant on borrowings from the Eurosystem, the Irish government decided it
needed a systemic solution to fix the balance sheets of the banks. A National Asset
Management Agency (NAMA) was set up in late 2009 to issue government-backed
bonds to the banks to purchase distressed property loans at a discount. NAMA began to
acquire loans from the banks gradually over 2010 and as further tranches of loans were
acquired, it became clear that the final bill for recapitalizing the Irish banks would be
enormous.
6 Report available online at http://www.finance.gov.ie/documents/publications/other/2009/anglopwc.pdf 7 Morgan Kelly (2008) famously declared of the plan to provide Anglo with €1.5 billion “For all it will achieve, the money might as well be piled up in St. Stephen’s Green and incinerated.”
21
By September 2010, the government provided a “final estimate” that Anglo Irish
Bank would cost the state about €30 billion or almost €7000 per person living in the state.
The bank was to be recapitalized by providing it with government bonds known as
“promissory notes” which would make cash payments over a number of years.
According to Eurostat’s rules, the promissory notes were counted against Ireland’s
general government deficit in 2010, leading to what must be a world record official
deficit of 32 percent of GDP for that year.
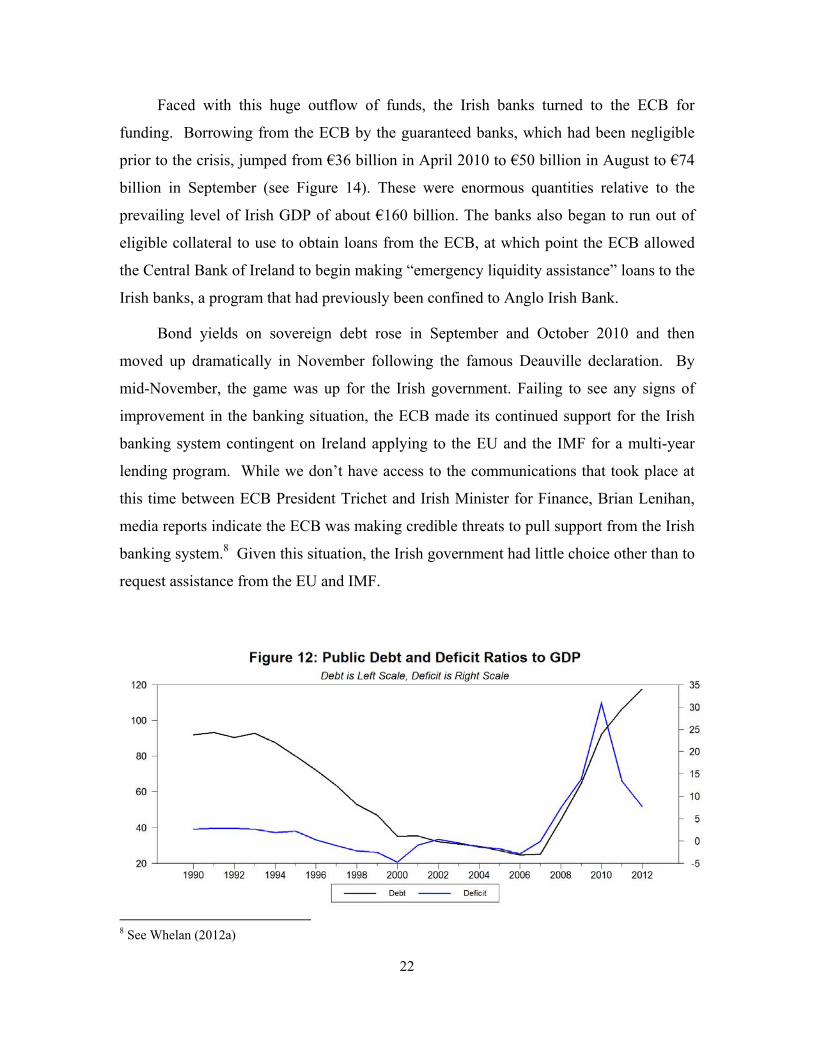
Despite having started the crisis with such a low level of debt, the combination of
large underlying deficits (the deficit in 2010 would have been about 12 percent of GDP
even without the Anglo recapitalization) and enormous bank bailout costs saw the debt to
GDP ratio heading towards 100 percent in 2010 (Figure 12). International markets, which
had been reasonably confident throughout 2009 that Ireland would make it through
without a sovereign default and which generally taken a favorable view of the Irish
government’s fiscal adjustment program, became increasingly concerned during 2010
that the banking sector was going to destroy the creditworthiness of the Irish sovereign.
This loss of faith in the sovereign further undermined the banks. The Irish banks
had been able to issue bonds from late 2008 to early 2010 under the protection of the state
guarantee. However, as concern about potential sovereign default began to rise, this
guarantee ceased to be of much use. With the loss of effectiveness of this backstop,
ratings agencies moved to lower their ratings on the Irish banks, which triggered
automatic outflows of money from corporate deposits.
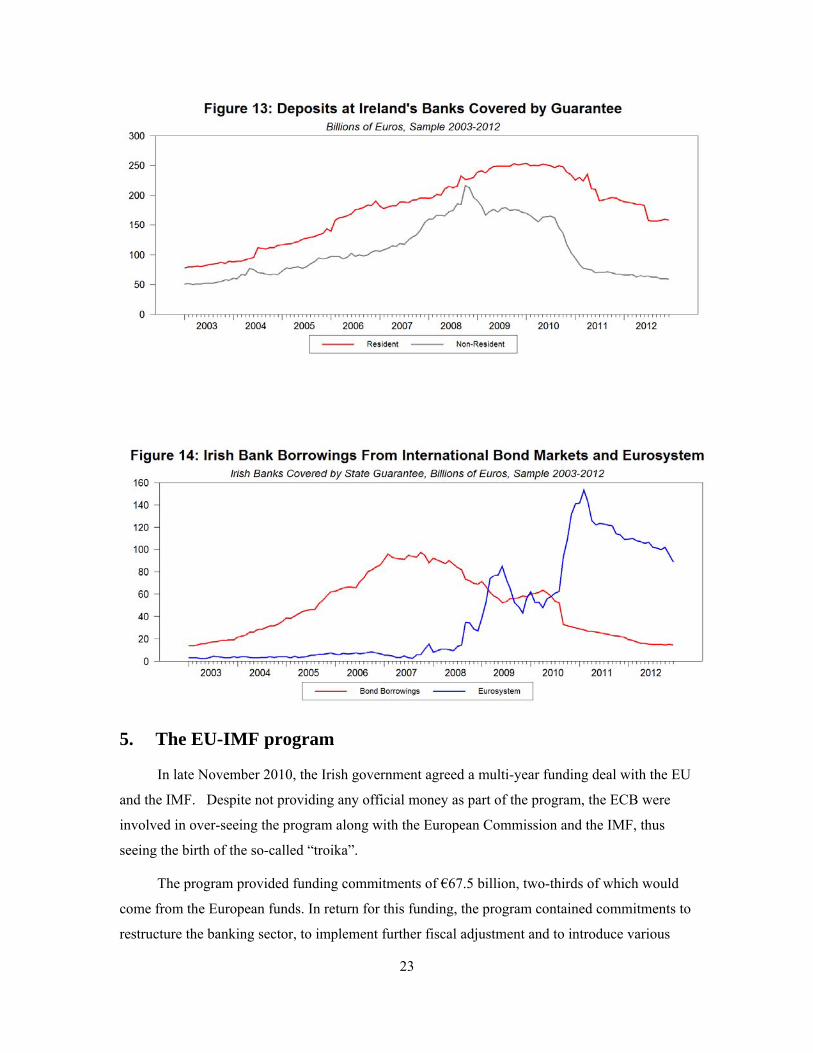
Many of the bonds that had been issued after the guarantee matured in September
2010, when the original guarantee ran out. When the banks failed to find new sources of
market funding in September 2010 to roll maturing bonds or replace the outflow of
corporate deposits, the Irish banking system effectively went into seizure. While there
was little public sign of trouble at Irish bank branches, behind the scenes there was
effectively a full-scale bank run, driven largely by non-resident deposits. Deposits of
non-residents at the Irish banks covered by the guarantee declined from €162 billion in
August 2010 to €116 billion in November 2010 (see Figure 13).
Faced with this huge outflow of funds, the Irish banks turned to the ECB for
funding. Borrowing from the ECB by the guaranteed banks, which had been negligible
prior to the crisis, jumped from €36 billion in April 2010 to €50 billion in August to €74
billion in September (see Figure 14). These were enormous quantities relative to the
prevailing level of Irish GDP of about €160 billion. The banks also began to run out of
eligible collateral to use to obtain loans from the ECB, at which point the ECB allowed
the Central Bank of Ireland to begin making “emergency liquidity assistance” loans to the
Irish banks, a program that had previously been confined to Anglo Irish Bank.
Bond yields on sovereign debt rose in September and October 2010 and then
moved up dramatically in November following the famous Deauville declaration. By
mid-November, the game was up for the Irish government. Failing to see any signs of
improvement in the banking situation, the ECB made its continued support for the Irish
banking system contingent on Ireland applying to the EU and the IMF for a multi-year
lending program. While we don’t have access to the communications that took place at
this time between ECB President Trichet and Irish Minister for Finance, Brian Lenihan,
media reports indicate the ECB was making credible threats to pull support from the Irish
banking system.8 Given this situation, the Irish government had little choice other than to
request assistance from the EU and IMF.
8 See Whelan (2012a)
22
5. The EU-IMF program
In late November 2010, the Irish government agreed a multi-year funding deal with the EU
and the IMF. Despite not providing any official money as part of the program, the ECB were
involved in over-seeing the program along with the European Commission and the IMF, thus
seeing the birth of the so-called “troika”.
The program provided funding commitments of €67.5 billion, two-thirds of which would
come from the European funds. In return for this funding, the program contained commitments to
restructure the banking sector, to implement further fiscal adjustment and to introduce various
23
24
reforms. This section describes the various elements of the program and the performance of the
Irish economy over this period.
5.1. Stabilizing the banking sector? The first priority for the program was to stabilize the banking sector. It was
announced that the Irish government were providing an additional €17.5 billion (mainly
from the National Pension Reserve Fund) towards bank recapitalization. Thus, the total
amount of funds available was €85 billion, with €35 billion of that earmarked for
potential use in bank recapitalization after the conduct of a comprehensive set of stress
tests.
It was hoped that this announcement would prevent further deposit outflows. In
fact, at first, the announcement of the EU-IMF deal intensified the problem with deposits
continuing to flee the Irish banking system and reliance on central bank funding increased
even further. However, the system began to stabilize in Spring 2011. The Central Bank
published a “Financial Measures Report” (FMP), a detailed document that set out loss
estimates for various parts of the loan books of the domestic Irish banks under stress
scenarios and capitalization requirements to cover these losses. The report also
established a set of deleveraging targets that would see the banks reduce their reliance on
ECB borrowing.
The program set recapitalization requirements of €24 billion for the four banks that
were examined; the other two covered banks (Anglo and Irish Nationwide) were merged
and put into wind-down. Some of this recapitalization came from write-downs of
subordinated bonds, a development enabled by the passage of new legislation that gave
the Minister for Finance wide powers to enforce coercive write-downs of subordinated
(but not senior) bonds in banks requiring state assistance. Bank of Ireland obtained
private equity investment and remained in majority private ownership but the other banks
did not. The state forked over another €16.5 billion for recapitalization purposes and
25
Allied and two other banks were nationalized. Of the six banks that were covered by the
September 2008 guarantee, only Bank of Ireland escaped full nationalization.9
Including the 2011 recapitalization, the total amount of funds provided by the Irish
state to recapitalize its banking sector has come in at about €63 billion or approximately
40 percent of current GDP. As illustrated in Figure 12, this means that the bank bailout
has contributed less than half of the increase in the ratio of public debt to GDP from 20
percent to 120 percent, with the rest of the increase mainly reflecting the large deficits
that have been run over this period. For this reason, it is not correct to blame Ireland’s
recent fiscal austerity on bank bailouts. Even without spending a cent on bank bailouts,
Ireland’s debt ratio in 2013 would be over 80 percent of GDP and rising. Without the
significant fiscal adjustment that has taken place, it is likely that Ireland would have
required an EU-IMF program even had there been no bank recapitalization. What is less
arguable, however, is that the banking-related costs probably made the difference
between Ireland having to enter a formal adjustment program in 2010 versus muddling
through on its own.
The program’s actions to stabilize the banking sector have been largely successful.
The banks have achieved the deleveraging targets set out in the program, mainly by
selling foreign assets, without incurring larger losses than envisaged in the FMP report.
Foreign deposits have not returned to the Irish banks but the quantity of these deposits
has stabilized, as have domestic deposits.
It would be a mistake, however, to over-state the current strength of the Irish banks
or to assume they have returned to anything approximating full health. There are a large
number of negative factors and uncertainties. While loan to deposit ratios of the two
largest retail banks, Bank of Ireland and Allied, have been reduced to the program’s
original target of 120 percent, the gap is made up by Eurosystem funding. While this now
places the Irish banks in a similar situation to many banks around Europe, the absence of
9 Even this escape was largely at the discretion of the government. The National Asset Management Agency acquired loans from the Irish banks at a premium to their market value. The European Commission has calculated that Bank of Ireland received almost €1 billion in state aid via this over-payment. Were it not for this over-payment, the Bank would likely have ended up in majority state ownership.
26
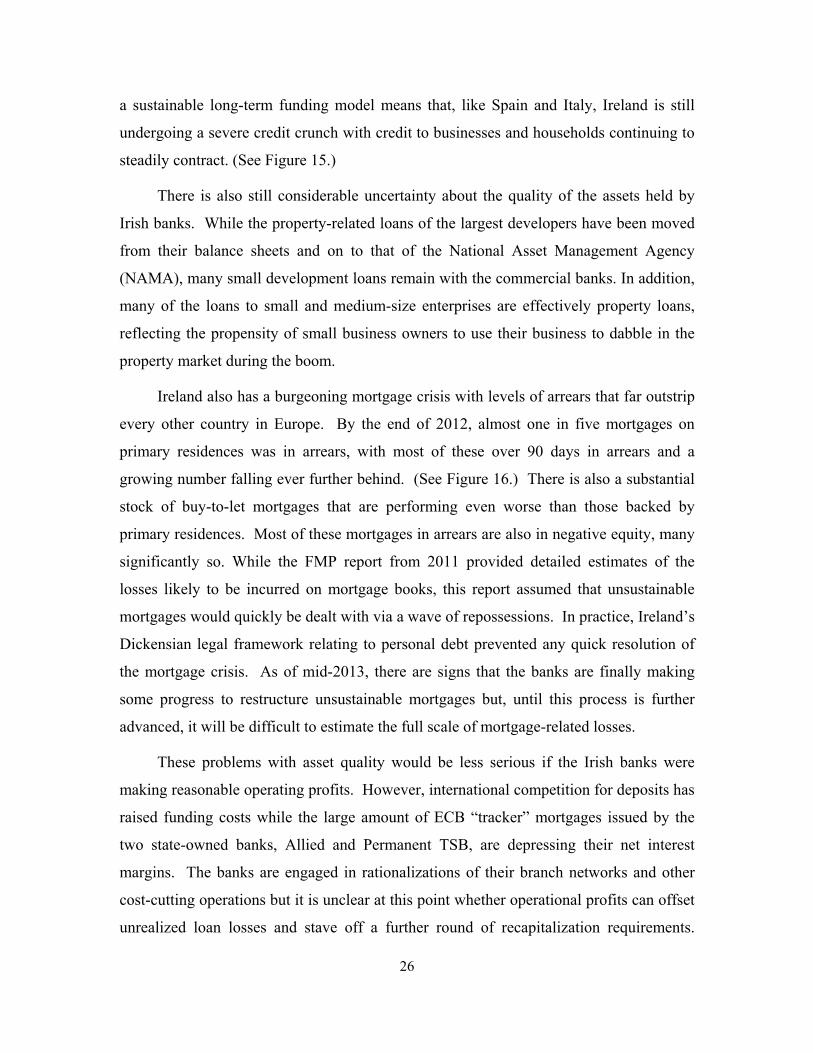
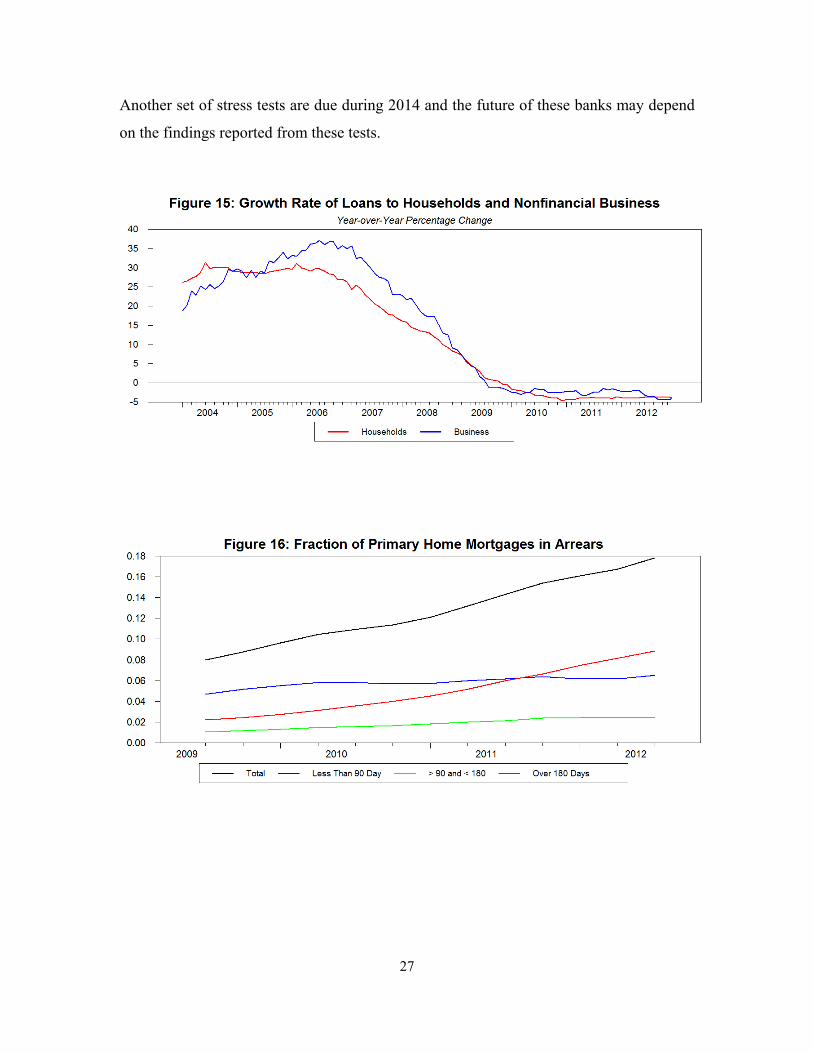
a sustainable long-term funding model means that, like Spain and Italy, Ireland is still
undergoing a severe credit crunch with credit to businesses and households continuing to
steadily contract. (See Figure 15.)
There is also still considerable uncertainty about the quality of the assets held by
Irish banks. While the property-related loans of the largest developers have been moved
from their balance sheets and on to that of the National Asset Management Agency
(NAMA), many small development loans remain with the commercial banks. In addition,
many of the loans to small and medium-size enterprises are effectively property loans,
reflecting the propensity of small business owners to use their business to dabble in the
property market during the boom.
Ireland also has a burgeoning mortgage crisis with levels of arrears that far outstrip
every other country in Europe. By the end of 2012, almost one in five mortgages on
primary residences was in arrears, with most of these over 90 days in arrears and a
growing number falling ever further behind. (See Figure 16.) There is also a substantial
stock of buy-to-let mortgages that are performing even worse than those backed by
primary residences. Most of these mortgages in arrears are also in negative equity, many
significantly so. While the FMP report from 2011 provided detailed estimates of the
losses likely to be incurred on mortgage books, this report assumed that unsustainable
mortgages would quickly be dealt with via a wave of repossessions. In practice, Ireland’s
Dickensian legal framework relating to personal debt prevented any quick resolution of
the mortgage crisis. As of mid-2013, there are signs that the banks are finally making
some progress to restructure unsustainable mortgages but, until this process is further
advanced, it will be difficult to estimate the full scale of mortgage-related losses.
These problems with asset quality would be less serious if the Irish banks were
making reasonable operating profits. However, international competition for deposits has
raised funding costs while the large amount of ECB “tracker” mortgages issued by the
two state-owned banks, Allied and Permanent TSB, are depressing their net interest
margins. The banks are engaged in rationalizations of their branch networks and other
cost-cutting operations but it is unclear at this point whether operational profits can offset
unrealized loan losses and stave off a further round of recapitalization requirements.
Another set of stress tests are due during 2014 and the future of these banks may depend
on the findings reported from these tests.
27

28
5.2. Fiscal adjustment
Ireland has made slow but steady progress in reducing its fiscal deficit and meeting
the program’s fiscal targets. A €5.4 billion fiscal adjustment (about three percent of GDP)
was introduced in December 2010 in the waning days of the Fianna Fail\Green Party
coalition government to satisfy the first fiscal requirements of the EU-IMF program. The
election of February 2011 featured plenty of brave claims from opposition politicians that
they planned to renegotiate this program in various ways. However, the Fine
Gael\Labour coalition government that won the election has barely changed the core
conditions of the program and have continued to implement the fiscal adjustments
dictated by the agreements, with a further fiscal adjustments of €3.5 billion introduced in
budgets in December 2011 and December 2012.
The fiscal targets set down in the program have been met and the government has
benefited from a number of developments. First, there have been substantial adjustments
to the program’s financing costs. The initial design of the program saw the €45 billion in
funds provided by the European Union carrying profit margins of around 300 basis points
and having an average maturity of 7.5 years. After Greece negotiated to have profit
margins on its loans eliminated, the same deal was passed on to Ireland and a deal has
recently been agreed to extend the maturity of these loans. Taken together, these
concessions have significantly reduced the annual cost of the bailout funds and reduced
the medium-term financing requirements associated with Ireland’s debt.
Second, the arrangements put in place to recapitalize Anglo Irish Bank have been
renegotiated. These arrangements had required the Irish taxpayer to provide the bank
with promissory note payments of €3.1 billion per year (about 2 percent of GDP) over the
next decade mainly to allow the bank to repay its ELA debts.10 In February 2013, Anglo
was liquidated and the Central Bank was compensated for its ELA loans by the provision
of government bonds. The ECB Governing Council has required that these government
bonds be sold to the private sector gradually over time, so the replacement of the
promissory notes with these bonds has not changed Ireland’s public debt. However, the
10 See Whelan (2012b) for a detailed description of the promissory note and ELA arrangements.
29
new arrangement does appear to provide more flexibility in relation to dealing with the
burden generated by the decision to bail out Anglo Irish and Irish Nationwide.
The execution of the fiscal side of the program has been good, with spending
targets being met. While this reflects well on the current government and on the Irish
civil service, the discipline in spending has been enforced by the need to meet troika
targets. For example, spending on health and social welfare has consistently run ahead of
targets but overall spending targets have been met because adjustment has been made
elsewhere. It is perhaps unlikely that this kind of spending discipline could have been
maintained outside a formal program.
Furthermore, while there has been a strong political narrative that the current
government has taken many brave decisions during the program to “restore the reputation
of the country” it is worth noting that only €7.3 billion of the cumulated fiscal adjustment
of €28.8 billion from 2007-2013 has taken place under the post-2011 government. If
credit is to be applied, it is perhaps best awarded, not to individual political parties, but
rather to the Irish people who have accepted the extraordinary scale of fiscal adjustment
with a remarkable level of equanimity and without any significant turn towards radical
politics. Still, with so many spending cuts and tax increases having been implemented
already, there is an increasing sense of “austerity fatigue” and the planned spending cuts
and tax increases over the next few years are likely to cause more political problems than
those seen up to now.
5.3. A return to growth
Ireland’s budget deficit is still projected to be about 7.3 percent of GDP in 2013.
The European Commission projects that the deficit will decline to 4.3 percent in 2014 and
2.1 percent in 2015, by which time the primary budget is projected to record a surplus of
3 percent. These improvements partly reflect further planned fiscal consolidation but
they are also reliant on projections that real GDP growth will return towards 3 percent in
the coming years.
There are good grounds for skepticism about the European Commission’s growth
projections. For each of the countries in the euro area, official forecasts have been

30
projecting a gradual return to healthy economic growth for a number of years, only to
have the forecasted recovery to be continually delayed. In Ireland’s case, however, there
are somewhat greater grounds for optimism. Perhaps surprisingly, Ireland’s economy
bottomed out in late 2010, right as the EU-IMF agreement was signed. After declining
steadily from early 2008 onwards, the economy recorded tentative growth in 2011 and
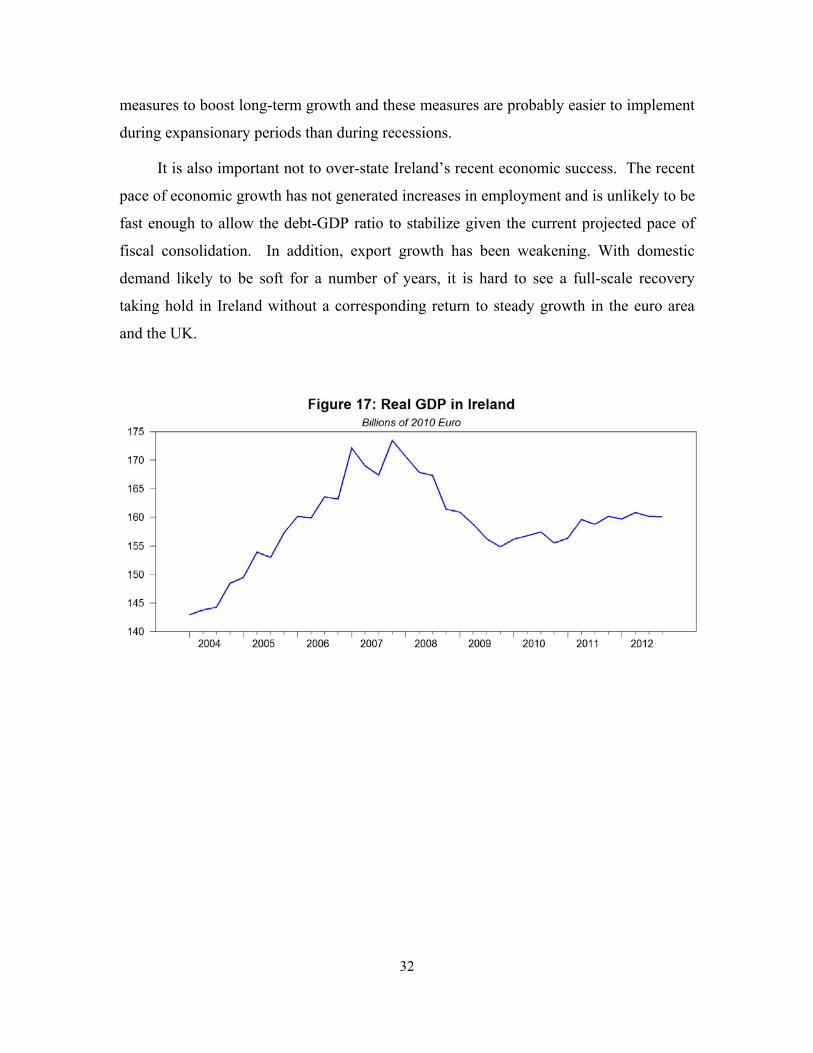
2012, with GDP growing by 1.4 percent and 0.9 percent respectively. (See Figure 17)
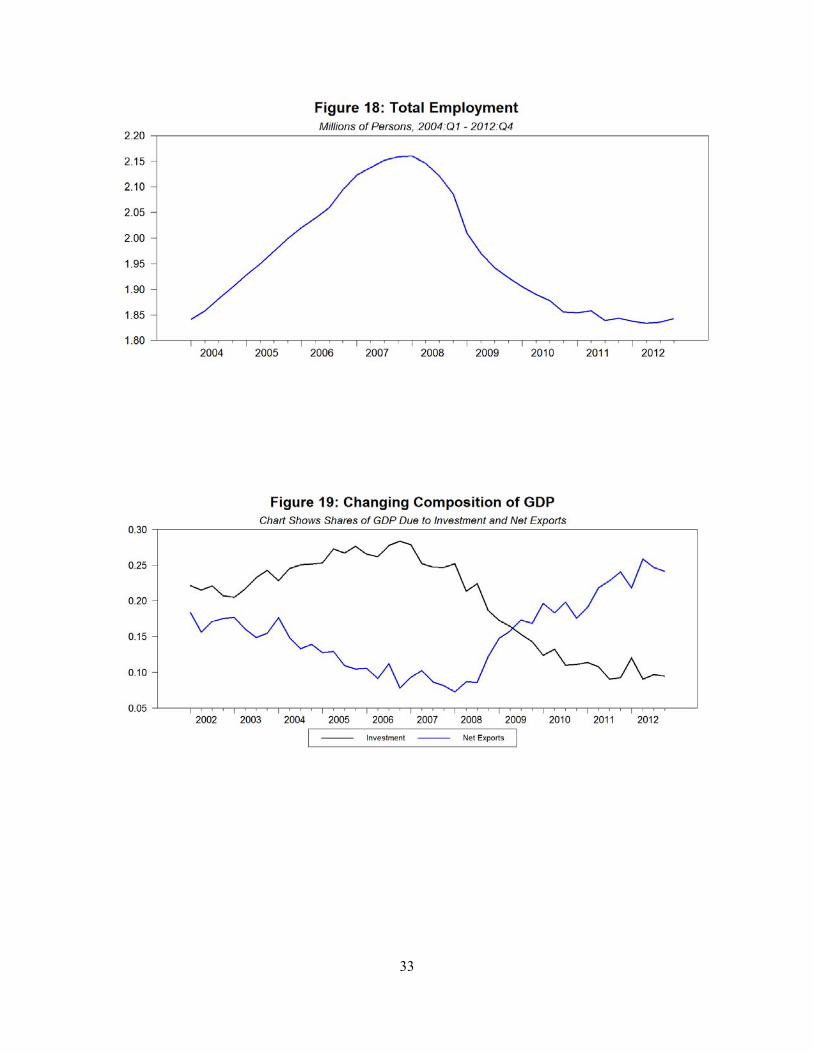
Employment, which had fallen 18 percent from its peak level, began to flatten out in 2011
but has yet to show signs of significant growth. (See Figure 18).
The economic growth of recent years has occurred despite fiscal contraction, tight
credit and severe balance sheet problems for households and firms. As expected, these
factors have severely depressed domestic demand, so the growth of recent years reflects a
re-orientation of the economy away from domestic demand and towards exports.
Ireland is a small and highly open economy that has a significant fraction of export-
platform foreign direct investment operations, so traditionally it has run a large trade
surplus. In the final years of the boom, however, Ireland’s cost competitiveness was
eroded and net exports declined as a share of GDP. With the collapse of the housing
bubble, the roles played by investment and net exports have flipped in the sense that in
2007, investment was 25% of GDP and net exports was 10% while by 2012 investment
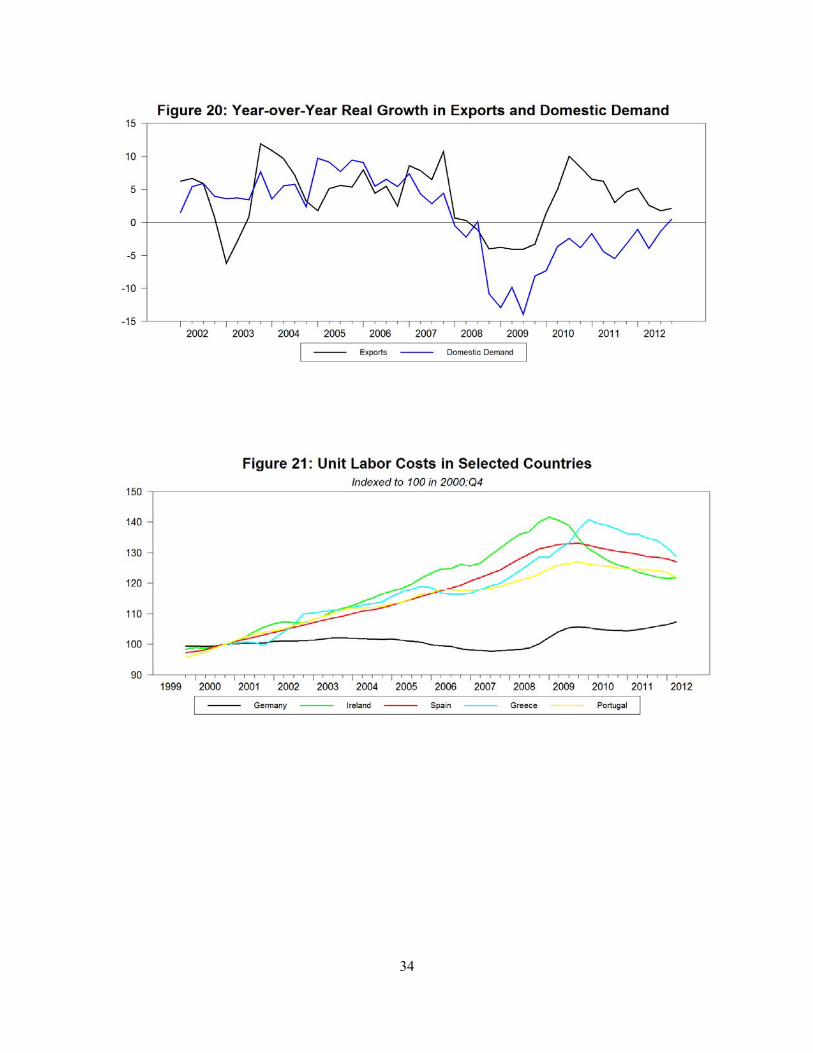
was 10% of GDP and net exports was 25%. (See Figure 19.) The role of export growth in
sustaining increases in GDP in recent years despite falling domestic demand is also
illustrated in Figure 20.
Ireland’s export growth in recent years partly reflects an improvement in
competitiveness. Figure 21 reports indexes of unit labor costs for various euro area
countries. It shows that Ireland has had the most significant improvement in unit labor
costs of any of the crisis countries. Still, this improvement has only made up part of the
loss of competitiveness relative to Germany that was built up during the boom period.
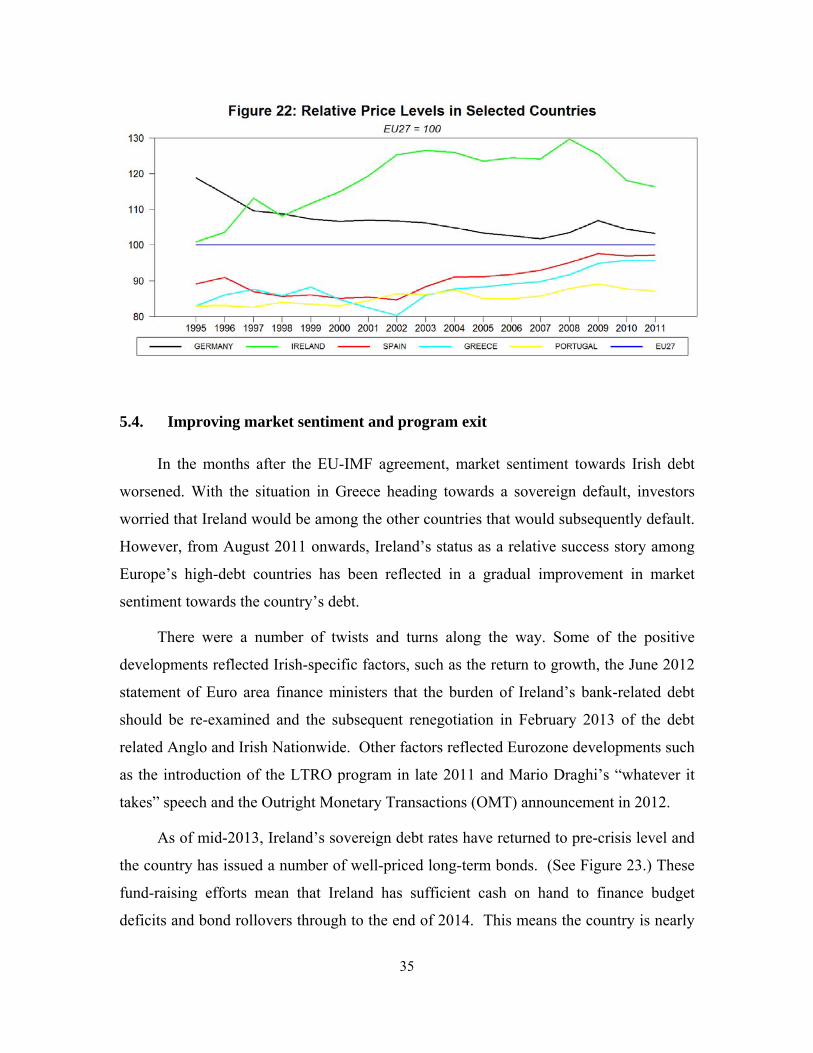
In terms of broader concepts of cost competitiveness, Figure 22 reports figures
from Eurostat showing comparable price levels for a selected group of EU countries.
Ireland went from being an average EU country in terms of the cost of living in 1995 to
31
being 30 percent more expensive than the average in 2008. With consumer prices down
on average from their level in 2008, about half of this excess has been eliminated but
Ireland remains a pretty expensive place to live and this acts as a constraint on
competitiveness.
This improvement in competitiveness partly reflects the depressed state of the labor
market but it also reflects the fact that the Irish economy is relatively flexible. For
example, Venn (2008) reported that Ireland has a lower score on the OECD Employment
Protection Index than any other euro area member state and the World Bank has
consistently ranked Ireland higher in its Doing Business index than other members of the
euro.
The relative success of Ireland in regaining competitiveness and sustaining export
growth in difficult conditions in recent years can be considered an argument in favor of a
theme regularly aired by European Commission officials and senior European politicians:
That adjustment to fiscal contraction can be easier if labor and product markets are more
flexible.
However, Ireland does not provide evidence for a more commonly-aired version of
this argument – that Ireland is an example of how structural reforms in product and labor
markets can boost growth while an economy undergoes fiscal austerity. In reality, there
have been very few structural reforms in Ireland during the EU-IMF program because, by
European standards, Ireland began the program with markets that are relatively
deregulated.11 A quick examination of a recent European Commission report on Ireland’s
progress reveals the modest nature of the structural reforms included in the program.12 A
streamlining of the company examinership process, a water services bill and steps to beef
up competition enforcement are among the hardly earthshattering list of reforms
discussed in the report. Rather than a complement to austerity likely to stimulate short-
term growth, structural reforms in labor and product markets should probably be seen as
11 Indeed, perhaps the most obvious labor market structural reform in the original EU-IMF program – cutting the minimum wage, which is high by European standards – was reversed when the Fine Gael\Labour government renegotiated the program in Spring 2011. 12 European Commission (2013).
measures to boost long-term growth and these measures are probably easier to implement
during expansionary periods than during recessions.
It is also important not to over-state Ireland’s recent economic success. The recent
pace of economic growth has not generated increases in employment and is unlikely to be
fast enough to allow the debt-GDP ratio to stabilize given the current projected pace of
fiscal consolidation. In addition, export growth has been weakening. With domestic
demand likely to be soft for a number of years, it is hard to see a full-scale recovery
taking hold in Ireland without a corresponding return to steady growth in the euro area
and the UK.
32
33
34
5.4. Improving market sentiment and program exit
In the months after the EU-IMF agreement, market sentiment towards Irish debt
worsened. With the situation in Greece heading towards a sovereign default, investors
worried that Ireland would be among the other countries that would subsequently default.
However, from August 2011 onwards, Ireland’s status as a relative success story among
Europe’s high-debt countries has been reflected in a gradual improvement in market
sentiment towards the country’s debt.
There were a number of twists and turns along the way. Some of the positive
developments reflected Irish-specific factors, such as the return to growth, the June 2012
statement of Euro area finance ministers that the burden of Ireland’s bank-related debt
should be re-examined and the subsequent renegotiation in February 2013 of the debt
related Anglo and Irish Nationwide. Other factors reflected Eurozone developments such
as the introduction of the LTRO program in late 2011 and Mario Draghi’s “whatever it
takes” speech and the Outright Monetary Transactions (OMT) announcement in 2012.
As of mid-2013, Ireland’s sovereign debt rates have returned to pre-crisis level and
the country has issued a number of well-priced long-term bonds. (See Figure 23.) These
fund-raising efforts mean that Ireland has sufficient cash on hand to finance budget
deficits and bond rollovers through to the end of 2014. This means the country is nearly
35
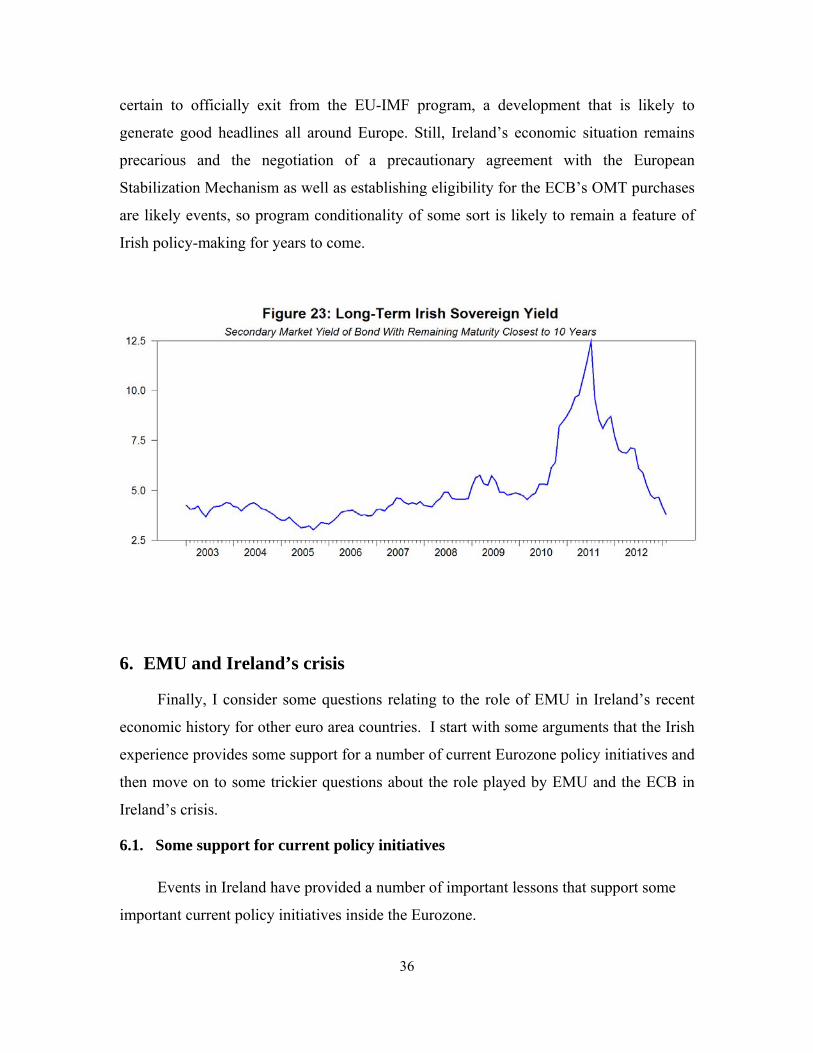
certain to officially exit from the EU-IMF program, a development that is likely to
generate good headlines all around Europe. Still, Ireland’s economic situation remains
precarious and the negotiation of a precautionary agreement with the European
Stabilization Mechanism as well as establishing eligibility for the ECB’s OMT purchases
are likely events, so program conditionality of some sort is likely to remain a feature of
Irish policy-making for years to come.
6. EMU and Ireland’s crisis
Finally, I consider some questions relating to the role of EMU in Ireland’s recent
economic history for other euro area countries. I start with some arguments that the Irish
experience provides some support for a number of current Eurozone policy initiatives and
then move on to some trickier questions about the role played by EMU and the ECB in
Ireland’s crisis.
6.1. Some support for current policy initiatives
Events in Ireland have provided a number of important lessons that support some
important current policy initiatives inside the Eurozone.
36
37
• The problems caused in Ireland by a housing bubble and an economy in which
employment and tax revenues are overly dependent on one sector are good
examples of the reasons for the broader approach to monitoring macroeconomic
imbalances being adopted now by the European Commission.
• The failure in Ireland of an approach to banking regulation that was focused mainly
on micro-prudential capital adequacy rules argues for a more macro-prudential
approach to regulation in which macro stress scenarios and feedback effects are
given more prominence. Europe has taken some steps in this direction with the
setting up of the European Systemic Risk Board and the introduction of stress tests
by the European Banking Authority.
• The Irish experience also argues strongly in favor of the proposed harmonized
approach to banking supervision across the euro area, so that supervisory cultures in
some countries that are lax in nature are not allowed to cause financial problems
that spill over to the whole of the area.
• Ireland’s greater success in reducing costs and raising exports in response to the
crisis has provided an illustration of the benefits of a less regulated labor market.
6.2. The role of EMU in producing the crisis
An important question is the role that euro membership played in the both the
build-up to the crisis and the policies adopted to deal with them. Some in Ireland blame
the low interest rates associated with euro membership for the housing bubble and
resulting crash.
I think the weight of blame is better placed on domestic fiscal and regulatory
policy. While the authorities may not have been able to do much about the low interest
rates brought in by euro membership, they had the power to place limits on mortgage
lending (limiting multiples of income or requiring large down-payments) and to restrict
the exposure of individual financial institutions to property development.
38
In addition, rather than “lean against” the property bubble, Ireland’s government
provided a host of tax-based incentives that encouraged property speculation: Some of
the largest loan losses incurred during the crash related to hotels or housing developments
in remote areas that were only undertaken as investments because of tax breaks and an
expectation of future price appreciation. Indeed, as shown in Figure 7, Irish property
prices flattened out in 2001 as the global economy slowed and various tax incentives
were removed. After lobbying from the property sector, the tax incentives were restored
and property prices began to soar again.
6.3. The role of the ECB in dealing with the crisis
Unlike the period leading up to the crisis, a mix of blame between the Irish
government and the ECB is more appropriate when considering how the banking crisis
was handled. I will focus on five areas: The introduction of the bank guarantee, the
diagnosis of solvency versus liquidity problems, the decisions to grant Emergency
Liquidity Assistance, the decisions on repayment of creditors after the EU-IMF program
and the transparency and accountability of the ECB.
1. The guarantee decision
Politicians from the government that issued the September 2008 guarantee have
suggested on various occasions that the decision was influenced by the ECB but no
documentary evidence for this has ever been provided.13 The ECB had the telephone
number of every finance minister in the euro area but no other governments introduced a
guarantee as broad as the Irish one. Indeed, there is evidence that a number of European
governments were upset by the precedent set by the Irish guarantee and concerned that
pressure would be placed on them to follow suit. All told, the blame for the important
role played in worsening Ireland’s banking crisis by the guarantee decision must rest with
the Irish politicians who introduced it.
13 Former Minister for Finance, Brian Lenihan, spoke on a number of occasions of how Jean-Claude Trichet had advised him “Save your banks.”
39
2. Solvency versus Liquidity
At around the same time as the Irish banks were getting into difficulty, Iceland’s
banks were going into meltdown. Having borrowed heavily in foreign currency, there
was no way the Central Bank of Iceland could act as a lender of last resort and ultimately,
Iceland had little choice other than to restructure its banking sector with bank creditors
taking a loss. The extent of the solvency problem faced by the Icelandic banks was not
diagnosed in September 2008 and has only revealed itself over time.
In Ireland, membership of the euro significantly eased the nature of the liquidity
problem faced by the banks. During the opening year of the crisis, the banks were largely
able to substitute for lost deposits and failed bond rollovers by increasing their
borrowings from the ECB. While this helped to keep the show on the road for a while, it
meant there was a substantial delay in admitting there was a serious solvency problem.
Another comparison that is useful is the recent haircutting of depositors in Cypriot
banks. Had the Irish banks been unable to access euro-denominated loans in October
2008, it is likely that some form of bank resolution would have to have been applied. In
the case of Anglo Irish Bank, which cost the Irish taxpayer over €30 billion, the impact
on retail depositors of a Cyprus-style haircut would have been relatively small. Out of
total liabilities in September 2008 of €97 billion, senior debt securities accounted for €17
billion, subordinated bonds for €5 billion and non-retail deposits accounted for €40
billion. Only €19 billion of Anglo’s liabilities were accounted for by retail deposits.
These figures show that, at the moment of the guarantee, there was a large amount of
loss-absorbing capacity among Anglo’s bondholders and large corporate depositors and
much of this capacity came from non-Irish investors.
Without wishing to understate the potential contagion effects that would have
occurred had Anglo been put into resolution in September 2008, I suspect the costs to
Ireland of putting the bank into resolution in October 2008 would have come in below
€30 billion. The ability of the authorities to use membership of the euro to postpone the
day of reckoning did not prove helpful for the majority of the Irish people.
40
3. Emergency liquidity assistance
By late 2010, it was clear that the Irish banks faced serious solvency problems. As
one by one, these banks ran out of ECB-eligible collateral, the ECB Governing Council
granted the Central Bank of Ireland permission to supply the banks with Emergency
Liquidity Assistance (ELA). There is an important difference between these two kinds of
loans. Losses incurred on regular Eurosystem loans, i.e. those back by ECB-eligible
collateral, are shared among participating euro area central banks. However, losses on
ELA loans fall only on the providing national central bank. Before the ELA loans were
given to banks, the Irish Minster for Finance was required to provide various guarantees
that these loans would be paid back, using state funds if necessary.
The exact nature of the interplay between the ECB and the Central Bank of Ireland
when granting ELA is unknown. For example, it’s not known whether the ECB
encouraged the provision of ELA because it was keen to avoid bank failures or whether
the ECB only reluctantly allowed the provision of ELA to an Irish Central Bank that was
keen to see the government’s guarantee not be called on. However the decisions were
taken, the decision to facilitate creditor withdrawals from Irish banks that had run out of
eligible collateral contributed to increasing the cost of the banking crisis for Irish
taxpayers. An alternative policy in which the ECB denied the use of ELA and advised
abandoning an unwise guarantee may have produced a better outcome.
4. Post-bailout approach to creditors
While Irish politicians should take most of the blame for the cost to their public of
the bank bailout, the ECB’s actions added to this cost.
Though not an official part of the program, it is widely understood that the ECB
insisted that all senior bond creditors in the Irish banks should be repaid and threatened to
withdraw liquidity support and\or significantly raise the cost of this funding. At the time,
the ECB’s implicit policy was that no banks should be allowed to fail in the euro area out
of fear that such an event could prove to be “another Lehmans”. The policy of repaying
all creditors was opposed in the negotiations by the IMF and by Ireland’s government
(which had belatedly admitted it shouldn’t try to bail out all bank creditors) but with the
41
European authorities providing most of the program money and the Irish banks dependent
on ECB liquidity support to maintain day-to-day operations, the ECB position prevailed.
Importantly, the ECB no longer favors the approach of insisting that all bank
creditors be repaid. Indeed, it was the ECB’s decision to make future funding to Cypriot
banks contingent on depositor write-downs that triggered the exact timing of the crisis in
Cyprus. While one can question whether the ECB has now swung too much to the
opposite extreme, it is good to see that the ECB now tacitly admits the approach taken to
bank creditors in Ireland is not one that can be applied more widely.
All told, while the Irish authorities did not help themselves, in the absence of an agreed
approach to bank resolution, the euro area in the later part of the last decade did not prove to be a
good place to have a banking crisis.
5. Transparency and accountability at the ECB
Finally, Ireland’s crisis and a number of other events of recent years have raised very
important questions about the transparency and accountability of the ECB. I have written
elsewhere at length about these issues and won’t repeat the arguments here.14 However, the
actions of the ECB to effectively force countries into bailout programs (via threats to cut off
liquidity if they don’t) as well as to influence the cost of these programs (by insisting certain
classes of creditors by repaid or haircut) have raised serious questions about whether an
organization that has so little democratic accountability and behaves with so little transparency
should be endowed with so much power.
7. Conclusions
Ireland’s recent economic history has produced many events that are likely to continue to
influence debates about economic policy in the euro area. Mistakes relating to lax banking
regulation, over-concentration on the housing sector and mishandling the resolution of insolvent
banks will provide important examples of policies that euro area countries should best avoid in
the future.
However, despite these mistakes, Ireland’s economy has a number of strong fundamental
factors including high productivity and a relatively flexible labor market. These factors have
14 See Whelan (2012c).
42
helped Ireland cope somewhat better with fiscal austerity in recent years than other euro area
member states. Despite serious problems with overhangs of public and private debt and a
difficult external environment, there are signs that the Irish economy is slowly getting back on
track. An important challenge now for Ireland is to re-build political and policy-making
institutions in a way that will help to avoid the type of self-inflicted mistakes that have
contributed to multiple economic crises over the past few decades.
More broadly, I argue in this paper that the euro area’s policy makers should avoid making
glib conclusions about the effects of austerity or structural reforms based on their reading of
Ireland’s experience and that events surrounding Ireland’s banking crisis should raise serious
questions about the transparency and accountability of the European Central Bank.
43
References
Bank of International Settlements (2006). Basel II: International Convergence of Capital Measurement and Capital Standards: A Revised Framework - Comprehensive Version
European Central Bank (2009). National Rescue Measures in Response to the Current Financial Crisis, Legal Working Paper N0. 8.
European Commission (2013). Economic Adjustment Programme for Ireland Winter 2012 Review. European Economy Occasional Papers 131.
Honohan, Patrick (2010). The Irish Banking Crisis Regulatory and Financial Stability Policy 2003-2008. Report to the Irish Minister for Finance by the Governor of the Central Bank
Honohan, Patrick and Brendan Walsh (2002). “Catching up with the Leaders: The Irish Hare,” Brookings Papers on Economic Activity, Part 1, pages 1-57.
International Monetary Fund (2010). World Economic Outlook, Chapter 3: “Will it Hurt? Macroeconomic Effects of Fiscal Consolidation”.
Kelly, Morgan (2006). “How the housing cornerstones of our economy could go into rapid freefall”, The Irish Times, December 28.
Kelly, Morgan (2007). "On the likely Extent of Falls in Irish House Prices," Quarterly Economic Commentary: Special Articles, Economic and Social Research Institute (ESRI), Summer edition, pages 42-54.
Kelly, Morgan (2007). “Banking on very shaky foundations”, The Irish Times, September 7.
Kelly, Morgan (2008). “Better to incinerate €1.5 billion than to waste it on Anglo Irish Bank”, The Irish Times, December 28.
Somerville, R.A. (2007). “Housing Tenure in Ireland,” The Economic and Social Review, pages, Volume 37, 107-134.
Venn, Danielle (2009), “Legislation, collective bargaining and enforcement: Updating the OECD employment protection indicators”, OECD Social, Employment and Migration Working Papers.
Whelan, Karl (2012a). “The ECB's Secret Letter to Ireland: Some Questions”, Blog post at Forbes.com. Available at http://www.forbes.com/sites/karlwhelan/2012/08/17/the-ecbs-secret-letter-to-ireland-some-questions/
Whelan, Karl (2012b). "ELA, Promissory Notes and All That: The Fiscal Costs of Anglo Irish Bank,” The Economic and Social Review, Volume 43, pages 653-673.
Whelan, Karl (2012c). “The ECB’s Role in Financial Assistance Programmes” Briefing paper for the European Parliament’s Economic and Monetary Affairs Committee. Available online at http://www.karlwhelan.com/EU-Dialogue/Whelan_June2012.pdf
44
Discussion Thomas Moutos Athens University of Economics and Business & CESifo
The paper by Karl Whelan provides a well-written and informative account of
Ireland’s recent macroeconomic performance and it draws useful conclusions regarding
the interpretation of facts and the post-2007 policy interventions (both at the national and
supranational level). Some of these conclusions, which are offered in contrast with
“common fallacies and misinterpretations of economic events”, are:
ii. Ireland’s economic performance was not built on an unsustainable credit
spree,
iii. by 2007, the growth-boosting factors of the previous decades were no longer
available,
iv. at the heart of (Irish) imbalances was an extraordinary housing boom,
v. it is not correct to blame Ireland’s fiscal austerity solely on bank bailouts,
vi. Irish policymakers may not have been able to do much about low interest
rates (set by ECB) , but they had the power to place limits on mortgage
lending or the exposure of individual financial institutions to property
development,
vii. the (Irish) government’s early blanket guarantee of banks’ liabilities played a
key role in limiting options to restructure insolvent banks in a way that would
have seen losses shared with private creditors,
viii. the decision to facilitate creditor withdrawals from Irish banks that had run out
of eligible collateral contributed to increasing the fiscal cost of the banking
crisis, but the ECB did not want to set a precedent – a position it abandoned in
the case of Cyprus.
45
The arguments offered in the paper in support of these conclusions are clear and
reasonable. The author notes that “… events in Ireland have commonly been used by in
international debates among economists, politicians and international organizations to
illustrate various preferred policy positions. However, often these arguments are based on
a weak understanding of the underlying macroeconomic facts about Ireland’s economy”.
I couldn’t agree more.
Nevertheless, I believe that the paper devotes insufficient attention to the fact that
the Irish economy is unique in many respects. For example, in 2011, net exports of goods
and services were about 25% of GDP, pharmaceutical exports were about 30% of
(nominal) GDP, the country was among the top 10 services exporters in the world, and
gross foreign debt was about 1000% of GDP. It would have been valuable to know more
about the extent to which the evolution of Ireland’s economic structure has been
intertwined with the country’s economic performance until 2007, and it would have been
even more valuable if there was a discussion of how the constellation of economic
structure and vested interests shaped the policies adopted to deal with the post-2007
crisis.
Let us consider the sources of Irish economic growth in the post-1987 period. The
paper notes the importance of demographic factors, i.e., that in the late 1980s only about
30 percent of the population was working (a very low percentage by OECD standards).
This was partly due to high unemployment rates, but it also reflected demographic and
social factors; most important amongst them was the low female labor force participation.
This meant that once the macroeconomic environment improved, changes in
social/cultural factors could unleash an almost infinitely elastic supply of labor to allow
the increased demand for labor to be translated in a huge increase in employment, from
1.1 million persons in the late 1980s to 2.1 million in 2007.
The author notes that by 2007 “… labor force participation and demographic
factors could no longer be called upon to generate large increases in the labor force…”
This is certainly true regarding demographic factors (see below) but I wonder whether it
is also the case as far as labor force participation rates are concerned. According to the
OECD database, the labor force participation rate for persons aged 15-64 was 72.7
46
percent in Ireland in 2007, while the corresponding numbers for countries belonging to
the “liberal” welfare states category as defined by Esping-Andersen (1990) were 76.2
percent for Australia, 76.5 percent for the UK, and 75.3 percent for the US. By this
measure, although Ireland had closed a large part of the gap regarding labor force
participation rates vis-à-vis its peers, there was still room for improvement. (The gap was
larger if the comparison is made vis-à-vis the “social-democratic” welfare states.) Thus, it
may be sensible to attribute only a small part of the (expected in 2007) collapse in the
growth potential of the Celtic Tiger to a tapering off of the increase in the labor force
participation rate.
The paper pays insufficient attention to the growth consequences of what is known
in the literature as the “demographic transition”, i.e., the movement from high rates of
mortality and fertility to low rates. Given that declines in infant mortality generally
precede declines in fertility the first part of this transition is characterized by large
cohorts of young people. When these cohorts reach working age they facilitate a
demographically-induced economic boost. Canning and Bloom (2003) have argued
persuasively about the importance of the changing population age distribution as a
facilitator for the determination of Irish macroeconomic performance. Their main
argument is that legalization of contraception in 1979 led to a decline in fertility, which in
turn led to a large rise in the share of working-age people in the population. Indeed, this
favorable development set Ireland apart from other Eurozone countries; according to
Eurostat, Ireland experienced a rise in the share of the working-age (15-64) population to
total population from 66.2 percent to 68.7 percent between 2001 and 2007, whereas the
corresponding numbers for the (average) of the 17 Eurozone countries showed a decline
from 67.2 to 66.7 percent during the same period.15 As the dependency ratio fell in
Ireland, opportunities for economic growth rose, creating the so-called “demographic
dividend”, which Ireland was able to exploit due to the temporal coincidence of other
growth-enhancing factors. Some of these factors relate to the quality of the country’s
institutional environment and the existence of a well-educated labor force; other factors,
15 By 2012, the share of working-age population to total population had dropped to 66.5 percent. Naturally, these fluctuations in the share of working-age population are interdependent with changes in net migration rates.
47
which are not featured in the paper relate to the country’s unique economic structure, to
which I now turn.
A distinguishing characteristic of Irish economic structure is the large presence of
multinational corporations (MNCs), initially attracted by the very low corporate tax rates
(zero initially, and 10% later) on manufacturing and some internationally traded
services.16 Ireland’s comparatively low corporate tax rate by advanced country standards
has encouraged the MNCs to use transfer pricing so as to declare a very high fraction of
their global profits in Ireland. These practices imply that apparent measures of labor
productivity (and its growth rate) can be distorted. For example, Murphy (2000) has
calculated that net output per employee in the 1990s for US owned firms located in
Ireland was 4.0 times higher than for Irish owned firms in computers, 4.5 times higher in
pharmaceuticals, 12.3 times higher in chemicals, and 22.8 times higher in cola
concentrates17. Given these extraordinary differences in measured labor productivity, one
can safely conclude that the reported growth in Irish labor productivity has, to some
extent, being an artifact of the tax strategies of the MNCs (Honohan and Walsh, 2002).
The above observations should not be interpreted as implying that Ireland’s
economic performance was not impressive during the twenty-year period up to 2007.
Using Gross Domestic Product (GDP) as the relevant measure, the growth rate per annum
from 1987 to 2007 was an impressive 6.4 percent, while the corresponding growth rate
for Gross National Income (GNI) – which corrects, inter alia, for the profits of foreign-
owned firms operating in Ireland - was still an impressive 6.0 percent. However, there
was a clear deceleration of the growth rate post-2000; whereas the GDP growth rate was
7.1 percent during 1987-2000, it fell to 5.1 percent from 2000 to 2007. One wonders how
large the drop would have been if housing construction did not accelerate from 50,000
house completions in 2000 (already being twice as large as the US the per-capita rate) to
16 Pressure by the European Commission resulted in an economy-wide corporate tax rate of 12.5 percent from 2003 onwards. 17 Another indication that recorded measures of value added in industries dominated by MNCs is affected by their tax strategies is provided by Honohan and Walsh (2002), who note that in 1999 the four-digit industry “other organic basic chemicals” had a share of labor in net output as low as 1.7 percent and a net output per worker as high as 2.5 million US dollars.
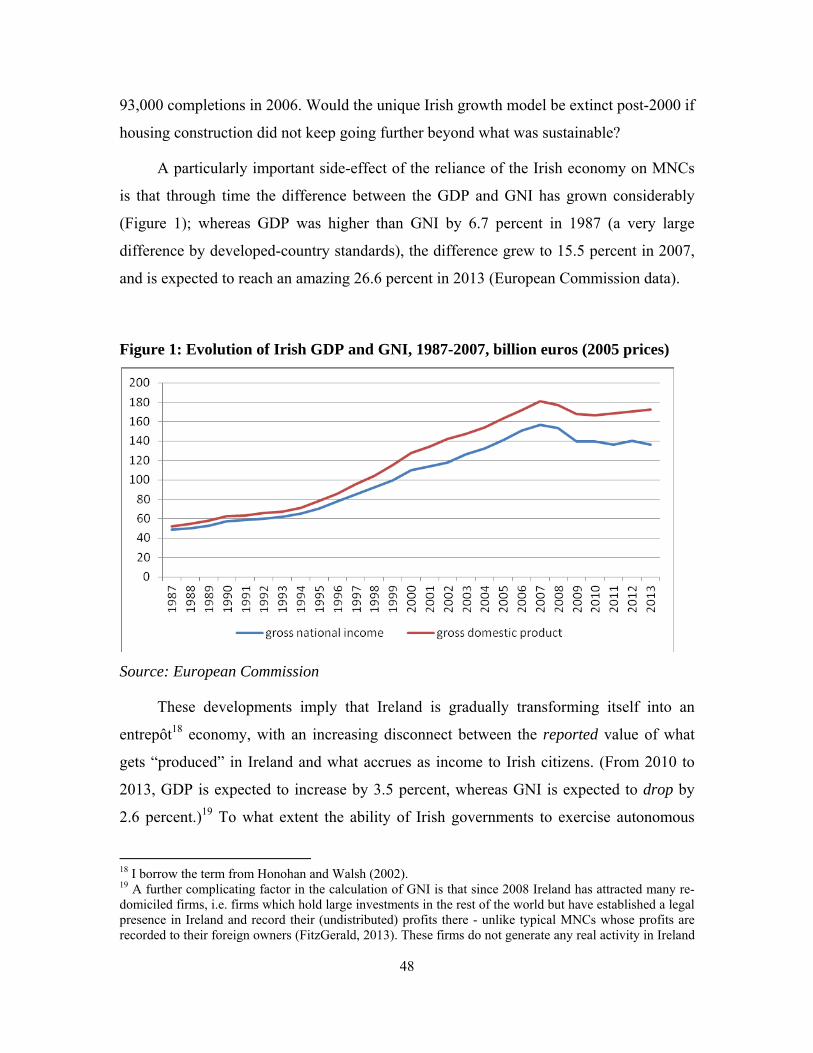
93,000 completions in 2006. Would the unique Irish growth model be extinct post-2000 if
housing construction did not keep going further beyond what was sustainable?
A particularly important side-effect of the reliance of the Irish economy on MNCs
is that through time the difference between the GDP and GNI has grown considerably
(Figure 1); whereas GDP was higher than GNI by 6.7 percent in 1987 (a very large
difference by developed-country standards), the difference grew to 15.5 percent in 2007,
and is expected to reach an amazing 26.6 percent in 2013 (European Commission data).
Figure 1: Evolution of Irish GDP and GNI, 1987-2007, billion euros (2005 prices)
Source: European Commission
These developments imply that Ireland is gradually transforming itself into an
entrepôt18 economy, with an increasing disconnect between the reported value of what
gets “produced” in Ireland and what accrues as income to Irish citizens. (From 2010 to
2013, GDP is expected to increase by 3.5 percent, whereas GNI is expected to drop by
2.6 percent.)19 To what extent the ability of Irish governments to exercise autonomous
18 I borrow the term from Honohan and Walsh (2002). 19 A further complicating factor in the calculation of GNI is that since 2008 Ireland has attracted many re-domiciled firms, i.e. firms which hold large investments in the rest of the world but have established a legal presence in Ireland and record their (undistributed) profits there - unlike typical MNCs whose profits are recorded to their foreign owners (FitzGerald, 2013). These firms do not generate any real activity in Ireland
48

49
economic policy has been hampered by the overwhelming presence of these footloose
foreign interests in the national economy?
Although it is clear that Ireland’s low corporate tax rate - with the effective tax rate
reportedly being as low as 2 percent in some cases - has played a major role in the
country’s growth trajectory, the paper offers no discussion as to the relative importance
of this factor for Ireland’s unique growth model. Such a discussion would be illuminating
since it would allow an appraisal of the conflicting interests between the Irish government
and the major lenders since the crisis erupted and during the negotiations regarding the
bailout agreement in 2010. For example, why did the Irish government implement an
inexplicably generous treatment of the foreign creditors of the banks that it has
effectively taken over? Did the Irish government cave-in to the strong and persistent
suggestions that the interests of those foreign creditors be protected (a position that
appears to have had the support of the European Central Bank) because it wanted to
protect its low-tax growth model (which was under attack by other EU countries)? Were
domestic vested interests in cahoots with foreign creditors, and the Irish government did
not perceive enough domestic political support to do what was “good for the Irish
people”? A discussion of the bargaining positions and interests of the key players within
a political-economy context would had being an important addition to this valuable paper.
in terms of employment or purchases of domestic inputs, yet their existence adds to both GDP and GNI. Thus, the presence of these firms makes the discrepancy between GDP and GNI to appear smaller than it actually is.
50
References
Bloom, D.E. and D. Canning (2003), “Contraception and the Celtic Tiger”, The Economic and Social Review, Vol. 34, No. 3, Winter, 2003, pp. 229–247
FitzGerald, J. (2013), “The Effect of Redomiciled Plcs on GNP and the Irish Balance of Payments”, ESRI Research Note 2013/1/2.
Honohan, P. and B. Walsh (2002), “Catching Up with the Leaders: The Irish Hare”, Brookings Papers on Economic Activity, 2002 (1), pp. 1-57.
Murphy, A. E. (2000), “The ‘Celtic Tiger’ – an Analysis of Ireland’s Economic Growth Performance”, EUI Working Papers, RSC No. 2000/16.
Special Conference Papers The Crisis in the Euro Area, May 23-24, 2013
14. Provopoulos George, “The Greek Economy and Banking System: Recent Developments and the Way Forward”, July 2013.
15. Constâncio Vítor, “The European Crisis and the Role of the Financial System”, July 2013.
16. Honkapohja Seppo, “The Euro Area Crisis: a View from the North”, including discussion by Dimitris Malliaropulos, July 2013.
17. Goodhart C.A.E., “Lessons for Monetary Policy from the Euro-Area Crisis”, including discussion by Gikas A. Hardouvelis, July 2013.
18. Bordo Michael and Harold James “The European Crisis in The Context of the History of Previous Financial Crises”, including discussion by Nicos Christodoulakis, July 2013.
19. Whelan Karl, “Ireland’s Economic Crisis: The Good, the Bad and the Ugly”, including discussion by Thomas Moutos, July 2013.
20. Gibson D. Heather, Hall G. Stephen, and Tavlas S. George, “Fundamentally Wrong: Market Pricing of Sovereigns and the Greek Financial Crisis”, including discussion by Elias Tzavalis and Thanasis Kazanas, July 2013.
21. De Grauwe Paul and Ji Yuemei, “How Much Fiscal Discipline in a Monetary Union?”, including discussion by George Hondroyiannis, July 2013.
22. Polito Vito and Wickens Michael, “How the Euro Crisis Evolved and How to Avoid Another: EMU, Fiscal Policy and Credit Ratings”, including discussion by Dimitrios Sideris, July 2013.
23. Azariadis Costas, “Credit Policy in Times of Financial Distress”, including discussion by Harris Dellas, July 2013.
24. Carneiro Anabela, Portugal Pedro and Varejão José, “Catastrophic Job Destruction during the Portuguese Economic Crisis”, including discussion by Daphne Nicolitsas, July 2013.
25. Eichengreen Barry, Jung Naeun, Moch Stephen and Mody Ashoka, “The Eurozone Crisis: Phoenix Miracle or Lost Decade?”, including discussion by Apostolis Philippopoulos, July 2013.
26. Reichlin Lucrezia, “Monetary Policy and Banks in the Euro Area: the Tale of Two Crises”, including discussion by Mike G. Tsonias, July 2013
27. Geanakoplos John, “Leverage, Default, and Forgiveness: Lessons from the American and European Crises”, including discussion by Nikos Vettas, July 2013.
28. Gibson D. Heather, Palivos Theodore, and Tavlas S. George., “The Crisis in the Euro Area: an Analytic Overview”, July 2013.