Bank of England, Tha Role of Macroprudential Policy
38
November 2009 The role of macroprudential policy A Discussion Paper
-
Upload
cliffordtorres -
Category
Documents
-
view
215 -
download
0
Transcript of Bank of England, Tha Role of Macroprudential Policy
8/20/2019 Bank of England, Tha Role of Macroprudential Policy
http://slidepdf.com/reader/full/bank-of-england-tha-role-of-macroprudential-policy 1/38
November 2009
The role of macroprudential policy
A Discussion Paper
8/20/2019 Bank of England, Tha Role of Macroprudential Policy
http://slidepdf.com/reader/full/bank-of-england-tha-role-of-macroprudential-policy 2/38
The Bank of England would welcome comments on, and criticisms of, the ideas expressed in this
paper. Comments should be sent to:
Victoria Saporta
Head of Prudential Policy Division
Bank of England
Threadneedle Street
London, EC2R 8AH
Or by email to: [email protected]
This paper was finalised on 19 November 2009.
© Bank of England 2009
ISSN 1754–4262
November 2009
The role of macroprudentialpolicy
A Discussion Paper
8/20/2019 Bank of England, Tha Role of Macroprudential Policy
http://slidepdf.com/reader/full/bank-of-england-tha-role-of-macroprudential-policy 3/38
Executive summary 3
1 Introduction 5
Box 1 The policy debate internationally 7
Box 2 Is dynamic provisioning sufficient to meet macroprudential objectives? 8
2 Possible objectives of macroprudential policy 9
2.1 What are the appropriate goals of macroprudential policy? 9
2.2 Microprudential, macroprudential and monetary policy 10
Box 3 How effective would monetary policy have been in stabilising the credit bubble? 11
3 The causes of systemic problems: financial frictions and propagation channels 12
3.1 Market failures 12
3.2 Propagation channels 13
4 Tools to manage aggregate risk 17
4.1 Systemic capital surcharges 17
4.2 Setting systemic capital surcharges 18
4.3 Complementary measures 19
Box 4 Calibrating time-varying capital surcharges 20
5 Tools to manage network risk 235.1 Institution-specific systemic capital surcharges 23
5.2 Complementary measures 23
Box 5 Calibrating cross-section systemic capital surcharges 25
6 Building a robust macroprudential regime 27
6.1 Rules versus discretion 27
6.2 Constraining discretion in a macroprudential regime 28
Box 6 Estimates of capital levels to weather crises 30
7 Operational issues 32
7.1 Institutional coverage 32
7.2 International scope 327.3 Data requirements 33
Box 7 Leakages in past regulations 34
8 Conclusion 35
References 36
Contents
8/20/2019 Bank of England, Tha Role of Macroprudential Policy
http://slidepdf.com/reader/full/bank-of-england-tha-role-of-macroprudential-policy 4/38
Discussion Paper November 2009 3
Executive summary
The global financial crisis has demonstrated the need for
fundamental reform of the financial system. The underlyingstructure of the international financial and monetary system is
being re-evaluated. Whatever its structure, the prudential
regulatory framework will need to be re-oriented to have a
system-wide focus. And improvements need to be made to
allow financial institutions to fail without imposing
unacceptable costs on the rest of society.
Working with UK Tripartite and international colleagues, the
Bank of England aims to contribute to each dimension of this
debate. A series of recent speeches by the Bank have
highlighted the importance of re-evaluating the structure of the financial system, improving the framework for financial
crisis management and resolution, and revisiting the
regulatory framework — in particular, the potential role for
macroprudential instruments.
In the run-up to the current crisis, there was a big build-up of
leverage and liquidity mismatches across the global financial
system. That left the system vulnerable to adverse changes in
the macroeconomic and market environment, and so sowed
the seeds of the present problems. One of the key challenges
is to re-orient prudential regulation towards risk across the
system as a whole — so-called systemic risk. This is the role
of macroprudential policy. In this discussion paper, the Bank
of England aims to contribute further to emerging ideas on
how macroprudential instruments might be designed and
deployed.
Macroprudential policy is a missing ingredient from the current
policy framework. In the past few decades, there has been too
great a gap between macroeconomic policy and the regulation
of individual financial institutions. If macroprudential policy
had been able to increase the resilience of the system and to
moderate exuberance in the supply of credit to the economy,
and especially to the financial system, the crisis would have
been less costly.
Financial stability is fundamentally concerned with
maintaining a stable provision of financial services to the wider
economy — payments services, credit supply, and insurance
against risk. This is the starting point for any macroprudentialpolicy instrument. It is possible to conceive of more ambitious
objectives, such as forestalling asset price bubbles. By
moderating exuberant increases in the supply of credit,
macroprudential policy might sometimes help to contain asset
bubbles. But it would be unrealistic to make the prevention of
asset bubbles a specific objective of the regulation of the
banking system.
Systemic risk has two principal sources. First, there is a strong
collective tendency for financial firms, as well as companies
and households, to overexpose themselves to risk in the
upswing of a credit cycle, and to become overly risk-averse in a
downswing. This has a variety of underlying causes, including a
perception that some financial institutions may be too
important to fail and herding in markets. Second, individual
banks typically fail to take account of the spillover effects of
their actions on risk in the rest of the financial network.
Macroprudential policy would ideally address both sources of
systemic risk.
This discussion paper examines whether it would be practical
to dampen cyclical overexuberance through a regime of capital
surcharges on top of prevailing microprudential capital ratios.These surcharges could be applied to headline capital
requirements or at a more disaggregated level (through
so-called ‘risk weights’ on particular types of exposure). The
sectoral approach might allow policy to be better targeted
at pockets of emerging exuberance, but would also entail
greater complexity. The appropriate level of disaggregation for
setting capital surcharges would need to be considered
carefully.
Increasing capital requirements in a credit boom would
generate greater systemic self-insurance for the system as a
whole and, at the margin, act as a restraint on overly
exuberant lending. Crucially, this mechanism could also
operate in reverse: lowering capital requirements in a bust
might provide an incentive for banks to lend and reduce the
The role of macroprudential policy
A discussion paper by the Bank of England.
8/20/2019 Bank of England, Tha Role of Macroprudential Policy
http://slidepdf.com/reader/full/bank-of-england-tha-role-of-macroprudential-policy 5/38
4 Discussion Paper November 2009
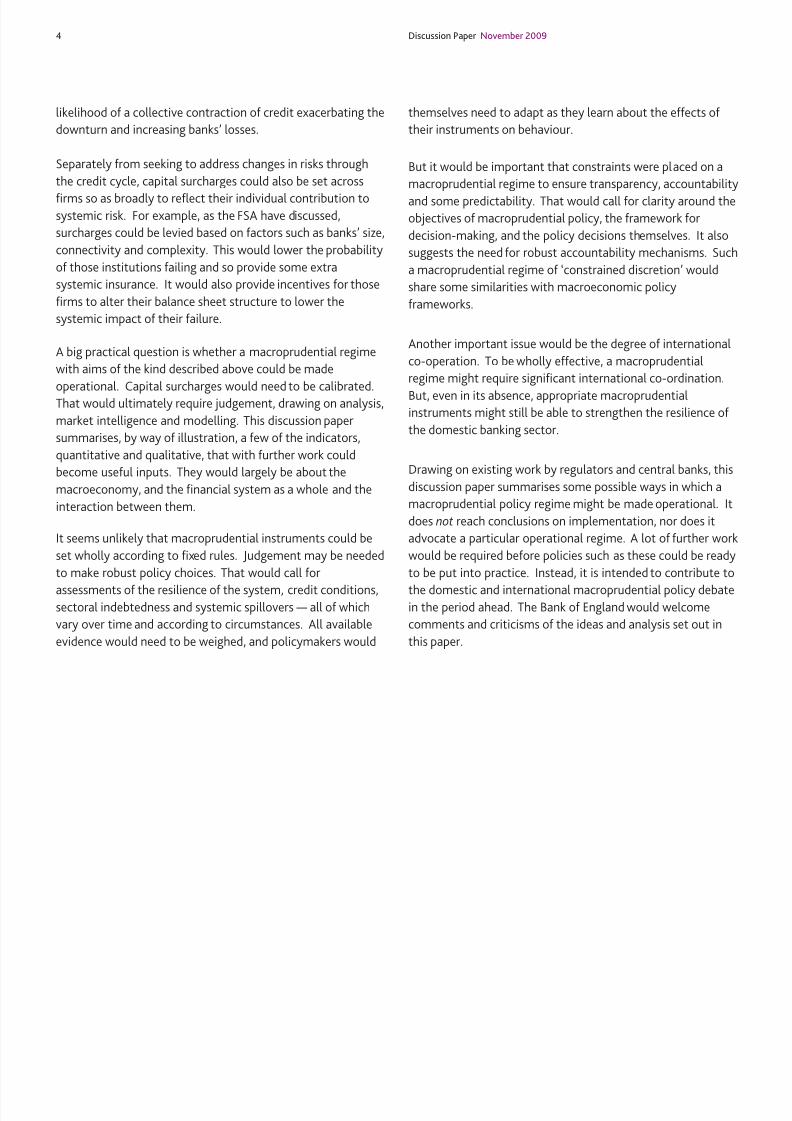
likelihood of a collective contraction of credit exacerbating the
downturn and increasing banks’ losses.
Separately from seeking to address changes in risks through
the credit cycle, capital surcharges could also be set across
firms so as broadly to reflect their individual contribution tosystemic risk. For example, as the FSA have discussed,
surcharges could be levied based on factors such as banks’ size,
connectivity and complexity. This would lower the probability
of those institutions failing and so provide some extra
systemic insurance. It would also provide incentives for those
firms to alter their balance sheet structure to lower the
systemic impact of their failure.
A big practical question is whether a macroprudential regime
with aims of the kind described above could be made
operational. Capital surcharges would need to be calibrated.That would ultimately require judgement, drawing on analysis,
market intelligence and modelling. This discussion paper
summarises, by way of illustration, a few of the indicators,
quantitative and qualitative, that with further work could
become useful inputs. They would largely be about the
macroeconomy, and the financial system as a whole and the
interaction between them.
It seems unlikely that macroprudential instruments could be
set wholly according to fixed rules. Judgement may be needed
to make robust policy choices. That would call for
assessments of the resilience of the system, credit conditions,sectoral indebtedness and systemic spillovers — all of which
vary over time and according to circumstances. All available
evidence would need to be weighed, and policymakers would
themselves need to adapt as they learn about the effects of
their instruments on behaviour.
But it would be important that constraints were placed on a
macroprudential regime to ensure transparency, accountability
and some predictability. That would call for clarity around theobjectives of macroprudential policy, the framework for
decision-making, and the policy decisions themselves. It also
suggests the need for robust accountability mechanisms. Such
a macroprudential regime of ‘constrained discretion’ would
share some similarities with macroeconomic policy
frameworks.
Another important issue would be the degree of international
co-operation. To be wholly effective, a macroprudential
regime might require significant international co-ordination.
But, even in its absence, appropriate macroprudentialinstruments might still be able to strengthen the resilience of
the domestic banking sector.
Drawing on existing work by regulators and central banks, this
discussion paper summarises some possible ways in which a
macroprudential policy regime might be made operational. It
does not reach conclusions on implementation, nor does it
advocate a particular operational regime. A lot of further work
would be required before policies such as these could be ready
to be put into practice. Instead, it is intended to contribute to
the domestic and international macroprudential policy debatein the period ahead. The Bank of England would welcome
comments and criticisms of the ideas and analysis set out in
this paper.
8/20/2019 Bank of England, Tha Role of Macroprudential Policy
http://slidepdf.com/reader/full/bank-of-england-tha-role-of-macroprudential-policy 6/38
Discussion Paper November 2009 5
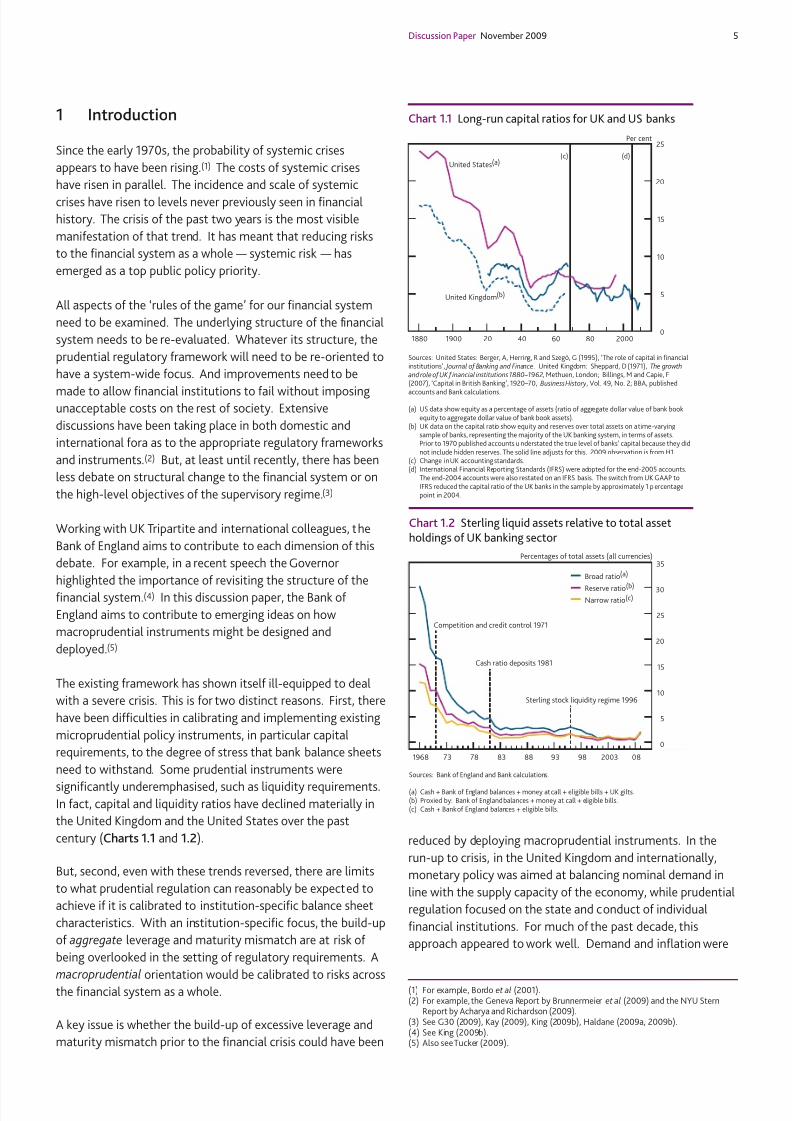
1 Introduction
Since the early 1970s, the probability of systemic crises
appears to have been rising.(1) The costs of systemic crises
have risen in parallel. The incidence and scale of systemic
crises have risen to levels never previously seen in financialhistory. The crisis of the past two years is the most visible
manifestation of that trend. It has meant that reducing risks
to the financial system as a whole — systemic risk — has
emerged as a top public policy priority.
All aspects of the ‘rules of the game’ for our financial system
need to be examined. The underlying structure of the financial
system needs to be re-evaluated. Whatever its structure, the
prudential regulatory framework will need to be re-oriented to
have a system-wide focus. And improvements need to be
made to allow financial institutions to fail without imposingunacceptable costs on the rest of society. Extensive
discussions have been taking place in both domestic and
international fora as to the appropriate regulatory frameworks
and instruments.(2) But, at least until recently, there has been
less debate on structural change to the financial system or on
the high-level objectives of the supervisory regime.(3)
Working with UK Tripartite and international colleagues, the
Bank of England aims to contribute to each dimension of this
debate. For example, in a recent speech the Governor
highlighted the importance of revisiting the structure of the
financial system.(4) In this discussion paper, the Bank of
England aims to contribute to emerging ideas on how
macroprudential instruments might be designed and
deployed.(5)
The existing framework has shown itself ill-equipped to deal
with a severe crisis. This is for two distinct reasons. First, there
have been difficulties in calibrating and implementing existing
microprudential policy instruments, in particular capital
requirements, to the degree of stress that bank balance sheets
need to withstand. Some prudential instruments were
significantly underemphasised, such as liquidity requirements.In fact, capital and liquidity ratios have declined materially in
the United Kingdom and the United States over the past
century (Charts 1.1 and 1.2).
But, second, even with these trends reversed, there are limits
to what prudential regulation can reasonably be expected to
achieve if it is calibrated to institution-specific balance sheet
characteristics. With an institution-specific focus, the build-up
of aggregate leverage and maturity mismatch are at risk of
being overlooked in the setting of regulatory requirements. A
macroprudential orientation would be calibrated to risks across
the financial system as a whole.
A key issue is whether the build-up of excessive leverage and
maturity mismatch prior to the financial crisis could have been
reduced by deploying macroprudential instruments. In the
run-up to crisis, in the United Kingdom and internationally,
monetary policy was aimed at balancing nominal demand in
line with the supply capacity of the economy, while prudential
regulation focused on the state and conduct of individual
financial institutions. For much of the past decade, this
approach appeared to work well. Demand and inflation were
(1) For example, Bordo et al (2001).(2) For example, the Geneva Report by Brunnermeier et al (2009) and the NYU Stern
Report by Acharya and Richardson (2009).(3) See G30 (2009), Kay (2009), King (2009b), Haldane (2009a, 2009b).(4) See King (2009b).(5) Also see Tucker (2009).
0
5
10
15
20
25
1880 1900 20 40 60 80 2000
Per cent
United Kingdom(b)
United States(a) (c) (d)
Chart 1.1 Long-run capital ratios for UK and US banks
Sources: United States: Berger, A, Herring, R and Szegö, G (1995), ‘The role of capital in financialinstitutions’, Journal of Banking and Finance. United Kingdom: Sheppard, D (1971), The growthand role of UK f inancial institutions 1880–1962, Methuen, London; Billings, M and Capie, F(2007), ‘Capital in British Banking’, 1920–70, Business History , Vol. 49, No. 2; BBA, published
accounts and Bank calculations.
(a) US data show equity as a percentage of assets (ratio of aggregate dollar value of bank bookequity to aggregate dollar value of bank book assets).
(b) UK data on the capital ratio show equity and reserves over total assets on a time-varyingsample of banks, representing the majority of the UK banking system, in terms of assets.Prior to 1970 published accounts u nderstated the true level of banks’ capital because they didnot include hidden reserves. The solid line adjusts for this. 2009 observation is from H1.
(c) Change in UK accounting standards.(d) International Financial Reporting Standards (IFRS) were adopted for the end-2005 accounts.
The end-2004 accounts were also restated on an IFRS basis. The switch from UK GAAP toIFRS reduced the capital ratio of the UK banks in the sample by approximately 1 p ercentagepoint in 2004.
0
5
10
15
20
25
30
35
1968 73 78 83 88 93 98 2003 08
Broad ratio(a)
Reserve ratio(b)Narrow ratio(c)
Percentages of total assets (all currencies)
Competition and credit control 1971
Cash ratio deposits 1981
Sterling stock liquidity regime 1996
Chart 1.2 Sterling liquid assets relative to total assetholdings of UK banking sector
Sources: Bank of England and Bank calculations.
(a) Cash + Bank of England balances + money at call + eligible bills + UK gilts.(b) Proxied by: Bank of England balances + money at call + eligible bills.(c) Cash + Bank of England balances + eligible bills.

8/20/2019 Bank of England, Tha Role of Macroprudential Policy
http://slidepdf.com/reader/full/bank-of-england-tha-role-of-macroprudential-policy 7/38
6 Discussion Paper November 2009
stable and there were very few failures of individual financial
institutions. But over that period global banks’ balance sheets
doubled, while UK banks’ balance sheets rose threefold. Latent
financial vulnerabilities emerged and financial exuberance took
hold. Leverage and connectivity within the financial system
increased rapidly and parts of the real economy borrowed toomuch. With no set of instruments or institution charged with
tempering this exuberance, the party grew more raucous. The
credit crisis of the past two years has exposed those
vulnerabilities.
As Box 1 outlines, various international bodies are currently
discussing ways of reforming the prudential framework to
improve the resilience of the financial system. These have
focused so far on the appropriate definition of the prudential
minimum for risk-based capital, leverage and liquidity
requirements; on how to reduce procyclicality in minimumregulatory requirements; and on policies that encourage
earlier provisioning for losses. Recently, there have been a
number of initiatives aimed explicitly at developing
macroprudential instruments.
This paper extends the debate to macroprudential policy
more generally, including whether discretionary policy could
usefully complement a set of rules. The paper is organised as
follows. Section 2 discusses the potential objectives of
macroprudential policy and considers how macroprudential
policy might sit alongside microprudential and
macroeconomic policy.
In exploring possible macroprudential instruments, a natural
starting point is the set of market failures and channels
through which systemic risk arises in the first place (Section 3).
These provide not only the rationale for macroprudential
policy, but also help identify the kind of instruments that may
be best suited to tackling the different underlying sources of
systemic risk.
Section 4 considers possible instruments for enhancing
systemic resilience of the banking system and moderating
shifts in the supply of credit over the credit cycle, while
Section 5 considers instruments for reducing variations in
systemic risk across institutions. Credit cycles and financial
network spillovers have long existed. And the possible
instruments for addressing these problems are also not
entirely new — for example, countercyclical or systemicallyoriented regulatory ratios. The key is to try to embed those
instruments within a coherent, practical regime.
Section 6 considers some of the possible building blocks for
making such a macroprudential regime operational. It outlines
specific measures to increase its transparency and
predictability. Transparency enhances accountability. Making
decision-makers accountable externally for their actions
might also sharpen significantly their incentives to act.
Accountability also provides legitimacy for policies that would
affect the quantity and allocation of credit supplied to theeconomy and so could be challenged, especially at peaks and
troughs in the credit cycle.
Finally, Section 7 discusses some operational challenges in
implementing a macroprudential regime of the kind described,
in particular the potential scope of such a regime in terms of
institutional coverage and international application and
co-operation. To be wholly effective, a macroprudential
regime might need to complement strong national
accountability with a significant degree of international
regulatory co-operation and information sharing.
Too much should not be expected of regulation. It would be
unrealistic and probably undesirable for regulation to seek to
eliminate financial failures. This paper is not intended to
advocate a particular macroprudential framework, nor to
provide all of the operational detail that would be necessary to
implement one. Rather the aim is to contribute to the debate
on how the authorities might further re-orient their regulatory
efforts to lower the incidence and cost of future systemic
crises.

8/20/2019 Bank of England, Tha Role of Macroprudential Policy
http://slidepdf.com/reader/full/bank-of-england-tha-role-of-macroprudential-policy 8/38
Discussion Paper November 2009 7
Box 1
The policy debate internationally
This box summarises briefly international initiatives aimed at
improving the prudential regulation of banks.
The Basel Committee on Banking Supervision (BCBS) has
embarked on an ambitious work programme to improve
minimum prudential standards. In particular, the Committee
is developing proposals that will improve the risk-capture of
capital requirements across banks’ trading and commercial
banking activities; improve the quality of capital; introduce a
leverage ratio as a backstop; and develop, for the first time, an
international liquidity standard.
One key dimension of the policy debate is the appropriate
level of equity capital in the financial system. It is commonlybelieved that raising additional equity capital is costly for the
banking system and would reduce levels of intermediation.
But a higher equity share in the capital structure of a firm need
not necessarily imply a higher cost of funding for the banking
system because of the reduced risk and hence cost of debt
finance arising from lower levels of leverage.(1)
Moreover, some of the reasons given for why higher equity
capital could conceivably raise the average cost of capital —
such as expectations of government support to protect bank
debt holders — are themselves distortions. Removing themwould potentially increase the attraction of raising equity. At
the same time, there may be some frictions in financial
markets that are not so easily removed and which may raise
the costs of issuing equity. Against this background, it is clear
that further evidence is needed on the costs and benefits of a
material increase in required equity capital for the banking
system. A recent discussion paper published by the Financial
Services Authority (FSA) provides a useful starting point.(2)
A second key dimension of the international debate is
mitigating any procyclicality in regulatory requirements.
Undesired cyclicality in regulatory ratios can be caused by the
use of static (‘point-in-time’) estimates of probability of
default, which tend to fall in an upturn and rise in a recession.
The BCBS has developed methodology to track the extent of
this cyclicality, which it has begun to apply. Any excessive
procyclicality could be reduced by using longer-run averages of
default probabilities (‘through-the-cycle’). For example, in its
implementation of the Basel II framework during the crisis, the
FSA has introduced measures which attempt to mimic this
smoothing effect.
Another means of mitigating procyclicality in themicroprudential regime might be to allow firms to make
general provisions against expected future losses as well as
incurred losses. The accounting profession is moving in this
direction with the recent publication by the International
Accounting Standards Board (IASB) of its proposals for
replacing the current incurred loss impairment methodology
with an expected loss (or cash-flow) approach.(3) The BCBS is
working closely with accounting standard setters to helpimprove banks’ incentives to set aside provisions against
expected losses. Broadly speaking, a similar principle
underpins the so-called ‘dynamic provisioning’ policy which
has operated in Spain for some time, although there are also
some important differences (Box 2).
All of these initiatives aim to increase the resilience and reduce
the procyclical tendencies of individual institutions. None of
them, however, aim to lean against credit exuberance by
acting in a forward-looking countercyclical fashion, or to offset
risks arising from complex interconnections within thefinancial system.
More recently, the Basel Committee has developed a work
programme to design capital buffers above regulatory
minimum requirements that will be built up during credit cycle
upswings to be drawn down during downswings. The Financial
Stability Board and the BCBS are also developing proposals to
address the ‘too-big-to-fail’ problem, which include assessing
the merits of capital surcharges applied to these institutions.
These efforts are consistent with calls from the G20 for
stronger regulation and oversight of such firms.(4) The UK
authorities support these initiatives, which are due to reportnext year.
(1) In an economy with no frictions and with no distortionary taxation, it can be shown
that the weighted average cost of capital is invariant to the choice of capitalstructures (Modigliani and Miller (1958)).(2) FSA (2009b).(3) See International Accounting Standards Board (2009).(4) See www.g20.org.

8/20/2019 Bank of England, Tha Role of Macroprudential Policy
http://slidepdf.com/reader/full/bank-of-england-tha-role-of-macroprudential-policy 9/38
8 Discussion Paper November 2009
Box 2
Is dynamic provisioning sufficient to meet
macroprudential objectives?
There has been considerable recent interest in the regulatoryregime of ‘dynamic provisioning’ introduced by the Spanish
authorities in 2000. This is a rule-based scheme that requires
banks to build up buffers of general provisions (also referred to
as ‘dynamic’ or ‘statistical’ provisions) against performing
loans in an upturn, which can then be drawn down in a
recession. Under the Spanish system, general provisions are
intended to complement specific provisions made against
loans which already show signs of impairment.
To see how the system works, consider the following stylised
example. When a bank in Spain extends a mortgage, it must
set aside a provision consistent with the historical loss
experience of that type of lending, even though the particular
mortgage itself may show no current sign of impairment. By
using long-run historical losses, general provisions are
intended to counter the natural procyclicality of specific
provisions, ensuring smoother total provisions over the cycle
(Chart A). In this way, dynamic provisions can contribute
towards making the banking sector more resilient to expected
losses and as a result less cyclical. By contrast, the role of
macroprudential instruments would be to increase the
resilience of the financial system to unexpected losses and be
countercyclical by design.
Dynamic provisioning is essentially a rule for setting aside
reserves based on stocks and flows of credit. The parameters
of the Spanish rule have been fixed since 2004 and were
calibrated to capture average historical incurred losses (a
proxy for long-run expected loss) in different lending sectors.As a fixed, backward-looking rule based on historical losses,
the scheme is not designed to respond to financial shocks in a
flexible way. For example, a backward-looking regime, by
definition, cannot distinguish between credit demand and
supply shocks.
Experience in Spain has shown that dynamic provisioning does
little to smooth the supply of credit. As Chart B illustrates,
since the introduction of dynamic provisioning in 2000 the
ratio of private credit to GDP in Spain has more than doubled,
growing at a faster rate than in the United Kingdom,
United States, Switzerland and Germany. But Spanish dynamic
provisions may have contributed towards increasing the
resilience of the Spanish banking sector, forcing banks to build
up buffers against particular types of lending.
Dynamic provisioning as currently implemented in Spain
applies only to exposures held in the banking book. It does not
capture exuberance in other parts of the balance sheet, such as
trading book holdings of securitised products.
Specific provisions as a percentage of total loansGeneral provisions as a percentage of total loans
Total provisions as a percentage of total loans
Per cent of total loans
Time
Upswing Downturn
0
Chart A Dynamic provisioning: a stylised illustration
0.0
0.5
1.0
1.5
2.0
2.5
1960 64 68 72 76 80 84 88 92 96 2000 04
Ratio
United Kingdom
Germany
Spain
United States
Switzerland
Chart B Ratio of private credit to GDP in selectedcountries(a)
Source: World Bank.
(a) Private credit defined as claims on the private sector by deposit money banks and otherfinancial institutions. It excludes credit issued to governments and public enterprises. Theratio is designed to measure the activity of financial intermediaries in channelling savings toinvestors. Measured on a real (deflated) basis.

8/20/2019 Bank of England, Tha Role of Macroprudential Policy
http://slidepdf.com/reader/full/bank-of-england-tha-role-of-macroprudential-policy 10/38
Discussion Paper November 2009 9
2 Possible objectives of macroprudential
policy
What could macroprudential policies reasonably expect to
achieve and, as importantly, not achieve? And how wouldthose goals relate to microprudential and macroeconomic
policy?
2.1 What are the appropriate goals of macroprudential policy?
In general terms, the goal of financial stability policies should
be the stable provision of financial intermediation services to
the wider economy — payment services, credit intermediation
and insurance against risk. They should seek to avoid the type
of boom and bust cycle in the supply of credit and liquidity
that has marked the recent financial crisis. Tighter regulatory
standards raise the cost of financial intermediation, soreducing the availability of credit to at least some households
and companies. The benefits of a less volatile supply and cost
of credit thus need to be weighed against these potential
losses.(1)
There has been recent debate about whether the objectives of
macroprudential policy are better cast in terms of ensuring the
resilience of the financial system over time — ‘protecting banks
from the cycle’ — or ensuring stability in the supply of credit to
the wider economy — ‘protecting the real economy from the
banks’. This may be too stark a distinction, as the resilience of the banking system affects the supply of credit, which in turn
affects the economic conditions influencing loan delinquencies
and defaults.
During upswings, the objective of dampening the credit
cycle is typically well aligned with ensuring the financial
system is robust and resilient. Tightening capital and/or
liquidity requirements in an upswing would tend to encourage
financial institutions to check growth in their balance sheets,
so increasing the future resilience of the banking system. In
these situations, resilience of the financial system is likely toreinforce the macroeconomic objective of stabilising the
supply of credit and its cost.
At times of collapse in credit and asset prices, such as
during the current crisis, however, the goal of maintaining
the provision of credit might appear to jar with narrowly
prudential objectives over a short horizon. A prudential
policymaker concerned only with the safety and soundness
of individual financial institutions might tend to push for
conservative lending policies. But a macroprudential
perspective would give weight to the prospect that, for the
system as a whole, excessively conservative lending policies
could prove counterproductive by weakening economic
activity, raising loan defaults and impairing the capital of
banks. In these circumstances, the primary role of
macroprudential policy would be maintaining a continuing
flow of lending by allowing buffers of regulatory capital built
up during the upswing to be drawn down. In this capacity,
macroprudential policy would be helping to temper the credit
cycle.
At the same time, there are clear limitations on the extent to
which prudential policy can moderate the credit cycle. For
example, with free capital mobility and cross-border lending, it
is generally not possible to control tightly the overall quantum
of domestic credit. At times, regulatory requirements may be
a weak instrument for controlling credit — for example, at the
peak of the boom (when banks tolerate raising new capital)
and in the trough of a recession (when those funding banks
may not permit a cut in capital ratios).
These limitations of macroprudential policy would be evenmore acute if the goal were instead to moderate asset price
bubbles or financial imbalances more broadly. To the extent
that fluctuations in credit supply contribute to — or indeed
finance — bubbles and imbalances, macroprudential policies
may help moderate them. Exuberance would, to a degree, be
choked off at source. But sometimes bubbles and imbalances
are not associated strongly with shifts in (bank) credit supply.
Macroprudential tools are likely to be ineffective in these
circumstances.
The ‘dotcom’ bubble in the early part of this decade may
provide a good example of this. It was inflated largely byoverexuberance among equity investors and entrepreneurs.
And it was not financed, in the main, by bank credit. As a
result, deflation of the dotcom bubble — while having a
significant impact on wealth and aggregate demand growth —
occurred without material adverse consequences for the
banking system as a whole. By contrast, the wave of defaults
that followed the bursting of the telecoms bubble could have
affected banking system stability.(2)
Finally, it is clear that there are some economic developments
which macroprudential policy should not seek to offset. Forexample, credit would tend to expand following a fall in global
real interest rates. To the extent that such falls in the global
cost of capital were sourced in developments in the real
economy — for example, greater savings in Asia — the effect
on credit should not be offset by macroprudential policy. The
same principle applies to other, productivity-related, increases
in credit demand. But macroprudential policy may sometimes
need to choke off an expansion of indebtedness whose roots
were warranted by economic fundamentals, but subsequently
overshot.
(1) Recent analysis by the National Institute of Economic and Social Research provides auseful first-pass attempt at calibrating this trade-off — see FSA (2009b).
(2) See Bank of England (2000).
8/20/2019 Bank of England, Tha Role of Macroprudential Policy
http://slidepdf.com/reader/full/bank-of-england-tha-role-of-macroprudential-policy 11/38
10 Discussion Paper November 2009
2.2 Microprudential, macroprudential and monetary
policy
Although there would be overlaps with both microprudential
and monetary policy, the role and objectives of
macroprudential policy would be distinct. The goal of
monetary policy is to stabilise the aggregate price of goodsand services in the economy. The macroprudential objective of
ensuring the resilience of the financial system as a whole in
order to maintain a stable supply of financial intermediation
services across the credit cycle is complementary to this
objective, but not the same.
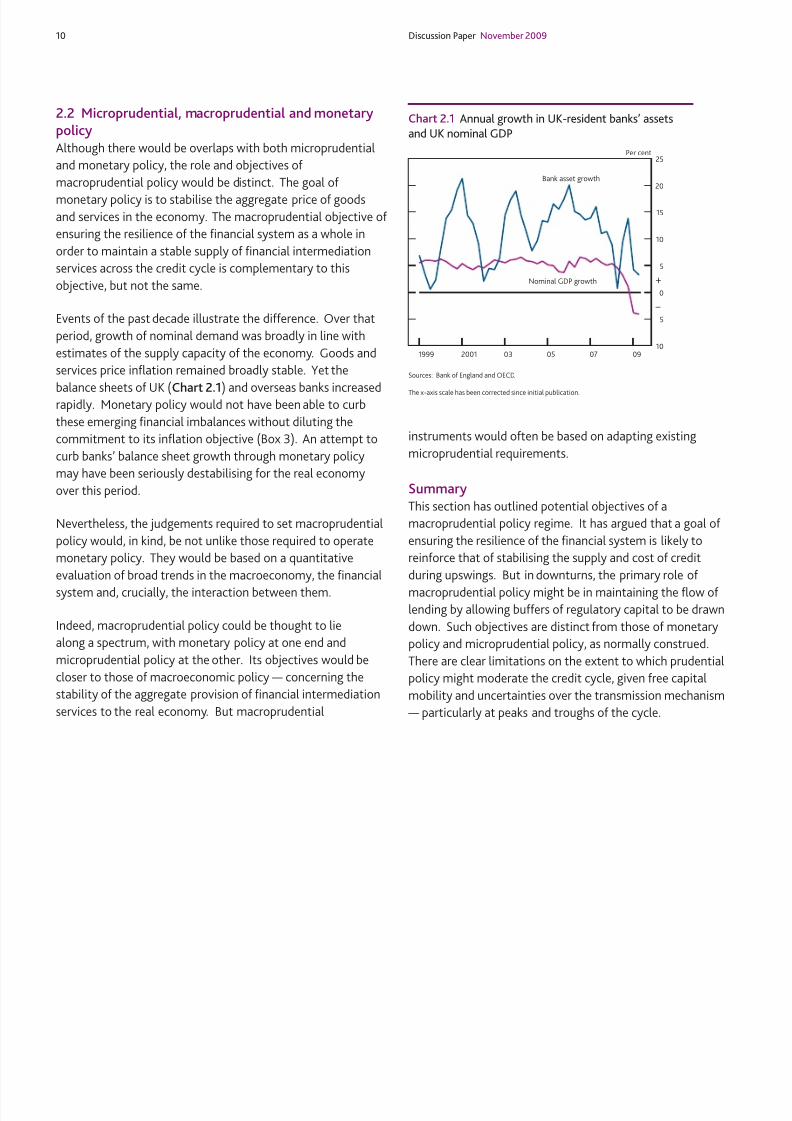
Events of the past decade illustrate the difference. Over that
period, growth of nominal demand was broadly in line with
estimates of the supply capacity of the economy. Goods and
services price inflation remained broadly stable. Yet the
balance sheets of UK (Chart 2.1) and overseas banks increasedrapidly. Monetary policy would not have been able to curb
these emerging financial imbalances without diluting the
commitment to its inflation objective (Box 3). An attempt to
curb banks’ balance sheet growth through monetary policy
may have been seriously destabilising for the real economy
over this period.
Nevertheless, the judgements required to set macroprudential
policy would, in kind, be not unlike those required to operate
monetary policy. They would be based on a quantitative
evaluation of broad trends in the macroeconomy, the financial
system and, crucially, the interaction between them.
Indeed, macroprudential policy could be thought to lie
along a spectrum, with monetary policy at one end and
microprudential policy at the other. Its objectives would be
closer to those of macroeconomic policy — concerning the
stability of the aggregate provision of financial intermediation
services to the real economy. But macroprudential
instruments would often be based on adapting existing
microprudential requirements.
Summary
This section has outlined potential objectives of a
macroprudential policy regime. It has argued that a goal of
ensuring the resilience of the financial system is likely to
reinforce that of stabilising the supply and cost of credit
during upswings. But in downturns, the primary role of
macroprudential policy might be in maintaining the flow of lending by allowing buffers of regulatory capital to be drawn
down. Such objectives are distinct from those of monetary
policy and microprudential policy, as normally construed.
There are clear limitations on the extent to which prudential
policy might moderate the credit cycle, given free capital
mobility and uncertainties over the transmission mechanism
— particularly at peaks and troughs of the cycle.
1999 2001 03 05 07 09
Nominal GDP growth
Bank asset growth
Per cent
10
5
0
5
10
15
20
25
+
–
Chart 2.1 Annual growth in UK-resident banks’ assets
and UK nominal GDP
Sources: Bank of England and OECD.
The x-axis scale has been corrected since initial publication.

8/20/2019 Bank of England, Tha Role of Macroprudential Policy
http://slidepdf.com/reader/full/bank-of-england-tha-role-of-macroprudential-policy 12/38
Discussion Paper November 2009 11
Box 3
How effective would monetary policy have
been in stabilising the credit bubble?
It is sometimes argued that the remit of central banks shouldbe modified to take greater account of movements in asset
prices or economic imbalances that threaten attainment of the
inflation target, even if those risks may not materialise for
several years. The remit given to the Monetary Policy
Committee provides latitude for policy to respond to such
medium term risks to the extent that they affect inflation and
output prospects.(1) In this box, we consider some of the
practical difficulties monetary policy might face in reacting to
financial imbalances.
Three arguments suggest that short-term interest rates may
be ill-suited to such an objective. First, it is unclear what
impact a rise in short-term interest rates would have on the
risk-taking propensity of the financial system. In normal times,
the impact of monetary policy on asset prices is a key
component of the transmission mechanism. But the impact of
short-term, risk-free interest rates on financial prices and
quantities is at best uncertain when risk premia are adjusting
rapidly, whether upwards or downwards. In these
circumstances, risk-free rates may be an ineffective instrument
for influencing risk-taking behaviour and risk premia.(2)
Second, in the run up to the present crisis monetary policywould probably have needed to slow materially money
spending in the economy, below that consistent with meeting
the inflation target, to quell growth in banks’ balance sheets.
This would have generated lower output relative to trend and
higher unemployment over this period. Those losses could
have been large if risk choices were relatively insensitive to
movements in short-term interest rates.(3)
To illustrate, Chart A shows counterfactual paths for interest
rates generated by adding a measure of the ‘gap’ in asset
prices from their trend to a standard Taylor rule.(4) The range
of paths is generated by varying the coefficient on this asset
price gap within an arbitrary range of 0 to 0.5. This is no more
than an illustrative exercise — for example, it makes no
attempt to account for the feedback effect of interest changes
on asset prices. Nonetheless, the chart illustrates that interest
rates may need to have been set at a materially higher level to
offset asset price inflation, potentially destabilising the real
and nominal economy.
A recent analysis by the IMF (2009) explores the economic
costs of assigning monetary policy the task of leaning
against credit market disturbances. Simulation resultsfrom a structural macroeconomic model suggest that —
in the absence of macroprudential instruments — a
stronger-than-usual reaction of monetary policy to signs of
credit market overheating is needed to reduce macroeconomic
volatility. But given a full set of instruments, the optimal
policy response would assign macroprudential instruments(5)
the task of dampening credit shocks, leaving monetary policy
to focus on inflation and real output.
Third, the strategy of using interest rates to lean against asset
bubbles risks de-anchoring the private sector’s expectations of
inflation. Persistent deviations of inflation from target may
make the central bank’s commitment to return inflation to
target in the medium term more challenging.(6) This
underscores the importance of developing tools to target
financial imbalances and lending exuberance at source.
(1) See Dale (2009).(2) See Kohn (2008).(3) See Bean (2009) and Dale (2009).(4) A Taylor rule is an equation linking interest rates to the deviation of inflation from
target and to the level of the output gap. Such rules have been shown to provide aconvenient description of actual movements in interest rates. And, under somecircumstances, they provide a useful normative guide. For this reason, Taylor rules are
a widely used benchmark in the monetary policy literature.(5) The model is insufficiently rich to specify the nature of these tools explicitly (banksare not explicitly modelled, for example). Rather, it is assumed that the policymakerhas access to an instrument which affects credit spreads directly.
(6) See Carney (2009).
0
2
4
6
8
10
12
14
16
18
20
2000 02 04 06 08
Per centBank Rate
Standard Taylor rule(c)Swathe of ‘augmented’ Taylor rules(b)
Inflation target switch from RPIX to CPI
Chart A Taylor rule with feedback from an asset pricegap(a)
Source: Bank calculations.
(a) Output gap measured as the deviation of log(GDP) from an HP filter trend. Asset price gapmeasured as the deviation of a real asset price index from a linear trend.
(b) Light blue area generated by varying the weight on the asset price gap between 0 and 0.5.(c) Weights on deviations from the inflation target and on the output gap set at 1.5 and 0.5
respectively.

8/20/2019 Bank of England, Tha Role of Macroprudential Policy
http://slidepdf.com/reader/full/bank-of-england-tha-role-of-macroprudential-policy 13/38
12 Discussion Paper November 2009
3 The causes of systemic problems:
financial frictions and propagation channels
In debating whether and how prudential regulation — and
internationally, the ‘rules of the game’ for the financial system
— should be re-oriented to focus on systemic risk, a natural
starting point is an assessment of the sources of systemic risk.
Risk, by itself, is neither bad nor avoidable. But past and
present crises have revealed a range of distortions which might
result in risk across the financial system rising above its socially
optimal level.
3.1 Market failures
Instances of market failure typically stem from three
underlying sources: incentives; information; and
co-ordination:
• Incentive problems can arise as an unintended consequence
of public policy, as in the case where insurance distorts
risk-taking incentives. They can also arise for institutional
reasons, such as limited liability.
• Information frictions cause markets to fail when buyers
doubt the quality of assets (adverse selection) or when
principals cannot perfectly observe the actions of their
agents (moral hazard). A large body of evidence also
suggests that people may not process information in a fully
rational way.(1)
• Co-ordination or ‘free rider’ problems also distort individual
incentives to act. Collective action may be in the interests
of each member of a group, but in the absence of a means
of co-ordinating this equilibrium may be unachievable.
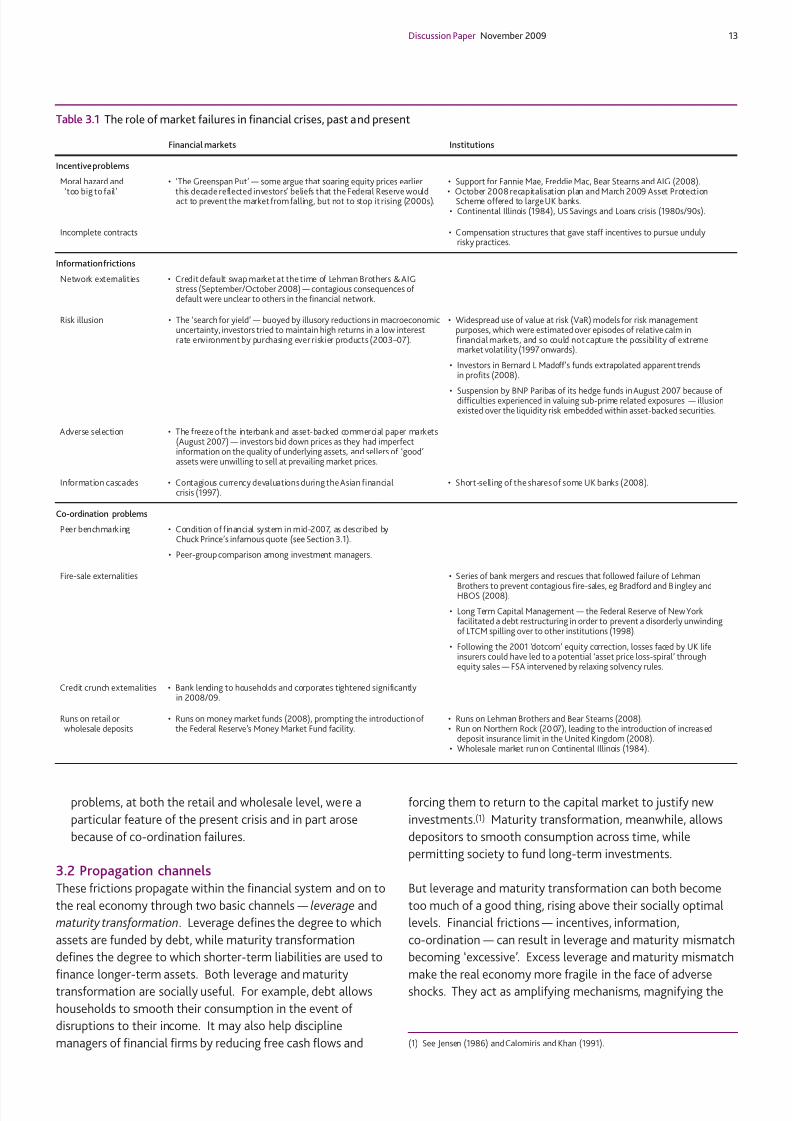
The history of financial crises provides a number of examples
of these market failures (Table 3.1). Incentive problems are
widely believed to have contributed to excessive risk-taking in
the run-up to the crisis, including through:
• Moral hazard arising from explicit or implicit guarantees of
official sector support offered to state-regulated financialinstitutions. Expectations of an official safety net
potentially contributed to the underpricing of risk among
financial institutions, perhaps especially among those
deemed too big or important to fail.(2) Similarly, incentives
of investors to monitor risk were distorted by the belief that
macroeconomic policy would insure against future tail risks.
• Financial contracts typically limit the downside risk borne
by shareholders and managers due to limited liability. This
generates an incentive for both to take big risks in order to
try to generate big returns. Strategies pursued by banks in
the run-up to the crisis amplified asymmetries in these
pay-offs. They included higher leverage, larger trading
books and writing of deep out-of-the-money options on
illiquid financial instruments.(3)
Information frictions also featured prominently in the run-up
to the crisis, including via:
• Network externalities which arise when agents in a financial
system do not have the information necessary to determine
the risks to which they are exposed. For example, thecontagious consequences of one firm failing may be opaque
to others in the financial network.
• Risk illusion, or disaster myopia, which can occur when
financial investors collectively underestimate the
probability of adverse scenarios following a period of
relative stability.(4) Misperceptions of risk are widely
believed to have underpinned the historically low
compensation that investors required to hold risky assets in
the run-up to the crisis — the so-called ‘search for yield’.
This phenomenon has behavioural parallels with theconcept of money illusion in a monetary policy context.
Co-ordination problems can generate financial instabilities
such as booms, bank runs, asset fire sales, credit crunches and
(market and funding) liquidity problems, all of which have
been evident during the present crisis:
• The performance of individuals or firms within the financial
sector is often judged relative to peer or industry
benchmarks.(5) This relative-return benchmarking generates
incentives to mimic others’ risk-taking behaviour to
maintain returns, even though it may be in no-one’slong-run interest to do so.(6) The comments of Chuck
Prince, former CEO of Citigroup, in July 2007 captured this
co-ordination failure during the present crisis.(7)
• In the face of solvency concerns, banks may seek to reduce
their balance sheet by selling legacy assets or constraining
new lending. While individually rational, collectively this
risks generating a worse outcome for everyone — for
example, because a fire sale of assets impairs market
liquidity and drives down asset prices, or because restricting
new lending generates a credit crunch for the real economy.Both have been a feature of the crisis.
• The simplest model of a bank run arises because depositors
lack a means of co-ordinating their actions. As long as there
is a first-come-first-served advantage, there will be an
incentive for depositors to be first in the queue.(8) This same
dynamic applies to wholesale depositors. Funding liquidity
(1) See Rabin (1998).(2) See Farhi and Tirole (2009), Calomiris (2009).(3) See Alessandri and Haldane (2009).(4) These effects receive prominent attention in classic studies by Minsky (1986) and
Kindleberger (1978). See also Haldane (2009a), King (2009a) and Tucker (2009).(5) Scharfstein and Stein (1990).(6) See Tucker (2009).(7) ‘When the music stops, in terms of liquidity, things will be complicated. But as long
as the music is playing, you’ve got to get up and dance. We’re still dancing’,FinancialTimes, 9 July 2007.
(8) See Diamond and Dybvig (1983).
8/20/2019 Bank of England, Tha Role of Macroprudential Policy
http://slidepdf.com/reader/full/bank-of-england-tha-role-of-macroprudential-policy 14/38
Discussion Paper November 2009 13
problems, at both the retail and wholesale level, were a
particular feature of the present crisis and in part arose
because of co-ordination failures.
3.2 Propagation channels
These frictions propagate within the financial system and on to
the real economy through two basic channels — leverage and
maturity transformation. Leverage defines the degree to which
assets are funded by debt, while maturity transformation
defines the degree to which shorter-term liabilities are used to
finance longer-term assets. Both leverage and maturity
transformation are socially useful. For example, debt allows
households to smooth their consumption in the event of
disruptions to their income. It may also help discipline
managers of financial firms by reducing free cash flows and
forcing them to return to the capital market to justify new
investments.(1) Maturity transformation, meanwhile, allows
depositors to smooth consumption across time, while
permitting society to fund long-term investments.
But leverage and maturity transformation can both become
too much of a good thing, rising above their socially optimal
levels. Financial frictions — incentives, information,
co-ordination — can result in leverage and maturity mismatch
becoming ‘excessive’. Excess leverage and maturity mismatch
make the real economy more fragile in the face of adverse
shocks. They act as amplifying mechanisms, magnifying the
Table 3.1 The role of market failures in financial crises, past and present
Financial markets Institutions
Incentive problems
Moral hazard and • ‘The Greenspan Put’ — some argue that soaring equity prices earlier • Support for Fannie Mae, Freddie Mac, Bear Stearns and AIG (2008).
‘too big to fail’ this decade reflected investors’ beliefs that the Federal Reserve would • October 2008 recapitalisation plan and March 2009 Asset Protectionact to prevent the market from falling, but not to stop it rising (2000s). Scheme offered to large UK banks.• Continental Illinois (1984), US Savings and Loans crisis (1980s/90s).
Incomplete contracts • Compensation structures that gave staff incentives to pursue undulyrisky practices.
Information frictions
Network externalities • Credit default swap market at the time of Lehman Brothers & AIGstress (September/October 2008) — contagious consequences ofdefault were unclear to others in the financial network.
Risk illusion • The ‘search for yield’ — buoyed by illusory reductions in macroeconomic • Widespread use of value at risk (VaR) models for risk managementuncertainty, investors tried to maintain high returns in a low interest purposes, which were estimated over episodes of relative calm inrate environment by purchasing ever riskier products (2003–07). financial markets, and so could not capture the possibility of extreme
market volatility (1997 onwards).
• Investors in Bernard L Madoff’s funds extrapolated apparent trendsin profits (2008).
• Suspension by BNP Paribas of its hedge funds in August 2007 because ofdifficulties experienced in valuing sub-prime related exposures — illusionexisted over the liquidity risk embedded within asset-backed securities.
Adverse selection • The freeze of the interbank and asset-backed commercial paper markets(August 2007) — investors bid down prices as they had imperfectinformation on the quality of underlying assets, and sellers of ‘good’assets were unwilling to sell at prevailing market prices.
Information cascades • Contagious currency devaluations during the Asian financial • Short-selling of the shares of some UK banks (2008).crisis (1997).
Co-ordination problems
Peer benchmarking • Condition of financial system in mid-2007, as described byChuck Prince’s infamous quote (see Section 3.1).
• Peer-group comparison among investment managers.
Fire-sale externalities • Series of bank mergers and rescues that followed failure of Lehman
Brothers to prevent contagious fire-sales, eg Bradford and B ingley andHBOS (2008).
• Long Term Capital Management — the Federal Reserve of New Yorkfacilitated a debt restructuring in order to prevent a disorderly unwindingof LTCM spilling over to other institutions (1998).
• Following the 2001 ‘dotcom’ equity correction, losses faced by UK lifeinsurers could have led to a potential ‘asset price loss-spiral’ throughequity sales — FSA intervened by relaxing solvency rules.
Credit crunch externalities • Bank lending to households and corporates tightened significantlyin 2008/09.
Runs on retail or • Runs on money market funds (2008), prompting the introduction of • Runs on Lehman Brothers and Bear Stearns (2008).wholesale deposits the Federal Reserve’s Money Market Fund facility. • Run on Northern Rock (2007), leading to the introduction of increased
deposit insurance limit in the United Kingdom (2008).• Wholesale market run on Continental Illinois (1984).
(1) See Jensen (1986) and Calomiris and Khan (1991).
8/20/2019 Bank of England, Tha Role of Macroprudential Policy
http://slidepdf.com/reader/full/bank-of-england-tha-role-of-macroprudential-policy 15/38
14 Discussion Paper November 2009
effects of liquidity and solvency shocks on the wider economy.
In understanding these dynamics, it is useful to distinguish
between aggregate risk which arises across the financial
system as a whole and network risk which arises within the
financial system.
3.2.1 Aggregate risk
History provides many examples of banks’ collective tendency
to assume excessive risk in an upswing and then to become
excessively risk-averse during the downswing. This often
reveals itself in procyclicality in the leverage and maturity
mismatch position of the financial system — a credit and
liquidity cycle. This cycle can also generate what in effect are
concentrated business models, whether on the asset side of
the balance sheet (exposures to particular sectors or firms) or
on the liability side (reliance on particular funding
instruments).
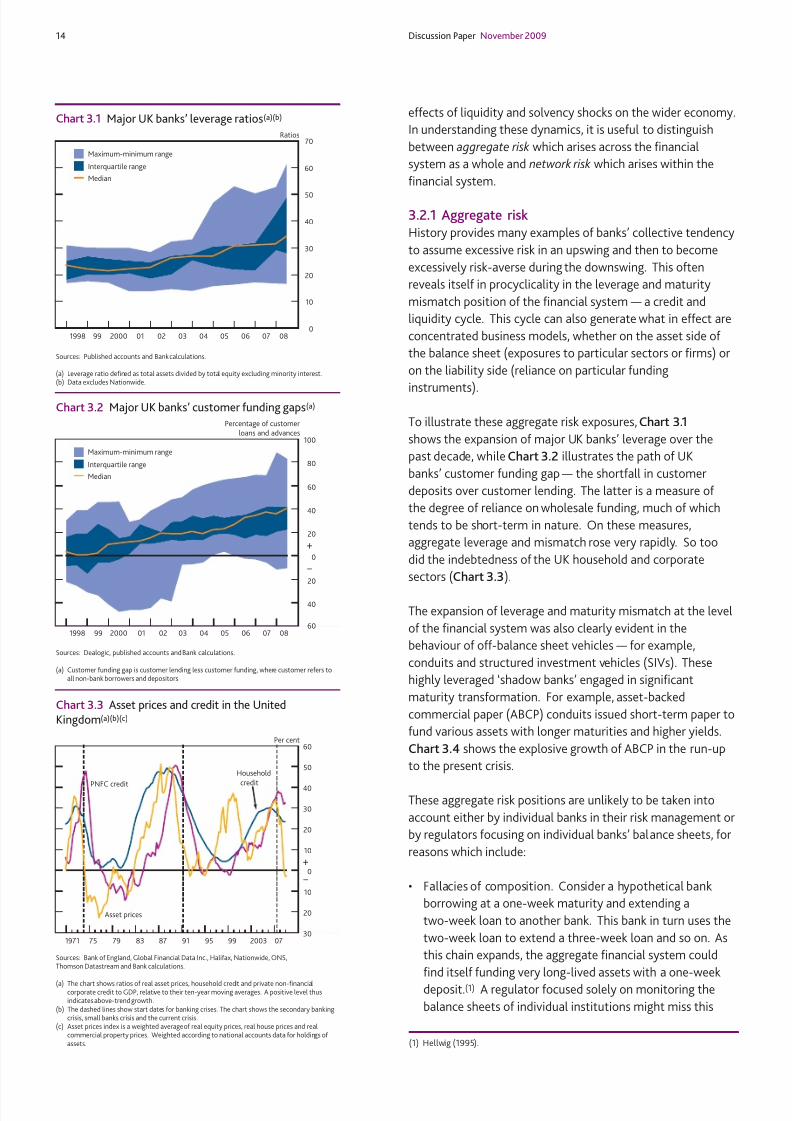
To illustrate these aggregate risk exposures, Chart 3.1
shows the expansion of major UK banks’ leverage over the
past decade, while Chart 3.2 illustrates the path of UK
banks’ customer funding gap — the shortfall in customer
deposits over customer lending. The latter is a measure of
the degree of reliance on wholesale funding, much of which
tends to be short-term in nature. On these measures,
aggregate leverage and mismatch rose very rapidly. So too
did the indebtedness of the UK household and corporate
sectors (Chart 3.3).
The expansion of leverage and maturity mismatch at the level
of the financial system was also clearly evident in the
behaviour of off-balance sheet vehicles — for example,
conduits and structured investment vehicles (SIVs). These
highly leveraged ‘shadow banks’ engaged in significant
maturity transformation. For example, asset-backed
commercial paper (ABCP) conduits issued short-term paper to
fund various assets with longer maturities and higher yields.
Chart 3.4 shows the explosive growth of ABCP in the run-up
to the present crisis.
These aggregate risk positions are unlikely to be taken into
account either by individual banks in their risk management or
by regulators focusing on individual banks’ balance sheets, for
reasons which include:
• Fallacies of composition. Consider a hypothetical bank
borrowing at a one-week maturity and extending a
two-week loan to another bank. This bank in turn uses the
two-week loan to extend a three-week loan and so on. As
this chain expands, the aggregate financial system could
find itself funding very long-lived assets with a one-week
deposit.(1) A regulator focused solely on monitoring the
balance sheets of individual institutions might miss this
1998 99 2000 01 02 03 04 05 06 07 08
Median
Ratios
0
10
20
30
40
50
60
70
Interquartile range
Maximum-minimum range
Chart 3.1 Major UK banks’ leverage ratios(a)(b)
Sources: Published accounts and Bank calculations.
(a) Leverage ratio defined as total assets divided by total equity excluding minority interest.(b) Data excludes Nationwide.
1998 99 2000 01 02 03 04 05 06 07 08
Percentage of customerloans and advances
–
+
60
40
20
0
20
40
60
80
100
Median
Interquartile range
Maximum-minimum range
Chart 3.2 Major UK banks’ customer funding gaps(a)
Sources: Dealogic, published accounts and Bank calculations.
(a) Customer funding gap is customer lending less customer funding, where customer refers toall non-bank borrowers and depositors.
30
20
10
0
10
20
30
40
50
60
1971 75 79 83 87 91 95 99 2003 07
Household
creditPNFC credit
Asset prices
Per cent
–
+
Chart 3.3 Asset prices and credit in the UnitedKingdom(a)(b)(c)
Sources: Bank of England, Global Financial Data Inc., Halifax, Nationwide, ONS,Thomson Datastream and Bank calculations.
(a) The chart shows ratios of real asset prices, household credit and private non-financialcorporate credit to GDP, relative to their ten-year moving averages. A positive level thusindicates above-trend growth.
(b) The dashed lines show start dates for banking crises. The chart shows the secondary bankingcrisis, small banks crisis and the current crisis.
(c) Asset prices index is a weighted average of real equity prices, real house prices and realcommercial property prices. Weighted according to national accounts data for holdings of assets. (1) Hellwig (1995).

8/20/2019 Bank of England, Tha Role of Macroprudential Policy
http://slidepdf.com/reader/full/bank-of-england-tha-role-of-macroprudential-policy 16/38
Discussion Paper November 2009 15
build-up in systemic risk, as no individual bank has a
maturity mismatch of over one week.
• The risks facing individual intermediaries often depend
importantly on system-wide behaviour. For example, the
recovery rate on a bank’s mortgage assets will depend
importantly on aggregate credit conditions. And the
funding vulnerability of a bank will depend on how many
other banks are reliant on the same funding source. Only by
looking at aggregate (leverage and liquidity) positions
would risks across the financial system start to becomeapparent.
• The effectiveness of a bank’s diversification strategy
depends on others’ strategies. The less diversity there is
across banks’ strategies, the smaller are the diversification
benefits a bank can expect. Indeed, in some cases
diversification strategies may reduce diversity across the
system and thereby increase the amount of aggregate risk
to which banks are exposed.
In each of these cases, a macroprudential perspective mighthave helped to identify broadly the risks to which the financial
system as a whole was becoming exposed.
3.2.2 Network risk
Individual institutions are unlikely to take sufficient account of
the spillover effects of their actions on others in the financial
network. They are similarly unlikely to pay sufficient attention
to the impact others’ actions could have on their own balance
sheets. This means that some risks across the financial system
may go undetected and unmanaged. Network risk is, in this
sense, an externality for the financial system: everyone bears
this risk, but no one individual firm is likely to take action
sufficient to mitigate it.(1)
During the current crisis, these spillover effects have often
been potent. The losses generated by failures of some
institutions have risked a cascade of counterparty defaults.
Information contagion has often been as strong as financial
contagion — for example, among several US security dealer
groups after the collapse of Lehman Brothers. Spillovers mayalso amplify liquidity risks. For example, precautionary
hoarding of liquidity contributed to the seizure in money
markets during the crisis. Some banks responded by selling
assets, impairing market liquidity and thereby generating
losses for other banks — for example, in some asset-backed
security markets.(2)
These spillovers operate across firms, but are also likely to
amplify risks over time. For example, an underpricing of
contagion risk may result in financial firms becoming larger or
more interconnected than might be desirable or than theyrealise. This would manifest itself in excess gross leverage
across the financial system — that is, high levels of
intra-financial system activity. Chart 3.5 shows that, in the
five years preceding the crisis, intrafinancial system flows grew
very rapidly. Chart 3.6 provides a visualisation of the complex
web of connections underlying this high gross leverage.
Many of the risks posed by these frictions were raised by the
Bank of England in its speeches and its Financial Stability
Reports in the run-up to the financial crisis and by others.(3)
Although, with hindsight, it is now clear that such messages
could have been put more forcefully, it is equally clear that
words alone would not have been sufficient to curb banks’
incentives to engage in excessive risk-taking. Actions were
needed to break the collective action problem. That reinforces
the need to explore whether there might be specific
macroprudential policy tools backing up words, which could
(1) See Haldane (2009b).(2) See Brunnermeier and Pederson (2009).(3) See Bank for International Settlements (2007) and Trichet (2007).
0.0
0.2
0.4
0.6
0.8
1.0
1.2
1.4
2001 02 03 04 05 06 07 08 09
US$ trillions
(a)
Chart 3.4 US asset-backed commercial paperoutstanding
Source: Federal Reserve.
(a) End-July 2007.
0
10
20
30
40
50
60
70
80
1997 98 99 2000 01 02 03 04 05 060.0
0.5
1.0
1.5
2.0
2.5
3.0
As percentage of all claimson UK residents (left-hand scale)
£ trillions (right-hand scale)
£ trillionsPer cent
Chart 3.5 UK-resident banks’ claims on other financialinstitutions in the United Kingdom(a)
Source: Bank of England.
(a) Sterling and foreign currency claims on other MFIs and OFCs.

8/20/2019 Bank of England, Tha Role of Macroprudential Policy
http://slidepdf.com/reader/full/bank-of-england-tha-role-of-macroprudential-policy 17/38
16 Discussion Paper November 2009
have provided a direct regulatory incentive to change
risk-taking behaviour.
Bringing all of this together, in dealing with systemic risk four
dimensions need to be considered. First, there are the two
potential sources of systemic risk: aggregate risk (which varies
over time) and network risk (which varies across institutions).
And second, there are two potential channels of systemic risk
propagation: maturity mismatch (liquidity) and leverage
(solvency). In other words, the macroprudential policy
problem is multifaceted.
This strongly suggests the need for a set of macroprudential
tools to tackle systemic risk. These tools might usefully target
the separate sources of systemic risk (Table 3.2). To that end,
Sections 4 and 5 discuss possible tools that might aim to
mitigate, respectively, aggregate and network risk across the
financial system. The analysis in these sections focuses largely
on the leverage dimension of the problem because
(internationally consistent) prudential capital instruments
have existed since the inception of the first Basel Accord
(1988), whereas microprudential liquidity requirements are
still in the process of being developed internationally. Giventhe prominent role played by liquidity problems during the
crisis, however, there is considerable benefit in further work on
using regulatory liquidity requirements as a macroprudential
tool. The Bank hopes that this can feature in the policy debate.
Summary
This section has argued that systemic risk has two principal
sources. First, there is a strong collective tendency for
financial firms, as well as companies and households, to
overexpose themselves to risk in the upswing of a credit
cycle, and to become overly risk-averse in a downswing.
Second, individual banks typically fail to take account of
the spillover effects of their actions on risk in the rest of
the financial network. These frictions propagate within
the financial system and on to the real economy through
two channels: leverage and maturity mismatch. Frictions
can cause both to rise above their socially optimal levels.
The macroprudential policy problem is therefore multifaceted.
Table 3.2 Different dimensions of the macroprudential problem
Network risk Aggregate risk
Capital • Lower the probability of failure • Act on the net leverage of theof systemically important firms. financial system over the credit
cycle.• Provide incentives to lower • Provide incentives to curtail
spillover effects. exuberant lending.
Liquidity • Lower the probability of key • Act on the net maturity mismatchproviders of interbank funds of the financial system over thehoarding liquidity. credit cycle.
• Provide incentives for more • Provide incentives to shortenrobust funding network . excessive maturity transformation.
Chart 3.6 Network of large exposures(a) between UKbanks(b)(c)
Source: FSA returns.
(a) A large exposure is one that exceeds 10% of a lending bank’s eligible capital during a period.Eligible capital is defined as Tier 1 plus Tier 2 capital, minus regulatory deductions.
(b) Each node represents a bank in the United Kingdom. The size of each node is scaled in
proportion to the sum of (1) the total value of exposures to a bank, and (2) the total value of exposures of the bank to others in the network. The thickness of a line is proportionate to thevalue of a single bilateral exposure.
(c) Based on 2008 Q1 data.

8/20/2019 Bank of England, Tha Role of Macroprudential Policy
http://slidepdf.com/reader/full/bank-of-england-tha-role-of-macroprudential-policy 18/38
Discussion Paper November 2009 17
4 Tools to manage aggregate risk
Aggregate risk increases the collective fragility of firms within
the financial system. The aim of macroprudential tools would
be to lean against the build-up of aggregate risk in the
upswing, making firms more resilient and thereby lowering theprobability of default across the financial system towards its
social optimum. And, as important, these tools would aim to
help to reduce impediments to risk-taking and lending during
the downswing to support economic activity. If such tools
were effective, the resilience of the system would thereby be
strengthened in both phases of the credit cycle.
In principle, there are a number of regulatory levers that could
be used to moderate banks’ risk-taking, including quantitative
restrictions on aggregate lending or limitations on lending
criteria such as loan to value or loan to income ratios. Inpractice there is merit, where possible, in using existing
regulatory tools when setting macroprudential policy. Indeed,
liquidity and capital requirements should, in principle, be
well-suited to influencing the two key channels through which
systemic risk propagates — maturity mismatch and leverage.
4.1 Systemic capital surchargesPerhaps the simplest macroprudential approach to dealing
with aggregate solvency risk in the financial system would
be to apply a top-up or ‘surcharge’ over and above
microprudential capital requirements (including
forward-looking dynamic provisions against expected losses).
To counter the accumulation of aggregate risk, those
surcharges would need to vary countercyclically, increasing in a
credit boom. Requiring banks to raise equity would raise the
marginal cost of their lending and thus provide incentives to
slow balance sheet growth.(1) Equally, capital surcharges
would fall in a downturn to provide incentives for banks to
maintain the supply of credit.
The calibration of systemic capital surcharges would differ
fundamentally from the setting of microprudential
requirements normally construed. What would matter formacroprudential purposes would be the aggregate state of
risk-taking and credit conditions, not that assumed by a
particular institution. For that reason, the surcharge would be
applied in an undifferentiated way across financial institutions
exposed to the same aggregate risks. The policy judgement
would, in that sense, be about the system as a whole, drawing
on macro data, even though it would be implemented using
prudential instruments.
Capital surcharges could be applied at varying levels of
granularity. For example, surcharges could apply to banks’headline capital requirements.(2) That would have the
advantage of simplicity and should definitely be part of future
debate and research. But, at least in some situations,
time-varying headline capital requirements may be a blunt
tool for influencing risk-taking behaviour in, and banking
exposures to, particular sectors. For example, consider banks
that are engaged in highly profitable but risky lending to
non-bank financial companies alongside less profitable lending
to households and corporates. Faced with higher overall
capital requirements, the banks may choose to conservecapital by slowing lending to the latter rather than the former.
One possible option for addressing that problem would be to
vary the capital which is required to be held against particular
sectoral lending exposures.(3) In regulatory terms, this could
be described as varying the ‘risk weights’ that apply to different
broad classes of lending and other exposures. This would
enable the macroprudential regulator to influence the
marginal cost of lending to exuberant parts of the economy,
while preserving the flexibility to raise aggregate capital
requirements if necessary. In the example from the precedingparagraph, the capital required to back lending to non-bank
financial companies could be increased, so leaving lending to
the real economy broadly unaffected.
In general, such flexibility may be useful because episodes of
exuberance typically originate in particular sectors of the
economy. Arbitrage then tends to turn sectoral pockets of
exuberance into aggregate exuberance, albeit with a lag. A
sectoral approach to the setting of capital surcharges might
allow a macroprudential policymaker to nip such problems in
the bud more effectively than otherwise.
The potential benefits of such an approach were perhaps
evident in the run-up to the present crisis. Growth in
unsecured lending to households fell sharply between 2005
and 2007, at a time when lending to other financial companies
(including securities dealers, SIVs, conduits and institutional
investors) was growing very strongly (Chart 4.1). An increase
in banks’ headline capital requirements would arguably have
been too blunt an instrument to control these problems.
A variety of degrees of granularity could be employed in a
systemic surcharge regime, trading off flexibility on the onehand and simplicity on the other. The granularity of the
macroprudential regime probably need not be anywhere near
as great as for microprudential regulation. The aim would not
be to adjust the ‘risk weight’ on every asset class whose risk
characteristics differ. Rather it could perhaps be to define
broad classes of assets or markets which might be susceptible
to exuberance and also constitute meaningful exposures for
the banking system. For example, for domestic credit
(1) This argument rests on there being financial frictions which distort the relationshipbetween a bank’s cost of debt and the amount of equity. Were capital markets to be
fully efficient, the extra cost of raising equity would be exactly offset by the benefit of making debt safer and hence cheaper (see Box 1 and Modigliani and Miller (1958)).The capital structure of banks would then have no impact on the cost of lending.A variety of information and incentive problems and policy distortions are widelybelieved to cause deviations from this theoretical equilibrium.
(2) See Brunnermeier et al (2009) and Bank for International Settlements (2009).(3) See Tucker (2009).

8/20/2019 Bank of England, Tha Role of Macroprudential Policy
http://slidepdf.com/reader/full/bank-of-england-tha-role-of-macroprudential-policy 19/38
18 Discussion Paper November 2009
exposures the ‘risk buckets’ might comprise banks’ secured and
unsecured exposures to households, commercial property
lending, other corporate lending and lending to other financial
companies. A further degree of granularity might plausibly
distinguish sub-prime lending to households, ‘leveraged’ or
high-yield lending to companies etc. If something broadly
along these lines merited further debate, careful study of the
sensible degree of granularity would be needed; and it would
not have to be fixed for all time, but would depend partly on
the circumstances. Within these broad risk buckets,
institution-specific loan characteristics would, as now, be
assessed and risk-weighted by the microprudential regulator.
4.2 Setting systemic capital surchargesWhatever the degree of granularity of the systemic surcharge
regime, a quantitative judgement would need to be made on
the degree of ‘overexuberance’ in credit conditions. In
practice, there is unlikely to be a single, quantitative indicator
which captures accurately exuberance in credit markets. This
mirrors the finding in other areas of macroeconomic policy,
including monetary policy. Experience has illustrated that
focusing on a single or fixed set of indicators is unlikely to be a
robust guidepost to policy over time.
It may be possible, however, to define an eclectic set of
indicator variables, at an aggregate and sectoral level, which
might inform judgements about excessively risky lending.
Table 4.1 lists some of the variables that might be considered.
Some are quantitative, others qualitative, including market
intelligence. Some of the data for these indicators already
exist; for others, new data would need to be collected.(1)
Translating this indicator set into possible summary measures
of aggregate risk, and potentially a set of sectoral ‘risk
weights’, will call for a technical judgement. One way of
making this process concrete and quantitative would be to
apply a prescribed set of stress scenarios to the factors driving
default and recovery rates on classes of lending. These
prescribed stresses could depend on the state of the credit
cycle — for example, gradually becoming more severe as a
credit boom expanded. Capital buffers required on lending to
each sector would then be adjusted to ensure the system was
resilient to these tail scenarios.
Under this approach, the task for the macroprudential
authorities would be to calibrate the stresses, their
implications and the necessary adjustment in capital charges
to ensure that banks would be likely to remain resilient were
these risks to materialise. Box 4 sets out conceptual steps
involved in such an exercise. It also provides an illustrative
calibration of capital surcharges based on a very broad subset
of currently available indicators. This calibration is intended to
demonstrate some of the methodological steps that would
need to be taken, not as a precise quantitative guide to how
policy might actually have been set. Approaches such as this
would need to be complemented with qualitative information
from sources such as market participants and surveys in
broadly the same way as monetary policy makers around theworld draw on modelling, conjunctural data analysis and
anecdotal information from real-economy contacts.
Nonetheless, this illustrative calibration is revealing in several
respects. First, even though crudely assembled, the calibration
does establish that using a plausible set of indicators to guide
policy could have resulted in a material rise in capital
surcharges during the middle of the decade. That might have
helped curb the credit boom of the past decade. Second, it
suggests that, in practice, it is difficult to find a single or fixed
set of indicators that could be combined to deliver a robustrule for macroprudential policy in all states of the world.
5
0
5
10
15
20
25
30
1999 2002 05 08
Four-quarter growth rate (per cent)
–
+
Lending to OFCs(a)
Unsecured lendingto households
Chart 4.1 Sectoral M4 lending growth
Source: Bank of England.
(a) Excludes lending to intermediate OFCs.
(1) Section 7 has a more detailed discussion of data requirements for a macroprudentialregime.
Table 4.1 Indicator variables for capital surcharge
• Credit flows, stocks and spreads.*
• Income and capital gearing of households, corporates and other financial companies(OFCs).*
• Unemployment rate.*
• House price to earnings ratio, house price inflation.*
• Maximum loan to income and value ratios of first-time buyers.*
• Commercial property prices and rents.*
• Property pipelines and vacancy rates.*
• Credit conditions surveys.*
• Volumes/spreads data on LBO (leveraged buyout) and private equity deals.*
• Volumes/spreads data on syndicated loan activity.*
• Growth in assets under management at hedge funds and OFCs.*
• Contribution to growth in mortgage market from other specialist lenders.*
• Reliable data on leverage ratios of hedge funds/other OFCs.
• A granular geographical breakdown of banks’ loan books.
• Richer data on the quality of institutions’ loan portfolios — such as the loan to valuebreakdown of their mortgage and commercial real estate lending; a breakdown of their
mortgage book between prime, adverse credit, self-certified and buy-to-let.• A consistent breakdown of trading assets by class and quality.
Note: An asterisk (*) denotes that the data source is currently available to us.

8/20/2019 Bank of England, Tha Role of Macroprudential Policy
http://slidepdf.com/reader/full/bank-of-england-tha-role-of-macroprudential-policy 20/38
Discussion Paper November 2009 19
4.3 Complementary measuresIt may be desirable to supplement macroprudential capital
requirements with other prudential instruments which could
help to achieve macroprudential objectives. Time-varying
margins or haircuts on certain secured financial transactions
between banks and non-banks are one example. They could belevied on secured lending to other parts of the financial system
— for example, ‘shadow’ banks or hedge funds. This would
allow the authorities to influence the marginal cost of lending
to non-bank financial companies if conditions became overly
exuberant. As such, they might be a means of averting an
imprudent increase in the leverage of non-banks.(1)
In principle, countercyclical surcharges could also be applied to
liquidity requirements to lean against the collective
underpricing of liquidity risk during credit booms — for
example, underpriced rollover risk in funding markets andmarket liquidity risk in asset markets.(2) As well as providing
additional liquidity insurance for the financial system, liquidity
surcharges would generate incentives for banks to put balance
sheets on a more stable liquidity footing. Further work would
be needed to calibrate any such instruments, taking into
account both internationally agreed microprudential liquidity
requirements,(3) and whether or not these instruments could
sensibly be related to the terms on which central banks
provide liquidity insurance. Measures on margins and
liquidity insurance could be connected if central banks
increased haircuts on eligible collateral over the credit
cycle.(4)
SummaryThis section has examined whether it would be practical to
dampen cyclical overexuberance through a regime of capital
surcharges on top of prevailing microprudential capital ratios.
The Basel Committee and other international groups are
working on this.
They could be applied to headline capital requirements or at a
more disaggregated level (through so-called ‘risk weights’ on
particular types of exposure). The sectoral approach might
allow policy to be better targeted at pockets of exuberance,
but would also entail greater complexity. Increasing capitalrequirements in a credit boom could offer greater system-wide
self-insurance against a subsequent bust. It would also
provide incentives for banks to restrain exuberant lending by
raising its marginal cost. Lowering capital requirements in a
bust, on at least some classes of lending, might provide an
incentive for banks to lend and reduce the likelihood of a
collective contraction of credit exacerbating the downturn and
losses to banks themselves.
(1) However, it should be noted that academic studies have typically found little evidencethat federal margin regulations in the United States have been effective in limitingstock price volatility. See Kupiec (1997).
(2) See Perotti and Suarez (2009). Brunnermeier et al (2009) suggest a capital surchargebased on banks’ maturity mismatch.
(3) See Bank for International Settlements (2008).(4) For example, see Bank of England (2008a).

8/20/2019 Bank of England, Tha Role of Macroprudential Policy
http://slidepdf.com/reader/full/bank-of-england-tha-role-of-macroprudential-policy 21/38
20 Discussion Paper November 2009
Box 4
Calibrating time-varying capital surcharges
The aim of (aggregate and sectoral) surcharges is to lean
against cyclical exuberance in bank lending that may lead tothe accumulation of excessive aggregate risk in the financial
system. This box considers how time-varying capital
surcharges might be calibrated for this purpose. It is intended
to highlight the set of judgements that a macroprudential
regulator would need to make to implement countercyclical
capital surcharges. The precise approach outlined here should
be considered no more than illustrative. In practice, a variety
of approaches, models, data and qualitative information would
be required to inform policy judgements.
In broad terms, this calibration requires quantification of:
• The link between indicators of exuberance and banks’
default probabilities; and
• The link between banks’ probability of default and capital
ratios.
There are no simple metrics for quantifying the first
ready-reckoner. Translating a set of economic and financial
indicators into default probabilities for the financial system
will inevitably be somewhat subjective. Here, a largely
statistical approach is adopted. For the secondready-reckoner, a Merton (1974)-based approach is used as a
starting point.(1) This involves simulating the future value of a
bank’s assets to assess the likelihood of default when debt
payments fall due. It allows a quantification of the link
between a bank’s capital ratio and its default probability.
To fix ideas, the calibration is applied to a set of six banks over
the past decade. As a starting point, banks’ domestic credit
exposures are partitioned into the following set of ‘risk
buckets’: secured and unsecured exposures to households;
commercial real estate lending; other corporate lending; and
lending to other financial companies. Other exposures aregrouped together in a catch-all residual bucket, which is given
the average surcharge. The choice of risk buckets is purely
illustrative. In practice, the granularity of the sectors chosen
should reflect their quantitative significance.
There are four steps involved in calibrating time-varying capital
surcharges for these sectors.
Step 1: Benchmark calibrationCalibrate the expected return (‘drift’) and volatility parameters
of the Merton model so that the balance sheet of theaggregate financial system is consistent with a default
probability of, say, 0.1%. Where individual banks appear
undercapitalised, it is assumed that the microprudential
regulator demands additional capital so that the probability of
default for all institutions is equal to or below 0.1%.
Step 2: Choose the ‘neutral’ macroprudential
surchargeSet the neutral or average surcharge to be applied when all
sectors are in equilibrium. If a ‘neutral’ surcharge is positive,
this is equivalent to demanding a more stringent threshold for
the default probability of the system.
Step 3: Estimate exuberance in each sectorIdentify a set of indicators of exuberance in lending to each of
the sectors. The indicators considered in this
exercise are drawn from Table 4.1. These have been chosen
to reflect pressures on credit supply, incorporating
information from both financial prices and quantities. Theapproach to measuring exuberance is common to each
sector. We normalise each of the indicators so they share
the same variance. And we define our indicator of
exuberance at each point in time as the median value across
the range of indicators. The task of judging exuberance
would in practice be less mechanical, involving a judgemental
sifting of all available evidence. Charts A–E present the
swathe of indicators used for each sector, together with the
median.
Step 4: Estimate the capital surcharge for each sectorThe benchmark calibration of the expected return and
volatility of banks’ assets (from Step 1) is then adjusted in light
of these estimates of exuberance. The greater the exuberance,
the higher the expected drift and variance of returns on
exposures to the exuberant sector. All else equal, this
increases the probability of default of the banking sector.
In precise terms, an adjustment factor is first computed for the
volatility of each bank’s assets. This factor is given by taking
the weighted average of exuberance estimates (from Step 3)
at each point in time, where the weights reflect balance sheet
shares. The volatility of each bank’s assets is then adjusted inproportion to this adjustment factor. A similar adjustment is
made to the expected drift to ensure a common market price
of risk across banks. Given these adjustments, the aggregate
capital surcharge for each bank at each point is determined as
that required to bring the default probability back to the
default threshold from Step 2.
Chart F illustrates the results of this process, reporting
surcharges by sector.(2) The cumulative effect is an
upward-sloping profile. This is largely driven by exuberance in
mortgage lending, reflecting both the time-profile of estimated exuberance in this sector and the large share of
mortgage lending. But it is notable that all sectors carry

8/20/2019 Bank of England, Tha Role of Macroprudential Policy
http://slidepdf.com/reader/full/bank-of-england-tha-role-of-macroprudential-policy 22/38
Discussion Paper November 2009 21
higher capital surcharges in the second half of the sample
period.
Chart G illustrates the counterfactual trajectory for aggregate
capital surcharges on a bank by bank basis. As collective risks
from the credit cycle build over time, countercyclical capital
surcharges increase, in particular from around 2002 onwards.
Although higher capital surcharges are applied equally across
banks, the incidence of these charges differs across firms
according to their precise exposures to exuberant sectors.
3
2
1
0
1
2
3
1998 99 2000 01 02 03 04 05 06 07
Range
Median
–
+
Chart A Swathe of exuberance indicators in unsecuredlending to households(a)(b)
Source: Bank of England.
(a) The following quarterly indicators for exuberance in unsecured lending to households areused: spreads on personal loans, credit cards and overdrafts; stocks and flows of unsecuredlending to households; and income and capital gearing of the household sector. Allindicators are de-trended and have been normalised by their standard deviation to allow forcomparison with other indicators.
(b) The top of the swathe shows the value of the largest indicator, the bottom of the swathe thevalue of the smallest indicator, and the orange line the median value of all indicators, all at agiven point in time.
3
2
1
0
1
2
3
1998 99 2000 01 02 03 04 05 06 07
Range
Median
–
+
Chart B Swathe of exuberance indicators in securedlending to households(a)(b)
Source: Bank of England.
(a) The following quarterly indicators for exuberance in secured lending to households are used:spreads on mortgage lending; measures of the house price to earnings ratio; stocks andflows of secured lending to households; and income and capital gearing of the householdsector. All indicators are de-trended and have been normalised by their standard deviation toallow for comparison with other indicators.
(b) The top of the swathe shows the value of the largest indicator, the bottom of the swathe thevalue of the smallest indicator, and the orange line the median value of all indicators, all at agiven point in time.
2
1
0
1
2
3
1998 99 2000 01 02 03 04 05 06 07
Range
Median
–
+
Chart C Swathe of exuberance indicators in lending tocommercial real estate(a)(b)
Source: Bank of England.
(a) The following quarterly indicators for exuberance in lending to commercial real estate areused: commercial rents; vacancy rates; stocks and flows of credit to commercial real estate;and commercial property price inflation. All indicators are de-trended and have beennormalised by their standard deviation to allow for comparison with other indicators.
(b) The top of the swathe shows the value of the largest indicator, the bottom of the swathe thevalue of the smallest indicator, and the orange line the median value of all indicators, all at agiven point in time.
3
2
1
0
1
2
3
1998 99 2000 01 02 03 04 05 06 07
–
+
Range
Median
Chart D Swathe of exuberance indicators in lending toother PNFCs(a)(b)
Source: Bank of England.
(a) The following quarterly indicators for exuberance in lending to other PNFCs are used:spreads on syndicated loans and corporate bonds; credit conditions for corporates; stocksand flows of lending to other PNFCs; and income and capital gearing of the corporate sector.All indicators are de-trended and have been normalised by their standard deviation to allowfor comparison with other indicators.
(b) The top of the swathe shows the value of the largest indicator, the bottom of the swathe thevalue of the smallest indicator, and the orange line the median value of all indicators, all at agiven point in time.

8/20/2019 Bank of England, Tha Role of Macroprudential Policy
http://slidepdf.com/reader/full/bank-of-england-tha-role-of-macroprudential-policy 23/38
22 Discussion Paper November 2009
(1) A modified version of the standard Merton model is used, incorporating a moresophisticated treatment of the default boundary. Specifically, equity is treated as a‘down-and-out barrier option’ claim on assets. While this is an improvement over themost basic form of the model, it still has deficiencies. For example, it assumes thatbanks have only one aggregate asset and that the liability side of the balance sheet is
static and not subject to runs.(2) Limitations of the data mean that the sectoral breakdown of these surcharges is no
more than illustrative. In particular, lending by banks to SIVs and conduits is capturedby the cross-sectional rather than time-series surcharge.
1998 99 2000 01 02 03 04 05 06 07
Household secured
Household unsecured
Commercial propertyPNFC
OFC
Capital surcharge
Chart F Contributions by sector to time-varying capitalbuffer(a)
Source: Bank calculations.
(a) Calculated using end-year balance sheet data and end-year exuberance indicators(see Charts A–E).
C a p i t a l s u r c h a r g e
Institutions
1998 99 2000 01 02 03 04 05 06 07
Chart G Capital surcharges for cyclical overexuberance(time-series dimension)
Source: Bank calculations.
3
2
1
0
1
2
3
4
5
1998 99 2000 01 02 03 04 05 06 07
Range
Median
–
+
Chart E Swathe of exuberance indicators in lending toother financial companies(a)(b)
Source: Bank of England.
(a) The following quarterly indicators for exuberance in lending to other financial companies are
used: US securities houses’ gross leverage; net capital flows into hedge funds; s tocks andflows of credit to the ‘leveraged’ OFC sector, including securities dealers; fund managers(including hedge funds); leasing and factoring companies; credit unions; and private equityfirms. All indicators are de-trended and have been normalised by their standard deviation toallow for comparison with other indicators.
(b) The top of the swathe shows the value of the largest indicator, the bottom of the swathe thevalue of the smallest indicator, and the orange line the median value of all indicators, all at agiven point in time.

8/20/2019 Bank of England, Tha Role of Macroprudential Policy
http://slidepdf.com/reader/full/bank-of-england-tha-role-of-macroprudential-policy 24/38
Discussion Paper November 2009 23
5 Tools to manage network risk
Network risk arises from the spillovers that are generated
within a closely interconnected financial network. While
aggregate risk increases the probability of default (PD) across
the financial system, the effects of network risk are instead feltin the loss given default (LGD) of the financial system (that is,
the resulting increase in distress felt across the financial
system when one bank fails). Because individual firms are
unlikely fully to internalise the costs of their distress on others,
the objective of macroprudential policy is to provide additional
incentives for banks to do so.
5.1 Institution-specific systemic capital surchargesIn practice, this means setting prudential surcharges that
better reflect individual institutions’ contribution to
system-wide risk.(1) One way of achieving this is by settingcapital add-ons which lower the probability of failure of banks
whose system-wide LGD would be greatest were they to fail.
Capital surcharges would then provide additional insurance for
the system as a whole.(2) They would also provide an incentive
for such firms to adjust their balance sheet to limit
system-wide losses — for example, by reducing their size and
connectivity to other banks. In this role, systemic surcharges
may be one means of addressing the ‘too-big-to-fail’ problem.
Under such a scheme, capital requirements would not only
depend on the risk profile of the bank, but also on a measure of
the spillover effects of their distress. In practice, there is no
single balance sheet metric of the system-wide losses which
might arise from a particular institution failing. It is possible,
however, to define a set of indicator variables which might
provide information on the scale of such losses. Table 5.1 sets
out a possible list of some of these variables. They include
balance sheet size, connectivity to other institutions and
measures of potential asset impairments in the event of fire
sales.(3)
In addition to quantitative data, there is a potentially
important role for qualitative indicators. For example, the
preparation of recovery and resolution plans, sometimes
referred to as ‘living wills’, would facilitate the orderly
wind-down of firms, thereby lowering potential costs to the
financial system in the event of failure. The existence of suchplans, if credible, should lower a bank’s systemic capital
surcharge. This would have the beneficial side-effect of
providing incentives for firms to establish these plans in the
first place. Information gleaned from market intelligence
would also be an important qualitative input to the calibration
of these capital surcharges.
As with capital surcharges for aggregate risk over the credit
cycle, it is likely to be difficult to find a fixed set of indicators
that would deliver a robust rule for dealing with network
risk.(4)
That points, again, to the need for a degree of discretionwhen setting cross-sectional capital surcharges. Nonetheless,
it is possible to generate illustrative calibrations of how a
policymaker might determine these surcharges based on
observed balance sheet characteristics. Box 5 provides such an
illustrative calibration, again as a demonstration of the steps
that would need to be followed rather than as a precise
quantitative guide to actual macroprudential policy. The
calibrations could be complemented with a range of
qualitative indicators, underlining the importance of
judgement in augmenting any quantitative or modelling
approach. The calibration suggests a considerable degree of
cross-institution differentiation in capital surcharges mighthave been necessary to mitigate this source of systemic risk.
5.2 Complementary measuresThere are again other instruments that could be used to tackle
network risk. Microprudential liquidity standards could be
adapted for macroprudential ends. For example, these might
aim to provide additional insurance against liquidity problems
emerging at critical lenders in the interbank network. Liquidity
hoarding would perhaps be less likely to occur if these critical
institutions were more resilient to shocks. Macroprudential
liquidity surcharges could also conceivably be calibrated toprovide incentives to reduce complexities in bank funding
markets, as reflected in long intra-financial system lending
chains. These chains increase counterparty uncertainty and
hence the potential for liquidity hoarding by institutions.
Concentration risk is a recurring theme in the history of bank
failures. In theory, limits on interbank exposures are a direct
way of capping the risks posed by concentrated exposures.
Within the European Union, banks are already subject to some
(1) See Acharya and Richardson (2009) and Squam Lake (2009a).(2) So-called ‘contingent capital’ instruments, which automatically convert to commonequity upon the trigger of a threshold, may have a role to play in providing suchinsurance.
(3) A similar set of factors are considered by Tarashev et al (2009). See FSA (2009b) andIMF/BIS/FSB (2009) for a discussion of indicators of systemic importance.
(4) FSA (2009b) is an important recent contribution to this debate.
Table 5.1 Indicator variables for cross-section capital surcharge
• Values of a bank’s total assets.*
• A bank’s interbank and OFC liabilities.*
• A bank’s repo liabilities.*
• Value of a bank’s trading assets and assets available for sale.*
• Information on common exposures across financial institutions.*
• Banks’ capital structure (for instance, the loss-absorbing capacity of its capitalstructure).*
• Presence of infrastructures that reduce uncertainty about interbank exposures(eg central counterparties for derivatives).*
• Banks taking action to ease their orderly resolution as a result of a recovery andresolution plan (also known as a ‘living will’).*
• More detailed information on network structure, including:
– Subsidiaries, branches and off-balance vehicles to which banks have explicit orimplicit (ie reputational) commitments to support.
– Banks’ credit default swap exposures and other derivative exposures within thefinancial system.
– Large liabilities to foreign banks and non-bank financial institutions.
Note: An asterisk (*) denotes that the data source is currently available to us periodically.

8/20/2019 Bank of England, Tha Role of Macroprudential Policy
http://slidepdf.com/reader/full/bank-of-england-tha-role-of-macroprudential-policy 25/38
24 Discussion Paper November 2009
limits on exposures to individual financial institutions or
groups of connected institutions.(1) In principle, there may be
advantages in introducing an analogous tool for the liabilities
between institutions. Large liability limits might usefully fill a
gap in the existing regime that occurs when large banks
extend loans to smaller counterparties. In those cases, thevalue of the loan is insufficiently large to represent a large
exposure of the creditor, yet represents a significant liability to
the debtor.
Structural policies may also make it easier for financial
institutions to fail without imposing high spillover losses on
the rest of the economy.(2) Several policies have been
proposed internationally, and the Bank of England is keen to
debate their relative merits. One example is the introduction
of ‘central counterparties’ for reasonably liquid market
instruments that are currently cleared bilaterally, therebyreducing interconnectedness and complexity in the financial
network.(3) These systemic risk benefits, however, would need
to be weighed against the increased concentration of risk
exposures within a handful of central counterparties around
the world, and so would require robust central risk
management and effective official oversight. Another policy
proposal would be subsidiarisation of different geographical
parts of a cross-border financial firm, in order to reduce the
potential for cross-country financial spillovers.(4) Anotherwould separate core payment activities or proprietary trading
from other banking activities, in order to limit the
contamination of critical bank business functions when risks
crystallise in those wider activities.(5)
SummaryThis section has explored how capital surcharges might be set
across firms to reflect better their individual contribution to
systemic risk. Surcharges could be levied based on factors
such as banks’ size, connectivity and complexity. This would
lower the probability of those institutions failing and soprovide some extra systemic insurance. It would also provide
incentives for these banks to alter their balance sheet structure
to lower the impact of their failure.
(1) However, in most EU countries, including the United Kingdom, exposures withmaturity of less than one year have in the past been exempted from any such limits.Following changes to EU legislation, the rules will be tightened up with effect from
2011 so that the interbank exposures of all but the smallest UK (and other EU) bankswill not be permitted to exceed a quarter of the bank’s total regulatory capital .(2) King (2009b).(3) See FSA (2009b) and the references therein. See also the Bank of England Financial
Stability Report, June 2009 and HM Treasury (2009).(4) See FSA (2009b).(5) Kay (2009) and G30 (2009).

8/20/2019 Bank of England, Tha Role of Macroprudential Policy
http://slidepdf.com/reader/full/bank-of-england-tha-role-of-macroprudential-policy 26/38
Discussion Paper November 2009 25
Box 5
Calibrating cross-section systemic capital
surcharges
The aim of cross-section systemic capital surcharges would beto reduce the default probabilities of institutions whose failure
would cause greater damage across the financial system. A
bank’s contribution to systemic risk is given by the product of
its probability of failure (PD) and the system-wide spillover
effects associated with its default or distress. Cross-section
capital surcharges can be calibrated to equalise banks’
marginal contributions to systemic risk at a chosen level. This
box outlines an illustrative methodology for performing such
a calibration. This is intended to highlight the set of
judgements that may be required to operationalise such a
regime.
In general terms, the calibration requires quantification of:
• The link between the observable balance sheet
characteristics of a bank and its contribution to
system-wide loss given default; and
• The link between an individual bank’s probability of failure
and its capital ratio.
Quantifying the spillover effects associated with aninstitution’s default is challenging. One approach would
involve constructing quantitative models to analyse the
response of the network to the default of an institution.(1) But
that is made significantly more complicated by uncertainty
about banks’ behavioural responses under stress. An
alternative is to use statistically based models calibrated from
market data.(2) But such approaches tend to underestimate
asset value correlations during credit booms and hence
systemic risk. The link between default probabilities and
capital ratios can be analysed using the same Merton-type
approach used in Box 4.
To make the calibration concrete, a simple illustrative
algorithm is outlined for determining individual banks’ capital
surcharges.
Step 1: Identify indicators of systemic importanceSpillovers within financial networks arise as a result of firms’
size and connectivity to others in the network.(3) For example,
the failure of a large bank would be expected to impose a
greater cost on the system at large. Size may also be
correlated with complexity. In the calibration, size is measured
by taking the value of a bank’s total assets (includingoff-balance sheet items) scaled by total banking system assets
(Chart A).
But size alone may be a poor proxy for systemic impact. There
is greater risk of contagious spillover effects for banks with
larger interconnections. The concept of connectivity has two
dimensions. The first dimension is captured by the absolute
level of intra-financial system activity — a network with higher
gross flow volume tends to be more susceptible to contagion.
The second dimension is captured by the distribution of
exposures — a network which contains a small number of
critical nodes tends to be less robust to systemic failure.(4) In
the calibration, these aspects of connectivity are measured
using the value of a bank’s interbank liabilities scaled by totalsystem assets (Chart B).
A third, distinct channel of connectivity occurs when fire sales
of assets by a weak institution inflict damage on the balancesheets of other institutions in the network. Fire sales may also
occur when secured lenders to defaulting banks sell the assets
0.0
0.1
0.2
0.3
0.4
1999 2000 01 02 03 04 05 06 07
Ratio
Maximum-minimum range
Interquartile range
Median
Chart A Indicators of systemic importance: size(a)
Source: Bank calculations.
(a) Measured as the ratio of individual banks’ assets relative to system-wide assets. The chartshows the range, interquartile range and median of this measure across the sample banks.
0.0
0.1
0.2
0.3
0.4
0.5
1999 2000 01 02 03 04 05 06 07
Ratio
Maximum-minimum range
Interquartile range
Median
Chart B Indicators of systemic importance:interconnectedness (a)
Source: Bank calculations.
(a) Measured as the ratio of individual banks’ interbank liabilities relative to system-wideinterbank liabilities. The chart shows the range, interquartile range and median of thismeasure across the sample banks.

8/20/2019 Bank of England, Tha Role of Macroprudential Policy
http://slidepdf.com/reader/full/bank-of-england-tha-role-of-macroprudential-policy 27/38
26 Discussion Paper November 2009
pledged by the bank as collateral. In the illustrative
calibration, these fire-sale propensities are measured by taking
the value of each bank’s repo liabilities (Chart C). This reflects
the risk that secured lenders to a bank might sell off assets
used as collateral in repo contracts in the event of the bank
defaulting.
Step 2: Compute each bank’s contribution to systemLGD
By arbitrarily placing equal weight on each of these balancesheet characteristics, a composite indicator of systemic
importance can be calculated. For illustrative purposes,
assume that total system-wide losses are 20% of system
assets. These system-wide losses are then allocated across the
banks according to their systemic impact score.
Step 3: Calculate the capital surcharge required toequalise expected system-wide lossesThe next step is to calculate the required adjustment in the
probability of failure of each institution necessary to equalise
their contribution to expected system-wide losses. The chosentolerance level for system-wide losses is arbitrarily taken to be
0.001% of system assets. The Merton model is used to map
the required adjustment in default probabilities into a capital
surcharge. These steps result in a calibration which seeks to
equalise the expected losses felt by the system in the event of
any firm failing, at a threshold chosen by the macroprudential
policymaker.
Chart D presents a visualisation of the capital surcharges that
result from applying this algorithm to a set of banks. There is
substantial variation across institutions, reflecting significant
differences in their size, interconnectivity and fire-sale
propensities. Larger and more connected banks carry a larger
surcharge, to reduce their default probability and hence their
contribution to system-wide risk. These surcharges increase
across all institutions over time, reflecting the increased
volume of intra-financial system activity in the lead-up to the
crisis. The ordering of surcharges across banks is, for the most
part, relatively stable — although this need not be the case
when business models change.
(1) See Aikman et al (2009) and Boss et al (2002).(2) See Adrian and Brunnermeier (2009) and Tarashev et al (2009).(3) See FSA (2009b) and IMF/BIS/FSB (2009) for a discussion of the factors determining
systemic importance.(4) See Anderson and May (1991).
0.0
0.1
0.2
0.3
0.4
0.5
0.6
0.7
1999 2000 01 02 03 04 05 06 07
Ratio
Maximum-minimum range
Interquartile range
Median
Chart C Indicators of systemic importance: asset firesale risk(a)
Source: Bank calculations.
(a) Measured as the ratio of individual banks’ repo liabilities relative to system-wide repoliabilities. The chart shows the range, interquartile range and median of this measure acrossthe sample banks.
1998 99 2000 01 02 03 04 05 06 07
C a p i t a l s u r c h a r g e
Institutions
Chart D Capital surcharges for spillover risk(cross-sectional dimension)
Source: Bank calculations.

8/20/2019 Bank of England, Tha Role of Macroprudential Policy
http://slidepdf.com/reader/full/bank-of-england-tha-role-of-macroprudential-policy 28/38
Discussion Paper November 2009 27
6 Building a robust macroprudential regime
To be effective, a macroprudential regime would need to meet
some high level criteria: it would need to be simple, but robust
to uncertainty and structural change. Policy decisions
themselves would need to be credible, predictable andtransparent to banks, borrowers and to the general public.
And the policymaker should be held accountable for their
actions. This section outlines some of the features of a
macroprudential regime that might help to deliver these
objectives.
6.1 Rules versus discretion
Any policy framework should seek to be credible, with policy
decisions applied consistently and systematically. To be
consistent over time, a regime needs to be robust to
uncertainty and unforeseen events. Robustness is a keycharacteristic of any policy regime, but especially a new one.
The level of microprudential regulatory capital and liquidity
requirements has a direct bearing on the robustness of a
macroprudential regime. With hindsight these are now
generally regarded as having been too low to accommodate
the losses that have arisen during past crises (Box 6). The
higher is the microprudential floor, the greater is the quantum
of capital and liquidity in the financial system and the lower is
systemic risk. The lower is systemic risk, the lesser the need
for an activist macroprudential policy regime to moderate risk
over the credit cycle.
Another dimension to robustness is adaptability in the face of
structural change or uncertainty. Structural change might
arise as a result of technological progress in the financial
system over time. But it is also likely to result from changes in
banks’ behaviour arising from the introduction of a new policy
framework. For example, banks’ capital planning decisions
would likely be affected significantly by the implementation of
systemic capital surcharges. These changes would compound
the uncertainty that policymakers would anyway face at the
outset of a new policy regime.
As Sections 4 and 5 discussed, unless effective rules could be
designed, macroprudential policy choices would likely be
based significantly on judgement. Importantly, this would
include qualitative evidence, such as that gathered from
market participants. A discretionary approach would also
allow policymakers to learn from observing the interaction
between macroprudential instruments, the financial system
and the economy, helping them improve modelling
approaches and data collection and, ultimately, the quality
of policy judgements.
Some studies have argued that credit growth and asset prices
are useful leading indicators of banking system crises.(1) It is
important that this work be pursued, as it may be possible to
introduce a baseline rule-like element into any system. The
pros and cons of this would need to be evaluated as such work
progresses. Designing a fixed macroprudential policy rule that
would stand the test of time may not, however, be easy. For
example, while rules based on stock imbalances perform
reasonably well in capturing mounting risks in an upswing,they appear to be slow to react in a cyclical downturn. (2) Flow
measures such as growth rates of credit and asset prices seem
to be affected by the reverse problem, reacting more quickly to
the downswing but missing the steady accumulation of risk in
the upswing.
These effects are apparent when simulating capital ratio rules
based on UK lending data (Chart 6.1). A stock-based rule
would have implied a very gradual unwind of capital ratios at
the onset of the recession in the early 1990s. And in the
current crisis, a stock-based rule would have continuedtightening policy into the depths of the recession. The
flow-based rule would have generated persistently high but
stable capital ratios throughout the decade preceding the
crisis. This suggests that any rule might need to be quite
simple; and may need to be accompanied by the use of
judgement to make robust policy choices.
While those arguments point to the importance of a
macroprudential regime being flexible, flexibility and discretion
would not, however, be costless.(3) The costs of discretion
(1) See Borio and Drehmann (2009) for example.(2) See Borio (2009).(3) See Kydland and Prescott (1977).
y
k *
1970 75 80 85 90 95 2000 05
Credit stock rule
Credit flow rule
Per cent
Chart 6.1 Banks’ capital ratios under alternativerules(a)(b)
Source: Bank calculations.
(a) Illustrative paths presented in the spirit of exposition, assuming a microprudential minimumof y %. We focus on the simplest case: a linear mapping from macrofinancial indicators, X t,to capital requirements, k t, of the form: k t – k * = β ( X t – X t
*). For the purpose of thiscalibration, we choose β such that the variance of capital ratios, K t, is similar across differentchoices of indicators, X t. k * represents the steady-state capital ratio. X t
* is the steady-statelevel of the indicator variable, calculated from a real time linear trend (ie using data availableup to the date of the calibration). ‘Stock’ rules use X t equal to the stock of lending tohouseholds and PNFCs in the United Kingdom as a percentage of nominal UK GDP. ‘Flow’rules use X t equal to the annual real flow in lending to households and PNFCs in theUnited Kingdom.
(b) Shaded areas indicate recessions in the United Kingdom. Recessions are defined as twoconsecutive quarters of falling output (at constant prices) estimated using the latest data.The recessions are assumed to end once output began to rise, apart from the 1970s wheretwo separate occasions of falling output are treated as a single recession.
8/20/2019 Bank of England, Tha Role of Macroprudential Policy
http://slidepdf.com/reader/full/bank-of-england-tha-role-of-macroprudential-policy 29/38
28 Discussion Paper November 2009
within a macroprudential policymaking framework might
include:
• Decision-making would be less predictable than under a
fixed rule. That lack of predictability may have a cost, with
banks facing greater uncertainty about their futureregulatory requirements. They may respond by holding
higher precautionary buffers of liquidity and capital, driving
up the overall cost of capital and credit in the economy.
• This uncertainty might in turn lower the effectiveness of the
regime. In general, the effects of regulatory action are likely
to be greatest when it is understood and is found to be
credible. If banks lacked clarity, their expectations and
actions would be less likely to adapt to macroprudential
policy changes, so reducing the impact on lending. So
under discretion, there would be a risk of adjustments inmacroprudential policy needing to be somewhat larger than
under a rule.
• There might also be a bias towards forbearance, with
policymakers unwilling to act promptly to head off
problems.(1) If the act of intervening were perceived to
reflect badly on the regulator, they may be reluctant to face
up to problems. Such behaviour was evident in the crisis
amongst Savings and Loans institutions in the United
States, the extent of whose problems were effectively
masked in the hope that favourable macroeconomic
developments would allow the thrifts to recapitalise.(2) Asystem of prompt corrective action was instituted in
response, the intention being to provide a timely and
non-discretionary triggering mechanism for supervisory
actions.
• It is well known that regulators are commonly subject to
pressures to modify regulation. A discretionary regime may
be more susceptible to regulatory capture and the influence
of lobbying, especially at peaks and troughs of the credit
cycle when macroprudential policy would likely be doing
most work.(3)
6.2 Constraining discretion in a macroprudential
regime
Given those potential costs to discretionary action, how could
a macroprudential regime be buttressed to make it more
transparent, predictable and accountable — a regime of
‘constrained discretion’? There are several potential options
including:
• Objectives: In the near-term, it seems unrealistic to think
that it would be possible to settle on an easily
comprehensible numerical target for macroprudential
policy, equivalent to the inflation target in a monetary
policy context. But that need not be fatal. Many public
policy frameworks operate effectively with a qualitative
objective, which here would be maintaining a stable supply
of financial intermediation services to the real economy
(Section 2). Given time, it may be possible to refine this
objective by better defining the authorities’ risk tolerance.
Because financial instability is a low probability tail event,
however, there are clear constraints on how meaningful andcredible quantitative objectives could be.
• Decision-making framework: To increase the effectiveness
of macroprudential policy decisions, the regime might
usefully set out in some detail the process and analysis
which underpins decision-making. This would amount to
communicating the macroprudential policy ‘reaction
function’. It would include setting out a menu of
instruments around which policy decisions would be based
— for example, in addressing cyclical risk, the categories of
‘risk weight’ which might be adjusted and in what sizedsteps, and the extent of reliance on ‘headline’ capital
requirements. It might include a listing and evaluation of
the set of indicators that would be used in the calibration —
for example, what variables best capture ‘exuberance’ in a
particular sector. If stress-testing were used to help
calibrate surcharges, details of the stress scenarios might be
made available. Some of this information and these
judgements are already regularly made available by the
authorities — for example, by the Bank of England through
the publication of its bi-annual Financial Stability Report and
by the Financial Services Authority in its Financial Risk
Outlook . But in a macroprudential regime such reports
would probably take on greater significance, explaining the
operation of the policy regime and the justification for
policy choices.
• Decision-making: Having defined the decision-making
framework, it would be important that policy decisions
themselves were communicated clearly and understood.
One possibility would be for macroprudential policy to be
set on a fixed timetable which was transparent to the wider
world. For example, decisions might be made on, say, a
six-monthly cycle, but with the option of intervening morefrequently if developments were sufficiently significant.
Another, not mutually exclusive option, would be for policy
decisions themselves to be publicly communicated, both as
a means of enhancing transparency and to strengthen
market discipline over banks’ decision-making. Either way,
it would be important that the authorities were able to
explain their decisions. That might be achieved via a formal
policy announcement and/or published minutes on the
decision-making process.
(1) See Dewatripont and Tirole (1994).(2) See Kane (1989).(3) See Stigler (1971).

8/20/2019 Bank of England, Tha Role of Macroprudential Policy
http://slidepdf.com/reader/full/bank-of-england-tha-role-of-macroprudential-policy 30/38
Discussion Paper November 2009 29
• Accountability: Macroprudential policy decisions involve
an important element of social choice. For instance, the
degree to which society values stability over growth, or the
extent to which the actions of individual firm’s behaviour
can be legitimately constrained for the benefit of the
system as a whole. It is important, therefore, thatmacroprudential policy decisions are backed by a clear,
explained mandate set by governments or legislatures. This
would be vital to ensure appropriate accountability to such
bodies and to the general public about macroprudential
decisions. Published reports can enhance transparency,
allowing policy judgements to be explained and the analysis
behind them to be set out. Appearances before
parliamentary committees serve a similar purpose. Having
to explain why certain policy actions have been taken and
why others have not would act as a substantial constraint
on discretion. It would be likely to sharpen policymakers’incentives to avoid showing forbearance and to act
promptly to stem incipient problems. Parliamentary
scrutiny may also provide legitimacy for policies which
could face lobbying pressures — for example, ‘taking the
punch bowl away’ from a credit boom in full swing. The
precise modalities of accountability may need to take into
account the extent of international co-ordination
(Section 7).
Taken together, these features might help to form a
macroprudential regime which, while largely judgemental,
could still aim to be sufficiently systematic, transparent andaccountable. The regime could be designed to place
constraints on the exercise of discretion. A macroprudential
policy regime of this type would, in many respects, be similar
in spirit to frameworks for monetary policy — a regime of
so-called ‘constrained discretion’. In general, regimes with
these mixed features are generally felt to be more robust and
time-consistent than either a fixed rule or pure discretion.
A systematic, transparent and accountable macroprudential
regime should be easier to integrate alongside the existing
arms of public policy. A well-defined macroprudential regime
would enable monetary, fiscal and microprudential
policymakers to take into account macroprudential policy in
the course of their decision-making and vice versa. This could
contribute to a greater degree of co-ordination in public policy
overall. But on each of these issues, a lot more debate and
analysis would be needed to make any such regime a reality.
SummaryThis section has suggested that it may be unlikely that
macroprudential instruments of the kind described earlier
could be set wholly according to a fixed rule. All available
evidence would need to be weighed and policymakers would
themselves need to adapt as they learned about how their
instruments affected behaviour. But it would be important
that constraints were placed on a macroprudential regime to
ensure transparency and accountability. That would call for
clarity around the objectives of macroprudential policy, the
framework for decision-making, and the policy decisions
themselves. It also suggests a need for robust accountability
mechanisms. Such a macroprudential regime of ‘constraineddiscretion’ would share some similarities with existing
macroeconomic policy frameworks.
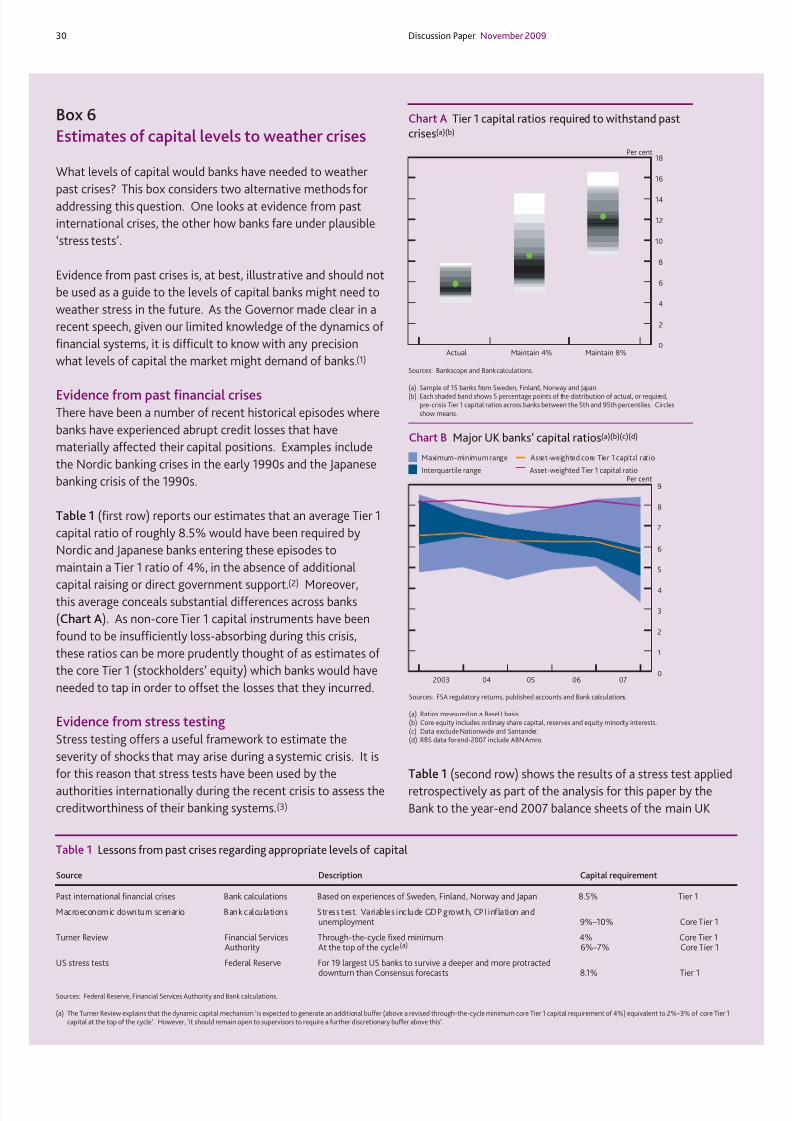
8/20/2019 Bank of England, Tha Role of Macroprudential Policy
http://slidepdf.com/reader/full/bank-of-england-tha-role-of-macroprudential-policy 31/38
30 Discussion Paper November 2009
Box 6
Estimates of capital levels to weather crises
What levels of capital would banks have needed to weather
past crises? This box considers two alternative methods foraddressing this question. One looks at evidence from past
international crises, the other how banks fare under plausible
‘stress tests’.
Evidence from past crises is, at best, illustrative and should not
be used as a guide to the levels of capital banks might need to
weather stress in the future. As the Governor made clear in a
recent speech, given our limited knowledge of the dynamics of
financial systems, it is difficult to know with any precision
what levels of capital the market might demand of banks.(1)
Evidence from past financial crisesThere have been a number of recent historical episodes where
banks have experienced abrupt credit losses that have
materially affected their capital positions. Examples include
the Nordic banking crises in the early 1990s and the Japanese
banking crisis of the 1990s.
Table 1 (first row) reports our estimates that an average Tier 1
capital ratio of roughly 8.5% would have been required by
Nordic and Japanese banks entering these episodes to
maintain a Tier 1 ratio of 4%, in the absence of additional
capital raising or direct government support.(2)
Moreover,this average conceals substantial differences across banks
(Chart A). As non-core Tier 1 capital instruments have been
found to be insufficiently loss-absorbing during this crisis,
these ratios can be more prudently thought of as estimates of
the core Tier 1 (stockholders’ equity) which banks would have
needed to tap in order to offset the losses that they incurred.
Evidence from stress testing
Stress testing offers a useful framework to estimate the
severity of shocks that may arise during a systemic crisis. It is
for this reason that stress tests have been used by the
authorities internationally during the recent crisis to assess thecreditworthiness of their banking systems.(3)
Table 1 (second row) shows the results of a stress test applied
retrospectively as part of the analysis for this paper by theBank to the year-end 2007 balance sheets of the main UK
Table 1 Lessons from past crises regarding appropriate levels of capital
Source Description Capital requirement
Past international financial crises Bank calculations Based on experiences of Sweden, Finland, Norway and Japan 8.5% Tier 1
Macroeconomic downturn scenario Bank calculations Stress test. Variables include GDP growth, CPI inflation andunemployment 9%–10% Core Tier 1
Turner Review Financial Services Through-the-cycle fixed minimum 4% Core Tier 1Authority At the top of the cycle(a) 6%–7% Core Tier 1
US stress tests Federal Reserve For 19 largest US banks to survive a deeper and more protracteddownturn than Consensus forecasts 8.1% Tier 1
Sources: Federal Reserve, Financial Services Authority and Bank calculations.
(a) The Turner Review explains that the dynamic capital mechanism ‘is expected to generate an additional buffer (above a revised through-the-cycle minimum core Tier 1 capital requirement of 4%) equivalent to 2%–3% of core Tier 1capital at the top of the cycle’. However, ‘it should remain open to supervisors to require a further discretionary buffer above this’.
0
1
2
3
4
5
6
7
8
9
2003 04 05 06 07
Per centInterquartile range
Maximum-minimum range Asset-weighted core Tier 1 capital ratio
Asset-weighted Tier 1 capital ratio
Chart B Major UK banks’ capital ratios(a)(b)(c)(d)
Sources: FSA regulatory returns, published accounts and Bank calculations.
(a) Ratios measured on a Basel I basis.(b) Core equity includes ordinary share capital, reserves and equity minority interests.(c) Data exclude Nationwide and Santander.(d) RBS data for end-2007 include ABN Amro.
0
2
4
6
8
10
12
14
16
18
Actual Maintain 4% Maintain 8%
Per cent
Chart A Tier 1 capital ratios required to withstand pastcrises(a)(b)
Sources: Bankscope and Bank calculations.
(a) Sample of 15 banks from Sweden, Finland, Norway and Japan.(b) Each shaded band shows 5 percentage points of the distribution of actual, or required,
pre-crisis Tier 1 capital ratios across banks between the 5th and 95th percentiles. Circlesshow means.

8/20/2019 Bank of England, Tha Role of Macroprudential Policy
http://slidepdf.com/reader/full/bank-of-england-tha-role-of-macroprudential-policy 32/38
Discussion Paper November 2009 31
banks — the peak of the credit cycle. The scenario assumes
paths for macroeconomic and financial variables consistent
with a severe but plausible slowdown in the UK economy,
anchored around the profiles observed in the early 1980s
recession. Under these conditions, banks would have needed
to enter the crisis with core Tier 1 capital or instrumentsconvertible(4) into core Tier 1 capital of around 10% of their
year-end 2007 risk weighted assets in order to have been able
to keep their core Tier 1 ratio above 4% throughout the crisis
without recourse to additional capital raising from the markets
or the government.(5) This is almost double average levels of
core Tier 1 capital at the onset of the crisis (Chart B).
Table 1 (fourth row) shows the results from the stress tests
co-ordinated by the Federal Reserve earlier this year, as applied
to the 19 largest US banks. These suggested that a Tier 1
capital ratio of around 8% was necessary to ensure those
institutions could survive a deeper and more protracted
downturn than implied by Consensus forecasts.
(1) See King (2009b). The estimates do not refer to minimum regulatory capitalrequirements and do not take account of the proposed changes to the definitions of capital eligible to meet such requirements.
(2) Based on realised retained income over the crisis periods for a sample of Nordic and Japanese banks and making a number of other simplifying assumptions, including thatdividend payments to shareholders and the paths of risk-weighted assets remained asobserved in reported accounts.
(3) Box 4 from the October 2008 Bank of England Financial Stability Report explains thelogic behind the stress-testing approach used in recapitalising the UK banks inAutumn 2008. Details of stress tests performed by the US authorities can be found inBoard of Governors of the Federal Reserve System (2009).
(4) It is assumed that such convertible capital would convert into core Tier 1 capital if thecore Tier 1 ratio fell below a certain threshold (where that threshold is above 4%).
(5) Adopting a through-the-cycle microprudential minimum of 4% core Tier 1 capital, assuggested in FSA (2009a).

8/20/2019 Bank of England, Tha Role of Macroprudential Policy
http://slidepdf.com/reader/full/bank-of-england-tha-role-of-macroprudential-policy 33/38
32 Discussion Paper November 2009
7 Operational issues
There would be a number of important practical challenges in
implementing a macroprudential policy regime along the lines
discussed in previous sections. Among the more important are
institutional coverage, international scope and datarequirements, as discussed in turn below.
7.1 Institutional coverageIn determining the appropriate institutional boundary of a
macroprudential policy regime, there would be broadly two
alternative approaches:
• Restricting coverage to deposit-taking institutions (‘banks’);
and
• Including any institution engaged in material maturitytransformation and/or leveraged finance.
Under the first approach, the perimeter of macroprudential
regulation would be the banking sector. Aggregate or sectoral
capital surcharges would aim to ensure that the banking sector
was resilient over time to aggregate risk; and systemic capital
surcharges would aim to offset spillover effects from the
failure or distress of individual banks onto the banking system.
A possible drawback of this approach would be that
disintermediation may shift systemic risk into the unregulated
sector — for example, ‘shadow banks’. But if banks’ exposures
to non-banks were tightly controlled, this problem may be
contained: there seem to be few examples of highly leveraged
non-bank institutions that are not reliant, directly or indirectly,
on bank credit and bank-provided liquidity lines. Additional
macroprudential tools could also be employed to contain the
disintermediation problem — for example, time-varying
margins on hedge funds’ secured borrowing (Section 4.3).
Under the second approach, coverage would be extended to a
wider set of institutions. The treatment of ‘shadow banks’
would then be the same as deposit-taking institutions, withtime series surcharges applied to real economy exposures and
cross-section charges applied to offset spillover effects. This
option has two drawbacks. First, operational complexity, as it
requires monitoring and regulation of perhaps a far larger set
of institutions. Second, there might be greater risk of moral
hazard if non-banks were perceived as having gained access to
the official sector safety net.
7.2 International scopeLeakages from prudential regulatory regimes are inevitable
(Box 7). From an international perspective, a macroprudentialregime would be susceptible to four broad sources of potential
leakage or arbitrage:
• Lending via foreign branches: foreign-owned banks can
operate in the United Kingdom via branches that are subject
to capital requirements imposed by their home authorities.
If capital requirements on these firms’ UK exposures were
lower than those imposed on UK-registered firms, they
could exploit their competitive advantage by increasinglending to the UK real economy.
• Direct cross-border lending: foreign-owned banks not
subject to tougher capital requirements could lend
cross-border to the UK real economy, either directly or via
corporate bond or commercial paper markets.
• Foreign lending via domestic non-bank financial companies:
foreign-owned banks could lend through wholesale markets
to UK non-bank financial companies which could, in turn,
lend these funds on to the real economy.
• Intragroup corporate lending: corporates could borrow
abroad from foreign-owned banks and then lend intragroup
to their UK arm.
Some of these channels of intermediation are, of course,
already large. For example, lending by foreign branches
accounts for a material share of total corporate lending by
UK-resident banks (Chart 7.1). Under European Union single
market rules, banks headquartered in an EEA member state
have the right to open branches in other member states or to
provide cross-border services.
International co-ordination might be one means of containing
potential leakage problems. Ideally, there would be explicit
co-ordination of the setting of macroprudential regulatory
requirements. Importantly, this co-ordination would focus on
the ultimate destination of these funds (the ‘host’), at least as
Total UK
claims
Claims on
banks
Lending to
OFCs(a)Lending to
PNFCs(a)Lending to
households(a)
Per cent
0
20
40
60
80
100
UK-owned EEA branches
EEA subsidiaries Non-EEA branches
Non-EEA subsidiaries
Chart 7.1 UK-resident banks’ claims by sector, end-2008
Source: Bank of England.
(a) Loans and advances and claims under sale and repurchase agreements (reverse repos).

8/20/2019 Bank of England, Tha Role of Macroprudential Policy
http://slidepdf.com/reader/full/bank-of-england-tha-role-of-macroprudential-policy 34/38
Discussion Paper November 2009 33
much as the source of these funds (the ‘home’). For example,
under an explicit international accord, control over the
regulatory requirements applied to exposures to UK residents
could reside with the UK authorities, irrespective of the origin
of the lender.
Practical constraints mean that a high degree of international
co-ordination, while clearly desirable, may not be feasible, at
least initially. In that event, a regime of international
communication and co-ordination of macroprudential analysis
and requirements may be more feasible. National regulators
might be encouraged to make clear to the international
regulatory community their concerns about exuberance within
their domestic economies. This could then be an input to
influence macroprudential choices among regulators of banks
which are big lenders into the United Kingdom.
For example, if the UK authorities were to raise capital
requirements on, say, UK commercial property exposures of
UK-registered banks, this decision might be communicated to
home regulators of overseas-domiciled banks lending into this
market. These authorities might then consider regulating the
UK commercial property exposures of their home banks more
stringently. Over time, this approach might evolve into
effective international regulatory co-ordination with a
system-wide orientation. However, for this approach to work,
a very great deal would need to be considered, including how
to maintain a relatively level playing field among different
regulatory jurisdictions.
7.3 Data requirementsThere are large data gaps that would need to be filled before a
macroprudential policy regime could be made operational.
Sufficient data would be needed to capture the evolution of
both the aggregate risk of the consolidated financial system
over time and the network risk operating across institutions at
any point in time.
Consolidated balance sheet information for the financial
system, netting out intrafinancial system assets and liabilities,would be required to evaluate aggregate leverage and
maturity mismatch. Data on the consolidated balance sheet
could be constructed bottom-up from the balance sheets of
individual financial institutions, both branches and
subsidiaries. Table 4.1 lists the set of information that might
be required.
Many of these indicators are already collected by regulators,
but in some cases without sufficient granularity. For example,
for some home countries there is insufficiently detailed
information on the geographical split of banks’ overseas
exposures. Perhaps most pressing would be a need for more
detailed and timely reporting of exposures to the non-bank
financial sector, including hedge funds, securities dealers,
private equity funds and insurance companies.
Turning to network risk, data on the network of counterparty
exposures between financial institutions is, at best, partial atpresent. Regulatory large exposures data provide some
information. But this would be an insufficient basis for
assessing accurately the complex web of financial connections
between firms, on and off balance sheet. Table 5.1 sets out
some of data required for this purpose. There would also be
questions about the appropriate frequency with which this
information should be collected, given the possibility of
exposure positions adjusting significantly and rapidly,
especially in situations of financial stress. There would also
need to be careful consideration of whether any of this
information should be publicly disclosed, consistent with not
falling foul of commercial confidentiality constraints forindividual firms.(1)
SummaryThis section has outlined some of the important practical
challenges in implementing a macroprudential policy regime.
International arbitrage (through branching and cross-border
lending) might significantly weaken the effectiveness of
macroprudential policies. To be wholly effective, the
macroprudential regime might require significant international
co-ordination, although in its absence appropriate
macroprudential instruments might still be able to serve tostrengthen the resilience of the domestic banking sector.
(1) Squam Lake (2009b) proposes disclosure of regulatory data to the private sector, withtime lags to protect proprietary information.
8/20/2019 Bank of England, Tha Role of Macroprudential Policy
http://slidepdf.com/reader/full/bank-of-england-tha-role-of-macroprudential-policy 35/38
34 Discussion Paper November 2009
Box 7Leakages in past regulations
The problem of disintermediation is endemic to financial
regulation.(1)
Recent financial history provides a number of instructive examples of the powerful incentives that exist to
circumvent regulation. In the United Kingdom, these include
direct credit ceilings in the 1960s and the supplementary
special deposit scheme, also known as the ‘Corset’, in the
1970s. International examples include federal margin and
deposit interest rate regulation after the Great Depression in
the United States and the introduction of Basel I. Most of the
examples were not primarily directed at prudential regulation
— many were seen as monetary policy instruments. But
without exception, they all resulted in financial activity leaking
to the unregulated sector. This box draws lessons from past
episodes of financial disintermediation.
Direct credit ceilings (1961–71)In the United Kingdom, direct ceilings on the growth in lending
to the private sector were enforced on clearing banks in the
1960s through to the introduction of Competition and Credit
Control in 1971. Although these appeared to be effective in
limiting credit creation by the firms they covered, financial
activity migrated to the less regulated secondary banks. These
fringe institutions developed large exposures to the
commercial property sector, financed through the wholesale
market, including from the clearing banks. The emergence of this highly vulnerable ‘shadow’ banking system culminated in
the Secondary Banking Crisis in the mid-1970s, forcing the
Bank of England to intervene for fear of a loss of depositor
confidence in the core banking sector.(2)
Supplementary special deposit scheme — ‘the Corset’(1973–80)The implementation of the ‘Corset’ at different phases
between 1973 and 1980 aimed to limit the rapid growth in
credit that had occurred following the introduction of
Competition and Credit Control in 1971.(3) Banks were
required to hold a share of their assets as non-interest bearingreserves if growth in certain sterling interest-bearing (retail
and wholesale) deposits grew beyond a specified limit.
These rules were quickly circumvented. Instead of borrowing
directly from banks, large companies financed themselves by
issuing bills that were guaranteed (accepted) by banks. The
growing ‘bill mountain’ had to be factored into monetary
policy decisions at the time. Non-bank financial institutions
were willing to buy these bills in the knowledge that they were
guaranteed by the major banks. Financial activity also diverted
to building societies which were not covered by the scheme.During the Corset period, building societies’ share of personal
sector deposits grew substantially and was used to finance
rapid growth in mortgage lending. Following the abolition of
the Corset, there was large-scale re-intermediation and a
marked increase in conventional measures of broad money
and bank lending growth.
Margin and Deposit Interest Rate Regulation(1933–34)US Federal regulations governing minimum initial margin
requirements have been in place since 1934, but there has
been no change in their level since the early 1970s because of
doubts about their effectiveness given the development of
derivatives and other financial innovation. Regulation Q —
which imposed ceilings on the interest rates that financial
institutions in the United States could pay on deposits —
spurred the development of the Eurodollar market in London,
especially after it was tightened in 1963.(4)
The Basel Capital Accord (1992–2007)At an international level, the incentive structure underlying the
original 1988 Basel Capital Accord contributed to the rapid
growth in securitisation over the past two decades. Banks
responded to the imposition of risk-weighted capital
requirements by engaging in regulatory arbitrage. Exposures
with high regulatory capital relative to economic capital were
shifted off balance sheet. The problem, as witnessed during
the current crisis, is that many of the vehicles used to
securitise these assets remained reliant on banks, actually or
implicitly through reputational effects. So when liquidity risks
materialised they were borne, to a significant extent, by theregulated institutions.
This historical experience with international leakages from
regulatory frameworks underscores the importance of
international co-ordination in implementing a robust
macroprudential regime.
(1) As Goodhart (2008) states, ‘effective regulation, one that actually bites, is likely topenalise those within the regulated sector, relative to those just outside, causing
substitution flows towards the unregulated’.(2) Bank of England (1978).(3) Bank of England (1982).(4) Milton (1971).

8/20/2019 Bank of England, Tha Role of Macroprudential Policy
http://slidepdf.com/reader/full/bank-of-england-tha-role-of-macroprudential-policy 36/38
Discussion Paper November 2009 35
8 Conclusion
Effective macroprudential policy instruments are an important
missing ingredient from the current policymaking toolkit, in
the United Kingdom and internationally. Had they existed, the
current crisis might plausibly have been less costly for the realeconomy. This discussion paper identifies some of the issues
around how a macroprudential policy regime might be
envisaged and made operational. It does not reach definitive
answers and does not seek to advocate a particular operational
regime. A lot of further work would be required before policies
such as these could be ready to be put into practice. But it
does suggest some directions for the international policy
debate in the period ahead. The Bank of England would
welcome comments on, and criticisms of, the ideas expressed
in this paper. Comments should be sent to:
Victoria Saporta
Head of Prudential Policy Division
Bank of England
Threadneedle Street
London, EC2R 8AH
Or by email to: [email protected]

8/20/2019 Bank of England, Tha Role of Macroprudential Policy
http://slidepdf.com/reader/full/bank-of-england-tha-role-of-macroprudential-policy 37/38
36 Discussion Paper November 2009
References
Acharya, V and Richardson, M (eds) (2009), Restoring financial
stabil ity: how to repair a failed syste m, Wiley Finance, March.
Adrian, T and Brunnermeier, M (2009), ‘CoVaR’, mimeo, Princeton.
Aikman, D, Alessandri, P, Eklund, B, Gai, P, Kapadia, S, Martin, E,
Mora, N, Sterne, G and Willison, M (2009), ‘Funding liquidity risk in
a quantitative model of systemic stability’, Bank of England Working
Paper no. 372.
Alessandri, P and Haldane, A (2009), ‘Banking on the state’, based
on a presentation delivered at the Federal Reserve Bank of Chicago
conference on ‘The international financial crisis: have the rules of
finance changed?’, September.
Anderson, R and May, R (1991), Infectious diseases of humans:
dynamics and control, OUP.
Bank for International Settlements (2007), 77th Annual Report.
Bank for International Settlements (2008), Principles for sound
liquidity risk management and supervision, Basel.
Bank for International Settlements (2009), 79th Annual Report.
Bank of England (1978), ‘The secondary banking crisis and the Bank
of England’s support operations’, Bank of England Quarterly Bulletin,
June, pages 230–39.
Bank of England (1982), ‘The supplementary special deposits
scheme’, Bank of England Quarterly Bulletin, March, pages 74–85.
Bank of England (2000), Financial Stability Review , June, page 10.
Bank of England (2008a), The Development of the Bank of England’s
Market Operations, page 27.
Bank of England (2008b), Financial Stability Report, October.
Bank of England (2009), Financial Stability Report, June.
Bean, C (2009), ‘The Great Moderation, the Great Panic and the
Great Contraction’, Schumpeter Lecture to the Annual Congress of the
European Economic Association, August.
Board of Governors of the Federal Reserve System (2009), ‘The
Supervisory Capital Assessment Program: Overview of Results’.
Bordo, M, Eichengreen, B, Klingebiel, D and Martinez-Peria, M S
(2001), ‘Is the crisis problem growing more severe?’, Economic Policy ,
Vol. 16, No. 1, pages 51–82.
Borio, C (2009), ‘Implementing the macro-prudential approach to
financial regulation and supervision’, Banque de France Financial
Stability Review , No. 13 — The Future of Financial Regulation,September.
Borio, C and Drehmann, M (2009), ‘Assessing the risk of banking
crises — revisited’, BIS Quarterly Review , March, pages 29–46.
Boss, M, Krenn, G, Puhr, C and Summer, M (2006), ‘Systemic Risk
Monitor: a model for systemic risk analysis and stress testing of
banking systems’, Financial Stability Report, Oesterreichische
Nationalbank, Issue 11, pages 83–95, June.
Brunnermeier, M, Crockett, A, Goodhart, C, Persaud, A and Shin, H
(2009), ‘The fundamental principles of financial regulation’,
ICMB-CEPR Geneva Report on the World Economy 11.
Brunnermeier, M and Pederson, L (2009), ‘Market liquidity and
funding liquidity’, Review of Financial Studies, Vol. 22(6),
pages 2,201–38.
Calomiris, C (2009), ‘Banking crises and the rules of the game’, NBER
Working Paper no. 15403, October.
Calomiris, C and Kahn, C (1991), ‘The role of demandable debt in
structuring optimal banking arrangements’, America n EconomicReview , Vol. 81, pages 497–513.
Carney, M (2009), ‘Some consideration on using monetary policy to
stabilize economic activity’, remarks at Jackson Hole, Wyoming,
22 August.
Dale, S (2009), ‘Inflation targeting: learning the lessons from the
financial crisis’, speech at the Society of Business Economists’ Annual
Conference, June.
Dewatripont, M and Tirole, J (1994), The prudential regulation of
banks, Cambridge, Massachusetts, MIT Press.
Diamond, D and Dybvig, P (1983), ‘Bank runs, deposit insurance, and
liquidity’, Journal of Poli tical Economy .
Farhi, E and Tirole, J (2009), ‘Collective moral hazard, maturity
mismatch and systemic bailouts’, NBER Working Paper no. 15138.
Financial Services Authority (2009a), The Turner Review: a
regulatory response to the global banking crisis .
Financial Services Authority (2009b), ‘The Turner Review
Conference Discussion Paper’, DP09/4, October.
Goodhart, C (2008), ‘The boundary problem in financial regulation’,
National Institute Economic Review , Vol. 206, pages 48–55.

8/20/2019 Bank of England, Tha Role of Macroprudential Policy
http://slidepdf.com/reader/full/bank-of-england-tha-role-of-macroprudential-policy 38/38
Discussion Paper November 2009 37
G30 (2009), Financial reform: a framework for financial stability , by
the Working Group on Financial Reform chaired by Paul Volcker.
Haldane, A (2009a), ‘Why banks failed the stress test’, speech at the
Marcus-Evans Conference on Stress Testing, 9–10 February.
Haldane, A (2009b), ‘Rethinking the financial network’, speech at the
Financial Student Association Amsterdam, April.
Hellwig, M (1995), ‘Systemic aspects of risk management in banking
and finance’, Schweizerische Zeitschriftfür Volkswirtschaft und
Statistik , Vol. 131, pages 723–37.
HM Treasury (2009), Reforming financial markets, London.
International Accounting Standards Board (2009), ‘Financial
instruments: amortised cost and impairment’, Exposure Draft
ED/2009/12.
International Monetary Fund (2009), ‘Lessons for monetary policy
from asset price fluctuations’, World Economic Outlook , Chapter 3,
October.
IMF/BIS/FSB (2009), ‘Guidance to assess the systemic importance of
financial institutions, markets and instruments: initial considerations
— background paper’, Report to the G20 Finance Ministers and
Central Bank Governors.
Jensen, M (1986), ‘Agency costs of free cash flow, corporate finance
and takeovers’, America n Economic Revi ew , Vol. 76, pages 323–29.
Kane, E J (1989), The S&L insurance mess: how did it happen?,
University Press of America.
Kay, J (2009), ‘Narrow banking: the reform of banking regulation’,
CSFI paper , September.
Kindleberger, C P (1978), Manias, panics and crashes: a history of
finan cial cri ses, Palgrave Macmillan.
King, M (2009a), ‘Finance: a return from risk’, speech at the
Mansion House, March.
King, M (2009b), speech to Scottish Business Organisations in
Edinburgh on 20 October.
Kohn, D (2008), ‘Monetary policy and asset prices revisited’, speech
to the Cato Institute’s annual monetary policy conference,
Kupiec, P (1997), ‘Margin requirements, volatility and market
integrity: what have we learned since the crash?’, Board of Governors
of the Federal Reserve System Finance and Economics Disc ussion
Series, FEDS Paper No. 97-22.
Kydland, F and Prescott, E (1977), ‘Rules rather than discretion:
the inconsistency of optimal plans’, Journa l of Political E conomy ,
Vol. 85(3), pages 473–91.
Merton, R (1974), ‘On the pricing of corporate debt: the risk
structure of interest rates’, Journal of Fin ance, Vol. 2, pages 449–70.
Milton, F (1971), ‘The euro-dollar market: some first principles’,
Federal Reserve Bank of St. Louis.
Minsky, H (1986), Stabilizing an unstable economy , New Haven:
Yale University Press.
Modigliani, F and Miller, M (1958), ‘The cost of capital, corporation
finance and the theory of investment’, America n Economic Revi ew ,
Vol. 48, pages 261–97.
Perotti, E and Suarez, J (2009), ‘Liquidity insurance charges as a
macro-prudential tool’, mimeo, University of Amsterdam and CEMFI.
Rabin, M (1998), ‘Psychology and economics’, Journal of Economic
Literature, Vol. 36, No. 1, pages 11–46.
Scharfstein, D and Stein, J (1990), ‘Herd behaviour and investment’,
American Economic Review , Vol. 80, pages 465–79.
Squam Lake Working Group on Financial Regulation (2009a),
‘Reforming capital requirements for financial institutions’, April.
Squam Lake Working Group on Financial Regulation (2009b), ‘A
new information infrastructure for financial markets’, February.
Stigler, G (1971) ‘The theory of economic regulation’, Bell Journal of
Economics, The RAND Corporation, Vol. 2(1), pages 3–21, Spring.
Tarashev, N, Borio, C and Tsatsaronis, K (2009), ‘The systemic
importance of financial institutions’, BIS Quarterly Review ,
September, pages 75–87.
Trichet, J C (2007), ‘Prepare for asset repricing, warns Trichet’, article
in Financial Times, 29 January.
Tucker, P (2009), ‘The debate on financial system resilience:
d i l i ’ B l A l L L d