Bank of America Merrill Lynch 16th Annual Canada Mining...
32
Bank of America Merrill Lynch 16 th Annual Canada Mining Conference September 2010
Transcript of Bank of America Merrill Lynch 16th Annual Canada Mining...

Bank of America Merrill Lynch 16th Annual Canada Mining Conference
September 2010

Cautionary StatementUnder the Private Securities Litigation Reform Act
This presentation contains certain forward-looking statements within the meaning of the Private Securities Litigation Reform
Act of 1995. Such forward-looking statements involve known and unknown risks, uncertainties, and other factors that could
cause actual results to differ materially from the projections and estimates contained herein and include, but are not limited
to, the operator’s estimates of production over the first six years and over the life of the mine, the operator’s estimates of
reserves and resources, and mine life; estimated annual revenue potential; that in 2013, 67% of revenues will come from
mines with lives greater than 15 years; estimated 2013 pro forma revenue by commodity and property; estimated 2013 pro
forma royalty gold equivalent ounces; estimated growth in gold and silver reserves and resources; estimated schedules of
achieving production and other related mine development, construction and production start-up timetables; and that our
future principal properties will consist of Peñasquito, Andacollo, Pascua-Lama, Voisey’s Bay, and Mt. Milligan. Factors that
could cause actual results to differ materially from these forward-looking statements include, among others: that the Plan of
Arrangement between Thompson Creek and Terrane does not close; the completion of the Mt. Milligan transaction; the risks
inherent in construction, development and ramp up of operations of a new mine at Mt. Milligan by an operator who has not
previously operated gold mines; changes in gold and other metals prices; decisions and activities of the Company’s
management; decisions and activities of the operators of the Company’s royalty properties; unanticipated grade, geological,
metallurgical, processing or other problems at the properties; changes in project parameters as plans of the operators are
refined; the results of current or planned exploration activities; economic and market conditions; operations in land subject
to First Nations jurisdiction in Canada, the ability of operators to bring non-producing and not yet in development projects
into production and operate in accordance with feasibility studies; future financial needs of the Company; the impact of
future acquisitions and royalty financing transactions; changes in the Mining Law of 1872; the outcome of the court decision
regarding the appeal of the Holt royalty dispute; risks associated with conducting business in foreign countries, including
application of foreign laws to contract and other disputes, environmental laws, enforcement and uncertain political and
economic environments; and customary closing conditions. These risks and other factors are discussed in more detail in the
Company’s public filings with the Securities and Exchange Commission. Statements made herein are as of the date hereof
and should not be relied upon as of any subsequent date. The Company’s past performance is not necessarily indicative of
its future performance. The Company disclaims any obligation to update any forward-looking statements.
The Company and its affiliates, agents, directors and employees accept no liability whatsoever for any loss or damage of anykind arising out of the use of all or any part of this material.
2

Strong Financial Results
Period of Portfolio Transformation
Setting the Stage for Future Growth
Agenda
3
0.00
0.25
0.50
0.75
1.00
1.25
1.50
1.75
2.00
2.25
2.50
2.75
3.00
3.25
3.50
2005 2006 2007 2008 2009 2010Fiscal Years Ending June 30
0
20
40
60
80
100
120
140
($ in
mill
ion
s)
See footnotes on page 26
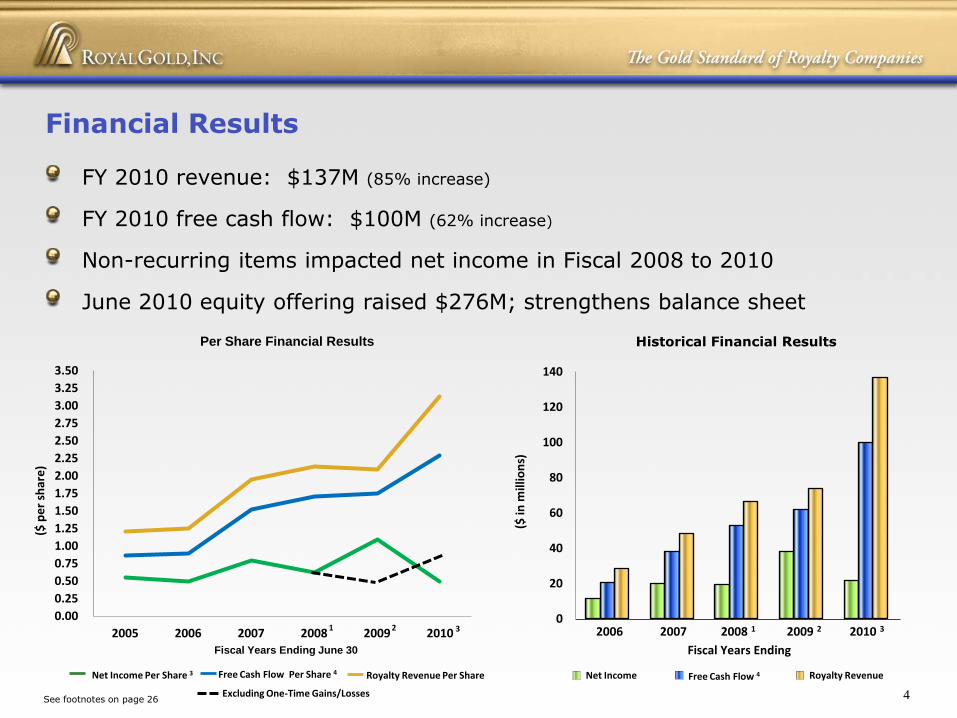
FY 2010 revenue: $137M (85% increase)
FY 2010 free cash flow: $100M (62% increase)
Non-recurring items impacted net income in Fiscal 2008 to 2010
June 2010 equity offering raised $276M; strengthens balance sheet
Financial Results
Per Share Financial Results Historical Financial Results
Free Cash Flow 4Net Income Royalty Revenue
Fiscal Years Ending
2006 2007 2008 1 2009 2 2010 3
4
($ p
er
shar
e)
2 3
Free Cash Flow Per Share 4Net Income Per Share 3 Royalty Revenue Per Share
1
Excluding One-Time Gains/Losses
0
50
100
150
200
250
1995 1997 1999 2001 2003 2005 2007 2009
Cu
mu
lati
ve R
eve
nu
e
($ m
illio
ns)
Fiscal Year Ending June 30,
Cumulative Cortez RevenueCortez Production (subject to royalty)
1.4
1.2
1.0
0.8
0.6
0.4
0.2
0
An
nu
al Pro
du
ction
Ou
nce
s (millio
ns)
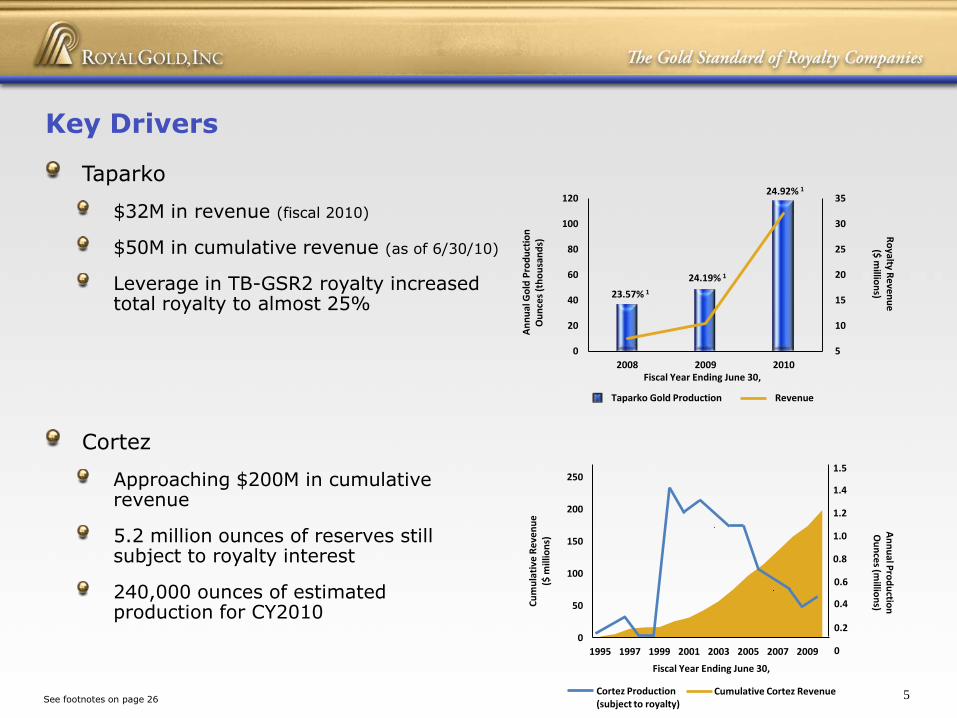
Taparko
$32M in revenue (fiscal 2010)
$50M in cumulative revenue (as of 6/30/10)
Leverage in TB-GSR2 royalty increasedtotal royalty to almost 25%
Cortez
Approaching $200M in cumulativerevenue
5.2 million ounces of reserves still subject to royalty interest
240,000 ounces of estimatedproduction for CY2010
5
10
15
20
25
30
35
0
20
40
60
80
100
120
2008 2009 2010
Ro
yalty Re
ven
ue
($ m
illion
s)
An
nu
al G
old
Pro
du
ctio
nO
un
ces
(th
ou
san
ds)
Fiscal Year Ending June 30,
23.57% 124.19% 1
24.92% 1
Key Drivers
5See footnotes on page 26
Taparko Gold Production Revenue
1.5
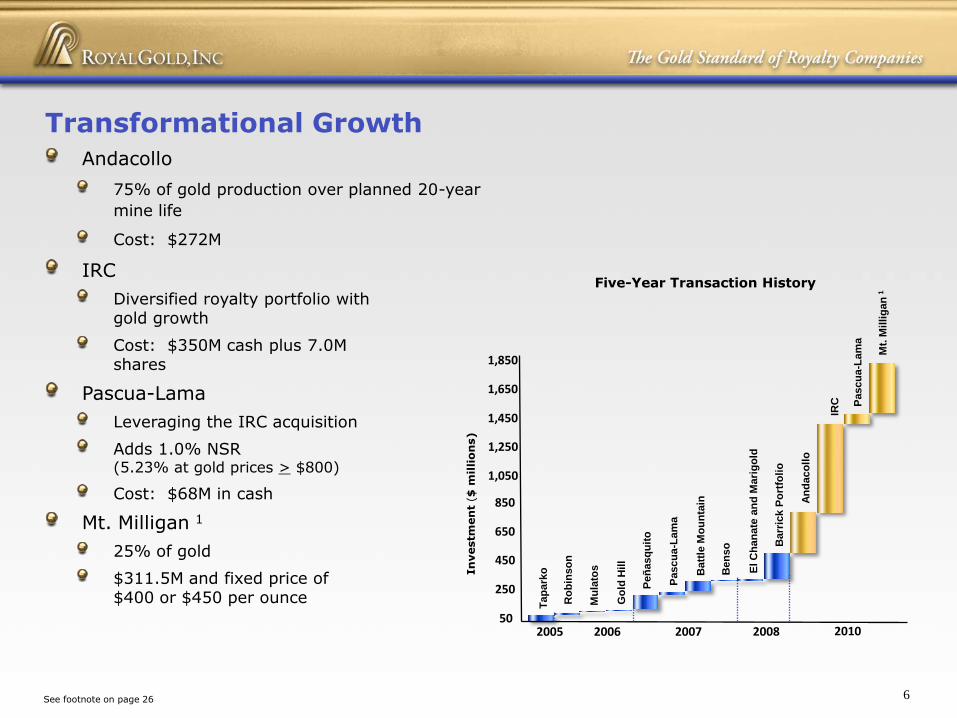
Andacollo
75% of gold production over planned 20-year
mine life
Cost: $272M
IRC
Diversified royalty portfolio with gold growth
Cost: $350M cash plus 7.0M shares
Pascua-Lama
Leveraging the IRC acquisition
Adds 1.0% NSR (5.23% at gold prices > $800)
Cost: $68M in cash
Mt. Milligan 1
25% of gold
$311.5M and fixed price of$400 or $450 per ounce
Transformational Growth
50
250
450
In
vestm
en
t ($
mil
lio
ns)
650
850
2005 2006 2007 2008
Mu
lato
s
Tap
ark
o
Go
ld H
ill
Peñ
asq
uit
o
Pascu
a-L
am
a
Batt
le M
ou
nta
in
Ben
so
El C
ha
nate
an
d M
ari
go
ld
Barr
ick P
ort
foli
o
An
da
co
llo
1,050
1,250
1,450
1,650
2010
Ro
bin
so
n
IRC
Mt.
Mil
lig
an
1
Pascu
a-L
am
a
1,850
6See footnote on page 26
Five-Year Transaction History

0
1
2
3
4
0
1
2
3
4
5
6
7
8
2004 2005 2006 2007 2008 2009
Ro
yalty Ou
nce
/Share
Ind
ex
Ou
nce
s (m
illio
ns)
Royalty Ounce Reserves 2
(calendar years ended December 31)
Indexed Total Equity PM Ounces (AuEq)/Share Index
Precious metal reserves subject to royalties increased 33% to 105.3M ounces 1
Precious metals royalty ounces in reserves increased 203% to 4.87M ounces 1
Organic growth demonstrated as properties in the portfolio on 12/31/08 added more reserves than were mined and processed
Reserve Growth - December 2008 to Present
0
20
40
60
80
100
120
Ou
nce
s (m
illio
ns)
Reserves Subject to Royalties (calendar years ended December 31)
20092005 2006 2007 2008
Silver (AuEq)Gold
Pro Forma(Mt. Milligan)
7See footnotes on page 26
Gold Silver
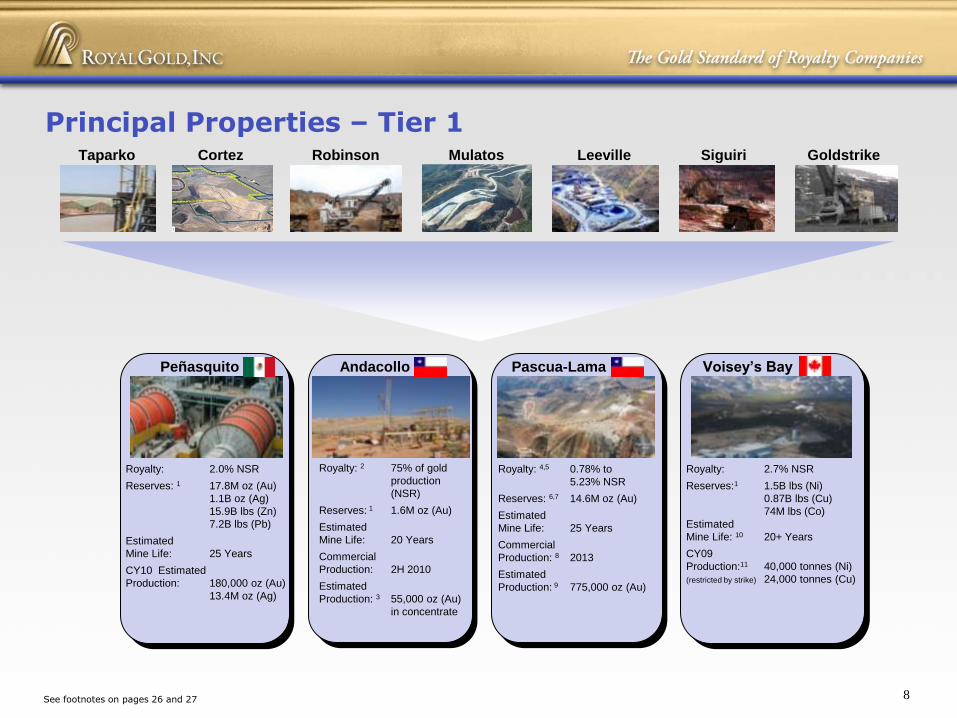
Principal Properties – Tier 1
See footnotes on pages 26 and 27
Taparko Cortez Robinson Mulatos Leeville Siguiri Goldstrike
Royalty: 2.0% NSR
Reserves: 1 17.8M oz (Au)
1.1B oz (Ag)
15.9B lbs (Zn)
7.2B lbs (Pb)
Estimated
Mine Life: 25 Years
CY10 Estimated
Production: 180,000 oz (Au)
13.4M oz (Ag)
Royalty: 2 75% of gold
production
(NSR)
Reserves: 1 1.6M oz (Au)
Estimated
Mine Life: 20 Years
Commercial
Production: 2H 2010
Estimated
Production: 3 55,000 oz (Au)
in concentrate
Royalty: 4,5 0.78% to
5.23% NSR
Reserves: 6,7 14.6M oz (Au)
Estimated
Mine Life: 25 Years
Commercial
Production: 8 2013
Estimated
Production: 9 775,000 oz (Au)
Royalty: 2.7% NSR
Reserves:1 1.5B lbs (Ni)
0.87B lbs (Cu)
74M lbs (Co)
Estimated
Mine Life: 10 20+ Years
CY09
Production:11 40,000 tonnes (Ni)
(restricted by strike) 24,000 tonnes (Cu)
Peñasquito Voisey’s BayAndacollo Pascua-Lama
8
-
5
10
15
20
25
30
35
40
2006 2007 2008 2009
Go
ld E
qu
ival
en
t O
un
ces
2
(mill
ion
s)
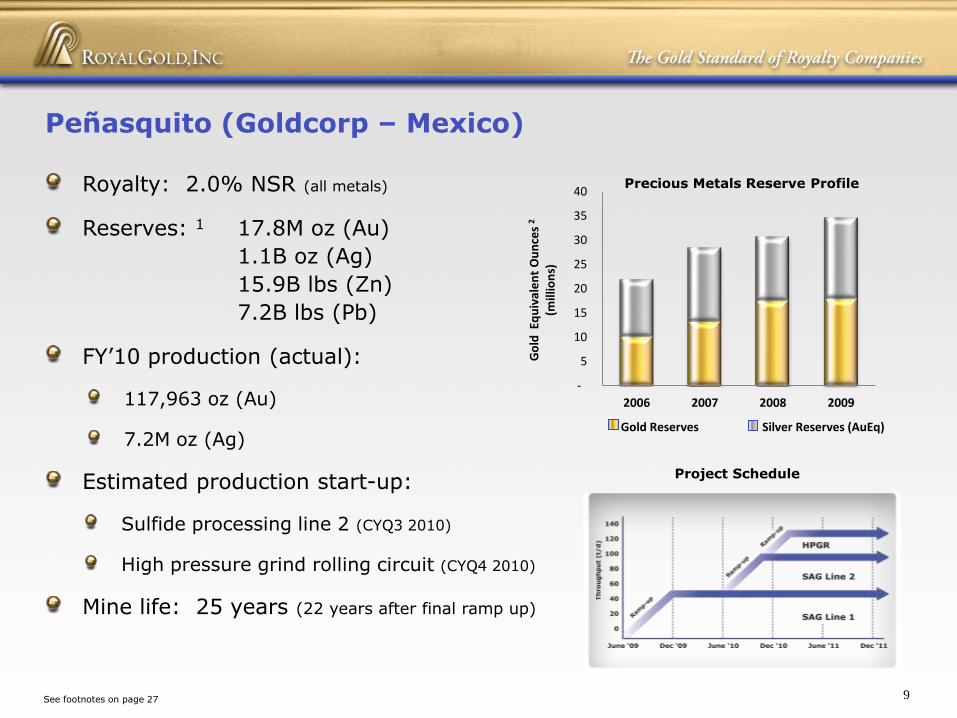
Royalty: 2.0% NSR (all metals)
Reserves: 1 17.8M oz (Au)
1.1B oz (Ag)
15.9B lbs (Zn)
7.2B lbs (Pb)
FY’10 production (actual):
117,963 oz (Au)
7.2M oz (Ag)
Estimated production start-up:
Sulfide processing line 2 (CYQ3 2010)
High pressure grind rolling circuit (CYQ4 2010)
Mine life: 25 years (22 years after final ramp up)
Gold Reserves
Precious Metals Reserve Profile
Peñasquito (Goldcorp – Mexico)
Project Schedule
Silver Reserves (AuEq)
9See footnotes on page 27
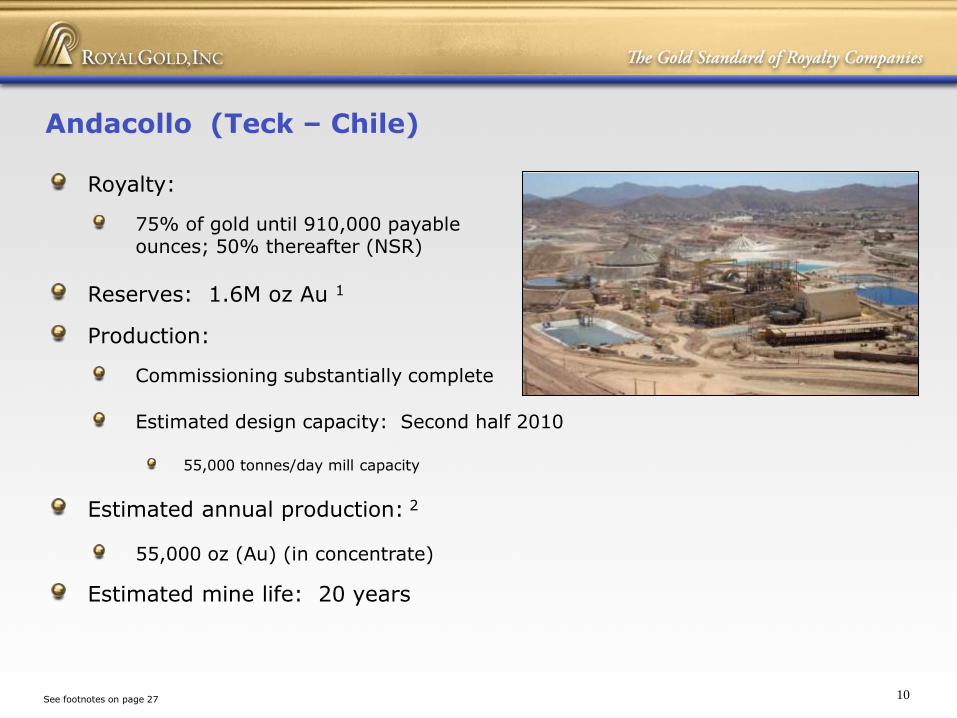
Royalty:
75% of gold until 910,000 payableounces; 50% thereafter (NSR)
Reserves: 1.6M oz Au 1
Production:
Commissioning substantially complete
Estimated design capacity: Second half 2010
55,000 tonnes/day mill capacity
Estimated annual production: 2
55,000 oz (Au) (in concentrate)
Estimated mine life: 20 years
Andacollo (Teck – Chile)
10See footnotes on page 27
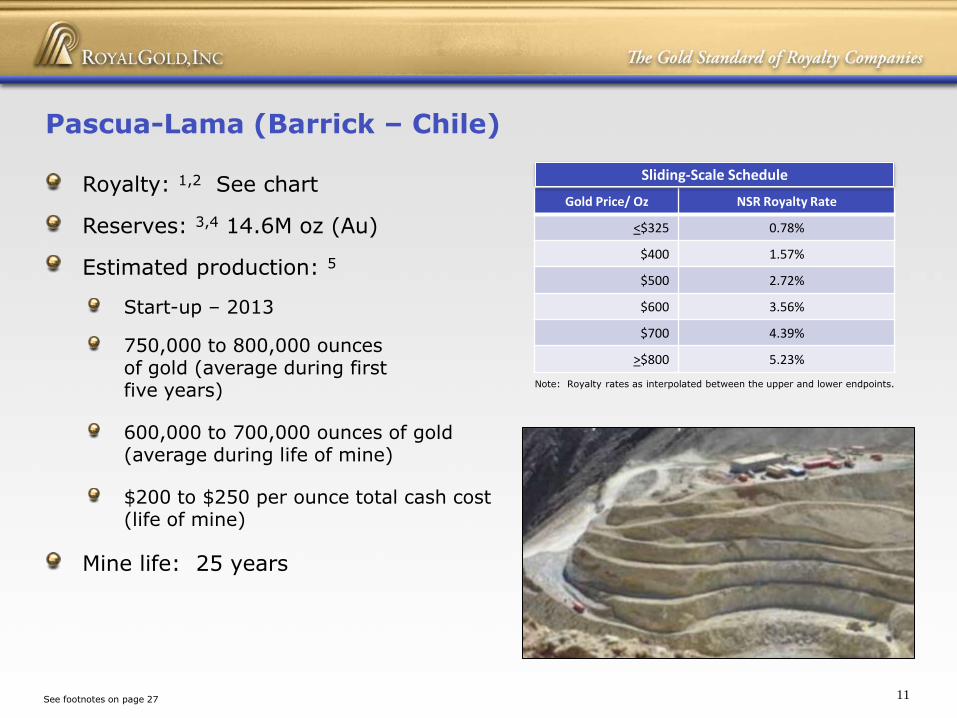
Royalty: 1,2 See chart
Reserves: 3,4 14.6M oz (Au)
Estimated production: 5
Start-up – 2013
750,000 to 800,000 ounces of gold (average during first five years)
600,000 to 700,000 ounces of gold (average during life of mine)
$200 to $250 per ounce total cash cost(life of mine)
Mine life: 25 years
Pascua-Lama (Barrick – Chile)
11See footnotes on page 27
Gold Price/ Oz NSR Royalty Rate
<$325 0.78%
$400 1.57%
$500 2.72%
$600 3.56%
$700 4.39%
>$800 5.23%
Note: Royalty rates as interpolated between the upper and lower endpoints.
Sliding-Scale Schedule

Royalty: 2.7% NSR
Reserves: 1 1,493M lbs (Ni)873M lbs (Cu)74M lbs (Co)
Production capacity: 6,000 tonnes per day
CY’09 production: 40,000 tonnes (Ni) (restricted by strike) 24,000 tonnes (Cu)
Mine life: 20+ years 2
Actual royalty revenue (TTM): 3 $17.2M
Voisey’s Bay (Vale – Canada)
“Voisey’s Bay could continue producing as much as 50,000
metric tons a year through 2049 if Vale decides to build the
underground mine,” said Tom Paddon, Voisey’s Bay General
Manager (September 2009).
12See footnotes on page 28
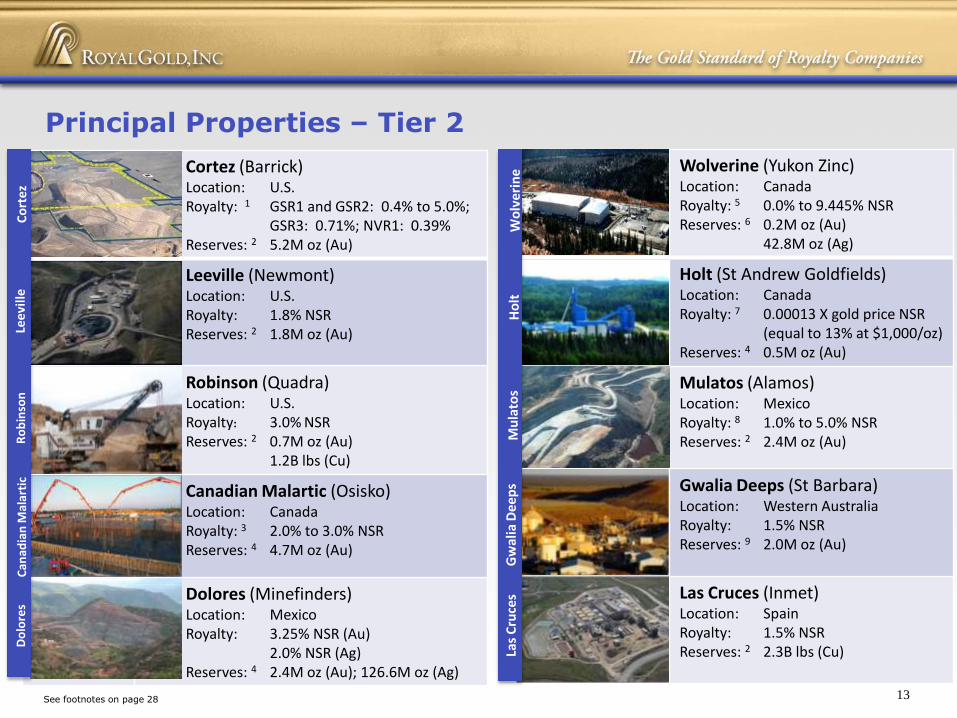
Cortez (Barrick)Location: U.S.Royalty: 1 GSR1 and GSR2: 0.4% to 5.0%;
GSR3: 0.71%; NVR1: 0.39%Reserves: 2 5.2M oz (Au)
Leeville (Newmont)Location: U.S.Royalty: 1.8% NSRReserves: 2 1.8M oz (Au)
Robinson (Quadra) Location: U.S.Royalty: 3.0% NSRReserves: 2 0.7M oz (Au)
1.2B lbs (Cu)
Canadian Malartic (Osisko)Location: CanadaRoyalty: 3 2.0% to 3.0% NSRReserves: 4 4.7M oz (Au)
Dolores (Minefinders)Location: MexicoRoyalty: 3.25% NSR (Au)
2.0% NSR (Ag) Reserves: 4 2.4M oz (Au); 126.6M oz (Ag)
Principal Properties – Tier 2
Wolverine (Yukon Zinc) Location: CanadaRoyalty: 5 0.0% to 9.445% NSR Reserves: 6 0.2M oz (Au)
42.8M oz (Ag)
Holt (St Andrew Goldfields)Location: CanadaRoyalty: 7 0.00013 X gold price NSR
(equal to 13% at $1,000/oz)Reserves: 4 0.5M oz (Au)
Mulatos (Alamos) Location: MexicoRoyalty: 8 1.0% to 5.0% NSRReserves: 2 2.4M oz (Au)
Gwalia Deeps (St Barbara)Location: Western Australia Royalty: 1.5% NSR Reserves: 9 2.0M oz (Au)
Las Cruces (Inmet)Location: SpainRoyalty: 1.5% NSR Reserves: 2 2.3B lbs (Cu)
Wo
lve
rin
eG
wal
ia D
eep
sM
ula
tos
Ho
ltLa
s C
ruce
s
Ro
bin
son
Lee
vill
eC
ort
ez
Can
adia
n M
alar
tic
Do
lore
s
13See footnotes on page 28
14
Mt. Milligan Transaction
and Project Overview
14

25% of payable gold from Mt. Milligan project
Total consideration: $311.5M
$226.5M to support Thompson Creek offer of Terrane Metals
Secured with assets of the project
$85.0M to finance construction of the Mt. Milligan project
Contingent on sufficiency of financing and staged receipt of permits
Pro-rata contribution with majority of fundingfrom Thompson Creek internal sources
$400 per ounce until 550,000 ounces are delivered to Royal Gold; $450 thereafter
No inflation adjustment
Fully funded transaction
Cash on hand (including proceeds from June 2010
equity offering)
Transaction Summary
15
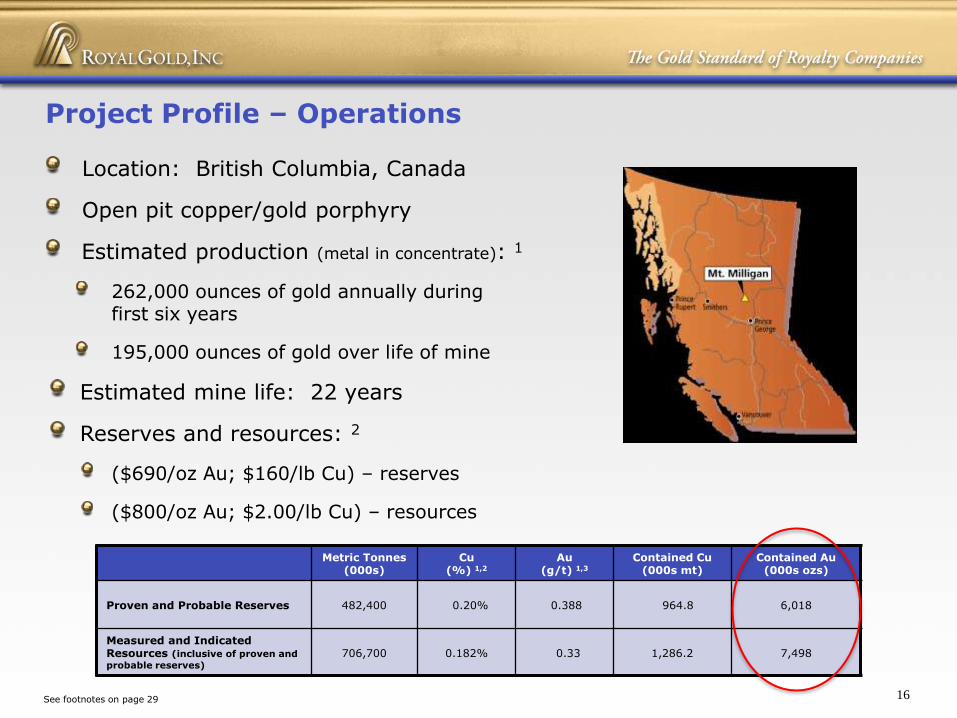
Location: British Columbia, Canada
Open pit copper/gold porphyry
Estimated production (metal in concentrate): 1
262,000 ounces of gold annually during first six years
195,000 ounces of gold over life of mine
Estimated mine life: 22 years
Reserves and resources: 2
($690/oz Au; $160/lb Cu) – reserves
($800/oz Au; $2.00/lb Cu) – resources
Project Profile – Operations
Metric Tonnes(000s)
Cu (%) 1,2
Au (g/t) 1,3
Contained Cu(000s mt)
Contained Au(000s ozs)
Proven and Probable Reserves 482,400 0.20% 0.388 964.8 6,018
Measured and Indicated Resources (inclusive of proven and
probable reserves)
706,700 0.182% 0.33 1,286.2 7,498
16See footnotes on page 29

Gold resources (M&I) are 25% higher than reserves (P&P)
Exploration potential at depth and adjacent to known resources
Several exploration targets with similargeophysical and geochemical signatures
Resource Opportunity
Source: Terrane’s April 2010 presentation
Source: Terrane’s April 2010 presentation
17

~ $51M over first six years 1
($1,200 gold price less $400 purchase price; 97% smelter return)
~ $37M over mine life 1
($1,200 gold price less an average of $425 purchase price; 97% smelter return)
0
50
100
150
200
250
300
2013 14 15 16 17 18 19 20 21 22 23 24 25 26 27 28 29 30 31 32 33 2034
Go
ld O
z (t
ho
usa
nd
s)(m
eta
l in
co
nce
ntr
ate
)
Year
Metal Production
Estimated Annual Net Revenue Potential
RGLD Share of Production Total Project Production18See footnote on page 29

0
50
100
150
200
250
2013 TTM June 2010
Dolores Andacollo Holt Peñasquito
Canadian Malartic Pascua-Lama Las Cruces Gwalia Deeps
South Laverton Wolverine Inata Pinson
Mt. Milligan TTM Pro forma Revenue
2013E Growth Pipeline 5,6
Growth Pipeline 1
Pro
du
ctio
n –
Ro
yalt
y G
old
Eq
uiv
ale
nt
Ou
nce
s(t
ho
usa
nd
s)
19See footnotes on page 29
> 90 Exploration
~ 40 Evaluation
Gold Hill (2012)
Marigold (2011)
Holt (2010+) 4
Tambor (2010)
Wolverine (2010)
Las Cruces (2010)
Andacollo (2010)
Inata (2010)
Dolores (2010)
Exploration Evaluation Development Construction Ramp Up to
Full Production
Peñasquito Sulfide HPGR (2010)
Peñasquito Sulfide Line 2 (2010)
Canadian Malartic (2011) 2
South Laverton (2010)
Pascua-Lama (2013)
Mt. Milligan (2013) 3
Other Development Projects (15)
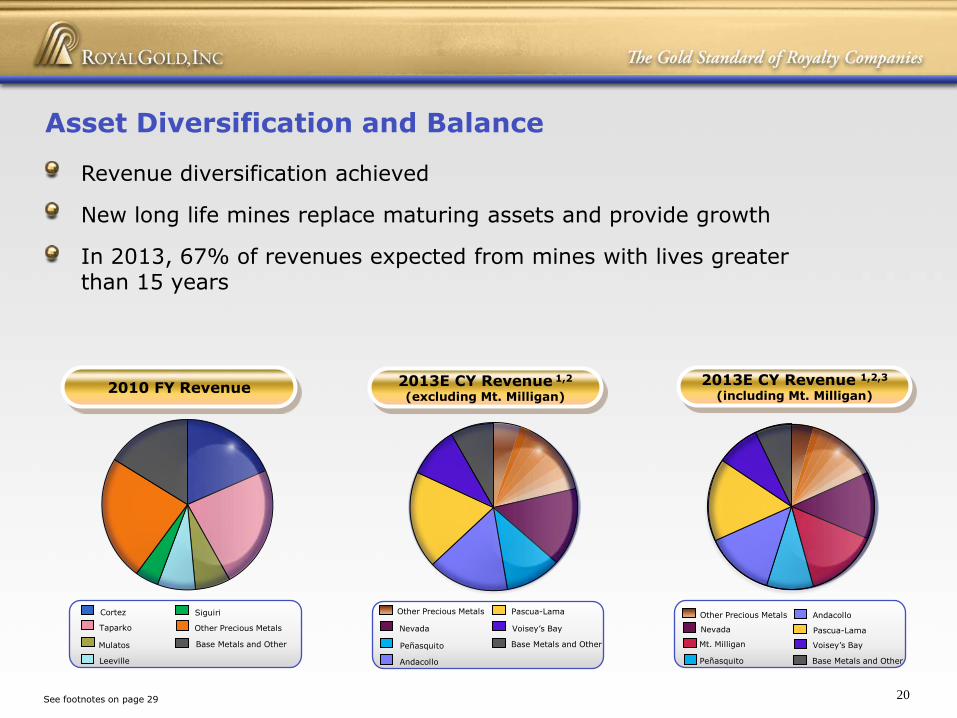
Revenue diversification achieved
New long life mines replace maturing assets and provide growth
In 2013, 67% of revenues expected from mines with lives greaterthan 15 years
Cortez
Taparko
Leeville
Mulatos
Siguiri
Base Metals and Other
Other Precious Metals
Asset Diversification and Balance
Nevada
Base Metals and Other
Andacollo
Peñasquito
Other Precious Metals
Voisey’s Bay
Pascua-Lama
2013E CY Revenue 1,2
(excluding Mt. Milligan)2010 FY Revenue
2013E CY Revenue 1,2,3
(including Mt. Milligan)
Mt. Milligan
Peñasquito Base Metals and Other
Voisey’s Bay
Andacollo
Nevada Pascua-Lama
Other Precious Metals
20See footnotes on page 29

United States OtherMexico Chile
Favorable Geopolitical Distribution
AfricaCanada Australia
Currently 68% of production from United States, Mexico, Canada, Chile and Australia
98% of reserves from United States, Mexico, Canada, Chile and Australia
21
Reserves 2Current Production 1
Royalty Ounces in Reserves
See footnotes on page 30

Strong Gold Focus
Base Metals and OtherSilverGold
Commissioning of near-term projects will grow precious metal exposure
Precious metals dominant, long-term growth profile
Chile Mexico Canada Australia Africa
Andacollo Peñasquito Canadian Malartic Gwalia Deeps Inata
Pascua-Lama Dolores Wolverine South Laverton
Holt
Mt. Milligan
2013E CY Revenue 1,2
(including Mt. Milligan 3)2010 FY Revenue 2013E CY Revenue 1,2
(excluding Mt. Milligan)
25%
75% TotalPrecious Metals
79% TotalPrecious Metals
21%
84% TotalPrecious Metals
16%
22See footnotes on page 30
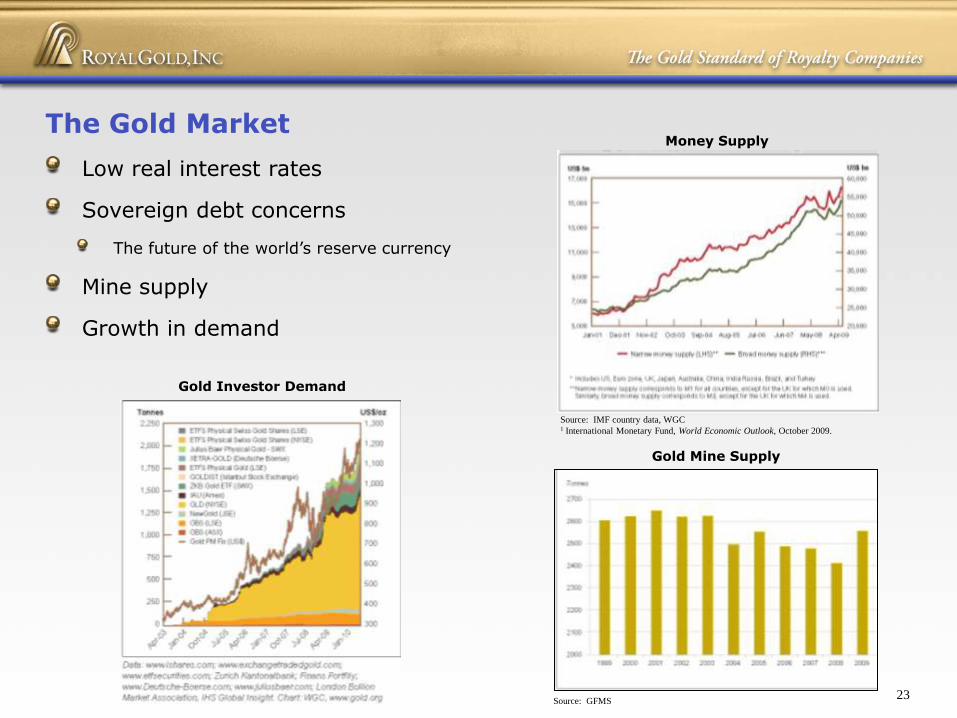
Low real interest rates
Sovereign debt concerns
The future of the world’s reserve currency
Mine supply
Growth in demand
The Gold Market
23
Gold Investor Demand
Gold Mine Supply
Money Supply
Source: IMF country data, WGC1 International Monetary Fund, World Economic Outlook, October 2009.
Source: GFMS
-200%
0%
200%
400%
600%
800%
1000%
1200%
1400%
1600%
1800%
2000%
Royal Gold Share Price Gold Price
See footnotes on page 30
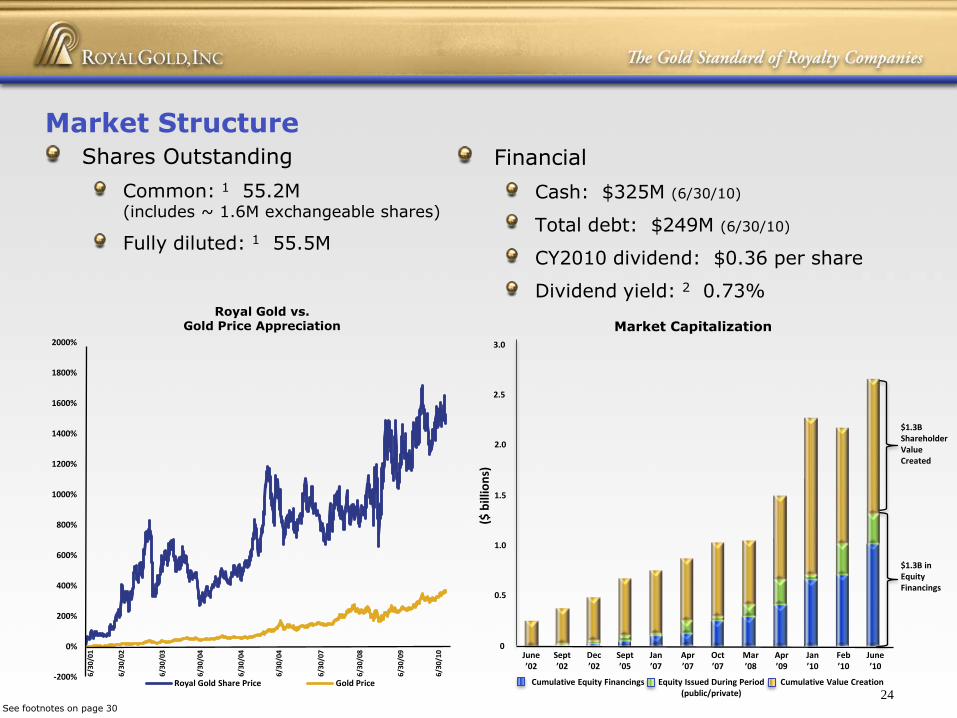
Financial
Cash: $325M (6/30/10)
Total debt: $249M (6/30/10)
CY2010 dividend: $0.36 per share
Dividend yield: 2 0.73%
Market StructureShares Outstanding
Common: 1 55.2M (includes ~ 1.6M exchangeable shares)
Fully diluted: 1 55.5M
Equity Issued During Period(public/private)
Market Capitalization
Cumulative Equity Financings Cumulative Value Creation
24
Royal Gold vs.Gold Price Appreciation
6/30
/01
6/30
/02
6/30
/03
6/30
/04
6/30
/04
6/30
/04
6/30
/07
6/30
/08
6/30
/09
6/30
/10 June
’10
$1.3B ShareholderValueCreated
$1.3B in Equity Financings
June’02
Sept’02
Dec’02
Sept’05
Jan’07
Apr’07
Oct’07
Mar’08
Apr’09
Jan’10
Feb’10
3.0
2.5
2.0
1.5
1.0
0.5
0
($ b
illio
ns)
Footnotes
25

FootnotesPAGE 4: FINANCIAL RESULTS1 In fiscal 2008, total net income was $24.0M. Basic income per share was reduced by the payment of preferred
dividends and a non-cash preferred share conversion adjustment of $4.8M, or $0.15 per basic share.2 Net income for fiscal 2009 includes one-time gains of $33.7M, or $0.62 per basic share, after taxes. 3 Net income for 2010 was impacted by pre-tax effects of severance and acquisition costs of $19.4 million, or $0.33
per share, related to the IRC transaction.4 The term “free cash flow” is a non-GAAP financial measure and is defined by the Company as operating income plus
depreciation, depletion and amortization, non-cash charges, and any impairment of mining assets, if any, less non-controlling interests in operating income from consolidated subsidiaries.
PAGE 5: KEY DRIVERS1 Percentages represent TB-GSR1 and TB-GSR2 combined royalty rate.
PAGE 6: TRANSFORMATIONAL GROWTH1 Pending closing of the transaction.
PAGE 7: RESERVE GROWTH – DECEMBER 2008 TO PRESENT1 Reserve increases from December 31, 2008 to December 31, 2009, including pro forma Mt. Milligan reserves.2 Royalty ounces in reserves were calculated using the following per ounce gold and silver prices: 2004 - $435.60
gold and $6.82 silver; 2005 - $513.00 gold and $8.83 silver; 2006 - $632 gold and $12.90 silver; 2007 - $833.75gold and $14.76 silver; 2008 - $869.75 gold and $10.79 silver; and 2009 - $1,087.50 gold and $16.99 silver.
PAGE 8: PRINCIPAL PROPERTIES - TIER 11 Reserves as of December 31, 2009.2 75% of gold until 910,000 payable ounces; 50% thereafter.3 Estimated average annual production over first 10 years of production.4 The sliding-scale royalty rate reflects Royal Gold's entire royalty interest upon the completion of the transaction
announced on July 6, 2010. The remaining portion of the additional royalty interest will be acquired on or beforeOctober 29, 2010.
26

Footnotes (cont.)PAGE 8: PRINCIPAL PROPERTIES – TIER 1 (cont.)5 Upon the completion of the transaction announced on July 6, 2010, which is scheduled to occur on or before
October 29, 2010, approximately 20% of the royalty is limited to the first 14.0M ounces of gold produced from theproject. Also, 24% of the royalty can be extended beyond 14.0M ounces produced for $4.4 million. In addition, aone-time payment totaling $8.4 million will be made if gold prices exceed $600 per ounces for any six-month periodwithin the first 36 months of commercial production.
6 Reserves as of December 31, 2008.7 Royalty applies to all gold production from an area of interest in Chile. Only that portion of reserves pertaining to
our royalty interest in Chile is reflected here.8 Barrick’s May 7, 2009 press release and presentation.9 Average annual forecast during the first five years of production.10 Based on 2008 Vale Inco EIS.11 Production did not meet capacity because of labor dispute.
PAGE 9: PENASQUITO (GOLDCORP – MEXICO)1 Reserves as of December 31, 2009.2 Gold equivalent ounces calculated at calendar year-end metal prices for each year.
PAGE 10: ANDACOLLO (TECK – CHILE)1 Reserves as of December 31, 2009.2 Teck press release dated April 20, 2010; estimated average annual production during the first 10 years.
PAGE 11: PASCUA-LAMA (BARRICK – CHILE)1 The sliding-scale royalty rate reflects Royal Gold’s entire royalty interest upon the completion of the transaction
announced on July 6, 2010. The remaining portion of the additional royalty interest will be acquired on or beforeOctober 29, 2010.
2 As of the acquisition of IRC on February 22, 2010; (1) approximately 74% of the royalty is limited to the first 14.0Mounces of gold produced from the project; (2) 30% of the royalty can be extended beyond 14.0 million ounces for$6.4 million; and (3) a one-time payment totaling $4.0M will be made if gold prices exceed $550 per ounce for anysix-month period within the first 36 months after commercial production and additional payments totaling $6.4M ifgold prices exceed $600 per ounce for any six-month period within the first 36 months after commercialproduction.
3 Reserves as of December 31, 2008.4 Royalty applies to all gold production from an area of interest in Chile. Only that portion of reserves pertaining to
our royalty interest in Chile is reflected here.5 Barrick’s May 7, 2009 press release and presentation.
27
~
Footnotes (cont.)
PAGE 12: VOISEY’S BAY (VALE – CANADA) 1 Reserves as stated in Vale’s 20F for 2008.2 Based on 2008 Vale Inco EIS. 3 Based on TTM revenue as of June 30, 2010.
PAGE 13: PRINCIPAL PROPERTIES – TIER 21 NSR sliding-scale schedule (price of gold per ounce – royalty rate): Below $210 – 0.40%; $210 to $229.99 –
0.50%; $230 to $249.99 – 0.75%; $250 to $269.99 – 1.30%; $270 to $309.99 – 2.25%; $310 to $329.99 –2.60%; $330 to $349.00 – 3.00%; $350 to $369.99 – 3.75%; $390 to $409.99 – 4.0%; $410 to $429.99 –4.25%; $430 to $449.99 – 4.50%; $450 to $469.99 – 4.75%; $470 and higher – 5.00%.
2 Reserves as of December 31, 2009.3 Royalty is subject to a buy-down right of $1.0 to $1.5 million depending on the price of gold, exercisable at any
time, for one half of the royalty.4 Reserves as of December 31, 2008.5 Gold royalty rate is based on the price of silver per ounce. NSR sliding-scale schedule (price of silver per ounce –
royalty rate) below $5.00 – 0.0%; $5.00 to $7.50 – 3.778%; >$7.50 – $9.445%.6 Reserves as of October 2007.7 In November 2008, the operator made application to the Ontario Superior Court of Justice for a declaration that it
is not obligated to pay the entire royalty defined under the royalty agreement and to dispute the royalty rate. Theoperator claimed that its predecessor in interest is responsible for payment of some or all of the royalty. OnJuly 23, 2009, the Court held that Royal Gold is entitled to payment from the predecessor of the full amount of theNSR sliding-scale royalty and that the operator’s obligation is to reimburse the predecessor for payment of theroyalty up to a flat rate of 0.013% NSR. On August 21, 2009, the predecessor appealed the portion of thejudgment holding it responsible for paying the royalty. On December 9, 2009, Royal Gold was made a party to theappeal.
8 The Company’s royalty is subject to a 2.0 million ounce cap on gold production. There have been approximately581,000 ounces of cumulative production, as of June 30, 2010. NSR sliding-scale schedule (price of gold per ounce– royalty rate): $0.00 to $299.99 – 1.0%; $300 to $324.99 – 1.50%; $325 to $349.99 – 2.0%; $350 to $374.99 –3.0%; $375 to $399.99 – 4.0%; $400 or higher – 5.0%.
9 Reserves as of June 2009.
28
Footnotes (cont.)
PAGE 16: PROJECT PROFILE – OPERATIONS1 Per Terrane Metal’s Feasibility Update Study – Technical Presentation dated December 15, 2009. 2 Reserves as of October 23, 2009 from Terrane’s Technical Report – Feasibility Study.
PAGE 18: ESTIMATED ANNUAL NET REVENUE POTENTIAL1 Per production estimates from Terrane Metal’s Feasibility Update Study – Technical Presentation dated
December 31, 2009.
PAGE 19: GROWTH PIPELINE1 The date in parentheses indicates the estimated date of production for each property, as estimated by the various
operators.2 The 2.0% to 3.0% NSR royalty rate is subject to a buy-down right which could reduce the royalty rate to a range of
1.0% to 1.5%.3 Pending closing of transaction.4 In November 2008, the operator made application to the Ontario Superior Court of Justice for a declaration that it
is not obligated to pay the entire royalty defined under the royalty agreement and to dispute the royalty rate. Theoperator claimed that its predecessor in interest is responsible for payment of some or all of the royalty. On July23, 2009, the Court held that Royal Gold is entitled to payment from the predecessor of the full amount of the NSRsliding-scale royalty and that the operator’s obligation is to reimburse the predecessor for payment of the royaltyup to a flat rate of 0.013% NSR. On August 21, 2009, the predecessor appealed the portion of the judgmentholding it responsible for paying the royalty. And on December 9, 2009, Royal Gold was made a party to theappeal.
5 Calculated using the following commodity prices: gold ($1,000 per ounce); silver ($15.00 per ounce); copper($2.75 per pound); zinc ($1.00 per pound); lead ($1.00 per pound); nickel ($7.00 per pound).
6 See page 32 for information regarding 2013 estimates.
PAGE 20: ASSET DIVERSIFICATION AND BALANCE1 2013 estimates assume development properties are brought into production and reach full-scale production on
schedule and also assume certain metal prices and currency exchange rates. See page 32 for additionalinformation regarding 2013 estimates.
2 Assuming no additional royalties added to portfolio.3 Pending closing of the transaction.
29
Footnotes (cont.)
PAGE 21: FAVORABLE GEOPOLITICAL DISTRIBUTION1 Equity gold equivalent ounces, based on TTM as of June 30, 2010 production, were calculated using a gold price of
$1,089.45 per ounce.2 Reserves as detailed in Royal Gold’s June 2010 reserve release. Equity gold equivalent ounces were calculated
using June 30, 2010 metals prices as follows: gold - $1,244.00 per ounce; silver - $18.74 per ounce; copper -$2.96 per pound; lead - $0.77 per pound; zinc - $0.78 per pound; nickel - $8.81 per pound; cobalt - $17.63 perpound.
PAGE 22: STRONG GOLD FOCUS1 2013 estimates assume development properties are brought into production and reach full-scale production on
schedule and also assume certain metal prices and currency exchange rates. See page 32 for additional information regarding 2013 estimates.
2 Assuming no additional royalties added to portfolio.3 Pending closing of the transaction.
PAGE 24: MARKET STRUCTURE1 Includes approximately 1.6M exchangeable shares.2 CY 2010 dividend divided by closing stock price of $49.07 per share on August 31, 2010.
30
2013E PRO FORMA FOOTNOTE:
All 2013 pro forma calculations include certain properties that are currently in development stage, and we have assumedfor purposes of the 2013 pro forma calculations that such development stage properties are brought into production andachieve full-scale production on schedule. Metal prices and currency exchange rates assumed in the estimate for 2013 areas follows: $1,000/ounce (gold), $15.00/ounce (silver), $2.75/lb (copper), $1.00/lb (zinc), $1.00/lb (lead); $7.00/lbnickel; $10.00/lb (molybdenum); $16.00/lb (cobalt); $129/tonne (metallurgical coal); $29.00/ton (steam coal); $46.76/lb(uranium); US$0.93/1A$; US$0.94/1C$.
All 2013 estimates constitute forward looking statements and, therefore, involve known and unknown risks, uncertaintiesand other factors that could cause actual results to differ materially from the projections and estimates contained hereinincluding, but not limited to, changes in gold and other metal prices from the prices outlined below; changes in the foreignexchange rates from the rates outlined below; decisions, assumptions, estimates and activities of the Company’smanagement; decisions and activities of the operators of the royalty properties; unanticipated grade, geological,metallurgical, processing or other problems at the properties; changes in project parameters as plans of the operators arerefined; the ability of operators to bring development stage properties into production and reach full-scale production ormaintain properties in production; the ability of operators to obtain financing and general economic and market conditions;the successful closing of the Pascua-Lama transactions and the Plan of Arrangement between Thompson Creek MetalsCompany and Terrane Metals Corp.; the outcome of the court decision regarding the appeal of the Holt royalty dispute;changes in the regulatory, tax, legal or political environment in each country in which the royalty properties are located.The Company disclaims any obligation to update these estimates and the Company and its affiliates, agents, directors andemployees accept no liability whatsoever for any loss or damage of any kind arising out of the use of all or any part of thismaterial.
31
Footnotes (cont.)
32
ROYAL GOLD, INC.
1660 Wynkoop Street
Denver, CO 80202-1132
PHONE
303.573.1660
FAX
303.595.9385
WEB
www.royalgold.com