
National Bank of Rwanda Quarterly Bulletin Fourth Quarter 2010

Bank of America Fourth Quarter 2008 Results
Ken Lewis
Chairman, CEO and President
Joe Price
Chief Financial Officer
January 16, 2009

2
Forward Looking Statements
Bank of America may make forward-looking statements, including, for example, statements about management expectations and intentions regarding our future financial results, integration plans and cost savings, growth opportunities, business outlook, loan and deposit growth, mortgage production, credit losses, and other similar matters. These forward-looking statements are not historical facts, but instead represent Bank of America’s current expectations, intentions or forecasts of future events, circumstances or results. These statements are not guarantees of future results or performance and involve certain risks, uncertainties and assumptions that are difficult to predict and often are beyond Bank of America’s control. Actual outcomes and results may differ materially from those expressed in, or implied by, any of these forward-looking statements.
You should not place undue reliance on any forward-looking statement and should consider the following possible events or factors that could cause results or performance to differ materially from those expressed in the forward-looking statements: negative economic conditions; changes in interest rates and market liquidity; changes in foreign exchange rates; adverse movements and volatility in debt and equity capital markets; changes in market rates and prices which may adversely impact the value of financial products and instruments; estimates of fair value of assets and liabilities; legislative and regulatory actions in the United States and internationally; liabilities resulting from litigation and regulatory investigations; changes in domestic or foreign tax laws, rules and regulations and governmental interpretations thereof; monetary and fiscal policies and regulations; changes in accounting standards, rules and interpretations; increased competition; the ability to grow Bank of America’s core businesses; the ability to develop and introduce new banking-related products, services and enhancements; mergers and acquisitions and their integration; decisions to downsize, sell or close units or otherwise change Bank of America’s business mix; management’s ability to identify and manage these and other risks; and the other risk factors discussed in Bank of America’s Annual Report on Form 10-K for 2007, Quarterly Report on Form 10-Q for the quarter ended September 30, 2008, and in any of Bank of America’s other subsequent SEC filings.
Forward-looking statements speak only as of the date they are made, and Bank of America undertakes no obligation to update any forward-looking statement to reflect the impact of circumstances or events that arise after the date the forward-looking statement was made.

3
Important Presentation Format Information
• Certain prior period amounts have been reclassified to conform to current period presentation
• This information is preliminary and based on company data available at the time of the presentation

4
Summary
• Despite unprecedented capital markets and recessionary headwinds, company reported profitable full year results of $4.0 billion
• 4Q08 loss of $1.8 billion includes capital markets dislocation charges of $4.6 billion and provision expense of $8.5 billion, which included an increase in the loan loss reserve of $3.0 billion
• Given the credit costs resulting from the deteriorating economy and continued capital markets disruptions we are announcing a reduction in the quarterly common dividend to $.01 per share
• Despite loss, pre-provision profits up in most primary businesses from 3Q08
• Total corporate average deposits grew $34.3 billion since 3Q08
• The quarter included a common equity raise and capital from a TARP investment
• Net interest income increased $1.5 billion from 3Q08 driven by lower rates and balance sheet management actions
• Higher credit costs reflect impact of economic environment
– Rising unemployment and declining home prices heighten losses
– Homebuilders remain weak
– Other commercial asset quality showing some softness as retail spending declined
– Reserve build remains elevated
• Countrywide operational integration is on track
• Merrill Lynch transaction closed on 1/1/09

5
Bank of America Addressing Economic Issues
• Remain committed to customers and clients during the economic stress
• Continue to support government efforts in stabilization
� Credit markets
� Home ownership
� Consumer health
� Commercial business stability
• Examples include:
� Loan modification program projected to modify $100 billion or more home loans over 3 years and keep 630,000 people in homes
� Currently have 6,000 associates working in home retention
� During 2008 Bank of America and Countrywide had completed over 300,000 workouts
� Currently working out two troubled loans for every foreclosure
• Lending is our business and we are extending credit
� 4Q08 new extensions of credit include:
– $ 45 billion mortgages
– $ 5 billion home equity
– $ 6 billion domestic card
– $ 2 billion indirect auto loans
– $ 56 billion commercial originations

6
Summary of Today’s Capital Actions
• Capital reductions from the Merrill Lynch losses in the quarter prompted discussions for government assistance to complete the transaction
• Negotiations completed for a new government investment and asset guarantee
� New government investment of $20 billion preferred stock
� $4 billion asset guarantee includes a wrap on approximately $118 billion of select assets
Strengthens the balance sheet and provides a backstop on losses on certain higher risk assets

7
Consolidated Highlights - Full Year 2008
1 Measures shown on an operating basis. Please refer to the Supplemental Information Package for more information.
($ in millions)
2008 Amount %
Net interest income (FTE) 46,554$ 10,364$ 29 %
Noninterest income 27,422 (4,970) (15)
Total revenue, net of interest expense (FTE) 73,976 5,394 8
Provision for credit losses 26,825 18,440 220
Noninterest expense 41,529 4,005 11
Pre-tax income 5,622 (17,051) (75)
Income tax expense (FTE) 1,614 (6,077) (79)
Net income 4,008$ (10,974)$ (73)
Preferred stock dividends 1,452 1,270
Net income applicable to common shareholders 2,556$ (12,244)$ (83)
Diluted EPS 0.55$ (2.75)$
After tax effect of merger charge 630 372
Return on common equity 1
2.25 % N/M
Tangible return on equity 1
5.46 N/M
Change vs. 2007

8
4Q08 Business Highlights
Global Consumer & Small Business Banking – net income $835 million
Deposits and Student Lending
• Total growth of average core retail deposits (including GWIM) was $18.8 billion from 3Q08
– Excludes the runoff, as expected, of $7.1 billion of Countrywide deposits
• Service charges decreased $145 million due to lower consumer spending resulting in lower transaction fees
– Service charges were up 3% from 4Q07 as a result of account growth
• Debit card income down slightly from 3Q08 on lower purchase volume
Mortgage Home Equity & Insurance Services
• Consolidated first mortgage production was $44.6 billion vs. $51.5 billion in 3Q08
– Mortgage application volume increased significantly following the November Treasury announcement
• Mortgage banking income decreased $154 million as the favorable impact of increased application volume and margins was offset by changes in credit related liabilities.
• MSRs at fair value of $12.7 billion represent 77 basis points of loans serviced for others portfolio
Card Services
• The net loss in Card Services was driven by higher credit costs in unsecured lending and small business
– Consumer credit card asset quality continued to deteriorate
– Managed net loss rate increased to 7.16% from 6.40% at 3Q08
– Managed 30+ delinquencies rose 79 bps to 6.68% from 3Q08
9
4Q08 Business Highlights
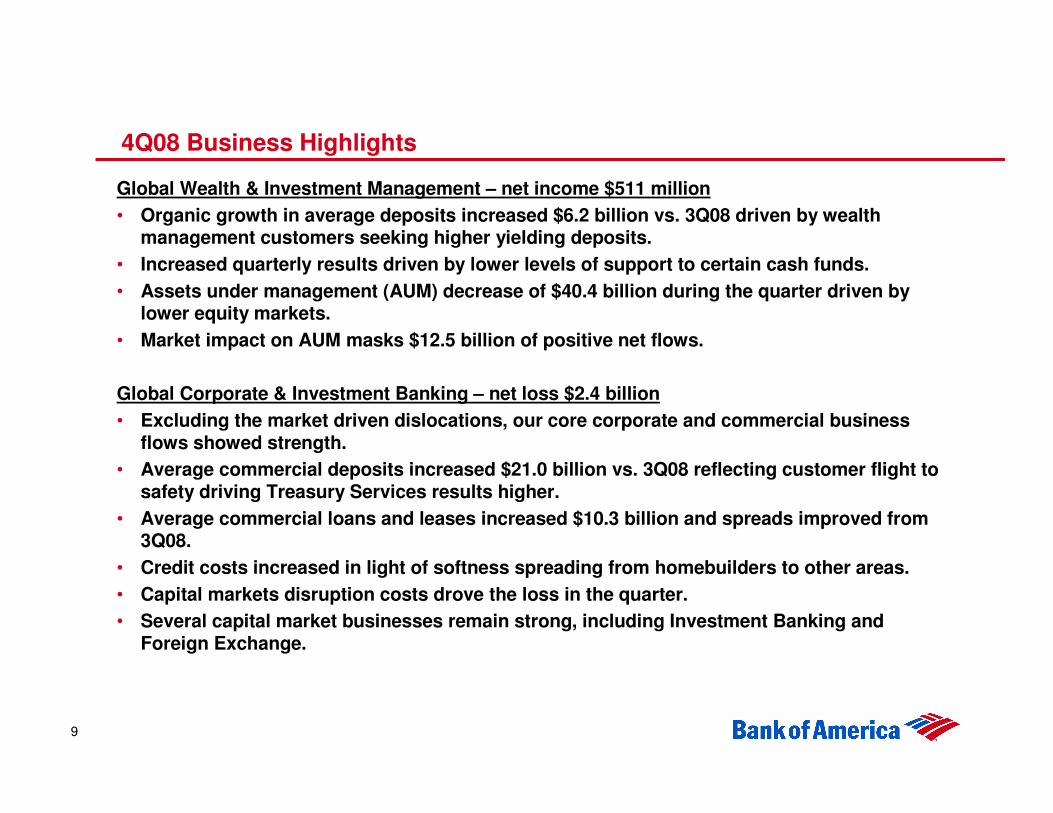
Global Wealth & Investment Management – net income $511 million
• Organic growth in average deposits increased $6.2 billion vs. 3Q08 driven by wealth management customers seeking higher yielding deposits.
• Increased quarterly results driven by lower levels of support to certain cash funds.
• Assets under management (AUM) decrease of $40.4 billion during the quarter driven by lower equity markets.
• Market impact on AUM masks $12.5 billion of positive net flows.
Global Corporate & Investment Banking – net loss $2.4 billion
• Excluding the market driven dislocations, our core corporate and commercial business flows showed strength.
• Average commercial deposits increased $21.0 billion vs. 3Q08 reflecting customer flight to safety driving Treasury Services results higher.
• Average commercial loans and leases increased $10.3 billion and spreads improved from 3Q08.
• Credit costs increased in light of softness spreading from homebuilders to other areas.
• Capital markets disruption costs drove the loss in the quarter.
• Several capital market businesses remain strong, including Investment Banking and Foreign Exchange.

10
Consolidated Highlights - 4Q08
1 Due to the net loss for the three months ended December 31, 2008, the impact of antidilutive equity instruments have been excluded from diluted earnings
per share and average diluted common shares.
2 Measures shown on an operating basis. Please refer to the Supplemental Information Package for more information.
($ in millions)
4Q'08 4Q'07 3Q'08
Net interest income (FTE) 13,406$ 3,591$ 1,486$
Noninterest income 2,574 (1,065) (5,405)
Total revenue, net of interest expense (FTE) 15,980 2,526 (3,919)
Provision for credit losses 8,535 5,225 2,085
Noninterest expense 10,947 538 (713)
Pre-tax income (3,502) (3,237) (5,291)
Income tax expense (benefit) (FTE) (1,713) (1,180) (2,325)
Net income (loss) (1,789)$ (2,057)$ (2,966)$
Preferred stock dividends 603 550 130
Net income (loss) applicable to common shareholders (2,392)$ (2,607)$ (3,096)$
Diluted EPS 1
(0.48)$ (0.53)$ (0.63)$
After tax effect of merger charge 206 118 23
Return on common equity 2
(6.10) % N/M N/M
Tangible return on equity 2
(6.65) N/M N/M
Increase (decrease) over

11
4Q08 Highlights
• Diluted EPS was a loss of $0.48, a loss of $0.44 excluding merger and restructuring charges.
• Net interest income increased $1.5 billion from 3Q08 due to the benefits of the rate environment and balance sheet management actions.
• $226 million charge to support cash funds and related writedowns.
• $411 million loss related to auction rate securities ($353 million in GCIB).
• Extreme capital markets volatility in the quarter included:
– Broad spectrum of asset price declines
– Equity and credit illiquidity
– Global deleveraging
– Correlation breakdowns on trading positions
• GCIB disruption charges of $4.6 billion.
– CDO and subprime - $1.7 billion, net of hedge activities
– Losses on structured credit positions - $1.3 billion
– Commercial real estate capital markets - $525 million
– Losses on equity investments made in acquisition related financings - $328 million
– Leveraged lending - $429 million
• Provision expense of $8.5 billion (includes approximately $3.0 billion in additions to reserve).
• Primary capital impacts:
– $9.8 billion common equity raised
– $15 billion TARP preferred equity
– Other comprehensive income reduced $5.2 billion
• Approximately $2 billion on equity securities and $3.4 billion from pension liability
– Tier 1 capital ratio at 9.15%
– Tangible common equity / Tangible assets ratio at 2.83%

12
Brief Terms of Government Agreements
$20B in Preferred Stock Series R
Dividend Rate: 8%
Warrant: Warrant for 10% of preferred balance
Priority: Pari Passu with all other preferred stock
Asset Guarantee - $ 4 billion preferred stock investment
Assets Included: Approximately $118B of high risk positions
US leveraged loans
US Commercial Real Estate
ML Investment Portfolio
CDO’s
Derivative and Counterparty Exposure
Deductible: $10B
Guarantee Fee: Preferred cost amortized over term
Term: 10-year - Residential
5-year - non-Residential
Loss Sharing: Losses allocated
- First to BAC to $10B deductible
- 90% US Government/10% to BAC thereafter
Loss sharing mechanism: Non-recourse loan
* Both agreements restrict common dividends to $.01 per quarter for 3 years without US Treasury consent

13
Capital Markets 4Q08 Revenue
• Excludes $36 million and $25 million margin from FVO loan book for 4Q08 and 3Q08
• Includes $4.6 billion of disruption charges in 4Q08 vs. $1.8 billion in 3Q08
1
1 Includes approximately $150 million in fees for intercompany transactions which are eliminated in consolidation.
($ in millions)
Total Sales & Trading Investment Banking
Liquid Products 618$ 602$ 16$
Credit Products (1,870) (2,188) 318
Structured Products (3,781) (3,876) 95
Equities 225 1 224
Other 133 - 133
Total (4,675)$ (5,461)$ 786$
Total Sales & Trading Investment Banking
Liquid Products (429)$ (441)$ 12$
Credit Products (1,989) (2,075) 86
Structured Products (2,558) (2,537) (21)
Equities (5) (179) 174
Other 44 - 44
Total (4,937)$ (5,232)$ 295$ 1
4Q08
Change in revenue from 3Q08

14
Key Capital Markets Risk Exposures
($ in millions) Exposures
4Q'08
Leveraged lending related:
EOP Funded commitments 3,641$ Net writedown (429)
Exposure originated prior to market disruption 2,294
Capital markets commercial mortgage related:
Unfunded commitments 700
Funded commitments 6,907 Net writedown (525) Other capital markets commercial mortgage writedowns (328)
Super Senior CDO and other subprime related:
Super senior subprime, net of insurance 981
Super senior nonsubprime, net of insurance 2,299
Retained positions from terminated deals 2,030 Net writedown (1,721)
1
2
1 Represents gross carrying value, carried at a market value of $2,791 million or 76%2 Represents gross carrying value, carried at a market value of $1,540 million or 67%

15
Asset Quality
• Credit quality deteriorated further during the quarter as the impacts of the recessionary economic environment worsened. Consumers continued to experience high levels of stress from depreciating home prices, rising unemployment and underemployment, and tighter credit conditions.
• The commercial portfolio was impacted by continued housing market stress on the homebuilder portfolio, higher losses in the domestic portfolios which were broad based in terms of borrowers and industries, and several foreign financial services borrowerdefaults.
• Held net charge-offs increased to 2.36%, up 52 basis points from 3Q08.
• Provision expense of $8.5 billion includes approximately $3.0 billion in additions to the reserve.
– Consumer stress from housing, unemployment and tighter credit conditions
� $750 million for former Countrywide impaired loans
� $580 million home equity
� $560 million consumer credit card
� $450 million domestic consumer lending
� $160 million dealer financial services
– Commercial reserves built by roughly $460 million for small business, broad based deterioration in commercial loans and homebuilders loans
• Allowance for loan and lease losses of $23.1 billion covering 2.49% of loans up 32 bps from 3Q08.
• Consumer card losses trended higher.
– Managed consumer credit card net loss rate increased to 7.16% from 6.40% in 3Q08. 30+ delinquencies increased to 6.68% from 5.89% in 3Q08. 90+ delinquencies increased to 3.16% from 2.88% in 3Q08.
• Direct/indirect lending, including unsecured lending and dealer financial services net charge-off ratio increased from 3.94% in 3Q08 to 5.03% in 4Q08.
• Small business net charge-off ratio increased 91 basis points to 11.55%.
• Commercial net charge-off ratio excluding small business increased 45 bps to 0.99%.
– Excluding small business and commercial real estate, net charge-off ratio increased 39 bps to 0.65%
16
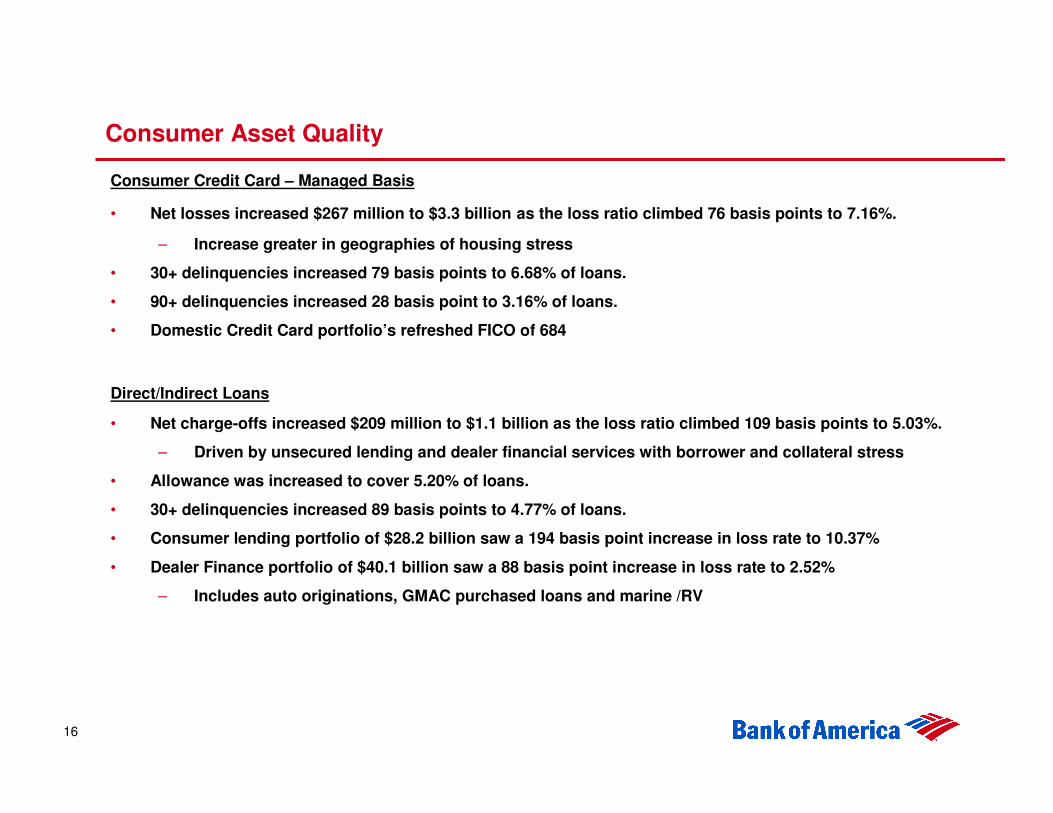
Consumer Credit Card – Managed Basis
• Net losses increased $267 million to $3.3 billion as the loss ratio climbed 76 basis points to 7.16%.
– Increase greater in geographies of housing stress
• 30+ delinquencies increased 79 basis points to 6.68% of loans.
• 90+ delinquencies increased 28 basis point to 3.16% of loans.
• Domestic Credit Card portfolio’s refreshed FICO of 684
Direct/Indirect Loans
• Net charge-offs increased $209 million to $1.1 billion as the loss ratio climbed 109 basis points to 5.03%.
– Driven by unsecured lending and dealer financial services with borrower and collateral stress
• Allowance was increased to cover 5.20% of loans.
• 30+ delinquencies increased 89 basis points to 4.77% of loans.
• Consumer lending portfolio of $28.2 billion saw a 194 basis point increase in loss rate to 10.37%
• Dealer Finance portfolio of $40.1 billion saw a 88 basis point increase in loss rate to 2.52%
– Includes auto originations, GMAC purchased loans and marine /RV
Consumer Asset Quality

17
Consumer Real Estate Asset Quality
Home Equity
• Net charge-off increased $149 million to $1.1 billion as the loss ratio climbed 39 basis points to 2.92%.
– Loans with >90% RCLTV represent 37% of portfolio reflecting home price deterioration.
– CA and FL represent 40% of the portfolio but 65% of losses
• Allowance for loan losses was 3.53% of loans.
Residential Mortgage
• Net charge-off increased $224 million to $466 million as the loss ratio climbed 36 basis points to 0.73%.
– Adjusted for the benefit of Resi Wrap protection, the loss rate would be 0.62%
– CRA portfolio still drove a disproportionate share of losses.
– Loans with >90% RLTV represented 23% of the portfolio reflecting home price deterioration
– CA and FL represented 42% of the portfolio but 63% of losses
• Allowance covers 0.56% of loans. The future benefits of Resi Wrap protection are included in setting the allowance level.
• Benefits of Resi Wrap protection increase as future additional deals reach loss protection thresholds.

18
Consumer Asset Quality Key Indicators
1 Adjusting for the benefit of Resi Wrap protection, the residential mortgage as reported loss rate would be 0.62% in 4Q08.
2 The future benefits of the Resi Wrap protection are included in setting the residential mortgage allowance level.
2
($ in millions)
As
Reported
Excluding
the SOP
03-3
Portfolio
As
Reported
Excluding
the SOP
03-3
Portfolio
As
Reported
Excluding
the SOP
03-3
Portfolio
As
Reported
Excluding
the SOP
03-3
Portfolio
As
Reported
Excluding
the SOP
03-3
Portfolio
As
Reported
Excluding
the SOP
03-3
Portfolio
Loans EOP 247,999$ 238,050$ 256,989$ 249,650$ 152,547$ 138,384$ 151,938$ 138,981$ 19,981$ 1,884$ 22,081$ 2,429$
Loans Avg 253,468 244,515 260,748 253,481 152,035 137,803 151,142 138,192 21,324 2,189 22,031 2,660
Net losses 466$ 466$ 242$ 242$ 1,113$ 1,113$ 964$ 964$ 19$ 19$ (3)$ (3)$
% of avg loans 1 0.73 % 0.76 % 0.37 % 0.38 % 2.92 % 3.22 % 2.53 % 2.77 % 0.36 % 3.48 % (0.05) % (0.43) %
Allowance for loan losses 2 1,382$ 1,376$ 5,385$ 5,219$ 4,744$ 658$ 74$ 82$
% of Loans 0.56 % 0.54 % 3.53 % 3.77 % 3.12 % 3.29 % 3.91 % 0.37 %
Avg. refreshed (C)LTV 71 69 83 81 73 77
90%+ refreshed (C)LTV 23 % 21 % 37 % 35 % 13 % 17 %
Avg. refreshed FICO 729 732 717 717 697 690
% below 620 FICO 8 % 7 % 10 % 9 % 17 % 20 %
4Q08
Residential Mortgage
4Q08
Discontinued Real EstateHome Equity
4Q083Q08 3Q08 3Q08

19
Consumer Asset Quality Key Indicators (cont.’d)
1 Other primarily consists of the following portfolios of loans: Consumer unsecured lending and dealer financial services.
• The average refreshed FICO for the Domestic Credit Card portfolio was 685 at 3Q08 compared to 684 at 4Q08; the percentage below 620 FICO was 16% at 3Q08 compared to 17% at 4Q08.
($ in millions)
4Q08 3Q08 4Q08 3Q08 4Q08 3Q08 4Q08 3Q08
Loans EOP 81,274$ 81,350$ 182,234$ 183,398$ 86,878$ 86,529$ 689,639$ 700,935$
Loans Avg 82,117 80,489 181,233 186,408 86,875 89,115 694,935 709,444
Net losses 1,406$ 1,242$ 3,263$ 2,996$ 1,178$ 951$ 6,039$ 5,150$
% of avg loans 6.82 % 6.14 % 7.16 % 6.40 % 5.39 % 4.25 % 3.46 % 2.89 %
Allowance for loan losses 4,689$ 4,257$ 4,544$ 3,926$ 16,658$ 14,385$
% of Loans 5.77 % 5.23 % 5.23 % 4.53 % 2.83 % 2.40 %
Total Managed
ConsumerCredit Card Other 1
Held Managed
20
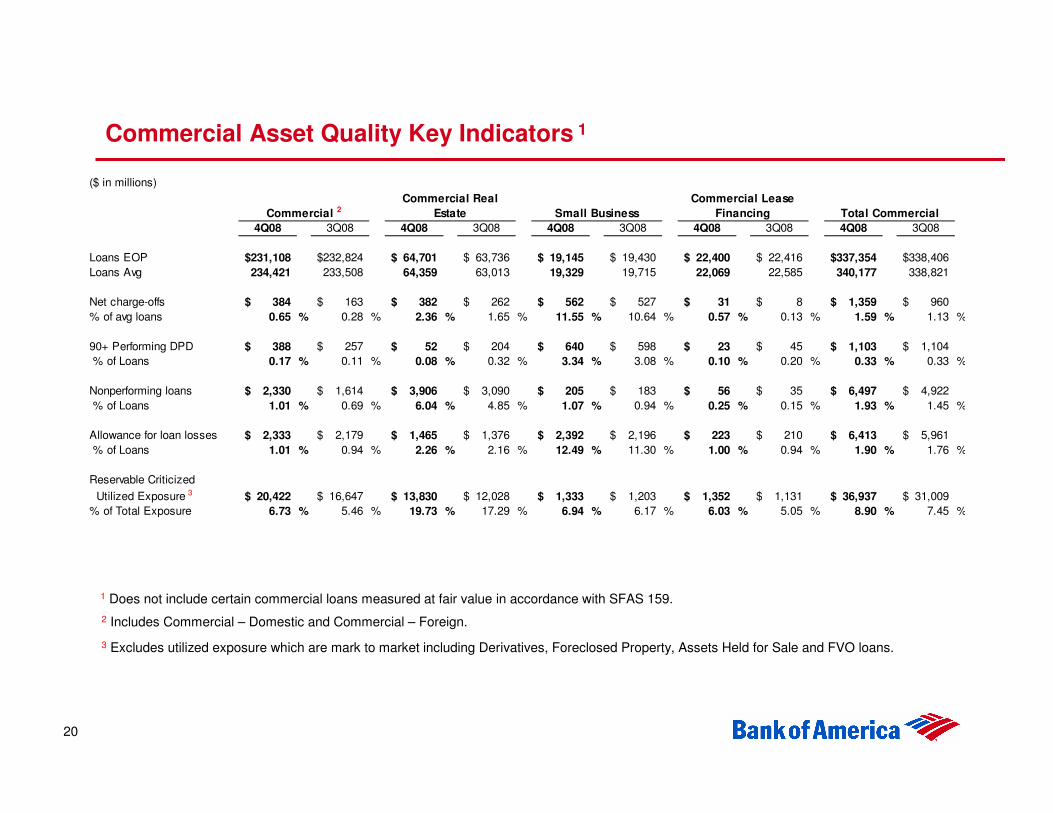
Commercial Asset Quality Key Indicators 1
1 Does not include certain commercial loans measured at fair value in accordance with SFAS 159.
2 Includes Commercial – Domestic and Commercial – Foreign.
3 Excludes utilized exposure which are mark to market including Derivatives, Foreclosed Property, Assets Held for Sale and FVO loans.
($ in millions)
4Q08 3Q08 4Q08 3Q08 4Q08 3Q08 4Q08 3Q08 4Q08 3Q08
Loans EOP 231,108$ 232,824$ 64,701$ 63,736$ 19,145$ 19,430$ 22,400$ 22,416$ 337,354$ 338,406$
Loans Avg 234,421 233,508 64,359 63,013 19,329 19,715 22,069 22,585 340,177 338,821
Net charge-offs 384$ 163$ 382$ 262$ 562$ 527$ 31$ 8$ 1,359$ 960$
% of avg loans 0.65 % 0.28 % 2.36 % 1.65 % 11.55 % 10.64 % 0.57 % 0.13 % 1.59 % 1.13 %
90+ Performing DPD 388$ 257$ 52$ 204$ 640$ 598$ 23$ 45$ 1,103$ 1,104$
% of Loans 0.17 % 0.11 % 0.08 % 0.32 % 3.34 % 3.08 % 0.10 % 0.20 % 0.33 % 0.33 %
Nonperforming loans 2,330$ 1,614$ 3,906$ 3,090$ 205$ 183$ 56$ 35$ 6,497$ 4,922$
% of Loans 1.01 % 0.69 % 6.04 % 4.85 % 1.07 % 0.94 % 0.25 % 0.15 % 1.93 % 1.45 %
Allowance for loan losses 2,333$ 2,179$ 1,465$ 1,376$ 2,392$ 2,196$ 223$ 210$ 6,413$ 5,961$
% of Loans 1.01 % 0.94 % 2.26 % 2.16 % 12.49 % 11.30 % 1.00 % 0.94 % 1.90 % 1.76 %
Reservable Criticized
Utilized Exposure 3 20,422$ 16,647$ 13,830$ 12,028$ 1,333$ 1,203$ 1,352$ 1,131$ 36,937$ 31,009$
% of Total Exposure 6.73 % 5.46 % 19.73 % 17.29 % 6.94 % 6.17 % 6.03 % 5.05 % 8.90 % 7.45 %
Commercial Lease
Financing Total CommercialCommercial 2Commercial Real
Estate Small Business

21
Commercial Real Estate
Homebuilders
• Homebuilder utilized balances at 12/31/08, included in commercial real estate, decreased $1.3 billion to $11.7 billion compared to 3Q08. These utilized balances are included in total exposure of $15.7 billion.
– Reservable criticized utilized exposure decreased $330 million to $7.6 billion (55% of reservable criticized utilized commercial real estate exposure)
– NPAs rose $318 million to $3.0 billion (72% of commercial real estate NPAs)
– 4Q08 charge-offs were $355 million compared to $222 million in 3Q08

22
Net Interest Income
• $1 billion increase in core net interest income and 16 bp yield improvement – managed basis driven by:
� Lower liability based funding - $750 million
� Funding benefits of equity raised - $200 million
• $438 million increase in market based funding driven by rate environment and trading strategies.
• 1Q09 expected to be negatively impacted as a result of asset repricing.
• Given the low rate environment the balance sheet position has now moved to be asset sensitive.
($ in millions)
4Q08 3Q08 $ Change
Reported net interest income (FTE) $ 13,406 $ 11,920 $ 1,486
Market-based NII (1,886) (1,448) (438)
Core net interest income (FTE) 11,520 10,472 1,048
Impact of securitizations 2,256 2,310 (54)
Core NII – Managed Basis $ 13,776 $ 12,782 $ 994
Average earning assets $ 1,616,673 $ 1,622,466 $ (5,793)
Market-based earning assets (318,818) (377,630) 58,812
Impact of securitizations 93,189 101,743 (8,554)
Reported net interest yield 3.31 % 2.93 % 38 bps
Core net interest yield 3.54 3.36 18
Core net interest yield – Managed Basis 3.95 3.79 16
23
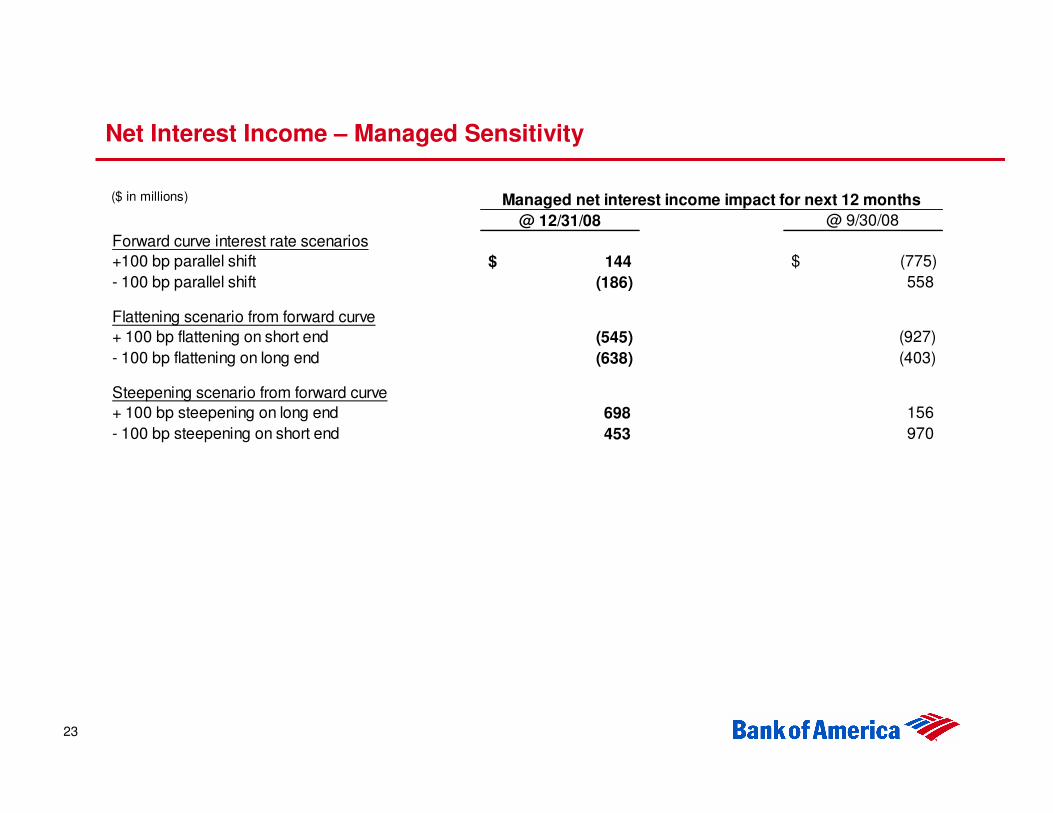
Net Interest Income – Managed Sensitivity
($ in millions)
@ 12/31/08 @ 9/30/08
Forward curve interest rate scenarios
+100 bp parallel shift $ 144 $ (775)
- 100 bp parallel shift (186) 558
Flattening scenario from forward curve
+ 100 bp flattening on short end (545) (927)
- 100 bp flattening on long end (638) (403)
Steepening scenario from forward curve
+ 100 bp steepening on long end 698 156
- 100 bp steepening on short end 453 970
Managed net interest income impact for next 12 months

• Raised $9.8 billion in common equity
• TARP investment of $15 billion in 4Q08
• $5.2 billion decline in other comprehensive income driven by decline in securities values and pension liability
• Tier 1 Capital Ratio ended the year at 9.15%
• Tangible common ratio ended at 2.83%
� Tangible common as percent of RWA is 3.70%
Capital Actions During the Quarter
24
(Dollars in millions)
Fourth Third Second First Fourth
Quarter Quarter Quarter Quarter Quarter
2008 (1)
2008 2008 2008 2007
Risk-based capital:
Tier 1 capital $120,804 $100,248 $101,439 $93,899 $83,372
Total capital 171,644 153,318 154,983 146,531 133,720
Risk-weighted assets 1,320,824 1,328,084 1,230,307 1,250,942 1,212,905
Tier 1 capital ratio 9.15 % 7.55 % 8.25 % 7.51 % 6.87 %
Total capital ratio 13.00 11.54 12.60 11.71 11.02
Tangible equity ratio (2)
5.01 4.03 4.62 4.16 3.62
Tangible common equity ratio (3)
2.83 2.64 3.14 3.11 3.35
Tier 1 leverage ratio 6.44 5.51 6.07 5.59 5.04
(1) Preliminary data on risk-based capital
(2) Tangible equity ratio equals shareholders' equity less goodwill and intangible assets divided by total assets less goodwill and intangible assets.
(3) Tangible common equity ratio equals common shareholders' equity less goodwill and intangible assets divided by total assets less goodwill and intangible assets.

25
Comments on Merrill Lynch Preliminary Results
• Merrill Lynch reported net revenues of negative $12.6 billion and a loss of $15.5 billion after preferred dividends
• Global Wealth Management results included net revenues of $2.6 billion as fees held up well in the declining market
• Financial advisor retention remains consistent with historical trends
• Investment banking revenue was down only 4% from 3Q08 with a resilient pipeline
• Commodities business remains strong
• The balance sheet was reduced by 24% from the end of September
• 4Q08 results included correlation breakdowns on trading positions in certain businesses as well as:
– $1.9 billion transitory leveraged finance write downs driven by several concentrated commitments
– $1.1 billion of marks taken on commercial real estate exposures
– $2.9 billion CVA charge on monoline financial guarantor exposure on non U.S. Super Senior ABS CDO assets
– $282 million CVA charge on monoline financial guarantors covering U.S. super senior ABS CDOs
– $1.2 billion other than temporary impairment charge on the U.S. bank investment portfolio
– $1.7 billion losses on private equity and principal investment holdings
– $2.3 billion goodwill impairment charge

26
Preliminary Merrill Lynch Income Statement
($ in millions)
4Q08 3Q08
Revenue:
Principal transactions (13,109)$ (6,573)$
Commissions 1,450 1,745
Managed accounts and other fee-based revenues 1,295 1,395
Investment banking 813 845
Earnings from equity method investments (430) 4,401
Other (3,390) (2,986)
Subtotal (13,371) (1,173)
Interest and dividend revenues 4,624 9,019
Less interest expense 3,804 7,830
Total revenue, net of interest expense (12,551) 16
Noninterest expense 8,981 8,267
Pre-tax loss from continuing operations (21,532) (8,251)
Income tax benefit (6,237) (3,131)
Net loss from continuing operations (15,295) (5,120)
Pre-tax loss from discontinued operations (31) (53)
Income tax benefit (15) (21)
Net loss from discontinued operations (16) (32)
Net loss (15,311)$ (5,152)$
Preferred dividends 139 2,319
Net loss applicable to common stockholders (15,450)$ (7,471)$

27
Preliminary Pro Forma Combined Balance Sheet
1 Merrill Lynch balance sheet shown at December 31, 2008 and includes certain reporting reclassifications to conform to the combined company's classification.
2 TARP Equity funds allocated to Merrill Lynch received after acquisition, as agreed upon with the Treasury in October of 2008.
3 Pro forma Balance sheet does not include intercompany eliminations between Merrill Lynch and Bank of America.
3
($ in billions)
Bank of America Merrill Lynch 1
Purchase
Accounting
Adjustments
TARP Equity
Issuance 2 Pro forma 3
Assets
Federal funds sold and securities purchased under
agreements to resell / securities borrowed 82.5$ 138.8$ -$ -$ 221.3$
Trading account assets 159.5 88.1 - - 247.6
Derivative assets 62.3 97.5 (0.5) - 159.3
Securities 277.6 75.5 (1.5) - 351.6
Loans and leases, net of allowance for credit losses 908.4 57.7 (5.0) - 961.1
Goodwill 81.9 2.2 (2.2) - 87.3
5.4
Intangible assets 8.5 0.4 (0.4) - 14.3
5.8
Other assets 237.2 202.9 (7.4) 10.0 442.7 Total assets 1,817.9$ 663.1$ (5.8)$ 10.0$ 2,485.2$
Liabilities
Deposits 883.0$ 98.1$ -$ -$ 981.1$
Federal funds purchased and securities sold under
agreements to repurchase / securities loaned 206.6 111.6 - - 318.2
Derivative liabilities 30.7 72.0 - - 102.7
Commercial paper and other short-term borrowings 158.1 31.2 - - 189.3
Accrued expenses and other liabilities 94.2 117.7 1.2 - 213.1
Long-term debt 268.3 211.9 (15.5) - 464.7
Total liabilities 1,640.9 642.5 (14.3) - 2,269.1
Total shareholders' equity 177.0 20.6 8.5 10.0 216.1 Total liabilities and shareholders' equity 1,817.9$ 663.1$ (5.8)$ 10.0$ 2,485.2$
Bank of America/Merrill Lynch
Pro Forma Condensed Combined Balance Sheet
(unaudited)
December 31, 2008

28
Certain Preliminary Merrill Lynch Risk Exposures
Income Statement($ in millions) Exposures Marks
4Q08 4Q08
Transitory leveraged lending 5,648$ 1 (1,924)$
Commercial real estate 9,704 2 (1,131)
Unhedged US Super Senior ABS CDO 800 (369)
Hedged US Super Senior ABS CDO 1,005 -
1,458 3 (282)
Notional of $2,831 million
7,770 4 (2,935)
Notional of $50,313 million
US Bank's investment securities portfolio 10,431 (1,162) 5
1 Represents gross exposure, carried at a market value of $2,385 or 42%2 Includes equity positions but excludes First Republic Bank of $3,119 3 Represents Carrying value with a mark to market of $2,353 million and life-to-date CVA adj. of $895 million 4 Represents Carrying value with a mark to market of $12,773 million and life-to-date CVA adj. of $5,003 million 5 The cumulative, pre-tax balance in OCI related to this portfolio was approximately negative $9.3 billion at 12/26/08
CDS with Monoline Financial Guarantors on US ABS CDOs
CDS with Monoline Financial Guarantors on non US ABS CDOs

29
Merrill Lynch Preliminary Purchase Accounting 1
1 The value of shares of common stock exchanged with Merrill Lynch shareholders was based upon the closing price of the Corporation's common stock on December 31, 2008, the last traded price prior to acquisition.
2 Represents Merrill Lynch preferred stock exchanged for Bank of America preferred stock having substantially identical terms.
Purchase price
Merrill Lynch stock exchanged (in millions) 1,600
Exchange ratio 0.8595
Corporation's common stock exchanged (in millions) 1,375
Purchase price per share of the Corporation's common stock 1 $14.08
Total value of the Corporation's common stock and cash exchanged $19.4
Merrill Lynch preferred stock 2 8.6
Fair value of outstanding Merrill Lynch employee stock awards 1.1
Total purchase price $29.1
Preliminary allocation of the purchase price
Merrill Lynch shareholders' equity 20.6
Less: Historical goodwill and intangibles (2.6)
Pre-tax adjustments to reflect assets acquired and liabilities assumed at fair value:
Loans (5.0)
Securities and derivatives (2.0)
Identified intangibles 5.8
Other assets (3.5)
Debt 15.5
Change in control (1.2)
Pre-tax total adjustments 9.6
Deferred income taxes (3.9)
After tax total adjustments 5.7
Fair value of net assets acquired 23.7
Preliminary goodwill resulting from the merger $5.4
($ in billions, except per share amounts)

30
Preliminary Pro Forma Capital Ratios
$ in millions
Proforma Proforma
Bank of America Merrill Lynch Today's
12/31/2008 and PAA 1
actions 3
Total Assets 1,817.9 2,485.2 2,509.2
Goodwill & Intangibles 90.5 99.8 99.8 Tangible Assets 1,727.5 2,385.5 2,409.5
Common Equity 139.4 160.9 163.3
Total Equity 177.1 216.1 240.1
Tangible Common Equity 48.9 61.1 63.5 Tangible Total Equity 86.6 116.3 140.3 Regulatory data is preliminary
Tier 1 capital 120.8 147.9 174.3
Risk weighted assets 1,320.8 1,700.1 1,633.8
Capital Ratios
Tier 1 9.1% 8.7% 10.7%Equity / Assets 9.7% 8.7% 9.6%
Common Equity / Assets 7.7% 6.5% 6.5%
Tangible 2
Equity / Assets 5.0% 4.9% 5.8%Common Equity / Assets 2.8% 2.6% 2.6%
1 Includes Merrill Lynch Balance Sheet, including TARP investment and purchae accounting adjustments
2 Tangible ratios exclude goodwill and intangibles
3 Today's actions include the additional capital announcements

31
Conclusions
• Environment remains challenging
– Credit costs reflect economic environment
– Capital markets remain volatile
• Business momentum remains strong in most businesses
– Retail deposits and lending growing
– Commercial customers seeking capital for liquidity
– Wealth management customers borrowing and seeking yield on deposit products
• Balance sheet strengthened
• Integration of acquisitions is progressing well

32
Appendix

33
Bank of America
NII Sensitivity on a Managed Basis
First Rolling 12 Months
December 31, 2008
-300
-200
-100
0
100
200
300
-300 -200 -100 0 100 200 300
Change in 10-yr Swap
Ch
an
ge
in F
ed F
un
ds
Curve Flatteners
Year 1
Curve Steepeners
Stable
FF: 0.25%
10-Y: 2.56%
NII ∆: -1,709
NII ∆: -25
FF: 0.75%
10-Y: 1.80%
NII ∆: -638
1 Yr Fwd Rates
Avg Dec '09
FF: 0.75%
10-Y: 2.80%
FF: 1.75%
10-Y: 2.80%
NII ∆: -545
FF: 0.00%
10-Y: 1.80%
NII ∆: 519
FF: 2.75%
10-Y: 3.80%
NII ∆: -560
NII ∆: 144
FF: 0.75%
10-Y: 3.80%
NII ∆: 698
FF: 0.00%
10-Y: 2.80%
NII ∆: 453
NII ∆: -186
NII ∆: -102

34
Bank of America
NII Sensitivity on a Managed Basis
First Rolling 12 Months
September 30, 2008
-300
-200
-100
0
100
200
300
-300 -200 -100 0 100 200 300
Change in 10-yr Swap
Ch
an
ge
in F
ed F
un
ds
Curve Steepeners
Curve Flatteners
Year 1
Stable
FF: 2.00%
10-Y: 4.50%
NII ∆: -2,716
NII ∆: -1,630
FF: 2.32%
10-Y: 3.67%
NII ∆: -403
1 Yr Fwd Rates
Avg Sep '09
FF: 2.32%
10-Y: 4.67%
FF: 3.32%
10-Y: 4.67%
NII ∆: -927
FF: 0.32%
10-Y: 3.67%
NII ∆: 1,471
FF: 4.32%
10-Y: 5.67%
NII ∆: -1,697
NII ∆: -775
FF: 2.32%
10-Y: 5.67%
NII ∆: 156
FF: 1.32%
10-Y: 4.67%
NII ∆: 970
NII ∆: 558
NII ∆: 761

35
Consumer Asset Quality Key Indicators – SOP 03-3 Portfolio 1
1 The table below presents outstandings net of purchase accounting adjustments and net losses had the portfolio not been subject to SOP 03-3.
2 Increased balances reflect refinement of impaired loan population under SOP-03.
• The net losses shown on this table are not included in the net losses reported by the company as these loans were considered impaired and written down to fair value at acquisition in accordance with SOP 03-3.
• For linked quarter comparison 3Q08 net losses included approximately $500 million of one-time amounts to conform charge-off practices.
($ in millions)
4Q08 2 3Q08 4Q08 2 3Q08 4Q08 3Q08
Loans EOP 9,949$ 7,339$ 14,163$ 12,957$ 18,097$ 19,652$
Net losses 202 236 722 772 719 980
Residential
Mortgage Home Equity Discontinued Real Estate