TD Bank Group Reports Fourth Quarter and Fiscal … Bank Group Reports Fourth Quarter and Fiscal...
21
TD Bank Group Reports Fourth Quarter and Fiscal 2016 Results Earnings News Release • Three and Twelve months ended October 31, 2016 FOURTH QUARTER FINANCIAL HIGHLIGHTS, compared with the fourth quarter last year: Reported diluted earnings per share were $1.20, compared with $0.96. Adjusted diluted earnings per share were $1.22, compared with $1.14. Reported net income was $2,303 million, compared with $1,839 million. Adjusted net income was $2,347 million, compared with $2,177 million. FULL YEAR FINANCIAL HIGHLIGHTS, compared with last year: Reported diluted earnings per share were $4.67, compared with $4.21. Adjusted diluted earnings per share were $4.87, compared with $4.61. Reported net income was $8,936 million, compared with $8,024 million. Adjusted net income was $9,292 million, compared with $8,754 million. FOURTH QUARTER ADJUSTMENTS (ITEMS OF NOTE) The fourth quarter reported earnings figures included the following items of note: Amortization of intangibles of $60 million after tax (3 cents per share), compared with $65 million after tax (3 cents per share) in the fourth quarter last year. A gain of $16 million after tax (1 cent per share) due to the change in fair value of derivatives hedging the reclassified available-for-sale securities portfolio, compared with a gain of $21 million after tax (1 cent per share) in the fourth quarter last year. TORONTO, December 1, 2016 — TD Bank Group ("TD" or the "Bank") today announced its financial results for the fourth quarter ending October 31, 2016. Fourth quarter earnings were $2.3 billion, up 25% on a reported basis and 8% on an adjusted basis compared with the same quarter last year, reflecting growth in the U.S. Retail and Wholesale segments. Reported earnings for the year were $8.9 billion, an increase of 11% over last year and adjusted earnings of $9.3 billion increased by 6%. "We are pleased with our performance this quarter and overall earnings growth in 2016," said Bharat Masrani, Group President and Chief Executive Officer. "Our results this year demonstrate the strength of our diverse business mix, organic growth strategy and the investments we've made to become a more productive and customer-focused organization." This quarterly earnings news release should be read in conjunction with the Bank's unaudited Fourth Quarter 2016 consolidated financial results for the year ended October 31, 2016, included in this Earnings News Release and the audited 2016 Consolidated Financial Statements, prepared in accordance with International Financial Reporting Standards (IFRS) as issued by the International Accounting Standards Board (IASB), which is available on TD's website at http://www.td.com/investor/. This analysis is dated November 30, 2016. Unless otherwise indicated, all amounts are expressed in Canadian dollars, and have been primarily derived from the Bank's Annual or Interim Consolidated Financial Statements prepared in accordance with IFRS. Certain comparative amounts have been reclassified to conform to the presentation adopted in the current period. Additional information relating to the Bank is available on the TD's website at http://www.td.com, as well as on SEDAR at http://www.sedar.com and on the U.S. Securities and Exchange Commission's (SEC) website at http://www.sec.gov (EDGAR filers section). Reported results conform to generally accepted accounting principles (GAAP), in accordance with IFRS. Adjusted measures are non-GAAP measures. Refer to the "How the Bank Reports" section of the 2016 Management's Discussion and Analysis (MD&A) for an explanation of reported and adjusted results. TD BANK GROUP • FOURTH QUARTER 2016 EARNINGS NEWS RELEASE Page 1
-
Upload
hoangkhanh -
Category
Documents
-
view
215 -
download
0
Transcript of TD Bank Group Reports Fourth Quarter and Fiscal … Bank Group Reports Fourth Quarter and Fiscal...
TD Bank Group Reports Fourth Quarter and Fiscal 2016 Results Earnings News Release • Three and Twelve months ended October 31, 2016
FOURTH QUARTER FINANCIAL HIGHLIGHTS, compared with the fourth quarter last year:
Reported diluted earnings per share were $1.20, compared with $0.96.
Adjusted diluted earnings per share were $1.22, compared with $1.14.
Reported net income was $2,303 million, compared with $1,839 million.
Adjusted net income was $2,347 million, compared with $2,177 million.
FULL YEAR FINANCIAL HIGHLIGHTS, compared with last year:
Reported diluted earnings per share were $4.67, compared with $4.21.
Adjusted diluted earnings per share were $4.87, compared with $4.61.
Reported net income was $8,936 million, compared with $8,024 million.
Adjusted net income was $9,292 million, compared with $8,754 million.
FOURTH QUARTER ADJUSTMENTS (ITEMS OF NOTE)
The fourth quarter reported earnings figures included the following items of note:
Amortization of intangibles of $60 million after tax (3 cents per share), compared with $65 million after tax (3 cents per share) in the fourth quarter
last year.
A gain of $16 million after tax (1 cent per share) due to the change in fair value of derivatives hedging the reclassified available-for-sale securities
portfolio, compared with a gain of $21 million after tax (1 cent per share) in the fourth quarter last year.
TORONTO, December 1, 2016 — TD Bank Group ("TD" or the "Bank") today announced its financial results for the fourth quarter ending October 31, 2016. Fourth quarter earnings were $2.3 billion, up 25% on a reported basis and 8% on an adjusted basis compared with the same quarter last year, reflecting growth in the U.S. Retail and Wholesale segments. Reported earnings for the year were $8.9 billion, an increase of 11% over last year and adjusted earnings of $9.3 billion increased by 6%. "We are pleased with our performance this quarter and overall earnings growth in 2016," said Bharat Masrani, Group President and Chief Executive Officer. "Our results this year demonstrate the strength of our diverse business mix, organic growth strategy and the investments we've made to become a more productive and customer-focused organization."
This quarterly earnings news release should be read in conjunction with the Bank's unaudited Fourth Quarter 2016 consolidated financial results for the year ended October 31, 2016, included in this Earnings News Release and the audited 2016 Consolidated Financial Statements, prepared in accordance with International Financial Reporting Standards (IFRS) as issued by the International Accounting Standards Board (IASB), which is available on TD's website at http://www.td.com/investor/. This analysis is dated November 30, 2016. Unless otherwise indicated, all amounts are expressed in Canadian dollars, and have been primarily derived from the Bank's Annual or Interim Consolidated Financial Statements prepared in accordance with IFRS. Certain comparative amounts have been reclassified to conform to the presentation adopted in the current period. Additional information relating to the Bank is available on the TD's website at http://www.td.com, as well as on SEDAR at http://www.sedar.com and on the U.S. Securities and Exchange Commission's (SEC) website at http://www.sec.gov (EDGAR filers section). Reported results conform to generally accepted accounting principles (GAAP), in accordance with IFRS. Adjusted measures are non-GAAP measures. Refer to the "How the Bank Reports" section of the 2016 Management's Discussion and Analysis (MD&A) for an explanation of reported and adjusted results.
TD BANK GROUP • FOURTH QUARTER 2016 EARNINGS NEWS RELEASE Page 1

Canadian Retail Canadian Retail net income was $1,502 million for the fourth quarter compared with $1,496 million in the same quarter last year. Revenue growth of 3% and lower insurance claims were largely offset by higher non-interest expenses, the impact of a higher effective tax rate, and higher provisions for credit loss.
U.S. Retail U.S. Retail net income was $701 million (US$536 million) for the fourth quarter compared with $595 million (US$452 million) on a reported basis and $646 million (US$491 million) on an adjusted basis for the fourth quarter last year. The U.S. Retail Bank, which excludes the Bank's investment in TD Ameritrade, generated net income of $608 million (US$465 million), an increase of 25% (26% in U.S. dollars) on a reported basis and 13% (14% in U.S. dollars) on an adjusted basis, compared with the fourth quarter last year. The growth in earnings reflects revenue growth, strong operating leverage, increased loan and deposit volume, and good credit quality. TD Ameritrade contributed $93 million (US$71 million) in earnings to the segment compared with $109 million (US$84 million) for the same quarter last year.
Wholesale Banking Wholesale Banking net income was $238 million for the fourth quarter, an increase of 21% compared with the fourth quarter last year, reflecting revenue growth from higher origination activity in debt and equity capital markets, and fixed income trading, partially offset by lower equity trading revenue and advisory fees.
Capital TD's Common Equity Tier 1 Capital ratio on a Basel III fully phased-in basis was 10.4%. Conclusion
"As we look to 2017, we remain focused on growing market share, making strategic investments in our businesses, and executing with determination to deliver on our purpose: to enrich the lives of our customers, communities and colleagues. If current conditions are sustained, we are well positioned to deliver in 2017," said Masrani. "I would like to thank our colleagues for their dedication and valuable contributions this year, and our customers for the opportunity to serve them every day." The foregoing contains forward-looking statements. Please refer to the "Caution Regarding Forward-Looking Statements" on page 3.
TD BANK GROUP • FOURTH QUARTER 2016 EARNINGS NEWS RELEASE Page 2

Caution Regarding Forward-Looking Statements
From time to time, the Bank (as defined in this document) makes written and/or oral forward-looking statements, including in this document, in other filings with Canadian regulators or the United States (U.S.) Securities and Exchange Commission (SEC), and in other communications. In addition, representatives of the Bank may make forward-looking statements orally to analysts, investors, the media and others. All such statements are made pursuant to the "safe harbour" provisions of, and are intended to be forward-looking statements under, applicable Canadian and U.S. securities legislation, including the U.S. Private Securities Litigation Reform Act of 1995. Forward-looking statements include, but are not limited to, statements made in this document, including in the Management's Discussion and Analysis ("2016 MD&A") under the heading "Economic Summary and Outlook", for each business segment under headings "Business Outlook and Focus for 2017", and in other statements regarding the Bank's objectives and priorities for 2017 and beyond and strategies to achieve them, the regulatory environment in which the Bank operates, and the Bank's anticipated financial performance. Forward-looking statements are typically identified by words such as "will", "should", "believe", "expect", "anticipate", "intend", "estimate", "plan", "may", and "could". By their very nature, these forward-looking statements require the Bank to make assumptions and are subject to inherent risks and uncertainties, general and specific. Especially in light of the uncertainty related to the physical, financial, economic, political, and regulatory environments, such risks and uncertainties – many of which are beyond the Bank's control and the effects of which can be difficult to predict – may cause actual results to differ materially from the expectations expressed in the forward-looking statements. Risk factors that could cause, individually or in the aggregate, such differences include: credit, market (including equity, commodity, foreign exchange, and interest rate), liquidity, operational (including technology and infrastructure), reputational, insurance, strategic, regulatory, legal, environmental, capital adequacy, and other risks. Examples of such risk factors include the general business and economic conditions in the regions in which the Bank operates; the ability of the Bank to execute on key priorities, including the successful completion of acquisitions and dispositions, business retention plans, and strategic plans and to attract, develop and retain key executives; disruptions in or attacks (including cyber-attacks) on the Bank's information technology, internet, network access or other voice or data communications systems or services; the evolution of various types of fraud or other criminal behaviour to which the Bank is exposed; the failure of third parties to comply with their obligations to the Bank or its affiliates, including relating to the care and control of information; the impact of new and changes to, or application of, current laws and regulations, including without limitation tax laws, risk-based capital guidelines and liquidity regulatory guidance; the overall difficult litigation environment, including in the U.S.; increased competition, including through internet and mobile banking and non-traditional competitors; changes to the Bank's credit ratings; changes in currency and interest rates (including the possibility of negative interest rates); increased funding costs and market volatility due to market illiquidity and competition for funding; critical accounting estimates and changes to accounting standards, policies, and methods used by the Bank; existing and potential international debt crises; and the occurrence of natural and unnatural catastrophic events and claims resulting from such events. The Bank cautions that the preceding list is not exhaustive of all possible risk factors and other factors could also adversely affect the Bank's results. For more detailed information, please refer to the "Risk Factors and Management" section of the 2016 MD&A, as may be updated in subsequently filed quarterly reports to shareholders and news releases (as applicable) related to any transactions or events discussed under the heading "Significant Events" in the relevant MD&A, which applicable releases may be found on www.td.com. All such factors should be considered carefully, as well as other uncertainties and potential events, and the inherent uncertainty of forward-looking statements, when making decisions with respect to the Bank and the Bank cautions readers not to place undue reliance on the Bank's forward-looking statements. Material economic assumptions underlying the forward-looking statements contained in this document are set out in the 2016 MD&A under the headings "Economic Summary and Outlook", and for each business segment, "Business Outlook and Focus for 2017", each as may be updated in subsequently filed quarterly reports to shareholders. Any forward-looking statements contained in this document represent the views of management only as of the date hereof and are presented for the purpose of assisting the Bank's shareholders and analysts in understanding the Bank's financial position, objectives and priorities and anticipated financial performance as at and for the periods ended on the dates presented, and may not be appropriate for other purposes. The Bank does not undertake to update any forward-looking statements, whether written or oral, that may be made from time to time by or on its behalf, except as required under applicable securities legislation.
This document was reviewed by the Bank's Audit Committee and was approved by the Bank's Board of Directors, on the Audit Committee's recommendation, prior to its release.
TD BANK GROUP • FOURTH QUARTER 2016 EARNINGS NEWS RELEASE Page 3

TABLE 1: FINANCIAL HIGHLIGHTS
(millions of Canadian dollars, except as noted) For the three months ended For the twelve months ended
October 31 July 31 October 31 October 31 October 31 2016 2016 2015 2016 2015 Results of operations Total revenue $ 8,745 $ 8,701 $ 8,047 $ 34,315 $ 31,426 Provision for credit losses 548 556 509 2,330 1,683 Insurance claims and related expenses 585 692 637 2,462 2,500 Non-interest expenses 4,848 4,640 4,911 18,877 18,073 Net income – reported 2,303 2,358 1,839 8,936 8,024 Net income – adjusted1 2,347 2,416 2,177 9,292 8,754 Return on common equity – reported 13.3 % 14.1 % 11.4 % 13.3 % 13.4 % Return on common equity – adjusted2 13.6 14.5 13.5 13.9 14.7 Financial position Total assets $ 1,176,967 $ 1,182,436 $ 1,104,373 $ 1,176,967 $ 1,104,373 Total equity 74,214 71,204 67,028 74,214 67,028 Total Common Equity Tier 1 Capital risk-weighted assets3 405,844 388,243 382,360 405,844 382,360 Financial ratios Efficiency ratio – reported 55.4 % 53.3 % 61.0 % 55.0 % 57.5 % Efficiency ratio – adjusted1 54.8 52.6 55.3 53.9 54.3 Common Equity Tier 1 Capital ratio3 10.4 10.4 9.9 10.4 9.9 Tier 1 Capital ratio3 12.2 11.9 11.3 12.2 11.3 Total Capital ratio3 15.2 14.6 14.0 15.2 14.0 Leverage ratio 4.0 3.8 3.7 4.0 3.7 Provision for credit losses as a % of net average loans and acceptances4 0.37 0.39 0.40 0.41 0.34 Common share information – reported (dollars) Per share earnings Basic $ 1.20 $ 1.24 $ 0.96 $ 4.68 $ 4.22 Diluted 1.20 1.24 0.96 4.67 4.21 Dividends per share 0.55 0.55 0.51 2.16 2.00 Book value per share 36.71 35.68 33.81 36.71 33.81 Closing share price 60.86 56.89 53.68 60.86 53.68 Shares outstanding (millions) Average basic 1,855.4 1,853.4 1,853.1 1,853.4 1,849.2 Average diluted 1,858.8 1,856.6 1,857.2 1,856.8 1,854.1 End of period 1,857.2 1,854.8 1,855.1 1,857.2 1,855.1 Market capitalization (billions of Canadian dollars) $ 113.0 $ 105.5 $ 99.6 $ 113.0 $ 99.6 Dividend yield 3.7 % 3.8 % 3.9 % 3.9 % 3.8 % Dividend payout ratio 45.7 44.5 53.0 46.1 47.4 Price-earnings ratio 13.0 12.8 12.8 13.0 12.8 Common share information – adjusted (dollars)1 Per share earnings Basic $ 1.23 $ 1.27 $ 1.15 $ 4.88 $ 4.62 Diluted 1.22 1.27 1.14 4.87 4.61 Dividend payout ratio 44.8 % 43.4 % 44.5 % 44.3 % 43.3 % Price-earnings ratio 12.5 11.9 11.7 12.5 11.7 1 Adjusted measures are non-GAAP measures. Refer to the "How the Bank Reports" section of this document for an explanation of reported and adjusted results. 2 Adjusted return on common equity is a non-GAAP financial measure. Refer to the "Return on Common Equity" section of this document for an explanation. 3 Each capital ratio has its own risk-weighted assets (RWA) measure due to the Office of the Superintendent of Financial Institutions Canada (OSFI) prescribed scalar for inclusion of the
Credit Valuation Adjustment (CVA). The scalars for inclusion of CVA for Common Equity Tier 1 (CET1), Tier 1, and Total Capital RWA are 64%, 71%, and 77%, respectively. 4 Excludes acquired credit-impaired (ACI) loans and debt securities classified as loans. For additional information on ACI loans, refer to the "Credit Portfolio Quality" section of the
2016 MD&A and Note 8 of the 2016 Consolidated Financial Statements. For additional information on debt securities classified as loans, refer to the "Exposure to Non-Agency Collateralized Mortgage Obligations" discussion and tables in the "Credit Portfolio Quality" section of the 2016 MD&A and Note 8 of the 2016 Consolidated Financial Statements.
TD BANK GROUP • FOURTH QUARTER 2016 EARNINGS NEWS RELEASE Page 4

HOW WE PERFORMED How the Bank Reports
The Bank prepares its Consolidated Financial Statements in accordance with IFRS, the current GAAP, and refers to results prepared in accordance with IFRS as "reported" results. The Bank also utilizes non-GAAP financial measures referred to as "adjusted" results to assess each of its businesses and to measure the Bank's overall performance. To arrive at adjusted results, the Bank removes "items of note", net of income taxes, from reported results. The items of note relate to items which management does not believe are indicative of underlying business performance. The Bank believes that adjusted results provide the reader with a better understanding of how management views the Bank's performance. The items of note are disclosed in Table 3. As explained, adjusted results differ from reported results determined in accordance with IFRS. Adjusted results, items of note, and related terms used in this document are not defined terms under IFRS and, therefore, may not be comparable to similar terms used by other issuers.
TABLE 2: OPERATING RESULTS – Reported (millions of Canadian dollars) For the three months ended For the twelve months ended October 31 July 31 October 31 October 31 October 31 2016 2016 2015 2016 2015 Net interest income $ 5,072 $ 4,924 $ 4,887 $ 19,923 $ 18,724 Non-interest income 3,673 3,777 3,160 14,392 12,702 Total revenue 8,745 8,701 8,047 34,315 31,426 Provision for credit losses 548 556 509 2,330 1,683 Insurance claims and related expenses 585 692 637 2,462 2,500 Non-interest expenses 4,848 4,640 4,911 18,877 18,073 Income before income taxes and equity in net income of an investment in TD Ameritrade 2,764 2,813 1,990 10,646 9,170 Provision for income taxes 555 576 259 2,143 1,523 Equity in net income of an investment in TD Ameritrade 94 121 108 433 377 Net income – reported 2,303 2,358 1,839 8,936 8,024 Preferred dividends 43 36 26 141 99 Net income available to common shareholders and non-controlling interests in subsidiaries $ 2,260 $ 2,322 $ 1,813 $ 8,795 $ 7,925 Attributable to: Common shareholders $ 2,231 $ 2,293 $ 1,784 $ 8,680 $ 7,813 Non-controlling interests 29 29 29 115 112
TD BANK GROUP • FOURTH QUARTER 2016 EARNINGS NEWS RELEASE Page 5

The following table provides a reconciliation between the Bank's adjusted and reported results. TABLE 3: NON-GAAP FINANCIAL MEASURES – Reconciliation of Adjusted to Reported Net Income
(millions of Canadian dollars) For the three months ended For the twelve months ended
October 31 July 31 October 31 October 31 October 31 2016 2016 2015 2016 2015 Operating results – adjusted Net interest income $ 5,072 $ 4,924 $ 4,887 $ 19,923 $ 18,724 Non-interest income1 3,654 3,777 3,209 14,385 12,713 Total revenue 8,726 8,701 8,096 34,308 31,437 Provision for credit losses 548 556 509 2,330 1,683 Insurance claims and related expenses 585 692 637 2,462 2,500 Non-interest expenses2 4,784 4,577 4,480 18,496 17,076 Income before income taxes and equity in net income of an investment in TD Ameritrade 2,809 2,876 2,470 11,020 10,178 Provision for income taxes3 572 597 417 2,226 1,862 Equity in net income of an investment in TD Ameritrade4 110 137 124 498 438 Net income – adjusted 2,347 2,416 2,177 9,292 8,754 Preferred dividends 43 36 26 141 99 Net income available to common shareholders and non-controlling interests in subsidiaries – adjusted 2,304 2,380 2,151 9,151 8,655 Attributable to: Non-controlling interests in subsidiaries, net of income taxes 29 29 29 115 112 Net income available to common shareholders – adjusted 2,275 2,351 2,122 9,036 8,543 Adjustments for items of note, net of income taxes Amortization of intangibles5 (60) (58) (65) (246) (255) Fair value of derivatives hedging the reclassified available-for-sale securities portfolio6 16 – 21 6 55 Impairment of goodwill, non-financial assets, and other charges7 – – – (116) – Restructuring charges8 – – (243) – (471) Charge related to the acquisition in U.S. strategic cards portfolio and related integration costs9 – – (51) – (51) Litigation and litigation-related charge(s)/reserve(s)10 – – – – (8) Total adjustments for items of note (44) (58) (338) (356) (730) Net income available to common shareholders – reported $ 2,231 $ 2,293 $ 1,784 $ 8,680 $ 7,813
1 Adjusted non-interest income excludes the following items of note: fourth quarter 2016 – $19 million gain due to change in fair value of derivatives hedging the reclassified available-for-sale securities portfolio, as explained in footnote 6; second quarter 2016 – $58 million loss due to change in fair value of derivatives hedging the reclassified available-for-sale securities portfolio; first quarter 2016 – $46 million gain due to change in fair value of derivatives hedging the reclassified available-for-sale securities portfolio; fourth quarter 2015 – $24 million gain due to change in fair value of derivatives hedging the reclassified available-for-sale securities portfolio; $73 million difference of the transaction price over the fair value of the Nordstrom assets acquired, as explained in footnote 9; third quarter 2015 – $21 million gain due to change in fair value of derivatives hedging the reclassified available-for-sale securities portfolio; second quarter 2015 – $17 million gain due to change in fair value of derivatives hedging the reclassified available-for-sale securities portfolio.
2 Adjusted non-interest expenses excludes the following items of note: fourth quarter 2016 – $64 million amortization of intangibles, as explained in footnote 5; third quarter 2016 – $63 million amortization of intangibles; second quarter 2016 – $69 million amortization of intangibles; $111 million impairment of goodwill, certain intangibles, other non-financial assets, and other charges, as further explained in footnote 7; first quarter 2016 – $74 million amortization of intangibles; fourth quarter 2015 – $73 million amortization of intangibles; $349 million due to the initiatives to reduce costs, as explained in footnote 8; $9 million due to integration costs related to the Nordstrom transaction, as explained in footnote 9; third quarter 2015 – $70 million amortization of intangibles; $39 million recovery of litigation losses, as explained in footnote 10; second quarter 2015 – $73 million amortization of intangibles; $337 million due to the initiatives to reduce costs; $52 million of litigation charges, as explained in footnote 10; first quarter 2015 – $73 million amortization of intangibles.
3 For a reconciliation between reported and adjusted provision for income taxes, refer to the "Non-GAAP Financial Measures – Reconciliation of Reported to Adjusted Provision for Income Taxes" table in the "Income Taxes" section of the MD&A.
4 Adjusted equity in net income of an investment in TD Ameritrade excludes the following items of note: fourth quarter 2016 – $16 million amortization of intangibles, as explained in footnote 5; third quarter 2016 – $16 million amortization of intangibles; second quarter 2016 – $17 million amortization of intangibles; first quarter 2016 – $16 million amortization of intangibles; fourth quarter 2015 – $16 million amortization of intangibles; third quarter 2015 – $15 million amortization of intangibles; second quarter 2015 – $16 million amortization of intangibles; first quarter 2015 – $14 million amortization of intangibles. These amounts were reported in the Corporate segment.
5 Amortization of intangibles relate to intangibles acquired as a result of asset acquisitions and business combinations. Although the amortization of software and asset servicing rights are recorded in amortization of intangibles, they are not included for purposes of the items of note.
6 The Bank changed its trading strategy with respect to certain trading debt securities and reclassified these securities from trading to the available-for-sale category effective August 1, 2008. These debt securities are economically hedged, primarily with credit default swap and interest rate swap contracts which are recorded on a fair value basis with changes in fair value recorded in the period's earnings. Management believes that this asymmetry in the accounting treatment between derivatives and the reclassified debt securities results in volatility in earnings from period to period that is not indicative of the economics of the underlying business performance in Wholesale Banking. The Bank may from time to time replace securities within the portfolio to best utilize the initial, matched fixed term funding. As a result, the derivatives are accounted for on an accrual basis in Wholesale Banking and the gains and losses related to the derivatives in excess of the accrued amounts are reported in the Corporate segment. Adjusted results of the Bank exclude the gains and losses of the derivatives in excess of the accrued amount.
7 In the second quarter of 2016, the Bank recorded impairment losses on goodwill, certain intangibles, other non-financial assets and deferred tax assets, as well as other charges relating to the Direct Investing business in Europe that has been experiencing continued losses. These amounts are reported in the Corporate segment.
8 During 2015, the Bank commenced its restructuring review and recorded restructuring charges of $337 million ($228 million after tax) and $349 million ($243 million after tax) on a net basis, in the second quarter and fourth quarter of 2015, respectively. The restructuring initiatives were intended to reduce costs and manage expenses in a sustainable manner and to achieve greater operational efficiencies. These measures included process redesign and business restructuring, retail branch and real estate optimization, and organizational review. The restructuring charges have been recorded as an adjustment to net income within the Corporate segment.
9 On October 1, 2015, the Bank acquired substantially all of Nordstrom's existing U.S. Visa and private label consumer credit card portfolio and became the primary issuer of Nordstrom credit cards in the U.S. The transaction was treated as an asset acquisition and the difference on the date of acquisition of the transaction price over the fair value of assets acquired has been recorded in Non-interest income. In addition, the Bank incurred set-up, conversion and other one-time costs related to integration of the acquired cards and related program agreement. These amounts are included as an item of note in the U.S. Retail segment.
10 As a result of an adverse judgment and evaluation of certain other developments and exposures in the U.S. in 2015, the Bank took prudent steps to reassess its litigation provision. Having considered these factors, including related or analogous cases, the Bank determined, in accordance with applicable accounting standards, that an increase of $52 million ($32 million after tax) to the Bank's litigation provision was required in the second quarter of 2015. During the third quarter of 2015, distributions of $39 million ($24 million after tax) were received by the Bank as a result of previous settlements reached on certain matters in the U.S., whereby the Bank was assigned the right to these distributions, if and when made available.
TD BANK GROUP • FOURTH QUARTER 2016 EARNINGS NEWS RELEASE Page 6

TABLE 4: RECONCILIATION OF REPORTED TO ADJUSTED EARNINGS PER SHARE (EPS)1
(Canadian dollars) For the three months ended For the twelve months ended
October 31 July 31 October 31 October 31 October 31 2016 2016 2015 2016 2015
Basic earnings per share – reported $ 1.20 $ 1.24 $ 0.96 $ 4.68 $ 4.22 Adjustments for items of note2 0.03 0.03 0.19 0.20 0.40
Basic earnings per share – adjusted $ 1.23 $ 1.27 $ 1.15 $ 4.88 $ 4.62
Diluted earnings per share – reported $ 1.20 $ 1.24 $ 0.96 $ 4.67 $ 4.21 Adjustments for items of note2 0.02 0.03 0.18 0.20 0.40
Diluted earnings per share – adjusted $ 1.22 $ 1.27 $ 1.14 $ 4.87 $ 4.61 1 EPS is computed by dividing net income available to common shareholders by the weighted-average number of shares outstanding during the period. 2 For explanations of items of note, refer to the "Non-GAAP Financial Measures – Reconciliation of Adjusted to Reported Net Income" table in the "How We Performed" section of this
document. TABLE 5: NON-GAAP FINANCIAL MEASURES – Reconciliation of Reported to Adjusted Provision for Income Taxes
(millions of Canadian dollars, except as noted) For the three months ended For the twelve months ended
October 31 July 31 October 31 October 31 October 31 2016 2016 2015 2016 2015 Provision for income taxes – reported $ 555 $ 576 $ 259 $ 2,143 $ 1,523 Adjustments for items of note: Recovery of (provision for) income taxes1,2 Amortization of intangibles 20 21 24 89 95 Fair value of derivatives hedging the reclassified available-for-sale securities portfolio (3) – (3) (1) (7) Impairment of goodwill, non-financial assets, and other charges – – – (5) – Restructuring charges – – 106 – 215 Charge related to the acquisition in U.S. strategic cards portfolio and related integration costs – – 31 – 31 Litigation and litigation-related charge(s)/reserve(s) – – – – 5 Total adjustments for items of note 17 21 158 83 339 Provision for income taxes – adjusted $ 572 $ 597 $ 417 $ 2,226 $ 1,862 Effective income tax rate – adjusted3 20.4 % 20.8 % 16.9 % 20.2 % 18.3 % 1 For explanations of items of note, refer to the "Non-GAAP Financial Measures – Reconciliation of Adjusted to Reported Net Income" table in the "How We Performed" section of this
document. 2 The tax effect for each item of note is calculated using the statutory income tax rate of the applicable legal entity.
3 Adjusted effective income tax rate is the adjusted provision for income taxes before other taxes as a percentage of adjusted net income before taxes. RETURN ON COMMON EQUITY
The Bank's methodology for allocating capital to its business segments is aligned with the common equity capital requirements under Basel III. The capital allocated to the business segments is based on 9% Common Equity Tier 1 (CET1) Capital. Adjusted return on common equity (ROE) is adjusted net income available to common shareholders as a percentage of average common equity. Adjusted ROE is a non-GAAP financial measure as it is not a defined term under IFRS. Readers are cautioned that earnings and other measures adjusted to a basis other than IFRS do not have standardized meanings under IFRS and, therefore, may not be comparable to similar terms used by other issuers. TABLE 6: RETURN ON COMMON EQUITY
(millions of Canadian dollars, except as noted) For the three months ended For the twelve months ended October 31 July 31 October 31 October 31 October 31 2016 2016 2015 2016 2015 Average common equity $ 66,769 $ 64,595 $ 62,157 $ 65,121 $ 58,178 Net income available to common shareholders – reported 2,231 2,293 1,784 8,680 7,813 Items of note, net of income taxes1 44 58 338 356 730 Net income available to common shareholders – adjusted 2,275 2,351 2,122 9,036 8,543 Return on common equity – reported 13.3 % 14.1 % 11.4 % 13.3 % 13.4 % Return on common equity – adjusted 13.6 14.5 13.5 13.9 14.7 1 For explanations of items of note, refer to the "Non-GAAP Financial Measures – Reconciliation of Adjusted to Reported Net Income" table in the "How We Performed" section of this
document. SIGNIFICANT EVENTS IN 2016
Announced Acquisition of Scottrade Bank
On October 24, 2016, the Bank announced an agreement to acquire Scottrade Bank, a federal savings bank wholly-owned by Scottrade Financial Services, Inc. (Scottrade), for cash consideration equal to the tangible book value of Scottrade Bank at closing, subject to certain adjustments. As of September 30, 2016, Scottrade Bank's tangible book value was approximately US$1.3 billion. TD Ameritrade also announced an agreement to acquire Scottrade for cash and TD Ameritrade shares. Subject to completion of the acquisitions, TD and TD Ameritrade have agreed that TD will accept sweep deposits from Scottrade clients. Pursuant to its preemptive rights and subject to any required regulatory approval, the Bank intends to concurrently purchase US$400 million in new common equity from TD Ameritrade in connection with the proposed transaction. As a result, the Bank's anticipated pro forma common stock ownership in TD Ameritrade is expected to be approximately 41.4%. The transaction is subject to the concurrent closing of the TD Ameritrade/Scottrade transaction as well as receipt of regulatory approvals and other customary closing conditions, and is expected to close in the second half of fiscal 2017. The results of the acquired business will be consolidated from the date of close and will be included in the U.S. Retail segment.
TD BANK GROUP • FOURTH QUARTER 2016 EARNINGS NEWS RELEASE Page 7

HOW OUR BUSINESSES PERFORMED For management reporting purposes, the Bank reports its results under three key business segments: Canadian Retail, which includes the results of the Canadian personal and commercial banking, wealth, and insurance businesses; U.S. Retail, which includes the results of the U.S. retail and commercial banking operations, wealth management services, and the Bank's investment in TD Ameritrade; and Wholesale Banking. The Bank's other activities are grouped into the Corporate segment. Results of each business segment reflect revenue, expenses, assets, and liabilities generated by the businesses in that segment. Where applicable, the Bank measures and evaluates the performance of each segment based on adjusted results and ROE, and for those segments the Bank indicates that the measure is adjusted. For further details, refer to the "How the Bank Reports" section of this document, the "Business Focus" section in the 2016 MD&A, and Note 1 of the Bank's Consolidated Financial Statements for the year ended October 31, 2016. For information concerning the Bank's measure of adjusted return on average common equity, which is a non-GAAP financial measure, refer to the "How We Performed" section of this document. Effective the first quarter of 2016, the presentation of the U.S. strategic cards portfolio revenues, provision for credit losses (PCL), and expenses in the U.S. Retail segment includes only the Bank's agreed portion of the U.S. strategic cards portfolio, while the Corporate segment includes the retailer program partners' share. Certain comparative amounts have been recast to conform with this revised presentation. There was no impact on the net income of the segments or on the presentation of gross and net results in the Bank's Consolidated Statement of Income. Net interest income within Wholesale Banking is calculated on a taxable equivalent basis (TEB), which means that the value of non-taxable or tax-exempt income, including dividends, is adjusted to its equivalent before-tax value. Using TEB allows the Bank to measure income from all securities and loans consistently and makes for a more meaningful comparison of net interest income with similar institutions. The TEB increase to net interest income and provision for income taxes reflected in Wholesale Banking's results are reversed in the Corporate segment. The TEB adjustment for the quarter was $86 million, compared with $95 million in the fourth quarter last year, and $79 million in the prior quarter. TABLE 7: CANADIAN RETAIL
(millions of Canadian dollars, except as noted) For the three months ended
October 31 July 31 October 31 2016 2016 2015 Net interest income $ 2,551 $ 2,519 $ 2,497 Non-interest income 2,599 2,622 2,500 Total revenue 5,150 5,141 4,997 Provision for credit losses 263 258 221 Insurance claims and related expenses 585 692 637 Non-interest expenses 2,250 2,133 2,143 Net income $ 1,502 $ 1,509 $ 1,496 Selected volumes and ratios Return on common equity 41.5 % 41.9 % 42.3 % Margin on average earning assets (including securitized assets) 2.78 2.79 2.84 Efficiency ratio 43.7 41.5 42.9 Assets under administration (billions of Canadian dollars) $ 345 $ 337 $ 310 Assets under management (billions of Canadian dollars) 268 265 245 Number of Canadian retail branches 1,156 1,152 1,165 Average number of full-time equivalent staff 39,149 38,852 38,782 Quarterly comparison – Q4 2016 vs. Q4 2015 Canadian Retail net income for the quarter was $1,502 million, an increase of $6 million compared with the fourth quarter last year. The increase in earnings reflects revenue growth and lower insurance claims, largely offset by higher non-interest expenses, the impact of a higher effective tax rate and higher PCL. The annualized ROE for the quarter was 41.5%, compared with 42.3% in the fourth quarter last year.
Canadian Retail revenue is derived from the Canadian personal and commercial banking, wealth, and insurance businesses. Revenue for the quarter was $5,150 million, an increase of $153 million, or 3%, compared with the fourth quarter last year. Net interest income increased $54 million, or 2%, reflecting loan and deposit volume growth, partially offset by lower margins. Non-interest income increased $99 million, or 4%, reflecting wealth asset growth, higher fee-based revenue in personal and commercial banking, and changes in the fair value of investments supporting claims liabilities, partially offset by lower insurance premiums. Margin on average earning assets was 2.78%, a 6 basis points (bps) decrease, reflecting the low interest rate environment and competitive pricing.
Average loan volumes increased $17 billion, or 5%, compared with the fourth quarter last year, reflecting 4% growth in personal loan volumes and 10% growth in business loan volumes. Average deposit volumes increased $26 billion, or 10%, compared with the fourth quarter last year, reflecting 7% growth in personal deposit volumes, 13% growth in business deposit volumes and 19% growth in wealth deposit volumes.
Assets under administration (AUA) were $345 billion as at October 31, 2016, an increase of $35 billion, or 11%, and assets under management (AUM) were $268 billion as at October 31, 2016, an increase of $23 billion, or 9%, compared with the fourth quarter of last year, both reflecting new asset growth and increases in market value.
PCL for the quarter was $263 million, an increase of $42 million, or 19%, compared with the fourth quarter last year. Personal banking PCL was $245 million, an increase of $17 million, or 7%, reflecting higher provisions in the auto lending portfolio in the current quarter. Business banking PCL was $18 million, an increase of $25 million, primarily reflecting higher commercial recoveries in the prior year. Annualized PCL as a percentage of credit volume was 0.28%, or an increase of 3 bps. Net impaired loans were $705 million, a decrease of $10 million, or 1%. Net impaired loans as a percentage of total loans were 0.19%, compared with 0.20% as at October 31, 2015.
Insurance claims and related expenses for the quarter were $585 million, a decrease of $52 million, or 8%, compared with the fourth quarter last year, reflecting more favourable prior years' claims development, less severe weather conditions and a change in mix of reinsurance contracts, partially offset by unfavourable current year claims experience and changes in the fair value of investments supporting claims liabilities.
Non-interest expenses for the quarter were $2,250 million, an increase of $107 million, or 5%, compared with the fourth quarter last year. The increase reflects business growth, higher investment in technology and higher employee-related expenses including revenue-based variable expenses in the wealth business, partially offset by productivity savings. The efficiency ratio for the quarter was 43.7%, compared with 42.9% in the fourth quarter last year.
TD BANK GROUP • FOURTH QUARTER 2016 EARNINGS NEWS RELEASE Page 8
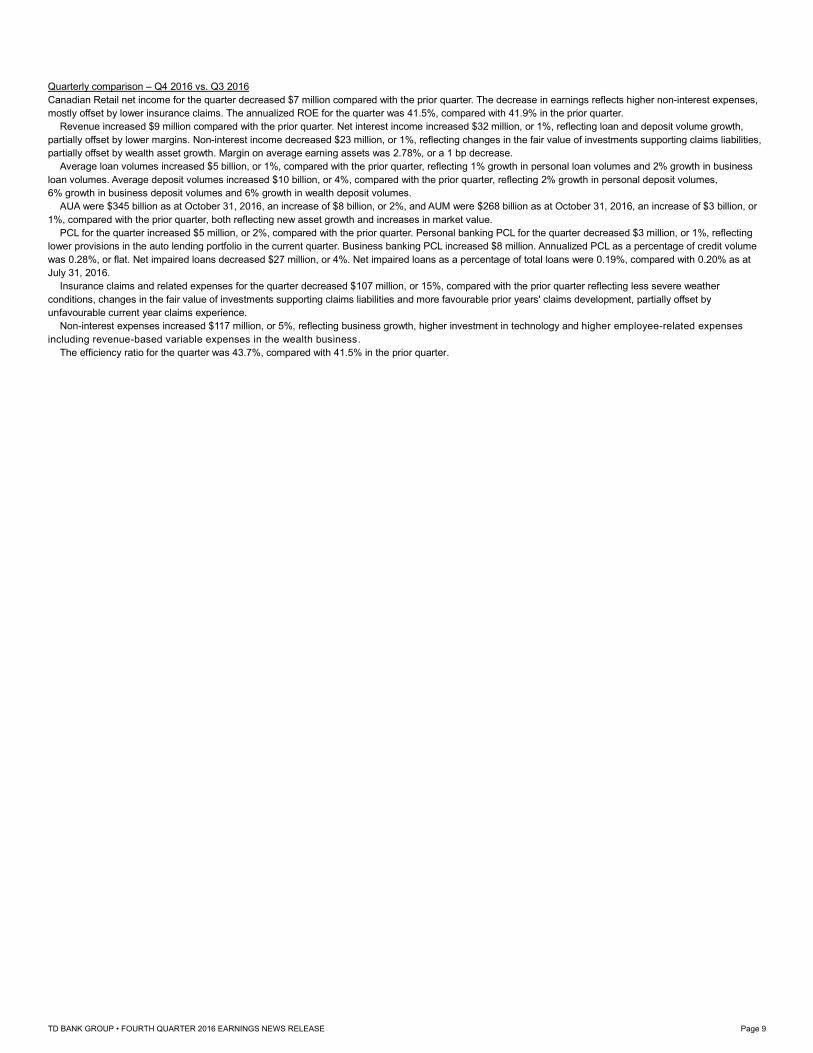
Quarterly comparison – Q4 2016 vs. Q3 2016 Canadian Retail net income for the quarter decreased $7 million compared with the prior quarter. The decrease in earnings reflects higher non-interest expenses, mostly offset by lower insurance claims. The annualized ROE for the quarter was 41.5%, compared with 41.9% in the prior quarter. Revenue increased $9 million compared with the prior quarter. Net interest income increased $32 million, or 1%, reflecting loan and deposit volume growth, partially offset by lower margins. Non-interest income decreased $23 million, or 1%, reflecting changes in the fair value of investments supporting claims liabilities, partially offset by wealth asset growth. Margin on average earning assets was 2.78%, or a 1 bp decrease. Average loan volumes increased $5 billion, or 1%, compared with the prior quarter, reflecting 1% growth in personal loan volumes and 2% growth in business loan volumes. Average deposit volumes increased $10 billion, or 4%, compared with the prior quarter, reflecting 2% growth in personal deposit volumes, 6% growth in business deposit volumes and 6% growth in wealth deposit volumes. AUA were $345 billion as at October 31, 2016, an increase of $8 billion, or 2%, and AUM were $268 billion as at October 31, 2016, an increase of $3 billion, or 1%, compared with the prior quarter, both reflecting new asset growth and increases in market value. PCL for the quarter increased $5 million, or 2%, compared with the prior quarter. Personal banking PCL for the quarter decreased $3 million, or 1%, reflecting lower provisions in the auto lending portfolio in the current quarter. Business banking PCL increased $8 million. Annualized PCL as a percentage of credit volume was 0.28%, or flat. Net impaired loans decreased $27 million, or 4%. Net impaired loans as a percentage of total loans were 0.19%, compared with 0.20% as at July 31, 2016. Insurance claims and related expenses for the quarter decreased $107 million, or 15%, compared with the prior quarter reflecting less severe weather conditions, changes in the fair value of investments supporting claims liabilities and more favourable prior years' claims development, partially offset by unfavourable current year claims experience. Non-interest expenses increased $117 million, or 5%, reflecting business growth, higher investment in technology and higher employee-related expenses including revenue-based variable expenses in the wealth business. The efficiency ratio for the quarter was 43.7%, compared with 41.5% in the prior quarter.
TD BANK GROUP • FOURTH QUARTER 2016 EARNINGS NEWS RELEASE Page 9

TABLE 8: U.S. RETAIL1
(millions of dollars, except as noted) For the three months ended
October 31 July 31 October 31 Canadian Dollars 2016 2016 2015 Net interest income $ 1,832 $ 1,755 $ 1,658 Non-interest income 592 591 492 Total revenue – reported 2,424 2,346 2,150 Total revenue – adjusted 2,424 2,346 2,223 Provision for credit losses 193 168 174 Non-interest expenses – reported 1,499 1,372 1,442 Non-interest expenses – adjusted 1,499 1,372 1,433 U.S. Retail Bank net income – reported2 608 663 486 Adjustments for items of note, net of income taxes3 Charge related to the acquisition in U.S. strategic cards portfolio and related integration costs – – 51 U.S. Retail Bank net income – adjusted2 608 663 537 Equity in net income of an investment in TD Ameritrade 93 125 109 Net income – adjusted $ 701 $ 788 $ 646 Net income – reported 701 788 595 U.S. Dollars Net interest income $ 1,396 $ 1,354 $ 1,260 Non-interest income 452 456 373 Total revenue – reported 1,848 1,810 1,633 Total revenue – adjusted 1,848 1,810 1,689 Provision for credit losses 146 130 133 Non-interest expenses – reported 1,142 1,058 1,096 Non-interest expenses – adjusted 1,142 1,058 1,089 U.S. Retail Bank net income – reported2 465 512 368 Adjustments for items of note, net of income taxes3 Charge related to the acquisition in U.S. strategic cards portfolio and related integration costs – – 39 U.S. Retail Bank net income – adjusted2 465 512 407 Equity in net income of an investment in TD Ameritrade 71 97 84 Net income – adjusted $ 536 $ 609 $ 491 Net income – reported 536 609 452 Selected volumes and ratios Return on common equity – reported 8.3 % 9.5 % 7.1 % Return on common equity – adjusted 8.3 9.5 7.8 Margin on average earning assets4 3.13 3.14 3.08 Efficiency ratio – reported 61.8 58.5 67.1 Efficiency ratio – adjusted 61.8 58.5 64.5 Assets under administration (billions of U.S. dollars) $ 13 $ 13 $ 12 Assets under management (billions of U.S. dollars)5 63 71 77 Number of U.S. retail stores 1,278 1,267 1,298 Average number of full-time equivalent staff 26,103 25,998 25,250 1 Certain comparative amounts and ratios have been recast to conform with the revised presentation, which includes only the Bank's agreed portion of revenue, PCL, and expenses for the
U.S. strategic cards portfolio and was adopted in the first quarter of 2016. For further details, refer to the "How our Businesses Performed" section of this document. 2 Before the equity in net income of the Bank's investment in TD Ameritrade. 3 For explanations of items of note, refer to the "Non-GAAP Financial Measures – Reconciliation of Adjusted to Reported Net Income" table in the "How We Performed" section of this
document. 4 The margin on average earning assets excludes the impact related to the TD Ameritrade insured deposit accounts (IDA) and the impact of intercompany deposits and cash collateral. In
addition, the value of tax-exempt interest income is adjusted to its equivalent before-tax value. 5 On August 30, 2016, a sub-advisory agreement with respect to $14 billion in assets was terminated, of which $3 billion were withdrawn before October 31, 2016, with the remainder to be
completed by December 8, 2016. The revenue and net income associated with the terminated sub-advisory agreement is not significant to the wealth business in U.S. Retail. Quarterly comparison – Q4 2016 vs. Q4 2015 U.S. Retail net income for the quarter was $701 million (US$536 million), which included net income of $608 million (US$465 million) from the U.S. Retail Bank and $93 million (US$71 million) from the Bank's investment in TD Ameritrade. U.S. Retail reported earnings increased US$84 million, or 19%, compared with the fourth quarter last year, while adjusted earnings were up US$45 million, or 9%. U.S. Retail Canadian dollar reported earnings were up $106 million, or 18% and adjusted earnings were up $55 million, or 9%. The reported and adjusted annualized ROE for the quarter was 8.3%, compared with 7.1% and 7.8%, respectively, in the fourth quarter last year. The contribution from TD Ameritrade of US$71 million was down US$13 million, or 15% compared with the fourth quarter last year, primarily due to reduced trading volumes and higher operating expenses, partially offset by higher asset-based revenue and favourable tax items. U.S. Retail Bank reported net income for the quarter increased US$97 million, or 26%, compared with the fourth quarter last year, due to higher loan and deposit volumes, fee income growth and a charge related to an acquisition in the strategic cards portfolio in the same period last year, partially offset by higher expenses. U.S. Retail Bank adjusted net income increased US$58 million, or 14%.
U.S. Retail Bank revenue is derived from personal and business banking, wealth management services, and investments. Revenue for the quarter was US$1,848 million. Reported revenue increased US$215 million, or 13%, compared with the fourth quarter last year, while adjusted revenue increased US$159 million, or 9%. Net interest income increased US$136 million, or 11%, reflecting higher loan and deposit volumes and higher deposit margins, partially offset by loan margin compression. Margin on average earning assets was 3.13%, a 5 bps increase, primarily due to higher deposit margins, the December 2015 Fed rate increase (the "rate increase"), and favourable balance sheet mix, partially offset by lower loan margins. Reported non-interest income increased US$79 million, or 21%, reflecting customer account growth, and the positive impact from an acquisition in the strategic cards portfolio, partially offset by unfavourable hedging impact. Adjusted non-interest income increased US$23 million, or 5%.
TD BANK GROUP • FOURTH QUARTER 2016 EARNINGS NEWS RELEASE Page 10

Excluding an acquisition in the strategic cards portfolio, average loan volumes increased US$12 billion, or 9%, compared with the fourth quarter last year due to growth in business and personal loans of 14% and 4%, respectively. Average deposit volumes increased US$20 billion, or 9%, reflecting 6% growth in business deposit volumes, 9% growth in personal deposit volumes and a 12% increase in sweep deposit volume from TD Ameritrade. AUA were US$13 billion as at October 31, 2016, an increase of 11%, compared with the fourth quarter last year, primarily due to an increase in private banking balances. AUM were US$63 billion as at October 31, 2016, a decrease of 17%, primarily due to net outflows from institutional accounts. PCL for the quarter was US$146 million, an increase of US$13 million, or 10%, compared with the fourth quarter last year. Personal banking PCL was US$105 million, a decrease of US$14 million, or 12%, primarily related to release of South Carolina flooding reserve. Business banking PCL was US$40 million, a US$4 million increase, or 11%. PCL associated with debt securities classified as loans was US$1 million, an increase of US$23 million, due to a recovery in the same period last year. Net impaired loans, excluding ACI loans and debt securities classified as loans, were US$1.5 billion, an increase of US$10 million, or 1%. Net impaired loans, excluding ACI loans and debt securities classified as loans, as a percentage of total loans were 1% as at October 31, 2016, a decrease of 8 bps compared with last year. Net impaired debt securities classified as loans were US$641 million, a decrease of US$157 million, or 20%. Non-interest expenses for the quarter were US$1,142 million. Reported non-interest expenses increased US$46 million, or 4%, compared with the fourth quarter last year, primarily due to business initiatives including store optimization, volume growth, investments in front line employees and additional charges by the Federal Deposit Insurance Corporation, partially offset by productivity savings. Adjusted non-interest expenses increased US$53 million, or 5%. The reported and adjusted efficiency ratios for the quarter were 61.8%, compared with 67.1% and 64.5%, respectively, in the fourth quarter last year. Quarterly comparison – Q4 2016 vs. Q3 2016 U.S. Retail earnings decreased US$73 million, or 12%, compared with the prior quarter. U.S. Retail Canadian dollar earnings decreased $87 million, or 11%. The annualized ROE for the quarter was 8.3%, compared to 9.5% in the prior quarter.
The contribution from TD Ameritrade decreased US$26 million, or 27%, compared with the prior quarter, primarily due to higher operating expenses, lower trading volumes and a favourable tax item in the prior quarter.
U.S. Retail Bank net income for the quarter decreased US$47 million, or 9%, compared with the prior quarter, due to higher expenses and PCL, partially offset by higher revenue.
Revenue for the quarter increased US$38 million, or 2%, compared with the prior quarter. Net interest income increased US$42 million, or 3%, primarily due to higher loan and deposit volumes. Margin on average earning assets was 3.13%, a 1bp decrease compared with the prior quarter. Non-interest income decreased US$4 million, or 1%, reflecting unfavourable hedging impact, partially offset by growth in consumer deposit fees.
Average loan volumes increased 2% compared with the prior quarter, due to growth in business and personal banking. Average deposit volumes increased US$9 billion, or 4%, primarily due to 5% growth in business deposit volumes and 6% growth in sweep deposit volume from TD Ameritrade. AUA were US$13 billion as at October 31, 2016, an increase of 5%, compared with the prior quarter. AUM were US$63 billion as at October 31, 2016, a decrease of 11%, primarily due to net outflows from institutional accounts. PCL for the quarter increased US$16 million, or 12%, compared with the prior quarter. Personal banking PCL was US$105 million, an increase of US$25 million, or 31%, reflecting seasonality in the auto lending and credit card portfolios. Business banking PCL was US$40 million, a decrease of US$9 million, primarily related to release of South Carolina flooding reserve. PCL associated with debt securities classified as loans was US$1 million, flat compared with the prior quarter. Net impaired loans, excluding ACI loans and debt securities classified as loans, were US$1.5 billion, flat compared with the prior quarter. Net impaired loans, excluding ACI loans and debt securities classified as loans, as a percentage of total loans decreased 3 bps compared to the prior quarter. Net impaired debt securities classified as loans decreased US$32 million, or 5%. Non-interest expenses for the quarter increased US$84 million, or 8%, compared with the prior quarter, primarily due to business initiatives, employee costs, seasonal increase in regulatory fees and additional charges by the Federal Deposit Insurance Corporation. The efficiency ratio for the quarter was 61.8%, compared with 58.5% in the prior quarter.
TD BANK GROUP • FOURTH QUARTER 2016 EARNINGS NEWS RELEASE Page 11

TABLE 9: WHOLESALE BANKING (millions of Canadian dollars, except as noted) For the three months ended October 31 July 31 October 31 2016 2016 2015 Net interest income (TEB) $ 396 $ 390 $ 550 Non-interest income 345 469 116 Total revenue 741 859 666 Provision for credit losses 1 11 14 Non-interest expenses 432 437 390 Net income $ 238 $ 302 $ 196 Selected volumes and ratios Trading-related revenue $ 380 $ 447 $ 316 Gross drawn (billions of Canadian dollars)1 20.7 20.6 16.1 Return on common equity 16.1 % 20.4 % 13.0 % Efficiency ratio 58.3 50.9 58.6 Average number of full-time equivalent staff 3,893 3,808 3,741 1 Includes gross loans and bankers' acceptances, excluding letters of credit, cash collateral, credit default swaps, and reserves for the corporate lending business. Quarterly comparison – Q4 2016 vs. Q4 2015 Wholesale Banking net income for the quarter was $238 million, an increase of $42 million, or 21%, compared with the fourth quarter last year reflecting higher revenue, lower PCL and a lower effective tax rate, partially offset by higher non-interest expenses. The annualized ROE for the quarter was 16.1%, compared with 13.0% in the fourth quarter last year. Wholesale Banking revenue is derived primarily from capital markets services and corporate lending. The capital markets businesses generate revenue from advisory, underwriting, trading, facilitation, and trade execution services. Revenue for the quarter was $741 million, an increase of $75 million, or 11%, compared with the fourth quarter last year reflecting higher origination activity in debt and equity capital markets and higher fixed income trading, partially offset by lower equity trading and advisory fees. PCL for the quarter was $1 million consisting primarily of the accrual cost of credit protection. PCL in the prior year reflected specific provisions in the oil and gas sector. Non-interest expenses were $432 million, an increase of $42 million, or 11%, compared with the fourth quarter last year, reflecting higher variable compensation, higher operating expenses and the unfavourable impact of foreign exchange translation. Quarterly comparison – Q4 2016 vs. Q3 2016 Wholesale Banking net income for the quarter decreased $64 million, or 21%, compared with the prior quarter reflecting lower revenue, partially offset by lower PCL, lower non-interest expenses and a lower effective tax rate. The annualized ROE for the quarter was 16.1%, compared with 20.4% in the prior quarter. Revenue for the quarter decreased $118 million, or 14%, compared with the prior quarter reflecting lower equity underwriting fees and lower fixed income trading. PCL for the quarter was $1 million consisting primarily of the accrual cost of credit protection. PCL in the prior quarter reflected specific provisions in the oil and gas sector.
TD BANK GROUP • FOURTH QUARTER 2016 EARNINGS NEWS RELEASE Page 12

TABLE 10: CORPORATE (millions of Canadian dollars) For the three months ended October 31 July 31 October 31 2016 2016 2015 Net income (loss) – reported $ (138) $ (241) $ (448) Adjustments for items of note1 Amortization of intangibles 60 58 65 Fair value of derivatives hedging the reclassified available-for-sale securities portfolio (16) – (21) Restructuring charges – – 243 Total adjustments for items of note 44 58 287 Net income (loss) – adjusted $ (94) $ (183) $ (161) Decomposition of items included in net income (loss) – adjusted Net corporate expenses $ (215) $ (222) $ (192) Other 92 10 2 Non-controlling interests 29 29 29 Net income (loss) – adjusted $ (94) $ (183) $ (161) Selected volumes Average number of full-time equivalent staff 13,830 13,320 12,781 1
For explanations of items of note, refer to the "Non-GAAP Financial Measures – Reconciliation of Adjusted to Reported Net Income" table in the "How We Performed" section of this document.
Quarterly comparison – Q4 2016 vs. Q4 2015 Corporate segment's reported net loss for the quarter was $138 million, compared with a reported net loss of $448 million in the fourth quarter last year. Reported net loss decreased due to restructuring charges of $243 million after tax in the fourth quarter last year and higher contribution from Other Items, partially offset by higher net corporate expenses. Other items included higher revenue from treasury and balance sheet management activities, favourable impact of tax items recognized in the current quarter, and provisions for incurred but not identified credit losses recognized in the fourth quarter last year. Net corporate expenses increased due to ongoing investments in enterprise and regulatory projects. Adjusted net loss was $94 million, compared with an adjusted net loss of $161 million in the fourth quarter last year. Quarterly comparison – Q4 2016 vs. Q3 2016 Corporate segment's reported net loss for the quarter was $138 million, compared with a reported net loss of $241 million in the prior quarter. Reported net loss decreased primarily due to higher contribution from Other Items and gains related to the fair value of derivatives hedging the reclassified available-for-sale securities portfolio recognized in the current quarter. Other items included higher revenue from treasury and balance sheet management activities, favourable impact of tax items recognized in the current quarter, and provisions for incurred but not identified credit losses recognized in the prior quarter. Adjusted net loss was $94 million, compared with an adjusted net loss of $183 million in the prior quarter.
TD BANK GROUP • FOURTH QUARTER 2016 EARNINGS NEWS RELEASE Page 13

INTERIM CONSOLIDATED FINANCIAL STATEMENTS (unaudited) INTERIM CONSOLIDATED BALANCE SHEET (unaudited) (millions of Canadian dollars) As at
October 31 October 31 2016 2015 ASSETS Cash and due from banks $ 3,907 $ 3,154 Interest-bearing deposits with banks 53,714 42,483 57,621 45,637 Trading loans, securities, and other 99,257 95,157 Derivatives 72,242 69,438 Financial assets designated at fair value through profit or loss 4,283 4,378 Available-for-sale securities 107,571 88,782 283,353 257,755 Held-to-maturity securities 84,395 74,450 Securities purchased under reverse repurchase agreements 86,052 97,364 Loans Residential mortgages 217,336 212,373 Consumer instalment and other personal 144,531 135,471 Credit card 31,914 30,215 Business and government 194,074 167,529 Debt securities classified as loans 1,674 2,187 589,529 547,775 Allowance for loan losses (3,873) (3,434) Loans, net of allowance for loan losses 585,656 544,341 Other Customers' liability under acceptances 15,706 16,646 Investment in TD Ameritrade 7,091 6,683 Goodwill 16,662 16,337 Other intangibles 2,639 2,671 Land, buildings, equipment, and other depreciable assets 5,482 5,314 Deferred tax assets 2,084 1,931 Amounts receivable from brokers, dealers, and clients 17,436 21,996 Other assets 12,790 13,248 79,890 84,826 Total assets $ 1,176,967 $ 1,104,373 LIABILITIES Trading deposits $ 79,786 $ 74,759 Derivatives 65,425 57,218 Securitization liabilities at fair value 12,490 10,986 Other financial liabilities designated at fair value through profit or loss 190 1,415 157,891 144,378 Deposits Personal 439,232 395,818 Banks 17,201 17,080 Business and government 317,227 282,678 773,660 695,576 Other Acceptances 15,706 16,646 Obligations related to securities sold short 33,115 38,803 Obligations related to securities sold under repurchase agreements 48,973 67,156 Securitization liabilities at amortized cost 17,918 22,743 Amounts payable to brokers, dealers, and clients 17,857 22,664 Insurance-related liabilities 7,046 6,519 Other liabilities 19,696 14,223 160,311 188,754 Subordinated notes and debentures 10,891 8,637 Total liabilities 1,102,753 1,037,345 EQUITY Common shares 20,711 20,294 Preferred shares 4,400 2,700 Treasury shares – common (31) (49) Treasury shares – preferred (5) (3) Contributed surplus 203 214 Retained earnings 35,452 32,053 Accumulated other comprehensive income (loss) 11,834 10,209 72,564 65,418 Non-controlling interests in subsidiaries 1,650 1,610 Total equity 74,214 67,028 Total liabilities and equity $ 1,176,967 $ 1,104,373
TD BANK GROUP • FOURTH QUARTER 2016 EARNINGS NEWS RELEASE Page 14
INTERIM CONSOLIDATED STATEMENT OF INCOME (unaudited)
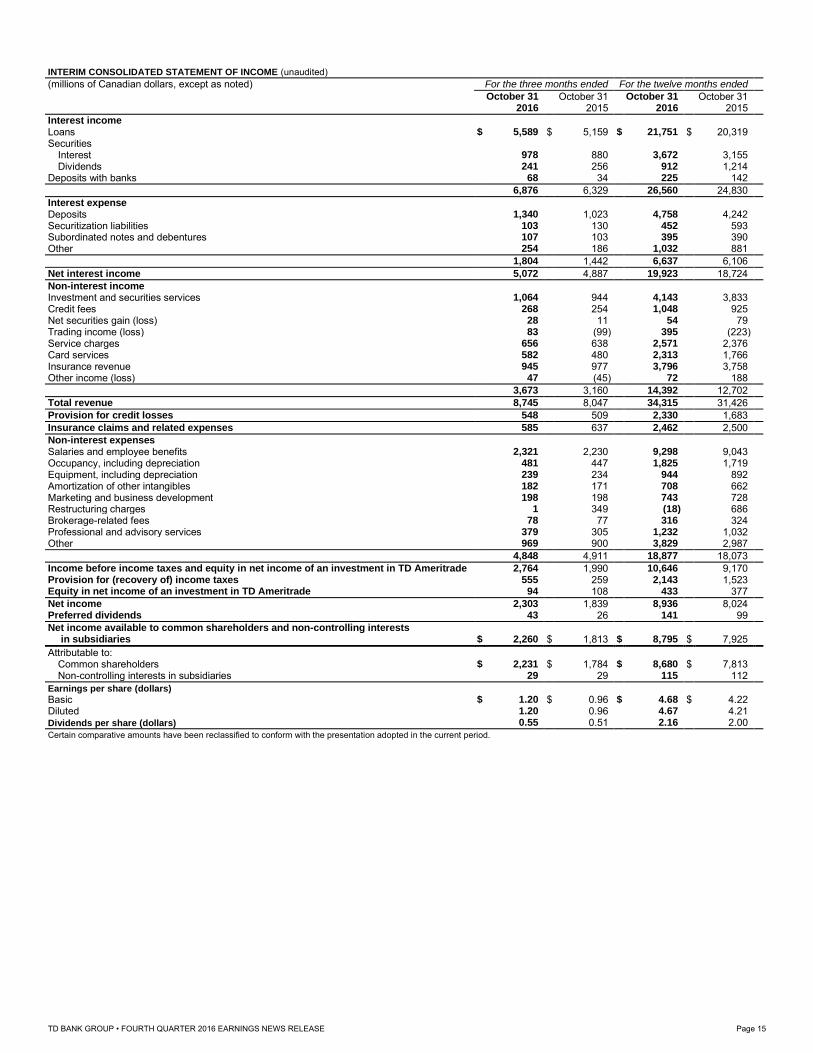
(millions of Canadian dollars, except as noted) For the three months ended For the twelve months ended October 31 October 31 October 31 October 31 2016 2015 2016 2015 Interest income Loans $ 5,589 $ 5,159 $ 21,751 $ 20,319 Securities Interest 978 880 3,672 3,155 Dividends 241 256 912 1,214 Deposits with banks 68 34 225 142 6,876 6,329 26,560 24,830 Interest expense Deposits 1,340 1,023 4,758 4,242 Securitization liabilities 103 130 452 593 Subordinated notes and debentures 107 103 395 390 Other 254 186 1,032 881 1,804 1,442 6,637 6,106 Net interest income 5,072 4,887 19,923 18,724 Non-interest income Investment and securities services 1,064 944 4,143 3,833 Credit fees 268 254 1,048 925 Net securities gain (loss) 28 11 54 79 Trading income (loss) 83 (99) 395 (223) Service charges 656 638 2,571 2,376 Card services 582 480 2,313 1,766 Insurance revenue 945 977 3,796 3,758 Other income (loss) 47 (45) 72 188 3,673 3,160 14,392 12,702 Total revenue 8,745 8,047 34,315 31,426 Provision for credit losses 548 509 2,330 1,683 Insurance claims and related expenses 585 637 2,462 2,500 Non-interest expenses Salaries and employee benefits 2,321 2,230 9,298 9,043 Occupancy, including depreciation 481 447 1,825 1,719 Equipment, including depreciation 239 234 944 892 Amortization of other intangibles 182 171 708 662 Marketing and business development 198 198 743 728 Restructuring charges 1 349 (18) 686 Brokerage-related fees 78 77 316 324 Professional and advisory services 379 305 1,232 1,032 Other 969 900 3,829 2,987 4,848 4,911 18,877 18,073 Income before income taxes and equity in net income of an investment in TD Ameritrade 2,764 1,990 10,646 9,170 Provision for (recovery of) income taxes 555 259 2,143 1,523 Equity in net income of an investment in TD Ameritrade 94 108 433 377 Net income 2,303 1,839 8,936 8,024 Preferred dividends 43 26 141 99 Net income available to common shareholders and non-controlling interests in subsidiaries $ 2,260 $ 1,813 $ 8,795 $ 7,925 Attributable to: Common shareholders $ 2,231 $ 1,784 $ 8,680 $ 7,813 Non-controlling interests in subsidiaries 29 29 115 112 Earnings per share (dollars)
Basic $ 1.20 $ 0.96 $ 4.68 $ 4.22 Diluted 1.20 0.96 4.67 4.21 Dividends per share (dollars)
0.55 0.51 2.16 2.00 Certain comparative amounts have been reclassified to conform with the presentation adopted in the current period.
TD BANK GROUP • FOURTH QUARTER 2016 EARNINGS NEWS RELEASE Page 15

INTERIM CONSOLIDATED STATEMENT OF COMPREHENSIVE INCOME (unaudited)
(millions of Canadian dollars) For the three months ended For the twelve months ended
October 31 October 31 October 31 October 31 2016 2015 2016 2015 Net income $ 2,303 $ 1,839 $ 8,936 $ 8,024 Other comprehensive income (loss), net of income taxes Items that will be subsequently reclassified to net income Change in unrealized gains (losses) on available-for-sale securities1 39 (384) 274 (464) Reclassification to earnings of net losses (gains) in respect of available-for-sale securities2 (13) (40) (56) (93) Net change in unrealized foreign currency translation gains (losses) on investments in foreign operations 1,639 (55) 1,290 8,090 Reclassification to earnings of net losses (gains) on investments in foreign operations3 – – – – Net foreign currency translation gains (losses) from hedging activities4 (349) 36 34 (2,764) Reclassification to earnings of net losses (gains) on hedges of investments in foreign operations5 – – – – Change in net gains (losses) on derivatives designated as cash flow hedges6 591 (65) 835 4,805 Reclassification to earnings of net losses (gains) on cash flow hedges7 (1,110) 240 (752) (4,301) Items that will not be subsequently reclassified to net income Actuarial gains (losses) on employee benefit plans8 (139) 450 (882) 400 658 182 743 5,673 Comprehensive income (loss) for the period $ 2,961 $ 2,021 $ 9,679 $ 13,697 Attributable to: Common shareholders $ 2,889 $ 1,966 $ 9,423 $ 13,486 Preferred shareholders 43 26 141 99 Non-controlling interests in subsidiaries 29 29 115 112 1 Net of income tax provision of $25 million for the three months ended October 31, 2016 (three months ended October 31, 2015 – net of income tax recovery of $214 million). Net of
income tax provision of $125 million for the twelve months ended October 31, 2016 (twelve months ended October 31, 2015 – net of income tax recovery of $210 million). 2 Net of income tax provision of $12 million for the three months ended October 31, 2016 (three months ended October 31, 2015 – net of income tax provision of $13 million). Net of income
tax provision of $32 million for the twelve months ended October 31, 2016 (twelve months ended October 31, 2015 – net of income tax provision of $78 million). 3 Net of income tax provision of nil for the three months ended October 31, 2016 (three months ended October 31, 2015 – income tax provision of nil). Net of income tax provision of nil for
the twelve months ended October 31, 2016 (twelve months ended October 31, 2015 – income tax provision of nil). 4 Net of income tax recovery of $126 million for the three months ended October 31, 2016 (three months ended October 31, 2015 – income tax provision of $10 million). Net of income tax
provision of $9 million for the twelve months ended October 31, 2016 (twelve months ended October 31, 2015 – income tax recovery of $985 million). 5 Net of income tax provision of nil for the three months ended October 31, 2016 (three months ended October 31, 2015 – income tax provision of nil). Net of income tax provision of nil for
the twelve months ended October 31, 2016 (twelve months ended October 31, 2015 – income tax provision of nil). 6 Net of income tax provision of $375 million for the three months ended October 31, 2016 (three months ended October 31, 2015 – income tax recovery of $44 million). Net of income tax
provision of $599 million for the twelve months ended October 31, 2016 (twelve months ended October 31, 2015 – net of income tax provision of $2,926 million). 7 Net of income tax provision of $624 million for the three months ended October 31, 2016 (three months ended October 31, 2015 – net of income tax recovery of $146 million). Net of
income tax provision of $533 million for the twelve months ended October 31, 2016 (twelve months ended October 31, 2015 – net of income tax provision of $2,744 million). 8 Net of income tax recovery of $71 million for the three months ended October 31, 2016 (three months ended October 31, 2015 – net of income tax provision of $169 million). Net of
income tax recovery of $340 million for the twelve months ended October 31, 2016 (twelve months ended October 31, 2015 – net of income tax provision of $147 million).
TD BANK GROUP • FOURTH QUARTER 2016 EARNINGS NEWS RELEASE Page 16

INTERIM CONSOLIDATED STATEMENT OF CHANGES IN EQUITY (unaudited)
(millions of Canadian dollars) For the three months ended For the twelve months ended
October 31 October 31 October 31 October 31 2016 2015 2016 2015 Common shares Balance at beginning of period $ 20,597 $ 20,180 $ 20,294 $ 19,811 Proceeds from shares issued on exercise of stock options 30 32 186 128 Shares issued as a result of dividend reinvestment plan 84 82 335 355 Purchase of shares for cancellation – – (104) – Balance at end of period 20,711 20,294 20,711 20,294 Preferred shares Balance at beginning of period 3,400 2,700 2,700 2,200 Issue of shares 1,000 – 1,700 1,200 Redemption of shares – – – (700) Balance at end of period 4,400 2,700 4,400 2,700 Treasury shares – common Balance at beginning of period (42) (17) (49) (54) Purchase of shares (1,361) (1,146) (5,769) (5,269) Sale of shares 1,372 1,114 5,787 5,274 Balance at end of period (31) (49) (31) (49) Treasury shares – preferred Balance at beginning of period (5) (4) (3) (1) Purchase of shares (58) (9) (115) (244) Sale of shares 58 10 113 242 Balance at end of period (5) (3) (5) (3) Contributed surplus Balance at beginning of period 197 226 214 205 Net premium (discount) on sale of treasury shares 10 (4) 26 25 Issuance of stock options, net of options exercised (1) (1) (28) – Other (3) (7) (9) (16) Balance at end of period 203 214 203 214 Retained earnings Balance at beginning of period 34,387 30,764 32,053 27,585 Net income attributable to shareholders 2,274 1,810 8,821 7,912 Common dividends (1,019) (945) (4,002) (3,700) Preferred dividends (43) (26) (141) (99) Share issue expenses and others (8) – (14) (28) Net premium on repurchase of common shares and redemption of preferred shares – – (383) (17) Actuarial gains (losses) on employee benefit plans (139) 450 (882) 400 Balance at end of period 35,452 32,053 35,452 32,053 Accumulated other comprehensive income (loss) Net unrealized gain (loss) on available-for-sale securities: Balance at beginning of period 273 505 81 638 Other comprehensive income (loss) 26 (424) 218 (557) Balance at end of period 299 81 299 81 Net unrealized foreign currency translation gain (loss) on investments in foreign operations, net of hedging activities: Balance at beginning of period 8,389 8,374 8,355 3,029 Other comprehensive income (loss) 1,290 (19) 1,324 5,326 Balance at end of period 9,679 8,355 9,679 8,355 Net gain (loss) on derivatives designated as cash flow hedges: Balance at beginning of period 2,375 1,598 1,773 1,269 Other comprehensive income (loss) (519) 175 83 504 Balance at end of period 1,856 1,773 1,856 1,773 Total 11,834 10,209 11,834 10,209 Non-controlling interests in subsidiaries Balance at beginning of period 1,633 1,639 1,610 1,549 Net income attributable to non-controlling interests in subsidiaries 29 29 115 112 Other (12) (58) (75) (51) Balance at end of period 1,650 1,610 1,650 1,610 Total equity $ 74,214 $ 67,028 $ 74,214 $ 67,028
TD BANK GROUP • FOURTH QUARTER 2016 EARNINGS NEWS RELEASE Page 17

INTERIM CONSOLIDATED STATEMENT OF CASH FLOWS (unaudited) (millions of Canadian dollars) For the three months ended For the twelve months ended October 31 October 31 October 31 October 31 2016 2015 2016 2015 Cash flows from (used in) operating activities Net income before income taxes $ 2,858 $ 2,098 $ 11,079 $ 9,547 Adjustments to determine net cash flows from (used in) operating activities Provision for credit losses 548 509 2,330 1,683 Depreciation 168 149 629 588 Amortization of other intangibles 182 171 708 662 Net securities losses (gains) (28) (11) (54) (79) Equity in net income of an investment in TD Ameritrade (94) (108) (433) (377) Deferred taxes 83 (92) 103 (352) Changes in operating assets and liabilities Interest receivable and payable 10 (99) 7 (294) Securities sold short (11,449) 4,467 (5,688) (662) Trading loans and securities 3,677 13,315 (4,100) 6,016 Loans net of securitization and sales (14,693) (13,634) (44,351) (63,947) Deposits 22,226 3,630 81,885 108,446 Derivatives 1,321 (284) 5,403 (7,633) Financial assets and liabilities designated at fair value through profit or loss 51 (367) 96 371 Securitization liabilities (1,050) (113) (3,321) (2,429) Other (2,718) 1,422 (168) (16,267) Net cash from (used in) operating activities 1,092 11,053 44,125 35,273 Cash flows from (used in) financing activities Change in securities sold under repurchase agreements (9,789) (6,871) (18,183) 14,044 Issue of subordinated notes and debentures 2,012 1,000 3,262 2,500 Redemption of subordinated notes and debentures – (800) (1,000) (1,675) Common shares issued 26 27 152 108 Preferred shares issued 992 – 1,686 1,184 Repurchase of common shares – – (487) – Redemption of preferred shares – – – (717) Sale of treasury shares 1,440 1,120 5,926 5,541 Purchase of treasury shares (1,419) (1,155) (5,884) (5,513) Dividends paid (978) (889) (3,808) (3,444) Distributions to non-controlling interests in subsidiaries (29) (29) (115) (112) Net cash from (used in) financing activities (7,745) (7,597) (18,451) 11,916 Cash flows from (used in) investing activities Interest-bearing deposits with banks 891 6,598 (11,231) 1,290 Activities in available-for-sale securities Purchases (17,142) (19,964) (53,145) (58,775) Proceeds from maturities 6,573 5,779 28,661 27,055 Proceeds from sales 1,961 38 4,665 6,631 Activities in held-to-maturity securities Purchases (5,285) (754) (20,575) (15,120) Proceeds from maturities 6,117 2,457 15,557 9,688 Activities in debt securities classified as loans Purchases – – (41) (23) Proceeds from maturities 84 119 621 875 Proceeds from sales – – 1 – Net purchases of land, buildings, equipment, and other depreciable assets (341) (159) (797) (972) Changes in securities purchased (sold) under reverse repurchase agreements 14,057 4,961 11,312 (14,808) Net cash acquired from (paid for) divestitures, acquisitions, and the sale of TD Ameritrade shares – (2,918) – (2,918) Net cash from (used in) investing activities 6,915 (3,843) (24,972) (47,077) Effect of exchange rate changes on cash and due from banks 52 (1) 51 261 Net increase (decrease) in cash and due from banks 314 (388) 753 373 Cash and due from banks at beginning of period 3,593 3,542 3,154 2,781 Cash and due from banks at end of period $ 3,907 $ 3,154 $ 3,907 $ 3,154 Supplementary disclosure of cash flows from operating activities Amount of income taxes paid (refunded) during the period $ 565 $ 125 $ 1,182 $ 554 Amount of interest paid during the period 1,728 1,377 6,559 6,167 Amount of interest received during the period 6,569 6,009 25,577 23,483 Amount of dividends received during the period 220 270 921 1,216
TD BANK GROUP • FOURTH QUARTER 2016 EARNINGS NEWS RELEASE Page 18

Appendix A – Segmented Information
For management reporting purposes, the Bank reports its results under three key business segments: Canadian Retail, which includes the results of the Canadian personal and commercial banking businesses, Canadian credit cards, TD Auto Finance Canada and Canadian wealth and insurance businesses; U.S. Retail, which includes the results of the U.S. personal and commercial banking businesses, U.S. credit cards, TD Auto Finance U.S., U.S. wealth business, and the Bank's investment in TD Ameritrade; and Wholesale Banking. The Bank's other activities are grouped into the Corporate segment. Results for these segments for the three and twelve months ended October 31 are presented in the following tables. Results by Business Segment
1
(millions of Canadian dollars) For the three months ended
Canadian Retail
U.S. Retail
Wholesale Banking
Corporate Total
Oct. 31
Oct. 31 Oct. 31 Oct. 31 Oct. 31
Oct. 31 Oct. 31 Oct. 31 Oct. 31 Oct. 31
2016 2015
2016 2015
2016 2015 2016 2015 2016 2015
Net interest income (loss) $
2,551 $ 2,497 $
1,832 $ 1,658 $
396 $ 550 $ 293 $ 182 $ 5,072 $ 4,887 Non-interest income (loss)
2,599 2,500
592 492
345 116 137 52 3,673 3,160
Total revenue
5,150 4,997
2,424 2,150
741 666 430 234 8,745 8,047 Provision for (reversal of) credit losses
263 221
193 174
1 14 91 100 548 509
Insurance claims and related expenses 585 637
– –
– – – – 585 637 Non-interest expenses
2,250 2,143
1,499 1,442
432 390 667 936 4,848 4,911
Income (loss) before income taxes
2,052 1,996
732 534
308 262 (328) (802) 2,764 1,990 Provision for (recovery of) income taxes
550 500
124 48
70 66 (189) (355) 555 259
Equity in net income of an investment in
TD Ameritrade
– –
93 109
– – 1 (1) 94 108
Net income (loss) $
1,502 $ 1,496 $
701 $ 595 $
238 $ 196 $ (138) $ (448) $ 2,303 $ 1,839
As at
Total assets $
383,011 $ 360,100 $
388,749 $ 347,249 $
342,478 $ 343,485 $ 62,729 $ 53,539 $ 1,176,967 $ 1,104,373
Results by Business Segment
(millions of Canadian dollars) For the twelve months ended
Canadian Retail
U.S. Retail
Wholesale Banking
Corporate Total
Oct. 31
Oct. 31 Oct. 31 Oct. 31 Oct. 31
Oct. 31 Oct. 31 Oct. 31 Oct. 31 Oct. 31
2016 2015
2016 2015
2016 2015 2016 2015 2016 2015
Net interest income (loss) $
9,979 $ 9,781 $
7,093 $ 6,131 $
1,685 $ 2,295 $ 1,166 $ 517 $ 19,923 $ 18,724 Non-interest income (loss)
10,230 9,904
2,366 2,098
1,345 631 451 69 14,392 12,702
Total revenue
20,209 19,685
9,459 8,229
3,030 2,926 1,617 586 34,315 31,426 Provision for (reversal of) credit losses
1,011 887
744 535
74 18 501 243 2,330 1,683
Insurance claims and related expenses
2,462 2,500
– –
– – – – 2,462 2,500 Non-interest expenses
8,557 8,407
5,693 5,188
1,739 1,701 2,888 2,777 18,877 18,073
Income (loss) before income taxes
8,179 7,891
3,022 2,506
1,217 1,207 (1,772) (2,434) 10,646 9,170 Provision for (recovery of) income taxes
2,191 1,953
498 394
297 334 (843) (1,158) 2,143 1,523
Equity in net income of an investment in
TD Ameritrade
– –
435 376
– – (2) 1 433 377
Net income (loss) $
5,988 $ 5,938 $
2,959 $ 2,488 $
920 $ 873 $ (931) $ (1,275) $ 8,936 $ 8,024
1 Effective fiscal 2016, the presentation of the U.S. strategic cards portfolio revenues, provision for credit losses, and expenses in the U.S. Retail segment includes only the Bank's agreed portion of the U.S. strategic cards portfolio, while the Corporate segment includes the retailer program partners' share. Certain comparative amounts have been recast to conform with this revised presentation. There was no impact on the net income of the segments or on the presentation of gross and net results in the Bank's Interim Consolidated Statement of Income.
TD BANK GROUP • FOURTH QUARTER 2016 EARNINGS NEWS RELEASE Page 19

SHAREHOLDER AND INVESTOR INFORMATION Shareholder Services
If you: And your inquiry relates to: Please contact: Are a registered shareholder (your name appears on your TD share certificate)
Missing dividends, lost share certificates, estate questions, address changes to the share register, dividend bank account changes, the dividend reinvestment plan, eliminating duplicate mailings of shareholder materials or stopping (and resuming) receiving annual and quarterly reports
Transfer Agent:
CST Trust Company P.O. Box 700, Station B Montréal, Québec H3B 3K3 1-800-387-0825 (Canada and U.S. only) or 416-682-3860 Facsimile: 1-888-249-6189 [email protected] or www.canstockta.com
Hold your TD shares through the Direct Registration System
in the United States
Missing dividends, lost share certificates, estate questions, address changes to the share register, eliminating duplicate mailings of shareholder materials or stopping (and resuming) receiving annual and quarterly reports
Co-Transfer Agent and Registrar
Computershare P.O. Box 30170 College Station, TX 77842-3170 or Computershare 211 Quality Circle, Suite 210 College Station, TX 77845 1-866-233-4836 TDD for hearing impaired: 1-800-231-5469 Shareholders outside of U.S.: 201-680-6578 TDD shareholders outside of U.S.: 201-680-6610 www.computershare.com
Beneficially own TD shares that are held in the name of an intermediary, such as a bank, a trust company, a securities broker or other nominee
Your TD shares, including questions regarding the dividend reinvestment plan and mailings of shareholder materials
Your intermediary
For all other shareholder inquiries, please contact TD Shareholder Relations at 416-944-6367 or 1-866-756-8936 or email [email protected]. Please note that by leaving us an e-mail or voicemail message, you are providing your consent for us to forward your inquiry to the appropriate party for response. Annual Report on Form 40-F (U.S.) A copy of the Bank's annual report on Form 40-F for fiscal 2016 will be filed with the Securities and Exchange Commission later today and wi ll be available at http://www.td.com. You may obtain a printed copy of the Bank's annual report on Form 40-F for fiscal 2016 free of charge upon request to TD Shareholder Relations at 416-944-6367 or 1-866-756-8936 or e-mail [email protected].
TD BANK GROUP • FOURTH QUARTER 2016 EARNINGS NEWS RELEASE Page 20

Access to Quarterly Results Materials Interested investors, the media and others may view this fourth quarter earnings news release, results slides, supplementary financial information, and the 2016 Consolidated Financial Statements and MD&A documents on the TD website at www.td.com/investor/. General Information Contact Corporate & Public Affairs: 416-982-8578 Products and services: Contact TD Canada Trust, 24 hours a day, seven days a week: 1-866-222-3456 French: 1-800-895-4463 Cantonese/Mandarin: 1-800-387-2828 Telephone device for the hearing impaired (TTY): 1-800-361-1180 Website: www.td.com Email: [email protected] Quarterly Earnings Conference Call TD Bank Group will host an earnings conference call in Toronto, Ontario on December 1, 2016. The call will be available live via TD's website at 3 p.m. ET. The call and audio webcast will feature presentations by TD executives on the Bank's financial results for the fourth quarter, discussions of related disclosures, and will be followed by a question-and-answer period with analysts. The presentation material referenced during the call will be available on the TD website at www.td.com/investor/qr_2016.jsp on December 1, 2016, by approximately 12 p.m. ET. A listen-only telephone line is available at 647-794-1827 or 1-800-274-0251 (toll free) and the passcode is 6437682. The audio webcast and presentations will be archived at www.td.com/investor/qr_2015.jsp. Replay of the teleconference will be available from 6 p.m. ET on December 1, 2016, until 6 p.m. ET on December 30, 2016, by calling 647-436-0148 or 1-888-203-1112 (toll free). The passcode is 6437682. Annual Meeting Thursday, March 30, 2017 Design Exchange Toronto, Ontario About TD Bank Group
The Toronto-Dominion Bank and its subsidiaries are collectively known as TD Bank Group ("TD" or the "Bank"). TD is the sixth largest bank in North America by branches and serves 25 million customers in three key businesses operating in a number of locations in financial centres around the globe: Canadian Retail, including TD Canada Trust, TD Auto Finance Canada, TD Wealth (Canada), TD Direct Investing, and TD Insurance; U.S. Retail, including TD Bank, America's Most Convenient Bank, TD Auto Finance U.S., TD Wealth (U.S.), and an investment in TD Ameritrade; and Wholesale Banking, including TD Securities. TD also ranks among the world's leading online financial services firms, with approximately 11 million active online and mobile customers. TD had CDN$1.2 trillion in assets on October 31, 2016. The Toronto-Dominion Bank trades under the symbol "TD" on the Toronto and New York Stock Exchanges.
For further information contact:
Gillian Manning, Head of Investor Relations, 416-308-6014 Alison Ford, Manager, Media Relations, 416-982-5401
TD BANK GROUP • FOURTH QUARTER 2016 EARNINGS NEWS RELEASE Page 21