Banca Popolare di Vicenza · Principal data and summary indicators for Banca Popolare di Vicenza 7...
693
A. Palladio, Palazzo Thiene (XVI century) - Historical headquarters of the Banca Popolare di Vicenza Banca Popolare di Vicenza 2008 ANNUAL REPORT
Transcript of Banca Popolare di Vicenza · Principal data and summary indicators for Banca Popolare di Vicenza 7...

A. Palladio, Palazzo Thiene (XVI century) - Historical headquarters of the Banca Popolare di Vicenza
BancaPopolare di Vicenza
2 0 0 8ANNUAL REPORT

.

Translation from the Italian original version.
ANNUAL REPORT2008
Società Cooperativa per azioni - Member of the Italian bankers association an italian interbank deposit protection fund - Parent of the Banca Popolare di Vicenza Bank-ing Group Registered office: I-Vicenza - Via Btg. Framarin, 18 - Tax Code 00204010243 - Vicenza Business Register 1858 Bank listing n. 1515 - Capital stock as of 31.12.2008 € 261,460,260.00 Banking Group 5728.1

INDEX
Corporate officers 3BPVi Group structure 4Territorial presence of the BPVi Group at 31 December 2008 5Principal data and summary indicators for Banca Popolare di Vicenza 7Principal data and summary indicators for the BPVi Group 9Directors' report on operations 11Economic and financial scenario 13Innovations in the regulatory framework 23Growth of the BPVi Group: activities of strategic importance 26Operational structure 34Commercial activities: characteristics and results 43Systems 49The system of internal controls and auditing 53Corporate social responsability and image 73Consolidated results of operations 81Principal equity investments 98Equity and regulatory capital 101Comments on the income statement 103Performance of BPVi Group companies 111Atypical and/or unusual transactions 134Investor protection act: new figure of the “Financial Reporting Manager” 135Significant subsequent events 136Outlook for operations 136Proposed allocation of net income 138Glossary 139Balance sheet 147Income statement 149Changes in 2008 equity 150Changes in 2007 equity 152Cash flow statement 154Explanatory notes 157Attestation of the Financial Reporting Manager 366Independent Auditor’s Report 369Consolidated financial statements 373Consolidated Balance sheet 375Consolidated Income statement 377Changes in 2008 consolidated equity 378Changes in 2007 consolidated equity 380Consolidated cash flow statement 382Explanatory notes to the consolidated financial statements 385Financial statements of subsidiary companies 627Attestation of the Financial Reporting Manager 679Independent Auditors’ Report 681BPVi branch network 685

3
CORPORATE OFFICERS
BOARD OF DIRECTORS
Chairman * Giovanni ZoninDeputy Chairmen * Giovanni Bettanin * Marino BreganzeManaging Director * Divo GronchiDirector and Secretary * Giorgio TibaldoDirector Paolo Bedoni Alessandro Benetton Mario Bonsembiante Giovanni Fantoni * Zeffirino Filippi Franco Miranda Gianfranco Pavan Paolo Sartori * Fiorenzo Sbabo Maurizio Stella Paolo Tellatin * Ugo Ticozzi * Giuseppe Zigliotto
BOARD OF STATUTORY AUDITORS
Chairman Giovanni ZamberlanActing Auditors Giacomo Cavalieri Laura PiussiAlternate Auditors Giuseppe Mannella Marco Poggi
BOARD OF ARBITRATORS
Chairman Gianfranco Corà
Acting Arbitrators Gian Paolo Boschetti Pierantonio Maule
Alternate Arbitrators Lelio Barbieri Altegrado Zilio
General Manager Samuele SoratoDeputy General Manager Franco TonatoDeputy General Manager Mauro MicilloDeputy General Manager Emanuele Giustini * Members of the Executive Committee.

4
The structure of the Banca Popolare di Vicenza Group at 31 December 2008 is analysed below by business area.
(1) In February 2009 turned from S.p.a. into S.c.p.a.(2) In March 2009 turned from S.p.a. into S.r.l.
BPVI GROUP STRUCTURE

Presence in Italy
Distribution of branches BPVi’s Group at December 2008
5
TERRITORIAL PRESENCE OF THE BPVI GROUP AT 31 DECEMBER 2008

6
The sales network of the BPVi’s Group 31/12/2008 Branches Financial Private bank Total shops outlets
Banca Popolare di Vicenza 436 1 18 455Cassa di Risparmio di Prato 94 – 3 97Banca Nuova 106 17 5 128Farbanca 1 – – 1
Total 637 18 26 681
Geographical distribution of branches 31/12/2008 Number Comp. %
North Italy 437 68,6 Central Italy 106 16,6 South Italy 94 14,8
Total 637 100,0
Presence abroad
The presence of the BPVi Group abroad is assured by three Representative Offices: in Hong Kong, operational since the 1980s, in Shanghai, opened in June 2005, and in New Delhi, which was opened in April 2006. In addition, the BPVi Group holds equity investments in a number of Central and Eastern Eu-ropean banks, in order to support those Italian firms that maintain commercial relations with the countries concerned. This support is guaranteed by Italian-speaking personnel who work for the International desks of the local banks in which investments are held.

7
PRINCIPAL DATA AND SUMMARY INDICATORSFOR BANCA POPOLARE DI VICENZA
Balance sheet highlights 2008 2007 Changes (in millions of euro) (+/-) %
Banking business 43,995 43,906 89 0.2Direct deposits 15,051 13,885 1,166 8.4Indirect deposits 12,926 15,108 -2,182 -14.4Loans to customers 16,018 14,913 1,105 7.4
Total Assets 22,881 21,411 1,470 6.9Risk-weighted assets (RWA) 17,124 20,266 -3,142 -15.5Net interbank position -467 -743 276 -37.1Equity (excluding net income for the year) 2,693 2,674 19 0.7Regulatory capital 2,859 2,665 194 7.3
Income statement highlights 2008 2007 Changes (in millions of euro) (+/-) %
Net interest income 405.6 355.3 50.3 14.2Net fee and commission income 177.6 175.0 2.6 1.5Net interest and other banking income 654.2 582.7 71.5 12.3Operating costs -434.1 -364.0 -70.1 19.3
of which: payroll -254.3 -209.9 -44.4 21.2of which: other administrative costs -179.4 -162.5 -16.9 10.4
Profit from current operations before tax 190.3 149.1 41.2 27.6Net income for the year 151.0 110.1 40.9 37.1
Other information 2008 2007 Change Change %
Number of employees at year-end (1) 3,508 3,354 154 4.6Number of branches 436 429 7 1.6
(1) The figure at 31/12/2007 includes employees of the former UBI branches.

8
Key performance indicators 2008 2007 Change 2008/2007 Structure ratios (%) Loans to customers / Total assets 70.0% 69.7% 0.3 p.p.Direct deposits / Total assets 65.8% 64.8% 1.0 p.p.Loans to customers / Direct deposits 106.4% 107.4% -1.0 p.p.Asset management and retirement savings /Indirect deposits 30.8% 37.6% -6.8 p.p.Total Assets / Equity (leverage) 8 x 7.7 x 0.3 x
Profitability and efficiency ratios (%) Net income for the year / Equity excluding net income for the year (ROE) 5.6% 4.1% 1.5 p.p.Net income for the year / Total average assets (ROAA) (1) 0.7% 0.6% 0.1 p.p.Net interest and other banking income / Total average assets 3.0% 3.0% 0.0 p.p.Administrative costs, amortization and depreciation /Total average assets 2.0% 2.0% 0.0 p.p.Cost/Income (2) 65.4% 60.8% 4.6 p.p.
Productivity ratios (3) Direct deposits per employee (in millions of euro) 4.4 4.5 -3.4%Indirect deposits per employee (in millions of euro) 3.7 4.9 -23.8%Loans to customers per employee (in millions of euro) 4.6 4.8 -4.3%Net interest income per employee (in thousands of euro) 117.3 115.3 1.7%Net interest and other banking incomeper employee (in thousands of euro) 189.1 189.1 0.0%Payroll costs per employee (in thousands of euro) 73.5 68.1 7.9%
Risk ratios (%) Risk-weighted assets / Total Assets 74.80% 94.70% -19.90 p.p.Net impaired loans/Net loans 3.50% 3.34% 0.16 p.p.Net non-performing loans/Net loans 1.38% 1.48% -0.10 p.p.Non-performing loans coverage (%) (4) 49.82% 42.45% 7.37 p.p.Impaired loans coverage (%) 34.52% 31.75% 2.77 p.p.Performing loans coverage (%) 0.45% 0.54% -0.09 p.p.
Capital adequacy ratios (%) Core Tier 1 12.04% 9.69% 2.35 p.p.Tier 1 (Tier 1 capital / Total weighted assets) 12.04% 9.69% 2.35 p.p.Total Capital Ratio (Regulatory capital / Total weighted assets) 16.70% 13.15% 3.55 p.p.
(1) Total average assets are determined as the simple average of total assets at the end of the current year and at the end of the previous year.
(2) This is the ratio of administrative costs (line item 150) plus net adjustments to property, plant and equipment and in-tangible assets (line items 170 and 180) to net interest and other banking income (line item 120) plus other operating charges/income (line item 190).
(3) The productivity indicators are calculated with reference to the average number of employees.(4) The coverage of non-performing loans at 31 December 2008, including receivables being written off for insolvency
proceedings still in progress, was 66.63%.

9
PRINCIPAL DATA AND SUMMARY INDICATORS FOR THE BPVI GROUP
Balance sheet highlights 2008 2007 Changes (in millions of euro) (+/-) %
Banking business 60,001 58,854 1,147 1.9Direct deposits 21,406 19,484 1,922 9.9Indirect deposits 15,890 18,531 -2,641 -14.3Loans to customers 22,705 20,839 1,866 9.0
Total Assets 28,933 27,255 1,678 6.2Risk-weighted assets (RWA) 21,243 25,672 - 4,429 -17.3Net interbank position -771 -1,290 519 -40.2Equity (excluding net income for the year) 2,621 2,629 -8 -0.3Regulatory capital 2,425 2,433 -8 -0.3
Income statement highlights 2008 2007 Changes (in millions of euro) (+/-) %
Net interest income 652.9 589.8 63.1 10.7Net fee and commission income 271.9 265.4 6.4 2.4Net interest and other banking income 952.4 877.2 75.2 8.6Operating costs -678.9 -588.6 -90.3 15.3
of which: payroll -411.5 -349.4 -62.1 17.8of which: other administrative costs -261.2 -237.0 -24.2 10.2
Profit from current operations before tax 172.1 194.2 -22.0 -11.4Net income for the year pertainingto the Parent Bank 108.7 113.7 -5.0 -4.4
Other information 2008 2007 Changes (+/-) %
Number of employees at year-end(1) 5,645 5,432 213 3.9Number of branches 637 628 9 1.4
(1) The figure at 31/12/2007 includes employees of the former UBI branches.

10
Key performance indicators 2008 2007 Change 2008/2007 Structure ratios (%) Loans to customers / Total assets 78.5% 76.5% 2.0 p.p.Direct deposits / Total assets 74.0% 71.5% 2.5 p.p.Loans to customers / Direct deposits 106.1% 107.0% -0.9 p.p.Asset management and retirement savings / Indirect deposits 33.3% 39.6% -6.3 p.p.Total Assets / Equity (leverage) 10.6 x 9.9 x 0.7 x Profitability and efficiency ratios (%) Net income for the year /Equity excluding net income for the year (ROE) 4.1% 4.3% -0.2 p.p.Net income for the year / Total average assets (ROAA)(1) 0.4% 0.4% 0.0 p.p.Net interest and other banking income /Total average assets 3.4% 3.4% 0.0 p.p.Administrative costs. amortization and depreciation /Total average assets 2.5% 2.4% 0.1 p.p.Cost/Income (2) 70.2% 64.8% 5.4 p.p. Productivity ratios (3) Direct deposits per employee (in millions of euro) 3.8 3.8 1.3%Indirect deposits per employee (in millions of euro) 2.9 3.6 -20.9%Loans to customers per employee (in millions of euro) 4.1 4.1 0.5%Net interest income per employee (in thousands of euro) 117.3 114.9 2.1%Net interest and other banking income per employee(in thousands of euro) 171.2 170.9 0.1%Payroll costs per employee (in thousands of euro) 74.0 68.1 8.6% Risk ratios (%) Risk-weighted assets / Total Assets 73.40% 94.20% -20.80 p.p.Net impaired loans/Net loans 3.72% 3.44% 0.28 p.p.Net non-performing loans/Net loans 1.51% 1.51% 0.00 p.p.Non-performing loans coverage (%) (4) 49.36% 44.49% 4.87 p.p.Impaired loans coverage (%) 34.31% 32.51% 1.80 p.p.Performing loans coverage (%) 0.49% 0.52% -0.03 p.p. Capital adequacy ratios (%) Core Tier 1 7.34% 5.96% 1.38 p.p.Tier 1 (Tier 1 capital / Total weighted assets) 7.34% 5.96% 1.38 p.p.Total Capital Ratio (Regulatory capital / Total weighted assets) 11.42% 9.48% 1.94 p.p.
(1) Total average assets are determined as the simple average of total assets at the end of the current year and at the end of the previous year.
(2) This is the ratio of administrative costs (line item 180) plus net adjustments to property, plant and equipment and in-tangible assets (line items 200 and 210) to net interest and other banking income (line item 120) plus other operating charges/income (line item 220).
(3) The productivity indicators are calculated with reference to the average number of employees.(4) The coverage of non-performing loans at 31 December 2008, including receivables being written off for insolvency
proceedings still in progress, was 66.63%.

11
DIRECTORS’ REPORT ON OPERATIONS
Stockholders,
The strong results presented in these financial statements were earned in a year without precedent since the Second World War. The sweeping events that affected the domestic and international economies, the financial markets and the banking sector are described in more detail in the section of this report dealing with the macroeconomic situation.
Fortified by a strong balance sheet, the BPVi Group took inspiration from its mission and its special characteristics as a people’s bank in determining the strategic guidelines and drivers required to face the operational challenges that, still today, are penalizing the entire financial system. These strategic guidelines are in fact set down in the new Business Plan 2008-2011, which was prepared during the first part of the year and definitively approved in September 2008. Key aspects include the maintenance of capital adequacy, a focus on traditional banking activity, improved equilibrium between the growth of lending and the level of direct customer deposits, stronger management and control at Group level, attentive risk control and rigorous cost management. In short, even before the crisis intensified so dramatically, the BPVi Group had already determined its strategy for the consolidation of growth, with a view to improving the profitability and efficiency of the core business over the medium term, and to creating the equity, operational, financial and organizational foundations for a possible new phase of growth in the future.Given current conditions, activity was focused on achieving a priority objective: stand alongside the local economies served by continuing to ensure lending support for households and businesses, especially small and medium-sized firms. Indeed, when approving the 2009 Budget, the Board decided to increase the size of available facilities in order to provide further oxygen to the local economies and their businesses at this crucial time.
This approach is reflected in the balance sheet of Banca Popolare di Vicenza, which reports a 7.4% increase in lending over the year to 16 billion euro at the end of 2008. These loans were financed entirely by the direct deposits taken from customers, which now exceed 15 billion euro after a rise of 12.2%, ignoring the liabilities for assets sold but not derecognized. By contrast, indirect deposits have fallen by 14.4% due to adverse conditions in the financial markets and the lower demand for asset management products.
The assurance sector has also performed well, with growth of 7.2% confirming the benefits of the recent partnership with the Cattolica Assicurazioni Group.
The income statement reports net income of 151 million euro, which is more than 37% higher than in the previous year. Despite the macroeconomic and banking sector complexities mentioned earlier, this performance reflects a strong rise in the interest margin (+14.2%), the stability of commission income (+1.5%) and a prudent approach to trading. Net interest and other banking income consequently rose to 654 million euro, up 12.3% with respect to 2007. The results of financial management were also up by more than 12% after adjustments to loans and other financial assets. Operating costs were 19.3% higher than in 2007, due to the physiological effects of the significant increase in scale achieved by the Bank in the recent past. The profit from current operations before tax was 27.6% greater than in the prior year, assisted by pre-tax profits from equity investments of 97.1 million euro, including the capital gain earned

12
on the disposal of the holding in Linea S.p.A.. The net income earned by the Parent Bank means that a dividend of 1.15 euro per share can be proposed (+15% with respect to 2007). This amount, part to be paid in cash (12.5%), part via the distribution of treasury shares, leaves room for a further improvement in the Group’s capital ratios and the natural continuation of support for households and businesses.
The growth in lending and deposits at a consolidated level reflects the trends already described in relation to the Parent Bank. Loans verso customers amount to 22.7 billion euro at 31 December 2008, up by 9.0% since 31 December 2007. Direct deposits total 21.4 billion euro following a rise of 13.4%, ignoring “liabilities for assets sold but not derecognized”, while indirect deposits have fallen due to the performance of the asset management and asset administration sector.
As stated, the capital ratios are very strong: The core tier 1 and tier 1 capital ratios are 7.3%, while the total capital ratio is 11.4%. These amounts are considerably higher than those recommended by the Supervisory Authorities and among the highest in the Italian banking system.
The consolidated income statement reports net income of 108.7 million euro, down slightly (-4.4%) with respect to 2007. This outcome was affected by the economic and financial crisis which influenced the results of certain Group companies. It was mainly achieved due to the good performance by Banca Popolare di Vicenza and the positive contribution made by most subsidiaries that reported profits for the year.

13
ECONOMIC AND FINANCIAL SCENARIO
Overview of the macroeconomic situation
Global economic conditions deteriorated during the last few months of 2008 at a rate not seen since the Second World War. . The contraction in GDP during the fourth quarter confirmed the broad recession afflicting the majority of the world’s leading economies. As a consequence, the macroeconomic situation moving into 2009 is somewhat bleak. This picture is confirmed by the changes in the most recent qualitative indicators, which do not suggest any significant recovery during the first part of 2009. On the other hand, the weakness of international economic activity together with the fall in consumption have lowered the rate of inflation in Europe and Italy to less than 2%. This follows the rapid rise during the first part of the year, to a peak at the end of the summer when the consumer price index touched 4% or so.
The extremely expansionary approach adopted by international monetary policy during the last part of the year, assisted by the drop in inflation, caused reference rates to fall to historical lows. This was done in an attempt to normalize the functioning of the financial markets and stimulate both business and consumer demand. The effectiveness of this move, at least in the latter case, might however be hampered by the credit-tightening measures implemented by the banking system.
The performance of the Italian economy reflected these international trends (2008 GDP was 1% lower than in 2007), although in this case the deterioration in the public sector accounts restricts the scope for recourse to fiscal policy as a driver to stimulate recovery.
This extremely difficult and uncertain situation is also confirmed by the performance of the banking sector, where operations were seriously affected by the intense and unexpected credit crunch caused by the collapse of confidence within the financial system. The latest available data shows both a progressive reduction in lending activities, due to the weakness of demand and the tightening by banks of their criteria for the granting of loans, and an acceleration in bank funding operations, especially the issue of bonds, in order to meet their financing requirements despite the overall shortage of liquidity. The focus of the banking system on the more traditional funding methods has penalized other types of investment including, in particular, the asset management sector which suffered another year of major net outflows and contractions in the volume of assets under management.With regard to bank rates, repeated policy action by the ECB resulted, from the end of November, in a generalized fall in both lending and funding rates. Since the latter declined by a lesser extent, the effect was to narrow the banking spread.
The international economic scenario
With its origins in the 2007 US sub-prime mortgage crisis, the financial crisis spread rapidly throughout the world and has now, in recent months, begun to affect economic activity in the developped countries, which were already weakened by the major rise in commodity prices seen in past months. Indeed, almost all the leading economies reported a contraction in GDP during the final quarter of the year, with a major drop in industrial production, a credit squeeze and a collapse in the confidence of households and businesses to record lows. The consequences for the emerging countries have also become clear, with both the flight of foreign capital, via the sale of shares and bonds held by international banks and investment funds, and the weakening of foreign demand. These factors have contributed to a marked slowdown in economic activity in those countries too, despite their apparent immunity to the financial crisis until a short while ago.

14
The weakness of international economic activity, combined with a fall in consumption, contributed to a sharp fall in commodity prices including oil (stabilized in January at around 40 dollars, compared with a peak of 143 dollars in July 2008), with a consequent reduction in the rate of inflation (December y-o-y: USA +0.1%, Euro area +1.6%, Italy +2.4%). This situation has enabled the leading central banks to adopt a strong expansionary policy in support of the economy, and to help normalize the functioning of the financial markets. This action has involved slashing official interest rates to unheard of levels by January 2009. (the ECB lowered the official rates to 2% in January 2009, while the FED voted unanimously to lower the rates for Fed Funds to between 0% and 0.25%, depending on the requirements). The many steps taken in recent months by governments and central banks, designed to ensure the continuous flow of lending to the economy by banks and restore market confidence, have had the effect of reducing market rates to especially low level. For the moment, however, these moves have not had a significant effect on the international economic situation, which continues to show worrying signs of recession. In particular, GDP data for the principal advanced economies has been among the worst in recent years: in December, the United States reported a drop in GDP for the second consecutive quarter (-1.6% between September and December, -0.1% in the third quarter), while three consecutive falls were reported in the Euro area (-1.5% in Q4, following -0.2% in both September and June), mainly due to the stagnation of both exports and private consumption. The extreme weakness of activity in the Euro area is confirmed by the performance of European industrial production, which suffered a record monthly fall of 2.6% in December 2008 and slumped by 12.0% over the year as a whole. Serious pessimism also stems from the most recent surveys of European business and consumer confidence, which highlight ongoing major concerns about employment, the prospects for savings and the trend in sales. All this is compounded by an extremely high level of uncertainty about the economic situation, as frequently evidenced by the ECB in their most recent monthly bulletins. These doubts continue to reduce the propensity to consume and investment, thus enhancing the risk of slower growth.
International monetary policy
The abrupt deterioration in the financial crisis and economic situation from the start of September resulted, during the final months of the year, in a radical change in the monetary policy adopted by the international central banks. Until last June, these were actually weighing the possibility of further minor restrictive measures, especially in the Euro area, to combat inflationary pressures. The worsening of the economic situation and the consequent drop in foreign demand caused the prices for commodities, and oil in particular, to collapse and resulted in an unexpected change in the overall picture, with low rates of inflation. These conditions allowed the international central banks to take strong action to tackle the deepening financial crisis, with massive injections of liquidity into the market and steps to save various international financial institutions. The first coordinated monetary policy action in history took place on 8 October 2008, with a simultaneous cut of 50 basis points in the policy rates of many leading international central banks, including the FED, the ECB, the Bank of England and the Bank of Canada. In the following months, there was more action from the FED (-50 basis points on 29 October, -75/-100 basis points on 16 December) and the ECB (-50 basis points on 6 November, -75 basis points on 4 December and -50 basis points on 15 January 2009), which lowered the cost of money to historical minimums: between 0% and 0.25% in the United States and 2% in Europe. The Bank of England also made additional cuts, lowering interest rates to 1% in February 2009, which is the lowest rate since the foundation of the UK’s central authority.

15
These special measures eased the tensions in the financial markets, as shown by the marked drop in interbank rates (3-month Euribor falling below 2%, a five-year minimum, in early February 2009), even though the level of uncertainty remains exceptionally high, as confirmed by President Trichet during the press conference that followed the ECB meeting on 5 February 2009. On that occasion, the Governing Council decided to leave rates unchanged at 2%, while remaining open to a further cut in March by between 25 and 50 basis points, given the sharp drop in the rate of inflation.
International financial markets
2008 was one of the worst years ever in the world financial markets, with extreme volatility and adverse performance that reached and, in some cases, exceeded declines of 50%. On the Milan exchange, only 7 out of the 336 listings managed to close the year ahead; the overall capitalization of this market essentially halved during the year (S&P/Mib down 49.5% from the end of 2007), falling to 372 billion euro or about one quarter of domestic GDP (slightly less than half in 2007). The Milan volatility index jumped from 12.5% in 2007 to 30.5% in 2008, peaking in October at 69.1% which was the highest level in the history of the Italian market: in particular, the exchange reported its largest fall on 1 October (-9.24%), followed by its largest gain on 13 October (+8.26%). The number of contracts made fell only slightly to 69.2 million, -4.6% compared with 2007.
Ongoing financial tensions have continued to discourage IPOs on the Italian exchange. No new companies were admitted during the last quarter of 2008, and there were just 7 initial public offerings during the year, compared with 32 in 2007. The number of companies delisted, 18, was broadly in line with recent experience (16 in 2007 and 17 in 2006). Overall, the Italian exchange now lists 336 companies, compared with 344 at the end of 2007.
The financial crisis was felt more in Italy than elsewhere (S&P 500, New York -39.4%, Nikkei, Tokyo -42.1%, FTSE, London -31.8%, DAX, Frankfurt -40.4%, CAC40, Paris -42.8%), mainly due to the greater weighting of banking shares on the exchange. These shares were sold heavily during the final months of the year, as news flooded in about the funding difficulties of Italy’s leading banks.

16
The Italian economy
The Italian economy moved into recession at the start of the second quarter of 2008. Following a positive start to the year (GDP +0.3% in the first quarter), the Italian economy deteriorated rapidly as the international crisis deepened, resulting in the worst slump in GDP for the last 15 years. In particular, GDP fell 0.6% between March and June, 0.7% in the third quarter and 1.9% in the final quarter, resulting in an average decline in 2008 of 1.0%. This sharp fall essentially reflects the worsening of the international situation, with a consequent drop in foreign demand to accompany the persistent weakness of domestic demand and the stagnation of capital investment. Although the Italian statistics were the worst in the Euro area, they were less dramatic than the situation that emerged in Germany, where the rate of growth during the fourth quarter was 2.1 percentage points lower than in the previous quarter. The crisis was also serious in France and Spain (Q4 down respectively 1.2% and 1.0% compared with Q3). There were numerous leading indicators of this adverse performance, including four consecutive monthly falls in domestic industrial production, resulting in a collapse of 12.2% over the year to December 2008. This was the worst result since 1991. Even the jobs market is showing increasing signs of difficulty: employment, having grown for more than 10 years, received a set back in the third quarter of 2008, while the unemployment rate rose 0.5 percentage points over the year to 6.1%. There was also a significant rise in the recourse to government-assisted lay-offs at the end of 2008.Due to a further deterioration in public sector finances, the contribution made to economic recovery by fiscal policy will be weak. Indeed, the most recent data from the Bank of Italy highlights an increase in public borrowing of about 65 billion euro over the year to December 2008, to a staggering record level of 1,663.6 billion euro. This statistic places the ratio of public borrowing to GDP at 105.8% (103.5% at the end of 2007), while the deficit has risen to 3.1% of GDP (1.7% at the end of 2007). This breach of the Maastricht maximum was mainly due to the marked reduction in inflows as a consequence of the economic slowdown.Inflation has continued to fall rapidly from its peak back in the summer (+4.1% between July and August): the consumer price index fell for the fifth consecutive month in January 2009, to below the 2% threshold for the first time in about eighteen months (+1.6% in January 2009, down sharply from +2.2% in December 2008). This effect was largely due to the large drop in the price of fuel, while food products remain “hot” although without repeating the significant increases seen throughout 2008. Continuation of this slowdown in the rate of inflation seems to be built into the expectations of most operators. The economic surveys carried out by ISAE at the start of the year have highlighted that both consumers and manufacturers expect a further significant reduction in inflation over the coming months.

17
The credit and savings market
Bank lending and non-performing loans
The growth of bank lending in Italy declined steadily during 2008, falling to +4.9% for the year to December compared with +9.8% at the end of 2007. The brake on bank lending appears closely linked with the weakness of demand for credit, given the prolonged slowdown of the Italian economy, not to mention the tougher criteria adopted by banks for lending to households and businesses. This last phenomenon, mainly reflecting the deterioration in the economic situation and difficulties in the sourcing of funds, heightened from the second half of September following the failure of Lehman Brothers, has been confirmed by the results of recent surveys of banks and firms. These indicate a rise in the margins applied on loans and a reduction, especially in the case of loans to households, of the ratio between the value of the loan and that of the guarantees given.

18
The slowdown in lending compared with 2007 has also been affected by the upturn in securitizations intended, for the most part, to create instruments then used to guarantee refinancing transactions with the Eurosystem (retained securitizations). These exceeded 80 billion euro at the end of 2008, compared with 10 billion euro in 2007.)
The quality of lending by Italian banks has begun to show signs of deterioration, as reflected in the most recent data available from the Supervisory Authorities at the time of this report. This information, covering the third quarter of 2008, highlights a rise in new non-performing loans (+18% with respect to September 2007), especially in Northern Italy and the Islands. The stock of watchlist loans also appears to be rising rapidly, both in absolute terms and as a percentage of lending: this dynamic is apparent in all geographical areas and all principal sectors, especially in the Northern regions, and in the business sector (increase in watchlist loans by 1.75 billion euro over the last twelve months) and the household sector (increase of more than 1 billion euro over the past year).
Deposits
The growth in bank deposits from Italian residents accelerated in 2008, with annual growth to December of +12.5% (+6.6% at the end of 2007) due to a rise in deposits and repurchase agreements and, above all, to an upturn in bond issues. In particular, the market for deposits and repos has been sustained in recent months by increased demand from households, due to the low opportunity cost of holding liquidity. The continued riskiness of the financial markets is, in fact, prompting a reallocation towards financial assets with a low risk-yield profile. The bond sector has grown strongly (+20.6% over the year, compared with +12.1% at the end of 2007) due to financial market tensions that have effectively forced Italian banks to make recourse to this important instrument for their funding needs. Deposits from abroad (borrowing from non-residents) contracted noticeably during the last part of the year, with the dynamic changing from +20.6% at the end of 2007 to -8.9% in December 2008.
2008 was undoubtedly one of the most difficult years ever for the asset management sector which, evidently, has not yet overcome the profound difficulties that emerged during 2007. The wealth managed by open-end mutual funds and sicavs totaled just 409.2 billion euro in December 2008, after falling 28.2% since the end of 2007. Net outflows continued throughout 2008, totalling about 140 billion euro over the year or almost triple those seen in 2007 (-53 billion euro). The latest data published by Assogestioni, relating to January 2009, does however appear to contain a small ray of hope. In particular, the rate of outflows from mutual funds has slowed considerably with respect to that recorded in 2008 (-4.9 billion euro during the month), with improvements in all segments except for bond funds, which still represent the largest source of outflows from mutual funds.
There was also a further decline in the portfolio management activities of Italian banks, which were down over the year to November 2008 by 36% (-12% at the end of 2007). The latest available data for total securities deposited with Italian banks (both under management and held directly by customers) reflects a slight, 2.0% rise over the year to November. Analysis of the type of financial assets held shows, in particular, that savers strongly prefer bonds and short-term treasuries (BOT) over mutual funds and longer-term treasuries (BTP and CCT).
19
Bank interest rates
Repeated cuts in the ECB’s policy rates from October (-0.50 percentage points on 8 October, -0.50 on 6 November, -0.75 on 4 December and -0.50 on 15 January 2009), only began to influence bank rates from the end of November. Between October and December 2008, the weighted average of bank lending rates on loans to households and non-financial businesses fell by 47 basis points (ABI data); this did not fully reflect the collapse in market rates over the same period (for example, 3-month Euribor dropped by 186 basis points between the end of October and the end of December). This sudden fall in market rates, outpacing that seen in relation to bank lending rates, caused the mark-up to increase from November to 3.19 percentage points at the end of December compared with 1.79 points just two months earlier. The slower dynamic of bank lending rates was partly due to the repricing mechanism applicable to forms of lending indexed to market rates, which frequently take a few months to reflect changes in their reference rate. It also took account of the higher remuneration required for increased counterparty risk, due to the rapid deterioration of the economic situation. This said, from January 2009 there was a more marked and generalized reduction in the bank rates for all forms of lending, given the continued decline in market rates.
Funding rates also fell considerably during the final two months of the year, although by less than lending rates, resulting in a narrowing of the spread. At the end of December, the rates paid on deposits and bonds were down by little more than 30 basis points: here too, rates fell further at the start of 2009, albeit not in line with the trend in market rates given the pressure on banks to source liquidity from their customers. The greater reduction in market rates with respect to deposit rates has, over the past few months, given rise to a significant drop in the mark down, to the lowest levels seen in recent years.
The economic situation in the areas in which the Group operates
Veneto
The steady slowdown of the Veneto economy during 2007 continued at a greater pace throughout 2008, with recession setting in during the second part of the year. Based on a study carried out by Unioncamere del Veneto, industrial production fell in the fourth quarter of 2008 both compared with the previous quarter (-2.5%) and with respect to the final quarter of 2007 (-8.2%). This represents the worst result for the past thirty years. Considering the business profile in terms of scale, the y-o-y fall in production during the final quarter of 2008 impacted small (10-49 employees) and medium-sized firms (50-249 employees), down by 7.1% and 7.3% respectively, while large firms were hit even more significantly (-10.6%). The situation for micro businesses (2-9 employees), appears even more critical with a contraction of 13.2%. In sector terms, industrial production fell over the year to December 2008 in all sectors, including in particular electronic and electrical machines (-13.3%), rubber and plastic (-11.6%) and the wood and furniture industries (-9.6%). In line with the fall in production, sales also dropped by 7.4% over the year to December 2008. The contraction affected all sectors, except for food, beverages and tobacco, which was essentially stable (+0.3%).
An analysis by province also shows a decline in production and sales across the board, with the greatest impact on the provinces of Belluno (production -11.5%, sales -10.3%) and Vicenza (production -10.2%, sales -9.4%).
There is also serious cause for concern on the employment front. With respect to the final quarter of 2007, the indicator highlights a contraction of 2.9% in the fourth quarter of 2008, which was more marked than the y-o-y falls seen in the second and third quarters (respectively

20
-1.5% and -1.6%). This situation affects firms of all sizes in every sector, with special problems for manufacturers including, in particular, goldsmiths (-7.3%) and textiles, clothing and footwear (-4.6%). Belluno and Vicenza were also the provinces with the greatest employment difficulties (down 6.0% and 3.8% respectively over the year).
Based on the qualitative assessment of Veneto entrepreneurs, production, sales and employment are all set to decline further over the next six months.
In terms of tourism, Veneto was confirmed as Italy’s leading region with regard to the hospitality industry during 2008. Given a 0.2% fall in arrivals and a 0.9% drop in stays with respect to 2007, Veneto tourism has essentially held up while the industry in Italy as a whole appears to be experiencing serious difficulties. Specifically with regard to Vicenza, the latest economic survey of manufacturing performance during the fourth quarter of 2008, carried out by the Vicenza Chamber of Commerce, confirms a compounding of the difficulties already reported in relation to the first nine months of the year. Small, medium and large-sized firms all reported adverse performance, although small firms were the worst hit. Economic operators expect a further decline in manufacturing and commercial activity in the province of Vicenza during the first part of 2009, with a probable consequent fall in sales and employment.
Friuli Venezia Giulia
The latest data for industrial performance in the region confirms the critical state of the manufacturing sector, which first became evident during the second half of 2007. All indicators are down, both respect to the previous quarter and the same quarter in the prior year. Industrial output remained down during the fourth quarter of 2008 (-3.6% compared with the previous quarter, -14.5% compared with the prior year), despite a slight improvement with respect to the position at the end of September; the situation is similar with regard to total sales, which fell by 2.4% with respect to the previous quarter (-15.7% compared with 2007). Considering other economic indicators, the value of new orders has continued to fall with respect to both September 2008 (-9.9%) and the prior year (-17.7%), while capacity utilization dropped to 76.4% in the final quarter from an average of around 85% in the earlier part of 2008. Examination of the region’s most representative manufacturing sectors shows that both “Engineering” and “Wood and wooden furniture” are adversely affected by the downward economic trend. The short-term expectations of industrial entrepreneurs at the end of 2008 also reflected growing concern, especially about the future performance of foreign demand and production.
The latest employment statistics show a deterioration during the third quarter of 2008 (-0.9% compared with June 2008) and the stabilization of the unemployment rate at above 4%.
Lombardy
Data from Unioncamere Lombardia concerning production in Lombardy during the fourth quarter shows an acceleration in the pace of the deterioration that began in the first quarter of 2008. At the end of December 2008, production was 6.0% below the level of the prior year and down 4.1% (deseasonalized) with respect to the third quarter of 2008. This slowdown is evident across many sectors. Indeed, only food remains positive, while other sectors are in decline including, in particular, clothing and textiles. Even sectors important to Lombardy’s economy, such as engineering and chemicals, reported a significant decline in production over the year.

21
Similarly, output fell over the year in all the craft sectors. Total sales were also down by 6.9% over the year, and by 3.6% with respect to the third quarter of 2008. Capacity utilization has fallen below 70% with regard to manufacturers, but to around 63% for artisans.
The latest ISTAT data for employment, covering the third quarter of 2008, reflect an essentially stable situation with respect to the previous quarter, with an unemployment rate of just over 3%, which is well below the national average of 6.1%. There is however growing recourse to government-assisted lay-offs, involving 15% of firms and 2.5% of total working hours.
Considering the medium/long-term trends, the flow of orders, expectations and the situation “inherited” from 2008, Unioncamere Lombardia forecasts a further fall in industrial output in the coming quarter. Despite the adverse economic climate, manufacturers in Lombardy still expect to invest during 2009, although at levels below those seen in the past two years.
Tuscany
The regional economy was marked by a widespread decline during 2008, the first signs of which emerged during the second half of 2007. The most recent data available regarding the third quarter highlight a continuation of this downturn, with a further contraction in industrial production (-3%) and sales (-2.3%). This decline is affecting all Tuscan provinces (except for Livorno) including Prato in particular, which has reported a drop of 8.3% with respect to the third quarter of 2007. Given the general recessionary outlook for manufacturing as a whole, large firms held up well during the third quarter with production slightly ahead (+1.3%) due, in part, to the containment of prices and margins. Performance at sector level varies between the essential stability of metal products and engineering (+0.0% and +0.1% respectively), and the collapse of non-metal products (-8.0%), wood and furniture (-7.0%), and textiles and clothing (-6.0%). This industrial decline is a consequence of lower domestic and foreign demand. In the first case, the weakness of domestic consumption has adversely affected both orders and retail sales, especially in the non-food sector (including in particular durables, items for the home and household appliances) and with regard to the medium-small distribution channels. In the second case, the slowdown in exports is especially worrying since this does not reflect national trends, which remained in positive territory (although not by much) during the period concerned.
The worsening local and international economic situation is beginning to have an effect on the jobs market: there was a strong upturn in government-assisted lay-offs during the third quarter of 2008 and a brake on the deseasonalized growth in employment (+0.1% with respect to the second quarter of 2008).
Sicily
The downturn in the Sicilian industrial sector began during the last quarter of 2007 and continued throughout the first nine months of 2008. Plant utilization declined in the first half of the year, confirming the slowdown in production, although there was a modest recovery during the third quarter. Inventories of finished products remain higher than normal.
The construction sector showed signs of contraction, marking an inversion of the upward trend seen over the past several years. In particular, prices for homes fell and the time taken to complete transactions extended. Expectations for a good year in the agricultural sector unfortunately seem set for revision. The harvest is estimated to be up 1.2%, compared with a national average of 3.3%. The best results were achieved in the winegrowing sector with growth of 19% (+10% nationally), while the worst performance came from fruit growing with

22
a contraction of 11% (essentially unchanged at national level). Services are also in progressive decline due to weakness of demand from households and the public administration, as well as to the recent deterioration of demand from businesses. Tourism was also down in terms of both arrivals and stays (-2.7% and -1.4% respectively). In line with the past three years, the statistics for foreigners were better than those for Italian visitors. Data from Assaeroporti for Sicily’s three major airports shows that passenger numbers rose by an annual rate of 3.1% during the first eight months of the year, which was somewhat slower than in the prior year (+11.1%) due, most probably, to the troubles that afflicted the national carrier.
There was also a deterioration on the jobs front, with a slight fall in employment during the third quarter (-0.7%) with respect to the second, and an inversion of the downward trend in the rate of unemployment which, after a decade, seems to have stabilized at 13% compared with a national average of less than half that rate.

23
INNOVATIONS IN THE REGULATORY FRAMEWORK
The current regulatory framework reflects measures taken in the second half of the year to tackle the serious crisis affecting the international economy.The principal legislative changes affecting bank activity during the first half of the year mainly comprised the publication on 30 April of the so-called “Consolidated Law on Safety at Work”, implementing art. 1 of Law 123 dated 3 August 2007 on the safeguarding of health and safety in workplaces and, in particular, the publication of Decree 93 dated 27 May 2008, the so-called “fiscal decree”, which governs the renegotiation of mortgages on first homes in accordance with criteria established in the convention signed between the Ministry of the Economy and ABI.
With regard to supervisory regulations relating to internal systems, the Bank of Italy issued its “Supervisory instructions for the organization and governance of banks” on 4 March 2008. These outlined a complete regulatory framework, as supplemented recently by measures recognizing the central role of systems in the definition of business strategies and policies for the management and control of the risks inherent in banking and financial activity. The general objectives pursued by the new instructions comprise the clear segregation of functions and the appropriate calibration of powers, the balanced membership of corporate bodies, an integrated and effective system of controls, remuneration mechanisms that are consistent with risk management policies and long-term strategies, and appropriate information flows that facilitate knowledgeable operating decisions. In the light of the new instructions, the Board of Directors of the Parent Bank arranged to check the organizational and financial structure, and the procedures for managing conflicts of interest, against the essential governance characteristics described in these instructions. As a result, a draft Group governance plan has been prepared, specifying the organizational and governance measures deemed appropriate in order to comply with the above supervisory instructions.
Other instructions affecting the sector were contained in Decree 112 dated 25 June 2008, as converted into Law 133 dated 6 August 2008, containing “Urgent instructions for economic development, the simplification, competitiveness and the stabilization of public finances, and the equitable distribution of taxation”. This decree deferred to 2009 application of the so-called “collective action” and introduced important changes to the privacy law by modifying arts. 34 and 38 of Decree 196/2003. The decree also established that a percentage of interest expense (3% in 2008 and 4% from 2009) will not be deductible for IRES and IRAP purposes, and reduced the annual deductible provision against receivables from 0.40% to 0.30% of their book value; provisions in excess of this limit will be deductible on a straight-line basis over the following 18 years (previously over the following 9 years).
In the second half of the year, Decree 155 dated 9 October 2008 regarding “Urgent measures to ensure the stability of the banking system and the continuity of lending to businesses and consumers, given the current crisis in the international financial markets” represented the start of action to deal with the crisis situation. Some of the more important measures included: authorization for the Minister of the Economy to support, by subscribing for or underwriting capital increases, the recapitalization of banks with an equity deficit; the ability of banks to go into special receivership in critical situations, such as a liquidity crisis, that prejudice the stability of the financial system, and the ability to use public funds to recapitalize such banks in special receivership. Another notable measure was support for the deposit guarantee offered by banks (on deposits of up to 103 thousand euro in Italy), whereby the Ministry of the Economy is authorized, for a period of 36 months, to make up the difference if the available fund proves insufficient, for the benefit of all depositors whether physical or legal persons (art. 4).Decree 155 was followed by Decree 157 comprising “Additional urgent measures to ensure the stability of the banking system”, which has three articles. Pursuant to art. 1, the Ministry of the

24
Economy is authorized to guarantee the bonds with a duration of less than five years issued by banks between the date when the decree came into force and 31 December 2009. The availability of government guarantees, again until 31 December 2009, also extends to those parties (e.g. insurance companies and pension funds) that make securities available to banks for refinancing transactions with the Eurosystem.
Law 166 was also published in October 2008. This converted into law Decree 134 dated 28 August 2008 comprising “Urgent measures for the restructuring of major companies in crisis”; certain modifications made on the conversion of this decree altered the requirements applying to major companies that are insolvent, while others increased the resources of the Fund initially consisting of the so-called “dormant accounts”, via the addition of two paragraphs to art. 3 of Decree 134/08 to include the amount of bankers’ drafts that are not collected before they become time barred.
Lastly, Decree 185 was published on 29 November 2008 comprising “Urgent measures in support of families, work, employment and business and to remodel national strategy on an anti-crisis basis”. The measures of principal interest to the banking system relate to current mortgages (arranged by physical persons up to 31/10/2008) on principal residences (excluding categories A1, A8 and A9), for which the floating rate for 2009 cannot exceed 4% (the difference between the installments determined on this basis and those deriving from application of the contractual conditions will be paid by the government), and to mortgage contracts (on principal residences) arranged from 2009 onwards, for which the banks must offer customers the option of a floating rate linked to the ECB rate. This decree also introduced regulations to strengthen the Confidi system, in order to mitigate the credit crunch risk for small and medium-sized firms. The objective is to ensure an adequate flow of finance to the economy and an adequate level of capitalization for the banking system, by authorizing the Ministry of the Economy, until 31 December 2009, to subscribe - upon specific request from the banks concerned - for financial instruments without voting rights (art. 2351 of the Italian Civil Code), included in the calculation of regulatory capital, issued by Italian banks whose shares are listed in regulated markets or by the parent companies of Italian banking groups whose shares are listed in regulated markets.
Among various tax innovations, the 2008 Finance Law (Law 244 dated 24 December 2007) which came into force on 1 January 2008 introduced significant changes to corporate taxation. The principal changes affecting the 2008 financial statements are summarized below:
− Reduction in the standard rates of IRES (from 33% to 27.5%) and IRAP (from 4.25% to 3.9%).− Abolition of the ability to deduct directly in the tax return (section EC) any “off-books”
depreciation and writedowns not charged to the income statement. In this regard, an option was introduced to frank the difference between the carrying amount and the tax value of depreciable assets and off-book adjustments. The effect of franking is to realign the tax value of assets with their carrying amounts. This realignment is subject to the application of a flat-rate tax on the amount of the difference to be cancelled.
− Changes to IRAP and IRES. With regard to IRAP, the tax base for this regional levy is determined with reference to the amounts stated for statutory reporting purposes, while in the case of IRES for companies that report under international accounting standards (IAS/IFRS), the tax rules apply the accounting policies (measurement, accruals basis, classification) required by those standards (this change envisages the issue of enabling instructions which have not yet been published at the time of preparing this report).
With regard to VAT, art. 1.261 of the 2008 Finance Law introduced a new form of VAT exemption from 1 July 2008, applicable - under the conditions established in the regulations - to services provided by consortiums to their members. In addition, commencing from 1 January 2009, the VAT exemption envisaged in art. 6 of Law 133/1999 and applying to ancillary services rendered within banking (or insurance) groups has been abrogated.

25
Again with reference to corporate taxation, Decree 185 dated 29/11/2008, as converted with modifications in Law 2 dated 28/01/2009, envisages inter alia the ability to deduct, with effect from 2008, 10% of the IRAP due on the taxable portion of interest expense or, alternatively, on payroll costs. The above decree also introduced special rules for realigning the differences between tax values and carrying amounts created by the application of international accounting standards..

26
GROWTH OF THE BPVi GROUP:ACTIVITIES OF STRATEGIC IMPORTANCE
The global crisis that swept the international financial markets from the middle of September, combined with the general slowdown in economic growth, surprised a number of domestic and international players in the banking world and, in some cases, caught them unprepared. This situation forced many banking groups to make rapid and costly changes to their strategies, with a view to recovering operational equilibrium and defending their capital adequacy following the liquidity crisis and the change in market conditions. In these circumstances, the BPVi Group has drawn on its financial solidity, the values embodied in its mission and the special characteristics of people’s banks, to define its strategic direction and identify the drivers needed to tackle the operational difficulties weighing on the entire financial system. The strategic guidelines set down in the new Business Plan 2008-2011, prepared earlier in the year and approved in September 2008, thus embrace the maintenance of capital adequacy, a focus on traditional banking, improved balance between the growth in lending and direct customer deposits, a strengthening of the Group’s management and control activities, close supervision of risk and strict cost control. In short, even before the crisis became so evidently intense and worrisome, the BPVi Group had already defined its strategy for the consolidation of growth. The objective is to enhance operational profitability and efficiency over the medium term, and create the necessary equity, operational, financial and organizational foundations for a new phase of growth after a preparatory period of about 18-24 months. In order to achieve the established objectives within the timeframe of the Plan, work during the last quarter focused on a new and challenging operational plan that involved the Group’s entire management team and which has already achieved important early results.
In addition, significant action was taken with regard to equity investments during the year, in order to optimize the structure of the Group by rationalizing non-strategic investments and focusing on those companies that contribute to the development of the business. Action included the reorganization of asset management activities via the merger of BPVi Fondi SGR and Verona Gestioni SGR, the subsequent joint venture between Banca Popolare di Vicenza, Azimut and Cattolica Assicurazioni, and the sale of the interest held in Linea S.p.A..
Lastly, work to manage liquidity risk more effectively during the last part of the year included the securitization of the Group’s residential mortgages, under the name Berica 7 Residential MBS, for more than 1 billion euro. This is a “retained” transaction that was taken up in full by the various banks within the BPVi Group, in proportion to the portfolio transferred, in order to create securities for use in funding repurchase agreements with the ECB.
The Business Plan 2008-2011 and the Master Action Plan
In recent years, the BPVi Group has stood out in the Italian financial market for its relentless pursuit of growth, culminating at the end of 2007 with the purchase of 61 branches from the UBI Banca Group and the strategic partnership signed with the Cattolica Assicurazioni Group. The growth in scale has strengthened Banca Popolare di Vicenza and the entire BPVi Group, facilitating the defence of its autonomy and independence. These are essential conditions for continuing to operate as an authentic people’s bank serving the economies of its chosen territories. The results achieved are highly satisfactory: the BPVi Group is now Italy’s 11th largest banking group, with a strong presence in the four home regions of the Group’s banks.
This recent growth path and the good positioning achieved now need to be consolidated,

27
especially now at a time of profound financial crisis and general deterioration in the economic situation. Consolidation will set the potential acquired to work, return efficiency to more appropriate levels and create the conditions needed for the next stage of development.
Indeed, the consolidation of growth is the principal strategic guideline underpinning the new Business Plan 2008-2011 approved by the Parent Bank’s Board of Directors on 11 September 2008. This objective will be achieved by focusing on the traditional banking core business, drawing on the strong grassroots presence already achieved and building on the ties with and deep knowledge of local economic activity. Emphasis will be given to the role of Distributor Bank, working in partnership with operators specializing in specific sectors (e.g. bankassurance, merchant banking and asset management). Key elements include the renewed emphasis on the performance of branches, the strengthening of the Parent Bank’s management and coordination capabilities, the active monitoring of credit risk, strict cost control, the strengthening of the corporate culture and the development of human resources. Subsequent to the 18/24-month consolidation period, the Group plan to review its strategic positioning for the long term and examine new opportunities for growth.
Following approval of the Business Plan 2008-2011, steps were taken immediately in September to implement the action planned and reach the established objectives. In particular, a program for change was devised and launched, organized into 7 “Directions” that will involve the entire Group over the plan period on the following main fronts:− Revision of the Group’s governance model as an essential prerequisite for strengthening
the ability to govern, guarantee the uniformity and consistency of the strategic/operational directions, and enhance operational efficiency.
− Evolution of the processes and tools for governance and control, with particular reference to strategic planning, operational control and systems of internal control.
− Optimization of the corporate structure via work to rationalize, consolidate partnership agreements and develop the existing product factories.
− Relaunch of the Group’s commercial strategy and rationalization of the sales network, via the closure of branches to re-open them in more attractive areas, and the selective strengthening of the team at “non-performing” branches with growth potential, while aiming to maintain employment at end-2008 levels.
− Control of credit risk, drawing on new systems for the measurement and monitoring of risk while, at the same time, capitalizing on the wealth of information made available by the Group’s grassroots presence.
Work on the Plan, partly due to the immediate involvement and commitment of all Group employees, has already achieved significant results, with the activation of 27 projects out of the 30 envisaged, and the completion by 31 December 2008 of about 25% of all the activities to be performed over the Plan period. The principal results already achieved in each main area of the Business Plan are discussed below.
Revision of the Group’s governance model
As mentioned, the Business Plan envisages strengthening the Parent Bank’s ability to direct and coordinate activities by making changes to the way the Group is organized and to the related governance processes. In part, the intention is to maximize profitability via operational efficiency. In summary, the Group’s new governance model envisages:− the strengthening of strategic guidance and control activities via both increased emphasis on
the role of the Group Coordination Committee, which is chaired by the Managing Director and comprises the General Managers of BPVi and the other banks within the Group, and the extension of the operational governance activities carried out by the Parent Bank;

28
− the simplification and streamlining of the organizational structure at Group banks via the rationalization of duplicated functions;
− the completion of work to centralize support activities within specialist service companies.
In line with these indications, the Boards of the Group’s banks have recently approved the centralization within the Parent Bank and Servizi Bancari, a subsidiary, a number of significant activities (back office, court searches, ICT, purchasing and payroll). In addition, the meeting of the Parent Bank’s Board on 16 December 2008 approved, with effect from January 2009, the centralization of a series of additional activities in the areas of lending, marketing, operations, personnel etc., as well as the guidelines for the next revision of the Group Regulations “Guidelines and instructions for the coordination of the banks and companies within the Banca Popolare di Vicenza Group”. This document identifies a series of rules and principles comprising the Group’s Governance Model which enable the Parent Bank to specify how its duty/powers to manage, coordinate and control the Group will be exercised, while offering all banks/companies within the Group precise points of reference for their activities.
Evolution of the processes and tools for governance and control
The purpose of moving in this direction is to evolve the logic underlying the planning and control processes towards the safeguarding of capital, enhancement of the ability to identify and monitor risk, and rigorous cost management. Activity in this regard has included approval by the Parent Bank’s Board of Directors of the revisions to the Regulations for the Strategic and Operational Planning Process, and the changes to the functions of the Group Coordination Committee, which were subsequently adopted by the other companies within the BPVi Group. The new Regulations formalize the strategic and operational planning process, the process of evaluating strategic investments and the process of operational control. The primary purpose of this is both to ensure consistency in the identification of objectives and related actions to be taken by the Parent Bank and Group companies, as part of and consistent with a united business approach, and to completely define the decision-making process underlying the selection of strategic investments. In this regard, the Internal Audit function has recently been reorganized and expanded, and guidelines have been prepared for the new architecture of the System of Internal Controls, as described in the section on “System of internal controls and audit functions”.
Optimization of the corporate structure
In terms of corporate structure, the Business Plan envisages the rationalization of non-strategic investments and the promotion of companies contributing to the development of the business.
Moves in this direction have included the reorganisation of asset management via the merger of BPVi Fondi SGR and Verona Gestioni SGR and the subsequent joint venture between Banca Popolare di Vicenza, Azimut e Cattolica Assicurazioni, the approval of a strategy to rationalize merchant banking activities, and the sale of the interest held in Linea S.p.A. The above transactions are described below in the section entitled “Changes in equity investments”.
Relaunch of the Group’s commercial strategy and rationalization of the sales network
One of the Business Plan’s key commercial guidelines refocuses the BPVi Group on its traditional core business, placing emphasis on the multi-channel approach and relaunching the branches in terms of both performance and image. A number of important results have already

29
been achieved in this area. These include identification of the first batch (10) of branches to be closed and re-opened in more attractive areas, the start of a project to relaunch under-performing branches and, lastly, activation of the new Network Model with a view to simplifying the chain of command at branch level and refocusing on branch activities and the role of the branch manager. A more detailed description of the new Network Model is provided in the section entitled “Commercial Action”.
Control of credit risk
The objective here is to ensure the more organized and effective control of credit risk when granting, managing and recovering loans. Action has included implementing new internal rating systems for the Private Customer, Small Business, Small and Mid Corporate segments, as well as formalizing authorization systems and lending policies based on these ratings and, consequently, including them in the loan granting and management processes. With regard to work to prevent the deterioration of loans, via the development of methodologies and analytical support tools and the implementation of any corrective action required, a new operational “early warning” model has been devised, simulated and calibrated for the environmental monitoring of lending. This model works with internal data and operational experience, combined with the new rating models, and is described further in the section on Risk Management.
Changes in equity investments
A number of important actions were taken with regard to equity investments during 2008. As envisaged in the guidelines contained in the new Business Plan, the purpose of these steps was to optimize the corporate structure by rationalizing non-strategic investments and promoting those companies that contribute to the development of the business.
Sale of interest in Linea S.p.A.
As mentioned in the half-year report, Banca Popolare di Vicenza sold its 47.96% interest in Linea S.p.A. to Compass S.p.A., a consumer credit subsidiary of Mediobanca, on 27 June 2008 following receipt of the necessary authorizations from the competent authorities. This transaction was mirrored by Banco Popolare, which had the same percentage interest in the company sold. The proceeds from the transaction amounted to 194.25 million euro, with a consolidated gross capital gain of 91.6 million euro.
The BPVi Group will nonetheless continue to have a presence in the consumer credit sector both by distributing Linea’s products and through Prestinuova, a subsidiary specializing in loans secured against “one-fifth of salary”.
Merger of BPVi Fondi SGR S.p.A. with Verona Gestioni SGR S.p.A.
Having obtained the necessary authorizations from the competent authorities, the absorption of Verona Gestioni SGR S.p.A. by BPVi Fondi SGR S.p.A. was completed on 3 November 2008. These two companies were the Group’s principal asset management companies and both were held jointly, 50% each, by BPVi and Cattolica Assicurazioni under the partnership agreement signed in 2007. This transaction took place on a “simplified” basis (merger without share exchange) given the identical ownership structure of both companies. The objective was to create a “product factory” within the asset management sector for the benefit of the BPVi Group

30
and Cattolica Assicurazioni, while releasing the significant synergies deriving from the merger. As of 31 December 2008, the new company is 50% held by BPVi and its carrying amount in the financial statements is 25.8 million euro.
Joint venture between Banca Popolare di Vicenza, Cattolica Assicurazioni and Azimut
At the end of August 2008, Banca Popolare di Vicenza, Cattolica Assicurazioni and Azimut, an established name in Italy’s asset management sector, launched a project to establish an independent asset management company (SGR) controlled equally by the three promoters. This joint venture, still at the preparatory stage, would - among other factors - meet the frequently expressed requirement of the Governor of the Bank of Italy to separate the ownership of SGR’s from their operating policies. Azimut, listed on the Milan stock exchange, is the holding company for a group of companies that promote, manage and distribute financial and insurance products. This project envisages Azimut Holding purchasing a 33% interest in BPVi Fondi Sgr, the asset management company owned equally by Banca Popolare di Vicenza and Cattolica Assicurazioni, from the two parent companies. Work is still in progress on the details of the project. The first step in the joint venture with Azimut was the signature in January 2009 of a sub-placement agreement between BPVi and Azimut for the distribution of the AZ Fund 1 Luxembourg funds to customers of the banking group.
Renegotiation of the joint venture agreement between the BPVi Group and the 21 Investimenti Group
Other agreements of strategic interest include the renegotiation in May 2008 of the joint venture agreement signed between the BPVi Group and the 21 Investimenti Group in October 2004. The earlier agreement covering a five-year period was signed to strengthen the merchant banking and private equity activities of the Banca Popolare di Vicenza Group and the 21 Investimenti Group, via the concentration of these activities respectively within Nordest Merchant S.p.A. and 21 Investimenti Partners S.p.A., subsidiaries of the two groups concerned.The principal reasons inducing the partners to renegotiate the agreement in force were found in the changes that have taken place since it was signed, which are influencing the current development strategies of the two groups, and in the need to “streamline” the terms of the agreement, especially with regard to the governance of the various companies linked to the joint venture. In particular, under the new partnership agreement which will have a duration of three years, compared with five previously, the no-competition restrictions applying to the BPVi Group in relation to the private equity sector have been eased, since these limited the Bank in terms of becoming more active in that sector.
In September 2008, 21 Investimenti S.p.A. sold its interest in 21 Investimenti Partners S.p.A. to the managers of that company.
Measurement of capital adequacy (ICAAP)
In current market conditions, marked by considerable uncertainty and risk, the careful quantification and planning of capital availability is an increasingly critical driver of operations. An adequate level of capitalization provides room for operational maneuver, ensuring that fluctuations in the economic cycle can be tackled and potential losses from extreme events absorbed. The role of bank equity is strengthened within the new regulatory framework (Basel 2) and the Supervisory Authorities now remind intermediaries with increasing frequency about the need for capital adequacy in order to cover all the risks accepted. For these reasons, the process of checking the overall risk exposure of intermediaries began in early 2008 as part of the so-called Second Basel II

31
Pillar, together with verification of the Parent Bank’s own assessment of the capital adequacy of all the banks and companies within the Group. The Second Pillar supplements the quantitative rules envisaged by the First Pillar for the determination of prudent capital with a process (the prudent control process) that takes account, via self assessment and discussions between the Supervisory Authorities and the intermediary, of the latter’s special cases and specific risk profiles. This means that the possible effect on intermediaries of changes in markets, products and technologies can be evaluated more readily. In this context, the Banca Popolare di Vicenza Group launched a project in April 2008 to prepare its first Statement on the Internal Capital Adequacy Assessment Process (ICAAP), which was submitted on time to the Supervisory Authorities. The key steps taken by the BPVi Group for the preparation of this statement involved the identification of risks and the creation of a risk map for the Group and for the individual functions within the Parent Bank and its subsidiaries, the development of methodologies for the measurement of “quantifiable” risks and verification of the organizational control over risks (both quantifiable and unquantifiable), the allocation of roles and responsibilities to boards, committees and functions in relation to ICAAP, the preparation of ICAAP Regulations, and the validation of the ICAAP Process by the internal audit function prior to validation by the compliance function as part of the full statement to be completed in April 2009. The first ICAAP statement prepared in simplified form and relating to the situation at 30 June 2008 was therefore sent to the Bank of Italy at the end of October 2008, accompanied by a favorable opinion from the Board of Statutory Auditors. In extreme summary, the assessment of capital adequacy contained in the ICAAP statement shows that regulatory capital is adequate, on both a current and forward-looking basis (31 December 2008), to deal with all the risks faced by the BPVi Group in relation to its operations, reference markets and propensity to accept risk which, as resolved by the Board of the Parent Bank, is measured with reference to a target level of equity and external ratings. This Statement must be prepared on an annual basis and delivered in April with reference to the data at 31 December.
Ratings
The most recent ratings for BPVi given by Standard & Poor’s and Fitch Ratings are summarized below.
Rating’s agency Long Short Outlook Date term term
Standard & Poor’s A- A-2 Negative 14/10/2008Fitch Ratings A- F2 Negative 14/07/2008
The usual meetings between the Parent Bank’s management and analysts from the rating agencies resulted in confirmation of the positive ratings given in the past, although the changes in the financial and operational profile of the Group, associated with intensive growth at a time of adverse conditions for the economy and the banking sector, have resulted in a revision of the outlook from stable to negative.In particular, the two agencies have recognized that the Bank’s strengths include its good positioning in the rich regions of Northern Italy, the good diversification of the loans portfolio and the financial support available from the shareholder base, as confirmed on multiple occasions. Nevertheless, the high level of operating costs, mainly associated with the rapid growth in scale over the past few years, combined with the cost of credit risk, continue to penalize overall performance; in addition, the growth in lending in prior years has increased the potential credit risk in view of the general deterioration in the economic situation. The rating agencies have however recognized that the Bank’s renewed management team has already acted to eliminate the critical points identified, and have confidence in the firm will shown to maintain an adequate level of capital adequacy.

32
Other information
New securitization: Berica 7 Residential MBS
With the intention of managing liquidity risk more efficiently and effectively, the Bank has securitized a new portfolio of residential mortgages, known as Berica 7 Residential MBS,totaling more than 1 billion euro. The related securities were fully taken up from within the BPVi Group.
The financial crisis stemming from the US sub-prime mortgage collapse gave rise to a widespread and dangerous international crisis of confidence among financial intermediaries during 2008. This situation essentially froze the normal functioning of the interbank market, making access uncertain to one of the principal sources of finance for financial intermediaries. Banks tackled their funding requirements or managed the risk associated with uncertain access to funds from the interbank market, partly by securitizing portfolios of loans that they then subscribed for in full (so-called retained securitizations). These securities were then used, for example, as collateral for refinancing transactions with the central bank (the total value of retained securitizations exceeded 80 billion euro in Italy during 2008). The Berica 7 Residential MBS transaction was arranged by the BPVi Group to obtain securities for use as collateral for short-term loans, at relatively competitive rates, at times - like now - of liquidity stress in the market.
Inspection by the Bank of Italy
As stated in the 2007 Annual Report and the Half-year Report at 30 June 2008, BPVi was subjected to a general inspection by the Bank of Italy that commenced in October 2007. This inspection was completed in March 2008 and, as a consequence, the Bank of Italy notified its inspection report, containing remarks and issues, on 9 June 2008. On 2 July, the Bank sent its initial thoughts on the observations and considerations expressed by the Bank of Italy to the Supervisory Authorities. On 25 July, a detailed reply to the Inspection Report was prepared containing the Bank’s considerations about the matters raised. With regard to certain of the points and exceptions raised in the Inspection Report, the Bank of Italy has commenced a disciplinary procedure, pursuant to arts. 7 and 8 of Law 241 dated 7/8/1990, that may lead to fines for the Directors, the Statutory Auditors and the General Manager in office at the time of the facts identified in the Inspection Report. The outcome of this procedure is not known at the time of preparing this report
Other significant court cases
On 6 March 2008 a notice of indictment and a notice advising the conclusion of investigations were served in relation to criminal proceedings brought by the Milan Public Prosecutor’s Office. The persons being investigated include Giovanni Zonin, BPVI chairman, and Divo Gronchi, for having, in conjunction with other bank representatives, organized, conducted and taken part in a secret build-up of shares in Banca Nazionale del Lavoro, with the goal of obtaining control of the bank and of blocking the public offer for its shares announced by BBVA. Banca Popolare di Vicenza is required to answer, as the party liable for the administrative offence under para.1 (a) of art. 5, art. 6 and paras. 1 and 2 of art. 25-sexies of Decree 231/2001 governing the administrative responsibility of legal persons, companies and associations without legal personality, for not having, before commission of the deeds ascribed to Giovanni Zonin and Divo Gronchi, adopted and effectively implemented organizational and management models capable of preventing offences such as the one being investigated. The Bank has engaged an external firm of lawyers for its defence. Subsequently, on 3 June 2008, the investigating magistrature applied for the indictment of all the parties investigated for market fraud and other offences. The preliminary hearing has not yet been heard in this case.

33
In March 2008, “Adusbef”, a consumers’ association, filed a complaint with the Vicenza Court that challenged the value of the Bank’s shares and requested the magistrates to open criminal proceedings against Bank personnel for the crimes envisaged in art. 2622 of the Italian Civil Code (false corporate disclosures to the detriment of the company, the stockholders or the creditors) and art. 2621 (false corporate disclosures), as well as arts. 173 bis (false prospectus), 184 (abuse of privileged information) and 185 (market manipulation) of Decree 58/1998, with partial responsibility for the Supervisory Authorities (Bank of Italy and Consob) for failure to check. Subsequent to this complaint, on 10 December 2008 the judge for the preliminary investigation at the Vicenza Court, upon request from the investigating magistrate presented on 20 November 2008, notified the entire Board of Directors and the General Manager of the Bank of the time extension of the preliminary investigation pursuant to art. 405 of the criminal procedures code covering crimes the referred to in art. 2621 of Decree 58/1998, art. 2622 of Decree 58/1998 and art. 173 of Decree 58/1998. The Bank’s defence lawyers and the bank personnel involved consider this complaint to be quite obviously without foundation and, for this reason, the lawyers petitioned the Court on 30 March 2008 for the case to be closed.Lastly, on 7 August 2008, Banca Popolare di Vicenza was notified of action by the Competition Authority with regard to alleged improper commercial practices by the Banca and Banca Nuova, a subsidiary, in relation to the free transferability of mortgages. This action, as widely reported in the national press, was commenced following a complaint from a consumers’ association that had carried out an investigation, using its own personnel in the role of customers. These investigators visited a number of branches of leading national banks, asking for information about transferability. In particular, the two BPVi Group banks, together with 21 other banks investigated, are accused of impeding the transfer of mortgages (envisaged in art. 8 of Decree 7 dated 31 January 2007, as modified by Law 40 dated 2 April 2007 and Law 244 dated 24 December 2007), by offering customers “the most onerous solution, being replacement of the mortgage rather than its transfer”. As a consequence of this violation, Banca Popolare di Vicenza and Banca Nuova, together with other banks, were subjected to an administrative fine of 440 thousand euro. An appeal against this fine was presented to the Lazio Administrative Court (TAR) in mid November 2007. On 28 January 2009, the Lazio TAR ruled to accept the appeal and cancelled the Competition Authority’s action.

34
OPERATIONAL STRUCTURE
This section of the Report on Operations provides information about the territorial presence and positioning of the branch network and the changes in employment by the BPVi Group.
Territorial presence of the Banca Popolare di Vicenza Group
Traditional distribution channels
The BPVi Group’s branch network in present in 11 regions and 56 Italian provinces, with roughly a 1.9% share of total branches nationwide.
At the end of 2008, the BPVi Group with 637 branches (9 more than at the end of 2007) is Italy’s 11th largest banking group.
The 5 provinces with the largest number of branches are, in order: Vicenza, Treviso, Brescia, Udine and Prato. The following table shows the territorial presence of the BPVi Group’s branch network, analyzed by region and principal province, at 31 December 2008.

35
Geographical distribution 31/12/2008 31/12/2007 Changeof branches BPVi’s Group Veneto 260 258 2
Vicenza 98 98 0Treviso 56 56 0Verona 32 30 2Padova 31 31 0Venezia 23 23 0
Friuli Venezia Giulia 68 67 1Udine 39 39 0Pordenone 15 15 0
Lombardia 87 86 1Brescia 40 40 0Bergamo 24 25 -1Milano 12 10 2
Emilia Romagna 15 13 2Liguria 4 4 0Piemonte 2 2 0Trentino Alto Adige 1 0 1
North Italy 437 430 7
Toscana 94 92 2Prato 34 34 0Firenze 23 22 1Pistoia 9 6 3
Lazio 12 11 1Roma 9 8 1
Central Italy 106 103 3
Sicilia 79 79 0Palermo 25 22 3Trapani 18 18 0
Calabria 15 16 -1
South Italy 94 95 -1
Total 637 628 9
The Parent Bank opened 9 branches during the year: Corsico (Mi), Castelnuovo del Garda (Vr), Brescia, Cormons (Go) Faenza (Ra), Sesto San Giovanni (Mi), Villafranca di Verona (Vr), Rovereto (Tn), Sassuolo (Mo). Two branches were closed, at Manerbio (Bs) just a few metres from one of the 61 branches purchased from the Ubi Banca Group, and at Treviglio (Bg).In the same period, Cariprato opened 2 branches at Pontassieve (Fi) and Follonica (Gr), while the number of Banca Nuova branches remained unchanged (106) following the opening of 5 branches, 1 in Gela (CI), 2 in Palermo, 1 at Cinisi airport (Pa) and 1 in Rome, and the close of 5 branches at Raddusa (Ct), Monforte (Me), Gerace (Rc), Agrigento and Chiaramente Gulfi (Rg).The following table shows the changes during the year in the branch network of each Group bank.
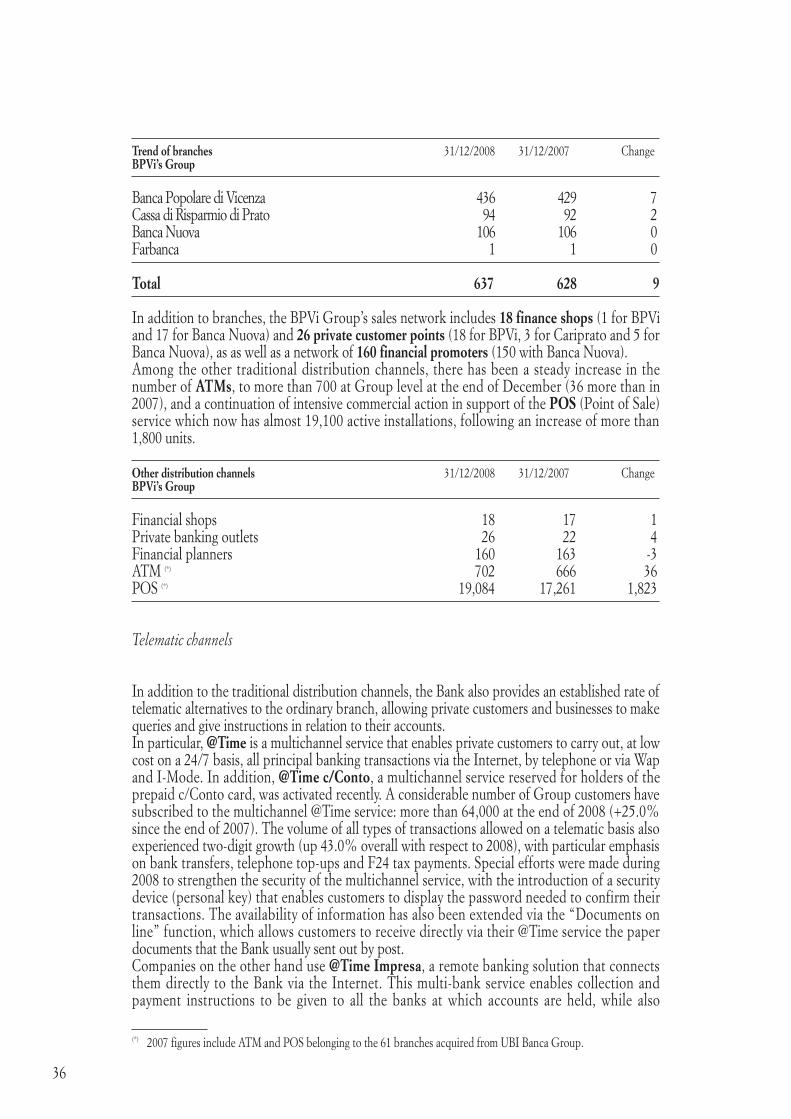
36
Trend of branches 31/12/2008 31/12/2007 ChangeBPVi’s Group Banca Popolare di Vicenza 436 429 7Cassa di Risparmio di Prato 94 92 2Banca Nuova 106 106 0Farbanca 1 1 0
Total 637 628 9
In addition to branches, the BPVi Group’s sales network includes 18 finance shops (1 for BPVi and 17 for Banca Nuova) and 26 private customer points (18 for BPVi, 3 for Cariprato and 5 for Banca Nuova), as as well as a network of 160 financial promoters (150 with Banca Nuova). Among the other traditional distribution channels, there has been a steady increase in the number of ATMs, to more than 700 at Group level at the end of December (36 more than in 2007), and a continuation of intensive commercial action in support of the POS (Point of Sale) service which now has almost 19,100 active installations, following an increase of more than 1,800 units.
Other distribution channels 31/12/2008 31/12/2007 ChangeBPVi’s Group Financial shops 18 17 1Private banking outlets 26 22 4Financial planners 160 163 -3ATM (*) 702 666 36POS (*) 19,084 17,261 1,823
Telematic channels
In addition to the traditional distribution channels, the Bank also provides an established rate of telematic alternatives to the ordinary branch, allowing private customers and businesses to make queries and give instructions in relation to their accounts.In particular, @Time is a multichannel service that enables private customers to carry out, at low cost on a 24/7 basis, all principal banking transactions via the Internet, by telephone or via Wap and I-Mode. In addition, @Time c/Conto, a multichannel service reserved for holders of the prepaid c/Conto card, was activated recently. A considerable number of Group customers have subscribed to the multichannel @Time service: more than 64,000 at the end of 2008 (+25.0% since the end of 2007). The volume of all types of transactions allowed on a telematic basis also experienced two-digit growth (up 43.0% overall with respect to 2008), with particular emphasis on bank transfers, telephone top-ups and F24 tax payments. Special efforts were made during 2008 to strengthen the security of the multichannel service, with the introduction of a security device (personal key) that enables customers to display the password needed to confirm their transactions. The availability of information has also been extended via the “Documents on line” function, which allows customers to receive directly via their @Time service the paper documents that the Bank usually sent out by post.Companies on the other hand use @Time Impresa, a remote banking solution that connects them directly to the Bank via the Internet. This multi-bank service enables collection and payment instructions to be given to all the banks at which accounts are held, while also
(*) 2007 figures include ATM and POS belonging to the 61 branches acquired from UBI Banca Group.

37
providing access to various supporting services (Cerved, WebPos). At the end of December 2008, this service is used Groupwide by almost 38 thousand companies (+12.7% since 2007), whose activities have increased the total number of transactions by 17.2%.Lastly, Treasuries have had access to the @Time Enti service for the past three years, This remote banking product offers information to Treasuries, via the use of a web platform to query accounting data and documents, and an ability to give instructions for the management of payment and collection flows. By year end, 328 Treasuries have subscribed for the @Time Enti service, with a rise over the year of 29.1% in terms of the number of contracts and 17.2% in terms of instructions given.
Representative offices abroad
The BPVi Group has three long-established representative offices abroad: Hong Kong, opened in the 1980s, Shanghai opened in June 2005, and New Delhi opened in April 2006. The purpose of these representative offices is both to facilitate the commercial transactions between Italian companies and the principal Asian markets, providing appropriate services for entrepreneurs intending to expand in those areas, and to develop lasting business relations with the principal and most experienced banking counterparts in Asia.
Cooperation agreements were signed with two foreign banks in 2008, Banco Credicoop in Argentina and Wells Fargo Bank in the USA, in order to facilitate commercial activity and investment by Italian firms in Argentina and the United States, as well as with the Interamerican Development Bank (IDB), which is a sovranational entity based in Washington.
Human resources
The BPVi Group employs 5,645 persons at 31 December 2008, up by 432 since the end of 2007 (+8.3%). This increase mostly took place during the first half of the year, as a consequence of the growth pursued until approval of the new Business Plan 2008-2011 which, by contrast, envisages a phase of consolidation and employment stability for the Group. In particular, the rise in employment at the Parent Bank (+373 since 31 December 2007, +11.9%) was mostly due to the addition to the Group of the persons employed at the 61 branches acquired from the UBI Banca Group (219 persons), together with the strengthening of the Commercial Network (+91 persons, including 56 allocated to the former UBI Banca branches) and, to a lesser extent, the Central Functions (+55 persons) that provide support to the Group. The remaining change related to the increase in employment by the commercial and business functions at Banca Nuova (+49 persons since 31 December 2007, +5.8%) and, to a lesser extent, at Cariprato (+10 persons since 31 December 2007, +1.0%). Among the other Group companies, the rise in employment at Prestinuova (+10 persons, +19.2% over the year) was mainly due to the strengthening of commercial activities in new territories. The following table shows the changes in employment at each company within the BPVi Group.

38
Staff 31/12/2008 31/12/2007 Changes Number % Number % (+/-) % Banca Popolare di Vicenza 3,508 62.1 3.135 60.1 373 11.9Cariprato 990 17.5 980 18.8 10 1.0Banca Nuova 899 15.9 850 16.3 49 5.8Farbanca 29 0.5 28 0.5 1 3.6
Banks total employees 5,426 96.1 4.993 95.8 433 8.7
PrestiNuova 62 1.1 52 1.0 10 19.2BPV Finance 6 0.1 6 0.1 0 0.0B.P.Vi. Fondi SGR (1) 37 0.7 40 0.8 -3 -7.5Nordest Merchant 10 0.2 10 0.2 0 0.0NEM SGR 0 0.0 0 0.0 0 n.s.NEM 2 SGR 5 0.1 4 0.1 1 25.0Nuova Merchant 0 0.0 8 0.2 -8 -100.0Servizi Bancari 82 1.5 84 1.6 -2 -2.4Immobiliare Stampa 17 0.3 16 0.3 1 6.3
Other companies total employees 219 3.9 220 4.2 -1 -0.5
Total employees 5,645 100.0 5.213 100.0 432 8.3
Analysis by function of employment by the Group’s banks (excluding persons who are inactive for various reasons, such as those on leave of absence or who are on secondment) shows an overall increase in persons working for the Commercial Network with respect to those at Central Functions (General Management, Credit Assessment and Back Office), rising from 72.5% at the end of 2007 to 73.3% at 31 December 2008. This change was due to addition of the 61 branches acquired from the UBI Banca Group and the policy of strengthening the Commercial Network implemented, for the most part, by the Parent Bank.
Bank employees 31/12/2008 31/12/2007 Branch Corp % Branch Corp % network Center network Center Banca Popolare di Vicenza 2.509 869 74,3 2.199 814 73,0Cariprato 664 280 70,3 656 274 70,5Banca Nuova 648 225 74,2 617 208 74,8Farbanca (2) 6 22 21,4 6 21 22,2
Total 3.827 1.396 73,3 3.478 1.317 72,5
(1) 2007 figure include employees belonging to Verona Gestioni SGR S.p.A. (11 employees), company that during 2008 has been merged into BPVi Fondi SGR S.p.A..
(2) Farbanca is on-line-bank and has a call center classificated into Corporate Center

39
With reference to the analysis of employment at Group companies by professional category, there are 132 executives, 2,205 managers and 2,982 clerical employees at the end of December 2008. The “Other” category mainly comprises apprentices.
Employees Categoryby professional category Senior managers Managers Remaining staff Other staff Banca Popolare di Vicenza 82 1,465 1,695 266Cariprato 11 340 617 22Banca Nuova 24 338 508 29Farbanca 1 5 23 0PrestiNuova 1 9 52 0BPV Finance 1 1 4 0B.P.Vi. Fondi SGR 4 9 24 0Nordest Merchant 3 4 3 0NEM SGR 0 0 0 0NEM 2 SGR 2 0 3 0Servizi Bancari 2 26 45 9Immobiliare Stampa 1 8 8 0
Total 132 2,205 2,982 326
At 31 December 2008, “effective” employment by the BPVi Group, considering the employees of Group companies, persons on secondment and project workers, totals 5,675 persons, up by 8.4% since the end of 2007. The following table shows effective employment by BPVi Group companies at 31 December 2008.
Permanent 31/12/2008Staff BPVi Staff seconded at seconded at Seconded Other Permanent (a) BPVi’s other other from staff (1) staff Group companies other (e) (a-b-c+d+e) companies (c) companies (b) (d) Banca Pop. di Vicenza 3,508 10 2 24 15 3,535Cariprato 990 17 0 5 0 978Banca Nuova 899 15 2 2 11 895Farbanca 29 1 0 1 0 29PrestiNuova 62 0 0 3 8 73BPV Finance 6 0 0 0 0 6B.P.Vi. Fondi SGR 37 0 0 0 0 37Nordest Merchant 10 4 0 1 0 7NEM SGR 0 0 0 3 0 3NEM 2 SGR 5 0 0 0 0 5Nuova Merchant 0 0 0 1 0 1Servizi Bancari 82 2 0 0 0 80Immobiliare Stampa 17 0 0 9 0 26
Total 5,645 49 4 49 34 5,675

40
Management and development of Human Resources
Significant organizational changes involving the commercial networks and the general management functions at Group banks were made during the year, with consequent effects for the management of employees. The changes involving the network included the opening of new branches by Group banks and the launch of the new Bergamo-Brescia Area by BPVi, as well as the recent reorganization of the Area model to optimize the commercial chain of command. This has involved eliminating the intermediate level of “area leader” branches and the introduction of the Market Manager role (Corporate, Small Business and Private Customers). In terms of the management of human resources, this change involved identifying the persons concerned and allocating them to their new roles, as well as the revision of job descriptions, in order to draw on the professional skills and potential already available within the Group.
With regard to the central functions, internal audit was reorganized as part of work to strengthen the organization and the system of internal controls in order to control business risks and enhance governance. In addition, in order to ensure the consistent application of personnel development policies within the BPVi Group, a support team has been formed at the Parent Bank to help Group banks and companies design and implement personnel development initiatives and programs, as well as design and present employee evaluation and incentive systems that are consistent with the guidelines established by the Parent Bank. In this context, the “New Employee Evaluation System” was developed during the first half of the year, with preparation of the related manual and procedures so that the system can be applied effectively. This system will be implemented by the Parent Bank and Farbanca during 2009, while the other Group companies are expected to adopt it from 2010.
Other initiatives included the start of an experimental tutorship program at the Parent Bank, involving individual meetings with “new colleagues” with about two years of seniority (about 80 persons involved by 31 December 2008), to identify any integration problems and assess both their levels of satisfaction and their expectations for career development. This program will continue in 2009.
Training activities
Training activities within the BPVi Group were developed and consolidated along the following principal lines during 2008:− Induction training. This is training for new recruits and all those who change role and need to
acquire the technical-operational knowledge needed to perform their new tasks.− Ongoing training. Regular updates that reflect business objectives and convey specialist
technical-professional knowledge.− Development training. Programs intended to spread and enhance managerial skills.− Compulsory training. This is training required by laws and regulations (e.g. anti money
laundering, Isvap, Mifid etc.)
In particular with regard to the induction training, a special training path has been activated for “Professional Apprentices”, as required by law and regional regulations.
As part of ongoing training, a new module has been developed for branch managers covering the legal and risk aspects of granting loans and, just at the Parent Bank, training on the new lending policies has been delivered to Area Managers, Business Consultants and Branch Managers.

41
Work to enhance managerial skills has included the introduction of a training program for candidate branch managers, comprising not only technical-specialist materials, but also modules focused on the management of staff and the planning of activities.
The training requirements imposed by the various regulations in force have been considerable covering, in particular, Isvap rules, anti money laundering, transparency, Decree 231/2001 on the administrative responsibility of legal persons, health and safety in the workplace, with training on hold-up risk and first aid, etc.
“Ad hoc” training projects were also devised during the year to meet the specific requirements of individual banks. In this regard, the Parent Bank organized training for the new colleagues joining from the 61 branches acquired from the UBI Banca Group, in order to ensure operational continuity and full integration with BPVi’s processes and internal regulations. A training program was also introduced for internal auditors, covering the recent internal reorganization and legal requirements, in order to update their skills. Training was also provided to the branch managers at Banca Nuova covering managerial and risk control matters. Special behavioral and management development training was developed for general management personnel at Cariprato, together with updates on the new regulations (Isvap, Mifid, Basel 2). With regard to the commercial network, branch managers received training on the analysis of creditworthiness and the management of positions considered to be at risk.
The large majority of the above courses were delivered by internal “lecturers” with at least three years’ experience, thus ensuring the regular update of the training programs and materials. The Group has also continued to work with the leading specialists in the sector, especially with reference to behavioral training.
This extensive commitment to training is confirmed by the results shown in the following tables, the first of which relates to the Group’s banks while the second is specific to BPVi.
Training Banks of BPVi Group(days) 2008 2007 (+/-) Chamge % Entrance 5,196 5,246 -50 -0.9Apprenticeship 3,129 2,378 751 31.6Permanent 4,873 3,221 1,652 51.3Development 5,405 2,332 3,073 131.8Progect UBI 367 0 367 n.s.,
Total 18,970 13,177 5,793 44,0
Mandatory 16,347 30,959 -14,612 -47.2
Total including mandatory 35,317 44,136 -8,818 -20.0

42
Training Banks of BPVi Group(days) 2008 2007 (+/-) Chamge % Entrance 2,653 2,461 192 7.8Apprenticeship 2,862 2,287 575 25.1Permanent 2,294 1,853 441 23.8Development 4,234 2,142 2,092 97.7Progect UBI 367 0 367 n.s. Total 12,410 8,743 3,667 41.9 Mandatory 10,593 19,141 -8,548 -44.7 Total including mandatory 23,003 27,884 -4,881 -17.5%
The employees of BPVi Group banks received a total of 35,300 mandays of training during 2008, of which 23,000 related to the Parent Bank. This was 20% less than in 2007 (-17.5% at BPVi), when considerable training was required for the application of ISVAP regulations (compulsory training). On the other hand, there was significant growth in the other types of training (+44.0% at Group level and +41.9% at BPVi) including, in particular, an increased commitment to the development of managerial skills (development training).
Employment policies
Internal discussions with the trade unions covered the organizational changes at the Parent Bank concerning, in particular, certain general management functions and the commercial network. In addition, consultations were still in progress at the end of 2008 regarding the transfer to Servizi Bancari S.p.A., the BPVi Group company that provides IT and back office services, of certain administrative, back and middle office activities previously carried out by the individual banks. This transfer involved the sale of the related lines of business.
With regard to the other Group companies, Banca Nuova, Cariprato, BPVi Fondi SGR and Servizi Bancari have signed the union agreements on bank bonuses for 2007 and 2008. Cariprato has also reached an important agreement governing the provision of training to employees. Lastly, other agreements were reached by BPVi Fondi SGR on the absorption of Verona Gestioni SGR and by Cariprato on activation of the “Solidarity Fund for sustaining the income of bank personnel”, while BPVi Fondi SGR and Servizi Bancari signed agreements to extend the cover provided by Caspie.
During 2008, the Parent Bank commenced and concluded 13 disciplinary procedures, applying the sanctions envisaged in the employment contract.
Examination has continued of the regulatory changes introduced by the “Welfare Protocol”, the decree governing tax relief for overtime working and variable remuneration, the renewal of the national payroll contract on 8/12/2007 especially with regard to the treatment of apprentices, and the changes to employment law contained in Decree 112 dated 25/6/2008 “Urgent instructions for economic development, the simplification, competitiveness and the stabilization of public finances, and the equitable distribution of taxation” (so-called “Summer Measures”).
Finally with regard to employment, the Parent Bank settled 6 disputes with employees before the Mediation Commissions.

43
COMMERCIAL ACTIVITIES: CHARACTERISTICS AND RESULTS
Commercial activities by the BPVi Group during 2008 principally included action to broaden the customer base and develop cross-selling via emphasis on the breadth and quality of services, as well as by the use of promotions.
These strategic guidelines were reaffirmed in the new Business Plan 2008-2011, which establishes that efforts to re-establish adequate levels of profitability and efficiency will include a focus on the traditional banking core business, with emphasis for BPVi’s role as a “distributor bank”, and the rebalancing of the loans-deposits ratio, thereby containing the level of borrowing from the interbank market.
In order to facilitate achievement of the commercial objectives indicated in the Business Plan, the BPVi Group has taken specific action to simplify the chain of command at branch level and strengthen their commercial push capabilities, thus confirming the central importance of the branch within the customer service-relations model. In particular, actions have included the activation of the new Group Network Model by BPVi from January 2009, thus facilitating the more effective and rapid delivery of services to customers. This model is currently being rolled out to the other banks in the Group. Summarizing, the new model eliminates the intermediate role of the “area leader” branch, creates the role of manager for each of the Corporate, Small Business and Retail markets, and activates efficient mechanisms for coordination between branches and the commercial areas.
With regard to the strengthening of commercial-push capabilities, a plan has been devised for renewal of the range of products and services offered to all customer segments including, in particular, retail customers. This segment in fact affords the greater growth opportunities (e.g. renewal of the range of current accounts, solutions for the transfer of mortgages, development of the insurance catalog, etc.). Consistent with the strategic guidelines contained in the Business Plan, work to develop the product catalog during 2008 therefore mainly concentrated on expanding the range of direct deposit products and implementing the partnership agreements reached with Cattolica Assicurazioni and, more recently, Azimut. The principal innovations made to the product catalog during 2008 are described in the section of this report entitled “Products, services and markets”.
Segment analysis of the BPVi Group’s customersAnalysis of the customers served and the operations of the banks within the BPVi Group demonstrates the commercial vocation towards private customers and family firms that is typical of people’s banks, confirming the close ties established with the various local economies.
The distribution of BPVi Group customers at 31 December 2008 confirms the preponderance of private customers (mass market and affluent customers), comprising more than 80% of the total, followed by the retail business segment (firms with sales of up to 2.5 million euro), representing 11% of the total. The
percentage of customers belong to the VIP segment (managed by the private banking area and by promoters) and the corporate segment (firms with sales of more than 2.5 million euro) is smaller, representing respectively 3.5% and 2.2% of the total. The “Other” category comprises employees, disputed accounts, firms managed directly by central functions etc.

44
Private customers also dominant the volume of direct deposits taken, contributing more than 57% of the funds gathered by the commercial networks of the BPVi Group’s banks. The VIP and corporate segments follow, contributing respectively 15% and 14% of the total, with retail businesses further behind at 8.5%.
By contrast, analysis of the contribution made to the growth in lending confirms the leading role of the corporate segment, which absorbs about 51% of total loans. The private customer segment follows with 28.5%, together with the retail business segment with more than 15%. Lending to th VIP segment is marginal (2.8%).
With regard to indirect deposits however, the weight of the VIP segment is evident with about 39% of the total from just 3.5% of total customers. The contribution from private customers is also significant, at 51.5% of the total, while the contributions from the corporate segment (6.5%) and retail businesses (0.9%) are much lower.
Considering the net interest and other banking income generated by the Group’s commercial network, the greatest contribution is made by private customers (43.3%). These are followed by the corporate segment (28.2%) and retail businesses (20.5%). Finally, the VIP segment contributes 6.1% of the total net interest and other banking income generated by the commercial networks of the BPVi Group’s banks.

45
Products, services and markets
As mentioned earlier, work continued during 2008 to upgrade the product catalog available to Group banks, and to refine the tools available in support of commercial activity including, above all, CRM tools. Activity in this last area has focused on two key aspects: support for branches in the management of customer relationships and guidance for the management of the sales network. In the first case, improvements have been made in the analysis of customer behavior, with a view to increasing both their loyalty and their satisfaction with their relationships with Group banks. With regard to the second aspect, the tools for monitoring commercial performance have undergone significant renewal, now focusing great attention on the individual customer segments ahead of the introduction of the new Network Model in early 2009.
Geomarketing tools have also been upgraded and refined in support of territorial development, with a view to identifying growth potential better and accelerating growth both in the newer territories and in more established areas.
The principal commercial innovations made in order to upgrade the product catalog are summarized below in relation to the two macrocategories: private customers and businesses.
Private Customers and VIP Segment
A new range of current accounts for households was launched in 2008 under the name of “SemprePiù”. This comprises four different proposals that accurately target the specific requirements of customers regarding the remuneration of deposits (“SemprePiù Rendimento”), the containment of costs (“SemprePiù Risparmio”), the certainty of costs for a full range of services (“SemprePiù Famiglia”) and remote current account access (“SemprePiù On-line”). The presentation of these proposals commenced in April with the launch of “SemprePiù Rendimento” and was completed during the second half of the year.
With regard to consumer credit, distribution of “Presto” from Linea S.p.A. has continued. Work with this partner during the second half of the year involved making some innovations to further extend the range of available solutions, including the presentation of “Maxiprestito” for loans up to 55,000 euro.
Given the increasing importance of the energy issue and the government assistance available for renewable and alternate energy sources, a new line of loans called “Credito Solare” has been introduced to finance the installation by households of solar-powered installations. BPVi has won significant recognition with “Credito Solare”, in the form of the “MF Innovazione Award 2008” first prize in the personal loans category.
In line with market trends with regard to lending to private customers, efforts to sell the Transfer of one-fifth of Salary (CQS) and Payment Authorization products via the branch network were augmented from the middle of 2008. These products are supplied by Prestinuova S.p.A., a specialist company operating within the Group.
Considering the regulatory changes influencing the home mortgages market during the year, the Group has developed a complete range of solutions for the transfer of mortgages from other banks, encompassing the possibility of transfer or replacement, as well as opportunities to obtain additional finance.
With regard to multi-channel activities, the introduction of the “personal key” and the “Documenti On Line” service mentioned earlier has further increased the quality and security of @Time, BPVi’s home banking service.

46
Working with the insurance companies owned together with Cattolica Assicurazioni, the range of products available in the loss insurance, life assurance and investment policy sectors has been rationalized and extended. In particular, in the loss sector, new or restyled insurance products have been presented together Compagnia ABC Assicura. These solutions are either linked to major banking products (such as credit protection insurance for home mortgages), or respond to the need to protect individuals, households or wealth (e.g. accident cover, head-of-household third-party liability, travel-related losses etc.). The range of life assurance policies has been extended, in collaboration with Compagnia Berica Vita, by introducing the “Berica Energy Rendita Immediata” policy for those who wish to ensure a guaranteed income, immediate and adjusted over time, for themselves or their loved ones. In addition, the range was reviewed as a whole in order to enhance the yields recognised to customers. With regard to life assurance for investment purposes, two new lines of investment have been introduced and a new range of unit-linked products has been launched under the name “Guida Life Swing”. This range was developed together with Vicenza Life and is linked to investments in ETFs, with an orientation towards prudent financial investment that, to some extent, is decoupled from equity market trends.
In addition to the launch of Fondo Arca Capitale Garantito, created and promoted in the asset management sector by Arca Sgr S.p.A., the portfolio management catalog of BPVI Fondi Sgr has also been revised in order to respond appropriately to changing market conditions, and to the entry into force of the new MiFID regulations. Bonds and certificates issued by third parties were also placed during the year, with a view to offering customers new investment solutions and diversification given the extreme volatility of European and world stock exchanges and of interest rates.
Lastly, following the agreement reached with Azimut, preparatory work began ahead of the placement of the “Az Fund” sicav funds by Group banks from the start of 2009.
In terms of Assurance products for VIP customers, the Group has continued to place established products (unit-linked, index-linked, standard life policies) and has also been successful in placing Personal Portfolio, a product that provides insurance cover for portfolios of securities. The bond sector has also been developed, with the issue of bonds specifically for the this segment.
Business Segment
During the year, the BPVi Group distinguished itself with the creation of new products including, as already mentioned, the “Credito Solare” loans to finance investment in renewable sources of energy. In addition, consistent with its vocation as a territorial bank attentive to the growth and development needs of small and medium-sized businesses, BPVi has signed a global loan agreement with the European Investment Bank (EIB) for the granting of loans totaling 130 million euro to small and medium-sized businesses. Available for periods of up to 12 years, these loans can finance investment in new works, the acquisition of plant and machinery, restructuring and modernization.
The catalog of assisted finance has been expanded significantly, involving agreements with Finlombarda and the EIB, the activation of loans pursuant to Regional Law FVG 29/2005 (commerce), and a contract for the management of grants from the Campania Region.
In order to assist customers with their business in foreign markets, the BPVi Group signed important new collaboration agreements during the year with Wells Fargo Bank, San Francisco, the USA’s fifth largest bank with about 6,000 branches, Arab African International Bank, Egypt, and Banco Credicoop, Argentina. Agreements were also signed with Interamerican Development Bank, Washington, with a view to hedging political and commercial risks in Latin America and the Caribbean, and with Istituto per il Commercio con l’Estero (ICE), in order
47
to facilitate the internationalization of Italian companies by making various forms of assistance available to customers.The successful strategic partnership with Volksbank has continued. Banca Popolare di Vicenza’s collaboration with this Austrian group has been consolidated by investment in the capital of seven banks situated in Central and Eastern Europe. The international desks staffed by Italian-speaking staff offer specific and professional on-site assistance, as well as consultancy to Italian firms that are either present in the countries concerned or interested in commercial expansion or other investment there. In addition, a representative of the Parent Bank is present on the international desk of Volksbank Romania in Timisoara, with a view to supporting the consolidation and expansion of Italian firms in Romania.
The gold and silver sector has continued to decline both at home and abroad, where the large majority of domestic production is sent. This contraction is principally due to the deterioration of the international economy, the volatility of the metals market and the changing tastes of end consumers who are tending to purchase alternate discretionary goods.
Commercial communications and promotional initiatives
The commercial activities addressing private customers and businesses during 2008 were accompanied and sustained by a series of communications campaigns and promotional initiatives.
Advertising activities
A major advertising campaign covering several channels was launched to support the presentation of the new range of current accounts for households: “SemprePiù”. There were three distinct stages in this campaign. In particular, multimedia campaigns focused mainly on advertising in local media, such as daily newspapers, free press and static/dynamic street hoardings available in the cities and provinces served. Promotional action on the web included a BPVi presence on some of Italy’s most important national portals (Corriere.it, Gazzetta.it, Ansa.it, Tiscali.it, Virgilio.it, Libero.it), as well as keyword advertising on the Google search engine. These actions were also supported by the product’s own website, www.contosemprepiu.it, referenced by the various promotional tools and the landing site for web advertising, as well as by the despatch of about 1,400,000 promotional e-mails.
The addition to the catalog of the “Credito Solare” loan product was supported advertising in the free press and local newspapers, in addition to a campaign in Italy’s leading financial press (Il Sole24Ore, MF, Milan Finanza). The advertising campaign also involved Radio 24 and the leading radio stations in the Bergamo and Brescia areas. In order to provide further support for “Credito Solare”, BPVi also took part in the renewal energy sector’s principal show with the distribution of brochures.
Following the recent legislation relating to mortgages, the Group has launched the “SOS Mutui” project which envisages the activation of a toll-free number for both customers and non-customers, staffed by specially trained personnel who are able to provide appropriate assistance on the subject. A pilot initiative was carried out in Tuscany during the year, with related advertising by Cariprato in the leading regional newspapers.
Last but not least, the Banca Popolare di Vicenza brand was promoted to the residents of the Bergamo and Brescia provinces via a press campaign in the leading daily newspapers and the free press. Special attention was given to the development of business customers, with a view to building relations between the Bank and businesses in the Lombardy region.

48
Promotional initiatives
Promotional initiatives included the “Vola al Sole” campaign, focused on arranging standing orders for utility payments, which included a trip to Mexico as a prize.
The second year of the “Operazioni Studenti” initiative is also worthy of mention. This addresses students between the ages of 13 and 30 and reflects an agreement signed between Banca Popolare di Vicenza and F.T.V., which operates the bus services in the province of Vicenza. This initiative, which commenced in August, offered prizes and discounts to all students using F.T.V.’s services who open a free current account (Amici or Feel Free).
Sponsorship of the youth section of Vicenza Calcio included the “Amici – City Camp 2008” initiative which, with a view to drawing the attention of young people to the management of money, made free banking products (deposit books, accounts) available to participants at the summer camps organized by the football club. Persons opening accounts were “rewarded” with the official football of the European Cup.
Again with a view to spreading awareness about the management of money among the younger section of the population, the “Scuole a Palazzo Thiene” initiative made free banking products (deposit books, accounts) to children on school visits to Palazzo Thiene. Those opening accounts were “rewarded” with an mp3 player.
A further initiative by Banca Popolare di Vicenza involving the local school system resulted in the development of a new automated system for the management of school meals and bus services for infants and primary school children in the Municipality of Vicenza. This initiative was organized with the Municipality as an extension of its treasury management contract. The new system will replace paper meal tickets and travel passes with a prepaid top-up card, using contactless technology, dedicated solely to the use of and payment for these services. Testing of this new automated system for the management of school meals and bus services began at 9 schools in the Municipality of Vicenza at the start of the 2008-2009 school year.
Given the success of initiatives that associate tangible rewards with the placement of banking products, an experimental marketing program was tested at just 51 BPVi branches. In particular, persons subscribing for Certificates of Deposit were given a “material” product for daily use in the home (a double quilt). This represents an innovative approach to promotion in the Italian market. During this promotion, the branches concerned were supported by posters, brochures, counter displays and special presentations (e.g. free-standing displays).
Research and development
In view of its business and industry sector, the BPVi Group does not generally carry out research and development as such. As a result, it has not recognized any intangible assets or costs in this regard. The usual activities of implementing and updating the product catalog, designed to ensure that each business line has a complete range of products and services in line with major competitors, and the revision of procedures and internal processes to ensure that the operational structure functions adequately, do not result in new or significantly improved products, services or processes relative to those already present on the market, since they are not the result of research and development in the strict sense.

49
SYSTEMS
As always, the systems area was particularly active during the year. In addition to working on the implementation of the Business Plan 2008-2011, as described in the section on “Activities of strategic importance”, the systems area has supported the activities within the Group’s Basel II project leading to delivery of the first Statement of Internal Capital Adequacy Assessment Process (ICAAP) to the Supervisory Authorities, and the initial use of the new rating models within the lending process by all BPVi Group banks.
The systems area has also been active as part of major revisions to some of the Group’s business models involving the chain of command at branch level, the finance area, and the decentralization of the analysis of loan applications, which was previously performed by the central loan labs. In addition, various significant activities (back office, court searches, ICT, purchasing and payroll) described in the section on “Activities of strategic importance” have been centralized within the Parent Bank and Servizi Bancari, and the internal audit function has been reorganized, as discussed in the section on the “System of strategic controls and auditing”.
The principal activities of the systems area during 2008 with regard to the organization of the Group, IT and procedures are described below with respect to each operational area.
Markets
The organization model for this area’s functions has been updated to reflect related developments within the central functions at the BPVi Group’s banks, and the network structure has been revised to take account of changes in the reference markets.. In particular, the new organizational model approved by the Boards of the Group’s banks is intended to simplify - by revising the network model - the chain of command at branch level in order to refocus on the branch, and the branch manager in particular, in terms of the provision of customer service. Action included elimination of the intermediate level of “area leader” branches, the creation of three markets (Corporate, Small Business and Retail) and the activation of effective mechanisms for coordinating the activities of branches and commercial areas. This has involved the introduction of two new roles, Business Manager and Private Customer Manager, with a view to focusing the internal organization of areas on the core operating segments (businesses, private customers).
Systems work in the markets area also included changes to central functions to make the commercial activities of the network structure more incisive. This action involved the creation of a commercial coordination function that reports directly to the commercial manager at each bank. The new function comprises the managers of the commercial areas and, at the Parent Bank, representatives from two staff functions: branch development and shareholder relations. The new function therefore acts as a point of reference for all business functions responsible for operations and business development. In addition, the CRM and Commercial Planning function has been established with the key objective of improving customer understanding, thereby helping to focus business development initiatives and equip the networks with the sales support tools they need.
Regulations
In accordance with the supervisory instructions for banks regarding the management and assessment of risk (Bank of Italy circ. no. 263/2006: Basel II), the Banca Popolare di Vicenza Group launched its Basel II project in 2006 in order to define, implement, coordinate and monitor the action

50
needed to ensure that the Group’s banks and companies complied with Basel II by the time the new regulations came into force. In this regard, the Group along with the vast majority of the banking system, decided to adopt the new prudential regime from 1 January 2008. As already described in previous Reports on Operations, this project comprised two macro areas: Compliance with Basel II and Development of rating systems. The Banca Popolare di Vicenza Group has adopted the standard methodology for credit and market risks and the basic methodology for operating risks, since it belongs to “class 2”.
In terms of Compliance with Basel II and, in particular, the Second Basel II Pillar, the process of checking the overall exposure of intermediaries began at the start of 2008, together with the checks on the self-assessment by the Parent Bank, on behalf of all Group banks and companies, of their capital adequacy (ICAAP). The resulting first Statement on the Internal Capital Adequacy Assessment Process (ICAAP) is described in the section on “Activities of strategic importance”.
The development of rating systems is described in relation to the Credit area.
With regard to the Market in Financial Instruments Directive (MiFID), work continued during 2008 on the adoption and consolidation of this directive throughout the Banca Popolare di Vicenza Group, having regard for the related regulatory changes. Actions involved the launch of a free investment consultancy service available to all customers, review of the product range for consistency with regulatory requirements and business objectives, the development of procedures for managing conflicts of interest and internal Group operations, as well as the improvement of procedures to make IT applications more efficient while continuing to comply with regulatory requirements. Work also continued on the refinement of operating processes, the design and development of the “advanced” consultancy service, and the monitoring of contract completeness.
Lastly, in compliance with the supervisory instructions for banks regarding the regulations issued by the Bank of Italy, the Board of the Parent Bank created a Compliance function in late January 2008, tasked with monitoring and managing at Group level the risk of non-compliance with laws and self-imposed regulations (articles of association, codes etc.). See the section on “System of strategic controls and auditing” for a description of the objectives and activities of the new Compliance function.
Finance
As discussed in the 2007 Annual Report and the Half-year Report at 30 June 2008, work was completed during the year on the strategic review of the business model. This was performed to ensure that Group banks and companies attain significant qualitative and quantitative results by sharing their specific skills, all highly correlated, in the areas of asset management, financial services, wealth management, and the management of Group offerings to the VIP segment. Following this review, in March 2008 the Board approved the new organizational structure which has involved dividing the Finance area into three separate departments (Global Markets, Wealth Management, Private Banking) with their own specific internal controls and reporting lines, regardless of business function. The management and monitoring of market risks has also been simplified and made more efficient via the definition of a new hierarchy of operational portfolios.
Lending
With regard to the development of rating systems as part of the broader Group Basel II project, new rating models for the corporate and retail segments have now been introduced. These were developed during 2007, drawing on the databases held by the entire banking group, with support from leading Italian consultancy firms. Fully automated statistical models have been devised for

51
private, small business and small corporate customers (with sales of up to 2.5 million euro), while the model for mid corporate customers (with sales of between 2.5 and 50 million euro) has been supplemented with a “qualitative” module and includes the ability to amend the counterpart rating, partly with reference to group membership criteria. Lastly, for larger corporates (with sales in excess of 50 million euro), an ad hoc model has been developed that envisages a more judgemental component, with assessments made by highly experienced personnel. Following a test period of 5 months, the new rating models were integrated within the Electronic Credit Approval Platform for use within the lending process by the entire BPVi Group network from April 2008.
In addition, as part of the review of rating models to enhance the tools previously in use, development work has been completed on the new early warning model of credit performance, which takes account of internal data and operational experience as well as the new rating models. Subsequent to the introduction of these more reliable tools that take account of internal experience and information, work is now proceeding on the definition and update of the rules and the process for classifying positions into the various operational states. The result will be to limit the discretion allowed to employees, consistent with the new credit management policies.
With regard to the management of lending anomalies, work has commenced on a revision of the organizational structure and processes for credit recovery, as well as on the industrialization of the anomaly management processes, adopting different approaches based on value/customer risk and using supporting tools on an ad hoc basis. In particular, the regulations for the administration of non-performing loans were updated and supplemented during 2008, while the new procedure for the active management of non-performing loans is scheduled for introduction in early 2009.
Lastly with regard to Lending, the analysis of loan applications has now been pushed down to the Territorial Areas. This activity was previously performed by central functions at each Group bank (so-called Loan Labs). The problems of inconsistent methodologies and processes that led to the centralization of these functions were deemed to have been overcome in 2008. Accordingly, a project to reorganize them was started and completed, with a view to improving credit culture within the sales network, ensuring on-site collaboration and support for the network organization, and guaranteeing proper control over credit risk. The new decentralized functions, known as “Area Lending”, are coordinated by a person within the Lending function, who also provides guidance on credit management (including credit policies, decisions and opinions on loan applications). These units report functionally to the Area Managers with regard to their objectives for efficiency, credit quality and the development of network credit management skills.
Logistics, Purchasing and Security
Various activities were completed during the year in relation to health and safety at work. These included completion of the “risk assessment” at all Parent Bank locations (including the 61 branches acquired from the UBI Banca Group) and preparation of the related “Improvement plan”. In addition, the principal requirements/improvements envisaged by the new “Consolidated law on health and safety at work” (Decree 81/08, replacing Decree 626/94 as amended) have also been identified and implemented, including the provision of safety training (how to deal with hold-ups, fire prevention, first-aid). Lastly, a new “post hold-up” procedure has been prepared and implemented. This classifies such action between “serious” and “not serious”, depending on its gravity, and makes “post event trauma assistance” available on a voluntary basis with support from the doctor concerned.
Other work performed in relation to security has included the preparation and issue of a new Group Safety Manual, following update of the security features and insurance cover at each branch; branches deemed to be at higher risk of theft (especially those acquired from UBI Banca and those recently

52
opened) have also been equipped with new generation “Cash-in Cash-out” safes. Relations with the police forces have been strengthened by signing a “Protocol of understanding for the prevention and repression of crime” and, in general, security standards at the branches acquired from the UBI Banca Group have been aligned with those of BPVi (alarm systems, access control, strong equipment, transport of valuable, security signage, anti hold-up training, surveillance, etc.).
The use of VoIP fixed line telephony has been tested at 19 BPVi branches, using the data transmission lines that are part of the technological infrastructure that links the Parent Bank with Sec Servizi. This experiment was successful and all BPVi telephone traffic will be moved over to VoIP technology during the first half of 2009.
Lastly, pursuant to point 26 of the “Technical document on minimum security measures”, attachment B to Decree 196/2003 (“Privacy Code”), it is confirmed that the “Security Planning Document” is kept up to date on a periodic basis. This document describes the measures taken to guarantee the privacy of the personal data processed.
Information Technology
The principal activities carried out within the Information Technology area included the implementation and introduction of new infrastructure. This has optimized the data traffic over the network used by BPVi, via the replacement of servers at branch level with servers installed at the SEC Servizi consortium. This activity involved all the branches acquired from the UBI Banca Group and has recently been extended to other branches with obsolete servers. The new infrastructure will be extended in future to the other Group banks. Following the same logic, but using different technology, the virtual workplace concept has been introduced for personnel who work on the move and who therefore need remote access to the branch system.
The IT systems used by Farbanca were improved and migrated during the year, involving the provision of technical/systems support at the time of the move.
Lastly, implementation of the “New Branch System” project began in September 2008, with a view to introducing innovations to users of the network and optimizing operational processes at branch level. Analysis and development activities included:− designing the new desktop in the form of a Web Home Page Web accompanied by new tools,
commercial information and operational warning messages, − releasing the new “Commercial Platform” that allows the adoption of new commercial approaches
and ways to sell products and services, thus accelerating both operational and consultancy activities,
− introducing the advanced ATM, which will have many more functions in future,− creation of a unified dashboard for the management of all conditions, regardless of the originating
application.
At the end of 2008, the New Branch System was already installed at 31 BPVi branches, 1 branch of Banca Nuova and 1 branch of Cariprato. The system will be rolled out to the rest of the Group network progressively during the year.

53
THE SYSTEM OF INTERNAL CONTROLS AND AUDITING
The system of internal controls and audit functions
The System of Internal Controls comprises the collection of rules, procedures and organizational structures that seeks to ensure compliance with business strategies and the achievement of effective and efficient business processes, ensure the safeguarding of assets and protection from loss, ensure the reliability, completeness and accuracy of accounting and operational information, and ensure that transactions comply the law, supervisory regulations and internal instructions. The system of internal controls is an integral part of the daily activities of the Group’s banks and companies and operates on three levels:
− line controls (first level): designed to ensure that transactions are carried out properly. These controls are performed within the same production unit (e.g. hierarchical controls) or are included in the procedures and information systems, or are carried out as a back-office activity;
− second-level controls: these controls are performed by functions outside of the production unit and are intended to:• contributetothedefinitionofmethodologiesforthemeasurementofrisk,checkcompliance
with the limits granted to the various operational functions and check the consistency of the transactions carried out by each production unit with the risk/yield objectives allocated to them. These activities are assigned to the risk management function.
• contributetothedefinitionofmethodologiesforthemeasurement/assessmentofcompliancerisk, identify suitable procedures for preventing the risks identified and request their adoption. This activity is assigned to the new Compliance function described below.
• certifycorporateaccountinginformationinaccordancewithlegalrequirements.Thisactivityisperformed by the authorized executive.
− Internal audit activity (third level): designed to identify anomalous trends, violations of procedures and regulations, and evaluate the functioning of the system of internal controls, taken as a whole. This work is carried out on a continuous, periodic or exception basis by functions other than independent of the production units, and includes on-site inspections (as required by the Supervisory Instructions, Book IV, Chapter 11, Section II).
A significant overhaul of the Group’s internal audit activities was carried out in 2008 with a view to redefining the role performed by this function within the Group. The most significant elements of the reorganization included, in the first place, the split of the internal audit function into two distinct organizations: Inspection and Audit. The Inspection team is tasked with checking behavioral compliance with procedures, internal regulations and corporate standards throughout the branch network; in this context, the established methodology based on the inspection of individual processes (lending, finance and operations-accounting) was modified, with the adoption of full branch-level inspections (covering all the various business processes) in order to formulate an overall opinion about the branch concerned. The Audit team on the other hand is focused on the performance of direct verification to assess the functioning of rules, processes and the organizational structure intended to monitor all forms of business risk.
Actions taken as part of the above reorganization included the preparation of a plan to strengthen the Internal Audit team, with a view to improving the effectiveness of checking activities and inspections in particular, and introduction of the role of Internal Audit Manager to the BPVi Group’s other banks and companies. This person reports to the Manager of the Parent Bank’s internal audit function and is the point of reference on internal audit matters for the Group’s supervision, management and control bodies. A project has been activated as part of work to implement the Business Plan 2008-2011, with a view to preparing the tools and methodologies to be applied by

54
the internal auditors (inspection guides, checklist, audit tracking tools, methodology for assessing the system of internal controls etc.).
Lastly, the reorganization also affected the structure and responsibilities of the Control Committee. In particular, the responsibilities associated with the management of the model pursuant to Decree 231/01, previously attributed to the Control Committee, have now been attributed to a specific Supervisory Body comprising two external members and the Manager of the Internal Audit function; in addition, the responsibilities attributed to the Control Committee have been revised, in order to adopt the new Supervisory Instructions on the Basel II principles (circular 253/2006) and the organization and governance of banks (circular dated 4 March 2008). The changes regarding the Control Committee and the Supervisory Body 231/01 were later adopted by the Group’s other banks having regard for their specific situations. With regard to the activities of these two bodies at the Parent Bank during 2008, the Control Committee met 9 times and its analysis included assessment of: the action taken to align the Bank with the anti money-laundering and Mifid regulations; the audit work performed on processes and central functions; the checks on and analysis of the branch network performed by the Internal Audit department; the risk profile of the loans portfolio; the trends in market risk, and the first ICAAP statement. The Supervisory Body 231/01 met 6 times and focused, in particular, on its own Regulations; analysis of the Organizational Model for prevention of the crimes referred to in Decree 231/2001; analysis of the Parent Bank’s regulatory and procedural framework with regard to the new Consolidated Law on Safety at Work, Decree 81/2008 (formerly 626/1994), and in relation to Decree 231/2007 adopting Directive 2005/60/EC on prevention of the use of the financial system for recycling the proceeds of criminal activities and for the financing of terrorism. Lastly, as described in the section on activities of strategic importance, during the year BPVi was charged with administrative improprieties, pursuant to arts. 5 (para. 1.a), 6, 25-sexies, paras. 1 and 2 of Decree 231/2001, for not having adopted and effectively implemented organizational and management models suitable for preventing the alleged crime notified to the Chairman, Giovanni Zonin, and Divo Gronchi who, together with other banking personnel, are claimed to have promoted, conducted and taken part in a hidden build up of capital in Banca Nazionale del Lavoro. See the “Other information” part of the section on activities of strategic significance for a more detailed description of the charges.
The Inspection team carried out 605 routine inspections of the BPVi Group’s branch network during 2008, including 330 at the Parent Bank, 120 at Cariprato, 151 at Banca Nuova and 4 at Farbanca. This work was accompanied by activity to obtain information or form an opinion about special circumstances, such as hold-ups, suspected internal or external fraud, analysis of the causes of lending disputes, evaluation of customer transactions etc. The checks envisaged by the regulations that require suspected money laundering transactions and market abuse to be reported are also performed in this context. Turning to the audit of processes and central functions by the Audit team, a series of processes and sub-processes were analyzed at Group level during 2008. This work involved Lending, Finance and ICT, Governance and Support, and operational processes (e.g. the management of savings books, certificates of deposit, credit and/or debit cards).
The complaints received were treated as usual in accordance with the “Rules for the management of complaints”, which call for an in-depth analysis of each case.. Consistent with these rules, complaints were drawn to the attention of the Complaints Committee, which met 13 times during 2008. Adequate provisions have been made in relation to the contingencies associated with the complaints, as discussed in the related section of the explanatory notes. Group banks received a total of 2,012 complaints during 2008 (1,428 BPVi, 297 Cariprato, 286 Banca Nuova, and 1 Farbanca), of which 1,587 (78.9%) related to ordinary banking activities and 425 (21.1%) to investment services. About 40% of the complaints relating to ordinary banking activities related to requests for reimbursement due to cloning, theft or loss of debit cards. The Group’s banks are not directly responsible for these losses incurred by customers. In certain cases, reimbursements are “advanced” if the related insurance indemnities have not yet been paid out.

55
Compliance Function
As described earlier, the Compliance function performs second-level control activities for the purpose, envisaged in the regulations (Supervisory Instructions no. 688006 dated 10 July 2007 entitled “The compliance function”), of preventing and managing the risk of non-compliance with the regulations, in order to safeguard the good name of the Parent Bank and the Group and the confidence of the public in the propriety of their operations and management. To this end, the function identifies, assesses and manages the risk of regulatory violations, and ensures that internal procedures are consistent with the objective of preventing the violation of laws, external regulations and self-imposed rules (codes of conduct, ethical codes) applicable to BPVi and to the Group.
The Compliance function was established by the Board of the Parent Bank on 29 January 2008. The project to activate the function commenced on that date, bearing in mind the criteria of efficiency and proportion with respect to scale and operational complexity, drawing on the synergies between the various functions and eliminating unnecessary duplications. The first part of the year was therefore dedicated to designing the function in terms of its organizational model and structure, resources and methodologies, as well as the identification of possible relations with other business functions and teams. This project also involved the other banks in the BPVi Group, Prestinuova and the asset management companies. During the second part of the year, actions were taken to strengthen and stabilize the function and a series of compliance-related activities were performed. Typical compliance function activities (assessment of the risk of non conformity) essentially comprised making assessments in relation to the “Management of conflicts of interest regarding the governance and obligations of banking personnel and related parties”, the management of the depositary bank and the analysis of the proper completion of portfolio management contracts. At Group level, the function verified compliance with internal regulations and that all responsible persons at Group companies were involved in the assessment work, in order to assist the Parent Company by highlighting specifics in relation to applicable regulations, processes, procedures, functions and internal regulations.
Risk Management
This section of the report provides significant information about the activities/results of the Group during 2008 with regard to the management of typical banking and financial risks, with special reference to the risk management function. Further details and quantitative information is provided in “Part E” of the explanatory notes entitled “Information about risks and the related hedging policies”.
The purpose of the risk management function is to measure and check risk (credit, market, rate, liquidity and operational) on behalf of the Parent Bank and the Group, supporting the delegated functions in determining parameters and methods for the definition of objectives, as well as in the assessment of risk/return and other results. This mission involves:− the definition and development of models and tools for the measurement and control of
risk at Group level, as well as the systematic and ongoing verification of the adequacy of the risk management models and tools used, while also monitoring changes in the regulatory guidelines that influence risk management activities, including reference to the matters involved in applying Basel II.
− verification that the risk profiles of the Group’s banks and companies comply with the limits established by the respective Boards of Directors.
In particular, with reference to credit risk, the risk management function develops rating and scoring models, and takes part in the definition at Group level of methodologies for estimating the general and specific provisions needed with reference to the related components of risk. More generally,

56
the function also provides support for the definition of measurement methodologies for accounting purposes. Additionally, a dedicated organizational unit monitors changes in the risk profile of the loans portfolio at a consolidated level and for each Group bank.With regard to market risks, the main activities of the risk management function are to propose, together with the finance function, a system of VaR and operational limits that are consistent with the propensity to accept risk expressed by the Board. The function also monitors compliance with these limits, validates and documents the sources of and the processes for gathering market data, and determines and validates the methodologies and criteria adopted for pricing the financial instruments used by various entities within the Group.
In relation to rate and liquidity risks, the risk management function develops strategic ALM models and tools, and produces daily operational maturity ladders and monthly structural maturity ladders, while also analyzing, maintaining and developing the reports that are generated. The function guarantees coordination with the authorized functions within other Group banks and companies.
Lastly, with regard to operational risk, the risk management function develops and maintains a system for the identification of operational risks, with particular reference to the process of self-assessment, and determines how to collect data on the operational losses incurred at Group level.
Risk profile of the BPVi Group
Consistent with the self-assessment of capital adequacy and changes in the operating environment, the Board of the Parent Bank determines the Group’s propensity to accept risk each year as part of the strategic planning and budgeting process. The BPVi Group’s propensity to accept risk was determined in terms of both a target level of capitalization for the Group, by fixing minimum levels for both the Tier one ratio and the Total capital ratio, and a target external rating, by defining an objective for the outlook rating attributed to the Parent and the Group by the rating agencies. With regard to the first and most significant aspect, the level of capitalization, the BPVi Group took account of the changing macroeconomic and sector conditions when approving the 2009 budget, requiring the Tier one ratio and the Total capital ratio to remain consistently above 6.5% and 10.5% respectively. This is higher than the minimums specified by the Supervisory Authorities. In terms of the target rating, the ongoing objective is to maintain the current short, medium and long-term ratings expressed by the rating agencies.
Credit risk
The BPVi Group has defined credit risk as the risk of loss due to an unexpected deterioration in the creditworthiness of a borrower, whether following contractual non-performance or otherwise. Counterparty risk is included in this context, being the risk that the counterparty to a transaction involving specified financial instruments will default prior to settlement, as is concentration risk, being the risk deriving from a concentration of exposures in the portfolio of loans to counterparties or groups of counterparties operating in the same economic sector, industry or geographical area.
In order to support the management of credit risk, the BPVi Group has implemented an internal rating system that has been integrated with its business processes and assists with the assessment of creditworthiness. The internal rating represents a summary assessment, for the coming year, of the credit quality of the customer expressed as a probability that the counterparty may become insolvent. This assessment is expressed on an internal scale of 11 rating classes. A probability of default is associated with each rating class. The rating classes are ordered as a function of credit risk: moving from a lower risk class to a higher risk class means an increase in the probability of default by the debtor.

57
The BPVi Group has decided to develop internal rating models that primarily cover the types of counterparts with which it usually works and to which it is most exposed: retail (private customers and small businesses), small corporate (sales between 2.5 and 50 million euro) and mid corporate (sales between 50 and 200 million euro). The new models for the various segments were completed and put into practice during 2008. The rating system for the corporate segment, used on an experimental basis by the Parent Bank’s Loan Lab, has been subjected to a planned revision with reference to the customer database and qualitative information, resulting in improved performance. Work has also been completed on the new internal rating model for the retail segment (private customers and small businesses). Both models have been tested by analysts at the Parent Bank and, with regard to the corporate segment, at Banca Nuova and Cariprato. This testing provided comforting results in terms of the consistency of the output from the models with the assessments made by the experts. Accordingly, the models became operational from the end of April 2008 throughout the Parent Bank’s commercial network, and from the beginning of June at Banca Nuova and Cariprato. Companies with sales of more than 200 million euro are currently excluded. Implementation of the model for this segment, based largely on actual experience, is now at an advanced stage at various functions within the Parent Bank.
Routine monitoring is based on the performance scoring system used by the three banks within the Group. This is known as SGR (meaning risk management system) and is used to check on the performance of lending relationships. This tools assigns a monthly score to loan positions in excess of 200 euro outstanding with private customers and businesses, and automatically proposes a classification of customers into three classes of increasing risk: “performing”, “ under observation” and “high risk”. In addition to this, the system considers the relations between customers, tracks discussions between account managers and the control bodies, and manages the entire process of classification, authorization and verification of the related powers. Backtesting and monitoring of the model has identified that the environmental rating system has a certain predictive ability, considering the defaults observed over a period of one year. The system is now undergoing profound revision in order to make the tool more effective and timely in the identification of anomalous events, and to integrate it with the new internal rating models. Without altering the current SGR tool and thus protecting the network from operational problems, the new system for the identification of anomalies has already been fully programmed and, following a test phase, will become operational during the first half of 2009.
In support of credit management activities, “Credit Policies” also came into force within the Parent Bank’s network in October 2008. These govern how the Parent Bank intends to accept credit risk in relation to its customers and cover both granting/renewal and the credit management phase. The purpose of the policies is to facilitate the balanced growth of lending to lower risk customers and limit lending to customers that are less creditworthy. In particular, four different credit policies have been identified: development, operations and protection, rebalancing and withdrawal. The assessment is made by the authorized functions, while the system automatically establishes, based on internal rating and environmental score, the powers of the network authorization committees based on the level of risk (lower powers in the case of high risk and greater powers in relation to more creditworthy customers).See the section on credit risk in “Parte E” of the explanatory notes for more details about the above and other quantitative information.

58
Market risk
The BPVi Group has defined market risk as the risk of adverse changes in the value of its exposure to financial instruments included in the trading portfolio for supervisory purposes, due to unfavourable changes in risk factors (interest rate, exchange rate, market prices, credit spread, commodity prices) and their volatility.
For some time now, the BPVi Group has quantified market risk and, as a consequence, set operating limits by using a Value-at-Risk model derived from historical simulation. In short, VaR is a statistic measure that indicates the maximum potential loss on an investment in a given period of time. The current process for determining VaR involves estimating the portfolio risk, with a time interval of one day and a 99% confidence interval, with reference to historical market changes. A quantitative analysis relating to 2008 is presented in “Part E” of the explanatory notes. Since this is an estimate, the above internal system for the measurement of risk is subjected to backtesting in order to assess the forecasting efficiency of the VaR results. This involves comparing the loss estimated by the model with the profit & loss effect of measuring the positions using actual market data. In addition, a stress test is performed to assess the ability, in terms of capital availability, to absorb the effects of significant market shocks. This involves re measuring the portfolio using extremely adverse risk factors, as well as remeasuring it using historical market crash scenarios (e.g. the terrorist attack on 11 September 2001, the failure of Lehman Brothers etc.). The stress test therefore complements the VaR and measures the potential vulnerability to exceptional, but nevertheless plausible events.
Compliance with the limits set for VaR during the budgeting process should cap, within the established confidence interval, the maximum daily loss. An individual unit may comply with the established limits on daily VaR and report losses over a period of days that fall within these limits; however, the sum of the losses accumulated over a given period of time may still be deemed excessive. This risk is tackled by associating indicators with the daily VaR limits designed to monitor any losses arising over longer periods (Stop Loss). This represent the maximum allowed loss that can be accumulated over a given period of time (one month and the entire year), at a given level of authorization, without the need to take specific action. Lastly, for completeness, additional operational limits have been defined in terms of sensitivity, delta, vega, concentration and credit risk.
The risk management function is responsible for the quantification and control of the VaR limits, while the Financial Control function within the Finance Division is responsible for the daily checking of operational and stop-loss limits.
During the year, the risk management function carried out the routine monitoring of the VaR limits that were, as usual, revised at the time of preparing the budget. This work was performed for both the Parent Bank and BPV Finance using the system based on the Murex VaR model. The Group has in fact migrated to a single system (Murex) for the calculation of risk, with a view to obtaining a consistent view of the underlying risk factors from the application of consistent methodology. This decision has a double advantage. The same position keeping system can be used for both the measurement and management of risk, while obtaining significant operational synergies with such activities as backtesting and stress testing.. In addition, operational risks have also been reduced as a result of no longer having to replicate in an external system the positions and deals contained in the Group’s official system.
Interest-rate risk
Interest-rate risk may be defined as the current and prospective risk of volatility affecting profits or equity due to adverse changes in interest rates. Interest-rate risk is associated with asset and liability positions within the banking portfolio and mainly derives from the transformation of maturities.
59
In particular, it is generated by the mismatch between interest-earning assets and interest-bearing liabilities in terms of volume, maturity and rate.
The Group’s exposure to the change in the interest-rate curve is monitored each month using ALMPro, an asset and liability management tool, which measures in “static” conditions the effect on the financial margin and equity of a change in interest rates. Operational and strategic decisions regarding the banking book by the Finance and ALMS Committee are designed to minimize the volatility in net interest income expected in the financial year (12 months) and so minimize the volatility in total equity value when interest rates change. The project to revise the methodologies adopted for the measurement of financial risk was completed at the end of 2007. With regard to interest-rate risk, the decision was taken to migrate from the previous platform to the ALMPro System from Prometeia, a sector leader, with a view to adopting a tool with more structured input processes that allows for the implementation of a dynamic model so that more realistic simulations can be made using diverse scenarios. The BPVI Group’s exposure to interest-rate risk has been reduced significantly following completion of the project work, the introduction of a new internal model for demand positions with customers and the activation of hedge accounting tools and processes. These last were approved by the Parent Bank’s Board on 3 June 2008 and used for the first time in July 2008 in order to hedge the Bank’s long-term fixed rate loans.
The Parent Bank’s Board is ultimately responsible for the management of interest-rate risk, as assisted by the Finance and ALM Committee and the business functions responsible for the strategic and operational management of such risk, both at Group level and at all companies within the Group. The Parent Bank’s Board approves the strategic guidelines and operational limits proposed by the Finance and ALM Committee, and is periodically informed about changes in the exposure to interest-rate risk and the way it is managed.
The risk management function inputs a complex and continuous flow of data into the Asset & Liability Management system, and is also responsible for reporting and the monitoring of operational limits. Lastly, the Finance Division is directly responsible for the operational management of interest-rate risk.
In order to mitigate its exposure to interest-rate risk, the Group arranges specific hedges for bonds issued at fixed or structured rates, in order to reduce the duration of the liabilities and fix the cost of structured issues. The hedge accounting tools and processes needed for the specific hedge of clusters of similar fixed-rate loans were defined during the first half of 2008. The hedges arranged during the second half of 2008 covered loans that mature after more than 10 years, which do not benefit from the natural hedge generated by the inelastic core component of demand deposits from customers.
Further details and quantitative information are provided in the section on credit risk in “Part E” of the explanatory notes.
Liquidity risk
The BPVI Group has defined Liquidity as the risk of being unable to meet payment obligations caused by inability to obtain funding (funding liquidity risk) and/or the presence of restrictions on the ability to sell assets (market liquidity risk). This risk can also take the form of a loss relative to fair value deriving from a forced sale of assets or, more generally, of a loss in terms of reputation or business opportunities. Funding liquidity risk is incurred in banking activities when institutional counterparties withdraw their usual funding, or request a significantly higher return than in normal circumstances. Market liquidity risk on the other hand relates to the risk that the Group may be unable to sell an asset, except at a capital loss, due to the illiquid nature of the market and/or due to the timing required for the transaction.

60
The exposure of the financial system to liquidity risk and the consequent, sometimes dramatic impact that this risk may have on banking activity emerged with unexpected intensity during 2008. Given this experience, liquidity risk has been classified among the killer risks, being those that have a low probability of arising but which may have major consequences for the operations of the intermediary. During the past year, the financial crisis that began in the US sub-prime mortgage market during 2007 generated, in fact, a widespread and dangerous international crisis of confidence among financial intermediaries. This essentially blocked the functioning of the interbank market, causing serious funding difficulties for financial intermediaries. This crisis of confidence then transformed into a dramatic liquidity crisis which forced the international banking system to rapidly recapitalize and restrict the criteria for the granting of loans. Given events of this gravity, governments and central banks reacted with massive and, for the first time, coordinated action designed to re-establish confidence in the markets, ensure the continuity of lending to financial institutions and to the economy, and extend and strengthen the guarantees for depositors. The effect of the various actions taken has been to reduce market rates to particularly low levels, even if the differential between the rates for unsecured loans(Euribor) and those for secured loans (Eurepo) highlights the ongoing high level of risk in the interbank market.
In this context, the BPVi Group reacted promptly via a careful and diversified funding policy, with a progressive move towards longer maturities for its interbank funding while avoiding significant exposures in the very short term. In order to contain market liquidity risk, steps were also taken to sell the less immediately liquid investments in the trading portfolio. In addition, a new securitization of residential mortgages was arranged in November 2008, as described in the section on activities of strategic importance, mainly to increase the quantity of instruments available as collateral for intraday advances. This securitization has enabled the Group to fund lending at relatively competitive rates at a time of liquidity stress. The arrangement of funding repurchase agreements with the ECB and direct customers has broadened the sources of finance with respect to the interbank market, especially considering the recent issues of liquidity by the Central Bank via an unlimited volume of fixed-rate (TUR) repo transactions.
With regard to the way liquidity risk is managed, the BPVi Group approved a policy in October 2008 that describes the methodologies for the measurement of risk, the roles and responsibilities of the committees and business functions involved, and the related management reports. The guiding principles underlying the model for the governance of liquidity risk are:- liquidity is managed on a centralized basis by the Parent Bank;- the Parent Bank’s Board is responsible for preparing guidelines for the management of liquidity
and the related risk, and delegates the task of defining strategic guidelines and the related operational management to the operations committee and the authorized business functions.
In particular, short-term liquidity (less than 12 months) is managed using the operational maturity ladder, which determines the mismatch between expected cash inflows and outflows in each time period. The accumulated mismatch is used to calculate the net financing requirement / surplus over the various time horizons considered. Medium/long-term liquidity is managed, on the other hand, using the structural maturity ladder which evaluates the equilibrium between assets and liabilities, not only in terms of the related cash flows, but also and above all with reference to the related balance sheet ratios. The objective is to maintain a sufficiently balanced profile of structural liquidity, placing restrictions on the possibility of financing medium/long-term assets with liabilities whose duration is not consistent.
The operational management of liquidity risk is entrusted to a dedicated function within the Finance Division, whose objective is to maintain the best balance between the medium-term maturities of loans and short-term funding, taking care to diversify it by counterparty and maturity arranged over the counter and in the interbank deposits market. In addition to the usual banking treasury activities (daily monitoring of the Group’s liquidity and optimization of its short-term
61
management), any medium and long-term imbalances are managed using appropriate funding policies established by the Finance and ALM Committee.
Operational risks
Operational risk is defined as the risk of losses deriving from inadequate or dysfunctional procedures, human resources or internal systems, or from external events. This category includes losses deriving from fraud, human error, the interruption of operations, the non-availability of systems, contractual non-performance and natural catastrophes. Operational risk also includes legal risk, but excludes strategic and reputation risk.
Back in 2006, the Parent Bank launched the “ORM” (Operational Risk Management) project as part of work to adopt the Basel II requirements. The objective of this project was to define an integrated framework for the measurement and management of operational risks, with a view to working gradually towards the requirements for adoption of the standardized method. During 2007, work on this project resulted in completion of the following phases: “Classification and Risk-mapping Models”, “Policy and Governance in the Operational Risk Management process” and “Self Risk Assessment”. The “Operational Risks Manual – Loss Date Collection” was also issued. During 2008, the work performed for the Parent Company, was repeated at a local level for Banca Nuova and Cassa di Risparmio di Prato, in order to enable operational risks to be managed at Group level. This work was completed in June 2008 with the adoption by the two subsidiaries of the “Operating Risks Manual – Loss Date Collection”, while the process of extending risk self-assessment activities to the subsidiaries is still in progress.
With regard to the monitoring of operational risks, the Parent Bank was a founding member in 2002 of DIPO, the interbank consortium promoted by ABI that maintains an Italian database of operational losses. As a consequence, the Group gathers regular information about its operational losses. The reporting of such losses continued during the year, benefiting in terms of completeness of the information gathered, from the improved organization of the process following issue of the manual. Commencing from the June 2008 reporting date, Banca Nuova and Cariprato gather information in the same way as the Parent Bank following the above extension of activities and adoption of the related manual. With regard to the way operating risks are managed, the internal audit function carries out remote and on-site checks of the distribution network to verify the consistency of their behavior with corporate standards (in essence: proper application of the regulations and proper performance of line controls).
Quantitative information about the operational losses identified for DIPO purposes is presented in “Part E – Operating Risks” of the explanatory notes.

62
Information about the exposure to high-risk financial products (pursuant to the recommendations on transparency issued by the Financial Stability Forum - FSF)
The turbulence in the international financial markets from August 2007, caused by the increasing number of insolvencies linked to US sub-prime mortgages, resulted in a general distrust by operators of a vast range of structured credit products. This meant that the markets for these products became highly illiquid and credit spreads widened. Market confidence was further eroded by the inadequate information provided by certain financial intermediaries, which did not always provide sufficient information about the nature of their on and off balance sheet exposures to those instruments and the related level of risk.
With a view to encouraging the gradual return to normal market conditions, the report of the Financial Stability Forum (FSF) issued on 7 April 2008 called on financial institutions to provide broad and detailed information about their exposures to certain instruments deemed by the market to be high risk. The report also called for information about the risks accepted by trading, whether directly or via vehicle companies or other non-consolidated entities, in such structured credit products as Collateralized Debt Obligations (CDO), residential mortgage-backed securities (RMBS), commercial mortgage-backed securities (CMBS), other special-purpose entities (SPE) and leveraged finance.
Considering these issues, Bank of Italy communication no. 671589 dated 18 June 2008, entitled “instructions about market information”, invited banks to comply with the FSF’s transparency recommendations on a complete and timely basis.
Consistent with this invitation from the Supervisory Authorities, the following disclosure are provided about the Group’s exposure to the above financial products.
Exposure to structured credit products deriving from securitization transactions originated by the Group.
Exposure to special-purpose entities (SPE)
Between 2000 and 2008, the BPVi Group has arranged seven securitizations of its performing portfolio of mortgages:Berica MBS Srl, Berica 2 MBS Srl, Berica 3 MBS Srl, Berica Residential MBS 1 Srl, Berica 5 Residential MBS Srl, Berica 6 Residential MBS Srl and Berica 7 Residential MBS Srl.
In addition, prior to joining the BPVi Group, Cassa di Risparmio di Prato had securitized performing mortgages under the name of “Siena Mortgages 02-3 Srl”.
All the above securitizations were carried out pursuant to Law 130/1999 via the formation of a special-purpose entity (SPE) to which the securitized assets were sold without recourse. None of the above SPEs has been consolidated, since the conditions envisaged by IAS 27 and SIC 12 do not apply. Nevertheless, with regard to the securitizations denominated “Berica 5 Residential Mbs”, “Berica 6 Residential Mbs” and “Berica 7 Residential MBS”, arranged subsequent to 1/1/2004, the residual securitized assets and related liabilities have been written back to the balance sheet, and the related asset-backed securities (ABS) held have been eliminated, since the conditions envisaged by IAS 39 for the derecognition of such assets and liabilities were not met because the Group continued to hold the junior tranche of the ABS issued by the vehicle companies.
The most recent multioriginator securitization, “Berica 7 Residential MBS Srl”, was arranged on 1 October 2008 via the sale without recourse of performing mortgages by the Parent Bank, Banca

63
Nuova and Cassa di Risparmio di Prato to Berica 7 Residential MBS Srl, the special-purpose entity formed for the transaction. Mortgage loans totaling 1,012.8 million euro were sold. The transaction was completed in November with the issue of ABS totaling 1,005 million euro (senior notes of 930 million euro and junior notes of 75 million euro) which were taken up in full by the originating banks. The purpose of the transaction was to obtain ABS usable as collateral for funding repo transactions with the European Central Bank.At 31 December 2008, the cash exposures to SPEs in relation to securitization arranged by the Group are summarized below:
The senior tranches subscribed for and/or repurchased by Group banks were used for refinancing purposes with the European Central Bank.At the same date, the “off balance sheet” exposures towards the above SPEs related to the margins available on lines of credit totaling 11.4 million euro, which were granted to the SPEs solely for use under difficult conditions.
Isin code Description Tranche Rating S&P Rating Rating Classification(1)
Book Moody’s Fitch value
IT0004432222 BERICA 7 MBS MBS A (2) Senior AAA n.a. n.a. L&R 930,000,000IT0004013790 BERICA 6 RES MBS A2 (2) Senior AAA Aaa*- AAA L&R 144,232,047IT0003765176 BERICA 5 RES MBS A (2) Senior AAA n.a. AAA L&R 60,715,556IT0003641005 BERICA RES MBS 1 A Senior AAA n.a. AAA L&R 1,129,641IT0004013824 BERICA 6 RES MBS D (2) Mezzanine B+ B1/*- n.a. L&R 8,565,000IT0003765184 BERICA 5 RES MBS B (2) Mezzanine A n.a. A L&R 4,000,000IT0003765200 BERICA 5 RES MBS C (2) Mezzanine BBB n.a. BBB L&R 16,897,000IT0003641047 BERICA RES MBS 1 C Mezzanine BBB n.a. BBB L&R 8,478,281IT0003422117 BERICA 3 MBS B Mezzanine A+ n.a. A L&R 5,559,984IT0003422141 BERICA 3 MBS C Mezzanine BBB n.a. BBB L&R 3,593,176IT0003247530 BERICA 2 MBS B Mezzanine AA- n.a. A+ L&R 3,353,321IT0003247563 BERICA 2 MBS C Mezzanine BBB n.a. BBB L&R 4,083,919 BERICA 6 RES MBS E (2) Junior n.a. n.a. n.a. L&R 1,118,725 BERICA 7 MBS MBS B (2) Junior n.a. n.a. n.a. L&R 21,287,538IT0004432230 BERICA 7 MBS MBS B (2) Junior n.a. n.a. n.a. AFS 75,000,000IT0004013832 BERICA 6 RES MBS E (2) Junior n.a. n.a. n.a. AFS 4,600,000IT0003765218 BERICA 5 RES MBS D (2) Junior n.a. n.a. n.a. AFS 35,400,000IT0003641054 BERICA RES MBS 1 D Junior n.a. n.a. n.a. AFS 22,921,951IT0003422158 BERICA 3 MBS D Junior n.a. n.a. n.a. CFV 8,443,409IT0003247571 BERICA 2 MBS D Junior n.a. n.a. n.a. CFV 5,691,848IT0003112254 BERICA MBS D Junior n.a. n.a. n.a. CFV 2,941,797 BERICA RES MBS 1 D Junior n.a. n.a. n.a. L&R 3,374,762 SIENA MORGAGES 02-3 Junior n.a. n.a. n.a. L&R 1,208,883
Total 1,372,596,837 (1) The acronyms included in this column are used to classify the following financial assets: L&R (loans and receivables): Loans and amounts due from cu-
stomers/banks; AFS (available for sale): financial assets available for sale; CFV (carried at fair value): financial assets measured at fair value; HFT (held for trading): financial assets held for trading.
(2) The exposures considered are not reported as assets since the securities concerned have been eliminated from the balance sheet. This is because the resi-dual securitized assets and related liabilities do not qualify for derecognition under IAS 39 and have been written back. The amounts indicated reflect the residual nominal value of the various tranches of ABS held by the Group.

64
Exposures as investor to structured credit products deriving from securitizations originated by third parties
At 31 December 2008, the Group’s exposures to financial products deriving from securitizations originated by third parties are held solely by Banca Nuova and BPV Finance, as described below.
Exposures held by Banca Nuova S.p.A.
The exposures of Banca Nuova, totaling 30.6 million euro, comprise ABS issued in relation to securitizations arranged pursuant to Law 130/1999 by the Palermo Chamber of Commerce and small and medium-sized businesses in Sicily.This subsidiary acted as arranger in the structuring of the transactions and also acts as servicer, calculation agent, cash manager, paying agent and collection account bank. It has no equity interest in the vehicle company.This activity, carried out by a dedicated internal team, is part of Banca Nuova’s investment strategy, in view of the particular attention given to the business world in Sicily.
The securities issued by “Boreale”, an SPE, do not have an official rating from specialist agencies given the “limited” size of the transactions. Nevertheless, they are well guaranteed from a credit standpoint since the sources of cash flow are governed by legislation published in the Official Gazette of the Sicily Region. In particular, the Decree of the General Director of the Sicily Region, no. 1646/7S dated 17/07/07, allocates funds from the Sicily Region directly to the vehicle and, therefore, to Banca Nuova.
More than half of the senior securities issued by “Boreale” are due for repayment in 2009, together with all the senior securities and an as yet unknown percentage of the mezzanine securities issued by “Turchese”, another SPE.
Neither of the above SPEs have been consolidated, since the conditions envisaged by IAS 27 and SIC 12 are not met.
All the above exposures are reported as “Loans and advances to customers” and are not subject to impairment losses, as defined in IAS 39.
Isin code Description Tranche Maturity Originator Geographical Type Rating Rating Rating Classification (1) Book date distribution of asset securitizied S&P Moody’s Fitch value
IT0004306640 TURCHESE A senior 31/12/17 C.C.I.A.A. Italy Diritti camerali n.a. n.a. n.a. L&R 8,011,478 di Palermo C.C.I.A.A. PalermoIT0004314164 TURCHESE A 2 senior 31/12/18 C.C.I.A.A. Italy Diritti camerali n.a. n.a. n.a. L&R 8,097,708 di Palermo C.C.I.A.A. PalermoIT0004250483 BOREALE FIN. senior 23/07/12 PMI siciliane Italy Crediti vantati n.a. n.a. n.a. L&R 7,080,555 CLASSE A dalla Regione SiciliaIT0003856611 LIBECCIO TV senior 30/12/15 C.C.I.A.A. Italy Diritti camerali n.a. n.a. n.a. L&R 577,013 CLASSE A di Palermo C.C.I.A.A. PalermoIT0003702211 MEMOSEC senior 31/12/14 C.C.I.A.A. Italy Diritti camerali n.a. n.a. n.a. L&R 258,877 CLASSE 1 di Palermo C.C.I.A.A. PalermoIT0004314198 TURCHESE mezzanine 31/12/18 C.C.I.A.A. Italy Diritti camerali n.a. n.a. n.a. L&R 3,583,236 4.75% 18 B 2 di Palermo C.C.I.A.A. PalermoIT0004306905 TURCHESE mezzanine 31/12/17 C.C.I.A.A. Italy Diritti camerali n.a. n.a. n.a. L&R 2,964,247 4.75% 17 B di Palermo C.C.I.A.A. Palermo
Total 30,573,114
(1) The acronyms included in this column are used to classify the following financial assets: L&R (loans and receivables): loans and amounts due from customers/banks.

65
Exposures of BPV Finance (International) PLC
The exposures of BPV Finance totaling 123.1 million euro relate to a Collateralized Debt Obligation (CDO) and various Asset-Backed Securities (ABS).
BPV Finance specializes in the management of multiple investment portfolios, including one entirely dedicated to transactions in ABS deriving from the securitization of residential and commercial mortgages, as well as leasing receivables, loans to small and medium-sized businesses and credit cards. This subsidiary’s investment policy is to optimize the medium-term value of the ABS, requiring that they be denominated in euro and have a minimum rating of single A (unless approved otherwise by the Board). The geographical breakdown of the assets underlying these transactions principally encompasses Western Europe and North America.
The exposures to structured credit instruments are measured in accordance with the relevant accounting standards. Except for the positions deriving from the Zoo III securitization, which have been written down in full, this portfolio is not subject to the recognition of any further impairment.
Although the ABS portfolio held by the company has not been significantly downgraded by the specialist agencies (except for the OXFORD 2005-1 A1 security which Moody’s downgraded from Aaa to Baa2 during 2008), its overall fair value at 31 December 2008 is 85.8 million euro, representing a reduction of about 37.3 million euro with respect to its carrying amount.
This adverse effect, principally associated with the illiquid nature of these securities in the financial markets, has not been recognised in the income statement since the entire ABS portfolio is classified among Loans and Receivables, consistent with the amendment to IAS 39 published by the IASB on 13 October 2008 and endorsed by the European Commission on 15 October 2008, Regulation EC no. 1004/2008. The portfolio is not subject to impairment losses pursuant to IAS 39.
The exposures at 31 December 2008 are analyzed by type below.
1) Exposures to CDOs (Collateralised Debt Obligations)
BPV Finance (International) PLC is exposed to the OXFORD 2005-1 A1 (Isin code XS0232966910) CDO with a nominal value of 5,000,000 euro, being the senior tranche of a CDO issued by Oxford Street Finance Ltd, a SPE based in Jersey. This company appears to be owned by the KBC Financial Products Group, which is entitled to the residual value of the vehicle.
The collateral backing the entire CDO (2 billion euro) consists of an exposure to individual corporate securities (57%), to corporate inner tranches (30%) and to a portfolio of ABS securities (13%). This last element amounts to 260 million euro and the concentration of US sub-prime debt at 30 October 2008 is 53.62% (43 individual ABS) according to Moody’s. The percentage of the entire CDO collateral invested in US sub-prime securities is therefore 6.970% (being 53.62% of 13%).
Isin code Description Tranche Expected Legal Originator Rating Rating Rating Classification (2) Book maturity (1) maturity S&P Moody’s Fitch value
XS0232966910 OXFORD senior 07/01/16 07/04/44 KBC Bank n.d. Baa2 - n.d. HFT 1,942,892 2005-1 A1
Total 1,942,892
(1) The expected maturity is estimated with reference to the average duration of the underlying portfolios and the latest available information about the incidence of early repayments.(2) The acronyms included in this column are used to classify the following financial assets: HFT (held for trading): financial assets held for trading.

66
Accordingly, the total indirect exposure to BPV Finance to US sub-prime securities at 31 December 2008 is 348,530 euro.
The Oxford Street Finance Ltd CDO comprises two parts: the first is a privately-placed senior credit default swap (representing the most senior part of the credit risk), while the second comprises 9 tranches of publicly-placed asset-backed bonds representing the remainder of the credit risk.
The publicly-placed notes totaling 382 million euro are analyzed as follows:
Tranche Currency Nominal Rating Moody’s
A1 EUR 87,000,000.00 Baa2A2 EUR 80,000,000.00 Ba1B EUR 64,000,000.00 Ba3C EUR 43,000,000.00 Caa2D EUR 33,000,000.00 Caa3E EUR 28,000,000.00 Caa3F EUR 17,000,000.00 Caa3G EUR 16,000,000.00 Caa3H EUR 14,000,000.00 Caa3
The percentage invested in corporate represents investments in “individual names”, while the corporate inner tranche part represents tranches of sub-portfolios also deriving from a portfolio of “individual names”.
According to Moody’s, the ABS part comprises: 4.88% Commercial Real Estate, 1.54% credit card, 1.92% IG Corporate CDO, 3.92% SME Corporate CDO, 4.97% ABS CDOs, 5.08% RMBS Mid-Prime, 8.45% RMBS Prime, 15.62% HY Corp CDO totaling 46.38%.
The sub-prime ABS (totaling 53.62%) are analyzed below by age of origination:
− 2007: 21%
− 2006: 25%
− 2005: 40%
− 2004: 11%
− 2003: 3%

67
2) Commercial Mortgage-Backed Securities - CMBS
BPV Finance (International) PLC is exposed for a total of 45.0 million euro towards Commercial Mortgage-Backed Securities, as detailed below:
All the above exposures are reported as “Loans and advances to customers” and are not subject to impairment losses, as defined in IAS 39.
XS0230464314 RECR IV A3 senior 20/10/12 20/10/14 NM Rothschild United Kingdom AAA Aaa n.a. L&R 4,746,990XS0239251092 MESDG 1 B senior 25/01/14 25/07/16 NIBC Bank Germany AA n.a. AAA L&R 3,778,840XS0246905805 PARGN 11X CB mezzanine 15/04/10 15/10/41 Paragon United Kingdom A A2 A L&R 3,294,210 Mortgage LtdXS0261650674 PARGN 12X C1B mezzanine 15/08/10 15/11/38 Paragon United Kingdom A A2 A L&R 5,602,354 Mortgage LtdXS0235420725 PARGN 10X C1B mezzanine 15/12/10 15/06/41 Paragon United Kingdom A A2 A L&R 2,872,212 Mortgage LtdXS0310524599 PARGN 15X CB mezzanine 15/06/12 15/12/39 Paragon United Kingdom A A2 A L&R 3,478,886 Mortgage LtdFR0010251504 EURO 21 B mezzanine 15/08/12 15/08/15 Morgan Stanley France AA n.a. n.a. L&R 1,813,039 Bank InternationalFR0010255141 EURO 21 C mezzanine 15/08/12 15/08/15 Morgan Stanley France A n.a. n.a. L&R 2,911,781 Bank InternationalIT0004070055 PTRMO 2006-1 C mezzanine 31/12/12 31/12/21 Banca Nazionale Italy AA n.a. AA- L&R 3,031,230 Lavoro Fondi SGRXS0301457635 IMMEO 2 C mezzanine 15/12/13 15/12/16 Morgan Stanley Germany AA n.a. AA L&R 2,510,334 Mtge ServIT0003872774 FIPF 1 A2 mezzanine 10/07/14 10/01/23 Fondo Immobiliare Italy A+ Aa2 AA- L&R 5,512,121 Pubblico FundingFR0010247593 PROUD 1 C mezzanine 18/08/14 18/08/17 FCC Proudreed France AA n.a. AA L&R 2,086,575 PropertiesXS0220767106 FORES 1 B mezzanine 12/05/15 12/05/18 Immofinanz. Austria AA n.a. AA L&R 3,378,499
Total 45,017,071
(1) The expected maturity is estimated with reference to the average duration of the underlying portfolios and the latest available information about the incidence of early repayments.(2) The acronyms included in this column are used to classify the following financial assets: L&R (loans and receivables): loans and amounts due from customers/banks.

68
3) Residential Mortgage-Backed Securities - RMBS
BPV Finance (International) PLC is exposed for a total of 23.3 million euro towards Residential Mortgage-Backed Securities, as detailed below:
All the above exposures are reported as “Loans and advances to customers” and are not subject to impairment losses, as defined in IAS 39.
Isin code Description Tranche Expected Legal Originator Geographical Rating Rating Rating Classification (2) Book maturity (1) maturity distribution S&P Moody’s Fitch value
FR0010029231 LOGGI senior 24/02/14 24/11/25 Electricite de France, France n.d. Aaa AAA L&R 2,774,296 2003-1 A Gas de FranceIT0003683262 CREDI 3 B mezzanine 20/08/16 20/11/25 ICCREA Italy A A1 n.d. L&R 3,251,122XS0274611317 EMACP mezzanine 25/10/13 25/04/39 GMAC RFC NL Netherlands A n.d. A- L&R 1,940,004 2006-3 CXS0168666013 GRAN mezzanine 21/07/14 20/07/43 Northern Rock Plc United Kingdom AA+ Aa1 AAA L&R 1,227,968 2003-2 2BXS0184563111 GRAN mezzanine 22/09/14 20/03/44 Northern Rock Plc United Kingdom AA+ Aa2 AAA L&R 2,970,530 2004-1 2BES0337985024 UCI 17 B mezzanine 17/09/20 17/12/49 Union de Creditos Spain BBB n.d. A- L&R 5,405,819 InmobiliariosXS0298976621 GRANM mezzanine 18/05/15 17/12/54 Northern Rock Plc United Kingdom A A2 A L&R 5,770,473 2007-2 3N2
Total 23,340,212
(1) The expected maturity is estimated with reference to the average duration of the underlying portfolios and the latest available information about the incidence of early repayments. (2) The acronyms included in this column are used to classify the following financial assets: L&R (loans and receivables): loans and amounts due from customers.

69
4) ABS with other forms of underlying loans
BPV Finance (International) PLC is exposed for a total of 52.8 million euro towards the SPEs of third parties, as detailed below:
None of the above SPEs have been consolidated, since the conditions envisaged by IAS 27 and SIC 12 are not met.All the above exposures are reported as “Loans and advances to customers” and are not subject to impairment losses, as defined in IAS 39.
5) Other exposures to subprime and Alt-A loans
In addition to the sub-prime mortgages and/or Alt-A loans described in point 1) above, BPV Finance also has indirect exposure to the US sub-prime sector via its investment in Blackstone Partners Offshore Sterling Fund Ltd. At 31 December 2008 this is not significant (less than 1,000 euro).
6) Leveraged Finance
The BPVi Group has no significant exposure to leveraged finance.
Cod Isin Description Tranche Expected Legal Originator Geographical Type of asset Rating Rating Rating Classification (2) Book maturity (1) maturity distribution securitized S&P Moody’s Fitch value
XS0254042541 HARVT IV senior 29/07/11 29/07/21 Mizuho Global Loans AAA n.d. AAA L&R 2,881,866 A1B Corporate Bank ES0337710026 SANTM 3 A3 senior 16/10/11 16/10/49 Banco Santander Spain Loans AAA Aaa AAA L&R 12,427,379 XS0272064337 EIRLES senior 15/05/14 17/05/21 Winchester Capital Global Loans AAA Aaa n.d. HFT 4,577,259 TWO LIMITED 303 XS0190180918 EXPLO mezzanine 25/03/09 25/09/12 Governo Portoghese Portugal Taxes and social AAA A1 AAA L&R 6,990,152 2004-1 M contributionsXS0143891488 CLISL 1X II mezzanine 21/09/15 19/03/20 Allied Irish Bank Global Loans AA Aa2 n.d. L&R 3,521,188 ES0312271010 AYTBT mezzanine 25/02/13 24/02/16 Ahorro y Titulizacion Spain Loans n.d. A2 A+ L&R 4,306,833 2006-II B ES0312284013 AYTDS mezzanine 26/11/11 17/11/19 Ahorro y Titulizacion Spain Loans BBB- n.d. A/- L&R 3,183,923 2006-I B XS0253600521 RMFE mezzanine 11/09/16 11/09/22 RMF Group Global Loans A A2 n.d. L&R 3,213,410 IV-A III IT0004137433 AGRI 2006-1 B mezzanine 08/03/15 08/12/23 Banca Agrileasing Italy Leases A n.d. A L&R 3,211,295IT0003940050 PHARM 2 B mezzanine 28/04/13 28/01/25 Comifin SpA Italy Leases A A2 n.d. L&R 3,161,658IT0003951123 LOCAT mezzanine 12/12/13 12/12/26 Locat SpA Italy Leases A A2 n.d. L&R 3,340,562 2005-3 BXS0238920655 SMILS 05 C mezzanine 20/01/12 20/01/15 ABN AMRO Netherlands Leases A A2 AA- HFT 2,014,905
Total 52,830,430
1) The expected maturity is estimated with reference to the average duration of the underlying portfolios and the latest available information about the incidence of early repayments. (2) The acronyms included in this column are used to classify the following financial assets: L&R (loans and receivables): loans and amounts due from customers/banks; HFT (held for
trading): financial assets held for trading

70
Information about lending
Information about lending by the Group is presented below in terms of concentration, geographical distribution and distribution by economic sector, together with a number of risk indicators. Except for the parameters relating to doubtful loans, the data used in this analysis was drawn from the financial statements and the information reported to the Central Risks Database, including cash loans, guarantees and derivatives. Group banks and companies are excluded from the aggregates, which however do include securitized mortgages in order to provide a complete picture of the way the Group’s loans portfolio is structured.
Concentration of customers
The Group’s loans portfolio is well spread overall with 255 thousand positions, of which 247 thousand representing just over 93% of the total have facilities of less than 250 thousand euro.The most numerous band with facilities of up to 25 thousand euro represents 51.3% of the total positions at 31 December 2008, just slightly lower than at the end of 2007 (52.0%) The bands from 26 to 250 thousand euro account for 41.9%, while those with greater facilities represent 6.8% of the total, much in line with 2007. Considering the amounts drawn down, the band with facilities up to 25 thousand euro accounts for just 2.7% of total loans granted by the Group (2.8% in 2007), while the bands from 26 to 250 thousand euro account for 34.7% (35.5% in 2007) and those drawing against greater facilities represent 62.6% of the total (61.7% in 2007). In particular, facilities in excess of 5 million euro account for 28.2% of the total loans drawn down.
With regard to the Parent Bank, the Board has taken a clear internal position on the control of concentration risk: in addition to having established in the past that facilities in excess of 60 million euro must not exceed 12% of total facilities granted by the Bank, the Board has also defined new thresholds for the monitoring and control of concentration risk in relation to facilities that exceed 5 million euro. This said, in December 2008 the loans granted to individual counterparts, or those belonging to the same economic group, with facilities in excess of 60 million euro represent 10.7% of total facilities granted by the Bank. This is slight more than 10.4% at the end of 2007 but still below the limit of 12%. With regard to the other facilities, the concentration of the 5 to 30 million euro band has fallen from 26.2% at the end of 2007 to 25.7% in December 2008, while that of the 30 to 60 million euro band is essentially unchanged at 10.7%.
As at the Parent Bank, Cassa di Risparmio di Prato and Banca Nuova have established limits for individual counterparts and those belonging to the same economic group, although the scale limit for the 12% threshold is 26 million euro at Cariprato and 20 million euro for Banca Nuova. In the first case, at 31 December 2008 the facilities belonging to this band represented 11.4% of the total, which is just below the limit having increased from 10.6% at the end of 2007; with regard to Banca Nuova, on the other hand, utilization is much lower (4.1%), although higher than at the end of 2007 (2.4%).

71
Geographical distribution
The geographical distribution of Group lending at 31 December 2008, by province of residence for physical persons and by location of registered office for companies, shows clearly the addition of the branches acquired from the UBI Banca Group which has helped to reduce the concentration of lending in the original home provinces.
In particular, 17.6% of total lending is distributed in the province of Vicenza, down from 18.4% at the end of 2007. The concentration in the province of Treviso has also declined from 8.1% al 7.0%, thus reducing its relative importance from 2nd to 3rd place. Similarly, the weighting of Prato has fallen (from 7.8% to 6.2%, from 3rd to 4th place). Padua and Udine at respectively 5.2% and 5.1% have decline slightly in percentage terms with respect to 2007. Considering the provinces where Banca Nuova is present, Palermo has increased its weighting from 4.3% at the end of 2007 to 4.6% in December 2008, while Trapani is stable at around 1.90%. The province of Milan has grown strongly to 8.2% from 7.7% in December 2007, becoming the Group’s second most important province, while Brescia (2.6%) and Bergamo (1.4%) together account for 4% of all Group loans, compared with 0.8% at the end of 2007.
Distribution by economic sector
Analysis of the distribution of the loans portfolio by economic sector highlights, at Group level, a marked increase in “Non-financial companies” from 55.6% at the end of 2007 to 59.8% in December 2008. By contrast, there has been a notable reduction in the weighting of loans to “Financial companies” (from 6.3% to 2.6%). “Households” absorbed 31.1% of total lending in December 2007, but this weighting is now 0.9 percentage points lower due to the slowdown in demand for residential mortgages. “Personal businesses” now represent 6.7% of total lending, up over the year by 0.3 percentage points.

72
Analyzing the loans to non-financial companies and personal businesses, which together represent 66.5% of the total loans portfolio, the Group is found to be mainly present in 6 segments: “Other services for sale” represent 21.6% of total lending, Commerce 11.6%, Construction 6.6%, Engineering (total of “Metal products” and “Agricultural and industrial machinery”) 4.5%, “Textiles, leather and footwear, clothing” (which includes tanning and, in particular, the districts of Prato and Alto Vicentino) 3.8%, and “Other industrial products” (including gold and furniture) 2.6%.
Risk indicators
At 31 December 2008, consolidated gross impaired loans (including non-performing, watch list, past due, over drawn and restructured) amount to 1,285 million euro, up by 224 million euro (+21.1% since 31 December 2007). This rise in impaired loans reflects an increase in non-performing loans (+110 million euro, or +19.4% since the end of 2007), watchlist loans (+94 million euro, +26.1%) due to a more restrictive definition of objective watchlist loans established by the Bank of Italy, and past due loans (+34 million, +36.4%). Despite this increase, the quality of the Group’s loans portfolio expressed as the ratio of doubtful loans to total lending has deteriorated only moderately since the end of 2007: the ratio of gross impaired loans to gross lending has risen from 4.98% at the end of 2007 to 5.52% at December 2008, while the ratio of non-performing loans to gross lending has increased from 2.67% to 2.92%. This increase should be assessed in the light of the slowdown in the growth of lending during 2008.
Changes in the risk relating to performing loans are monitored using the Risk Management System (SGR). This has been operational for more than three years and uses a system of counterpart scoring that classifies customers is decreasing order of credit quality. The calculations are based on trend indicators and information received from the IT systems of Group banks that might be relevant to a change in the level of risk associated with the counterpart. In particular, the SGR system classifies performing positions with anomalous trends into two categories: “under observation” or “high risk”. At Group level, the loans classified as “under observation” as a percentage of the total loans portfolio has risen from 2.8% at the end of 2007 to 3.3% in December 2008, while “high risk” loans have increased from 1.3% to 1.7%.
With reference to the most significant economic sectors in terms of total Group lending, the highest risk sectors (lowest percentage of “performing” loans) are “Textiles, leather and footwear, clothing” (performing at 78.3%), “Other industrial products” (79.6%) and Construction (85.5%). The principal sectors with the lowest level of risk, on the other hand, include “Agricultural and industrial machinery” (93.4%), “Other services for sale” (92.3%) and “Commerce” (89.9%).

73
CORPORATE SOCIAL RESPONSABILITY AND IMAGE
This chapter will describe projects supported and actions adopted by the Parent Bank for the benefit of all its stakeholders. The purpose is to confirm our Bank’s firm desire to be an active and responsible part of the social and environmental context in which it operates, knowing that contributing to the economic and social progress of its local area and residents is part of the essence of co-operative banking with its central values and principles of mutualism and solidarity.
Annual report on the mutualistic nature of the co-operative pursuant to art. 2545 of the Italian Civil Code
When co-ordinating the provisions of the Italian Civil Code with the special rules for co-operative banks contained in articles 29 et seq of the Consolidated Law on Banking and Lending, the legislator has restated that «popolare» banks belong to the co-operative category and has recognized the specific nature of their mutualistic purpose, stating that the associated principles adopted must be suitably disclosed in the present report.The mutualistic purpose, especially in a co-operative bank, is pursued not only in the typical forms of “internal” mutuality, but also those of “external” mutuality relating to the community and social context in which the bank itself operates and which is increasingly important in terms of corporate social responsibility.In the case of Banca Popolare di Vicenza, its mutualistic purpose involves:− providing members with banking services at times under preferential conditions;− taking actions in favour of the local area, households and businesses aimed at enhancing the
local economy for the specific benefit of the community as a whole;− allocating funds to projects of social benefit, charities, welfare and cultural initiatives with
benefits for the community and local area in which the Bank directly operates.
Banking services for Members
An effective mutualistic relationship with its Members also involves the specific offer of financial services relating to the principal products and services, starting with current accounts.The main product for Members is called the “Socio Più” (Members Plus) account, a complete package offered by Banca Popolare di Vicenza for the personal and family needs of its Members under absolutely preferential conditions. The package includes some of its more exclusive services free of charge, such as the Oro Socio Più (Gold Members Plus) credit card and the international debit card which now boasts microchip security and functionality, the securities deposit service, the safety deposit box, discounts on mortgage and loan arrangement fees, access to the latest multi-channel banking services and the prestigious fur coats custody service.
Members also enjoy exclusive insurance coverage: the Lost Baggage policy, which covers all material damage to the personal effects and baggage of Members and their family as a result of theft, robbery, fire and other accidents, the Member-Customer Accidents policy which insures against occupational and non-occupational accidents resulting in death or permanent disability and the Medical policy which offers a daily reimbursement for hospital stays resulting from accidents or major surgery plus a specialist information and booking service.
Members who opt for the “Socio Più” account are entitled to access a series of non-banking services, some of which provided through “Carta SemprePiù”, the prestigious service card provided free of charge which offers a series of discounts and benefits on exclusive goods and

74
services supported by a freephone service and special website. Members are also entitled to free guided tours of Palazzo Thiene (the bank’s historic headquarters) and its rich art collection and are constantly kept abreast of what is going on in the Bank through free subscription to the “BPVI Oggi” magazine sent to them at home.
Member admission criteria and management of member relationships
The close relationship between the Bank and its Members is one of the hallmarks of the co-operative banking model, featuring the presence of a large number of Members each with one vote and prevention of the formation of controlling majorities. The close relationship between the Bank and its Members is evident from the very moment of a new member’s admission, which is governed by art. 8 et seq of the articles of association. Applications for admission to membership are examined, before presentation to the Board of Directors, by a special Members Committee, set up under a board resolution adopted on 23 February 1999, which has the task of evaluating whether such applications satisfy the requirements contained in the acceptance clause in the articles of association and comply with the co-operative spirit. In particular, the Members Committee checks that existing or new members seeking the allocation of new shares are not acting for purely speculative ends, but have demonstrated their loyalty and attachment to the Bank over time; in this way, the committee puts forward only those applications that best respond to the nature and goals of co-operative banking.
An intense mutualistic relationship with Members is also reflected in constant, effective communications. Among the tools adopted are the publication of the annual Social Report, which looks in detail at the relationship between the Bank and its stakeholders, with particular reference to internal stakeholders such as Members, and the letter sent at least twice a year in which the Bank’s management provides information on the Bank’s results and performance, in compliance with the principle of providing the market with the same information.
Information on the shareholding structure of Banca Popolare di Vicenza
Banca Popolare di Vicenza had 53,329 Members at the end of 2008 (+1.6% compared with the end of 2007), plus 3,425 simple stockholders without voting rights, for a total of 56,754. Our Bank’s commercial development has been put on a more solid footing thanks to the entry of new Members, especially in the recent, new areas of operation in Bergamo and Brescia, while membership in our traditional areas has continued to rise steadily.
The analysis of members’ composition reveals one of the typical hallmarks of the co-operative model, namely a large number of Members, almost entirely comprising natural persons (99.0%) with a small representation of companies, entities and institutions (1.0%).

75
Shareholders 2008 Comp. % 2007 Change Change %composition
Men 33,616 59.2 33,136 480 1.4Women 22,565 39.8 22,441 124 0.6Companies, Administrative body, Institution 573 1.0 528 45 8.5
Total 56,754 100.0 56,105 649 1.2
Another feature which also reflects the primarily mutualistic character of BPVi is the huge number of private individuals and personal businesses who are both customers and Members of an entity that since its origin has sought to act “…so that the working classes, small businesses, retailers and shopkeepers” can “easily access credit born of the fruitful and liberal principle of providence and mutuality”. In fact, around 97.5% of all the Members are individuals falling into the category of consumer households, followed by 1.5% who belong to the personal businesses category. The rest of the shares are held by companies, religious institutes, banks, financial institutions, insurance companies and public entities.
Shareholders composition 2008 Comp. % 2007 Change Change %by business sector
Households 55,341 97.5% 54,758 583 1.1Individual companies 861 1.5% 840 21 2.5Companies 453 0.8% 420 33 7.9Religious institutions 41 0.1% 36 5 13.9Banks, insurances, etc. 50 0.1% 46 4 8.7Administrative body 8 0.0% 5 3 60.0
Total 56,754 100.0% 56,105 649 1.2
More than 62% of the stockholders have been Members of the Bank for over 10 years. This figure reflects the long-term, non-speculative nature of investing in BPVi and the close fiduciary relationship that has always bound the Bank to its Members.
Shareholders composition 2008 Change %by ageing of the relationship
Less than 5 years 21,313 37.6Between 6 and 10 years 16,105 28.4More than 10 years 19,336 34.1
Total 56,754 100.0
In fact, the expectations of these Members are many and complex, being not only investors but also customers, employees of the Bank and many players from the traditional areas of operation, whose objective is not based on mere short-term economic “return” on the investment but above all aimed at ensuring lasting, balanced development for the Bank itself, in harmony with the local social and economic environment, thereby creating the necessary conditions for uninterrupted pursuit of the corporate mission.

76
The Bank’s ties with its local area are even more evident from the geographical breakdown of Members, which confirms its deep roots in its traditional regions: over 80% of Members reside in the Veneto region and around 14% in Friuli Venezia Giulia. The proportion in Lombardy has increased because of the admission of new Members presented by the branches acquired from the UBI Banca Group in the provinces of Brescia and Bergamo.
Shareholders distribution 2008 2007 Change. %by geographical area N. Comp. % N. a/a
Veneto 45,774 80.7 45,680 0.2Vicenza 28,085 49.5 28,216 -0.5Treviso 8,122 14.3 8,052 0.9Padova 4,058 7.2 4,028 0.7Verona 3,049 5.4 2,995 1.8Venezia 1,619 2.9 1,579 2.5Belluno 732 1.3 734 -0.3Rovigo 109 0.2 76 43.4
Friuli V. G. 7,900 13.9 7,941 -0.5Udine 6,307 11.1 6,385 -1.2Pordenone 1,158 2.0 1,112 4.1Gorizia 214 0.4 218 -1.8Trieste 221 0.4 226 -2.2
Lombardia 1,445 2.5 971 48.8Emilia Rom. 380 0.7 375 1.3Sicilia 246 0.4 216 13.9Lazio 227 0.4 207 9.7Other italian area 665 1.2 599 11.0Abroad 117 0.2 116 0.9
Total 56,754 100.0 56,105 1.2
Banca Popolare di Vicenza and the community
The mission of “external” mutuality harmoniously complements that of “internal” mutuality and involves numerous actions by the Bank in favour of the local area and the local community.
In fact, as required by art. 53 of the Parent Bank’s articles of association, BPVi distributed a total of 1,869,311 euro in 2008 from the sum approved by the Members’ Meeting for charitable works, welfare, culture and projects of social benefit. The sums donated to projects of social benefit were basically the same as in 2007 and involved 965 individual donations (+2.7% relative to 2007), of which 38.7% in the sector of culture and safeguarding of artistic heritage, 19.7% in the sector of health and welfare, 14.4% for research, studies and education, 13.4% to voluntary entities and associations involved in social and cultural aggregation and in support of the underprivileged (which received 40.3% of total donations in this category), 4.9% for sport and youth associations, and the remaining 8.9% to other minor causes.
Donations in support of art and culture included:− a contribution to the Fondazione Teatro Comunale Città di Vicenza (Vicenza’s Municipal
Theatre), of whom the Parent Bank is a founding member, in support of the programme of activities in 2008;
− support for the Bertoliana Civic Library in Vicenza for the celebration of its 300th anniversary and the publication of a book on the history of this institution;

77
− a contribution to the Cathedral in Castelfranco Veneto for restoring the eighteenth century wooden choir stalls flanking the high altar;
− support for making a copy of the crown of the statue of the Monte Berico Madonna, stolen at the end of 2008;
Donations in support of studies, education and research included:− a major three-year contribution to the Vicenza University Campus, particularly in support of
the degree course in Business Economics and Administration;− a contribution in support of the Centro Universitario di Organizzazione Aziendale (Corporate
Organization University Centre) in Altavilla Vicentina, traditionally backed by BPVi, for the establishment of a scholarship to attend the Masters course in Banking and Finance;
− a contribution to the Centro Internazionale di Studi di Architettura Andrea Palladio (Andrea Palladio International Centre for Architectural Studies), in support of the traditional course on Palladian architecture for young Italian and foreign student;
− support to the University of Venice for the annual seminar on banking contracts;
Donations in the field of medical care and welfare were made to:− the Vicenza Green Cross to buy an ambulance;− the S.O.S. Village in Vicenza to buy a property to house children from difficult family
backgrounds;− the Padua section of the Italian Multiple Schlerosis Association to buy a specially equipped
vehicle for transporting the disabled.
Still in the area of medical care and welfare, of particular relevance was the renewed contribution to medical facilities operating in the Vicenza area and in Italy’s North East. The “Progetto Sanità 2008” (Health Project 2008), to which a total of 250,000 euro was allocated, included the following principal donations:− donation of equipment to the Urological Unit at Vicenza Hospital (for treating prostatic
adenoma), to the Spinal Unit at Vicenza Hospital (for rehabilitating patients with medullar injury) and to the Pro Senectute Association in Vicenza (for the experimental treatment of Alzheimer’s disease);
− scholarships for specialization and medical research in the Pediatric Surgery Unit and Plastic Surgery Unit at Vicenza Hospital, for Vicenza’s Friends of the Kidney Association (for the doctor working in the Nephrology Unit at Vicenza Hospital) and for the Foundation for Advanced Biomedical Research in Padua.
Donations in the field of sport included:− renewed support for the mini-marathon in Udine, now part of the sporting tradition in the
Veneto and Friuli Venezia Giulia;Lastly, all the ticket sales from the exhibition entitled “Returned Masterpieces - Paintings in the collection of the Banca Popolare di Vicenza Group”, held in Rome from 28 February to 15 June 2008, were donated to the Italian Cancer Research Association.
Corporate Social Responsibility Report
During 2008 the Parent Bank presented the sixth edition of its Corporate Social Responsibility Report for 2007. It considers this an increasingly important tool for clearly and transparently communicating the effects that its activities have on all the principal stakeholders operating within and without its business, namely Human Resources, Members, Customers and the Community as a whole.
In fact, Banca Popolare di Vicenza firmly believes that the primary need of creating lasting value

78
for any business cannot be separated from the close and growing interdependence between economic results and social performance. Attention to progress and establishment of its role in its local areas is even more important for a co-operative bank like ours whose core values and operational guidelines are based on mutuality and solidarity. These principles now appear to be even more relevant for the banking system as a whole, exposed to high reputational risk in an increasingly difficult and complex market.
This document, which is available on the website, briefly summarizes the key stages in the Bank’s history, its underlying values and its mission. As usual, plenty of room is given to the section entitled “Social Report”, which identifies and examines the most useful and effective indicators of actions taken in the interests of all stakeholders. This section begins with a presentation of the “Social Dashboard”, comprising a “system of indicators”, representing the results of the Bank’s “social performance”, thus providing an overview of how our Bank fits into its local environment and interacts with local players.
External communication and corporate image
The economic and socio-cultural role played by Banca Popolare di Vicenza in its local areas has been enhanced during the year by many, valid initiatives and by its continued support for institutions like Vicenza Calcio (Vicenza football club), of which BPVi is co-sponsor, and of the junior team of which the bank is official sponsor.
Other initiatives include the official sponsorship of the 81st National Alpine Corps Meeting, held in May in Bassano del Grappa 60 years after the corps’ undertaking to rebuild the Bassano Bridge, and the sponsorship of the Rovigo Rugby Club. We have also been involved in a number of high profile national events, such as renewed sponsorship for the Campiello Literary Prize, organized by Confindustria Veneto and the Guido Piovene Journalism Prize, created to celebrate this great Vicenza-born writer and organized by the Bank once every two years, reaching its fifth edition in 2008, accompanied by the second edition of the Piovene Youth Competition, organized in partnership with “Il Giornale di Vicenza”, a local newspaper and open to students of upper secondary schools in Vicenza and its province.
In the musical sphere, the Bank continued its intense programme of events, including the “Spring Concert”, offered by the Bank to the City of Udine and performed by the Orchestra of the Olympic Theatre in Vicenza, the much applauded concert of the Solisti Veneti, accompanied by James Galway on the flute, in the Hermitage Church in Padua, the traditional choral concert entitled “Invitation to Summer” hosted in June in the Palladian courtyard of the historic headquarters of Palazzo Thiene and performed by the Cadore Brigade choir, the concert of the Solisti Veneti in Castelfranco Veneto in November, and the traditional “Christmas Concert” offered to the City of Vicenza which saw the St. John’s Orchestra and the OSJ London Voices conducted by John Lubbock perform in the Temple of the Sainted Crown.
In the sphere of art and culture, the Bank confirmed its commitment to promoting and enhancing the value of its artistic heritage through a series of important local and national events. Apart from the usual “Sunday lectures”, on the myth of Venus and Love, held in Palazzo Thiene in the first quarter of the year and following on from the “Returned Masterpieces” exhibition in 2007, the Bank organized, a major exhibition in the first half of the year, together with the Memmo Foundation in Rome, entitled “Returned Masterpieces. Paintings in the collection of the Banca Popolare di Vicenza Group”. This event, receiving the patronage of the Ministry of Culture, and the high patronage of the President of Italy, saw the prestigious setting of Palazzo Ruspoli in Rome host over 100 masterpieces from the collections of Banca Popolare di Vicenza, Cariprato and Banca Nuova. At the same time as this important event in Rome, the Republic

79
of San Marino decided to issue a collection of stamps reproducing four masterpieces from the Group’s collection, thus confirming the importance of the Bank’s cultural project to recover great works of Venetian art from the art markets and safeguard them. In exchange for this initiative, last summer the Bank lent the St. Frances Art Gallery in San Marino three of the four paintings for the exhibition: “Tiepolo Pellegrini Bassano. Three masterpieces in San Marino from the collection of the Banca Popolare di Vicenza Group”.
Since 2008 marked the 5th centenary of the birth of Andrea Palladio, the Bank had the honour to host at Palazzo Thiene, a masterpiece of Palladian architecture and a Unesco world heritage site, Giorgio Napolitano, the President of Italy, during his visit to Vicenza for the Palladio anniversary celebrations. The visit, on 19 September 2008, came 56 years after the visit by another Italian President, Luigi Einaudi, and has been commemorated by a special plaque in the palace’s porch. To mark the Palladian anniversary our Bank not only supported a series of events organized for the occasion by the Province of Vicenza with the patronage of the Veneto Region, it also organized the “Schools Project at Palazzo Thiene”, involving the exceptional opening of Palazzo Thiene for school year 2008-2009 to pupils of primary and secondary schools in the Veneto, Friuli Venezia Giulia, Bergamo and Brescia, with special educational tours for visiting the palace and its collections. Still as part of the Palladian anniversary celebrations, in September the Bank organized at Palazzo Thiene the exhibition “The Doge of Palladio. Portraits of Nicolò da Ponte by Tintoretto in the 1700s”, which paid homage to the doge serving in the year of the celebrated architect’s death. This was also the occasion for presenting the city with the “Portrait of the Doge Nicolò da Ponte”, a recently purchased eighteenth century Venetian school replica of the Tintoretto original already in the Bank’s collection.
As for the Bank’s art collection, we recall the acquisition of the matching paintings by Giulio Carpioni: “Bacchanal” and “The plage of Aegina”; precious canvases by the Venetian seventeenth century master and now on display in Palazzo Thiene, and the purchase of a medallion of the Doge Andrea Gritti, year IV – 1526, adding to the Bank’s collection of Venetian medallions which is now missing only one example to be complete. The Bank also purchased “Alexander’s triumph in Babylon”, a large painting by Antonio Zanchi, a seventeenth century Venetian master; this painting, recovered on the North American art market and brought back to Italy by the Bank, was the centrepiece of the traditional exhibition of “Returned Masterpieces” organized at year end in Palazzo Thiene. The exhibition entitled “Antonio Zanchi. Alexander the Great in triumph” displayed, in addition to the rediscovered masterpiece, several works from public and private collections and a multi-media section on the topic of “Film triumphs”.
Internal communication
Internal communication activities continued in 2008, with them playing an important role in quickly spreading information and enhancing a common corporate culture throughout the Group. In particular, efforts focused on improving the quantity and quality of the services broadcast by the BPVI Channel, the Corporate TV channel of the BPVi Group, by increasing the time devoted to commercial and other initiatives by all the Group’s banks with the goal of creating a real corporate community around this medium.
The corporate publications BPV OGGI and Linea Diretta also continued to appear regularly and actually increased the number of topics addressed and improved the quality of their pictures. As regards the house organ “BPV OGGI” (BPV TODAY), the editorial style was consolidated in 2008 with the goal of reporting the key facts relating to all the Group’s banks as well as giving ample space to exclusive articles on economics, finance, foreign politics, art and culture by national journalists or experts. The “Linea Diretta” (Direct Line) magazine has established itself as the periodical for the Group’s employees, which consider it theirs and

80
eagerly anticipate its publication. The articles and reports about employees in their daily jobs are very popular, like those on leisure and sport. In almost eight years of publication, the “La parola ai Colleghi” (Employee forum) column has never been short of input, confirming the attention and affection that the magazine enjoys; the “Bear or Bull” competition devised and organized by “Linea Diretta” also proved a great success with over 3,500 participants.

81
CONSOLIDATED RESULTS OF OPERATIONS
Scope of consolidation
The scope of consolidation at 31 December 2008 is summarized below:
The scope of consolidation has undergone the changes discussed below since 31 December 2007.
Acquisitions, mergers and cancellations
Verona Gestioni SGR S.p.A.: on 15 October 2008 this company was merged into BPVI Fondi SGR S.p.A. (50% controlled), effective from 1 January 2008 for accounting purposes pursuant to art. 2504 of the Italian Civil Code, and resulting in the cancellation of Verona Gestioni SGR S.p.A.

82
Linea S.p.A.: on 27 June 2008 the entire 47.96% interest in Linea S.p.A. was sold to Compass S.p.A. (Mediobanca Group). In compliance with IFRS 5, this equity investment had been classified in “Non-current assets held for sale” at 31 December 2007.
Otto a Più Investimenti SGR S.p.A.: the subsidiary BPVI Fondi SGR S.p.A. sold its entire 20.00% interest in this company during the year.
Changes in equity interests
Farbanca S.p.A.: during the year the Parent Bank acquired another small interest in this company, taking its holding from 47.44% in December 2007 to 47.52% at the end of 2008.
Other changes
Società Cattolica di Assicurazione S.c.p.A.: further to Cattolica di Assicurazione S.c.p.A. taking a 0.50% interest in Banca Popolare di Vicenza on 31 October 2008, a “significant influence” is now considered to exist between our Group and this company as defined by IAS 28 “Investments in associates”. In fact, this interest by Cattolica Assicurazioni in the Bank has sealed the existing strategic and business alliance between the two groups, further strengthening their major partnership in the sector of insurance, banking and financial services, also confirmed by the fact that each has a representation on the other’s Board of Directors.
The 12.72% interest held in Cattolica Assicurazioni, previously classified in “financial assets available for sale”, has now been reclassified to “equity investments” at the carrying amount against cancellation of the previously recognized valuation reserve.This company has therefore been consolidated in 2008 using the equity method, with the share of its related income and expenses included from 1 November 2008.
Temporary investments held as part of merchant banking activities and insignificant interests have been excluded from the scope of consolidation, even though such holdings may exceed 20% of capital, and are classified as “financial assets available for sale” (note that insignificance is defined in terms of the effect of exclusion on the financial and operating structure of the consolidated financial statements, with regard to potential line-by-line consolidations, and on the components of equity, with regard to potential measurement using the equity method).
The balance sheets and income statements used for consolidation purposes (line-by-line, proportional, equity method) are those approved by the Boards of Directors of the individual companies as of 31 December 2008. These financial statements have been adjusted, where necessary, to align them with proper and consistent accounting policies adopted by the Group. The financial statements of companies consolidated line-by-line, but presented using formats that differ from those established in Circular 262 of 22 December 2005, have been duly reclassified in accordance with these formats.
The investments in Interporto della Toscana Centrale S.p.A.1 and Magazzini Generali e Derrate S.p.A. have been reported using the equity method with reference to their 2007 financial statements, while the holdings in Cattolica di Assicurazione S.c.p.A. and 21 Investimenti Partners S.p.A. have been carried at equity with reference to their financial statements at 31 December 2008 and 31 December 2007 respectively. The consolidated financial statements of the Banca Popolare di Vicenza Group as of
(1) Although the interest in the company’s equity exceeds the carrying amount of the investment, the company has re-ported losses in recent years and, for the sake of prudence, its carrying amount has not been adjusted.

83
31 December 2008 therefore comprise, as required by IAS 27, the financial information reported by the Parent Bank and its direct and indirect subsidiaries and associated companies:
1) consolidated line-by-line (unless otherwise specified, control is held by the Parent Bank):− Banca Popolare di Vicenza S.C.p.A. - Parent Bank− Banca Nuova S.p.A. (99.59% controlled)− Cassa di Risparmio di Prato S.p.A. (79.00% controlled)− Farbanca S.p.A. (47.52% controlled)− B.P.Vi. Fondi SGR S.p.A. (50.00% controlled)− Nordest Merchant S.p.A. (80.00% controlled)− NEM SGR S.p.A. (100% controlled by Nordest Merchant S.p.A.)− NEM 2 SGR S.p.A. (100% controlled by Nordest Merchant S.p.A.)− Nuova Merchant S.p.A. (100% controlled)− BPV Finance (International) Plc (99.99% controlled)− Servizi Bancari S.c.p.A. (97.00% controlled with 1.00% owned by Banca Nuova S.p.A.,
1.00% by Cassa di Risparmio di Prato S.p.A. and 1.00% by Farbanca S.p.A.)− PrestiNuova S.p.A. (6.33% owned with 88.67% controlled by Banca Nuova S.p.A.)− Immobiliare Stampa S.p.A. (100% controlled)− Monforte 19 S.r.l. (100% controlled)
2) consolidated using the equity method (unless otherwise specified, the equity investment is held by the Parent Bank): − Berica Vita S.p.A. (49.00% owned with 1.00% held by Banca Nuova S.p.A.)− Vicenza Life Ltd (50.00% owned)− ABC Assicura S.p.A. (50.00% owned)− Cattolica di Assicurazione S.c.p.A. (12.72% owned)− 21 Investimenti Partners S.p.A. (20.00% owned)− Farmanuova S.p.A. (30.00% owned by Banca Nuova S.p.A.)− BPVI – Cattolica Mediazione Creditizia S.p.A. (50.00% owned)− Magazzini Generali Merci e Derrate S.p.A. (25.00% owned)− SEC Servizi S.C.p.A. (47.04% owned, with 1.66% held by Banca Nuova S.p.A., 1.02% by
Cassa di Risparmio di Prato S.p.A. and 0.10% by Farbanca S.p.A.)− Interporto della Toscana Centrale S.p.A. (20% owned by Cassa di Risparmio di Prato S.p.A.).

84
Information on financial instruments reclassified following amendments to IAS 39 and IFRS 7 and methods of determining fair value.
The serious crisis hitting financial markets in the second half of 2008 led governments in the European Union to ask the International Accounting Standards Board (IASB), an independent body responsible for issuing international accounting standards, to amend the accounting standards applying to the classification of financial instruments (also to bring them into line with the related US standards) and the method of determining their fair value in situations of market illiquidity like at present.
The following paragraphs will describe the amendments made in October 2008 to IAS 39, allowing the possibility of reclassifying financial instruments, and the IASB’s recommendations concerning measurements in light of the problems of measuring fair in unstable financial markets. The decisions adopted by the BPVi Group in this regard will also be discussed.

85
Reclassification of financial instruments: changes introduced following the amendments to IAS 39 and IFRS 7
With reference to the classification of financial assets, on 13 October 2008 the IASB published some amendments to IAS 39 “Financial instruments: recognition and measurement” and to IFRS 7 “Financial instruments: disclosures” in a paper entitled “Reclassification of Financial Assets”, endorsed under urgent procedures by the European Commission on 15 October 2008 in Regulation EC 1004/2008.
In brief, these amendments allow companies that apply international accounting standards the option to reclassify certain financial instruments from their originally designated category in accordance with specific instructions and in rare circumstances. The current situation on financial markets undoubtedly qualifies as one of the “rare circumstances” envisaged by the amendments.
In more detail, the amendment to IAS 39 has removed the previous ban on reclassifying non-derivative financial instruments from the assets held for trading category (measured at fair value through profit or loss) to other categories (assets held to maturity, asset available for sale, and loans and receivables). It is now also possible to reclassify certain financial assets available for sale to loans and receivables.
Such reclassifications are permitted when a financial asset, in rare circumstances, is no longer held for near-term trading, even though it was purchased primarily for such purpose, and the company has the intention and ability to hold it for the foreseeable future or to maturity. The financial instrument’s characteristics must nonetheless be such as to allow its transfer into the new category at the reclassification date.
The provisions of IAS 39 already permitting reclassification of financial instruments from “financial assets held to a maturity” to “financial assets available for sale” and vice versa still hold good.
A reclassified financial asset is recorded in its new category at its fair value on the reclassification date and profits and losses previously recognized in the income statement must not be reversed.
Solely for reclassifications approved before 1 November 2008 is it permitted, in view of the exceptional circumstances, to use the fair value of the financial instrument at 1 July 2008 as the transfer value.
In the event of reclassifying a financial instrument from “financial assets available for sale”, the profits and losses previously deferred in equity, if referring to an instrument with a predetermined maturity, are amortized over the term of the investment using the effective interest method; conversely, if the instrument does not have a predetermined maturity, such profits and losses stay in the reserve until the instrument is sold or cancelled.

86
Reclassifications by the Banca Popolare di Vicenza Group
The turmoil on financial markets and the reduced liquidity of certain financial instruments means that it is no longer possible to pursue in the near term the intent under which they were originally classified as financial assets held for trading, effectively forcing them to be held over the medium/long term or to maturity. In view of these circumstances, the Banca Popolare di Vicenza Group has applied the options allowed by the amendments to the international accounting standards discussed above and made the following reclassifications totalling 465.7 million euro (of which 118.9 million euro pertaining to the Parent Bank Banca Popolare di Vicenza and 346.8 million euro to the subsidiary BPV Finance Plc):
(in millions of Euro)
Category before Category after Amount of wich BPVi of wich BPVreclassification reclassification reclassified Finance Financial assets Loans and advances 253.3 29.4 223.9available for sale to customersFinancial assets Loans and advances 149.2 44.1 105.1available for sale to banksFinancial assets Financial assets 63.2 45.4 17.8held for trading available for sale
Total 465.7 118.9 346.8 Since the Boards of Directors of the Parent Bank and the subsidiary BPV Finance resolved to make these reclassifications before 1 November 2008, they have been made with effect from 1 July 2008 (as permitted by the amendment to IAS 39), with the fair value recognized in the new category equal to the related book value at 30 June 2008. Purchases of additional securities after 30 June 2008 have been reclassified with effect from the purchase date, using the price on such date as the fair value. As a result of these reclassifications, the financial instruments reclassified to “loans and advances to customers” and “loans and advances to banks” are now being measured at “amortized cost” as adjusted to take account of any impairment in compliance with IAS 39.
At 31 December 2008 the book value of financial assets reclassified in the year amounted to 461.8 million euro compared with a fair value of 387.9 million euro. The fair value of the above financial assets has been determined on the basis of the related market prices at 31 December 2008 which in some cases reflect situations of severe illiquidity.

87
The following table provides the information required by paragraph 12A of IFRS 7 in the event of reclassifying financial instruments from the fair value through profit or loss category (in compliance with paragraph 50B or 50D of IAS 39) or from the “available for sale” category (in compliance with paragraph 50E of IAS 39):
At the reclassification date, the effective interest rate of the financial assets reclassified from “financial assets available for sale” and “financial assets held for trading” to “loans and advances to customers” or to “loans and advances to banks” is close to the nominal interest rate of the reclassified financial instruments, and in view of the fact that they are classified as performing, the estimated amount of expected cash flows are near to their book value.
(in millions of Euro)
Category before Category after Book value Fair value fair value gain/loss: reclassification reclassification as at as at recognised in recognised in not not 31/12/2008 31/12/08 profit/loss in profit/loss in recognised in recognised the previous the year profit/loss in in AFS reserve year the year in the year
Financial assets available Loans and advances 257.9 199.2 - - - -58.7for sale to customersFinancial assets available Loans and advances 150.7 135.5 - - - -15.2for sale to banksFinancial assets held Financial assets 53.2 53.2 -6.7 -16.1 -2.4 - for trading available for sale
Total 461.8 387.9 -6.7 -16.1 -2.4 -73.9

88
Determination of fair value of financial assets
With reference to the methods of measuring financial instruments if their market is “not active”, the IASB set up an advisory panel in May 2008 to define the rules for determining fair value in illiquid or no longer active markets; the results were published on 31 October 2008 in a paper entitled “Measuring and disclosing the fair value of financial instruments in markets that are no longer active”.
These guidelines are consistent with those already issued by the Financial Accounting Standards Board (FASB) in the United States and are designed to allow greater use of valuation techniques, also based on assumptions by management, if the market for an asset is no longer considered to be active.
In brief, the paper includes the following indications:− no deviations are permitted from fair value; − the objective of a fair value measurement is to establish the price at which a transaction would
ordinarily take place between market participants, not the price resulting from a forced liquidation or a distress sale;
− even at times of market crisis not all market activity represents forced liquidations or distress sales, meaning that even if a market is inactive the price of transactions cannot be ignored;
− the fundamental value (independent estimate by a company’s management on the basis of expected cash flows) if left unadjusted, is unsuitable for determining fair value since it does not consider factors that the market would consider (credit/liquidity risk);
− if a market becomes inactive - meaning there is little observable input data - it is possible to determine values other than market prices that are equally reliable using valuation techniques and models which consider the different factors of risk;
− if a valuation technique is used for determining fair value, it is necessary to periodically calibrate the model used for observable market data to ensure that it represents current market conditions and to identify any weaknesses in it;
− if the fair value measurement differs from market prices, the disclosures are of prime importance for the purposes of measurement transparency.
As regards the criteria for determining fair value, the new guidelines have confirmed the approach already generally followed by the Group.

89
Direct deposits
Direct deposits, excluding “liabilities for assets sold but not derecognized”, amounted to 20,253 million euro at 31 December 2008, reporting an increase of 13.4% on the year before (+9.9% including “liabilities for assets sold but not derecognized”).
Direct deposits 31/12/2008 31/12/2007 Changes (in millions of Euro) (+/-) % Current accounts and unrestricted deposits 10,002 8,625 1,377 16.0Current accounts and restricted deposits 182 25 157 628.0Repurchase agreements and other payables 801 1,074 -273 -25.4Bonds 8,968 7,827 1,141 14.6Certificates of deposit and other securities 300 302 -2 -0.7
sub-total 20,253 17,853 2,400 13.4Liabilities for assets sold but not derecognized 1,153 1,631 -478 -29.3
Total direct deposits 21,406 19,484 1,922 9.9
The changes in the different types of direct deposit reflect strong growth in “bonds” (+14.6%) and “current accounts and unrestricted deposits” (+16.0%), but a contraction in “repurchase agreements and other payables” (-25.4%). This downward trend in repurchase agreements in favour of other types of funding is a positive sign in terms of liquidity, with our Group closing such funding transactions with lending transactions generally in the same technical form. “Certificates of deposit and other securities” and “current accounts and restricted deposits” have settled for some time now at much reduced levels: while the former posted a modest decrease over the twelve months of 0.7%, the later grew by 157 million euro in absolute terms (+628.0%).
With reference to the Group’s own bond issues, which account for 42% of all direct deposits, the Group made no new issues in the year under its European Medium Term Notes programme , after issuing more than 1,815 million euro in notes in 2007; consequently, the entire change for the year is attributable to ordinary placement activities with retail customers , with obvious benefits in terms of diversification of the sources and cost of funding.
“Liabilities for assets sold but not derecognized” were 29.3% lower than at 31 December 2007. These relate to the “Berica 5 Residential MBS” and “Berica 6 Residential MBS” securitizations arranged in 2004 and 2006 respectively, which, as discussed in the section on loans, have been “reinstated” in the balance sheet, as required by IAS 39. In fact, they represent notes issued by vehicle companies that are backed by securitized home mortgages; their decrease since 31 December 2007 reflects partial repayment of such securities and the Parent Bank’s repurchase of 208.9 million euro in senior and mezzanine notes issued as part of the above securitizations which have consequently been derecognized.
With reference to the latest securitization known as “Berica 7 Residential MBS”, carried out in November 2008 and also “reinstated” in the balance sheet under IAS 39, since all the related asset backed securities (ABS) were subscribed by the originator banks (BPVi, Banca Nuova and Cariprato), no “liabilities for assets sold but not derecognized” have been recognized.

90
Indirect deposits
Indirect deposits had a total market value of 15,890 million euro at 31 December 2008, reporting a decrease of 14.3% on a year earlier.This aggregate has been seriously affected by the recent turmoil on financial markets and the decline in its value is almost entirely attributable to negative performance in the asset management sector, which although accounting for only 20% of all indirect deposits, posted an absolute decrease in value of 2,142 million euro over the year (-40.0%). Assets under administration, which represent 67% of the total aggregate, also reported a negative performance although not as large (-5.3%). Pension premiums, accounting for 13% of total indirect deposits, increased by 4.8% over the year, reflecting the benefits of partnership with the Cattolica Assicurazioni Group.
Indirect deposits 31/12/2008 31/12/2007 Changes (in millions of Euro) (+/-) % Mutual funds 2,484 3,845 -1,361 -35.4Personal asset management 735 1,516 -781 -51.5Pension premiums 2,078 1,982 96 4.8Shares 1,347 2,198 -851 -38.7Other securities 5,519 5,255 264 5.0Treasury shares 3,727 3,735 -8 -0.2
Total indirect deposits 15,890 18,531 -2,641 -14.3
assets under management 3,219 5,361 -2,142 -40.0retirement savings 2,078 1,982 96 4.8assets under administration 10,593 11,188 -595 -5.3

91
Looking at the various forms of indirect deposits, the sharp contraction in assets under management, which for some time has witnessed a reduction in volumes due to investor disaffection for this sector, reflects decreases in both “mutual funds” (-35.4%) and “personal asset management” (-51.5%). With regard to assets under administration, “shares” were 38.7% lower mainly because of the steep drop in global share prices, while “other securities” were 5.0% higher. “Treasury shares” were generally stable. Lastly, “pension premiums” posted an annual increase of 4.8% to more than 2 billion euro at 31 December 2008.
Loans to customers
The volume of loans to businesses and households in our home regions continued to grow in a satisfactory fashion in 2008, all of which was funded by the growth in direct deposits from customers.
Loans to customers 31/12/2008 31/12/2007 Changes (in millions of Euro) (+/-) % Ordinary current accounts 4,573 4,354 219 5.0Mortgage loans 9,064 8,562 502 5.9Syndicated loans 1,736 1,650 86 5.2Import/export loans 1,374 1,316 58 4.4Other loans 2,907 2,908 -1 0.0Debt securities 331 38 293 771.1Repurchase agreements 32 8 24 300.0Net non-performing loans 1 312 300 12 4.0
sub-total 20,329 19,136 1,193 6.2Assets sold but not derecognized 2,376 1,703 673 39.5
Total net loans 22,705 20,839 1,866 9,0
(1) This does not include non-performing loans related to “assets sold but not derecognized”.

92
Net of impairment adjustments, loans to customers increased by 9.0% on the prior year to 22,705 million euro at 31 December 2008 (+6.2% excluding “assets sold but not derecognized”). This increase also reflects the reclassification of 253.3 million euro in debt securities from “financial assets available for sale” to “loans and advances to customers”, after the Group took up the option allowed by the IASB, as endorsed by the European Commission (Regulation 1004/2008 of 15 October 2008), of reclassifying certain financial instruments in rare circumstances like those caused by the current financial crisis. Ignoring these reclassifications, discussed in a specific section of this report, cash loans to customers would have amounted to 22,452 million euro, with an increase of 7.7% on 31 December 2007 (+4.9% excluding “assets sold but not derecognized”).
In terms of individual lending products, all the different technical forms grew despite the economic slowdown. In particular, “mortgage loans” grew by 5.9%, “ordinary current accounts” by 5.0%, “syndicated loans” by 5.2% and “import-export loans” by 4.4%. The increase in “debt securities” (+771.1%) reflects the effect of the above reclassification of financial instruments further to the amendments to IAS 39. “Repurchase agreements”, of relatively immaterial absolute amount, were up 300%, while “other loans” were unchanged.
“Mortgage loans”, grew at a slower pace than in the past, reflecting a contraction in individual customer demand throughout the banking industry as a whole, and the securitization, carried out in November 2008, under which the Parent Bank, Banca Nuova and Cariprato sold 968.4 million euro in performing residential mortgage loans to a special purpose entity called “Berica 7 Residential MBS Srl”. Like the “Berica 5 Residential Mbs” and “Berica 6 Residential MBS” securitizations, this securitization does not meet the derecognition requirements of IAS 39;2 accordingly, the residual securitized assets have been “reinstated” in the balance sheet at 31 December 2008 as “assets sold but not derecognized”, which have therefore increased by 673 million euro (+39.5%).
“Mortgage loans” nonetheless continued to represent around 40% of total loans (and over 50% including the securitized mortgages classified in “assets sold but not derecognized”). Credit risk indicators have deteriorated throughout the banking industry in the wake of the financial market crisis in the second half of the year and the resulting deterioration in an already weak economy. These events have had a negative impact on the quality of the Group’s loan book, which has deteriorated at the end of 2008 relative to 31 December 2007. This deterioration, expressed in terms of the ratio between impaired loans and total loans, was less than for the banking industry as a whole.
(2) With regard to the other securitizations carried out before 1 January 2004, the securitized assets were not reinstated on first-time adoption of IAS 39, as allowed by paragraph 27 of IFRS 1.

93
Impaired loans to customers (net of adjustments and including any impaired loans classified as “assets sold but not derecognized”) were 127.9 million euro higher (+17.9%) at 31 December 2008 than a year earlier; however, as a percentage of total net loans, impaired loans increased by just 0.28 percentage points, from 3.44% at 31 December 2007 to 3.72% at the end of 2008. The ratio of net non-performing loans to net loans to customers was 1.51%, the same as at 31 December 2007.
Looking at the composition of impaired loans, it is mainly the watchlist loans and positions past due by more than 180 days that have deteriorated most, increasing by 79.0 million euro (+29.0%) and 33.8 million euro (+38.6%) respectively; non-performing loans have increased by 28.1 million euro (+8.9%), while restructured loans have fallen by 13.0 million euro (-32.2%).
In terms of coverage, meaning the ratio between total provisions and gross exposure, the coverage of impaired loans has increased from 32.51% at 31 December 2007 to 34.31% at 31 December 2008, mainly due to higher provisions against non-performing loans, whose coverage, ignoring partial write-offs, has risen from 44.49% at 31 December 2007 to 49.36% at the end of 20083.
Lastly, the “general provision” for “performing” loans amounted to 106.7 million euro at 31 December 2008, providing coverage of 0.49%, slightly down from 0.52% at 31 December 2007.
(3) The coverage of non-performing loans, including write-offs for bankruptcy proceedings still in progress at 31 Decem-ber 2008, was 63.60% at year end, while that of gross impaired loans would be 45.55%.

94
Financial assets
The Group’s financial assets amounted to 1,273 million euro at 31 December 2008, 41.4% below the figure of 2,174 million euro reported at the end of 2007.
Financial assets breakdown 31/12/2008 31/12/2007 Changes (in millions of Euro) (+/-) % Financial assets held for trading 794 886 -92 -10.4Financial assets at fair value 17 26 -9 -34.6Financial assets available for sale 436 1,216 -780 -64.1Financial assets held to maturity 26 46 -20 -43.5
Total 1,273 2,174 -901 -41.4
Under the option allowed by the IASB and endorsed by the European Commission (Regulation 1004/2008 of 15 October 2008) to reclassify certain financial instruments in rare circumstances, such as those caused by the current financial crisis, the Group has transferred 402.5 million euro in debt securities from “financial assets available for sale” to “loans and advances to customers” and “loans and advances to banks” and 63.2 million euro in debt securities from “financial assets held for trading” to “financial assets available for sale”. Excluding these reclassifications, described in a specific section of this report, financial assets would have amounted to 1,676 million euro at the end of 2008, with a decrease of 22.9% on 31 December 2007.
Assets held for trading represented 62.4% of the Group’s financial assets at 31 December 2008, 10.4% below the year before. Over 91% of these assets were derivatives (724 million euro).Financial assets available for sale accounted for 34.2% of total financial assets, down 64.1% on 2007.
Excluding the reclassifications described earlier, “financial assets available for sale” would have amounted to 775 million euro, with a decrease of 36.2% relative to 31 December 2007, and representing 46.3% of total financial assets.

95
Financial assets are analyzed by type of assets as follows:
Financial assets breakdown 31/12/2008 31/12/2007 Changes (in millions of Euro) (+/-) % Debt securities 216 1.058 -842 -79.6Equities 164 365 -201 -55.1Mutual funds 109 96 13 13.5Assets sold but not derecognized 50 81 -31 -38.3Financial derivatives 724 574 150 26.1Loans 10 – -10 n.s
Total 1,273 2,174 -901 -41.4

96
Interbank position and liquidity
The Group’s net exposure to the interbank market was a negative 771 million euro at 31 December 2008, down from -1,290 million euro a year earlier. The improvement in the interbank position is attributable to better matched growth between customer lending and deposits, one of the Group’s top priorities, and to the cash generated from selling financial assets and equity investments.
Net interbank position 31/12/2008 31/12/2007 Changes (in millions of Euro) (+/-) % Loans and advances to banks 2,306 1,989 317 15.9Deposits from banks 3,077 3,279 - 202 -6.2
Total -771 -1,290 519 -40.2
The following table summarizes the cash flow statement for 2008 and 2007 presented in the consolidated financial statements at 31 December 2008 and prepared on the basis of IAS/IFRS. This shows that the Group absorbed 12.0 million euro in net liquidity in 2008, having generated 31.4 million euro in net liquidity the year before.
31/12/2008 31/12/2007 Changes (in thousands of Euro) (+/-) % Cash and cash equivalents 186,946 155,504 31,442 20.2at the beginning of the year
Net liquidity generated/absorbed 76,157 134,409 - 58,252 -43.3by operating activitiesNet liquidity generated/absorbed 85,066 - 470,904 555,970 -118.1by investing activitiesNet liquidity generated/ -173,235 367,937 -541,172 -147.1absorbed by funding activities
Net liquidity generated/ -12,012 31,442 - 43,454 -138.2absorbed in the year
Cash and cash equivalents 174,934 186,946 -12,012 -6.4at the end of the year
Net liquidity generated by operating activities amounted to 76.2 million euro in 2008 (134.4 million euro in 2007) and is the product of: − liquidity of -2,142.7 million euro absorbed by financial assets (-3,547.1 million euro in 2007)
of which -2,086.7 million euro for increased loans to customers (-4,347.8 million euro in 2007); it is recalled that a total of 968.4 million euro in loans were sold during the year as part of the “Berica 7 Residential MBS” securitization.
− liquidity of 1,941.8 million euro generated by financial liabilities (3,254.2 million euro in 2007);− liquidity of 277.1 million euro generated by operations (427.3 million euro in 2007).

97
With reference to liquidity generated by financial liabilities, deposits from banks decreased by 202 million euro, while amounts due to customers increased by 1,160.5 million euro, debt securities in issue by 387.4 million euro and financial liabilities at fair value by 573.8 million euro.
Net liquidity generated by investing activities amounted to 85.1 million euro in 2008 (-470.9 million euro in 2007). In particular:− liquidity generated by investing activities amounted to 216 million euro (79.4 million euro in
2007), of which 194.3 million euro from the sale of the entire interest in Linea S.p.A.− liquidity absorbed by investing activities amounted to -130.9 million euro (-550.3 million euro
in 2007), of which -85.3 million euro relating to the purchase of a new property in Milan by the subsidiary Monforte S.r.l.
Lastly, net liquidity absorbed by funding activities amounted to -173.2 million euro in 2008 (+367.9 million euro generated in 2007), as follows:− liquidity of 100.6 million euro absorbed to buy back equity instruments and treasury shares
(+436.2 million euro generated in 2007 following the issue of new shares);− liquidity of -72.6 million euro absorbed by paying dividends (-68.3 million euro in 2007).

98
PRINCIPAL EQUITY INVESTMENTS
The Group continued to work in 2008 towards a more rational, effective management of its equity investments, including in relation to the Parent Bank’s co-ordinating role and its assistance to subsidiaries with their own equity investments and partnership agreements.
In completion of the information presented in the section on activities of strategic importance, the principal agreements, acquisitions and disposals relating to equity investments made in 2008 will now be described.
Agreements
Strategically important agreements include the joint venture between Banca Popolare di Vicenza, Azimut and Cattolica Assicurazioni and the renegotiation of the agreement between the BPVi Group and the 21 Investimenti Group, already described in the section on activities of strategic importance.
In May 2008, Banca Popolare di Vicenza made an agreement with Banco di Sicilia S.p.A. (Unicredit Group) to buy a controlling 76.26% interest in IRFIS, a bank based in Palermo that specializes in medium/long-term lending to small and medium businesses. The remaining interest in IRFIS is held by the Region of Sicily (21.00%) and other smaller stockholders (2.74%). The Bank of Italy had not yet authorized the purchase of the controlling interest in IRFIS at 31 December 2008, having requested Banca Popolare di Vicenza to provide it with additional information.
Lastly, the controlling stockholders of Polis Fondi SGR S.p.A. (some of whom are major co-operative banks) entered an agreement in October 2008 to sell a controlling interest in this company to Sopaf S.p.A., a property company listed on the Milan Stock Exchange. Under this agreement Banca Popolare di Vicenza would sell a 9.80% interest in this company; the sale is subject to the Bank of Italy’s authorization.
Corporate actions
Changes in holdings of equity investments during 2008 are described below.
The following changes took place in investments held by the Parent Bank Banca Popolare di Vicenza:
Compagnia Investimenti e Sviluppo S.p.A.Banca Popolare di Vicenza subscribed to its share of a capital increase, from 60 million to 75 million euro, by Compagnia Investimenti e Sviluppo S.p.A. in February 2008. By taking up its rights, the Bank subscribed to 625,000 new shares, thus increasing the value of its investment in this company by 1.25 million euro. The Bank’s equity interest of 4.167% in Compagnia Investimenti e Sviluppo S.p.A. was carried at a value of 6.25 million euro in the balance sheet at 31 December 2008.
Equitalia S.p.A.In the first half of 2008 the Bank was allocated 5 financial instruments with a nominal value of 250 thousand euro in exchange for its interest in S.F.E.T. S.p.A., the company previously responsible for tax collection in Friuli Venezia Giulia; this was the conclusion of an operation

99
that saw Banca Popolare di Vicenza, along with other shareholder banks, sell their interests in S.F.E.T. S.p.A. in September 2006 to Equitalia S.p.A. (a state-controlled company under whom all tax collecting activities have been centralized nationally, having been previously decentralized to regional collection agencies). These instruments, which earn interest for their holders, will be purchased by the public shareholders of Equitalia by the end of 2010.
Veneto Sviluppo S.p.A.The Bank subscribed its share of a capital increase in 2008, which was partly a bonus issue and partly a rights issue; as a result, it subscribed to 23,549 new shares for 235 thousand euro, increasing the carrying amount of the equity investment to 1.5 million euro at 31 December 2008.
Hopa S.p.A.Under a settlement for the repayment of a customer loan, the Bank took over ownership of a package of shares in Hopa S.p.A. worth around 700 thousand euro, thereby increasing its existing interest in this company. The Bank held 1.202% of Hopa S.p.A. at 31 December 2008, with a book value of 3.3 million euro.
Cattolica-BPVI Mediazione Creditizia S.p.A.This company was set up in 2007 under the partnership agreement with Cattolica Assicurazioni for the placement of basic banking products through the latter’s agency network and is owned in equal shares by the two partners. Cattolica Assicurazioni and BPVi paid in a total of 800 thousand euro, split equally between the two, to this company in 2008 in order to strengthen its capital structure; the sum paid in by the Bank has increased the book value of the equity investment to 550 thousand euro at 31 December 2008.
Nuova Merchant S.p.A.Following a recapitalization of Nuova Merchant, in which Banca Nuova S.p.A. did not participate (it used to hold 20% while the other 80% was held by Banca Popolare di Vicenza), Banca Popolare di Vicenza subscribed to all of the new capital stock for 120 thousand euro, thus becoming this company’s sole stockholder at 31 December 2008. The extraordinary stockholders’ meeting of Nuova Merchant resolved on 10 March to transform it legal status from that of an “S.p.A.” (joint stock company) to an “S.r.l.” (limited liability company) with a consequent change of name to “NUOVA MERCHANT S.r.l.”. Capital stock, all of which owned by the sole stockholder Banca Popolare di Vicenza, was reduced and reinstated to the legal minimum of 10,000 euro for limited liability companies. The change of legal status is in preparation for the subsequent merger of Nuova Merchant into Nordest Merchant, the BPVi Group’s other merchant banking company, with the goal of rationalizing corporate structure as set out in the new Business Plan for 2008-2011. The merger will come into effect during the first half of 2009.
Servizi Bancari S.p.A.In December 2008, the Bank sold its banking subsidiaries (Cariprato, Banca Nuova and Farbanca) an overall 3% interest in Servizi Bancari S.p.A., the group company that provides IT and back office services. The sale of this interest, which reduced the Parent Bank’s share from 100% to 97%, was a precursor to transforming the company from a joint stock company into a co-operative and took place at a value based on the company’s equity. Furthermore, in February 2009, with 60 days having passed since filing the resolution of transformation without any opposition from creditors, Servizi Bancari was transformed from a joint stock company into a co-operative; this transformation had been approved in an extraordinary stockholders’ meeting in December 2008 with the aim of optimizing the benefits of rationalizing back office processes for the banking group as a whole. Lastly, on 27 February 2009 Banca Popolare di Vicenza, Cariprato and Banca Nuova formalized the transfer of their respective back offices to Servizi Bancari, as envisaged in the Business Plan for 2008-2011; at the same time, Servizi

100
Bancari transferred its ICT activities to Banca Popolare di Vicenza.
In addition, on 19 December 2008 the extraordinary stockholders’ meetings of Banca Nuova S.p.A. and Cariprato S.p.A. voted to make bonus increases in capital of 12.9 and 50 million euro respectively (with the par value of outstanding shares increased from 3.0 euro to 4.3 euro in the case of Banca Nuova and from 51.65 euro to 76.65 euro in the case of Cariprato), by allocating almost all of the existing “revaluation reserves” to capital stock. This bonus increase in capital has a positive impact on the Tier 1 capital of these two banks, with these reserves now included in Tier 1 capital rather than in Tier 2 like before.
Lastly, the Parent Bank’s Board of Directors decided in December 2008 to transfer Banca Popolare di Vicenza’s interest in Cattolica Assicurazioni from the AFS portfolio to the “Equity investments” portfolio. This transfer is mainly the result of strengthening the strategic and business alliance between these two financial groups in 2008 such that there is now a “significant influence” between our Group and Cattolica Assicurazioni within the meaning of IAS 28. For the purposes of ensuring a consistent accounting treatment between the separate and consolidated financial statements, the entire interest held by BPV Finance (International) Plc in Cattolica Assicurazioni comprising 458,000 shares was transferred to the Parent Bank on 22 December 2008 involving a wholesale market transaction at a carrying amount of 21.5 million euro.
As regards the other banks in the BPVi Group, Cariprato subscribed to a capital increase by Lineapiù S.p.A., a company operating in the textiles and yarn sector, which required an investment of 126 thousand euro, and paid in the remaining 75%, corresponding to 105 thousand euro, of a capital increase by Fidi Toscana S.p.A., a company operating in the collective underwriting of loans, for which the original 25% had been paid in 2007. Banca Nuova subscribed to its 30% share of a capital increase by Farmanuova S.p.A. involving an investment of 122 thousand euro (following on from a previous capital increase for 717 thousand euro in December 2007), raising the book value of this equity investment to 1.1 million euro at 31 December 2008.
Sale of equity investments
Apart from the sale of the equity investment in Linea S.p.A., already described in the section on activities of strategic importance, in January 2008 BPVi sold its 14.44% interest in Santex Holding S.p.A. after the controlling stockholder exercised a call option. Under the terms of the option contact, the Bank received 739 thousand euro for the sale of its 520,000 shares in Santex Holding S.p.A., realizing a capital gain of almost 170 thousand euro.
Other equity investments classified as “available for sale” (AFS)
BPVi purchased 200 thousand shares in Aachener und Munchener Beteiligung A.G. (AMB), corresponding to a 0.37% interest, for 15.6 million euro. This German company, listed on the Frankfurt Stock Exchange, heads up the business of the Generali Group in Germany, and is in turn controlled by its Italian parent. Lastly, in December 2008 the Bank acquired a package of shares representing a 1.95% interest in Banca Profilo S.p.A., a company listed on the Milan Stock Exchange, for 1.3 million euro, and 0.20% of Autostrada Brescia – Verona – Vicenza – Padua S.p.A., manager of the motorway between Brescia and Padua, for 2.2 million euro.

101
EQUITY AND REGULATORY CAPITAL
Consolidated equity pertaining to the Group amounted to 2,729.9 million euro at 31 December 2008, reporting a decrease of 13.0 million euro (-0.5%) since 31 December 2007.
Group equity 31/12/2008 31/12/2007 Changes (in thousands of Euro) (+/-) % Capital stock 261,460 261,656 - 196 -0.1Additional paid-in capital 1,960,355 1,963,297 - 2,942 -0.1Equity instruments 13,104 13,630 - 526 -3.9Valuation reserves 90,362 66,081 24,281 36.7Reserves 392,812 324,487 68,325 21.1Treasury shares - 96,981 - - 96,981 n.s.
Equity 2,621,112 2,629,151 -8,039 -0.3
Net income for 108,739 113,731 - 4,992 -4.4the year pertaining to the Group
Total equity 2,729,851 2,742,882 -13,031 -0.5
The decreases of 196 thousand euro in “capital stock” and of 2,942 thousand euro in “additional paid-in capital” reflect the combined effect of issuing new shares allotted to employees after achieving a specific length of service and of reimbursing shares to estates of deceased members and then cancelling them.
“Equity instruments” of 13.1 million euro at 31 December 2008 refer to the equity component embedded in the convertible bond known as “BPVI 13.a Emissione 2007-2015”, placed by the Parent Bank in July 2007, and reported separately in accordance with IAS 32. The decrease of 526 thousand euro reflects bonds that were bought back but have not yet been resold.
Apart from the changes in fair value recognized in the year for financial instruments classified as “financial assets available for sale”, the increase of 24.3 million euro in the “valuation reserves” mainly reflects: -52.4 million euro for the bonus increase in capital by Banca Nuova and Cassa di Risparmio di Prato in October, using 12.9 and 39.5 million euro respectively in revaluation reserves; +65.7 million euro for cancelling the negative valuation reserves relating to the interest in Cattolica Assicurazioni after reclassifying it to “equity investments” with effect from 31 October 2008.
The “valuation reserves” also include the reserves arising from the valuation of land, buildings and works of art at deemed cost on the first-time adoption of IAS/IFRS, as well as the reserves relating to special revaluation laws.
The increase of 68.3 million euro in other “reserves” reflects +41.1 million euro in allocations of prior year net income to the Group’s reserves, -23.2 million euro for the effects of the first-time consolidation of the interest in Cattolica Assicurazioni at equity, +52.4 million euro for the effect, described above, of reducing the revaluation reserves of the subsidiaries Banca Nuova S.p.A. and Cassa di Risparmio di Prato S.p.A involving a matching increase in other reserves forming part of consolidated equity4 and -2 million euro in other effects. These
(4) Consolidated equity includes not only the Parent Company’s “valuation reserves” but also those of its subsidiaries, in proportion to its interest in such companies. Therefore, every change in the “valuation reserves” of subsidiaries has a corresponding opposite impact on the Group’s “Other reserves”.

102
reserves also include reserves formed from prior year earnings, as well as the positive and negative reserves arising on first-time adoption of IAS-IFRS not recognized in other equity accounts. These reserves also include the former “reserve for general banking risks” recorded pursuant to Decree 87/92 which, in accordance with IAS, has been reclassified to equity.
A total of 1,616,346 treasury shares were held at 31 December 2008 with a value of 97.0 million euro. These were the result of buy-backs in the year using the specific reserve for treasury shares previously set up.
The amount of the Group’s capital is adequate and provides reliable coverage of business risks, while fully satisfying the minimum requirements established by the Supervisory Authorities.
Consolidated regulatory capital is made up as follows:
31/12/2008 31/12/2007 Changes (in milions of Euro) (+/-) % Tier 1 capital 1,559.1 1,529.6 29.5 1.9Tier 2 capital 872.3 906.7 -34.4 -3.8Deductions -18.9 -29.4 10.5 -35.7
Regulatory capital 2,412.5 2,406.9 5.6 0.2Tier 3 capital 12.4 25.8 -13.4 -51.9
Regulatory capital including 2,424.9 2,432.7 -7.8 -0.3Tier 3 capital
The consolidated prudential ratios are as follows:
Capital adeguacy ratios 31/12/2008 31/12/2007 Changes 2008 /2007
Core Tier 1 capital ratio 7.34% 5.96% 1.4 p.p.Tier 1 capital ratio (Tier 1 capital/Risk-weighted assets) 7.34% 5.96% 1.4 p.p.Total capital ratio 11.42% 9.48% 1.9 p.p.(Regulatory capital/ Risk-weighted assets)
Regulatory capital and risk assets were calculated at 31 December 2007 using the previously applicable rules of Basel I, while those at 31 December 2008 have been determined under the rules of Basel II.

103
COMMENTS ON THE INCOME STATEMENT
Despite the most unprecedented financial crisis in recent history, the impact of which started to spill over into the real economy in the last part of the year, the Banca Popolare di Vicenza Group closed 2008 with 108.7 million euro in net income, only 4.4% below the prior year. The Group was able to face the effects of the crisis in a calm fashion thanks to the nature of the Group, comprising banks focused on their core business with deep roots in their home areas, and its time-honoured attention to a solid balance sheet. Consolidated net income primarily reflected the results of core retail banking activities, even if it included the increase in operating costs due to the rapid growth in size in recent years and the prudent policy of providing against risks and charges, especially necessary at times of great uncertainty. Income and expenses not relating to the core business, particularly the capital gain on the sale of the interest in Linea S.p.A., reported a net positive balance of 52 5 million euro and helped further strengthen the Group’s capital base. The good resistance of the Parent Bank’s results and the performance of the subsidiary Banca Nuova, which closed the year with 15.2 million euro in net income (+51.5% on 2007), have supported the Group’s results, despite the loss of 21.7 million euro reported by the subsidiary BPV Finance (which had 2.0 million in net income in 2007) and the modest contribution of 462 thousand euro from the subsidiary Cassa di Risparmio di Prato (12.2 million euro in 2007).
This result, combined with the establishment of adequate capital buffers against risks and further potential for growth thanks to our increase in size in recent years make us moderately optimistic about the future despite the significant uncertainties permeating the environment.
For the purposes of better appreciating the contribution of the various areas of the Group’s operations to consolidated net income, trends in the principal performance indicators during 2008 are discussed below and compared with those in the prior year.
Changes in the scope of consolidation in 2007, particularly the method of consolidating the insurance companies Berica Vita and Vicenza Life, which were consolidated line-by-line up until 31 August 2007 and thereafter at equity, as well as the impact of acquiring 61 branches from the UBI Group at the end of 2007, mean that there are some limits on the comparability of a number of lines in the income statement.
Net interest income
Captions (in thousands of Euro) 31/12/2008 31/12/2007 Changes (+/-) %
10. Interest income and similar revenues 1,533,552 1,256,160 277,392 22.120. Interest expense and similar charges (880,602) (666,324) (214,278) 32.2
30. Net interest income 652,950 589,836 63,114 10.7
Net interest income of 652.9 million euro was 10.7% up on 2007, reflecting higher volumes as well as spread management policies, fostered by the favourable trend in market rates in 2008.
5 Calculated by deducting the amount reported in line item 130 b) “Net impairment adjustments to financial assets avai-lable for sale” (-33.2 million euro) from the sum of line items 240 “Income from equity investments” (86.4 million euro), 250 “net gains (losses) arising on fair value adjustments to tangible and intangible fixed assets” (95 thousand euro), 260 “Adjustments to goodwill” (-1.4 million euro) and 270 “Profits/losses from disposals of investments” (-0.2 million euro).

104
Net interest and other banking income
Captions (in thousands of Euro) 31/12/2008 31/12/2007 Changes (+/-) %
30. Net interest income 652,950 589,836 63,114 10.7
40. Fee and commission income 300,321 304,508 (4,187) -1.450. Fee and commission expense (28,467) (39,092) 10,625 -27.2
60. Net fee and commission income 271,854 265,416 6,438 2.4 70. Dividend and similar income 29,114 38,824 (9,710) -25.080. Net trading income (13,226) (16,329) 3,103 -19.090. Net hedging gains (losses) 461 – 461 n.s.100. Gains (losses) on disposals/ repurchases of: 13,548 6,264 7,284 116.3 a) loans and advances (50) (1) (49) n.s. b) financial assets available for sale (931) 4,538 (5,469) -120.5 d) financial liabilities 14,529 1,727 12,802 741.3110. Net change in financial assets and liabilities at fair value (2,324) (6,845) 4,521 -66.0
120. Net interest and other banking income 952,377 877,166 75,211 8.6
Net interest and other banking income came to 952.4 million euro in 2008, reporting an increase of 8.6% on the prior year. This is a particularly satisfying result in view of the difficult circumstances in which it was achieved.
Net fee and commission income was 2.4% higher than in 2007 at 271.9 million euro. Even this result is gratifying given the growing loss of customer confidence in financial markets and the consequently sharp fall in the acceptance of orders and placement of asset management products. The breakdown of fees and commission by type of business shows a steep contraction in those from placement of personal asset management products but an increase in those from the sale of other products, primarily insurance.
Dividend and similar income of 29.1 million euro was 25.0% lower than in the prior year which had benefited from a number of short-term investment transactions in equities close to their ex-div dates.
Net trading income reported a loss of 13.2 million euro, compared with a loss of 16.3 million euro in the prior year. Given the major turmoil affecting global financial and stock markets in 2008, even if this result is negative it should be seen in a positive light and reflects the particularly prudent, vigilant management of the Group’s trading activities.
Net hedging gains (losses) reported a net gain of 461 thousand euro, having been zero at 31 December 2007.
Losses on disposal of financial assets available for sale (caption 100 b) amounted to 931 thousand euro, compared with gains of 4.5 million euro in the prior year, almost all of which refers to the sale of the sale of shares in Banca Popolare di Intra. Gains on repurchases of financial liabilities (caption 100 d) amounted to 14.5 million euro

105
(compared with 1.7 million euro in 2007) and mostly refer to the repurchase of part of the senior and mezzanine notes relating to the fifth and sixth securitizations organized by the Group, which are “reinstated” in the financial statements.
The net change in financial assets and liabilities at fair value was a negative 2.3 million euro compared with a negative 6.8 million euro in the prior year, with this year’s figure penalized by the negative change in fair value of junior notes relating to the first three of the securitizations organized by the Parent Bank.
Comparison of net interest and other banking income reported in 2008 with the prior year shows increased contributions from net interest income (68.6% versus 67.2%), from net gains on the disposal or repurchase of financial assets and liabilities, caption 100 (1.4% versus 0.7%) and from the net change in financial assets and liabilities at fair value (-0.2% versus -0.8%). Although net trading income made a generally stable contribution (-1.4% versus -1.9%), net fee and commission income made a smaller contribution (28.5% versus 30.3%) as did dividend and similar income (3.1% versus 4.4%).
Net income from financial and insurance activities
Captions (in thousands of Euro) 31/12/2008 31/12/2007 Changes (+/-) %
120. Net interest and other banking income 952,377 877,166 75,211 8.6
130. Net impairment adjustments to: (186,319) (146,291) (40,028) 27.4 a) loans and advances (152,115) (135,843) (16,272) 12.0 b) financial assets available for sale (33,237) (10,022) (23,215) 231.6 d) other financial transactions (967) (426) (541) 127.0
140. Net income from financial activities 766,058 730,875 35,183 4.8
150. Net premium income – 241,177 (241,177) n.s.160. Other insurance income (charges) – (236,330) 236,330 n.s.
170. Net income from financial and insurance activities 766,058 735,722 30,336 4.1
Net income from financial and insurance activities was 4.1% higher at 766.1 million euro, up from 735.7 million euro in the prior year.
Net impairment adjustments to loans and advances were 12.0% higher at 152.1 million euro, up from 135.8 million euro in the prior year, also reflecting increased coverage of impaired loans due to vigilant and prudent policies of credit risk evaluation.
Net impairment adjustments to financial assets available for sale amounted to 33.2 million euro, compared with 10.0 million euro in the prior year. These adjustments include another writedown of 3.4 million euro against the investment in Hopa Spa, taking its carrying amount to 0.25 euro per share. Net impairment adjustments also include 15.3 million euro in writedowns

106
against a structured loan provided under the sale agreement completed in the year relating to all the shares in Linea S.p.A.
Net impairment adjustments to other financial transactions amounted to 967 thousand euro (426 thousand euro in 2007) and refer to adjustments against guarantees and commitments to disburse funds.
Unlike in the prior year, the Group’s consolidated results do not contain any contribution from net income from insurance activities; this is because 50% of Berica Vita and Vicenza Life was sold under the partnership agreement with the Cattolica Assicurazioni Group made in the last quarter of 2007, meaning that these companies are now being consolidated at equity.
Operating costs
Captions (in thousands of Euro) 31/12/2008 31/12/2007 Changes (+/-) %
180. Administrative costs: (672,697) (586,427) (86,270) 14.7 a) payroll (411,516) (349,420) (62,096) 17.8 b) other administrative costs (261,181) (237,007) (24,174) 10.2190. Net provisions for risks and charges (22,464) (41,092) 18,628 -45.3200. Net adjustments to property, plant and equipment (20,427) (17,401) (3,026) 17.4210. Net adjustments to intangible assets (5,729) (3,752) (1,977) 52.7220. Other operating charges/income 42,453 60,074 (17,621) -29.3
230. Operating costs (678,864) (588,598) (90,266) 15.3
Operating costs were 15.3% higher at 678.9 million euro, reflecting the natural effects of the Group’s recent growth in size.
Analysis of the different components of cost reveals that payroll increased by 17.8% on 2007 to 411.5 million euro, mainly because of the cost of staff in the former UBI branches (not included at 31 December 2007), new recruits to staff newly opened branches and the costs for accessing the Law 449/1997 solidarity fund during the year. Other administrative costs climbed by 10.2% to 261.2 million euro, reflecting the costs of the new branches acquired from the UBI Group and higher costs associated with internally-driven expansion.
Net provisions for risks and charges amounted to 22.5 million euro and were 45.3% lower than at 31 December 2007; last year’s figure included major provisions against possible negative outcomes on certain types of financial products acquired from customers, which, given the state of financial markets, had suggested making suitable provisions against the related risks.
Net adjustments to property, plant and equipment increased by 17.4% from 17.4 million euro in 2007 to 20.4 million euro in 2008, while those to intangible assets increased by 52.7% from 3.8 to 5.7 million euro; the increase in net adjustments to intangible assets mostly reflects higher amortization (of 1.6 million euro) after allocating 24.1 million euro of the purchase price paid for acquiring the former UBI branches to “intangibles” (which reduced the amount provisionally booked to goodwill in the prior year and reflects the value of the acquired relationships), in compliance with the treatment envisaged by IFRS 3 “Business combinations”.

107
Other operating charges/income reported 42.5 million euro in net income, down 29.3% on 60.1 million euro in 2007, partly due to costs of closing out early certain financial instruments subscribed by customers and costs of renegotiating securitized mortgage loans.
The cost/income ratio1 was 70.25% compared with 64.83% in 2007.
Profit (loss) from current operations before tax
Captions (in thousands of Euro) 31/12/2008 31/12/2007 Changes (+/-) %
240. Profit (loss) from equity investments 86,445 46,911 39,534 84.3250. Net gains (losses) arising on fair value adjustments to property, plant and equipment and intangible assets 95 172 (77) -44.8260. Adjustments to goodwill (1,386) (660) (726) 110.0270. Gains (losses) on disposal of investments (201) 645 (846) -131.2
280. Profit (loss) from current operations before tax 172,147 194,192 (22,045) -11.4
Profit (loss) from current operations before tax was 11.4% below the prior year at 172.1 million euro.
Profits from equity investments amounted to 86.4 million euro, compared with 46.9 million euro in 2007, and reflect the capital gain of 91.6 million euro realized on the disposal of the entire interest in Linea S.p.A. to Compass S.p.A., less the losses for the year of certain associates consolidated at equity.
Net gains (losses) arising on fair value adjustments to property, plant and equipment and intangible assets reported immaterial amounts.
Adjustments to goodwill amounted to 1.4 million euro, compared with 660 thousand euro in the prior year, and reflect the recognition of impairment losses on all the remaining goodwill arising on consolidation relating to the subsidiary Nuova Merchant.
Lastly, losses on disposal of investments amounted to 201 thousand euro compared with gains of 645 thousand euro in the prior year.
1 This indicator reports administrative costs (caption 180) plus net adjustments to property, plant and equipment and intangible assets (captions 200 and 210) as a proportion of net interest and other banking income (caption 120) plus other operating charges/income (caption 220).

108
Net income for the year pertaining to the Parent Bank
Captions (in thousands of Euro) 31/12/2008 31/12/2007 Changes (+/-) %
280. Profit (loss) from current operations before tax 172,147 194,192 (22,045) -11.4
290. Income taxes on current operations (61,092) (76,652) 15,560 -20.3
300. Profit (loss)from current operations after tax 111,055 117,540 (6,485) -5.5
320. Net income for the year 111,055 117,540 (6,485) -5.5
330. Minority interests (2,316) (3,809) 1,493 -39.2
340. Net income (loss) for the year pertaining to the parent bank 108,739 113,731 (4,992) -4.4
Income taxes amounted to 61.1 million euro (with a tax rate of 35.5%), compared with 76.7 million euro in 2007 (with a tax rate of 39.5%).
Following the above charge for tax, profit (loss) from current operations after tax and net income for the year amounted to 111.1 million, down 5.5% on the prior year.
Net income pertaining to minority interests in subsidiary companies came to 2.3 million euro compared with 3.8 million euro in 2007, while net income for the year pertaining to the Parent Bank was 108.7 million euro, down 4.4% on the prior year.

109
Reconciliation of equity and net income of the Parent Bank with the related consolidated amounts
The following table reconciles equity and net income reported in the Parent Bank’s individual financial statements for 2008 with the corresponding figures in the consolidated financial statements.
31/12/2008 31/12/2007 Equity of which: net Equity of which: net(in thousands of Euro) profit for the year profit for the year
Parent bank's financial statement 2,844,153 151,035 2,783,607 110,090
Year results pertainingto the Group, as to:
- companies consolidated line-by-line -17,030 -17,030 33,214 33,214- companies valued at shareholders’equity -948 -948 12,757 12,757
Differences comparedto carrying values, as to:
- companies consolidated line-by-line -3,838 23,226 - 24,323 - 415- companies valued at shareholders’equity -28,419 -19,305 7,729 - 776
Write-off of dividendscollected during the year from:
- companies consolidated line-by-line -27,688 - 33,218- companies valued at shareholders’equity -2,943 - 8,608
Derecognitionof intercompany profit and loss 10,474 2,226 4,606 1,859
Derecognition of intercompanycapital gains from discontinuingand contributing operations -83,831 -66 - 83,765 82
Other consolidation adjustments 9,290 232 9,057 - 1,254
Consolidated financial statement 2,729,851 108,739 2,742,882 113,731
Consolidated equity pertaining to the Parent Bank of 2,729.9 million euro is 114.3 million euro lower than that reported in the Parent Bank’s individual financial statements. The changes in consolidated equity are detailed in a specific schedule forming part of the consolidated financial statements.
Consolidated net income for the year pertaining to the Parent Bank of 108.7 million euro is 42.3 million euro lower than that reported in the Parent Bank’s individual financial statements; this difference mainly reflects the negative contribution by the subsidiaries BPV Finance (-21.7 million euro after consolidation adjustments) and Nuova Merchant (-4.9 million euro after consolidation adjustments) which were affected by the difficulties on financial markets, and the smaller amount of the capital gain reported for consolidation purposes (-19.4 million euro) on the sale of all the shares in Linea S.p.A. during the year.

110
Information relating to the ownership and sale of treasury shares
Information relating to treasury shares of the Parent Bank and of companies included in the consolidation is provided in the explanatory notes.
Audit of the consolidated financial statements
The Parent Bank has had its individual and consolidated financial statements audited by KPMG SpA, who were reappointed as the Group’s auditors for the three-year period 2008-2011 at the stockholders’ meeting held on 19 April 2008, with the approval of the Board of Statutory Auditors.

111
PERFORMANCE OF BPVi GROUP COMPANIES
Highlights from the 2008 balance sheets and income statements of the Group’s companies are presented and discussed below.
The principal aggregates of each of the Group’s banking subsidiaries are presented below, thereby putting them into perspective within the Group as a whole and providing an overview of the scale of its banking activities.
Intercompany transactions and balances have not been eliminated from these figures.
Items BPVi Banca Cariprato Farbanca Gruppo(in thousands of Euro) Nuova BPVi 1
Loans to customers 16,018 2,856 3,394 319 22,705Direct deposits 15,051 3,494 2,871 95 21,406Indirect deposits 12,926 1,271 1,671 21 15,890Equity 2,844 210 279 37 2,730Net income for the year 151.0 15.2 0.5 2.7 108.7Number of outlets 2 455 128 97 1 681Number of branches 436 106 94 1 637Number of employees 3 3,508 899 990 29 5,645
Performance of the Parent Bank
Direct deposits
Direct deposits, excluding “liabilities for assets sold but not derecognized”, amounted to 14,271 million euro at 31 December 2008, reporting an increase of 12.2% on the year before (+8.4% including “liabilities for assets sold but not derecognized”).
Direct deposits 31/12/2008 31/12/2007 Changes (in millions of Euro) (+/-) %
Current accounts and unrestricted deposits 5,946 5,344 602 11.3Current accounts and restricted deposits 200 22 178 809.1Repurchase agreements and other payables 575 604 -29 -4.8Bonds 7,386 6,571 815 12.4Certificates of deposit and other securities 164 180 -16 -8.9
sub-total 14,271 12,721 1,550 12.2Liabilities for assets soldbut not derecognized 780 1,164 -384 -33.0
Total direct deposits 15,051 13,885 1,166 8.4.
1 The Group’s figures refer to the consolidated financial statements and not to the sum of the companies presented above.2 The number of outlets includes bank branches, money shops and private banking offices.3 As of 31 December 2008.

112
The changes in the different types of direct deposit reflect strong growth in “bonds” (+12.4%) and “current accounts and unrestricted deposits” (+11.3%), but a contraction in “repurchase agreements and other payables” (-4.8%). This downward trend in repurchase agreements in favour of other types of funding is a positive sign in terms of liquidity, with the Bank closing such funding transactions with lending transactions generally in the same technical form. “Certificates of deposit and other securities” and “current accounts and restricted deposits” have settled for some time now at much reduced levels: while the former posted a decrease over the twelve months of 8.9%, the later grew by 178 million euro in absolute terms (+809.1%).
With reference to the Bank’s own bond issues, which account for 49% of all direct deposits, the Bank made no new issues in the year under its European Medium Term Notes programme, after issuing more than 1,815 million euro in notes in 2007; consequently, the entire change for the year is attributable to ordinary placement activities with retail customers, with obvious benefits in terms of diversification of the sources and cost of funding.
“Liabilities for assets sold but not derecognized” were 33.0% lower than at 31 December 2007. These relate to the “Berica 5 Residential MBS” and “Berica 6 Residential MBS” securitizations arranged in 2004 and 2006 respectively, which, as discussed in the section on loans, have been “reinstated” in the balance sheet, as required by IAS 39. In fact, they represent notes issued by vehicle companies that are backed by securitized home mortgages; their decrease since 31 December 2007 reflects partial repayment of such securities and the Bank’s repurchase of 208.9 million euro in senior and mezzanine notes issued as part of the above securitizations which have consequently been derecognized.
With reference to the latest securitization known as “Berica 7 Residential MBS”, carried out in November 2008 and also “reinstated” in the balance sheet under IAS 39, since all the related asset backed securities (ABS) were subscribed by the originator banks (BPVi, Banca Nuova and Cariprato), no “liabilities for assets sold but not derecognized” have been recognized.

113
Indirect deposits
Indirect deposits had a total market value of 12,926 million euro at 31 December 2008, reporting a decrease of 14.4% on a year earlier.
This aggregate has been seriously affected by the recent turmoil on financial markets and the decline in its value is almost entirely attributable to negative performance in the asset management sector, which although accounting for only 19% of all indirect deposits, posted an absolute decrease in value of 1,792 million euro over the year (-42.2%). Assets under administration, which represent 69% of the total aggregate, also reported a negative performance although not as large (-5.2%). Pension premiums, accounting for 12% of total indirect deposits, increased by 7.2% over the year, reflecting the benefits of partnership with the Cattolica Assicurazioni Group.
Indirect deposits 31/12/2008 31/12/2007 Changes (in millions of Euro) (+/-) %
Mutual funds 1,993 3,148 -1,155 -36.7Personal asset management 457 1,094 -637 -58.2Pension premiums 1,536 1,433 103 7.2Shares 1,202 1,938 -736 -38.0Other securities 4,029 3,773 256 6.8Treasury shares 3,709 3,722 -13 -0.3
Total indirect deposits 12,926 15,108 -2,182 -14.4
assets under management 2,450 4,242 -1,792 -42.2retirement savings 1,536 1,433 103 7.2assets under administration 8,940 9,433 -493 -5.2
Looking at the various forms of indirect deposits, the sharp contraction in assets under management, which for some time has witnessed a reduction in volumes due to investor disaffection for this sector, reflects decreases in both “mutual funds” (-36.7%) and “personal asset management” (-58.2%). With regard to assets under administration, “shares” were 38.0% lower mainly because of the steep drop in global share prices, while “other securities” were 6.8% higher. “Treasury shares” were generally stable. Lastly, “pension premiums” posted an annual increase of 7.2% to 1,536 million euro at 31 December 2008.

114
Loans to customers
The volume of loans to businesses and households in our home regions continued to grow in a satisfactory fashion in 2008, all of which was funded by the growth in direct deposits from customers.
Loans to customers 31/12/2008 31/12/2007 Changes (in millions of Euro) (+/-) %
Ordinary current accounts 3,265 3,194 71 2.2Mortgage loans 5,910 5,364 546 10.2Syndicated loans 1,541 1,468 73 5.0Import/export loans 1,177 1,132 45 4.0Other loans 2,160 2,332 -172 -7.4Debt securities 48 18 30 166.7Repurchase agreements 47 7 40 571.4Net non-performing loans 1 193 207 -14 -6.8
sub-total 14,341 13.722 619 4.5Assets sold but not derecognized 1,677 1.191 486 40.8
Total net loans 16,018 14,913 1,105 7.41 This does not include non-performing loans related to “assets sold but not derecognized”.
Net of impairment adjustments, loans to customers increased by 7.4% on the prior year to 16,018 million euro at 31 December 2008 (+4.5% excluding “assets sold but not derecognized”).
In terms of individual lending products, almost all the different technical forms grew despite the economic slowdown. In particular, “mortgage loans” grew by 10.2%, “ordinary current accounts” by 2.2%, “syndicated loans” by 5.0% and “import-export loans” by 4.0%. The increase in “debt securities” (+166.7%) is mainly due to the reclassification in the year of certain financial instruments previously classified as “financial assets available for sale”; this reclassification was permitted under the amendments to IAS 39 endorsed in Regulation EC 1004/2008, as already discussed in an earlier section of this report.
“Repurchase agreements”, of relatively immaterial absolute amount, were 40 million euro higher (+571.4%), while “other loans” were 7.4% lower.

115
“Mortgage loans” grew at a slower pace than in the past, reflecting a contraction in individual customer demand throughout the banking industry as a whole, and the new securitization carried out in November 2008, under which BPVi, Banca Nuova and Cariprato sold a total of 968.4 million euro in performing residential mortgage loans (of which 682.4 million euro related to BPVi) to a special purpose entity called “Berica 7 Residential MBS Srl”. Like the “Berica 5 Residential Mbs” and “Berica 6 Residential MBS” securitizations, this securitization does not meet the derecognition requirements of IAS;6 accordingly, the residual securitized assets have been “reinstated” in the financial statements at 31 December 2008 as “assets sold but not derecognized” (which have therefore increased by 486 million euro (+40.8%).
“Mortgage loans” nonetheless continued to represent around 37% of total loans (and over 47% including the securitized mortgages classified in “assets sold but not derecognized”).
Credit risk indicators have deteriorated throughout the banking industry in the wake of the financial market crisis in the second half of the year and the resulting deterioration in an already weak economy. These events have had a negative impact on the quality of the Bank’s loan book, which has deteriorated somewhat at the end of 2008 relative to 31 December 2007. This deterioration, expressed in terms of the ratio between impaired loans and total loans, was less than for the banking industry as a whole.
Impaired loans to customers (net of adjustments and including any impaired loans classified as “assets sold but not derecognized”) were 62.5 million euro higher (+12.5%) at 31 December 2008 than a year earlier; however, as a percentage of total net loans, impaired loans increased by just 0.16 percentage points, from 3.34% at 31 December 2007 to 3.50% at the end of 2008. The ratio of net non-performing loans to net loans to customers was 1.38%, marking an improvement of 0.10 percentage points on the figure of 1.48% reported at the end of 2007.
6 With regard to the other securitizations carried out before 1 January 2004, the securitized assets were not reinstated on the first-time adoption of IAS 39, as allowed by paragraph 27 of IFRS 1.
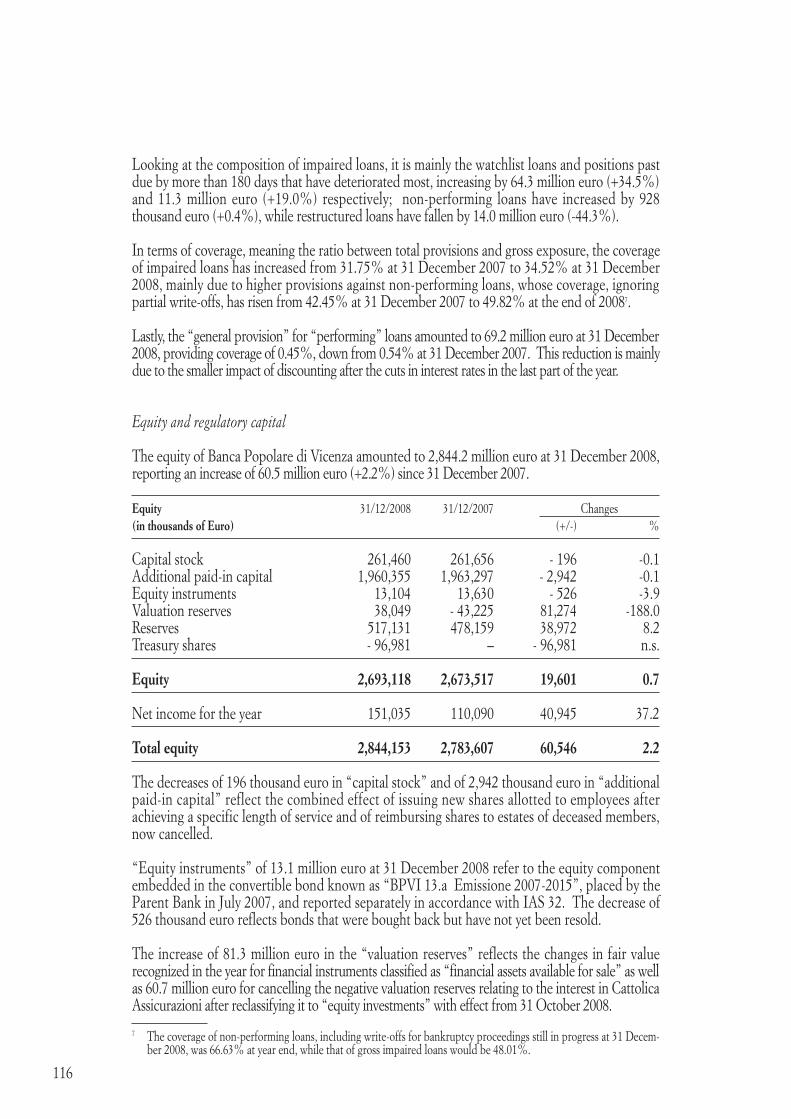
116
Looking at the composition of impaired loans, it is mainly the watchlist loans and positions past due by more than 180 days that have deteriorated most, increasing by 64.3 million euro (+34.5%) and 11.3 million euro (+19.0%) respectively; non-performing loans have increased by 928 thousand euro (+0.4%), while restructured loans have fallen by 14.0 million euro (-44.3%).
In terms of coverage, meaning the ratio between total provisions and gross exposure, the coverage of impaired loans has increased from 31.75% at 31 December 2007 to 34.52% at 31 December 2008, mainly due to higher provisions against non-performing loans, whose coverage, ignoring partial write-offs, has risen from 42.45% at 31 December 2007 to 49.82% at the end of 20087.
Lastly, the “general provision” for “performing” loans amounted to 69.2 million euro at 31 December 2008, providing coverage of 0.45%, down from 0.54% at 31 December 2007. This reduction is mainly due to the smaller impact of discounting after the cuts in interest rates in the last part of the year.
Equity and regulatory capital
The equity of Banca Popolare di Vicenza amounted to 2,844.2 million euro at 31 December 2008, reporting an increase of 60.5 million euro (+2.2%) since 31 December 2007.
Equity 31/12/2008 31/12/2007 Changes (in thousands of Euro) (+/-) %
Capital stock 261,460 261,656 - 196 -0.1Additional paid-in capital 1,960,355 1,963,297 - 2,942 -0.1Equity instruments 13,104 13,630 - 526 -3.9Valuation reserves 38,049 - 43,225 81,274 -188.0Reserves 517,131 478,159 38,972 8.2Treasury shares - 96,981 – - 96,981 n.s.
Equity 2,693,118 2,673,517 19,601 0.7
Net income for the year 151,035 110,090 40,945 37.2
Total equity 2,844,153 2,783,607 60,546 2.2
The decreases of 196 thousand euro in “capital stock” and of 2,942 thousand euro in “additional paid-in capital” reflect the combined effect of issuing new shares allotted to employees after achieving a specific length of service and of reimbursing shares to estates of deceased members, now cancelled.
“Equity instruments” of 13.1 million euro at 31 December 2008 refer to the equity component embedded in the convertible bond known as “BPVI 13.a Emissione 2007-2015”, placed by the Parent Bank in July 2007, and reported separately in accordance with IAS 32. The decrease of 526 thousand euro reflects bonds that were bought back but have not yet been resold.
The increase of 81.3 million euro in the “valuation reserves” reflects the changes in fair value recognized in the year for financial instruments classified as “financial assets available for sale” as well as 60.7 million euro for cancelling the negative valuation reserves relating to the interest in Cattolica Assicurazioni after reclassifying it to “equity investments” with effect from 31 October 2008.
7 The coverage of non-performing loans, including write-offs for bankruptcy proceedings still in progress at 31 Decem-ber 2008, was 66.63% at year end, while that of gross impaired loans would be 48.01%.

117
The “valuation reserves” also include the reserves arising from the valuation of land, buildings and works of art at deemed cost on the first-time adoption of IAS/IFRS, together with the reserves relating to special revaluation laws.
The increase of 39.0 million euro in other “reserves” reflects 37.5 million euro in allocations of prior year net income to the Group’s reserves, and 1.5 million euro in other changes. These reserves also include reserves formed from prior year earnings, as well as the positive and negative reserves arising on first-time adoption of IAS-IFRS not recognized in other equity accounts. They also include the former “reserve for general banking risks” recorded pursuant to Decree 87/92 which, in accordance with IAS, has been reclassified to equity.
A total of 1,616,346 treasury shares were held at 31 December 2008 with a value of 97.0 million euro. These were the result of buy-backs in the year using the specific reserve for treasury shares previously set up.
Capital stock comprised 69,722,736 shares at 31 December 2008 compared with 69,775,066 at 31 December 2007, reporting a net decrease of 52,330 reflecting the issue of 5,620 new shares to employees upon reaching a specific length of service and the cancellation of 57,950 shares. Excluding the 1,616,346 treasury shares held by the Bank, the number of outstanding shares at 31 December 2008 was 68,106,390.
The shares of the Bank, which is one of the Relevant Issuers listed in CONSOB Resolutions 11.768/98 and 11.862/99, are dematerialized and centralized with Monte Titoli, in accordance with the provisions of Decree 58/98 and Decree 213/98.
The following table reports the Bank’s purchases and sales of its shares in accordance with art. 18 of the articles of association.
Treasury shares Number % on Equity 1 Amount of shares (in thousands of Euro)
31/12/07 – – –Purchases 5,211,730 7.47 312,704 Sales 3,595,384 5.15 215,723 31/12/2008 1,616,346 2.32 96,981
Capital stock at 31 December 2008 was held by 53,329 Members; this was 849 more than at 31 December 2007, reflecting the admission of 3,234 new Members in the year and the departure of 2,385 Members.
1 % determined with reference to the number of shares outstanding at year end.

118
The amount of the Bank’s capital is adequate and provides reliable coverage of business risks, while satisfying the minimum requirements established by the Supervisory Authorities.
The Bank’s regulatory capital is made up as follows:
(in millions of Euro) 31/12/2008 31/12/2007 Changes (+/-) %
Tier 1 capital 2,061.8 1,963.9 97.9 5.0Tier 2 capital 823.9 728.1 95.8 13.2Deductions -26.8 -26.8 0.0 0.0
Regulatory capital 2,858.9 2,665.2 193.7 7.3
The prudential ratios are as follows:
Capital adeguacy ratios 31/12/2008 31/12/2007 var. 2008 /2007
Core Tier 1 capital ratio 12.04% 9.69% 2.4 p.p.Tier 1 capital ratio(Tier 1 capital/Risk-weighted assets) 12.04% 9.69% 2.4 p.p.Total capital ratio(Regulatory capital/ Risk-weighted assets) 16.70% 13.15% 3.6 p.p.
Regulatory capital and risk assets were calculated at 31 December 2007 using the previously applicable rules of Basel I, while those at 31 December 2008 have been determined under the rules of Basel II.
Comments on the income statement
Banca Popolare di Vicenza closed 2008 with 151.0 million euro in net income, 37.2% above the prior year. This result is more than satisfactory in view of the context in which it was achieved, with the most unprecedented financial crisis in recent history starting to spill over into the real economy in the last part of the year. The Bank was able to face the effects of the crisis in a calm fashion thanks to its focus on core business and its deep roots in its home areas, combined with time-honoured attention to a solid balance sheet. Net income primarily reflected the results of core retail banking activities and careful management of the Bank’s own portfolios, even if it included the increase in operating costs due to the rapid growth in size in recent years and the prudent policy of providing against risks and charges, especially necessary at times of great uncertainty. Income and expenses not relating to the core business, particularly the capital gain on the sale of the interest in Linea S.p.A., reported a net positive balance of 728 million euro and helped further strengthen the Group’s capital base. This result, combined with the good resistance of the core business, the establishment of adequate capital buffers against risks and further potential for growth thanks to our increase in size in recent years make us moderately optimistic about the future despite the significant uncertainties permeating the environment.
8 Calculated by deducting the amount reported in line item 130 b) “Net impairment adjustments to financial assets available for sale” (-24.5 million euro) from the sum of line items 210 “Income from equity investments” (97.1 million euro) and 240 “Profits/losses from disposals of investments” (-0.2 million euro).

119
For the purposes of better appreciating the contribution of the various areas of the Bank’s operations to net income, trends in the principal performance indicators during 2008 are discussed below and compared with those in the prior year. Al fine di meglio interpretare il contributo delle varie aree di attività alla formazione del risultato d’esercizio, si illustrano, nel prosieguo, le dinamiche delle principali grandezze economiche nel corso dell’esercizio 2008, comparate con quelle dello scorso anno.
Net interest income
Caption (in thousands of Euro) 31/12/2008 31/12/2007 Changes (+/-) %
10. Interest income and similar revenues 1,110,538 877,720 232,818 26.520. Interest expense and similar charges (704,906) (522,448) (182,458) 34.9
30. Net interest income 405,632 355,272 50,360 14.2
Net interest income of 405.6 million euro was 14.2% up on 2007, reflecting higher volumes as well as spread management policies, fostered by the favourable trend in market rates in 2008.
Net interest and other banking income
Captions (in thousands of Euro) 31/12/2008 31/12/2007 Changes (+/-) %
30. Net interest income 405,632 355,272 50,360 14.2
40. Fee and commission income 194,894 193,435 1,459 0.850. Fee and commission expense (17,325) (18,446) 1,121 -6.1
60. Net fee and commission income 177,569 174,989 2,580 1.5
70. Dividend and similar income 55,340 68,299 (12,959) -19.0%80. Net trading income 1,485 (18,437) 19,922 n.s.90. Net hedging gains (losses) 273 – 273 n.s.100. Gains (losses) on disposals/ repurchases of: 17,670 5,122 12,548 245.0 a) loans and advances (38) (17) (21) 123.5 b) financial assets available for sale 3,961 4,055 (94) -2.3 d) financial liabilities 13,747 1,084 12,663 n.s.110. Net change in financial assets and liabilities at fair value (3,723) (2,566) (1,157) 45,1
120. Net interest and other banking income 654,246 582,679 71,567 12.3
120
Net interest and other banking income came to 654.2 million euro in 2008, reporting an increase of 12.3% on the prior year. This is a particularly satisfying result in view of the difficult circumstances in which it was achieved.
Net fee and commission income was 1.5% higher than in 2007 at 177.6 million euro. Even this result is gratifying given the growing loss of customer confidence in financial markets and the consequently sharp fall in the acceptance of orders and placement of asset management products. The breakdown of fees and commission by type of business shows a steep contraction in those from placement of personal asset management products but an increase in those from the sale of other products, primarily insurance.
Dividend and similar income of 55.3 million euro was 19.0% lower than in the prior year which had benefited from a number of short-term investment transactions in equities close to their ex-div dates.
Net trading income reported a profit of 1.5 million euro, compared with a loss of 18.4 million euro in the prior year. Given the major turmoil affecting global financial and stock markets in 2008, this result should be seen in a positive light and reflects the particularly prudent, vigilant management of the Bank’s trading activities.
Net hedging gains (losses) reported a net gain of 273 thousand euro, having been zero at 31 December 2007.
Gains on disposal of financial assets available for sale (Caption 100 b) amounted to 4.0 million euro, staying generally in line with the prior year (-2.3%).
Gains on repurchases of financial liabilities (caption 100 d) amounted to 13.7 million euro (compared with 1.1 million euro in 2007) and mostly refer to the repurchase of part of the senior and mezzanine notes relating to the fifth and sixth securitizations organized by the Group, which are “reinstated” in the financial statements.
The net change in financial assets and liabilities at fair value was a negative 3.7 million euro, compared with a negative 2.6 million euro in the prior year, with this year’s figure penalized by the negative change in the fair value of junior notes relating to the first three of the securitizations organized by the Parent Bank.
Comparison of net interest and other banking income reported in 2008 with the prior year shows increased contributions from net interest income (62.0% versus 61.0%), from net gains on the disposal or repurchase of financial assets and liabilities, caption 100 (2.7% versus 0.9%) and from net trading income (0.3% versus -3.2%). Although the net change in financial assets and liabilities at fair value made a generally stable contribution (-0.6% versus -0.4%), net fee and commission income made a smaller contribution (27.1% versus 30.0%) as did dividend and similar income (8.5% versus 11.7%).

121
Net income from financial activities
Captions (in thousands of Euro) 31/12/2008 31/12/2007 Changes (+/-) %
120. Net interest and other banking income 654,246 582,679 71,567 12.3
130. Net impairment adjustments to: (126,710) (112,206) (14,504) 12.9 a) loans and advances (101,313) (102,790) 1,477 -1.4 b) financial assets available for sale (24,475) (9,117) (15,358) 168.5 d) other financial transactions (922) (299) (623) 208.4
140. Net income from financial activities 527,536 470,473 57,063 12.1
Net income from financial activities amounted to 527.5 million euro compared with 470.5 million euro in the prior year, posting an increase of 12.1%.
Net impairment adjustments to loans and advances were 1.4% lower at 101.3 million euro, down from 102.8 million euro in the prior year.
Net impairment adjustments to financial assets available for sale amounted to 24.5 million euro, compared with 9.1 million euro in the prior year. These adjustments include another writedown of 3.4 million euro against the investment in Hopa Spa, taking its carrying amount to 0.25 euro per share. Net impairment adjustments also include 15.3 million euro in writedowns against a structured loan provided under the sale agreement completed in the year relating to all the shares in Linea S.p.A.
Net impairment adjustments to other financial transactions amounted to 922 thousand euro (299 thousand euro in 2007) and refer to adjustments against guarantees and commitments to disburse funds.
Operating costs
Captions (in thousands of Euro) 31/12/2008 31/12/2007 Changes (+/-) %
150. Administrative costs: (433,704) (372,363) (61,341) 16.5 a) payroll (254,337) (209,897) (44,440) 21.2 b) other administrative costs (179,367) (162,466) (16,901) 10.4160. Net provisions for risks and charges (15,332) (26,105) 10,773 -41.3170. Net adjustments to property, plant and equipment (7,456) (5,673) (1,783) 31.4180. Net adjustments to intangible assets (4,430) (2,199) (2,231) 101.5190. Other operating charges/income 26,831 42,339 (15,508) -36.6
200. Operating costs (434,091) (364,001) (70,090) 19.3

122
Operating costs were 19.3% higher at 434.1 million euro, reflecting the natural effects of the Bank’s recent growth in size.
Analysis of the different components of cost reveals that payroll increased by 21.2% on 2007 to 254.3 million euro, mainly because of the cost of staff in the former UBI branches (not included at 31 December 2007) and of new recruits to staff newly opened branches. Other administrative costs climbed by 10.4% to 179.4 million euro, reflecting the costs of the new branches acquired from the UBI Group and higher costs associated with internally-driven expansion.
Net provisions for risks and charges amounted to 15.3 million euro and were 41.3% lower than at 31 December 2007; last year’s figure included major provisions against possible negative outcomes on certain types of financial products acquired from customers, which, given the state of financial markets, had suggested making suitable provisions against the related risks.
Net adjustments to property, plant and equipment increased by 31.4% from 5.7 million euro in 2007 to 7.5 million euro in 2008, while those to intangible assets increased by 101.5% from 2.2 to 4.4 million euro; the increase in net adjustments to intangible assets mostly reflects higher amortization (of 1.6 million euro) after allocating 24.1 million euro of the purchase price paid for acquiring the former UBI branches to “intangibles” (which reduced the amount provisionally booked to goodwill in the prior year and reflects the value of the acquired relationships), in compliance with the treatment envisaged by IFRS 3 “Business combinations”.
Other operating charges/income reported 26.8 million euro in net income, down 36.6% on 42.3 million euro in 2007, partly due to costs of closing out early certain financial instruments subscribed by customers and costs of renegotiating securitized mortgage loans.
The cost/income ratio1 was 65.42% compared with 60.84% in 2007.
Profit (loss) from current operations before tax
Captions (in thousands of Euro) 31/12/2008 31/12/2007 Changes (+/-) %
210. Profit (loss) from equity investments 97,070 42,628 54,442 127.7240. Gains (losses) on disposal of investments (178) 9 (187) n.s.
250. Profit (loss) from current operations before tax 190,337 149,109 41,228 27.6
Profit (loss) from current operations before tax was 27.6% above the prior year at 190.3 million euro.
Profit from equity investments amounted to 97.1 million euro, compared with 42.6 million euro in 2007, and reflects the capital gain of 110.0 million euro realized on the disposal of the entire interest in Linea S.p.A. to Compass S.p.A., less the impairment losses recognized against the value of certain subsidiaries.
1 This indicator reports administrative costs (caption 150) plus net adjustments to property, plant and equipment and intangible assets (captions 170 and 180) as a proportion of net interest and other banking income (caption 120) plus other operating charges/income (caption 190).

123
Lastly, losses on disposal of investments amounted to 178 thousand euro compared with gains of 9 thousand euro in the prior year.
Net income for the year
Captions (in thousands of Euro) 31/12/2008 31/12/2007 Changes (+/-) %
250. Profit (loss) from current operations before tax 190,337 149,109 41,228 27.6
260. Income taxes on current operations (39,302) (39,019) (283) 0.7
270. Profit (loss) from current operations after tax 151,035 110,090 40,945 37.2
290. Net income for the year 151,035 110,090 40,945 37.2
Income taxes amounted to 39.3 million euro (with a tax rate of 20.6%), compared with 39.0 million euro in 2007 (with a tax rate of 26.2%).
Following the above charge for tax, profit (loss) from current operations after tax and net income for the year amounted to 151.0 million euro, up 37.2% on the prior year.
Performance of other group banks
Banca Nuova S.p.A.
Balance sheet and income statement highlights 31/12/2008 31/12/2007 Change (in millions of euro) (+/-) %
Balance sheet highlightsDirect deposits 3,494.5 2,887.1 607.4 21.0Indirect deposits 1,271.4 1,333.5 -62.1 -4.7Loans to customers 2,856.3 2,520.3 336.0 13.3Total Assets 4,087.8 3,263.0 824.8 25.3Risk-weighted assets (RWA) 2,214.0 2,371.8 -157.8 -6.7Equity(including net income for the year) 210.3 205.0 5.3 2.6Regulatory capital 186.4 194.4 -8.0 -4.1
Income statement highlightsNet interest income 98.9 91.8 7.1 7.7Net interestand other banking income 144.4 136.9 7.5 5.5Operating costs -108.0 -103.4 -4.6 4.4
of which: payroll -60.1 -55.1 -5 9.1Net income for the year 15.2 10.0 5.2 52.0

124
Other information 31/12/2008 31/12/2007 Change (+/-) %
Number of employees at year-end 899 850 49 5.8Number of branches 106 106 0 0.0
Key performance indicators 31/12/2008 31/12/2007 Change 2008/2007
Structure ratios (%)Loans to customers / Total assets 69.9% 77.2% -7.3 p.p.Direct deposits / Total assets 85.5% 88.5% -3.0 p.p.Loans to customers / Direct deposits 81.7% 87.3% -5.6 p.p.
Profitability and efficiency ratios(%)Net income for the year /Equity excluding net income for the year (ROE) 7.8% 5.1% 2.7 p.p.Net income for the year /Total average assets (ROAA) (1) 0.4% 0.3% 0.1 p.p.Cost/Income (2) 74.2% 72.1% 2.1 p.p.
Productivity ratios (3)
Direct deposits per employee (in millions of euro) 4.0 3.4 17.1%Loans to customers per employee (in millions of euro) 3.3 3.0 9.7%Net interest and other banking income per employee (in thousands of euro) 165.8 162.4 2.1%
Risk ratios (%)Net impaired loans/Net loans 3.70% 3.49% 0.21 p.p.Net non-performing loans/Net loans 1.67% 1.67% 0.00 p.p.Non-performing loans coverage (%) 57.38% 57.10% 0.28 p.p.Impaired loans coverage (%) 41.82% 42.31% -0.49 p.p.
Capital adequacy ratios (%)Core Tier 1 6.44% 5.29% 1.15 p.p.Tier 1 (Tier 1 capital / Total weighted assets) 6.44% 5.29% 1.15 p.p.Total Capital Ratio(Regulatory capital / Total weighted assets) 8.42% 8.20% 0.22 p.p. Banca Nuova, 99.59% owned by Banca Popolare di Vicenza (which carries it at a book value of 284.1 million euro), is a retail bank with deep roots in Sicily, where it has branches in every province, and which has gradually expanded into the regions of Calabria and Lazio in recent years.
Its commercial network had 128 outlets at 31 December 2008: 106 bank branches, 17 money shops and 5 private banking offices. It had 899 employees at this date, of whom 22 under fixed-term contracts, 7 under apprenticeship contracts and 24 part-timers, with a net increase of 49 since the end of the prior
1 Total average assets are determined as the simple average of total assets at the end of the current year and at the end of the previous year.
2 This is the ratio of administrative costs (line item 150) plus net adjustments to property, plant and equipment and in-tangible assets (line items 170 and 180) to net interest and other banking income (line item 120) plus other operating charges/income (line item 190).
3 The productivity indicators are calculated with reference to the average number of employees.

125
year. The Financial Promoter network had 150 consultants at 31 December 2008, two fewer than a year earlier.
Banca Nuova managed to expand its banking business significantly in 2008: the bank’s total deposits amounted to 4,765 million euro at 31 December 2008, 12.9% more than a year earlier, while net loans were 13.3% higher at 2,856 million euro.Direct deposits increased by 607 million euro to 3,494 million euro (+21%). Most of this increase was attributable to growth in “current accounts and unrestricted deposits” and “bonds”. In fact, current accounts and unrestricted deposits grew by more than 563 million euro (+31.5%) since 31 December 2007, while bonds increased by around 124 million euro (+19.7%).
Indirect deposits amounted to over 1,271 million euro, reporting a decrease of 63 million euro since the end of the prior year (-4.7%). In particular, the largest decreases were in the mutual funds and shares sectors, only partly offset by growth in asset administration and in other securities.
Net loans increased by 336 million euro to 2,856 million euro (13.3%); in detail, “current accounts” increased by over 111 million euro (+34.6%), “repurchase agreements” by more than 31 million euro (considered exceptional following a transaction at year end), “mortgage loans” by 162 million euro (+11.2%), “import-export loans ” by more than 10 million euro (+46.1%) and “debt securities” by 10 million euro (+53.5%). In contrast, “syndicated loans ” decreased by around 16 million euro (-28.1%) and “other loans” by 130 million euro (-31.3%), mostly attributable to a loan repaid by the subsidiary Prestinuova.
Assets sold but not derecognized increased by 151 million euro (+75.2%) following the new multi-originator securitization carried out in the year known as “Berica 7 Residential MBS”.With reference to the indicators of credit risk, the ratio of net impaired loans to net loans (including those loans represented by “Assets sold but not derecognized”) went from 3.49% at 31 December 2007 to 3.70% at 31 December 2008, while the ratio of net non-performing loans to net loans was stable at 1.67%.
In terms of the subsidiary’s income statement, it reported 15.2 million euro in net income for the year (+51.5% on 2007), particularly reflecting the improvement in net interest income which was 7.1 million euro higher at 98.9 million euro (+7.8%).
Even though net fee and commission income was generally stable (+0.8%) largely because of downturn in the asset management business, net interest and other banking income was 7.5 million euro higher at 144.4 million euro (+5.5%).
Net income from financial activities improved by 5.8% to 133.6 million euro.
Operating costs rose by 4.5% to 108 million euro.
Profit (loss) from current operations before tax came to 25.1 million euro, posting an absolute increase of around 3 million euro (+13.5%) on 2007.
Income taxes were 2.2 million euro lower than in the prior year at 9.9 million euro (-18.1%). The reduction reflects 1.9 million euro for franking the differences between asset book and tax values arising from off-book adjustments made up until 31 December 2007 (so-called franking of Form EC).
Net income for the year came to 15.2 million euro, reporting an absolute increase of 5.2 million euro (+51.5%) on 2007.

126
Cariprato S.p.A. Balance sheet and income statement highlights 31/12/2008 31/12/2007 Change (in millions of euro) (+/-) %
Balance sheet highlightsDirect deposits 2,871 2,684 187 7.0Indirect deposits 1,671 2,064 -393 -19.0Loans to customers 3,394 3,193 201 6.3Total Assets 3,897 3,811 86 2.3Risk-weighted assets (RWA) 3,041 3.394 -353 -10.4Equity(including net income for the year) 279.1 288.8 -9.7 -3.4Regulatory capital 267.0 268.1 -1.1 -0.4
Income statement highlightsNet interest income 122.1 109.4 12.7 11.6Net interestand other banking income 161.4 156.3 5.1 3.3Operating costs -117.4 -109.8 -7.6 6.9
of which: payroll -73.2 -64.7 -9 13.1Net income for the year 0.5 12.2 -11.7 -96.2
Other information 31/12/2008 31/12/2007 Change (+/-) %
Number of employees at year-end 990 980 10 1.0Number of branches 94 92 2 2.2

127
Key performance indicators 31/12/2008 31/12/2007 Change 2008/2007
Structure ratios (%)Loans to customers / Total assets 87.1% 83.8% 3.3 p.p.Direct deposits / Total assets 73.7% 70.4% 3.3 p.p.Loans to customers / Direct deposits 118.2% 119.0% -0.8 p.p.
Profitability and efficiency ratios (%)Net income for the year /Equity excluding net income for the year (ROE) 0.2% 4.4% -4.2 p.p.Net income for the year /Total average assets (ROAA) (1) 0.0% 0.3% -0.3 p.p.Cost/Income (2) 71.4% 66.7% 4.7 p.p.
Productivity ratios (3)
Direct deposits per employee (in millions of euro) 3.0 2.8 4.0%Loans to customers per employee (in millions of euro) 3.5 3.4 3.3%Net interest and other bankingincome per employee (in thousands of euro) 165.9 165.2 0.4%
Risk ratios (%)Net impaired loans/Net loans 4.96% 3.84% 1.12 p.p.Net non-performing loans/Net loans 2.16% 1.64% 0.52 p.p.Non-performing loans coverage (%) 39.82% 38.73% 0.27 p.p.Impaired loans coverage (%) 27.95% 27.68% 1.09 p.p.
Capital adequacy ratios (%)Core Tier 1 8.86% 6.47% 2.4 p.p.Tier 1 (Tier 1 capital / Total weighted assets) 8.86% 6.47% 2.4 p.p.Total Capital Ratio(Regulatory capital / Total weighted assets) 8.78% 7.90% 0.9 p.p. Cariprato, 79% owned by Banca Popolare di Vicenza (which carries it at a book value of 404.8 million euro), is a retail bank with its home in the Prato business district. It has expanded significantly in recent years (as many as 25 new branches were opened between 2006 and 2007), with the number of branches rising from 53 at the end of 2002, concentrated just in the provinces of Prato, Florence and Pistoia, to 94 at present, which are spread all over Tuscany.
At 31 December 2008, the bank had 990 employees, of whom 89 with part-time contracts.
This was 10 more than a year earlier (+1%) and reflected 36 joiners and 26 leavers. The net increase of 10 since the end of 2007 involved strengthening both the commercial network and the management team.
The bank’s total deposits amounted to 4,542 million euro at 31 December 2008, 4.3% less than a year earlier.
1 Total average assets are determined as the simple average of total assets at the end of the current year and at the end of the previous year.
2 This is the ratio of administrative costs (line item 150) plus net adjustments to property, plant and equipment and in-tangible assets (line items 170 and 180) to net interest and other banking income (line item 120) plus other operating charges/income (line item 190).
3 The productivity indicators are calculated with reference to the average number of employees.
128
Direct deposits from customers amounted to 2,871 million euro at 31 December 2008, up 7.0% on a year earlier, while indirect deposits were 19.0% lower at 1,671 million euro, with 28.8% of the decrease attributable to asset management and 9.9% to asset administration, reflecting not only the collapse in market values, particularly of shares and corporate bonds, but also the transfer of funds into the bank’s bonds, preferred by customers as a low-risk investment.
Loans to customers rose by 6.3% on 2007 to 3,394 million euro at the end of 2008.
With reference to the indicators of credit risk, the ratio of net impaired loans to net loans (including those loans represented by “Assets sold but not derecognized”) went from 3.8% at 31 December 2007 to 5.0% at 31 December 2008, while the ratio of net non-performing loans to net loans climbed from 1.6% to 2.2%.
The coverage of impaired loans went from 27.7% at 31 December 2007 to 28.0% at 31 December 2008, while that of non-performing loans rose from 38.7% to 39.8%.
In terms of the income statement, net interest income rose by 11.7% on 2007 to 122.1 million euro, while net interest and other banking income climbed by 3.3% to 161.4 million euro.
Net fee and commission income was 4.2% lower, entirely attributable to lower income from placement activities and operations in the asset administration and management sector. Commission on commercial operations with customers were stable, while that on the disbursement of syndicated loans rose considerably.
The negative performance of the local economy caused an increase in impaired loans with a consequent increase in loan impairment adjustments, which rose from 21.8 million euro in 2007 to 36.7 million euro in 2008 (+68.2%).
Payroll costs, excluding 4.7 million euro in charges for accessing the Solidarity Fund in 2008, climbed by 5.5%. This partly reflects increases after fully staffing the branches opened in 2007. The growth of 6.5% in other administrative costs is largely a reflection of the bank’s territorial expansion.
Operating costs as a whole increased by 6.9%.
As a consequence of the above factors, profit from current operations before tax came to 7.2 million euro, compared with 24.4 million euro in 2007, while net income for the year was 96.2% lower at 0.46 million euro, down from 12.2 million euro in 2007.

129
Farbanca S.p.A.
Balance sheet and income statement highlights 31/12/2008 31/12/2007 Change (in millions of euro) (+/-) %
Balance sheet highlightsDirect deposits 95.5 65.0 30.5 46.9Indirect deposits 21.2 25.7 -4.5 -17.5Loans to customers 319.0 206.0 113.0 54.9Total Assets 341.2 239.5 101.7 42.5Risk-weighted assets (RWA) 287.5 226.2 61.3 27.1Equity(including net income for the year) 37.4 35.8 1.6 4.5Regulatory capital 35.9 34.7 1.2 3.5
Income statement highlightsNet interest income 8.9 6.1 2.8 45.9Net interestand other banking income 9.7 6.7 3.0 44.8Operating costs -4.2 -4.0 -0.2 5.0
of which: payroll -2.4 -1.8 -0.6 33.3Net income for the year 2.7 1.6 1.1 68.8
Other information 31/12/2008 31/12/2007 Change (+/-) %
Number of employees at year-end 29 28 1 3.6Number of branches 1 1 0 0.0

130
Key performance indicators 31/12/2008 31/12/2007 Change 2008/2007
Structure ratios (%)Loans to customers / Total assets 93.5% 86.0% 7.5 p.p.Direct deposits / Total assets 28.0% 27.1% 0.9 p.p.Loans to customers / Direct deposits 334.0% 316.9% 17.1 p.p.
Profitability and efficiency ratios (%)Net income for the year /Equity excluding net income for the year (ROE) 7.8% 4.7% 3.1 p.p.Net income for the year /Total average assets (ROAA) (1) 0.9% 0.7% 0.2 p.p.Cost/Income (2) 44.3% 58.0% -13.7 p.p.
Productivity ratios(3)
Direct deposits per employee (in millions of euro) 3.3 2.3 41.9%Loans to customers per employee (in millions of euro) 11.0 7.4 49.5%Net interest and other bankingincome per employee (in thousands of euro 334.5 239.3 39.8%
Risk ratios (%)Net impaired loans/Net loans 1.41% 1.90% -0.49 p.p.Net non-performing loans/Net loans 0.20% 0.28% -0.08 p.p.Non-performing loans coverage (%) 76.61% 66.28% 10.33 p.p.Impaired loans coverage (%) 37.53% 28.06% 9.47 p.p.
Capital adequacy ratios (%)Core Tier 1 12.49% 15.34% -2.9 p.p.Tier 1 (Tier 1 capital / Total weighted assets) 12.49% 15.34% -2.9 p.p.Total Capital Ratio Total Capital Ratio (Regulatory capital /Total weighted assets) 12.49% 15.34% -2.9 p.p.
Farbanca is an on-line bank specializing in the offer of banking services to pharmacies; the Parent Bank Banca Popolare di Vicenza owns a direct interest of 47.52%, carried at a book value of 22.9 million euro.
It had 29 employees at 31 December 2008; its commercial structure at this date was unchanged, with three representative offices in Milan, Naples and Catania which follow customers in these areas, while the office in Bologna follows all other customers. The bank has a team of financial promoter employees for door-to-door services, who have been trained in-house to acquire knowledge of this sector and the ability to serve the bank’s pharmacist customers.
Net of impairment adjustments, loans amounted to 319.0 million euro at 31 December 2008, 54.9% more than at 31 December 2007; direct deposits climbed by 47.0% to 95.5 million euro while indirect deposits fell by 17.6% to 21.2 million euro.
1 Total average assets are determined as the simple average of total assets at the end of the current year and at the end of the previous year.
2 This is the ratio of administrative costs (line item 150) plus net adjustments to property, plant and equipment and in-tangible assets (line items 170 and 180) to net interest and other banking income (line item 120) plus other operating charges/income (line item 190).
3 The productivity indicators are calculated with reference to the average number of employees.

131
The income statement reports 9.7 million euro in net interest and other banking income, an increase of 43.8% on the prior year primarily thanks to a 45.1% growth in net interest income to 8.9 million euro, reflecting significant growth both in average volumes and in market rates.Net impairment adjustments to loans amounted to 1.1 million euro, compared with 141 thousand euro in writebacks in 2007.
Operating costs were 5.5% higher at 4.2 million euro, up from 4.0 million euro in 2007. The containment of costs combined with an increase in margins helped the cost/income ratio improve from 58.0% in 2007 to 44.3% in 2008.
Profit (loss) from current operations before tax was significantly higher, climbing from 2.8 million euro in 2007 to 4.3 million euro at 31 December 2008 (+52.0%).Net income for the year soared 70.9% to 2.7 million euro from 1.5 million euro in 2007.
Performance of other group companies
PrestiNuova S.p.A.Banca Popolare di Vicenza has a direct interest of 6.33% in PrestiNuova and an indirect one of 88.67% through Banca Nuova; this company has a total carrying amount 33.1 million euro. Its core business comprises “lending secured against one-fifth of salary/pension” and loans, particularly to public-sector employees, that are repaid through withholdings from salaries/pensions.
In fact, PrestiNuova was set up to rationalize and enhance the Group’s existing business in the consumer credit sector, especially after Banca Nuova made a three-year agreement in 2004 with INPDAP (Italy’s social security agency for public-sector employees) for the disbursement of loans to pensioners as well, with repayment automatically deducted at source. This agreement was renewed during the second half of 2007. The temporary business group (comprising PrestiNuova, Banca Popolare di Vicenza, Banca Nuova and Cassa di Risparmio di Prato) is one of the leading banks and financial institutions partaking in the new agreement (which involves managing loans secured against/repaid from pensions and public-sector employee wages, and disbursing specific consumer loans and mortgages). This has placed PrestiNuova in a position of privilege as well as offering it important opportunities for development.
The company’s distribution network at 31 December 2008 comprised 25 offices within branches of group banks and 4 separate offices in the cities of Genoa, Naples, Padua and Vicenza. PrestiNuova had 65 employees at 31 December 2008.
At 31 December 2008 “Loans secured against one-fifth of salary”, representing all of the company’s lending, amounted to 368.5 million euro, net of impairment adjustments, compared with 313.4 million euro at 31 December 2007 (+17.6%).
In terms of its income statement, Prestinuova closed 2008 with 2.8 million euro in net income, 1.7% more than the year before.
Net interest income was 16.4% higher than in 2007 at 10.3 million euro, accounting for 91.1% of net interest and other banking income.
Net fee and commission income of 1.0 million euro accounted for the remaining 8.9% of net interest and other banking income, most of which commission income passed back to the company from insurance companies in relation to life and job-loss insurance policies taken out by customers to secure the loans received.

132
Net interest and other banking income was 13.4% up on the prior year at 11.4 million euro.Net impairment adjustments to loans came to 1.2 million euro in 2008 compared with 201 thousand euro in 2007.
Administrative costs were 24.6% higher at 5.8 million euro, of which 3.9 million euro related to payroll costs (+27.0%) and 1.9 million euro to other administrative costs (+20.0%). The increase in administrative costs particularly reflects investment in strengthening the company’s structure and sales network.
Profit from current operations before tax came to 4.9 million euro, down 6.1% on 2007.
The cost/income ratio, serving as an overall indicator of operating performance, was 50.5% in 2008 compared with 49.7% in the previous year.
After deducting 1.8 million euro in tax (corresponding to a tax rate of 39.6%), net income for the year came to 2.8 million euro, an increase of 1.7% on the prior year.
BPV Finance (International) Plc This Irish-registered company is 99.99% owned by Banca Popolare di Vicenza and operates out of Dublin’s International Financial Services Centre. The carrying amount of this investment is 93.4 million euro. BPV Finance specializes in proprietary trading, and carries out its business by investing in securities of Italian and international companies and by providing loans to foreign subsidiaries of the Group’s corporate customers in Italy. More specifically, the company’s portfolio, which has a generally high rating, mostly consists of bonds issued by European and US banks and financial institutions, corporate securities, asset backed securities (ABS) (with European and US collateral), shares traded on the Italian Stock Exchange and commercial loans granted to foreign subsidiaries of Italian companies.
The year 2008 was a rather critical one for BPV Finance with the recent financial crisis having a major impact on its investment portfolio, which suffered severe losses in view of its typical investment activities, the types of securities in its portfolio and the evident instability of financial markets during the year.
The portfolio of banking securities was hard hit by this crisis, being the prime sector affected by defaults on US subprime loans. BPV Finance nonetheless managed to limit its losses by reducing exposure to positions considered most at risk and by exploiting the few market opportunities emerging during the year.
The corporate portfolio suffered less than the financial sector one, even if it now reflects expectations for lower profits in every segment of industry; BPV Finance’s exposure to the corporate segment is nonetheless very limited.
The subsidiary’s ABS portfolio suffered serious losses in 2008, mainly because of the impairment of certain positions relating to European residential mortgages and to the commercial sector. Despite the high credit rating of the bonds held, this portfolio is exposed to the market risks of this sector, even if the portfolio does not contain any “toxic” securities and its exposure to the United States is only marginal.
The subsidiary’s equity portfolio suffered from its exposure to the financial sector, with regard to financial instruments held both for trading and for investment purposes. This portfolio also suffered a major loss on a single position relating to a hedge fund associated with a recent financial fraud by a US businessman, that came to light in December 2008.
133
As a result, the subsidiary closed 2008 with a loss of 37.2 million euro, with a negative contribution on the Group’s result of 21.7 million euro (after consolidation adjustments), and a reduction of 7.6 million euro in its equity for changes in the fair value of available-for-sale financial instruments. The company’s equity amounted to 41.2 million euro at 31 December 2008.
B.P.Vi Fondi SGR S.p.A.This company is 50% controlled by Banca Popolare di Vicenza, which carries it at a value of 5.2 million euro. B.P.Vi Fondi acts as the asset manager for the entire Banca Popolare di Vicenza Group and supports the placement business by the provision of training and information to the sales network.
Verona Gestioni Sgr was merged into BPVi Fondi Sgr in November 2008, with the goals of creating a “product factory” devoted to the asset management sector at the service of the BPVi Group and Cattolica Assicurazioni and of achieving major synergies through this combination.
The company reported a considerable outflow of assets in 2008, like for the rest of the asset management industry nationwide, causing a contraction in the assets under management. This trend was particularly affected by customer disaffection for asset management products, especially by those customers with a low propensity for risk, who preferred liquid investments with known returns given the highly uncertain and volatile situation on financial markets. The contraction in volumes had a consequent impact on the company’s results, which closed 2008 with 914 thousand euro in net income.
Nordest Merchant S.p.A.This company, 80% owned by Banca Popolare di Vicenza and reported in its financial statements at a carrying value of 3.3 million euro, is the Group’s merchant bank. Its main business is the provision of extraordinary finance to small and medium enterprises, particularly involving acquisition financing, corporate finance and mergers and acquisitions, also through its two wholly-owned managers of closed-end and speculative investment funds (NEM Sgr and NEM 2 Sgr). The company reported 828 thousand euro in net income for 2008.
NEM SGR S.p.A.This wholly-owned subsidiary of Nordest Merchant S.p.A. carries out collective asset management activities by promoting, launching and managing closed-end mutual funds. The company reported 433 thousand euro in net income for 2008.
NEM 2 SGR S.p.A.This company, formed in October 2006 as a wholly-owned subsidiary of Nordest Merchant S.p.A, carries out collective asset management by promoting, launching and managing speculative mutual funds and particularly mezzanine funds. NEM 2 SGR, in operation since May 2007, continued to manage the “NEM Mezzanine” fund throughout 2008 but terminated “NEM Mezzanine II”, a new speculative fund, in advance of its natural expiry. The company reported 579 thousand euro in net income for 2008.
Nuova Merchant S.p.A.This wholly-owned subsidiary of the Banca Popolare di Vicenza Group provides support and development services for business projects in Central and Southern Italy. Nuova Merchant closed 2008 with a loss of 3.5 million euro. As a result of the subsidiary’s negative performance, the Parent Bank voted to cover its losses and reinstate its capital stock to the legal minimum after having resolved to transform its legal status from that of an “S.p.A.” (joint stock company) to an “S.r.l.” (limited liability company). In order to ensure continued business, it was also resolved that the company would be absorbed by Nordest Merchant S.p.A., a BPVi Group company also active in the merchant banking sector. The merger will come into effect during the first half of 2009.

134
Servizi Bancari S.p.A.This wholly-owned subsidiary of Banca Popolare di Vicenza provides back office and IT services to the Group’s companies. The transformation of Servizi Bancari from a joint stock company into a co-operative came into effect in February 2009; this transformation had been approved in an extraordinary stockholders’ meeting in December 2008 with the aim of optimizing the benefits of rationalizing back office processes for the banking group as a whole. In addition, during the same month Banca Popolare di Vicenza, Cariprato and Banca Nuova formalized the transfer of their respective back offices to Servizi Bancari, as envisaged in the Business Plan for 2008-2011; at the same time, Servizi Bancari transferred its ICT activities to Banca Popolare di Vicenza.The company reported 324 thousand euro in net income for 2008.
Immobiliare Stampa S.p.A.This wholly-owned subsidiary of Banca Popolare di Vicenza, with a carrying value of 195.9 million euro, manages the real estate portfolio of Banca Popolare di Vicenza and provides it, along with Cariprato and Banca Nuova, with real estate services, as well as carrying out administrative activities relating to the management of group properties leased to third parties and of third-party properties leased by group companies. The company reported 2.8 million euro in net income for 2008.
Monforte 19 S.r.l.This company, a wholly-owned subsidiary of Banca Popolare di Vicenza, is the owner of two prestigious buildings in Milan, let to third parties outside the banking group. This company’s carrying amount is 13.7 million euro. It closed 2008 with a loss of 1.7 million euro.
ATYPICAL AND/OR UNUSUAL TRANSACTIONS
Atypical and/or unusual transactions are defined as all significant transactions, as defined in the explanatory notes to the condensed consolidated, which due to the nature of the counterparties, the purpose of the transactions, the method of determining the transfer price or the timing of the event (proximity to the accounting reference date) may give rise to doubts about the correctness/completeness of the information reported in the financial statements, about possible conflicts of interest, the safeguarding of company assets or the protection of minority stockholders. As required by CONSOB Communication 6064293 dated 28 July 2006, it is reported that no atypical and/or unusual transactions were undertaken in 2008 such as to have a significant impact on the balance sheet, results of operations and financial position of the Banca Popolare di Vicenza Group.

135
INVESTOR PROTECTION ACT: NEW FIGUREOF THE “FINANCIAL REPORTING MANAGER”
The process of revising the rules and models of corporate governance already started for listed companies under Law 262 dated 28 December 2005 (“Provisions for the protection of investors and regulation of financial markets”, which amended the Consolidated Financial Markets Act (Decree 58/98), has been extended under Decree 195 dated 6 November 2007 to companies which issue financial instruments that are admitted to trading on regulated markets; the latter decree was in implementation of the Transparency Directive (Directive 2004/109/EC) on the harmonization of transparency requirements.
Like with the US experience of implementing the Sarbanes-Oxley Act, these laws address the problems of financial markets, and enhance and amend the rules on corporate governance, banking transparency, auditing, systems of administration and control, and the system of penalties and fines, with the aim of integrating and perfecting the tools for protecting investors and restoring confidence in the markets and their credibility.
These new laws have introduced the new figure of the “Financial reporting manager” (art. 154-bis – Consolidated Financial Markets Act) and establish that the Board of Directors (or other delegated bodies) and the Financial Reporting Manager have specific responsibilities and duties in order to ensure the true and fair presentation of the balance sheet, income statement and financial position of the issuer and of the group of companies included in the consolidation.
Banca Popolare di Vicenza has issued bonds that are listed on the Luxembourg Stock Exchange as part of its European Medium Term Notes programme, choosing Italy as its member state of origin. As a result, it is now obliged under art. 154-bis of the Consolidated Financial Markets Act as amended by Decree 195/2007 which adopted the Transparency Directive, to establish the position of a Financial Reporting Manager.
In view of these legal requirements, the Parent Bank’s Board of Directors:
− amended the Bank’s articles of association (art. 39) on 3 June 2008 to establish the position of “Financial Reporting Manager”, as well as the required experience that such person must have and the methods of their appointment;
− appointed Franco Tonato, the Deputy General Manager in charge of the Financial Reporting and Equity Investments Department, as Financial Reporting Manager on 17 June 2008, after verifying his integrity and experience and having obtained the consent of the Board of Statutory Auditors;
− delegated its functions on 28 August 2008 regarding the attestation under art. 154-bis of the Consolidated Financial Markets Act to Divo Gronchi, the Managing Director;
− approved on 23 September 2008 the Governance and Control Model for accounting and administrative processes (Organizational and methodological model of the Financial Reporting Manager).
In compliance with the mandate received from the Board of Directors, the Financial Reporting Manager had rapidly embarked on a project with the assistance of Deloitte Consulting, designed:− to foster full compliance with the new law, with particular reference to the contents of art.154-
bis of the Consolidated Financial Markets Act;− to adopt a method of governance and control that ensures the Financial Reporting Manager
a constant and complete vision of the areas of business that are effectively relevant for the purposes of preparing the company’s financial reports.

136
This project, which was started in July 2008, involved two modules:− Module 1: Design of the Financial Reporting Manager Model;− Module 2: Development and application of the Model to the processes of Credit, Finance and
Consolidation, deemed to be particularly “sensitive” for financial reporting purposes.
Module 1 was completed on 23 September 2008 when the Board of Directors of Banca Popolare di Vicenza approved the Financial Reporting Manager Governance and Control Model and the related operational manual.
Module 2, which started in September 2008, has developed and applied the Model relating to:− the process of Credit at Banca Popolare di Vicenza and its subsidiaries Cariprato and Banca Nuova;− the process of Finance at Banca Popolare di Vicenza and BPV Finance;− the process of the Group’s financial consolidation.
The review of the adequacy of the processes examined revealed that the Group is exposed to a generally “acceptable” level of accounting and administrative risk.
These results provide top management and the Financial Reporting Manager with reasonably certainty that the above processes which generate accounting data are adequately controlled and that the related controls are effectively applied, and allow the Financial Reporting Manager and Managing Director to make their attestation on the individual and consolidated financial statements for 2008.
SIGNIFICANT SUBSEQUENT EVENTS
With reference to the disclosure of significant events subsequent to year end, required by article 2428 (5) of the Italian Civil Code, this information can be found in the explanatory notes in Part A “Accounting policies” - Section 3 “Subsequent events”.
OUTLOOK FOR OPERATIONS
The latest economic data and market surveys confirm that the Euro-zone and its principal trading partners are going through a prolonged period of major economic slowdown, made worse by a persistent and exceptionally high level of uncertainty. The latest forecasts for 2009 have revised down economic growth in the Euro-zone to around -2.5%, with only a slight recovery in 2010. Inflationary pressures are diminishing in the Euro-zone. Annual inflation could come down even more in coming months, mainly because of the underlying effects of past trends in energy prices, and by mid-year it could reach a very low level indeed. However, inflation is expected to start increasing again in the second half of the year because of the same underlying effects.
As for the Italian economy, the signs are that 2009 will also be a year of recession. GDP is expected to contract by around 2.5% relative to 2008, the same amount currently estimated for the Euro-zone as a whole. The additional contraction in economic activity in 2009 will be mostly determined by the strong adverse impact bequeathed by the downturn in the last part of 2008 to

137
the current year. Furthermore, the most recent economic indicators, especially in the first part of 2009, reveal a situation dominated, with few exceptions, by negative signs. There are a few weak signs of improvement in consumer confidence, thanks to the rapid retreat in inflation, while the news relating to industrial activity continues to be very bad. In fact, business confidence is at an all-time low, affected by a fresh shrinkage in order books for both the domestic and export markets, while there is a continued increase in the number of businesses that are practising forms of credit rationing to others.
As for credit markets, the outlook is equally difficult and uncertain for the whole of 2009, due not only to the slower growth in volumes intermediated but also to the expected reduction in the spread between banking lending and borrowing rates. In fact, the business of financial intermediaries will probably continue to be severely affected throughout 2009 by the effects of the liquidity crisis exploding in 2008. This factor, combined with the deterioration in the macroeconomic environment will cause a further slowdown in the growth in bank lending. With continued lack of confidence on the interbank market, the need for banks to satisfy their funding requirements should carry on supporting the growing trend in direct funding from traditional channels, especially from bonds. The worsening economic scenario will cause an increase in problem loans (watchlist and non-performing) both in the household and corporate segments, with a consequent rise in risk indices. As regards the asset management sector, the liquidity needs of banking intermediaries and continued high demand for government debt securities by savers should penalize net inflows to funds and personal asset management, causing another contraction in volumes, which are expected to start rising only in 2010. The profitability and efficiency of the banking system is expected to worsen in 2009 relative to 2008, basically because of a contraction in net interest and other banking income and an increase in adjustments, only partly offset by greater focus on reducing operating costs. Income, in particular, could be affected by reduced volumes of lending and a reduction in the spread between bank lending and borrowing rates, as well as by another decrease in asset management revenue.
In this decidedly unfavourable context that is opening up for 2009, the BPVi Group is seeking to face the risks and operational difficulties with prudence, but also with reasonable optimism, in compliance with the values of a co-operative bank at the service of its territory. The level of capitalization achieved, considered adequate and reassuring, and the policy of reducing liquidity risks, implemented by developing “traditional” direct funding from customers and using and increasing the quantity of securities that can be refinanced with the ECB, should make it possible to provide constant support to companies and individuals, through a growth in lending, albeit selectively, by exploiting the competitive advantage typical of local banks, based on their extensive knowledge of local business, supported by the new methods and instruments for more effective credit risk management described in this report. The Parent Bank’s Board of Directors has approved a budget which forecasts loans to grow by more than 10%, dependent on the Group’s ability to finance this with direct customer deposits. A key contribution to the Group’s profitability should nonetheless come, as predicted in the Business Plan 2008-2011 and confirmed in the Budget for 2009, from enlargement of the customer base, full operation of the new branches, resulting from recent internal and external-led growth, and from full exploitation of the strategic partnerships in the sectors of insurance/pensions and asset management. There nonetheless continue to be high risks relating to the economy and strong uncertainties over the recovery in financial markets, which could cause a higher-than-expected level of adjustments and an insufficient contribution from trading activity, with a consequently negative impact on the Group’s earnings. In summary, as stated in the Budget for 2009, the BPVi Group considers that it is adequately “equipped” to face the risks and uncertainties of the current year and to continue effectively pursuing its corporate mission, with the achievement of another positive set of results in 2009.

138
PROPOSED ALLOCATION OF NET INCOME
Stockholders,
We propose that you should approve the following allocation to equity reserves out of the net income for the year, which amounted to Euro 151,035,348.32:
Euro 10,000,000.00 = to the Legal reserve;Euro 32,000,000.00 = to the Extraordinary reserve;Euro 28,000,000.00 = to the reserve for the purchase of treasury shares.
Following these allocations, we propose that you allocate the residual amount of Euro 81,035,348.32 as follows:
Residual income available for allocation 81,035,348.32
• TotheStockholders: – € 1.15 or each of the 68,106,390 shares outstanding with 78,322,348.50 full enjoyment rights (on the basis described below) • TotheDirectors 1,437,158.47
• Tosocialsupport,charities,cultureandthepublicinterest 1,275,841.35
Total 81,035,348.32
The dividends declared will become payable with a value date of 30 April 2009.
In terms of how the dividend will be paid, we propose making the payment partly in cash (12.50%) and partly by allotment of the treasury shares held by the Bank (87.50%).
The treasury shares held by the Bank would be allotted to each stockholder in proportion to the shares already held, as rounded down if the number of shares due is not a whole number. Any fractions of shares would be also be settled as a cash payment.
The above proposal is justified by the need to strengthen consolidated stockholders’ equity and improve the Group’s prudential coefficients. Considering that the shares to be allotted were purchased by the Bank at a price of 60 euro per share, this method of payment will not dilute the stockholders, which would be the situation in the event of a capitalization issue of shares.
.

139
GLOSSARY
ABS Securities deriving from securitizations and, therefore, guaranteed (Asset backed securities) by a portfolio comprising various underlying assets (consumer loans,
credit cards, mortgages, lease installments etc.).
Acquisition financing Loans financing the acquisition of businesses
ALMS Asset & Liability Management System. This is an instrument for measuring interest rate risk relating to interest-bearing assets and liabilities and identifies how changes in rate curves influence the Bank’s future profit margins.
The ALMS is a valid tool for management allowing it to assess ex-ante at what level of risk the Bank intends to position itself in expected financial scenarios and to estimate the value of balance sheet items by discounting future cash flows, thus keeping a constant eye on the Bank’s value.
Euro-zone The group of countries which have adopted the euro as the single currency. The Euro-zone comprises the following countries: Belgium, Germany, Greece, Spain, France, Ireland, Italy, Cyprus, Luxembourg, Malta, Holland, Austria, Portugal, Finland, Slovenia and, starting from 1 January 2009, Slovakia.
Assessment An assessment is an evaluation involving an opinion on the likely turn of the events assessed.
Asset management The management of wealth on behalf of third parties, comprising collective management (open-end and closed-end mutual funds, real estate funds, pension funds and SICAVs), endowment assurance products and individual management (by banks, brokers and trust companies).
ATM Automatic Teller Machine: a machine for dispensing cash. The “Bancomat” machines installed by banks are ATMs.
Back office The department of a financial institution which deals with all the disclosure, accounting and administrative requirements relating to transactions carried out by the front office (branches).
Backtesting Retrospective analysis to test the reliability of measurements of the sources of risk associated with asset positions.
Banking book Generally relates to securities and financial instruments in general, identifying that part of the investment portfolio held for internal purposes.
ECB European Central Bank. This meets periodically to analyze the economic situation in Europe (GDP, inflation, unemployment rate etc) and to decide monetary policy.
Benchmark Indicator, measure, reference parameter against which a company assesses its performance relating to products, services, business processes.

140
Securitization A securitization represents a special issue of bonds with the payment of coupons and the redemption of principal on maturity funded by the cash flows deriving from a portfolio of financial assets (mortgages, commercial paper, leasing contracts) held by the vehicle company (v.) issuing the securitization. Each securitization is divided into various tranches of bonds with different ratings (from AAA to BBB or even lower), depending on the credit risk involved.
CDO (Collateralised Securities issued as part of securitization transactions, guaranteed by Debt Obligations) an underlying represented by loans, securities or other financial assets.
Certificates These are derivative instruments quoted on a market in the form of negotiable securities. They replicate the performance of an underlying asset. They can have a leverage effect or otherwise. The issuer who quotes them is liable for reimbursing them to the holder at maturity.
Compliance (function) The compliance function serves to prevent the risk of non-compliance by company activity with compulsory regulations and laws or self-regulatory ones (for example, articles of association, codes of conduct, self-regulatory codes etc.).
Economic trend This indicates the general state of the national economy and its related growth trend.
Consob The “Commissione Nazionale per le Società e la Borsa” (Italian stockmarket regulator), set up under Law 216 dated 7 June 1974, is an independent administrative authority, with a separate legal identity and full autonomy under Law 281/1985, whose activities are aimed at investor protection, and the efficiency, transparency and development of the Italian stock market.
Corporate finance Comprises the full range of products offered by the Bank to meet the financing and consultancy needs of businesses.
Cost income An economic indicator which expresses in percentage terms the ratio between a bank’s cost and its income. The lower it is the more efficient the bank..
Performing loans Loans for which no risk of default is perceived.
Creditor protection An insurance policy combined with financial products which allow insurance customers to insure the residual debt or repayment instalment against
the occurrence of events that might make such repayment difficult (eg. death, permanent disability or loss of employment).
Period Growth relative to the previous reporting period-on-period growth (for example, the previous quarter).
Year-on-year growth Growth relative to the same period in the prior year.
CRM (Customer Methods and software products that contribute to optimizing Relationship the management of customer relationships.Management)

141
Cross selling This is an indicator of the average number of products held by each customer; the higher the number of products held, the greater the degree of customer loyalty and the more profitable the relationship.
Probability The probability that a counterparty enters a state of default, even if of default (PD) temporarily, before the end of the reference period (one year). This
measure is the output of a rating system.
Euribor Euribor (Euro Interbank Offered Rate) is the principal market reference rate and is calculated as the weighted average of interest rates applied to financial transactions in euro between prime European banks. It is published on a daily basis by the European Banking Federation with quotations for 1 month, 3 month and 6 month maturities.
Fair Value The amount at which an asset could be exchanged, or a liability settled, between knowledgeable, willing parties in an arm’s length transaction.
FED Federal Reserve System. This is the central bank of the United States, authorized by Congress to issue money and implement monetary policy; it thus determines the quantity of the money supply and sets the level of interest rates.
Financial Stability The FSF is an international entity created by the G7 in February 1999 Forum (FSF) with a view to promoting the stability of the international financial
system. The Forum comprises senior members from the national financial authorities (e.g. central banks, supervisory authorities, treasury departments), international financial institutions and international supervisory and regulatory bodies, committees of central bank experts and the European Central Bank. Mario Draghi, governor of the Bank of Italy, is currently chairman of the Forum. The FSF maintains a small secretariat at the Bank for International Settlements in Basel.
Governance This term is used to refer to the governing bodies of a company and the associated rules (voting rights, hierarchies etc.). It indicates the set of principles and processes adopted by a company to create value for its stockholders and the well-being of its other stakeholders.
Home banking, Telematic connection to access bank accounts, carry out transactions Remote banking and check movements and terms and conditions.
House organ Periodic publication by a business to communicate with its employees and/or customers.
IAS/IFRS International Accounting Standards/International Financial Reporting Standards. These are the international accounting standards issued by the IASB (International Accounting Standards Board), whose application is compulsory (under a decree published in November 2004) for the purposes of preparing separate and consolidated financial statements by a wide array of companies, including banks.
Impairment In the context of international accounting standards (IAS), impairment represents the loss in the value of an asset that is recognized if its carrying amount exceeds its recoverable value, being the amount that

142
could be obtained by selling it or using it in the business. Impairment testing must be performed on all assets, except for those measured at fair value since, in this case, any losses (or gains) are implicit in such value.
ISAE ISAE (Institute for studies and economic analysis) is a public research body that mainly carries out analysis and studies in support of the social and economic policy decisions taken by the government, parliament and the public administration.
ISTAT Italy’s publicly-operated central statistics office. It has been in operation since 1926 and is the principal producer of official statistics in support of citizens and public policy-makers.
ISVAP This institute supervises the insurance industry. It has a separate legal identity under public law and was set up under Law 576 dated 12 August 1982 to supervise insurance and reinsurance companies, and all other parties governed by the law on private insurers, including agents and insurance brokers. ISVAP carries out its duties on the basis of government-determined policy.
Joint venture A company or business set up under joint ownership for a specific purpose.
Mark-down Negative differential relative to a reference indicator, normally an interbank rate, applied to the rate on customer deposits.
Mark-up Positive differential relative to a reference indicator, normally an interbank rate, applied to the rate on loans to customers.
Merchant Banking This comprises a series of services to companies such as: investments in risk capital, advice on special financing transactions etc., mainly for the purpose of company reorganization, growth in business, or satisfaction of financial needs in view of a subsequent sell-off.
Mezzanine financing A type of financing with characteristics partly similar to debt and partly similar to an equity interest. It generally takes the form of convertible bonds or warrants.
Mission A clear statement of strategic objectives that a company wants to achieve and which must be widely shared by its entire organization.
Multi-channel The offer of retail banking products and services both through activities traditional physical channels (branches) and through telematic channels
OTC (market) Over the counter market. All those “markets” in which financial assets are traded other than official regulated ones. The methods of contracting are not standardized and it is possible to agree “atypical” contracts. Securities traded on an OTC market are generally less liquid that those traded on official markets.
Outlook When used by rating agencies, this means a company’s forecast or prospects.

143
GDP Acronym of Gross Domestic Product. It refers to the value of all goods and services produced by an economy, plus indirect taxes on imports less goods for intermediate consumption. It is the fundamental measure of economic activity. In national accounting, GDP is the same as national income.
POS POS (Points of Sale) are small terminals at cash registers in shops and supermarkets used for making payments with debit or credit cards.
Rating Classification or rating of an issuer of securities on international financial markets, by a specialist agency. A rating expresses the creditworthiness of issuers of bonds using letters that indicate the debtor’s reliability. For example, a triple A (AAA) rating represents the highest quality investment grade; the scores descend progressively (AA, A, BBB, BB, B). Triple C (CCC) ratings are awarded to the least reliable debtors.
Recession Negative economic situation featuring a reduction in industrial output, a fall in consumption, and a decrease in household income.
Risk management This refers to all practices (measurements, estimates, analyses, actions) that allow the Bank to be constantly and promptly informed about the status of risks to which it is exposed and any changes therein and to be able to intervene when the risks requires mitigating and/or the instruments and functions of control require revision. The Risk Management unit is independent from the units that assume risk and is responsible for developing methods and principles for measuring credit, financial and operational risks so as to let top management and the Board of Directors govern the exposure to such risks. The Risk Management unit is therefore part of the wider spectrum of the Bank’s risk management.
Sec Servizi SEC SERVIZI is a credit and finance outsourcing co-operative which provides highly innovative services ranging from software applications, centralized back office services and advanced multi-channel solutions, consulting, training and support services.
Sgr SGRs (Società di Gestione del Risparmio) or asset management companies are companies authorized to promote, set up, organize and manage the assets of a mutual fund (collective asset management), keeping their own assets separate from those of the fund. An SGR can also manage funds set up by other asset management companies.
Small business Market segment relating to small and very small businesses (typically tradesmen and shopkeepers).
Stress testing Simulation used to measure the impact of extreme market scenarios on the bank’s overall exposure to risk.
Subprime Literally “less than prime”, being a residential mortgage that carries more risk that prime quality US mortgages. Sub-prime mortgages are granted to

144
low quality borrowers: in many cases, installments in the first two years are extremely low. Alt-A mortgages fall half way between sub-prime (for high risk borrowers) and prime (top-end borrowers), and target borrowers with low savings.
VaR Value at Risk is an estimate of the expected potential loss on a portfolio of financial instruments in a specified time period, with a defined level of probability, upon the occurrence of unfavourable market conditions.
Vip Category of very wealthy customers who require advisory services and sophisticated investment management.

FINANCIAL STATEMENTS
.

Assets 31.12.2008 31.12.200710. Cash and balances with central banks 99,973,419 108,425,370
20. Financial assets held for trading 704,704,825 796,391,192
30. Financial assets at fair value 17,077,054 25,792,223
40. Financial assets available for sale 344,924,159 656,373,763
60. Loans and advances to banks 3,153,912,386 2,690,551,667
70. Loans and advances to customers 16,017,622,149 14,939,215,395
90 . Fair value change of assets in hedged portfolios (+/-) 16,950,558 -
100. Equity investments 1,391,841,795 1,107,185,447
110. Property, plant and equipment 45,309,013 42,474,229
120. Intangible assets 706,091,429 711,243,074 of which: - goodwill 679,580,932 705,588,934
130. Tax assets 125,971,954 95,273,538 a) current 42,040,803 21,607,258 b) deferred 83,931,151 73,666,280
140. Non-current assets held for sale – 81,928,764
150. Other assets 256,290,829 156,172,462
Total assets 22,880,669,570 21,411,027,124
147
BANCA POPOLARE DI VICENZABALANCE SHEET (in thousands of Euro)
148
Equity and Liabilities 31.12.2008 31.12.200710. Deposits from banks 3,620,928,410 3,433,575,122
20. Due to customers 7,503,635,137 7,216,764,487
30. Debt securities in issue 4,609,152,490 4,566,190,907
40. Financial liabilities held for trading 618,361,569 621,977,800
50. Financial liabilities at fair value 2,938,129,959 2,185,335,769
60. Hedging derivatives 16,677,368 -
80. Tax liabilities: 91,411,434 74,395,535 a) current 44,441,441 52,620,952 b) deferred 46,969,993 21,774,583
100. Other liabilities 526,928,876 408,669,247
110. Provision for severance indemnities 51,759,578 51,814,097
120. Provisions for risks and charges 59,532,239 68,697,406 b) other provisions 59,532,239 68,697,406
130. Valuation reserves 38,048,247 (43,225,395)
150. Equity instruments 13,104,216 13,629,996
160. Reserves 517,130,455 478,158,674
170. Additional paid-in capital 1,960,354,744 1,963,296,772
180. Capital stock 261,460,260 261,656,498
190. Treasury shares (-) (96,980,760) -
200. Net income (loss) for the year (+/-) 151,035,348 110,090,209
Total Equity and Liabilities 22,880,669,570 21,411,027,124

BANCA POPOLARE DI VICENZAINCOME STATEMENT(in thousands of Euro)
149
Captions 31.12.2008 31.12.200710. Interest income and similar revenues 1,110,537,966 877,720,355
20. Interest expense and similar charges (704,906,191) (522,448,280)
30. Net interest income 405,631,775 355,272,075 40. Fee and commission income 194,894,172 193,434,776
50. Fee and commission expense (17,325,477) (18,446,032)
60. Net fee and commission income 177,568,695 174,988,744 70. Dividend and similar income 55,339,748 68,299,335
80. Net trading income 1,485,332 (18,437,536)
90. Fair vale adjustments in hedge accounting 273,190 -
100. Gains (losses) on disposal or repurchase of: 17,670,169 5,122,557 a) loans and advances (37,474) (16,717) b) financial assets available for sale 3,960,776 4,054,957 d) financial liabilities 13,746,867 1,084,317
110. Net change in financial assets and liabilities at fair value (3,723,069) (2,566,634)
120. Net interest and other banking income 654,245,840 582,678,541 130. Net impairment adjustments to: (126,709,595) (112,205,499) a) loans and advances (101,312,312) (102,790,209) b) financial assets available for sale (24,474,994) (9,116,990) d) other financial transactions (922,289) (298,300)
140. Net income from financial activities 527,536,245 470,473,042 150. Administrative costs: (433,703,378) (372,363,369) a) payroll (254,336,596) (209,896,967) b) other administrative costs (179,366,782) (162,466,402)
160. Net provisions for risks and charges (15,331,836) (26,104,834)
170. Net adjustments to property, plant and equipment (7,455,828) (5,673,226)
180. Net adjustments to intangible assets (4,430,135) (2,198,992)
190. Other operating charges/income 26,830,665 42,339,155
200. Operating costs (434,090,512) (364,001,266)210. Profit (loss) from equity investments 97,069,566 42,627,679
240. Gains (losses) on disposal of investments (177,827) 9,438
250. Profit (loss) from current operations before tax 190,337,472 149,108,893 260. Income taxes on current operations (39,302,124) (39,018,684)
270. Profit (loss) from current operations after tax 151,035,348 110,090,209
290. Net income (loss) for the year 151,035,348 110,090,209

150
The “Issue of new shares” is stated net of the cancellations recorded during the year,
CHANGES IN 2008 EQUITY
Balance at Changes to Balance at Allocation of prior year Changes in the year Equity at 31/12/2007 opening 01/01/2008 results Changes Equity transactions Net income 31/12/2008 balances Reserves Dividends and in reserves Issue Purchase of Extraordinary Change in Derivatives Stock (loss) other of new treasury distribution equity on treasury Options for the year allocations shares shares of dividends instruments shares Capital stock: 261,656,498 – 261,656,498 – – – (196,238) – – – – – – 261,460,260 a) ordinary shares 261,656,498 – 261,656,498 – – – (196,238) – – – – – – 261,460,260 b) other shares – – – – – – – – – – – – – –
Additional paid–in capital 1,963,296,772 – 1,963,296,772 – – – (2,942,028) – – – – – – 1,960,354,744
Reserves: 478,158,674 – 478,158,674 37,500,000 – 1,471,781 – – – – – – – 517,130,455 a) from earnings 321,757,942 – 321,757,942 17,500,000 – 1,471,781 – – – – – 340,729,723 b) other 156,400,732 – 156,400,732 20,000,000 – – – – – – – – 176,400,732
Valuation reserves: (43,225,395) – (43,225,395) – – 81,273,642 – – – – – – – 38,048,247 a) available for sale assets (45,325,689) – (45,325,689) – – 81,273,642 – – – – – – – 35,947,953 b) cash flow hedges – – – – – – – – – – – – – – c) other 2,100,294 – 2,100,294 – – – – – – – – – – 2,100,294 – property, plant and equipment – – – – – – – – – – – – – – – special revaluation laws 2,100,294 – 2,100,294 – – – – – – – – – – 2,100,294
Equity instruments 13,629,996 – 13,629,996 – – – – – (525,780) – – – 13,104,216
Treasury shares – – – – – – – (96,980,760) – – – – – (96,980,760)
Net income (loss) for the year 110,090,209 – 110,090,209 (37,500,000) (72,590,209) – – – – – – – 151,035,348 151,035,348
Equity 2,783,606,754 – 2,783,606,754 – (72,590,209) 82,745,423 (3,138,266) (96,980,760) – (525,780) – – 151,035,348 2,844,152,510

151
Balance at Changes to Balance at Allocation of prior year Changes in the year Equity at 31/12/2007 opening 01/01/2008 results Changes Equity transactions Net income 31/12/2008 balances Reserves Dividends and in reserves Issue Purchase of Extraordinary Change in Derivatives Stock (loss) other of new treasury distribution equity on treasury Options for the year allocations shares shares of dividends instruments shares Capital stock: 261,656,498 – 261,656,498 – – – (196,238) – – – – – – 261,460,260 a) ordinary shares 261,656,498 – 261,656,498 – – – (196,238) – – – – – – 261,460,260 b) other shares – – – – – – – – – – – – – –
Additional paid–in capital 1,963,296,772 – 1,963,296,772 – – – (2,942,028) – – – – – – 1,960,354,744
Reserves: 478,158,674 – 478,158,674 37,500,000 – 1,471,781 – – – – – – – 517,130,455 a) from earnings 321,757,942 – 321,757,942 17,500,000 – 1,471,781 – – – – – 340,729,723 b) other 156,400,732 – 156,400,732 20,000,000 – – – – – – – – 176,400,732
Valuation reserves: (43,225,395) – (43,225,395) – – 81,273,642 – – – – – – – 38,048,247 a) available for sale assets (45,325,689) – (45,325,689) – – 81,273,642 – – – – – – – 35,947,953 b) cash flow hedges – – – – – – – – – – – – – – c) other 2,100,294 – 2,100,294 – – – – – – – – – – 2,100,294 – property, plant and equipment – – – – – – – – – – – – – – – special revaluation laws 2,100,294 – 2,100,294 – – – – – – – – – – 2,100,294
Equity instruments 13,629,996 – 13,629,996 – – – – – (525,780) – – – 13,104,216
Treasury shares – – – – – – – (96,980,760) – – – – – (96,980,760)
Net income (loss) for the year 110,090,209 – 110,090,209 (37,500,000) (72,590,209) – – – – – – – 151,035,348 151,035,348
Equity 2,783,606,754 – 2,783,606,754 – (72,590,209) 82,745,423 (3,138,266) (96,980,760) – (525,780) – – 151,035,348 2,844,152,510

152
The “Issue of new shares” is stated net of the cancellations recorded during the year,
CHANGES IN 2007 EQUITY
Balance at Changes to Balance at Allocation of prior year Changes in the year Equity at 31/12/2006 opening 01/01/2007 results Changes Equity transactions Net income 31/12/2007 balances Reserves Dividends and in reserves Issue Purchase of Extraordinary Change in Derivatives Stock (loss) other of new treasury distribution equity on treasury Options for the year allocations shares shares of dividends instruments shares Capital stock: 230,868,285 – 230,868,285 – – – 30,788,213 – – – – – – 261,656,498 a) ordinary shares 230,868,285 – 230,868,285 – – – 30,788,213 – – – – – – 261,656,498 b) other shares – – – – – – – – – – – – – –
Additional paid–in capital 1,557,855,602 – 1,557,855,602 – – – 405,441,170 – – – – – – 1,963,296,772
Reserves: 410,244,233 – 410,244,233 54,600,000 – 1,260,493 – – – 12,053,948 – – – 478,158,674 a) from earnings 283,843,501 – 283,843,501 24,600,000 – 1,260,493 – – 12,053,948 – – – 321,757,942 b) other 126,400,732 – 126,400,732 30,000,000 – – – – – – – – 156,400,732
Valuation reserves: 16,724,407 – 16,724,407 – – (59,949,802) – – – – – – – (43,225,395)a) available for sale assets 14,624,113 – 14,624,113 – – (59,949,802) – – – – – – – (45,325,689)b) cash flow hedges – – – – – – – – – – – – – – c) other 2,100,294 – 2,100,294 – – – – – – – – – – 2,100,294 – property, plant and equipment – – – – – – – – – – – – – – – special revaluation laws 2,100,294 – 2,100,294 – – – – – – – – – – 2,100,294
Equity instruments 12,053,948 – 12,053,948 – – – – – 1,576,048 – – – 13,629,996
Treasury shares – – – – – – – – – – – – – –
Net income (loss) for the year 120,025,063 – 120,025,063 (54,600,000) (65,425,063) – – – – – – – 110,090,209 110,090,209
Equity 2,347,771,538 – 2,347,771,538 – (65,425,063) (58,689,309) 436,229,383 – – 13,629,996 – – 110,090,209 2,783,606,754

153
Balance at Changes to Balance at Allocation of prior year Changes in the year Equity at 31/12/2006 opening 01/01/2007 results Changes Equity transactions Net income 31/12/2007 balances Reserves Dividends and in reserves Issue Purchase of Extraordinary Change in Derivatives Stock (loss) other of new treasury distribution equity on treasury Options for the year allocations shares shares of dividends instruments shares Capital stock: 230,868,285 – 230,868,285 – – – 30,788,213 – – – – – – 261,656,498 a) ordinary shares 230,868,285 – 230,868,285 – – – 30,788,213 – – – – – – 261,656,498 b) other shares – – – – – – – – – – – – – –
Additional paid–in capital 1,557,855,602 – 1,557,855,602 – – – 405,441,170 – – – – – – 1,963,296,772
Reserves: 410,244,233 – 410,244,233 54,600,000 – 1,260,493 – – – 12,053,948 – – – 478,158,674 a) from earnings 283,843,501 – 283,843,501 24,600,000 – 1,260,493 – – 12,053,948 – – – 321,757,942 b) other 126,400,732 – 126,400,732 30,000,000 – – – – – – – – 156,400,732
Valuation reserves: 16,724,407 – 16,724,407 – – (59,949,802) – – – – – – – (43,225,395)a) available for sale assets 14,624,113 – 14,624,113 – – (59,949,802) – – – – – – – (45,325,689)b) cash flow hedges – – – – – – – – – – – – – – c) other 2,100,294 – 2,100,294 – – – – – – – – – – 2,100,294 – property, plant and equipment – – – – – – – – – – – – – – – special revaluation laws 2,100,294 – 2,100,294 – – – – – – – – – – 2,100,294
Equity instruments 12,053,948 – 12,053,948 – – – – – 1,576,048 – – – 13,629,996
Treasury shares – – – – – – – – – – – – – –
Net income (loss) for the year 120,025,063 – 120,025,063 (54,600,000) (65,425,063) – – – – – – – 110,090,209 110,090,209
Equity 2,347,771,538 – 2,347,771,538 – (65,425,063) (58,689,309) 436,229,383 – – 13,629,996 – – 110,090,209 2,783,606,754

154
A. OPERATING ACTIVITIES 31–12–2008 31–12–2007
1 Operations 165,274,241 216,595,662
– Interest income collected (+) 1,092,195,481 867,791,527 – Interest expense paid (–) (704,906,191) (512,776,326) – Dividend and similar income 27,547,992 29,357,904 – Net fee and commission income (+/–) 177,568,695 174,988,744 – Payroll costs (–) (245,293,495) (191,150,723) – Other costs (–) (169,366,782) (159,177,500) – Other revenues (+) 26,830,665 46,580,720 – Taxation (–) (39,302,124) (39,018,684)
2. Liquidity generated/absorbed by financial assets (1,445,577,804) (2,842,215,436)
– Financial assets held for trading (3,209,633) 561,952,635 – Financial assets at fair value 16,242,169 2,400,885 – Financial assets available for sale 68,911,604 (276,152,000) – Loans and advances to customers (977,094,442) (2,344,860,309) – Loans and advances to banks: demand (400,781,719) (752,584,841) – Loans and advances to banks: other receivables (62,579,000) (5,625,903) – Other assets (87,066,783) (27,345,903)
3. Liquidity generated/absorbed by financial liabilities 1,258,709,373 2,732,607,964
– Deposits from banks: demand (189,001,712) 89,224,664 – Deposits from banks: other payables 376,355,000 1,537,303,684 – Due to customers 286,870,650 85,707,828 – Debt securities in issue 42,961,583 243,161,421 – Financial liabilities held for trading (3,616,231) 7,465,306 – Financial liabilities at fair value 617,684,190 722,627,000 – Other liabilities 127,455,893 47,118,061
Net liquidity generated/absorbed by operating activities (21,594,190) 106,988,190
B. INVESTING ACTIVITIES
1. Liquidity generated by 222,363,600 113,143,431
– Disposal of equity investments (1) 194,300,000 74,147,000 – Dividends collected on equity investments 27,791,756 38,941,431 – Disposal of property, plant and equipment 271,844 55,000
2. Liquidity absorbed by (35,986,346) (581,841,173)
– Purchase of equity investments (24,286,500) (82,555,000) – Purchase of property, plant and equipment (10,515,798) (13,448,754) – Purchase of intangible assets (1,184,048) (4,484,000) – Purchase of businesses – (481,353,419)
Net liquidity generated/absorbed by investing activities 186,377,254 (468,697,742)
CASH FLOW STATEMENT
Direct method

155
C. FUNDING ACTIVITIES
– Issue/purchase of treasury shares (100,119,026) 436,229,383 – Issue/Purchases of equity instruments (525,780) – – Distribution of dividends and other purposes (72,590,209) (61,564,876)
Net liquidity generated/absorbed by funding activities (173,235,015) 374,664,507
NET LIQUIDITY GENERATED/ABSORBED IN THE YEAR (8,451,951) 12,954,955
RECONCILIATION
Captions 31–12–2008 31–12–2007
Cash and cash equivalents at the beginning of the year 108,425,370 95,470,415
Net liquidity generated/absorbed in the year (8,451,951) 12,954,955
Cash and cash equivalents at the end of the year 99,973,419 108,425,370
(1) This item includes the sale of the entire interest held in Linea SpA, classified in 2007 under “Non-current assets held for sale”.
The statement of cash flows presented above was prepared using the “direct” method envisaged by IAS 7 and reports the “cash flows” from the Bank’s operating, investing and financing activities.

,

Part A – Accounting policies
Part B – Information on the balance sheet
Part C – Information on the income statement
Part D – Segment information
Part E – Information on risks and related hedging policy
Part F – Information on equity
Part G – Combinations of companies and businesses
Part H – Related-party transactions
Part I – Equity-settled payment arrangements
157
EXPLANATORY NOTES TO THE FINANCIAL STATEMENTS

158
PARTE AACCOUNTING POLICIES
A. 1 - GENERAL INFORMATION
Section 1 - Declaration of conformity with IFRS
The financial statements consist of the balance sheet, the income statement, the statement of changes in equity, the statement of cash flows and these explanatory notes, accompanied by the report of the Board of Directors; they have been prepared in accordance with the International Accounting Standards (IAS) and International Financial Reporting Standards (IFRS) issued by the International Accounting Standards Board (IASB) and endorsed by the European Commission under the procedure in art. 6 of Regulation (EC) 1606/2002 and in force at the balance sheet date, including the related interpretations of the International Financial Reporting Interpretations Committee (IFRIC).
Section 2 - Basis of preparation
The financial statements are prepared on a going concern basis and with reference to the general criteria listed below:– true and fair view;– matching principle;– consistency of comparison;– no-offset, except where specifically allowed; – substance over form;– prudence.
Consistent with art. 9 of Decree 38/2005, the financial statements have been prepared with reference to the formats and rules specified in Bank of Italy Circular 262 dated 22 December 2005. Additional information, considered necessary to give a true and fair view of the financial statements, has also been provided even if not specifically required by the regulations.
The amounts contained in the balance sheet, the income statement, the statement of changes in equity and the statement of cash flows are stated in euro, while these explanatory notes, except where indicated otherwise, are stated in thousands of euro. The roundings have been made in accordance with the related regulations.
Going concern
The joint co-ordination committee for IAS/IFRS application between the Bank of Italy, Consob and Isvap (Italy’s insurance industry regulator) issued its document no. 2 on 6 February 2009 entitled “Disclosures in financial reports on going concern, financial risks, impairment testing and estimation uncertainty”. This document requires management to carry out a particularly detailed review in relation to the presumption of going concern.Paragraphs 23-24 of IAS 1 establish that: “When preparing financial statements, management shall make an assessment of an entity’s ability to continue as a going concern. Financial statements shall be prepared on a going concern basis unless management either intends to liquidate the entity or to cease trading, or has no realistic alternative but to do so. When management is aware, in making its assessment, of material uncertainties related to events or conditions that may cast significant doubt upon the entity’s ability to continue as a going concern, those uncertainties shall be disclosed. When financial statements are not prepared on a going concern basis, that fact shall be disclosed, together with the basis on which the financial statements are prepared and the reason why the entity is not regarded as a going concern”.

159
The current conditions of financial markets and of the real economy and the negative short/medium-term forecasts mean that the presumption of going concern must now be assessed particularly thoroughly.
Having examined the risks and uncertainties associated with the current macroeconomic context, the Bank can reasonably expect to carry on its operations in the foreseeable future and so its financial statements for 2008 have been prepared on a going concern basis.
Uncertainties associated with liquidity, credit and earnings risks are viewed as not significant and in any case not such as to cast doubt upon the Bank’s ability to continue as a going concern, also in view of the constant growth in the Bank’s earnings in recent years, the good quality of its loan book and its ease of access to financial resources. For more details, please refer to the paragraph on “Outlook for operations” in the directors’ report.
Section 3 – Subsequent events
There have been no significant events since the date of the financial statements (31 December 2008) and the date of their approval by the Board of Directors (24 March 2009), except as indicated below.On 28 January 2009 the Lazio regional Tax Tribunal accepted the appeal by Banca Popolare di Vicenza and cancelled the action taken by the Italian Antitrust Authority in August 2008 against the Bank, relating to alleged unfair business practice involving the transferability of mortgages at zero charge (as allowed by art. 8 of Decree 7 dated 31 January 2007, as amended by Law 40 dated 2 April 2007 and Law 244 dated 24 December 2007).On 1 March 2009, the Bank acquired the Corporate Business Unit (CBU) of Banca Popolare Commercio e Industria in Brescia. The acquisition of the Corporate Business Unit, comprising corporate customers in the provinces of Brescia and Bergamo, forms part of the previous acquisition on 31 December 2007 of 18 bank branches located in these provinces, and so has taken place without the Bank paying any additional consideration. More details about these acquisitions can be found in Part G of these Explanatory Notes.
Section 4 – Other matters
The figures contained in the balance sheet, income statement, statement of changes in equity, cash flow statement and the tables in Part B and Part C of these explanatory notes are all presented on a comparative basis with those at 31 December 2007. Line items in the balance sheet and income statement and in the tables in the explanatory notes are not presented if their balance is zero in both years.
As from the date of these financial statements, the emoluments of the Board of Statutory Auditors and related reimbursement of expenses are being classified in “Payroll costs” (previously they were reported in “Other administrative costs”); this reclassification is to comply with the Bank of Italy’s instructions regarding financial statements of banks and financial institutions. These amounts have consequently been reclassified in the income statement and related notes for 2007.
The financial statements have been audited by KPMG S.p.A., an independent firm of auditors. The financial statements are also accompanied by the attestation of the Financial Reporting Manager, as required by art. 154-bis, para. 5, of Decree 58/98 (Italy’s Consolidated Financial Markets Act – TUF) as amended by Decree 195/2007 which implemented the EU’s Transparency Directive.

160
Estimation uncertainty and risks
As indicated in the explanatory notes, estimation processes have been completed in support of the carrying amount of the more significant items requiring valuation in the financial statements at 31 December 2008, as required by prevailing accounting standards and relevant regulation. These processes are largely based on estimating the future recoverability of amounts reported in the financial statements in accordance with rules dictated by current regulation and have been performed on a going concern basis, ie. valuations are not based on the assumption of a forced sale.
The outcome of this work supports the carrying amount of these items at 31 December 2008. It should be stated, however, that this valuation process was particularly complex in view of the current macroeconomic and market context, featuring abnormal volatility in all financial measures used for valuation purposes, and the consequent difficulty in making even short-term forecasts for these financial parameters which have a significant impact on estimates.
The parameters and information used for verifying the values mentioned above have been heavily affected by the particularly uncertain macroeconomic and market environment which could, like in recent months, experience currently unforeseeable rapid changes, with a consequent impact on the amounts reported in the financial statements at 31 December 2008.

161
A.2 - PART RELATING TO THE PRINCIPAL FINANCIAL STATEMENT LINE ITEMS
This section describes the accounting policies adopted for the preparation of the financial statements as of 31 December 2008. These policies were applied on a basis consistent with those adopted for the preparation of the 2007 financial statements, which were also prepared under IAS/IFRS, except for the changes to IAS 39 “Financial instruments: recognition and measurement” and to IFRS 7 “Financial instruments: disclosures” contained in the document “Reclassification of Financial Assets”, published by the IASB on 13 October 2008 and endorsed by the European Commission on 15 October 2008 with Regulation EC 1004/2008.
ASSETS
1. Financial assets held for trading
Classification
This line item comprises the financial instruments held for trading in the short term; specifically:• debtsecurities,whetherlistedorunlisted,heldfortrading;• listedequityinstrumentsheldfortrading;• unlistedequityinstrumentsheldfortrading,butonlyiftheirfairvaluecanbedeterminedon
a reliable basis;• asset-backeddebtsecurities(ABS),seniorormezzanine,issuedbyspecial-purposevehicles
(SPV) as part of securitizations by the Parent Bank or by third parties;• structuredsecurities;• unitsinmutualfundsandsicavsheldfortrading;• derivativecontractswithapositivefairvalueatthereportingdate,exceptforcontractsthat
are designated as effective hedging instruments; if the fair value of a derivative contract subsequently becomes negative it is recorded as a financial liability held for trading.
Derivative contracts include embedded derivatives which are attached to a primary financial instrument, known as the “host contract”, and forward transactions in currencies, securities, goods and precious metals. An embedded derivative is recognized separately from the host contract when all of the following conditions are satisfied:1. its economic and risk characteristics are not closely correlated with those of the “host”
instrument;2. the separated embedded instrument meets the definition of a derivative;3. the hybrid instrument is not carried at fair value through the income statement.
Financial instruments are designated as financial assets held for trading upon initial accounting recognition. They cannot be subsequently reclassified, except as provided by paragraphs 50 to 54 of IAS 39, as amended by Regulation (EC) 1004/2008 of the European Commission issued on 15 October 2008.
Recognition
The initial recognition of financial assets held for trading takes place: on the settlement date for debt securities, equity instruments and units in mutual funds and sicavs; on the subscription date for derivative contracts.
162
Financial assets held for trading are initially recognized at their fair value and the transaction costs and/or income directly attributable to them are not recognized. The fair value of instruments acquired on market terms is represented by their purchase cost.
Measurement and recognition of components affecting the income statement
Subsequent to initial recognition, financial assets held for trading are stated at fair value through the income statement. IAS 39 defines fair value as “the amount for which an asset could be exchanged, or a liability settled, between knowledgeable, willing parties in an arms’-length transaction”. For the determination of fair value, please refer to paragraph 4 “Criteria for determining fair value” in the “Other information” section of Part A.
If the fair value of financial assets cannot be determined reliably, they are stated at cost and recorded as “financial assets available for sale“.
Gains and losses realized on sale or redemption and unrealized gains and losses deriving from changes in the fair value of financial assets/liabilities held for trading are classified in the “net trading profit (loss)” caption of the income statement, together with the effect of measuring foreign currency monetary assets and liabilities.
Derecognition
Financial assets held for trading are derecognized when the contractual rights over the related cash flows expire or when the financial asset is transferred together with substantially all the contractual risks and benefits associated with its ownership.
2. Financial assets at fair value
Classification
This line item comprises the assets or groups of assets designated at fair value through the income statement, under the fair-value option (FVO) envisaged by IAS 39. In particular, the FVO is used when it eliminates or significantly reduces accounting imbalances deriving from the inconsistent recognition of financial instruments that are correlated (natural hedges) or covered by derivative contracts which, due to difficulties and complexities, cannot be recognised as hedges. The FVO is also used in the presence of an embedded derivative that meets the conditions described in paragraph 11 of IAS 39. This avoids separating it from the host instrument by stating the entire financial instrument at fair value.
Financial instruments are designated as financial assets at fair value upon initial recognition. They cannot be reclassified subsequently.
Recognition, measurement, derecognition and recording of components affecting the income statement
The principles applying to the recognition, measurement and derecognition of financial assets at fair value are the same as those relating to “financial assets held for trading”.
Gains and losses realized on sale or redemption and unrealized gains and losses deriving from changes in the fair value of financial assets/liabilities at fair value are classified as “net trading profit (loss) financial assets and liabilities at fair value” in the income statement.

163
3. Financial assets available for sale
Classification
This line item comprises the non-derivative financial assets that are not classified in the other categories envisaged by IAS 39. Accordingly, this is a residual category that includes for example:• unlistedequities,unlessoriginallyattributedtotheportfoliooffinancialassetsheldfor
trading;• securitiesthatguaranteetransactionsarrangedwiththirdparties,ifnotclassifiedelsewhere;• unitsinmutualfundsandsicavs,unlessoriginallyattributedtotheportfoliooffinancialassets
held for trading;• junior asset-backed debt securities issued by SPVs as part of own or third-party
securitizations;• equityinvestmentsthatdonotrepresentinterestsinsubsidiaries,associatesorjointventures;• otherdebtandequityinstrumentsthatcannotbeclassifiedintotheabovecategories.
Financial instruments are designated as financial assets available for sale upon initial recognition. They cannot be subsequently reclassified, except as provided by paragraphs 50 to 54 of IAS 39, as amended by Regulation (EC) 1004/2008 of the European Commission issued on 15 October 2008.
Recognition
Financial assets available for sale are initially recognized on the settlement date, on the basis of their fair value, as uplifted by any directly-attributable acquisition costs.
Measurement and recognition of components affecting the income statement
Subsequent to initial recognition, AFS financial assets are stated at fair value; the profits and losses deriving from any changes in fair value are recorded in a specific equity reserve until the financial assets concerned are derecognized or a permanent impairment of value is recognized.
If an AFS financial asset suffers an impairment loss, the accumulated unrealized losses deferred to equity are released to “net impairment adjustments to financial assets available for sale” in the income statement. Write-backs of AFS financial instruments are credited to the income statement if they are debt securities or to equity if they are equity instruments.
Fair value is determined on the basis described in relation to financial assets held for trading. If the fair value of financial assets cannot be determined on a reliable basis, they are stated at cost.
The interest income on these financial assets is determined using the effective interest method.
Any exchange gains or losses on AFS financial assets are recorded in the income statement if they relate to monetary items (e.g. debt securities) and as part of equity if they relate to non-monetary items (e.g. equity instruments).
Derecognition
AFS financial assets are derecognized when the contractual rights over the related cash flows expire or when the financial asset is transferred together with substantially all the contractual risks and benefits associated with its ownership.

164
4. Financial assets held to maturity
Classification
This category comprises debt instruments quoted in “active markets”, with fixed maturities and fixed or determinable payments, which the Bank intends and is able to hold until maturity. These include debt securities with maturities/residual lives of not less than 24 months which comply with the quantitative limits established at Group level, as authorized by the Board of Directors.
Financial instruments are designated as financial assets held to maturity upon initial recognition. They cannot be subsequently reclassified, except as provided by paragraphs 50 to 54 of IAS 39, as amended by Regulation (EC) 1004/2008 of the European Commission issued on 15 October 2008.
Recognition
Financial assets held to maturity are initially recognized on the settlement date, on the basis of their fair value, as uplifted by any directly-attributable acquisition costs.
Measurement and recognition of components affecting the income statement
Subsequent to initial recognition, financial assets held to maturity are measured at amortized cost, using the effective interest method. Profits and losses relating to these assets held to maturity are recorded in the income statement at the time of derecognition.An impairment test is carried out at the reporting date to check for objective evidence of any loss in value. Any losses identified are charged to the income statement under “net impairment adjustments to financial assets held to up to maturity”. If the reasons for such losses cease to apply due to events subsequent to the write-down, the original amounts are reinstated by crediting the related write-backs to the income statement. Write-backs do not exceed the amortized cost that the instrument would have had in the absence of earlier write-downs.
The interest income on these financial assets is determined using the effective interest method.
Derecognition
Financial assets held to maturity are derecognized when the contractual rights over the related cash flows expire or when the financial asset is transferred together with substantially all the contractual risks and benefits associated with its ownership.
5. Loans and advances to banks
Classification
This line item comprises financial assets due from banks (current accounts, guarantee deposits, debt securities, etc.) that have been classified in the loan portfolio.
Details of the recognition, measurement, derecognition and recording of these loans can be found in the subsequent note on “loans and advances to customers”.

165
6. Loans and advances to customers Classification
Loans to customers include short and long-term finance granted directly to customers or purchased from third parties, which is repayable on fixed or determinable dates and is not quoted in an active market.
This category also includes debt securities not quoted in an active market acquired on initial placement, where the lending element prevails over the investment element, and the purchase essentially represents the granting of a loan.
Financial instruments are designated as loans and advances to customers upon initial recognition. They cannot be subsequently reclassified, except as provided by the amendment to IAS 39 “Financial instruments: recognition and measurement” contained in the document “Reclassification of Financial Assets” approved by the European Commission on 15 October 2008.
Recognition
The initial recognition of a loan takes place on the grant date or, in the case of debt securities, on the settlement date, with reference to the fair value of the financial instrument. This is the amount paid out, or the subscription price, including the directly-related and determinable costs and commissions applying from the start of the transaction.
Costs with the above characteristics are excluded if they are reimbursable by the borrower or represent normal internal administrative costs.
Measurement and recognition of components affecting the income statement
Subsequent to initial recognition, loans to customers are measured at amortized cost. This is their initially-recorded value as decreased/increased by repayments of principal, write-downs/write-backs and the amortization – determined using the effective interest method – of the difference between the amount paid out and that repayable on maturity, which typically represents costs/income directly attributable to the individual loans.
The effective interest rate is the rate that discounts the flow of estimated future payments over the expected duration of the loan so as to obtain exactly the net book value at the time of initial recognition, which includes directly-related transaction costs and all fees paid or received between the contracting parties. This financial method of accounting distributes the economic effect of costs/income over the expected residual life of each loan.
Estimates of the flows and the contractual duration of the loan take account of all contractual clauses that could influence the amounts and due dates (such as early repayments and the various options that can be exercised), but without considering any expected losses on the loan.
The amortized cost method is not applied to short-term loans, since the discounting effect would be negligible, and these are therefore stated at historical cost. The same measurement criterion is applied to loans without a fixed repayment date or which are repayable upon demand.
In addition, an analysis is performed to identify any problem loans for which there is objective evidence of possible impairment. This category includes loans classified as “non-performing”,

166
“watchlist”, “restructured” or “past due”, as defined by the supervisory regulations.The adjustment to the value of each loan represents the difference between its amortized cost (or historical cost for short-term and demand loans) at the time of measurement and the discounted value of the related future cash flows, determined using the original effective interest rate.
Key elements in determining the present value of future cash flows comprise the estimated realizable value of loans, also taking account of any available guarantees, the expected timing of recoveries and the forecast loan-recovery costs. Cash flows relating to loans due to be recovered in the short term are not discounted.
In particular, the approach taken for determining case-by-case the recoverable value of non-performing loans depends on their amount:• uptoEuro25,000,thepositionsareanalyzedcase-by-casebutarenotdiscounted,sincethey
are frequently not taken to court, but sold after the usual attempts to obtain recovery on an amicable basis - these loans generally remain in this category for not more than 12/18 months, representing the short term;
• fromEuro25,000toEuro150,000,thepositionsareanalyzedonacase-by-casebasistoestimate the amount recoverable, which is discounted over the average recovery period, as determined with reference to historical-statistical information;
• amountsexceedingEuro150,000areanalyzedonacase-by-casebasistoestimatetheamountrecoverable, which is discounted over the likely recovery period, as determined by the competent corporate functions.
Watchlist loans exceeding Euro 150,000 are analyzed on a case-by-case basis to estimate the amount recoverable, which is discounted over the likely average recovery period, as determined on the basis of historical-statistical information.Watchlist loans falling below the above threshold are assessed on an overall basis according to their amount:• uptoEuro25,000,theassessmentiscarriedoutusingprobabilityofdefault(PD)andloss
given default (LGD) parameters estimated for the specific class; these positions are not discounted, since they will be settled and/or sold within 12-18 months of being classified as non-performing;
• fromEuro25,000toEuro150,000,theassessmentiscarriedoutusingthePDandLGDparameters estimated for the specific class, with the related future nominal cash flows discounted over the estimated average recovery period, as determined with reference to historical-statistical information.
Restructured loans are valued by discounting the “implied” loss arising from restructuring the position. If restructured loans are predicted to produce a loss over and above the “implied” loss above, they are immediately put on the watchlist and valued in accordance with the rules applying to this category.
Loans past due are written down on an overall basis. This test is performed by grouping loans into categories that reflect a similar degree of risk. The related loss percentages are then estimated with reference to historical information, in order to measure the inherent loss for each category of loan. Estimated future cash flows are determined using PD and LGD parameters by technical form and the resulting flows are discounted on the basis of average recovery times, determined with reference to historical-statistical information.
Loans for which no objective evidence of loss has been individually identified, i.e. performing loans, including those to residents in countries at risk, are subjected to impairment testing on an overall basis. This test is performed by grouping loans into categories that reflect a similar degree of risk. The related loss percentages are then estimated with reference to historical information,

167
in order to measure the inherent loss for each category of loan. Estimated future cash flows are also determined using PD and LGD parameters by technical form and the resulting flows are discounted on the basis of average recovery times, determined with reference to historical-statistical information.No write-downs are recorded in relation to loans represented by repurchase agreements, since they are not subject to lending risk, or to loans to Group companies, non-profit organizations and local and public administrations.
Provisions made for an impaired loan are only reversed if the credit quality has improved to the extent that timely recovery of the principal and interest, with respect to the original terms for the loan contract, is reasonably certain, or if the amount actually recovered exceeds the recoverable amount estimated previously. Write-backs include the positive effect of discounting adjustments made due to the progressive reduction in the estimated time required to recover the related loans.
Adjustments, net of previous provisions and the partial or total recovery of amounts previously written down, are recorded in income statement line item 130 a) “net impairment adjustments to loans and advances”.
Derecognition
Loans are derecognized as assets when they are deemed to be unrecoverable or are transferred together with substantially all the related risks and benefits.
7. Hedging derivatives
Classification
This line item reports the derivative contracts designated as effective hedging instruments which have a positive fair value at the reporting date. If the fair value of a derivative contract subsequently becomes negative it is recorded as a liability in the corresponding line item.
Derivative contracts are intended to neutralize possible losses on certain elements or groups of elements due to a given risk (e.g. a rise in interest rates), via the generation of profits if the events associated with that risk should actually occur.
Derivatives not held for hedging purposes are classified as “financial assets held for trading”.
At the time that a hedging derivative is arranged, the Bank classifies it as one of the following types of hedge:• fairvaluehedgeofagivenassetorliability:theobjectiveistohedgetheexposuretochanges
in fair value of an item caused by given risks;• cashflowhedgeattributabletoaparticularassetorliability:theobjectiveistohedgethe
exposure to changes in the future cash flows associated with an item caused by given risks; • hedgeoftheeffectsofaninvestmentdenominatedinforeigncurrency:theobjectiveisto
hedge the risks associated with investing in a foreign operation denominated in foreign currency.
Hedges can refer to individual financial instruments and/or groups of financial assets/liabilities.
The derivative instrument is classified as a hedge if it has been formally designated as such, there

168
is a documented relationship between the hedged instrument and the hedging instrument, and it is effective – prospectively and retrospectively – both at the start of the hedge and throughout its life.
A hedge is considered effective if the hedging instrument is able to generate a cash flow or a change in fair value that is consistent with that of the hedged instrument. More precisely, the hedge is effective when changes in the fair value (or cash flows) of the hedging instrument neutralize the changes in the hedged instrument, deriving from the risk being hedged, within an interval of 80%-125%.
The effectiveness of the hedge is assessed at the start of the hedge and throughout its life and, in particular, on each reporting date, using:• prospectiveteststhatjustifytheadoptionofhedgeaccountingbyshowingtheexpected
effectiveness of the hedge in future periods;
• retrospectiveteststhatshowtheeffectivenessofthehedgeduringthereferenceperiod.
If the tests do not confirm the effectiveness of the hedge, the hedge accounting described above is terminated and the related derivative contract is reclassified among the “financial assets held for trading”.
In addition, transactions are no longer classified as hedges if:• thehedgecreatedbythederivativeceases;• thederivativeexpires,issold,terminatedorexercised;• thehedgeditemissold,expiresorisredeemed;• thehedgenolongermeetsthecriteriatoqualifyforhedgeaccounting.
Recognition
The initial recognition of hedging derivatives takes place when their fair value is determined.
Measurement and recognition of components affecting the income statement
Subsequent to initial recognition, hedging derivatives are stated at fair value on the basis described below: • inthecaseof fairvaluehedges,changes in thevalueof thehedged instrumentandthe
hedging instrument are reflected in the income statement, in order to offset effectively changes in the fair value of the hedged item against the opposite changes in the fair value of the hedging instrument. Any difference, representing the ineffective portion of the hedge, therefore represents the net economic effect of the hedge;
• inthecaseofcashflowhedges,changesinthefairvalueofthederivativearerecordedinequity, to the extent that the hedge is effective, and are only released to the income statement when the related cash flows are actually generated by the hedged item. If the hedge is not effective, changes in the fair value of the hedging contract are recorded in the income statement;
• hedgesofinvestmentsdenominatedinforeigncurrencyarerecordedinthesamewayascashflow hedges.
Hedging instruments only consist of derivative contracts, excluding therefore any internal deals or other types of financial instrument.

169
Derecognition
Hedging derivatives are derecognized on disposal, if this substantially involves the transfer of all the risks and benefits associated with them. If the hedge becomes ineffective, the hedge accounting described above ceases and the derivative contract is reclassified to “financial assets held for trading”.
8. Equity investments
Classification
This line item comprises investments in subsidiary and associated companies and joint ventures.
Recognition
Equity investments are recorded in the financial statements at their acquisition cost inclusive of incidental expenses.
Measurement criteria
Equity investments are tested for impairment by estimating their recoverable amount, which takes account of the present value of future cash flows generated by equity investment, including the value of its ultimate sale and/or other factors.
If the recoverable amount is less that book value, the difference is recognized in the income statement under “Profit (loss) from equity investments”.
If the reasons for such impairment cease to apply due to events subsequent to its recognition, the write-down is reversed through the income statement in the same line item as above, but for no more than the amount of the original impairment loss.
Derecognition
Equity investments are derecognized on expiry of the contractual rights over the related financial flows, or when the investment is sold with the transfer of essentially all the related risks and benefits of ownership.
Recognition of components affecting the income statement
Consistent with IAS 18, dividends are recorded when the stockholders’ right to receive them is established, which is subsequent to the related resolution adopted by the stockholders of the declaring company.

170
9. Property, plant and equipment
Classification
This line item comprises the fixed assets held for use in the generation of income, for rent or for administrative purposes, such as land, business property, investment property, installations, furniture, furnishings and all types of equipment.
Business property is that held for the provision of services or for administrative purposes, while investment property is that owned to earn rental income and/or with a view to capital appreciation.
Property, plant and equipment also include leasehold improvements, if they can be separated from the related assets. If these items are expected to generate future benefits, but are not functionally and operationally independent, they are classified as “other assets” and depreciated over the expected useful life of the improvements or the residual lease period, whichever is shorter.
Amounts paid in advance to acquire and restructure assets not yet used for productive purposes are capitalized, but not depreciated.
Recognition
Property, plant and equipment are initially recorded at cost, including all directly attributable costs of bringing them to working condition. Expenditure that improves an asset or increases the future economic benefits expected from the asset is allocated to the asset concerned and depreciated over its remaining useful life.
Measurement and recognition of components affecting the income statementSubsequent to initial recognition, property, plant and equipment are stated at cost, net of accumulated depreciation and any impairment write-downs, consistent with the “cost model” described in para. 30 of IAS 16.
Property, plant and equipment are systematically depreciated over their useful lives on a straight-line basis, except for: • land, whether acquired separately or included in the value of buildings, which is not
depreciated since it has an unlimited useful life. With regard to free-standing properties, the value of the land is separated from the value of the related buildings by internal and/or independent expert appraisals, unless this information is directly available from the purchase contract;
• worksofart,whicharenotdepreciatedsincetheynormallyhaveanindefiniteusefullifeandtheir value is likely to increase over time;
• investmentproperties,whicharestatedatfairvalueinaccordancewithIAS40.
The investment properties covered by IAS 40 are stated at the market value determined by independent appraisals and changes in their fair value are recorded in “net gains (losses) arising on fair value adjustments to property, plant and equipment and intangible assets” in the income statement.The depreciation charge for assets acquired during the year is determined on a daily basis from the time they enter into service. The depreciation charge for assets sold and/or retired during the year is determined on a daily basis up to the date of disposal and/or retirement.

171
At each reporting date, if there is evidence that the value of an asset may be impaired, its carrying value is compared with its recoverable value, being either its fair value net of any selling costs or its value in use, represented by the present value of the future cash flows to be generated by the asset, whichever is greater. Any adjustments are recorded in the “net adjustments to the value of property, plant and equipment” caption of the income statement.
If the reasons for recognizing an impairment loss cease to apply, the consequent write-back cannot cause the value of the asset to exceed its net book value (after depreciation) had no impairment losses been recognized in prior years.
Derecognition
Property, plant and equipment are derecognized upon disposal or when they are retired from use on a permanent basis and no economic benefits are expected from their disposal.
10. Intangible assets
Classification
This line item reports non-monetary assets without physical form that have the following characteristics:• identifiability;• controlovertheassetsconcerned;• existenceoffutureeconomicbenefits.
If any one of these characteristics is missing, the related purchase or internally-generated cost is expensed in the year incurred.
Intangible assets include, in particular, applications software used for a number of years and other identifiable intangible assets over which the Group has legal or contractual rights.
This line item also includes goodwill, representing the positive difference between the purchase cost and the fair value of assets and liabilities acquired as a result of business combinations. In particular, an intangible asset is recorded as goodwill when the positive difference between the fair value of the net assets acquired and their purchase cost (including related charges) represents the ability of the investment to generate future earnings. If this difference is negative (badwill) or if the goodwill is not justified by the acquired company’s ability to generate future earnings, the difference is recorded directly in the income statement.
Recognition
Intangible assets are initially recorded at cost, including any directly-related charges.
Measurement criteria
Subsequent to initial recognition, intangible assets are stated at cost, net of accumulated amortization and any impairment losses, in accordance with the “cost model” described in para. 74 of IAS 38.

172
Intangible assets are amortized systematically each year on a straight-line basis over their estimated useful lives. The amortization charge for assets acquired during the year is determined on a daily basis from the time they enter into service. The amortization charge for those sold and/or retired during the year is determined on a daily basis up to the date of disposal and/or retirement.
Assets with an indefinite useful life, such as goodwill, are not amortized but are subjected to periodic impairment testing of the fairness of their carrying value, as required by IAS 36. Any reductions in value, representing the difference between the recorded value of the asset and its recoverable value, are charged to the “adjustment of goodwill” caption of the income statement.
Derecognition
Intangible assets are eliminated from the balance sheet if no future economic benefits are expected or on disposal.
11. Deferred tax assets and liabilities
Current and deferred income taxes are calculated in accordance with current fiscal legislation.
Income taxes reported in the income statement represent a prudent estimate of the current tax charge and the related changes in deferred tax assets and liabilities. In particular, deferred tax assets and liabilities are determined with reference to temporary differences between the book value of assets and liabilities and their tax bases. Deferred tax assets are recognized if they are likely to be recoverable, determined with reference to the Bank’s ongoing ability to generate taxable income.
Deferred tax assets and liabilities are recorded in the balance sheet as, respectively, “Tax assets” and “Tax liabilities”, on an open account basis without offset.
In the case of current taxes, payments on account for individual taxes are offset against the related tax payable, with positive balances reported as “current tax assets” and negative balances as “current tax liabilities”.
Taxes are recorded in the income statement, except for those relating to changes in the fair value of AFS financial assets or of cash flow hedges or hedges of net investments in a foreign operation, which are recognized directly in equity.
In accordance with para. 52b of IAS 12, no provision for deferred taxation has been recorded in relation to the reserves and revaluation surpluses that are in suspense for tax purposes, since their distribution is not envisaged; in this regard, the Bank has not carried out, and has no short or medium-term plans to carry out, any activities which could give rise to the payment of deferred taxes.
12. Non-current assets held for sale
Classification
This line item comprises all the non-current assets and groups of assets held for sale pursuant to IFRS 5, as well as those assets and groups of assets whose book value will principally be recovered through sale rather than via continuous use.

173
Measurement criteria
These assets are measured at the lower of their carrying value or their fair value, net of selling costs, except for the following assets which continue to be valued in accordance with the related accounting policies:• deferredtaxassets;• assetsderivingfromemployeebenefits;• financialinstruments;• investmentproperty.
Recognition of components affecting the income statement
Income (interest income, dividends etc.) and expenses (interest expense, depreciation etc.) relating to “groups of assets” and related liabilities held for sale are classified, net of the related current and deferred taxation, in the “profit (loss) from disposal groups, net of taxation” caption of the income statement. Income and expenses relating to “individual, non-current assets” held for sale continue to be recorded in the line items concerned.

174
LIABILITIES
1. Deposits from banks, due to customers and debt securities in issue
Classification
Deposits from banks, due to customers and debt securities in issue include the various forms of interbank and customer funding, together with the funds gathered by issuing various types of bond and certificates of deposit, net of any amounts repurchased by the Bank. This line item also includes securities which are due at the balance sheet date but have not yet been redeemed.
Recognition
These financial liabilities are initially recorded on receipt of the amounts collected or on the issue of the debt securities.
They are initially measured at the fair value of the liabilities, usually corresponding to the amount collected or the issue price, plus any additional costs/proceeds directly attributable to the individual funding transaction or issue and not reimbursed by the creditor. Internal administrative costs are excluded. The implicit derivatives embedded in the above financial liabilities are separated and valued in accordance with IAS 32 and 39.
Measurement criteria
Following initial recognition, the above financial liabilities are stated at amortized cost using the effective interest method, except that short-term liabilities continue to be stated at nominal value since the effect of discounting is negligible.
Derecognition
Financial liabilities are derecognized when they expire or are settled. Derecognition also applies when issued securities are repurchased, even if this acquisition is only temporary. Any differences between the book value of the derecognized liability and the amount paid is recorded in the “profit (loss) from disposal or repurchase of financial liabilities” caption of the income statement. If, subsequent to repurchase, the Bank places its own securities back in the market, this transaction is treated as a new issue and the liabilities are recorded at the new placement price.
2. Financial liabilities held for trading
Classification
This line item reports the negative fair value of derivatives not designated as effective hedging instruments, liabilities arising from technical mismatches generated by trading in securities.
Derivative contracts include embedded derivatives which are attached to a primary financial instrument, known as the “host contract”, and forward transactions in currencies, securities,

175
goods and precious metals. An embedded derivative is recognized separately from the host contract when all of the following conditions are satisfied:
1. its economic and risk characteristics are not closely correlated with those of the “host” instrument;
2. the separated embedded instrument meets the definition of a derivative;3. the hybrid instrument is not carried at fair value through the income statement.
If the fair value of a derivative contract subsequently becomes positive it is recorded as a financial asset held for trading.
Financial instruments are designated as financial liabilities held for trading upon initial recognition. They cannot be reclassified subsequently.
Measurement criteria
All financial liabilities held for trading are stated at fair value, determined on the basis described in paragraph 4 “Criteria for determining fair value” in the “Other information” section of Part A.
3. Financial liabilities at fair value
Classification
This line item comprises those financial liabilities or groups of financial liabilities stated at fair value through the income statement, following exercise of the fair value option envisaged by IAS 39.
Financial instruments are designated as financial liabilities held for trading upon initial recognition. They cannot be reclassified subsequently.
At the reporting date, this line item comprises own bonds hedged for interest rate and/or price risk by derivative contracts, as well as bonds with an embedded derivative contract that has not been separated out.
Recognition, measurement, derecognition and recording of components affecting the income statement
The recognition, measurement, derecognition and recording of the effects on the income statement of the above financial liabilities are described in the earlier paragraph on “financial assets at fair value”.
4. Hedging derivatives
This line item reports the financial derivatives designated as effective hedging instruments which have a negative fair value at the balance sheet date. The recognition, measurement, derecognition and recording of the related effects on the income statement are described in the paragraph on the corresponding asset line item.If the fair value of a derivative contract subsequently becomes positive it is recorded as an asset in the corresponding line item.

176
5. Liabilities associated with non-current assets held for sale
Reference is made to the paragraph on “non-current assets and groups of assets held for sale”.
6. Provision for severance indemnities
According to IFRIC, the provision for severance indemnities is a “post-employment benefit” qualifying as a “defined-benefit plan”, the value of which according to IAS 19 must be determined on an actuarial basis. As a consequence, the year-end actuarial valuation of this line item is carried out with reference to earned benefits using the projected unit credit method. This method involves the projection of future payments with reference to historical and statistical analyses and probabilities, adopting suitable demographic techniques. This makes it possible to calculate the severance indemnities accruing at a specific date on an actuarial basis, distributing the cost over the entire remaining service of the current workforce, and no longer presenting them as a cost payable as if the business were to cease trading on the balance sheet date.
The provision for severance indemnities has been valued by an independent actuary using the method outlined above.
7. Provisions for risks and charges
In accordance with IAS 37, the provisions for risks and charges reflect known obligations (legal or implicit) deriving from past events, the settlement of which is likely to involve the use of economic resources whose timing and extent are uncertain, on condition that a reliable estimate can be made of the amount needed to settle them. If settlement of the liability is likely to be deferred and the effect of discounting would be significant, the provisions are discounted using current market rates. Increases in provisions for risks and charges are recorded in the appropriate line items of the income statements, depending on the “nature” of the expense. In particular, provisions for future personnel expenses in connection with bonuses and other incentive schemes are classified in “Payroll” costs, provisions for tax risks and charges are classified in “Income taxes” and provisions for potential losses not directly attributable to specific line items in the income statement are reported in “Net provisions for risks and charges”.
8. Equity instruments
This line item reports the carrying value of bonds convertible into treasury shares, determined in accordance with IAS 32, since these represent equity instruments other than capital stock and reserves.

177
OTHER INFORMATION
1. Treasury shares
Treasury shares acquired by the Bank are deducted from equity. No profit or loss deriving from the purchase, sale, issue or cancellation of treasury shares is booked to the income statement. Differences between the purchase and selling prices for these transactions are booked to equity.
Any costs incurred for the purchase of treasury shares are deducted from equity, on condition that they are marginal costs directly attributable to these transactions that would not otherwise have been incurred.
2. Transactions in foreign currency
Foreign currency transactions are initially recognized in euro, by translating the foreign currency amount using the exchange rate prevailing on the date of the transaction.
Foreign currency assets and liabilities are subsequently translated to euro using period-end exchange rates. With regard to repurchase agreements and derivative contracts denominated in foreign currencies, reference is made to the paragraphs on financial assets and liabilities held for trading.
Exchange differences deriving from the settlement of monetary items or from the translation of monetary items using rates other than the initial translation rate, or the closing rate at the end of prior periods, are recorded in the “net trading income” caption of income statement for the period, to the extent that they relate to foreign currency assets and liabilities other than those carried at fair value, those whose fair value and cash flows are hedged, and hedging derivatives.
3. Repurchase agreements
Repurchase agreements are treated as loans against securities and the amounts received and paid are recorded as payables and loans. In particular, spot sales with forward repurchases are recorded as a payable for the spot amount collected, while spot purchases with forward resales are recorded as a receivable for the spot amount paid.
The cost of borrowing and income from lending, comprising interest coupons on securities and the differential between the spot and forward prices for such securities, are recorded as interest in the statement of income. These transactions do not determine movements in the securities portfolio.
4. Criteria for determining fair value
The following criteria are used to determine the fair value of securities:
• Securitieslistedonactivemarkets:The fair value of financial instruments listed on active markets is represented by the following prices:– equity instruments and debt securities listed on the Italian Stock Exchange: the official price
on the last trading day of the reference period;

178
– equity instruments and debt securities listed on foreign stock exchanges: the official price (or other equivalent price) on the last day of the reference period;
– units in mutual funds and sicavs: the official price (or other equivalent price) of the units on the last day of the reference period.
• Securitiesnotlistedonactivemarkets:The fair value of financial instruments not listed on active markets is represented by the
following prices:– shares in cooperative banks: the latest price set by the Board of Directors/Stockholders’
Meeting of the issuing bank;– units in mutual funds and sicavs: the latest value of the units communicated by the
management company;– capital accumulation insurance policies: the redemption value determined with reference to
the issue regulations;– for other debt securities and equities, in the following order:
• thereferencepriceforrecenttransactions;• theprices indicatedbyreliable informationsources,whereavailable, suchas ICMA,
BLOOMBERG, REUTERS;• thepriceobtainedbyapplyingvaluationtechniquesthataregenerallyacceptedbymarket
participants, such as:• fordebtsecurities,theircashflowsdiscountedusingthereferenceratesapplyingatyear
end for equivalent residual maturities, taking account of any “counterparty risk” and/or “liquidity risk”;
• forequitiesofsignificantvalue,theamountestablishedbyindependentappraisals,orbased on recent similar transactions where available, or otherwise the value of the related interest held in the equity reported in the company’s latest approved financial statements;
• thepricesuppliedbytheissuer,assuitablyadjustedtotakeaccountofany“counterpartyrisk” and/or “liquidity risk”;
• theirpurchaseprice,asadjustedforanyimpairment,iffairvaluecannotbemeasuredreliably in the manner indicated above.
The following criteria are used to determine the fair value of derivative contracts:
– derivative contracts traded on regulated markets: their fair value is deemed to be their market price on the last trading day of the year;
– derivative contracts traded over the counter: their fair value is deemed to be their market value at the reference date, determined in the following manner depending on the type of contract: • contractsoninterestrates:marketvalueistakentobetheso-called“replacementcost”,
determined by discounting back to the expected settlement dates, the differences between flows at contract rates and flows at market rates, calculated on an objective basis, current at year-end for equivalent residual maturities;
• optioncontractsonsecuritiesandotherassets:marketvalue,representedbythetheoreticalpremium at the reference date, is determined by using the Black & Scholes formula, or other equivalent methods;
• forwardcurrencytransactions:marketvalueisdeterminedusingtheforwardexchangeratecurrent at the above date, for maturities corresponding to those of the transactions concerned;
• forward transactions in securities, commodities or precious metals: market value isrepresented by the “forward” price current at the above date, for maturities corresponding to those of the underlying asset.
The fair value of over-the-counter contracts is determined by adjusting their market value, if positive, by the credit risk associated with the counterparty.

179
PART BINFORMATION ON THE BALANCE SHEET
ASSETS
SECTION 1
Cash and balances with central banks – Line item 10
1.1 Cash and balances with central banks: analysis
31/12/2008 31/12/2007
a) Cash 99,973 108,425 b) Unrestricted deposits with central banks – –
Total 99,973 108,425

180
SECTION 2
Financial assets held for trading – Line item 20
2.1 Financial assets held for trading: breakdown by type
Items/Amounts 31/12/2008 31/12/2007 Listed Unlisted Listed Unlisted
A. Cash assets 1. Debt securities – 23,596 46,911 93,261 1.1 Structured securities – 6,945 4,726 16,905 1.2 Other debt securities – 16,651 42,185 76,356 2. Equities 2,338 – 11,507 – 3. Mutual funds – – 4,354 34,445 4. Loans – – – – 4.1 Repurchase agreements – – – – 4.2 Other – – – – 5. Impaired assets – – – – 6. Assets sold but not derecognized – 7,179 76,924 3,628
Total A 2,338 30,775 139,696 131,334
B. Derivatives 1. Financial derivatives – 671,592 – 525,361 1.1 for trading – 542,248 – 500,329 1.2 connected with the fair value option – 129,344 – 25,032 1.3 other – – – – 2. Credit derivatives – – – – 2.1 for trading – – – – 2.2 “connected with the fair value option” – – – – 2.3 other – – – –
Total B – 671,592 – 525,361
Total (A+B) 2,338 702,367 139,696 656,695
“Assets sold but not derecognized” relate to debt securities temporarily sold under funding “repurchase agreements” with customers and banks.
The decrease in this overall balance is mostly due to the Bank’s wish to reduce its exposure to financial instruments held for short-term trading in view of the highly volatile state of financial markets and associated negative performance.
This line item also reflects Euro 45,326 in reclassifications during the year of certain financial instruments to “Financial assets available for sale” as a result of the amendments to IAS 39 “Financial instruments: recognition and measurement” contained in the “Reclassification of Financial Assets” published by the IASB on 13 October 2008 and endorsed by the European Commission on 15 October 2008 with Regulation EC 1004/2008, which has been fully discussed in the relevant section of this report.

181
2.2 Financial assets held for trading: analysis by debtor/issuer
Items/Amounts 31/12/2008 31/12/2007
A. CASH ASSETS
1. Debt securities 23,596 140,172 a) Governments and central banks – 7,310 b) Other public entities – – c) Banks 21,370 103,881 d) Other issuers 2,226 28,981
2. Equities 2,338 11,507 a) Banks 112 10,695 b) Other issuers: 2,226 812 – insurance companies 152 – – financial companies – – – non–financial companies 2,074 812 – other – –
3. Mutual funds – 38,799
4. Loans – – a) Governments and central banks – – b) Other public entities – – c) Banks – – d) Other issuers – –
5. Impaired assets – – a) Governments and central banks – – b) Other public entities – – c) Banks – – d) Other issuers – –
6. Assets sold but not derecognized 7,179 80,552 a) Governments and central banks – – b) Other public entities – – c) Banks 7,179 80,552 d) Other issuers – –
Total A 33,113 271,030
B. DERIVATIVES a) Banks 550,977 384,380 b) Customers 120,615 140,981
Total B 671,592 525,361
Total (A+B) 704,705 796,391
During the year the Bank used bilateral offsetting arrangements relating to operations in over-the-counter derivatives with principal market counterparties, giving the option to offset creditor positions against debtor positions in the event of counterparty default.
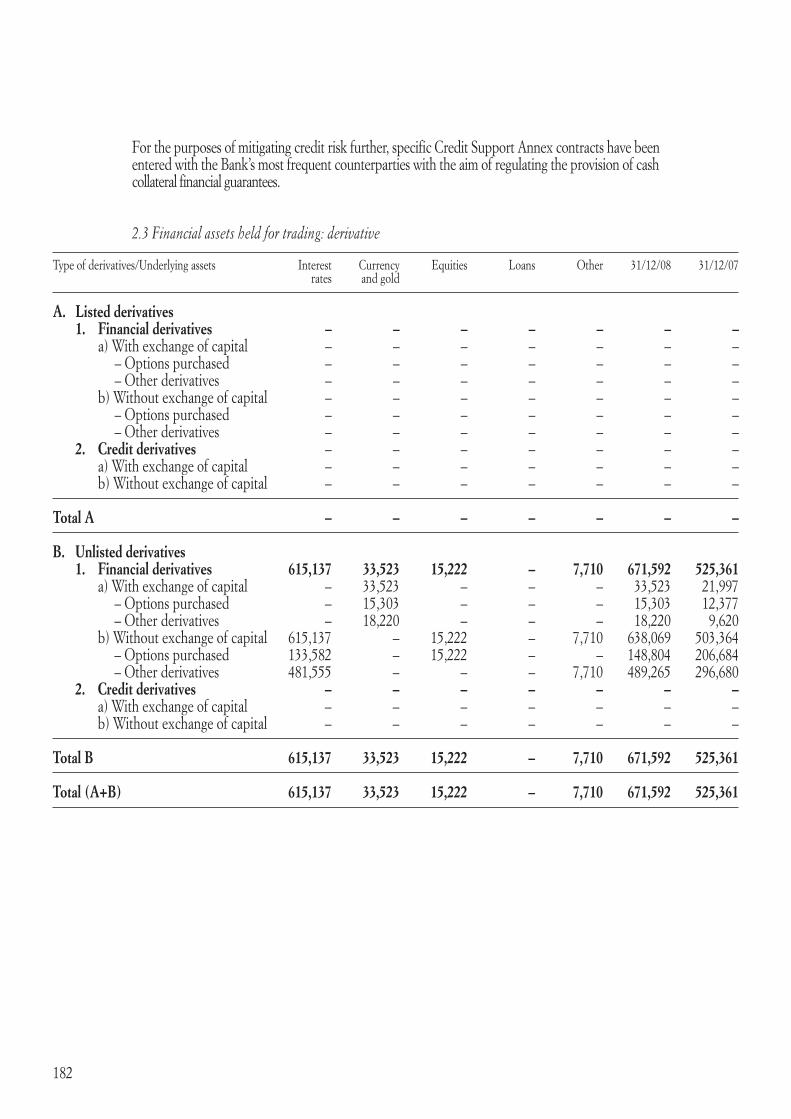
182
For the purposes of mitigating credit risk further, specific Credit Support Annex contracts have been entered with the Bank’s most frequent counterparties with the aim of regulating the provision of cash collateral financial guarantees.
2.3 Financial assets held for trading: derivative
Type of derivatives/Underlying assets Interest Currency Equities Loans Other 31/12/08 31/12/07 rates and gold
A. Listed derivatives 1. Financial derivatives – – – – – – – a) With exchange of capital – – – – – – – – Options purchased – – – – – – – – Other derivatives – – – – – – – b) Without exchange of capital – – – – – – – – Options purchased – – – – – – – – Other derivatives – – – – – – – 2. Credit derivatives – – – – – – – a) With exchange of capital – – – – – – – b) Without exchange of capital – – – – – – –
Total A – – – – – – –
B. Unlisted derivatives 1. Financial derivatives 615,137 33,523 15,222 – 7,710 671,592 525,361 a) With exchange of capital – 33,523 – – – 33,523 21,997 – Options purchased – 15,303 – – – 15,303 12,377 – Other derivatives – 18,220 – – – 18,220 9,620 b) Without exchange of capital 615,137 – 15,222 – 7,710 638,069 503,364 – Options purchased 133,582 – 15,222 – – 148,804 206,684 – Other derivatives 481,555 – – – 7,710 489,265 296,680 2. Credit derivatives – – – – – – – a) With exchange of capital – – – – – – – b) Without exchange of capital – – – – – – –
Total B 615,137 33,523 15,222 – 7,710 671,592 525,361
Total (A+B) 615,137 33,523 15,222 – 7,710 671,592 525,361
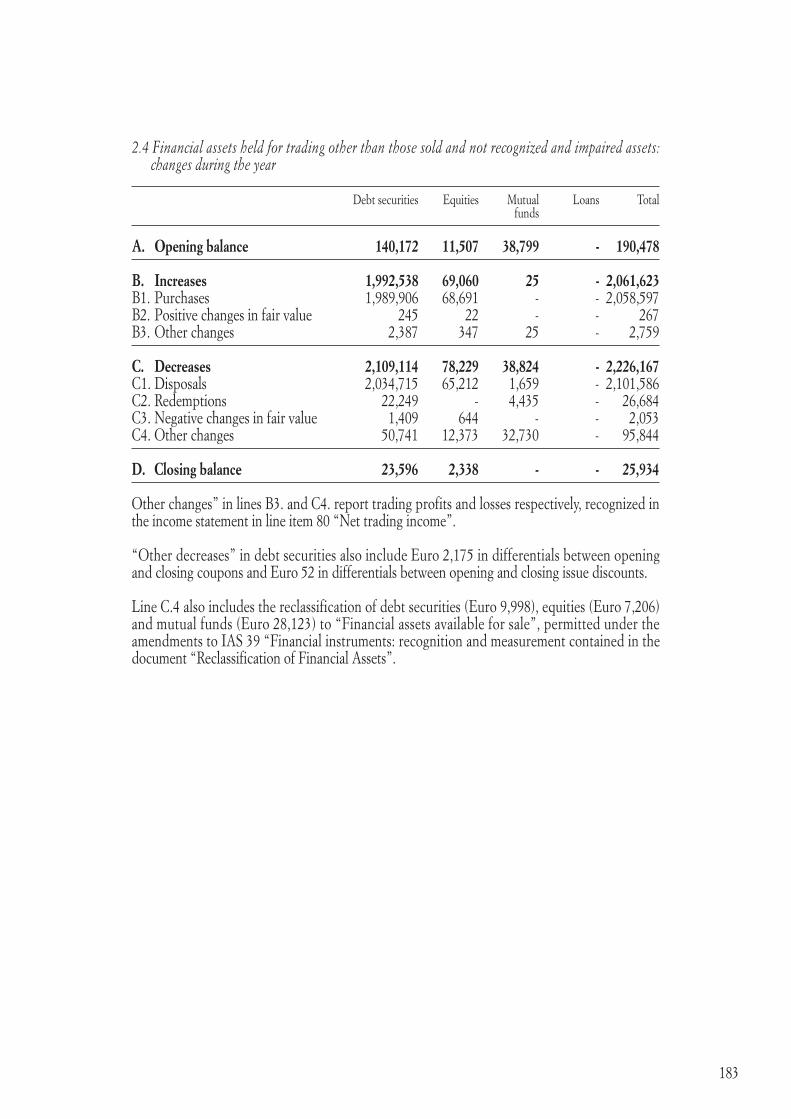
183
2.4 Financial assets held for trading other than those sold and not recognized and impaired assets: changes during the year
Debt securities Equities Mutual Loans Total funds
A. Opening balance 140,172 11,507 38,799 - 190,478
B. Increases 1,992,538 69,060 25 - 2,061,623 B1. Purchases 1,989,906 68,691 - - 2,058,597 B2. Positive changes in fair value 245 22 - - 267 B3. Other changes 2,387 347 25 - 2,759
C. Decreases 2,109,114 78,229 38,824 - 2,226,167 C1. Disposals 2,034,715 65,212 1,659 - 2,101,586 C2. Redemptions 22,249 - 4,435 - 26,684 C3. Negative changes in fair value 1,409 644 - - 2,053 C4. Other changes 50,741 12,373 32,730 - 95,844
D. Closing balance 23,596 2,338 - - 25,934
Other changes” in lines B3. and C4. report trading profits and losses respectively, recognized in the income statement in line item 80 “Net trading income”.
“Other decreases” in debt securities also include Euro 2,175 in differentials between opening and closing coupons and Euro 52 in differentials between opening and closing issue discounts.
Line C.4 also includes the reclassification of debt securities (Euro 9,998), equities (Euro 7,206) and mutual funds (Euro 28,123) to “Financial assets available for sale”, permitted under the amendments to IAS 39 “Financial instruments: recognition and measurement contained in the document “Reclassification of Financial Assets”.

184
SECTION 3
Financial assets at fair value - Line item 30
3.1 Financial assets at fair value: breakdown by type
Items/Amounts 31/12/2008 31/12/2007 Listed Unlisted Listed Unlisted
1. Debt securities – 17,077 – 25,792 1.1 Structured securities – – – – 1.2 Other debt securities – 17,077 – 25,792
2. Equities – – – –
3. Mutual funds – – – –
4. Loans – – – – 4.1 Repurchase agreements – – – – 4.2 Other – – – –
5. Impaired assets – – – –
6. Assets sold but not derecognized – – – –
Total – 17,077 – 25,792
Cost – 51,364 – 50,926
This line item comprises the junior securities deriving from “own” securitizations carried out by the Bank in prior years, which are measured at fair value using a financial-mathematical model, developed together with an independent specialist firm of consultants, that measures the performance of the assets underlying these securities. These valuations were based on the results of the individual underlying transactions at the reference date, using specific assumptions about the principal variables that affect performance (rate of early loan repayments, rate of recognition of non-performing loans, percentage of expected losses, etc.). The application of the fair value option to these securities reduces the mismatch with the related back-to-back swaps arranged as part of the securitizations which are highly correlated with the junior securities.

185
3.2 Financial assets at fair value: analysis by debtor/issuer
Items/Amounts 31/12/2008 31/12/2007
1. Debt securities 17,077 25,792 a) Governments and central banks – – b) Other public entities – – c) Banks – – d) Other issuers 17,077 25,792
2. Equities – – a) Banks – – b) Other issuers: – – – insurance companies – – – financial companies – – – non–financial companies – – – other – –
3. Mutual funds – –
4. Loans – – a) Governments and central banks – – b) Other public entities – – c) Banks – – d) Other issuers – –
5. Impaired assets – – a) Governments and central banks – – b) Other public entities – – c) Banks – – d) Other issuers – –
6. Assets sold but not derecognized – – a) Governments and central banks – – b) Other public entities – – c) Banks – – d) Other issuers – –
Total 17,077 25,792

186
3.3 Assets at fair value, other than those sold but not derecognized and impaired assets: changes during the year
Debt Equities Mutual Loans Total securities funds
A. Opening balance 25,792 – – – 25,792
B. Increases 1,027 – – – 1,027 B1. Purchases – – – – – B2. Positive changes in fair value – – – – – B3. Other changes 1,027 – – – 1,027
C. Decreases 9,742 – – – 9,742 C1. Disposals – – – – – C2. Redemptions 2,215 – – – 2,215 C3. Negative changes in fair value 7,527 – – – 7,527 C4. Other changes – – – – –
D. Closing balance 17,077 – – – 17,077
The “Other changes” reported in line B3. include the profits (Euro 1,014) deriving from the early redemption of certain tranches of the above junior securities, which are recorded in line item 110 “Net change in financial assets and liabilities at fair value” of the income statement. They also include the differential (Euro 13) between opening and closing accruals.
The “Negative changes in fair value” in line C3. relating to the valuation of these junior securities have their matching entry in line item 110 “Net change in financial assets and liabilities at fair value” of the income statement. They have been partially offset by the collection during the year of related interest income and additional returns, totaling Euro 3,906, recorded respectively in line items 10 “Interest income and similar revenues” and 190 “Other operating charges/income” of the income statement respectively.

187
SECTION 4
Financial assets available for sale – Line item 40
4.1 Financial assets available for sale: breakdown by type
Items/Amounts 31/12/2008 31/12/2007 Listed Unlisted Listed Unlisted
1. Debt securities 31,797 45,995 209,522 109,742 1.1 Structured securities – 252 – 252 1.2 Other debt securities 31,797 45,743 209,522 109,490
2. Equities 21,828 113,193 211,394 92,452 2.1 Carried at fair value 21,828 111,118 211,394 90,015 2.2 Carried at cost – 2,075 – 2,437
3. Mutual funds – 88,185 4,235 29,029
4. Loans – 9,700 – –
5. Impaired assets – – – –
6. Assets sold but not derecognized 34,226 – – –
Total 87,851 257,073 425,151 231,223
“Unlisted equities carried at cost” refer to certain individually immaterial equity interests, whose fair value cannot be reliably or verifiably determined and so are reported at cost, as adjusted for any impairment.
“Loans” relate to a loan granted under the sale of the entire interest in Linea SpA to Compass SpA (Mediobanca Group) which, in accordance with IAS 39, has been recognized as “Financial assets available for sale” because its repayment does not depend on the counterparty’s creditworthiness but instead on the performance of one of its loan books.
“Assets sold but not derecognized” relate to debt securities temporarily sold under funding “repurchase agreements” with customers and banks.
The interest in Cattolica Assicurazioni ScpA was reclassified from “Financial assets available for sale” to “Equity investments” during the year. In fact, on 31 October 2008, this company acquired 348,000 shares in Banca Popolare di Vicenza, corresponding to 0.50% of its capital stock, for a figure of Euro 20.9 thousand, making it one of the Group’s largest stockholders. This has sealed the existing strategic and business alliance between the two Groups, further strengthening their major partnership in the sector of insurance, banking and financial services. The cross-representation on the Boards of Directors of the two companies further confirms the great importance and merit of this partnership. These circumstances have underlined the existence of a “significant influence” between the Banca Popolare di Vicenza Group and Cattolica Assicurazioni, as defined by IAS 28 “Investments in associates”, also confirmed in the specific opinion prepared by an independent expert, with the consequent need to reclassify the 6,093,915 shares (a 11.83% interest) held by the Bank in Cattolica Assicurazioni from “Financial assets available for sale” to “Equity investments in associated companies”. The investment
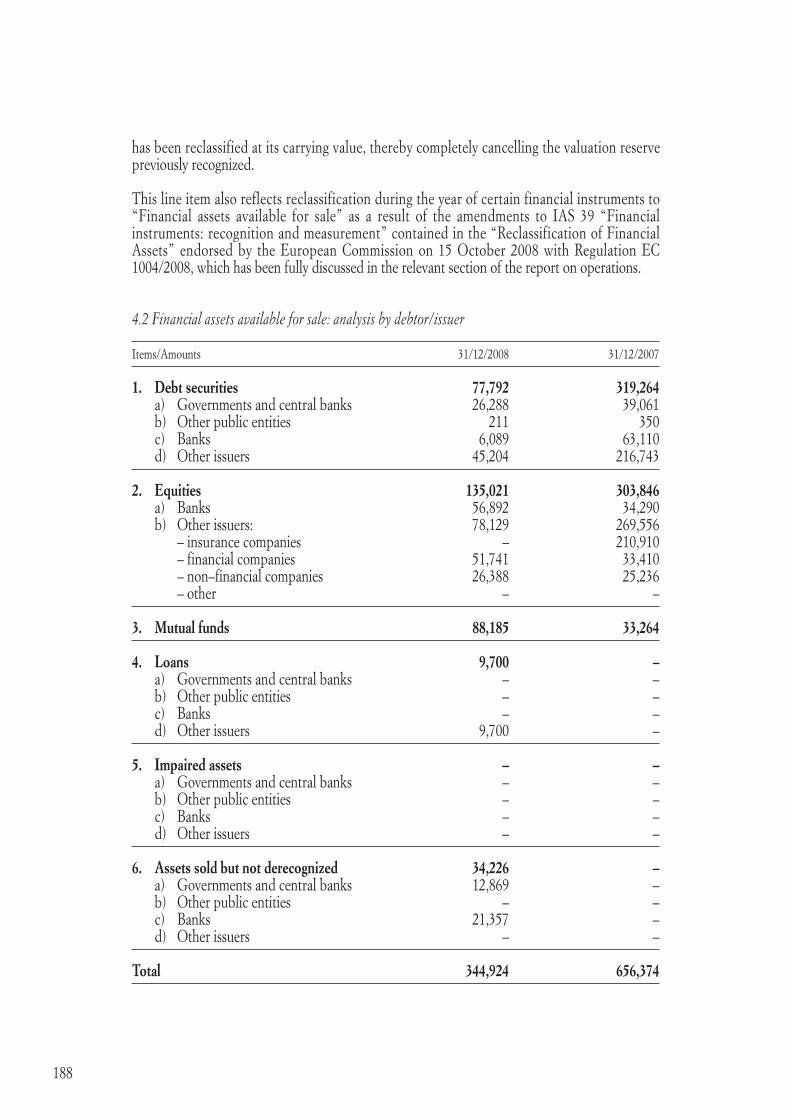
188
has been reclassified at its carrying value, thereby completely cancelling the valuation reserve previously recognized.
This line item also reflects reclassification during the year of certain financial instruments to “Financial assets available for sale” as a result of the amendments to IAS 39 “Financial instruments: recognition and measurement” contained in the “Reclassification of Financial Assets” endorsed by the European Commission on 15 October 2008 with Regulation EC 1004/2008, which has been fully discussed in the relevant section of the report on operations.
4.2 Financial assets available for sale: analysis by debtor/issuer
Items/Amounts 31/12/2008 31/12/2007
1. Debt securities 77,792 319,264 a) Governments and central banks 26,288 39,061 b) Other public entities 211 350 c) Banks 6,089 63,110 d) Other issuers 45,204 216,743
2. Equities 135,021 303,846 a) Banks 56,892 34,290 b) Other issuers: 78,129 269,556 – insurance companies – 210,910 – financial companies 51,741 33,410 – non–financial companies 26,388 25,236 – other – –
3. Mutual funds 88,185 33,264
4. Loans 9,700 – a) Governments and central banks – – b) Other public entities – – c) Banks – – d) Other issuers 9,700 –
5. Impaired assets – – a) Governments and central banks – – b) Other public entities – – c) Banks – – d) Other issuers – –
6. Assets sold but not derecognized 34,226 – a) Governments and central banks 12,869 – b) Other public entities – – c) Banks 21,357 – d) Other issuers – –
Total 344,924 656,374

189
4.5 Financial assets available for sale (other than those sold but not derecognized and impaired assets): changes during the year
Debt Equities Mutual Loans Total securities funds
A. Opening balance 319,264 303,846 33,264 – 656,374
B. Increases 13,705 60,676 70,155 25,000 169,536 B1. Purchases 439 23,211 41,218 25,000 89,868 B2. Positive changes in fair value 3,069 28,453 814 – 32,336 B3. Writebacks – – – – – – booked to income statement – X – – – – booked to equity – – – – – B4. Transfers from other asset portfolios 9,998 7,206 28,123 – 45,327 B5. Other changes 199 1,806 – – 2,005
C. Decreases 255,177 229,501 15,234 15,300 515,212 C1. Disposals 69,749 11,830 6,262 – 87,841 C2. Redemptions 105,165 – – – 105,165 C3. Negative changes in fair value 3,292 3,209 5,343 – 11,844 C4. Impairment writedowns 1,097 3,530 3,629 15,300 23,556 – booked to income statement 1,097 3,530 3,629 15,300 23,556 – booked to equity – – – – – C5. Transfers to other asset portfolios 73,532 210,910 – – 284,442 C6. Other changes 2,342 22 – – 2,364
D. Closing balance 77,792 135,021 88,185 9,700 310,698
Line B4. “Transfers from other asset portfolios” reports reclassifications of financial instruments from “Financial assets held for trading” in application of the amendments to IAS 39 discussed in section 4.1.
Similarly, line C5. “Transfers to other asset portfolios” reports reclassifications of financial instruments to “Loans and advances to banks” (Euro 44,131) and to “Loans and advances to customers” (Euro 29,401) in application of the amendments to IAS 39; The “Equities” column of line C5. reports the reclassification of Cattolica Assicurazioni from “Financial assets available for sale” to “Equity investments”, as discussed earlier.
“Impairment writedowns” reported in line C4. refer to impairment losses recognized under IAS 39 against some of the financial instruments held by the Bank.
Other changes” in lines B5. and C6. report the profits and losses respectively arising on reimbursement/disposal of financial assets held for sale, recognized in the income statement in line item 100 “Gains (losses) on disposal/repurchase” along with the reversal to income of the related “Valuation reserves” from equity.
“Other changes” in line C6 include the differential between opening and closing coupons (Euro 1,058) and the differential between opening and closing issued discounts (Euro 75), as well as the amortized cost adjustment for the year (Euro 110) recognized as a deduction from interest income.

190
SECTION 5
Financial assets held to maturity – Line item 50
Nothing has been classified in this section because the Bank does not hold any financial assets falling into this category.

191
SECTION 6
Loans and advances to banks – Line item 60
6.1 Loans and advances to banks: breakdown by type
Type of transaction/Amounts 31/12/2008 31/12/2007
A. Deposits with central banks 177,555 17,355 1. Time deposits 1,705 – 2. Compulsory reserve 175,850 17,355 3. Repurchase agreements – – 4. Other – –
B. Due from other banks 2,976,357 2,673,197 1. Current accounts and sight deposits 662,801 600,222 2. Time deposits 831,541 860,118 3. Other loans 663,645 1,053,679 3.1 Repurchase agreements 594,369 1,039,375 3.2 Finance leases – – 3.3 Other 69,276 14,304 4. Debt securities 522,812 128,637 4.1 Structured securities – – 4.2 Other debt securities 522,812 128,637 5. Impaired assets 911 – 6. Assets sold but not derecognized 294,647 30,541
Total (book value) 3,153,912 2,690,552
Total (fair value) 3,142,121 2,691,588
The increase in the compulsory reserve reflects centralization under the Bank of this obligation for its subsidiaries.
“Assets sold but not derecognized” relate to debt securities classified in this category which have been temporarily sold under funding “repurchase agreements” with customers.
The increase in “Debt securities” reported in lines 4. and 6. includes Euro 44,131 for transferring certain financial assets from “Financial assets available for sale” in application of the amendments to IAS 39 and Euro 588,279 for the purchase of bonds issued by Mediobanca, subscribed as part of the sale, agreed in the year, of the entire interest in Linea S.p.A. to Compass S.p.A. (a Mediobanca Group company) in substitution of loans granted to the former investee company.
In view of the predominantly short-term nature of loans to banks, except for debt securities, their fair value is conventionally taken to be their carrying amount.
The fair value of debt securities classified in this line item is calculated in the same way as for similar financial instruments classified in other balance sheet line items, as described in Part A of these explanatory notes.
Impaired assets refer to a single loan to a Russian bank, classified on the watchlist after having difficulty in recovering it. A writedown of Euro 297 has been recorded against this exposure.

192
SECTION 7
Loans and advances to customers – Line item 70
7.1 Loans and advances to customers: breakdown by type
Type of transaction/Amounts 31/12/2008 31/12/2007
1. Current accounts 3,169,816 2,991,356 2. Repurchase agreements 46,403 7,213 3. Mortgages 6,950,106 6,506,802 4. Credit cards, personal loans and assignments of one–fifth of salary 72,678 84,680 5. Finance leases – – 6. Factoring – – 7. Other transactions 3,558,986 3,687,292 8. Debt securities 48,119 18,373 8.1 Structured securities – – 8.2 Other debt securities 48,119 18,373 9. Impaired assets 494,440 452,657 10. Assets sold but not derecognized 1,677,074 1,190,842
Total (book value) 16,017,622 14,939,215
Total (fair value) 16,044,926 15,409,137
Assets sold but not derecognized mainly relate to the mortgages sold as part of the securitizations known as “Berica 5 Residential MBS”, “Berica 6 Residential MBS” and “Berica 7 Residential MBS” which, since they do not satisfy the IAS 39 requirements for derecognition, have been “reinstated” in the financial statements.
The securitization known as “Berica 7 Residential MBS”, the Group’s 7th such operation and the 4th multioriginator kind, commenced on 1 October 2008 with the without-recourse sale of performing mortgages to a special purpose entity. This operation was completed in November with the issue of Euro 1,005 million in asset backed securities (of which Euro 930 million in Senior notes and Euro 75 million in Junior notes), all of which subscribed by the originator banks. The Senior notes have been used for refinancing with the European Central Bank.
The increase in “Debt securities” reported in line 8. refers to the transfer of certain financial instruments from “Financial assets available for sale” (Euro 29,401), in application of the amendments to IAS 39 “Financial instruments: recognition and measurement”.
The fair value of loans and advances to customers corresponds to the sum of the future cash flows from the outstanding loans, including interest, discounted with reference to a risk-free rate curve. The nominal cash flows are adjusted for expected losses using the probability of default (PD) and loss-given-default (LGD) parameters attributed to each class of risk. The fair value calculation is made for each individual long-term loan, while the fair value of “on demand” relationships is conventionally taken to be their carrying value.

193
7.2 Loans and advances to customers: analysis by debtor/issuer
Type of transaction/Amounts 31/12/2008 31/12/2007
1. Debt securities: 48,119 18,373 a) Governments – – b) Other public entities – – c) Other issuers 48,119 18,373 – non–financial companies – – – financial companies 48,119 18,373 – insurance companies – – – other – –
2. Loans to: 13,797,989 13,277,343 a) Governments – – b) Other public entities 11,966 9,693 c) Other issuers 13,786,023 13,267,650 – non–financial companies 9,875,611 8,646,004 – financial companies 1,124,385 1,480,830 – insurance companies 23,033 641 – other 2,762,994 3,140,175
3. Impaired assets 494,440 452,657 a) Governments – – b) Other public entities – – c) Other issuers 494,440 452,657 – non–financial companies 348,379 349,668 – financial companies 171 295 – insurance companies – – – other 145,890 102,694
4. Assets sold but not derecognized 1,677,074 1,190,842 a) Governments – – b) Other public entities – – c) Other issuers 1,677,074 1,190,842 – non–financial companies 9,272 – – financial companies – – – insurance companies – – – other 1,667,802 1,190,842
Total 16,017,622 14,939,215
Exposures to “non–financial companies” relating to “assets sold but not derecognized” mostly refer to dept securities temporarily sold “repurchase agreements” with customers.

194
SECTION 8
Hedging derivatives – Line item 80
Nothing has been classified in this section because the Bank does not hold any derivatives falling into this category.
SECTION 9
Remeasurement of financial assets backed by general hedges – Line item 90
9.1 Remeasurement of hedged assets: analysis by hedged portfolio
Remeasurement of financial assets backed by general hedges 31/12/2008 31/12/2007
1. Positive fair value 16,951 – 1.1 in specific portfolios: 16,951 – a) loans and receivables 16,951 – b) assets available for sale – – 1.2 Aggregate – – 2. Negative fair value – – 2.1 in specific portfolios: – – a) loans and receivables – – b) assets available for sale – – 2.2 Aggregate – –
Total 16,951 – The above table reports changes in the fair value of medium/long-term fixed-rate loans negotiations with costumers which have been hedged from the second half of 2008 using interest rate swaps in order to limit/reduce exposure to interest rate risk.
The Bank has selected Macro Fair Value Hedging as the accounting method for representing these hedges in the financial statements. Consequently, the remeasurement of hedged assets in compliance with IAS 39 is reported in this line item, with the matching entry recognized in line item 90 “Net hedging gains (losses)” of the income statement, together with the results of measuring the associated hedging derivatives.
9.2 Assets backed by macro hedges of interest rate risk: breakdown
Remeasurement of financial assets backed by general hedges 31/12/2008 31/12/2007
1. Loans and receivables 281,802 – 2. Assets available for sale – – 3. Portfolio – – Total 281,802 –

195
SECTION 10
Equity investments – Line item 100
10.1 Equity investments in subsidiary companies, companies under joint control (carried at equity) and those over which significant influence is exercised: disclosures
Name Location % held
A. SUBSIDIARY COMPANIES
1. CASSA DI RISPARMIO DI PRATO SpA Capital stock Euro 153.300.000 in shares of par value Euro 76,65 PRATO 79.00
2. BANCA NUOVA SpA Capital stock Euro 42.690.211 in shares of par value Euro 4,3 PALERMO 99.59
3. IMMOBILIARE STAMPA SpA Capital stock Euro 125.000.000 in shares of par value Euro 500 VICENZA 100.00
4. BPV FINANCE INTERNATIONAL PLC Capital stock Euro 103.291 in shares of par value Euro 1 DUBLINO 99.99
5. FARBANCA SpA Capital stock Euro 28.242.100 in shares of par value Euro 10 BOLOGNA 47.52
6. MONFORTE 19 SRL Capital stock Euro 10.000 in shares of par value Euro 1 VICENZA 100.00
7. B.P.VI FONDI Sgr SpA Capital stock Euro 10.000.000 in shares of par value Euro 5 VICENZA 50.00
8. NORDEST MERCHANT SpA Capital stock Euro 2.000.000 in shares of par value Euro 1 VICENZA 80.00
9. PRESTINUOVA SpA 1 Capital stock Euro 25.263.160 in shares of par value Euro 10 PALERMO 6.33
10. NUOVA MERCHANT SPA Capital stock Euro 120.000 in shares of par value Euro 1 ROMA 100.00
11. SERVIZI BANCARI ScpA Capital stock Euro 100.000 in shares of par value Euro 50 VICENZA 97.00

196
Name Location % held
C. ASSOCIATED COMPANIES
1. BERICA VITA SpA Capital stock Euro 31.000.000 in shares of par value Euro 10 VICENZA 49.00
2. SEC SERVIZI SCpA Capital stock Euro 25.000.000 in shares of par value Euro 1 PADOVA 47.04
3. VICENZA LIFE LTD Capital stock Euro 634.850 in shares of par value Euro 1 DUBLINO 50.00
4. ABC ASSICURA SpA Capital stock Euro 8.925.000 in shares of par value Euro 0,51 VERONA 50.00
5. 21 INVESTIMENTI PARTNERS SpA Capital stock Euro 4.250.000 in shares of par value Euro 1 TREVISO 20.00
6. MAGAZZINI GENERALI MERCI E DERRATE SpA Capital stock Euro 1.241.317 in shares of par value Euro 5,17 VICENZA 25.00
7. CATTOLICA-BPVI MEDIAZIONE CREDITIZIA SPA Capital stock Euro 300.000 in shares of par value Euro 1 VICENZA 50.00
8. SOCIETA’ CATTOLICA DI ASSICURAZIONE Scarl Capital stock Euro 154.536.612 in shares of par value Euro 3” VERONA 12.72
1 indirectly controlled through Banca Nuova which owns 88.67% of capital stock.
The percentage interest in equity also reflects the voting rights at stockholders’ meetings.

197
10.2 Equity investments in subsidiary companies, companies under joint control and those over which significant influence is exercised: accounting information
1 equity includes net income (loss) for the year
The figures presented in this table relate to the latest approved financial statements of these
Name Total assets Total revenues Net income Equity1 Book Fair (loss) value value
A. SUBSIDIARY COMPANIES
1. CASSA DI RISPARMIO DI PRATO SpA 3,896,523 283,183 462 279,120 404,765 x
2. BANCA NUOVA SpA 4,087,782 262,262 15,211 210,287 284,143 x 3. IMMOBILIARE STAMPA SpA 228,311 15,423 2,832 199,250 195,880 x 4. BPV FINANCE INTERNATIONAL Plc 537,493 35,893 (37,166) 41,172 93,418 x
5. FARBANCA SpA 341,159 19,450 2,656 37,356 22,884 x
6. MONFORTE 19 Srl 117,791 1,071 (1,685) 3,314 13,734 x 7. B,P,VI FONDI Sgr SpA 23,669 17,549 914 18,538 25,778 x
8. NORDEST MERCHANT SpA 7,447 4,694 828 5,853 3,280 x
9. PRESTINUOVA SpA 376,590 26,854 2,804 38,073 1,933 x
10. NUOVA MERCHANT SpA 2,493 319 (3,511) (155) 0 x 11. SERVIZI BANCARI ScpA 4,089 8,113 324 953 428 x
TOTAL SUBSIDIARY COMPANIES 1,046,242
C. ASSOCIATED COMPANIES
1. BERICA VITA SpA 645,039 127,525 (22,110) 12,104 16,683 n.a. 2. SEC SERVIZI SCpA 65,741 106,736 – 27,091 12,411 n.a.
3. VICENZA LIFE Ltd 992,094 196,783 3,122 18,409 10,090 n.a.
4. ABC ASSICURA SpA 37,713 14,508 (1,162) 7,741 5,305 n.a. 5. 21 INVESTIMENTI PARTNERS SpA 9,921 1,584 455 9,430 3,816 n.a.
6. MAGAZZINI GENERALI MERCI E DERRATE SpA 5,424 2,079 31 1,515 314 n.a. 7. CATTOLICA– BPVI MEDIAZIONE CREDITIZIA SpA 956 83 (263) 814 550 n.a. 8. SOCIETA’ CATTOLICA DI ASSICURAZIONE SCARL 16,152,963 3,316,721 28,645 1,151,197 296,431 162,530
TOTAL ASSOCIATED COMPANIES 345,600

198
companies at 31 December 2008, except for Magazzini Generali Merci e Derrate SpA and 21 In-vestimenti Partners S.p.A. whose figures refer to their financial statements at 31 December 2007. The figures relating to Società Cattolica di Assicurazione S.c.a.r.l. have been taken from the con-solidated financial statements of the Cattolica Assicurazioni Group at 31 December 2008. Assessments of the value of equity investments have not revealed the existence of any impair-ment losses requiring recognition in the income statement under IAS 36, except for the subsidia-ries BPV Finance and Nuova Merchant for which impairment losses of Euro 10,000 and Euro 4,002 respectively have been recognized, reflecting their losses for the year.
With particular reference to the equity investment in Cattolica Assicurazioni, given its highly volatile share price from the date of acquisition to the balance sheet date due to general stock-market trends, and given the non-speculative nature of this investment, it has been decided to value it using a model based on fundamentals, namely the Dividend Discount Model, as adjusted to take account of the benefits that the partnership with this company (lasting 5 years and auto-matically renewable for another 5) will bring to the Group in terms of insurance sales in the loss sector and synergies in asset management. The results of the valuation, performed by an outside specialist company, have revealed that the value of the equity investment in Cattolica Assicura-zioni is in line with its carrying amount.

199
10.3 Equity investments: changes during the year
31/12/2008 31/12/2007
A. Opening balance 1,107,185 1,138,078
B. Increases 299,230 125,578 B.1 Purchases 24,286 82,555 B.2 Writebacks – – B.3 Revaluations – – B.4 Other changes 274,944 43,023
C. Decreases 14,573 156,471 C.1 Sales 48 74,147 C.2 Adjustments 14,002 – C.3 Other changes 523 82,324
D. Closing balance 1,391,842 1,107,185
E. Total revaluations – –
F. Total adjustments 14,002 –
“Purchases” reported in line B.1 refer to:
• Euro21,522foracquiring458,000sharesinCattolicaAssicurazionifromthesubsidiaryBPVFinance at the original carrying amount recorded by the subsidiary;
• Euro2,322inpaymentsoncapitalaccounttoNuovaMerchanttocoveritslosses;• Euro400inpaymentsoncapitalaccounttoCattolica-BPVIMediazioneCreditizia;• Euro42toacquireanother0.8%ofFarbancaSpA.
“Other changes” reported in line B.4 include the reclassification of Euro 274,909 from “Financial assets available for sale” in relation to the interest in Cattolica Assicurazioni, as discussed in the earlier Section 4 of these notes.
“Sales” reported in line C.1 refer to the disposal of 3% of Servizi Bancari S.c.p.A. to the subsidiaries Banca Nuova (1%), Cassa di Risparmio di Prato (1%) and FarBanca (1%).
“Adjustments” in line C.2 comprise Euro 10,000 in impairment of investment in the subsidiary BPV Finance and Euro 4,002 for writing down the investment in the subsidiary Nuova Merchant after its capital was reduced to zero because of losses.
“Other changes” in line C.3 all refer to the distribution of an extraordinary dividend by 21 Investimenti Partners S.p.A out of its existing additional paid-in capital.

200
SECTION 11
Property, plant and equipment – Line item 110
11.1 Property, plant and equipment: analysis of assets carried at cost
Assets/Amounts 31/12/2008 31/12/2007
A. Assets used in business 1.1 Owned 44,615 41,780 a) Land 1,597 1,388 b) Buildings 4,024 3,169 c) Furniture 9,176 7,894 d) IT equipment 4,137 3,915 e) Other 25,681 25,414 1.2 Purchased under finance leases 694 694 a) Land 309 – b) Buildings 385 694 c) Furniture – – d) IT equipment – – e) Other – –
Total A 45,309 42,474
B. Investment property 2.1 owned – – a) Land – – b) Buildings – – 2.2 purchased under finance leases – – a) Land – – b) Buildings – –
Total B – –
Total (A+B) 45,309 42,474

201
11.3 Property, plant and equipment used for business purposes: changes during the year
“Other changes” in lines B.7 and C.7 referring to Land and Buildings relate to the reclassification of the value of land on which stands a building purchased under finance lease last year.
The remaining “Other changes” refer to profits and losses arising on the sale and/or retirement of certain assets and recognized in line item 240 “Gains (losses) on disposal of investments” of the income statement.
Land Buildings Furniture IT Other Total equipment
A. Opening gross amount 1,388 4,059 34,683 20,560 55,945 116,635
A.1 Total net reductions in value – 196 26,789 16,645 30,531 74,161
A.2 Opening net amount 1,388 3,863 7,894 3,915 25,414 42,474
B. Increases: 518 961 3,095 1,968 4,333 10,875 B.1 Purchases 209 961 3,085 1,965 4,296 10,516 B.2 Capitalized improvement expenditure – – – – – – B.3 Writebacks – – – – – – B.4 Fair value increases booked to: – – – – – – a) equity – – – – – – b) income statement – – – – – – B.5 Positive exchange rate adjustments – – – – – – B.6 Transfers from investment property – – – – – – B.7 Other changes 309 – 10 3 37 359
C. Decreases – 415 1,813 1,746 4,066 8,040 C.1 Sales – – 97 47 127 271 C.2 Depreciation – 106 1,716 1,699 3,935 7,456 C.3 Impairment charges booked to: – – – – – – a) equity – – – – – – b) statement of income – – – – – – C.4 Fair value decreases booked to: – – – – – – a) equity – – – – – – b) income statement – – – – – – C.5 Negative exchange rate adjustments – – – – – – C.6 Transfers to: – – – – – – a) investment property – – – – – – b) assets held for sale – – – – – – C.7 Other changes – 309 – – 4 313
D. Closing net amount 1,906 4,409 9,176 4,137 25,681 45,309
D.1 Total net reductions in value – 302 28,505 18,344 34,466 81,617
D.2 Closing gross amount 1,906 4,711 37,681 22,481 60,147 126,926
E. Carried at cost – – – – – –

202
Property, plant and equipment are systematically depreciated each year on a straight-line basis, using rates that reflect the residual technical and economic useful lives of the related assets, re-ported below:
%
Buildings 3Furnishings 15Furniture and ordinary office machines 12Vehicles 25Lifting equipment 7.5Miscellaneous equipment 15Electronic/electromechanical machines 20Filming equipment/alarms 30Temporary buildings 10Communications equipment 25Armoured counters 20Lifting trucks 20
The value of land associated with free-standing property has been separated from the value of the building and is not depreciated since it has an indefinite useful life.

203
SECTION 12
Intangible assets – Line item 120
12.1 Intangible assets: analysis by type
Assets/Amounts 31/12/2008 31/12/2007 Finite Indefinite Finite Indefinite life life life life A.1 Goodwill x 679,581 – 705,589 A.2 Other intangible assets 26,510 – 5,654 – A.2.1 Carried at cost: 26,510 – 5,654 – a) Intangible assets generated internally – – – – b) Other assets 26,510 – 5,654 A.2.2 Carried at fair value: – – – – a) Intangible assets generated internally – – – – b) Other assets – – – –
Total 26,510 679,581 5,654 705,589
Line A.1 “Goodwill” includes:• Euro195,462 in residualgoodwillpaid for thepurchaseofbankingbusinessesby four
subsidiary banks in 2000;• Euro36,591inresidualgoodwillofthe26bankbranchesacquiredin2001fromcertain
banks in the Intesa Group;• Euro144inresidualgoodwillpaidtoacquiretheCallCenterfromtheformersubsidiary
Banca Idea SpA in 2002;• Euro4,177inresidualgoodwillpaidtoacquirethebranchnetworkoftheformersubsidiary
Banca Idea SpA in 2003;• Euro443,207ingoodwillpaidtoacquire61branchesfromtheUBIGroupon31December2007.
The carrying value of this goodwill has been tested for impairment in accordance with IAS 36, since it represents an intangible asset with an indefinite useful life. The results of these tests are discussed in the specific paragraph later on in this section.
The increase in “Other intangible assets” (line A.2) mostly refers to intangibles identified as part of the purchase price allocation process relating to the acquisition of 61 branches from the UBI Group at the end of 2007. In fact, IFRS 3 states that the cost of a business combination (such as the acquisition of the 61 UBI branches) must be accounted for using the purchase method and that the price paid be allocated to the assets acquired and liabilities assumed as measured at their respective fair values. The “intangibles” identified of Euro 24,100, expressing the value of the relationships acquired, have been recognized as intangible assets at their fair value, while deducting a corresponding amount from the goodwill provisionally recognized upon initially accounting for these branches at the end of 2007. As assets with a finite useful life, these “intangibles” are being amortized over the period they are expected to benefit (the average life is estimated as 17 years for intangibles relating to individual customers and as 12 years for corporate customers, corresponding to the related retention rates). The annual amortization charge for the “intangibles” identified is Euro 1,649.

204
The other intangible assets classified in A.2.1 “Other intangible assets” mainly refer to capitalized software and user licenses. Information about impairment testing of goodwill and intangible assets with an indefinite useful life (IAS 36, para. 134-137) The CGU (Cash Generating Unit) tested to verify the book value of its goodwill is the CGU Banca Popolare di Vicenza (referring to the legal entity Banca Popolare di Vicenza net of its equity investments and consequent effects on equity and income);
The following table reports the value of goodwill allocated to the CGU: CGU GOODWILL Banca Popolare di Vicenza 679,581
The value in use and market/disposal value have been determined for this CGU. Not only is this approach consistent with IAS 36, which requires a CGU’s carrying amount to be compared with the higher of its value in use and market/disposal value, it is also appropriate in view of current market uncertainty, causing the making of financial forecasts to be particularly difficult and uncertain.The different valuation techniques fall into the following core categories: • analytical methods (for determining value in use)• market methods (for determining fair value)
Analytical methodsIn compliance with recent valuation practice, the adoption of value in use as the measure for determining recoverable amount involves using methods based on estimating future income or cash flow, such as for example, the dividends that a CGU is able to produce in the future (Dividend Discount Model - DDM, with reference to “Excess Capital”).The Dividend Discount Model is a variation on the cash flow method. In particular, this method, in its “Excess Capital” variant, establishes that the economic value of a financial company is given by discounting a stream of dividends determined on the basis of minimum capital requirements dictated by the regulator.Value in use has therefore been determined using methods currently adopted by sector players (Dividend Discount Model).
Market methodsThe two principal market methods are:• thestockmarketquotations/marketmultiplesmethod• thecomparabletransactionsmethod
The stockmarket quotations/market multiples method is based on analyzing listed companies similar to the one being valued and particularly the relationship between the market value of such companies and their balance sheet and profit indicators.
The comparable transactions method adopts a similar approach to that of the market multiples method and involves analyzing the relationship between prices reported for company/business acquisitions and the balance sheet and profit indicators of such companies.

205
The multiples of Italian listed banks have been considerably volatile in recent years. In fact, Price/Book Value (P/BV) ratios have gone from 2 in 2007 to multiples ranging between 0.2 and 0.4 at the start of 2009, reflecting the general decline in all stocks in the Italian banking sector. Despite the Bank of Italy’s reassurances about the relatively greater solidity of our banking system compared with other countries, in the week from 16 to 20 February the sector index in Milan lost 17%, more than the general Stoxx one (-14%). As noted in the specialist press (Il Sole 24 Ore of 21 February 2009) “the markets are no longer capable of distinguishing healthy companies from those in crisis”. Consequently, we are of the opinion that in the current market context stockmarket multiples cannot be used as an indicator of market/disposal value.It has been decided instead to refer to multiples for comparable transactions, provided there are a sufficient, appropriate number of recent transactions.
Value in use and market value were both higher than book value for the above CGU.
Analytical methods: financial and economic projections
The method adopted for determining value in use (specifically DDM), is based on constructing the economic and financial projects needed to determine the estimated dividends that the CGU is able to produce in the future.The Board of Directors approved the Business Plan for 2008 – 2011 on 11 September 2008, ie. before the bankruptcy of Lehman Brothers and the steady deterioration in the macroeconomic environment. This plan was prepared using assumptions that, despite being based on estimates by primary forecasting institutes, now appear to be superseded by events, at least as far as the specific planning period is concerned.In recent months the economic, financial and operating scenario for the sector has experienced changes that are without precedent in recent history and still appears to feature exceptional levels of uncertainty regarding the outlook for the real economy, financial markets and the associated developments in monetary policy, as stated more than once by the ECB in its latest bulletin in February 2009.Since we are aware that the Business Plan for 2008-2011 has been prepared on the basis of macroeconomic and operating assumptions that are no longer realistic, at least with reference to the specific planning period, and that the Budget for 2009 subsequently prepared now appears to be superseded, at least in part, by the current scenario and by the high degree of uncertainty affecting the current outlook, we have prepared separate financial and economic projections for valuation purposes based on the specific assumptions set of below and which have been tested for sensitivity.
General approach used for making forecasts
The simulations/projections developed for DDM application purposes are based on the 2009 Budget, as revised solely to take account of the impact of adjusting rates and spreads for new assumptions regarding trends in market rates but not for any other corrective actions; in the case of Banca Popolare di Vicenza, the cost of credit has also been prudently revised with reference to the amount of impaired loans.
The assumptions regarding rates are based on expectations reflected in the current rate curve and on estimates contained in the Forecast published by Prometeia in January 2009.
The estimates for 2010 and 2011 have been prepared with reference to the growth rates contained in the Plan, taking account of the need to ensure balanced growth in deposits and lending and of certain specific assumptions particularly relating to the cost of credit.

206
The estimates for 2012 and 2013 are a steady-state projection that assumes a gradual convergence of industry growth rates (based on the projections contained in the latest Forecast Bank Results by Prometeia)
Consequently, these projections cannot be treated as a revision of the Business Plan, or even less, of the budget; instead, they are a forecast of the possible evolution in the Bank’s results based on specific assumptions, that take account of projections by forecasting institutes, and specifically prepared in order to have the information needed for the purposes of impairment testing.
In addition, for the purposes of determining terminal value, it has been assumed that a steady-state level of income will be achieved based on a zero-growth extrapolation from the plan.
Summary of the assumptions used for deriving terminal value: CGU Method of calculation Growth Rate Post-tax discount terminal value (g) rate Banca Popolare di Vicenza Steady state return 2% 8,48%
The comparable transactions method has referred to transactions in Italy in the second half of 2008 relating to multiples on equity, total deposits (as the value of goodwill).

207
12.2 Intangible assets: changes during the year
The opening balance of “Other intangible assets” does not include those assets which had been fully amortized at the end of the prior year.
“Other increases” in goodwill mostly refer to related costs (legal and notary fees, indirect taxes) incurred by the Bank in relation to the acquisition of the UBI branches.
Goodwill Other intangible assets: Other intangible assets: Total generated internally Other Finite Indefinite Finite Indefinite
A. Opening balance 853,525 – – 8,265 – 861,790
A.1 Total net reductions in value 147,936 – – 2,611 – 150,547
A.2 Opening net amount 705,589 – – 5,654 – 711,243
B. Increases 16,747 – – 25,286 – 42,033 B.1 Purchases – – 1,186 – 1,186 B.2 Increases in internally generated intangible assets X – – – – – B.3 Writebacks X – – – – – B.4 Positive changes in fair value X – – – – – – booked to equity – – – – – – booked to income statement – – – – – B.5 Positive exchange rate adjustments X – – – – – B.6 Other changes 16,747 – – 24,100 – 40,847
C. Decreases 42,755 – – 4,430 – 47,185 C.1 Sales – – – – – – C.2 Adjustments – – 4,430 – 4,430 – Amortization – – – 4,430 – 4,430 – Writedowns – – – – – – •equity – – – – – – •incomestatement – – – – – –C.3 Negative changes in fair value – – – – – – – booked to equity – – – – – – – booked to income statement – – – – – – C.4 Transfers to non–current assets held for sale – – – – – –C.5 Negative exchange rate adjustments – – – – – C.6 Other changes 42,755 – – – – 42,755
D. Closing net amount 679,581 – – 26,510 – 706,091
D.1 Total net value adjustments 147,936 – – 7,041 – 154,977
E. Closing gross amount 827,517 – – 33,551 – 861,068
F. Carried at cost – – – – – –

208
Other decreases” in goodwill reflect Euro 18,655 for adjusting the provisional price of the UBI branches previously recorded and Euro 24,100 for reclassifying to “Other intangible assets” the “intangibles” identified as part of the purchase price allocation process (this same amount features in the “Other increases” in “Other intangible assets”).
Intangible assets, except goodwill, are amortized systematically each year on a straight-line basis over their estimated useful lives.
Le “Altre variazioni” in diminuzione degli avviamenti si riferiscono per euro 18.655 alla rettifica del prezzo provvisorio degli sportelli UBI precedentemente iscritto e per euro 24.100 alla riclassifica tra le “Altre attività immateriali” di “intangibili” identificati nell’ambito del già citato processo di Purchase Price Allocation (la stessa risulta inoltre esposta tra le “Altre variazioni” in aumento delle “Altre attività immateriali” della tabella in esame).
Le attività immateriali, con l’eccezione dell’avviamento, sono sistematicamente ammortizzate in ogni esercizio sulla base della stima della loro vita utile utilizzando come criterio di ammortamento il metodo a quote costanti.
SECTION 13
Tax assets and liabilities – Asset Line item 130 and liability line item 80
13.1 Deferred tax assets: analysis
31/12/2008 31/12/2007
– Adjustments to loans to customers 46,733 35,123 – Taxed provisions for risks and charges 16,236 18,323 – Adjustments to junior securities 8,861 7,818 – Effect of continuing involvement in own securitizations 7,470 4,990 – Writedowns of financial assets available for sale 1,770 3,518 – Writedown of equities 2,401 1,667 – Amortization of non–deductible portion of goodwill – 985 – Deferred charges expensed to income statement – portion deductible in future years – 501 – Other 460 741
Total 83,931 73,666

209
13.2 Deferred tax liabilities: analysis 31/12/2008 31/12/2007
– Tax implications of goodwill amortization 27,532 9,354 – Effect of continuing involvement in own securitizations 11,479 5,056 – Revaluations of financial assets available for sale 5,637 4,187 – Effect of actuarial valuation of severance indemnities 1,075 1,774 – Revaluation of works of art on First Time Application 846 720 – Untaxed revaluation of own securities 285 448 – Deferred capital gains on non–current financial assets 80 160 – Other 36 76
Total 46,970 21,775
13.3 Change in deferred tax assets (with matching entry in income statement)
31/12/2008 31/12/2007
1. Opening balance 70,148 86,344
2. Increases 28,352 28,692 2.1 Deferred tax assets recorded during the year 28,352 28,692 a) relating to prior years 2,097 – b) due to changes in accounting policies – – c) writebacks – – d) other 26,255 28,692 2.2 New taxes or increases in tax rates – – 2.3 Other increases – –
3. Decreases 16,339 44,888 3.1 Deferred tax assets reversing during the year 16,151 24,558 a) reversals 16,151 22,691 b) written down as no longer recoverable – 1,867 c) change in accounting policies – – 3.2 Reduction in tax rates – 8,263 3.3 Other decreases 188 12,067
4. Closing balance 82,161 70,148
Line 2.1 a) reflects the recognition of deferred tax assets for IRAP (Italian regional business tax) following changes to the law contained in Decree 185 of 29 November 2008, as converted with amendments into Law 2 of 28 January 2009.

210
13.4 Change in deferred tax liabilities (with matching entry in income statement)
31/12/2008 31/12/2007
1. Opening balance 17,587 49,170
2. Increases 25,088 19,150 2.1 Deferred tax liabilities recorded during the year 25,088 19,150 a) relating to prior years 1,087 – b) due to changes in accounting policies – – c) other 24,001 19,150 2.2 New taxes or increases in tax rates – – 2.3 Other increases – –
3. Decreases 1,342 50,733 3.1 Deferred tax liabilities eliminated during the year 1,326 28,403 a) reversals 1,326 27,827 b) due to changes in accounting policies – – c) other – 576 3.2 Reduction in tax rates – 4,887 3.3 Other decreases 16 17,443
4. Closing balance 41,333 17,587
Line 2.1 a) reflects deferred tax liabilities for prior year IRAP following changes to the law contained in Decree 185 of 29 November 2008, as converted with amendments into Law 2 of 28 January 2009.

211
13.5 Change in deferred tax assets (with matching entry to equity)
31/12/2008 31/12/2007
1. Opening balance 3,518 250
2. Increases 1,115 3,518 2.1 Deferred tax assets recorded during the year 608 3,518 a) relating to prior years – – b) due to changes in accounting policies – – c) other 608 3,518 2.2 New taxes or increases in tax rates – – 2.3 Other increases 507 –
3. Decreases 2,863 250 3.1 Deferred tax assets reversing during the year 2,863 – a) reversals 2,863 – b) written down as no longer recoverable – – c) due to changes in accounting policies – – 3.2 Reduction in tax rates – – 3.3 Other decreases – 250
4. Closing balance 1,770 3,518
13.6 Change in deferred tax liabilities (with matching entry to equity)
31/12/2008 31/12/2007
1. Opening balance 4,188 6,190
2. Increases 2,987 1,943 2.1 Deferred tax liabilities recorded during the year 2,986 1,943 a) relating to prior years – – b) due to changes in accounting policies – – c) other 2,986 1,943 2.2 New taxes or increases in tax rates – – 2.3 Other increases 1 –
3. Decreases 1,538 3,945 3.1 Deferred tax assets reversing during the year 1,538 2,813 a) reversals 1,538 2,813 b) due to changes in accounting policies – – c) other – – 3.2 Reduction in tax rates – 1,114 3.3 Other decreases – 18
4. Closing balance 5,637 4,188

212
13.7 Other information
“Current tax assets” are broken down as follows:
31/12/2008 31/12/2007
1. Direct tax assets 25,394 – 2. Indirect tax assets 11,476 13,828 3. Other current tax assets 5,171 7,779
Totale 42,041 21,607
As regards the Bank’s tax situation, in order to reduce the risk of potential disputes with the tax authorities, the Bank decided to take advantage of the so-called “tombstone tax amnesty” for VAT purposes as per Law 289 of 27/12/2002, settling tax years 1997 to 2002; advantage was also taken for income tax purposes of art. 8 (the so-called “simple integration”) of the same law, at the same time avoiding the two-year extension of the period of assessment envisaged in the provision. Therefore, as far as both direct income tax and VAT are concerned, the last year that has been closed is 2003.In previous years the Italian tax authorities sent the Bank two assessments for alleged irregularities in calculating and paying IRAP in relation to fiscal years 2003 and 2004, against which the Bank duly appealed. The relating rulings were published in 2008, which partially accepted the Bank’s defence.In February 2008 the Vicenza branch of the Tax Police started a partial investigation into VAT for fiscal years 2003-2006, which ended in March 2008 with the issue of the related report of findings. After examining the Bank’s memorandum, the tax authorities instructed that this report be archived for all the years in dispute.Lastly, it is reported that the Bank has exercised the option under art. 117 et seq. of the Income Tax Consolidation Act to file for tax on a group basis, together with its subsidiaries Cassa di Risparmio di Prato, Immobiliare Stampa and BPVi Fondi Sgr, for the three-year period 2006-2008. The latter left the tax group in 2007 after it ceased to be a subsidiary following the Bank’s sale of 50% of its shares. During 2008 the subsidiary Monforte S.r.l. joined the tax group for the three-year period 2008-2010.

213
SECTION 14
Non-current assets held for sale and associated liabilities – Asset line item 140 and liability line item 90
14.1 Non-current assets held for sale and associated liabilities: analysis by type
31/12/2008 31/12/2007
A. Individual assets A.1 Equity investments – 81,929 A.2 Property, plant and equipment – – A.3 Intangible assets – – A.4 Other non–current assets – –
Total A – 81,929
B. Groups of assets (discontinued operations) B.1 Financial assets held for trading – – B.2 Financial assets at fair value – – B.3 Financial assets available for sale – – B.4 Financial assets held to maturity – – B.5 Loans and advances to banks – – B.6 Loans and advances to customers – – B.7 Equity investments – – B.8 Property, plant and equipment – – B.9 Intangible assets – – B.10 Other assets – –
Total B – –
C. Liabilities associated with assets held for sale C.1 Payables – – C.2 Securities – – C.3 Other liabilities – –
Total C – –
D. Liabilities associated with assets held for sale D.1 Deposits from banks – – D.2 Due to customers – – D.3 Debt securities in issue – – D.4 Financial liabilities held for trading – – D.5 Financial liabilities at fair value – – D.6 Provisions – – D.7 Other liabilities – –
Total D – –

214
At 31 December 2007, line A.1 referred to the entire interest (47.9625% of capital stock) held in Linea SpA, reclassified to non-current assets held for sale, in compliance with IFRS 5, after signing a contract in December for this company’s sale that was awaiting completion at year end. This sale was completed on 27 June 2008 and resulted in the recognition of a capital gain, net of related costs, of Euro 111,037 in line item 210 “Profit (loss) from equity investments”.
SECTION 15
Other assets – Line item 150
15.1 Other assets: analysis
31/12/2008 31/12/2007
1. Miscellaneous debits in transit 25,073 27,312 2. Miscellaneous security transactions 5,078 166 3. Amounts recorded on the last day of the year 89,998 59,204 4. Checks drawn on third parties sent for collection 2,676 10,109 5. Adjustments to non-liquid portion of notes discounted with recourse 19,566 14,090 6. Accrued income and prepaid expenses not allocated to specific accounts 17,811 12,580 7. Leasehold improvements 10,759 9,382 8. Items awaiting allocation 503 704 9. Differences on elimination 43,750 - 10. Other miscellaneous items 41,077 22,625
Total 256,291 156,172
“Leasehold improvements” consist of improvement expenditure that cannot be separated from the assets themselves, meaning that it cannot be separately recognized in property, plant and equipment. These costs are amortized over the period they are expected to benefit or the residual duration of the lease, whichever is shorter.
“Amounts recorded on the last day of the year” refer to items almost all of which settled in the first few days of the new year.
In compliance with the clarifications and explanations contained in a recent letter from the Supervisory Authorities to bank intermediaries, as from 31 December 2008 “Other assets” include “operating receivables” previously classified in “Loans and advances to customers”.

215
LIABILITIES AND EQUITY
SECTION 1
Deposits from banks – Line item 10
1.1 Deposits from banks: breakdown by type
31/12/2008 31/12/2007
1. Due to central banks 701,185 85,086 2. Due to other banks 2,919,743 3,348,489 2.1 Current accounts and sight deposits 166,254 542,609 2.2 Time deposits 2,160,919 2,203,487 2.3 Loans 523,659 521,467 2.3.1 Finance leases – – 2.3.2 Other 523,659 521,467 2.4 Payables for commitments to repurchase own equity instruments – – 2.5 Liabilities relating to assets sold but not derecognized 68,892 80,926 2.5.1 Repurchase agreements 68,892 80,926 2.5.2 Other – – 2.6 Other payables 19 –
Total 3,620,928 3,433,575
Fair value 3,620,928 3,433,575
The increase in “Due to central banks” mainly reflects refinancing activity, through repurchase agreements, directly with the European Central Bank.
“Loans: other” in line 2.3.2 include funding repurchase agreements arranged to match equivalent lending repurchase agreements classified as loans to banks or to customers. Funding repurchase agreements arranged using investment securities are classified in line 2.5.1.
In view of the predominantly short-term nature of deposits from banks, their fair value is conventionally taken to be their carrying amount.
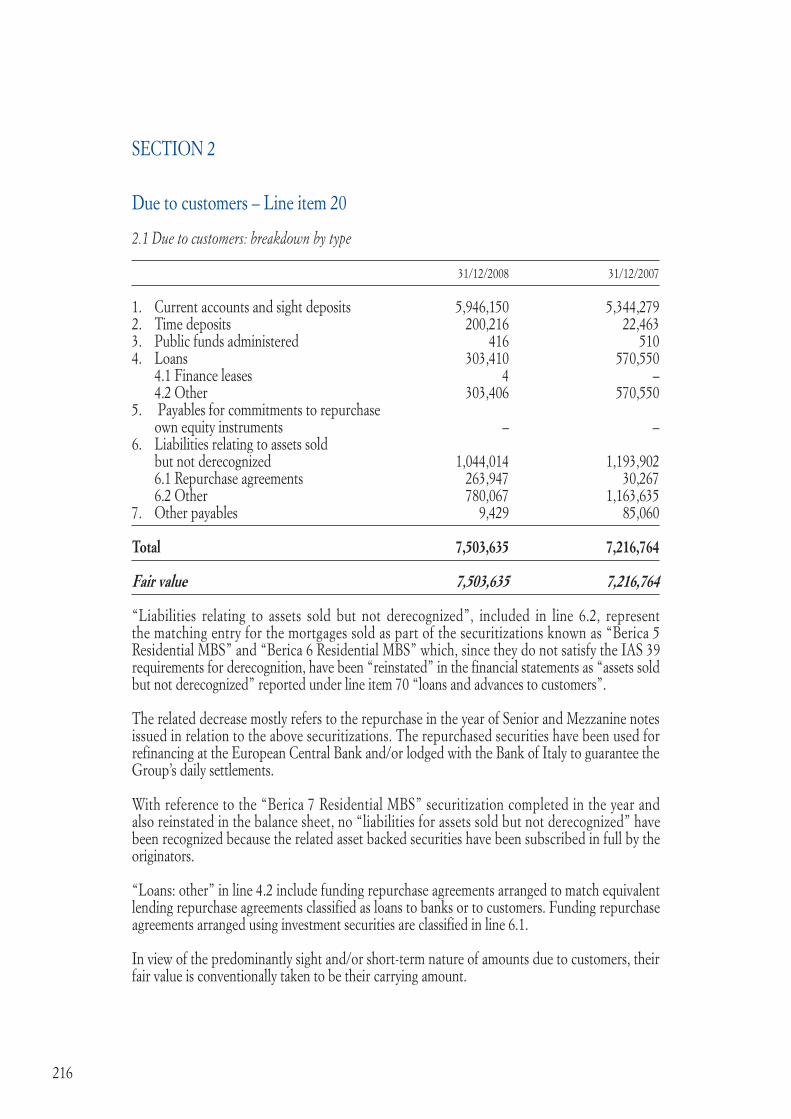
216
SECTION 2
Due to customers – Line item 20
2.1 Due to customers: breakdown by type
31/12/2008 31/12/2007
1. Current accounts and sight deposits 5,946,150 5,344,279 2. Time deposits 200,216 22,463 3. Public funds administered 416 510 4. Loans 303,410 570,550 4.1 Finance leases 4 – 4.2 Other 303,406 570,550 5. Payables for commitments to repurchase own equity instruments – – 6. Liabilities relating to assets sold but not derecognized 1,044,014 1,193,902 6.1 Repurchase agreements 263,947 30,267 6.2 Other 780,067 1,163,635 7. Other payables 9,429 85,060
Total 7,503,635 7,216,764
Fair value 7,503,635 7,216,764
“Liabilities relating to assets sold but not derecognized”, included in line 6.2, represent the matching entry for the mortgages sold as part of the securitizations known as “Berica 5 Residential MBS” and “Berica 6 Residential MBS” which, since they do not satisfy the IAS 39 requirements for derecognition, have been “reinstated” in the financial statements as “assets sold but not derecognized” reported under line item 70 “loans and advances to customers”.
The related decrease mostly refers to the repurchase in the year of Senior and Mezzanine notes issued in relation to the above securitizations. The repurchased securities have been used for refinancing at the European Central Bank and/or lodged with the Bank of Italy to guarantee the Group’s daily settlements.
With reference to the “Berica 7 Residential MBS” securitization completed in the year and also reinstated in the balance sheet, no “liabilities for assets sold but not derecognized” have been recognized because the related asset backed securities have been subscribed in full by the originators.
“Loans: other” in line 4.2 include funding repurchase agreements arranged to match equivalent lending repurchase agreements classified as loans to banks or to customers. Funding repurchase agreements arranged using investment securities are classified in line 6.1.
In view of the predominantly sight and/or short-term nature of amounts due to customers, their fair value is conventionally taken to be their carrying amount.

217
SECTION 3
Debt securities in issue – Line item 30
3.1 Debt securities in issue: breakdown by type
Type of transactions/Members of the group 31/12/2008 31/12/2007 Book value Fair value Book value Fair value
A. Listed securities – – – – 1. Bonds – – – – 1.1 structured – – – – 1.2 other – – – – 2. Other securities – – – – 2.1 structured – – – – 2.2 other – – – – B. Unlisted securities 4,609,152 4,910,261 4,566,191 4,335,427 1. Bonds 4,447,405 4,748,514 4,385,562 4,154,798 1.1 structured – – – – 1.2 other 4,447,405 4,748,514 4,385,562 4,154,798 2. Other securities 161,747 161,747 180,629 180,629 2.1 structured – – – – 2.2 other 161,747 161,747 180,629 180,629
Total 4,609,152 4,910,261 4,566,191 4,335,427
3.2 Detail of line item 30 “Debt securities in issue”: subordinated securities
31/12/2008 31/12/2007
Debt securities in issue 761,850 768,059
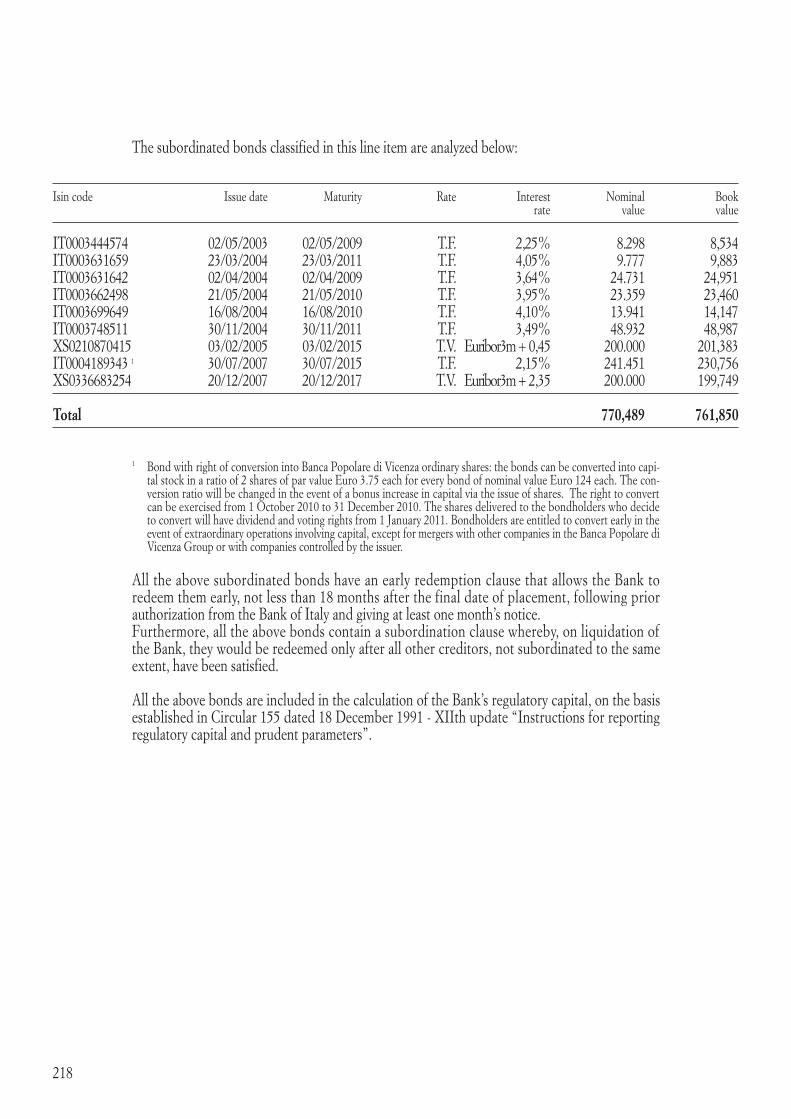
218
The subordinated bonds classified in this line item are analyzed below:
1 Bond with right of conversion into Banca Popolare di Vicenza ordinary shares: the bonds can be converted into capi-tal stock in a ratio of 2 shares of par value Euro 3.75 each for every bond of nominal value Euro 124 each. The con-version ratio will be changed in the event of a bonus increase in capital via the issue of shares. The right to convert can be exercised from 1 October 2010 to 31 December 2010. The shares delivered to the bondholders who decide to convert will have dividend and voting rights from 1 January 2011. Bondholders are entitled to convert early in the event of extraordinary operations involving capital, except for mergers with other companies in the Banca Popolare di Vicenza Group or with companies controlled by the issuer.
All the above subordinated bonds have an early redemption clause that allows the Bank to redeem them early, not less than 18 months after the final date of placement, following prior authorization from the Bank of Italy and giving at least one month’s notice. Furthermore, all the above bonds contain a subordination clause whereby, on liquidation of the Bank, they would be redeemed only after all other creditors, not subordinated to the same extent, have been satisfied.
All the above bonds are included in the calculation of the Bank’s regulatory capital, on the basis established in Circular 155 dated 18 December 1991 - XIIth update “Instructions for reporting regulatory capital and prudent parameters”.
Isin code Issue date Maturity Rate Interest Nominal Book rate value value IT0003444574 02/05/2003 02/05/2009 T.F. 2,25% 8.298 8,534 IT0003631659 23/03/2004 23/03/2011 T.F. 4,05% 9.777 9,883 IT0003631642 02/04/2004 02/04/2009 T.F. 3,64% 24.731 24,951 IT0003662498 21/05/2004 21/05/2010 T.F. 3,95% 23.359 23,460 IT0003699649 16/08/2004 16/08/2010 T.F. 4,10% 13.941 14,147 IT0003748511 30/11/2004 30/11/2011 T.F. 3,49% 48.932 48,987 XS0210870415 03/02/2005 03/02/2015 T.V. Euribor3m + 0,45 200.000 201,383 IT0004189343 1 30/07/2007 30/07/2015 T.F. 2,15% 241.451 230,756 XS0336683254 20/12/2007 20/12/2017 T.V. Euribor3m + 2,35 200.000 199,749 Total 770,489 761,850

219
SECTION 4
Financial liabilities held for trading – Line item 40
4.1 Financial liabilities held for trading: breakdown by type
FV = Fair valueFV* = Fair value calculated excluding the differences in value due to changes in the issuer’s credit rating since the issue dateVN = Nominal or notional valueQ = ListedNQ = Unlisted
Type of transaction/Members of the group 31/12/2008 31/12/2007 VN FV FV* VN FV FV* Q NQ Q NQ
A. Cash liabilities 1. Due to other banks – – – – – – – –2. Due to customers – – – – – – – –3. Debt securities in issue – – – – – – – – 3.1 Bonds – – – x – – – x 3.1.1 Structured – – – – – – – – 3.1.2 Other bonds – – – – – – – – 3.2 Other securities – – – x – – – x 3.2.1 Structuredi – – – – – – – – 3.2.2 Other – – – – – – – –
Total A – – – – – – – –
B. Derivatives 1. Financial derivatives x – 618,362 x x – 621,978 x 1.1 For trading x – 573,017 x x – 537,901 x 1.2 Connected with the fair value option x – 45,345 x x – 84,077 x 1.3 Other x – – x x – – x 2. Other x – – x x – – x 2.1 For trading x – – x x – – x 2.2 Connected with the fair value option x – – x x – – x 2.3 Other x – – x x – – x
Total B x – 618,362 x x – 621,978 x
Total (A+B) x – 618,362 x x – 621,978 x

220
4.4 Financial liabilities held for trading: derivatives
Type of derivatives/Underlying assets Interest Currency Equities Loans Other 31/12/2008 31/12/2007 rates and gold
A) Listed derivatives 1) Financial derivatives: – – – – – – – a) With exchange of capital – – – – – – – – Options issued – – – – – – – – Other derivatives – – – – – – – b) Without exchange of capital – – – – – – – – Options issued – – – – – – – – Other derivatives – – – – – – – 2) Credit derivatives: – – – – – – – a) With exchange of capital – – – – – – – b) Without exchange of capital – – – – – – –
Total A – – – – – – –
B.) Unlisted derivatives 1) Financial derivatives: 573,986 25,075 15,223 – 4,078 618,362 621,978 a) With exchange of capital – 25,075 – – – 25,075 33,382 – Options issued – 7,959 – – – 7,959 8,368 – Other derivatives – 17,116 – – – 17,116 25,014 b) Without exchange of capital 573,986 – 15,223 – 4,078 593,287 588,596 – Options issued 183,709 – 15,223 – – 198,932 239,863 – Other derivatives 390,277 – – – 4,078 394,355 348,733 2) Credit derivatives: – – – – – – – a) With exchange of capital – – – – – – – b) Without exchange of capital – – – – – – –
Total B 573,986 25,075 15,223 – 4,078 618,362 621,978
Total (A+B) 573,986 25,075 15,223 – 4,078 618,362 621,978

221
SECTION 5
Financial liabilities at fair value – Line item 50
5.1 Financial liabilities at fair value: breakdown by type
FV = Fair valueFV* = Fair value calculated excluding the differences in value due to changes in the issuer’s credit rating since the issue dateVN = Nominal or notional valueQ = ListedNQ = Unlisted
This line item includes own bonds correlated with derivative contracts that hedge interest rate risk, valued by applying the fair value option, as allowed by IAS 39.
5.2 Detail of line item 50 “Financial liabilities at fair value”: subordinated liabilities
The above bond contains a subordination clause whereby, on liquidation of the Bank, it would be redeemed only after all other creditors, not subordinated to the same extent, have been satisfied.
This bond is included in the calculation of the Bank’s regulatory capital, on the basis established in Circular 155 dated 18 December 1991 - XIIth update “Instructions for reporting regulatory capital and prudent parameters”.
Type of security/Amounts 31/12/2008 31/12/2007 VN FV FV* VN FV FV* Q NQ Q NQ
1. Due to other banks – – – – – – 1.1 Structured – – – x – – – x 1.2 Other – – – x – – – x 2. Due to customers – – – – – – 2.1 Structured – – – x – – – x 2.2 Other – – – x – – – x 3. Debt securities 2,826,859 – 2,938,130 2,228,791 – 2,185,336 3.1 Structured 687,024 – 688,465 x 905,875 – 867,917 x 3.2 Other 2,139,835 – 2,249,665 x 1,322,916 – 1,317,419 x
Total 2,826,859 – 2,938,130 – 2,228,791 – 2,185,336 –
sin code Issue date Maturity Rate Interest Nominal Book rate value value IT0004424351 15/12/2008 15/12/2015 T.F. 5,00% 115,497 119,849 Total 115,497 119,849

222
5.3 Financial liabilities at fair value: changes during the year
Due to Due to Debt securities Total other banks customers in issue
A. Opening balance – – 2,185,336 2,185,336
B. Increases – – 1,015,301 1,015,301 B.1 Issues – – 849,497 849,497 B.2 Sales – – 23,663 23,663 B.3 Positive changes in fair value – – 136,489 136,489 B.4 Other changes – – 5,652 5,652
C. Decreases – – 262,507 262,507 C.1 Purchases – – 40,843 40,843 C.2 Redemptions – – 216,212 216,212 C.3 Negative changes in fair value – – 1,379 1,379 C.4 Other changes – – 4,073 4,073
D. Closing balance – – 2,938,130 2,938,130
The “Positive and negative changes in fair value” (lines B.3 and C.3) relating to “Debt securities in issue” are reported in line item 110 “Net change in financial assets and liabilities at fair value” of the income statement. These changes are almost entirely offset by the results of valuing the associated derivative contracts, also reported in the same line item of the income statement.
“Other changes” reported in line B4. for “Debt securities in issue” include Euro 1,684 in trading losses which are recognized in line item 110 “Net change in financial assets and liabilities at fair value” of the income statement, Euro 1,168 in differentials between opening and closing coupons and Euro 2,800 in differentials between opening and closing issue discounts.
“Other changes” reported in line C.4 for “Debt securities in issue” all refer to trading profits recognized in line item 110 “Net change in financial assets and liabilities at fair value” of the income statement.

223
SECTION 6
Hedging derivatives – Line item 60
6.1 Hedging derivatives: analysis by type of contract and underlying asset
This line item reports derivatives with a negative fair value, taken out to hedge interest rate risk relating to a fixed-rate loan book.
Type of derivatives/underlying assets Interest Currencies Equity Loans Other Total rates and gold securities
A) Quoted derivatives 1. Financial derivatives – – – – – – a) With exchange of capital – – – – – – – Issued options – – – – – – – Other derivatives – – – – – – b) Without exchange of capital – – – – – – – Issued options – – – – – – – Other derivatives – – – – – – 2. Credit derivatives – – – – – – a) With exchange of capital – – – – – – b) Without exchange of capital – – – – – –
Total A – – – – –
B. Unquoted derivatives 1. Financial derivatives 16,677 – – – – 16,677 a) With exchange of capital – – – – – – – Issued options – – – – – – – Other derivatives – – – – – – b) Without exchange of capital 16,677 – – – – 16,677 – Issued options – – – – – – – Other derivatives 16,677 – – – – 16,677 2. Credit derivatives – – – – – – a) With exchange of capital – – – – – – b) Without exchange of capital – – – – – –
Total B 16,677 – – – – 16,677
Total (A+B) at 31/12/2008 16,677 – – – – 16,677
Total (A+B) at 31/12/2007 – – – – – –
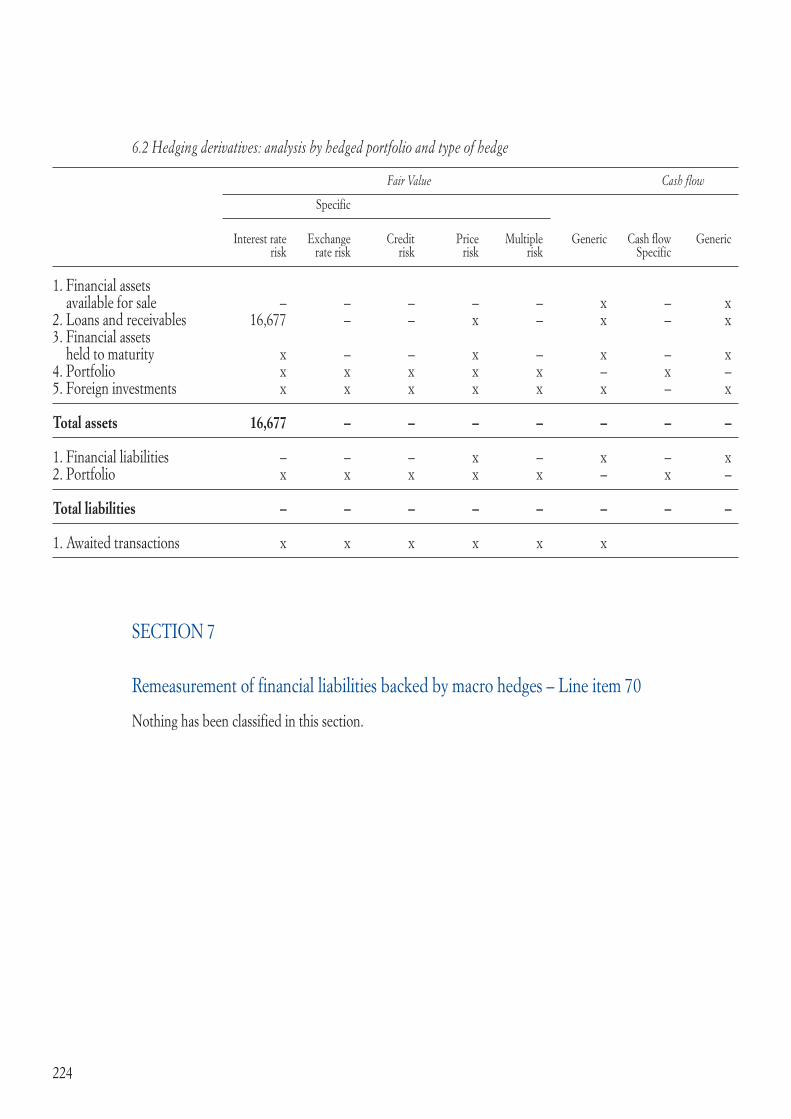
224
6.2 Hedging derivatives: analysis by hedged portfolio and type of hedge
SECTION 7
Remeasurement of financial liabilities backed by macro hedges – Line item 70
Nothing has been classified in this section.
Fair Value Cash flow
Specific
Interest rate Exchange Credit Price Multiple Generic Cash flow Generic risk rate risk risk risk risk Specific
1. Financial assets available for sale – – – – – x – x 2. Loans and receivables 16,677 – – x – x – x 3. Financial assets held to maturity x – – x – x – x 4. Portfolio x x x x x – x – 5. Foreign investments x x x x x x – x
Total assets 16,677 – – – – – – –
1. Financial liabilities – – – x – x – x 2. Portfolio x x x x x – x –
Total liabilities – – – – – – – –
1. Awaited transactions x x x x x x

225
SECTION 8
Tax liabilities – Line item 80
Analysis of “Current tax liabilities”
31/12/2008 31/12/2007
1. Direct tax liabilities 1,383 8,3782. Indirect tax liabilities 708 5073. Other tax liabilities 42,350 43,736
Total 44,441 52,621
Deferred tax liabilities are discussed in asset section 13. The same section also contains information about the Bank’s tax position. In compliance with IAS 12, payments on account for individual taxes have been offset against the related tax payable, with positive balances reported as “current tax assets” and negative balances as “current tax liabilities”.
SECTION 9
Liabilities associated with non-current assets held for sale – Line item 90
Nothing has been classified in this section.
SECTION 10
Other liabilities – Line item 100
10.1 Other liabilities: analysis
31/12/2008 31/12/2007
1. Miscellaneous security transactions 10,395 17,567 2. Employee salaries and contributions 31,810 37,494 3. Suppliers 24,064 29,050 4. Transactions in transit 163,391 79,966 5. Adjustments for non-liquid balances relating to the portfolio 192,705 132,111 6. Liability for risks on guarantees and commitments 4,581 3,659 7. Accrued expenses and deferred income not allocated to specific accounts 2,005 2,073 8. Other miscellaneous items 97,978 106,749
Total 526,929 408,669
Transactions in transit refer to positions taken in the last few days of the year, almost all of which settled in the first few days of the new year.

226
SECTION 11
Provision for severance indemnities – Line item 110
11.1 Severance indemnities: changes during the year
31/12/2008 31/12/2007
A. Opening balance 51,814 55,568
B. Increases 4,091 (245)
B.1 Provisions 4,041 (3,461) B.2 Other increases 50 3,216
C. Decreases 4,145 3,509
C.1 Payments made 4,142 3,243 C.2 Other decreases 3 266
D. Closing balance 51,760 51,814
Total 51,760 51,814
According to IFRIC, the provision for severance indemnities is a “post-employment benefit” qualifying as a “defined-benefit plan”, the value of which according to IAS 19 must be determined on an actuarial basis. As a consequence, the year-end valuation of this amount was carried out by an independent actuary using the projected unit credit method with reference to earned benefits. This method involves the projection of future payments with reference to historical and statistical analyses and probabilities, adopting suitable demographic techniques. This makes it possible to calculate the severance indemnities accruing at a specific date on an actuarial basis, distributing the cost over the entire remaining service of the current workforce, and no longer presenting them as a cost payable as if the business were to cease trading on the balance sheet date.
The 2007 Finance Act (Law 296 of 27 December 2006) brought forward to 1 January 2007 the effective date of new pension fund legislation (Decree 252/2005). As a result of the new legislation, provisions for severance indemnities from that date are being paid into external pension funds or, at the employee’s specific request, into the specific fund set up under the same law and managed by INPS (Italy’s social security agency). Given the above, the provision for severance indemnities is therefore “static”, representing the amount accruing for employees up until 1 January 2007.
The valuation performed at 31 December 2008 has revealed a difference of Euro 4,413 between severance indemnities calculated on an actuarial basis and those calculated under prevailing law and collective payroll agreements.

227
SECTION 12
Provision for risks and charges – line item 120
12.1 Provisions for risks and charges: analysis
Items/Amounts 31/12/2008 31/12/2007
1. Pensions and similar commitments – – 2. Other provisions 59,532 68,697 2.1 legal disputes 38,670 35,425 2.2 personnel expenses 6,500 4,900 2.3 other 14,362 28,372
Total 59,532 68,697
12.2 Provisions for risks and charges: changes during the year
Pensions Other provisions Total
A. Opening balance – 68,697 68,697
B. Increases – 23,175 23,175
B.1 Provisions – 21,832 21,832 B.2 Changes due to the passage of time – – – B.3 Changes due to variations in the discount rate – – – B.4 Other changes – 1,343 1,343
C. Decreases – 32,340 32,340
C.1 Utilizations during the year – 30,471 30,471 C.2 Changes due to variations in the discount rate – – – C.3 Other changes – 1,869 1,869
D. Closing balance – 59,532 59,532
Line B.1 “Provisions” comprises:• Euro6,500inprovisionsforfuturepersonnelexpensesrelatingtotheemployeeincentive
scheme, the matching entry to which is reported in “Payroll” (line item 150a) in the income statement;
• Euro15,332inprovisionsrelatingtolegaldisputesandsundrycharges,thematchingentryto which is reported in “Net provisions for risks and charges” (line item 160 of the income statement).
“Other increases” reported in line B.4 reflect Euro 1,343 for the portion of 2007 net income allocated to the provision for charitable donations, aid and works in the public interest, while the related utilizations are included in “Other decreases” in line C.3.
228
12.4 Provisions for risks and charges – other provisions
The information required by paras. 85 and 86 of IAS 37 is provided below for each category of contingent liability.
The provision for legal disputes relates to contingencies associated with claims against the Bank and from the liquidators of bankrupt companies.
The provision for employment costs refers to the employee incentive scheme .
The other provisions for risks and charges relate to complaints from customers, fiscal disputes and other sundry charges.
Recent assessment indicates that the above contingencies are likely to be settled within the next 12/18 months. Consequently, the charges associated with the above liabilities have not been discounted since the effect would not be significant.
SECTION 13
Redeemable shares – Line item 140
Nothing has been classified in this section.

229
SECTION 14
Group equity – Line items 130, 150, 160, 170, 180, 190 and 200
14.1 Group equity: analysis
Items/Amounts 31/12/2008 31/12/2007
1. Capital stock 261,460 261,656 2. Additional paid–in capital 1,960,355 1,963,297 3. Reserves 517,131 478,159 4 . (Treasury shares) (96,981) – 5. Valuation reserves 38,048 (43,225)6. Equity instruments 13,104 13,630 7. Net income for the year pertaining to the Group 151,035 110,090
Total 2,844,152 2,783,607
The “reserves” included in line 3 comprise the pre-existing profit reserves (legal reserve, statutory reserve, extraordinary reserve, reserve for the purchase of treasury shares etc.), as well as the positive and negative reserves associated with the transition to IAS/IFRS not classified in the other equity accounts. They also include the reserve for general banking risks recorded pursuant to the former Decree 87/92 which, in accordance with IAS, has been reclassified as part of equity. The “valuation reserves” reported in line 5 include the reserves arising on the valuation of property, land and works of art at fair value rather than cost, on the first-time adoption of IAS/IFRS, together with the valuation reserves relating to AFS financial assets and the monetary revaluation reserves.“Equity instruments” reported in line 6 relate to the equity component embedded in the “BPVi 13.a emissione 2007- 2015” convertible bond which, in accordance with IAS 32, has been separated and classified in equity, net of tax.
14.2 “Capital stock” and “Treasury shares”: analysis
31/12/2008 31/12/2007
– Treasury shares 69,722,736 69,775,066 – Nominal value euro 3,75 euro 3,75

230
14.3 Capital stock – Number of shares: changes during the year
Items/Types Ordinary Other
A. Treasury shares at the beginning of the year 69,775,066 – – fully paid 69,775,066 – – not fully paid – – A.1 Treasury shares (–) – –
A.2 Outstanding shares: opening balance 69,775,066 –
B. Increases 3,601,004 – B.1 New issues 5,620 – – payment: – – – business combinations – – – conversion of bonds – – – exercise of warrants – – – other – – – bonus: 5,620 – – to employees 5,620 – – to directors – – – other – – B.2 Sale of treasury shares 3,595,384 – B.3 Other changes – –
C. Decreases 5,269,680 – C.1 Cancellation 57,950 – C.2 Purchase of treasury shares 5,211,730 – C.3 Disposal of companies – – C.4 Other changes – –
D. Outstanding shares: closing balance 68,106,390 – D.1 Treasury shares (+) 1,616,346 – D.2 Treasury shares at the end of the year 69,722,736 – – fully paid 69,722,736 – – not fully paid – –
14.4 Capital stock: other information
As a result of bonus issues in previous years, capital stock includes the following revaluation reserves in suspense for tax purposes:
• ReserveunderLaw74dated11.02.1952forEuro24;• ReserveunderLaw72dated19.03.1983forEuro13,005;• ReserveunderLaw576dated02.12.1975forEuro553;• ReserveunderLaw218dated30.07.1990forEuro30,582;• ReserveunderLaw408dated29.12.1990forEuro12,834;• ReserveunderLaw413dated30.12.1991forEuro28,054.

231
14.5 Reserves from earnings: other information
The line item “Reserves” is detailed as follows:
Item/Amounts 31/12/2008 31/12/2007
1. Legal reserve 110,977 104,978 2. Extraordinary reserve 161,707 150,207 3. Reserve for general banking risks 90,895 90,895 4. First Time Adoption reserves (61,355) (61,355)5. Reserve for the purchase of treasury shares (unrestricted) 25,019 102,000 6. Reserve for the purchase of treasure shares (restricted) 96,981 –7. Other reserves 92,907 91,434
Total 517,131 478,159
14.6 Equity instruments: analysis and changes during the years
Item/Amounts 31/12/2008 31/12/2007
Equity instruments 13,104 13,630
Equity instruments relate to the equity component embedded in the “BPVi 13.a emissione 2007- 2015” convertible bond issued which, in accordance with IAS 32, has been separated and classified in equity, net of tax.
14.7 Valuation reserves: analysis
Item/Amounts 31/12/2008 31/12/2007
1. Financial assets available for sale 35,948 (45,325)2. Property, plant and equipment – –3. Intangible assets – –4. Hedges of foreign investments – –5. Cash-flow hedges – –6. Exchange differences – –7. Non-current assets held for sale – –8. Special revaluation laws 2,100 2,100
Total 38,048 (43,225)

232
“Valuation reserves” relating to “Special revaluation laws” are analyzed as follows:
Items/Amounts 31/12/2008 31/12/2007
1. Law 413 of 30.12.91 344 344 2. Revaluation of property, plant and equipment at deemed cost 1,756 1,756
Total 2,100 2,100
14.8 Valuation reserves: changes during the year
14.9 Valuation reserves - AFS financial assets: analysis
31/12/2008 31/12/2007 Positive reserve Negative reserve Positive reserve Negative reserve
1. Debt securities 3,432 (1,001) 3,178 (1,338)2. Equities 39,295 (2,386) 15,460 (61,884)3. Mutual funds 933 (4,325) 689 (1,430)4. Loans – – – –
Total 43,660 (7,712) 19,327 (64,652)
This table reports the positive and negative reserves, net of tax, arising on the fair value measurement of financial assets available for sale.
The negative reserve for debt securities includes Euro 1,333 in residual value of the valuation reserve calculated on the basis of the fair value at the reclassification date (1 July 2008) of securities reclassified from “Financial assets available for sale”, under the amendment to IAS 39 “Financial instruments: recognition and measurement” contained in the “Reclassification of Financial Assets” published by the IASB on 13 October 2008 and endorsed by the European Commission on 15 October 2008 with Regulation CE 1004/2008, as discussed more fully in the specific section of the explanatory notes.
Financial Property, Intangible Hedges Cash-flow Exchange Non-current Special assets plant and assets of hedges differences assets revaluation available equipment foreign held laws for sale investments for sale
A. Opening balance (45,325) – – – – – – 2,100
B. Increases 103,953 – – – – – – –B.1 Increases in fair value 32,336 – – – – – – –B.2 Other changes 71,617 – – – – – – –
C. Decreases 22,680 – – – – – – –
C.1 Decreases in fair value 11,844 – – – – – – –C.2 Other changes 10,836 – – – – – – –
D. Closing balance 35,948 – – – – – – 2,100

233
14.10 Valuation reserves - AFS financial assets: changes during the year
Debt securities Equities Mutual funds Loans
1. Opening balance 1,840 (46,424) (741) –
2. Positive changes 5,855 94,945 3,153 –2.1 Increases in fair value 3,069 28,453 814 –2.2 Release to the income statement of negative reserve: 258 676 612 – - from impairment – 307 612 – - from disposal 258 369 – –2.3 Other changes 2,528 65,816 1,727 –
3. Negative changes 5,264 11,612 5,804 –3.1 Negative changes in fair value 3,292 3,209 5,343 –3.2 Release to the income statement of positive reserves: from disposals 697 3,008 – –3.3 Other changes 1,275 5,395 461 –
4. Closing balance 2,431 36,909 (3,392) –
Lines 2.3 and 3.4 report the positive and negative tax changes respectively in respect of movements in the year in the valuation reserve for AFS financial assets.
Line 2.3 in relation to equities also includes the release of the valuation reserve relating to the interest in Cattolica Assicurazioni reported in the financial statements at 31 December 2007 (Euro 63,813), after reclassifying this interest to “Equity investments” from “Financial assets available for sale”.Lastly, line 2.3 in relation to debt securities includes Euro 201 in amortization of reserves relating to “Financial assets available for sale” reclassified to “Loans”; this amortization is being calculated using the effective interest method over the residual life of the investment and is recorded in line item 10 “Interest income and similar revenues” of the income statement as a deduction from the interest income on the same securities, in compliance with para. 54 (a) of IAS 39.

234
OTHER INFORMATION
As required by art. 2427, para. 7-bis of the Italian Civil Code, the following table analyzes the equity accounts according to their permitted uses and distribution:
Description Amount Permitted Unrestricted Uses in past uses portion three years to cover for other losses reasons
Capital stock 261,460 204 Treasury shares (96,981) Capital reserves - additional paid-in capital 1,960,355 a,b,c 1,960,355 – 2,916 - reserve for treasury shares (restricted portion) 50,000 Equity instruments 13,104 – Valuation reserves - art. 6.1 b) Decree 38/2005 (Financial assets available for sale) 35,948 – – - art. 7.6 Decree 38/2005 1,756 a,b 1,756 - reserve Law 72/83 5,066 - reserve Law 408/90 12,834 - reserve Law 413/91 344 a,b,c 344 – 28,054
Profit reserves - legal reserve 110,977 b 52,292 – – a,b,c 58,685 - reserve for treasury shares (restricted portion) 46,981 - reserve for treasury shares (unrestricted portion) 25,019 a,b,c 25,019 – – - reserve art. 2349 Civil Code 3,691 a 3,691 2,854 - art. 7.3 Decree 38/2005 (14,007) (14,007) - art. 7.7 Decree 38/2005 (47,348) (47,348) - reserve Law 124/93 489 a,b,c 489 – – - reserve Law 153/99 27,037 a,b,c 27,037 – – - reserve Law 218/90 1,586 a,b,c 1,586 - other reserves 312,706 a,b,c 312,706 – – Net income for 2008 (1) 151,035 a,b,c 138,532 c 9,790 d 2,713 TOTAL 2,844,152 2,533,640 – 51,928
Undistributable portion 60,452 Remaining distributable portion 2,473,188
Key: “a”: for capital increases; “b”: for covering losses; “c”: for distribution to stockholders; “d”: for other purposes.(1) As regards net income for 2008, the permitted use and unrestricted portion takes account of the allocation of earnings
proposed to the Stockholders’ Meeting.

235
The above table classifies the reserves according to the permitted uses specified in the Italian Civil Code and in special laws governing such reserves.The permitted use and unrestricted portion do not take account of any restrictions imposed by tax law.
Attention is drawn to the fact that the Supervisory Instructions for Banks lay down minimum capital requirements which place limits on the actual possibility of distributing reserves.
Lastly, it is noted that art. 109.4.b) of the Income Tax Consolidation Act provides for suspension of tax with reference to “off-balance sheet” deductions made using the income tax return’s form EC. This suspension of tax amounts to Euro 2,168 and is carried out “en masse”, meaning that it does not place any restrictions on the reserves reported in the balance sheet.
OTHER INFORMATION
1. Guarantees given and commitments
Operations 31/12/2008 31/12/2007
1) Financial guarantees 1,051,847 995,040 a) Banks 4 21,328 b) Customer 1,051,843 973,712 2) Commercial guarantees 811,506 666,040 a) Banks 53,173 36,562 b) Customer 758,333 629,478 3) Irrevocable commitments to make loans 1,447,496 1,650,140 a) Banks 172,469 244,440 i) certain to be called on 159,374 233,395 ii) not certain to be called on 13,095 11,045 b) Customer 1,275,027 1,405,700 i) certain to be called on 410 54,798 ii) not certain to be called on 1,274,617 1,350,902 4) Commitments underlying credit derivatives: protection sold – –5) Assets lodged to guarantee the commitments of third parties – –6) Other commitments 1,757,591 1,358,284
Total 5,068,440 4,669,504
“Other commitments” include the put options on debt securities and equities issued by the Bank, as well as undrawn revocable credit lines.

236
2. Assets pledged to guarantee own liabilities and commitments
Portfolio 31/12/2008 31/12/2007
1. Financial assets held for trading 7,179 113,186 2. Financial assets at fair value – –3. Financial assets available for sale 59,848 214,393 4. Financial assets held to maturity – –5. Loans and advances to banks 596,895 30,541 6. Loans and advances to customer 826,669 –7. Property, plant and equipment – –
The increase in assets pledged in guarantee mostly refers to asset backed securities relating to own transactions repurchased/subscribed in the year, used for refinancing at the Central European Bank and/or lodged with the Bank of Italy to guarantee the Group’s daily settlements.
4. Administration and trading on behalf of third parties
The Bank is authorized to trade in securities in accordance with article 1.5 letters a), b), c) and e) of Decree 58 dated 24 February 1998.
Type of service 31/12/2008 31/12/2007
1. Trading in financial instruments on behalf of third parties 3,528,432 6,744,085 a) Purchases 1,335,970 3,020,579 1. Settled 1,323,415 3,016,081 2. Unsettled 12,555 4,498 b) Sales 2,192,462 3,723,506 1. Settled 2,178,370 3,717,054 2. Unsettled 14,092 6,452 2. Private portfolios under management – – a) Individual – – b) Collective – –3. Custody and administration of securities 18,923,220 16,701,710 a) Third-party securities on deposit: associated with activities as a custodian bank (excluding portfolio management) 1,162,525 1,244,069 1. securities issued by consolidated companies – – 2. other securities 1,162,525 1,244,069 b) Third-party securities in custody (excluding portfolio management): other 15,383,527 14,471,810 1. securities issued by consolidated companies 3,920,302 2,928,641 2. other securities 11,463,225 11,543,169 c) Third-party securities on deposits with third parties 15,975,063 15,195,066 d) Own securities on deposit with third parties 2,377,168 985,831 4. Other transactions – –
The Bank’s does not perform asset management activities as they are carried out by the subsidiary BPVi Fondi Sgr.

237
Part C iNCOME StatEMENt
SECtiON 1
interest – Line items 10 and 20
1.1 Interest income and similar revenues: analysis
1.2 Interest income and similar revenues: differentials relating to hedging transactions
items/amounts 31/12/2008 31/12/2007
A. Positive differentials relating to: a.1 Specified hedges of asset fair value 57 –a.2 Specified hedges of liability fair value – –a.3 Macro hedges of interest rate risk – –a.4 Specific hedges of asset cash flows – –a.5 Specific hedges of liability cash flows – –a.6 Macro hedges of cash flows – –
Total positive differentials (A) 57 –
B. Negative differentials relating to: B.1 Specified hedges of asset fair value – –B.2 Specified hedges of liability fair value – –B.3 Macro hedges of interest rate risk – –B.4 Specific hedges of asset cash flows – –B.5 Specific hedges of liability cash flows – –B.6 Macro hedges of cash flows – –
Total negative differentials (B) – –
C. Balance (A-B) 57 –
items/technical forms Performing financial assets Non- Other assets 31/12/2008 31/12/2007 Debt securities Loans performing assets 1. Financial assets held for trading 6,372 – – – 6,372 15,701 2. Financial assets available for sale 7,083 – – – 7,083 13,180 3. Financial assets held to maturity – – – – – –4. Loans and advances to banks 17,153 106,974 – – 124,127 96,607 5. Loans and advances to customers 1,787 887,073 587 – 889,447 679,187 6. Financial assets at fair value 2,189 – – – 2,189 2,102 7. Hedging derivatives – – – 57 57 –8. Financial assets sold but not derecognized – 81,104 – – 81,104 70,824 9. Other assets – – – 159 159 119
Total 34,584 1,075,151 587 216 1,110,538 877,720

238
1.3 Interest income and similar revenues: other information
1.3.1 Interest income on foreign currency financial assets
31/12/2008 31/12/2007
a) on foreign currency assets 12,662 16,813
1.4 Interest expense and similar charges: analysis
items/technical form Payables Securities Other 31/12/2008 31/12/2007 liabilities 1. Depostis from banks (156,246) – – (156,246) (103,483)2. Due to customer (147,054) – – (147,054) (109,085)3. Debt securities in issue – (228,115) – (228,115) (178,599)4. Financial liabilities held for trading – – (24,077) (24,077) (9,538)5. Financial liabilities at fair value – (99,519) – (99,519) (65,449)6. Financial liabilities associated with assets sold but not derecognized (49,895) – – (49,895) (56,294)7. Other liabilities – – – – –8. Hedging derivatives – – – – –
Total (353,195) (327,634) (24,077) (704,906) (522,448)
1.6 Interest expense and similar charges: other information
1.6.1 Interest expense on foreign currency liabilities
31/12/2008 31/12/2007
a) on foreign currency liabilities (14,047) (18,179)

239
SECtiON 2
Commissions – Line items 40 and 50
2.1 Fee and commission income: analysis
type of service/amounts 31/12/2008 31/12/2007
a) Guarantees given 10,251 8,973 b) Credit serivatives – –c) Management, intermediation and advisory services: 90,129 95,796 1. trading in financial instruments 1,043 1,331 2. foreign currency trading 8,261 8,182 3. portfolio management – – 3.1 individual – – 3.2 collective – – 4. custody and administration of securities 2,318 1,697 5. custodian bank 1,315 1,576 6. placement of securities 25,408 34,317 7. acceptance of orders 4,978 6,404 8. advisory services – – 9. distribution of third party services 46,806 42,289 9.1 portfolio management 4,048 9,343 9.1.1 individual 3,623 8,931 9.1.2 collective 425 412 9.2 insurance products 18,143 14,335 9.3 other products 24,615 18,611 d) Collection and payment services 12,598 12,408 e) Services for securitizations 3,371 3,454 f) Services for factoring transactions – –g) tax collection services – –h) Other services 78,545 72,804
Total 194,894 193,435
Details of “Other services”
31/12/2008 31/12/2007
1. Fees and commissions on loans 14,799 13,173 2. Current account expenses and other recoveries 44,196 41,506 3. Commissions and expenses on bank transfers 8,420 7,866 4. Commissions on debit/credit cards 8,248 7,591 5. Collection commissions 2,267 2,032 6. Other services 615 636
Total 78,545 72,804

240
2.2 Fee and commission income: product and service distribution channels
Channels/amounts 31/12/2008 31/12/2007
a) At own branches: 70,667 75,341 1. portfolio management – – 2. placement of securities 25,309 34,174 3. third-party products and services 45,358 41,167 b) Door-to-door: 1,547 1,265 1. portfolio management – – 2. placement of securities 99 143 3. third-party products and services 1,448 1,122 c) Other distribution channels: – – 1. portfolio management – – 2. placement of securities – – 3. third-party products and services – –
2.3 Fee and commission expense: analysis
type of service/amounts 31/12/2008 31/12/2007
a) Guarantees received (14) (10)b) Credit derivatives – –c) Management and dealing services: (3,491) (4,055) 1. trading in financial instruments (1,362) (1,723) 2. trading in foreign currency (341) (300) 3. portfolio management: – – 3.1 own portfolio – – 3.2 third-party portfolio – – 4. custody and administration of securities – – 5. placement of financial instruments (1,474) (1,607) 6. doo-to-door distribution of financial instruments, products and services (314) (425)d) Collection and payment services (3,530) (4,000)e) Other services (10,290) (10,381)
Total (17,325) (18,446)
Details of “Other services”
31/12/2008 31/12/2007
1. Commissions claimed by banks (4,531) (5,027)2. Commissions on debit/credit cards (5,338) (4,738)3. Other services (421) (616)
Total (10,290) (10,381)
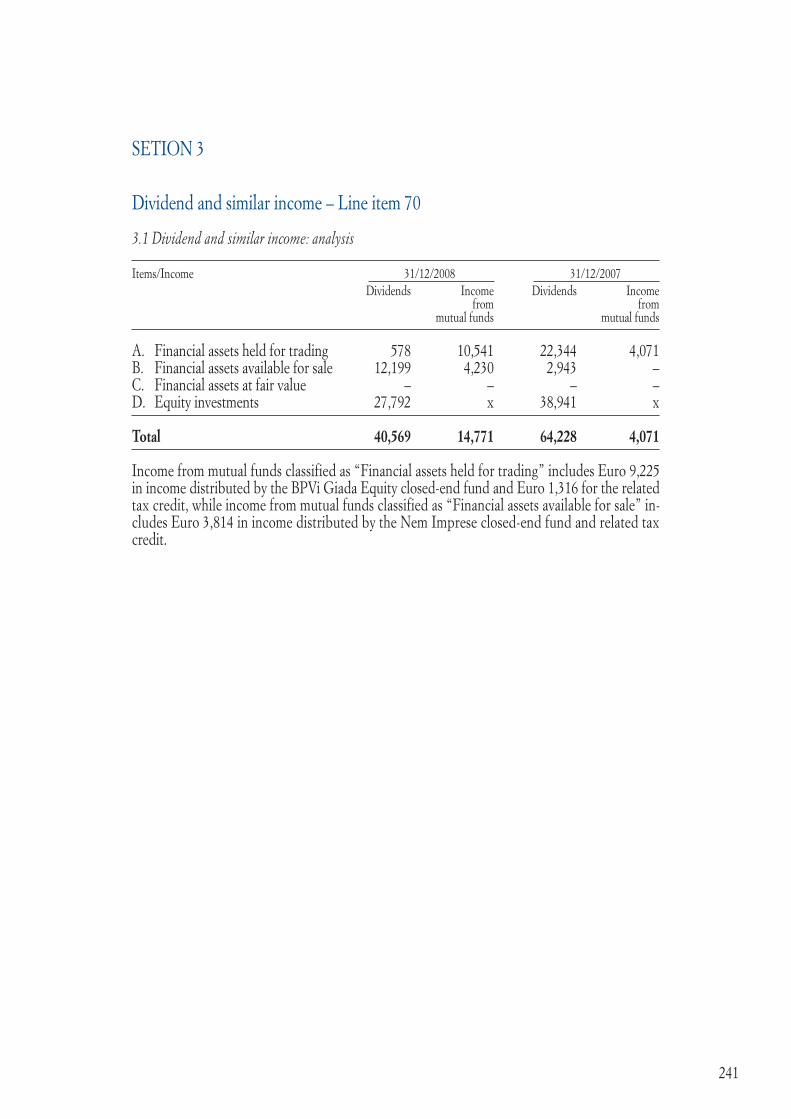
241
SEtiON 3
Dividend and similar income – Line item 70
3.1 Dividend and similar income: analysis
items/income 31/12/2008 31/12/2007 Dividends income Dividends income from from mutual funds mutual funds
a. Financial assets held for trading 578 10,541 22,344 4,071 B. Financial assets available for sale 12,199 4,230 2,943 –C. Financial assets at fair value – – – –D. Equity investments 27,792 x 38,941 x
Total 40,569 14,771 64,228 4,071
income from mutual funds classified as “Financial assets held for trading” includes Euro 9,225 in income distributed by the BPVi Giada Equity closed-end fund and Euro 1,316 for the related tax credit, while income from mutual funds classified as “Financial assets available for sale” in-cludes Euro 3,814 in income distributed by the Nem imprese closed-end fund and related tax credit.

242
SECtiON 4
Net trading income – Line item 80
4.1 Net trading income: analysis
transactions/income items Gains trading Losses trading Net profit losses result (a) (b) (c) (d) [(a+b)-(c+d)] 1. Financial assets held for trading 267 2,759 (2,053) (13,290) (12,317) 1.1 Debt securities 245 2,387 (1,409) (3,516) (2,293) 1.2 Equities 22 347 (644) (5,167) (5,442) 1.3 Mutual funds – 25 – (4,607) (4,582) 1.4 Loans – – – – – 1.5 Other – – – – –
2. Financial liabilities held for trading – – – – – 2.1 Debt securities – – – – – 2.2 Payables – – – – –
3. Other financial assets and liabilities: exchange differences x x x x 14,924
4. Derivatives 594,739 768,955 (605,588) (752,313) (1,122) 4.1 Financial derivatives: 594,739 768,955 (605,588) (752,313) (1,122) - on debt securities and interest rates 565,197 718,523 (576,045) (704,049) 3,626 - on equities and equity indices 29,542 50,432 (29,543) (48,264) 2,167 - on currency and gold x x x x (6,915) - other – – – – – 4.2 Credit derivatives – – – – –
Total 595,006 771,714 (607,641) (765,603) 1,485
trading profits (losses) and valuation gains (losses) relating to financial derivatives are presented on an open account basis for each individual financial instrument.

243
SECtiON 5
Net hedging gains (losses) – Line item 90
5.1 Net hedging gains (losses): analysis
transactions/income items 31/12/2008 31/12/2007
A. Income on: a.1 Fair value hedging derivatives – –a.2 Hedged financial assets (fair value) 16,951 –a.3 Hedged financial liabilities (fair value) – –a.4 Cash flow hedging derivatives – –a.5 Foreign currency assets and liabilities – –
Total hedging income(A) 16,951 –
B. Expense on: B.1 Fair value hedging derivatives (16,678) –B.2 Hedged financial assets (fair value) – –B.3 Hedged financial liabilities (fair value) – –B.4 Cash flow hedging derivatives – –B.5 Foreign currency assets and liabilities – –
Total hedging expense (B) (16,678) –
C. Net profit/loss on hedging transactions (A-B) 273 –
the Bank has taken out interest rate swaps as from the month of July to hedge interest rate risk on a portfolio of fixed-rate loans granted in the past three years.
the tests carried out at year end in compliance with iaS 39 have confirmed the effectiveness of the hedge. the net gain (loss) reported above reflects the partial ineffectiveness of hedges, which nonetheless remains with the range permitted by iaS 39.

244
SECtiON 6
Disposal/repurchase gains (losses) – Line item 100
6.1 Disposal/repurchase gains (losses): analysis
the profits and losses from “Financial assets available for sale” include the “release” to income of the positive and negative valuation reserves, recorded separately under equity at 31 December 2007, as a result of selling assets during the year.
the profits relating to “Equities” classified as “Financial assets available for sale” mostly relate to the disposal in the year of the shares held in JP residential.
the profits relating to “Due to customers” refer to the repurchase of part of the senior and mezzanine notes issued in relation to the “Berica 5 residential MBS” and “Berica 6 residential MBS” securitizations, both of which “reinstated” in the financial statements.
items/income items 31/12/2008 31/12/2007 Profits Losses Net Profits Losses Net result result Financial assets 1. Loans and advances to banks – – – – – –2. Loans and advances to customer 4 (41) (37) – (17) (17)3. Financial assets available for sale 4,446 (484) 3,962 5,230 (1,175) 4,055 3.1 Debt securities – (461) (461) – (1,082) (1,082) 3.2 Equities 4,446 (23) 4,423 5,230 (93) 5,137 3.3 Mutual funds – – – – – – 3.4 Loans – – – – – –4. Financial assets held to maturity – – – – – –
Total assets 4,450 (525) 3,925 5,230 (1,192) 4,038
Financial liabilities 1. Deposits from banks – – – – – –2. Due to customers 12,322 – 12,322 – – –3. Debt securities in issue 1,425 – 1,425 1,087 (3) 1,084
Total liabilities 13,747 – 13,747 1,087 (3) 1,084

245
SECtiON 7
Net change in financial assets and liabilities at fair value – Line item 110
7.1 Net change in financial assets and liabilities at fair value: analysis
transactions/income items Gains Gains on Losses Losses on Net profit (a) disposals disposals (loss) (b) (c) (d) [(a+b)-(c+d)] 1. Financial assets – 1,014 (7,527) – (6,513) 1.1 Debt securities – 1,014 (7,527) – (6,513) 1.2 Equities – – – – – 1.3 Mutual funds – – – – – 1.4 Loans – – – – –
2. Financial liabilities 1,379 4,073 (136,489) (1,684) (132,721) 2.1 Debt securities 1,379 4,073 (136,489) (1,684) (132,721) 2.2 Deposits from banks – – – – – 2.3 Due to customers – – – – –
3. Foreign currency financial assets and liabilities: exchange differences x x x x –
4. Derivatives 4.1 Financial derivatives 130,138 11,970 (4,780) (1,817) 135,511 - on debt securities and interests rates 130,138 11,970 (4,780) (1,817) 135,511 - on equities and equity indices – – – – – - on currency and gold x x x x – - other – – – – – 4.2 Credit derivatives – – – – –
Total derivatives 130,138 11,970 (4,780) (1,817) 135,511
Total 131,517 17,057 (148,796) (3,501) (3,723)
trading profits (losses) and valuation gains (losses) relating to financial derivatives are presented on an open account basis for each individual financial instrument.

246
SECtiON 8
Net impairment adjustments – Line item 130
8.1 Net impairment adjustments to loans and advances: analysis
a = interestsB = other
8.2 Net impairment adjustments to financial assets available for sale: analysis
a = interestsB = other
the specific adjustments included in the “Other” column of line B. “Equity instruments” almost entirely relate to the write-down during the year of the interest held in HOPa Spa.Specific adjustments in the “Other” column of “Loans to customers” (line E) refer to the partial write-down of a loan granted in connection with the sale of the entire interest in Linea S.p.a. to Compass S.p.a. (Mediobanca Group), whose repayment depends on the performance of an underlying loan book.
Transactions/Income Adjustments Adjustments 31/12/2008 31/12/2007items Specific Portafolio Specific Portafolio Write-offs Other a B a B a. Loans and advances to banks – (297) – – – – – (297) 720 B. Loans and advances to customers (5,442) (137,508) (10,737) 4,026 48,646 – – (101,015) (103,510)
C. Total (5,442) (137,805) (10,737) 4,026 48,646 – – (101,312) (102,790)
Transactions/Income items Adjustments Writebacks 31/12/2008 31/12/2007 Specific Specific Write-offs Other a B a. Debt securities – (1,097) – – (1,097) –B. Equities – (3,837) – – (3,837) (9,117)C. Mutual funds – (4,241) – – (4,241) –D. Loans and advances to banks – – – – – –E. Loans and advances to customers – (15,300) – – (15,300) –
F. Total – (24,475) – – (24,475) (9,117)

247
8.4 Net impairment adjustments to other financial transactions: analysis
a = interestB = other
SECtiON 9
administrative costs – Line item 150
9.1 Payroll costs: analysis
type of expense/amounts 31/12/2008 31/12/2007
1) Employees (246,220) (202,998) a) wages and salaries (179,711) (152,216) b) social security contribution (44,925) (39,004) c) severance indemnities (215) (392) d) pension costs (418) (356) e) provision for severance indemnities (4,041) 3,461 f) provision for pensions and similar benefits: – – - defined contibution – – - defines benefit – – g) payments to external supplementary pension funds: (15,865) (12,643) - defined contibution (15,865) (12,643) - defines benefit – – h) costs deriving from equity-settled payment arrangements (341) (1,048) i) other personnel benefits (704) (800)
2) Other personnel (982) (727)
3) Retired personnel (2,579) (2,980)
4) Directors and statutory auditors (4,556) (3,192)
Total (254,337) (209,897)
Transactions/Income Adjustments Adjustments 31/12/2008 31/12/2007items Specific Portafolio Specific Portafolio Write-offs Other a B a B a. Guarantees given – – (911) – – – – (911) (298)B. Credit derivatives – – – – – – – – –C. Commitments to disburse funds – – (11) – – – – (11) –D. Other transactions – – – – – – – – –
E. Total – – (922) – – – – (922) (298)

248
“Payroll” includes the costs of employees of other companies who have been seconded to the Bank, net of any recharged costs for the Bank’s employees seconded to other companies. these costs also include provisions for future expenses relating to the employee productivity bonuses, in compliance with iaS which require costs to be classified by “nature” of the expense.
Line 1.i) “other personnel benefits” reports costs associated with redundancy incentives under Law 449/97.
in 2007 line 1.e) “Provision for severance indemnities” included not only the actual provision for the year but also the extraordinary effect of curtailment.
in compliance with recent clarifications by the Supervisory authorities, payments of severance indemnity directly into iNPS are reported in line 1.g) “payments to external supplementary pension funds: defined contribution”. in addition, the fees paid to the statutory auditors have been reclassified to “Payroll” in line 4) “Directors and Statutory auditors”. the corresponding amounts for 2007 have also been reclassified.
9.2 Average number of employees, by level
31/12/2008 31/12/2007
1. Employees 3,447 3,070 a) Managers 73 63 b) Middle managers 1,443 1,281 - of which: 3rd and 4th level 785 693 c) Other employees 1,931 1,726 2. Other personnel 13 12
Total 3,460 3,082
the average number of employees is calculated as the average of those at the start and end of the year.
in compliance with current rules, “Employees” include those of other companies that have been seconded to the Bank and exclude those of the Bank that have been seconded to other compa-nies; “other employees” include staff working under contracts other than permanent employ-ment ones, such as temporary or project contracts.
the increase in the average number of employees is mainly due to the acquisition of 61 branches from the UBi Banca Group, involving the addition of 219 extra staff from 1 January 2008.

249
9.5 Other administrative costs: analysis
31/12/2008 31/12/2007
1. Indirect taxes (40,545) (37,325)2. Non-professional products and services: (56,784) (53,254) 2.1. postage, telephone charges (10,135) (8,762) 2.2. security and valuables transportation (3,623) (3,226) 2.3. electricity, heating and water (3,941) (3,378) 2.4. transport (1,449) (1,146) 2.5. hire of programs and microfiches (777) (564) 2.6. data processing (32,804) (32,468) 2.7. stationery and printing (2,097) (2,078) 2.8. cleaning of premises (1,958) (1,632)3. Professional services: (13,317) (12,100) 3.1. fees paid to professionals (5,315) (5,303) 3.2. legals, survey and search fees (8,002) (6,797)4. Rentals: (27,012) (22,988) 4.1. rent of buildings (26,194) (22,302) 4.2. machine lease installments (818) (686)5. Maintenance of furniture and installations (5,840) (4,361)6. Insurance premiums (1,979) (2,060)7. Other expenses: (33,890) (23,008) 7.1. surveys, searches and subscriptions (4,858) (4,746) 7.2. meal vouchers (3,584) (3,063) 7.3. membership fees (1,216) (1,006) 7.4. advertising and entertainment (10,614) (7,767) 7.5. intercompany service costs (5,793) (7,370) 7.6. other miscellaneous expenses (7,825) (6,426)
Total (179,367) (162,466)

250
SECtiON 10
Net provisions for risks and charges – Line item 160
10.1 Net provisions for risks and charges: analysis
31/12/2008 31/12/2007
a) Provisions for legal disputes and other charges (1,881) (8,979)b) Provision for other risks and charges (13,451) (17,126)
Total (15,332) (26,105)
the provisions for legal disputes cover claims from the liquidators of bankrupt customers and other claims against the Bank.
the provisions for other risks and charges mainly relate to potential costs associated with the effects on customer loans of the current adverse climate on financial markets and the likely nega-tive impact on the Bank in terms of recovering its loans.
SECtiON 11
Net adjustments to property, plant and equipment – Line item 170
11.1 Net adjustments to property, plant and equipment: analysis
assets/income items Depreciation impairment Writebacks Net (a) adjustments resul (b) (c) (a+b-c) a. Property, plant and equipment a.1 Owned (7,456) – – (7,456) – for business purposes (7,456) – – (7,456) – for investment purposes – – – – a.2 Held under finance lease – – – – – for business purposes – – – – – for investment purposes – – – –
Total (7,456) – – (7,456)
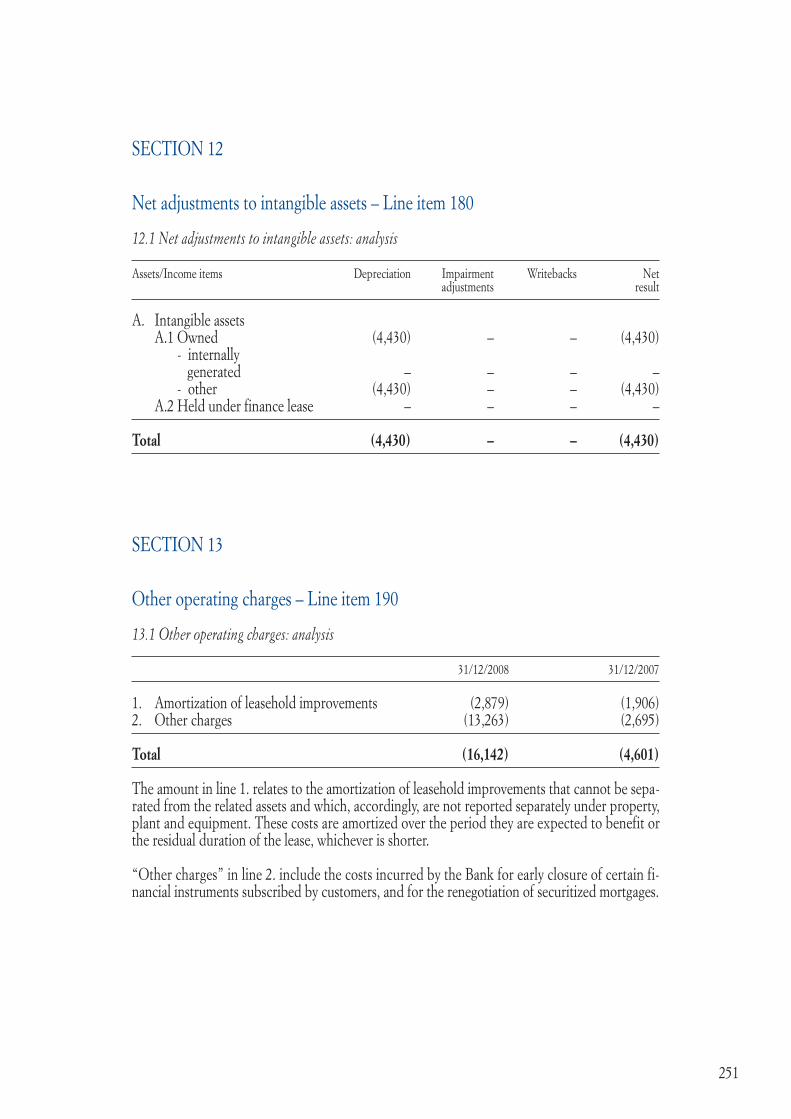
251
SECtiON 12
Net adjustments to intangible assets – Line item 180
12.1 Net adjustments to intangible assets: analysis
assets/income items Depreciation impairment Writebacks Net adjustments result
a. intangible assets a.1 Owned (4,430) – – (4,430) - internally generated – – – – - other (4,430) – – (4,430) a.2 Held under finance lease – – – –
Total (4,430) – – (4,430)
SECtiON 13
Other operating charges – Line item 190
13.1 Other operating charges: analysis
31/12/2008 31/12/2007
1. amortization of leasehold improvements (2,879) (1,906)2. Other charges (13,263) (2,695)
Total (16,142) (4,601)
the amount in line 1. relates to the amortization of leasehold improvements that cannot be sepa-rated from the related assets and which, accordingly, are not reported separately under property, plant and equipment. these costs are amortized over the period they are expected to benefit or the residual duration of the lease, whichever is shorter.
“Other charges” in line 2. include the costs incurred by the Bank for early closure of certain fi-nancial instruments subscribed by customers, and for the renegotiation of securitized mortgages.

252
13.2 Other operating income: analysis
31/12/2008 31/12/2007
1. Expenses recharged to third parties on current and savings accounts 901 1.054 2. Property rental income 227 186 3. recharge of stamp duty and other indirect taxes 25,958 24,050 4. recharge of intercompany service costs 2,903 2,575 5. Other income 12,984 19,075
Total 42,973 46,940
Other income includes Euro 1,716 for the additional return received during the year on junior notes held in relation to the Bank’s own securitizations.
SECtiON 14
Profit (loss) from equity investments – Line item 210
14.1 Profit (loss) from equity investments: analysis
income item/amounts 31/12/2008 31/12/2007
a. income 111,072 43,023 1. revaluations – – 2. Profit from disposals 111,072 43,023 3. Writebacks – – 4. Other positive changes – – B. Charges (14,002) (395) 1. Writedowns – – 2. impairments writedowns (14,002) – 3. Loss from disposals – (395) 4. Other negative changes – –
Net result 97,070 42,628
“Profit from disposals” relate to the sale of interests held in certain equity investments, as discus-sed in asset section 10 of these notes. in detail, they include Euro 111,037 for the gain on the sale of the entire interest in Linea Spa, classified at the end of 2007 in “Non-current assets held for sale”. they also include Euro 35 for the gain realized on the sale of 3% of Servizi Bancari S.c.p.a. to the subsidiaries Banca Nuova (1%), Cassa di risparmio di Prato (1%) and FarBanca (1%).
“impairment writedowns” comprise Euro 10,000 for the impairment of the investment in the su-bsidiary BPV Finance and Euro 4,002 for writing down the investment in the subsidiary Nuova Merchant after its capital was reduced to zero because of losses.
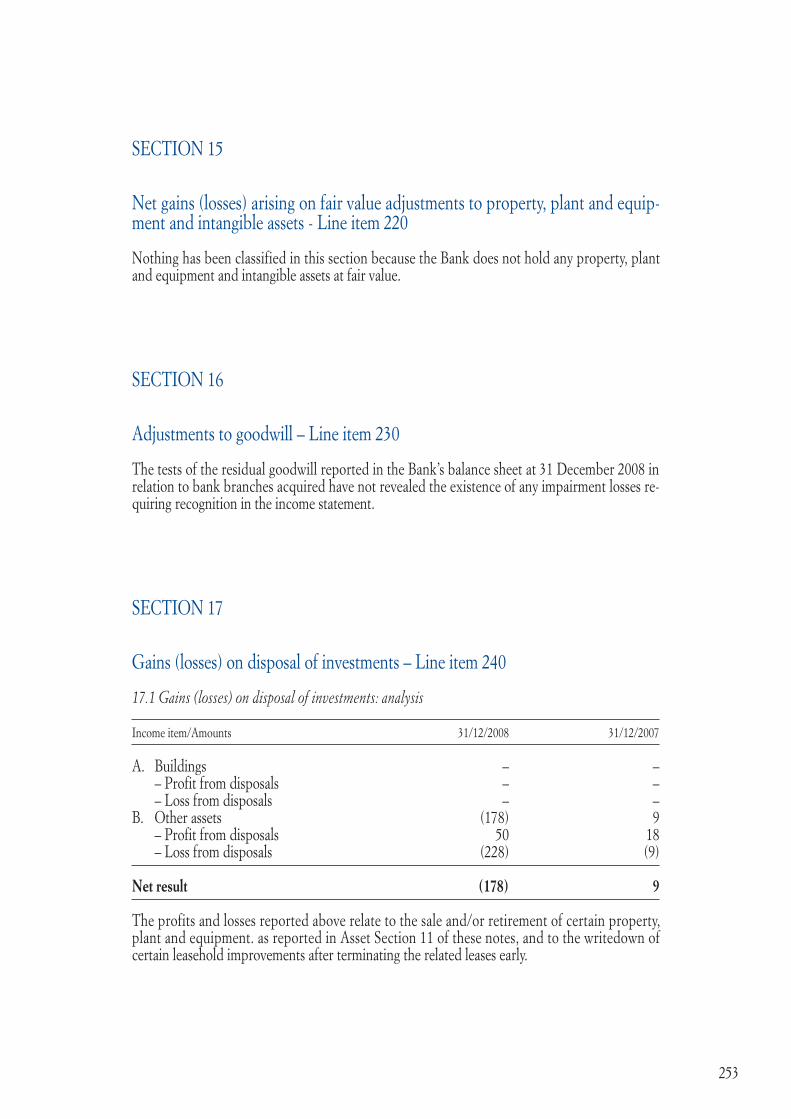
253
SECtiON 15
Net gains (losses) arising on fair value adjustments to property, plant and equip-ment and intangible assets - Line item 220
Nothing has been classified in this section because the Bank does not hold any property, plant and equipment and intangible assets at fair value.
SECtiON 16
adjustments to goodwill – Line item 230
the tests of the residual goodwill reported in the Bank’s balance sheet at 31 December 2008 in relation to bank branches acquired have not revealed the existence of any impairment losses re-quiring recognition in the income statement.
SECtiON 17
Gains (losses) on disposal of investments – Line item 240
17.1 Gains (losses) on disposal of investments: analysis
income item/amounts 31/12/2008 31/12/2007
a. Buildings – – – Profit from disposals – – – Loss from disposals – – B. Other assets (178) 9 – Profit from disposals 50 18 – Loss from disposals (228) (9)
Net result (178) 9
the profits and losses reported above relate to the sale and/or retirement of certain property, plant and equipment. as reported in asset Section 11 of these notes, and to the writedown of certain leasehold improvements after terminating the related leases early.

254
SECtiON 18
income taxes on current operations – Line item 260
18.1 Income taxes on current operations: analysis
income item/amounts 31/12/2008 31/12/2007
1. Current income taxes (–) (30,941) (50,188)2. Change in year income taxes (+/–) 3,200 1,158 3. reduction in current taxes (+) – – 4. Change in deferred tax assets (+/–) 12,201 (4,129)5. Change in deferred tax liabilities (+/–) (23,762) 14,140 6. Income taxes for the year (39,302) (39,019)
Current income taxes include withholding taxes on income from capitalization policies and taxes paid abroad, for a total of Euro 99.
the change in prior period income taxes refers to surplus tax provisions booked in previous years.

255
18.2 Reconciliation between theoretical tax charge and actual tax charge reported in the financial statements
IRES %
Ires with application at nominal rate 52,343 27.50
Disallowable portion of interest expense 5,155 2.71Disallowable writedown and losses on equities 4,956 2.60Disallowable costs 888 0.47Other add-backs 126 0.07
Total tax effect of add-backs 11,125 5.84
Gains and revaluations of exempt equity investments 29,004 15.24Dividends 10,448 5.49Change in prior period income taxes 1,500 0.79Other deductions 1,068 0.56
Total tax effect of deductions 42,020 22.08
Ires recognized in the income statement 21,448 11.27
IRAP %
Irap with application at nominal rate 7,423 3.90
Payroll 7,045 3.70Net adjustments to loans 4,548 2.39Higher rates approved by the regions 3,925 2.06Deferred taxes relating to prior years 1,087 0.57Disallowable costs 1,543 0.81Disallowable provisions 634 0.33Other add-backs 22 0.01
Total tax effect of add-backs 18,804 9.88
Gains on equity investments 3,786 1.99Deferred tax assets relating to prior years 2,096 1.10Change in prior period income taxes 1,700 0.89Dividends 791 0.42
Total tax effect of deductions 8,373 4.40
Ires recognized in the income statement 17,854 9.38

256
SECtiON 19
Profit (loss) from disposal groups, net of tax - Line item 280
Nothing has been classified in this section.
SECtiON 20
Other information
1. Amounts collected on behalf of third parties: debit and credit adjustments
31/12/2008 31/12/2007
a) Debit adjustments 3,157,320 2,760,086 1. Current accounts 10,881 9,692 2. Central portfolio 3,125,151 2,737,417 3. Cash 21,288 12,977 4. Other accounts - - b) Credit adjustments 3,350,025 2,892,197 1. Current accounts 6,922 5,379 2. transferors of notes and documents 3,323,537 2,872,728 3. Other accounts 19,566 14,090
the difference between the “debit” and “credit” adjustments during the year is classified in line item 100 “Other liabilities”.

257
SECtiON 21
Earnings per share
Basis earnings per share and diluted earnings per share are reported below, as required by para. 70.b) of iaS 33.
Basic earnings per share is determined by dividing the results attributable to the holders of the Bank’s ordinary equity instruments (the numerator) by the weighted average number of ordinary shares outstanding during the year (the denominator).
Diluted earnings per share is determined by adjusting both the results attributable to the holders of the Bank’s ordinary equity instruments and the weighted average number of shares outstan-ding to take account of any dilutive effects associated with the convertible bond issued during the prior year.
31/12/2008 31/12/2007
Earnings per share (basic) 2.179 1.630 Earnings per share (diluted) 2.165 1.633
21.1 Average number of ordinary shares on dilution of share capital
31/12/2008 31/12/2007
Weighted average number of ordinary shares 69,305,047 67,545,273 Dilution adjustment 3,996,305 1,691,987 Weighted average number of ordinary shares(fully dilutes) 73,301,352 69,237,260
in order to determine the basic earnings per share, the weighted average number of ordinary shares outstanding is calculated with reference to the number of ordinary shares outstanding at the start of the year, as adjusted by the number of ordinary shares cancelled or issued during the year multiplied by the number of days such shares were in circulation in proportion to the total number of days in the year. treasury shares are not included in the total number of shares outstanding.
in order to determine the diluted earnings per share, the weighted average number of ordinary shares outstanding is increased by the weighted average number of additional ordinary shares that would have been outstanding had all potential ordinary shares with a dilutive effect been converted. the potential ordinary shares with a dilutive effect, calculated on the basis of the conversion ratio established by the regulations of the convertible bond issued in the year, were treated as if they had been converted into ordinary shares on the bond issue date (31 July 2007).
21.2 Other information
Since there are no preference shares, the results attributable to the holders of ordinary equity instruments coincide with net income for the year.

258
Part DSEGMENt iNFOrMatiON
Under the Bank of italy’s Circular no. 262 of 22 December 2005, the completion of this section is optional for unlisted banks; accordingly it has not been completed, also in view of the fact that these disclosures have been provided in the 2008 consolidated financial statements of the Banca Popolare di Vicenza Group.
259
Part EINFOrMatION ON rISKS aND rELatED HEDGING POLICY
SECtION 1
Credit risk
QUaLItatIVE INFOrMatION
1. General aspects
Credit risk is the risk of losses due to non-performance by the counterparty (specifically the obli-gation to repay loans) or, more broadly, the failure of customers or their guarantors to meet their obligations.Credit risk also usually includes “Country risk”, being the risk that public and private borrowers in a country might be affected by the political, economic and financial situation there. In such cases, the failure to meet their obligations may depend on external factors beyond their control (political and economic risks, currency controls etc.) that relate to the country in which they are resident.Lending by the Bank has always aimed to support both the borrowing needs of households and the development and consolidation of businesses, especially small and medium-sized firms, whi-ch typify the local economies where the Bank operates. In keeping with prior years, the lending policy adopted in 2008 sought to respond to the needs of individuals and firms, while paying particular attention to the difficult economic situation, credit risk and an adequate level of guarantees.
With reference to private customers, the development of activities focused on the longer-term segment with the granting and/or renegotiation of home mortgages and personal loans either directly via the Bank or via other companies.
Development activities in relation to small businesses have mainly focused on short-term len-ding, where the risk is spread widely, using technical forms that are supported by underwriting syndicates wherever possible. Medium-term lending has been expanded in relation to medium and large businesses, with a special focus on those with secured guarantees. In all cases, special care has been taken in the selection of economic sectors from which borrowers come, in order to give preference to lower risk activities. Sector analysis has become increasingly important in the credit management process and involves the examination of internal data and external data provided by specialist Italian companies, in order to maximize their significance in view of the characteristics of the Bank and areas in which it operates.
the Bank is not active in the field of credit derivatives.
2. Credit risk management policies
2.1 Organizational aspects
the change in the regulatory context and in the supervisory instructions regarding risk manage-ment, along with the size of the Parent Bank and its banking subsidiaries, have created the cir-cumstances for revising the approach and methods used for managing loans and non-performing positions. During the year the Board of Directors therefore initiated a project to reorganize its head of-fice functions devoted to non-performing loans. With the goal of standardizing loan manage-ment and controlling it better (from the loan proposal to management of disputed positions), the Loans Division has been created under the responsibility of a manager, appointed by board

260
resolution and who reports directly to the General Manager. the following three departments report to the Loans Division:
– Ordinary Loans Department, which maintains effective control over the quality of credit di-sbursed, assures the review and evaluation stage of loan applications, ensuring compliance with internal and external rules, and defines Credit Policies for the network both at the gran-ting/renewal stage and credit management stage.
– Loan administration and Finalization Department, which oversees and/or supports the mana-gement, finalization and checking of guarantees received and of lending operations, ensuring compliance with internal and external rules; this department is also responsible for checking and implementing data for the purposes of reporting risks.
– anomalous Loans Department, which monitors anomalous positions, manages disputed po-sitions and the recovery process1, protects and safeguards the Bank’s loans, taking the most appropriate, beneficial actions in the Bank’s interests.
the unification of disputed, watchlist and anomalous loans in a single division is fundamentally important because it gives rise to important synergies in the management of problem loans.For the purpose of spreading credit risk management policies throughout the network, the re-view and evaluation of loan applications under the responsibility of the network’s approving bodies has been decentralized into organizational units (area Loans Units) which report to the Ordinary Loans Department but are based in the various area offices. the heads of such units, assuming their independence of judgement and absence of interests/involvement in commercial objective, have also been granted specific powers to grant and manage credit.
With regard to the Basel II project, rating models have been implemented and put into opera-tion for retail counterparties (individuals and small firms) and for small corporate counterparties (from Euro 2.5 to 50 million in turnover) and mid corporate counterparties (from Euro 50 to 200 million in turnover).
the rating model for corporate counterparties with turnover in excess of Euro 200 million is at an advanced stage of implementation.
2.2 Management, measurement and monitoring systems
the lending process is organized as follows:
– the granting of loans involves: investigation, assessment, decision, formalization of the loan and any guarantees;
– the management of loans involves: way utilized, monitoring, review of facility, management of anomalies;
– Management of non-performing loans and recovery of loans.
the first and most important step in the measurement and management of risk is taken when loans are granted.
1 Previously carried out by the Legal, General affairs and Disputes Department.

261
the Bank’s regulations for the management of lending, contained in its Credit Manual, require a prudent approach to the assessment of risk. the documentation needed to make an adequate assessment of a borrower’s credit and the proposed structure of loan, with particular attention to the medium/long-term feasibility of projects financed, must be obtained by bank officials at the preliminary stage of the loan process. Credit-worthiness is also assessed on the basis of all the relationships that the borrower, and its related economic group, has with the BPVi Group. On the other hand, pricing and/or income from the relationship cannot be a factor when evaluating credit-worthiness and agreeing a loan.account managers monitor and administer loans day by day and are responsible for their gran-ting.
the investigation process depends on the type of customer concerned. For individual and small businesses, the granting or otherwise of the facility requested is dealt with at branch or area level for relatively small amounts. this follows a simplified process using an internal scoring system, which is an It tool that checks credit-worthiness at the time new lines of credit are granted, using both internal and external sources of information. For better control over the process of granting credit to individual customers, stricter limits have been introduced on decision-making powers, identified on the basis of the risk profile attributed to the counterparty by the internal scoring system.
the granting of loans to companies/entities follows a more complex process, which is the re-sponsibility of account managers, up to their authorization limits, and the central departments for larger amounts. Proposed lending to such customers must be supported by a technical opi-nion from the Ordinary Loans Department, presented by its Organizational Units.
the credit limit attributable to economic groups or individual counterparties that are not banks or do not belong to a banking group is indicatively Euro 60 million.However, risk is split so that the credit granted to economic groups or individual counterparties, as stated above (for facilities in excess of Euro 60 million), is kept within a maximum limit of 12% of the total loans granted.the risk-management system (SGr) plays an important role in the monitoring and management of credit risk, allowing account managers to check on changes in the credit status of customers and quickly identify any deterioration in the standing of borrowers.as required by the Supervisory Instructions (Part IV, Chapter 11, Section II), suitable systems for the identification, measurement and control of risks have been adopted in order to manage lending in a proper and prudent manner.
Controls form an integral part of the daily activities of the Bank. there are four types:– Functional controls: these are performed at organizational level (e.g. hierarchical controls) or
are built into procedures or carried out as part of back-office work;– Risk-management controls: these contribute to defining the ways in which risk is measured,
check compliance with the limits established for the various functions and monitor the consi-stency of operations. these controls are performed by functions without operational respon-sibilities;
– Internal revision: the purpose of this activity is to reassess the credit rating of individual bor-rowers, at predetermined intervals.
– Inspections: these are carried out by the audit function both on-site and on a remote basis, in order to verify the quality of loans and the support for decisions taken by the functions responsible for granting and administering loans.

262
Partly as a result of the reorganization at head office, the Loans Division, assisted by the other competent divisions/departments, has taken a number of steps to revise and improve internal credit management processes.
Some of the more projects started in 2009, which will be completed in the first quarter of 2008, include:
– the introduction of specific Credit Policies for governing the way in which the Bank means to assume credit risk with customers, by fostering balanced growth in loans to counterparties with higher “credit ratings” and regulating/limiting the grant of credit to riskier customers;
– the revision of authorization levels, differentiating them on the basis of counterparty risk;– the revision of the loan performance monitoring system with the goal of obtaining early war-
ning of any deterioration.
During the year the process of automatically renewing credit facilities was refined by requiring the position’s manager to authorize such renewals.
In compliance with the Bank of Italy’s instructions relating to Basel 2 and “groups of connected customers”, the Bank introduced a number of changes relating to the management of economic groups for increasing the level of objectivity and process repetition regarding their composition.
2.3. Credit risk mitigation techniques
the credit risk associated with individual counterparties or groups is mitigated by obtaining security (pledges, mortgages and special privileges) and/or personal guarantees (sureties, endor-sements, credit mandates and letters of patronage). the degree of mitigation attributed to each guarantee is governed by specific regulations that take account of the varying nature of the guarantees obtained.
Unsecured guarantees are obtained only after assessing the suitability of the guarantor’s assets and rating.
2.4 Impaired financial assets
the main tool used to identify “anomalous” loans is the SGr procedure (Sistemi Gestione rischi or risk Management System) which provides a “performance score”. In the first half of 2009 this procedure will interface with the new Early Warning monitoring system, developed to make the identification of signs of deterioration more efficient and precise.
anomalous loans not classified as non-performing are monitored not only by the commercial network but also by specific organizational structures, whose mission is to “prevent default”. these structures consist of staff both in the head office and in the area offices into which the Bank’s sales network is organized.
account managers are required to adopt an operational approach that is geared to eliminating anomalies and limiting risks. In particular, as regards “watchlist” loans, this approach is designed to prevent the emergence of disputed positions, through gradual friendly recovery or, at least, miti-gation of any negative effects in the event of default.
the classification of loans as “non-performing” is based on the criteria laid down in the supervi-sory regulations. accordingly, this category comprises loans to parties that are insolvent or in simi-

263
lar circumstances, even if not confirmed by a judge, the recovery of which is the subject of court action or other suitable measures.
the “Non-performing loans, recovery and disputed loans” unit is responsible for the management of non-performing loans and the recovery of loans and reports to the anomalous Loans Depart-ment forming part of the Loans Division.
recovery activities are carried out on a pro-active basis, with a view to optimizing the legal proce-dures and maximizing the outcome in economic and financial terms. In particular, when evaluating the steps to take, internal lawyers prefer to take out-of-court action with recourse to settlements that accelerate recoveries and contain the level of costs incurred. Where this route is not appli-cable, and especially with regard to larger amounts and when greater recoveries can be expected, external lawyers are instructed to take legal action since this represents both a method of putting legitimate pressure on the debtor and a way to resolve disputes.
Small loans that are uncollectible or difficult to collect are generally grouped together and sold without recourse, given that legal action would be uneconomic in cost/benefit terms.
For financial reporting purposes, non-performing loans are analyzed on a case-by-case basis to determine the provisions required to cover expected losses. the extent of the loss expected from each relationship is determined with reference to the solvency of the debtor, the nature and value of the guarantees obtained and the progress made by recovery procedures. Estimates are made on a prudent basis and adopting discounting criteria, as required by accounting standards. this com-plex evaluation process is assisted by the subdivision of the loan portfolio into similar categories and year of origin, taking account of the realizable value of the personal and/or corporate assets of the debtor and the guarantors.
Lastly, the proper performance of the task of administering and evaluating non-performing loans is assured by both periodic internal audit checks and by external verification activities, carried out by the Board of Statutory auditors and the independent auditors.Since the start of 2009 the administrative management of non-performing loans has been suppor-ted by computerized procedures, allowing a gradual move away from much of the previous pape-rwork and ultimately being able to provide an immediate overview of the same.

264
QUaNtItatIVE INFOrMatION
a. CrEDIt QUaLItY
a.1 IMPaIrED aND PErFOrMING EXPOSUrES: SIZE, aDJUStMENtS, trENDS, ECONOMIC aND tErrItOrIaL DIStrIBUtION
a.1.1 Distribution of financial assets by portfolio and credit quality (book values)
Portfolio/Quality Non-performing Watchlist restructured Past due Country Other Total risk assets 1. Financial assets held for trading 6 3,687 – 1,344 – 699,668 704,705 2. Financial assets available for sale – – – – – 344,924 344,924 3. Financial assets held to maturity – – – – – – –4. Loans and advances to banks – 911 – – – 3,153,001 3,153,912 5. Loans and advances to customers 221,413 250,438 17,646 71,311 – 15,456,814 16,017,622 6. Financial assets at fair value – – – – – 17,077 17,077 7. Financial assets begin sold – – – – – – –8. Hedging derivatives – – – – – – –
Total at 31/12/2008 221,419 255,036 17,646 72,655 – 19,671,484 20,238,240
Total at 31/12/2007 220,498 187,867 31,663 62,043 8,112 18,598,141 19,108,324

265
A.1.2 Distribution of financial assets by portfolio and credit quality (gross and net values)
A.1.3 Cash and off-balance sheet exposures to banks: gross and net values
type of exposure/amounts Gross Specific Portfolio Net exposure adjustments adjustments exposure
A. CASH EXPOSURE a) Non-performing loans – – – –b) Watchlist loans 1,208 (297) – 911 c) restructured exposures – – – –d) Past due exposures – – – –e) Country risk – x – –f) Other assets 3,266,000 x – 3,266,000
TOTAL A 3,267,208 (297) – 3,266,911
B. OFF-BALANCE SHEET EXPOSURES a) Impaired assets – – – –b) Other 776,623 x – 776,623
TOTAL B 776,623 – – 776,623
Portfolio/Quality Impaired assets Other assets Total Gross Specific Portfolio Net Gross Portfolio Net (Net exposure adjustments adjustments exposure exposure adjustments exposure exposure) 1. Financial assets held for trading 5,652 (615) – 5,037 x x 699,668 704,705 2. Financial assets available for sale – – – – 344,924 – 344,924 344,924 3. Financial assets held to maturity – – – – – – – –4. Loans and advances to banks 1,208 (297) – 911 3,153,001 – 3,153,001 3,153,912 5. Loans and advances to customers 856,515 (295,707) – 560,808 15,525,972 (69,158) 15,456,814 16,017,622 6. Financial assets at fair value – – – – x x 17,077 17,077 7. Financial assets begin sold – – – – – – – –8. Hedging derivatives – – – – – – – –
Total at 31/12/2008 863,375 (296,619) – 566,756 19,023,897 (69,158) 19,671,484 20,238,240
Total at 31/12/2007 734,454 (203,844) (28,539) 502,071 17,866,214 (78,336) 18,606,253 19,108,324

266
A.1.4 Cash exposures to banks: changes in gross impaired loans and loans subject to “country risk”
Objects/Categories Non-performing Watchlist restructured Past due Country risk
A. Opening gross exposure – – – – 5,353 -of which: sold but not derecognized – – – – –
B. Increases – 1,208 – – –B.1 transfers from performing loans 1,208 – – –B.2 transfer from other categories of impaired exposure – – – – –B.3 Other increases – – – –C. Decreases – – – – 5,353 C.1 transfer to performing loans – – – – –C.2 Write-offs – – – – –C.3 Collections – – – – –C.4 Proceed from disposals – – – – –C.5 transfers to other categories of impaired exposure – – – – –C.6 Other decreases – – – – 5,353
D. Closing gross exposure – 1,208 – – – -of which: sold but not derecognized – – – – –
A.1.5 Cash exposures to banks: changes in total writedowns
Objects/Categories Non-performing Watchlist restructured Past due Country risk
A. Opening total exposure – – – – – -of which: sold but not derecognized – – – – –
B. Increases – 297 – – –B.1 adjustments – 297 – – –B.2 transfer from other categories of impaired exposure – – – – –B.3 other increases – – – – –C. Decreases – – – – –C.1 writebacks from valuations – – – – –C.2 writebacks of collections – – – – –C.3 write-offs – – – – –C.4 transfers to other categories of impaired exposure – – – – –C.5 other decreases – – – – –
D. Total closing adjustments – 297 – – – -of which: sold but not derecognized – – – – –

267
A.1.6 Cash and off-balance sheet exposures to customers: gross and net values
type of exposure/amounts Gross Specific Portfolio Net exposure adjustments adjustments exposure
A. CASH EXPOSURE a) Non-performing loans 441,205 (219,792) – 221,413 b) Watchlist loans 323,112 (72,674) – 250,438 c) restructured exposures 17,646 – – 17,646 d) Past due exposures 74,552 (3,241) – 71,311 e) Country risk – x – –f) Other assets 15,808,087 x (69,158) 15,738,929
TOTAL A 16,664,602 (295,707) (69,158) 16,299,737
B. OFF-BALANCE SHEET EXPOSURES a) Impaired assets 32,340 (615) – 31,725 b) Other 4,931,684 x – 4,931,684
TOTAL B 4,964,024 (615) – 4,963,409
A.1.7 Cash exposures to customers: changes in gross impaired loans and loans subject to “country risk”
Objects/Categories Non-performing Watchlist restructured Past due Country risk
A. Opening gross exposure 383,106 251,330 32,639 63,004 2,759 -of which: sold but not derecognized 20,702 33,874 – – –
B. Increases 247,042 427,201 25,014 74,988 –B.1 transfers from performing loans 12,576 367,992 – 74,781 –B.2 transfer from other categories of impaired exposure 203,085 44,725 17,510 – –B.3 Other increases 31,381 14,484 7,504 207 –C. Decreases 188,943 355,419 40,007 63,440 2,759 C.1 transfer to performing loans – 68,370 – 26,584 –C.2 Write-offs 54,464 5,032 – 161 –C.3 Collections 133,632 83,946 – 1,213 –C.4 Proceed from disposals 845 3,398 – – –C.5 transfers to other categories of impaired exposure – 194,099 35,739 35,482 –C.6 Other decreases 2 574 4,268 – 2,759
D. Closing gross exposure 441,205 323,112 17,646 74,552 – -of which: sold but not derecognized 48,387 45,307 – – –

268
A.1.8 Cash exposures to customers: changes in total writedowns
Objects/Categories Non-performing Watchlist restructured Past due Country risk
A. Opening opening adjustments 162,621 65,163 976 3,056 – -of which: sold but not derecognized 6,763 2,207 – – –
B. Increases 146,299 51,602 – 1,184 –B.1 adjustments 91,392 50,626 – 960 –B.2 transfer from other categories of impaired exposure 20,392 976 – 224 –B.3 Other increases 34,515 – – – –C. Decreases 89,128 44,091 976 999 –C.1 Write-backs on valuation 31,151 17,494 – – –C.2 Write-backs due to collections 3,513 543 – – –C.3 Write-offs 54,464 5,032 – 161 –C.4 transfers to other categories of impaired exposure – 19,778 976 838 –C.5 Other decreases – 1,244 – – –
D. Total closing adjustments 219,792 72,674 – 3,241 – -of which: sold but not derecognized 19,777 7,549 – – –

269
a.2 CLaSSIFICatION OF EXPOSUrES BaSED ON EXtErNaL aND INtErNaL ratINGS
A.2.1 Distribution of cash and “off-balance sheet” exposures by external rating class
this table is not provided given the modest value of exposures with an “external rating”.
A.2.2 Distribution of cash and “off-balance sheet” exposures by internal rating class
the new rating systems for granting and renewing credit have not yet been applied to all the cu-stomers. accordingly, this table has not been provided.

270
a.3 DIStrIBUtION OF GUaraNtEED EXPOSUrES BY tYPE OF GUaraNtEE
A.3.1 Guaranteed cash exposures to banks and customers
A.3.2 Guaranteed “off-balance sheet” exposures to banks and customers
Amount of Secured guarantees Unsecured guarantees Total exposure (1) (2) (1)+(2) Buildings Securities Other Credit derivatives Guarantees assets Governments Other public Banks Other Governments Other public Banks Other entities parties entities parties 1. Guaranteed exposure to banks: 25,856 – – – – – – – – – – 25,856 25,856 1.1 fully guaranteed 25,856 – – – – – – – – – – 25,856 25,856 1.2 partially guaranteed – – – – – – – – – – – – –
2. Guaranteed exposure to customer: 8,633,736 5,590,616 346,428 132,196 – – – – – 8,210 91,398 2,046,184 8,215,032 2.1 fully guaranteed 7,808,221 5,543,125 278,770 74,803 – – – – – 3,072 39,424 1,869,027 7,808,221 2.2 partially guaranteed 825,515 47,491 67,658 57,393 – – – – – 5,138 51,974 177,157 406,811
Amount of Secured guarantees Unsecured guarantees Total exposure (1) (2) (1)+(2) Buildings Securities Other Credit derivatives Guarantees assets Governments Other public Banks Other Governments Other public Banks Other entities parties entities parties 1. Guaranteed exposure to banks: 8,827 – – – – – – – 8,825 – 2 – 8,827 1.1 fully guaranteed 8,827 – – – – – – – 8,825 – 2 – 8,827 1.2 partially guaranteed – – – – – – – – – – – – –
2. Guaranteed exposure to customer: 568,572 8,838 22,463 33,954 – – – – – – 2,678 358,939 426,872 2.1 fully guaranteed 319,218 7,277 11,893 25,927 – – – – – – 1,074 273,047 319,218 2.2 partially guaranteed 249,354 1,561 10,570 8,027 – – – – – – 1,604 85,892 107,654

271
Amount of Secured guarantees Unsecured guarantees Total exposure (1) (2) (1)+(2) Buildings Securities Other Credit derivatives Guarantees assets Governments Other public Banks Other Governments Other public Banks Other entities parties entities parties 1. Guaranteed exposure to banks: 25,856 – – – – – – – – – – 25,856 25,856 1.1 fully guaranteed 25,856 – – – – – – – – – – 25,856 25,856 1.2 partially guaranteed – – – – – – – – – – – – –
2. Guaranteed exposure to customer: 8,633,736 5,590,616 346,428 132,196 – – – – – 8,210 91,398 2,046,184 8,215,032 2.1 fully guaranteed 7,808,221 5,543,125 278,770 74,803 – – – – – 3,072 39,424 1,869,027 7,808,221 2.2 partially guaranteed 825,515 47,491 67,658 57,393 – – – – – 5,138 51,974 177,157 406,811
Amount of Secured guarantees Unsecured guarantees Total exposure (1) (2) (1)+(2) Buildings Securities Other Credit derivatives Guarantees assets Governments Other public Banks Other Governments Other public Banks Other entities parties entities parties 1. Guaranteed exposure to banks: 8,827 – – – – – – – 8,825 – 2 – 8,827 1.1 fully guaranteed 8,827 – – – – – – – 8,825 – 2 – 8,827 1.2 partially guaranteed – – – – – – – – – – – – –
2. Guaranteed exposure to customer: 568,572 8,838 22,463 33,954 – – – – – – 2,678 358,939 426,872 2.1 fully guaranteed 319,218 7,277 11,893 25,927 – – – – – – 1,074 273,047 319,218 2.2 partially guaranteed 249,354 1,561 10,570 8,027 – – – – – – 1,604 85,892 107,654

272
A.3.3 Guaranteed impaired cash exposures to banks and customers
Guarantees (fair value) Total Excess Unsecured guarantees fair value, Credit derivatives guarantee Governments Other Banks Financial Insurance Non- Other and central public companies companies financial parties banks entities institutions
1. Guarantee exposures to banks: – – – – – – – – – 1.1 150% or more – – – – – – – – – 1.2 between 100% and 150% – – – – – – – – – 1.3 between 50% and 100% – – – – – – – – – 1.4 up to 50% – – – – – – – – –
2. Guarantee exposures to customers: – 928 1,670 839 1,410 19,499 76,144 368,930 – 2.1 150% or more – 752 835 419 1,090 15,335 – 136,576 – 2.2 between 100% and 150% – – 204 74 – 1,809 5,112 91,645 – 2.3 between 50% and 100% – – 59 – – 1,630 67,482 128,500 – 2.4 up to 50% – 176 572 346 320 725 3,550 12,209 –
Amount of Amount Guarantees (fair value) exposure guaranteed Secured guarantees Unsecured guarantees Buildings Securities Other Credit derivatives assets Governments Other Banks Financial Insurance Non- Other and central public companies companies financial issues banks entities institutions 1. Guarantee exposures to banks: – – – – – – – – – – – – 1.1 150% or more – – – – – – – – – – – – 1.2 between 100% and 150% – – – – – – – – – – – – 1.3 between 50% and 100% – – – – – – – – – – – – 1.4 up to 50% – – – – – – – – – – – –
2. Guarantee exposures to customers: 384,296 368,930 257,349 951 10,140 – – – – – – – 2.1 150% or more 136,576 136,576 116,775 363 1,007 – – – – – – – 2.2 between 100% and 150% 91,645 91,645 83,715 78 653 – – – – – – – 2.3 between 50% and 100% 130,478 128,500 53,808 328 5,193 – – – – – – – 2.4 up to 50% 25,597 12,209 3,051 182 3,287 – – – – – – –
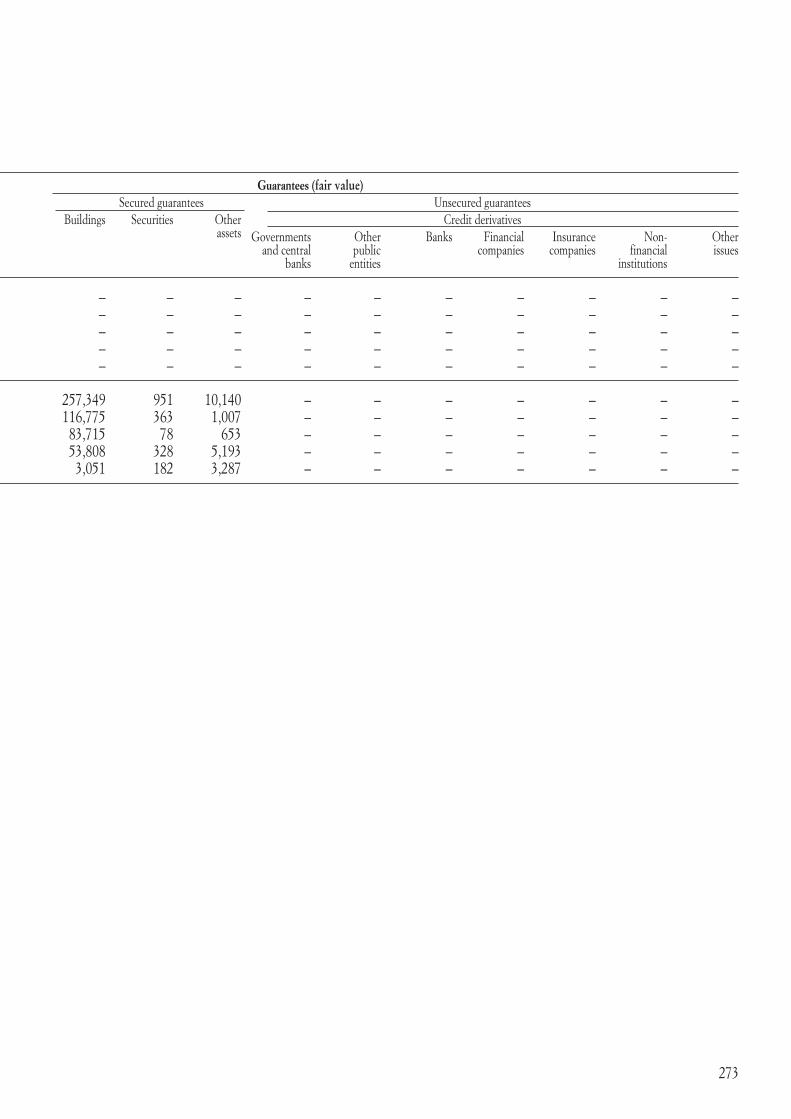
273
Amount of Amount Guarantees (fair value) exposure guaranteed Secured guarantees Unsecured guarantees Buildings Securities Other Credit derivatives assets Governments Other Banks Financial Insurance Non- Other and central public companies companies financial issues banks entities institutions 1. Guarantee exposures to banks: – – – – – – – – – – – – 1.1 150% or more – – – – – – – – – – – – 1.2 between 100% and 150% – – – – – – – – – – – – 1.3 between 50% and 100% – – – – – – – – – – – – 1.4 up to 50% – – – – – – – – – – – –
2. Guarantee exposures to customers: 384,296 368,930 257,349 951 10,140 – – – – – – – 2.1 150% or more 136,576 136,576 116,775 363 1,007 – – – – – – – 2.2 between 100% and 150% 91,645 91,645 83,715 78 653 – – – – – – – 2.3 between 50% and 100% 130,478 128,500 53,808 328 5,193 – – – – – – – 2.4 up to 50% 25,597 12,209 3,051 182 3,287 – – – – – – –

274
A.3.4 Guaranteed impaired “off-balance sheet” exposures to banks and customers
Guarantees (fair value) Total Excess Unsecured guarantees fair value, Credit derivatives guarantee Governments Other Banks Financial Insurance Non- Other and central public companies companies financial parties banks entities institutions
1. Guarantee exposures to banks: – – – – – – – – – 1.1 150% or more – – – – – – – – – 1.2 between 100% and 150% – – – – – – – – – 1.3 between 50% and 100% – – – – – – – – – 1.4 up to 50% – – – – – – – – –
2. Guarantee exposures to customers: – – 80 – – 194 3,864 5,933 – 2.1 150% or more – – – – – 5 18 92 – 2.2 between 100% and 150% – – 80 – – 81 – 337 – 2.3 between 50% and 100% – – – – – 21 3,115 4,674 – 2.4 up to 50% – – – – – 87 731 830 –
Amount of Amount Guarantees (fair value) exposure guaranteed Secured guarantees Unsecured guarantees Buildings Securities Other Credit derivatives assets Governments Other Banks Financial Insurance Non- Other and central public companies companies financial issues banks entities institutions 1. Guarantee exposures to banks: – – – – – – – – – – – – 1.1 150% or more – – – – – – – – – – – – 1.2 between 100% and 150% – – – – – – – – – – – – 1.3 between 50% and 100% – – – – – – – – – – – – 1.4 up to 50% – – – – – – – – – – – –
2. Guarantee exposures to customers: 9,390 5,933 – 123 1,672 – – – – – – – 2.1 150% or more 92 92 – 44 25 – – – – – – – 2.2 between 100% and 150% 337 337 – 13 163 – – – – – – – 2.3 tra il 50% e il 100% 7,298 4,674 – 54 1,484 – – – – – – – 2.4 up to 50% 1,663 830 – 12 – – – – – – – –

275
Amount of Amount Guarantees (fair value) exposure guaranteed Secured guarantees Unsecured guarantees Buildings Securities Other Credit derivatives assets Governments Other Banks Financial Insurance Non- Other and central public companies companies financial issues banks entities institutions 1. Guarantee exposures to banks: – – – – – – – – – – – – 1.1 150% or more – – – – – – – – – – – – 1.2 between 100% and 150% – – – – – – – – – – – – 1.3 between 50% and 100% – – – – – – – – – – – – 1.4 up to 50% – – – – – – – – – – – –
2. Guarantee exposures to customers: 9,390 5,933 – 123 1,672 – – – – – – – 2.1 150% or more 92 92 – 44 25 – – – – – – – 2.2 between 100% and 150% 337 337 – 13 163 – – – – – – – 2.3 tra il 50% e il 100% 7,298 4,674 – 54 1,484 – – – – – – – 2.4 up to 50% 1,663 830 – 12 – – – – – – – –

276
B. DIStrIBUtION aND CONCENtratION OF CrEDIt
B.1 Distribution by sector of cash and “off-balance sheet” exposures to customers
Exposures/Counterparties Governments and central banks Other public entities Financial companies Gross Specific Portfolio Net Gross Specific Portfolio Net Gross Specific Portfolio Net exposure adjustments adjustments exposure exposure adjustments adjustments exposure exposure adjustments adjustments exposure
A. Cash exposure a.1 Non-performing loans – – – – – – – – 963 (794) – 169 a.2 Watchlist loans – – – – – – – – – – – – a.3 restructured exposures – – – – – – – – – – – – a.4 Past due exposures – – – – – – – – 2 – – 2 a.5 Other exposures 39,157 – – 39,157 12,177 – – 12,177 1,182,136 – (2,740) 1,179,396
Total 39,157 – – 39,157 12,177 – – 12,177 1,183,101 (794) (2,740) 1,179,567
B. “Off-balance sheet” exposures a.1 Non-performing loans – – – – – – – – 2 – – 2 a.2 Watchlist loans – – – – – – – – – – – – a.3 Other impaired assets – – – – – – – – – – – – a.4 Other exposures 55,423 – – 55,423 26,110 – – 26,110 739,369 – – 739,369
Total 55,423 – – 55,423 26,110 – – 26,110 739,371 – – 739,371
Total at 31/12/2008 94,580 – – 94,580 38,287 – – 38,287 1,922,472 (794) (2,740) 1,918,938
Total at 31/12/2007 120,883 – – 120,883 18,590 – (9) 18,581 2,513,054 (912) (6,385) 2,505,757
Exposures/Counterparties Insurance companies Non-financial institutions Other parties Gross Specific Portfolio Net Gross Specific Portfolio Net Gross Specific Portfolio Net exposure adjustments adjustments exposure exposure adjustments adjustments exposure exposure adjustments adjustments exposure
A. Cash exposure a.1 Non-performing loans – – – – 257,706 (136,066) – 121,640 182,536 (82,932) – 99,604 a.2 Watchlist loans – – – – 214,268 (43,099) – 171,169 108,844 (29,575) – 79,269 a.3 restructured exposures – – – – 17,646 – – 17,646 – – – – a.4 Past due exposures – – – – 39,762 (1,838) – 37,924 34,788 (1,403) – 33,385 a.5 Other exposures 23,185 – – 23,185 9,953,240 – (52,265) 9,900,975 4,598,192 – (14,153) 4,584,039
Total 23,185 – – 23,185 10,482,622 (181,003) (52,265) 10,249,354 4,924,360 (113,910) (14,153) 4,796,297
B. “Off-balance sheet” exposures a.1 Non-performing loans – – – – 13 (7) – 6 21 – – 21 a.2 Watchlist loans – – – – 4,270 (583) – 3,687 4,326 – – 4,326 a.3 Other impaired assets – – – – 1,369 (25) – 1,344 22,339 – – 22,339 a.4 Other exposures 20,627 – – 20,627 2,535,038 – – 2,535,038 1,555,117 – – 1,555,117
Total 20,627 – – 20,627 2,540,690 (615) – 2,540,075 1,581,803 – – 1,581,803
Total at 31/12/2008 43,812 – – 43,812 13,023,312 (181,618) (52,265) 12,789,429 6,506,163 (113,910) (14,153) 6,378,100
Total at 31/12/2007 263,652 – (5) 263,647 11,403,055 (146,538) (74,183) 11,182,334 6,099,523 (56,394) (26,293) 6,016,836

277
Exposures/Counterparties Governments and central banks Other public entities Financial companies Gross Specific Portfolio Net Gross Specific Portfolio Net Gross Specific Portfolio Net exposure adjustments adjustments exposure exposure adjustments adjustments exposure exposure adjustments adjustments exposure
A. Cash exposure a.1 Non-performing loans – – – – – – – – 963 (794) – 169 a.2 Watchlist loans – – – – – – – – – – – – a.3 restructured exposures – – – – – – – – – – – – a.4 Past due exposures – – – – – – – – 2 – – 2 a.5 Other exposures 39,157 – – 39,157 12,177 – – 12,177 1,182,136 – (2,740) 1,179,396
Total 39,157 – – 39,157 12,177 – – 12,177 1,183,101 (794) (2,740) 1,179,567
B. “Off-balance sheet” exposures a.1 Non-performing loans – – – – – – – – 2 – – 2 a.2 Watchlist loans – – – – – – – – – – – – a.3 Other impaired assets – – – – – – – – – – – – a.4 Other exposures 55,423 – – 55,423 26,110 – – 26,110 739,369 – – 739,369
Total 55,423 – – 55,423 26,110 – – 26,110 739,371 – – 739,371
Total at 31/12/2008 94,580 – – 94,580 38,287 – – 38,287 1,922,472 (794) (2,740) 1,918,938
Total at 31/12/2007 120,883 – – 120,883 18,590 – (9) 18,581 2,513,054 (912) (6,385) 2,505,757
Exposures/Counterparties Insurance companies Non-financial institutions Other parties Gross Specific Portfolio Net Gross Specific Portfolio Net Gross Specific Portfolio Net exposure adjustments adjustments exposure exposure adjustments adjustments exposure exposure adjustments adjustments exposure
A. Cash exposure a.1 Non-performing loans – – – – 257,706 (136,066) – 121,640 182,536 (82,932) – 99,604 a.2 Watchlist loans – – – – 214,268 (43,099) – 171,169 108,844 (29,575) – 79,269 a.3 restructured exposures – – – – 17,646 – – 17,646 – – – – a.4 Past due exposures – – – – 39,762 (1,838) – 37,924 34,788 (1,403) – 33,385 a.5 Other exposures 23,185 – – 23,185 9,953,240 – (52,265) 9,900,975 4,598,192 – (14,153) 4,584,039
Total 23,185 – – 23,185 10,482,622 (181,003) (52,265) 10,249,354 4,924,360 (113,910) (14,153) 4,796,297
B. “Off-balance sheet” exposures a.1 Non-performing loans – – – – 13 (7) – 6 21 – – 21 a.2 Watchlist loans – – – – 4,270 (583) – 3,687 4,326 – – 4,326 a.3 Other impaired assets – – – – 1,369 (25) – 1,344 22,339 – – 22,339 a.4 Other exposures 20,627 – – 20,627 2,535,038 – – 2,535,038 1,555,117 – – 1,555,117
Total 20,627 – – 20,627 2,540,690 (615) – 2,540,075 1,581,803 – – 1,581,803
Total at 31/12/2008 43,812 – – 43,812 13,023,312 (181,618) (52,265) 12,789,429 6,506,163 (113,910) (14,153) 6,378,100
Total at 31/12/2007 263,652 – (5) 263,647 11,403,055 (146,538) (74,183) 11,182,334 6,099,523 (56,394) (26,293) 6,016,836

278
B.2 Distribution of loans to resident non-financial businesses
this table is not being presented, having been suspended under the Bank of Italy’s “Instructions regarding financial statements of banks and financial institutions”.
B.3 Geographical distribution of cash and “off-balance sheet” exposures to customers (book value)
Exposures/Counterparties ItaLY OtHEr EU COUNtrIES aMErICa aSIa rESt OF tHE WOrLD Gross Net Gross Net Gross Net Gross Net Gross Net exposure exposure exposure exposure exposure exposure exposure exposure exposure exposure
A. Cash exposure a.1 Non-performing loans 435,044 221,379 5,682 12 449 – 30 22 – –a.2 Watchlist loans 322,716 250,167 396 271 – – – – – –a.3 restructured exposures 17,646 17,646 – – – – – – – –a.4 Past due exposures 74,374 71,145 178 166 – – – – – –a.5 Other exposures 15,445,791 15,376,965 356,253 355,938 3,674 3,670 1,647 1,636 722 720
Total 16,295,571 15,937,302 362,509 356,387 4,123 3,670 1,677 1,658 722 720
B. “Off-balance sheet” exposures B.1 Non-performing loans 36 29 – – – – – – – –B.2 Watchlist loans 8,596 8,013 – – – – – – – –B.3 Other impaired assets 23,708 23,683 – – – – – – – –B.4 Other exposures 4,262,624 4,262,624 668,313 668,313 603 603 – – 144 144
Total 4,294,964 4,294,349 668,313 668,313 603 603 – – 144 144
Total at 31/12/2008 20,590,535 20,231,651 1,030,822 1,024,700 4,726 4,273 1,677 1,658 866 864
Total at 31/12/2007 19,197,214 18,893,618 1,176,301 1,169,624 42,232 41,808 1,624 1,604 1,386 1,384

279
Exposures/Counterparties ItaLY OtHEr EU COUNtrIES aMErICa aSIa rESt OF tHE WOrLD Gross Net Gross Net Gross Net Gross Net Gross Net exposure exposure exposure exposure exposure exposure exposure exposure exposure exposure
A. Cash exposure a.1 Non-performing loans 435,044 221,379 5,682 12 449 – 30 22 – –a.2 Watchlist loans 322,716 250,167 396 271 – – – – – –a.3 restructured exposures 17,646 17,646 – – – – – – – –a.4 Past due exposures 74,374 71,145 178 166 – – – – – –a.5 Other exposures 15,445,791 15,376,965 356,253 355,938 3,674 3,670 1,647 1,636 722 720
Total 16,295,571 15,937,302 362,509 356,387 4,123 3,670 1,677 1,658 722 720
B. “Off-balance sheet” exposures B.1 Non-performing loans 36 29 – – – – – – – –B.2 Watchlist loans 8,596 8,013 – – – – – – – –B.3 Other impaired assets 23,708 23,683 – – – – – – – –B.4 Other exposures 4,262,624 4,262,624 668,313 668,313 603 603 – – 144 144
Total 4,294,964 4,294,349 668,313 668,313 603 603 – – 144 144
Total at 31/12/2008 20,590,535 20,231,651 1,030,822 1,024,700 4,726 4,273 1,677 1,658 866 864
Total at 31/12/2007 19,197,214 18,893,618 1,176,301 1,169,624 42,232 41,808 1,624 1,604 1,386 1,384

280
B.4 Geographical distribution of cash and “off-balance sheet” exposures to banks
B.5 Significant risks
31/12/2008 31/12/2007
a) amount 627,042 623,564 b) number 2 1
On the basis of instructions issued by the Bank of Italy, positions are considered significant if the overall exposure of a single customer is equal to or greater than 10% of the Bank’s regulatory capital. the total weighted amount is indicated.
Exposures/Counterparties ItaLY OtHEr EU COUNtrIES aMErICa aSIa rESt OF tHE WOrLD Gross Net Gross Net Gross Net Gross Net Gross Net exposure exposure exposure exposure exposure exposure exposure exposure exposure exposure
A. Cash exposure a.1 Non-performing loans – – – – – – – – – –a.2 Watchlist loans – – 1,208 911 – – – – – –a.3 restructured exposures – – – – – – – – – –a.4 Past due exposures – – – – – – – – – –a.5 Other exposures 2,966,866 2,966,866 214,655 214,655 31,227 31,227 50,938 50,938 2,314 2,314
Total 2,966,866 2,966,866 215,863 215,566 31,227 31,227 50,938 50,938 2,314 2,314
B. “Off-balance sheet” exposures B.1 Non-performing loans – – – – – – – – – –B.2 Watchlist loans – – – – – – – – – –B.3 Other impaired assets – – – – – – – – – –B.4 Other exposures 567,054 567,054 142,282 142,282 33,458 33,458 29,286 29,286 4,543 4,543
Total 567,054 567,054 142,282 142,282 33,458 33,458 29,286 29,286 4,543 4,543
Total at 31/12/2008 3,533,920 3,533,920 358,145 357,848 64,685 64,685 80,224 80,224 6,857 6,857
Total at 31/12/2007 2,930,813 2,930,813 577,969 577,969 59,659 59,659 19,222 19,222 82,127 82,127

281
Exposures/Counterparties ItaLY OtHEr EU COUNtrIES aMErICa aSIa rESt OF tHE WOrLD Gross Net Gross Net Gross Net Gross Net Gross Net exposure exposure exposure exposure exposure exposure exposure exposure exposure exposure
A. Cash exposure a.1 Non-performing loans – – – – – – – – – –a.2 Watchlist loans – – 1,208 911 – – – – – –a.3 restructured exposures – – – – – – – – – –a.4 Past due exposures – – – – – – – – – –a.5 Other exposures 2,966,866 2,966,866 214,655 214,655 31,227 31,227 50,938 50,938 2,314 2,314
Total 2,966,866 2,966,866 215,863 215,566 31,227 31,227 50,938 50,938 2,314 2,314
B. “Off-balance sheet” exposures B.1 Non-performing loans – – – – – – – – – –B.2 Watchlist loans – – – – – – – – – –B.3 Other impaired assets – – – – – – – – – –B.4 Other exposures 567,054 567,054 142,282 142,282 33,458 33,458 29,286 29,286 4,543 4,543
Total 567,054 567,054 142,282 142,282 33,458 33,458 29,286 29,286 4,543 4,543
Total at 31/12/2008 3,533,920 3,533,920 358,145 357,848 64,685 64,685 80,224 80,224 6,857 6,857
Total at 31/12/2007 2,930,813 2,930,813 577,969 577,969 59,659 59,659 19,222 19,222 82,127 82,127

282
C. SECUrItIZatIONS aND DISPOSaL OF aSSEtS
C.1 SECUrItIZatIONS
Qualitative information
Objectives, strategies and processes underlying securitizations
In terms of the objectives and goals pursued, Banca Popolare di Vicenza has arranged seven securitizations of performing mortgage loans. the last four were multi-originator securitizations involving the other banks in the Group: Banca Nuova S.p.a. and CariPrato - Cassa di risparmio di Prato S.p.a. all these securitizations form a strategic part of the Group’s expectations of further expansion in the mortgage sector and the general process of expanding bank lending, which requires adequate liquidity to be raised in advance to meet future loan applications.
More specifically, the securitizations carried out address the following objectives:– to free up resources on the asset-side of the balance sheet, whilst improving the treasury
position;− to reduce maturity mismatching between deposits and long-term lending;− to reduce the ratio of long-term lending to total lending.
the securitizations arranged between 2000 and 2008 are as follows:
− Berica MBS Srl;− Berica 2 MBS Srl;− Berica 3 MBS Srl;− Berica residential MBS 1 Srl;− Berica 5 residential MBS Srl;− Berica 6 residential MBS Srl;− Berica 7 residential MBS Srl.
With regard to the first four securitizations, set up before 1 January 2004, the securitized assets were not reinstated on the first-time adoption of IaS-IFrS, as allowed by para. 27 of IFrS 1.
the other securitizations known as Berica 5 residential Mbs, Berica 6 residential Mbs and Berica 7 residential Mbs, arranged subsequent to 1 January 2004, do not meet the derecognition requirements of IaS 39 since the Bank has subscribed all the junior asset-backed securities issued by the vehicle company. accordingly, the residual securitized assets have been reinstated at the balance sheet date to the extent of the Bank’s share of the loans sold, while the related junior notes have been eliminated. the securitized assets reported in the balance sheet have been valued using the same principles as for the Bank’s own assets.
For all of its securitization transactions, Banca Popolare di Vicenza has signed specific servicing contracts with the respective vehicle companies, to co-ordinate and supervise management, administration and collection of the securitized mortgages, as well as recovery in the case of breach of contract by the debtors.
these contracts require the payment of an annual servicing fee as well as recompense for each position recovered. the function of servicer is carried out by specific structures within the company, whose work has been duly organized and is checked by the Bank’s internal auditors, who verify the propriety and conformity of its conduct with respect to the terms of the servicing contract.

283
Lastly, Banca Popolare di Vicenza also acts as the administrative servicer for the above securitizations, receiving a contractually-agreed fee from the vehicle company for providing this service.
Internal systems for the measurement and control of risk
the residual risk for the Bank in relation to the total insolvency of borrowers represents, for the own securitizations not reinstated, the value of the junior securities (highest degree of subordination) held.
the Bank periodically monitors changes in the key lending and financial variables relating to each securitization.
With a view to controlling risk, special attention is focused on the performance of the trigger ratios, which indicate default and delinquency experience, with respect to the excess spread that remunerates the junior securities held by the Bank. the Board of Directors receives a summary and detailed statement about the securitizations at least every six months.
at the same time as issuing the aBS, a number of back-to-back swaps were arranged in the form of Interest rate Swaps (IrS), in order to shield the vehicle company (SPV) from interest rate risk.
these instruments are measured at fair value, as discussed below, and are included in the periodic asset & Liability Management (aLM) analysis which is performed at least every quarter.
“Berica 7 Residential MBS Srl” securitization
this operation, started on 1 October 2008, is the Bank’s seventh securitization and fourth multi-originator kind. the operation has involved transferring a portfolio of residential mortgages from Banca Popolare di Vicenza and its subsidiaries Banca Nuova and Cariprato to a special purpose entity called “Berica 7 residential MBS”.In the wake of the US subprime loans crisis, market conditions in 2008 got dramatically worse, with access to the primary market effectively impossible. this situation caused a massive recourse to asset securitization, particularly of the rMBS (residential mortgage backed securities) kind with the goal of having securities that could be lodged with the European Central Bank for refinancing.).the Berica 7 residential MBS securitization, carried out for this purpose for an amount of over Euro 1 billion at group level, has therefore made it possible to finance assets, used as collateral against short-term loans, at relatively competitive rates in a situation of liquidity stress like at present. Funding repurchase agreements carried out with the ECB by the Group’s individual banks who subscribed the securities in proportion to the loan books sold, have therefore made it possible to diversify the sources of financing relative to the interbank market, also in light of the Central Bank’s numerous injections of liquidity.

284
the characteristics of the securitization are set out below:
In thosusands of Euro
- Vehicle company Berica 7 residential MBS Srl - Bank interest in vehicle company none - Date of sale of loans 01.10.2008 - type of loans sold Mortgage loans - Quality of loans sold Performing loans - Guarantees on loans sold First mortgage - Geographical area of loans sold Italy - Economic status of debtors sold Individuals - Number of loans sold 8.960 of which: Banca Popolare di Vicenza 6.067 - Price of loans sold: euro 969.709 of which: Banca Popolare di Vicenza euro 682.860 - Value of loans sold (principal amount) euro 968.407 of which: Banca Popolare di Vicenza euro 682.373 - Interest accrued on loans sold euro 1.302 of which: Banca Popolare di Vicenza euro 486
In detail, this securitization commenced on 1 October 2008 with the without-recourse sale of performing loans to a specially-formed special purpose vehicle; these loans represented a total of 6,262 positions relating to Banca Popolare di Vicenza with residual principal of Euro 707,816,912. the sale price was equal to the nominal value of the receivables sold plus the interest accruing. No profits/losses have emerged since the date of sale.On 24 December 2008, after certain customers opted for the aBI/MEF renegotiation proposal under the “tremonti Decree”, some positions “left” the securitization with retrospective effect. as a result, the total portfolio of securitized loan has gone down to Euro 968,407,463, of which Banca Popolare di Vicenza’s share is Euro 682,373,494 relating to 6,067 positions.On 17 November 2008, the vehicle company issued Euro 930 million in Senior Class a notes, with a Standard & Poor’s investment grade aaa, as well as Euro 75 million in Junior Class B notes, which were not rated . all these securities were subscribed by the originator banks in proportion to the size of the loan portfolio sold. With regard to these securities, the share held by Banca Popolare di Vicenza is almost Euro 52 million.
the yield on these securities is indexed to 3/M Euribor plus a spread of 50 basis points for the senior issue and 100 basis points for the junior issue.
the geographical distribution of the securitized assets is as follows:
Italy Other EU Other america total
North- North- Centre South and countries non-EU West East Islands countries
Securitized assets 65,403 610,955 2,891 2,257 271 28 568 682,373
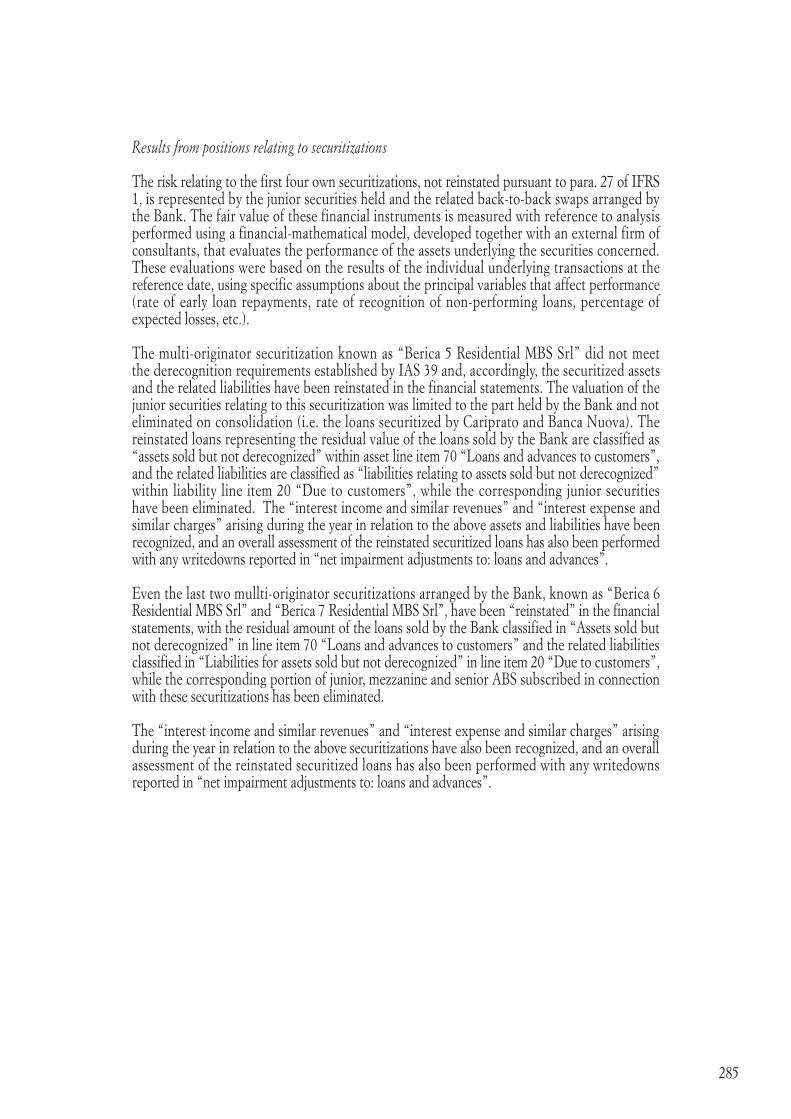
285
Results from positions relating to securitizations
the risk relating to the first four own securitizations, not reinstated pursuant to para. 27 of IFrS 1, is represented by the junior securities held and the related back-to-back swaps arranged by the Bank. the fair value of these financial instruments is measured with reference to analysis performed using a financial-mathematical model, developed together with an external firm of consultants, that evaluates the performance of the assets underlying the securities concerned. these evaluations were based on the results of the individual underlying transactions at the reference date, using specific assumptions about the principal variables that affect performance (rate of early loan repayments, rate of recognition of non-performing loans, percentage of expected losses, etc.).
the multi-originator securitization known as “Berica 5 residential MBS Srl” did not meet the derecognition requirements established by IaS 39 and, accordingly, the securitized assets and the related liabilities have been reinstated in the financial statements. the valuation of the junior securities relating to this securitization was limited to the part held by the Bank and not eliminated on consolidation (i.e. the loans securitized by Cariprato and Banca Nuova). the reinstated loans representing the residual value of the loans sold by the Bank are classified as “assets sold but not derecognized” within asset line item 70 “Loans and advances to customers”, and the related liabilities are classified as “liabilities relating to assets sold but not derecognized” within liability line item 20 “Due to customers”, while the corresponding junior securities have been eliminated. the “interest income and similar revenues” and “interest expense and similar charges” arising during the year in relation to the above assets and liabilities have been recognized, and an overall assessment of the reinstated securitized loans has also been performed with any writedowns reported in “net impairment adjustments to: loans and advances”.
Even the last two mullti-originator securitizations arranged by the Bank, known as “Berica 6 residential MBS Srl” and “Berica 7 residential MBS Srl”, have been “reinstated” in the financial statements, with the residual amount of the loans sold by the Bank classified in “assets sold but not derecognized” in line item 70 “Loans and advances to customers” and the related liabilities classified in “Liabilities for assets sold but not derecognized” in line item 20 “Due to customers”, while the corresponding portion of junior, mezzanine and senior aBS subscribed in connection with these securitizations has been eliminated.
the “interest income and similar revenues” and “interest expense and similar charges” arising during the year in relation to the above securitizations have also been recognized, and an overall assessment of the reinstated securitized loans has also been performed with any writedowns reported in “net impairment adjustments to: loans and advances”.

286
the principal results from positions relating to securitizations are summarized in the following table:
this table does not include the changes in fair value of junior securities arising from the 4th and 5th securitizations classified as “financial assets available for sale”, which are reported in the specific equity reserve. this reserve reported a positive balance of Euro 1,974 at 31 December 2008.
Securitizations Interest Positive Writebacks Other Gains Gains total income (negative) (writedowns) income (losses) (losses) on (expense) differential of loans (expenses) from valuation disposals
1. Berica MBS Srl 1,516 (730) – 157 172 (802) 313 - aBS 1,516 – – – 172 (1,599) 89 - assets & liabilities reinstated in balance – – – – – – – - Back to back swap – (730) – – – 797 67 - Securization servicing – – – 157 – – 157 - Other income (expenses) – – – – – – –2. Berica 2 MBS Srl 320 (775) – 369 632 (2,296) (1,750) - aBS 320 – – 179 632 (1,676) (545) - assets & liabilities reinstated in balance – – – – – – – - Back to back swap – (775) – – – (620) (1,395) - Securization servicing – – – 246 – – 246 - Other income (expenses) – – – (56) – – (56)3. Berica 3 MBS Srl 354 (1,161) – 1,717 209 (4,208) (3,089) - aBS 354 – – 1,538 209 (4,252) (2,151) - assets & liabilities reinstated in balance – – – – – – – - Back to back swap – (1,161) – – – 44 (1,117) - Securization servicing – – – 290 – – 290 - Other income (expenses) – – – (111) – – (111)4. Berica Residential MBS 1 Srl 405 (1,773) – 4 (291) 2,894 1,239 - aBS 405 – – – (291) – 114 - assets & liabilities reinstated in balance – – – – – – – - Back to back swap – (1,773) – – – 2,894 1,121 - Securization servicing – – – 404 – – 404 - Other income (expenses) – – – (400) – – (400)5. Berica 5 Residential MBS Srl 9,490 (1,506) (5,972) (99) 5,094 658 7,665 - aBS 1,152 – – – 5,094 – 6,246 - assets & liabilities reinstated in balance 8,338 – (5,972) – – – 2,366 - Back to back swap – (1,506) – – – 658 (848) - Securization servicing – – – 575 – – 575 - Other income (expenses) – – – (674) – – (674)6. Berica 6 Residential MBS Srl 13,115 2,264 (11,950) (116) 7,228 – 10,541 - aBS – – – – 7,228 – 7,228 - assets & liabilities reinstated in balance 13,115 – (11,950) – – – 1,165 - Back to back swap – 2,264 – – – – 2,264 - Securization servicing – – – 1,406 – – 1,406 - Other income (expenses) – – – (1,522) – – (1,522)7. Berica 7 Residential MBS Srl 9,756 985 (1,707) 293 – – 9,327 - aBS – – – – – – – - assets & liabilities reinstated in balance 9,756 – (1,707) – – – 8,049 - Back to back swap – 985 – – – – 985 - Securization servicing – – – 293 – – 293 - Other income (expenses) – – – – – – –
Total 34,956 (2,696) (19,629) 2,325 13,044 (3,754) 14,919

287
Rating agencies
the following rating agencies were engaged to perform due diligence work on the above transac-tions and assign ratings to the related aBS: – Berica MBS Srl securitization: Standard & Poor’s, Fitch ratings and Moody’s;– Berica 2 MBS Srl securitization: Standard & Poor’s and Fitch ratings;– Berica 3 MBS Srl securitization: Standard & Poor’s and Fitch ratings;– Berica residential MBS 1 Srl securitization: Standard & Poor’s and Fitch ratings;– Berica 5 residential MBS Srl securitization: Standard & Poor’s and Fitch ratings;– Berica 6 residential MBS Srl securitization: Standard & Poor’s, Fitch ratings and Moody’s
Investors Service Inc.;– Berica 7 residential MBS Srl securitization: Standard & Poor’s.

288
QUaNtItatIVE DISCLOSUrES
C.1.1 Exposures deriving from securitizations analyzed by quality of the underlying assets
C.1.2 Exposures deriving from the principal “own” securitizations analyzed by type of asset securiti-zed and type of exposure
Quality of underlying assets/Exposures Cash exposures Guarantees given Credit lines Senior Mezzanine Junior Senior Mezzanine Junior Senior Mezzanine Junior Gross Net Gross Net Gross Net Gross Net Gross Net Gross Net Gross Net Gross Net Gross Net exposure exposure exposure exposure exposure exposure exposure exposure exposure exposure exposure exposure exposure exposure exposure exposure exposure exposure A. Own securitized underlying assets: 602,301 602,301 16,218 16,218 131,620 96,678 – – – – – – 9,094 9,094 – – – – a) Impaired loans – – – – – – – – – – – – – – – – – – b) Other 602,301 602,301 16,218 16,218 131,620 96,678 – – – – – – 9,094 9,094 – – – –
B. Third-party securitized underlying assets: 252,097 252,097 6,879 6,879 35,427 35,427 – – – – – – 2,325 2,325 – – – – a) Impaired loans – – – – – – – – – – – – – – – – – – b) Other 252,097 252,097 6,879 6,879 35,427 35,427 – – – – – – 2,325 2,325 – – – –
Type of assets securitized/Exposure Cash exposures Guarantees given Credit lines Senior Mezzanine Junior Senior Mezzanine Junior Senior Mezzanine Junior Book Writedowns Book Writedowns Book Writedowns Book Writedowns Book Writedowns Book Writedowns Book Writedowns Book Writedowns Book Writedowns value /writebacks value /writebacks value /writebacks value /writebacks value /writebacks value /writebacks value /writebacks value /writebacks value /writebacks
A. Fully derecognized a.1 Berica MBS S.r.l. - mortgage loans – – – – 2,942 (16,465) – – – – – – – – – – – –a.2 Berica 2 MBS S.r.l. - mortgage loans – – – – 5,692 (9,695) – – – – – – 2,119 – – – – –a.3 Berica 3 MBS S.r.l. - mortgage loans – – – – 8,443 (8,782) – – – – – – 2,200 – – – – –a.4 Berica Residential MBS 1 S.r.l. - mortgage loans – – – – 16,003 – – – – – – – 1,948 – – – – –B. Partially derecognized C. Not derecognized C.1 Berica Residential MBS 5 S.r.l. - mortgage loans 41,863 – 2,758 – 24,408 – – – – – – – 2,827 – – – – –C.2 Berica 6 Residential MBS S.r.l. - mortgage loans 102,928 – 558 – 2,293 – – – – – – – – – – – – –C.3 Berica 7 Residential MBS S.r.l. - mortgage loans 457,510 12,902 36,897 –

289
Quality of underlying assets/Exposures Cash exposures Guarantees given Credit lines Senior Mezzanine Junior Senior Mezzanine Junior Senior Mezzanine Junior Gross Net Gross Net Gross Net Gross Net Gross Net Gross Net Gross Net Gross Net Gross Net exposure exposure exposure exposure exposure exposure exposure exposure exposure exposure exposure exposure exposure exposure exposure exposure exposure exposure A. Own securitized underlying assets: 602,301 602,301 16,218 16,218 131,620 96,678 – – – – – – 9,094 9,094 – – – – a) Impaired loans – – – – – – – – – – – – – – – – – – b) Other 602,301 602,301 16,218 16,218 131,620 96,678 – – – – – – 9,094 9,094 – – – –
B. Third-party securitized underlying assets: 252,097 252,097 6,879 6,879 35,427 35,427 – – – – – – 2,325 2,325 – – – – a) Impaired loans – – – – – – – – – – – – – – – – – – b) Other 252,097 252,097 6,879 6,879 35,427 35,427 – – – – – – 2,325 2,325 – – – –
Type of assets securitized/Exposure Cash exposures Guarantees given Credit lines Senior Mezzanine Junior Senior Mezzanine Junior Senior Mezzanine Junior Book Writedowns Book Writedowns Book Writedowns Book Writedowns Book Writedowns Book Writedowns Book Writedowns Book Writedowns Book Writedowns value /writebacks value /writebacks value /writebacks value /writebacks value /writebacks value /writebacks value /writebacks value /writebacks value /writebacks
A. Fully derecognized a.1 Berica MBS S.r.l. - mortgage loans – – – – 2,942 (16,465) – – – – – – – – – – – –a.2 Berica 2 MBS S.r.l. - mortgage loans – – – – 5,692 (9,695) – – – – – – 2,119 – – – – –a.3 Berica 3 MBS S.r.l. - mortgage loans – – – – 8,443 (8,782) – – – – – – 2,200 – – – – –a.4 Berica Residential MBS 1 S.r.l. - mortgage loans – – – – 16,003 – – – – – – – 1,948 – – – – –B. Partially derecognized C. Not derecognized C.1 Berica Residential MBS 5 S.r.l. - mortgage loans 41,863 – 2,758 – 24,408 – – – – – – – 2,827 – – – – –C.2 Berica 6 Residential MBS S.r.l. - mortgage loans 102,928 – 558 – 2,293 – – – – – – – – – – – – –C.3 Berica 7 Residential MBS S.r.l. - mortgage loans 457,510 12,902 36,897 –

290
C.1.3 Exposures deriving from the principal “third-party” securitizations analyzed by type of asset securitized and type of exposure
C.1.4 Exposures to securitizations analyzed by portfolio and by type
apart from the cash exposures presented in these tables, there are also Euro 7,319 in undrawn credit lines available to special purpose entities set up for the Bank’s own securitizations and not reinstated in the balance sheet.
type of assets securitized/Exposure Cash exposures Guarantees given Credit lines Senior Mezzanine Junior Senior Mezzanine Junior Senior Mezzanine Junior Book Writedowns Book Writedowns Book Writedowns Book Writedowns Book rettifiche/ Book Writedowns Book Writedowns Book Writedowns Book Writedowns value /writebacks value /writebacks value /writebacks value /writebacks value /writebacks value /writebacks value /writebacks value /writebacks value /writebacks
a.1 Berica Residential MBS 1 S.r.l. – - mortgage loans – – – – 8,036 – – – – – – – 1,052 – – – – –a.2 Berica Residential MBS 5 S.r.l. - mortgage loans 18,853 – 1,242 – 10,992 – – – – – – – 1,273 – – – – –a.3 Berica Residential MBS 6 S.r.l. - mortgage loans 41,304 224 920 a.4 Berica Residential MBS 7 S.r.l. - mortgage loans 191,940 – 5,413 – 15,479 – – – – – – – – – – – – –
Exposure/Portfolio Financial Financial Financial Financial Loans 31/12/2008 31/12/2007 assets assets at assets assets held for fair value available held to trading for sale maturity
1. Cash exposures – 17,077 50,313 – 260,093 327,483 68,740 – senior – – – – 252,097 252,097 1,691 – mezzanine – – – – 6,879 6,879 – – junior – 17,077 50,313 – 1,117 68,507 67,049
2. “Off-balance sheet” exposures – – – – – – – – senior – – – – – – – – mezzanine – – – – – – – – junior – – – – – – –

291
C.1.5 Total amount of securitized assets underlying the junior securities or other forms of credit instrument
assets/amounts traditional securitizations Synthetic securitizations A. Own underlying assets: 1,965,862 –a.1 Fully derecognized 579,002 1. Non-performing loans 20,694 x 2. Watchlist loans 20,525 x 3. restructured exposures – x 4. Past due exposures – x 5. Other assets 537,783 x a.2 Partially derecognized – 1. Non-performing loans – x 2. Watchlist loans – x 3. restructured exposures – x 4. Past due exposures – x 5. Other assets – x a.3 Not derecognized 1,386,860 – 1. Non-performing loans 21,225 – 2. Watchlist loans 34,445 – 3. restructured exposures – – 4. Past due exposures – – 5. Other assets 1,331,190 –
B. Third–party underlying assets: 398,061 –B.1 Non-performing loans 4,021 –B.2 Watchlist loans 6,564 –B.3 restructured exposures – –B.4 Past due exposures – –B.5 Other assets 387,476 –
type of assets securitized/Exposure Cash exposures Guarantees given Credit lines Senior Mezzanine Junior Senior Mezzanine Junior Senior Mezzanine Junior Book Writedowns Book Writedowns Book Writedowns Book Writedowns Book rettifiche/ Book Writedowns Book Writedowns Book Writedowns Book Writedowns value /writebacks value /writebacks value /writebacks value /writebacks value /writebacks value /writebacks value /writebacks value /writebacks value /writebacks
a.1 Berica Residential MBS 1 S.r.l. – - mortgage loans – – – – 8,036 – – – – – – – 1,052 – – – – –a.2 Berica Residential MBS 5 S.r.l. - mortgage loans 18,853 – 1,242 – 10,992 – – – – – – – 1,273 – – – – –a.3 Berica Residential MBS 6 S.r.l. - mortgage loans 41,304 224 920 a.4 Berica Residential MBS 7 S.r.l. - mortgage loans 191,940 – 5,413 – 15,479 – – – – – – – – – – – – –

292
C.1.6 Holdings in vehicle companies
Name registered offices Interest % – Berica MBS S.r.l. Milano 5.0– Berica 2 MBS S.r.l. Vicenza 5.0– Berica 3 MBS S.r.l. Vicenza 5.0– Berica residential MBS 1 S.r.l. Vicenza 5.0– Berica 5 residential MBS S.r.l. Vicenza 5.0– Berica 6 residential MBS S.r.l. Vicenza 5.0– Berica 7 residential MBS S.r.l. Vicenza 5.0
the holdings in the above vehicle companies are held indirectly through the subsidiary BPV Fi-nance Plc (Dublin).
C.1.7 Servicer activities - collection of securitized loans and redemption of securities issued by the vehicle company
Vehicle company Securitized assets Loans collected Percentage of securities redeemed 31/12/2008 during the year 31/12/2008 Impaired Performing Impaired Performing Senior Mezzanine Junior assets assets assets assets Impaired Performing Impaired Performing Impaired Performing assets assets assets assets assets assets
– Berica MBS S.r.l. 46,206 18,437 100.00% 73.16% 4.75%– Berica 2 MBS S.r.l. 95,721 25,821 100.00% 40.75% 17.78%– Berica 3 MBS S.r.l. 138,216 36,436 66.15% – 20.27%– Berica residential MBS 1 S.r.l. 194,084 40,121 48.47% – 29.94%– Berica 5 residential MBS S.r.l. 286,680 48,689 36.36% – –– Berica 6 residential MBS S.r.l. 728,984 111,894 100.00% 16.14% –– Berica 7 residential MBS S.r.l. 661,410 19,791 – – –

293
C.2 DISPOSaLS
C.2.1. Financial assets sold but not derecognized
type of asset securitized/ Financial assets Loans and Loans and Total Totalexposure held to maturity advances to banks advances to customer 31/12/2008 31/12/2007 a B C a B C a B C
A. Cash assets – – – 294,647 – – 1,677,074 – – 2,013,126 1,301,935 1. Debt securities – – – 294,647 – – – – – 336,052 111,093 2. Equities x x x x x x x x x – –3. Mutual funds x x x x x x x x x – –4. Loans – – – – – – 1,610,706 – – 1,610,706 1,145,236 5. Impaired assets – – – – – – 66,368 – – 66,368 45,606 B. Derivatives x x x x x x x x x – –
Total at 31/12/2008 – – – 294,647 – – 1,677,074 – – 2,013,126 –
Total at 31/12/2007 – – – 30,541 – – 1,190,842 – – – 1,301,935
type of asset securitized/ Financial assets Financial assets Financial assetsexposure held for trading at fair value available for sale a B C a B C a B C
A. Cash assets 7,179 – – – – – 34,226 – –1. Debt securities 7,179 – – – – – 34,226 – –2. Equities – – – – – – – – –3. Mutual funds – – – – – – – – –4. Loans – – – – – – – – –5. Impaired assets – – – – – – – – –
B. Derivatives – – – x x x x x x
Total at 31/12/2008 7,179 – – – – – 34,226 – –
Total at 31/12/2007 80,552 – – – – – – –

294
C.2.2 Financial liabilities relating to financial assets sold but not derecognized
Liabilities/assets portfolio Financial Financial Financial Financial Loans and Loans and Total assets assets at assets assets advances advances held fair value available helt to to banks to customer for trading for sale maturity
1. Due to customer 5,472 – 28,545 – 229,929 780,067 1,044,013 a) for assets recognized in full 5,472 – 28,545 – 229,929 780,067 1,044,013 b) for assets recognized in part – – – – – – –2. Deposits from banks 1,682 – 5,036 – 62,174 – 68,892 a) for assets recognized in full 1,682 – 5,036 – 62,174 – 68,892 b) for assets recognized in part – – – – – – –
Total at 31/12/2008 7,154 – 33,581 – 292,103 780,067 1,112,905
Total at 31/12/2007 80,926 – – – 30,267 1,163,635 1,274,828

295
D. MODELS USED FOr MEaSUrING CrEDIt rISK
the new internal ratings models for the retail segment (private individuals and small businesses), small corporate segment (with turnover of Euro 2.5 to 50 million) and mid corporate segment (with turnover of Euro 50 to 200 million) went live in the Banca Popolare di Vicenza’s commercial network at the end of april 2008 and in Banca Nuova e CariPrato at the start of June. For the time being, the segment of companies (or groups) with turnover in excess of Euro 200 million has been left out, since its model, mainly based on the logic of experience, is still being perfected by the Parent Bank.
the models currently in use have been tested by analysts in the Parent Bank, and by those in Banca Nuova and CariPrato with reference to the corporate segment. these tests have provided very reassuring results in terms of the coincidence of the experts’ opinions with the output of these models.
It will be recalled that the SGr monitoring system (Sistema di Gestione dei rischi or risk management system) has been in use at the Bank since October 2004. Its principal use is to provide early warnings to alert account managers of the existence of problems with certain customers and to make them take corrective action against the higher risk situations, in accordance with precisely defined procedures.
the SGr system has undergone a major revision, with the aim of making this monitoring tool still more effective in quickly identifying anomalies, and has involved the definition of a new model and calculation algorithm for performance scoring, as well as interfacing the system with the new internal ratings models.
the new anomalies reporting system has been completed from a software point of view and, once tested, it will enter operation in the first half of 2009.

296
SECtION 2
Market risk
2.1 INtErESt ratE rISK - traDING BOOK FOr SUPErVISOrY PUrPOSES
QUaLItatIVE INFOrMatION
A. General aspects
Interest rate risk represents the risk of incurring losses due to adverse trends in the rates of return on debt securities. three types of interest-rate risk can be identified:
– level: risk associated with an absolute change in the forward structure of risk-free interest rates (parallel shifts in the yield curve);
– curve and fundamental: the first identifies the risk deriving from a relative change in the structure of interest rates; the second derives from the imperfect correlation of the elements of a position, particularly with reference to hedging strategies;
– credit spread. risk deriving from changes in the prices of bonds and credit derivatives associated with unexpected changes in the issuer’s credit rating.
the investment policy adopted by the Group focuses on the optimization of operating results and on reducing their volatility. the crisis of the financial system turned into a dramatic crisis of liquidity and credit over the course of 2008. the effects of the liquidity crisis gradually retreated in the last few weeks of 2008, with a reduction in spreads between the discount rate and Eonia rate on the one hand, and Euribor rates on the other; the credit crisis spread to financial and government securities and to credit default swaps on the sovereign debt of less virtuous countries, even after major public intervention wherever necessary.
at the same time, the price of raw materials and energy experienced a dramatic reversal in trend, giving rise to a deflationary scenario. the European Central Bank was therefore forced to intervene on as many as three occasions, progressively cutting discount rates by 1.75% in less than six months. the short-term rate curve has incorporated new expectations about monetary policy, while the long-term rate curve has got gradually steeper.
the portfolio of own bonds was significantly reduced in the first six months of the year while the interest rate derivatives portfolio, for some time prudently focused on basic risks relating to the various Euribor tenors (3, 6 and 12 months), offset the losses arising on residual bond positions with gains on directional and basic positions.

297
B. Management and measurement of interest rate risk
the control of all financial risks is centralized for all Group banks (including BPV Finance Plc) within the risk Management unit of the Parent Bank’s Planning and risk Management Department. Operating and stop loss limits are also used to guide the activity of individual desks, which is monitored and controlled by the Financial Control office in the Finance Division of Banca Popolare di Vicenza.
Var limits underwent their annual revision and were approved by the Board of Directors on 29 January 2008 in its resolution on “Finance limits on Var for BPVi and proposals for group companies”.the Board delegated the General Manager at the same meeting to define, at the recommendation of the Finance and aLMS Committee, the other operating and stop loss limits on a consistent basis with the Var limits assigned.
the new structure of operating limits for the Global Markets Department has three levels:
a) Operating limits (sensitivity, delta, vega, credit concentration and risk);b) Stop loss limits;c) Value at risk (Var) limits.
the structure of operating and position limits, applying in the first half of 2008, involved using the following indicators:
1. Exchange rate risk: delta in monetary terms (cash equivalent position for spot, forward and rate derivative portfolios), vega (change in market value on a change in volatility);
2. Equity risk: delta equivalent (market value of shares and cash equivalent position for equity derivatives);
3. Interest rate risk: sensitivity (change in profit or loss on a parallel shift in the reference curve by one-hundredth of a point), vega (change in market value on a change in volatility);
4. Maximum invested amount: book value of cash securities/funds (gross of the derivatives’ delta) to ensure that assets and liabilities are balanced within the assigned budget limits;
5. Limits on the acceptance of credit risk: overall limits are established for the exposure to each rating class, especially those below investment grade;
6. Limits on the concentration in individual issuers / issues, with tighter restrictions as the rating class of the issuer diminishes.
the structure of operating limits, applying from 1 July as per the instruction of 30 June 2008, is based on:1. Sensitivity (interest rate risk): change in profit or loss that would occur in the event of a
parallel shift in the reference curve by one basis point;2. Vega (interest rate risk): change in profit or loss that would occur in the event of a 1% change
in volatility (or in the volatility curves) for the financial instrument;3. Vega (exchange rate risk): change in profit or loss that would occur in the event of a 1%
change in the volatility of the exchange rate;4. Delta in cash terms (exchange rate risk): cash equivalent position for spot, forward and
exchange rate derivative portfolios;5. Delta equivalent (equity risk): market value of shares and cash equivalent position for equity
and stock index derivatives;6. Maximum invested amount (position): book value of cash securities/funds (gross of the
derivatives’ delta) to ensure that assets and liabilities are balanced within the assigned budget limits;

298
7. Concentration: maximum limit, in percentage or absolute terms, on an asset that can be held in the portfolio (by instrument or issuer);
8. Credit risk Sensitivity (credit risk): change in profit or loss that would occur in the event of a shift in the reference curve by one-hundredth of a point.
Stop loss limits are monitored on a monthly basis against profit & loss results inclusive of cumulative financing since the start of the month, and on an annual basis in a report to management for appropriate decision if cumulative losses exceed twice the monthly stop loss limits.
responsibility for the daily first level checks on operating limits, position limits and stop loss limits is entrusted to the Financial Control office within the Finance Division.
Value at risk (Var) represents an estimate of the maximum potential loss on a portfolio due to adverse market conditions. Var limits are calculated assuming a 99% confidence level and a holding period of 1 day2, using for the estimated Value at Risk, calculated on a daily basis, a historical simulation based on around 250 scenarios.
Since mid February 2008, the revision of the portfolio tree of the Bank’s Finance Division has made it necessary to amend Var reporting to make it consistent with other management reports produced by the Bank. the results presented therefore refer to the new structure in the period 18 February - 31 December3, while the full-year results have been recalculated for consistency of method. this change represents a substantial revision in the limit which was previously defined by the investment’s predominant risk factor (interest rate - equity - exchange rate), but now refers to overall operations by Global Markets, while still presenting an analysis of Var for individual strategies identified in the new portfolio tree4.
the risk Management Office is responsible for reporting Var. this analysis is performed on a daily basis, partly to check that the Var remains within the parameters established and defined by the Board of Directors.
For the purposes of having a standard representation of the underlying risk factors and a consistent method of calculation, the Bank has migrated to a single risk calculation system using the Var program by Murex. this decision has the benefit not only of using the same system of position keeping as for managing and measuring risks but also of producing important operational synergies. In addition, operational risks have also been reduced as a result of no longer having to replicate in a third system the positions and deals contained in the Bank’s official system.
2 the holding period was previously 10 days.3 Var was monitored in the previous period against the limits set under the previous resolution.4 Global Markets: has defined its sphere of operation as the following areas:Global Strategies – currently not activeInterest rate Strategies – investments in the interest rates area regarding both securities and derivatives and with institu-
tional counterparties and bank customersEquity Strategies – share investments both in cash and derivativesCredit Strategies – currently not active, involves activities concentrated on asset credit ratings Forex & Commodities – forex operations in cash and derivatives, the commodities sector is currently not activeOpportunistic – management of securities and funds relating to previous investmentsSecondary Market – trading activity on the secondary market both in branded and third-party paper

299
the adoption of the new system has involved the addition of adequate backtesting and stress testing functionalities, allowing Var reports to present different scenarios in adverse market conditions and allowing risk measurements to be validated by daily comparison between the estimated loss and the theoretical profit & loss.
the calculation of Var extends to all the trading book reported for supervisory purposes.
as regards backtesting the model’s results, the Clean Backtesting approach has been used, which compares the Var calculated at time t for estimating the expected loss in time t+1 with the P&L change computed using market parameters between time t and time t+1 for the same portfolio.
the stress test, instead, measures potential vulnerability upon the occurrence of exceptional, improbable events that are nonetheless possible. the analysis – which refers to the period 18 February to 31 December 2008 - was carried out on a daily basis and the scenarios used represent 8 levels of extreme, symmetrical variations regarding stock markets, parallel shifts in rate curves, trends in exchange rates, volatility and credit spreads.
the following assumptions have been made regarding correlation between risk factors:1. rises in the stock market are accompanied by downward movements in government securities,
meaning that shares and risk-free rates rise at the same time;2. declines in the stock market are followed by a collapse in the corporate bond market (high
correlation between equities and credit spread), meaning credit spreads rise when stock markets fall.
the Var models are used solely for management control purposes and are not used for the calculation of capital adequacy. the trends in Var for the Bank’s trading book are described in point 2 below.

300
QUaNtItatIVE DISCLOSUrES
1. Trading book for supervisory purposes: distribution by residual maturity (repricing date) of recor-ded financial assets and liabilities and financial derivatives
Currency: Euro
type/residual duration Sight Up to 3 to 6 6 to 12 1 to 5 5 to 10 Over Unspecified 3 months months months years years 10 years duration 1. Cash assets – 3,676 11,501 11,794 3,804 – – –1.1 Debt securities – 3,676 11,501 11,794 3,804 – – – – with early redemption option – – – – – – – – – other – 3,676 11,501 11,794 3,804 – – –1.2 Other assets – – – – – – – –
2. Cash liabilities – (7,236) – – – – – –2.1 Debt securities – (7,236) – – – – – –2.2 Other liabilities – – – – – – – –
3. Financial derivatives – 2,873,822 794,036 (3,215,328) (600,377) 21,396 84,493 –3.1 With underlying security – (60,110) 27,631 16,234 (29,516) 23 – – – Options – (39,714) 2,205 (6,329) (699) – – – – long positions – 15,157 18,399 36,181 – – – – – short positions – (54,871) (16,194) (42,510) (699) – – – – Other derivatives – (20,396) 25,426 22,563 (28,817) 23 – – – long positions – 146,305 113,205 89,354 152 29 – – – short positions – (166,701) (87,779) (66,791) (28,969) (6) – –3.2 Without underlying security – 2,933,932 766,405 (3,231,562) (570,861) 21,373 84,493 – – Options – 869,970 (918,171) (220,422) 266,797 1,422 404 – – long positions – 4,970,464 1,819,838 2,430,911 7,576,082 55,240 4,628 – – short positions – (4,100,494) (2,738,009) (2,651,333) (7,309,285) (53,818) (4,224) – – Other derivatives – 2,063,962 1,684,576 (3,011,140) (837,658) 19,951 84,089 – – long positions – 11,028,769 3,756,999 1,531,380 4,588,045 1,348,584 293,367 – – short positions – (8,964,807) (2,072,423) (4,542,520) (5,425,703) (1,328,633) (209,278) –

301
Currency: USD
type/residual duration Sight Up to 3 to 6 6 to 12 1 to 5 5 to 10 Over Unspecified 3 months months months years years 10 years duration 1. Cash assets – – – – – – – –1.1 Debt securities – – – – – – – – – with early redemption option – – – – – – – – – other – – – – – – – –1.2 Other assets – – – – – – – –
2. Cash liabilities – – – – – – – –2.1 Debt securities – – – – – – – –2.2 Other liabilities – – – – – – – –
3. Financial derivatives – (389,196) (266,348) (180,784) 814,209 – – –3.1 With underlying security – 339 7,963 (13,705) 695 – – – – Options – 72,312 (5,304) (5,395) 695 – – – – long positions – 80,857 5,867 38,905 695 – – – – short positions – (8,545) (11,171) (44,300) – – – – – Other derivatives – (71,973) 13,267 (8,310) – – – – – long positions – 98,053 48,906 64,814 – – – – – short positions – (170,026) (35,639) (73,124) – – – –3.2 Without underlying security – (389,535) (274,311) (167,079) 813,514 – – – – Options – 7,139 3,353 – (10,492) – – – – long positions – 7,139 3,353 – 7,647 – – – – short positions – – – – (18,139) – – – – Other derivatives – (396,674) (277,664) (167,079) 824,006 – – – – long positions – 766,599 7,480 6,516 1,293,238 – – – – short positions – (1,163,273) (285,144) (173,595) (469.232) – – –

302
Currency: GBP
type/residual duration Sight Up to 3 to 6 6 to 12 1 to 5 5 to 10 Over Unspecified 3 months months months years years 10 years duration 1. Cash assets – – – – – – – –1.1 Debt securities – – – – – – – – – with early redemption option – – – – – – – – – other – – – – – – – –1.2 Other assets – – – – – – – –
2. Cash liabilities – – – – – – – –2.1 Debt securities – – – – – – – –2.2 Other liabilities – – – – – – – –
3. Financial derivatives – (2,792) 288 193 – – – –3.1 With underlying security – (3,538) – 129 – – – – – Options – (5,342) – 129 – – – – – long positions – 167 – 129 – – – – – short positions – (5,509) – – – – – – – Other derivatives – 1,804 – – – – – – – long positions – 13,248 – – – – – – – short positions – (11,444) – – – – – –3.2 Without underlying security – 746 288 64 – – – – – Options – – – – – – – – – long positions – – – – – – – – – short positions – – – – – – – – – Other derivatives – 746 288 64 – – – – – long positions – 4,411 2,083 84 – – – – – short positions – (3,665) (1,795) (20) – – – –

303
Currency: CHF
type/residual duration Sight Up to 3 to 6 6 to 12 1 to 5 5 to 10 Over Unspecified 3 months months months years years 10 years duration 1. Cash assets – – – – – – – –1.1 Debt securities – – – – – – – – – with early redemption option – – – – – – – – – other – – – – – – – –1.2 Other assets – – – – – – – –
2. Cash liabilities – – – – – – – –2.1 Debt securities – – – – – – – –2.2 Other liabilities – – – – – – – –
3. Financial derivatives – 57,274 – (506) – – – –3.1 With underlying security – 57,141 – (506) – – – – – Options – – – (6,396) – – – – – long positions – – – 8,291 – – – – – short positions – – – (14,687) – – – – – Other derivatives – 57,141 – 5,890 – – – – – long positions – 57,141 – 5,890 – – – – – short positions – – – – – – – –3.2 Without underlying security – 133 – – – – – – – Options – – – – – – – – – long positions – – – – – – – – – short positions – – – – – – – – – Other derivatives – 133 – – – – – – – long positions – 134 – – – – – – – short positions – (1) – – – – – –

304
Currency: JPY
type/residual duration Sight Up to 3 to 6 6 to 12 1 to 5 5 to 10 Over Unspecified 3 months months months years years 10 years duration 1. Cash assets – – – – – – – –1.1 Debt securities – – – – – – – – – with early redemption option – – – – – – – – – other – – – – – – – –1.2 Other assets – – – – – – – –
2. Cash liabilities – – – – – – – –2.1 Debt securities – – – – – – – –2.2 Other liabilities – – – – – – – –
3. Financial derivatives – (13,251) 1,339 (1,086) – – – –3.1 With underlying security – (14,468) 1,092 (1,086) – – – – – Options – 77 3,678 17,729 – – – – – long positions – 77 10,601 17,729 – – – – – short positions – – (6,923) – – – – – – Other derivatives – (14,545) (2,586) (18,815) – – – – – long positions – 396 1,952 – – – – – – short positions – (14,941) (4,538) (18,815) – – – –3.2 Without underlying security – 1,217 247 – – – – – – Options – – – – – – – – – long positions – – – – – – – – – short positions – – – – – – – – – Other derivatives – 1,217 247 – – – – – – long positions – 64,223 7,858 1,070 – – – – – short positions – (63,006) (7,611) (1,070) – – – –

305
Currency: Other currencies
type/residual duration Sight Up to 3 to 6 6 to 12 1 to 5 5 to 10 Over Unspecified 3 months months months years years 10 years duration 1. Cash assets – – – – – – – –1.1 Debt securities – – – – – – – – – with early redemption option – – – – – – – – – other – – – – – – – –1.2 Other assets – – – – – – – –
2. Cash liabilities – – – – – – – –2.1 Debt securities – – – – – – – –2.2 Other liabilities – – – – – – – –
3. Financial derivatives – 2,988 188 – – – – –3.1 With underlying security – (7,733) 188 – – – – – – Options – (21,221) – – – – – – – long positions – 6,095 – – – – – – – short positions – (27,316) – – – – – – – Other derivatives – 13,488 188 – – – – – – long positions – 32,307 15,627 – – – – – – short positions – (18,819) (15,439) – – – – –3.2 Without underlying security – 10,721 – – – – – – – Options – – – – – – – – – long positions – – – – – – – – – short positions – – – – – – – – – Other derivatives – 10,721 – – – – – – – long positions – 14,483 – – – – – – – short positions – (3,762) – – – – – –

306
2. Trading portfolio for supervisory purposes: internal models and other methodologies for the analysis of sensitivity
trends in Var and the results of stress tests and backtesting for the trading book in 2008 are discussed below for Banca Popolare di Vicenza.
VaR of the entire book
During the period examined, the Bank’s 1-day 99% Value at risk (Var) averaged Euro 931 thousand, with a maximum of Euro 2 million and minimum of Euro 455 thousand.
In terms of limit absorption, this averaged 19.27% with a maximum of 31.89% and a minimum of 10.11%.
at 31 December 2008, 1-day 99% Var of the entire book was Euro 541 thousand, representing a limit absorption of 12.02%.
Stress Test Scenario
as for the Stress test Scenario applied to the entire book, the following table reports the minimum, maximum, average and period-end figures (in thousands of euro) of the various scenarios.
Scenario 1 Scenario 2 Scenario 3 Scenario 4 Scenario 5 Scenario 6 Scenario 7 Scenario 8
MaX 55,146 33,401 18,184 7,354 5,253 10,289 16,514 23,914MIN – 56,090 – 34,374 – 15,431 – 6,181 – 5,713 – 10,028 – 13,567 – 17,259MEDIa 9,864 5,577 3,224 1,389 – 79 509 1,656 3,13831/12/08 40,386 23,319 12,072 4,762 -3,122 – 6,355 – 9,589 – 12,925

307
Backtesting
the following chart presents the results of backtesting during 2008.
there were three cases of negative P&L in excess of Var, one due to movements in rate curves and sudden widespread increases in credit spreads (particularly hitting securities in the financial sector) and two of a technical nature due to a structural change in the underlying pricing model.
the limited change in the risk indicator, particularly in the last part of the year, reflects a persistently prudent approach to investment strategy in an extremely volatile market context with ever higher credit spreads, and the reclassification of securities from their original accounting designation as permitted by the recent amendments to IaS 395, with their consequent departure from the scope of Var monitoring and entry into the scope of interest rate risk monitored by the aLM system.
1 this refers to the amendments to IaS 39 “Financial instruments: recognition and measurement” and to IFRS 7 “Fi-nancial instruments: disclosures” contained in the document “Reclassification of Financial Assets”, endorsed by the European Commission on 15 October 2008.

308
2.2 INtErESt ratE rISK - BaNKING BOOK
QUaLItatIVE INFOrMatION
A. General aspects, management and measurement of interest rate risk
the banking book comprises all the positions other than those included in the trading book for supervisory purposes. the interest rate risk incurred by the Bank in relation to the banking books mainly derives from the activity of transforming maturities. It particularly arises from the mismatch of interest-bearing assets and liabilities in terms of amount, due date and interest rates.
the process of measuring and controlling interest rate risk on the banking book, with the aim of effectively managing the medium/long-term economic and financial equilibrium of the Bank and the Group, is governed by a specific policy which defines:
− the principles and methods of managing risk with reference to the roles and responsibilities of corporate bodies and functions;
− the methods of measuring risk, of defining operating limits, of structuring the risk management process;
− the principles and methods used for conducting stress tests;− the Management reporting System.
responsibility for managing interest rate risk lies with the Board of Directors, which uses the Finance and aLMs Committee and relevant company functions for the strategic and operational management of the same both at the level of the Group and of individual legal entities. In particular, the governance of interest rate risk involves the following bodies:
− the Board of Directors approves the strategic guidelines and operating limits proposed by the Finance and aLMs Committee, and is periodically informed (at least once a quarter) about changes in exposure to interest rate risk and its operational management;
− the Finance and aLMs Committee proposes strategic guidelines in its consultative capacity to the Board of Directors, and sends the Finance Division operating instructions for managing interest rate risk;
− the Planning and risk Management Department is responsible for reporting and monitoring operating limits, and prepares the topics of discussion in meetings of the Finance and aLMs Committee;
− the Finance Division has direct responsibility for the operational management of interest rate risk.
the asset & Liability Management methods adopted by the Bank largely respond to the need to monitor exposure of all interest-earning assets and interest-bearing liabilities to interest rate risk when market conditions change. a report is produced once a month for the purpose of analyzing interest rate exposure of both net interest income and the economic value of the banking book. rate risk is monitored using the following models:
− repricing gap analysis: estimates repricing mismatches and expected change in net interest income following a sudden, parallel shock to rate curves (±100 bp);
− refixing gap analysis: estimates refixing mismatches (split by benchmark, such as to ensure monitoring of lags and basis risks) for floating-rate positions;
− maturity gap analysis fixed rate: estimates mismatches between fixed-rate balance sheet

309
positions in the banking book, and the corrective effects of any hedging strategies;− duration gap analysis and sensitivity analysis: estimates market value, duration, sensitivity,
bucket sensitivity of the economic value of the banking book following a sudden, parallel shock to rate curves of ±100 bp and ±200 bp;
− decalage and cashflow analysis: reports the structural liquidity position, expressed as the time distribution of balance sheet aggregates by type of rate on the basis of due dates.
the analyses performed are static and therefore exclude assumptions about future changes in the structure of assets and liabilities, in terms of volumes and product mix. Sight positions with customers are managed using a specific internal model, which makes it possible to take account of the stickiness of the rate applied to such transactions when market rates change, as well as of the duration of such positions. the inclusion of this “behavioural” model in static aLM analyses completes the collection of methods used to estimate the interest rate risk of the banking book, thereby overcoming the assumption of full and immediate repricing of such positions when market rates change and of the assumptions of the Bank of Italy’s simplified model.
Strategic and operating decisions regarding the banking book by the Finance and aLMs Committee aim to minimize the volatility in net interest income expected in the gapping period (12 months) or rather to minimize the volatility in total economic value when interest rates change.
B. Fair value hedges
the Bank has arranged specific hedges for fixed-rate or structured bonds, which are reported using the fair value option (FVO). the strategy underlying the hedge is to reduce the duration of the liability or obtain certainty for the cost of structured issues. During the first half of 2008 instruments and processes were defined for hedging accounting for specific clusters of similar fixed-rate loans (Fair value hedge - micro group hedge). Hedges taken out in the second half of 2008 referred to loans with a maturity of more than 10 years, which do not enjoy the natural hedge created by the core, inelastic component of sight deposits from customers.
C. Cash flow hedges
the Bank does not undertake cash flow hedges.

310
QUaNtItatIVE DISCLOSUrES
1. Banking book: distribution by residual duration (repricing date) of financial assets and liabilities
Currency: EURO
type/residual duration Sight Up to 3 to 6 6 to 12 1 to 5 5 to 10 Over Unspecified 3 months months months years years 10 years duration 1. Cash assets 13,604,497 2,317,624 188,824 57,190 196,161 154,274 370,725 368,653 1.1 Debt securities 17 766,651 75,093 10 103,188 36,253 37,057 – – with early redemption option – – – – – – – – – other 17 766,651 75,093 10 103,188 36,253 37,057 –1.2 Loans to banks 625,871 1,334,888 18,990 44,114 8,167 1,905 – 175,850 1.3 Loans to customers 12,978,609 216,085 94,741 13,066 84,806 116,116 333,668 192,803 – current accounts 3,255,972 – – – – – – – – other loans 9,722,637 216,085 94,741 13,066 84,806 116,116 333,668 192,803 – with early redemption option 8,840,404 203,811 15,820 12,975 82,390 116,116 333,668 – – other 882,233 12,274 78,921 91 2,416 – – 192,803
2. Cash liabilities (7,907,476) (5,436,669) (1,030,848) (670,246) (1,990,108) (368,074) (15,973) –2.1 Due to customers (5,898,785) (723,863) (556) (1,229) (3,359) – – – – current accounts (5,672,085) – – – – – – – – other payables (226,700) (723,863) (556) (1,229) (3,359) – – – – with early redemption option – – – – – – – – – other (226,700) (723,863) (556) (1,229) (3,359) – – –2.2 Deposits from banks (150,491) (2,664,726) (421,881) (35,126) – – – – – current accounts (40,703) – – – – – – – – other payables (109,788) (2,664,726) (421,881) (35,126) – – – –2.3 Debt securities (1,858,200) (2,048,080) (608,411) (633,891) (1,986,749) (368,074) (15,973) – – with early redemption option – – – – – – – – – other (1,858,200) (2,048,080) (608,411) (633,891) (1,986,749) (368,074) (15,973) –2.4 Other liabilities – – – – – – – – – with early redemption option – – – – – – – – – other – – – – – – – –
3. Financial derivatives – (252,218) (109,102) (912,747) 1,432,611 108,247 (266,791) –3.1 With underlying security – – – – – – – – – Options – – – – – – – – – long positions – – – – – – – – – short positions – – – – – – – – – Other derivatives – – – – – – – – – long positions – – – – – – – – – short positions – – – – – – – –3.2 Without underlying security – (252,218) (109,102) (912,747) 1,432,611 108,247 (266,791) – – Options – (1) – 32,250 1 (32,250) – – – long positions – – – 32,250 1 – 4,301 – – short positions – (1) – – – (32,250) (4,301) – – Other derivatives – (252,217) (109,102) (944,997) 1,432,610 140,497 (266,791) – – long positions – 929,324 149,285 535,200 1,718,204 233,101 25,000 – – short positions – (1,181,541) (258,387) (1,480,197) (285,594) (92,604) (291,791) –

311
Currency: USD
type/residual duration Sight Up to 3 to 6 6 to 12 1 to 5 5 to 10 Over Unspecified 3 months months months years years 10 years duration 1. Cash assets 117,682 159,064 2,618 25,909 – – – –1.1 Debt securities – – – – – – – – – with early redemption option – – – – – – – – – other – – – – – – – –1.2 Loans to banks 39,337 23,491 1,456 20,884 – – – –1.3 Loans to customers 78,345 135,573 1,162 5,025 – – – – – current accounts 195 – – – – – – – – other loans 78,150 135,573 1,162 5,025 – – – – – with early redemption option 78,150 135,573 1,113 5,025 – – – – – other – – 49 – – – – –
2. Cash liabilities (97,325) (199,717) (10,308) (11,201) – – – –2.1 Due to customers (59,669) (19,430) (461) (1,570) – – – – – current accounts (59,444) – – – – – – – – other payables (225) (19,430) (461) (1,570) – – – – – with early redemption option – – – – – – – – – other (225) (19,430) (461) (1,570) – – – –2.2 Deposits from banks (37,656) (176,629) (9,847) (9,631) – – – – – current accounts (13,203) – – – – – – – – other payables (24,453) (176,629) (9,847) (9,631) – – – –2.3 Debt securities – (3,658) – – – – – – – with early redemption option – – – – – – – – – other – (3,658) – – – – – –2.4 Other liabilities – – – – – – – – – with early redemption option – – – – – – – – – other – – – – – – – –
3. Financial derivatives – (22,721) 9 (4,948) 3,593 – – –3.1 With underlying security – – – – 3,593 – – – – Options – – – – – – – – – long positions – – – – – – – – – short positions – – – – – – – – – Other derivatives – – – – 3,593 – – – – long positions – – – – 3,593 – – – – short positions – – – – – – – –3.2 Without underlying security – (22,721) 9 (4,948) – – – – – Options – – – – – – – – – long positions – – – – – – – – – short positions – – – – – – – – – Other derivatives – (22,721) 9 (4,948) – – – – – long positions – – 9 – – – – – – short positions – (22,721) – (4,948) – – – –

312
Currency: GBP
type/residual duration Sight Up to 3 to 6 6 to 12 1 to 5 5 to 10 Over Unspecified 3 months months months years years 10 years duration 1. Cash assets 6,211 1,457 – – – – – – 1.1 Debt securities – – – – – – – – – with early redemption option – – – – – – – – – other – – – – – – – – 1.2 Loans to banks 2,786 – – – – – – – 1.3 Loans to customers 3,425 1,457 – – – – – – – current accounts 5 – – – – – – – – other loans 3,420 1,457 – – – – – – – with early redemption option 1,595 1,068 – – – – – – – other 1,825 389 – – – – – –
2. Cash liabilities (4,528) (525) – (195) – – – – 2.1 Due to customers (4,521) – – (195) – – – – – current accounts (4,521) – – – – – – – – other payables – – – (195) – – – – – with early redemption option – – – – – – – – – other – – – (195) – – – – 2.2 Deposits from banks (7) (525) – – – – – – – current accounts (7) – – – – – – – – other payables – (525) – – – – – – 2.3 Debt securities – – – – – – – – – with early redemption option – – – – – – – – – other – – – – – – – – 2.4 Other liabilities – – – – – – – – – with early redemption option – – – – – – – – – other – – – – – – – –
3. Financial derivatives – – – – – – – – 3.1 With underlying security – – – – – – – – – Options – – – – – – – – – long positions – – – – – – – – – short positions – – – – – – – – – Other derivatives – – – – – – – – – long positions – – – – – – – – – short positions – – – – – – – – 3.2 Without underlying security – – – – – – – – – Options – – – – – – – – – long positions – – – – – – – – – short positions – – – – – – – – – Other derivatives – – – – – – – – – long positions – 1,050 – – – – – – – short positions – (1,050) – – – – – –

313
Currency: CHF
type/residual duration Sight Up to 3 to 6 6 to 12 1 to 5 5 to 10 Over Unspecified 3 months months months years years 10 years duration 1. Cash assets 31,684 12,126 – – – – – – 1.1 Debt securities – – – – – – – – – with early redemption option – – – – – – – – – other – – – – – – – – 1.2 Loans to banks 11,995 12,126 – – – – – – 1.3 Loans to customers 19,689 – – – – – – – – current accounts – – – – – – – – – other loans 19,689 – – – – – – – – with early redemption option 19,689 – – – – – – – – other – – – – – – – –
2. Cash liabilities (1,044) (22,057) – – – – – – 2.1 Due to customers (1,044) (83) – – – – – – – current accounts (1,044) – – – – – – – – other payables – (83) – – – – – – – with early redemption option – – – – – – – – – other – (83) – – – – – – 2.2 Deposits from banks – (21,974) – – – – – – – current accounts – – – – – – – – – other payables – (21,974) – – – – – – 2.3 Debt securities – – – – – – – – – with early redemption option – – – – – – – – – other – – – – – – – – 2.4 Other liabilities – – – – – – – – – with early redemption option – – – – – – – – – other – – – – – – – –
3. Financial derivatives – – – – – – – – 3.1 With underlying security – – – – – – – – – Options – – – – – – – – – long positions – – – – – – – – – short positions – – – – – – – – – Other derivatives – – – – – – – – – long positions – – – – – – – – – short positions – – – – – – – – 3.2 Without underlying security – – – – – – – – – Options – – – – – – – – – long positions – – – – – – – – – short positions – – – – – – – – – Other derivatives – – – – – – – – – long positions – – – – – – – – – short positions – – – – – – – –

314
Currency: JPY
type/residual duration Sight Up to 3 to 6 6 to 12 1 to 5 5 to 10 Over Unspecified 3 months months months years years 10 years duration 1. Cash assets 15,640 4,687 875 – – – – – 1.1 Debt securities – – – – – – – – – with early redemption option – – – – – – – – – other – – – – – – – – 1.2 Loans to banks 2,458 4,528 875 – – – – – 1.3 Loans to customers 13,182 159 – – – – – – – current accounts – – – – – – – – – other loans 13,182 159 – – – – – – – with early redemption option 13,182 159 – – – – – – – other – – – – – – – –
2. Cash liabilities (2,051) (6,543) – – – – – – 2.1 Due to customers (498) (2,072) – – – – – – – current accounts (498) – – – – – – – – other payables – (2,072) – – – – – – – with early redemption option – – – – – – – – – other – (2,072) – – – – – – 2.2 Deposits from banks (1,553) (4,471) – – – – – – – current accounts (1,553) – – – – – – – – other payables – (4,471) – – – – – – 2.3 Debt securities – – – – – – – – – with early redemption option – – – – – – – – – other – – – – – – – – 2.4 Other liabilities – – – – – – – – – with early redemption option – – – – – – – – – other – – – – – – – –
3. Financial derivatives – – – – – – – – 3.1 With underlying security – – – – – – – – – Options – – – – – – – – – long positions – – – – – – – – – short positions – – – – – – – – – Other derivatives – – – – – – – – – long positions – – – – – – – – – short positions – – – – – – – – 3.2 Without underlying security – – – – – – – – – Options – – – – – – – – – long positions – – – – – – – – – short positions – – – – – – – – – Other derivatives – – – – – – – – – long positions – – – – – – – – – short positions – – – – – – – –

315
Currency: Other currencies
type/residual duration Sight Up to 3 to 6 6 to 12 1 to 5 5 to 10 Over Unspecified 3 months months months years years 10 years duration 1. Cash assets 11,250 – – – – – – – 1.1 Debt securities – – – – – – – – – with early redemption option – – – – – – – – – other – – – – – – – – 1.2 Loans to banks 6,732 – – – – – – – 1.3 Loans to customers 4,518 – – – – – – – – current accounts – – – – – – – – – other loans 4,518 – – – – – – – – with early redemption option 4,518 – – – – – – – – other – – – – – – – –
2. Cash liabilities (5,473) (2,754) – (8) (24,246) – – – 2.1 Due to customers (4,528) (920) – (8) – – – – – current accounts (4,528) – – – – – – – – other payables – (920) – (8) – – – – – with early redemption option – – – – – – – – – other – (920) – (8) – – – – 2.2 Deposits from banks (945) (1,834) – – – – – – – current accounts (945) – – – – – – – – other payables – (1,834) – – – – – – 2.3 Debt securities – – – – (24,246) – – – – with early redemption option – – – – – – – – – other – – – – (24,246) – – – 2.4 Other liabilities – – – – – – – – – with early redemption option – – – – – – – – – other – – – – – – – –
3. Financial derivatives – – – – 24,076 – – – 3.1 With underlying security – – – – 24,076 – – – – Options – – – – – – – – – long positions – – – – – – – – – short positions – – – – – – – – – Other derivatives – – – – 24,076 – – – – long positions – – – – 24,076 – – – – short positions – – – – – – – – 3.2 Without underlying security – – – – – – – – – Options – – – – – – – – – long positions – – – – – – – – – short positions – – – – – – – – – Other derivatives – – – – – – – – – long positions – 2,506 – – – – – – – short positions – (2,506) – – – – – –

316
2. Banking book: internal models and other methods of sensitivity analysis
as mentioned earlier, the Bank uses a static aLM model to measure the sensitivity of the banking book’s financial and economic equilibrium to changes in interest rates.
Stress testing represents the collection of qualitative and quantitative techniques used by the Bank to assess its vulnerability to adverse market conditions. the Bank periodically carries out stress tests to measure and control the interest rate risk of the banking book. Stress tests look at target variables with a view to the «outlook for current profits» and the «outlook for market values». Stress tests are conducted for the following purposes:
− to highlight the risk generated by any mismatches between interest-earning assets and interest-bearing liabilities, and so clearly define what actions are needed to mitigate and keep interest rate risk within the established limits;
− to produce measures of sensitivity to monitor the operating limits on interest rate risk.
the scenarios adopted for measuring the exposure of net interest income to risk assume that rate curves shift by ±100 basis points. the scenarios used to measure the exposure of the banking book’s economic value to risk assume that rate curves shift by ±100 basis points and ±200 basis points. In each of these scenarios, all the risk factors experience the same shock.
as stated before, the estimates are made under the assumption that the structure of the balance sheet remains unchanged in terms of volumes and product mix. the stickiness and persistency of sight positions with customers are managed using a specific internal model.
the principal indicators of the banking book’s interest rate risk at 31 December 2008 are set out below.
Positive shock
▲ Net interest income + 100 bps euro 2,948,983 % Net interest income 0.75%
▲ Economic value + 100 bps euro -36,602,656 % regulatory Capital -1.38%
▲ Economic value + 200 bps euro -67,362,176 % regulatory Capital -2.53%
Negative shock
▲ Net interest income - 100 bps euro -2,890,167 % Net interest income -0.73%
▲ Economic value - 100 bps euro 43,671,696 % regulatory Capital 1.64%
▲ Economic value - 200 bps euro 95,923,733 % regulatory Capital 3.61%

317
The need to assess the Bank’s vulnerability to exceptional but plausible events has involved developing more complex, detailed scenarios than the shift ones. the twist scenarios respond to this requirement: the construction of such scenarios (involving curve steepening, flattening and inversion) requires the shocks to be initially applied to specific points of the curves, and that the resulting shock differential be transferred to other points. the use of these scenarios helps estimate sensitivity indicators for many risk factors, represented by individual points of the rate curves.

318
2.3 PrICE rISK - traDING BOOK FOr SUPErVISOrY PUrPOSES
QUaLItatIVE INFOrMatION
A. General aspects
Price risk represents the risk associated with changes in the value of equity portfolios due to fluctuations in market prices. this risk is analyzed between:
– Generic risk: change in the price of an equity instrument following fluctuations in the market concerned;
– Specific risk: change in the market price of a specific equity instrument due to revised market expectations about the financial strength or prospects of the issuer.
Financial year 2008 proved extremely difficult, if not dramatic for equity and credit markets, whose steep correction commencing in the initial quarters of the year got considerably worse over the summer with the financial crisis being exacerbated by the collapse of Lehman Brothers, the US investment bank. Some of the principal reasons for the steep downturn by international stock markets include: continued deterioration of conditions on the real estate market; the rise in commodity and oil prices in the first half of the year, followed by an unprecedented collapse in the second half; the worsening of the international macroeconomic environment, with a significant deterioration in all the principal indicators of consumption, productivity, confidence and employment.
Investment strategy relating to the equities trading book was based on extreme prudence and caution, which in practical terms translated into rigid operating limits on total exposure, concentration and stop-loss, with the aim of ensuring operational tranquillity and effective control of risk in such a volatile market. a “fundamental relative value” approach was adopted rather than one based on trend, building a portfolio of pan-European large-cap shares (with the focus on value shares) selected after detailed intersector and intrasector analysis, and using liquid and diversified stock index futures for hedging (Futures on Eurostoxx50 and Dax). Preference was given to defensive sectors, with a particular focus on Food, Pharma, Consumer Staples, Utility and Energy, while strategically avoiding the Financial sector and considering more cyclical sectors (auto, Industrial and Basic resources) only in the event of significant losses and only with a view to short-term investment.
the exposure to equity markets was reduced even further following the collapse of Lehman Brothers, with it effectively being impossible to manage the portfolio profitably in such a fragile, emotional market, in which the level of intra-day volatility combined with the international authorities’ ban on short-selling in certain sectors made it impracticable to operate an “equity market neutral” strategy and very difficult to hedge positions effectively with derivatives.
B. Management and measurement of price risk
the processes for the management and measurement of price risk have been described in section 2.1 “Interest-rate risk – trading book for supervisory purposes”, to which reference is made.

319
3. Trading book for supervisory purposes: internal models and other methods of sensitivity analysis
the processes for the management and measurement of price risk in relation to listed equities and mutual funds have been described in section 2.1 “Interest-rate risk – trading book for supervisory purposes”, to which reference is made.
QUaNtItatIVE DISCLOSUrES
1. Trading book for supervisory purposes: cash exposures in equities and mutual funds
assets/ amounts Book value Listed Unlisted
A. Equities 2,338 –a.1 Shares 2,338 –a.2 Innovative equity instruments – –a.3 Other equities – –
B. Mutual funds – – B.1 Italian – – – open-end harmonized – – – open-end, not harmonized – – – closed-end – – – reserved – – – hedge funds – – B.2 Other EU nations – – – open-end harmonized – – – open-end, not harmonized – – – closed-end, not harmonized – –B.3 Non-EU nations – – – open-end – – – closed-end – –
Total 2,338 –
2. Trading book for supervisory purposes: distribution of the exposures in equities and stock indices by principal country and market of listing
assets/ amounts Listed Unlisted Italy France Germany Switzerland Other countries A. Equities – long positions 1,252 551 355 111 69 – – short positions – – – – – – B. Unsettled transaction in equities – long positions 33 – – – – – – short positions (12) – – – – – C. Other derivatives on equities – long positions – – – – – – – short positions – – – – (441) – D. Derivatives on equity indices – long positions – – – – – 280,296 – short positions – – – – – (280,296)

320
2.4 PrICE rISK - BaNKING BOOK
QUaLItatIVE INFOrMatION
A. General aspects, management and measurement of price risk
the banking book comprises minority holdings in equities classified as available for sale (aFS) and mutual funds. Investments in associates and subsidiaries are also included.
B. Hedging of price risk
the Bank does not arrange hedges of this kind.
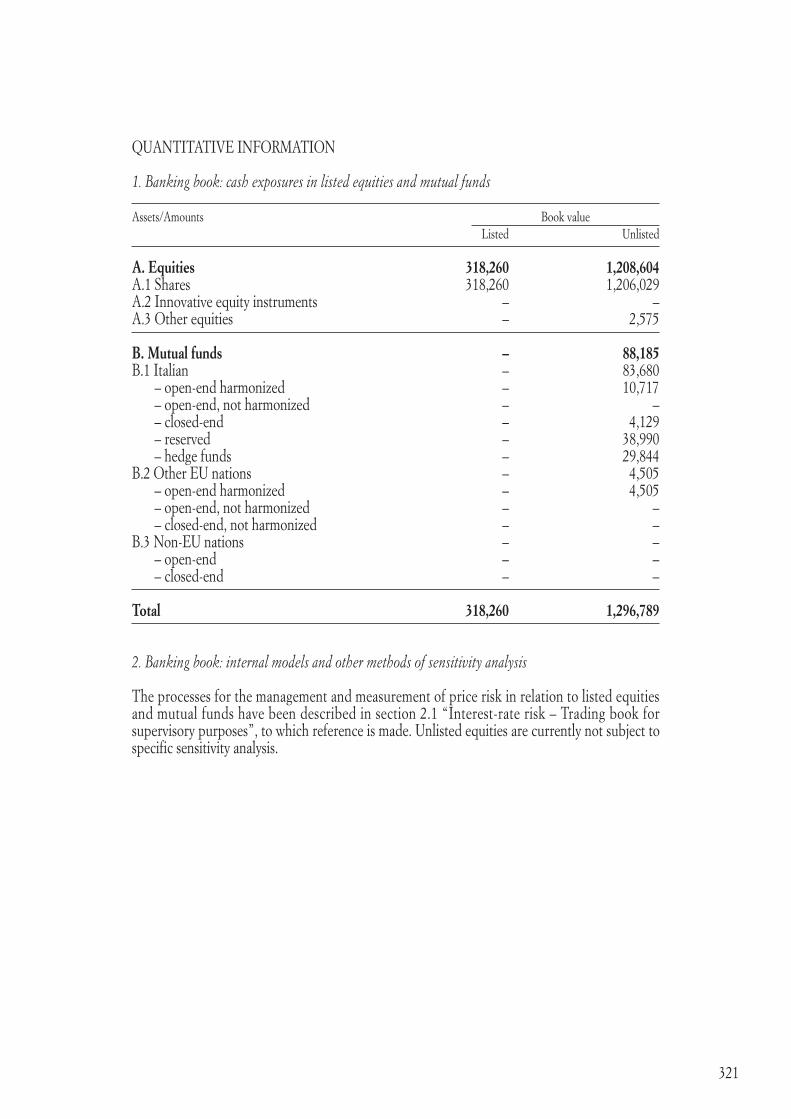
321
QUaNtItatIVE INFOrMatION
1. Banking book: cash exposures in listed equities and mutual funds
assets/amounts Book value Listed Unlisted
A. Equities 318,260 1,208,604 a.1 Shares 318,260 1,206,029 a.2 Innovative equity instruments – – a.3 Other equities – 2,575
B. Mutual funds – 88,185 B.1 Italian – 83,680 – open-end harmonized – 10,717 – open-end, not harmonized – – – closed-end – 4,129 – reserved – 38,990 – hedge funds – 29,844 B.2 Other EU nations – 4,505 – open-end harmonized – 4,505 – open-end, not harmonized – – – closed-end, not harmonized – – B.3 Non-EU nations – – – open-end – – – closed-end – –
Total 318,260 1,296,789
2. Banking book: internal models and other methods of sensitivity analysis
the processes for the management and measurement of price risk in relation to listed equities and mutual funds have been described in section 2.1 “Interest-rate risk – trading book for supervisory purposes”, to which reference is made. Unlisted equities are currently not subject to specific sensitivity analysis.

322
2.5 EXCHaNGE ratE rISK
QUaLItatIVE INFOrMatION
A. General aspects, management and measurement of operational risk
Exchange rate risk represents the risk associated with changes in the value of positions denominated in foreign currencies deriving from unexpected variations in the cross rates. Exchange rate risk is principally generated by the support provided for commercial activity in foreign currencies and by trading in foreign securities.
automatic network systems interfaced with a single position-keeping system enable the Global Markets Department to monitor constantly, in real time, the currency flows that are processed instantaneously on the interbank forex market. In addition, a specific unit within the Global Markets Department is responsible for managing on own account positions and products relating to the exchange derivatives needed to meet the various investment and hedging requirements of Group customers.
an advanced management system (Murex, the subject of work in the year to improve input of volatility parameters) and an external pricing system (Super-Derivatives) assure the efficient management of spot, forward and option flows within a specific framework of limits set by the competent organizational bodies.
B. Hedging of exchange rate risk
Currency investment and hedging of exchange rate risk involve transactions that minimize currency exposure (purchase and sale of currency on the interbank market) as well as management of the derivatives book by delta hedging and managing the risk curves within precise limits.

323
QUaNtItatIVE INFOrMatION
1. Breakdown by currency of assets, liabilities and derivatives
2. Internal models and other methods of sensitivity analysis
the exchange rate risk generated by the trading book and the banking book is monitored using the Var model described in detail in section 2.1 “Interest-rate risk - trading book for supervisory purposes”, to which reference is made. With regard to the estimation of exchange-rate risk, reference is made to the tables included in the quantitative information for that section.
Line items Currency US Sterling Japanese Canadian Swiss Other Dollars Yen Dollars Francs currencies A. Financial assets 305,273 7,668 21,202 707 43,810 14,208 a.1 Debt securities – – – – – – a.2 Equities – – – – – 3,665 a.3 Loans to banks 85,168 2,786 7,861 681 24,121 6,051 a.4 Loans to customer 220,105 4,882 13,341 26 19,689 4,492 a.5 Other financial assets – – – – – –
B. Other assets – – – – – –
C. Financial liabilities (318,551) (5,248) (8,594) (2,305) (23,101) (30,176)C.1 Deposits from banks (233,763) (532) (6,024) (581) (21,974) (2,198)C.2 Due to customer (81,130) (4,716) (2,570) (1,724) (1,127) (3,732)C.3 Debt securities (3,658) – – – – (24,246)
D. Other financial liabilities – – – – – –
E. Financial derivatives (46,186) (2,311) (12,998) 4,476 56,768 22,776 – Options 62,308 (5,213) 21,484 (21,221) (6,396) – – long positions 144,463 296 28,407 – 8,291 6,095 – short positions (82,155) (5,509) (6,923) (21,221) (14,687) (6,095) – Other derivatives (108,494) 2,902 (34,482) 25,697 63,164 22,776 – long positions 2,289,208 20,876 75,499 26,845 63,165 62,154 – short positions (2,397,702) (17,974) (109,981) (1,148) (1) (39,378)
Total assets 2,738,944 28,840 125,108 27,552 115,266 82,457
Total liabilities (2,798,408) (28,731) (125,498) (24,674) (37,789) (75,649)
Net balance (+/–) (59,464) 109 (390) 2,878 77,477 6,808

324
2.6 FINaNCIaL DErIVatIVES
a. FINaNCIaL DErIVatIVES
A.1 Trading book: period-end and average notional amounts
type of transaction/Underlyings Debt securities Equities Exchange and interest rates and equities indices rates and gold Listed Unlisted Listed Unlisted Listed Unlisted
1. Forward rate agreements – 607,782 – – – – 2. Interest rate swaps – 19,581,611 – – – – 3. Domestic currency swaps – – – – – – 4. Currency interest rate swap – – – – – 604,926 5. Basic swaps – 2,957,929 – – – – 6. Swap of stock indices – – – – – – 7. Swap of real indices – – – – – – 8. Futures 1,346,887 – 441 – – – 9. Cap options – 25,941,472 – – – – – purchased – 13,064,419 – – – – – issued – 12,877,053 – – – – 10. Floor options – 20,684,395 – – – – – purchased – 8,644,345 – – – – – issued – 12,040,050 – – – – 11. Other options – 2,402,170 – 560,592 – 595,033 – Purchased – 1,201,000 – 280,296 – 322,529 – Plain vanilla – 1,200,000 – 211,172 – 290,159 – Exotic – 1,000 – 69,124 – 32,370 – Issued – 1,201,170 – 280,296 – 272,504 – Plain vanilla – 1,200,000 – 211,172 – 272,504 – Exotic – 1,170 – 69,124 – – 12. Forward contracts 73,847 1,754 45 – – 220,382 – Purchases 55,452 311 33 – – 106,505 – Sales 18,395 1,443 12 – – 110,486 – Currency against currency – – – – – 3,391 13. Other derivative contracts – – – – – –
Total 1,420,734 72,177,113 486 560,592 – 1,420,341
Averages 948,950 41,410,259 486 635,436 – 1,752,531

325
type of transaction/Underlyings Other instruments 31/12/2008 31/12/2007 Listed Unlisted Listed Unlisted Listed Unlisted
1. Forward rate agreement – – – 607,782 – – 2. Interest rate swaps – – – 19,581,611 – 28,047,847 3. Domestic currency swaps – – – – – – 4. Currency interest rate swaps – – – 604,926 – 339,246 5. Basic swaps – – – 2,957,929 – 3,416,799 6. Swap of stock indices – – – – – – 7. Swap of real indices – – – – – – 8. Futures – – 1,347,328 – 477,165 – 9. Cap options – – – 25,941,472 – 38,510,299 – purchased – – – 13,064,419 – 19,098,346 – issued – – – 12,877,053 – 19,411,953 10. Floor options – – – 20,684,395 – 33,911,199 – purchased – – – 8,644,345 – 14,415,779 – issued – – – 12,040,050 – 19,495,420 11. Other options – – – 3,557,795 – 4,684,551 – Purchased – – – 1,803,825 – 2,340,666 – Plain vanilla – – – 1,701,331 – 2,046,404 – Exotic – – – 102,494 – 294,262 – Issued – – – 1,753,970 – 2,343,885 – Plain vanilla – – – 1,683,676 – 2,071,548 – Exotic – – – 70,294 – 272,337 12. Forward contracts – – 73,892 222,136 – 319,153 – Purchases – – 55,485 106,816 – 108,198 – Sales – – 18,407 111,929 – 176,972 – Currency against currency – – – 3,391 – 33,983 13. Other derivative contracts – – – – – –
Total – – 1,421,220 74,158,046 477,165 109,229,094
Averages – – 949,436 43,798,225 238,583 126,412,393

326
A.2 Banking book: notional amounts at period end and average
A.2.1 For hedging
type of transaction/Underlyings Debt securities Equities Exchange and interest rates and equity indices rates and gold Listed Unlisted Listed Unlisted Listed Unlisted
1. Forward rate agreements – – – – – – 2. Interest rate swaps – 281,791 – – – – 3. Domestic currency swaps – – – – – – 4. Currency interest rate swap – – – – – – 5. Basic swaps – – – – – – 6. Swap of stock indices – – – – – – 7. Swap of real indices – – – – – – 8. Futures – – – – – – 9. Cap options – – – – – – – purchased – – – – – – – issued – – – – – – 10. Floor options – – – – – – – purchased – – – – – – – issued – – – – – – 11. Other options – – – – – – – Purchased – – – – – – – Plain vanilla – – – – – – – Exotic – – – – – – – Issued – – – – – – – Plain vanilla – – – – – – – Exotic – – – – – – 12. Forward contracts – – – – – – – Purchases – – – – – – – Sales – – – – – – – Currency against currency – – – – – – 13. Other derivative contracts – – – – – –
Total – 281,791 – – – –
Averages – 281,791 – – – –

327
type of transaction/Underlyings Other instruments 31/12/2008 31/12/2007 Listed Unlisted Listed Unlisted Listed Unlisted
1. Forward rate agreements – – – – – – 2. Interest rate swaps – – – 281,791 – – 3. Domestic currency swaps – – – – – – 4. Currency interest rate swap – – – – – – 5. Basic swaps – – – – – – 6. Swap of stock indices – – – – – – 7. Swap of real indices – – – – – – 8. Futures – – – – – – 9. Cap options – – – – – – – purchased – – – – – – – issued – – – – – – 10. Floor options – – – – – – – purchased – – – – – – – issued – – – – – – 11. Other options – – – – – – – Purchased – – – – – – – Plain vanilla – – – – – – – Exotic – – – – – – – Issued – – – – – – – Plain vanilla – – – – – – – Exotic – – – – – – 12. Forward contracts – – – – – – – Purchases – – – – – – – Sales – – – – – – – Currency against currency – – – – – – 13. Other derivative contracts – – – – – –
Total 281,791
Averages 281,791

328
A.2.2 Other derivatives
type of transaction/Underlyings Debt securities Equities Exchange and interest rates and equity indices rates and gold Listed Unlisted Listed Unlisted Listed Unlisted
1. Forward rate agreements – – – – – – 2. Interest rate swaps – 2,168,390 – – – – 3. Domestic currency swaps – – – – – – 4. Currency interest rate swaps – – – – – 27,669 5. Basic swaps – 996,624 – – – – 6. Swap of stock indices – – – – – – 7. Swap of real indices – – – – – – 8. Futures – – – – – – 9. Cap options – 42,250 – – – – – purchased – 32,250 – – – – – issued – 10,000 – – – – 10. Floor options – 97,000 – – – – – purchased – 97,000 – – – – – issued – – – – – – 11. Other options – 600 – 59,563 – – – Purchased – 600 – 59,563 – – – Plain vanilla – 600 – – – – – Exotic – – – 59,563 – – – Issued – – – – – – – Plain vanilla – – – – – – – Exotic – – – – – – 12. Forward contracts – – – – – – – Purchases – – – – – – – Sales – – – – – – – Currency against currency – – – – – – 13. Other derivative contracts – – – – – –
Total – 3,304,864 – 59,563 – 27,669
Average s – 3,048,967 – 59,563 – 27,749
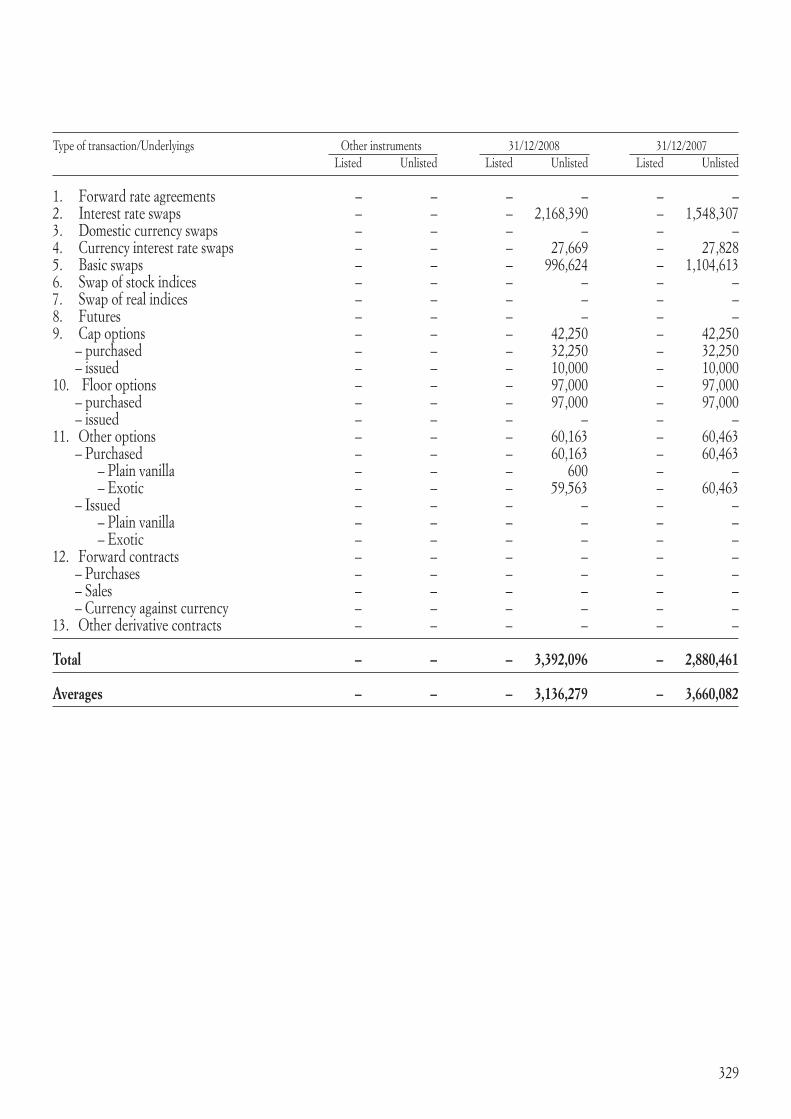
329
type of transaction/Underlyings Other instruments 31/12/2008 31/12/2007 Listed Unlisted Listed Unlisted Listed Unlisted
1. Forward rate agreements – – – – – – 2. Interest rate swaps – – – 2,168,390 – 1,548,307 3. Domestic currency swaps – – – – – – 4. Currency interest rate swaps – – – 27,669 – 27,828 5. Basic swaps – – – 996,624 – 1,104,613 6. Swap of stock indices – – – – – – 7. Swap of real indices – – – – – – 8. Futures – – – – – – 9. Cap options – – – 42,250 – 42,250 – purchased – – – 32,250 – 32,250 – issued – – – 10,000 – 10,000 10. Floor options – – – 97,000 – 97,000 – purchased – – – 97,000 – 97,000 – issued – – – – – – 11. Other options – – – 60,163 – 60,463 – Purchased – – – 60,163 – 60,463 – Plain vanilla – – – 600 – – – Exotic – – – 59,563 – 60,463 – Issued – – – – – – – Plain vanilla – – – – – – – Exotic – – – – – – 12. Forward contracts – – – – – – – Purchases – – – – – – – Sales – – – – – – – Currency against currency – – – – – – 13. Other derivative contracts – – – – – –
Total – – – 3,392,096 – 2,880,461
Averages – – – 3,136,279 – 3,660,082
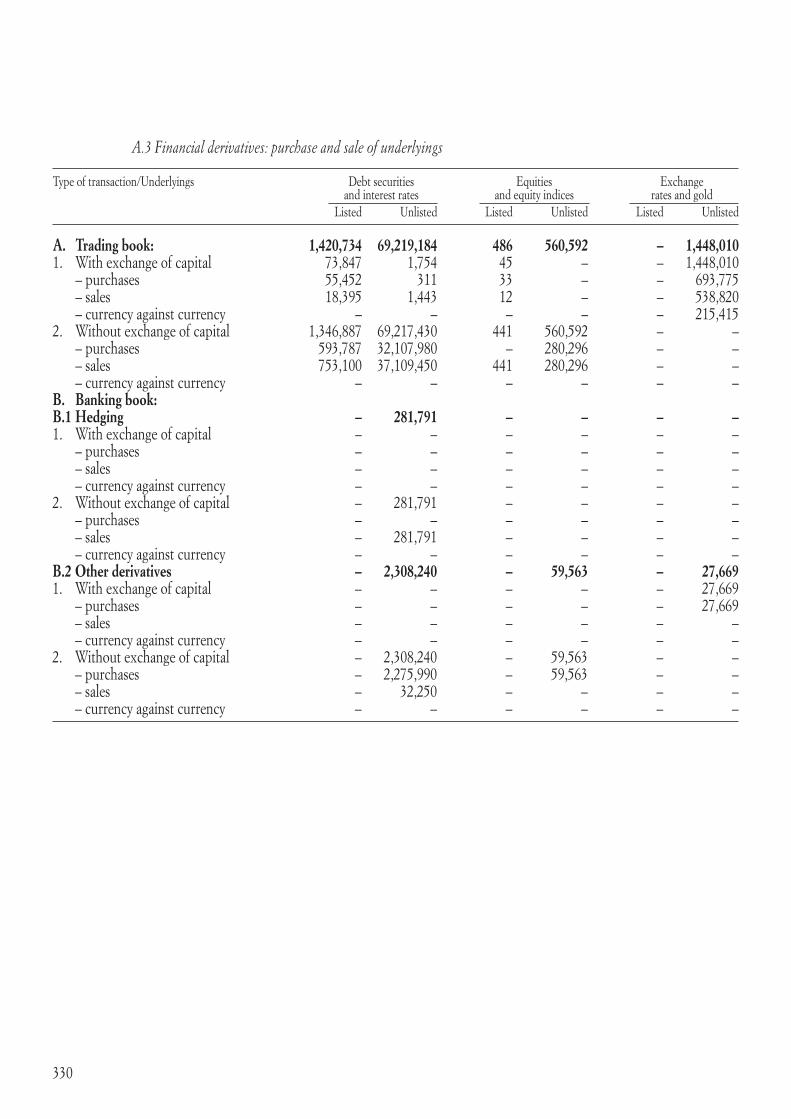
330
A.3 Financial derivatives: purchase and sale of underlyings
type of transaction/Underlyings Debt securities Equities Exchange and interest rates and equity indices rates and gold Listed Unlisted Listed Unlisted Listed Unlisted
A. Trading book: 1,420,734 69,219,184 486 560,592 – 1,448,010 1. With exchange of capital 73,847 1,754 45 – – 1,448,010 – purchases 55,452 311 33 – – 693,775 – sales 18,395 1,443 12 – – 538,820 – currency against currency – – – – – 215,415 2. Without exchange of capital 1,346,887 69,217,430 441 560,592 – – – purchases 593,787 32,107,980 – 280,296 – – – sales 753,100 37,109,450 441 280,296 – – – currency against currency – – – – – – B. Banking book: B.1 Hedging – 281,791 – – – – 1. With exchange of capital – – – – – – – purchases – – – – – – – sales – – – – – – – currency against currency – – – – – – 2. Without exchange of capital – 281,791 – – – – – purchases – – – – – – – sales – 281,791 – – – – – currency against currency – – – – – – B.2 Other derivatives – 2,308,240 – 59,563 – 27,669 1. With exchange of capital – – – – – 27,669 – purchases – – – – – 27,669 – sales – – – – – – – currency against currency – – – – – – 2. Without exchange of capital – 2,308,240 – 59,563 – – – purchases – 2,275,990 – 59,563 – – – sales – 32,250 – – – – – currency against currency – – – – – –

331
type of transaction/Underlyings Other instruments 31/12/2008 31/12/2007 Listed Unlisted Listed Unlisted Listed Unlisted
A. Trading book: – – 1,421,220 71,227,786 477,165 105,812,295 1. With exchange of capital – – 73,892 1,449,764 – 2,164,301 – purchases – – 55,485 694,086 – 926,310 – sales – – 18,407 540,263 – 935,965 – currency against currency – – – 215,415 – 302,026 2. Without exchange of capital – – 1,347,328 69,778,022 477,165 103,647,994 – purchases – – 593,787 32,388,276 293,050 47,475,148 – sales – – 753,541 37,389,746 184,115 56,172,846 – currency against currency – – – – – – B. Banking book: B.1 Hedging – – – 281,791 – – 1. With exchange of capital – – – – – – – purchases – – – – – – – sales – – – – – – – currency against currency – – – – – – 2. Without exchange of capital – – – 281,791 – – – purchases – – – – – – – sales – – – 281,791 – – – currency against currency – – – – – – B.2 Other derivatives – – – 2,395,472 – 1,775,848 1. With exchange of capital – – – 27,669 – 27,828 – purchases – – – 27,669 – 27,828 – sales – – – – – – – currency against currency – – – – – – 2. Without exchange of capital – – – 2,367,803 – 1,748,020 – purchases – – – 2,335,553 – 1,715,770 – sales – – – 32,250 – 32,250 – currency against currency – – – – – –

332
A.4 Over-the-counter financial derivatives: positive fair value - counterparty risk
Counterparty/Underlyings Debt securities and interest rates Equities and equity indices Exchange rates and gold Other instruments Different underlying Gross not Gross Future Gross not Gross Future Gross not Gross Future Gross not Gross Future Offset Future offset offset exposure offset offset exposure offset offset exposure offset offset exposure exposure
A. Trading book for supervisory purposes a.1 Governments and central banks – – – – – – – – – – – – – – a.2 Public entities – – – – – – – – – – – – – – a.3 Banks 34,401 34,401 113,131 – – 20,948 14,902 14,902 7,670 – – – 76,810 52,145 a.4 Financial companies 10,011 10,011 3,975 – – 643 168 168 1,293 – – – 3,039 949 a.5 Insurance companies – – – – – – – – – – – – – – a.6 Non-financial institutions 79,223 79,223 18,476 – – – 13,137 13,137 2,490 – – – – – a.7 Other issuers 103 103 15 – – – 1,859 1,859 478 – – – – –
Total at 31/12/2008 123,738 123,738 135,597 – – 21,591 30,066 30,066 11,931 – – – 79,849 53,094
Total at 31/12/2007 471,783 471,783 173,700 48,139 48,139 32,438 22,109 22,109 9,399 – – – – –
B. Banking book B.1 Governments and central banks – – – – – – – – – – – – – – B.2 Public entities – – – – – – – – – – – – – – B.3 Banks 18,875 18,875 12,388 – – 4,765 – – – – – – 86,212 16,420 B.4 Financial companies – – 238 – – – – – – – – – 8,158 238 B.5 Insurance companies – – – – – – – – – – – – – – B.6 Non-financial institutions – – – – – – – – – – – – – – B.7 Other issuers – – – – – – – – – – – – – –
Total at 31/12/2008 18,875 18,875 12,626 – – 4,765 – – – – – – 94,370 16,658
Total at 31/12/2007 23,522 23,522 6,142 – – – – – – – – – – –

333
Counterparty/Underlyings Debt securities and interest rates Equities and equity indices Exchange rates and gold Other instruments Different underlying Gross not Gross Future Gross not Gross Future Gross not Gross Future Gross not Gross Future Offset Future offset offset exposure offset offset exposure offset offset exposure offset offset exposure exposure
A. Trading book for supervisory purposes a.1 Governments and central banks – – – – – – – – – – – – – – a.2 Public entities – – – – – – – – – – – – – – a.3 Banks 34,401 34,401 113,131 – – 20,948 14,902 14,902 7,670 – – – 76,810 52,145 a.4 Financial companies 10,011 10,011 3,975 – – 643 168 168 1,293 – – – 3,039 949 a.5 Insurance companies – – – – – – – – – – – – – – a.6 Non-financial institutions 79,223 79,223 18,476 – – – 13,137 13,137 2,490 – – – – – a.7 Other issuers 103 103 15 – – – 1,859 1,859 478 – – – – –
Total at 31/12/2008 123,738 123,738 135,597 – – 21,591 30,066 30,066 11,931 – – – 79,849 53,094
Total at 31/12/2007 471,783 471,783 173,700 48,139 48,139 32,438 22,109 22,109 9,399 – – – – –
B. Banking book B.1 Governments and central banks – – – – – – – – – – – – – – B.2 Public entities – – – – – – – – – – – – – – B.3 Banks 18,875 18,875 12,388 – – 4,765 – – – – – – 86,212 16,420 B.4 Financial companies – – 238 – – – – – – – – – 8,158 238 B.5 Insurance companies – – – – – – – – – – – – – – B.6 Non-financial institutions – – – – – – – – – – – – – – B.7 Other issuers – – – – – – – – – – – – – –
Total at 31/12/2008 18,875 18,875 12,626 – – 4,765 – – – – – – 94,370 16,658
Total at 31/12/2007 23,522 23,522 6,142 – – – – – – – – – – –

334
A.5 Over-the-counter financial derivatives: negative fair value - financial risk
Counterparty/Underlyings Debt securities and interest rates Equities and equity indices Exchange rates and gold Other instruments Different underlying Gross not Gross Future Gross not Gross Future Gross not Gross Future Gross not Gross Future Offset Future offset offset exposure offset offset exposure offset offset exposure offset offset exposure exposure
A. Trading book for supervisory purposes a.1 Governments and central banks – – – – – – – – – – – – – – a.2 Public entities – – – – – – – – – – – – – – a.3 Banks 55,212 55,212 51,196 – – – 13,005 13,005 2,840 – – – 145,007 121,088 a.4 Financial companies 268 268 5,690 – – 26 1,197 1,197 837 – – – 25,972 7,625 a.5 Insurance companies – – – 15,222 15,222 – – – – – – – – – a.6 Non-financial institutions 1,262 1,262 525 – – – 5,011 5,011 565 – – – – – a.7 Other issuers 1,417 1,417 – – – – 1,792 1,792 227 – – – – –
Total at 31/12/2008 58,159 58,159 57,411 15,222 15,222 26 21,005 21,005 4,469 – – – 170,979 128,713
Total at 31/12/2007 496,415 – 51,149 48,185 – 6 33,428 – 3,027 – – – – –
B. Banking book B.1 Governments and central banks – – – – – – – – – – – – – – B.2 Public entities – – – – – – – – – – – – – – B.3 Banks 2,358 2,358 4,983 – – – – – – – – – 41,447 3,930 B.4 Financial companies 1,089 1,089 – – – – – – – – – – – – B.5 Insurance companies – – – – – – – – – – – – – – B.6 Non-financial institutions – – – – – – – – – – – – – – B.7 Other issuers – – – – – – – – – – – – – –
Total at 31/12/2008 3,447 3,447 4,983 – – – – – – – – – 41,447 3,930
Total at 31/12/2007 133,546 – 3,408 – – – – – – – – – – –

335
Counterparty/Underlyings Debt securities and interest rates Equities and equity indices Exchange rates and gold Other instruments Different underlying Gross not Gross Future Gross not Gross Future Gross not Gross Future Gross not Gross Future Offset Future offset offset exposure offset offset exposure offset offset exposure offset offset exposure exposure
A. Trading book for supervisory purposes a.1 Governments and central banks – – – – – – – – – – – – – – a.2 Public entities – – – – – – – – – – – – – – a.3 Banks 55,212 55,212 51,196 – – – 13,005 13,005 2,840 – – – 145,007 121,088 a.4 Financial companies 268 268 5,690 – – 26 1,197 1,197 837 – – – 25,972 7,625 a.5 Insurance companies – – – 15,222 15,222 – – – – – – – – – a.6 Non-financial institutions 1,262 1,262 525 – – – 5,011 5,011 565 – – – – – a.7 Other issuers 1,417 1,417 – – – – 1,792 1,792 227 – – – – –
Total at 31/12/2008 58,159 58,159 57,411 15,222 15,222 26 21,005 21,005 4,469 – – – 170,979 128,713
Total at 31/12/2007 496,415 – 51,149 48,185 – 6 33,428 – 3,027 – – – – –
B. Banking book B.1 Governments and central banks – – – – – – – – – – – – – – B.2 Public entities – – – – – – – – – – – – – – B.3 Banks 2,358 2,358 4,983 – – – – – – – – – 41,447 3,930 B.4 Financial companies 1,089 1,089 – – – – – – – – – – – – B.5 Insurance companies – – – – – – – – – – – – – – B.6 Non-financial institutions – – – – – – – – – – – – – – B.7 Other issuers – – – – – – – – – – – – – –
Total at 31/12/2008 3,447 3,447 4,983 – – – – – – – – – 41,447 3,930
Total at 31/12/2007 133,546 – 3,408 – – – – – – – – – – –

336
A.6 Residual life of over-the-counter financial derivatives: notional value
Underlyings/residual life Within 1 to 5 Over 31/12/2008 12 months years 5 years
A. Trading book for supervisory purposes 28,050,140 43,752,747 3,776,330 75,579,217 a.1 Financial derivatives on debt and interest rates 26,544,931 43,276,582 3,776,330 – a.2 Financial derivatives on equities and equity indices 86,327 474,706 – – a.3 Financial derivatives on exchange rates and gold 1,418,882 1,459 – – a.4 Financial derivatives on other instruments – – – – B. Banking book 1,198,710 1,893,034 582,143 3,673,887 B.1 Financial derivatives on debt securities and interest rates 1,198,710 1,805,802 582,143 – B.2 Financial derivatives on equities and equity indices – 59,563 – – B.3 Financial derivatives on exchange rates and gold – 27,669 – – B.4 Financial derivatives on other instruments – – – –
Total at 31/12/2008 29,248,850 45,645,781 4,358,473 79,253,104
Total at 31/12/2007 44,170,604 64,365,914 4,050,202 112,586,720
B. CrEDIt DErIVatIVES
the Bank does not have any credit derivatives. Consequently, no information is being provided in this regard.

337
SECtION 3
Liquidity risk
QUaLItatIVE INFOrMatION
A. General aspects, management and measurement of liquidity risk
Liquidity risk is the risk of being unable to meet payment obligations caused by inability to obtain funding (funding liquidity risk) and/or the presence of restrictions on the ability to sell assets (market liquidity risk). this risk can also take the form of a loss relative to fair value deriving from a forced sale, or more generally, of a loss in terms of reputation or business opportunities.
Liquidity funding risk is incurred in banking activities when institutional counterparties withdraw their usual funding, or request a significantly higher return than in normal circumstances.
the policy for managing liquidity risk, approved in October 2008, specifies the following fundamental principles for governing this risk:
– liquidity is managed centrally by the Parent Bank, Banca Popolare di Vicenza;– responsibility for guidelines on managing liquidity and the associated risk rests with the Parent Bank’s
Board of Directors;– the Liquidity Funding Plan (for ordinary liquidity management) and the Contingency Funding Plan (for
contingency management) are developed and managed by the Parent Bank on behalf of the entire BPVi Group.
the Parent Bank’s Board of Directors uses the Finance and aLMs Committee and relevant company functions for the operational and strategic management of this risk. In particular:
– the Finance and aLMs Committee proposes strategic guidelines in its consultative capacity to the Parent Bank’s Board of Directors;
– the Managing Director, or in his absence the Parent Bank’s General Manager, manages situations of stress and crisis, within the scope of their respective powers and having consulted the Finance and aLMs Committee. If the actions identified for overcoming situations of stress and crisis fall outside the scope of their powers, the proposed actions must be submitted to the competent bodies;
– the Finance Division has operational management duties.
Short-term liquidity management (within a 12-month horizon) uses an Operating Maturity Ladder, which identifies mismatches between expected cash inflows and outflows for each time period (liquidity gaps on precise dates). the cumulative mismatches (cumulative liquidity gaps) are used for calculating the net cash requirement/surplus for the different time horizons considered. Medium/long-term liquidity management uses a Structural Maturity Ladder, which identifies the balance between assets and liabilities by matching them not only in terms of cash flows but also in terms of balance sheet ratios. the objective is to ensure that the profile of structural liquidity is sufficiently balanced, with restrictions on the possibility of financing medium/long-term assets with liabilities of a different duration.
the Global Markets Department is responsible for operational management of liquidity risk by seeking to maintain an optimum balance between average maturities of short-term lending and funding, and by diversifying positions by counterparty and due date negotiated both over the counter and on the Interbank Deposits Market. In addition to usual banking treasury activities (daily monitoring of the Group’s liquidity and optimization of its short-term management), any medium and long-term imbalances are managed using appropriate policies established by the Finance and aLMS Committee.

338
the Bank managed to face the extremely tense situation on money markets in 2008 despite growing commitments to disburse funds, the smaller number of banking counterparties in the loan book and the general reduction in credit by the system as whole. these circumstances made it even more necessary to adopt a cautious, diversified funding policy, that sought to gradually lengthen the average maturity of interbank funding, and to avoid large exposures to overnight positions. Market liquidity risk was also limited by additional sell offs of the less readily marketable investments in the trading book.
Since November 2008 it has been possible to use securitization of residential mortgages with the principal purpose of obtaining refinancing from the ECB and of increasing the quantity of instruments that can be lodged against intra-day operations. Such securitization has made it possible to finance assets at relatively competitive rates in situations of liquidity stress. the conduct of funding repurchase agreements with the ECB and with direct customers has helped diversify the sources of funds relative to the interbank market, also in view of the recent injections of liquidity by the ECB through repo transactions at a fixed rate (equal to the official reference rate) and with no limits on quantity.
the project for reorganizing the treasury function continued throughout the year, including with the assistance of outside consultants for optimizing procedural and organizational aspects.

339
QUaNtItatIVE DISCLOSUrES
1. Breakdown of the residual contractual duration of financial assets and liabilities
Currency: Euro
Items/time bands Sight 1 to 7 7 to 15 15 days 1 to 3 3 to 6 6 to 12 1 to 5 Over Unspecified days days to 1 month months months months years 5 years duration
Cash assets a.1 Government securities – – – – – 10,926 15,361 – 1 – a.2 Listed debt securities 7 – – – – 10,115 10,058 11,617 – – a.3 Other debt securities 10 – – – 106 161 86,245 742,132 131,530 – a.4 Mutual funds 88,185 – – – – – – – – – a.5 Loans 3,102,952 510,660 329,143 1,532,223 1,578,317 518,995 680,883 3,654,759 3,667,785 658,497 – Banks 616,487 419,410 93,107 346,009 481,258 8,837 46,354 12,951 9,521 175,850 – Customers 2,486,465 91,250 236,036 1,186,214 1,097,059 510,158 634,529 3,641,808 3,658,264 482,647
Cash liabilities B.1 Deposits (8,004,408) (194,294) (407,815) (613,063) (534,820) (206,624) (43,737) (928) (24,334) – – Banks (1,423,789) (193,803) (407,437) (610,246) (531,466) (200,000) (35,126) – – – – Customers (6,580,619) (491) (378) (2,817) (3,354) (6,624) (8,611) (928) (24,334) – B.2 Debt securities (5,554) (12,482) (15,419) (106,824) (211,815) (369,996) (133,706) (4,970,423) (1,693,159) – B.3 Other liabilities – – – – – – – – – –
“Off-balance sheet” transactions C.1 Financial derivatives with exchange of capital – (37,087) (8,901) (14,540) (114) 29,066 18,990 (29,392) 23 – – long positions – 46,947 11,170 64,190 120,077 151,028 136,287 276 29 – – short positions – (84,034) (20,071) (78,730) (120,191) (121,962) (117,297) (29,668) (6) – C.2 Deposits and loans to be received – (9,438) – 2,384 5,514 1,585 – – – – – long positions – 50,000 – 2,384 5,514 1,585 – – – – – short positions – (59,438) – – – – – – – – C.3 Irrevocable commitments to make loans – – – – – – – – – – – long positions – 83,825 – – – – – – – – – short positions – (83,825) – – – – – – – –

340
Currency: USD
Items/time bands Sight 1 to 7 7 to 15 15 days 1 to 3 3 to 6 6 to 12 1 to 5 Over Unspecified days days to 1 month months months months years 5 years duration
Cash assets a.1 Government securities – – – – – – – – – – a.2 Listed debt securities – – – – – – – – – – a.3 Other debt securities – – – – – – – – – – a.4 Mutual funds – – – – – – – – – – a.5 Loans 46,663 3,841 31,903 42,031 146,242 9,291 26,012 830 1,275 2,651 – Banks 39,337 – 22,617 874 – 1,456 20,884 – – – – Customers 7,326 3,841 9,286 41,157 146,242 7,835 5,128 830 1,275 2,651
Cash liabilities B.1 Deposits (94,802) (20,602) (8,378) (10,395) (44,179) (9,885) (1,570) – – – – Banks (35,550) (18,009) (7,193) (2,517) (35,990) (9,424) – – – – – Customers (59,252) (2,593) (1,185) (7,878) (8,189) (461) (1,570) – – – B.2 Debt securities – – – – – – – (3,658) – – B.3 Other liabilities – – – – – – – – – –
“Off-balance sheet” transactions C.1 Financial derivatives with exchange of capital – 865 8,332 (2,551) (18,202) 5,718 (16,954) 4,266 – – – long positions – 25,545 16,594 80,953 108,899 62,253 110,235 4,288 – – – short positions – (24,680) (8,262) (83,504) (127,101) (56,535) (127,189) (22) – – C.2 Deposits and loans to be received – – – – – – – – – – – long positions – 8,623 – – – – – – – – – short positions – (8,623) – – – – – – – – C.3 Irrevocable commitments to make loans – (5,217) (626) – 260 9 4,948 – – – – long positions – – 11,022 – 260 9 4,948 – – – – short positions – (5,217) (11,648) – – – – – – –

341
Currency: GBP
Items/time bands Sight 1 to 7 7 to 15 15 days 1 to 3 3 to 6 6 to 12 1 to 5 Over Unspecified days days to 1 month months months months years 5 years duration
Cash assets a.1 Government securities – – – – – – – – – – a.2 Listed debt securities – – – – – – – – – – a.3 Other debt securities – – – – – – – – – – a.4 Mutual funds – – – – – – – – – – a.5 Loans 2,791 21 433 549 1,975 73 – – – 1,825 – Banks 2,786 – – – – – – – – – – Customers 5 21 433 549 1,975 73 – – – 1,825
Cash liabilities B.1 Deposits (4,528) (525) – – – – (195) – – – – Banks (7) (525) – – – – – – – – – Customers (4,521) – – – – – (195) – – – B.2 Debt securities – – – – – – – – – – B.3 Other liabilities – – – – – – – – – –
“Off-balance sheet” transactions C.1 Financial derivatives with exchange of capital – (128) 157 (6,929) 4,110 288 193 – – – – long positions – 2 209 1,785 15,830 2,083 213 – – – – short positions – (130) (52) (8,714) (11,720) (1,795) (20) – – – C.2 Deposits and loans to be received – – – – – – – – – – – long positions – 1,050 – – – – – – – – – short positions – (1,050) – – – – – – – – C.3 Irrevocable commitments to make loans – – – – – – – – – – – long positions – – – – – – – – – – – short positions – – – – – – – – – –

342
Currency: CHF
Items/time bands Sight 1 to 7 7 to 15 15 days 1 to 3 3 to 6 6 to 12 1 to 5 Over Unspecified days days to 1 month months months months years 5 years duration
Cash assets a.1 Government securities – – – – – – – – – – a.2 Listed debt securities – – – – – – – – – – a.3 Other debt securities – – – – – – – – – – a.4 Mutual funds – – – – – – – – – – a.5 Loans 12,374 7,101 8,997 2,544 12,169 418 – – 98 109 – Banks 11,995 6,737 5,389 – – – – – – – – Customers 379 364 3,608 2,544 12,169 418 – – 98 109
Cash liabilities B.1 Deposits (1,044) – – (60,639) (40,487) – – – – – – Banks – – – (60,639) (40,404) – – – – – – Customers (1,044) – – – (83) – – – – – B.2 Debt securities – – – – – – – – – – B.3 Other liabilities – – – – – – – – – –
“Off-balance sheet” transactions C.1 Financial derivatives with exchange of capital – 133 – 40,303 16,838 – (505) – – – – long positions – 134 – 40,303 16,838 – 14,182 – – – – short positions – (1) – – – – (14,687) – – – C.2 Deposits and loans to be received – – – – – – – – – – – long positions – – – – – – – – – – – short positions – – – – – – – – – – C.3 Irrevocable commitments to make loans – – – – – – – – – – – long positions – – – – – – – – – – – short positions – – – – – – – – – –

343
Currency: JPY
Items/time bands Sight 1 to 7 7 to 15 15 days 1 to 3 3 to 6 6 to 12 1 to 5 Over Unspecified days days to 1 month months months months years 5 years duration
Cash assets a.1 Government securities – – – – – – – – – – a.2 Listed debt securities – – – – – – – – – – a.3 Other debt securities – – – – – – – – – – a.4 Mutual funds – – – – – – – – – – a.5 Loans 4,120 2,625 1,586 4,246 6,103 2,012 – – 34 476 – Banks 2,458 2,379 – – 2,149 875 – – – – – Customers 1,662 246 1,586 4,246 3,954 1,137 – – 34 476
Cash liabilities B.1 Deposits (2,051) – (1,976) – (4,567) – – – – – – Banks (1,553) – – – (4,471) – – – – – – Customers (498) – (1,976) – (96) – – – – – B.2 Debt securities – – – – – – – – – – B.3 Other liabilities – – – – – – – – – –
“Off-balance sheet” transactions C.1 Financial derivatives with exchange of capital – 1,298 93 (14,545) (97) 1,339 (1,087) – – – – long positions – 3,282 1,014 872 7,998 20,411 18,799 – – – – short positions – (1,984) (921) (15,417) (8,095) (19,072) (19,886) – – – C.2 Deposits and loans to be received – – – – – – – – – – – long positions – – – – – – – – – – – short positions – – – – – – – – – – C.3 Irrevocable commitments to make loans – – – – – – – – – – – long positions – – – – – – – – – – – short positions – – – – – – – – – –

344
Currency: other currencies
Items/time bands Sight 1 to 7 7 to 15 15 days 1 to 3 3 to 6 6 to 12 1 to 5 Over Unspecified days days to 1 month months months months years 5 years duration
Cash assets a.1 Government securities – – – – – – – – – – a.2 Listed debt securities – – – – – – – – – – a.3 Other debt securities – – – – – – – – – – a.4 Mutual funds – – – – – – – – – – a.5 Loans 6,756 2 59 – 3,597 – – 379 – 457 – Banks 6,731 2 – – – – – – – – – Customers 25 – 59 – 3,597 – – 379 – 457
Cash liabilities B.1 Deposits (5,473) (1,834) – (177) (742) – (8) – – – – Banks (945) (1,834) – – – – – – – – – Customers (4,528) – – (177) (742) – (8) – – – B.2 Debt securities – – – – – – – – (24,246) – B.3 Other liabilities – – – – – – – – – –
“Off-balance sheet” transactions C.1 Financial derivatives with exchange of capital – (625) – 3,368 247 186 – – 24,076 – – long positions – 767 3,302 45,789 3,028 15,626 – – 24,076 – – short positions – (1,392) (3,302) (42,421) (2,781) (15,440) – – – – C.2 Deposits and loans to be received – – – – – – – – – – – long positions – 2,506 – – – – – – – – – short positions – (2,506) – – – – – – – – C.3 Irrevocable commitments to make loans – – – – – – – – – – – long positions – – – – – – – – – – – short positions – – – – – – – – – –

345
2. Sector breakdown of financial liabilities
3. Geographical distribution of financial liabilities
Exposure/Counterparties ItaLY OtHEr aMErICa aSIa rESt EU OF tHE COUNtrIES WOrLD
1. Due to customers 7,281,088 206,940 11,369 553 3,685 2. Deposits from banks 3,217,997 352,314 41 493 50,083 3. Debt securities in issue 2,223,586 2,385,566 – – – 4. Financial liabilities held for trading 46,190 490,612 81,560 – – 5. Financial liabilities at fair value 2,009,806 928,324 – – –
Total at 31/12/2008 14,778,667 4,363,756 92,970 1,046 53,768
Total at 31/12/2007 11,014,998 5,634,150 101,686 2,526 106,849
Exposure/Counterparties Governments and Other public Financial Insurance Non-financial Other parties central banks entities companies companies institutions
1. Due to customers 23,511 116,421 424,966 150,672 2,184,466 4,603,599 2. Debt securities in issue – 10,187 – 167,556 146,230 2,047,808 3. Financial liabilities held for trading – – 36,173 15,222 3,561 3,210 4. Financial liabilities at fair value – 36,757 22,061 367,053 133,797 1,182,735
Total at 31/12/2008 23,511 163,365 483,200 700,503 2,468,054 7,837,352
Total at 31/12/2007 26,462 174,992 327,478 640,700 2,040,145 5,455,683

346
SECtION 4
Operational risk
QUaLItatIVE DISCLOSUrES
A. General aspects, management and measurement of operational risk
Operational risk is defined as the risk of losses deriving from inadequate or dysfunctional procedures, human resources or internal systems, or external events. this includes legal risk, but not strategic risk or the risk to reputation.
During 2008 the Internal audit Department carried out remote and on-site checks in relation to the distribution network in order to verify compliance with company standards (basically: correct application of regulations and correct performance of line controls).
the audit of processes rather than the central owners of the same also examined regulatory, procedural and organizational structure in order to assess the adequacy of controls over operational risks in terms of compliance with corporate strategy, achieving maximum efficiency and effectiveness in all processes, protecting the value of assets and protection against losses, the reliability and completeness of accounting and management information, and the compliance of transactions with the law, supervisory requirements and internal instructions.
the results attest the existence and adequacy of the system of controls protecting against such risks, and as far as distribution processes are concerned are based on the compliance observed during audit activities within the Network.
With regard to the monitoring of operational risks, the Bank was a founding member in 2002 of DIPO, the interbank consortium promoted by aBI that maintains an Italian database of operational losses. as a consequence, the Group gathers regular information about its operational losses.
Lastly in this area, the Group commenced an “OrM” (Operational risk Management) project during the first half of 2006 as part of alignment with the Basel II requirements.
the new Basel 2 accord establishes capital adequacy requirements for banks with regard to credit risk, market risk and, for the first time, operational risk. With regard to this last risk, there are three possible approaches of increasing complexity:
− BIa – Basic Standard approach: this involves the application of a fixed coefficient of 15% to the average of net interest and other banking income over the last three years.
− tSa – traditional Standardized approach: this involves the application of fixed coefficients to net interest and other banking income for the last three years deriving from the various lines of business envisaged in the New Capital accord. this approach also and more especially envisages the creation of an integrated framework for the recording, management and measurement of operational risks, imposing on banks a tight series of organizational requirements.
− aMa – advanced Measurement approach: this applies the organizational model for the recording, management and measurement of operational risks adopted by the standardized approach, but on an even more stringent basis which allows banks to adopt internal models for calculating the related capital adequacy requirements.
the Operational risk Management project, organized into four modules is intended to define an framework for the measurement and management of Operational risks that is consistent with

347
the requirements of Basel 2, while also working towards alignment with the requirements of the standardized approach. Various stages in this project have already been completed: “Classification Models and risk Mapping”, “Policies for and Governance of Operational risk Management” and “Self risk assessment”. this last stage entailed the direct involvement of managers from the Departments subject to Operational risks and the area offices, who took part in a top-down analysis of risks by completing a detailed questionnaire designed to obtain quali-quantitative information needed for managing the risk. the fourth and final stage of the project, whose organizational implications were reviewed in the first half of 2007, was intended to define and develop a structured process for Loss Data Collection in place of the current process used to provide information to the DIPO consortium. this work was completed at the end of October 2007 with the publication of the “Operational risks Manual – Loss Data Collection”.
the same work was carried out in the first half of 2008 at a local level for Banca Nuova and Cassa di risparmio di Prato, in order to manage operational risks throughout the banking Group.
this work was completed in June 2008 when these two subsidiaries adopted the “Operational risks Manual – Loss Data Collection”.
the introduction of Self risk assessment at these subsidiaries is still in progress.
QUaNtItatIVE INFOrMatION
the Bank continued to gather data on operational losses for reporting to DIPO, which was more complete thanks to the more structured approach used after adopting the manual, which was also adopted by the two subsidiaries Banca Nuova and Cassa di risparmio di Prato in June 2008. the information gathered was not only more accurate, but also contained details of events not previously considered, such as those associated with “employment practices and workplace safety”.
this reporting revealed 73 new events in 2008, resulting in losses or provisions for losses totaling Euro 4.809 million. Of these new events, 41% (30 events) were caused by “employment practices and workplace safety” (58% in value terms), 21% by “customers, products and business practice” (27% in value terms), 19% by errors in “execution, delivery and process management” (9% in value terms), 18% by “external fraud” (6% in value terms) and 1% (1 event) by “damage to physical assets” (0.2% in value terms).
Events are analyzed by line of business as well as by type. these lines of business are the same as those envisaged in the New Capital accord (Basel 2). In particular:− “retail banking” includes the losses deriving from customers served operationally by the
Private Banking or retail businesses;− “retail intermediation” includes the operational losses incurred on retail customer instructions
relating to securities that were handled incorrectly;− “trading and sale” includes the operational losses incurred on corporate customer instructions
relating to securities that were handled incorrectly;− “commercial banking” includes the operational losses attributable to the corporate segment.
In 2008, 67% of loss events related to the retail business (71% in value terms), 17% to retail intermediation (11% in value terms), 15% to trading and sale (15% in value terms), and 1% to commercial banking (3% in value terms).

348
Part FCaPItaL
SECtION 1
Capital
a. QUaLItatIVE INFOrMatION
Definition of capital
the definition of capital used by the Bank corresponds to the sum of the following equity accounts: 130 “Valuation reserves”, 140 “redeemable shares”, 150 “Equity instruments”, 160 “reserves”, 170 “additional paid-in capital”, 180 “Capital”, 190 “treasury stock” and 200 “Net income (loss) for the year”.
Quantitative information is provided in Part B, Liabilities Section 14 – “Equity” of these explanatory notes.
Nature of the capital adequacy requirement
Since the Bank carries out lending activities, it is subject to the requirements of art. 29 et seq. of Decree 385 dated 1 September 1993 “Consolidated law on banking and lending” or “tUB”. accordingly, the Group must comply with the capital adequacy requirements detailed in the above legislation.
Management of capital
Information about the way in which the Bank pursues its capital management objectives is provided in section 2.2 below.
B. QUaNtItatIVE INFOrMatION
Quantitative information is provided in Part B, Liabilities Section 14 – “Equity” of these explanatory notes.

349
SECtION 2
regulatory capital and capital adequacy ratios
2.1 rEGULatOrY CaPItaL
a . QUaLItatIVE INFOrMatION
1. Tier 1 capital
tier 1 capital comprises capital stock, additional paid-in capital and other equity reserves (inclusive of the related allocation of 2008 net income to reserves) calculated on the basis of current legislation, less any treasury shares and intangible assets.
“Prudential filters” make corrections to equity in order to safeguard the quality of regulatory capital and reduce the potential volatility deriving from the application of IFrS. these filters include adding to tier 1 capital the cumulative net losses on subordinated liabilities computed in tier 2 capital, classified in the balance sheet as “Financial liabilities at fair value”.
tier 1 capital as of 31 December 2008 does not include any innovative or other capital instruments.
2. Tier 2 capital
tier 2 capital essentially comprises the special revaluation reserves recorded for property, plant and equipment, the positive valuation reserves relating to debt securities, equities and mutual fund units classified as “Financial assets available for sale” and the subordinated liabilities issued, to the extent allowed by the regulations.
the “prudential filters” include the deduction of 50% of the positive valuation reserve relating to debt securities, equities and mutual fund units classified as “Financial assets available for sale”.

350
the principal contractual characteristics of the subordinated loans included in tier 2 capital are presented below, together with the portion included in this capital:
all the above subordinated bonds, except for the issue with Isin code It0004424351, have an early redemption clause that allows the Bank to redeem them early, not less than 18 months after the final date of placement, following prior authorization from the Bank of Italy and giving at least one month’s notice. Furthermore, all the above bonds contain a subordination clause whereby, on liquidation of the Bank, they would be redeemed only after all other creditors, not subordinated to the same extent, have been satisfied.
tier 2 capital does not include any hybrid debt capital instruments at 31 December 2007.
“Deductions” from regulatory capital, consisting of the equity investments in banking, financial and insurance companies held by the Bank, are deducted in accordance with the rules set out in Circular 263 of 27 December 2006 (3rd revision dated 15 January 2009) and in Circular 155 of 18 December 1991 (12th revision dated 5 February 2008). In particular, 50% of the above equity investments are deducted from tier 1 capital and 50% from tier 2 capital, except for the equity investments in insurance companies purchased before 20 July 2006, the full amount of which is deducted from both tier 1 and 2 capital.
Issue Maturity rate Interest Nominal Portion Isin data rate value included in tier 2 capital It0003444574 02/05/2003 02/05/2009 t.F. 2.25% 8,298 8,298 It0003631659 23/03/2004 23/03/2011 t.F. 4.05% 9,777 6,000 It0003631642 02/04/2004 02/04/2009 t.F. 3.64% 24,731 5,000 It0003662498 21/05/2004 21/05/2010 t.F. 3.95% 23,359 10,000 It0003699649 16/08/2004 16/08/2010 t.F. 4.10% 13,941 6,000 It0003748511 30/11/2004 30/11/2011 t.F. 3.49% 48,932 30,000 XS0210870415 03/02/2005 03/02/2015 t.V. Euribor3m + 0.45 200,000 199,829 It0004189343 (1) 30/07/2007 30/07/2015 t.F. 2.15% 241,451 241,451 XS0336683254 20/12/2007 20/12/2017 t.V. Euribor3m + 2.35 200,000 200,000 It0004424351 15/12/2008 15/12/2015 t.F. 5.00% 115,497 115,497
Total 885,986 822,075
(1) Bond with right of conversion into Banca Popolare di Vicenza ordinary shares: the bonds can be converted into capital stock in a ratio of 2 shares of par value Euro 3.75 each for every bond of nominal value Euro 124 each. the conversion ratio will be changed in the event of a bonus increase in capital via the issue of shares. the right to convert can be exercised from 1 October 2010 to 31 December 2010. the shares delivered to the bondholders who decide to convert will have dividend and voting rights from 1 January 2011. Bondholders are entitled to convert early in the event of extraordinary operations involving capital, except for mergers with other companies in the Banca Popolare di Vicenza Group or with companies controlled by the issuer.

351
3. Tier 3 capital
the Bank’s regulatory capital at 31 December2008 does not include any elements of tier 3 capital.
B. QUaNtItatIVE INFOrMatION
31/12/2008 31/12/2007
A. Tier 1 before the application of prudential filters 2,072,687 2,029,369 B. Prudential filters of tier 1 capital 2,972 (51,620) B.1 Positive IFrS prudential filters (+) 2,972 – B.2 Negative IFrS prudential filters (–) – (51,620)C. Tier 1 capital after the application of prudential filters 2,075,659 1,977,749 D. Deductions from tier 1 capital 13,831 13,863
E. Total Tier 1 capital 2,061,828 1,963,886
F. Tier 2 capital before the application of prudential filters 851,219 741,944 G. Prudential filters of tier 2 capital (13,522) – G.1 Positive IFrS prudential filters (+) – – G.2 Negative IFrS prudential filters (–) (13,522) – H. Tier 2 capital after the application of prudential filters 837,697 741,944 I. Deductions from tier 2 capital 13,831 13,863
L. Total Tier 2 capital 823,866 728,081
M. Deductions from tier 1 and tier 2 capital 26,773 26,773
N. Regulatory capital 2,858,921 2,665,194
O. tier 3 capital – –
P. Regulatory capital including Tier 3 capital 2,858,921 2,665,194

352
2.2 CaPItaL aDEQUaCY
a. QUaLItatIVE INFOrMatION
the capital management policies adopted by the Banca Popolare di Vicenza Group are intended to ensure that tier 1 capital is consistent with the overall level of risk accepted and the plans for the expansion of the Group, as well as to optimize the composition of capital by recourse to various financial instruments that minimize the related cost.

353
B. QUaNtItatIVE INFOrMatION
“Other prudential requirements” at 31 December 2008 refer to the specific capital requirement ordered by the Supervisory authorities on 9 October 2007, involving a doubling of weightings relative to those currently used for counterparty risk relating to the “trading portfolio for supervisory purposes”. this requirement was included in “Market risks” at 31 December 2007.
“Other prudential requirements” at 31 December 2007 referred to the requirement relating to the Group’s securitizations, not included in “risk assets” in compliance with the previously applicable supervisory regulations. this requirement has been included in “Credit and counterparty risks” in line B.1 at 31 December 2008, while the related risk assets are reported in line a.1.1.
the Group has used the “standard approach” (simplified CrM) to calculate risk-weighted assets and the related capital requirement for credit risks, adopting unsolicited external ratings provided by Moody’s, S&P and Fitch for the supervisory portfolios “Exposures with or guaranteed by central administrations and central banks” and “Positions relating to securitizations” and unsolicited ratings provided by Lince for the portfolio “Exposures to companies and other parties”.
In the case of overall market risks on debt securities and interest rates, derivatives and other off-balance sheet transactions involving debt securities and interest rates have been represented using financial or sensitivity models in place of the “double entry” method previously used.
Categories/amounts Unweighted amounts Weighted amounts/requirements 31/12/2008 31/12/2007 31/12/2008 31/12/2007
A. RISKS ASSETS A.1 Credit and counterparty risk 38,182,147 34,479,148 15,590,472 15,792,953 1. Standard methodology 38,161,980 34,479,148 15,338,381 15,792,953 2. Metodology based on internal ratings – – – – 2.1 Basic – – – – 2.2 advanced – – – – 3. Securitizations 20,167 – 252,091 –
B. CAPITAL ADEQUACY REQUIREMENTS B.1 Credit and counterparty risk x x 935,428 1,105,507 B.2 Market risk x x 11,680 237,242 1. Standard methodology x x 11,680 237,242 2. Internal models x x – – 3. Concentration risk x x – – B.3 Operational risks x x 68,534 – 1. Basic method x x 68,534 – 2. Standard method x x – – 3. advanced method x x – – B.4 Other prudential requirements x x 15,734 75,874 B.5 Total prudential requirements x x 1,031,376 1,418,623
C. RISK ASSETS AND CAPITAL RATIOS x x C.1 risk-weighted assets x x 17,124,047 20,266,039 C.2 tier 1 capital/risk-weighted assets (tier 1 capital ratio) x x 12.04% 9.69%C.3 regulatory capital including tIEr 3/risk-weighted asset (total capital ratio) x x 16.70% 13.15%

354
Part GBUSINESS COMBINatIONS
SECtION 1
transactions during the year
1.1 Business combinations
this section has not been completed because the Banca Popolare di Vicenza did not carry out any business combinations during the year.
1.2 Other information on business combinations
1.2.1 Changes in year in goodwill
With reference to the acquisition of the 61 bank branches from the UBI Banca Group on 31 De-cember 2007, for which goodwill of Euro 469,215 was provisionally recognized, there have been the following changes during the year:
• anincreaseofEuro16,747forincidentalexpenses(legalandnotaryfees,indirecttaxes);• areductionofEuro18,654afterdeterminingthefinalpriceofthebranches,inaccordance
with the terms of the sale agreement;• areductionofEuro24,100afterreclassifyingto“Otherintangibleassets”the“intangibles”
identified as part of the purchase price allocation process in compliance with IFrS 3 which states that the cost of a business combination (such as the acquisition of the 61 UBI branches) must be accounted for using the purchase method and that the price paid be allocated to the assets acquired and liabilities assumed as measured at their respective fair values. these “in-tangibles” express the value of the relationships acquired and are amortized over the period they are expected to benefit.
Goodwill relating to the acquisition of the 61 UBI Group branches therefore amounts to Euro 443,207 at 31 December 2008, at which date no evidence of impairment has been observed that would require recognition in the income statement under IaS 36.

355
SECtION 2
transactions after the end of the year
2.1 Business combinations
acquisition of Corporate Business Unit (CBU) from Banca Popolare Commercio e Industria (BPCI)
On 1 March 2009, the Bank acquired the Corporate Business Unit (CBU) from Banca Popolare Commercio e Industria in Brescia. the acquisition of the Corporate Business Unit, by the Parent Bank BPVi, comprising corporate customers in the provinces of Brescia and Bergamo, forms part of the previous acquisition on 31 December 2007 of 18 bank branches (out of the total 61 branches acquired from the UBI Group) located in these provinces, and so has taken place without the Bank paying any additional consideration.
the balance sheet of this business at 31 July 2008 was as follows (in thousands of euro):
Position at 31 July 2008
Assets acquired: Liabilities acquired:– Cash and cash equivalents € – – Due to customers € 18,485– Loans and advances to customer € 247,742 – Debt securities in issue € 98 – Property, plant and equipment € – – Provisions for severance indemn € 26 – Other assets € 36 – Other liabilities € 912
Total assets € 247,778 Total liabilities € 19,521 Balance € 228,257
at this date the acquired business reported Euro 267.7 million in banking balances, of which Euro 18.5 million in direct deposits, Euro 1.5 million in indirect deposits and Euro 247.7 million in loans.
the balance sheet at 1 March 2009 (effective date of the acquisition) is in the process of being prepared.

356
Part HrELatED-PartY traNSaCtIONS
1. Information on the remuneration of directors and managers
the following table reports the remuneration paid to key management personnel in 2008.
Key management personnel
a) Short-term benefits 8.024 b) Post-employment benefits 212 c) Other long-term benefits –d) Indemnities due on termination of employment – e) Share-based payments –
Total 8.236
Key management personnel comprise members of General Management, as defined in the Bank’s articles of association, as well as its serving directors and statutory auditors.
the remuneration categories included in the above table comprise:a) Short-term benefits: these include: i) for General Management: wages, salaries and related
social security contributions, payment in lieu of vacation and sick leave, incentives and benefits in kinds, such as medical assistance, housing, company cars and goods and services provided free or at reduced cost; ii) for Directors and Statutory auditors: attendance fees, remuneration for the performance of their duties, and, solely in relation to the directors, their share of 2007 net income;
b) Post-employment benefits: these include the Bank’s contributions to pension funds (pension and retirement plans, life assurance and health care subsequent to termination) and the provision for severance indemnities recorded on the basis required by law and in-house agreements;
c) Other long-term benefits: there are no other long-term benefits worthy of mention (such as leave of absence or sabbaticals related to length of service, bonuses linked to anniversaries, other benefits linked with length of service, disability benefits and, if due more than twelve months after the balance sheet date, profit share, incentives and deferred remuneration);
d) Indemnities due on termination of employment: these include the amounts paid for early termination prior to pensionable age, incentives for voluntary redundancy and incentives for early retirement;
e) Share-based payments: these include the cost of shares granted on achieving a certain length of service or specific objectives.
2. Information on related-party transactions
“related-party transactions” are defined as all transactions with parties defined as such in IaS 24.
More specifically, with reference to the organization and governance of the Bank, the following parties are deemed to be “related parties”:- subsidiary companies: companies belonging to the Banca Popolare di Vicenza Group over
which the Parent Bank Banca Popolare di Vicenza exercises direct or indirect control;- companies under joint control: companies over which the Group exercises joint control,
whether directly or indirectly;- associated companies: companies over which the Group exercises significant influence,

357
whether directly or indirectly;- key management personnel, being members of General Management and the Directors and
Statutory auditors of the Bank and other group companies;- “close family” of key management personnel;- companies controlled by, jointly controlled by or associated with key management personnel or
their close family;- parties that manage pension plans for the Bank’s employees and any other parties related to the
Bank.
“Close family” are deemed to be: (a) companion and children of the related party; (b) children of the companion; (c) dependents of the related party or their companion.
the following tables summarize the balances and transactions with related parties during the year and their impact on cash flow, according to their classification at 31 December 2008.
Balance sheet
1 asset line items 20, 30 and 40 from the balance sheet.2 Liability line items 30, 40 and 50 from the balance sheet.3 Include the close family of key management personnel, companies controlled by, jointly controlled by or associated
with key management personnel or their close family, and parties that manage pension plans for the Bank’s employees and any other parties related to the Bank.
related parties Loans and Loans and Other Deposits Due Other Guarantees advances to advances to assets1 from to liabilities2 and banks customers banks customers commitments
– Subsidiary companies 1,030,895 667,276 8,292 817,438 44,977 1,702 653,985 – associated companies – 4,045 299,436 – 109,401 96,946 16,405 – Companies under joint control – – – – – – – – Key management personnel – 8,247 – – 11,069 2,558 2,830 – Other related parties 3 – 216,020 2,362 – 36,589 6,936 17,641
Total related parties 1,030,895 895,588 310,090 817,438 202,036 108,142 690,861
Total reported in balance sheet 3,153,912 16,017,622 1,066,706 3,620,928 7,503,635 8,165,644 5,068,440 % incidence 32.69% 5.59% 29.07% 22.58% 2.69% 1.32% 13.63%

358
Income statement
related parties Interest Interest Net fee and Dividend Other costs/ income expense commission other revenues1
– Subsidiary companies 57,403 (27,252) 4,049 24,854 (14,565) – associated companies 320 (6,859) 9,319 2,937 (30,365) – Companies under joint control 12,702 – 5,302 – – – Key management personnel 464 (581) 270 – (9,708) – Other related parties2 10,484 (1,135) 805 – (315)
Total related parties 81,373 (35,827) 19,745 27,791 (54,953)
Total reported in balance sheet 1,110,538 (704,906) 177,569 55,340 (406,872)
% incidence 7.33% 5.08% 11.12% 50.22% 13;51%
1 Line items 150 and 190 from the income statement. they include the remuneration paid to key management person-nel.
2 Include the close family of key management personnel, companies controlled by, jointly controlled by or associated with key management personnel or their close family, and parties that manage pension plans for the Bank’s employees and any other parties related to the Bank.
Cash flows
Cash flows 31/12/2008
Loans and advances to banks (118,886)Loans and advances to customers 124,132Other assets 1 (246,431)
Total cash flows with related parties (241,185)
Total liquidity absorbed by financial assets (1,445,578)
Incidence % 16.68%
1 1 asset line items 20, 30 and 40 from the balance sheet.
Cash flows 31/12/2008
Deposits from banks 247,795Due to customers 136,662Other liabilities 2 (474,510)
Total cash flows with related parties (90,053)
Total liquidity absorbed by financial assets 1,258,709
Incidence % -7.15%2 Liability line items 30, 40 and 50 from the balance sheet.

359
Cash flows 31/12/2008
Interest income and similar revenues 81,373Interest expense and similar charges (35,827)Commissioni nette 19,745Oter income/other costs1 (54,953)
Total cash flows with related parties 10,338
Total cash flow from operations 165,274
Incidence % 6.26%1 Line items 150 and 190 from the income statement.
Cash flows 31/12/2008
Dividend 27,791
Total cash flows with related parties 27,791
Total liquidity generated by investing activities 222,364
Incidence % 12.50%
transactions with Group companies – which represent most of the related-party transactions – are of a commercial and financial nature.
Such commercial and financial transactions with Group companies reflect a multifunctional organizational and strategic model, involving on the one hand centralization under the Parent Bank of the key activities of governance and control and assistance in legal, economic, organizational and personnel management matters and on the other, outsourcing of back office and support services to some of the Group’s support companies. In particular, intragroup transactions are based on rules that define contractual formats and principles for determining and recharging costs for the services provided. the contractual formats involve master agreements and specific service level agreements (SLas, which define the level of service and applicable economic terms and conditions). the consideration agreed for services under such agreements is determined with reference to specific quantitative criteria and conditions judged to be in line with market ones, or if no suitable external parameters are available, on the basis of the cost incurred. However, there is no guarantee that if such transactions had been entered between or with third parties, such parties would have negotiated the related contracts, or carried out the same transactions, under the same conditions or in the same way.
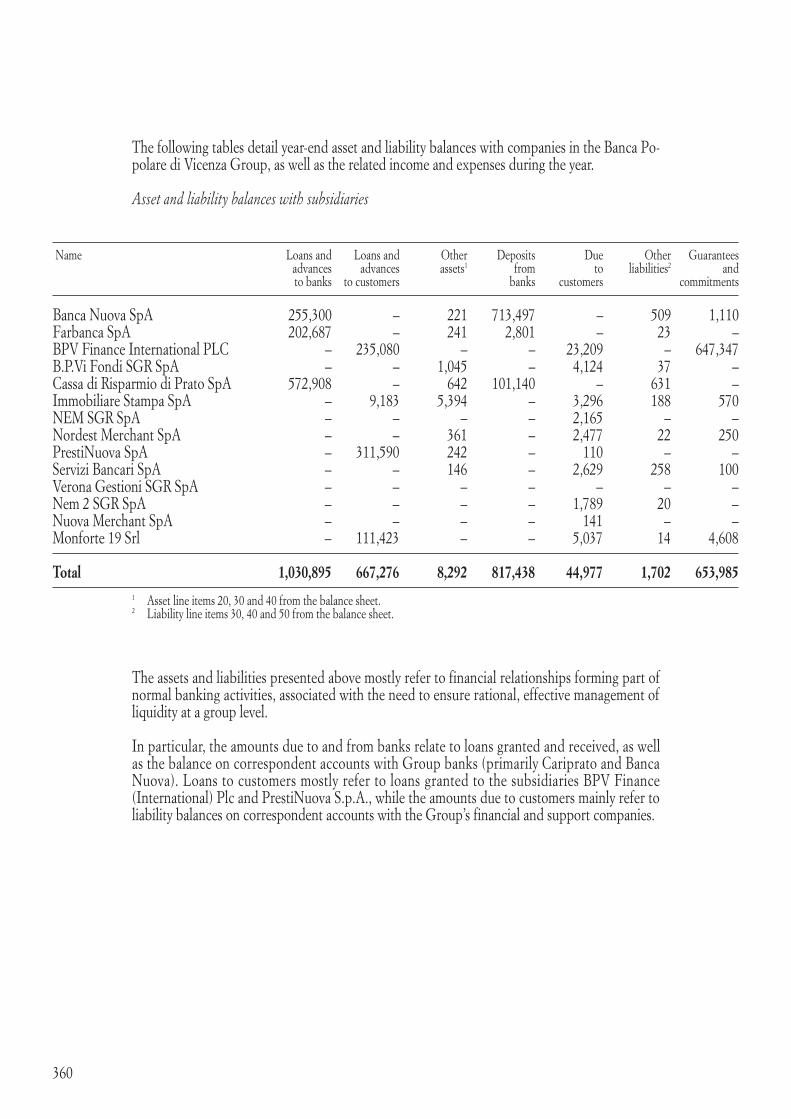
360
the following tables detail year-end asset and liability balances with companies in the Banca Po-polare di Vicenza Group, as well as the related income and expenses during the year.
Asset and liability balances with subsidiaries
1 asset line items 20, 30 and 40 from the balance sheet.2 Liability line items 30, 40 and 50 from the balance sheet.
the assets and liabilities presented above mostly refer to financial relationships forming part of normal banking activities, associated with the need to ensure rational, effective management of liquidity at a group level.
In particular, the amounts due to and from banks relate to loans granted and received, as well as the balance on correspondent accounts with Group banks (primarily Cariprato and Banca Nuova). Loans to customers mostly refer to loans granted to the subsidiaries BPV Finance (International) Plc and PrestiNuova S.p.a., while the amounts due to customers mainly refer to liability balances on correspondent accounts with the Group’s financial and support companies.
Name Loans and Loans and Other Deposits Due Other Guarantees advances advances assets1 from to liabilities2 and to banks to customers banks customers commitments
Banca Nuova Spa 255,300 – 221 713,497 – 509 1,110 Farbanca Spa 202,687 – 241 2,801 – 23 – BPV Finance International PLC – 235,080 – – 23,209 – 647,347 B.P.Vi Fondi SGr Spa – – 1,045 – 4,124 37 – Cassa di risparmio di Prato Spa 572,908 – 642 101,140 – 631 – Immobiliare Stampa Spa – 9,183 5,394 – 3,296 188 570 NEM SGr Spa – – – – 2,165 – – Nordest Merchant Spa – – 361 – 2,477 22 250 PrestiNuova Spa – 311,590 242 – 110 – – Servizi Bancari Spa – – 146 – 2,629 258 100 Verona Gestioni SGr Spa – – – – – – – Nem 2 SGr Spa – – – – 1,789 20 – Nuova Merchant Spa – – – – 141 – – Monforte 19 Srl – 111,423 – – 5,037 14 4,608
Total 1,030,895 667,276 8,292 817,438 44,977 1,702 653,985

361
Income and expenses with subsidiaries
Name Interest Interest Net fee and Dividend Other costs/ income expense commission other income revenues1
Banca Nuova Spa 550 (18,204) 111 9,393 788 Farbanca Spa 6,429 (335) 3 537 399 BPV Finance International PLC 9,104 (2) – – – B.P.Vi Fondi SGr Spa – (234) 3,689 875 34 Cassa di risparmio di Prato Spa 25,930 (7,798) 154 7,742 411 Immobiliare Stampa Spa 57 (103) 3 3,057 (11,957)NEM SGr Spa – (115) 1 – 15 Nordest Merchant Spa – (94) 3 – 195 PrestiNuova Spa 13,685 (19) – 160 455 Servizi Bancari Spa – (174) 4 2,040 (4,975)Verona Gestioni SGr Spa – – – 1,050 – Nem 2 SGr Spa – (103) 1 – 53 Nuova Merchant Spa 72 – 3 – 16 Monforte 19 Srl 1,576 (71) 77 – 1
Total 57,403 (27,252) 4,049 24,854 (14,565)1 Do not include profits and losses on trading in securities, currency and other instruments between Group companies,
settled under market rates.
Interest income and expense represents the remuneration, at market rates, on loans granted and received or on bonds subscribed and issued. Net fee and commission income comprises the remuneration earned by the Bank’s commercial network for placing the products of Group companies, net of the costs incurred for services provided by the various Group companies to the Bank. Dividends refer to the Bank’s interests in the various Group companies. Other revenues/other costs refer to the recharge of Bank personnel seconded to Group companies or to other services provided/received.
3. Disclosures by listed issuers and issuers whose financial instruments are held by the general public pursuant to art. 116 of the TUF – Requirements pursuant to art. 114.5 of Decree 58/98
CONSOB Communication 6064293 dated 28 July 2006 regarding “Disclosures by listed issuers and issuers whose financial instruments are held by the general public pursuant to art. 116 of the TUF – Requirements pursuant to art. 114.5 of Decree 58/98”, requires all listed companies and issuers of securities held by the public to provide detailed information in their explanatory notes and report on operations regarding: related-party transactions, significant and non-recurring events and operations, and positions and transactions deriving from atypical and/or unusual transactions.
In order to comply with the above CONSOB Communication, on 23 January 2007 the Board of Directors of the Bank approved the “Regulations for reporting information about: transactions with related parties, significant and non-recurring transactions and atypical and/or unusual transactions”.
these regulations bring together all the rules applied by Banca Popolare di Vicenza S.C.p.a. and its subsidiaries to identify transactions with related parties, significant and non-recurring transactions and atypical and/or unusual transactions, defining quantitative/qualitative criteria

362
for the identification of such transactions for the purposes of reporting them in the financial statements pursuant to the CONSOB communication referred to above.
In order to define the operational rules applying within the Bank that ensure implementation of the instructions contained in the above regulations, a Manual has been prepared to clarify how to identify related parties, significant and non-recurring transactions and atypical and/or unusual transactions, and to establish the responsibilities for and controls over such activities.
the definitions and qualitative/quantitative criteria set out in the regulations for the identification of the above transactions are presented below.
Related-party transactionsthe definition of “related parties” is included in the earlier point entitled 2 “Information on related-party transactions”.
Significant and non-recurring transactions“Significant and non-recurring” transactions are defined as all transactions that are not repeated frequently in the ordinary course of the Bank’s activities and whose balance sheet and/or economic value exceeds a certain threshold of significance. In particular:- Significant transactions:
transactions whose balance sheet and/or economic value exceeds at least one of the following parameters:• 1%ofequity,asreportedinthelatestfinancialstatementsapprovedbytheStockholders’
Meeting;• 4%ofnetincomefortheyear,asreportedinthelatestfinancialstatementsapprovedby
the Stockholders’ Meeting.
Significant transactions undertaken by the Bank are defined on the basis of the lower of the thresholds of significance resulting from the separate and consolidated financial statements.
For the purposes of the above calculation, each transaction must be considered separately; if transactions are strictly and objectively related as part of the same strategic or operational plan, the calculation must refer to all the related transactions taken together.If no consideration is agreed for a transaction, its “normal value” must be determined beforehand to reflect the price at which the transaction would have taken place between independent parties on arms’-length terms. Standard funding, lending and investment activities conducted on normal market terms are not reported as significant transactions.
- Non-recurring transactions: transactions that are not repeated frequently in the ordinary course of the Bank’s activities. the frequency of transactions must also be assessed with reference to prior years as well as to the current year.
Atypical and/or unusual transactionsthese are defined as all significant transactions, as defined above, which due to the nature of the counterparties, the purpose of the transaction, the method of determining the transfer price or the timing of the event (close to the accounting reference date) may give rise to doubts about the correctness/completeness of the information reported in the financial statements, possible conflicts of interest, the safeguarding of assets or the protection of minority stockholders.
atypical and/or unusual transactions are a subset of significant transactions and are identifiable from the atypical nature of the counterparty or purpose of the transactions and/or from the

363
unusual way in which the transfer price is determined or from the timing of the event.
as an example, the following may be atypical and/or unusual transactions:• consideringthenatureofthecounterparty:significanttransactionsarrangedwithrelatedparties;• withreferencetothepurposeofthetransaction:significanttransactionsinvolvingthetransfer
of resources, services or obligations that are not conducted in the ordinary course of the Bank’s activities;
• withreferencetothewaythattransferpriceisdetermined:significanttransactionswhosetransferprice is not determined on an arms’-length basis and, in any case, those for which no consideration is agreed;
• withreferencetothetimingoftheevent:significanttransactionsarrangedclosetotheaccountingreference date or other relevant dates for the purposes of providing information to the stockholders and/or the market.
With reference to the transactions referred to above, the following quantitative disclosures pro-vided in accordance with the requirements of CONSOB Communication 6064293 dated 28 July 2006 were determined on the basis described above.
3.1 Related-party transactions
the related quantitative disclosures have been provided earlier in point 2 “Information on related-party transactions”.
3.2 Significant non-recurring events and transactions
the entire interest (47.9625% of capital stock) held in Linea Spa was sold on 27 June 2008 for Euro 193 million, net of related costs, under the agreement reached in December 2007 with Compass Spa (Mediobanca Group).
this significant non-recurring transaction falls within the ordinary course of business and does not represent an atypical and/or unusual transaction.
the effect of this transaction on the Bank’s balance sheet, cash flows and income statement in 2008 is summarized in the following tables.
Summary of significant and non-recurring events and transactions affecting the balance sheet
transaction (in thousands of euro) amount Line item1 % Description amount incidence
Sale of interest in Linea S.p.a. (81,929) 140 assets – -100.0%
1 this refers to the total amount reported in the corresponding line item of the balance sheet.

364
Summary of significant and non-recurring events and transactions affecting the cash flow statement:
transaction (in thousands of euro) amount Line item1 % Description amount incidence
Sale of interest in Linea S.p.a. 192,966 B.1. 222,364 86.8%
1 this refers to the total cash flow generated (absorbed) reported in the corresponding line of the cash flow statement.
Summary of significant and non-recurring events and transactions affecting the income state-ment:
transaction (in thousands of euro) amount Line item1 % Description amount incidence
Sale of interest in Linea S.p.a.– gross of tax effect 111,037 250 income stat. 190,337 58.3%– tax effect (1,530) 260 income stat. (39,302) 3.9%– net of tax effect 109,507 290 income stat. 151,035 72.5%
1 this refers to the total amount reported in the corresponding line item of the income statement.
3.3 Positions or transactions deriving from atypical and/or unusual transactions
after the relationship between the Banca Popolare di Vicenza Group and Cattolica assicurazioni became one of “significant influence” under the definition contained in IaS 28 “Investments in associates”, as described in more detail in “Part B – Information on the balance sheet”, Section 4 “Financial assets available for sale” of the explanatory notes, during the year the Parent Bank reclassified 6,097,915 shares (representing an interest of 11.83%) in Cattolica assicurazioni from “Financial assets available for sale” to “Equity investments”. Since the subsidiary BPV Finance also held 458,000 shares (an interest of 0.89%) in Cattolica assicurazioni (also classified in “Financial assets available for sale”), for the purposes of managing and accounting for this investment on an uniform basis in both the consolidated and separate financial statements,on 22 December 2008 the Parent Bank acquired the above shares from BPV Finance on the wholesale market at a price of Euro 46.99 per share, corresponding to the carrying amount in the subsidiary’s books of Euro 21.5 million.

365
there are no outstanding equity-settled payment arrangements.
Part IEQUItY-SEttLED PaYMENt arraNGEMENtS

366
attEStatION OF FINaNCIaL rEPOrtING MaNaGErat 31 DECEMBEr 2008
ATTESTATION OF THE FINANCIAL STATEMENTS PURSUANT TO ART. 81-TER OF CONSOB REGULATION 11971 DATED 14 MAY 1999 AS AMENDED AND UPDATED
1. the undersigned
– Divo Gronchi, as Managing Director, and – Franco tonato, as Financial reporting Manager of Banca Popolare di Vicenza S.c.p.a. attest, also taking account of the provisions of
paragraphs 3 and 4, art. 154-bis of Decree 58 dated 24 February 1998:
• theadequacyinrelationtotheenterprise’scharacteristicsand• theeffectiveapplicationoftheadministrativeandaccountingprocessesforpreparingthe
financial statements, during 2008.
2. No significant matters have emerged in this regard. Banca Popolare di Vicenza has been obliged - under art. 154-bis of Decree 58/98 - to create the position of “Financial reporting Officer” because, as part of its European Medium term Notes programme, it has issued bonds listed on the Luxembourg stock exchange, having chosen Italy as its member state of origin by resolution of the Board of Directors on 6 May 2008. In view of the aforementioned legal requirements, the Board of Directors of Banca Popolare di Vicenza:
• amendedtheBank’sarticlesofassociation(art.39)on3June2008toestablishthepositionof “Financial reporting Manager”, as well as the required experience that such person must have and the methods of their appointment;
• appointed Franco Tonato, the Deputy General Manager in charge of the Financialreporting and Equity Investments Department, as Financial reporting Manager on 17 June 2008, after verifying his integrity and experience and having obtained the consent of the Board of Statutory auditors;
• delegateditsfunctionson28August2008regardingtheattestationunderart.154-bisofDecree 58/98 to Divo Gronchi, the Managing Director;
• approvedon23September2008theBPViGroup’sGovernanceandControlModelforaccounting and administrative processes (Organizational and methodological model of the Financial reporting Manager).

367
3. they also attest that:
3.1 the financial statements:
a. have been prepared in accordance with applicable international accounting standards recognized by the European Union under regulation (EC) 1606/2002 of the European Parliament and Council dated 19 July 2002;
b. correspond to the underlying accounting records and books of account;
c. have been prepared in accordance with the International Financial reporting Standards adopted by the European Union and with the measures implementing art. 9 of Decree 38/2005 and are able to provide a true and fair view of the issuer’s balance sheet, results of operations and financial position;
3.2 the report on operations contains a reliable analysis of performance and the results of operations, as well as of the issuer’s situation, together with a description of the principal risks and uncertainties to which it is exposed.
Vicenza, 7th april 2008
Managing Director Financial reporting Manager
Divo Gronchi Franco tonato

.

INDEPENDENt aUDItOrS’ rEPOrtON tHE CONSOLIDatED FINaNCIaL StatEMENtSaS OF 31 DECEMBEr 2008

370


CONSOLIDATED FINANCIAL STATEMENTSAT 31 DECEMBER 2008
.

376
Assets 31.12.2008 31.12.200710. Cash and balances with central banks 174,934 186,946
20. Financial assets held for trading 794,041 885,773
30. Financial assets at fair value 17,077 25,792
40. Financial assets available for sale 435,913 1,215,589
50. Financial assets held to maturity 25,737 46,129
60. Loans and advances to banks 2,305,618 1,988,830
70. Loans and advances to customers 22,704,640 20,891,458
90. Fair value adjustments of assets in hedged portfolios (+/-) 31,662 –
100. Equity investments 319,600 52,385
120. Property, plant and equipment 547,919 437,609
130. Intangible assets 971,900 984,936 of which: - goodwill 943,762 976,996
140. Tax assets 185,289 140,613 a) current 63,725 37,506 b) deferred 121,564 103,107
150. Non-current assets held for sale – 101,320
160. Other assets 419,000 297,239
Total assets 28,933,330 27,254,619
375
GRUPPO BANCA POPOLARE DI VICENZACONSOLIDATED BALANCE SHEET(in thousands of Euro)
Equity and liabilities 31.12.2008 31.12.200710. Deposits from banks 3,076,718 3,278,694
20. Due to customers 12,161,877 11,479,359
30. Debt securities in issue 5,971,162 5,583,746
40. Financial liabilities held for trading 644,778 662,154
50. Financial liabilities at fair value 3,273,188 2,545,976
60. Hedging derivatives 31,201 –
80. Tax liabilities: 133,411 116,866 a) current 75,052 81,778 b) deferred 58,359 35,088
100. Other liabilities 645,065 559,929
110. Provision for severance indemnities 82,876 82,329
120. Provisions for risks and charges 91,780 108,675 a) pensions and similar commitments 8,643 9,191 b) other provisions 83,137 99,484
140. Valuation reserves 90,362 66,081
160. Equity instruments 13,104 13,630
170. Reserves 392,812 324,487
180. Additional paid-in capital 1,960,355 1,963,297
190. Capital stock 261,460 261,656
200. Treasury shares (-) (96,981) -
210. Minority interests (+/-) 91,423 94,009
220. Net income (loss) for the year (+/-) 108,739 113,731
Total Equity and Liabilities 28,933,330 27,254,619

Captions 31.12.2008 31.12.200710. Interest income and similar revenues 1,533,552 1,256,160
20. Interest expense and similar charges (880,602) (666,324)
30. Net interest income 652,950 589,836 40. Fee and commission income 300,321 304,508
50. Fee and commission expense (28,467) (39,092)
60. Net fee and commission income 271,854 265,416 70. Dividend and similar income 29,114 38,824
80. Net trading income (13,226) (16,329)
90. Fair value adjustments in hedge accounting 461 -
100. Gains (losses) on disposal or repurchase of: 13,548 6,264 a) loans and advances (50) (1) b) financial assets available for sale (931) 4,538 d) financial liabilities 14,529 1,727
110. Net change in financial assets and liabilities (2,324) (6,845)
120. Net interest and other banking income 952,377 877,166 130. Net impairment adjustments to: (186,319) (146,291) a) loans and advances (152,115) (135,843) b) financial assets available for sale (33,237) (10,022) d) other financial transaction (967) (426)
140. Net income from financial activities 766,058 730,875 150. Net premium income - 241,177
160. Other insurance income (charges) - (236,330)
170. Net income from financial and insurance activities 766,058 735,722 180. Administrative costs: (672,697) (586,427) a) payroll (411,516) (349,420) b) other administrative costs (261,181) (237,007)
190. Net provisions for risks and charges (22,464) (41,092)
200. Net adjustments to property, plant and equipment (20,427) (17,401)
210. Net adjustments to intangible assets (5,729) (3,752)
220. Other operating charges/income 42,453 60,074
230. Operating costs (678,864) (588,598)240. Profit (loss) from equity investments 86,445 46,911
250. Net gains (losses) arising on fair value adjustments to property, plant and equipment and intangible assets 95 172
260. Adjustments to goodwill (1,386) (660)
270. Gains (losses) on disposal of investments (201) 645
280. Profit (loss) from current operations before tax 172,147 194,192 290. Income taxes on current operations (61,092) (76,652)
300. Profit (loss) from current operations after tax 111,055 117,540 320. Net income (loss) for the year 111,055 117,540 330. Minority interests (2,316) (3,809)
340. Net income (loss) for the year pertaining to the parent bank 108,739 113,731
GRUPPO BANCA POPOLARE DI VICENZACONSOLIDATED INCOME STATEMENT(in thousands of Euro)
377

378
The “Issue of new shares” is stated net of the cancellations recorded during the year.
CHANGES IN CONSOLIDATED EQUITY
Balance at Balance at Changes Balance at Balance at Allocation of prior year results Changes in the year Equity at 31/12/2007 31/12/2007 to opening 01/01/2008 01/01/2008 Group Reserves - Dividends Changes Changes Equity transactions Net income Net income 31/12/2008 Group Minority balances Group Minority reserves Minority and other in reserves - in reserves - Issue Issue of Purchase Purchase of Extraordinary Change in Derivatives Stock (loss) (loss) Group Minority interests interests interests allocations Group Minority of new new shares of treasury treasury shares distribution equity on treasury Options for 2008 - for 2008 - interests interests shares Minority shares Minority of dividends instruments shares Group Minority Group interests Group interests interests Capital stock: 261,656 46,323 – 261,656 46,323 – – – – 7,528 (196) – – – – – – – – – 261,460 53,851 a) ordinary shares 261,656 46,323 – 261,656 46,323 – – – – 7,528 (196) – – – – – – – – 261,460 53,851 b) other shares – – – – – – – – – – – – – – – – – – – – – –
Additional paid-in capital 1,963,297 6,371 – 1,963,297 6,371 – – – – (4) (2,942) – – – – – – – – 1,960,355 6,367 Reserves: 324,487 26,762 – 324,487 26,762 41,141 959 (1,891) 27,184 2,997 – – – – – – – – – – 392,812 28,827 a) from earnings 238,305 26,678 – 238,305 26,678 41,141 959 (1,891) (25,169) (3) – – – – – – – – – – 254,277 25,743 b) other 86,182 84 – 86,182 84 – – – 52,353 3,000 – – – – – – – – – – 138,535 3,084
Valuation reserves: 66,081 10,744 – 66,081 10,744 – – – 24,281 (10,682) – – – – – – – – – – 90,362 62 a) available for sale assets (72,633) 155 – (72,633) 155 – – 76,634 (129) – – – – – – – – – – 4,001 26 b) cash flow hedges – – – – – – – – – – – – – – – – – – – – – – c) other 138,714 10,589 – 138,714 10,589 – – – (52,353) (10,553) – – – – – – – – – – 86,361 36 – property, plant and equipment – – – – – – – – – – – – – – – – – – – – – – – special revaluation laws 138,714 10,589 – 138,714 10,589 – – – (52,353) (10,553) – – – – – – – – – – 86,361 36
Equity instruments 13,630 – – 13,630 – – – – – – – – – – – (526) – – – – 13,104 –
Treasury shares – – – – – – – – – – – – (96,981) – – – – – – – (96,981) –
Net income (loss) for the year 113,731 3,809 – 113,731 3,809 (41,141) (959) (75,440) – – – – – – – – – – 108,739 2,316 108,739 2,316
Equity 2,742,882 94,009 – 2,742,882 94,009 – – (77,331) 51,465 (161) (3,138) – (96,981) – – (526) – – 108,739 2,316 2,729,851 91,423

379
Balance at Balance at Changes Balance at Balance at Allocation of prior year results Changes in the year Equity at 31/12/2007 31/12/2007 to opening 01/01/2008 01/01/2008 Group Reserves - Dividends Changes Changes Equity transactions Net income Net income 31/12/2008 Group Minority balances Group Minority reserves Minority and other in reserves - in reserves - Issue Issue of Purchase Purchase of Extraordinary Change in Derivatives Stock (loss) (loss) Group Minority interests interests interests allocations Group Minority of new new shares of treasury treasury shares distribution equity on treasury Options for 2008 - for 2008 - interests interests shares Minority shares Minority of dividends instruments shares Group Minority Group interests Group interests interests Capital stock: 261,656 46,323 – 261,656 46,323 – – – – 7,528 (196) – – – – – – – – – 261,460 53,851 a) ordinary shares 261,656 46,323 – 261,656 46,323 – – – – 7,528 (196) – – – – – – – – 261,460 53,851 b) other shares – – – – – – – – – – – – – – – – – – – – – –
Additional paid-in capital 1,963,297 6,371 – 1,963,297 6,371 – – – – (4) (2,942) – – – – – – – – 1,960,355 6,367 Reserves: 324,487 26,762 – 324,487 26,762 41,141 959 (1,891) 27,184 2,997 – – – – – – – – – – 392,812 28,827 a) from earnings 238,305 26,678 – 238,305 26,678 41,141 959 (1,891) (25,169) (3) – – – – – – – – – – 254,277 25,743 b) other 86,182 84 – 86,182 84 – – – 52,353 3,000 – – – – – – – – – – 138,535 3,084
Valuation reserves: 66,081 10,744 – 66,081 10,744 – – – 24,281 (10,682) – – – – – – – – – – 90,362 62 a) available for sale assets (72,633) 155 – (72,633) 155 – – 76,634 (129) – – – – – – – – – – 4,001 26 b) cash flow hedges – – – – – – – – – – – – – – – – – – – – – – c) other 138,714 10,589 – 138,714 10,589 – – – (52,353) (10,553) – – – – – – – – – – 86,361 36 – property, plant and equipment – – – – – – – – – – – – – – – – – – – – – – – special revaluation laws 138,714 10,589 – 138,714 10,589 – – – (52,353) (10,553) – – – – – – – – – – 86,361 36
Equity instruments 13,630 – – 13,630 – – – – – – – – – – – (526) – – – – 13,104 –
Treasury shares – – – – – – – – – – – – (96,981) – – – – – – – (96,981) –
Net income (loss) for the year 113,731 3,809 – 113,731 3,809 (41,141) (959) (75,440) – – – – – – – – – – 108,739 2,316 108,739 2,316
Equity 2,742,882 94,009 – 2,742,882 94,009 – – (77,331) 51,465 (161) (3,138) – (96,981) – – (526) – – 108,739 2,316 2,729,851 91,423

380
The “Issue of new shares” is stated net of the cancellations recorded during the year.
CHANGES IN CONSOLIDATED EQUITY
Balance at Balance at Changes Balance at Balance at Allocation of prior year results Changes in the year Equity at 31/12/2006 31/12/2006 to opening 01/01/2007 01/01/2007 Group Reserves - Dividends Changes Changes Equity transactions Net income Net income 31/12/2007 Group Minority balances Group Minority reserves Minority and other in reserves - in reserves - Issue Issue of Purchase Purchase of Extraordinary Change in Derivatives Stock (loss) (loss) Group Minority interests interests interests allocations Group Minority of new new shares of treasury treasury shares distribution equity on treasury Options for 2007 - for 2007 - interests interests shares Minority shares Minority of dividends instruments shares Group Minority Group interests Group interests interests Capital stock: 230,868 22,272 – 230,868 22,272 – – – – 24,051 30,788 – – – – – – – – – 261,656 46,323 a) ordinary shares 230,868 22,272 – 230,868 22,272 – – – – 24,051 30,788 – – – – – – – – – 261,656 46,323 b) other shares – – – – – – – – – – – – – – – – – – – – – –
Additional paid-in capital 1,557,856 3,487 – 1,557,856 3,487 – – – – 2,884 405,441 – – – – – – – – – 1,963,297 6,371 Reserves: 236,116 22,809 – 236,116 22,809 79,076 774 – (2,759) 3,179 – – – – – 12,054 – – – – 324,487 26,762 a) from earnings 179,934 22,725 – 179,934 22,725 49,076 774 – (2,759) 3,179 – – – – – 12,054 – – – – 238,305 26,678 b) other 56,182 84 – 56,182 84 30,000 – – – – – – – – – – – – – – 86,182 84
Valuation reserves: 153,719 10,618 – 153,719 10,618 – – – (87,638) 126 – – – – – – – – – – 66,081 10,744 a) available for sale assets 15,030 4 – 15,030 4 – – (87,663) 151 – – – – – – – – – – (72,633) 155 b) cash flow hedges – – – – – – – – – – – – – – – – – – – – – – c) other 138,689 10,614 – 138,689 10,614 – – – 25 (25) – – – – – – – – – – 138,714 10,589 – property, plant and equipment – – – – – – – – – – – – – – – – – – – – – – – special revaluation laws 138,689 10,614 – 138,689 10,614 – – – 25 (25) – – – – – – – – – – 138,714 10,589
Equity instruments 12,054 – – 12,054 – – – – – – – – – – – 1,576 – – – – 13,630 –
Treasury shares – – – – – – – – – – – – – – – – – – – – – –
Net income (loss) for the year 144,502 3,641 – 144,502 3,641 (79,076) (774) (68,292) – – – – – – – – – – 113,731 3,809 113,731 3,809
Equity 2,335,115 62,827 – 2,335,115 62,827 – – (68,292) (90,397) 30,240 436,229 – – – – 13,630 – – 113,731 3,809 2,742,882 94,009

381
Balance at Balance at Changes Balance at Balance at Allocation of prior year results Changes in the year Equity at 31/12/2006 31/12/2006 to opening 01/01/2007 01/01/2007 Group Reserves - Dividends Changes Changes Equity transactions Net income Net income 31/12/2007 Group Minority balances Group Minority reserves Minority and other in reserves - in reserves - Issue Issue of Purchase Purchase of Extraordinary Change in Derivatives Stock (loss) (loss) Group Minority interests interests interests allocations Group Minority of new new shares of treasury treasury shares distribution equity on treasury Options for 2007 - for 2007 - interests interests shares Minority shares Minority of dividends instruments shares Group Minority Group interests Group interests interests Capital stock: 230,868 22,272 – 230,868 22,272 – – – – 24,051 30,788 – – – – – – – – – 261,656 46,323 a) ordinary shares 230,868 22,272 – 230,868 22,272 – – – – 24,051 30,788 – – – – – – – – – 261,656 46,323 b) other shares – – – – – – – – – – – – – – – – – – – – – –
Additional paid-in capital 1,557,856 3,487 – 1,557,856 3,487 – – – – 2,884 405,441 – – – – – – – – – 1,963,297 6,371 Reserves: 236,116 22,809 – 236,116 22,809 79,076 774 – (2,759) 3,179 – – – – – 12,054 – – – – 324,487 26,762 a) from earnings 179,934 22,725 – 179,934 22,725 49,076 774 – (2,759) 3,179 – – – – – 12,054 – – – – 238,305 26,678 b) other 56,182 84 – 56,182 84 30,000 – – – – – – – – – – – – – – 86,182 84
Valuation reserves: 153,719 10,618 – 153,719 10,618 – – – (87,638) 126 – – – – – – – – – – 66,081 10,744 a) available for sale assets 15,030 4 – 15,030 4 – – (87,663) 151 – – – – – – – – – – (72,633) 155 b) cash flow hedges – – – – – – – – – – – – – – – – – – – – – – c) other 138,689 10,614 – 138,689 10,614 – – – 25 (25) – – – – – – – – – – 138,714 10,589 – property, plant and equipment – – – – – – – – – – – – – – – – – – – – – – – special revaluation laws 138,689 10,614 – 138,689 10,614 – – – 25 (25) – – – – – – – – – – 138,714 10,589
Equity instruments 12,054 – – 12,054 – – – – – – – – – – – 1,576 – – – – 13,630 –
Treasury shares – – – – – – – – – – – – – – – – – – – – – –
Net income (loss) for the year 144,502 3,641 – 144,502 3,641 (79,076) (774) (68,292) – – – – – – – – – – 113,731 3,809 113,731 3,809
Equity 2,335,115 62,827 – 2,335,115 62,827 – – (68,292) (90,397) 30,240 436,229 – – – – 13,630 – – 113,731 3,809 2,742,882 94,009

382
A. OPERATING ACTIVITIES 31/12/2008 31/12/2007
1. Operations 277,060 427,289
– Interest income collected (+) 1,521,492 1,256,160 – Interest expense paid (-) (870,218) (666,324) – Dividend and similar income 29,114 38,824 – Net fee and commission income (+/-) 271,854 265,416 – Payroll costs (-) (411,516) (326,452) – Net premium income (+) – 241,177 – Other insurance income (charges) (+/-) – (126,959) – Other costs (-) (272,937) (237,975) – Other revenues (+) 42,217 60,074 – Taxation (-) (32,945) (76,652)
2. Liquidity generated/absorbed by financial assets (2,142,686) (3,547,110)
– Financial assets held for trading 88,024 646,034 – Financial assets at fair value 2,214 320,538 – Financial assets available for sale 126,590 184,251 – Loans and advances to customers (2,086,660) (4,347,797) – Loans and advances to banks: demand 582,846 (302,413) – Loans and advances to banks: other receivables (750,634) (5,626) – Other assets (105,066) (42,097)
3. Liquidity generate/absorbed by financial liabilities 1,941,783 3,254,230
– Deposits from banks: demand 214,326 89,225 – Deposits from banks: other payables (416,302) 1,089,218 – Due to customers 1,160,518 606,765 – Debt securities in issue 387,416 649,910 – Financial liabilities held for trading 17,376 (39,170) – Financial liabilities at fair value 573,815 868,259 – Other liabilities 4,634 (9,977)
Net liquidity generated/absorbed by operating activities 76,157 134,409
CONSOLIDATED CASH FLOW STATEMENT
Direct method(in thousands of Euro)

383
B. INVESTING ACTIVITIES
1. Liquidity generated by 215.996 79.393
– Disposal of property, plant and equipment (1) 194.562 72.998 – Dividends collected on equity investments – 863 – Disposal/redemption of financial assets held to maturity 21.093 479 – Disposal of property, plant and equipment 341 5.053
2. Liquidity absorbed by (130.930) (550.297)
– Purchase of equity investments (522) (6.029) – Purchase of businesses – (481.353) – Purchase of property, plant and equipment (128.499) (32.279) – Purchase of intangible assets (1.909) (30.636)
Net liquidity generated/absorbedby investing activities 85.066 (470.904)
C. FUNDING ACTIVITIES
– Issue/purchase of treasury shares (100.119) 436.229 – Issue/purchase of equity instruments (526) – – Distribution of dividends and other purposes (72.590) (68.292)
Net liquidity generated/absorbedby funding activities (173.235) 367.937
NET LIQUIDITY GENERATED/ABSORBED IN THE YEAR (12.012) 31.442
RECONCILIATION
Captions 31/12/2008 31/12/2007
Cash and cash equivalents at the beginning of the year 186.946 155.504
Net liquidity generated/absorbed in the year (12.012) 31.442
Cash and cash equivalents at the end of the year 174.934 186.946
The consolidated statement of cash flows presented above was prepared using the “direct” method envisaged by IAS 7 and reports the “cash flows” from the Group’s operating, investing and financing activities.
1 This line item comprises liquidity generated by the disposal of the entire interest in Linea S.p.A.recognized in line item “non-current assets held for sale” at 31 December 2007.

.

Part A - Accounting policies
Part B - Information on the consolidated balance sheet
Part C - Information on the consolidated income statement
Part D – Segment information
Part E - Information on risks and related hedging policy
Section 1 - Risks of the Banking Group: 1.1 Credit risk Section 1 - Risks of the Banking Group: 1.2 Market risk Section 1 - Risks of the Banking Group: 1.3 Liquidity risk Section 1 - Risks of the Banking Group: 1.4 Operational risks
Part F – Information on consolidated equity
Part G – Business combinations
Part H - Related-party transactions
Part I – Equity-settled payment arrangements
385
EXPLANATORY NOTES TO THE CONSOLIDATED FINANCIAL STATEMENTS

386
PART AACCOuNTING POLICIES
A. 1 – GENERAL INFORMATION
The consolidated financial statements of the Banca Popolare di Vicenza Group at 31 December 2008 have been prepared in accordance with the International Accounting Standards (IAS) and International Financial Reporting Standards (IFRS) issued by the International Accounting Standards Board (IASB) and endorsed by the European Commission under the procedure in art. 6 of Regulation (EC) 1606/2002 and in force at the balance sheet date, including the related interpretations of the International Financial Reporting Interpretations Committee (IFRIC).
Section 2 - Basis of preparation
The consolidated financial statements consist of the balance sheet, the income statement, the statement of changes in equity, the statement of cash flows and these explanatory notes, accompanied by the report of the Board of Directors.
Consistent with art. 9 of Decree 38/2005, the consolidated financial statements have been prepared with reference to the formats and rules specified in Bank of Italy Circular 262 dated 22 December 2005. Additional information, considered necessary to give a true and fair view of the financial statements, has also been provided even if not specifically required by the regulations.
The amounts contained in the balance sheet, the income statement, the statement of changes in equity, the statement of cash flows and these explanatory notes are, except where indicated otherwise, stated in thousands of euro. The roundings have been made in accordance with the related regulations.
The consolidated financial statements are prepared on a going concern basis and with reference to the general criteria listed below:– true and fair view;– matching principle;– consistency of comparison;– no-offset, except where specifically allowed; – substance over form;– prudence.
Going concern
The joint co-ordination committee for IAS/IFRS application between the Bank of Italy, Consob and Isvap (Italy’s insurance industry regulator) issued its document no. 2 on 6 February 2009 entitled “Disclosures in financial reports on going concern, financial risks, impairment testing and estimation uncertainty”. This document requires management to carry out a particularly detailed review in relation to the presumption of going concern.
Paragraphs 23-24 of IAS 1 establish that: “When preparing financial statements, management shall make an assessment of an entity’s ability to continue as a going concern. Financial statements shall be prepared on a going concern basis unless management either intends to liquidate the entity or to cease trading, or has no realistic alternative but to do so. When management is aware, in making its assessment, of material uncertainties related to events

387
or conditions that may cast significant doubt upon the entity’s ability to continue as a going concern, those uncertainties shall be disclosed. When financial statements are not prepared on a going concern basis, that fact shall be disclosed, together with the basis on which the financial statements are prepared and the reason why the entity is not regarded as a going concern”.
The current conditions of financial markets and of the real economy and the negative short/medium-term forecasts mean that the presumption of going concern must now be assessed particularly thoroughly.
Having examined the risks and uncertainties associated with the current macroeconomic context, the Group can reasonably expect to carry on its operations in the foreseeable future and so its financial statements for 2008 have been prepared on a going concern basis.
uncertainties associated with liquidity, credit and earnings risks are viewed as not significant and in any case not such as to cast doubt upon the Group’s ability to continue as a going concern, also in view of the constant growth in the Group’s earnings in recent years, the good quality of its loan book and its ease of access to financial resources. For more details, please refer to the paragraph on “Outlook for operations” in the directors’ report.
Section 3 - Scope of consolidation and methodology
The carrying value of investments consolidated on a line-by-line basis, including their assets and liabilities, off-balance sheet transactions, as well as income and expenses, is eliminated against the related interest in their equity at the time they were acquired or consolidated for the first time; any differences are allocated, as far as possible, to the assets and liabilities of the consolidated companies concerned and residual amounts are reported as “Goodwill”.
Investments in joint ventures and associates are measured using the equity method, adjusting their carrying values to reflect the Group’s interest in the equity reported in their financial statements at the time they were acquired or consolidated for the first time. Where not attributable to specific asset and liability line items, the differences emerging upon first-time consolidation of such investments are allocated to “Goodwill” in the case of subsidiaries, but included in the carrying amount of the investment in the case of associates and joint ventures. Subsequent changes are allocated to equity investments, with the matching entry to “Profit (loss) from equity investments” in the income statement.
Equity investments classified as “non-current assets and disposal groups” in compliance with IFRS 5, are carried at the lower of their book or fair value net of selling costs.
Dividends distributed within the Group are reversed back to reserves since the related income was recognized by the individual companies in prior years.
Receivables, payables, income and expenses arising from transactions between Group companies are eliminated, except where insignificant.
The balance sheets and income statements used for line-by-line consolidation purposes are those approved by the Boards of Directors of the individual companies as of 31 December 2008; the financial statements prepared under IAS/IFRS were used directly while, for companies that prepared their financial statements under Italian GAAP, balance sheets and income statements were prepared in accordance with the accounting policies adopted by the Parent Bank.

388
Investments in companies carried at equity are stated with reference to the equity reported in their 2007 financial statements, if their financial statements for the current year have not yet been approved by their respective Boards of Directors.
Following changes in the scope of consolidation during the prior year – discussed in the relevant section of the report on operations – the figures reported in certain sections, line items and tables of the explanatory notes may not be immediately comparable with those reported in the prior year.
Lastly, the income statements of companies joining or leaving the scope of consolidation in the year or those whose method of consolidation changes in the year are consolidated from the date of acquisition or up until the date of disposal or from/until the date of change respectively.

389
1. Equity investments in subsidiary companies and joint ventures
Key:
(1) Nature of holding:1 = majority of voting rights at ordinary stockholders’ meeting2 = dominant influence at ordinary stockholders’ meeting3 = agreements with other stockholders
Name Registered Nature of Investment details office holding (1) Holder % interest held A. COMPANIES A.1 COMPANIES CONSOLIDATED LINE-BY-LINE 1. BANCA POPOLARE DI VICENZA S.c.p.A. Capital stock Euro 261,460,260 in shares of par value Euro 3,75 VICENZA Parent Bank 2. CASSA DI RISPARMIO DI PRATO S.p.A. Capital stock Euro 153,300,000 in shares of par value Euro 76,65 PRATO 1 B. Pop. Vicenza 79.003. BANCA NuOVA S.p.A. Capital stock Euro 42,690,210,80 in shares of par value Euro 4,3 PALERMO 1 B. Pop. Vicenza 99.594. FARBANCA S.p.A. Capital stock Euro 28,242,100 in shares of par value Euro 10 BOLOGNA 1 B. Pop. Vicenza 47.525. IMFurnitureARE STAMPA S.p.A. Capital stock Euro 125,000,000 in shares of par value Euro 500 VICENZA 1 B. Pop. Vicenza 100.006. MONFORTE 19 S.r.l. Capital stock Euro 10,000 in shares of par value Euro 1 VICENZA 1 B. Pop. Vicenza 100.007. BPV FINANCE INTERNATIONAL PLC Capital stock Euro 103,291 in shares of par value Euro 1 DuBLINO 1 B. Pop. Vicenza 99.998. NORDEST MERCHANT S.p.A. Capital stock Euro 2,000,000 in shares of par value Euro 1 VICENZA 1 B. Pop. Vicenza 80.009. NEM SGR S.p.A. Capital stock Euro 1,200,000 in shares of par value Euro 1 VICENZA 1 Nordest Merchant 100.0010. NEM DuE SGR S.p.A. Capital stock Euro 1,200,000 in shares of par value Euro 1 VICENZA 1 Nordest Merchant 100.0011. B.P.VI FONDI SGR S.p.A. Capital stock Euro 10,000,000 in shares of par value Euro 5 VICENZA 4 B. Pop. Vicenza 50.0012 SERVIZI BANCARI S.p.A. Capital stock Euro 100,000 in shares of par value Euro 50 VICENZA 1 B. Pop. Vicenza 97.00 B.Nuova 1.00 Cariprato 1.00 Farbanca 1.0013. PRESTINuOVA S.p.A. Capital stock Euro 25,263,160 in shares of par value Euro 10 PALERMO 1 B. Nuova 88.67 B. Pop. Vicenza 6.3314. NuOVA MERCHANT S.p.A. Capital stock Euro 120,000 in shares of par value Euro 1 ROMA 1 B. Pop. Vicenza 100.00
4 = other forms of control5 = coordinated control under art. 26.1 of Decree 87/926 = coordinated control under art. 26.2 of Decree 87/927 = joint control

390
Section 4 – Subsequent events
There have been no significant events since the date of the consolidated financial statements (31 December 2008) and the date of their approval by the Board of Directors (24 March 2009), except as indicated below.
On 28 January 2009 the Lazio regional Tax Tribunal accepted the appeal by Banca Popolare di Vicenza and Banca Nuova and cancelled the action taken by the Italian Antitrust Authority in August 2008 against these two BPVi Group banks, relating to alleged unfair business practice involving the transferability of mortgages at zero charge (as allowed by art 8 of Decree 7 dated 31 January 2007, as amended by Law 40 dated 2 April 2007 and Law 244 dated 24 December 2007).
With 60 days having passed since filing the resolution of transformation without any opposition from creditors, Servizi Bancari was transformed from a joint-stock company into a co-operative with effect from February 2009; this transformation had been approved in an extraordinary shareholders’ meeting in December 2008 with the aim of optimizing the benefits of rationalizing back office processes for the banking group as a whole.
Two contracts were signed on 27 February 2009 with the uBI Banca Group for the acquisition of the Corporate Business unit (CBu) of Banca Popolare Commercio e Industria and its Palermo Branch located in Via Notarbartolo. The acquisition of the Corporate Business unit, by the Parent Bank BPVi, comprising corporate customers in the provinces of Brescia and Bergamo, forms part of the previous acquisition on 31 December 2007 of 18 bank branches (out of the total 61 branches acquired from the uBI Group) located in these provinces, and so has taken place without the Group paying any additional consideration. The Palermo Branch has been acquired by the subsidiary Banca Nuova at a provisional price of Euro 2 million, which will be adjusted if the amount of deposits reported in the final balance sheet is lower than that reported at 31 July 2008 (the date being used for the opening balance sheet). These acquisitions were completed on 1 March 2009. More details about these acquisitions can be found in “Part G - Business combinations” of these Explanatory Notes.
On 10 March 2009 an extraordinary shareholders’ meeting of Nuova Merchant voted to transform its legal status from that of a joint-stock company (S.p.A.) into that of a private limited company (S.r.l.) with a consequent change in its name to “NuOVA MERCHANT S.r.l.”. Its capital stock, still held by the sole stockholder Banca Popolare di Vicenza, has been reduced to the legal minimum of Euro 10,000 required for “S.r.l.” companies. The change of legal status is a preliminary to the subsequent merger of Nuova Merchant into Nordest Merchant, the BPVi Group’s other merchant banking company, as part of the plans to rationalize corporate structure set out in the new Business Plan for 2008-2011. The merger will come into effect by mid 2009.
Lastly, on 5 March 2009 the Governing Council of the ECB decided to cut the Eurozone base rate by half a point, taking it to an all-time low of 1.50%. On the same day the Bank of England also cut its base rate by another half a point, taking it to 0.50%, the lowest ever level since the Bank of England’s foundation in 1694.

391
Section 5 – Other matters
The figures contained in the balance sheet, income statement, statement of changes in consolidated equity, cash flow statement and the tables in Part B and Part C of these explanatory notes are all presented on a comparative basis with those at 31 December 2007. Line items in the balance sheet and income statement and in the tables in the explanatory notes are not presented if their balance is zero in both years.
As from the date of these consolidated financial statements, the emoluments of the Board of Statutory Auditors and related reimbursement of expenses are being classified in “Payroll costs” (previously they were reported in “Other administrative costs”); this reclassification is to comply with the Bank of Italy’s instructions regarding financial statements of banks and financial institutions. These amounts have consequently been reclassified in the income statement and related notes for 2007.
The consolidated financial statements have been audited by KPMG S.p.A., an independent firm of auditors. The consolidated financial statements are also accompanied by the attestation of the Financial Reporting Manager, as required by art. 154-bis, para. 5, of Decree 58/98 (Italy’s Consolidated Financial Markets Act – TuF) as amended by Decree 195/2007.
Estimation uncertainty and risks
As indicated in the explanatory notes, estimation processes have been completed in support of the carrying amount of the more significant items requiring valuation in the consolidated financial statements at 31 December 2008, as required by prevailing accounting standards and relevant regulation. These processes are largely based on estimating the future recoverability of amounts reported in the financial statements in accordance with rules dictated by current regulation and have been performed on a going concern basis, ie. valuations are not based on the assumption of a forced sale.
The outcome of this work supports the carrying amount of these items at 31 December 2008. It should be stated, however, that this valuation process was particularly complex in view of the current macroeconomic and market context, featuring abnormal volatility in all financial measures used for valuation purposes, and the consequent difficulty in making even short-term forecasts for these financial parameters which have a significant impact on estimates.
The parameters and information used for verifying the values mentioned above have been heavily affected by the particularly uncertain macroeconomic and market environment which could, like in recent months, experience currently unforeseeable rapid changes, with a consequent impact on the amounts reported in the consolidated financial statements at 31 December 2008.

392
A.2 – PART RELATING TO THE PRINCIPAL FINANCIAL STATEMENT LINE ITEMS
This section describes the accounting policies adopted for the preparation of the consolidated financial statements as of 31 December 2008. These policies were applied on a basis consistent with those adopted for the preparation of the 2007 financial statements, which were also prepared under IAS/IFRS, except for the changes to IAS 39 “Financial instruments: recognition and measurement” and to IFRS 7 “Financial instruments: disclosures” contained in the document “Reclassification of Financial Assets”, published by the IASB on 13 October 2008 and endorsed by the European Commission on 15 October 2008 with Regulation EC 1004/2008.
ASSETS
1. Financial assets held for trading
Classification
This line item comprises the financial instruments held for trading in the short term; specifically:• debtsecurities,whetherlistedorunlisted,heldfortrading;• listedequityinstrumentsheldfortrading;• unlistedequityinstrumentsheldfortrading,butonlyiftheirfairvaluecanbedetermined
on a reliable basis;• asset-backeddebtsecurities(ABS),seniorormezzanine,issuedbyspecial-purposevehicles
(SPV) as part of securitizations by the Parent Bank or by third parties;• structuredsecurities;• unitsinmutualfundsandsicavsheldfortrading;• derivativecontractswithapositivefairvalueatthereportingdate,exceptforcontractsthat
are designated as effective hedging instruments; if the fair value of a derivative contract subsequently becomes negative it is recorded as a financial liability held for trading.
Derivative contracts include embedded derivatives which are attached to a primary financial instrument, known as the “host contract”, and forward transactions in currencies, securities, goods and precious metals. An embedded derivative is recognized separately from the host contract when all of the following conditions are satisfied:
• itseconomiccharacteristicsandrisksarenotcloselyrelatedtothoseofthe“host”contract;• theseparatedembeddedinstrumentmeetsthedefinitionofaderivative;• thehybridinstrumentisnotmeasuredatfairvaluethroughtheincomestatement.
Financial instruments are designated as financial assets held for trading upon initial recognition. They cannot be subsequently reclassified, except as provided by paragraphs 50 to 54 of IAS 39, as amended by Regulation (EC) 1001/2008 of the European Commission issued on 15 October 2008.
Recognition
The initial recognition of financial assets held for trading takes place: on the settlement

393
date for debt securities, equity instruments and units in mutual funds and sicavs; on the subscription date for derivative contracts.
Financial assets held for trading are initially recognized at their fair value and the transaction costs and/or income directly attributable to them are not recognized. The fair value of instruments acquired on market terms is represented by their purchase cost.
Measurement and recognition of components affecting the income statement
Subsequent to initial recognition, financial assets held for trading are stated at fair value through the income statement. IAS 39 defines fair value as “the amount for which an asset could be exchanged, or a liability settled, between knowledgeable, willing parties in an arms’-length transaction”. Fair value is determined as follows:• the“quotedmarketprice”offinancialinstrumentstradedinan“activemarket”;• the prices struck in over-the-counter markets or, otherwise, using generally accepted
internal pricing models, if the financial instruments are not traded in an “active market”.
If the fair value of financial assets cannot be determined reliably on the above basis, they are stated at cost and recorded as “financial assets available for sale“.
Gains and losses realized on sale or redemption and unrealized gains and losses deriving from changes in the fair value of financial assets/liabilities held for trading are classified in the “net trading profit (loss)” caption of the income statement, together with the effect of measuring foreign currency monetary assets and liabilities.
Derecognition
Financial assets held for trading are derecognized when the contractual rights over the related cash flows expire or when the financial asset is transferred together with substantially all the contractual risks and benefits associated with its ownership.
2. Financial assets at fair value
Classification
This line item comprises the assets or groups of assets designated at fair value through the income statement, under the fair-value option (FVO) envisaged by IAS 39. In particular, the FVO is used when it eliminates or significantly reduces accounting imbalances deriving from the inconsistent recognition of financial instruments that are correlated (natural hedges) or covered by derivative contracts which, due to difficulties and complexities, cannot be recognised as hedges. The FVO is also used in the presence of an embedded derivative that meets the conditions described in paragraph 11 of IAS 39. This avoids separating it from the host instrument by stating the entire financial instrument at fair value.
Financial instruments are designated as financial assets at fair value upon initial recognition. They cannot be subsequently reclassified, except as provided by paragraphs 50 to 54 of IAS 39, as amended by Regulation (EC) 1001/2008 of the European Commission issued on 15 October 2008.

394
Recognition, measurement, derecognition and recording of components affecting the income statement
The principles applying to the recognition, measurement and derecognition of financial assets at fair value are the same as those relating to “financial assets held for trading”.
Gains and losses realized on sale or redemption and unrealized gains and losses deriving from changes in the fair value of financial assets/liabilities at fair value are classified as “net trading profit (loss)” in the income statement.
3. Financial assets available for sale
Classification
This line item comprises the non-derivative financial assets that are not classified in the other categories envisaged by IAS 39. Accordingly, this is a residual category that includes for example:• unlistedequities,unlessoriginallyattributedtotheportfoliooffinancialassetsheldfor
trading;• securitiesthatguaranteetransactionsarrangedwiththirdparties,ifnotclassifiedelsewhere;• unitsinmutualfundsandsicavs,unlessoriginallyattributedtotheportfoliooffinancial
assets held for trading;• junior asset-backed debt securities issued by SPVs as part of own or third-party
securitizations;• equity investments that do not represent interests in subsidiaries, associates or joint
ventures;• otherdebtandequityinstrumentsthatcannotbeclassifiedintotheabovecategories.
Financial instruments are designated as financial assets available for sale upon initial recognition. They cannot be subsequently reclassified, except as provided by paragraphs 50 to 54 of IAS 39, as amended by Regulation (EC) 1001/2008 of the European Commission issued on 15 October 2008.
Recognition
The initial recognition of available-for-sale (AFS) financial assets takes place on the settlement date. The financial assets classified in this category are recorded at fair value upon initial recognition, as uplifted by any directly-attributable acquisition costs.
Measurement and recognition of components affecting the income statement
Subsequent to initial recognition, AFS financial assets are stated at fair value; the profits and losses deriving from any changes in fair value are recorded in a specific equity reserve until the financial assets concerned are derecognized or a permanent impairment of value is recognized.
If an AFS financial asset suffers an impairment loss, the accumulated unrealized losses deferred to equity are released to “net impairment adjustments to financial assets available for sale” in the income statement. Write-backs of AFS financial instruments are credited to the income statement if they are debt securities or to equity if they are equity instruments.

395
Fair value is determined on the basis described in relation to financial assets held for trading. If the fair value of financial assets cannot be determined on a reliable basis, they are stated at cost.
The interest income on these financial assets is determined using the effective interest method.
Any exchange gains or losses on AFS financial assets are recorded in the income statement if they relate to monetary items (e.g. debt securities) and as part of equity if they relate to non-monetary items (e.g. equity instruments).
Derecognition
AFS financial assets are derecognized when the contractual rights over the related cash flows expire or when the financial asset is transferred together with substantially all the contractual risks and benefits associated with its ownership.
4. Financial assets held to maturity
Classification
This category comprises debt instruments quoted in “active markets”, with fixed maturities and fixed or determinable payments, which the Group intends and is able to hold until maturity. These include debt securities with maturities/residual lives of not less than 24 months which comply with the quantitative limits established at Group level, as authorized by the Board of Directors of the Parent Bank.
Financial instruments are designated as financial assets held to maturity upon initial recognition. They cannot be subsequently reclassified, except as provided by paragraphs 50 to 54 of IAS 39, as amended by Regulation (EC) 1001/2008 of the European Commission issued on 15 October 2008.
Recognition
Financial assets held to maturity are initially recognized on the settlement date, on the basis of their fair value, as uplifted by any directly-attributable acquisition costs.
Measurement and recognition of components affecting the income statement
Subsequent to initial recognition, financial assets held to maturity are measured at amortized cost, using the effective interest method. Profits and losses relating to these assets held to maturity are recorded in the income statement at the time of derecognition.
An impairment test is carried out at the reporting date to check for objective evidence of any loss in value. Any losses identified are charged to the income statement under “net impairment adjustments to financial assets held to maturity”. If the reasons for such losses cease to apply due to events subsequent to the write-down, the original amounts are reinstated by crediting the related write-backs to the income statement. Write-backs do not exceed the

396
amortized cost that the instrument would have had in the absence of earlier write-downs.
The interest income on these financial assets is determined using the effective interest method.
Derecognition
Financial assets held to maturity are derecognized when the contractual rights over the related cash flows expire or when the financial asset is transferred together with substantially all the contractual risks and benefits associated with its ownership.
5. Loans and advances to banks
Classification
This line item comprises financial assets not quoted in an active market due from banks (current accounts, guarantee deposits, debt securities, etc.) that have been classified in the loan portfolio.
The balance includes amounts due from Central Banks, other than unrestricted deposits (e.g. the compulsory reserve).
Details of the recognition, measurement, derecognition and recording of these loans can be found in the subsequent note on “loans and advances to customers”.
6. Loans and advances to customers Classification
Loans to customers include short and long-term finance granted directly to customers or purchased from third parties, which is repayable on fixed or determinable dates and is not quoted in an active market.
This category also includes debt securities not quoted in an active market acquired on initial placement, where the lending element prevails over the investment element, and the purchase essentially represents the granting of a loan.
Financial instruments are designated as loans and advances to customers upon initial recognition. They cannot be reclassified subsequently.
Recognition
The initial recognition of a loan takes place on the grant date or, in the case of debt securities, on the settlement date, with reference to the fair value of the financial instrument. This is the amount paid out, or the subscription price, including the directly-related and determinable costs and commissions applying from the start of the transaction.
Costs with the above characteristics are excluded if they are reimbursable by the borrower or represent normal internal administrative costs.

397
Measurement and recognition of components affecting the income statement
Subsequent to initial recognition, loans to customers are measured at amortized cost. This is their initially-recorded value as decreased/increased by repayments of principal, write-downs/write-backs and the amortization – determined using the effective interest method – of the difference between the amount paid out and that repayable on maturity, which typically represents costs/income directly attributable to the individual loans.
The effective interest rate is the rate that discounts the flow of estimated future payments over the expected duration of the loan so as to obtain exactly the net book value at the time of initial recognition, which includes directly-related transaction costs and all fees paid or received between the contracting parties. This financial method of accounting distributes the economic effect of costs/income over the expected residual life of each loan.
Estimates of the flows and the contractual duration of the loan take account of all contractual clauses that could influence the amounts and due dates (such as early repayments and the various options that can be exercised), but without considering any expected losses on the loan.
The amortized cost method is not applied to short-term loans, since the discounting effect would be negligible, and these are therefore stated at historical cost. The same measurement criterion is applied to loans without a fixed repayment date or which are repayable upon demand.
In addition, an analysis is performed to identify any problem loans for which there is objective evidence of possible impairment. This category includes loans classified as “non-performing”, “watchlist”, “restructured” or “past due or overdrawn for more than 180 days”, as defined by the supervisory regulations.
The adjustment to the value of each loan represents the difference between its amortized cost (or historical cost for short-term and demand loans) at the time of measurement and the discounted value of the related future cash flows, determined using the original effective interest rate.
Key elements in determining the present value of future cash flows comprise the estimated realizable value of loans, also taking account of any available guarantees, the expected timing of recoveries and the forecast loan-recovery costs. Cash flows relating to loans due to be recovered in the short term are not discounted.
In particular, the approach taken for determining case-by-case the recoverable value of non-performing loans depends on their amount:
• uptoEuro25,000,thepositionsareanalyzedcase-by-casebutarenotdiscounted,sincethey are frequently not taken to court, but sold after the usual attempts to obtain recovery on an amicable basis - these loans generally remain in this category for not more than 12/18 months, representing the short term;
• fromEuro25,000toEuro150,000,thepositionsareanalyzedonacase-by-casebasistoestimate the amount recoverable, which is discounted over the average recovery period, as determined with reference to historical-statistical information;
• amountsexceedingEuro150,000areanalyzedonacase-by-casebasis toestimate theamount recoverable, which is discounted over the likely recovery period, as determined by the competent corporate functions.
Watchlist loans exceeding Euro 150,000 are analyzed on a case-by-case basis to estimate
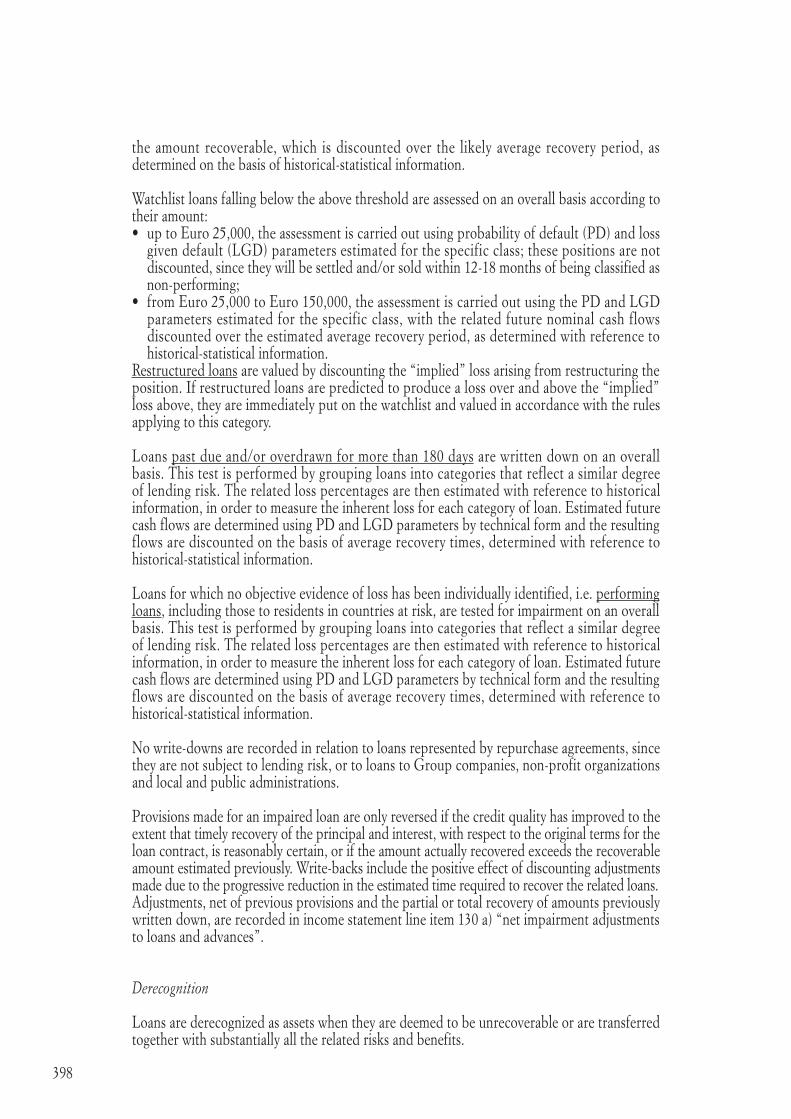
398
the amount recoverable, which is discounted over the likely average recovery period, as determined on the basis of historical-statistical information.
Watchlist loans falling below the above threshold are assessed on an overall basis according to their amount:• uptoEuro25,000,theassessmentiscarriedoutusingprobabilityofdefault(PD)andloss
given default (LGD) parameters estimated for the specific class; these positions are not discounted, since they will be settled and/or sold within 12-18 months of being classified as non-performing;
• fromEuro25,000toEuro150,000,theassessmentiscarriedoutusingthePDandLGDparameters estimated for the specific class, with the related future nominal cash flows discounted over the estimated average recovery period, as determined with reference to historical-statistical information.
Restructured loans are valued by discounting the “implied” loss arising from restructuring the position. If restructured loans are predicted to produce a loss over and above the “implied” loss above, they are immediately put on the watchlist and valued in accordance with the rules applying to this category.
Loans past due and/or overdrawn for more than 180 days are written down on an overall basis. This test is performed by grouping loans into categories that reflect a similar degree of lending risk. The related loss percentages are then estimated with reference to historical information, in order to measure the inherent loss for each category of loan. Estimated future cash flows are determined using PD and LGD parameters by technical form and the resulting flows are discounted on the basis of average recovery times, determined with reference to historical-statistical information.
Loans for which no objective evidence of loss has been individually identified, i.e. performing loans, including those to residents in countries at risk, are tested for impairment on an overall basis. This test is performed by grouping loans into categories that reflect a similar degree of lending risk. The related loss percentages are then estimated with reference to historical information, in order to measure the inherent loss for each category of loan. Estimated future cash flows are determined using PD and LGD parameters by technical form and the resulting flows are discounted on the basis of average recovery times, determined with reference to historical-statistical information.
No write-downs are recorded in relation to loans represented by repurchase agreements, since they are not subject to lending risk, or to loans to Group companies, non-profit organizations and local and public administrations.
Provisions made for an impaired loan are only reversed if the credit quality has improved to the extent that timely recovery of the principal and interest, with respect to the original terms for the loan contract, is reasonably certain, or if the amount actually recovered exceeds the recoverable amount estimated previously. Write-backs include the positive effect of discounting adjustments made due to the progressive reduction in the estimated time required to recover the related loans.Adjustments, net of previous provisions and the partial or total recovery of amounts previously written down, are recorded in income statement line item 130 a) “net impairment adjustments to loans and advances”.
Derecognition
Loans are derecognized as assets when they are deemed to be unrecoverable or are transferred together with substantially all the related risks and benefits.

399
7. Hedging derivatives
Classification
This line item reports the derivative contracts designated as effective hedging instruments which have a positive fair value at the reporting date.
If the fair value of a derivative contract subsequently becomes negative it is recorded as a liability in the corresponding line item.
Derivative contracts are intended to neutralize possible losses on certain elements or groups of elements due to a given risk (e.g. a rise in interest rates), via the generation of profits if the events associated with that risk should actually occur.
Derivatives not held for hedging purposes are classified as “financial assets held for trading”.
At the time that a hedging derivative is arranged, the Group classifies it as one of the following types of hedge:• fairvaluehedgeofagivenassetor liability: theobjective is tohedge theexposure to
changes in fair value of an item caused by given risks;• cashflowhedgeattributabletoaparticularassetorliability:theobjectiveistohedgethe
exposure to changes in the future cash flows associated with an item caused by given risks; • hedgeoftheeffectsofaninvestmentdenominatedinforeigncurrency:theobjectiveistohedge
the risks associated with investing in a foreign operation denominated in foreign currency.
Hedges can refer to individual financial instruments and/or groups of financial assets/liabilities.
The derivative instrument is classified as a hedge if it has been formally designated as such, there is a documented relationship between the hedged instrument and the hedging instrument, and it is effective - prospectively and retrospectively - both at the start of the hedge and throughout its life.
A hedge is considered effective if the hedging instrument is able to generate a cash flow or a change in fair value that is consistent with that of the hedged instrument. More precisely, the hedge is effective when changes in the fair value (or cash flows) of the hedging instrument neutralize the changes in the hedged instrument, deriving from the risk being hedged, within an interval of 80%-125%.
The effectiveness of the hedge is assessed at the start of the hedge and throughout its life and, in particular, on each reporting date, using:• prospectiveteststhatjustifytheadoptionofhedgeaccountingbyshowingtheexpected
effectiveness of the hedge in future periods;• retrospectiveteststhatshowtheeffectivenessofthehedgeduringthereferenceperiod.
If the tests do not confirm the effectiveness of the hedge, the hedge accounting described above is terminated and the related derivative contract is reclassified among the “financial assets held for trading”.
In addition, transactions are no longer classified as hedges if:• thehedgecreatedbythederivativeceases;• thederivativeexpires,issold,terminatedorexercised;• thehedgeditemissold,expiresorisredeemed;• thehedgenolongermeetsthecriteriatoqualifyforhedgeaccounting.

400
Recognition
The initial recognition of hedging derivatives takes place when their fair value is determined.
Measurement and recognition of components affecting the income statement
Subsequent to initial recognition, hedging derivatives are stated at fair value on the basis described below: • inthecaseoffairvaluehedges,changesinthevalueofthehedgedinstrumentandthe
hedging instrument are reflected in the income statement, in order to offset effectively changes in the fair value of the hedged item against the opposite changes in the fair value of the hedging instrument. Any difference, representing the ineffective portion of the hedge, therefore represents the net economic effect of the hedge;
• inthecaseofcashflowhedges,changesinthefairvalueofthederivativearerecordedinequity,to the extent that the hedge is effective, and are only released to the income statement when the related cash flows are actually generated by the hedged item. If the hedge is not effective, changes in the fair value of the hedging contract are recorded in the income statement;
• hedgesofinvestmentsdenominatedinforeigncurrencyarerecordedinthesamewayascash flow hedges.
Hedging instruments only consist of derivative contracts, excluding therefore any internal deals or other types of financial instrument.
Derecognition
Hedging derivatives are derecognized on disposal, if this substantially involves the transfer of all the risks and benefits associated with them. If the hedge becomes ineffective, the hedge accounting described above ceases and the derivative contract is reclassified to “financial assets held for trading”.
8. Equity investments
Classification
This line item comprises investments in associated companies and joint ventures.
Recognition
Equity investments are valued using the equity method.
Measurement criteria
Changes in the Group’s interest in a company’s equity between one accounting period and another are reported as “profit/loss from equity investments” with a matching entry to “equity investments” in the balance sheet.

401
Derecognition
Equity investments are derecognized on expiry of the contractual rights over the related financial flows, or when the investment is sold with the transfer of essentially all the related risks and benefits of ownership.Recognition of components affecting the income statement
Consistent with IAS 18, dividends are recorded when the stockholders’ right to receive them is established, which is subsequent to the related resolution adopted by the stockholders of the declaring company.
9. Property, plant and equipment
Classification
This line item comprises the fixed assets held for use in the generation of income, for rent or for administrative purposes, such as land, business property, investment property, installations, furniture, furnishings and all types of equipment.
Business property is that held for the provision of services or for administrative purposes, while investment property is that owned to earn rental income and/or with a view to capital appreciation.
Property, plant and equipment also include leasehold improvements, if they can be separated from the related assets. If these items are expected to generate future benefits, but are not functionally and operationally independent, they are classified as “other assets” and depreciated over the expected useful life of the improvements or the residual lease period, whichever is shorter.
Amounts paid in advance to acquire and restructure assets not yet used for productive purposes are capitalized, but not depreciated.
Recognition
Property, plant and equipment are initially recorded at cost, including all directly attributable costs of bringing them to working condition. Expenditure that improves an asset or increases the future economic benefits expected from the asset is allocated to the asset concerned and depreciated over its remaining useful life.
Measurement and recognition of components affecting the income statement
Subsequent to initial recognition, property, plant and equipment are stated at cost, net of accumulated depreciation and any impairment write-downs, consistent with the “cost model” described in para. 30 of IAS 16.
Property, plant and equipment are systematically depreciated over their useful lives on a straight-line basis, except for: • land,whetheracquiredseparatelyorincludedinthevalueofbuildings,whichisnotdepreciated
since it has an unlimited useful life. With regard to free-standing properties, the value of the land is separated from the value of the related buildings by internal and/or independent expert

402
appraisals, unless this information is directly available from the purchase contract;• worksofart,whicharenotdepreciatedsincetheynormallyhaveanindefiniteusefullife
and their value is likely to increase over time;• investmentproperties,whicharestatedatfairvalueinaccordancewithIAS40.The investment properties covered by IAS 40 are stated at the market value determined by independent appraisals and changes in their fair value are recorded in “net gains (losses) arising on fair value adjustments to property, plant and equipment and intangible assets” in the income statement.The depreciation charge for assets acquired during the year is determined on a daily basis from the time they enter into service. The depreciation charge for assets sold and/or retired during the year is determined on a daily basis up to the date of disposal and/or retirement.
At each reporting date, if there is evidence that the value of an asset may be impaired, its carrying value is compared with its recoverable value, being either its fair value net of any selling costs or its value in use, represented by the present value of the future cash flows to be generated by the asset, whichever is greater. Any adjustments are recorded in the “net adjustments to the value of property, plant and equipment” caption of the income statement.
If the reasons for recognizing an impairment loss cease to apply, the consequent write-back cannot cause the value of the asset to exceed its net book value (after depreciation) had no impairment losses been recognized in prior years.
Derecognition
Property, plant and equipment are derecognized upon disposal or when they are retired from use on a permanent basis and no economic benefits are expected from their disposal.
10. Intangible assets
Classification
This line item reports non-monetary assets without physical form that have the following characteristics:• identifiability;• controlovertheassetsconcerned;• existenceoffutureeconomicbenefits.
If any one of these characteristics is missing, the related purchase or internally-generated cost is expensed in the year incurred.
Intangible assets include, in particular, applications software used for a number of years and other identifiable intangible assets over which the Group has legal or contractual rights.
This line item also includes goodwill, representing the positive difference between the purchase cost and the fair value of assets and liabilities acquired as a result of business combinations. In particular, an intangible asset is recorded as goodwill when the positive difference between the fair value of the net assets acquired and their purchase cost (including related charges) represents the ability of the investment to generate future earnings. If this difference is negative (badwill) or if the goodwill is not justified by the acquired company’s ability to generate future earnings, the difference is recorded directly in the income statement.

403
Recognition
Intangible assets are initially recorded at cost, including any directly-related charges.
Measurement criteria
Subsequent to initial recognition, intangible assets are stated at cost, net of accumulated amortization and any impairment losses, in accordance with the “cost model” described in para. 74 of IAS 38.
Intangible assets are amortized systematically each year on a straight-line basis over their estimated useful lives. The amortization charge for assets acquired during the year is determined on a daily basis from the time they enter into service. The amortization charge for those sold and/or retired during the year is determined on a daily basis up to the date of disposal and/or retirement.
Assets with an indefinite useful life, such as goodwill, are not amortized but their carrying value is tested periodically for impairment, as required by IAS 36. Any reductions in value, representing the difference between the carrying amount of the asset and its recoverable value, are charged as “net adjustments to intangible assets” or, if relating to goodwill, as “adjustments to goodwill” in the income statement.
Derecognition
Intangible assets are eliminated from the balance sheet if no future economic benefits are expected or on disposal.
11. Deferred tax assets and liabilities
Current and deferred income taxes are calculated in accordance with current fiscal legislation. They are recorded in the income statement, except for those relating to amounts credited or debited directly to equity.
Income taxes reported in the income statement represent a prudent estimate of the current tax charge and the related changes in deferred tax assets and liabilities. In particular, deferred tax assets and liabilities are determined with reference to temporary differences between the book value of assets and liabilities and their tax bases. Deferred tax assets are recognized if they are likely to be recoverable, determined with reference to the Group’s ongoing ability to generate taxable income.
Deferred tax assets and liabilities are recorded in the balance sheet as, respectively, “Tax assets” and “Tax liabilities”, on an open account basis without offset.
Changes in deferred tax assets and liabilities are recorded in the income statement, except for those relating to gains or losses on AFS financial assets and to changes in the fair value of derivative instruments that hedge future cash flows or investments denominated in foreign currencies, which are recorded directly in equity net of taxation.
In accordance with para. 52b of IAS 12, no provision for deferred taxation has been recorded in relation to the reserves and revaluation surpluses that are in suspense for tax purposes,

404
since their distribution is not envisaged; in this regard, the Group has not carried out, and has no short or medium-term plans to carry out, any activities which could give rise to the payment of deferred taxes.
In the case of current taxes, payments on account for individual taxes are offset against the related tax payable, with positive balances reported as “current tax assets” and negative balances as “current tax liabilities”.
12. Non-current assets held for sale
Classification
This line item comprises all the non-current assets and groups of assets held for sale pursuant to IFRS 5, as well as those assets and groups of assets whose book value will principally be recovered through sale rather than via continuous use.
Measurement criteria
These assets are measured at the lower of their carrying value or their fair value, net of selling costs, except for the following assets which continue to be valued in accordance with the related accounting policies:• deferredtaxassets;• assetsderivingfromemployeebenefits;• financialinstruments;• investmentproperty.
Recognition of components affecting the income statement
Income (interest income, dividends etc.) and expenses (interest expense, depreciation etc.) relating to “groups of assets” and related liabilities held for sale are classified, net of the related current and deferred taxation, as “net profit (loss) from discontinued operations” in the income statement. Income and expenses relating to “individual, non-current assets” held for sale continue to be recorded in the line items concerned.

405
LIABILITIES AND EQuITY
1. Deposits from banks, due to customers and debt securities in issue
Classification
Deposits from banks, due to customers and debt securities in issue include the various forms of interbank and customer funding, together with the funds gathered by issuing various types of bond and certificates of deposit, net of any amounts repurchased by the Group. This line item also includes securities which are due at the balance sheet date but have not yet been redeemed.
Recognition
These financial liabilities are initially recorded on receipt of the amounts collected or on the issue of the debt securities.
They are initially measured at the fair value of the liabilities, usually corresponding to the amount collected or the issue price, plus any additional costs/proceeds directly attributable to the individual funding transaction or issue and not reimbursed by the creditor. Internal administrative costs are excluded. Any derivatives embedded in the above financial liabilities are separated and valued in accordance with IAS 32 and 39.
Measurement criteria
Following initial recognition, the above financial liabilities are stated at amortized cost using the effective interest method, except that short-term liabilities continue to be stated at nominal value since the effect of discounting is negligible.
Derecognition
Financial liabilities are derecognized when they expire or are settled. Derecognition also applies when issued securities are repurchased, even if this acquisition is only temporary. Any differences between the book value of the derecognized liability and the amount paid are recorded as “gains (losses) on disposal or repurchase of financial liabilities” in the income statement. If, subsequent to repurchase, the Group places its own securities back in the market, this transaction is treated as a new issue and the liabilities are recorded at the new placement price.
2. Financial liabilities held for trading
Classification
This line item reports the negative fair value of derivatives not designated as effective hedging instruments, liabilities arising from technical mismatches generated by trading in securities.
Derivative contracts include embedded derivatives which are attached to a primary financial

406
instrument, known as the “host contract”, and forward transactions in currencies, securities, goods and precious metals. An embedded derivative is recognized separately from the host contract when all of the following conditions are satisfied:
• itseconomiccharacteristicsandrisksarenotcloselyrelatedtothoseofthe“host”contract;• theseparatedembeddedinstrumentmeetsthedefinitionofaderivative;• thehybridinstrumentisnotmeasuredatfairvaluethroughtheincomestatement;
If the fair value of a derivative contract subsequently becomes positive it is recorded as a financial asset held for trading.
Financial instruments are designated as financial liabilities held for trading upon initial recognition. They cannot be reclassified subsequently.
Measurement criteria
All trading liabilities are stated at fair value, determined on the basis described in the paragraph on “financial assets held for trading”.
3. Financial liabilities at fair value
Classification
This line item comprises those financial liabilities or groups of financial liabilities stated at fair value through the income statement, following exercise of the fair value option envisaged by IAS 39.
Financial instruments are designated as financial liabilities held for trading upon initial recognition. They cannot be reclassified subsequently.
At the reporting date, this line item comprises own bonds hedged by derivative contracts, as well as bonds with an embedded derivative contract that has not been separated out.
Recognition, measurement, derecognition and recording of components affecting the income statement
The recognition, measurement, derecognition and recording of the effects on the income statement of the above financial liabilities are described in the earlier paragraph on “financial assets at fair value”.
4. Hedging derivatives
This line item reports the financial derivatives designated as effective hedging instruments which have a negative fair value at the balance sheet date. The recognition, measurement, derecognition and recording of the related effects on the income statement are described in the paragraph on the corresponding asset line item.If the fair value of a derivative contract subsequently becomes positive it is recorded as an asset in the corresponding line item.

407
5. Liabilities associated with non-current assets held for sale
Reference is made to the paragraph on “non-current assets and groups of assets held for sale”.
6. Provision for severance indemnities
According to IFRIC, the provision for severance indemnities is a “post-employment benefit” qualifying as a “defined-benefit plan”, the value of which according to IAS 19 must be determined on an actuarial basis. As a consequence, the year-end actuarial valuation of this line item is carried out with reference to earned benefits using the projected unit credit method. This method involves the projection of future payments with reference to historical and statistical analyses and probabilities, adopting suitable demographic techniques. This makes it possible to calculate the severance indemnities accruing at a specific date on an actuarial basis, distributing the cost over the entire remaining service of the current workforce, and no longer presenting them as a cost payable as if the business were to cease trading on the balance sheet date.
The provision for severance indemnities has been valued by an independent actuary using the method outlined above.
7. Provisions for risks and charges
In accordance with IAS 37, the provisions for risks and charges reflect known obligations (legal or constructive) deriving from past events, the settlement of which is likely to involve the use of economic resources whose timing and extent are uncertain, on condition that a reliable estimate can be made of the amount needed to settle them. If settlement of the liability is likely to be deferred and the effect of discounting would be significant, the provisions are discounted using current market rates. Increases in provisions for risks and charges are recorded in the appropriate line items of the income statements, depending on the “nature” of the expense. In particular, provisions for future personnel expenses in connection with bonuses and other incentive schemes are classified in “Payroll” costs, provisions for tax risks and charges are classified in “Income taxes” and provisions for potential losses not directly attributable to specific line items in the income statement are reported in “Net provisions for risks and charges”.
8. Equity instruments
This line item reports the carrying value of bonds convertible into treasury shares, determined in accordance with IAS 32, since these represent equity instruments other than capital stock and reserves.

408
OTHER INFORMATION
1. Treasury shares
Treasury shares acquired by the Group are deducted from equity. No profit or loss deriving from the purchase, sale, issue or cancellation of treasury shares is booked to the income statement. Differences between the purchase and selling prices for these transactions are booked to equity.
Any costs incurred for the purchase of treasury shares are deducted from equity, on condition that they are marginal costs directly attributable to these transactions that would not otherwise have been incurred.
2. Transactions in foreign currency
Foreign currency transactions are initially recognized in euro, by translating the foreign currency amount using the exchange rate prevailing on the date of the transaction.
Foreign currency assets and liabilities are subsequently translated to euro using period-end exchange rates. With regard to repurchase agreements and derivative contracts denominated in foreign currencies, reference is made to the paragraphs on financial assets and liabilities held for trading.
Exchange differences deriving from the settlement of monetary items or from the translation of monetary items using rates other than the initial translation rate, or the closing rate at the end of prior periods, are recorded as “net trading income” in the income statement for the period, to the extent that they relate to foreign currency assets and liabilities other than those carried at fair value or those whose fair value and cash flows are hedged, or hedging derivatives.
3. Repurchase agreements
Repurchase agreements are treated as loans against securities and the amounts received and paid are recorded as payables and loans. In particular, spot sales with forward repurchases are recorded as a payable for the spot amount collected, while spot purchases with forward resales are recorded as a receivable for the spot amount paid.
The cost of borrowing and income from lending, comprising interest coupons on securities and the differential between the spot and forward prices for such securities, are recorded as interest in the income statement. These transactions do not determine movements in the securities portfolio.

409
4. Criteria for determining fair value
The following criteria are used to determine the fair value of securities:
• Securitieslistedonactivemarkets:The fair value of financial instruments listed on active markets is represented by the following prices:
– equity instruments and debt securities listed on the Italian Stock Exchange: the official price on the last trading day of the reference period;
– equity instruments and debt securities listed on foreign stock exchanges: the official price (or other equivalent price) on the last day of the reference period;
– units in mutual funds and sicavs: the official price (or other equivalent price) of the units on the last day of the reference period.
• Securitiesnotlistedonactivemarkets: The fair value of financial instruments not listed on active markets is represented by the
following prices:
– shares in cooperative banks: the latest price set by the Board of Directors/Stockholders’ Meeting of the issuing bank;
– units in mutual funds and sicavs: the latest value of the units communicated by the management company;
– capital accumulation insurance policies: the redemption value determined with reference to the issue regulations;
– other debt securities and equities, in the following order:• thereferencepriceforrecenttransactions;• thepricesindicatedbyreliableinformationsources,whereavailable,suchasICMA,
BLOOMBERG, REuTERS;• thepriceobtainedbyapplyingvaluationtechniquesthataregenerallyacceptedby
market participants, such as:• fordebtsecurities,theircashflowsdiscountedusingthereferenceratesapplying
at year end for equivalent residual maturities, taking account of any “counterparty risk” and/or “liquidity risk”;
• forequitiesofsignificantvalue,theamountestablishedbyindependentappraisals,where available, or otherwise the value of the related interest held in the equity reported in the company’s latest approved financial statements;
• the price supplied by the issuer, as suitably adjusted to take account of any“counterparty risk” and/or “liquidity risk”;
• theirpurchaseprice,asadjustedforanyimpairment,iffairvaluecannotbemeasuredreliably in the manner indicated above.
The following criteria are used to determine the fair value of derivative contracts:
• derivativecontractstradedonregulatedmarkets:theirfairvalueisdeemedtobetheirmarket price on the last trading day of the period;
• over-the-counterderivativecontracts:theirfairvalueisdeemedtobetheirmarketvalueatthe reference date, determined in the following manner depending on the type of contract: – contracts on interest rates: market value is taken to be the so-called “replacement
cost”, determined by discounting back to the expected settlement dates, the differences between flows at contract rates and flows at market rates, calculated on an objective basis, current at period-end for equivalent residual maturities;
– option contracts on securities and other assets: market value, represented by the

410
theoretical premium at the reference date, is determined by using the Black & Scholes formula, or other equivalent methods;
– forward currency transactions: market value is determined using the forward exchange rate current at the above date, for maturities corresponding to those of the transactions concerned;
– forward transactions in securities, commodities or precious metals: market value is represented by the “forward” price current at the above date, for maturities corresponding to those of the underlying asset.
The fair value of over-the-counter contracts is determined by adjusting their market value, if positive, by the credit risk associated with the counterparty.

411
ASSETS
SECTION 1
Cash and balances with central banks – Line item 10
1.1 Cash and balances with central banks: analysis
Banking Insurance Other 31/12/2008 31/12/2007 group companies companies
a) Cash 174,934 – – 174,934 186,946 b) unrestricted deposits with central banks – – – – –
Total 174,934 – – 174,934 186,946
PART BINFORMATION ON THE CONSOLIDATED BALANCE SHEET

412
SECTION 2
Financial assets held for trading – Line item 20
2.1 Financial assets held for trading: breakdown by type
“Assets sold but not derecognized” relate to debt securities temporarily sold under funding “repurchase agreements” with customers and banks.
The decrease in this overall balance is mostly due to the Group’s wish to reduce its exposure to financial instruments held for short-term trading in view of the highly volatile state of financial markets and associated negative performance.
Items/Amounts Banking group Insurance companies Other companies 31/12/2008 31/12/2007 Listed unlisted Listed unlisted Listed unlisted Listed unlisted Listed unlisted
A. Cash assets
1. Debt securities 22,495 25,553 – – – – 22,495 25,553 98,694 58,409 1.1 Structured securities – 8,651 – – – – – 8,651 4,726 16,989 1.2 Other debt securities 22,495 16,902 – – – – 22,495 16,902 93,968 41,420 2. Equities 4,508 – – – – – 4,508 – 17,631 – 3. Mutual funds 1,378 – – – – – 1,378 – 9,812 46,317 4. Loans – – – – – – – – – – 4.1 “Repurchase agreements” – – – – – – – – – – 4.2 Other – – – – – – – – – – 5. Impaired assets – – – – – – – – – – 6. Assets sold but not derecognized 10,204 5,491 – – – – 10,204 5,491 76,924 3,628
Total A 38,585 31,044 – – – – 38,585 31,044 203,061 108,354
B. Derivatives
1. Financial derivatives – 724,412 – – – – – 724,412 – 574,358 1.1 for trading – 564,985 – – – – – 564,985 – 531,060 1.2 connected with the fair value option – 159,427 – – – – – 159,427 – 43,298 1.3 other – – – – – – – – – – 2. Credit derivatives – – – – – – – – – – 2.1 for trading – – – – – – – – – – 2.2 connected with the fair value option – – – – – – – – – – 2.3 other – – – – – – – – – –
Total B – 724,412 – – – – – 724,412 – 574,358
Total (A+B) 38,585 755,456 – – – – 38,585 755,456 203,061 682,712

413
This line item also reflects Euro 63,136 in reclassifications during the year of certain financial instruments to “Financial assets available for sale” as a result of the amendments to IAS 39 “Financial instruments: recognition and measurement” contained in the “Reclassification of Financial Assets” published by the IASB on 13 October 2008 and endorsed by the European Commission on 15 October 2008 with Regulation EC 1004/2008, which has been fully discussed in the relevant section of this report.
2.2 Financial assets held for trading: analysis by debtor/issuer
Items/Amounts Banking Insurance Other 31/12/2008 31/12/2007 group companies companies
A. CASH ASSETS 1. Debt securities 48,048 – – 48,048 157,103 a) Governments and central banks 18 – – 18 10,176 b) Other public entities – – – – – c) Banks 28,111 – – 28,111 75,486 d) Other issuers 19,919 – – 19,919 71,441
2. Equities 4,508 – – 4,508 17,631 a) Banks 684 – – 684 13,100 b) Other issuers: 3,824 – – 3,824 4,531 – insurance companies 393 – – 393 797 – financial companies – – – – 187 – non-financial companies 3,431 – – 3,431 3,547 – other – – – – –
3. Mutual funds 1,378 – – 1,378 56,129
4. Loans – – – – – a) Governments and central banks – – – – – b) Other public entities – – – – – c) Banks – – – – – d) Other issuers – – – – –
5. Impaired assets – – – – – a) Governments and central banks – – – – – b) Other public entities – – – – – c) Banks – – – – – d) Other issuers – – – – –
6. Assets sold but not derecognized 15,695 – – 15,695 80,552 a) Governments and central banks – – – – – b) Other public entities – – – – – c) Banks 5,491 – – 5,491 80,552 d) Other issuers 10,204 – – 10,204 – Total A 69,629 – – 69,629 311,415 B. DERIVATIVES a) Banks 583,875 – – 583,875 410,712 b) Customers 140,537 – – 140,537 163,646 Total B 724,412 – – 724,412 574,358 Total (A+B) 794,041 – – 794,041 885,773

414
During the year the Parent Bank used bilateral offsetting arrangements relating to operations in over-the-counter derivatives with principal market counterparties, giving the option to offset creditor positions against debtor positions in the event of counterparty default.
For the purposes of mitigating credit risk further, specific Credit Support Annex contracts have been entered with the Group’s most frequent counterparties with the aim of regulating the provision of cash collateral financial guarantees.
2.3 Financial assets held for trading: derivatives
2.3.1 attributable to the banking group
Type of derivatives/underlying assets Interest Currency Equities Loans Other 31/12/2008 31/12/2007 rates and gold
A) Listed derivatives 1. Financial derivatives – – – – – – – a) With exchange of capital – – – – – – – – Options purchased – – – – – – – – Other derivatives – – – – – – – b) Without exchange of capital – – – – – – – – Options purchased – – – – – – – – Other derivatives – – – – – – – 2. Credit derivatives – – – – – – – a) With exchange of capital – – – – – – – b) Without exchange of capital – – – – – – –
Total A – – – – – – –
B. Unlisted derivatives 1. Financial derivatives 667,206 34,274 15,222 – 7,710 724,412 574,358 a) With exchange of capital – 34,274 – – – 34,274 22,961 – Options purchased – 15,357 – – – 15,357 12,723 – Other derivatives – 18,917 – – – 18,917 10,238 b) Without exchange of capital 667,206 – 15,222 – 7,710 690,138 551,397 – Options purchased 135,516 – 15,222 – – 150,738 225,764 – Other derivatives 531,690 – – – 7,710 539,400 325,633 2. Credit derivatives – – – – – – – a) With exchange of capital – – – – – – – b) Without exchange of capital – – – – – – –
Total B 667,206 34,274 15,222 – 7,710 724,412 574,358
Total (A+B) 667,206 34,274 15,222 – 7,710 724,412 574,358

415
2.4 Financial assets held for trading other than those sold and not recognized and impaired assets: changes during the year
2.4.1 attributable to the banking group
Debt Equities Mutual Loans Total securities funds
A. Opening balance 157,103 17,631 56,129 – 230,863
B. Increases 2,351,963 84,931 7,025 – 2,443,919 B1. Purchases 2,348,614 84,419 7,000 – 2,440,033 B2. Positive changes in fair value 259 22 – – 281 B3. Other changes 3,090 490 25 – 3,605
C. Decreases 2,461,018 98,054 61,776 – 2,620,848 C1. Disposals 2,304,069 81,507 5,267 – 2,390,843 C2. Redemptions 130,959 – 4,435 – 135,394 C3. Negative changes in fair value 10,414 1,657 866 – 12,937 C4. Other changes 15,576 14,890 51,208 – 81,674
D. Closing balance 48,048 4,508 1,378 – 53,934
“Other changes” in lines B3. and C4. report trading profits and losses respectively, recognized in the income statement in line item 80 “Net trading income”.
“Other decreases” in debt securities also include Euro 2,050 in differentials between opening and closing coupons and between opening and closing issue discounts.
Lastly, as detailed in the specific section of the report on operations, line C4. also includes the transfer during the year of debt securities (Euro 9,998), of equities (Euro 7,206) and of mutual funds (Euro 45,932) to “Financial assets available for sale” under the amendments to IAS 39 “Financial instruments: recognition and measurement” contained in the document “Reclassification of Financial Assets”.

416
SECTION 3
Financial assets at fair value – Line item 30
3.1 Financial assets at fair value: breakdown by type
This line item comprises the junior securities deriving from the first three securitizations carried out by the Group in prior years, which are measured at fair value using a financial-mathematical model, developed together with an independent specialist firm of consultants, that measures the performance of the assets underlying these securities. These valuations were based on the results of the individual underlying transactions at the reference date, using specific assumptions about the principal variables that affect performance (rate of early loan repayments, rate of recognition of non-performing loans, percentage of expected losses, etc.).
The application of the fair value option to these securities reduces the mismatch with the related back-to-back swaps arranged as part of the securitizations which are highly correlated with the junior securities.
Items/Amounts Banking Group Insurance companies Other companies 31/12/2008 31/12/2007 Listed unlisted Listed unlisted Listed unlisted Listed unlisted Listed unlisted
1. Debt securities – 17,077 – – – – – 17,077 – 25,792 1.1 Structured securities – – – – – – – – – – 1.2 Other debt securities – 17,077 – – – – – 17,077 – 25,792 2. Equities – – – – – – – – – – 3. Mutual funds – – – – – – – – – – 4. Loans – – – – – – – – – – 4.1 Structured securities – – – – – – – – – – 4.2 Other – – – – – – – – – – 5. Impaired assets – – – – – – – – – – 6. Assets sold but not derecognized – – – – – – – – – –
Total – 17,077 – – – – – 17,077 – 25,792
Cost – 51,364 – – – – – 51,364 – 53,579

417
3.2 Financial assets at fair value: analysis by debtor/issuer
Items/Amounts Banking Insurance Other 31/12/2008 31/12/2007 Group companies companies
1. Debt securities 17,077 – – 17,077 25,792 a) Governments and central banks – – – – – b) Other public entities – – – – – c) Banks – – – – – d) Other issuers 17,077 – – 17,077 25,792
2. Equities – – – – – a) Banks – – – – – b) Other issuers: – – – – – – insurance companies – – – – – – financial companies – – – – – – non-financial companies – – – – – – other – – – – –
3. Mutual funds – – – – –
4. Loans – – – – – a) Governments and central banks – – – – – b) Other public entities – – – – – c) Banks – – – – – d) Other issuers – – – – –
5. Impaired assets – – – – – a) Governments and central banks – – – – – b) Other public entities – – – – – c) Banks – – – – – d) Other issuers – – – – –
6. Assets sold but not derecognized – – – – – a) Governments and central banks – – – – – b) Other public entities – – – – – c) Banks – – – – – d) Other issuers – – – – –
Total 17,077 – – 17,077 25,792

418
3.3 Assets at fair value, other than those sold but not derecognized and impaired assets: changes during the year
3.3.1 attributable to the banking group
Debt Equities Mutual Loans Total securities funds
A. Opening balance 25,792 – – – 25,792
B. Increases 1,027 – – – 1,027 B1. Purchases – – – – – B2. Positive changes in fair value – – – – – B3. Other changes 1,027 – – – 1,027
C. Decreases 9,742 – – – 9,742 C1. Disposals – – – – – C2. Redemptions 2,215 – – – 2,215 C3. Negative changes in fair value 7,527 – – – 7,527 C4. Other changes – – – – –
D. Closing balance 17,077 – – – 17,077
The “Other changes” reported in line B3. include the profits (Euro 1,014) deriving from the early redemption of certain tranches of the above junior securities, which are recorded in line item 110 “Net change in financial assets and liabilities at fair value” of the income statement. They also include the differential (Euro 13) between opening and closing accruals.
The “Negative changes in fair value” in line C3. relating to the valuation of these junior securities have their matching entry in line item 110 “Net change in financial assets and liabilities at fair value” of the income statement. They have been partially offset by the collection during the year of related interest income and additional returns, totaling Euro 3,906, recorded respectively in line items 10 “Interest income and similar revenues” and 220 “Other operating charges/income” of the income statement respectively.

419
SECTION 4
Financial assets available for sale – Line item 40
4.1 Financial assets available for sale: breakdown by type
“unlisted equities carried at cost” refer to certain individually immaterial equity interests, whose fair value cannot be reliably or verifiably determined and so are reported at cost, as adjusted for any impairment. These equities also include the interest held by the subsidiary Cariprato in the Bank of Italy (Euro 6,865).“Loans” relate to a loan granted under the sale of the entire interest in Linea Spa to Compass Spa (Mediobanca Group) which, in accordance with IAS 39, has been recognized as “Financial assets available for sale” because its repayment does not depend on the counterparty’s creditworthiness but instead on the performance of one of its loan books.“Assets sold but not derecognized” relate to debt securities temporarily sold under funding “repurchase agreements” with customers and banks.The interest in Cattolica Assicurazione Scpa was reclassified from “Financial assets available for sale” to “Equity investments” during the year. In fact, on 31 October 2008, this company acquired 348,000 shares in Banca Popolare di Vicenza, corresponding to 0.50% of its capital stock, for a figure of Euro 20.9 million, making it one of the Group’s largest stockholders. This has sealed the existing strategic and business alliance between the two Groups, further strengthening their major partnership in the sector of insurance, banking and financial services. The cross-representation on the Boards of Directors of the two companies further confirms the great importance and merit of this partnership. These circumstances have underlined the existence of a “significant influence” between the Banca Popolare di Vicenza Group and Cattolica Assicurazioni, as defined by IAS 28 “Investments in associates”, also confirmed in the specific opinion prepared by an independent expert, with the consequent need to reclassify the 6,551,915 shares (a 12.72% interest) held by the BPVI Group in Cattolica Assicurazioni from “Financial assets available for sale” to “Equity investments in associated companies”. The investment has been reclassified at its carrying value, thereby completely cancelling the valuation reserve previously recognized. This line item, as detailed below, also reflects reclassification during the year of certain financial instruments to “Financial assets available for sale” as a result of the amendments
Items/Amounts Banking Group Insurance companies Other companies 31/12/2008 31/12/2007 Listed Non Listed Non Listed Non Listed Non Listed Non Listed Listed Listed Listed Listed
1. Debt securities 84,357 46,054 – – – – 84,357 46,054 738,273 90,845 1.1 Structured securities – 252 – – – – – 252 – 252 1.2 Other debt securities 84,357 45,802 – – – – 84,357 45,802 738,273 90,593 2. Equities 26,254 132,337 – – – – 26,254 132,337 233,268 113,126 2.1 Carried at fair value 26,254 122,332 – – – – 26,254 122,332 233,268 101,236 2.2 Carried at Cost – 10,005 – – – – – 10,005 – 11,890 3. Mutual funds 5,531 102,493 – – – – 5,531 102,493 4,235 35,842 4. Loans – 9,700 – – – – – 9,700 – – 5. Impaired assets – – – – – – – – – – 6. Assets sold but not derecognized 29,187 – – – – – 29,187 – – –
Total 145,329 290,584 – – – – 145,329 290,584 975,776 239,813

420
to IAS 39 “Financial instruments: recognition and measurement” contained in the “Reclassification of Financial Assets” published by the IASB on 13 October 2008 and endorsed by the European Commission on 15 October 2008 with Regulation EC 1004/2008, which has been fully discussed in the relevant section of this report.
4.2 Financial assets available for sale: analysis by debtor/issuer
Items/Amounts Banking Insurance Other 31/12/2008 31/12/2007 Group companies companies
1. Debt securities 130,411 – – 130,411 829,118 a) Governments and central banks 63,920 – – 63,920 76,882 b) Other public entities 211 – – 211 350 c) Banks 21,016 – – 21,016 238,647 d) Other issuers 45,264 – – 45,264 513,239
2. Equities 158,591 – – 158,591 346,394 a) Banks 68,150 – – 68,150 46,532 b) Other issuers: 90,441 – – 90,441 299,862 – insurance companies – – – – 226,762 – financial companies 54,394 – – 54,394 35,099 – non-financial companies 34,076 – – 34,076 34,586 – other 1,971 – – 1,971 3,415
3. Mutual funds 108,024 – – 108,024 40,077
4. Loans 9,700 – – 9,700 – a) Governments and central banks – – – – – b) Other public entities – – – – – c) Banks – – – – – d) Other issuers 9,700 – – 9,700 –
5. Impaired assets – – – – – a) Governments and central banks – – – – – b) Other public entities – – – – – c) Banks – – – – – d) Other issuers – – – – –
6. Assets sold but not derecognized 29,187 – – 29,187 – a) Governments and central banks 8,812 – – 8,812 – b) Other public entities – – – – – c) Banks 20,375 – – 20,375 – d) Other issuers – – – – –
Total 435,913 – – 435,913 1,215,589

421
4.5 Financial assets available for sale (other than those sold but not derecognized and impaired assets): changes during the year
4.5.1 attributable to the banking group
Debt Equities Mutual Loans Total securities funds
A. Opening balance 829,118 346,394 40,077 – 1,215,589
B. Increases 36,234 63,348 91,125 25,000 215,707 B1. Purchases 20,719 24,329 44,363 25,000 114,411 B2. Positive changes in fair value 5,077 29,321 825 – 35,223 B3. Writebacks – – – – – – booked to income statement – x – – – – booked to equity – – – – – B4. Transfers from other assets portfolios 9,998 7,206 45,933 – 63,137 B5. Other changes 440 2,492 4 – 2,936
C. Decreases 734,941 251,151 23,178 15,300 1,024,570 C1. Disposals 144,844 14,561 6,466 – 165,871 C2. Redemptions 157,236 549 – – 157,785 C3. Negative changes in fair value 23,930 4,258 7,462 – 35,650 C4. Impairment writedowns 1,480 4,888 9,250 15,300 30,918 – booked to income statement 1,480 4,888 9,250 15,300 30,918 – booked to equity – – – – – C5. Transfers to other asset portfolios 402,548 226,761 – – 629,309 C6. Other changes 4,903 134 – – 5,037
D. Closing balance 130,411 158,591 108,024 9,700 406,726
Line B4. “Transfers from other asset portfolios” reports reclassifications of financial instruments from “Financial assets held for trading” in application of the amendments to IAS 39 discussed earlier.
Similarly, line C5. “Transfers to other asset portfolios” reports reclassifications of financial instruments to “Loans and advances to banks” (Euro 149,267) and to “Loans and advances to customers” (Euro 253,282) in application of the amendments to IAS 39; The “Equities” column of line C5. reports the reclassification of Cattolica Assicurazioni from “Financial assets available for sale” to “Equity investments”, as discussed earlier.
“Impairment writedowns” reported in line C4. refer to impairment losses recognized under IAS 39 against some of the financial instruments held by the Group.
“Other changes” in lines B5. and C6. report the profits and losses respectively arising on reimbursement/disposal of financial assets held for sale, recognized in the income statement in line item 100 “Gains (losses) on disposal/repurchase” along with the reversal to income of the related “Valuation reserves from equity. “Other decreases” in debt securities also include Euro 567 in differentials between opening and closing coupons and between opening and closing issue discounts.

422
SECTION 5
Financial assets held to maturity – Line item 50
5.1 Financial assets held to maturity: breakdown by type
“Assets sold but not derecognized” relate to debt securities temporarily sold under funding “re-purchase agreements” with banks.
5.2 Financial assets held to maturity: analysis by debtor/issuer Type of transaction/Amounts Banking Insurance Other 31/12/2008 31/12/2007 group companies companies
1. Debt securities 20,597 - - 20,597 46,129 a) Governments and central banks - - - - - b) Other public entities - - - - - c) Banks 5,122 - - 5,122 8,931 d) Other issuers 15,475 - - 15,475 37,198
2. Loans - - - - - a) Governments and central banks - - - - - b) Other public entities - - - - - c) Banks - - - - - d) Other issuers - - - - -
3. Impaired assets - - - - - a) Governments and central banks - - - - - b) Other public entities - - - - - c) Banks - - - - - d) Other issuers - - - - -
4. Assets sold but not derecognized 5,140 - - 5,140 - a) Governments and central banks - - - - - b) Other public entities - - - - - c) Banks - - - - - d) Other issuers 5,140 - - 5,140 -
Total 25,737 - - 25,737 46,129
Type of transaction/ Banking Group Insurance companies Other companies 31/12/2008 31/12/2007Members of the group Book Fair Book Fair Book Fair Book Fair Book Fair value value value value value value value value value value
1. Debt securities 20,597 18,612 – – – – 20,597 18,612 46,129 44,577 1.1 Structured securities – – – – – – – – – – 1.2 Other debt securities 20,597 18,612 – – – – 20,597 18,612 46,129 44,577 2. Loans – – – – – – – – – – 3. Impaired assets – – – – – – – – – – 4. Assets sold but not derecognized 5,140 4,786 – – – – 5,140 4,786 – –
Total 25,737 23,398 – – – – 25,737 23,398 46,129 44,577

423
5.4 Financial assets held to maturity (other than those sold but not derecognized and impaired as-sets): changes during the year
Debt securities Loans Total
A. Opening balance 46,129 – 46,129
B. Increases 700 – 700 B1. Purchases – – – B2. Writebacks – – – B3. Transfers from other assets portfolios – – – B4. Other changes 700 – 700
C. Decreases 26,232 – 26,232 C1. Disposals – – – C2. Redemptions 21,092 – 21,092 C3. Adjustments – – – C4. Transfers to other asset portfolios – – – C5. Other changes 5,140 – 5,140
D. Closing balance 20,597 – 20,597
“Other increases” in debt securities refer to the differential between opening and closing coupons and between opening and closing issue discounts.
“Other decreases” refer to debt securities temporarily sold under funding “repurchase agreements” with banks and classified under “Assets sold but not derecognized”.

424
SECTION 6
Loans and advances to banks – Line item 60
6.1 Loans and advances to banks: breakdown by type
6.1.1 attributable to the banking group
Type of transaction/Amounts 31/12/2008 31/12/2007
A. Deposits with central banks 177,555 87,264 1. Time deposits 1,705 – 2. Compulsory reserve 175,850 87,264 3. Repurchase agreements – – 4. Other – – B. Due from other banks 2,128,063 1,901,566 1. Current accounts and sight deposits 719,651 623,892 2. Time deposits 241,212 198,626 3. Other loans 376,240 1,054,845 3.1 Repurchase agreements 304,098 1,039,140 3.2 Finance leases – – 3.3 Other 72,142 15,705 4. Debt securities 514,046 24,203 4.1 Debt securities – – 4.2 Other debt securities 514,046 24,203 5. Impaired assets 911 – 6. Assets sold but not derecognized 276,003 –
Total (book value) 2,305,618 1,988,830
Total (fair value) 2,279,673 1,989,867 “Assets sold but not derecognized” relate to debt securities temporarily sold under funding “repurchase agreements” with customers and banks.
The increase in “Debt securities” reported in lines 4. and 6. includes Euro 149,267 for transferring certain financial assets from “Financial assets available for sale” in application of the amendments to IAS 39 and Euro 618,368 for the purchase of bonds issued by Mediobanca, subscribed as part of the sale, agreed in the year, of the entire interest in Linea S.p.A. to Compass S.p.A. (a Mediobanca Group company) in substitution of loans granted to the former investee company.
In view of the predominantly short-term nature of loans to banks, except for debt securities, their fair value is conventionally taken to be their carrying amount.
The fair value of debt securities classified in this line item is calculated in the same way as for similar financial instruments classified in other balance sheet line items, as described in Part A of these explanatory notes.
Impaired assets refer to a single loan to a Russian bank, classified on the watchlist after having difficulty in recovering it. A writedown of Euro 297 has been recorded against this exposure.

425
SECTION 7
Loans and advances to customers – Line item 70
7.1 Loans and advances to customers: breakdown by type
7.1.1 attributable to the banking group
Type of transaction/Amounts 31/12/2008 31/12/2007
1. Current accounts 4,189,077 3,837,264 2. Repurchase agreements 32,321 7,857 3. Mortgages 10,124,813 9,755,017 4. Credit cards, personal loans and assignments of one-fifth of salary 475,044 431,185 5. Finance leases – – 6. Factoring – – 7. Other transactions 4,414,320 4,459,329 8. Debt securities 282,815 38,284 8.1 Structured securities – – 8.2 Other Debt securities 282,815 38,284 9. Impaired assets 761,733 659,872 10. Assets sold but not derecognized 2,424,517 1,702,650
Total (Book value) 22,704,640 20,891,458
Total (Fair value) 22,686,625 21,662,903
Assets sold but not derecognized mainly relate to the mortgages sold as part of the securitizations known as “Berica 5 Residential MBS”, “Berica 6 Residential MBS” and “Berica 7 Residential MBS” which, since they do not satisfy the IAS 39 requirements for derecognition, have been “reinstated” in the financial statements.
The securitization known as “Berica 7 Residential MBS”, the Group’s 7th such operation and the 4th multioriginator kind, commenced on 1 October 2008 with the without-recourse sale of performing mortgages of Euro 1,012.8 million by Banca Popolare di Vicenza and its subsidiaries Banca Nuova and Cassa di Risparmio di Prato, to a special purpose entity. This operation was completed in November with the issue of Euro 1,005 million in asset backed securities (of which Euro 930 million in Senior notes and Euro 75 million in Junior notes), all of which subscribed by the originator banks. The Senior notes have been used for refinancing with the European Central Bank.
The increase in “Debt securities” reported in line 8. refers to the transfer of certain financial instruments from “Financial assets available for sale” (Euro 253,282), in application of the amendments to IAS 39 “Financial instruments: recognition and measurement”.
The fair value of loans and advances to customers corresponds to the sum of the future cash flows from the outstanding loans, including interest, discounted with reference to a risk-free rate curve. The expected nominal cash flows are adjusted for expected losses using the probability of default (PD) and loss-given-default (LGD) parameters attributed to each class of risk. The fair value calculation is made for each individual long-term loan, while the fair value of “on demand” relationships is conventionally taken to be their carrying value. The fair

426
value of debt securities classified in this line item is calculated in the same way as for similar financial instruments classified in other balance sheet line items, as described in Part A of these explanatory notes.
7.2 Loans and advances to customers: analysis by debtor/issuer
7.2.1 attributable to the banking group
Type of transaction/Amounts 31/12/2008 31/12/2007
1. Debt securities: 282,815 38,284 a) Governments – – b) Other public entities – – c) Other issuers 282,815 38,284 – non-financial companies 7,962 10,976 – financial companies 274,853 27,308 – insurance companies – – – other – –
2. Loans to: 19,235,575 18,490,652 a) Governments 28 52 b) Other public entities 39,460 34,319 c) Other issuers 19,196,087 18,456,281 – non-financial companies 13,581,824 11,927,220 – financial companies 700,583 1,309,518 – insurance companies 23,672 2,463 – other 4,890,008 5,217,080
3. Impaired assets 761,733 659,872 a) Governments – – b) Other public entities 1 – c) Other issuers 761,732 659,872 – non-financial companies 520,363 485,711 – financial companies 545 1,863 – insurance companies 654 5 – other 240,170 172,293
4. Assets sold but not derecognized 2,424,517 1,702,650 a) Governments – – b) Other public entities – – c) Other issuers 2,424,517 1,702,650 – non-financial companies 43,826 – – financial companies 38,392 – – insurance companies – – – other 2,342,299 1,702,650
Total 22,704,640 20,891,458
Exposures to “non-financial companies” and “financial companies” relating to “Assets sold but not derecognized” mostly refer to debt securities temporarily sold under funding “repurchase agreements” with banks and customers.

427
SECTION 8
Hedging derivatives – Line item 80
Nothing has been classified in this section because the Group does not hold any derivatives fal-ling into this category.
SECTION 9
Remeasurement of financial assets backed by macro hedges – Line item 90
9.1 Remeasurement of hedged assets: analysis by hedged portfolio
In the second half of 2008, the Parent Bank Banca Popolare di Vicenza and its subsidiary Banca Nuova put in place a number of hedges against interest rate risk on fixed-rate loans granted in the last three years.
The table reports changes in the fair value of loans whose interest rate risk has been hedged using interest rate swaps, with the Group having selected Macro Fair Value Hedging as the accounting method for representing these hedges.
Changes in the fair value of hedged assets are recognized in line item 90 “Net hedging gains (losses)” in the income statement, together with the results of measuring the associated hedging derivatives.
9.2 Banking group assets backed by macro hedges of interest rate risk: breakdown
Hedged assets 31/12/2008 31/12/2007
1. Loans and receivables 458,896 – 2. Assets available for sale – – 3. Portfolio – –
Total 458,896 –
Banking Insurance Other Total group companies companies
1. Positive fair value 31,662 – – 31,662 1.1 in specific portfolios: 31,662 – – 31,662 a) loans and receivables 31,662 – – 31,662 b) assets available for sale – – – – 1.2 Aggregate – – – –
2. Negative fair value – – – – 2.1 in specific portfolios: – – – – a) loans and receivables – – – – b) assets available for sale – – – – 2.2 Aggregate – – – –
Total 31,662 – – 31,662

428
SECTION 10
Equity investments – Line item 100
10.1 Equity investments in companies under joint control (carried at equity) and those over which significant influence is exercised: disclosures
Key: (2) = significant influence
The percentage interest in equity also reflects the voting rights at stockholders’ meetings.
Name Location Type of Type of investment relationship Holder Held % B. ASSOCIATED COMPANIES (SUBJECT TO SIGNIFICANT INFLUENCE)
1. SEC SERVIZI S.C.p.A. Capital stock Euro 25,000,000 in shares of par value Euro 1 PADOVA 2 B. Pop. Vicenza 47.04 B.Nuova 1.66 Cariprato 1.02 Farbanca 0.102. 21 INVESTIMENTI PARTNERS S.p.A. Capital stock Euro 4,250,000 in shares of par value Euro 1 TREVISO 2 B. Pop. Vicenza 20.003. MAGAZZINI GENERALI MERCI E DERRATE S.p.A. Capital stock Euro 1,241,317 in shares of par value Euro 5.17 VICENZA 2 B. Pop. Vicenza 25.004. INCIPIT Scarl Capital stock Euro 12,500 in shares of par value Euro 1 NAPOLI 2 B.Nuova 20.005. INTERPORTO DELLA TOSCANA CENTRALE S.p.A. Capital stock Euro 12,075,000 in shares of par value Euro 0.21 PRATO 2 Cariprato 20.006. SOCIETà CATTOLICA DI ASSICuRAZIONI Scarl Capital stock Euro 154,536,612 in shares of par value Euro 3 VERONA 2 B. Pop. Vicenza 12.727. VICENZA LIFE LTD Capital stock Euro 634,850 in shares of par value Euro 1 DuBLINO 2 B. Pop. Vicenza 50.008. BERICA VITA S.p.A. Capital stock Euro 31,000,000 in shares of par value Euro 10 VICENZA 2 B. Pop. Vicenza 49.00 Banca Nuova 1.009. ABC ASSICuRA S.p.A. Capital stock Euro 8,925,000 in shares of par value Euro 0.51 VERONA 2 B. Pop. Vicenza 50.0010. FARMANuOVA S.p.A. Capital stock Euro 3,796,740 in shares of par value Euro 10 PALERMO 2 B.Nuova 30.0011. CATTOLICA-BPVI MEDIAZIONE CREDITIZIA S.p.A. Capitale sociale 300,000 in shares of par value Euro 1 VICENZA 2 B. Pop. Vicenza 50.00

429
10.2 Equity investments in companies under joint control and those over which significant influence is exercised: accounting information
Name Total Total Net income Equity1 Consolidated Fair assets revenues (loss) book value value
A. COMPANIES VALUED AT EQUITY A.1 Associated companies (subject to significant influence) 1. SEC SERVIZI S.C.p.A. Capital stock Euro 25,000,000 in shares of par value Euro 1 65,741 106,736 – 27,091 13,496 n.a.2. 21 INVESTIMENTI PARTNERS S.p.A. 2
Capital stock Euro 4,250,000 in shares of par value Euro 1 22,966 1,584 801 9,576 3,456 n.a.3. MAGAZZINI GENERALI MERCI E DERRATE S.p.A. 3
Capital stock Euro 1,241,317 in shares of par value Euro 5.17 5,424 2,079 31 1,515 379 n.a.4. INCIPIT Scarl 3
Capital stock Euro 12,500 in shares of par value Euro 1 47 – (11) 37 3 n.a.5. INTERPORTO DELLA TOSCANA CENTRALE S.p.A. 3
Capital stock Euro 12,075,000 in shares of par value Euro 0.21 53,246 3,068 (303) 13,468 2,198 n.a.6. SOCIETà CATTOLICA DI ASSICuRAZIONI S.c.a.r.l. Capital stock Euro 154,536,612 in shares of par value Euro 3 16,152,963 3,316,721 28,645 1,151,197 272,642 162,530 7. VICENZA LIFE LTD Capital stock Euro 634,850 in shares of par value Euro 1 992,094 196,783 3,122 18,409 11,314 n.a.8. BERICA VITA S.p.A. Capital stock Euro 31,000,000 in shares of par value Euro 10 645,039 127,525 (22,110) 12,104 10,213 n.a.9. ABC ASSICuRA S.p.A. Capital stock Euro 8,925,000 in shares of par value Euro 0.51 37,713 14,508 (1,162) 7,741 4,392 n.a.10. FARMANuOVA S.p.A. Capital stock Euro 3,796,740 in shares of par value Euro 10 23,490 3,045 177 3,668 1,100 n.a.11. CATTOLICA–BPVI MEDIAZIONE CREDITIZIA S.p.A. Capitale sociale 300,000 in shares of par value Euro 1 956 83 (263) 814 407 n.a.
A. TOTAL COMPANIES VALUED AT EQUITY 319,600 1 The amounts include the net income (loss) for the year;2 The amounts refer to the latest approved consolidated financial statements of the company concerned at 31 December 2007;3 The amounts refer to the latest approved financial statements of the company concerned at 31 December 2007.
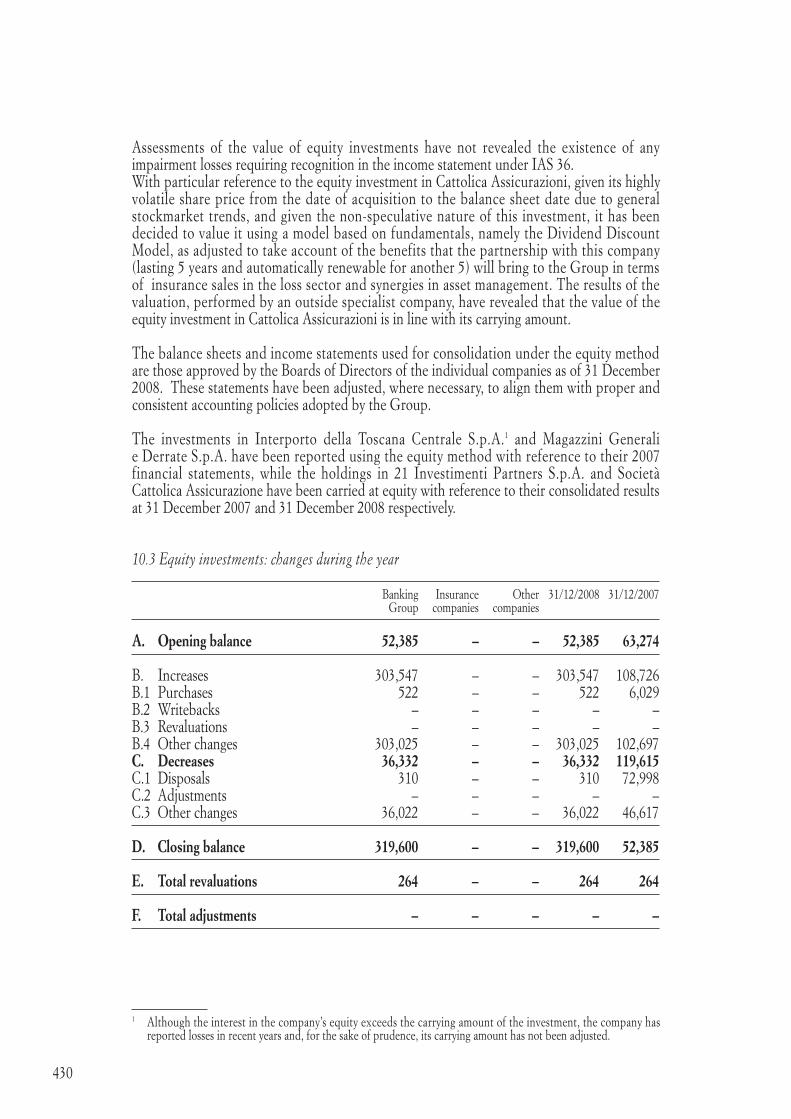
430
Assessments of the value of equity investments have not revealed the existence of any impairment losses requiring recognition in the income statement under IAS 36.With particular reference to the equity investment in Cattolica Assicurazioni, given its highly volatile share price from the date of acquisition to the balance sheet date due to general stockmarket trends, and given the non-speculative nature of this investment, it has been decided to value it using a model based on fundamentals, namely the Dividend Discount Model, as adjusted to take account of the benefits that the partnership with this company (lasting 5 years and automatically renewable for another 5) will bring to the Group in terms of insurance sales in the loss sector and synergies in asset management. The results of the valuation, performed by an outside specialist company, have revealed that the value of the equity investment in Cattolica Assicurazioni is in line with its carrying amount.
The balance sheets and income statements used for consolidation under the equity method are those approved by the Boards of Directors of the individual companies as of 31 December 2008. These statements have been adjusted, where necessary, to align them with proper and consistent accounting policies adopted by the Group.
The investments in Interporto della Toscana Centrale S.p.A.1 and Magazzini Generali e Derrate S.p.A. have been reported using the equity method with reference to their 2007 financial statements, while the holdings in 21 Investimenti Partners S.p.A. and Società Cattolica Assicurazione have been carried at equity with reference to their consolidated results at 31 December 2007 and 31 December 2008 respectively.
10.3 Equity investments: changes during the year
Banking Insurance Other 31/12/2008 31/12/2007 Group companies companies
A. Opening balance 52,385 – – 52,385 63,274
B. Increases 303,547 – – 303,547 108,726 B.1 Purchases 522 – – 522 6,029 B.2 Writebacks – – – – – B.3 Revaluations – – – – – B.4 Other changes 303,025 – – 303,025 102,697 C. Decreases 36,332 – – 36,332 119,615 C.1 Disposals 310 – – 310 72,998 C.2 Adjustments – – – – – C.3 Other changes 36,022 – – 36,022 46,617
D. Closing balance 319,600 – – 319,600 52,385
E. Total revaluations 264 – – 264 264
F. Total adjustments – – – – –
1 Although the interest in the company’s equity exceeds the carrying amount of the investment, the company has reported losses in recent years and, for the sake of prudence, its carrying amount has not been adjusted.

431
“Purchases” reported in line B.1 refer to:• Euro400inpaymentsoncapitalaccounttoCattolica-BPVimediazionecreditiziaSpa;• Euro122tosubscribetheincreaseincapitalbyFarmanuovaSpa.
“Other changes” reported in line B.4 include the reclassification of Euro 296,245 relating to the interest in Cattolica Assicurazioni, as discussed in Section 4 above. They also include Euro 5,794 in goodwill arising on application of the equity method relating to the Vicenza Life, ABC Assicura and 21 Investimenti, previously recorded under goodwill. Lastly, “Other changes” reported in lines B.4 and C.3 include the effects of equity accounting for companies over which significant influence is exercised.“Sales” reported in line C.1 refer to the disposal of the entire interest in “Otto a più investimenti SGR”, which gave rise to a capital gain of Euro 81, recognized in line item 240 “Profit (loss) from equity investments” in the income statement and classified in line B.4 “Other changes” of the above table.
SECTION 11
Technical reserves borne by reinsurers – Line item 110
Nothing has been classified in this section.

432
SECTION 12
Property, plant and equipment – Line item 120
12.1 Property, plant and equipment: analysis of assets carried at cost
Assets/Amounts Banking Insurance Other 31/12/2008 31/12/2007 group companies companies
A. Assets used in business 1.1 Owned 412,299 – – 412,299 389,052 a) Land 74,877 – – 74,877 71,304 b) Buildings 240,526 – – 240,526 223,819 c) Furniture 54,873 – – 54,873 54,030 d) IT equipment 8,756 – – 8,756 8,683 e) Other 33,267 – – 33,267 31,216 1.2 Purchased under finance leases 694 – – 694 694 a) Land 309 – – 309 – b) Buildings 385 – – 385 694 c) Furniture – – – – – d) IT equipment – – – – – e) Other – – – – –
Total A 412,993 – – 412,993 389,746
B. Investment property 2.1 Owned – – – – – a) Land – – – – – b) Buildings – – – – – 2.2 Purchased under finance leases – – – – – a) Land – – – – – b) Buildings – – – – –
Total B – – – – –
Total A+B 412,993 – – 412,993 389,746

433
12.2 Property, plant and equipment: analysis of assets carried at fair value or revalued
Assets/Amounts Banking Insurance Other 31/12/2008 31/12/2007 group companies companies
A. Assets used in business 1.1 Owned – – – – – a) Land – – – – – b) Buildings – – – – – c) Furniture – – – – – d) IT equipment – – – – – e) Other – – – – – 1.2 Purchased under finance leases – – – – – a) Land – – – – – b) Buildings – – – – – c) Furniture – – – – – d) IT equipment – – – – – e) Other – – – – –
Total A – – – – –
B. Investment property 2.1 Owned 134,926 – – 134,926 47,863 a) Land 26,931 – – 26,931 9,703 b) Buildings 107,995 – – 107,995 38,160 2.2 Purchased under finance leases – – – – – a) Land – – – – – b) Buildings – – – – –
Total B 134,926 – – 134,926 47,863
Total A+B 134,926 – – 134,926 47,863
The increase in this balance mostly refers to the purchase of a property in Milan (Piazza Durante no. 11) by the subsidiary Monforte 19, after accepting the court proposal dated 1 August 2008 under the judicial winding up of Magiste Real Estate SpA in C.P. whereby Banca Popolare di Vicenza would purchase or have one of its subsidiaries or associates purchase the property mortgaged against the loan that the Bank had made to the company now being wound up.

434
12.3 Property, plant and equipment used for business purposes: changes during the year
12.3.1 attributable to the banking group
Land Buildings Furniture IT Other Total equipment
A. Opening gross amount 71,304 283,772 98,759 48,883 86,792 589,510
A.1 Total net reductions in value – 59,259 44,729 40,200 55,576 199,764
A.2 Opening net amount 71,304 224,513 54,030 8,683 31,216 389,746
B. Increases: 3,882 24,161 5,273 3,513 8,747 45,576 B.1 Purchases 3,573 21,859 5,262 3,510 7,403 41,607 B.2 Capitalized improvement expenditure – 2,302 – – – 2,302 B.3 Writebacks – – – – – – B.4 Fair value increases booked to: – – – – – – a) equity – – – – – – b) income statement – – – – – – B.5 Positive exchange rate adjustments – – – – – – B.6 Transfers from investment property – – – – – – B.7 Other changes 309 – 11 3 1,344 1,667
C. Decreases – 7,763 4,430 3,440 6,696 22,329 C.1 Sales – – 108 48 185 341 C.2 Depreciation – 7,454 3,129 3,358 6,482 20,423 C.3 Impairment charges booked to: – – – – 4 4 a) equity – – – – – – b) income statement – – – – 4 4 C.4 Fair value decreases booked to: – – – – – – a) equity – – – – – – b) income statement – – – – – – C.5 Negative exchange rate adjustments – – – – – – C.6 Transfers to: – – – – – – a) investment property – – – – – – b) assets held for sale – – – – – – C.7 Other changes – 309 1,193 34 25 1,561
D. Closing net amount 75,186 240,911 54,873 8,756 33,267 412,993
D.1 Total net reductions in value – 66,713 47,858 43,558 62,058 220,187
D.2 Closing gross amount 75,186 307,624 102,731 52,314 95,325 633,180

435
12.4 Investment property: changes during the year
The positive and negative changes in fair value of investment properties, arising from their adjustment to market value determined in specific appraisals by an outside company, have been recognized in line item 250 “Net gains (losses) arising on fair value adjustments to property, plant and equipment and intangible assets” in the income statement.
Banking Group Insurance companies Other companies 31/12/2008 Land Buildings Land Buildings Land Buildings Land Buildings
A. Opening balance 9,703 38,160 – – – – 9,703 38,160
B. Increases 17,268 69,954 – – – – 17,268 69,954 B.1 Purchases 17,072 69,820 – – – – 17,072 69,820 B.2 Capitalized improvement expenditure – 76 – – – – – 76 B.3 Fair value increases 196 58 – – – – 196 58 B.4 Writebacks – – – – – – – – B.5 Positive exchange rate adjustments – – – – – – – – B.6 Transfers from property, plant and equipment used for business purposes – – – – – – – – B.7 Other changes – – – – – – – – C. Decreases 40 119 – – – – 40 119 C.1 Sales – – – – – – – – C.2 Depreciation – – – – – – – – C.3 Fair value decreases 40 119 – – – – 40 119 C.4 Impairment charges – – – – – – – – C.5 Impairment charges – – – – – – – – C.6 Transfers to: – – – – – – – – a) property used for business porposes – – – – – – – – b) assets held for sale – – – – – – – – C.7 Other changes – – – – – – – –
D. Closing balance 26,931 107,995 – – – – 26,931 107,995
E. Fair value 26,931 107,995 – – – – 26,931 107,995

436
SECTION 13
Intangible assets – Line item 130
13.1 Intangible assets: analysis by type
Line A.1 “Goodwill” includes:• Euro443,207ingoodwillpaidbytheParentBanktoacquire61branchesfromtheUBI
Group on 31 December 2007;• Euro208,580arisingonconsolidationofthesubsidiaryCaripratoSpA;• Euro120,198representingtheresidualgoodwillpaidtotheformerGroupbanksthatsold
their businesses to the Parent Bank in 2000;• Euro55,661arisingonconsolidationofthesubsidiaryBancaNuovaSpA;• Euro52,889representingtheresidualgoodwillpaidforthepurchaseof46branchesfrom
banks in the Intesa Group during 2001;• Euro36,000representingtheresidualgoodwillpaidtoBancaAntonVenetaforthepurchase
of 30 branches in eastern Sicily at the end of 2004;• Euro16,707arisingontheconsolidationofthesubsidiaryBPViFondiSGRresultingfrom
the absorption of Verona Gestioni SGR SpA; • Euro6,223arisingonconsolidationofthesubsidiaryFarbancaSpA;• Euro4,121ingoodwillpaidbythesubsidiaryCaripratoSpAtoacquireabusinessfrom
Banca Steinhauslin &C.;• Euro176arisingonconsolidationofthesubsidiaryNordestMerchantSpA.
The carrying value of this goodwill has been tested for impairment in accordance with IAS 36, since it represents an intangible asset with an indefinite useful life. The results of these tests are discussed in the specific paragraph later on in this section. The increase in “Other intangible assets” (line A.2) mostly refers to intangibles identified as part of the purchase price allocation process relating to the acquisition of 61 branches
Assets/Amounts Banking Group Insurance companies Other companies 31/12/2008 31/12/2007 Finite Indefinite Finite Indefinite Finite Indefinite Finite Indefinite Finite Indefinite life life life life life life life life life life
A.1 Goodwill – 943,762 – – – – – 943,762 – 976,996 A.1.1 attributable to the group x 943,762 – – – – – 943,762 – 976,996 A.1.2 attributable to minority interests x – – – – – – – – – A.2 Other intangible assets 28,138 – – – – – 28,138 – 7,940 – A.2.1 Carried at cost: 28,138 – – – – – 28,138 – 7,940 – a) Intangible assets generated internally – – – – – – b) Other assets 28,138 – – – – – 28,138 – 7,940 – A.2.2 Carried at fair value: – – – – – – – – – – a) Intangible assets generated internally – – – – – – – – b) Other assets – – – – – – – – – –
Total 28,138 943,762 – – – – 28,138 943,762 7,940 976,996
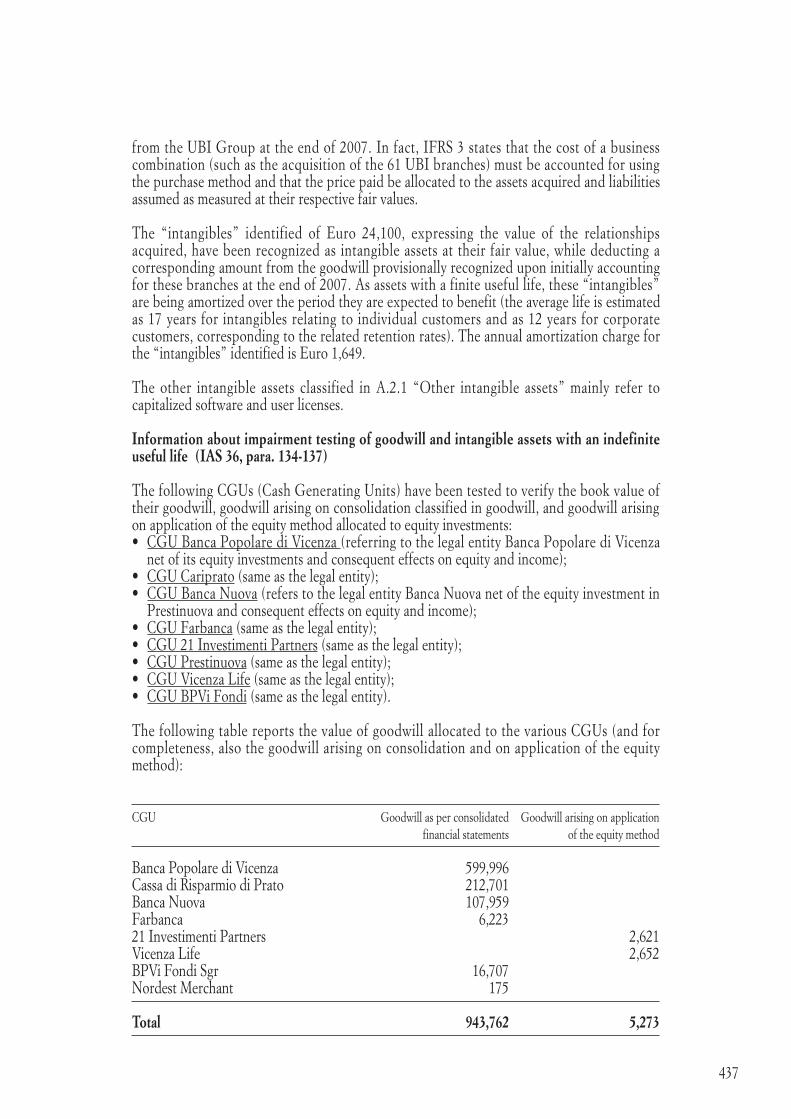
437
from the uBI Group at the end of 2007. In fact, IFRS 3 states that the cost of a business combination (such as the acquisition of the 61 uBI branches) must be accounted for using the purchase method and that the price paid be allocated to the assets acquired and liabilities assumed as measured at their respective fair values.
The “intangibles” identified of Euro 24,100, expressing the value of the relationships acquired, have been recognized as intangible assets at their fair value, while deducting a corresponding amount from the goodwill provisionally recognized upon initially accounting for these branches at the end of 2007. As assets with a finite useful life, these “intangibles” are being amortized over the period they are expected to benefit (the average life is estimated as 17 years for intangibles relating to individual customers and as 12 years for corporate customers, corresponding to the related retention rates). The annual amortization charge for the “intangibles” identified is Euro 1,649.
The other intangible assets classified in A.2.1 “Other intangible assets” mainly refer to capitalized software and user licenses.
Information about impairment testing of goodwill and intangible assets with an indefinite useful life (IAS 36, para. 134-137)
The following CGus (Cash Generating units) have been tested to verify the book value of their goodwill, goodwill arising on consolidation classified in goodwill, and goodwill arising on application of the equity method allocated to equity investments:• CGu Banca Popolare di Vicenza (referring to the legal entity Banca Popolare di Vicenza
net of its equity investments and consequent effects on equity and income);• CGu Cariprato (same as the legal entity);• CGu Banca Nuova (refers to the legal entity Banca Nuova net of the equity investment in
Prestinuova and consequent effects on equity and income);• CGu Farbanca (same as the legal entity);• CGu 21 Investimenti Partners (same as the legal entity);• CGu Prestinuova (same as the legal entity);• CGu Vicenza Life (same as the legal entity);• CGu BPVi Fondi (same as the legal entity).
The following table reports the value of goodwill allocated to the various CGus (and for completeness, also the goodwill arising on consolidation and on application of the equity method):
CGu Goodwill as per consolidated Goodwill arising on application financial statements of the equity method
Banca Popolare di Vicenza 599,996Cassa di Risparmio di Prato 212,701Banca Nuova 107,959Farbanca 6,22321 Investimenti Partners 2,621Vicenza Life 2,652BPVi Fondi Sgr 16,707Nordest Merchant 175
Total 943,762 5,273

438
The value in use and market/disposal value, where considered significant, have been determined for all the CGus identified. Not only is this approach consistent with IAS 36, which requires a CGu’s carrying amount to be compared with the higher of its value in use and market/disposal value, it is also appropriate in view of current market uncertainty, causing the making of financial forecasts to be particularly difficult and uncertain.
The different valuation techniques fall into the following core categories: • analytical methods (for determining value in use)• market methods (for determining fair value)
Analytical methods
In compliance with recent valuation practice, the adoption of value in use as the measure for determining recoverable amount involves using methods based on estimating future income or cash flow, such as for example, the dividends that a CGu is able to produce in the future (Dividend Discount Model - DDM, with reference to “Excess Capital”).
The Dividend Discount Model is a variation on the cash flow method. In particular, this method, in its “Excess Capital” variant, establishes that the economic value of a financial company is given by discounting a stream of dividends determined on the basis of minimum capital requirements dictated by the regulator.
Value in use has therefore been determined using methods currently adopted by sector players (Dividend Discount Model for the banks and consumer credit companies and earnings method for the insurance companies/21 Investimenti Partners).
Market methods
The two principal market methods are:• thestockmarketquotations/marketmultiplesmethod• thecomparabletransactionsmethodThe stockmarket quotations/market multiples method is based on analyzing listed companies similar to the one being valued and particularly the relationship between the market value of such companies and their balance sheet and profit indicators.
The comparable transactions method adopts a similar approach to that of the market multiples method and involves analyzing the relationship between prices reported for company/business acquisitions and the balance sheet and profit indicators of such companies.
The multiples of Italian listed banks have been considerably volatile in recent years. In fact, Price/Book Value (P/BV) ratios have gone from 2 in 2007 to multiples ranging between 0.2 and 0.4 at the start of 2009, reflecting the general decline in all stocks in the Italian banking sector. Despite the Bank of Italy’s reassurances about the relatively greater solidity of our banking system compared with other countries, in the week from 16 to 20 February the sector index in Milan lost 17%, more than the general Stoxx one (-14%). As noted in the specialist press (Il Sole 24 Ore of 21 February 2009) “the markets are no longer capable of distinguishing healthy companies from those in crisis”. Consequently, we are of the opinion that in the current market context stockmarket multiples cannot be used as an indicator of market/disposal value.
It has been decided instead to refer to multiples for comparable transactions, provided there are a sufficient, appropriate number of recent transactions.

439
Summary of the valuation methods applied:
CGu tested Recoverable amount higher of Value in use Market value
Banca Popolare di Vicenza x xCassa di Risparmio di Prato x xBanca Nuova x xFarbanca x x21 Investimenti Partners x n.a.Prestinuova x n.a.Vicenza Life x n.a.BPVi Fondi Sgr n.a. x
In all the above cases, with the sole exception of Cassa di Risparmio di Prato, value in use where calculated was higher than book value.
Analytical methods: financial and economic projections
The method adopted for determining value in use (specifically DDM), is based on constructing the economic and financial projects needed to determine the estimated dividends that the CGu is able to produce in the future.
The Board of Directors approved the Business Plan for 2008 – 2011 on 11 September 2008, ie. before the bankruptcy of Lehman Brothers and the steady deterioration in the macroeconomic environment. This plan was prepared using assumptions that, despite being based on estimates by primary forecasting institutes, now appear to be superseded by events, at least as far as the specific planning period is concerned.
In recent months the economic, financial and operating scenario for the sector has experienced changes that are without precedent in recent history and still appears to feature exceptional levels of uncertainty regarding the outlook for the real economy, financial markets and the associated developments in monetary policy, as stated more than once by the ECB in its latest bulletin in February 2009.
Since we are aware that the Business Plan for 2008-2011 has been prepared on the basis of macroeconomic and operating assumptions that are no longer realistic, at least with reference to the specific planning period, and that the Budget for 2009 subsequently prepared now appears to be superseded, at least in part, by the current scenario and by the high degree of uncertainty affecting the current outlook, we have prepared separate financial and economic projections for valuation purposes based on the specific assumptions set of below and which have been tested for sensitivity.
General approach used for making forecasts
The simulations/projections developed for DDM application purposes are based on the 2009 Budget, as revised solely to take account of the impact of adjusting rates and spreads for new assumptions regarding trends in market rates but not for any other corrective actions; in the case of Banca Popolare di Vicenza, the cost of credit has also been prudently revised with reference to the amount of impaired loans.

440
The assumptions regarding rates are based on expectations reflected in the current rate curve and on estimates contained in the Forecast published by Prometeia in January 2009.
The estimates for 2010 and 2011 have been prepared with reference to the growth rates contained in the Plan, taking account of the need to ensure balanced growth in deposits and lending and of certain specific assumptions particularly relating to the cost of credit.
The estimates for 2012 and 2013 are a steady-state projection that assumes a gradual convergence of industry growth rates (based on the projections contained in the latest Forecast Bank Results by Prometeia)
Consequently, these projections cannot be treated as a revision of the Business Plan, or even less, of the budget; instead, they are a forecast of the possible evolution in the Group’s results based on specific assumptions, that take account of projections by forecasting institutes, and specifically prepared in order to have the information needed for the purposes of impairment testing.
In addition, for the purposes of determining terminal value, it has been assumed that a steady-state level of income will be achieved based on a zero-growth extrapolation from the plan.
Summary of the assumptions used for deriving terminal value:
CGu Method of calculating Growth rate Post-tax terminal value (g) discount rate
Banca Popolare Steady stete return 2% 8.48%di VicenzaCassa di Risparmio Steady stete return 2% 8.48%di Prato Banca Nuova Steady stete return 2% 8.48% Farbanca Steady stete return 2% 8.48% 21 Investimenti Partners Steady stete return 2% 9.32% Prestinuova Steady stete return 2% 9.25% Vicenza Life Steady stete return 2% 9.57%
The comparable transactions method has referred to transactions in Italy in the second half of 2008 relating to multiples on equity, total deposits (as the value of goodwill), and the amount of assets ma-naged, in the case of asset management.

441
13.2 Intangible assets: changes during the year
13.2.1 attributable to the banking group
Key:Finite: finite lifeIndefinite: Indefinite life
Goodwill Other intangible assets: Other intangible assets: Total generated internally other Finite Indefinite Finite Indefinite
A. Opening balance 1,194,181 – – 13,959 – 1,208,140
A.1 Total net reductions in value 217,185 – – 6,019 – 223,204
A.2 Opening net amount 976,996 – – 7,940 – 984,936
B. Increases 16,919 – – 26,009 – 42,928 B.1 Purchases – – – 1,909 – 1,909 B.2 Increases in internally generated intangible assets x – – – – – B.3 Writebacks x – – – – – B.4 Positive changes in fair value – – – – – – – booked to equity x – – – – – – booked to income statement x – – – – – B.5 Positive exchange rate adjustments – – – – – – B.6 Other changes 16,919 – – 24,100 – 41,019
C. Decreases 50,153 – – 5,811 – 55,964 C.1 Sales – – – – – – C.2 Adjustments 1,386 5,729 7,115 – Amortization x – – 5,674 – 5,674 – Writedowns 1,386 – – 55 – 1,441 + equity X – – – – – + income statement 1,386 – – 55 – 1,441 C.3 Negative changes in fair value – – – – – – – booked to equity x – – – – – – booked to income statement x – – – – – C.4 Transfer to non-current assets held for sale – – – – – C.5 Negative exchange rate adjustments – – – – – – C.6 Other changes 48,767 – – 82 – 48,849
D. Closing net amount 943,762 – – 28,138 – 971,900
D.1 Total net value adjustments 218,571 – – 11,748 – 230,319
E. Closing gross amount 1,162,333 – – 39,886 – 1,202,219

442
The opening balance of “Other intangible assets” does not include those assets which had been fully amortized at the end of the prior year.
“Other increases” in goodwill mostly refer to related costs (legal and notary fees, indirect taxes) incurred by the Parent Bank in relation to the acquisition of the uBI branches.
“Other decreases” in goodwill reflect Euro 18,654 for adjusting the provisional price of the uBI branches previously recorded and Euro 24,100 for reclassifying to “Other intangible assets” the “intangibles” identified as part of the purchase price allocation process (this same amount features in the “Other increases” in “Other intangible assets”). Lastly, line C.6 also reflects the reclassification to “Equity investments” of the goodwill arising on application of the equity method in relation to the associated companies Vicenza Life, ABC Assicura and 21 Investimenti (Euro 5,794).
Intangible assets, except goodwill, are amortized systematically each year on a straight-line basis over their estimated useful lives.
SECTION 14
Tax assets and liabilities – Asset line item 140 and liabilitiy line item 80
14.1 Deferred tax assets: analysis
Deferred tax assets Banking Insurance Other 31/12/2008 31/12/2007 group companies companies
– Deferred tax assets booket to income statement 114,822 – – 114,822 95,033 – Deferred tax assets booket to Equity 6,742 – – 6,742 8,074
Total 121,564 – – 121,564 103,107
14.2 Deferred tax liabilities: analysis
Deferred tax liabilities Banking Insurance Other 31/12/2008 31/12/2007 group companies companies
– Deferred tax liabilities booket to income statement 52,037 – – 52,037 30,482 – Deferred tax liabilities booket to equity 6,322 – – 6,322 4,606
Total 58,359 – – 58,359 35,088

443
14.3 Change in deferred tax assets (with matching entry in income statement)
Banking Insurance Other 31/12/2008 31/12/2007 group companies companies
1. Opening balance 95,033 – – 95,033 116,326
2. Increases 46,196 – – 46,196 40,666 2.1 Deferred tax assets recorded during the year 45,030 – – 45,030 40,288 a) relating to prior years 2,097 – – 2,097 162 b) due to changes in accounting policies – – – – – c) writebacks – – – – – d) other 42,933 – – 42,933 40,126 2.2 New taxes or increases in tax rates – – – – 77 2.3 Other increases 1,166 – – 1,166 301
3. Decreases 26,407 – – 26,407 61,959 3.1 Deferred tax assets reversing during the year 26,217 – – 26,217 35,200 a) reversals 26,170 – – 26,170 33,171 b) written down as no longer recoverable 47 – – 47 2,029 c) change in accounting policies – – – – – 3.2 Reduction in tax rates – – – – 10,267 3.3 Other decreases 190 – – 190 16,492
4. Closing balance 114,822 – – 114,822 95,033
Line 2.1 a) reflects the recognition of deferred tax assets for IRAP (Italian regional business tax) following changes to the law contained in Decree 185 of 29 November 2008, as converted with amendments into Law 2 of 28 January 2009.

444
14.4 Change in deferred tax liabilities (with matching entry in income statement)
Banking Insurance Other 31/12/2008 31/12/2007 group companies companies
1. Opening balance 30,482 – – 30,482 75,353
2. Increases 29,683 – – 29,683 28,477 2.1 Deferred tax assets recorded during the year 28,472 – – 28,472 24,272 a) relating to prior years 1,301 – – 1,301 – b) due to changes in accounting policies – – – – – c) other 27,171 – – 27,171 24,272 2.2 New taxes or increases in tax rates – – – – 156 2.3 Other increases 1,211 – – 1,211 4,049
3. Decreases 8,128 – – 8,128 73,348 3.1 Deferred tax liabilities eliminated during the year 8,112 – – 8,112 31,827 a) reversals 8,112 – – 8,112 30,787 b) due to changes in accounting policies – – – – – c) other – – – – 1,040 3.2 Reduction in tax rates – – – – 7,983 3.3 Other decreases 16 – – 16 33,538
4. Closing balance 52,037 – – 52,037 30,482
Line 3.1.a) includes the removal of liabilities recognized in the past after Banca Nuova and Cassa di Risparmio di Prato decided to frank “Form EC” by paying a flat tax in the year.

445
14.5 Change in deffered tax assets (with matching entry to equity)
Banking Insurance Other 31/12/2008 31/12/2007 group companies companies
1. Opening balance 8,074 – – 8,074 927
2. Increases 1,644 – – 1,644 11,221 2.1 Deferred tax assets recorded during the year 1,136 – – 1,136 11,221 a) relating to prior years – – – – – b) due to changes in accounting policies – – – – – c) other 1,136 – – 1,136 11,221 2.2 New taxes or increases in tax rates – – – – – 2.3 Other increases 508 – – 508 –
3. Decreases 2,976 – – 2,976 4,074 3.1 Deferred tax assets reversing during the year 2,936 – – 2,936 673 a) reversals 2,936 – – 2,936 673 b) written down as no longer recoverable – – – – – c) due to changes in accounting policies – – – – – 3.2 Reduction in tax rates – – – – 1 3.3 Other decreases 40 – – 40 3,400
4. Closing balance 6,742 – – 6,742 8,074

446
14.6 Change in deferred tax liabilities (with matching entry to equity)
Banking Insurance Other 31/12/2008 31/12/2007 group companies companies
1. Opening balance 4,606 – – 4,606 6,230
2. Increases 3,283 – – 3,283 4,638 2.1 Deferred tax assets recorded during the year 3,280 – – 3,280 4,074 a) relating to prior years – – – – – b) due to changes in accounting policies – – – – – c) other 3,280 – – 3,280 4,074 2.2 New taxes or increases in tax rates – – – – – 2.3 Other increases 3 – – 3 564
3. Decreases 1,567 – – 1,567 6,262 3.1 Deferred tax assets reversing during the year 1,567 – – 1,567 3,148 a) reversals 1,567 – – 1,567 3,148 b) due to changes in accounting policies – – – – – c) other – – – – – 3.2 Reduction in tax rates – – – – 1,236 3.3 Other decreases – – – – 1,878
4. Closing balance 6,322 – – 6,322 4,606

447
SECTION 15
Non-current assets held for sale and associated liabilities – Asset line item 150 and liability line item 90
15.1 Non-current assets held for sale and associated liabilities: analysis by type
Banking Insurance Other 31/12/2008 31/12/2007 group companies companies
A. Individual assets A.1 Equity investments – – – – 64,548 A.2 Property, plant and equipment – – – – – A.3 Intangible assets – – – – 36,772 A.4 Other non-current assets – – – – –
Total A – – – – 101,320
B. Groups of assets (discontinued operations) B.1 Financial assets held for trading – – – – – B.2 Financial assets at fair value – – – – – B.3 Financial assets available for sale – – – – – B.4 Financial assets held to maturity – – – – – B.5 Loans and advances to banks – – – – – B.6 Loans and advances to customers – – – – – B.7 Equity investments – – – – – B.8 Property, plant and equipment – – – – – B.9 Intangible assets – – – – – B.10 Other assets – – – – –
Total B – – – – –
C. Liabilities associated with assets held for sale C.1 Payables – – – – – C.2 Securities – – – – – C.3 Other liabilities – – – – –
Total C – – – – –
D. Liabilities associated with assets held for sale D.1 Deposits from banks – – – – – D.2 Due to customers – – – – – D.3 Debt securities in issue – – – – – D.4 Financial liabilities held for trading – – – – – D.5 Financial liabilities at fair value – – – – – D.6 Provisions – – – – – D.7 Other liabilities – – – – –
Total D – – – – –

448
At 31 December 2007, line A.1 referred to the entire interest (47.9625% of capital stock) held in Linea SpA while line A.3 reported the related goodwill arising on application of the equity method, both of which reclassified to non-current assets held for sale, in compliance with IFRS 5, after signing a contract in December 2007 for this company’s sale. This sale was completed on 27 June 2008 and resulted in the recognition of a capital gain, net of related costs, of Euro 91,646 in line item 240 “Profit (loss) from equity investments”.
SECTION 16
Other assets – Line item 160
16.1 Other assets: analysis
31/12/2008 31/12/2007
1. Miscellaneous debits in transit 54,846 58,474 2. Miscellaneous security transactions 5,159 3,591 3. Amounts recorded on the last day of the year 124,552 89,644 4. Checks drawn on third parties sent for collection 19,935 26,493 5. Adjustments to non-liquid portion of notes discounted with recourse 20,265 23,547 6. Accrued income and prepaid expenses not allocated to specific accounts 15,258 22,027 7. Leasehold improvements 24,761 22,501 8. Items awaiting allocation 1,076 1,622 9. Other items relating to assets sold but not derecognized 71,041 – 10. Other miscellaneous items 82,107 49,340
Total 419,000 297,239 “Leasehold improvements” consist of improvement expenditure that cannot be separated from the assets themselves, meaning that it cannot be separately recognized in property, plant and equipment. These costs are amortized over the period they are expected to benefit or the residual duration of the lease, whichever is shorter.
“Amounts recorded on the last day of the year” refer to items almost all of which settled in the first few days of the new year.
In compliance with the clarifications and explanations contained in a recent letter from the Supervisory Authorities to bank intermediaries, as from 31 December 2008 “Other assets” include “operating receivables” previously classified in “Loans and advances to customers”.

449
LIABILITIES AND EQuITY
SECTION 1
Deposits from banks – Line item 10
1.1 Deposits from banks: breakdown by type
Type of transaction/Members of the group Banking Insurance Other 31/12/2008 31/12/2007 group companies companies
1. Due to central banks 701,185 – – 701,185 85,086 2. Due to other banks 2,375,533 – – 2,375,533 3,193,608 2.1 Current accounts and sight deposits 168,832 – – 168,832 493,468 2.2 Time deposits 1,589,227 – – 1,589,227 2,200,292 2.3 Loans 517,734 – – 517,734 422,711 2.3.1 Finance leases – – – – – 2.3.2 Other 517,734 – – 517,734 422,711 2.4 Payables for commitments to repurchase own equity instruments – – – – – 2.5 Liabilities relating to assets sold but not derecognized 99,721 – – 99,721 77,137 2.5.1 Repurchase agreements 99,721 – – 99,721 77,137 2.5.2 Other – – – – – 2.6 Other payables 19 – – 19 –
Total 3,076,718 – – 3,076,718 3,278,694
Fair value 3,076,718 – – 3,076,718 3,278,694 The increase in “Due to central banks” mainly reflects refinancing activity, through repurchase agreements, directly with the European Central Bank.
“Loans: other” in line 2.3.2 include funding repurchase agreements arranged to match equivalent lending repurchase agreements classified as loans to banks or to customers.
In view of the predominantly short-term nature of deposits from banks, their fair value is conventionally taken to be their carrying amount.

450
SECTION 2
Due to customers – Line item 20
2.1 Due to customers: breakdown by type
Type of transaction/Members of the group Banking Insurance Other 31/12/2008 31/12/2007 group companies companies
1. Current accounts and sight deposits 10,001,254 – – 10,001,254 8,624,5742. Time deposits 182,612 – – 182,612 25,720 3. Public funds administered 416 – – 416 510 4. Loans 523,648 – – 523,648 1,070,312 4.1 Finance leases 4 – – 4 – 4.2 Other 523,644 – – 523,644 1,070,312 5. Payables for commitments to repurchase own equity instruments – – – – – 6. Liabilities relating to assets sold but not derecognized 1,416,625 – – 1,416,625 1,631,160 6.1 Repurchase agreements 263,947 – – 263,947 – 6.2 Other 1,152,678 – – 1,152,678 1,631,160 7. Other payables 37,322 – – 37,322 127,083
Total 12,161,877 – – 12,161,877 11,479,359
Fair value 12,161,877 – – 12,161,877 11,479,359 “Liabilities relating to assets sold but not derecognized”, included in line 6.2, represent the matching entry for the mortgages sold as part of the securitizations known as “Berica 5 Residential MBS” and “Berica 6 Residential MBS” which, since they do not satisfy the IAS 39 requirements for derecognition, have been “reinstated” in the financial statements as “assets sold but not derecognized” reported under line item 70 “loans and advances to customers”.
The related decrease mostly refers to the repurchase in the year of Senior and Mezzanine notes issued in relation to the above securitizations. The repurchased securities have been used for refinancing at the European Central Bank and/or lodged with the Bank of Italy to guarantee the Group’s daily settlements.
With reference to the “Berica 7 Residential MBS” securitization completed in the year and also reinstated in the balance sheet, no “liabilities for assets sold but not derecognized” have been recognized because the related asset backed securities have been subscribed in full by the originators.
“Loans: other” in line 4.2 include funding repurchase agreements arranged to match equivalent lending repurchase agreements classified as loans to banks or to customers. Funding repurchase agreements arranged using investment securities are classified in line 6.1.
In view of the predominantly sight and/or short-term nature of amounts due to customers, their fair value is conventionally taken to be their carrying amount.

451
SECTION 3
Debt securities in issue – Line item 30
3.1 Debt securities in issue: breakdown by type
Type of transaction/ Banking Group Insurance companies Other companies 31/12/2008 31/12/2007Members of the group Book Fair Book Fair Book Fair Book Fair Book Fair value value value value value value value value value value
A. Listed securities – – – – – – – – – – 1. Bonds – – – – – – – – – – 1.1 structured – – – – – – – – – – 1.2 other – – – – – – – – – – 2. Other securities – – – – – – – – – – 2.1 structured – – – – – – – – – – 2.2 other – – – – – – – – – – B. Unlisted securities 5,971,162 6,283,428 – – – – 5,971,162 6,283,428 5,583,746 5,323,597 1. Bonds 5,695,140 6,007,406 – – – – 5,695,140 6,007,406 5,281,354 5,021,205 1.1 structured – – – – – – – – – – 1.2 other 5,695,140 6,007,406 – – – – 5,695,140 6,007,406 5,281,354 5,021,205 2. Other securities 276,022 276,022 – – – – 276,022 276,022 302,392 302,392 2.1 structured – – – – – – – – – – 2.2 other 276,022 276,022 – – – – 276,022 276,022 302,392 302,392
Total 5,971,162 6,283,428 – – – – 5,971,162 6,283,428 5,583,746 5,323,597

452
3.2 Detail of line item 30 “Debt securities in issue”: subordinated securities
31/12/2008 31/12/2007
Subordinated liabilities 781,877 788,096
The subordinated bonds classified in this table are analyzed below:
1 Bond with right of conversion into Banca Popolare di Vicenza ordinary shares: the bonds can be converted into
capital stock in a ratio of 2 shares of par value Euro 3.75 each for every bond of nominal value Euro 124 each. The conversion ratio will be changed in the event of a bonus increase in capital via the issue of shares. The right to convert can be exercised from 1 October 2010 to 31 December 2010. The shares delivered to the bondholders who decide to convert will have dividend and voting rights from 1 January 2011. Bondholders are entitled to convert early in the event of extraordinary operations involving capital, except for mergers with other companies in the Banca Popolare di Vicenza Group or with companies controlled by the issuer.
All the above subordinated bonds have an early redemption clause that allows the Issuer to redeem them early, not less than 18 months after the final date of placement, following prior authorization from the Bank of Italy and giving at least one month’s notice.
Furthermore, all the above bonds contain a subordination clause whereby, if the Issuer is wound up, they would be redeemed only after all other creditors, not subordinated to the same extent, have been satisfied.
All the above bonds are included in the calculation of the Bank’s regulatory capital, on the basis established in Circular 155 dated 18 December 1991 - XIIth update “Instructions for reporting regulatory capital and prudent parameters”.
Isin code Issue Maturity Rate Interest Nominal Book date rate value value IT0003444574 2-05-2003 2-05-2009 Fixed 2.25% 8,298 8,534 IT0003631659 23-03-2004 23-03-2011 Fixed 4.05% 9,777 9,883 IT0003631642 2-04-2004 2-04-2009 Fixed 3.64% 24,731 24,951 IT0003662498 21-05-2004 21-05-2010 Fixed 3.95% 23,359 23,460 IT0003699649 16-08-2004 16-08-2010 Fixed 4.10% 13,941 14,147 IT0003748511 30-11-2004 30-11-2011 Fixed 3.49% 48,932 48,987 XS0210870415 3-02-2005 3-02-2015 Floating Euribor3m + 0.45 200,000 201,383 IT0004189343 1 30-07-2007 30-07-2015 Fixed 2.15% 241,451 230,756 XS0336683254 20-12-2007 20-12-2017 Floating Euribor3m + 2.35 200,000 199,749 IT0003782684 15-12-2004 15-12-2011 Fixed 4.18% 19,990 20,027
Total 790,479 781,877

453

454
SECTION 4
Financial liabilities held for trading – Line item 40
4.1 Financial liabilities held for trading: breakdown by type Type of transaction/Members of the group Banking Group Insurance companies Other companies NV FV FV* NV FV FV* NV FV FV* Q NQ Q NQ Q NQ
A. Cash liabilities 1. Due to other banks – – – – – – – – – – – – 2. Due to customers – – – – – – – – – – – – 3. Debt securities in issue – – – – – – – – – – – – 3.1 Bonds – – – x – – – x – – – x 3.1.1 Structured – – – x – – – – – – – x 3.1.2 Other bonds – – – x – – – – – – – x 3.2 Other securities – – – x – – – x – – – x 3.2.1. Structured – – – x – – – – – – – x 3.2.2 Other – – – x – – – – – – – x Total A – – – – – – – – – – – –
B. Derivatives 1. Financial derivatives x – 644,778 x x – – x x – – x 1.1 For trading x – 595,850 x – – – – x – – x 1.2 Connected with the fair value option x – 48,928 x – – – – x – – x 1.3 Other x – – x – – – – x – – x 2. Credit derivatives x – – x x – – x x – – x 2.1 For trading x – – x – – – – x – – x 1.2 Connected with the fair value optionn x – – x – – – – x – – x 2.3 Other x – – x – – – – x – – x
Total B – – 644,778 – – – – – – – – –
Total (A+B) – – 644,778 – – – – – – – – –
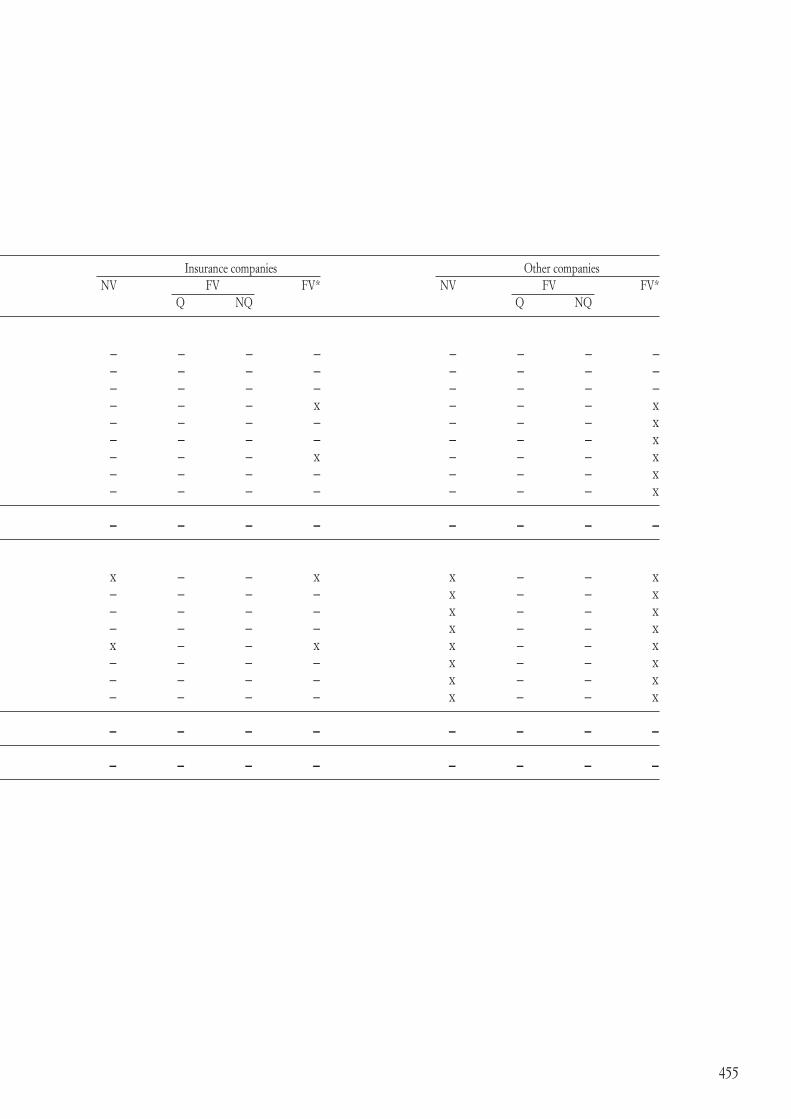
455
Type of transaction/Members of the group Banking Group Insurance companies Other companies NV FV FV* NV FV FV* NV FV FV* Q NQ Q NQ Q NQ
A. Cash liabilities 1. Due to other banks – – – – – – – – – – – – 2. Due to customers – – – – – – – – – – – – 3. Debt securities in issue – – – – – – – – – – – – 3.1 Bonds – – – x – – – x – – – x 3.1.1 Structured – – – x – – – – – – – x 3.1.2 Other bonds – – – x – – – – – – – x 3.2 Other securities – – – x – – – x – – – x 3.2.1. Structured – – – x – – – – – – – x 3.2.2 Other – – – x – – – – – – – x Total A – – – – – – – – – – – –
B. Derivatives 1. Financial derivatives x – 644,778 x x – – x x – – x 1.1 For trading x – 595,850 x – – – – x – – x 1.2 Connected with the fair value option x – 48,928 x – – – – x – – x 1.3 Other x – – x – – – – x – – x 2. Credit derivatives x – – x x – – x x – – x 2.1 For trading x – – x – – – – x – – x 1.2 Connected with the fair value optionn x – – x – – – – x – – x 2.3 Other x – – x – – – – x – – x
Total B – – 644,778 – – – – – – – – –
Total (A+B) – – 644,778 – – – – – – – – –

456
FV = Fair value FV* = Fair value calculated excluding the differences in value due to changes in the issuer’s credit rating VN = Nominal or notional valueQ = ListedNQ = Non Listed
Type of transaction/Members of the group 31/12/2008 31/12/2007 NV FV FV* NV FV FV* Q NQ Q NQ
A. Cash liabilities 1. Due to other banks – – – – – – – – 2. Due to customers – – – – – – – – 3. Debt securities in issue – – – – – – – – 3.1 Bonds – – – x – – – x 3.1.1 Structured – – – x – – – x 3.1.2 Other bonds – – – x – – – x 3.2 Other securities – – – x – – – x 3.2.1. Structured – – – x – – – x 3.2.2 Other – – – x – – – x
Total A – – – – – – – –
B. Derivatives 1. Financial derivatives x – 644,778 x x – 662,154 x 1.1 For trading x – 595,850 x x – 568,751 x 1.2 Connected with the fair value option x – 48,928 x x – 93,403 x 1.3 Other x – – x x – – x 2. Credit derivatives x – – x x – – x 2.1 For trading x – – x x – – x 1.2 Connected with the fair value option x – – x x – – x 2.3 Other x – – x x – – x
Total B – – 644,778 – – – 662,154 –
Total (A+B) – – 644,778 – – – 662,154 –

457
4.4 Financial liabilities held for trading: derivatives
4.4.1 Attributable to the banking group
Tipologia derivati/underlying assets Interest Currency Equities Loans Other 31/12/2008 31/12/2007 rates and gold
A) Listed derivatives 1. Financial derivatives – – – – – – – a) With exchange of capital – – – – – – – – Options issued – – – – – – – – Other derivatives – – – – – – – b) Without exchange of capital – – – – – – – – Options issued – – – – – – – – Other derivatives – – – – – – – 2. Credit derivatives – – – – – – – a) With exchange of capital – – – – – – – b) Without exchange of capital – – – – – – –
Total A – – – – – – –
B. Unlisted derivatives 1. Financial derivatives 599,489 25,989 15,222 – 4,078 644,778 662,154 a) With exchange of capital – 25,989 – – – 25,989 35,182 – Options issued – 8,013 – – – 8,013 8,714 – Other derivatives – 17,976 – – – 17,976 26,468 b) Without exchange of capital 599,489 – 15,222 – 4,078 618,789 626,972 – Options issued 185,435 – 15,222 – – 200,657 245,230 – Other derivatives 414,054 – – – 4,078 418,132 381,742 2. Credit derivatives – – – – – – – a) With exchange of capital – – – – – – – b) Without exchange of capital – – – – – – –
Total B 599,489 25,989 15,222 – 4,078 644,778 662,154
Total (A+B) 599,489 25,989 15,222 – 4,078 644,778 662,154

458
SECTION 5
Financial liabilities at fair value – Line item 50
5.1 Financial liabilities at fair value: breakdown by type
FV = Fair value FV* = Fair value calculated excluding the differences in value due to changes in the issuer’s credit rating VN = Nominal or notional valueQ = ListedNQ = Non Listed
Type of transaction/Amounts Banking Group Insurance companies Other companies NV FV FV* NV FV FV* NV FV FV* Q NQ Q NQ Q NQ
1. Due to other banks – – – – – – – – – – – – 1.1 Structured – – – x – – – – – – – – 1.2 Other – – – x – – – – – – – – 2. Due to customers – – – – – – – – – – – – 2.1 Structured – – – x – – – – – – – – 2.2 Other – – – x – – – – – – – – 3. Debt securities 3,161,615 – 3,273,188 – – – – – – – – – 3.1 Structured 711,990 – 711,758 x – – – – – – – – 3.2 Other 2,449,625 – 2,561,430 x – – – – – – – –
Total 3,161,615 – 3,273,188 – – – – – – – – –
Type of transaction/Amounts 31/12/2008 31/12/2007 NV FV FV* NV FV FV* Q NQ Q NQ
1. Due to other banks – – – – – – – – 1.1 Structured – – – – – – – – 1.2 Other – – – – – – – – 2. Due to customers – – – – – – – – 2.1 Structured – – – – – – – – 2.2 Other – – – – – – – – 3. Debt securities 3,161,615 – 3,273,188 – 2,594,185 – 2,545,976 – 3.1 Structured 711,990 – 711,758 – 933,679 – 893,102 – 3.2 Other 2,449,625 – 2,561,430 – 1,660,506 – 1,652,874 –
Total 3,161,615 – 3,273,188 – 2,594,185 – 2,545,976 –

459
“Debt securities” include own bonds correlated with derivative contracts that hedge interest rate risk, valued by applying the fair value option, as allowed by IAS 39.
5.2 Detail of line item 50 “Financial liabilities at fair value”: subordinated liabilities
31/12/2008 31/12/2007
Subordinated liabilities 160,011 38,886
The subordinated bonds classified in this line item are analyzed below:
Type of transaction/Amounts Banking Group Insurance companies Other companies NV FV FV* NV FV FV* NV FV FV* Q NQ Q NQ Q NQ
1. Due to other banks – – – – – – – – – – – – 1.1 Structured – – – x – – – – – – – – 1.2 Other – – – x – – – – – – – – 2. Due to customers – – – – – – – – – – – – 2.1 Structured – – – x – – – – – – – – 2.2 Other – – – x – – – – – – – – 3. Debt securities 3,161,615 – 3,273,188 – – – – – – – – – 3.1 Structured 711,990 – 711,758 x – – – – – – – – 3.2 Other 2,449,625 – 2,561,430 x – – – – – – – –
Total 3,161,615 – 3,273,188 – – – – – – – – –
Isin code Issue Maturity Rate Interest Nominal Book date rate value value IT0004015746 21-02-2006 21-02-2012 Fixed 3.78% 39,030 40,162 IT0004424351 15-12-2008 15-12-2015 Fixed 5.00% 115,497 119,849
Total 154,527 160,011

460
The subordinated bond with Isin code IT0004015746 has an early redemption clause that allows the Parent Bank to redeem it early, not less than 18 months after the final date of placement, following prior authorization from the Bank of Italy and giving at least one month’s notice.
Furthermore, all the above bonds contain a subordination clause whereby, if the Issuer is wound up, they would be redeemed only after all other creditors, not subordinated to the same extent, have been satisfied.
All the above bonds are included in the calculation of the Bank’s regulatory capital, on the basis established in Circular 155 dated 18 December 1991 - XIIth update “Instructions for reporting regulatory capital and prudent parameters”.
5.3 Financial liabilities at fair value: changes during the year
Due to other Due to Debt securities Total banks customers in issue
A. Opening balance – – 2,545,976 2,545,976
B. Increases – – 1,064,629 1,064,629 B.1 Issues – – 877,393 877,393 B.2 Sales – – 27,978 27,978 B.3 Positive changes in fair value – – 151,402 151,402 B.4 Other changes – – 7,856 7,856
C. Decreases – – 337,417 337,417 C.1 Purchases – – 50,472 50,472 C.2 Redemptions – – 281,084 281,084 C.3 Negative changes in fair value – – 1,763 1,763 C.4 Other changes – – 4,098 4,098
D. Closing balance – – 3,273,188 3,273,188
The “Positive and negative changes in fair value” (lines B.3 and C.3) are reported in line item 110 “Net change in financial assets and liabilities at fair value” of the income statement. These changes are almost entirely offset by the results of valuing the associated derivative contracts, also reported in the same line item of the income statement.
“Other changes” reported in lines B4. and C4. include trading profits and losses which are recognized in line item 110 “Net change in financial assets and liabilities at fair value ” of the income statement. Line C4. also includes Euro 5,416 in differentials between opening and closing coupons and between opening and closing issue discounts.

461
SECTION 6
Hedging derivatives – Line item 60
6.1 Hedging derivatives: analysis by type of contract and underlying asset
6.1.1 attributable to the banking group
This line item reports interest rate swaps with a negative fair value, taken out to hedge interest rate risk relating to a fixed-rate loan book.
Interest Currency Equity Loans Other Total rates and gold securities
A) Quoted derivatives 1. Financial derivatives – – – – – – a) With exchange of capital – – – – – – – Issued options – – – – – – – Other derivatives – – – – – – b) Without exchange of capital – – – – – – – Issued options – – – – – – – Other derivatives – – – – – – 2. Credit derivatives – – – – – – a) With exchange of capital – – – – – – b) Without exchange of capital – – – – – –
Total A – – – – – –
B. Unlisted derivatives 1. Financial derivatives 31,201 – – – – 31,201 a) With exchange of capital – – – – – – – Issued options – – – – – – – Other derivatives – – – – – – b) Without exchange of capital 31,201 – – – – 31,201 – Issued options – – – – – – – Other derivatives 31,201 – – – – 31,201 2. Credit derivatives – – – – – – a) With exchange of capital – – – – – – b) Without exchange of capital – – – – – –
Total B 31,201 – – – – 31,201
Total at 31/12/2008 31,201 – – – – 31,201
Total at 31/12/2007 – – – – – –

462
6.2 Hedging derivatives: analysis by hedged portfolio and type of hedge
6.2.1 attributable to the banking group
SECTION 7
Remeasurement of financial liabilities backed by macro hedges – Line item 70
Nothing has been classified in this section because the Group has not taken out any macro hedges against financial liabilities.
SECTION 8
Tax liabilities – Line item 80
Deferred tax liabilities are discussed in asset section 14.
Fair value Cash flow Specific Generic Specific Generic Interest Exchange Credit Price Multiple rate risk rate risk risk risk risk
1. Financial assets available for sale – – – – – x – x 2. Loans and receivables 31,201 – – x – x – x 3. Financial assets held to maturity x – – x – x – x 4. Portfolio x x x x x – x – 5. Foreign investments x x x x x x – x
Total assets 31,201 – – – – – – –
1. Financial liabilities – – – x x x – x 2. Portfolio x x x x x – x –
Total liabilities – – – – – – – –
1. Awaited transactions x x x x x x – –

463
SECTION 9
Liabilities associated with non-current assets held for sale – Line item 90
Nothing has been classified in this section.
SECTION 10
Other liabilities – Line item 100
10.1 Other liabilities: analysis
31/12/2008 31/12/2007
1. Miscellaneous security transactions 13,589 20,156 2. Employee salaries and contributions 58,735 60,579 3. Suppliers 55,812 57,708 4. Transactions in transit 196,529 85,849 5. Adjustments for non-liquid balances relating to the portfolio 163,410 169,058 6. Liability for risks on guarantees and commitments 5,572 4,606 7. Accrued expenses and deferred income not allocated to specific accounts 3,088 7,514 8. Other miscellaneous items 146,358 148,274 9. Differences on elimination 1,972 6,185
Total 645,065 559,929
Transactions in transit refer to positions taken in the last few days of the year, almost all of which settled in the first few days of the new year.

464
SECTION 11
Provision for severance indemnities – Line item 110
11.1 Severance indemnities: changes during the year
Banking Insurance Other 31/12/2008 31/12/2007 group companies companies
A. Opening balance 82,329 82,329 88,672
B. Increases 6,441 – – 6,441 94 B.1 Provisions 6,312 6,312 (3,511) B.2 Other increases 129 129 3,605
C. Decreases 5,894 – – 5,894 6,437 C.1 Payments made 5,502 5,502 5,631 C.2 Other decreases 392 392 806
D. Closing balance 82,876 – – 82,876 82,329 According to IFRIC, the provision for severance indemnities is a “post-employment benefit” qualifying as a “defined-benefit plan”, the value of which according to IAS 19 must be determined on an actuarial basis. As a consequence, the year-end valuation of this amount was carried out by an independent actuary using the projected unit credit method with reference to earned benefits. This method involves the projection of future payments with reference to historical and statistical analyses and probabilities, adopting suitable demographic techniques. This makes it possible to calculate the severance indemnities accruing at a specific date on an actuarial basis, distributing the cost over the entire remaining service of the current workforce, and no longer presenting them as a cost payable as if the business were to cease trading on the balance sheet date.
The 2007 Finance Act (Law 296 of 27 December 2006) brought forward to 1 January 2007 the effective date of new pension fund legislation (Decree 252/2005). As a result of the new legislation, provisions for severance indemnities from that date are being paid into external pension funds or, at the employee’s specific request, into the specific fund set up under the same law and managed by INPS (Italy’s social security agency). Given the above, the provision for severance indemnities is therefore “static”, representing the amount accruing for employees up until 1 January 2007.
The valuation performed at 31 December 2008 has revealed a difference of Euro 6.8 million between severance indemnities calculated on an actuarial basis and those calculated under prevailing law and collective payroll agreements.

465
SECTION 12
Provisions for risks and charges – Line item 120
12.1 Provisions for risks and charges: analysis
Items/Amounts Banking Insurance Other 31/12/2008 31/12/2007 group companies companies
1. Pensions and similar commitments 8,643 – – 8,643 9,191 2. Other provisions 83,137 – – 83,137 99,484 2.1 legal disputes 49,708 – – 49,708 43,811 2.2 personnel expenses 13,745 – – 13,745 13,524 2.3 other 19,684 – – 19,684 42,149 Total 91,780 – – 91,780 108,675
Provisions for pensions and similar charges refer to the Supplementary Section of the pension fund operated by Cariprato SpA, more details of which can be found in note 12.3. The Capitalization Section of this fund is a defined-contribution plan and so is not reported in the balance sheet, in compliance with IAS 19.

466
12.2 Provisions for risks and charges: changes during the year
Line B.1 “Provisions” comprises:• Euro11,938inprovisionsforfuturepersonnelexpensesrelatingtotheemployeeincentive
scheme, the matching entry to which is reported in “Payroll” (line item 180 a) of the income statement);
• Euro22,464inprovisionsrelatingtolegaldisputesandsundrycharges,thematchingentryto which is reported in “Net provisions for risks and charges” (line item 190 of the income statement);
“Other increases” reported in line B.4 in relation to “Other provisions” reflect Euro 1,343 for the portion of 2007 net income allocated to the provision for charitable donations, aid and works in the public interest, while the related utilizations of Euro 1,869 are included in “Other decreases” in line C.3.
12.3 Defined-benefit company pension funds
1. Description of funds
Cassa di Risparmio di Prato operates a supplementary pension fund for employees under an agreement signed on 30 June 1998 with the unions and its employees. This Fund, restricted under article 2117 of the Italian Civil Code and governed by specific regulations, is divided into two Sections:• the Capitalization Section which guarantees supplementary pension benefits on a defined-
contribution basis, requiring the bank to pay an annual amount calculated with reference to the taxable base used for determining severance indemnity;
• the defined-benefit Supplementary Section, which is described in this note.
The Supplementary Section represents the continuation, under current rules, of the original Fund set up under an in-house agreement dated 27 June 1972 to supplement the benefits
Items/Amounts Banking Group Insurance companies Other companies Total Pensions Other Total Pensions Other Total Pensions Other Total Pensions Other Total provisions provisions provisions provisions
A. Opening balance 9,191 99,484 108,675 – – – – – – 9,191 99,484 108,675
B. Increases 402 36,014 36,416 – – – – – – 402 36,014 36,416 B.1 Provisions – 34,402 34,402 – – – – – – – 34,402 34,402 B.2 Changes due to the passage of time – – – – – – – – – – – – B.3 Changes due to variations in the discount rate – 269 269 – – – – – – – 269 269 B.4 Other changes 402 1,343 1,745 – – – – – – 402 1,343 1,745
C. Decreases 950 52,361 53,311 – – – – – – 950 52,361 53,311 C.1 utilization during the year 950 49,577 50,527 – – – – – – 950 49,577 50,527 C.2 Changes due to variations in the discount rate – – – – – – – – – – – – C.3 Other changes – 2,784 2,784 – – – – – – – 2,784 2,784
D. Closing balance 8,643 83,137 91,780 – – – – – – 8,643 83,137 91,780

467
payable by INPS. Its participants comprise persons who were already pensioners as of 1 July 1998, as well as the employees of the bank at 1 May 1981 who opted to remain in the Supplementary Section on 1 July 1998.
The Fund guarantees pension benefits to members that supplement those paid by INPS under the obligatory national scheme. These benefits can represent up to 75% of the last pensionable salary received (after 35 years of service). As of 31 December 2008, the Supplementary Section’s participants comprise 4 bank employees and 141 pensioners. The Fund’s financial statements have been prepared in accordance with IAS 19.
2. Changes in funds during the year
The opening and closing balances of the present value of the defined benefit obligation are reconciled below, indicating the effects of changes during the year:
Description Mathematical reserve
Reserve at 31.12.2007 9,011 Net earnings of the Fund 400 Cost 2 Payments made (950)Actuarial profit (loss) - 2008 25 Reserve at 31.12.2008 8,488
under IAS 19, the Fund made an actuarial loss during 2008, as represented by the difference between the size of the Fund as of 31 December 2008 and the reserve calculated at that date.
Art. 8 of the Fund Regulations state that in the event of consistent surpluses in the Fund’s assets over its mathematical reserve, the contracting parties will seek appropriate solutions by using these surpluses essentially for the provision of benefits to pensioners. In compliance with this
Items/Amounts Banking Group Insurance companies Other companies Total Pensions Other Total Pensions Other Total Pensions Other Total Pensions Other Total provisions provisions provisions provisions
A. Opening balance 9,191 99,484 108,675 – – – – – – 9,191 99,484 108,675
B. Increases 402 36,014 36,416 – – – – – – 402 36,014 36,416 B.1 Provisions – 34,402 34,402 – – – – – – – 34,402 34,402 B.2 Changes due to the passage of time – – – – – – – – – – – – B.3 Changes due to variations in the discount rate – 269 269 – – – – – – – 269 269 B.4 Other changes 402 1,343 1,745 – – – – – – 402 1,343 1,745
C. Decreases 950 52,361 53,311 – – – – – – 950 52,361 53,311 C.1 utilization during the year 950 49,577 50,527 – – – – – – 950 49,577 50,527 C.2 Changes due to variations in the discount rate – – – – – – – – – – – – C.3 Other changes – 2,784 2,784 – – – – – – – 2,784 2,784
D. Closing balance 8,643 83,137 91,780 – – – – – – 8,643 83,137 91,780

468
rule, the overall accumulated actuarial profit of Euro 155 thousand at 31 December 2008 has not been released to the bank’s income statement. The Fund’s assets are all invested in liquid assets.
3. Changes in year in plan assets and other information
The liquid assets in which the Fund’s cash balances are invested decreased from Euro 9,191 thousand at 31 December 2007 to Euro 8,643 thousand at 31 December 2008. Decreases reflect the payment of Euro 950 thousand in pensions, while increases refer to Euro 402 thousand in interest income earned on cash balances.
4. Reconciliation between present value of the fund, present value of plan assets and assets and liabilities reported in the balance sheet
There are no differences between the present value of plan assets and the assets and liabilities reported in the balance sheet since all the fund’s resources are invested in liquid assets.
5. Description of principal actuarial assumptions
The amount of the supplementary fund in relation to the obligations to its participants is reviewed once a year by an independent actuary.
The principal actuarial assumptions adopted for the latest calculation of the mathematical reserve at 31 December 2008 are set out below.
This valuation has been made using the demographic, economic and financial assumptions described below.
Demographic assumptions
The following criteria have been adopted:• probability of death of current employees and pensioners: mortality rates applying to
the Italian population published by ISTAT in 2002; in the case of underage orphans the probability was assumed to be zero;
• probabilityofterminationofserviceforabsoluteandpermanentdisability:probabilitiesadopted by the Treasury Ministry’s Pension Institutes, published in the report for 1969, reduced to 75% of the original amount;
• ageofretirement:ithasbeenassumedthatactiveemployeeswhodonot“dieinservice”or “retire for intervening disability” stop working as soon as they reach the minimum pensionable age/length of service established by current retirement legislation in Italy. As stated in the introduction, no person may receive benefits unless they also qualify for a pension payable by INPS;
• calculationofindirectexpensesandofreversibility:thecalculationreferstothecompositionof the average surviving family unit, depending on sex and age of the pensioner’s death, and the number of years since death. The probabilities of marriage (by sex and age) and the probabilities of fertility (by age of the female and by order of birth of the children) have been taken from the ISTAT “Marriage tables” (1971) and from the ISTAT “Female fertility survey” (1974), with appropriate adjustments to take account of social changes in the past twenty years. In order to take account of the changes introduced by Law 335/1995 on the accumulation of surviving spouse pensions and beneficiary income, the pension payable by INPS to surviving spouses has been reduced to 60% (based on information obtained in

469
relation to a major bank). • typesofremuneration:thesehavebeentaken,withsuitablestandardization,fromactual
statistics relating to the staff of a bank at 31 December 1995, split between the four categories: managers and officials, male middle managers and clerical staff, female middle managers and clerical staff, subordinate and auxiliary staff. Since Cariprato only has a limited number of employees, it was not considered to be a source of sufficiently significant data.
Economic and financial assumptions
The following rates have been adopted:• technicaldiscountingrate:3.5%• annualinflationrate:2%• annualrateofsalaryincreases:2.25%• annualgrowthinnominalGDP(art.1.9Law335/1995):3%
6. Comparative information
The present value of the defined-benefit obligation and the fair value of the plan assets and the plan’s surplus or deficit are presented for the current year and six previous ones:
Present value Fair value Surplus assets or (Deficit)
2002 14,008 14,092 16 2003 12,834 12,904 30 2004 11,515 11,761 178 2005 10,600 10,717 113 2006 9,638 9,842 204 2007 9,011 9,191 180 2008 8,488 8,643 155
Like in the past, the fund’s surplus relative to its mathematical reserve means that it is currently not expected to have to make any new provisions in 2009.
12.4 Provisions for risks and charges– other provisions
The information required by paras. 85 and 86 of IAS 37 is provided below for each category of contingent liability.
The provision for legal disputes relates to contingencies associated with claims against the Group and from the liquidators of bankrupt companies.
The provision for employment costs refers to the incentive scheme and productivity bonuses for employees.
The other provisions for risks and charges relate to complaints from customers, fiscal disputes and other sundry charges.
Recent assessment indicates that the above contingencies are likely to be settled within the next 12/18 months. Consequently, the charges associated with the above liabilities have not been discounted since the effect would not be significant.

470
SECTION 13
Technical reserves
Nothing has been classified in this section.
SECTION 14
Redeemable shares – Line item 150
Nothing has been classified in this section.
SECTION 15
15.1 Group equity – Line items 140, 160, 170, 180, 190 and 220
15.1 Group equity: analysis
Items/Amounts 31/12/2008 31/12/2007
1. Capital stock 261,460 261,656 2. Additional paid-in capital 1,960,355 1,963,297 3. Reserves 392,812 324,487 4. (Treasury shares): (96,981) – a) Parent Bank (96,981) – b) subsidiaries – – 5. Valuation reserves 90,362 66,081 6. Equity instruments 13,104 13,630 7. Net income for the year pertaining to the Group 108,739 113,731 Total 2,729,851 2,742,882
The “reserves” included in line 3 comprise the pre-existing profit reserves (legal reserve, statutory reserve, extraordinary reserve, reserve for the purchase of treasury shares etc.), as well as the positive and negative reserves associated with the transition to IAS/IFRS not classified in the other equity accounts. They also include the reserve for general banking risks recorded pursuant to the former Decree 87/92 which, in accordance with IAS, has been reclassified as part of equity.
The “valuation reserves” reported in line 5 include the reserves arising on the valuation of property, land and works of art at fair value rather than cost, on the first-time adoption of

471
IAS/IFRS, together with the valuation reserves relating to AFS financial assets and the monetary revaluation reserves.“Equity instruments” reported in line 6 relate to the equity component embedded in the “BPVi 13.a emissione 2007-2015” convertible bond issued by the Parent Bank which, in accordance with IAS 32, has been separated and classified in equity, net of tax.
15.2 “Capital stock” and “Treasury shares”: analysis 31/12/2008 31/12/2007
– Treasury shares 69,722,736 69,775.066 – Nominal value euro 3.75 euro 3.75
15.3 Capital stock - Number of shares issued by the Parent Bank: changes during the year
Items/Types Ordinary Other
A. Treasury shares at the beginning of the year 69,775,066 – – fully paid 69,775,066 – – not fully paid – – A.1 Treasury shares (-) – –
A.2 Outstanding shares: opening balance 69,775,066 –
B. Increases 3,601,004 – B.1 New issues 5,620 – – payment:: – – – business combinations – – – conversion of bonds – – – exercise of warrants – – – other – – – bonus: 5,620 – – to employees 5,620 – – to directors – – – other – – B.2 Sale of treasury shares 3,595,384 – B.3 Other changes – –
C. Decreases 5,269,680 – C.1 Cancellation 57,950 – C.2 Purchase of treasury shares 5,211,730 – C.3 Disposal of companies – – C.4 Other changes – –
D. Outstanding shares: closing balance 68,106,390 –
D.1 Treasury shares (+) 1,616,346 – D.2 Treasury shares at the end of the year 69,722,736 – – fully paid 69,722,736 – – not fully paid – –

472
15.6 Valuation reserves: analysis
Items/Amounts Banking Insurance Other 31/12/2008 31/12/2007 group companies companies
1. Financial assets available for sale 4,001 – – 4,001 (72,633)2. Property, plant and equipment – – – – – 3. Intangible assets – – – – – 4. Hedges of foreign investments – – – – – 5. Cash-flow hedges – – – – – 6. Exchange differences – – – – – 7. Non-current assets held for sale – – – – – 8. Special revaluation laws 86,361 – – 86,361 138,714
Total 90,362 – – 90,362 66,081
15.7 Valuation reserves: changes during the year
15.7.1 attributable to the banking group
15.8 Valuation reserves - AFS financial assets: analysis
Financial Property, Intangible Hedges Cash-flow Exchange Non-current Special assets available plant and assets of foreign hedges differences assets held revaluation for sale equipment investments for sale laws
A. Opening balance (72,633) – – – – – – 138,714
B. Increases 125,847 – – – – – – – B.1 Increases in fair value 35,101 – – – – – – – B.2 Other changes 90,746 – – – – – – –
C. Decreases 49,213 – – – – – – 52,353 C.1 Decreases di fair value 35,370 – – – – – – – C.2 Other changes 13,843 – – – – – – 52,353
D. Closing balance 4,001 – – – – – – 86,361
Assets/Amounts Banking Group Insurance companies Other companies 31/12/2008 31/12/2007 Positive Negative Positive Negative Positive Negative Positive Negative Positive Negative reserve reserve reserve reserve reserve reserve reserve reserve reserve reserve
1. Debt securities 4,042 (32,636) – – – – 4,042 (32,636) 5,398 (26,517)2. Equities 40,731 (2,794) – – – – 40,731 (2,794) 17,467 (68,064)3. Mutual funds 937 (6,279) – – – – 937 (6,279) 689 (1,606)4. Loans – – – – – – – – – –
Total 45,710 (41,709) – – – – 45,710 (41,709) 23,554 (96,187)

473
This table reports the positive and negative reserves, net of tax, arising on the fair value measurement of financial assets available for sale.
The negative reserve for debt securities includes Euro 34,953 in residual value of the valuation reserve calculated on the basis of the fair value at the reclassification date (1 July 2008) of securities reclassified from “Financial assets available for sale”, under the amendment to IAS 39 “Financial instruments: recognition and measurement” contained in the “Reclassification of Financial Assets” published by the IASB on 13 October 2008 and endorsed by the European Commission on 15 October 2008 with Regulation CE 1004/2008, as discussed more fully in the specific section in the report on operations.
15.9 Valuation reserves - AFS financial assets: changes during the year
15.9.1 attributable to the banking group
Debt securities Equities Mutual funds Loans
1. Opening balance (21,119) (50,597) (917) –
2. Positive changes 19,217 103,161 3,469 – 2.1 Increases in fair value 5,045 29,237 819 – 2.2 Release to the income statement of negative reserves: 3,826 2,017 612 – – from impairment 217 1,490 612 – – from disposals 3,609 527 – – 2.3 Other changes 10,346 71,907 2,038 –
3. Negative changes 26,692 14,627 7,894 – 3.1 Negative changes in fair value 23,808 4,130 7,432 – 3.2 Impairment writedowns – – – – 3.3 Release to the income statement of negative reserves: from disposals 772 3,953 – – 3.4 Other changes 2,112 6,544 462 –
4. Closing balance (28,594) 37,937 (5,342) –
Lines 2.3 and 3.4 report the positive and negative tax changes respectively in respect of movements in the year in the valuation reserve for AFS financial assets.
Line 2.3 in relation to equities also includes the release of the valuation reserve relating to the interest in Cattolica Assicurazione reported in the financial statements at 31 December 2007 (Euro 65,701), after this interest was reclassified in the year to “Equity investments”, as already discussed in Section 4 of these notes. Lastly, line 2.3 in relation to debt securities includes Euro 6,581 in amortization of reserves relating to “Financial assets available for sale” reclassified to “Loans”; this amortization is being calculated using the effective interest method over the residual life of the investment and is recorded in line item 10 “Interest income and similar revenues” of the income statement as a deduction from the interest income on the same securities, in compliance with para. 54 (a) of IAS 39.

474
SECTION 16
Minority interests – Line item 210
16.1 Minority interests: analysis
Banking Insurance Other 31/12/2008 31/12/2007 group companies companies
1. Capital stock 53,851 – – 53,851 46,323 2. Additional paid-in capital 6,367 – – 6,367 6,371 3. Reserves 28,827 – – 28,827 26,762 4. (Treasury shares) – – – – – 5. Valuation reserves 62 – – 62 10,744 6. Equity instruments – – – – – 7. Net income (loss) for the year pertaining to minority interests 2,316 – – 2,316 3,809
Total 91,423 – – 91,423 94,009
16.2 Valuation reserves: analysis
Banking Insurance Other 31/12/2008 31/12/2007 group companies companies
1. Financial assets available for sale 26 – – 26 155 2. Property, plant and equipment – – – – – 3. Intangible assets – – – – – 4. Hedges of foreign investments – – – – – 5. Cash-flow hedges – – – – – 6. Exchange differences – – – – – 7. Non-current assets held for sale – – – – – 8. Special revaluation laws 36 – – 36 10,589
Total 62 – – 62 10,744

475
16.4 Valuation reserves - AFS financial assets: analysis
16.5 Valuation reserves: changes during the year
16.5.1 attributable to the banking group
Assets/Value Banking Group Insurance companies Other companies 31/12/2008 31/12/2007 Positive Negative Positive Negative Positive Negative Positive Negative Positive Negative reserve reserve reserve reserve reserve reserve reserve reserve reserve reserve
1. Debt securities 26 (90) – – – – 26 (90) 32 (1)2. Equities 186 (51) – – – – 186 (51) 186 (33)3. Mutual funds 4 (49) – – – – 4 (49) – (29)4. Loans – – – – – – – – – –
Total 216 (190) – – – – 216 (190) 218 (63)
Financial Property, Intangible Hedges Cash-flow Exchange Non-current Special assets available plant and assets of foreign hedges differences assets held revaluation for sale equipment investments for sale laws
A. Opening balance 155 – – – – – – 10,589
B. Increases 240 – – – – – – – B.1 Increases in fair value 122 – – – – – – – B.2 Other changes 118 – – – – – –
C. Decreases 369 – – – – – – 10,553 C.1 Decreases in fair value 280 – – – – – – – C.2 Other changes 89 – – – – – – 10,553
D. Closing balance 26 – – – – – – 36

476
OTHER INFORMATION
1. Guarantees given and commitments
Operations Banking Insurance Other 31/12/2008 31/12/2007 group companies companies
1) Financial guarantees 539,087 – – 539,087 466,421 a) Banks 298 – – 298 286 b) Customers 538,789 – – 538,789 466,135 2) Commercial guarantees 883,498 – – 883,498 736,156 a) Banks 53,417 – – 53,417 37,233 b) Customers 830,081 – – 830,081 698,923 3) Irrevocable commitments to make loans 1,825,729 – – 1,825,729 1,749,935 a) Banks 180,080 – – 180,080 245,703 i) certain to be called on 158,724 – – 158,724 230,602 ii) not certain to be called on 21,356 – – 21,356 15,101 b) Customers 1,645,649 – – 1,645,649 1,504,232 i) certain to be called on 1,463 – – 1,463 58,389 ii) not certain to be called on 1,644,186 – – 1,644,186 1,445,843 4) Commitments underlying credit derivatives:protection sold – – – – – 5) Assets lodged to guarantee the commitments of third parties – – – – – 6) Other commitments 1,825,455 – – 1,825,455 1,402,656
Total 5,073,769 – – 5,073,769 4,355,168
“Other commitments” include the put options on debt securities and equities issued by the Group, as well as undrawn revocable credit lines.
2. Assets pledged to guarantee own liabilities and commitments
Portfolio 31/12/2008 31/12/2007
1. Financial assets held for trading 17,383 113,186 2. Financial assets at fair value – – 3. Financial assets available for sale 82,869 237,414 4. Financial assets held to maturity 5,140 – 5. Loans and advances to banks 684,228 – 6. Loans and advances to customers 1,155,603 – 7. Property, plant and equipment – –
The increase in assets pledged in guarantee mostly refers to asset backed securities relating to own transactions repurchased/subscribed in the year and the bonds issued by Mediobanca, used for refinancing at the Central European Bank and/or lodged with the Bank of Italy to guarantee the Group’s daily settlements.

477
5. Administration and dealing on behalf of third parties
Type of service 31/12/2008 31/12/2007
1. Trading in financial instruments on behalf of third parties 3,528,432 6,849,449 a) Purchases 1,335,970 3,064,071 1. Settled 1,323,415 3,059,573 2. unsettled 12,555 4,498 b) Sales 2,192,462 3,785,378 1. Settled 2,178,370 3,778,926 2. unsettled 14,092 6,452 2. Private portfolios under management 4,541,174 5,851,922 a) Individual 4,333,318 5,211,861 b) Collective 207,856 640,061 3. Custody and administration of securities 19,794,363 17,248,026 a) Third-party securities on deposit: associated with activities as a custodian bank (excluding portfolio management) 1,162,525 1,244,069 1. securities issued by consolidated companies – – 2. other securities 1,162,525 1,244,069 b) Third party securities in custody (excluding portfolio management): other 15,741,611 14,881,354 1. securities issued by consolidated companies 5,362,271 4,052,570 2. other securities 10,379,340 10,828,784 c) Third-party securities on deposit with third parties 16,206,699 15,474,267 d) Own securities on deposit with third parties 2,890,227 1,122,603 4. Other transactions – –

478

479
Part CINFOrMatION ON tHE CONSOLIDatED INCOME StatEMENt
SECtION 1
Interest – Line items 10 and 20
1.1 Interest income and similar revenues: analysis
1.1.1 attributable to the banking group
1.1.2 attributable to insurance companies
Items/technical forms technical forms Non-performnig Other assets 31/12/2008 31/12/2007 Debt securities Loans assets 1. Financial assets held for trading 6,852 – – – 6,852 16,288 2. Financial assets at fair value 2,189 – – – 2,189 2,102 3. Financial assets available for sale 22,030 – – – 22,030 42,650 4. Financial assets held to maturity 1,288 – – – 1,288 2,243 5. Loans and advances to banks 13,514 77,797 – – 91,311 77,771 6. Loans and advances to customers 10,612 1,283,475 697 – 1,294,784 1,002,158 7. Hedging derivatives x x x 294 294 – 8. Financial assets sold but not derecognized – 114,612 – – 114,612 100,652 9. Other assets x x x 192 192 240
Total 56,485 1,475,884 697 486 1,533,552 1,244,104
Items/technical forms technical forms Non-performnig Other assets 31/12/2008 31/12/2007 Debt securities Loans assets 1. Financial assets held for trading – – – – – 11,674 2. Financial assets at fair value – – – – – 100 3. Financial assets available for sale – – – – – – 4. Financial assets held to maturity – – – – – – 5. Loans and advances to banks – – – – – 282 6. Loans and advances to customers – – – – – – 7. Hedging derivatives – – – – – – 8. Financial assets sold but not derecognized – – – – – – 9. Other assets – – – – – –
Total – – – – – 12,056

480
1.2 Interest income and similar revenues: differentials relating to hedging transactions
Line items/Segments Banking Insurance Other 31/12/2008 31/12/2007 group companies companies A. Positive differentials relating to:a.1 Specific hedges of asset fair value 294 – – 294 – a.2 Specific hedges of liability fair value – – – – – a.3 Portfolio hedges of interest rate risk – – – – – a.4 Specific hedges of asset cash flows – – – – – a.5 Specific hedges of liability cash flows – – – – – a.6 Portfolio hedges of cash flows – – – – –
Total positive differentials (A) 294 – – 294 –
B. Negative differential relating to B.1 Specific hedges of asset fair value – – – – – B.2 Specific hedges of liability fair value – – – – – B.3 Portfolio hedges of interest rate risk – – – – – B.4 Specific hedges of asset cash flows – – – – – B.5 Specific hedges of liability cash flows – – – – – B.6 Portfolio hedges of cash flows – – – – –
Total negative differentials (B) – – – – –
C. Balance (A–B) 294 – – 294 –
1.3 Interest income and similar revenues: other information
1.3.1 Interest income on foreign currency financial assets
31/12/2008 31/12/2007
a) on foreign currency assets 17,213 22,279

481
1.4 Interest expense and similar charges: analysis
1.4.1 attributable to the banking group
Line items/technical forms Payables Securities Other 31/12/2008 31/12/2007 liabilities 1. Deposits from banks (149,760) X – (149,760) (115,405)2. Due to customers (246,170) X – (246,170) (170,467)3. Debt securities in issue X (274,548) – (274,548) (210,451)4. Financial liabilities held for trading – – (26,922) (26,922) (10,631)5. Financial liabilities at fair value – (111,978) – (111,978) (79,273)6. Financial liabilities associated with assets sold but not derecognized (71,224) – – (71,224) (79,181)7. Other liabilities X X – – – 8. Hedging derivatives X X – – –
Total (467,154) (386,526) (26,922) (880,602) (665,408)
1.4.2 attributable to insurance companies
Line items/technical forms Payables Securities Other 31/12/2008 31/12/2007 liabilities 1. Deposits from banks – – – – –2. Due to customers – – – – –3. Debt securities in issue – – – – –4. Financial liabilities held for trading – – – – –5. Financial liabilities at fair value – – – – (916)6. Financial liabilities associated with assets sold but not derecognized – – – – –7. Other liabilities – – – – – 8. Hedging derivatives – – – – –
Total – – – – (916)
1.6 Interest expense and similar charges: other information
1.6.1 Interest expense on foreign currency liabilities
31/12/2008 31/12/2007
a) on foreign currency liabilities (17,127) (22,280)

482
SECtION 2
Commissions – Line items 40 and 50
2.1 Fee and commission income: analysis
2.1.1 attributable to the banking group
type of service/Segments 31/12/2008 31/12/2007
a) Guarantees given 12,442 11,011 b) Credit derivatives – – c) Management, intermediation and advisory services: 143,341 148,342 1. trading in financial instruments 4,060 3,025 2. foreign currency trading 10,698 10,626 3. portfolio management 15,862 24,404 3.1 individual 12,460 18,325 3.2 collective 3,402 6,079 4. custody and administration of securities 3,012 2,407 5. custodian bank 1,315 1,576 6. placement of securities 31,300 42,368 7. acceptance of orders 8,068 9,979 8. advisory services 5,889 6,084 9. distribution of third party services 63,137 47,873 9.1 portfolio management 496 486 9.1.1 individual 5 51 9.1.2 collective 491 435 9.2 insurance products 25,573 16,474 9.3 other products 37,068 30,913 d) Collection and payment services 17,474 17,512 e) Services for securitizations 4,646 4,650 f) Services for factoring transactions – – g) tax collection services – –h) Other services 122,418 115,654
Total 300,321 297,169

483
2.1.2 attributable to insurance companies
type of service/Segments 31/12/2008 31/12/2007
a) Guarantees given – – b) Credit derivatives – – c) Management, intermediation and advisory services: – 7,339 1. trading in financial instruments – – 2. foreign currency trading – – 3. portfolio management – – 3.1 individual – – 3.2 collective – – 4. custody and administration of securities – – 5. custodian bank – – 6. placement of securities – – 7. acceptance of orders – – 8. advisory services – – 9. distribution of third party services – 7,339 9.1 portfolio management – – 9.1.1 individual – – 9.1.2 collective – – 9.2 insurance products – 7,339 9.3 other products – – d) Collection and payment services – – e) Services for securitizations – – f) Services for factoring transactions – – g) tax collection services – – h) Other services – –
Total – 7,339
2.2 Fee and commission income: product and service distribution channels: banking group
Channels/Segments 31/12/2008 31/12/2007
a) At own branches: 104.748 109.206 1. portfolio management 15.862 24.404 2. placement of securities 29.899 40.731 3. third-party products and services 58.987 44.071 b) Door-to-door: 5.551 5.439 1. portfolio management – – 2. placement of securities 1.401 1.637 3. third-party products and services 4.150 3.802 c) Other distribution channels: – – 1. portfolio management – – 2. placement of securities – – 3. third-party products and services – –

484
2.2.1 Fee and commission income: product and service distribution channels: insurance companies
Channels/Segments 31/12/2008 31/12/2007
a) At own branches: – 7,339 1. portfolio management – – 2. placement of securities – – 3. third-party products and services – 7,339 b) Door-to-door: – – 1. portfolio management – – 2. placement of securities – – 3. third-party products and services – – c) Other distribution channels: – – 1. portfolio management – – 2. placement of securities – – 3. third-party products and services – –
2.3 Fee and commission expense: analysis
2.3.1 attributable to the banking group
Services/Segments 31/12/2008 31/12/2007
a) Guarantees received (112) (117)b) Credit derivatives – – c) Management and dealing services (9,165) (9,573) 1. trading in financial instruments (1,362) (1,743) 2. trading in foreign currency (348) (306) 3. portfolio management: (1,183) (827) 3.1 own portfolio (1,183) (827) 3.2 third-party portfolio – – 4. custody and administration of securities (98) – 5. placement of financial instruments (1,381) (1,269) 6. door-to-door distribution of financial instruments, products and services (4,793) (5,428)d) Collection and payment services (4,922) (5,823)e) Other services (14,268) (14,617)
Total (28,467) (30,130)

485
2.3.2 attributable to insurance companies
Services/Segments 31/12/2008 31/12/2007
a) Guarantees received – – b) Credit derivatives – – c) Management and dealing services – – 1. trading in financial instruments – – 2. trading in foreign currency – – 3. portfolio management: – – 3.1 own portfolio – – 3.2 third-party portfolio – – 4. custody and administration of securities – – 5. placement of financial instruments – – 6. door-to-door distribution of financial instruments, products and services – – d) Collection and payment services – – e) Other services – (8,962)
Total – (8,962)

486
SECtION 3
Dividend and similar income – Line item 70
3.1 Dividend and similar income: analysis
Income from mutual funds classified as “Financial assets held for trading” relate to the income distributed by the BPVi Giada Equity closed-end fund and related tax credit, while income from mutual funds classified as “Financial assets available for sale” includes Euro 3,814 in income distributed by the Nem Imprese closed-end fund and related tax credit.
Items/Income Banking group Insurance companies Other companies 31/12/2008 31/12/2007 Dividends Income Dividends Income Dividends Income Dividends Income Dividends Income from from from from from mutual funds mutual funds mutual funds mutual funds mutual funds
a. Financial assets held for trading 965 10,541 – – – – 965 10,541 28,479 4,071 B. Financial assets available for sale 13,378 4,230 – – – – 13,378 4,230 6,274 – C. Financial assets at fair value – – – – – – – – – – D. Equity investments – X – – – X – X – X
Total 14,343 14,771 – – – – 14,343 14,771 34,753 4,071

487
SECtION 4
Net trading income – Line item 80
4.1 Net trading income: analysis
4.1.1 attributable to the banking group
transactions/Income items Gains trading Losses trading Net profits losses result 1. Financial assets held for trading 281 3,605 (12,937) (16,488) (25,539) 1.1 Debt securities 259 3,090 (10,414) (3,528) (10,593) 1.2 Equities 22 490 (1,657) (7,684) (8,829) 1.3 Mutual funds – 25 (866) (5,276) (6,117) 1.4 Loans – – – – – 1.5 Other – – – – –
2. Financial liabilities held for trading – – – – – 2.1 Debt securities – – – – – 2.2 Payables – – – – – 2.3 Other – – – – –
3. Other financial assets and liabilities: exchange differences X X X X 15,079
4. Derivatives 615,791 829,965 (627,566) (814,059) (2,766) 4.1 Financial derivatives: 615,791 829,965 (627,566) (814,059) (2,766) – on debt securities and interest rates 586,249 779,533 (598,024) (765,795) 1,963 – on equities and equity indices 29,542 50,432 (29,542) (48,264) 2,168 – on currency and gold X X X X (6,897) – other – – – – – 4.2 Credit derivatives – – – – – Total 616,072 833,570 (640,503) (830,547) (13,226)
this line item includes the net result up the reclassification date (1 July 2008) on financial instruments for which the Group has taken up the option permitted by the amendments to IaS 39, discussed earlier.
trading profits (losses) and valuation gains (losses) relating to financial derivatives are presented on an open account basis for each individual financial instrument.

488
SECtION 5
Net hedging gains (losses) – Line item 90
5.1 Net hedging gains (losses): analysis
Income items/amounts Banking Insurance Other 31/12/2008 31/12/2007 group companies companies
A Income on:a.1 Fair value hedging derivatives – – – – – a.2 Hedged financial assets (fair value) 31,662 – – 31,662 – a.3 Hedged financial liabilities (fair value) – – – – – a.4 Cash flow hedging derivatives – – – – – a.5 Foreign currency assets and liabilities – – – – –
Total hedging income (A) 31,662 – – 31,662 –
B. Charges on:B.1 Fair value hedging derivatives (31,201) – – (31,201) – B.2 Hedged financial assets (fair value) – – – – – B.3 Hedged financial liabilities (fair value) – – – – – B.4 Cash flow hedging derivatives – – – – – B.5 Foreign currency assets and liabilities – – – – –
Total hedging expense (B) (31,201) – – (31,201) –
C. Net profit/loss on hedging transactions (A–B) 461 – – 461 –
Hedge effectiveness has been assessed at year end, as required by IaS 39. these assessments have confirmed the effectiveness of such hedges and so the revaluations/writedowns of hedging derivatives and hedged items have been recognized in this line item.
the net gain (loss) reported above reflects the partial ineffectiveness of hedges, which nonetheless remains with the range permitted by IaS 39.

489
SECtION 6
Disposal/repurchase gains (losses) – Line item 100
6.1 Disposal/repurchase gains (losses): analysis
Items/Income items Banking group Insurance companies Other companies Profits Losses Net Profits Losses Net Profits Losses Net result result result
Financial assets 1. Loans and advances to banks – – – – – – – – – 2. Loans and advances to customers 5 (55) (50) – – – – – – 3. Financial assets available for sale 6,259 (7,190) (931) – – – – – – 3.1 Debt securities 364 (7,051) (6,687) – – – – – – 3.2 Equities 5,891 (139) 5,752 – – – – – – 3.3 Mutual funds 4 – 4 – – – – – – 3.4 Loans – – – – – – – – – 4. Financial assets held to maturity – – – – – – – – – Total assets 6,264 (7,245) (981) – – – – – –
Financial liabilities 1. Deposits from banks – – – – – – – – – 2. Due to customers 12,321 – 12,321 – – – – – – 3. Debt securities in issue 2,211 (3) 2,208 – – – – – –
Total liabilities 14,532 (3) 14,529 – – – – – –

490
the gains and losses from “Financial assets available for sale” include the “release” to income of the positive and negative valuation reserves, recorded separately under equity at 31 December 2007, as a result of selling assets during the year.
the gains relating to “Equities” classified as “Financial assets available for sale” mostly relate to the sale of interests in certain Luxembourg-registered vehicle companies arising from the investment in the property sector through participation in the “Investor Club” proposed by Jargonnant Partners. the gains at 31 December 2007 mainly referred to the sale of all the shares held in Banca Popolare di Intra.
the repurchase gains from “Due to customers” refer to the repurchase of part of the senior and mezzanine notes issued in relation to the fifth and sixth securitizations undertaken by the Group and “reinstated” in the financial statements.
Items/Income items 31/12/2008 31/12/2007 Profits Losses Net Profits Losses Net result result Financial assets 1. Loans and advances to banks – – – – – – 2. Loans and advances to customers 5 (55) (50) 16 (17) (1)3. Financial assets available for sale 6,259 (7,190) (931) 10,228 (5,690) 4,538 3.1 Debt securities 364 (7,051) (6,687) 2,540 (3,947) (1,407) 3.2 Equities 5,891 (139) 5,752 7,688 (1,743) 5,945 3.3 Mutual funds 4 – 4 – – – 3.4 Loans – – – – – – 4. Financial assets held to maturity – – – – – –
Total assets 6,264 (7,245) (981) 10,244 (5,707) 4,537
Financial liabilities 1. Deposits from banks – – – – – – 2. Due to customers 12,321 – 12,321 – – – 3. Debt securities in issue 2,211 (3) 2,208 1,730 (3) 1,727 Total liabilities 14,532 (3) 14,529 1,730 (3) 1,727

491
SECtION 7
Net change in financial assets and liabilities at fair value – Line item 110
7.1 Net change in financial assets and liabilities at fair value: analysis
7.1.1 attributable to the banking group
transactions/Income items Gains Gains on Losses Losses on Net profit disposals disposals (loss) 1. Financial assets – 1,014 (7,527) – (6,513) 1.1 Debt securities – 1,014 (7,527) – (6,513) 1.2 Equities – – – – – 1.3 Mutual funds – – – – – 1.4 Loans – – – – –
2. Financial liabilities 1,763 4,098 (151,402) (2,440) (147,981) 2.1 Debt securities 1,763 4,098 (151,402) (2,440) (147,981) 2.2 Deposits from banks – – – – – 2.3 Due to customers – – – – –
3. Foreign currency financial assets and liabilities: exchange differences X X X X –
4. Derivatives 4.1 Financial derivatives 148,968 13,430 (5,248) (4,980) 152,170 – on debt securities and interest rates 148,968 13,430 (5,248) (4,980) 152,170 – on equities and equity indices – – – – – – on currency and gold X X X X – – other – – – – – 4.2 Credit derivatives – – – – –
Total derivatives 148,968 13,430 (5,248) (4,980) 152,170
Total 150,731 18,542 (164,177) (7,420) (2,324)
trading profits (losses) and valuation gains (losses) relating to financial derivatives are presented on an open account basis for each individual financial instrument.

492
SECtION 8
Net impairment adjustments – Line item 130
8.1 Net impairment adjustments to loans and advances: analysis
8.1.1 attributable to the banking group
Key:a = interestB = other
8.2 Net impairment adjustments to financial assets available for sale: analysis
8.2.1 attributable to the banking group
Key:a = interestB = other
“Write-offs” in line C. “Mutual funds.” refer to the total write-off of the Farfield funds following the “Madoff” crack. “Other” adjustments refer to certain financial instruments for which impairment losses have been recognized in accordance with IaS 39.
Lastly, adjustments to “Loans to customers” refer to the partial writedown of a loan disbursed as part of the disposal of all the shares in Linea Spa to Compass Spa (Mediobanca Group), whose repayment depends on the performance of an underlying loan book.
transactions/Income Adjustments Writebacks 31/12/2008 31/12/2007items Specific Portfolio Specific Portfolio Write-offs Other a B a B a. Loans and advances to banks – (297) – – – – – (297) 720 B. Loans and advances to customers (9,863) (194,367) (15,548) 8,478 57,932 1,480 70 (151,818) (136,563)
C. Total (9,863) (194,664) (15,548) 8,478 57,932 1,480 70 (152,115) (135,843)
transactions/Income items Adjustments Writebacks 31/12/2008 31/12/2007 Specific Specific Write-offs Other a B a. Debt securities (600) (1,097) – – (1,697) (773)B. Equities – (6,378) x x (6,378) (9,249)C. Mututal funds (5,621) (4,241) x – (9,862) – D. Loans and advances to banks – – – – – – E. Loans and advances to customers – (15,300) – – (15,300) –
F. Total (6,221) (27,016) – – (33,237) (10,022)

493
8.4 Net impairment adjustments to other financial transactions: analysis
8.4.1 attributable to the banking group
Key:a = interestB = other
transactions/Income Adjustments Writebacks 31/12/2008 31/12/2007items Specific Portfolio Specific Portfolio Write-offs Other a B a B a. Guarantees given – (333) (951) – 304 – 24 (956) (426)B. Credit derivatives – – – – – – – – – C. Commitments to disburse funds – – (11) – – – – (11) – D. Other transactions – – – – – – – – –
E. Total – (333) (962) – 304 – 24 (967) (426)

494
SECtION 9
Net premium income – Line item 150
9.1 Net premium income: analysis
Premiums from Direct Indirect 31/12/2008 31/12/2007insurance business business business
A. Life sector a.1 Gross premiums recorded (+) – – – 241,395 a.2 Premiums transferred to reinsurers (–) – – – (218) a.3 total – – – 241,177
B. Loss sector B.1 Gross premiums recorded (+) – – – – B.2 Premiums transferred to reinsurers (–) – – – – B.3 Change in gross amount of premium reserve (+/–) – – – – B.4 Change in premium reserve borne by reinsurers (+/–) – – – – B.5 total – – – –
C. Total net premium income – – – 241,177
the figures at 31 December 2007 related to the two insurance companies Berica Vita and Vicenza Life. after selling 50% of Berica Vita and Vicenza Life on 5 September 2007, these insurance companies have been carried at equity from this date rather than consolidated line-by-line.

495
SECtION 10
Other insurance income (charges) – Line item 160
10.1 Other insurance income (charges): analysis
Line items 31/12/2008 31/12/2007
1. Net change in technical reserves – (153,475)2. Period claims settled during the year – (60,396)3. Other insurance income (charges) – (22,459)
Total – (236,330)
10.2 Analysis of “Net change in technical reserves”
Net change in technical reserves 31/12/2008 31/12/2007
1. Life sectora. Mathematical reserves – (134,356) a.1 Gross amount for year – (134,356) a.2 (–) Portion borne by reinsurers – – B. Other technical reserves – (353) B.1 Gross amount for year – (353) B.2 (–) Portion borne by reinsurers – – C. technical reserves even though the investment risk is borne by the insured parties – (18,766) C.1 Gross amount for year – (18,766) C.2 (–) Portion borne by reinsurers – –
Total “Life sector reserves” – (153,475)
2. Loss sector Change in the technical reserves of the loss sector, excluding the claims reserve, net of transfers to reinsurers – –

496
10.3 Analysis of “Claims relating to the year”
Charges for claims 31/12/2008 31/12/2007
Life sector: Charges for claims, net of transfers to reinsurers a. amounts paid – (59,247) a.1 Gross amount for year – (59,247) a.2 (–) Portion borne by reinsurers – – B. Changes in reserves for amounts to be paid – (1,149) B.1 Gross amount for year – (1,149) B.2 (–) Portion borne by reinsurers – –
Total “Life sector reserves” – (60,396)
Loss sector: Charges for claims, net of recoveries and transfers to reinsurers C. amounts paid: – – C.1 Gross amount for year – – C.2 (–) Portion borne by reinsurers – – D. “Change in recoveries, net of the portion borne by reinsurers” – – E. Change in claims reserve – – E.1 Gross amount for year – – E.2 (–) Portion borne by reinsurers – –
Total “Claims - loss sector” – – 10.4 Analysis of “Other insurance income/charges, net”
31/12/2008 31/12/2007
a) Charges “Life sector” – (22,459)b) Charges “Loss sector” – –
Total – (22,459)
the figures at 31 December 2007 related to the two insurance companies Berica Vita and Vicenza Life. after selling 50% of Berica Vita and Vicenza Life on 5 September 2007, these insurance companies have been carried at equity from this date rather than consolidated line-by-line.

497
SECtION 11
administrative costs – Line item 180
11.1 Payroll costs: analysis
type of expense/Segments Banking Insurance Other 31/12/2008 31/12/2007 group companies companies
1. Employees (392,692) – – (392,692) (336,904) a) wages and salaries (288,331) – – (288,331) (253,612) b) social security contributions (72,309) – – (72,309) (64,284) c) severance indemnities (409) – – (409) (569) d) pension costs (867) – – (867) (694) e) provision for severance indemnities (6,312) – – (6,312) 3,511 f) provision for pensions and similar benefits: (838) – – (838) (1,047) – defined contribution (838) – – (838) (1,047) – defined benefit – – – – – g) payments to external – – supplementary pension funds: (22,551) – – (22,551) (18,199) – defined contribution (22,551) – – (22,551) (18,199) – defined benefit – – – – – h) costs deriving from equity-settled payment arrangements (341) – (341) (1,048) i) other personnel benefits (734) – – (734) (962)2. Other personnel (2,175) – – (2,175) (1,237)3. retired personnel (7,651) – – (7,651) (4,744)4. Directors and statutory auditors (8,998) – – (8,998) (6,535)
Total (411,516) – – (411,516) (349,420)
these costs also include provisions for future expenses relating to the employee incentive scheme and productivity bonuses, in compliance with IaS which require costs to be classified by “nature” of the expense.
Line 1.i) “other personnel benefits” reports costs associated with redundancy incentives under Law 449/97.
In 2007 line 1.e) “Provision for severance indemnities” included not only the actual provision for the year but also the extraordinary effect of curtailment.
In compliance with recent clarifications by the Supervisory authorities, payments of severance indemnity directly into INPS are reported in line 1.g) “payments to external supplementary pension funds: defined contribution”. In addition, the fees paid to the statutory auditors have been reclassified to “Payroll” in line 4) “Directors and Statutory auditors”. the corresponding amounts for 2007 have also been reclassified.

498
11.2 Average number of employees, by level: banking group
Banking Insurance Other 31/12/2008 31/12/2007 group companies companies
1. Employees 5,536 – – 5,536 5,108 a) Managers 125 – – 125 116 b) Middle managers 2,157 – – 2,157 1,953 of which: 3rd and 4th level 1,130 – – 1,130 990 c) Other employees 3,254 – – 3,254 3,039 2. Other personnel 30 – – 30 24
Total 5,566 – – 5,566 5,132
the average number of employees is calculated as the average of those at the start and end of the year.
“Other employees” include staff working under contracts other than permanent employment ones, such as temporary or project contracts.
the increase in the average number of employees is mainly due to the acquisition of 61 branches from the UBI Banca Group, involving the addition of 219 extra staff from 1 January 2008.
11.5 Other administrative costs: analysis
31/12/2008 31/12/2007
1. Indirect taxes (57,413) (53,217)2. Non-professional products and services (93,975) (88,518) 2.1. postage, telephone charges (17,481) (15,535) 2.2. security and valuables transportation (7,211) (6,339) 2.3. electricity, heating and water (6,731) (5,879) 2.4. transport (2,513) (2,138) 2.5. hire of programs and microfiches (1,409) (1,290) 2.6. data processing (50,911) (50,230) 2.7. stationery and printing (3,805) (3,631) 2.8. cleaning of premises (3,914) (3,476)3. Professional services (21,182) (19,582)4. Rentals (28,457) (23,592) 4.1. rent of buildings (27,256) (22,490) 4.2. machine lease installments (1,201) (1,102)5. Maintenance of furniture and installations (9,760) (7,227)6. Insurance premiums (3,498) (3,328)7. Other expenses (46,896) (41,543) 7.1. surveys, searches and subscriptions (6,214) (5,984) 7.2. meal vouchers (5,599) (4,833) 7.3. membership fees (2,029) (1,795) 7.4. advertising and entertainment (16,683) (13,337) 7.5. other miscellaneous expenses (16,371) (15,594)
Total (261,181) (237,007)

499
SECtION 12
Net provisions for risks and charges – Line item 190
12.1 Net provisions for risks and charges: analysis
31/12/2008 31/12/2007
a) Provisions for legal disputes and other charges (7,614) (12,119)b) Provision for other risks and charges (14,850) (28,973)
Total (22,464) (41,092) the provisions for legal disputes cover claims from the liquidators of bankrupt customers and other claims against the Group.
the provisions for other risks and charges mainly relate to potential costs associated with the effects on customer loans of the current adverse climate on financial markets and the likely negative impact on the Group in terms of recovering its loans.

500
SECtION 13
Net adjustments to property, plant and equipment – Line item 200
13.1 Net adjustments to property, plant and equipment: analysis
13.1.1 attributable to the banking group
assets/Income items Depreciation Impairment Writebacks Net adjustment result a. Property, plant and equipment a.1 Owned (20,423) (4) – (20,427) – for business purposes (20,423) (4) – (20,427) – for investment purposes – – – – a.2 Held under finance lease: – – – – – for business purposes – – – – – for investment purposes – – – –
Total (20,423) (4) – (20,427)

501
SECtION 14
Net adjustments to intangible assets – Line item 210
14.1 Net adjustments to intangible assets: analysis
14.1.1. attributable to the banking group
assets/Income items Depreciation Impairment Writebacks Net adjustment result
a. Intangible assets a.1 Owned (5,674) (55) – (5,729) – internally generated – – – – – other (5,674) (55) – (5,729) a.2 Held under finance lease – – – – Total (5,674) (55) – (5,729)

502
SECtION 15
Other operating charges – Line item 220
15.1 Other operating charges: analysis
31/12/2008 31/12/2007
1. amortization of leasehold improvements (7,083) (5,364)2. Other charges (15,912) (5,013)
Total (22,995) (10,377)
the amount in line 1 relates to the amortization of leasehold improvements that cannot be separated from the related assets and which, accordingly, are not reported separately under property, plant and equipment. these costs are amortized over the period they are expected to benefit or the residual duration of the lease, whichever is shorter.
“Other charges” in line 2 include the costs incurred by the Bank for early closure of certain financial instruments subscribed by customers, and for the renegotiation of securitized mortgages.
15.2 Other operating income: analysis
31/12/2008 31/12/2007
1. Expenses recharged to third parties on current and savings accounts 1,532 1,749 2. Property rental income 2,773 1,310 3. recharge of stamp duty and other indirect taxes 39,973 37,438 4. Other income 21,170 29,954
Total 65,448 70,451
Other income includes Euro 1,716 for the additional return received during the year on junior notes held in relation to the Group’s own securitizations.

503
SECtION 16
Profit (loss) from equity investments – Line item 240
16.1 Profit (loss) from equity investments: analysis
Income item/Segments Banking Insurance Other 31/12/2008 31/12/2007 group companies companies
1) Companies under joint control a. Income 91.646 – – 91.646 6.473 1. revaluations – – – – – 2. Profit from disposals 91.646 – – 91.646 – 3. Writebacks – – – – – 4. Other positive changes – – – – 6.473 B. Charges – – – – – 1. Writedowns – – – – – 2. Impairment writedowns – – – – – 3. Loss from disposals – – – – – 4. Other negative changes – – – – –
Net result 91.646 – – 91.646 6.473
2) Companies subject to significant influence a. Income 1.762 – – 1.762 41.283 1. revaluations – – – – – 2. Profit from disposals 81 – – 81 38.828 3. Writebacks – – – – – 4. Other positive changes 1.681 – – 1.681 2.455 B. Charges (6.963) – – (6.963) (845) 1. Writedowns – – – – – 2. Impairment writedowns – – – – – 3. Loss from disposals – – – – (395) 4. Other negative changes (6.963) – – (6.963) (450)
Net result (5.201) – – (5.201) 40.438
Total 86.445 – – 86.445 46.911
“Profits from disposals” of companies under joint control relate to the sale of all the shares held in Linea Spa, classified in “Non-current assets held for sale” in the 2007 balance sheet.
“Profits from disposals” of companies subject to significant influence relate to the sale of the entire interest in Otto a più investimenti Sgr.
“Other positive changes” and “Other negative changes” relating to companies subject to significant influence refer to the results for the year of equity investments consolidated using the equity method.

504
SECtION 17
Net gains (losses) arising on fair value adjustments to property, plant and equipment and intangible assets – Line item 250
17.1 Net gains (losses) arising on fair value adjustments to property, plant and equipment and in-tangible assets: analysis
17.1.1 Attributable to the banking group
assets/Income items revaluation Writedowns Exchange differences Net Net Positive Negative result at result at 31/12/2008 31/12/2007
A. Property, plant and equipment 254 (159) – – 95 172 a.1 Owned: 254 (159) – – 95 172 – for business purposes – – – – – – – for investment purposes 254 (159) – – 95 172 a.2 Held under finance lease: – – – – – – – for business purposes – – – – – – – for investment purposes – – – – – – B. Intangible assets – – – – – – B.1 Owned: – – – – – – B.1.1 internally generated – – – – – – B.1.2 other – – – – – – B.2 Held under finance lease – – – – – –
Total 254 (159) – – 95 172
SECtION 18
adjustments to goodwill – Line item 260
18.1 Adjustments to goodwill: analysis
31/12/2008 31/12/2007
a) adjustments to goodwill (1,386) (660)
the adjustments reflect the total write-off of goodwill arising on consolidation of Nuova Merchant Spa following this subsidiary’s net loss for the year.

505
SECtION 19
Gains (losses) on disposal of investments – Line item 270
19.1 Gains (losses) on disposal of investments: analysis
Income item/Segments Banking Insurance Other 31/12/2008 31/12/2007 group companies companies
a. Buildings – – – – 651 – Profits from disposals – – – – 671 – Loss from disposals – – – – (20)B. Other assets (201) – – (201) (6) – Profits from disposals 67 – – 67 22 – Loss from disposals (268) – – (268) (28)
Net result (201) – – (201) 645
the profits and losses reported above relate to the sale and/or retirement of certain property, plant and equipment. as reported in asset Section 11 of these notes, and to the writedown of certain leasehold improvements after terminating the related leases early (Euro 224).
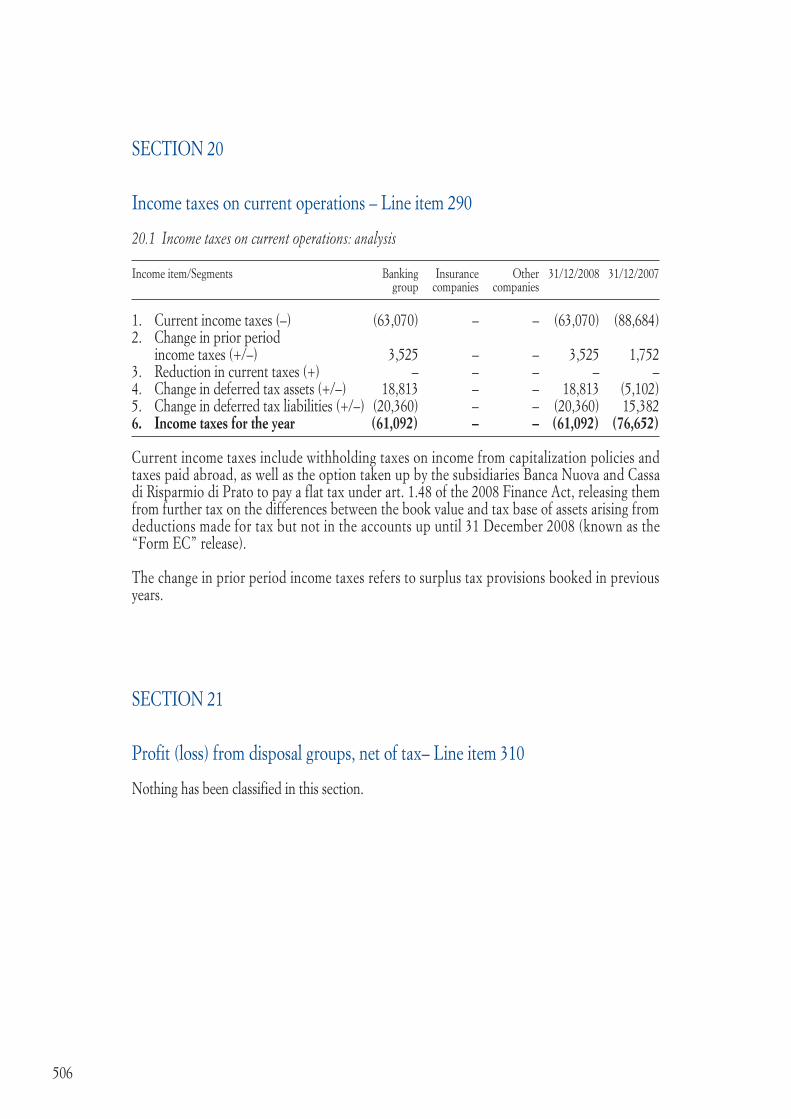
506
SECtION 20
Income taxes on current operations – Line item 290
20.1 Income taxes on current operations: analysis
Income item/Segments Banking Insurance Other 31/12/2008 31/12/2007 group companies companies
1. Current income taxes (–) (63,070) – – (63,070) (88,684)2. Change in prior period income taxes (+/–) 3,525 – – 3,525 1,752 3. reduction in current taxes (+) – – – – – 4. Change in deferred tax assets (+/–) 18,813 – – 18,813 (5,102)5. Change in deferred tax liabilities (+/–) (20,360) – – (20,360) 15,382 6. Income taxes for the year (61,092) – – (61,092) (76,652) Current income taxes include withholding taxes on income from capitalization policies and taxes paid abroad, as well as the option taken up by the subsidiaries Banca Nuova and Cassa di risparmio di Prato to pay a flat tax under art. 1.48 of the 2008 Finance act, releasing them from further tax on the differences between the book value and tax base of assets arising from deductions made for tax but not in the accounts up until 31 December 2008 (known as the “Form EC” release).
the change in prior period income taxes refers to surplus tax provisions booked in previous years.
SECtION 21
Profit (loss) from disposal groups, net of tax– Line item 310
Nothing has been classified in this section.

507
SECtION 22
Minority interests – Line item 330
22.1 Analysis of line item 330 “Minority interests”
31/12/2008 31/12/2007
1. Cassa di risparmio di Prato Spa (97) (2,569)2. Banca Nuova Spa (62) (41)3. Nordest Merchant Spa (166) (86)4. PrestiNuova Spa (140) (138)5. BPVi Fondi Sgr Spa (457) (227)6. Farbanca Spa (1,394) (407)5. Verona Gestioni Sgr Spa – (341)
Total (2,316) (3,809)
the absorption of the subsidiary Verona Gestioni Sgr into the subsidiary BPVi Fondi Sgr was completed on 1 November 2008.
SECtION 23
Other information
23.1 Amounts collected on behalf of third parties: debit and credit adjustments
31/12/2008 31/12/2007
a) Debit adjustments 3,787,312 3,515,066 1. Current accounts 16,515 14,498 2. Central portfolio 3,744,143 3,481,319 3. Cash 26,654 19,249 4. Other accounts – – b) Credit adjustments 3,950,722 3,684,124 1. Current accounts 11,594 9,767 2. transferors of notes and documents 3,918,863 3,650,810 3. Other accounts 20,265 23,547
the difference between the “debit” and “credit” adjustments during the year is classified in line item 100 “Other liabilities”.

508
SECtION 24
Earnings per share
Basic earnings per share and diluted earnings per share are reported below, as required by para. 70.b) of IaS 33.
Basic earnings per share is determined by dividing the results attributable to the holders of the Parent Bank’s ordinary equity instruments (the numerator) by the weighted average number of ordinary shares outstanding during the year (the denominator).
Diluted earnings per share is determined by adjusting both the results attributable to the holders of the Parent Bank’s ordinary equity instruments and the weighted average number of shares outstanding to take account of any dilutive effects associated with the convertible bond issued during the prior year.
31/12/2008 31/12/2007
Earnings per share (basic) 1,569 1,684 Earnings per share (diluted) 1,588 1,685
24.1 Average number of ordinary shares on dilution of share capital
31/12/2008 31/12/2007
Weighted average number of ordinary shares 69,305,047 67,545,273 Dilution adjustment 3,996,305 1,691,987 Weighted average number of ordinary shares (fully diluted) 73,301,352 69,237,260
In order to determine the basic earnings per share, the weighted average number of ordinary shares outstanding is calculated with reference to the number of ordinary shares outstanding at the start of the year, as adjusted by the number of ordinary shares acquired or issued during the year multiplied by the number of days such shares were in circulation in proportion to the total number of days in the year. treasury shares are not included in the total number of shares outstanding.
In order to determine the diluted earnings per share, the weighted average number of ordinary shares outstanding is increased by the weighted average number of additional ordinary shares that would have been outstanding had all potential ordinary shares with a dilutive effect been converted. the potential ordinary shares with a dilutive effect, calculated on the basis of the conversion ratio established by the regulations of the convertible bond issued in the year, were treated as if they had been converted into ordinary shares on the bond issue date (31 July 2007).
24.2 Other information
Since there are no preference shares, the results attributable to the holders of ordinary equity instruments coincide with net income for the year.

509
Part DSEGMENt INFOrMatION
the composition of the various business segments is as follows:
retail banks: Banca Popolare di Vicenza SCpa Cassa di risparmio di Prato Spa Banca Nuova Spa Farbanca Spa
Product companies: B.P.Vi. Fondi SGr Spa Nordest Merchant Spa NEM Sgr Spa NEM 2 SGr Spa BPV Finance (International) Plc PrestiNuova Spa Nuova Merchant Spa
Service companies: Immobiliare Stampa Spa Monforte 19 Srl Servizi Bancari Spa
the composition of the various geographical areas is as follows:
Northern Italy: Banca Popolare di Vicenza SCpa Immobiliare Stampa Spa Servizi Bancari Spa B.P.Vi. Fondi SGr Spa Nordest Merchant Spa NEM Sgr Spa NEM 2 SGr Spa Monforte 19 Srl
Central Italy: Cassa di risparmio di Prato Spa Nuova Merchant Spa Farbanca Spa
Southern Italy Banca Nuova Spaand the Islands: PrestiNuova Spa
Other EU countries: BPV Finance (International) Plc

510
a. PrIMarY SEGMENt
A.1 Distribution by business segments: income statement
Line items/Segments retail Product Service Other total banks companies companies
1. Interest income and similar revenues (line item 10) 1,504,510 57,422 400 (28,780) 1,533,552 2. Interest expense and similar charges (line item 20) (868,911) (40,958) (1,934) 31,201 (880,602)3. Net fee and commission income (line item 60) 257,164 14,537 (84) 237 271,854 4. Dividend and similar income (line item 70) 57,726 2,020 (30,632) 29,114 5. Net change in value of financial assets and liabilities (line items 80, 90, 100 and 110) 19,227 (31,095) – 10,327 (1,541)6. Net impairment adjustments to financial assets (line item 130) (175,667) (15,741) – 5,089 (186,319)7. Net income from insurance activities (line items 150 and 160) – – – – – 8. administrative costs (line item 180) (660,127) (22,150) (11,961) 21,541 (672,697)9. Net provisions for risks and charges (line item 190) (22,559) (10) (50) 155 (22,464)10. Net adjustments to property, plant and equipment (line items 200 and 210) (19,759) (325) (5,705) (367) (26,156)11. Other operating charges/income (line items 220, 240, 250, 260 and 270) 135,339 996 23,564 (32,493) 127,406 Net result 226,943 (35,304) 4,230 (23,722) 172,147
the “Other” column includes the eliminations not considered since they relate to other segments and consolidation adjustments.

511
A.2 Distribution by business segment: balance sheet
retail Product Service Other total banks companies companies
1. Loans and advances to customers (line item 70) 22,587,294 684,485 – (567,139) 22,704,640 2. Deposits with banks and liquid assets (line items 10 and 60) 2,545,372 146,990 11,016 (222,826) 2,480,552 3. Financial assets (line items 20, 30, 40, 50 and 90) 1,216,855 94,978 4,726 (12,129) 1,304,430 4. Equity investments (line item 100) 1,427,456 2,400 – (1,110,256) 319,600 5. Property, plant and equipment and intangible assets (line items 120 and 130) 944,054 4,833 357,605 213,327 1,519,819 6. Other assets (line items 150 and 160) 466,117 6,115 859 (54,091) 419,000 Total assets 29,187,148 939,801 374,206 (1,753,114) 28,748,041 1. Due to customers (line item 20) 12,115,206 – – 46,671 12,161,877 2. Deposits from banks (line item 10) 2,836,348 793,886 134,025 (687,541) 3,076,718 3. Financial liabilities (line items 30, 40, 50 and 60) 10,071,507 23,411 – (174,589) 9,920,329 4. Other liabilities (line items 100, 110 and 120) 834,733 25,992 10,942 (51,946) 819,721 Total liabilities 25,857,794 843,289 144,967 (867,405) 25,978,645
Total indirect deposits 15,890,206 – – – 15,890,206
the “Other” column includes the eliminations not considered since they relate to other segments and consolidation adjustments.

512
B. SECONDarY SEGMENt
B.1 Distribution by geographical area: income statement
the “Other” column includes the eliminations not considered since they relate to other segments and consolidation adjustments.
Line items/Segments Italy Other EU Other total Northern Central Southern Italy countries Italy Italy and the Islands
1. Interest income and similar revenues (line item 10) 1,109,506 250,942 224,922 30,993 (82,811) 1,533,552 2. Interest expense and similar charges (line item 20) (704,314) (120,053) (115,662) (25,805) 85,232 (880,602)3. Net fee and commission income (line item 60) 191,138 40,087 40,489 (138) 278 271,854 4. Dividends and similar income (line item 70) 56,083 140 2,246 1,277 (30,632) 29,114 5. Net change in value of financial assets and liabilities (line items 80, 90, 100 and 110) 15,889 (210) 3,731 (31,278) 10,327 (1,541)6. Net impairment adjustments to financial assets (line item 130) (126,709) (38,151) (12,011) (14,537) 5,089 (186,319)7. Net income from insurance activities (line items 150 and 160) – – – – – – 8. administrative costs (line item 180) (439,426) (124,795) (114,251) (1,493) 7,268 (672,697)9. Net provisions for risks and charges (line item 190) (15,382) (4,540) (2,697) – 155 (22,464)10. Net adjustments to property, plant and equipment (line items 200 and 210) (17,771) (4,014) (3,984) (20) (367) (26,156)11. Other operating charges/income (line items 220, 240, 250, 260 and 270) 129,751 8,697 6,948 271 (18,261) 127,406 Net result 198,765 8,103 29,731 (40,730) (23,722) 172,147

513
B.2 Distribution by geographical area: balance sheet
the “Other” column includes the eliminations not considered since they relate to other segments and consolidation adjustments.
Line items/Segments Italy Other EU Other total Northern Central Southern Italy countries Italy Italy and the Islands
1. Loans and advances to customers (line item 70) 15,894,016 3,713,398 3,221,013 315,813 (439,600) 22,704,640 2. Deposits with banks and liquid assets (line items 10 and 60) 3,253,999 215,039 924,661 132,930 (2,046,077) 2,480,552 3. Financial assets (line items 20, 30, 40, 50 and 90) 1,103,636 82,743 50,455 79,725 (12,129) 1,304,430 4. Equity investments (line item 100) 1,394,241 2,525 33,090 – (1,110,256) 319,600 5. Property, plant and equipment and intangible assets (line items 120 and 130) 1,109,505 112,504 84,466 16 213,328 1,519,819 6. Other assets (line items 150 and 160) 252,296 86,411 128,922 118 (48,747) 419,000 Total assets 23,007,693 4,212,620 4,442,607 528,602 (3,443,481) 28,748,041 1. Due to customers (line item 20) 7,482,117 1,919,896 2,690,240 – 69,624 12,161,877 2. Deposits from banks (line item 10) 3,631,348 797,931 583,710 472,964 (2,409,235) 3,076,718 3. Financial liabilities (line items 30, 40, 50 and 60) 8,182,321 1,065,815 823,370 23,411 (174,588) 9,920,329 4. Other liabilities (line items 100, 110 and 120) 647,623 119,807 98,550 350 (46,609) 819,721 Total liabilities 19,943,409 3,903,449 4,195,870 496,725 (2,560,808) 25,978,645
Total indirect deposits 12,926,080 1,692,686 1,271,440 – – 15,890,206

514
SECTION 1
RISKS OF THE BANKING GROUP
1.1 CREDIT RISK
QUALITATIVE DISCLOSURES
1. General aspects
Credit risk is the risk of losses due to non-performance by the counterparty (specifically the obligation to repay loans) or, more broadly, the failure of customers or their guarantors to meet their obligations.
Credit risk also usually includes “Country risk”, being the risk that public and private borrowers in a country might be affected by the political, economic and financial situation there. In such cases, the failure to meet their obligations may depend on external factors beyond their control (political and economic risks, currency controls etc.) that relate to the country in which they are resident.
Lending by the BPVi Group has always aimed to support both the borrowing needs of households and the development and consolidation of businesses, especially small and medium-sized firms, which typify the local economies where the Group’s banks operates.
In keeping with prior years, the lending policy adopted in 2008 by the Group’s different businesses sought to respond to the needs of individuals and firms, while paying particular attention to the difficult economic situation, credit risk and an adequate level of guarantees.
With reference to private customers, the development of activities focused on the longer-term segment with the granting and/or renegotiation of home mortgages and personal loans either directly via the Group’s banks or via other companies.
Development activities in relation to small businesses have mainly focused on short-term lending, where the risk is spread widely, using technical forms that are supported by underwriting syndicates wherever possible. Medium-term lending has been expanded in relation to medium and large businesses, with a special focus on those with secured guarantees. In all cases, special care has been taken in the selection of economic sectors from which borrowers come, in order to give preference to lower risk activities. Sector analysis has become increasingly important in the credit management process and involves the examination of internal data and external data provided by specialist Italyn companies, in order to maximize their significance in view of the characteristics of the different banks and areas in which they operate.
The Group is not active in the field of credit derivatives.
Lastly, it is reported that the disclosures required under Pillar 3 have been elaborated. The new rules introduce compulsory disclosure concerning capital adequacy, exposure to risks and the general characteristics of systems used to identify, measure and manage them. These disclosures enhance the transparency of the banking business’s risk management. In particular, the Bank of Italy has prepared specific tables containing the quantitative and qualitative information that interAVERAGEries need to publish, hence allowing data comparison.
PART EINFORMATION ON RISKS AND RELATED HEDGING POLICY

515
These disclosures will be published on the website of the parent bank Banca Popolare di Vicenza (www.popolarevicenza.it) in the “Corporate Documents” section.
2. Credit risk management policies
2.1 Organizational aspects
The Group’s regulations for the management of lending, contained in its Credit Manual, require a prudent approach to the assessment of risk. At the investigation stage, borrowers are required to provide all the documentation needed for an adequate assessment of their credit-worthiness. Such documentation must allow assessment of the consistency between the amount requested, the technical form of the loan and the project to be financed; it must also allow the characteristics and qualities of borrowers to be identified, having regard for all forms of relationship with them.
The risks associated with individual customers from the same Group must be considered separately. If there are legal or economic relations between individual customers, these parties form a unit in risk terms and represent a Group (economic group or risk group).When granting and/or renewing lines of credit, it is necessary to verify the exposure by the entire BPVI Group to borrowers and that to any groups to which they belong.Pricing and/or income from the relationship cannot be a factor when evaluating credit-worthiness and agreeing a loan.
Account managers monitor and administer loans day by day and are responsible for their granting. If customer risk increases, the operating objective is to contain the bank’s risk by adopting all the measures needed for this purpose on a timely basis.
Further to the “New prudential supervisory instructions for banks” (Bank of Italy Circular 263/06), the Group has adopted a process which, as far as property securing loans is concerned, constantly checks and updates its estimated value, also by using statistical methods based on georeferenced systems. In accordance with these instructions, a new category of anomalous loan (called “Past due”) was introduced at the end of 2007 for the purposes of isolating “Past due exposures”. Unlike the other existing classifications, the new one originates solely from the causes defined by the new supervisory rules.
With regard to the Basel II project, rating models have been implemented and put into operation for retail counterparties (individuals and small firms) and for small corporate counterparties (from Euro 2.5 to 50 million in turnover) and mid corporate counterparties (from Euro 50 to 200 million in turnover).
The rating model for corporate counterparties with turnover in excess of Euro 200 million is at an advanced stage of implementation at the Parent Bank.

516
2.2 Management, measurement and monitoring systems
The lending process is organized as follows:– The granting of loans involves: investigation, assessment, decision, formalization of the loan
and any guarantees;– The management of loans involves: way utilized, monitoring, review of facility, management
of anomalies;– Management of non-performing loans and recovery of loans.
The first and most important step in the measurement and management of risk is taken when loans are granted.
The Group’s regulations for the management of lending, contained in its Credit Manual, require a prudent approach to the assessment of risk. The documentation needed to make an adequate assessment of a borrower’s credit and the proposed structure of loan, with particular attention to the medium/long-term feasibility of projects financed, must be obtained by bank officials at the preliminary stage of the loan process. Credit-worthiness is also assessed on the basis of all the relationships that the borrower, and its related economic group, has with the BPVi Group. On the other hand, pricing and/or income from the relationship cannot be a factor when evaluating credit-worthiness and agreeing a loan.
Account managers monitor and administer loans day by day and are responsible for their granting.
The investigation process depends on the type of customer concerned. For individual and small businesses, the granting or otherwise of the facility requested is dealt with at branch or Area level for relatively small amounts. This follows a simplified process using an internal scoring system, which is an IT tool that checks credit-worthiness at the time new lines of credit are granted, using both internal and external sources of information. For better control over the process of granting credit to individual customers, stricter limits have been introduced on decision-making powers, identified on the basis of the risk profile attributed to the counterparty by the internal scoring system.
The granting of loans to companies/entities follows a more complex process, which is the responsibility of account managers, up to their authorization limits, and the central departments for larger amounts. Proposed lending to such customers must be supported by a technical opinion from the Ordinary Loans Department, presented by its Organizational Units.
The risk-management system (SGR) plays an important role in the monitoring and management of credit risk, allowing account managers to check on changes in the credit status of customers and quickly identify any deterioration in the standing of borrowers.As required by the Supervisory Instructions (Part IV, Chapter 11, Section II), suitable systems for the identification, measurement and control of risks have been adopted in order to manage lending in a proper and prudent manner.

517
Controls form an integral part of the daily activities of the Group. There are four types:
– Functional controls: these are performed at organizational level (e.g. hierarchical controls) or are built into procedures or carried out as part of back-office work;
– Risk-management controls: these contribute to defining the ways in which risk is measured, check compliance with the limits established for the various functions and monitor the consistency of operations. These controls are performed by functions without operational responsibilities;
– Internal revision: the purpose of this activity is to reassess the credit rating of individual borrowers, at predetermined intervals.
– Inspections: these are carried out by the audit function both on-site and on a remote basis, in order to verify the quality of loans and the support for decisions taken by the functions responsible for granting and administering loans.
2.3. Credit risk mitigation techniques
The credit risk associated with individual counterparties or groups is mitigated by obtaining security (pledges, mortgages and special privileges) and/or personal guarantees (sureties, endorsements, credit mandates and letters of patronage).The degree of mitigation attributed to each guarantee is governed by specific regulations that take account of the varying nature of the guarantees obtained.
Analysis of these guarantees does not reveal a special degree of concentration within the various technical forms of cover/guarantee since, except with regard to general sureties, they are essentially “specific” to each position. In addition, overall, there are no contractual restrictions that might undermine the legal validity of the guarantees obtained.
2.4 Impaired financial assets
Anomalous loans not classified as non-performing are monitored in a standard fashion for all Group banks by the Anomalous Loans Unit, whose mission is to “prevent default”. This Unit, which reports hierarchically and functionally to the Loans Division, operates at Head Office and, with regard to the Parent Company, in the Area offices responsible for the branch network.
The main tool used to identify “anomalous” loans is the SGR procedure (Sistemi Gestione Rischi or Risk Management System) which provides a “performance rating”. In the first half of 2009 this procedure will interface with the new Early Warning monitoring system, developed to make the identification of signs of deterioration more efficient and precise.
Once a month this procedure analyzes all individual and corporate customers with an open position (the higher of the line of credit or the drawdown) of at least Euro 200, excluding the positions that are already classified as past due, watchlist or non-performing, attributing them a rating on the basis of a 12 point rising scale. This classification represents a forecast for the next 6-12 months.
Based on the class of risk identified, the SGR system proposes to the account manager a classification of the position in one of the following categories: “performing” (BO), “observation” (OS), “high risk” (AR) or “past due” (SC).

518
The account manager, having assessed the real situation of the customer with regard to all positions that are not automatically classified as “performing”, may:– agree with the proposed classification and therefore establish a suitable plan for improving
the position;– disagree with the proposed classification, being in possession of information that justifies
an exception to the system’s proposal, and not confirm the proposal. This option is not available for “past due” classifications since the anomaly is identified on the basis of objective factors (as defined by Basel 2) and may not be “excepted” by the account manager.
Accordingly, with regard to customers with “anomalies”, account managers are required to take a preventive approach rather than one based on justifications, thereby minimizing the need to take action for the forced recovery of loans. In general, positions remain under “observation” or “high risk” or “past due” for a maximum predefined period, after which they are either returned to “performing“ or transferred to “default”.
“Restructured” loans are not automatically identified and managed by the SGR procedure, but in compliance with the supervisory rules (“Cash and off-balance sheet exposures (...) for which a bank, due to deterioration in the borrower’s economic and financial status, allows the original contractual conditions to be revised (...) giving rise to a loss”), their management focuses on checking observance of the agreed restructuring plan and the fact that they may be compatible with other internal classifications, such as “watchlist”.
Activities relating to watchlist loans give priority to friendly, even if gradual, recovery of credit or at least to the mitigation of any negative effects in the event of default.
The classification of loans as “non-performing” is based on the criteria laid down in the supervisory regulations. Accordingly, this category comprises loans to parties that are insolvent or in similar circumstances, even if not confirmed by a judge, the recovery of which is the subject of court action or other suitable measures.
Specific staff functions within Banca Nuova and CariPrato are responsible for the management of non-performing loans and the recovery of loans, while since the start of 2008 the Parent Bank’s “Non-performing loans, recovery and disputed loans” unit has been incorporated in the Anomalous Loans unit forming part of the Loans Division.
These units consist of internal lawyers and personnel who carry out administrative and accounting activities in relation to the non-performing loans concerned. The accounting processes make use of an IT procedure common to all the companies belonging to the Sec Servizi consortium.
Recovery activities are carried out on a pro-active basis, with a view to optimizing the legal procedures and maximizing the outcome in economic and financial terms. In particular, when evaluating the steps to take, internal lawyers prefer to take out-of-court action with recourse to settlements that accelerate recoveries and contain the level of costs incurred. Where this route is not applicable, and especially with regard to larger amounts and when greater recoveries can be expected, external lawyers are instructed to take legal action since this represents both a method of putting legitimate pressure on the debtor and a way to resolve disputes.
Small loans that are uncollectible or difficult to collect are generally grouped together and sold without recourse, given that legal action would be uneconomic in cost/benefit terms.
For financial reporting purposes, non-performing loans are analyzed on a case-by-case basis

519
to determine the provisions required to cover expected losses. The extent of the loss expected from each relationship is determined with reference to the solvency of the debtor, the nature and value of the guarantees obtained and the progress made by recovery procedures. Estimates are made on a prudent basis using discounting criteria, as required by the applicable accounting standards. This complex evaluation process is assisted by the subdivision of the loan portfolio into similar categories and year of origin, taking account of the realizable value of the personal and/or corporate assets of the debtor and the guarantors.
Lastly, the proper performance of the task of administering and evaluating non-performing loans is assured by both periodic internal audit checks and by external verification activities, carried out by the Board of Statutory Auditors and the independent auditors.

520
QUANTITATIVE DISCLOSURES
A. CREDIT QUALITY
A.1 IMPAIRED AND PERFORMING EXPOSURES: SIZE, ADJUSTMENTS, TRENDS, ECONOMIC AND TERRITORIAL DISTRIBUTION
A.1.1 Distribution of financial assets by portfolio and credit quality (book values)
Portfolio/Quality Banking group Other companies Total Non- Watchlist Restructured Past due Country Other Impaired Other performing risk assets assets 1. Financial assets held for trading 5 3,726 – 1,344 – 788,966 – – 794,041 2. Financial assets available for sale – – – – – 435,913 – – 435,913 3. Financial assets held to maturity – – – – – 25,737 – – 25,737 4. Loans and advances to banks – 911 – – – 2,304,707 – – 2,305,618 5. Loans and advances to customers 343,618 351,276 27,376 121,671 – 21,860,699 – – 22,704,640 6. Financial assets at fair value – – – – – 17,077 – – 17,077 7. Financial assets being sold – – – – – – – – – 8. Hedging derivatives – – – – – – – – –
Total at 31/12/2008 343,623 355,913 27,376 123,015 – 25,433,099 – – 26,283,026 Total at 31/12/2007 315,561 273,957 40,360 89,910 8,182 24,325,601 – – 25,053,571

521
A.1.2 Distribution of financial assets by portfolio and credit quality (gross and net values)
Portfolio/Quality Impaired assets Other assets Total Gross Specific Portfolio Net Gross Portfolio Net exposure adjustments adjustments exposure exposure adjustments exposure A. Banking group 1. Financial assets held for trading 5,690 (615) – 5,075 X X 788,966 794,041 2. Financial assets available for sale – – – – 444,360 (8,447) 435,913 435,913 3. Financial assets held to maturity – – – – 25,737 – 25,737 25,737 4. Loans and advances to banks 1,208 (297) – 911 2,304,707 – 2,304,707 2,305,618 5. Loans and advances to customers 1,284,649 (440,708) – 843,941 21,967,362 (106,663) 21,860,699 22,704,640 6. Financial assets at fair value – – – – 17,077 – 17,077 17,077 7. Financial assets being sold – – – – – – – – 8. Hedging derivatives – – – – – – – –
Total A 1,291,547 (441,620) – 849,927 24,759,243 (115,110) 25,433,099 26,283,026
B. Other consolidated companies 1. Financial assets held for trading – – – – – – – – 2. Financial assets available for sale – – – – – – – – 3. Financial assets held to maturity – – – – – – – – 4. Loans and advances to banks – – – – – – – – 5. Loans and advances to customers – – – – – – – – 6. Financial assets at fair value – – – – – – – – 7. Financial assets being sold – – – – – – – – 8. Hedging derivatives – – – – – – – –
Total B – – – – – – – –
Total at 31/12/2008 1,291,547 (441,620) – 849,927 24,759,243 (115,110) 25,433,099 26,283,026
Total at 31/12/2007 1,065,263 (301,135) (44,340) 719,788 24,439,621 (105,838) 24,333,783 25,053,571

522
A.1.3 Cash and off-balance sheet exposures to banks: gross and net values
Type of exposure/Amounts Gross Specific Portfolio Net exposure adjustments adjustments exposure A. CASH EXPOSURES A.1 Banking group a) Non-performing loans – – – – b) Watchlist loans 1,208 (297) – 911 c) Restructured exposures – – – – d) Past due exposures – – – – e) Country risk – X – – f) Other assets 2,455,881 X (2,225) 2,453,656
TOTAL A.1 2,457,089 (297) (2,225) 2,454,567
A.2 Other companies a) Impaired assets – – – – b) Other – – – –
TOTAL A.2 – – – –
TOTAL A 2,457,089 (297) (2,225) 2,454,567
B. OFF-BALANCE SHEET EXPOSURES B.1 Banking group a) Impaired assets – – – – b) Other 817,670 X – 817,670
TOTAL B.1 817,670 – – 817,670
B.2 Other companies a) Impaired assets – – – – b) Other – – – –
TOTAL B.2 – – – –
TOTAL B 817,670 – – 817,670

523
A.1.4 Cash exposures to banks: changes in gross impaired loans and loans subject to “country risk” Categories Non-performing Watchlist Restructured Past Country due risk
A. Opening gross exposure – – – – 5,353 of which: sold but not derecognized – – – – –
B. Increases – 1,208 – – – B.1 Transfers from performing loans – 1,208 – – – B.2 Transfers from other categories of impaired exposure – – – – – B.3 Other increases – – – – –
C. Decreases – – – – 5,353 C.1 Transfers to performing loans – – – – – C.2 Write-offs – – – – – C.3 Collections – – – – – C.4 Proceeds from disposals – – – – – C.5 Transfers to other categories of impaired exposure – – – – – C.6 Other decreases – – – – 5,353
D. Closing gross exposure – 1,208 – – – of which: sold but not derecognized - - - - -
A.1.5 Cash exposures to banks: changes in total writedowns
Categories Non-performing Watchlist Restructured Past Country due risk
A. Total opening adjustments – – – – – of which: sold but not derecognized – – – – –
B. Increases – 297 – – – B.1 Adjustments – 297 – – – B.2 Transfers from other categories of impaired exposure – – – – – B.3 Other increases – – – – –
C. Decreases – – – – – C.1 Write-backs on valuation – – – – – C.2 Write-backs due to collections – – – – – C.3 Write-offs – – – – – C.4 Transfers to other categories of impaired exposure – – – – – C.5 Other decreases – – – – –
D. Total closing adjustments – 297 – – – of which: sold but not derecognized – – – – –

524
A.1.6 Cash and off-balance sheet exposures to customers: gross and net values
Type of exposure/Amounts Gross Specific Portfolio Net exposure adjustments adjustments exposure A. CASH EXPOSURESA.1 Banking groupa) Non-performing loans 678,580 (334,962) – 343,618 b) Watchlist loans 452,003 (100,727) – 351,276 c) Restructured exposures 27,817 (441) – 27,376 d) Past due exposures 126,249 (4,578) – 121,671 e) Country risk – X – – f) Other assets 22,373,299 X (113,193) 22,260,106
TOTAL A.1 23,657,948 (440,708) (113,193) 23,104,047
A.2 Other companiesa) Impaired assets – – – – b) Other – – – –
TOTAL A.2 – – – –
TOTAL A 23,657,948 (440,708) (113,193) 23,104,047
B. OFF-BALANCE SHEET EXPOSURESB.1 Banking groupa) Impaired assets 40,073 (1,063) – 39,010 b) Other 4,941,719 X (218) 4,941,501
TOTAL B.1 4,981,792 (1,063) (218) 4,980,511
B.2 Other companiesa) Impaired assets – – – – b) Other – – – –
TOTAL B.2 – – – –
TOTAL B 4,981,792 (1,063) (218) 4,980,511

525
A.1.7 Cash exposures to customers: changes in gross impaired loans and loans subject to “country risk”
Categories Non-performing Watchlist Restructured Past Country due risk
A. Opening gross exposure 568,372 358,409 41,526 92,561 2,829 of which: sold but not derecognized 22,454 43,392 – – –
B. Increases 341,947 530,989 36,500 126,999 – B.1 Transfers from performing loans 35,253 458,247 10,642 126,792 – B.2 Transfers from other categories of impaired exposure 261,316 55,593 18,355 – – B.3 Other increases 45,378 17,149 7,503 207 – C. Decreases 231,739 437,395 50,209 93,311 2,829 C.1 Transfers to performing loans 225 87,434 – 36,534 – C.2 Write-offs 77,911 5,312 – 470 – C.3 Collections 152,573 104,420 1,315 1,926 – C.4 Proceeds from disposals 1,026 3,398 – – – C.5 Transfers to other categories of impaired exposure – 236,257 44,626 54,381 – C.6 Other decreases 4 574 4,268 – 2,829
D. Closing gross exposure 678,580 452,003 27,817 126,249 – of which: sold but not derecognized 53,146 59,985 – – –
A.1.8 Cash exposures to customers: changes in total writedowns
Categories Non-performing Watchlist Restructured Past Country due risk
A. Total opening adjustments 252,841 86,155 1,166 4,746 – of which: sold but not derecognized 7,386 2,372 – – –
B. Increases 204,622 65,304 441 1,676 – B.1 Adjustments 142,022 64,328 441 1,419 – B.2 Transfers from other categories of impaired exposure 23,285 976 – 256 – B.3 Other increases 39,315 – – 1 – C. Decreases 122,501 50,732 1,166 1,844 – C.1 Write-backs on valuation 39,094 20,892 – 355 – C.2 Write-backs due to collections 5,496 644 – – – C.3 Write-offs 77,911 5,312 – 470 – C.4 Transfers to other categories of impaired exposure” – 22,332 1,166 1,019 – C.5 Other decreases – 1,552 – – –
D. Total closing adjustments 334,962 100,727 441 4,578 – of which: sold but not derecognized 21,838 9,085 – – –

526
A. CREDIT QUALITY
A.2 CLASSIFICATION OF EXPOSURES BASED ON EXTERNAL AND INTERNAL RATINGS
A.2.1 Distribution of cash and “off-balance sheet” exposures by external rating class
This table is not provided given the modest value of exposures with an “external rating”.
A.2.2 Distribution of cash and “off-balance sheet” exposures by internal rating class
Group banks do not currently use a system of internal ratings for the process of making and renewing loans. Accordingly, this table has not been provided. A.3 DISTRIBUTION OF GUARANTEED EXPOSURES BY TYPE OF GUARANTEE
A.3.1 Guaranteed cash exposures to banks and customers
A.3.2 Guaranteed “off-balance sheet” exposures to banks and customers
Amount Secured guarantees Unsecured guarantees Total of exposure (1) (2) (1)+(2) Buildings Securities Other Credit derivatives Guarantees assets Governments Other public Banks Other Governments Other public Banks Other entities parties entities parties 1. Guaranteed exposures to banks: 25,856 – – – – – – – – – – 25,856 25,856 1.1 fully guaranteed 25,856 – – – – – – – – – – 25,856 25,856 1.2 partially guaranteed – – – – – – – – – – – – –
2. Guaranteed exposures to customers: 13,095,320 8,681,949 420,349 164,162 – – – – – 12,158 91,410 3,215,666 12,585,694 2.1 fully guaranteed 12,075,753 8,614,407 334,238 95,916 – – – – – 7,020 39,430 2,984,742 12,075,753 2.2 partially guaranteed 1,019,567 67,542 86,111 68,246 – – – – – 5,138 51,980 230,924 509,941
Amount Secured guarantees Unsecured guarantees Total of exposure (1) (2) (1)+(2) Buildings Securities Other Credit derivatives Guarantees assets Governments Other public Banks Other Governments Other public Banks Other entities parties entities parties 1. Guaranteed exposures to banks: 18,310 – – – – – – – 18,308 – 2 – 18,310 1.1 fully guaranteed 18,310 – – – – – – – 18,308 – 2 – 18,310 1.2 partially guaranteed – – – – – – – – – – – – –
2. Guaranteed exposures to customers: 769,339 9,945 35,563 51,696 – – – – – – 2,728 502,071 602,003 2.1 fully guaranteed 473,290 8,142 23,709 41,569 – – – – – – 1,124 398,746 473,290 2.2 partially guaranteed 296,049 1,803 11,854 10,127 – – – – – – 1,604 103,325 128,713

527
Amount Secured guarantees Unsecured guarantees Total of exposure (1) (2) (1)+(2) Buildings Securities Other Credit derivatives Guarantees assets Governments Other public Banks Other Governments Other public Banks Other entities parties entities parties 1. Guaranteed exposures to banks: 25,856 – – – – – – – – – – 25,856 25,856 1.1 fully guaranteed 25,856 – – – – – – – – – – 25,856 25,856 1.2 partially guaranteed – – – – – – – – – – – – –
2. Guaranteed exposures to customers: 13,095,320 8,681,949 420,349 164,162 – – – – – 12,158 91,410 3,215,666 12,585,694 2.1 fully guaranteed 12,075,753 8,614,407 334,238 95,916 – – – – – 7,020 39,430 2,984,742 12,075,753 2.2 partially guaranteed 1,019,567 67,542 86,111 68,246 – – – – – 5,138 51,980 230,924 509,941
Amount Secured guarantees Unsecured guarantees Total of exposure (1) (2) (1)+(2) Buildings Securities Other Credit derivatives Guarantees assets Governments Other public Banks Other Governments Other public Banks Other entities parties entities parties 1. Guaranteed exposures to banks: 18,310 – – – – – – – 18,308 – 2 – 18,310 1.1 fully guaranteed 18,310 – – – – – – – 18,308 – 2 – 18,310 1.2 partially guaranteed – – – – – – – – – – – – –
2. Guaranteed exposures to customers: 769,339 9,945 35,563 51,696 – – – – – – 2,728 502,071 602,003 2.1 fully guaranteed 473,290 8,142 23,709 41,569 – – – – – – 1,124 398,746 473,290 2.2 partially guaranteed 296,049 1,803 11,854 10,127 – – – – – – 1,604 103,325 128,713

528
A.3.3 Guaranteed impaired cash exposures to banks and customers
Amount Amount Guarantees (fair value) of exposure guaranteed Secured guarantees Unsecured guarantees Buildings Securities Other Credit derivatives assets Governments Other Banks Financial Insurance Non-financial Other and central public companies companies institutions issuers banks entities 1. Guaranteed exposures to banks: – – – – – – – – – – – – 1.1 150% or more – – – – – – – – – – – – 1.2 between 100% and 150% – – – – – – – – – – – – 1.3 between 50% and 100% – – – – – – – – – – – – 1.4 up to 50% – – – – – – – – – – – –
2. Guaranteed exposures to customers: 591,078 573,177 389,641 4,648 12,932 – – – – – – – 2.1 150% or more 220,134 220,134 184,740 687 1,850 – – – – – – – 2.2 between 100% and 150% 148,132 148,132 134,824 255 979 – – – – – – – 2.3 between 50% and 100% 193,158 191,043 66,856 3,474 6,719 – – – – – – – 2.4 up to 50% 29,654 13,868 3,221 232 3,384 – – – – – – –
Guarantees (fair value) Total Excess Unsecured guarantees fair value Guarantees guarantee Governments Other Banks Financial Insurance Non- Other and central public companies companies financial parties banks entities institutions
1. Guaranteed exposures to banks: – – – – – – – – – 1.1 150% or more – – – – – – – – – 1.2 between 100% and 150% – – – – – – – – – 1.3 between 50% and 100% – – – – – – – – – 1.4 up to 50% – – – – – – – – –
2. Guaranteed exposures to customers: – 928 1,670 5,328 1,410 28,061 128,559 573,177 – 2.1 150% or more – 752 835 1,506 1,090 18,560 10,114 220,134 – 2.2 between 100% and 150% – – 204 297 – 2,607 8,966 148,132 – 2.3 between 50% and 100% – – 59 3,165 – 6,161 104,609 191,043 – 2.4 up to 50% – 176 572 360 320 733 4,870 13,868 –
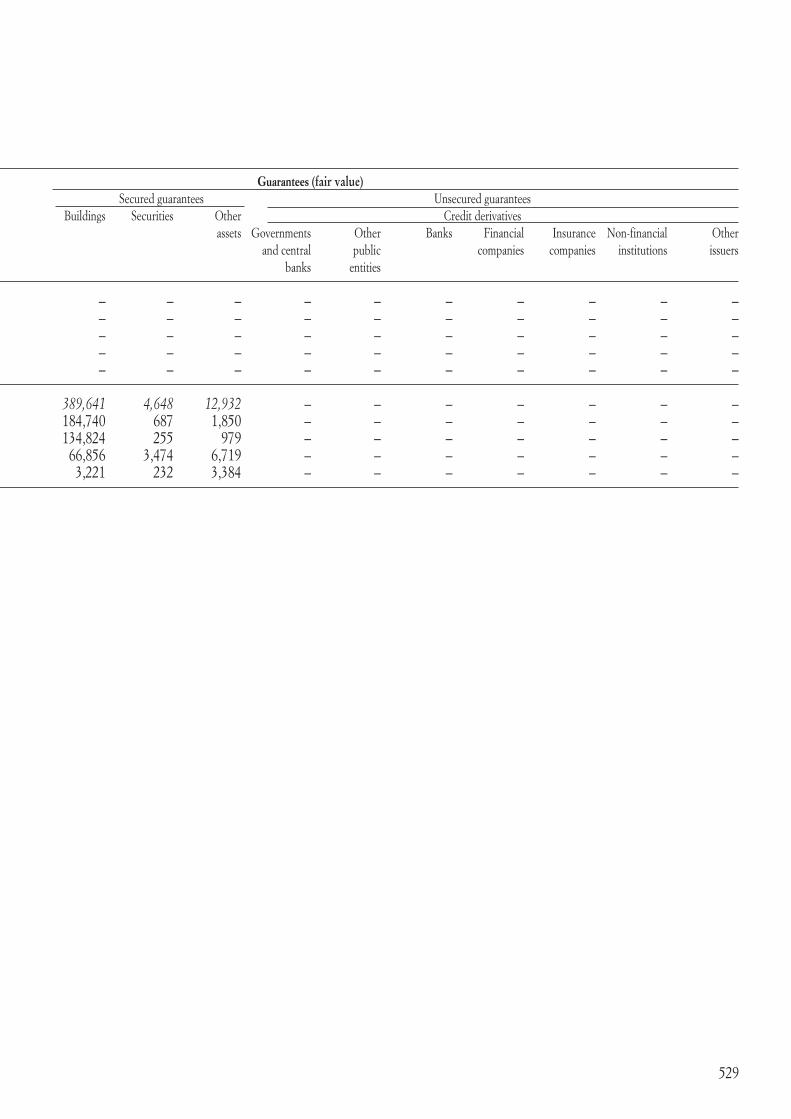
529
Amount Amount Guarantees (fair value) of exposure guaranteed Secured guarantees Unsecured guarantees Buildings Securities Other Credit derivatives assets Governments Other Banks Financial Insurance Non-financial Other and central public companies companies institutions issuers banks entities 1. Guaranteed exposures to banks: – – – – – – – – – – – – 1.1 150% or more – – – – – – – – – – – – 1.2 between 100% and 150% – – – – – – – – – – – – 1.3 between 50% and 100% – – – – – – – – – – – – 1.4 up to 50% – – – – – – – – – – – –
2. Guaranteed exposures to customers: 591,078 573,177 389,641 4,648 12,932 – – – – – – – 2.1 150% or more 220,134 220,134 184,740 687 1,850 – – – – – – – 2.2 between 100% and 150% 148,132 148,132 134,824 255 979 – – – – – – – 2.3 between 50% and 100% 193,158 191,043 66,856 3,474 6,719 – – – – – – – 2.4 up to 50% 29,654 13,868 3,221 232 3,384 – – – – – – –

530
A.3.4 Guaranteed impaired “off-balance sheet” exposures to banks and customers
Guarantees (fair value) Total Excess Unsecured guarantees fair value Guarantees guarantee Governments Other Banks Financial Insurance Non- Other and central public companies companies financial parties banks entities institutions
1. Guaranteed exposures to banks: – – – – – – – – – 1.1 150% or more – – – – – – – – – 1.2 between 100% and 150% – – – – – – – – – 1.3 between 50% and 100% – – – – – – – – – 1.4 up to 50% – – – – – – – – –
2. Guaranteed exposures to customers: – – 80 281 – 234 4,598 9,083 – 2.1 150% or more – – – 74 – 22 286 1,926 – 2.2 between 100% and 150% – – 80 – – 81 8 707 – 2.3 between 50% and 100% – – – 207 – 44 3,573 5,620 – 2.4 up to 50% – – – – – 87 731 830 –
Amount Amount Guarantees (fair value) of exposure guaranteed Secured guarantees Unsecured guarantees Buildings Securities Other Credit derivatives assets Governments Other Banks Financial Insurance Non-financial Other and central public companies companies institutions issuers banks entities 1. Guaranteed exposures to banks: – – – – – – – – – – – – 1.1 150% or more – – – – – – – – – – – – 1.2 between 100% and 150% – – – – – – – – – – – – 1.3 between 50% and 100% – – – – – – – – – – – – 1.4 up to 50% – – – – – – – – – – – –
2. Guaranteed exposures to customers: 12,626 9,083 647 1,017 2,226 – – – – – – – 2.1 150% or more 1,926 1,926 647 872 25 – – – – – – – 2.2 between 100% and 150% 707 707 – 13 525 – – – – – – – 2.3 between 50% and 100% 8,330 5,620 – 120 1,676 – – – – – – – 2.4 up to 50% 1,663 830 – 12 – – – – – – – –

531
Amount Amount Guarantees (fair value) of exposure guaranteed Secured guarantees Unsecured guarantees Buildings Securities Other Credit derivatives assets Governments Other Banks Financial Insurance Non-financial Other and central public companies companies institutions issuers banks entities 1. Guaranteed exposures to banks: – – – – – – – – – – – – 1.1 150% or more – – – – – – – – – – – – 1.2 between 100% and 150% – – – – – – – – – – – – 1.3 between 50% and 100% – – – – – – – – – – – – 1.4 up to 50% – – – – – – – – – – – –
2. Guaranteed exposures to customers: 12,626 9,083 647 1,017 2,226 – – – – – – – 2.1 150% or more 1,926 1,926 647 872 25 – – – – – – – 2.2 between 100% and 150% 707 707 – 13 525 – – – – – – – 2.3 between 50% and 100% 8,330 5,620 – 120 1,676 – – – – – – – 2.4 up to 50% 1,663 830 – 12 – – – – – – – –

532
B. DISTRIBUTION AND CONCENTRATION OF CREDIT
B.1 Distribution by sector of cash and “off-balance sheet” exposures to customers
Exposures/Counterparties Governments and central banks Other public entities Financial companies Gross Specific Portfolio Net Gross Specific Portfolio Net Gross Specific Portfolio Net exposure adjustments adjustments exposure exposure adjustments adjustments exposure exposure adjustments adjustments exposure
A. Cash exposure A.1 Non-performing loans – – – – – – – – 1,989 (1,674) – 315 A.2 Watchlist loans – – – – 1 – – 1 292 (68) – 224 A.3 Restructured exposures – – – – – – – – – – – – A.4 Past due exposures – – – – – – – – 7 (1) – 6 A.5 Other exposures 60,127 x – 60,127 39,671 x – 39,671 1,065,163 x (18,292) 1,046,871
Total 60,127 – – 60,127 39,672 – – 39,672 1,067,451 (1,743) (18,292) 1,047,416
B. “Off-balance sheet” exposures A.1 Non-performing loans – – – – – – – – 2 – – 2 A.2 Watchlist loans – – – – – – – – – – – – A.3 Other impaired assets – – – – – – – – – – – – A.4 Other exposures 69,328 x – 69,328 26,419 x – 26,419 92,552 x – 92,552
Total 69,328 – – 69,328 26,419 – – 26,419 92,554 – – 92,554
Total at 31/12/2008 129,455 – – 129,455 66,091 – – 66,091 1,160,005 (1,743) (18,292) 1,139,970
Total at 31/12/2007 175,518 – – 175,518 43,439 – (9) 43,430 1,774,781 (1,772) (7,625) 1,765,384
Exposures/Counterparties Insurance companies Non-financial institutions Other parties Gross Specific Portfolio Net Gross Specific Portfolio Net Gross Specific Portfolio Net exposure adjustments adjustments exposure exposure adjustments adjustments exposure exposure adjustments adjustments exposure
A. Cash exposure A.1 Non-performing loans – – – – 419,709 (213,393) – 206,316 256,882 (119,895) – 136,987 A.2 Watchlist loans – – – – 290,241 (61,604) – 228,637 161,469 (39,055) – 122,414 A.3 Restructured exposures 684 (42) – 642 27,133 (399) – 26,734 – – – – A.4 Past due exposures 12 – – 12 61,247 (2,455) – 58,792 64,983 (2,122) – 62,861 A.5 Other exposures 51,331 x (2) 51,329 13,749,462 x (73,590) 13,675,872 7,407,545 x (21,309) 7,386,236
Total 52,027 (42) (2) 51,983 14,547,792 (277,851) (73,590) 14,196,351 7,890,879 (161,072) (21,309) 7,708,498
B. “Off-balance sheet” exposures A.1 Non-performing loans – – – – 1,513 (455) – 1,058 26 – – 26 A.2 Watchlist loans – – – – 9,755 (583) – 9,172 4,404 – – 4,404 A.3 Other impaired assets – – – – 2,034 (25) – 2,009 22,339 – – 22,339 A.4 Other exposures 20,630 x – 20,630 3,069,334 x (218) 3,069,116 1,663,456 x – 1,663,456
Total 20,630 – – 20,630 3,082,636 (1,063) (218) 3,081,355 1,690,225 – – 1,690,225
Total at 31/12/2008 72,657 (42) (2) 72,613 17,630,428 (278,914) (73,808) 17,277,706 9,581,104 (161,072) (21,309) 9,398,723
Total at 31/12/2007 294,103 – (17) 294,086 15,148,684 (207,602) (103,110) 14,837,972 9,278,113 (92,181) (39,595) 9,146,337

533
Exposures/Counterparties Governments and central banks Other public entities Financial companies Gross Specific Portfolio Net Gross Specific Portfolio Net Gross Specific Portfolio Net exposure adjustments adjustments exposure exposure adjustments adjustments exposure exposure adjustments adjustments exposure
A. Cash exposure A.1 Non-performing loans – – – – – – – – 1,989 (1,674) – 315 A.2 Watchlist loans – – – – 1 – – 1 292 (68) – 224 A.3 Restructured exposures – – – – – – – – – – – – A.4 Past due exposures – – – – – – – – 7 (1) – 6 A.5 Other exposures 60,127 x – 60,127 39,671 x – 39,671 1,065,163 x (18,292) 1,046,871
Total 60,127 – – 60,127 39,672 – – 39,672 1,067,451 (1,743) (18,292) 1,047,416
B. “Off-balance sheet” exposures A.1 Non-performing loans – – – – – – – – 2 – – 2 A.2 Watchlist loans – – – – – – – – – – – – A.3 Other impaired assets – – – – – – – – – – – – A.4 Other exposures 69,328 x – 69,328 26,419 x – 26,419 92,552 x – 92,552
Total 69,328 – – 69,328 26,419 – – 26,419 92,554 – – 92,554
Total at 31/12/2008 129,455 – – 129,455 66,091 – – 66,091 1,160,005 (1,743) (18,292) 1,139,970
Total at 31/12/2007 175,518 – – 175,518 43,439 – (9) 43,430 1,774,781 (1,772) (7,625) 1,765,384
Exposures/Counterparties Insurance companies Non-financial institutions Other parties Gross Specific Portfolio Net Gross Specific Portfolio Net Gross Specific Portfolio Net exposure adjustments adjustments exposure exposure adjustments adjustments exposure exposure adjustments adjustments exposure
A. Cash exposure A.1 Non-performing loans – – – – 419,709 (213,393) – 206,316 256,882 (119,895) – 136,987 A.2 Watchlist loans – – – – 290,241 (61,604) – 228,637 161,469 (39,055) – 122,414 A.3 Restructured exposures 684 (42) – 642 27,133 (399) – 26,734 – – – – A.4 Past due exposures 12 – – 12 61,247 (2,455) – 58,792 64,983 (2,122) – 62,861 A.5 Other exposures 51,331 x (2) 51,329 13,749,462 x (73,590) 13,675,872 7,407,545 x (21,309) 7,386,236
Total 52,027 (42) (2) 51,983 14,547,792 (277,851) (73,590) 14,196,351 7,890,879 (161,072) (21,309) 7,708,498
B. “Off-balance sheet” exposures A.1 Non-performing loans – – – – 1,513 (455) – 1,058 26 – – 26 A.2 Watchlist loans – – – – 9,755 (583) – 9,172 4,404 – – 4,404 A.3 Other impaired assets – – – – 2,034 (25) – 2,009 22,339 – – 22,339 A.4 Other exposures 20,630 x – 20,630 3,069,334 x (218) 3,069,116 1,663,456 x – 1,663,456
Total 20,630 – – 20,630 3,082,636 (1,063) (218) 3,081,355 1,690,225 – – 1,690,225
Total at 31/12/2008 72,657 (42) (2) 72,613 17,630,428 (278,914) (73,808) 17,277,706 9,581,104 (161,072) (21,309) 9,398,723
Total at 31/12/2007 294,103 – (17) 294,086 15,148,684 (207,602) (103,110) 14,837,972 9,278,113 (92,181) (39,595) 9,146,337

534
B.2 Distribution of loans to resident non-financial businesses
This table is not being presented, having been suspended under the Bank of Italy’s “Instruc-tions regarding financial statements of banks and financial institutions”.
B.3 Geographical distribution of cash and “off-balance sheet” exposures to customers (book value)
Exposures/Counterparties ITALY OTHER EU COUNTRIES AMERICA ASIA REST OF THE WORLD Gross Net Gross Net Gross Net Gross Net Gross Net exposure exposure exposure exposure exposure exposure exposure exposure exposure exposure
A. Cash exposure A.1 Non-performing loans 672,359 343,533 5,742 63 449 – 30 22 – – A.2 Watchlist loans 451,606 351,004 397 272 – – – – – – A.3 Restructured exposures 27,817 27,376 – – – – – – – – A.4 Past due exposures 126,071 121,505 178 166 – – – – – – A.5 Other exposures 21,941,155 21,843,381 372,885 357,580 49,577 49,485 1,647 1,636 8,035 8,024
Total 23,219,008 22,686,799 379,202 358,081 50,026 49,485 1,677 1,658 8,035 8,024
B. “Off-balance sheet” exposures B.1 Non-performing loans 1,541 1,086 – – – – – – – – B.2 Watchlist loans 14,159 13.576 – – – – – – – – B.3 Other impaired assets 24,373 24,348 – – – – – – – – B.4 Other exposures 4,919,889 4,919,671 21,083 21,083 603 603 – – 144 144
Total 4,959,962 4,958,681 21,083 21,083 603 603 – – 144 144
Total at 31/12/2008 28,178,970 27,645,480 400,285 379,164 50,629 50,088 1,677 1,658 8,179 8,168
Total at 31/12/2007 25,940,637 25,496,344 644,543 637,372 118,742 118,317 1,624 1,604 9,092 9,090

535
Exposures/Counterparties ITALY OTHER EU COUNTRIES AMERICA ASIA REST OF THE WORLD Gross Net Gross Net Gross Net Gross Net Gross Net exposure exposure exposure exposure exposure exposure exposure exposure exposure exposure
A. Cash exposure A.1 Non-performing loans 672,359 343,533 5,742 63 449 – 30 22 – – A.2 Watchlist loans 451,606 351,004 397 272 – – – – – – A.3 Restructured exposures 27,817 27,376 – – – – – – – – A.4 Past due exposures 126,071 121,505 178 166 – – – – – – A.5 Other exposures 21,941,155 21,843,381 372,885 357,580 49,577 49,485 1,647 1,636 8,035 8,024
Total 23,219,008 22,686,799 379,202 358,081 50,026 49,485 1,677 1,658 8,035 8,024
B. “Off-balance sheet” exposures B.1 Non-performing loans 1,541 1,086 – – – – – – – – B.2 Watchlist loans 14,159 13.576 – – – – – – – – B.3 Other impaired assets 24,373 24,348 – – – – – – – – B.4 Other exposures 4,919,889 4,919,671 21,083 21,083 603 603 – – 144 144
Total 4,959,962 4,958,681 21,083 21,083 603 603 – – 144 144
Total at 31/12/2008 28,178,970 27,645,480 400,285 379,164 50,629 50,088 1,677 1,658 8,179 8,168
Total at 31/12/2007 25,940,637 25,496,344 644,543 637,372 118,742 118,317 1,624 1,604 9,092 9,090

536
B.4 Geographical distribution of cash and “off-balance sheet” exposures to banks
B.5 Significant risks (pursuant to supervisory regulations)
31/12/2008 31/12/2007
a) amount 845,921 533,402b) number 3 2
On the basis of instructions issued by the Bank of Italy, positions are considered significant if the overall exposure of a single customer is equal to or greater than 10% of the Group’s regulatory capital. The total weighted amount is indicated.
Exposures/Counterparties ITALY OTHER EU COUNTRIES AMERICA ASIA REST OF THE WORLD Gross Net Gross Net Gross Net Gross Net Gross Net exposure exposure exposure exposure exposure exposure exposure exposure exposure exposure
A. Cash exposure A.1 Non-performing loans – – – – – – – – – – A.2 Watchlist loans – – 1,208 911 – – – – – – A.3 Restructured exposures – – – – – – – – – – A.4 Past due exposures – – – – – – – – – – A.5 Other exposures 2,085,632 2,083,407 257,717 257,717 58,983 58,983 51,235 51,235 2,314 2,314
Total 2,085,632 2,083,407 258,925 258,628 58,983 58,983 51,235 51,235 2,314 2,314
B. “Off-balance sheet” exposures B.1 Non-performing loans – – – – – – – – – – B.2 Watchlist loans – – – – – – – – – – B.3 Other impaired assets – – – – – – – – – – B.4 Other exposures 595,498 595,498 154,307 154,307 33,493 33,493 29,709 29,709 4,663 4,663
Total 595,498 595,498 154,307 154,307 33,493 33,493 29,709 29,709 4,663 4,663
Total at 31/12/2008 2,681,130 2,678,905 413,232 412,935 92,476 92,476 80,944 80,944 6,977 6,977
Total at 31/12/2007 2,298,593 2,298,593 635,812 635,812 109,214 109,214 20,230 20,230 82,163 82,163

537
Exposures/Counterparties ITALY OTHER EU COUNTRIES AMERICA ASIA REST OF THE WORLD Gross Net Gross Net Gross Net Gross Net Gross Net exposure exposure exposure exposure exposure exposure exposure exposure exposure exposure
A. Cash exposure A.1 Non-performing loans – – – – – – – – – – A.2 Watchlist loans – – 1,208 911 – – – – – – A.3 Restructured exposures – – – – – – – – – – A.4 Past due exposures – – – – – – – – – – A.5 Other exposures 2,085,632 2,083,407 257,717 257,717 58,983 58,983 51,235 51,235 2,314 2,314
Total 2,085,632 2,083,407 258,925 258,628 58,983 58,983 51,235 51,235 2,314 2,314
B. “Off-balance sheet” exposures B.1 Non-performing loans – – – – – – – – – – B.2 Watchlist loans – – – – – – – – – – B.3 Other impaired assets – – – – – – – – – – B.4 Other exposures 595,498 595,498 154,307 154,307 33,493 33,493 29,709 29,709 4,663 4,663
Total 595,498 595,498 154,307 154,307 33,493 33,493 29,709 29,709 4,663 4,663
Total at 31/12/2008 2,681,130 2,678,905 413,232 412,935 92,476 92,476 80,944 80,944 6,977 6,977
Total at 31/12/2007 2,298,593 2,298,593 635,812 635,812 109,214 109,214 20,230 20,230 82,163 82,163

538
C. SECURITIZATIONS AND DISPOSAL OF ASSETS
C.1 SECURITIZATIONS
QUALITATIVE INFORMATION
Objectives, strategies and processes underlying securitizations
In terms of the objectives and goals pursued, the Banca Popolare di Vicenza Group has arranged seven securitizations of performing mortgage loans, the first three of whose sole originator was the Parent Bank. The last four were multi-originator securitizations involving the other banks in the Group: Banca Nuova S.p.A. and CariPrato - Cassa di Risparmio di Prato S.p.A.
All these securitizations form a strategic part of the Group’s expectations of further expansion in the mortgage sector and the general process of expanding bank lending, which requires adequate liquidity to be raised in advance to meet future loan applications.
More specifically, the securitizations carried out address the following objectives:− to free up resources on the asset-side of the balance sheet, whilst improving the treasury
position;− to reduce maturity mismatching between deposits and long-term lending;− to reduce the ratio of long-term lending to total lending.
The securitizations arranged between 2000 and 2008 are as follows:− Berica MBS Srl;− Berica 2 MBS Srl;− Berica 3 MBS Srl;− Berica Residential MBS 1 Srl;− Berica 5 Residential MBS Srl;− Berica 6 Residential MBS Srl;− Berica 7 Residential MBS Srl.
With regard to the first four securitizations, set up before 1 January 2004, the securitized assets were not reinstated on the first-time adoption of IAS-IFRS, as allowed by para. 27 of IFRS 1.
The other securitizations known as Berica 5 Residential Mbs, Berica 6 Residential Mbs and Berica 7 Residential Mbs, arranged subsequent to 1 January 2004, do not meet the derecognition requirements of IAS 39 since the Group has subscribed all the junior asset-backed securities issued by the vehicle company. Accordingly, the residual securitized assets have been reinstated at the balance sheet date and the related junior notes eliminated. The securitized assets reported in the balance sheet have been valued using the same principles as for the Group’s own assets.
The individual banks involved in each securitization have signed specific servicing contracts with the respective vehicle companies for the coordination and supervision of the management, administration and collection of the securitized loans, as well as for recovery activities in the event of default by the borrowers.
These contracts require the payment of an annual servicing fee as well as recompense for each position recovered. The function of servicer is carried out by specific structures within the company, whose work has been duly organized and is checked by internal auditors, who verify

539
the propriety and conformity of its conduct with respect to the terms of the servicing contract.Lastly, the banks concerned also act as the administrative servicer for the above securitizations, receiving a contractually-agreed fee from the vehicle company for providing this service.
BPV Finance specializes in managing several investment books, one of which is entirely devoted to ABS. It applies a “buy and hold” policy to ABS deriving from the securitization of residential and commercial mortgages, as well as from other forms of financing, such as leasing, loans to small and medium-sized firms, and credit cards.
The assets underlying the securitizations are geographically distributed in Western Europe and North America, the securities are denominated in euro and must have a minimum single “A” rating (unless otherwise specifically approved by the Board of Directors).
BPV Finance’s front office is responsible for managing and selecting these positions, based on research produced by various investment banks.
The process of monitoring and measuring the risks involves the periodic collection and analysis of the investor reports published by the various originators during the year. In addition, the various positions are monitored through Bloomberg and websites specialized in monitoring such securities, and through publications and analysis produced by the different investment houses.
Internal systems for the measurement and control of risk
The residual risk for each bank in relation to the total insolvency of borrowers represents, for the own securitizations not reinstated, the value of the junior securities (highest degree of subordination) held.
The Group’s banks monitor changes in the key lending and financial variables relating to each securitization.
With a view to controlling risk, special attention is focused on the performance of the trigger ratios, which indicate default and delinquency experience, with respect to the excess spread that remunerates the junior securities held by the Group. The Board of Directors of each bank receives a summary and detailed statement about the securitizations at least every six months.
At the same time as issuing the ABS, a number of back-to-back swaps were arranged in the form of Interest Rate Swaps (IRS), in order to shield the vehicle company (SPV) from interest rate risk.
These instruments are measured at fair value, as discussed below, and are included in the periodic Asset & Liability Management (ALM) analysis which is performed every quarter.
“Berica 7 Residential MBS Srl” securitization
In the wake of the US subprime loans crisis, market conditions in 2008 got dramatically worse, with access to the primary market effectively impossible. This situation caused a massive recourse to asset securitization, particularly of the RMBS (residential mortgage backed securities) kind with the goal of having securities that could be lodged with the European Central Bank for refinancing.

540
The Berica 7 Residential MBS securitization, carried out for this purpose for an amount of over Euro 1 billion at group level, has therefore made it possible to finance assets, used as collateral against short-term loans, at relatively competitive rates in a situation of liquidity stress like at present. Funding repurchase agreements carried out with the ECB by the Group’s individual banks who subscribed the securities in proportion to the loan books sold, have therefore made it possible to diversify the sources of financing relative to the interbank market, also in light of the Central Bank’s numerous injections of liquidity. The characteristics of the securitization are set out below:
in thousand of Euro– Vehicle company: Berica 7 Residential MBS Srl– Interest in vehicle company* 5%– Date of sale of loans 01.10.2008– Type of loans sold Mortgage loans– Quality of loans sold Performing loans– Guarantees on loans sold First mortgage– Geographical area of loans sold Italy– Economic status of debtors sold Individuals– Number of loans sold 8.960– Price of loans sold Euro 969,709– Value of loans sold (principal amount) Euro 968,407– Interest accrued on loans sold Euro 1,302
* Held by BPV Finance (Dublin)
In detail, this securitization commenced on 1 October 2008 with the without-recourse sale of performing loans to a specially-formed special purpose vehicle; these loans represented a total of 9,316 positions with residual principal of Euro 1,012,793,682. The sale price was equal to the nominal value of the receivables sold plus the interest accruing. No profits/losses have emerged since the date of sale.
On 24 December 2008, after certain customers opted for the ABI/MEF renegotiation proposal under the “Tremonti Decree”, 356 positions “left” the securitization with retrospective effect. As a result, the total portfolio of securitized loan has gone down to Euro 968,407,463, relating to 8,960 positions.
On 17 November 2008, the vehicle company issued Euro 930 million in Senior Class A notes, with a Standard & Poor’s investment grade AAA, as well as Euro 75 million in Junior Class B notes, which were not rated. All these securities were subscribed by the originator banks in proportion to the size of the loan portfolio sold.
The yield on these securities is indexed to 3/M Euribor plus a spread of 50 basis points for the senior issue and 100 basis points for the junior issue.

541
The geographical distribution of the securitized assets is as follows:
Results from positions relating to securitizations
The risk relating to the first four own securitizations, not reinstated pursuant to para. 27 of IFRS 1, is represented by the junior securities held and the related back-to-back swaps arranged by the Parent Bank. The fair value of these financial instruments is measured with reference to analysis performed using a financial-mathematical model, developed together with an external firm of consultants, that evaluates the performance of the assets underlying the securities concerned. These evaluations were based on the results of the individual underlying transactions at the reference date, using specific assumptions about the principal variables that affect performance (rate of early loan repayments, rate of recognition of non-performing loans, percentage of expected losses, etc.).
The multi-originator securitizations known as “Berica 5 Residential MBS Srl”, “Berica 6 Residential MBS Srl” and “Berica 7 Residential MBS Srl” do not meet the derecognition requirements established by IAS 39 and, accordingly, the securitized assets and the related liabilities have been reinstated in the financial statements. The residual amount of the loans sold is classified as “assets sold but not derecognized” in asset line item 70 “Loans and advances to customers” and the related liabilities are classified as “liabilities relating to assets sold but not derecognized” in liability line item 20 “Due to customers”2, while the corresponding portion of asset-backed securities relating to these securitizations have been eliminated from the Group’s portfolio. The “interest income and similar revenues” and “interest expense and similar charges” arising during the year in relation to the above assets and liabilities have been recognized, and an overall assessment of the reinstated securitized loans has also been performed with any writedowns reported in “net impairment adjustments to: loans and advances”.
Italy Other Other America Total Northern Northern Central Southern Italy U.E. non U.E. West Italy East Italy Italy and Islands countries countries
Securtized assets 65,514 611,275 119,487 171,264 271 28 568 968,407
2 With reference to the “Berica 7 Residential MBS” securitization completed in the year, no “liabilities relating
to assets sold but not derecognized” have been reported because the related asset-backed securities have been subscribed in full by the originators.

542
The principal results from positions relating to the Group’s own securitizations are summarized in the following table:
Securitizations Interest Positive Writebacks Other income Gains Gains Total income (negative) (writedowns) (expenses) (losses) (losses) on (expense) differential of loans from disposals valuation
1. Berica MBS Srl 1,516 (730) – 157 172 (802) 313 – ABS 1,516 – – – 172 (1,599) 89 – Assets & liabilities reinstated in balance sheet – – – – – – – – Back to back swap – (730) – – – 797 67 – Securitization servicing – – – 157 – – 157 – Other operating income/charges – – – – – – – 2. Berica 2 MBS Srl 810 (775) – 369 632 (2,296) (1,260) – ABS 810 – – 179 632 (1,676) (55) – Assets & liabilities reinstated in balance sheet – – – – – – – – Back to back swap – (775) – – – (620) (1,395) – Securitization servicing – – – 246 – – 246 – Other operating income/charges – – – (56) – – (56)3. Berica 3 MBS Srl 938 (1,161) – 1,717 209 (4,208) (2,505) – ABS 938 – – 1,538 209 (4,252) (1,567) – Assets & liabilities reinstated in balance sheet – – – – – – – – Back to back swap – (1,161) – – – 44 (1,117) – Securitization servicing – – – 290 – – 290 – Other operating income/charges – – – (111) – – (111)4. Berica Residential MBS 1 Srl 1,762 (1,773) – 166 (291) 2,894 2,758 – ABS 1,762 – – – (291) – 1,471 – Assets & liabilities reinstated in balance sheet – – – – – – – – Back to back swap – (1,773) – – – 2,894 1,121 – Securitization servicing – – – 566 – – 566 – Other operating income/charges – – – (400) – – (400)5. Berica 5 Residential MBS Srl 11,123 (1,506) (7,019) 14 5,094 658 8,364 – ABS – – – – 5,094 – 5,094 – Assets & liabilities reinstated in balance sheet 11,123 – (7,019) – – – 4,104 – Back to back swap – (1,506) – – – 658 (848) – Securitization servicing – – – 696 – – 696 – Other operating income/charges – – – (682) – – (682)6. Berica 6 Residential MBS Srl 18,473 1,050 (13,748) 200 7,228 – 13,203 – ABS – – – – 7,228 – 7,228 – Assets & liabilities reinstated in balance sheet 18,473 – (13,748) – – – 4,725 – Back to back swap – 1,050 – 295 – – 1,345 – Securitization servicing – – – 1,441 – – 1,441 – Other operating income/charges – – – (1,536) – – (1,536)7. Berica 7 Residential MBS Srl 13,793 1,567 (2,172) 402 – – 13,590 – ABS – – – – – – – – Assets & liabilities reinstated in balance sheet 13,793 – (2,172) – – – 11,621 – Back to back swap – 1,567 – – – – 1,567 – Securitization servicing – – – 402 – – 402 – Other operating income/charges – – – – – – – 8. Siena Mortagages 02–23 Srl – (359) – 83 – – (276) – ABS – – – – – – – – Assets & liabilities reinstated in balance sheet – – – – – – – – Back to back swap – (359) – – – – (359) – Securitization servicing – – – 83 – – 83 – Other operating income/charges – – – – – – –
Total 48,415 (3,687) (22,939) 3,108 13,044 (3,754) 34,187

543
Positions held by the Group in connection with third-party securitizations generated Euro 9.5 million in interest income in the year and Euro 8.9 million in negative changes in fair value through the income statement.
The above table does not contain changes in fair value relating to the junior notes issued as part of the “Berica Residential MBS 1” securitization, which are recognized through equity; these notes are held by the Parent Bank and classified as “Financial assets available for sale”. This reserve reported a positive balance of Euro 2,006 at 31 December 2008.
The valuation reserves for “Financial assets available for sale” include a negative amount of Euro 4,998 calculated on the basis of the fair value at the reclassification date (1 July 2008) of mezzanine securities held by BPV Finance, issued as part of the Group’s own securitizations which have not been reinstated in the balance sheet, and which were reclassified from “Financial assets available for sale” to “Loans and advances to customers”, under the amendment to IAS 39 “Financial instruments: recognition and measurement” contained in the document “Reclassification of Financial Assets” published by the IASB on 13 October 2008 and endorsed by the European Commission on 15 October 2008 with Regulation CE 1004/2008.
Rating agencies
The following rating agencies were engaged to perform due diligence work on the above transactions and assign ratings to the related ABS: – Berica MBS Srl securitization: Standard & Poor’s, Fitch Ratings and Moody’s;– Berica 2 MBS Srl securitization: Standard & Poor’s and Fitch Ratings;– Berica 3 MBS Srl securitization: Standard & Poor’s and Fitch Ratings;– Berica Residential MBS 1 Srl securitization: Standard & Poor’s and Fitch Ratings;– Berica 5 Residential MBS Srl securitization: Standard & Poor’s and Fitch Ratings;– Berica 6 Residential MBS Srl securitization: Standard & Poor’s, Fitch Ratings and Moody’s;– Berica 7 Residential MBS Srl securitization: Standard & Poor’s.

544
C.1.1 Exposures deriving from securitizations analyzed by quality of the underlying assets
C.1.2 Exposures deriving from the principal “own” securitizations analyzed by type of asset securitized and type of exposure
Quality of underlying assets/Exposures Cash exposure Guarantees given Credit lines Senior Mezzanine Junior Senior Mezzanine Junior Senior Mezzanine Junior Gross Net Gross Net Gross Net Gross Net Gross Net Gross Net Gross Net Gross Net Gross Net exposure exposure exposure exposure exposure exposure exposure exposure exposure exposure exposure exposure exposure exposure exposure exposure exposure exposure A. Own securitized underlying assets: 1,136,078 1,136,078 76,936 76,936 193,403 158,461 – – – – – – 11,419 11,419 – – – – a) Impaired loans – – – – – – – – – – – – – – – – – – b) Other 1,136,078 1,136,078 76,936 76,936 193,403 158,461 – – – – – – 11,419 11,419 – – – –
B. Third-party securitized underlying assets: 57,155 57,155 96,547 96,547 1,122 1,122 – – – – – – – – – – – – a) Impaired loans – – – – – – – – – – – – – – – – – – b) Other 57,155 57,155 96,547 96,547 1,122 1,122 – – – – – – – – – – – –
Type of assets securitized/Exposures Cash exposure Guarantees given Credit lines Senior Mezzanine Junior Senior Mezzanine Junior Senior Mezzanine Junior Book Writedowns/ Book Writedowns/ Book Writedowns/ Book Writedowns/ Book Writedowns/ Book Writedowns/ Book Writedowns/ Book Writedowns/ Book Writedowns/ value writebacks value writebacks value writebacks value writebacks value writebacks value writebacks value writebacks value writebacks value writebacks A. Fully derecognized A.1 Berica MBS S.r.l. – mortgage loans – – – – 2,942 (16,465) – – – – – – – – – – – – A.2 Berica 2 MBS S.r.l. – mortgage loans – – 7,437 – 5,692 (9,695) – – – – – – 2,119 – – – – – A.3 Berica 3 MBS S.r.l. – mortgage loans – – 9,153 – 8,443 (8,782) – – – – – – 2,200 – – – – – A.4 Berica Residential MBS 1 S.r.l. – mortgage loans 1,130 – 8,478 – 26,297 – – – – – – – 3,000 – – – – – A.5 Siena Mortgages 02–3 S.r.l. – residential mortgage loans – – – – 87 – – – – – – – – – – – – – B. Partially derecognized C. Not derecognized C.1 Berica Residential MBS 5 S.r.l. – mortgage loans 60,716 – 20,897 – 35,400 – – – – – – – 4,100 – – – – – C.2 Berica 6 Residential MBS S.r.l. – mortgage loans 144,232 – 9,684 – 4,600 – – – – – – – – – – – – – C.3 Berica 7 Residential MBS S.r.l. – mortgage loans 930,000 – 21,287 – 75,000 – – – – – – – – – – – – –

545
Quality of underlying assets/Exposures Cash exposure Guarantees given Credit lines Senior Mezzanine Junior Senior Mezzanine Junior Senior Mezzanine Junior Gross Net Gross Net Gross Net Gross Net Gross Net Gross Net Gross Net Gross Net Gross Net exposure exposure exposure exposure exposure exposure exposure exposure exposure exposure exposure exposure exposure exposure exposure exposure exposure exposure A. Own securitized underlying assets: 1,136,078 1,136,078 76,936 76,936 193,403 158,461 – – – – – – 11,419 11,419 – – – – a) Impaired loans – – – – – – – – – – – – – – – – – – b) Other 1,136,078 1,136,078 76,936 76,936 193,403 158,461 – – – – – – 11,419 11,419 – – – –
B. Third-party securitized underlying assets: 57,155 57,155 96,547 96,547 1,122 1,122 – – – – – – – – – – – – a) Impaired loans – – – – – – – – – – – – – – – – – – b) Other 57,155 57,155 96,547 96,547 1,122 1,122 – – – – – – – – – – – –
Type of assets securitized/Exposures Cash exposure Guarantees given Credit lines Senior Mezzanine Junior Senior Mezzanine Junior Senior Mezzanine Junior Book Writedowns/ Book Writedowns/ Book Writedowns/ Book Writedowns/ Book Writedowns/ Book Writedowns/ Book Writedowns/ Book Writedowns/ Book Writedowns/ value writebacks value writebacks value writebacks value writebacks value writebacks value writebacks value writebacks value writebacks value writebacks A. Fully derecognized A.1 Berica MBS S.r.l. – mortgage loans – – – – 2,942 (16,465) – – – – – – – – – – – – A.2 Berica 2 MBS S.r.l. – mortgage loans – – 7,437 – 5,692 (9,695) – – – – – – 2,119 – – – – – A.3 Berica 3 MBS S.r.l. – mortgage loans – – 9,153 – 8,443 (8,782) – – – – – – 2,200 – – – – – A.4 Berica Residential MBS 1 S.r.l. – mortgage loans 1,130 – 8,478 – 26,297 – – – – – – – 3,000 – – – – – A.5 Siena Mortgages 02–3 S.r.l. – residential mortgage loans – – – – 87 – – – – – – – – – – – – – B. Partially derecognized C. Not derecognized C.1 Berica Residential MBS 5 S.r.l. – mortgage loans 60,716 – 20,897 – 35,400 – – – – – – – 4,100 – – – – – C.2 Berica 6 Residential MBS S.r.l. – mortgage loans 144,232 – 9,684 – 4,600 – – – – – – – – – – – – – C.3 Berica 7 Residential MBS S.r.l. – mortgage loans 930,000 – 21,287 – 75,000 – – – – – – – – – – – – –

546
C.1.3 Exposures deriving from the principal “third-party” securitizations analyzed by type of asset securitized and type of exposure
Type of assets securitized/Exposures Cash exposure Guarantees given Credit lines Senior Mezzanine Junior Senior Mezzanine Junior Senior Mezzanine Junior Book Writedowns/ Book Writedowns/ Book Writedowns/ Book Writedowns/ Book Writedowns/ Book Writedowns/ Book Writedowns/ Book Writedowns/ Book Writedowns/ value writebacks value writebacks value writebacks value writebacks value writebacks value writebacks value writebacks value writebacks value writebacks A.1 Memo Sec S.r.l. – Palermo 2 – performing receivables of Palermo Chamber of Commerce (annual fees) 259 – – – – – – – – – – – – – – – – – A.2 Libeccio S.r.l. – performing and non-performing receivables of Palermo Chamber of Commerce (annual fees) 577 – – – – – – – – – – – – – – – – – A.3 Boreale Finance S.r.l. – Regione of Sicily - tradesperson loans 7,081 – – – – – – – – – – – – – – – – – A.4 Turchese Finance S.r.l. – performing and non-performing receivables of Palermo Chamber of Commerce (annual fees) 8,011 – 2,964 – – – – – – – – – – – – – – – A.5 Turchese Finance S.r.l. – performing and non-performing receivables of Palermo Chamber of Commerce (annual fees) 8,098 – 3,583 – – – – – – – – – – – – – – – A.6 OXFORD 2005–1 A1 – loans 1,943 – – – – – – – – – – – – – – – – – A.7 RECR IV A3 – commercial mortgages 4,747 – – – – – – – – – – – – – – – – – A.8 MESDG 1 B – commercial mortgages 3,779 – – – – – – – – – – – – – – – – – A.9 PARGN 11X CB – commercial mortgages – – 3,294 – – – – – – – – – – – – – – – A.10 PARGN 12X C1B – commercial mortgages – – 5,602 – – – – – – – – – – – – – – – A.11 PARGN 10X C1B – commercial mortgages – – 2,872 – – – – – – – – – – – – – – – A.12 PARGN 15X CB – commercial mortgages – – 3,479 – – – – – – – – – – – – – – – A.13 EURO 21 B – commercial mortgages – – 1,813 – – – – – – – – – – – – – – – A.14 EURO 21 C – commercial mortgages – – 2,912 – – – – – – – – – – – – – – – A.15 PTRMO 2006–1 C – commercial mortgages – – 3,031 – – – – – – – – – – – – – – – A.16 IMMEO 2 C – commercial mortgages – – 2,510 – – – – – – – – – – – – – – – A.17 FIPF 1 A2 – commercial mortgages – – 5,512 – – – – – – – – – – – – – – – A.18 PROUD 1 C – commercial mortgages – – 2,087 – – – – – – – – – – – – – – – A.19 FORES 1 B – commercial mortgages – – 3,378 – – – – – – – – – – – – – – – A.20 LOGGI 2003–1 A – commercial mortgages 2,774 – – – – – – – – – – – – – – – – –

547
Type of assets securitized/Exposures Cash exposure Guarantees given Credit lines Senior Mezzanine Junior Senior Mezzanine Junior Senior Mezzanine Junior Book Writedowns/ Book Writedowns/ Book Writedowns/ Book Writedowns/ Book Writedowns/ Book Writedowns/ Book Writedowns/ Book Writedowns/ Book Writedowns/ value writebacks value writebacks value writebacks value writebacks value writebacks value writebacks value writebacks value writebacks value writebacks A.1 Memo Sec S.r.l. – Palermo 2 – performing receivables of Palermo Chamber of Commerce (annual fees) 259 – – – – – – – – – – – – – – – – – A.2 Libeccio S.r.l. – performing and non-performing receivables of Palermo Chamber of Commerce (annual fees) 577 – – – – – – – – – – – – – – – – – A.3 Boreale Finance S.r.l. – Regione of Sicily - tradesperson loans 7,081 – – – – – – – – – – – – – – – – – A.4 Turchese Finance S.r.l. – performing and non-performing receivables of Palermo Chamber of Commerce (annual fees) 8,011 – 2,964 – – – – – – – – – – – – – – – A.5 Turchese Finance S.r.l. – performing and non-performing receivables of Palermo Chamber of Commerce (annual fees) 8,098 – 3,583 – – – – – – – – – – – – – – – A.6 OXFORD 2005–1 A1 – loans 1,943 – – – – – – – – – – – – – – – – – A.7 RECR IV A3 – commercial mortgages 4,747 – – – – – – – – – – – – – – – – – A.8 MESDG 1 B – commercial mortgages 3,779 – – – – – – – – – – – – – – – – – A.9 PARGN 11X CB – commercial mortgages – – 3,294 – – – – – – – – – – – – – – – A.10 PARGN 12X C1B – commercial mortgages – – 5,602 – – – – – – – – – – – – – – – A.11 PARGN 10X C1B – commercial mortgages – – 2,872 – – – – – – – – – – – – – – – A.12 PARGN 15X CB – commercial mortgages – – 3,479 – – – – – – – – – – – – – – – A.13 EURO 21 B – commercial mortgages – – 1,813 – – – – – – – – – – – – – – – A.14 EURO 21 C – commercial mortgages – – 2,912 – – – – – – – – – – – – – – – A.15 PTRMO 2006–1 C – commercial mortgages – – 3,031 – – – – – – – – – – – – – – – A.16 IMMEO 2 C – commercial mortgages – – 2,510 – – – – – – – – – – – – – – – A.17 FIPF 1 A2 – commercial mortgages – – 5,512 – – – – – – – – – – – – – – – A.18 PROUD 1 C – commercial mortgages – – 2,087 – – – – – – – – – – – – – – – A.19 FORES 1 B – commercial mortgages – – 3,378 – – – – – – – – – – – – – – – A.20 LOGGI 2003–1 A – commercial mortgages 2,774 – – – – – – – – – – – – – – – – –

548
Type of assets securitized/Exposures Cash exposure Guarantees given Credit lines Senior Mezzanine Junior Senior Mezzanine Junior Senior Mezzanine Junior Book Writedowns/ Book Writedowns/ Book Writedowns/ Book Writedowns/ Book Writedowns/ Book Writedowns/ Book Writedowns/ Book Writedowns/ Book Writedowns/ value writebacks value writebacks value writebacks value writebacks value writebacks value writebacks value writebacks value writebacks value writebacks A.21 CREDI 3 B – Residential mortgages – – 3,251 – – – – – – – – – – – – – – – A.22 EMACP 2006–3 C – Residential mortgages – – 1,940 – – – – – – – – – – – – – – – A.23 GRAN 2003–2 2B – Residential mortgages – – 1,228 – – – – – – – – – – – – – – – A.24 GRAN 2004–1 2B – Residential mortgages – – 2,971 – – – – – – – – – – – – – – – A.25 UCI 17 B – Residential mortgages – – 5,406 – – – – – – – – – – – – – – – A.26 GRANM 2007–2 3M2 – Residential mortgages – – 5,770 – – – – – – – – – – – – – – – A.27 HARVT IV A1B – Loans 2,882 – – – – – – – – – – – – – – – – – A.28 SANTM 3 A3 – Loans 12,427 – – – – – – – – – – – – – – – – – A.29 EIRLES TWO LIMITED 303 – Loans 4,577 – – – – – – – – – – – – – – – – – A.30 EXPLO 2004–1 M Taxes and social contributions – – 6,990 – – – – – – – – – – – – – – – A.31 CLISL 1X II – Loans – – 3,521 – – – – – – – – – – – – – – – A.32 AYTBT 2006–II B – Loans – – 4,307 – – – – – – – – – – – – – – – A.33 AYTDS 2006–I B – Loans – – 3,184 – – – – – – – – – – – – – – – A.34 RMFE IV–A III – Loans – – 3,213 – – – – – – – – – – – – – – – A.35 AGRI 2006–1 B – Leases – – 3,211 – – – – – – – – – – – – – – – A.36 PHARM 2 B – Leases – – 3,162 – – – – – – – – – – – – – – – A.37 LOCAT 2005–3 B – Leases – – 3,341 – – – – – – – – – – – – – – – A.38 SMILS 05 C – Loans – – 2,015 – – – – – – – – – – – – – – – A.39 Siena Mortgages 02–3 S.r.l. – Residential mortgages – – – – 1,122 – – – – – – – – – – – – –

549
Type of assets securitized/Exposures Cash exposure Guarantees given Credit lines Senior Mezzanine Junior Senior Mezzanine Junior Senior Mezzanine Junior Book Writedowns/ Book Writedowns/ Book Writedowns/ Book Writedowns/ Book Writedowns/ Book Writedowns/ Book Writedowns/ Book Writedowns/ Book Writedowns/ value writebacks value writebacks value writebacks value writebacks value writebacks value writebacks value writebacks value writebacks value writebacks A.21 CREDI 3 B – Residential mortgages – – 3,251 – – – – – – – – – – – – – – – A.22 EMACP 2006–3 C – Residential mortgages – – 1,940 – – – – – – – – – – – – – – – A.23 GRAN 2003–2 2B – Residential mortgages – – 1,228 – – – – – – – – – – – – – – – A.24 GRAN 2004–1 2B – Residential mortgages – – 2,971 – – – – – – – – – – – – – – – A.25 UCI 17 B – Residential mortgages – – 5,406 – – – – – – – – – – – – – – – A.26 GRANM 2007–2 3M2 – Residential mortgages – – 5,770 – – – – – – – – – – – – – – – A.27 HARVT IV A1B – Loans 2,882 – – – – – – – – – – – – – – – – – A.28 SANTM 3 A3 – Loans 12,427 – – – – – – – – – – – – – – – – – A.29 EIRLES TWO LIMITED 303 – Loans 4,577 – – – – – – – – – – – – – – – – – A.30 EXPLO 2004–1 M Taxes and social contributions – – 6,990 – – – – – – – – – – – – – – – A.31 CLISL 1X II – Loans – – 3,521 – – – – – – – – – – – – – – – A.32 AYTBT 2006–II B – Loans – – 4,307 – – – – – – – – – – – – – – – A.33 AYTDS 2006–I B – Loans – – 3,184 – – – – – – – – – – – – – – – A.34 RMFE IV–A III – Loans – – 3,213 – – – – – – – – – – – – – – – A.35 AGRI 2006–1 B – Leases – – 3,211 – – – – – – – – – – – – – – – A.36 PHARM 2 B – Leases – – 3,162 – – – – – – – – – – – – – – – A.37 LOCAT 2005–3 B – Leases – – 3,341 – – – – – – – – – – – – – – – A.38 SMILS 05 C – Loans – – 2,015 – – – – – – – – – – – – – – – A.39 Siena Mortgages 02–3 S.r.l. – Residential mortgages – – – – 1,122 – – – – – – – – – – – – –

550
C.1.4 Exposures to securitizations analyzed by portfolio and by type
Apart from the cash exposures presented in these tables, there are also Euro 7,319 in undrawn credit lines available to special purpose entities set up for the Group’s own securitizations and not reinstated in the balance sheet.
C.1.5 Total amount of securitized assets underlying the junior securities or other forms of credit instrument
Assets/Amounts Traditional securitizations Synthetic securitizations A. Own underlying assets: 2.999.957 – A.1 Fully derecognized 623.824 1. Non-performing loans 21.206 x 2. Watchlist loans 20.641 x 3. Restructured exposures – x 4. Past due exposures – x 5. Other assets 581.977 x A.2 Partially derecognized – 1. Non-performing loans – x 2. Watchlist loans – x 3. Restructured exposures – x 4. Past due exposures – x 5. Other assets – x A.3 Not derecognized 2.376.133 – 1. Non-performing loans 31.308 – 2. Watchlist loans 50.900 – 3. Restructured exposures – – 4. Past due exposures – – 5. Other assets 2.293.925 – B. Third-party underlying assets: 580.177 – B.1 Non-performing loans 6.627 – B.2 Watchlist loans 1.500 – B.3 Restructured exposures – – B.4 Past due exposures – – B.5 Other assets 572.050 –
Exposure/Portfolio Financial Financial Financial Financial Loans 31/12/2008 31/12/2007 assets assets at assets assets held for available helt to trading fair value for sale maturity
1. Cash exposure 8,535 17,077 22,922 – 175,949 224,483 264,735 – senior 6,520 – – – 51,765 58,285 68,207 – mezzanine 2,015 – – – 119,600 121,615 139,184 – junior – 17,077 22,922 – 4,584 44,583 57,344 2. “Off-balance sheet” exposures – – – – – – – – senior – – – – – – – – mezzanine – – – – – – – – junior – – – – – – –

551
C.1.6 Holdings in vehicle companies
Name Registered offices Interest % - – Berica MBS S.r.l. Milan 5.0– Berica 2 MBS S.r.l. Vicenza 5.0– Berica 3 MBS S.r.l. Vicenza 5.0– Berica Residential MBS 1 S.r.l. Vicenza 5.0– Berica 5 Residential MBS S.r.l. Vicenza 5.0– Berica 6 Residential MBS S.r.l. Vicenza 5.0– Berica 7 Residential MBS S.r.l. Vicenza 5.0– Siena Mortgages 02–03 S.r.l. Conegliano (TV) 0.9
C.1.7 Servicer activities - collection of securitized loans and redemption of securities issued by the vehicle company
1 Class A securities2 Class B securities
Type of assets Securitized assets Loans collecting Percentage of securities redeemedsecuritized/exposures 31/12/2008 during the year 31/12/2008 Impaired Performing Impaired Performing Senior Mezzanine Junior assets assets assets assets Impaired Performing Impaired Performing Impaired Performing assets assets assets assets assets assets
– Berica MBS S.r.l. – 46,206 – 18,437 – 100.00% – 73.16% – 4.75%– Berica 2 MBS S.r.l. – 95,721 – 25,821 – 100.00% – 40.75% – 17.78%– Berica 3 MBS S.r.l. – 138,216 – 36,436 – 66.15% – – – 20.27%– Berica Residential MBS 1 S.r.l. – 298,859 – 62,346 – 48.47% – – – 29.94%– Berica 5 Residential MBS S.r.l. – 415,787 – 72,776 – 36.36% – – – – – Berica 6 Residential MBS S.r.l. – 1,021,518 – 170,571 – 100.00% – 16.14% – – – Berica 7 Residential MBS S.r.l. – 938,826 – 28,400 – – – – – – – Siena Mortgages 02–3 S.r.l. – 44,822 – 13,873 – 60.94% – – – 98.34%– Memo Sec S.r.l. – Palermo 1 – – – 1.476 100.00% 100.00% – – – 100.00%– Memo Sec S.r.l. – Palermo 2 1,091 – 559 – 100.00%1 83.12%2 – – – – – Libeccio S.r.l. 2,018 – 388 – 94.05%1 – – – – – – Rubino Finance S.r.l. – 38,886 – 10,421 41.20% – – – – – – Boreale Finance S.r.l. – 4,951 – 1,327 – – – – – – – Turchese Finance S.r.l. – 5,497 – 1,107 – – – – – – – Turchese Finance S.r.l. (second tranche) – 4,078 – 10,146 – – – – – –

552
C.2 DISPOSALS
C.2.1 Financial assets sold but not derecognized
Type of assets Financial assets Loans and advances Loans and advances Totalsecuritized/exposures held to maturity to banks to customers A B C A B C A B C
A. Cash assets 5,140 – – 276,003 – – 2,424,517 – – 2,750,542 1. Debt securities 5,140 – – 276,003 – – 48,384 – – 374,409 2. Equities x x x x x x x x x – 3. Mutual funds x x x x x x x x x – 4. Loans – – – – – – 2,293,925 – – 2,293,925 5. Impaired assets – – – – – – 82,208 – – 82,208
B. Derivatives x x x x x x x x x –
Total at 31/12/2008 5,140 – – 276,003 – – 2,424,517 – – 2,750,542
Total at 31/12/2007 – – – – – – 1,702,650 – – 1,783,202
Type of assets Financial assets Financial assets Financial assetssecuritized/exposures held for trading at fair value available for sale A B C A B C A B C
A. Cash assets 15,695 – – – – – 29,187 – – 1. Debt securities 15,695 – – – – – 29,187 – – 2. Equities – – – – – – – – – 3. Mutual funds – – – – – – – – – 4. Loans – – – – – – – – – 5. Impaired assets – – – – – – – – –
B. Derivatives – – – x x x x x x
Total at 31/12/2008 15,695 – – – – – 29,187 – –
Total at 31/12/2007 80,552 – – – – – – – –

553
C.2.2 Financial liabilities relating to financial assets sold but not derecognized
Liabilities/Assets portfolio Financial Financial Financial Financial Loans and Loans and Total assets assets at assets assets advances advances held for fair value available held to to banks to customers trading for sale maturity
1. Due to customers 5,472 – 28,545 – 229,930 1,152,678 1,416,625 a) for assets recognized in full 5,472 – 28,545 – 229,930 1,152,678 1,416,625 b) for assets recognized in part – – – – – – – 2. Deposits from banks 10,032 – – 4,777 38,437 46,475 99,721 a) for assets recognized in full 10,032 – – 4,777 38,437 46,475 99,721 b) for assets recognized in part – – – – – – – 3. Debt securities in issue – – – – – – – a) for assets recognized in full – – – – – – – b) for assets recognized in part – – – – – – –
Total at 31/12/2008 15,504 – 28,545 4,777 268,367 1,199,153 1,516,346
Total at 31/12/2007 77,137 – – – – 1,631,160 1,708,297

554
D. MODELS USED FOR MEASURING CREDIT RISK
The new internal ratings models for the retail segment (private individuals and small businesses), small corporate segment (with turnover of Euro 2.5 to 50 million) and mid corporate segment (with turnover of Euro 50 to 200 million) went live in the Banca Popolare di Vicenza’s commercial network at the end of April 2008 and in Banca Nuova e CariPrato at the start of June. For the time being, the segment of companies (or groups) with turnover in excess of Euro 200 million has been left out, since its model, mainly based on the logic of experience, is still being perfected by the Parent Bank.
The models currently in use have been tested by analysts in the Parent Bank, and by those in Banca Nuova and CariPrato with reference to the corporate segment. These tests have provided very reassuring results in terms of the coincidence of the experts’ opinions with the output of these models.
It will be recalled that the SGR monitoring system (Sistema di Gestione dei Rischi or risk management system) has been in use at the Parent Bank since October 2004 and at Cariprato and Banca Nuova since April 2005. Its principal use is to provide early warnings to alert account managers of the existence of problems with certain customers and to make them take corrective action against the higher risk situations, in accordance with precisely defined procedures.
The SGR system has undergone a major revision, with the aim of making this monitoring tool still more effective in quickly identifying anomalies, and has involved the definition of a new model and calculation algorithm for performance scoring, as well as interfacing the system with the new internal ratings models.
The new anomalies reporting system has been completed from a software point of view and, once tested, it will enter operation in the first half of 2009.

555
1.2 – MARKET RISK
1.2.1 INTEREST RATE RISK - TRADING BOOK FOR SUPERVISORY PURPOSES
QUALITATIVE INFORMATION
A. General aspects
Interest rate risk represents the risk of incurring losses due to adverse trends in the rates of return on debt securities and other interest rate related instruments. Three types of interest-rate risk can be identified:• level:riskassociatedwithanabsolutechangeintheforwardstructureofrisk-freeinterest
rates (parallel shifts in the yield curve);• curveandfundamental:thefirstidentifiestheriskderivingfromarelativechangeinthe
structure of interest rates, while the second derives from the imperfect correlation of the elements of a position, particularly with reference to hedging strategies;
• creditspread:riskderivingfromchangesinthepricesofbondsandcreditderivativesassociated with unexpected changes in the issuer’s credit rating.
The investment policy adopted by the Group focuses on optimizing operating results and on reducing their volatility. The crisis of the financial system turned into a dramatic crisis of liquidity and credit over the course of 2008. The effects of the liquidity crisis gradually retreated in the last few weeks of 2008, with a reduction in spreads between the discount rate and Eonia rate on the one hand, and Euribor rates on the other; the credit crisis spread to financial and government securities and to credit default swaps on the sovereign debt of less virtuous countries, even after major public intervention wherever necessary.
At the same time, the price of raw materials and energy experienced a dramatic reversal in trend, giving rise to a deflationary scenario. The European Central Bank was therefore forced to intervene on as many as three occasions, progressively cutting discount rates by 1.75% in less than six months. The short-term rate curve has incorporated new expectations about monetary policy, while the long-term rate curve has got gradually steeper.
The portfolio of own bonds was significantly reduced in the first six months of the year while the interest rate derivatives portfolio, for some time prudently focused on basic risks relating to the various Euribor tenors (3, 6 and 12 months), offset the losses arising on residual bond positions with gains on directional and basic positions.
B. Management and measurement of interest rate risk
The control of all financial risks is centralized for all Group banks and BPV Finance Plc within the Risk Management unit of the Parent Bank’s Plyearsng and Risk Management Department. Operating and stop loss limits are also used to guide the activity of individual desks, which is monitored and controlled by the Financial Control office in the Finance Division of Banca Popolare di Vicenza.
VaR limits underwent their annual revision and were approved by the Board of Directors on 29 January 2008 in its resolution on “Finance limits on VaR for BPVi and proposals for group companies”.

556
The Board delegated the General Manager at the same meeting to define, at the recommendation of the Finance and ALMS Committee, the other operating and stop loss limits on a consistent basis with the VaR limits assigned.
The new structure of operating limits for the Global Markets Department has three levels:• Operatinglimits(sensitivity,delta,vega,creditconcentrationandrisk);• Stoplosslimits;• ValueatRisk(VaR)limits.
The structure of operating and position limits, applying in the first half of 2008, involved using the following indicators:• Exchangeraterisk:deltainmonetaryterms(cashequivalentpositionforspot,forwardand
rate derivative portfolios), vega (change in market value on a change in volatility);• Equityrisk:deltaequivalent(marketvalueofsharesandcashequivalentpositionforequity
derivatives);• Interestraterisk:sensitivity(changeinprofitorlossonaparallelshiftinthereference
curve by one-hundredth of a point), vega (change in market value on a change in volatility);• Maximuminvestedamount:bookvalueofcashsecurities/funds(grossofthederivatives’
delta) to ensure that assets and liabilities are balanced within the assigned budget limits;• Limitsontheacceptanceofcreditrisk:overalllimitsareestablishedfortheexposureto
each rating class, especially those below investment grade; • Limitsontheconcentrationinindividualissuers/issues,withtighterrestrictionsasthe
rating class of the issuer diminishes.
The structure of operating limits, applying from 1 July as per the instruction of 30 June 2008, is based on:• Sensitivity (interest rate risk): change in profit or loss that would occur in the event of a
parallel shift in the reference curve by one basis point;• Vega (interest rate risk): change in profit or loss that would occur in the event of a 1%
change in volatility (or in the volatility curves) for the financial instrument;• Vega (exchange rate risk): change in profit or loss that would occur in the event of a 1%
change in the volatility of the exchange rate;• Delta in cash terms (exchange rate risk): cash equivalent position for spot, forward and
exchange rate derivative portfolios;• Delta equivalent (equity risk): market value of shares and cash equivalent position for equity
and stock index derivatives;• Maximum invested amount (position): book value of cash securities/funds (gross of the
derivatives’ delta) to ensure that assets and liabilities are balanced within the assigned budget limits;
• Concentration: maximum limit, in percentage or absolute terms, on an asset that can be held in the portfolio (by instrument or issuer);
• Credit Risk Sensitivity (credit risk): change in profit or loss that would occur in the event of a shift in the reference curve by one-hundredth of a point.
Stop loss limits are monitored on a monthly basis against profit & loss results inclusive of cumulative financing since the start of the month, and on an annual basis in a report to management for appropriate decision if cumulative losses exceed twice the monthly stop loss limits.
Responsibility for the daily first level checks on operating limits, position limits and stop loss limits is entrusted to the Financial Control office within the Parent Company’s Finance Division.

557
Value at Risk (VaR) represents an estimate of the maximum potential loss on a portfolio due to adverse market conditions. VaR limits are calculated assuming a 99% confidence level and a holding period of 1 day3, using for the estimated Value at Risk, calculated on a daily basis, a historical simulation based on around 250 scenarios.
Since mid February 2008, the revision of the portfolio tree of the Parent Bank’s Finance Division has made it necessary to amend VaR reporting to make it consistent with other management reports produced by the Bank. The results presented therefore refer to the new structure in the period 18 February - 31 December4, while the full-year results have been recalculated for consistency of method. This change represents a substantial revision in the limit which was previously defined by the investment’s predominant risk factor (interest rate - equity - exchange rate), but now refers to overall operations by Global Markets, while still presenting an analysis of VaR for individual strategies identified in the new portfolio tree5.
The Risk Management unit in the Parent Bank’s Plyearsng and Risk Management Department is responsible for reporting VaR. This analysis is performed on a daily basis, partly to check that the VaR remains within the parameters established and defined by the Board of Directors of the Parent Bank.
For the purposes of having a standard representation of the underlying risk factors and a consistent method of calculation, the Parent Bank has migrated to a single risk calculation system using the VaR program by Murex. This decision has the benefit not only of using the same system of position keeping as for managing and measuring risks but also of producing important operational synergies. In addition, operational risks have also been reduced as a result of no longer having to replicate in a third system the positions and deals contained in the Parent Bank’s official system. The adoption of the new system has involved the addition of adequate backtesting and stress testing functionalities, allowing VaR reports to present different scenarios in adverse market conditions and allowing risk measurements to be validated by daily comparison between the estimated loss and the theoretical profit & loss.
In the case of BPV Finance, the Parent Bank’s Risk Management unit updates Murex with the subsidiary’s risk positions for calculating Value at Risk using the specific calculation module. The results of VaR and stress testing are sent every day6 to the General Manager of BPV Finance.
The calculation of VaR extends to all the trading book reported for supervisory purposes.
3 The holding period was previously 10 working days.4
VaR was monitored in the previous period against the limits set under the previous resolution.5 Global Markets has defined its sphere of operation as the following areas:
Global Strategies – currently not active Interest Rate Strategies – investments in the interest rates area regarding both securities and derivatives and with
institutional counterparties and bank customers Equity Strategies – share investments both in cash and derivatives Credit Strategies – currently not active, involves activities concentrated on credit-worthiness of assets Forex & Commodities – forex operations in cash and derivatives, the commodities sector is currently not active Opportunistic – management of securities and funds relating to previous investments Secondary Market – trading activity on the secondary market both in branded and third-party paper6
Previously once a week.

558
As regards backtesting the model’s results, the Clean Backtesting approach has been used, which compares the VaR calculated at time t for estimating the expected loss in time t+1 with the P&L change computed using market parameters between time t and time t+1 for the same portfolio.
The stress test, instead, measures potential vulnerability upon the occurrence of exceptional, improbable events that are nonetheless possible. The analysis – which refers to the period 18 February to 31 December 2008 - was carried out on a daily basis and the scenarios used represent 8 levels of extreme, symmetrical variations regarding stock markets, parallel shifts in rate curves, trends in exchange rates, volatility and credit spreads. The following assumptions have been made regarding correlation between risk factors:• rises in the stock market are accompanied by downward movements in government
securities, meaning that shares and risk-free rates rise at the same time;• declinesinthestockmarketarefollowedbyacollapseinthecorporatebondmarket(high
correlation between equities and credit spread), meaning credit spreads rise when stock markets fall.
The VaR models are used solely for management control purposes and are not used for the calculation of capital adequacy. The trends in VaR for the Bank’s trading book are described in point 2 below.

559
QUANTITATIVE DISCLOSURES
1. Trading book for supervisory purposes: distribution by residual maturity (repricing date) of recor-ded financial assets and liabilities and financial derivatives
Currency: Euro
Type/Redisual duration Sight Up to 3 to 6 6 to 12 1 to 5 to 10 Over Unspecified 3 months months months months years 10 years duration 1. Cash assets 1.1 Debt securities – with early redemption option – – – – – – – – – other – 3,676 17,145 16,316 19,689 6,897 20 – 1.2 Other assets – – – – – – – –
2. Cash liabilities 2.1 Debt securities – with early redemption option – – – – – – – – – other – – – – – – – – 2.2 Other liabilities – – – – – – – –
3. Financial derivatives 3.1 With underlying security – Options – long positions – 15,675 18,399 36,324 – – – – – short positions – (55,389) (16,194) (42,653) (699) – – – – Other derivatives – long positions – 147,988 131,614 89,364 305 29 – – – short positions – (185,909) (87,889) 66,791 (29,055) (6) – – 3.2 Without underlying security – Options – long positions 7,676 5,153,462 1,837,983 2,431,005 7,765,503 67,872 9,433 – – short positions (9,199) (4,280,481) (2,756,127) (2,651,422) (7,500,240) (66,438) (9,029) – – Other derivatives – long positions – 11,888,646 3,858,470 1,551,323 4,804,928 1,373,231 336,003 – – short positions – (9,827,194) (2,177,651) (4,562,343) (5,650,386) (1,358,280) (251,914) –

560
Currency: USD
Type/Redisual duration Sight Up to 3 to 6 6 to 12 1 to 5 to 10 Over Unspecified 3 months months months months years 10 years duration 1. Cash assets 1.1 Debt securities – with early redemption option – – – – – – – – – other – – – – – – – – 1.2 Other assets – – – – – – – –
2. Cash liabilities 2.1 Debt securities – with early redemption option – – – – – – – – – other – – – – – – – – 2.2 Other liabilities – – – – – – – –
3. Financial derivatives 3.1 With underlying security – Options – long positions – 81,383 5,867 39,039 695 – – – – short positions – (9,071) (11,171) (44,434) – – – – – Other derivatives – long positions – 98,447 49,014 64,814 – – – – – short positions – (171,430) (35,639) (73,124) – – – – 3.2 Without underlying security – Options – long positions – 7,139 3,353 – 7,647 – – – – short positions – – – – (18,139) – – – – Other derivatives – long positions – 772,562 7,767 8,168 1,293,238 – – – – short positions – (1,172,402) (286,785) (175,368) (469,232) – – –

561
Currency: GBP
Type/Redisual duration Sight Up to 3 to 6 6 to 12 1 to 5 to 10 Over Unspecified 3 months months months months years 10 years duration 1. Cash assets 1.1 Debt securities – with early redemption option – – – – – – – – – other – – – – – – – – 1.2 Other assets – – – – – – – –
2. Cash liabilities 2.1 Debt securities – with early redemption option – – – – – – – – – other – – – – – – – – 2.2 Other liabilities – – – – – – – –
3. Financial derivatives 3.1 With underlying security – Options – long positions – 167 – 129 – – – – – short positions – (5,509) – – – – – – – Other derivatives – long positions – 13,302 – – – – – – – short positions – (11,444) – – – – – – 3.2 Without underlying security – Options – long positions – – – – – – – – – short positions – – – – – – – – – Other derivatives – long positions – 4,452 2,170 84 – – – – – short positions – (3,670) (1,795) (20) – – – –

562
Currency: CHF
Type/Redisual duration Sight Up to 3 to 6 6 to 12 1 to 5 to 10 Over Unspecified 3 months months months months years 10 years duration 1. Cash assets 1.1 Debt securities – with early redemption option – – – – – – – – – other – – – – – – – – 1.2 Other assets – – – – – – – –
2. Cash liabilities 2.1 Debt securities – with early redemption option – – – – – – – – – other – – – – – – – – 2.2 Other liabilities – – – – – – – –
3. Financial derivatives 3.1 With underlying security – Options – long positions – – – 8,291 – – – – – short positions – – – (14,687) – – – – – Other derivatives – long positions – 57,141 – 5,890 – – – – – short positions – – – – – – – – 3.2 Without underlying security – Options – long positions – – – – – – – – – short positions – – – – – – – – – Other derivatives – long positions – 134 – – – – – – – short positions – (155) – – – – – –

563
Currency: JPY
Type/Redisual duration Sight Up to 3 to 6 6 to 12 1 to 5 to 10 Over Unspecified 3 months months months months years 10 years duration 1. Cash assets 1.1 Debt securities – with early redemption option – – – – – – – – – other – – – – – – – – 1.2 Other assets – – – – – – – –
2. Cash liabilities 2.1 Debt securities – with early redemption option – – – – – – – – – other – – – – – – – – 2.2 Other liabilities – – – – – – – –
3. Financial derivatives 3.1 With underlying security – Options – long positions – 77 10,601 17,729 – – – – – short positions – – (6,923) – – – – – – Other derivatives – long positions – 396 1,952 – – – – – – short positions – (14,941) (4,538) (18,815) – – – – 3.2 Without underlying security – Options – long positions – – – – – – – – – short positions – – – – – – – – – Other derivatives – long positions – 64,354 7,937 1,070 – – – – – short positions – (63,068) (7,611) (1,070) – – – –

564
Currency: Other currencies
Type/Redisual duration Sight Up to 3 to 6 6 to 12 1 to 5 to 10 Over Unspecified 3 months months months months years 10 years duration 1. Cash assets 1.1 Debt securities – with early redemption option – – – – – – – – – other – – – – – – – – 1.2 Other assets – – – – – – – –
2. Cash liabilities 2.1 Debt securities – with early redemption option – – – – – – – – – other – – – – – – – – 2.2 Other liabilities – – – – – – – –
3. Financial derivatives 3.1 With underlying security – Options – long positions – 6,095 – – – – – – – short positions – (27,316) – – – – – – – Other derivatives – long positions – 32,307 15,627 – – – – – – short positions – (18,819) (15,439) – – – – – 3.2 Without underlying security – Options – long positions – – – – – – – – – short positions – – – – – – – – – Other derivatives – long positions – 14,505 – – – – – – – short positions – (3,845) – – – – – –

565
2. Trading book for supervisory purposes: internal models and other methods of sensitivity analysis
Trends in VaR and Stress Tests for the trading book in 2008 are discussed below for both the Parent Bank and BPV Finance. The results of backtesting will also be presented for the Parent Bank.
The daily analysis of VaR for BPV Finance refers to the period 18 February – 31 December, before when monitoring was carried out on a weekly basis.
VaR – Stress Test Scenario – Backtesting of entire trading book of Banca Popolare di Vicenza
During the period examined, the Parent Bank’s 1-day 99% Value at Risk (VaR) averaged Euro 931 thousand, with a maximum of Euro 2 million and minimum of Euro 455 thousand.
In terms of limit absorption, this averaged 19.27% with a maximum of 31.89% and a minimum of 10.11%.
At 31 December 2008, 1-day 99% VaR of the entire book was Euro 541 thousand, representing a limit absorption of 12.02%.
As for the Stress Test Scenario applied to the entire book, the following table reports the minimum, maximum, average and period-end figures (in thousands of euro) of the various scenarios.
Scenario 1 Scenario 2 Scenario 3 Scenario 4 Scenario 5 Scenario 6 Scenario 7 Scenario 8
MAX 55.146 33.401 18.184 7.354 5.253 10.289 16.514 23.914MIN -56.090 -34.374 -15.431 -6.181 -5.713 -10.028 -13.567 -17.259AVERAGE 9.864 5.577 3.224 1.389 -79 509 1.656 3.13831/12/08 40.386 23.319 12.072 4.762 -3.122 -6.355 -9.589 -12.925

566
The following chart presents the results of backtesting during 2008.
There were three cases of negative P&L in excess of VaR, one due to movements in rate curves and sudden widespread increases in credit spreads (particularly hitting securities in the financial sector) and two of a technical nature due to a structural change in the underlying pricing model.
The limited change in the risk indicator, particularly in the last part of the year, reflects a persistently prudent approach to investment strategy in an extremely volatile market context with ever higher credit spreads, and the reclassification of securities from their original accounting designation as permitted by the recent Amendments to IAS 397, with their consequent departure from the scope of VaR monitoring and entry into the scope of interest rate risk monitored by the ALM system.
VaR – Stress Test Scenario of entire trading book of BPV Finance
During the period examined, BPV Finance’s 1-day 99% Value at Risk (VaR) averaged Euro 2.7 million, with a maximum of Euro 2.99 million and minimum of Euro 1.8 thousand.
In terms of limit absorption, this averaged 106.76% with a maximum of 119.55% and a minimum of 70.73%.
At 31 December 2008, 1-day 99% VaR of the entire book was Euro 2,556 million, representing a limit absorption of 102.22%.The absorption of VaR must be seen not only in light of the situation on financial markets, but also of the significant absorption caused by the Berica securities relating to the Group’s securitizations. Excluding this investment, absorption was below the maximum limit during the period monitored.
7 This refers to the Amendments to IAS 39 “Financial instruments: recognition and measurement” and to IFRS 7 “Financial instruments: disclosures” contained in the document “Reclassification of Financial Assets”, endorsed by the European Commission on 15 October 2008.

567
Following the recent amendments to IAS 39 and IFRS 7, BPV Finance has reclassified around Euro 400 million in AFS and HFT assets to “loans and receivables”.
As for the Stress Test Scenario applied to the entire book, the following table reports the minimum, maximum, average and period-end figures (in thousands of euro) of the various scenarios.
Scenario 1 Scenario 2 Scenario 3 Scenario 4 Scenario 5 Scenario 6 Scenario 7 Scenario 8
MAX -23.595 -17.617 -11.685 -5.809 8.266 16.677 25.223 33.904MIN -31.346 -23.793 -16.044 -8.108 5.729 11.368 16.907 22.337AVERAGE -28.438 -21.331 -14.214 -7.099 7.073 14.109 21.102 28.04431/12/08 -29.509 -22.360 -15.051 -7.592 7.710 15.524 23.431 31.433

568
1.2.2 INTEREST RATE RISK - BANKING BOOK
QUALITATIVE INFORMATION
A. General aspects, management and measurement of interest rate risk
The banking book comprises all the positions other than those included in the trading book for supervisory purposes. The interest rate risk incurred by the BPVi Group in relation to the banking books mainly derives from the activity of transforming maturities. It particularly arises from the mismatch of interest-bearing assets and liabilities in terms of amount, due date and interest rates.
The process of measuring and controlling interest rate risk on the banking book, with the aim of effectively managing the medium/long-term economic and financial equilibrium of the BPVi Group, is governed by a specific policy which defines:• theprinciplesandmethodsofmanagingriskwithreferencetotherolesandresponsibilities
of corporate bodies and functions;• the methods of measuring risk, of defining operating limits, of structuring the risk
management process;• theprinciplesandmethodsusedforconductingstresstests;• theManagementReportingSystem.
Responsibility for managing interest rate risk lies with the Parent Bank’s Board of Directors, which uses the Finance and ALMs Committee and relevant company functions for the strategic and operational management of the same both at the level of the Group and of individual legal entities. In particular, the governance of interest rate risk involves the following bodies at the Parent Bank:• theBoardofDirectorsapprovesthestrategicguidelinesandoperatinglimitsproposedby
the Finance and ALMs Committee, and is periodically informed (at least once a quarter) about changes in exposure to interest rate risk and its operational management;
• theFinanceandALMsCommitteeproposesstrategicguidelinesinitsconsultativecapacityto the Board of Directors, and sends the Finance Division operating instructions for managing interest rate risk;
• the Plyearsng and Risk Management Department is responsible for reporting andmonitoring operating limits, and prepares the topics of discussion in meetings of the Finance and ALMs Committee;
• theFinanceDivisionhasdirectresponsibilityfortheoperationalmanagementofinterestrate risk.

569
The Asset & Liability Management methods adopted by the BPVi Group largely respond to the need to monitor exposure of all interest-earning assets and interest-bearing liabilities to interest rate risk when market conditions change. A report is produced once a month for the purpose of analyzing interest rate exposure of both net interest income and the economic value of the banking book. Rate risk is monitored using the following models:• repricinggapanalysis:estimatesrepricingmismatchesandexpectedchangeinnetinterest
income following a sudden, parallel shock to rate curves (±100 bp);• refixinggapanalysis:estimatesrefixingmismatches(splitbybenchmark,suchastoensure
monitoring of lags and basis risks) for floating-rate positions;• maturitygapanalysisfixedrate:estimatesmismatchesbetweenfixed-ratebalancesheet
positions in the banking book, and the corrective effects of any hedging strategies; • durationgapanalysisandsensitivityanalysis:estimatesmarketvalue,duration,sensitivity,
bucket sensitivity of the economic value of the banking book following a sudden, parallel shock to rate curves of ±100 bp and ±200 bp;
• decalageandcashflowanalysis:reportsthestructuralliquidityposition,expressedasthetime distribution of balance sheet aggregates by type of rate on the basis of due dates.
The analyses performed are static and therefore exclude assumptions about future changes in the structure of assets and liabilities, in terms of volumes and product mix. Sight positions with customers are managed using a specific internal model, which makes it possible to take account of the stickiness of the rate applied to such transactions when market rates change, as well as of the duration of such positions. The inclusion of this “behavioural” model in static ALM analyses completes the collection of methods used to estimate the interest rate risk of the banking book, thereby overcoming the assumption of full and immediate repricing of such positions when market rates change and of the assumptions of the Bank of Italy’s simplified model.
Strategic and operating decisions regarding the banking book by the Finance and ALMs Committee aim to minimize the volatility in net interest income expected in the gapping period (12 months) or rather to minimize the volatility in total economic value when interest rates change.
B. Fair value hedges
The Group has arranged specific hedges for fixed-rate or structured bonds, which are reported using the fair value option (FVO). The strategy underlying the hedge is to reduce the duration of the liability or obtain certainty for the cost of structured issues. During the first half of 2008 instruments and processes were defined for hedging accounting for specific clusters of similar fixed-rate loans (Fair value hedge - micro group hedge). Hedges taken out in the second half of 2008 referred to loans with a maturity of more than 10 years, which do not enjoy the natural hedge created by the core, inelastic component of sight deposits from customers.
C. Cash flow hedges
The Group does not undertake cash flow hedges.

570
QUANTITATIVE DISCLOSURES
1. Banking book: distribution by residual duration (repricing date) of financial assets and liabilities
Currency: Euro
Type/Redisual duration Sight Up to 3 to 6 6 to 12 1 to 5 to 10 Over Unspecified 3 months months months months years 10 years duration 1. Cash assets 1.1 Debt securities – with early redemption option – – – – – – – – – other 12,206 790,067 97,209 25,236 254,863 115,608 13,621 – 1.2 Loans to banks 553,705 568,258 19,972 44,114 8,167 1,905 – 175,850 1.3 Loans to customers – current accounts 4,303,377 – – – – – – – – other loans – with early redemption option 12,265,115 222,605 28,624 35,932 254,401 291,108 668,337 – – other 754,469 62,799 94,026 31,912 197,188 130,538 52 313,475
2. Cash liabilities 2.1 Due to customers – current accounts (9,350,961) – – – – – – – – other payables – with early redemption option – – – – – – – – – other (612,237) (919,003) (1,535) (1,229) (3,359) – – – 2.2 Deposits from banks – current accounts (30,149) – – – – – – – – other payables (117,394) (2,053,531) (462,351) (35,126) (53,176) – – – 2.3 Debt securities – with early redemption option – – – – – – – – – other (1,873,783) (2,550,219) (815,930) (703,463) (2,761,264) (495,814) (15,973) – 2.4 Other liabilities – with early redemption option – – – – – – – – – other – – – – – – – –
3. Financial derivatives 3.1 With underlying security – Options – long positions – – – – – – – – – short positions – – – – – – – – – Other derivatives – long positions – – – – – – – – – short positions – – – – – – – – 3.2 Without underlying security – Options – long positions 1 – 4,301 – – – – – – short positions – (44,358) (4,301) – – – – – – Other derivatives – long positions 1,894,014 302,852 25,000 – – – – – – short positions 336,404 121,855 (468,569) – – – – –

571
Currency: USD
Type/Redisual duration Sight Up to 3 to 6 6 to 12 1 to 5 to 10 Over Unspecified 3 months months months months years 10 years duration 1. Cash assets 1.1 Debt securities – with early redemption option – – – – – – – – – other – – – – 8,269 6,582 – – 1.2 Loans to banks 51,231 23,491 1,456 23,398 – – – – 1.3 Loans to customers – current accounts 196 – – – – – – – – other loans – with early redemption option 99,544 153,253 1,130 5,025 – – – – – other – – 2,282 – – 17,118 – –
2. Cash liabilities 2.1 Due to customers – current accounts (75,774) – – – – – – – – other payables – with early redemption option – – – – – – – – – other (2,386) (22,115) (512) (1,595) – – – – 2.2 Deposits from banks – current accounts (13,203) – – – – – – – – other payables (24,453) (220,390) (9,907) (9,631) – – – – 2.3 Debt securities – with early redemption option – – – – – – – – – other – (3,658) – – – – – – 2.4 Other liabilities – with early redemption option – – – – – – – – – other – – – – – – – –
3. Financial derivatives 3.1 With underlying security – Options – long positions – – – – – – – – – short positions – – – – – – – – – Other derivatives – long positions – – – – 3,593 – – – – short positions – – – – – – – – 3.2 Without underlying security – Options – long positions – – – – – – – – – short positions – – – – – – – – – Other derivatives – long positions – – 58 213 – – – – – short positions – (22,983) – (4,948) – – – –

572
Currency: GBP
Type/Redisual duration Sight Up to 3 to 6 6 to 12 1 to 5 to 10 Over Unspecified 3 months months months months years 10 years duration 1. Cash assets 1.1 Debt securities – with early redemption option – – – – – – – – – other – – – – – – – –1.2 Loans to banks 2,818 – – – – – – –1.3 Loans to customers – current accounts 5 – – – – – – – – other loans – with early redemption option 2,262 1,068 – – – – – – – other 2,292 389 – – – 1,044 – –
2. Cash liabilities 2.1 Due to customers – current accounts (5,141) – – – – – – – – other payables – with early redemption option – – – – – – – – – other – – – (195) – – – –2.2 Deposits from banks – current accounts (1,246) – – – – – – – – other payables – (525) (1,050) – – – – –2.3 Debt securities – with early redemption option – – – – – – – – – other – – – – – – – –2.4 Other liabilities – with early redemption option – – – – – – – – – other – – – – – – – –
3. Financial derivatives 3.1 With underlying security – Options – long positions – – – – – – – – – short positions – – – – – – – – – Other derivatives – long positions – – – – – – – – – short positions – – – – – – – –3.2 Without underlying security – Options – long positions – – – – – – – – – short positions – – – – – – – – – Other derivatives – long positions – 1,050 – – – – – – – short positions – (1,050) – – – – – –

573
Currency: CHF
Type/Redisual duration Sight Up to 3 to 6 6 to 12 1 to 5 to 10 Over Unspecified 3 months months months months years 10 years duration 1. Cash assets 1.1 Debt securities – with early redemption option – – – – – – – – – other – – – – – – – –1.2 Loans to banks 11,995 12,126 – – – – – – 1.3 Loans to customers – current accounts – – – – – – – – – other loans – with early redemption option 34,809 85 68 – – – – – – other – – – – – – – –
2. Cash liabilities 2.1 Due to customers – current accounts (1,055) – – – – – – – – other payables – with early redemption option – – – – – – – – – other – (83) – – – – – –2.2 Deposits from banks – current accounts (4,601) – – – – – – – – other payables – (27,363) – – – – – – 2.3 Debt securities – with early redemption option – – – – – – – – – other – – – – – – – –2.4 Other liabilities – with early redemption option – – – – – – – – – other – – – – – – – –
3. Financial derivatives 3.1 With underlying security – Options – long positions – – – – – – – – – short positions – – – – – – – – – Other derivatives – long positions – – – – – – – – – short positions – – – – – – – –3.2 Without underlying security – Options – long positions – – – – – – – – – short positions – – – – – – – – – Other derivatives – long positions – – – – – – – – – short positions – – – – – – – –

574
Currency: JPY
Type/Redisual duration Sight Up to 3 to 6 6 to 12 1 to 5 to 10 Over Unspecified 3 months months months months years 10 years duration 1. Cash assets 1.1 Debt securities – with early redemption option – – – – – – – – – other – – – – – – – –1.2 Loans to banks 4,101 4,528 875 – – – – –1.3 Loans to customers – current accounts – – – – – – – – – other loans – with early redemption option 13,577 159 – – – – – – – other 4,525 – – – – – – –
2. Cash liabilities 2.1 Due to customers – current accounts (2,860) – – – – – – – – other payables – with early redemption option – – – – – – – – – other – (2,072) (591) – – – – –2.2 Deposits from banks – current accounts (1,969) – – – – – – – – other payables – (6,620) (875) – – – – –2.3 Debt securities – with early redemption option – – – – – – – – – other – – – – – – – –2.4 Other liabilities – with early redemption option – – – – – – – – – other – – – – – – – –
3. Financial derivatives 3.1 With underlying security – Options – long positions – – – – – – – – – short positions – – – – – – – – – Other derivatives – long positions – – – – – – – – – short positions – – – – – – – –3.2 Without underlying security – Options – long positions – – – – – – – – – short positions – – – – – – – – – Other derivatives – long positions – – – 310 – – – – – short positions – (310) – – – – – –

575
Currency: Other currencies
Type/Redisual duration Sight Up to 3 to 6 6 to 12 1 to 5 to 10 Over Unspecified 3 months months months months years 10 years duration 1. Cash assets 1.1 Debt securities – with early redemption option – – – – – – – – – other – – – – – – – –1.2 Loans to banks 7,579 – – – – – – –1.3 Loans to customers – current accounts – – – – – – – – – other loans – with early redemption option 4.519 – – – – – – – – other – – – – – – – –
2. Cash liabilities 2.1 Due to customers – current accounts (5,152) – – – – – – – – other payables – with early redemption option – – – – – – – – – other – (920) (8) – – – – –2.2 Deposits from banks – current accounts (1,324) – – – – – – – – other payables – (1,834) – – – – – –2.3 Debt securities – with early redemption option – – – – – – – – – other – – – – (24,246) – – –2.4 Other liabilities – with early redemption option – – – – – – – – – other – – – – – – – –
3. Financial derivatives 3.1 With underlying security – Options – long positions – – – – – – – – – short positions – – – – – – – – – Other derivatives – long positions – – – – 24,076 – – – – short positions – – – – – – – –3.2 Without underlying security – Options – long positions – – – – – – – – – short positions – – – – – – – – – Other derivatives – long positions – 2,506 – – – – – – – short positions – (2,506) – – – – – –

576
2. Banking book: internal models and other methods of sensitivity analysis
As mentioned earlier, the BPVi Group uses a static ALM model to measure the sensitivity of the banking book’s financial and economic equilibrium to changes in interest rates.
Stress testing represents the collection of qualitative and quantitative techniques used by the Group to assess its vulnerability to adverse market conditions. The Group periodically carries out stress tests to measure and control the interest rate risk of the banking book. Stress tests look at target variables with a view to the «outlook for current profits» and the «outlook for market values». Stress tests are conducted for the following purposes:• tohighlighttheriskgeneratedbyanymismatchesbetweeninterest-earningassetsand
interest-bearing liabilities, and so clearly define what actions are needed to mitigate and keep interest rate risk within the established limits;
• toproducemeasuresofsensitivitytomonitortheoperatinglimitsoninterestraterisk.
The scenarios adopted for measuring the exposure of net interest income to risk assume that rate curves shift by ±100 basis points. The scenarios used to measure the exposure of the banking book’s economic value to risk assume that rate curves shift by ±100 basis points and ±200 basis points. In each of these scenarios, all the risk factors experience the same shock.
As stated before, the estimates are made under the assumption that the structure of the balance sheet remains unchanged in terms of volumes and product mix. The stickiness and persistency of sight positions with customers are managed using a specific internal model.
The principal indicators of the banking book’s interest rate risk at 31 December 2008 are set out below.
Positive shock
▲ Net Interest Income + 100 bps euro 1,927,613 % Net Interest Income 0.30%
▲ Economic value + 100 bps euro -70,593,803 % Regulatory Capital -2.86%
▲ Economic value + 200 bps euro -130,317,847 % Regulatory Capital -5.28%
Negative shock
▲ Net Interest Income - 100 bps euro -1,889,897 % Net Interest Income -0.30%
▲ Economic value - 100 bps euro 83,739,652 % Regulatory Capital 3.39%
▲ Economic value - 200 bps euro 183,434,170 % Regulatory Capital 7.43%

577
The need to assess the Group’s vulnerability to exceptional but plausible events has involved developing more complex, detailed scenarios than the shift ones. The twist scenarios respond to this requirement: the construction of such scenarios (involving curve steepening, flattening and inversion) requires the shocks to be initially applied to specific points of the curves, and that the resulting shock differential be transferred to other points. The use of these scenarios helps estimate sensitivity indicators for many risk factors, represented by individual points of the rate curves.

578
1.2.3 PRICE RISK - TRADING BOOK FOR SUPERVISORY PURPOSES
QUALITATIVE INFORMATION
A. General aspects
Price risk represents the risk associated with changes in the value of equity portfolios due to fluctuations in market prices. This risk is analyzed between:
• Genericrisk:changeinthepriceofanequityinstrumentfollowingfluctuationsinthemarket concerned;
• Specificrisk:changeinthemarketpriceofaspecificequityinstrumentduetorevisedmarket expectations about the financial strength or prospects of the issuer.
Financial year 2008 proved extremely difficult, if not dramatic for equity and credit markets, whose steep correction commencing in the initial quarters of the year got considerably worse over the summer with the financial crisis being exacerbated by the collapse of Lehman Brothers, the US investment bank. Some of the principal reasons for the steep downturn by international stock markets include: continued deterioration of conditions on the real estate market; the rise in commodity and oil prices in the first half of the year, followed by an unprecedented collapse in the second half; the worsening of the international macroeconomic environment, with a significant deterioration in all the principal indicators of consumption, productivity, confidence and employment.
Investment strategy relating to the equities trading book was based on extreme prudence and caution, which in practical terms translated into rigid operating limits on total exposure, concentration and stop-loss, with the aim of ensuring operational tranquillity and effective control of risk in such a volatile market. A “fundamental relative value” approach was adopted rather than one based on trend, building a portfolio of pan-European large-cap shares (with the focus on value shares) selected after detailed intersector and intrasector analysis, and using liquid and diversified stock index futures for hedging (Futures on Eurostoxx50 and Dax). Preference was given to defensive sectors, with a particular focus on Food, Pharma, Consumer Staples, Utility and Energy, while strategically avoiding the Financial sector and considering more cyclical sectors (Auto, Industrial and Basic Resources) only in the event of significant losses and only with a view to short-term investment.
The exposure to equity markets was reduced even further following the collapse of Lehman Brothers, with it effectively being impossible to manage the portfolio profitably in such a fragile, emotional market, in which the level of intra-day volatility combined with the international authorities’ ban on short-selling in certain sectors made it impracticable to operate an “equity market neutral” strategy and very difficult to hedge positions effectively with derivatives.
B. Management and measurement of price risk
The processes for the management and measurement of price risk have been described in section 1.2.1 “Interest rate risk – Trading book for supervisory purposes”, to which reference is made.

579
QUANTITATIVE DISCLOSURES
1. Trading book for supervisory purposes: cash exposures in equities and mutual funds
Assets/Value Book value Listed Unlisted
A. Equities 4,508 –A.1 Shares 4,508 –A.2 Innovative equity instruments – –A.3 Other equities – –B. Mutual funds 1,378 –B.1 Italian – – – open-end harmonized – – – open-end, not harmonized – – – closed-end – – – reserved – – – hedge funds – – B.2 Other EU nations 1,378 – – open-end harmonized – – – open-end, not harmonized – – – closed-end, not harmonized 1,378 –B.3 Non-EU nations – – – open-end – – – closed-end – –
Total 5,886 –
2. Trading book for supervisory purposes: distribution of the exposures in equities and stock indices by principal country and market of listing
Assets/Amounts Listed Unlisted Italy France Germany Switwerland Other A. Equities – long positions 3,422 551 355 111 69 – – short positions – – – – – – B. Unsettled transactions in equities – long positions 33 – – – – – – short positions (12) – – – – – C. Other derivatives on equities – long positions – – – – – – – short positions – – – – (441) – D. Derivatives on equity indices – long positions – – – – – 280,296 – short positions – – – – – (280,296)

580
3. Trading book for supervisory purposes: internal models and other methods of sensitivity analysis
The processes for the management and measurement of price risk in relation to listed equities and mutual funds have been described in section 1.2.1 “Interest rate risk – Trading book for supervisory purposes”, to which reference is made.
1.2.4. PRICE RISK - BANKING BOOK
QUALITATIVE INFORMATION
A. General aspects, management and measurement of price risk
The Group’s banking book comprises minority holdings in equities classified as available for sale (AFS) and investments in mutual funds. Investments in associates are also included.
B. Hedging of price risk
No such hedges are arranged.

581
QUANTITATIVE DISCLOSURES
1. Banking book: cash exposures in listed equities and mutual funds
Assets/Amounts Book value Listed Unlisted
A. Equities 298,896 179,295 A.1 Shares 298,896 176,720 A.2 Innovative equity instruments – – A.3 Other equities – 2,575 B. Mutual funds 5,531 102,493 B.1 Italian 2,611 90,556 – open-end harmonized 2,611 10,717 – open-end, not harmonized – – – closed-end – 10,787 – reserved – 39,208 – hedge funds – 29,844 B.2 Other EU nations 2,920 4,505 – open-end harmonized 640 4,505 – open-end, not harmonized – – – closed-end, not harmonized 2,280 – B.3 Non-EU nations – 7,432 – open-end – – – closed-end – 7,432
Total 304,427 281,788
2. Banking book: internal models and other methods of sensitivity analysis
The processes for the management and measurement of price risk in relation to listed equities and mutual funds have been described in section 1.2.1 “Interest rate risk – Trading book for supervisory purposes”, to which reference is made. Unlisted equities are currently not subject to specific sensitivity analysis.

582
1.2.5 EXCHANGE RATE RISK
QUALITATIVE INFORMATION
A. General aspects, management and measurement of exchange rate risk
Exchange rate risk represents the risk associated with changes in the value of positions denominated in foreign currencies deriving from unexpected variations in the cross rates. Exchange rate risk is principally generated by the support provided for commercial activity in foreign currencies and by trading in foreign securities.
Automatic network systems interfaced with a single position-keeping system enable the Global Markets Department of the Parent Bank to monitor constantly, in real time, the currency flows that are processed instantaneously on the interbank forex market. In addition, a specific unit within the Global Markets Department is responsible for managing on own account positions and products relating to the exchange derivatives needed to meet the various investment and hedging requirements of Group customers.
An advanced management system (Murex, the subject of work in the year to improve input of volatility parameters) and an external pricing system (Super-Derivatives) assure the efficient management of spot, forward and option flows within a specific framework of limits set by the competent organizational bodies.
B. Hedging of exchange rate risk
Currency investment and hedging of exchange rate risk involve transactions that minimize currency exposure (purchase and sale of currency on the interbank market) as well as management of the derivatives book by delta hedging and managing the risk curves within precise limits.

583
QUANTITATIVE DISCLOSURES
1. Breakdown by currency of assets, liabilities and derivatives
2. Internal models and other methods of sensitivity analysis
The exchange rate risk generated by the trading book and the banking book is monitored using the VaR model described in detail in section 1.2.1 “Interest rate risk - Trading book for supervisory purposes”, to which reference is made. With regard to the estimation of exchange-rate risk, reference is made to the tables included in the quantitative information for that section.
Voci Currency US Dollars Sterling Japanese Canadian Swiss Other Yen Dollars Francs currencies A. Financial assets 392,975 9,878 27,765 1,223 59,083 14,540 A.1 Debt securities 14,851 – – – – – A.2 Equities – – – – – 3,665 A.3 Loans to banks 99,576 2,818 9,504 1,197 24,121 6,382 A.4 Loans to customers 278,548 7,060 18,261 26 34,962 4,493 A.5 Other financial assets – – – – – –
B. Other assets – – – – – –
C. Financial liabilities (383,624) (8,157) (14,987) (2,899) (33,102) (30,585)C.1 Deposits from banks (277,584) (2,821) (9,464) (581) (31,964) (2,577)C.2 Due to customers (102,382) (5,336) (5,523) (2,318) (1,138) (3,762)C.3 Debt securities (3,658) – – – – (24,246)C.4 Other financial liabilities – – – – – –
D. Financial derivatives (51,729) (2,134) (12,850) 4,476 56,614 22,715
– Options 62,308 (5,213) 21,484 (21,221) (6,396) – – long positions 145,123 296 28,407 – 8,291 6,095 – short positions (82,815) (5,509) (6,923) (21,221) (14,687) (6,095) – Other derivatives (114,037) 3,079 (34,334) 25,697 63,010 22,715 – long positions 2,297,874 21,058 76,019 26,845 63,165 62,176 – short positions (2,411,911) (17,979) (110,353) (1,148) (155) (39,461)
Total assets 2,835,972 31,232 132,191 28,068 130,539 82,811
Total liabilities (2,878,350) (31,645) (132,263) (25,268) (47,944) (76,141)
Net balance (+/–) (42,378) (413) (72) 2,800 82,595 6,670

584
1.2.6 DERIVATIVE PRODUCTS
A. FINANCIAL DERIVATIVES
A.1 Trading book: period-end and average notional amounts
Type of transaction/Underlyings Debt securities Equities Exchange and interest rates and equity indices rates and gold Listed Unlisted Listed Unlisted Listed Unlisted
1. Forward rate agreements – 607,782 – – – – 2. Interest rate swaps – 20,254,264 – – – – 3. Domestic currency swaps – – – – – – 4. Currency interest rate swaps – – – – – 606,886 5. Basic swaps – 3,371,627 – – – – 6. Swap of stock indices – – – – – – 7. Swap of real indices – – – – – – 8. Futures 1,346,887 – 441 – – – 9. Cap options – 27,225,121 – – – – – purchased – 13,709,885 – – – – – issued – 13,515,236 – – – – 10. Floor options – 21,077,225 – – – – – purchased – 8,840,760 – – – – – issued – 12,236,465 – – – – 11. Other options – 2,402,170 – 560,592 – 597,765 – Purchased – 1,201,000 – 280,296 – 323,895 – Plain vanilla – 1,200,000 – 211,172 – 291,309 – Exotic – 1,000 – 69,124 – 32,586 – Issued – 1,201,170 – 280,296 – 273,870 – Plain vanilla – 1,200,000 – 211,172 – 273,654 – Exotic – 1,170 – 69,124 – 216 12. Forward contracts 87,021 7,391 45 – – 241,491 – Purchases 68,626 5,746 33 – – 114,768 – Sales 18,395 1,645 12 – – 123,332 – Currency against currency – – – – – 3,391 13. Other derivative contracts – – – – – –
Total 1,433,908 74,945,580 486 560,592 – 1,446,142

585
Type of transaction/Underlyings Other instruments 31/12/2008 31/12/2007 Listed Unlisted Listed Unlisted Listed Unlisted
1. Forward rate agreements – – – 607,782 – – 2. Interest rate swaps – – – 20,254,264 – 29,267,452 3. Domestic currency swaps – – – – – – 4. Currency interest rate swaps – – – 606,886 – 349,972 5. Basic swaps – – – 3,371,627 – 4,221,470 6. Swap of stock indices – – – – – – 7. Swap of real indices – – – – – – 8. Futures – – 1,347,328 – 477,165 – 9. Cap options – – – 27,225,121 – 41,208,264 – purchased – – – 13,709,885 – 20,450,857 – issued – – – 13,515,236 – 20,757,407 10. Floor options – – – 21,077,225 – 35,989,773 – purchased – – – 8,840,760 – 15,455,066 – issued – – – 12,236,465 – 20,534,707 11. Other options – – – 3,560,527 – 4,701,399 – Purchased – – – 1,805,191 – 2,349,090 – Plain vanilla – – – 1,702,481 – 2,054,250 – Exotic – – – 102,710 – 294,840 – Issued – – – 1,755,336 – 2,352,309 – Plain vanilla – – – 1,684,826 – 2,079,394 – Exotic – – – 70,510 – 272,915 12. Forward contracts – – 87,066 248,882 – 347,662 – Purchases – – 68,659 120,514 – 125,436 – Sales – – 18,407 124,977 – 188,242 – Currency against currency – – – 3,391 – 33,984 13. Other derivative contracts – – – – – –
Total – – 1,434,394 76,952,314 477,165 116,085,992

586
A.2 Banking book: period-end and average notional amounts
A.2.1 For hedging
Type of transaction/Underlyings Debt securities Equities Exchange and interest rates and equity indices rates and gold Listed Unlisted Listed Unlisted Listed Unlisted
1. Forward rate agreements – – – – – –2. Interest rate swaps – 458,569 – – – –3. Domestic currency swaps – – – – – –4. Currency interest rate swaps – – – – – – 5. Basic swaps – – – – – –6. Swap of stock indices – – – – – –7. Swap of real indices – – – – – –8. Futures – – – – – –9. Cap options – – – – – – – purchased – – – – – – – issued – – – – – –10. Floor options – – – – – – – purchased – – – – – – – issued – – – – – –11. Other options – – – – – – – Purchased – – – – – – – Plain vanilla – – – – – – – Exotic – – – – – – – Issued – – – – – – – Plain vanilla – – – – – – – Exotic – – – – – –12. Forward contracts – – – – – – – Purchases – – – – – – – Sales – – – – – – – Currency against currency – – – – – –13. Other derivative contracts – – – – – –
Total – 458,569 – – – –

587
Type of transaction/Underlyings Other instruments 31/12/2008 31/12/2007 Listed Unlisted Listed Unlisted Listed Unlisted
1. Forward rate agreements – – – – – –2. Interest rate swaps – – – 458,569 – – 3. Domestic currency swaps – – – – – –4. Currency interest rate swaps – – – – – –5. Basic swaps – – – – – – 6. Swap of stock indices – – – – – –7. Swap of real indices – – – – – –8. Futures – – – – – –9. Cap options – – – – – – – purchased – – – – – – – issued – – – – – – 10. Floor options – – – – – – – purchased – – – – – – – issued – – – – – –11. Other options – – – – – – – Purchased – – – – – – – Plain vanilla – – – – – – – Exotic – – – – – – – Issued – – – – – – – Plain vanilla – – – – – – – Exotic – – – – – –12. Forward contracts – – – – – – – Purchases – – – – – – – Sales – – – – – – – Currency against currency – – – – – –13. Other derivative contracts – – – – – –
Total – – – 458,569 – –

588
A.2.2 Other derivatives
Type of transaction/Underlyings Debt securities Equities Exchange and interest rates and equity indices rates and gold Listed Unlisted Listed Unlisted Listed Unlisted
1. Forward rate agreements – – – – – – 2. Interest rate swaps – 2,488,951 – – – – 3. Domestic currency swaps – – – – – – 4. Currency interest rate swaps – – – – – 27,669 5. Basic swaps – 1,021,624 – – – – 6. Swap of stock indices – – – – – – 7. Swap of real indices – – – – – – 8. Futures – – – – – – 9. Cap options – 66,750 – – – – – purchased – 51,750 – – – – – issued – 15,000 – – – – 10. Floor options – 97,000 – – – – – purchased – 97,000 – – – – – issued – – – – – – 11. Other options – 600 – 59,563 – – – Purchased – 600 – 59,563 – – – Plain vanilla – 600 – – – – – Exotic – – – 59,563 – – – Issued – – – – – – – Plain vanilla – – – – – – – Exotic – – – – – – 12. Forward contracts – – – – – – – Purchases – – – – – – – Sales – – – – – – – Currency against currency – – – – – – 13. Other derivative contracts – – – – – –
Total – 3,674,925 – 59,563 – 27,669

589
Type of transaction/Underlyings Other instruments 31/12/2008 31/12/2007 Listed Unlisted Listed Unlisted Listed Unlisted
1. Forward rate agreements – – – – – – 2. Interest rate swaps – – – 2,488,951 – 1,889,549 3. Domestic currency swaps – – – – – – 4. Currency interest rate swaps – – – 27,669 – 27,828 5. Basic swaps – – – 1,021,624 – 1,133,029 6. Swap of stock indices – – – – – – 7. Swap of real indices – – – – – – 8. Futures – – – – – – 9. Cap options – – – 66,750 – 47,250 – purchased – – – 51,750 – 32,250 – issued – – – 15,000 – 15,000 10. Floor options – – – 97,000 – 116,500 – purchased – – – 97,000 – 116,500 – issued – – – – – – 11. Other options – – – 60,163 – 70,463 – Purchased – – – 60,163 – 65,463 – Plain vanilla – – – 600 – 5,000 – Exotic – – – 59,563 – 60,463 – Issued – – – – – 5,000 – Plain vanilla – – – – – 5,000 – Exotic – – – – – – 12. Forward contracts – – – – – – – Purchases – – – – – – – Sales – – – – – – – Currency against currency – – – – – – 13. Other derivative contracts – – – – – –
Total – – – 3,762,157 – 3,284,619

590
A.3 Financial derivatives: purchase and sale of underlyings
Type of transaction/Underlyings Debt securities Equities Exchange and interest rates and equity indices rates and gold Listed Unlisted Listed Unlisted Listed Unlisted
A. Trading book 1. With exchange of capital 87,021 7,391 45 – – 1,473,812 – purchases 68,626 5,746 33 – – 703,960 – sales 18,395 1,645 12 – – 554,437 – currency against currency – – – – – 215,415 2. Without exchange of capital 1,346,887 71,566,562 441 560,592 – – – purchases 593,787 33,270,004 – 280,296 – – – sales 753,100 38,296,558 441 280,296 – – – currency against currency – – – – – – B. Banking book: B.1 Hedging 1. With exchange of capital – – – – – – – purchases – – – – – – – sales – – – – – – – currency against currency – – – – – – 2. Without exchange of capital – 458,569 – – – – – purchases – – – – – – – sales – 458,569 – – – – – currency against currency – – – – – – B.2 Other derivatives 1. With exchange of capital – – – – – 27,828 – purchases – – – – – 27,828 – sales – – – – – – – currency against currency – – – – – – 2. Without exchange of capital – 2,653,301 – 59,563 – – – purchases – 2,601,551 – 59,563 – – – sales – 51,750 – – – – – currency against currency – – – – – –

591
Type of transaction/Underlyings Other instruments 31/12/2008 31/12/2007 Listed Unlisted Listed Unlisted Listed Unlisted
A. Trading book 1. With exchange of capital – – 87,066 1,481,203 – 2,220,384 – purchases – – 68,659 709,706 – 954,282 – sales – – 18,407 556,082 – 964,075 – currency against currency – – – 215,415 – 302,027 2. Without exchange of capital – – 1,347,328 72,127,154 477,165 109,644,138 – purchases – – 593,787 33,550,300 293,050 50,460,491 – sales – – 753,541 38,576,854 184,115 59,183,647 – currency against currency – – – – – – B. Banking book: B.1 Hedging 1. With exchange of capital – – – – – – – purchases – – – – – – – sales – – – – – – – currency against currency – – – – – – 2. Without exchange of capital – – – 458,569 – 188,412 – purchases – – – – – 168,912 – sales – – – 458,569 – 19,500 – currency against currency – – – – – – B.2 Other derivatives 1. With exchange of capital – – – 27,828 – 27,828 – purchases – – – 27,828 – 27,828 – sales – – – – – – – currency against currency – – – – – – 2. Without exchange of capital – – – 2,712,864 – 1,935,350 – purchases – – – 2,661,114 – 1,898,100 – sales – – – 51,750 – 37,250 – currency against currency – – – – – –

592
A.4 Over-the-counter financial derivatives: positive fair value - counterparty risk
Counterparty/Underlyings Debt securities and interest rates Equities and equity indices Exchange rates and gold Other instruments Different underlyings Gross not Gross Future Gross not Gross Future Gross not Gross Future Gross not Gross Future Offset Future offset offset exposure offset offset exposure offset offset exposure offset offset exposure exposure
A. Trading book for supervisory purposes A.1 Governments and central banks – – – – – – – – – – – – – – A.2 Public entities – – – – – – – – – – – – – – A.3 Banks 35,705 35,705 113,933 – – 20,948 14,902 14,902 7,793 – – – 76,810 52,145 A.4 Financial companies 10,203 10,203 3,994 – – 643 168 168 1,293 – – – 3,039 949 A.5 Insurance companies – – – – – – – – – – – – – – A.6 Non-financial institutions 98,338 98,338 23,017 – – – 13,833 13,833 2,675 – – – – – A.7 Other issuers 203 203 15 – – – 1,859 1,859 479 – – – – –
Total at 31/12/2008 144,449 144,449 140,959 – – 21,591 30,762 30,762 12,240 – – – 79,849 53,094
Total at 31/12/2007 539,217 568,217 191,100 48,139 48,139 32,438 23,104 23,104 9,601 – – – – –
B. Banking book B.1 Governments and central banks – – – – – – – – – – – – – – B.2 Public entities – – – – – – – – – – – – – – B.3 Banks 39,702 39,702 13,139 – – 4,765 – – – – – – 88,598 16,832 B.4 Financial companies – – 238 – – – – – – – – – 8,158 238 B.5 Insurance companies – – – – – – – – – – – – – – B.6 Non-financial institutions – – – – – – – – – – – – – – B.7 Other issuers – – – – – – – – – – – – – –
Total at 31/12/2008 39,702 39,702 13,377 – – 4,765 – – – – – – 96,756 17,070
Total at 31/12/2007 41,677 41,677 7,580 – – – – – – – – – – –
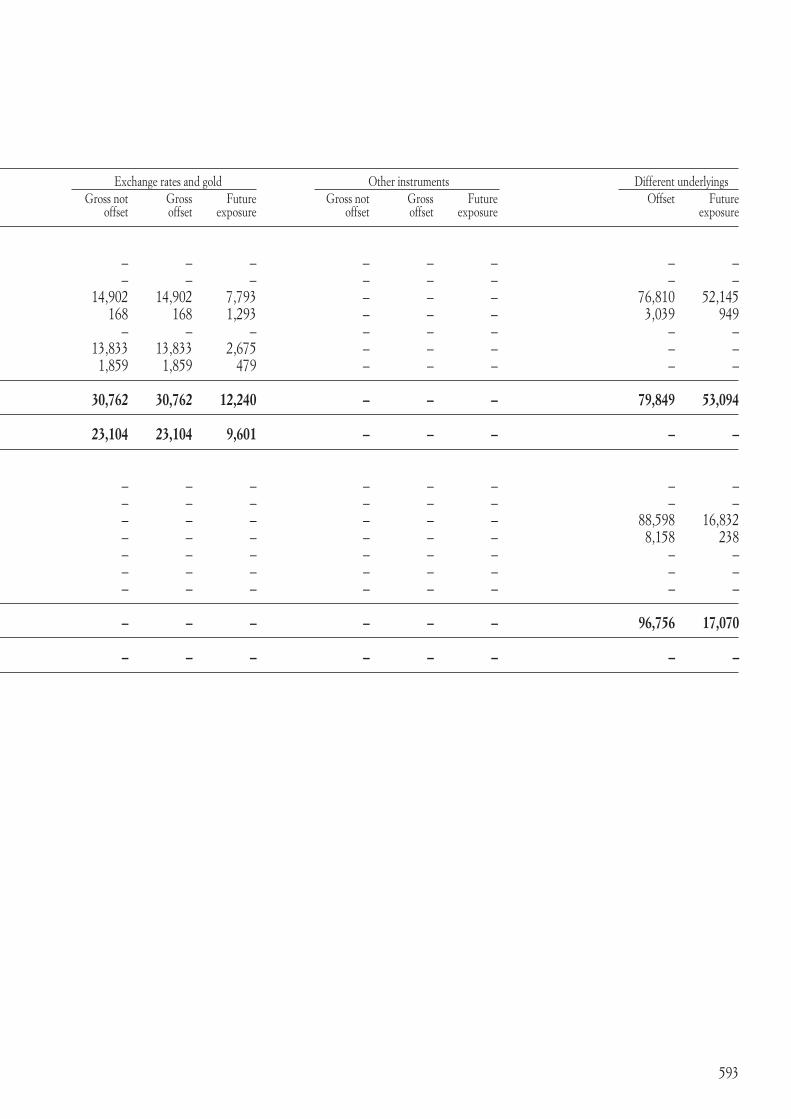
593
Counterparty/Underlyings Debt securities and interest rates Equities and equity indices Exchange rates and gold Other instruments Different underlyings Gross not Gross Future Gross not Gross Future Gross not Gross Future Gross not Gross Future Offset Future offset offset exposure offset offset exposure offset offset exposure offset offset exposure exposure
A. Trading book for supervisory purposes A.1 Governments and central banks – – – – – – – – – – – – – – A.2 Public entities – – – – – – – – – – – – – – A.3 Banks 35,705 35,705 113,933 – – 20,948 14,902 14,902 7,793 – – – 76,810 52,145 A.4 Financial companies 10,203 10,203 3,994 – – 643 168 168 1,293 – – – 3,039 949 A.5 Insurance companies – – – – – – – – – – – – – – A.6 Non-financial institutions 98,338 98,338 23,017 – – – 13,833 13,833 2,675 – – – – – A.7 Other issuers 203 203 15 – – – 1,859 1,859 479 – – – – –
Total at 31/12/2008 144,449 144,449 140,959 – – 21,591 30,762 30,762 12,240 – – – 79,849 53,094
Total at 31/12/2007 539,217 568,217 191,100 48,139 48,139 32,438 23,104 23,104 9,601 – – – – –
B. Banking book B.1 Governments and central banks – – – – – – – – – – – – – – B.2 Public entities – – – – – – – – – – – – – – B.3 Banks 39,702 39,702 13,139 – – 4,765 – – – – – – 88,598 16,832 B.4 Financial companies – – 238 – – – – – – – – – 8,158 238 B.5 Insurance companies – – – – – – – – – – – – – – B.6 Non-financial institutions – – – – – – – – – – – – – – B.7 Other issuers – – – – – – – – – – – – – –
Total at 31/12/2008 39,702 39,702 13,377 – – 4,765 – – – – – – 96,756 17,070
Total at 31/12/2007 41,677 41,677 7,580 – – – – – – – – – – –

594
A.5 Over-the-counter financial derivatives: negative fair value - financial risk
Counterparty/Underlyings Debt securities and interest rates Equities and equity indices Exchange rates and gold Other instruments Different underlyings Gross not Gross Future Gross not Gross Future Gross not Gross Future Gross not Gross Future Offset Future offset offset exposure offset offset exposure offset offset exposure offset offset exposure exposure
A. Trading book for supervisory purposes A.1 Governments and central banks – – – – – – – – – – – – – – A.2 Public entities – – – – – – – – – – – – – – A.3 Banks 55,825 55,825 53,328 – – – 13,615 13,615 2,958 – – – 163,280 127,374 A.4 Financial companies 276 276 5,690 – – 26 1,197 1,197 837 – – – 25,972 7,625 A.5 Insurance companies – – – 15,222 15,222 – – – – – – – – – A.6 Non-financial institutions 1,435 1,435 526 – – – 5,229 5,229 638 – – – – – A.7 Other issuers 2,662 2,662 – – – – 1,794 1,794 228 – – – – –
Total at 31/12/2008 60,198 60,198 59,544 15,222 15,222 26 21,835 21,835 4,661 – – – 189,252 134,999
Total at 31/12/2007 534,141 37,726 54,469 48,185 – 6 35,264 1,836 3,157 – – – – –
B. Banking book B.1 Governments and central banks – – – – – – – – – – – – – – B.2 Public entities – – – – – – – – – – – – – – B.3 Banks 2,358 2,358 5,058 – – – – – – – – – – – B.4 Financial companies 1,089 1,089 – – – – – – – – – – – – B.5 Insurance companies – – – – – – – – – – – – – – B.6 Non-financial institutions – – – – – – – – – – – – – – B.7 Other issuers – – – – – – – – – – – – – –
Total at 31/12/2008 3,447 3,447 5,058 – – – – – – – – – – –
Total at 31/12/2007 142,929 9,383 4,523 – – – – – – – – – – –

595
Counterparty/Underlyings Debt securities and interest rates Equities and equity indices Exchange rates and gold Other instruments Different underlyings Gross not Gross Future Gross not Gross Future Gross not Gross Future Gross not Gross Future Offset Future offset offset exposure offset offset exposure offset offset exposure offset offset exposure exposure
A. Trading book for supervisory purposes A.1 Governments and central banks – – – – – – – – – – – – – – A.2 Public entities – – – – – – – – – – – – – – A.3 Banks 55,825 55,825 53,328 – – – 13,615 13,615 2,958 – – – 163,280 127,374 A.4 Financial companies 276 276 5,690 – – 26 1,197 1,197 837 – – – 25,972 7,625 A.5 Insurance companies – – – 15,222 15,222 – – – – – – – – – A.6 Non-financial institutions 1,435 1,435 526 – – – 5,229 5,229 638 – – – – – A.7 Other issuers 2,662 2,662 – – – – 1,794 1,794 228 – – – – –
Total at 31/12/2008 60,198 60,198 59,544 15,222 15,222 26 21,835 21,835 4,661 – – – 189,252 134,999
Total at 31/12/2007 534,141 37,726 54,469 48,185 – 6 35,264 1,836 3,157 – – – – –
B. Banking book B.1 Governments and central banks – – – – – – – – – – – – – – B.2 Public entities – – – – – – – – – – – – – – B.3 Banks 2,358 2,358 5,058 – – – – – – – – – – – B.4 Financial companies 1,089 1,089 – – – – – – – – – – – – B.5 Insurance companies – – – – – – – – – – – – – – B.6 Non-financial institutions – – – – – – – – – – – – – – B.7 Other issuers – – – – – – – – – – – – – –
Total at 31/12/2008 3,447 3,447 5,058 – – – – – – – – – – –
Total at 31/12/2007 142,929 9,383 4,523 – – – – – – – – – – –

596
A.6 Residual life of over-the-counter financial derivatives: notional value
Underlyings/residual life Whitin 1 to 5 Over 31/12/2008 12 months years 5 years
A. Trading book for supervisory purposes 28,720,842 45,512,915 4,152,904 78,386,661 A.1 Financial derivatives on debt securities and interest rates 27,189,830 45,036,750 4,152,904 76,379,484 A.2 Financial derivatives on equities and equity indices 86,328 474,706 – 561,034 A.3 Financial derivatives on exchange rates and gold 1,444,684 1,459 – 1,446,143 A.4 Financial derivatives on other instruments – – – – B. Banking book 1,298,710 2,073,844 848,172 4,220,726 B.1 Financial derivatives on debt securities and interest rates – – – – B.2 Financial derivatives on equities and equity indices 1,298,710 1,986,612 848,172 4,133,494 B.3 Financial derivatives on exchange rates and gold – 59,563 – 59,563 B.4 Financial derivatives on other instruments – 27,669 – 27,669
Total at 31/12/2008 30,019,552 47,586,759 5,001,076 82,607,387
Total at 31/12/2007 45,293,831 69,638,328 4,915,617 119,847,776

597
SECTION 1.3 – LIQUIDITY RISK
QUALITATIVE INFORMATION
A. General aspects, management and measurement of liquidity risk
Liquidity risk is the risk of being unable to meet payment obligations caused by inability to obtain funding (funding liquidity risk) and/or the presence of restrictions on the ability to sell assets (market liquidity risk). This risk can also take the form of a loss relative to fair value deriving from a forced sale, or more generally, of a loss in terms of reputation or business opportunities.
Liquidity funding risk is incurred in banking activities when institutional counterparties withdraw their usual funding, or request a significantly higher return than in normal circumstances.
The policy for managing liquidity risk, approved in October 2008, specifies the following fundamental principles for governing this risk:
• liquidityismanagedcentrallybytheParentBank,BancaPopolarediVicenza;• responsibilityforguidelinesonmanagingliquidityandtheassociatedriskrestswiththe
Parent Bank’s Board of Directors;• theLiquidityFundingPlan(forordinary liquiditymanagement)andtheContingency
Funding Plan (for contingency management) are developed and managed by the Parent Bank on behalf of the entire BPVi Group.
The Parent Bank’s Board of Directors uses the Finance and ALMs Committee and relevant company functions for the operational and strategic management of this risk. In particular:
• theFinanceandALMsCommitteeproposesstrategicguidelinesinitsconsultativecapacityto the Parent Bank’s Board of Directors;
• theManagingDirector,orinhisabsencetheParentBank’sGeneralManager,managessituations of stress and crisis, within the scope of their respective powers and having consulted the Finance and ALMs Committee. If the actions identified for overcoming situations of stress and crisis fall outside the scope of their powers, the proposed actions must be submitted to the competent bodies;
• theFinanceDivisionhasoperationalmanagementduties.
Short-term liquidity management (within a 12-month horizon) uses an Operating Maturity Ladder, which identifies mismatches between expected cash inflows and outflows for each time period (liquidity gaps on precise dates). The cumulative mismatches (cumulative liquidity gaps) are used for calculating the net cash requirement/surplus for the different time horizons considered. Medium/long-term liquidity management uses a Structural Maturity Ladder, which identifies the balance between assets and liabilities by matching them not only in terms of cash flows but also in terms of balance sheet ratios. The objective is to ensure that the profile of structural liquidity is sufficiently balanced, with restrictions on the possibility of financing medium/long-term assets with liabilities of a different duration.
The Global Markets Department is responsible for operational management of liquidity risk by seeking to maintain an optimum balance between average maturities of short-term lending and funding, and by diversifying positions by counterparty and due date negotiated both over the counter and on the Interbank Deposits Market. In addition to usual banking treasury activities (daily monitoring of the Group’s liquidity and optimization of its short-term

598
management), any medium and long-term imbalances are managed using appropriate policies established by the Finance and ALMS Committee.
The Group managed to face the extremely tense situation on money markets in 2008 despite growing commitments to disburse funds, the smaller number of banking counterparties in the loan book and the general reduction in credit by the system as whole. These circumstances made it even more necessary to adopt a cautious, diversified funding policy, that sought to gradually lengthen the average maturity of interbank funding, and to avoid large exposures to overnight positions. Market liquidity risk was also limited by additional sell offs of the less readily marketable investments in the trading book.
Since November 2008 it has been possible to use securitization of residential mortgages with the principal purpose of obtaining refinancing from the ECB and of increasing the quantity of instruments that can be lodged against intra-day operations. Such securitization has made it possible to finance assets at relatively competitive rates in situations of liquidity stress. The conduct of funding repurchase agreements with the ECB and with direct customers has helped diversify the sources of funds relative to the interbank market, also in view of the recent injections of liquidity by the ECB through repo transactions at a fixed rate (equal to the official reference rate) and with no limits on quantity.
The project for reorganizing the Parent Bank’s treasury function continued throughout the year, including with the assistance of outside consultants for optimizing procedural and organizational aspects.

599
QUANTITATIVE DISCLOSURES
1. Breakdown of the residual contractual duration of financial assets and liabilities
Currency: Euro
Items/Time bands Sight 1 to 7 7 to 15 15 days 1 to 3 3 to 6 6 to 12 1 to 5 Over Unspecified days days to 1 month months months months years 5 years duration
Cash assets A.1 Government securities – – – – – 12,265 33,164 27,302 19 – A.2 Listed debt securities 7 – – – 5,651 16,173 14,580 27,642 27,401 – A.3 Other debt securities 10 – 2,995 – 14,952 22,901 24,688 969,976 172,827 – A.4 Mutual funds 106,600 – – – – – – – 191 2,611 A.5 Loans – Banks 471,713 140,386 123,925 9 308,834 9,819 46,354 12,951 9,521 248,459 – Customers 3,230,513 113,140 320,758 1,701,761 1,389,124 745,138 268,523 5,195,189 5,958,557 731,255 Cash liabilities B.1 Deposits – Banks (1,373,156) (193,802) (407,437) (30,000) (418,560) (240,470) (35,126) (53,176) – – – Customers (10,842,371) (635) (1,769) (3,714) 19,410 (7,695) (9,043) (1,290) (41,217) – B.2 Debt securities (11,863) (19,644) (19,883) (130,502) (291,003) (487,338) (222,198) (6,212,083) (1,821,932) – B.3 Other liabilities – – – – – – – – – – Off-balance sheet transactions C.1 Financial derivatives with exchange of capital – long positions – 106,062 20,219 79,922 122,988 122,527 119,136 29,819 6 – – short positions – (109,438) – (2,384) (5,514) (1,585) – – – – C.2 Deposits and loans to be received – long positions 5,636 172,286 – – – – – – – – – short positions (5,636) (82,825) – – – – – – – – C.3 Irrevocable commitments to make loans – long positions – – – – – – – – – – – short positions – – – – – – – – – –

600
Currency: USD
Items/Time bands Sight 1 to 7 7 to 15 15 days 1 to 3 3 to 6 6 to 12 1 to 5 Over Unspecified days days to 1 month months months months years 5 years duration
Cash assets A.1 Government securities – – – – – – – – – – A.2 Listed debt securities – – – – – – – – – – A.3 Other debt securities – – – – – – – 8,269 6,582 – A.4 Mutual funds – – – – – – – – – – A.5 Loans – Banks 51,231 – 22,617 874 – 1,456 23,398 – – – – Customers 8,320 4,518 10,633 43,905 151,508 18,272 5,128 830 35,434 – Cash liabilities B.1 Deposits – Banks (166,455) (18,009) (7,238) (3,391) (73,067) (9,424) – – – – – Customers (77,746) (2,593) (2,981) (7,900) (9,055) (512) (1,595) – – – B.2 Debt securities – – – – – – – (3,658) – – B.3 Other liabilities – – – – – – – – – – Off-balance sheet transactions C.1 Financial derivatives with exchange of capital – long positions – 28,206 16,738 82,175 111,756 62,648 112,020 4,288 – – – short positions – (26,354) (10,013) (85,874) (132,364) (58,176) (129,096) (22) – – C.2 Deposits and loans to be received – long positions – – – – – – – – – – – short positions – – – – – – – – – – C.3 Irrevocable commitments to make loans – long positions – – – – – 49 213 – – – – short positions – (262) (12,430) – – – – – – –

601
Currency: GBP
Items/Time bands Sight 1 to 7 7 to 15 15 days 1 to 3 3 to 6 6 to 12 1 to 5 Over Unspecified days days to 1 month months months months years 5 years duration
Cash assets A.1 Government securities – – – – – – – – – – A.2 Listed debt securities – – – – – – – – – – A.3 Other debt securities – – – – – – – – – – A.4 Mutual funds – – – – – – – – – – A.5 Loans – Banks 2,818 – – – – – – – – – – Customers 28 21 433 565 2,297 380 – – 3,336 – Cash liabilities B.1 Deposits – Banks (1,246) (525) – – (1,050) – – – – – – Customers (5,141) – – – – – (195) – – – B.2 Debt securities – – – – – – – – – – B.3 Other liabilities – – – – – – – – – – Off-balance sheet transactions C.1 Financial derivatives with exchange of capital – long positions – 43 209 1,785 15,830 2,137 300 – – – – short positions – (137) (52) (8,714) (11,720) (1,795) (20) – – – C.2 Deposits and loans to be received – long positions – 1,050 – – – – – – – – – short positions – (1,050) – – – – – – – – C.3 Irrevocable commitments to make loans – long positions – – – – – – – – – – – short positions – – – – – – – – – –

602
Currency: CHF
Items/Time bands Sight 1 to 7 7 to 15 15 days 1 to 3 3 to 6 6 to 12 1 to 5 Over Unspecified days days to 1 month months months months years 5 years duration
Cash assets A.1 Government securities – – – – – – – – – – A.2 Listed debt securities – – – – – – – – – – A.3 Other debt securities – – – – – – – – – – A.4 Mutual funds – – – – – – – – – – A.5 Loans – Banks 11,995 6,737 5,389 – – – – – – – – Customers 8,973 1,271 3,709 2,861 14,799 3,142 – – 207 – Cash liabilities B.1 Deposits – Banks (10,425) – (5,389) (16,150) – – – – – – – Customers (1,055) – – – (83) – – – – – B.2 Debt securities – – – – – – – – – – B.3 Other liabilities – – – – – – – – – – Off-balance sheet transactions C.1 Financial derivatives with exchange of capital – long positions – 134 – 40,303 16,838 – 14,181 – – – – short positions – (155) – – – – (14,687) – – – C.2 Deposits and loans to be received – long positions – – – – – – – – – – – short positions – – – – – – – – – – C.3 Irrevocable commitments to make loans – long positions – – – – – – – – – – – short positions – – – – – – – – – –

603
Currency: JPY
Items/Time bands Sight 1 to 7 7 to 15 15 days 1 to 3 3 to 6 6 to 12 1 to 5 Over Unspecified days days to 1 month months months months years 5 years duration
Cash assets A.1 Government securities – – – – – – – – – – A.2 Listed debt securities – – – – – – – – – – A.3 Other debt securities – – – – – – – – – – A.4 Mutual funds – – – – – – – – – – A.5 Loans – Banks 4,101 2,379 – – 2,149 875 – – – – – Customers 1,846 307 1,586 4,902 6,536 2,260 – – 824 – Cash liabilities B.1 Deposits – Banks (1,969) – – – (6,620) (875) – – – – – Customers (2,860) – (1,976) – (96) (591) – – – – B.2 Debt securities – – – – – – – – – – B.3 Other liabilities – – – – – – – – – – Off-balance sheet transactions C.1 Financial derivatives with exchange of capital – long positions – 3,414 1,014 872 7,998 20,490 18,799 – – – – short positions – (2,046) (921) (15,417) (8,095) (19,072) (19,886) – – – C.2 Deposits and loans to be received – long positions – – – – – – – – – – – short positions – – – – – – – – – – C.3 Irrevocable commitments to make loans – long positions – – – – – – 310 – – – – short positions – (310) – – – – – – – –

604
Currency: Other currencies
Items/Time bands Sight 1 to 7 7 to 15 15 days 1 to 3 3 to 6 6 to 12 1 to 5 Over Unspecified days days to 1 month months months months years 5 years duration
Cash assets A.1 Government securities – – – – – – – – – – A.2 Listed debt securities – – – – – – – – – – A.3 Other debt securities – – – – – – – – – – A.4 Mutual funds – – – – – – – – – – A.5 Loans – Banks 7,577 2 – – – – – – – – – Customers 27 – 59 – 3,597 – – 379 457 – Cash liabilities B.1 Deposits – Banks (1,323) (1,835) – – – – – – – – – Customers (5,161) – – (177) (742) – – – – – B.2 Debt securities – – – – – – – – (24,246) – B.3 Other liabilities – – – – – – – – – – Off-balance sheet transactions C.1 Financial derivatives with exchange of capital – long positions – 789 3,302 45,789 3,028 15,626 – – 24,076 – – short positions – (1,451) (3,326) (42,421) (2,781) (15,440) – – – – C.2 Deposits and loans to be received – long positions – 2,506 – – – – – – – – – short positions – (2,506) – – – – – – – – C.3 Irrevocable commitments to make loans – long positions – – – – – – – – – – – short positions – – – – – – – – – –

605
2. Sector breakdown of financial liabilities
3. Geographical distribution of financial liabilities
Exposures/Counterparties Italy Other America Asia Rest EU of the countries world
1. Due to customers 11,953,867 186,611 16,298 666 4,435 2. Deposits from banks 2,432,382 593,719 41 493 50,083 3. Debt securities in issue 3,503,901 2,467,261 – – – 4. Financial liabilities held for trading 71,022 492,196 81,560 – – 5. Financial liabilities at fair value 2,316,693 956,495 – – –
31–12–2008 20,277,865 4,696,282 97,899 1,159 54,518
31–12–2007 15,629,095 6,075,820 104,170 2,633 107,051
Exposures/Counterparties Governments and Other public Financial Insurance Non-financial Other parties Central banks entities companies companies institutions
1. Due to customers 41,854 401,125 520,217 156,676 3,546,861 7,495,144 2. Debt securities in issue 5 10,187 9,556 190,013 216,506 3,259,371 3. Financial liabilities held for trading – – 36,173 15,222 3,871 4,364 4. Financial liabilities at fair value – 36,757 22,061 367,053 161,968 1,465,740
31–12–2008 41,859 448,069 588,007 728,964 3,929,206 12,224,619
31–12–2007 50,134 381,012 440,989 643,561 3,220,569 9,191,941

606
1.4 – OPERATIONAL RISK
QUALITATIVE INFORMATION
A. General aspects, management and measurement of operational risk
Operational risk is defined as the risk of losses deriving from inadequate or dysfunctional procedures, human resources or internal systems, or external events. This includes legal risk, but not strategic risk or the risk to reputation.
During 2008 the Internal Audit Department carried out remote and on-site checks in relation to the distribution network in order to verify compliance with company standards (basically: correct application of regulations and correct performance of line controls).
The audit of processes rather than the central owners of the same also examined regulatory, procedural and organizational structure in order to assess the adequacy of controls over operational risks in terms of compliance with corporate strategy, of protecting the value of assets and protecting against losses, of the reliability and completeness of accounting and management information, and the compliance of transactions with the law, supervisory requirements and internal instructions.
The results attest the existence and adequacy of the system of controls protecting against such risks, and as far as distribution processes are concerned are based on the compliance observed during audit activities within the Network.
With regard to the monitoring of operational risks, the Parent Bank was a founding member in 2002 of DIPO, the interbank consortium promoted by ABI that maintains an Italyn database of operational losses. As a consequence, the Group gathers regular information about its operational losses.
Lastly in this area, the Group commenced an “ORM” (Operational Risk Management) project during the first half of 2006 as part of alignment with the Basel II requirements.
The new Basel 2 accord establishes capital adequacy requirements for banks with regard to credit risk, market risk and, for the first time, operational risk. With regard to this last risk, there are three possible approaches of increasing complexity:• BSA–BasicStandardApproach:thisinvolvestheapplicationofafixedcoefficientof15%
to the average of net interest and other banking income over the last three years.• TSA–TraditionalStandardizedApproach:thisinvolvestheapplicationoffixedcoefficients
to net interest and other banking income for the last three years deriving from the various lines of business envisaged in the New Capital Accord. This approach also and more especially envisages the creation of an integrated framework for the recording, management and measurement of operational risks, imposing a series of strict organizational requirements on banks.
• AMA–AdvancedMeasurementApproach:thisappliestheorganizationalmodelfortherecording, management and measurement of operational risks adopted by the standardized approach, but on an even more stringent basis which allows banks to adopt internal models for calculating the related capital adequacy requirements.
The Operational Risk Management project, organized into four modules is intended to define a framework for measuring and managing Operational Risks that is consistent with the requirements of Basel 2, while also working towards alignment with the requirements of the standardized approach.

607
Various stages in this project have already been completed: “Classification Models and Risk Mapping”, “Policies for and Governance of Operational Risk Management” and “Self Risk Assessment”. This last stage entailed the direct involvement of managers from the Departments subject to Operational Risks and the Area offices, who took part in a top-down analysis of risks by completing a detailed questionnaire designed to obtain quali-quantitative information needed for managing the risk. The fourth and final stage of the project, whose organizational implications were reviewed in the first half of 2007, was intended to define and develop a structured process for Loss Data Collection in place of the current process used to provide information to the DIPO consortium. This work was completed at the end of October 2007 with the publication of the “Operational Risks Manual – Loss Data Collection”.
The same work was carried out in the first half of 2008 at a local level for Banca Nuova and Cassa di Risparmio di Prato, in order to manage operational risks throughout the banking Group. This work was completed in June 2008 when these two subsidiaries adopted the “Operational Risks Manual – Loss Data Collection”.The introduction of Self Risk Assessment at these subsidiaries is still in progress.
QUANTITATIVE INFORMATION The Parent Bank continued to gather data on operational losses for reporting to DIPO, which was more complete thanks to the more structured approach used after adopting the manual. The information gathered was not only more accurate, but also contained details of events not previously considered, such as those associated with “employment practices and workplace safety”. Since the June 2008, information for Banca Nuova and Cariprato has been gathered in the same way as for the Parent Bank after adopting the related processes and procedures (see preceding paragraph). In particular, 92 events arose in 2008 resulting in losses or provision for losses, totaling Euro 5.336 million. Of these new events, 32.61% were caused by “employment practices and workplace safety” (52.1% in value terms), 31.52% by “external fraud” (10.6% in value terms), 18.48% by errors in “execution, delivery and process management” (12.7% in value terms), 16.3% by “customers, products and business practice” (24.44% in value terms) and 1.09% by “damage to physical assets” (0.16% in value terms).
These lines of business are the same as those envisaged in the New Capital Accord (Basel 2). In particular:• “retailbanking”includesthelossesderivingfromcustomersservedoperationallybythe
Private Banking or Retail businesses ;• “retail intermediation” includes the operational losses incurred on retail customer
instructions relating to securities that were handled incorrectly;• “trading and sale” includes the operational losses incurred on corporate customer
instructions relating to securities that were handled incorrectly;• “commercial banking” includes the operational losses attributable to the corporate
segment.
In 2008, 77.17% of loss events related to the retail business (70.64% in value terms), 11.96% to trading and sale (13.39% in value terms), 8.7% to retail intermediation (15.22% in value terms) and 2.17% to commercial banking (0.75% in value terms).

608
SECTION 2
Risks pertaining to insurance activities
This section is not used.
SECTION 3
Risks pertaining to other businesses
This section is not used.

609
PART FINFORMATION ON CONSOLIDATED EQUITY
SECTION 1
Consolidated capital
A. QUALITATIVE INFORMATION
Definition of consolidated capital
The definition of consolidated capital used by the Group corresponds to the sum of the following equity accounts: 140 “Valuation reserves”, 150 “Redeemable shares”, 160 “Equity instruments”, 170 “Reserves”, 180 “Additional paid-in capital”, 190 “Capital stock”, 200 “Treasury shares” and 220 “Net income (loss) for the year”.
Nature of the capital adequacy requirement
Since the Banking Group carries out lending activities, it is subject to the requirements of art. 29 et seq. of Decree 385 dated 1 September 1993 “Consolidated law on banking and lending” or “TUB”. Accordingly, the Group must comply with the capital adequacy requirements detailed in the above legislation.
Management of capital
Information about the way in which the Group pursues its capital management objectives is provided in section 2.2 below.
B. QUANTITATIVE DISCLOSURES
Quantitative information is provided in Part B, Liabilities Section 15 – “Group equity” of these explanatory notes.

610
SECTION 2
Regulatory capital and capital adequacy ratios
2.1 Scope of application of the regulations
The calculation of consolidated regulatory capital applies the consolidation methodology envisaged in Bank of Italy Circular 155 – “Instructions for reporting capital for supervisory purposes and prudential parameters” (12th revision dated February 2008). In particular, this involves:• line-by-line consolidation of the banking, financial and related companies within the
banking group;• proportional consolidation of the banking, financial and related companies in which
the banking group holds an interest of 20% or more, when such companies are “jointly controlled” together with other parties under agreements with them;
• application of the equity method for:a. other banking and financial companies in which the banking group holds an interest of
20% or more, or which in any case are subject to “significant influence”;b. companies, other than banking, financial and related companies, that are directly or
jointly controlled by the banking group, or subject to significant influence.
Accordingly, there are no differences between the scope of consolidation used to calculate regulatory capital and capital adequacy and that of the consolidated financial statements.
2.2 Regulatory capital of banks
QUALITATIVE INFORMATION
1. Tier 1 capital
Tier 1 capital comprises total equity pertaining to the group and minority interests (capital stock, additional paid-in capital, other equity reserves and the related allocation of 2008 net income to reserves) calculated on the basis of current legislation, less any treasury shares and intangible assets.“Prudential filters” make corrections to equity in order to safeguard the quality of regulatory capital and reduce the potential volatility deriving from the application of IFRS. These involve:• addingtoTier1capitalthecumulativenetlossesonsubordinatedliabilitiescomputedin
Tier 2 capital, classified in the balance sheet as “Financial liabilities at fair value”;• deductingfromTier1capitalthenegativevaluationreservesrelatingtodebtsecurities,
classified as “Financial assets available for sale”, together with the residual amount of the valuation reserve relating to debt securities reclassified from “Financial assets available for sale” to the “Loans” book. Accumulated net gains on property, plant and equipment held for investment purposes are also deducted from Tier 1 capital.
Tier 1 capital as of 31 December 2008 does not include any innovative or other capital instruments.

611
2. Tier 2 capital
Tier 2 capital essentially comprises the special revaluation reserves recorded for property, plant and equipment, the positive valuation reserves relating to equities and mutual fund units classified as “Financial assets available for sale” and the subordinated liabilities issued, to the extent allowed by the regulations.
The “prudential filters” include:• theadd-backof50%oftheaccumulatednetgainsonproperty,plantandequipment;• thedeductionof50%ofthepositivevaluationreserverelatingtoequitiesandmutualfund
units classified as “Financial assets available for sale”.
The following table presents the principal contractual characteristics of the subordinated loans computed in Tier 2 capital to the extent allowed by the regulatory requirements (corresponding to 50% of “Tier 1 capital after the application of precautionary filters”).
1 Bond with right of conversion into Banca Popolare di Vicenza ordinary shares: the bonds can be converted into capital stock in a ratio of 2 shares of par value Euro 3.75 each for every bond of nominal value Euro 124 each. The conversion ratio will be changed in the event of a bonus increase in capital via the issue of shares. The right to convert can be exercised from 1 October 2010 to 31 December 2010. The shares delivered to the bondholders who decide to convert will have dividend and voting rights from 1 January 2011. Bondholders are entitled to convert early in the event of extraordinary operations involving capital, except for mergers with other companies in the Banca Popolare di Vicenza Group or with companies controlled by the issuer.
All the above subordinated bonds, except for the issue with Isin code IT0004424351, have an early redemption clause that allows the issuer to redeem them early, not less than 18 months after the final date of placement, following prior authorization from the Bank of Italy and giving at least one month’s notice. Furthermore, all the above bonds contain a subordination clause whereby, if the issuer were to be wound up, they would be redeemed only after all other creditors, not subordinated to the same extent, have been satisfied.
Isin Code Issue Maturity Rate Interest Nominal Portion date date date value included in Tier 2 capital IT0003444574 2-05-2003 2-05-2009 Fixed 2,25% 8,298 8,298 IT0003631659 23-03-2004 23-03-2011 Fixed 4.05% 9,777 6,000 IT0003631642 2-04-2004 2-04-2009 Fixed 3.64% 24,731 5,000 IT0003662498 21-05-2004 21-05-2010 Fixed 3.95% 23,359 10,000 IT0003699649 16-08-2004 16-08-2010 Fixed 4.10% 13,941 6,000 IT0003748511 30-11-2004 30-11-2011 Fixed 3.49% 48,932 30,000 XS0210870415 3-02-2005 3-02-2015 Floating Euribor3m + 0.45 200,000 199,829 IT0004189343 1 30-07-2007 30-07-2015 Fixed 2.15% 241,451 241,451 XS0336683254 20-12-2007 20-12-2017 Floating Euribor3m + 2.35 200,000 200,000 IT0003782684 15-12-2004 15-12-2011 Fixed 4.18% 19,990 12,000 IT0004015746 21-02-2006 21-02-2012 Fixed 3.78% 39,030 32,000 IT0004424351 15-12-2008 15-12-2015 Fixed 5.000% 115,497 115,497 Total 945,006 866,075

612
Tier 2 capital does not include any hybrid debt capital instruments at 31 December 2008.
“Deductions” from regulatory capital, consisting of the equity investments in banking, financial and insurance companies held by the Group, are deducted in accordance with the rules set out in Circular 263 of 27 December 2006 (3rd revision dated 15 January 2009) and in Circular 155 of 18 December 1991 (12th revision dated 5 February 2008). In particular, 50% of the above equity investments are deducted from Tier 1 capital and 50% from Tier 2 capital, except for the equity investments in insurance companies purchased before 20 July 2006, the full amount of which is deducted from both Tier 1 and 2 capital.
3. Tier 3 capital
The Group’s Tier 3 capital at 31 December 2008 includes the portion of subordinated liabilities not computed in Tier 2 capital because it exceeded 50% of “Tier 1 capital after the application of precautionary filters”, which can be used to cover the capital requirements for market risks relating to the “Trading book for supervisory purposes”, up to the maximum limit permitted by the supervisory regulations (71.4% of these requirements).

613
B. QUANTITATIVE INFORMATION
31/12/2008 31/12/2007
A. Tier 1 before the application of prudential filters 1,598,113 1,635,688
B. Prudential filters of Tier 1 capital (24,052) (89,281) B.1 Positive IFRS prudential filters (+) 3,307 - B.2 Negative IFRS prudential filters (-) (27,359) (89,281)C. Tier 1 capital after the application of prudential filters 1,574,061 1,546,407 D. Deductions from Tier 1 capital (14,919) (16,796)
E. Total Tier 1 capital 1,559,142 1,529,611 F. Tier 2 capital before the application of prudential filters 899,184 922,723 G. Prudential filters for Tier 2 capital (12,032) 811 G.1 Positive IFRS prudential filters (+) 845 811 G.2 Negative IFRS prudential filters (-) (12,877) – H. Tier 2 capital after the application of prudential filters 887,152 923,534 I. Deductions from Tier 2 capital (14,919) (16,796) L. Total Tier 2 capital 872,233 906,738 M. Deductions from Tier 1 and Tier 2 capital (18,875) (29,442) N. Regulatory capital 2,412,500 2,406,907 O. Tier 3 capital 12,451 25,762 P. Regulatory capital including Tier 3 capital 2,424,951 2,432,669
2.3 Capital adequacy
A. QUALITATIVE INFORMATION
The capital management policies adopted by the Banca Popolare di Vicenza Group are intended to ensure that Tier 1 capital is consistent with the overall level of risk accepted and the plans for the expansion of the Group, as well as to optimize the composition of capital by recourse to various financial instruments that minimize the related cost.

614
B. QUANTITATIVE DISCLOSURES
“Other prudential requirements” at 31 December 2008 refer to the specific capital requirement ordered by the Supervisory Authorities on 9 October 2007, involving a doubling of weightings relative to those currently used for counterparty risk relating to the “Trading portfolio for supervisory purposes”. This requirement was included in “Market risks” at 31 December 2007.
Other prudential requirements” at 31 December 2007 referred to the requirement relating to the Group’s securitizations, not included in “Risk assets” in compliance with the previously applicable supervisory regulations. This requirement has been included in “Credit and counterparty risks” in line B.1 at 31 December 2008, while the related risk assets are reported in line A.1.1.
The Group has used the “standard approach” (simplified CRM) to calculate risk-weighted assets and the related capital requirement for credit risks, adopting unsolicited external ratings provided by Moody’s, S&P and Fitch for the supervisory portfolios “Exposures with or guaranteed by central administrations and central banks” and “Positions relating to securitizations” and unsolicited ratings provided by Lince for the portfolio “Exposures to companies and other parties”. In the case of overall market risks on debt securities and interest rates, derivatives and other off-balance sheet transactions involving debt securities and interest rates have been represented using financial or sensitivity models in place of the “double entry” method previously used.
Categorie/Amounts Unweighted amounts Weighted amounts/Requirements 31/12/2008 31/12/2007 31/12/2008 31/12/2007 A. RISk ASSETS 1 A.1 Credit and counterparty risk 45,962,957 44,426,264 19,133,784 21,075,139 1. Standard methodology 45,817,788 44,426,264 19,080,366 21,075,139 2. Methodology based on internal ratings – – – – 2.1 Basic – – – – 2.2 Advanced – – – – 3. Securitizations 145,169 – 53,418 –
B. CAPITAL ADEQUACY REQUIREMENTS B.1 Credit and counterparty risk x x 1,530,703 1,686,011 B.2 Market risks x x 17,438 263,576 1. Standard methodology x x 17,438 263,576 2. Internal models x x – 3. Concentration risk x x – – B.3 Operational risks x x 135,549 – 1. Basic method x x 135,549 – 2. Standard method x x – – 3. Advanced method x x – – B.4 Other prudential requirements x x 15,734 104,136 B.5 Total prudential requirements x x 1,699,424 2,053,723
C. RISk ASSETS AND CAPITAL RATIOS x x C.1 Risk-weighted assets x x 21,242,799 25,671,537 C.2 Tier 1 capital/Risk-weighted assets (Tier 1 capital ratio) x x 7.34% 5.96%C.3 Regulatory capital including TIER 3/ Risk-weighted assets (Total capital ratio) x x 11.42% 9.48%
1 Risk assets are presented in this table net of intercompany balances eliminated upon consolidation.

615
PART GBUSINESS COMBINATIONS
SECTION 1
Transactions during the year
1.1 Business combinations
This section has not been completed because the Group did not carry out any business combinations during the year.
1.2 Other information on business combinations
1.2.1 Changes in year in goodwill
With reference to the acquisition of the 61 bank branches from the UBI Banca Group on 31 December 2007, for which goodwill of Euro 469,215 was provisionally recognized, there have been the following changes during the year: • anincreaseofEuro16,747forincidentalexpenses(legalandnotaryfees,indirecttaxes);• areductionofEuro18,654afterdeterminingthefinalpriceofthebranches,inaccordance
with the terms of the sale agreement;• areductionofEuro24,100afterreclassifyingto“Otherintangibleassets”the“intangibles”
identified as part of the purchase price allocation process in compliance with IFRS 3 which states that the cost of a business combination (such as the acquisition of the 61 UBI branches) must be accounted for using the purchase method and that the price paid be allocated to the assets acquired and liabilities assumed as measured at their respective fair values. These “intangibles” express the value of the relationships acquired and are amortized over the period they are expected to benefit.
Goodwill relating to the acquisition of the 61 UBI Group branches therefore amounts to Euro 443,207 at 31 December 2008, at which date no evidence of impairment has been observed that would require recognition in the income statement under IAS 36.

616
SECTION 2
Transactions after the end of the year
2.1 Business combinations
Two business acquisition contracts were signed on 27 February 2009 with the UBI Banca Group. In particular, Banca Nuova acquired the Palermo branch of Banca Popolare Commercio e Industria located in Via Notarbartolo, while the Parent Bank Banca Popolare di Vicenza acquired the Corporate Business Unit of Banca Popolare Commercio e Industria in Brescia.
These acquisitions were completed on 1 March 2009.
“Palermo branch” business
The provisional price paid for the acquisition of this business is Euro 2 million, which will be adjusted if the amount of deposits reported in the final balance sheet is lower than that reported at 31 July 2008 (the date being used for the opening balance sheet).
The balance sheet of this business at 31 July 2008 was as follows (in thousands of euro):
Position at 31 July 2008
Assets acquired: Liabilities acquired:– Cash and cash equivalents € 201 – Due to customers € 5,684 – Loans and advances – Provisions for severance to customers € 36,260 indemnities € 65 – Property, plant – Provisions for risks and and equipment € – charges € 17 – Other assets € 278 – Other liabilities € 194
Total Assets € 36,739 Total Liabilities € 5,960 Balance € 30,779
At this date the acquired business reported Euro 65.6 million in banking balances, of which Euro 5.7 million in direct deposits, Euro 23.7 million in indirect deposits and Euro 36.3 million in loans.The balance sheet at 1 March 2009 (effective date of the acquisition) is in the process of being prepared.

617
“Corporate Business Unit” in Brescia
This business was transferred from the UBI Group to Banca Popolare di Vicenza by way of an addition to the business comprising 61 branches of UBI Banca SpA acquired on 31 December 2007, meaning that no additional consideration was payable. The balance sheet of this business at 31 July 2008 (the date being used for the opening balance sheet) was as follows (in thousands of euro):
Position at 31 July 2008
Assets acquired: Liabilities acquired:– Cash and cash equivalents € – – Due to customers € 18,485 – Loans and advances – Provisions for severance to customers € 247,742 indemnities € 98 – Property, plant – Provisions for risks and– and equipment € – charges € 26 – Other assets € 36 – Other liabilities € 912
Total Assets € 247,778 Total Liabilities € 19,521 Balance € 228,257
At this date the acquired business reported Euro 267.7 million in banking balances, of which Euro 18.5 million in direct deposits, Euro 1.5 million in indirect deposits and Euro 247.7 million in loans.The balance sheet at 1 March 2009 (effective date of the acquisition) is in the process of being prepared.

618
PART HRELATED-PARTY TRANSACTIONS
1. Information on the remuneration of directors and managers
The following table reports the remuneration paid to key management personnel in 2008.
Key management personnel
a) Short-term benefits 8,813 b) Post-employment benefits 212 c) Other long-term benefits – d) Indemnities due on termination of employment – e) Share-based payments –
Total 9,025
Key management personnel comprise members of the Parent Bank’s General Management team, as defined in its articles of association, as well as its serving directors and statutory auditors.
The remuneration categories included in the above table comprise:a) Short-term benefits: these include: i) for members of the General Management team:
wages, salaries and related social security contributions, payment in lieu of vacation and sick leave, incentives and benefits in kind, such as medical assistance, housing, company cars and goods and services provided free or at reduced cost; ii) for Directors and Statutory Auditors: attendance fees, remuneration for the performance of their duties (including for similar offices held in Group companies), and, solely in relation to the directors, their share of 2007 net income;
b) Post-employment benefits: these include the Group’s contributions to pension funds (pension and retirement plans, life assurance and health care subsequent to termination) and the provision for severance indemnities recorded on the basis required by law and in-house agreements;
c) Other long-term benefits: there are no other long-term benefits worthy of mention (such as leave of absence or sabbaticals related to length of service, bonuses linked to yearsversaries, other benefits linked with length of service, disability benefits and, if due more than twelve months after the balance sheet date, profit share, incentives and deferred remuneration);
d) Indemnities due on termination of employment: these include the amounts paid for early termination prior to pensionable age, incentives for voluntary redundancy and incentives for early retirement;
e) Share-based payments: these include the cost of shares granted on achieving a certain length of service or specific objectives.

619
2. Information on related-party transactions
“Related-party transactions” are defined as all transactions with parties defined as such in IAS 24.
More specifically, with reference to the organization and governance of the Group, the following parties are deemed to be “related parties”:– companies under joint control: companies over which the Group exercises joint control,
whether directly or indirectly;– associated companies: companies over which the Group exercises significant influence,
whether directly or indirectly;– key management personnel, being members of General Management of the Parent Bank
and its banking subsidiaries, the General Manager and/or Managing Director of other subsidiaries, the Directors and Statutory Auditors of the Parent Bank and other group companies;
– “close family” of key management personnel;– companies controlled by, jointly controlled by or associated with key management personnel
or their close family;– parties that manage pension plans for the Group’s employees and any other parties related to
the Group.
“Close family” are deemed to be: (a) companion and children of the related party; (b) children of the companion; (c) dependents of the related party or their companion.
The following tables summarize the balances and transactions with related parties during the year and their impact on cash flow, according to their classification at 31 December 2008.
Balance sheet
1 Asset line items 20, 30, 40 and 50 from the consolidated balance sheet.2 Liability line items 30, 40 and 50 from the consolidated balance sheet.3 Include the close family of key management personnel, companies controlled by, jointly controlled by or associated
with key management personnel or their close family, and parties that manage pension plans for the Group’s employees and any other parties related to the Group.
Related parties Loans and Loans and Other Deposits Due Other Guarantees advances advances assets1 from to liabilities2 and to banks to customers banks customers commitments
– Associated companies – 28,357 300,144 – 113,322 97,403 24,224 – Companies under joint control – – – – – – – – Key management personnel – 8,543 – – 11,560 3,067 2,830 – Other related parties3 – 218,664 3,076 – 41,430 7,008 17,641
Total – 255,564 303,220 – 166,312 107,478 44,695
Total reported in balance sheet 2,305,618 22,704,640 1,272,768 3,076,718 12,161,877 9,889,128 5,073,769
% incidence 0.00% 1.13% 23.82% 0.00% 1.37% 1.09% 0.88%

620
Income statement
Related parties Interest Interest Net fee and Other costs/ income expense commission other income revenues1
– Associated companies 2,531 (6,983) 14,626 (44,077)– Companies under joint control 12,857 – 7,540 – – Key management personnel 497 (613) 277 (10,497)– Other related parties2 10,741 (1,215) 1,400 (594)
Total 26,626 (8,811) 23,843 (55,168)
Total reported in income statement 1,533,552 (880,602) 271,854 (630,244)
% incidence 1.74% 1.00% 8.77% 8.75%
1 Line items 180 and 220 from the consolidated income statement. They include the remuneration paid to key management personnel of the Parent Bank.
2 Include the close family of key management personnel, companies controlled by, jointly controlled by or associated with key management personnel or their close family, and parties that manage pension plans for the Group’s employees and any other parties related to the Group
Cash flows
Cash flows 31/12/2008
Loans and advances to customers (383,589)Other assets1 303,080
Total cash flows with related parties (80,509)
Total liquidity absorbed by financial assets (2,142,686)
% incidence 3.76%1 Asset line items 20, 30, 40 and 50 from the consolidated balance sheet.
Cash flows 31/12/2008
Due to customers 112,642 Other liabilities 2 (466,503)
Total cash flows with related parties (353,861)
Total liquidità generated by financial liabilities 1,941,783
% incidence -18.22%
2 Liability line items 30, 40 and 50 from the consolidated balance sheet.

621
Cash flows 31/12/2008
Interest income and similare revenues 26,626Interest expense and similar charges (8,811)Net fee and commission income 23,843Other income / other costs1 (55,168)
Total cash flows with related parties (13,510)
Total liquidity generated by financial liabilities 277,060
% incidence -4.88%1 Line items 180 and 220 from the consolidated income statement.
3. Disclosures by listed issuers and issuers whose financial instruments are held by the general public pursuant to art. 116 of the TUF – Requirements pursuant to art. 114.5 of Decree 58/98
CONSOB Communication 6064293 dated 28 July 2006 regarding “Disclosures by listed issuers and issuers whose financial instruments are held by the general public pursuant to art. 116 of the TUF – Requirements pursuant to art. 114.5 of Decree 58/98”, requires all listed companies and issuers of securities held by the public to provide detailed information in their explanatory notes and report on operations regarding: related-party transactions, significant and non-recurring events and operations, and positions and transactions deriving from atypical and/or unusual transactions.
In order to comply with the above CONSOB Communication, on 23 January 2007 the Board of Directors of the Parent Bank approved the “Regulations for reporting information about: transactions with related parties, significant and non-recurring transactions and atypical and/or unusual transactions”.
These Regulations bring together all the rules applied by Banca Popolare di Vicenza S.C.p.A. and its subsidiaries to identify transactions with related parties, significant and non-recurring transactions and atypical and/or unusual transactions, defining quantitative/qualitative criteria for the identification of such transactions for the purposes of reporting them in the financial statements pursuant to the CONSOB communication referred to above.
In order to define the operational rules applying within the Group that ensure implementation of the instructions contained in the above Regulations, a Manual has been prepared to clarify how to identify related parties, significant and non-recurring transactions and atypical and/or unusual transactions, and to establish the responsibilities for and controls over such activities.
The definitions and qualitative/quantitative criteria set out in the Regulations for the identification of the above transactions are presented below.
Related-party transactionsThe definition of “related parties” is included in the earlier point 2 entitled “Information on related-party transactions”.

622
Significant and non-recurring transactions“Significant and non-recurring” transactions are defined as all transactions that are not repeated frequently in the ordinary course of the Group’s activities and whose balance sheet and/or economic value exceeds a certain threshold of significance. In particular:– Significant transactions: transactions whose balance sheet and/or economic value exceeds at least one of the
following parameters:• 1%ofGroupequity,asreportedinthelatestconsolidatedfinancialstatements;• 4% of the Group’s net income for the year, as reported in the latest consolidated
financial statements.
For the purposes of the above calculation, each transaction must be considered separately; if transactions are strictly and objectively related as part of the same strategic or operational plan, the calculation must refer to all the related transactions taken together.
If no consideration is agreed for a transaction, its “normal value” must be determined beforehand to reflect the price at which the transaction would have taken place between independent parties on arms’-length terms. Standard funding, lending and investment activities conducted on normal market terms are not reported as significant transactions.
– Non-recurring transactions: Transactions that are not repeated frequently in the ordinary course of the Group’s activities. The frequency of transactions must also be assessed with reference to prior years as well as to the current year.
Atypical and/or unusual transactionsThese are defined as all significant transactions, as defined above, which due to the nature of the counterparties, the purpose of the transaction, the method of determining the transfer price or the timing of the event (close to the accounting reference date) may give rise to doubts about the correctness/completeness of the information reported in the financial statements, possible conflicts of interest, the safeguarding of assets or the protection of minority stockholders.
Atypical and/or unusual transactions are a subset of significant transactions and are identifiable from the atypical nature of the counterparty or purpose of the transactions and/or from the unusual way in which the transfer price is determined or from the timing of the event.
As an example, the following may be atypical and/or unusual transactions:• withreferencetothenatureofthecounterparty:significanttransactionsarrangedwith
related parties; • withreferencetothepurposeofthetransaction:significanttransactionsinvolvingthe
transfer of resources, services or obligations that are not conducted in the ordinary course of the Group’s activities;
• withreferencetothewaythattransferpriceisdetermined:significanttransactionswhosetransfer price is not determined on an arms’-length basis and, in any case, those for which no consideration is agreed;
• withreferencetothetimingoftheevent:significanttransactionsarrangedclosetotheaccounting reference date or other relevant date for the purposes of providing information to the stockholders and/or the market.

623
With reference to the transactions referred to above, the following quantitative disclosures provided in accordance with the requirements of CONSOB Communication 6064293 dated 28 July 2006 have been determined on the basis described above.
3.1 Related-party transactions
The related quantitative disclosures have been provided earlier in point 2 “Information on related-party transactions”.
3.2 Significant non-recurring events and transactions
The entire interest (47.9625% of capital stock) held in Linea SpA was sold on 27 June 2008 for Euro 193 million, net of related costs, under the agreement reached in December 2007 with Compass SpA (Mediobanca Group).
This significant non-recurring transaction falls within the ordinary course of business and does not represent an atypical and/or unusual transaction.
The effect of this transaction on the Group’s balance sheet, cash flows and income statement in 2008 is summarized in the following tables.
Summary of significant and non-recurring events and transactions affecting the balance sheet.
(in thousand of euro)
Transaction Amount Line item1 % Description Amount incidence
Disposal of interests in Linea SpA 101,320 150 Assets – -100.0%
1 This refers to the total amount reported in the corresponding line item of the balance sheet.
Summary of significant and non-recurring events and transactions affecting the cash flow state-ment.(in thousand of euro) Transaction Amount Line item1 % Description Amount incidence
Disposal of interests in Linea SpA 192,966 B.1 215,996 89.3%
1 This refers to the total cash flow generated (absorbed) reported in the corresponding line of the cash flow state-ment.

624
Summary of significant and non-recurring events and transactions affecting the income statement.
(in thousand of euro) Transaction Amount Line item1 % Description Amount incidence
Disposal of interests in Linea SpA Income Statement – gross of tax 91,646 280 IS 172,147 53.2% – tax (1,530) 290 IS (61,092) 2.5% – net of tax 90,116 340 IS 108,739 82.9%1 This refers to the total amount reported in the corresponding line item of the income statement.
3.3 Positions or transactions deriving from atypical and/or unusual transactions
No atypical and/or unusual transactions with a significant effect on the Group’s balance sheet, financial position and results of operations were arranged during the year.

625
PART IEQUITY-SETTLED PAYMENT ARRANGEMENTS
There are no outstanding equity–settled payment arrangements

626
ATTACHMENT N. 1
In compliance with the requirements of art. 160.1-bis of TUF (Italy’s Consolidated Financial Markets Act), the following table presents the fees earned by the independent auditors and members of its network for auditing and other services provided to the Group.
(in thousands of euro)
Type of services Party providing service Fees1
Audit KPMG SpA 500 Attestation services KPMG SpA 35 Tax advisory services K-Studio Associato SpA 32 Other services KPMG SpA / KPMG Advisory SpA 257 Total 823
1 these amounts include out-of-pocket expenses recharged plus any disallowable VAT.

FINANCIAL STATEMENTS OF SUBSIDIARY COMPANIESAT 31 DECEMBER 2008
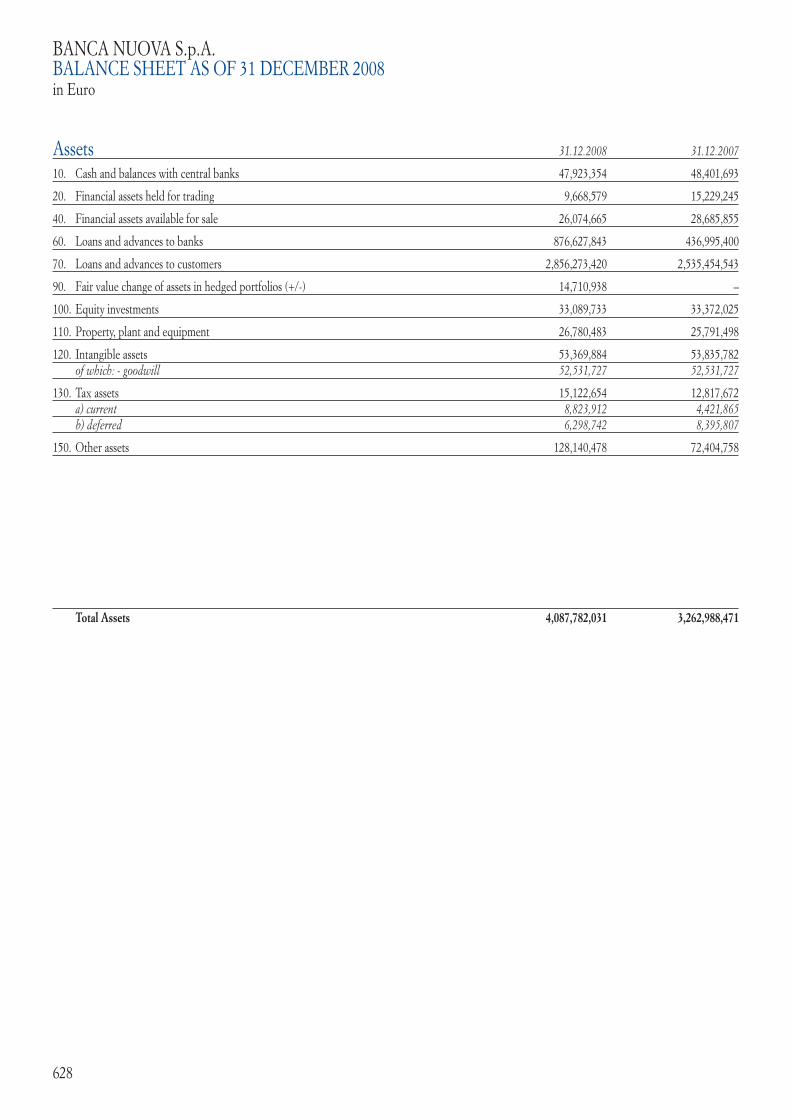
628
BANCA NUOVA S.p.A.BALANCE SHEET AS OF 31 DECEMBER 2008in Euro
Assets 31.12.2008 31.12.2007
10. Cash and balances with central banks 47,923,354 48,401,693
20. Financial assets held for trading 9,668,579 15,229,245
40. Financial assets available for sale 26,074,665 28,685,855
60. Loans and advances to banks 876,627,843 436,995,400
70. Loans and advances to customers 2,856,273,420 2,535,454,543
90. Fair value change of assets in hedged portfolios (+/-) 14,710,938 –
100. Equity investments 33,089,733 33,372,025
110. Property, plant and equipment 26,780,483 25,791,498
120. Intangible assets 53,369,884 53,835,782 of which: - goodwill 52,531,727 52,531,727
130. Tax assets 15,122,654 12,817,672 a) current 8,823,912 4,421,865 b) deferred 6,298,742 8,395,807
150. Other assets 128,140,478 72,404,758
Total Assets 4,087,782,031 3,262,988,471

629
Equity and liabilities 31.12.2008 31.12.2007
10. Deposits from banks 267,119,279 26,842,985
20. Due to customers 2,691,675,113 2,210,791,744
30. Debt securities in issue 632,975,571 518,466,867
40. Financial liabilities held for trading 6,056,084 21,549,468
50. Financial liabilities at fair value 169,815,360 167,490,617
60. Hedging derivatives 14,523,267 –
80. Tax liabilities: 14,599,058 17,608,345 a) current 11,093,002 12,365,563 b) deferred 3,506,056 5,242,782
100. Other liabilities 61,105,842 69,173,280
110. Provision for severance indemnities 11,952,477 11,505,434
120. Provisions for risks and charges: 7,672,948 14,557,008 b) other provisions 7,672,948 14,557,008
130. Valuation reserves 938,938 14,340,798
160. Reserves 43,008,728 42,403,332
170. Additional paid-in capital 108,437,771 108,437,771
180. Capital stock 42,690,211 29,783,868
200. Net income (loss) for the year (+/-) 15,211,384 10,036,954
Total Equity and Liabilities 4,087,782,031 3,262,988,471

630
BANCA NUOVA S.p.A.INCOME STATEMENT FOR THE YEAR ENDED 31 DECEMBER 2008in Euro
Captions 31.12.2008 31.12.2007
10. Interest income and similar revenues 202,222,328 164,003,097
20. Interest income and similar charges (103,304,734) (72,230,937)
30. Net interest income 98,917,594 91,772,160
40. Fee and commission income 47,004,127 47,023,308
50. Fee and commission expense (7,524,415) (7,842,151)
60. Net fee and commission income 39,479,712 39,181,157
70. Dividen and similar income 2,245,714 4,215,861
80. Net trading income 598,863 1,382,864
90. Fair value adjustments in hedge accounting 187,671 –
100. Gain (losses) on disposals/repurchases of: 1,747,557 454,710 a) loans and advances (12,496) 15,814 b) financial assets available for sale 1,429,723 – d) financial liabilities 330,330 438,896
110. Net charge in financial assets and liabilities at fair value 1,196,358 (131,758)
120. Net interest and other banking income 144,373,469 136,874,994
130. Net impairment adjustments to: (10,807,274) (10,632,850) a) loans and advances (10,825,894) (10,669,202) b) financial assets available for sale (5,165) – d) other financial transactions 23,785 36,352
140. Net income from financial activities 133,566,195 126,242,144
150. Administrative costs: (108,532,068) (100,558,463) a) payroll (60,140,578) (55,117,499) b) other administrative costs (48,391,490) (45,440,964)
160. Net provisions for risks and charges (2,697,181) (6,711,888)
170. Net adjustments to property, plant and equipment (3,088,993) (2,752,433)
180. Net adjustments to intangible assets (782,045) (688,144)
190. Other operating charges/income 7,058,522 7,314,685
200. Operating costs (108,041,765) (103,396,243)
210. Profit (loss) from equity investments (420,000) (660,000)
220. Net gains (losses) arising on fair value adjustments to property, plant and equipment and intangible assets – (87,653)
240. Gains (losses) on disposals of investments (17,028) 1,883
250. Profit (loss) from current operations before tax 25,087,402 22,100,131
260. Income taxes on current operations (9,876,018) (12,063,177)
270. Profit (loss) from current operations after tax 15,211,384 10,036,954
290. Net income (loss) for the year 15,211,384 10,036,954

.

632
CARIPRATO S.p.A.BALANCE SHEET AS OF 31 DECEMBER 2008in Euro
Assets 31.12.2008 31.12.2007
10. Cash and balances with central banks 26,990,599 30,083,437
20. Financial assets held for trading 43,401,151 35,557,355
40. Financial assets available for sale 39,331,844 39,172,771
60. Loans and advances to banks 185,211,088 324,709,018
70. Loans and advances to customers 3,394,376,187 3,198,350,751
100. Equity investments 2,483,792 2,467,804
110. Property, plant and equipment 105,850,459 105,980,263
120. Intangible assets 6,326,469 6,343,224 of which: - goodwill 5,764,659 5,764,659
130. Tax assets 27,221,718 16,066,702 a) current 9,030,312 4,166,742 b) deferred 18,191,406 11,899,960
150. Other assets 65,329,275 52,693,790
Total Assets 3,896,522,582 3,811,425,115

633
Equity and liabilities 31.12.2008 31.12.2007
10. Deposits from banks 593,059,013 692,667,408
20. Due to customers 1,834,384,528 1,853,782,255
30. Debt securities in issue 871,185,029 637,062,779
40. Financial liabilities held for trading 19,406,661 18,627,191
50. Financial liabilities at fair value 165,242,248 193,149,283
80. Tax liabilities: 19,063,622 18,561,868 a) current 6,384,192 4,022,112 b) deferred 12,679,430 14,539,756
100. Other liabilities 75,061,142 68,605,190
110. Provision for severance indemnities 16,478,124 16,240,501
120. Provisions for risks and charges: 23,522,498 23,923,741 a) pensions and similar commitments 8,642,776 9,191,287 b) other provisions 14,879,722 14,732,454
130. Valuation reserves 546,840 50,894,099
160. Reserves 111,308,034 108,876,499
170. Additional paid-in capital 13,502,766 13,502,766
180. Capital stock 153,300,000 103,300,000
200. Net income (loss) for the year (+/-) 462,077 12,231,535
Total Equity and Liabilities 3,896,522,582 3,811,425,115

634
CARIPRATO S.p.A.INCOME STATEMENT FOR THE YEAR ENDED 31 DECEMBER 2008in Euro
Captions 31.12.2008 31.12.2007
10. Interest income and similar revenues 232,661,299 195,116,438
20. Interest income and similar charges (110,525,731) (85,741,734)
30. Net interest income 122,135,568 109,374,704
40. Fee and commission income 41,337,146 43,268,469
50. Fee and commission expense (1,968,114) (2,163,272)
60. Net fee and commission income 39,369,032 41,105,197
70. Dividen and similar income 140,036 4,691,970
80. Net trading income (787,569) 875,850
100. Gain (losses) on disposals/repurchases of: 379,713 193,204 b) financial assets available for sale 14,854 – d) financial liabilities 364,859 193,204
110. Net charge in financial assets and liabilities at fair value 202,452 41,063
120. Net interest and other banking income 161,439,232 156,281,988
130. Net impairment adjustments to: (37,036,218) (22,120,005) a) loans and advances (36,657,680) (21,792,013) b) financial assets available for sale (310,173) (163,670) d) other financial assets (68,365) (164,322)
140. Net income from financial activities 124,403,014 134,161,983
150. Administrative costs: (117,273,928) (106,383,340) a) payroll (73,223,299) (64,874,663) b) other administrative costs (44,050,629) (41,508,677)
160. Net provisions for risks and charges (4,429,423) (8,369,212)
170. Net adjustments to property, plant and equipment (3,623,899) (3,253,275)
180. Net adjustments to intangible assets (315,902) (237,664)
190. Other operating charges/income 8,291,823 8,455,376
200. Operating costs (117,351,329) (109,788,115)
220. Net gains (losses) arising on fair value adjustments to property, plant and equipment and intangible assets 170,790 15,000
240. Gains (losses) on disposals of investments (419) (8,344)
250. Profit (loss) from current operations before tax 7,222,056 24,380,524
260. Income taxes on current operations (6,759,979) (12,148,989)
270. Profit (loss) from current operations after tax 462,077 12,231,535
290. Net income (loss) for the year 462,077 12,231,535

.

636
Assets 31.12.2008 31.12.2007
10. Cash and balances with central banks 37,736 23,532
40. Financial assets available for sale 10,613 10,613
60. Loans and advances to banks 2,799,103 9,504,887
70. Loans and advances to customers 319,021,771 206,053,950
100. Equity investments 40,988 25,000
110. Property, plant and equipment 299,276 108,536
120. Intangible assets 27,513 2,203
130. Tax assets 297,914 152,252 a) current 73,724 74,419 b) deferred 224,190 77,833
150. Other assets 18,623,654 23,637,753
Total Assets 341,158,568 239,518,726
FARBANCA S.p.A.BALANCE SHEET AS OF 31 DECEMBER 2008in Euro
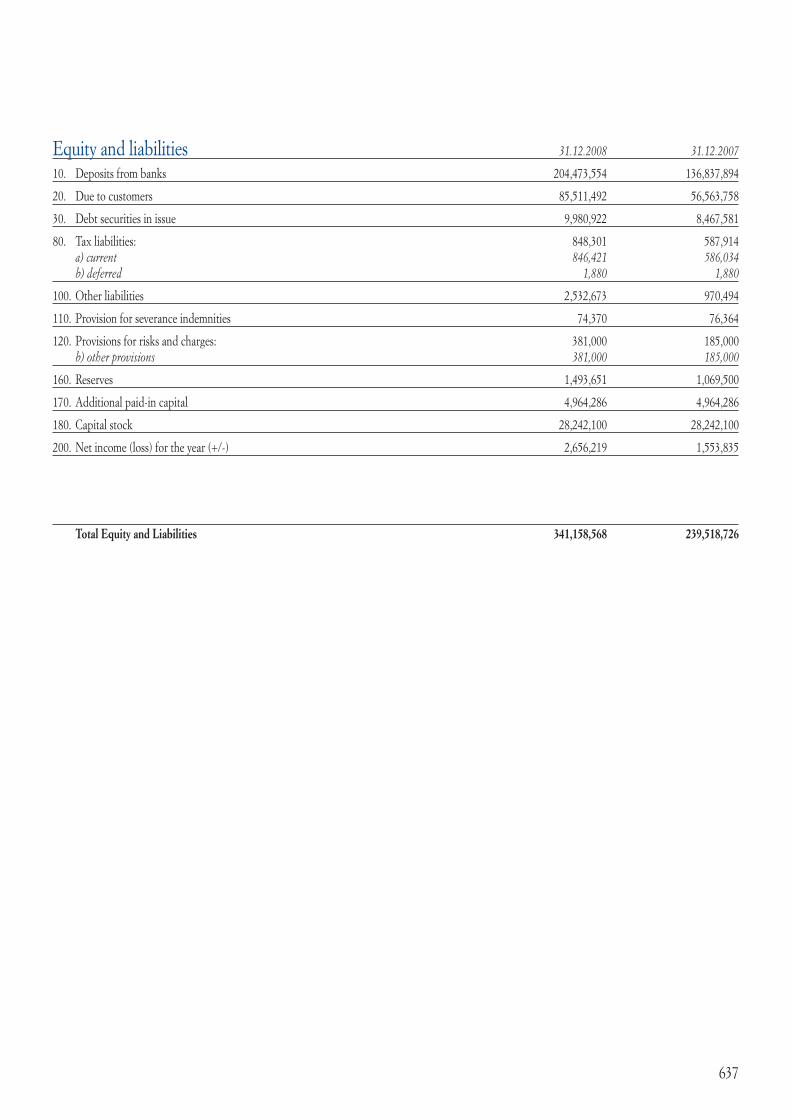
637
Equity and liabilities 31.12.2008 31.12.2007
10. Deposits from banks 204,473,554 136,837,894
20. Due to customers 85,511,492 56,563,758
30. Debt securities in issue 9,980,922 8,467,581
80. Tax liabilities: 848,301 587,914 a) current 846,421 586,034 b) deferred 1,880 1,880
100. Other liabilities 2,532,673 970,494
110. Provision for severance indemnities 74,370 76,364
120. Provisions for risks and charges: 381,000 185,000 b) other provisions 381,000 185,000
160. Reserves 1,493,651 1,069,500
170. Additional paid-in capital 4,964,286 4,964,286
180. Capital stock 28,242,100 28,242,100
200. Net income (loss) for the year (+/-) 2,656,219 1,553,835
Total Equity and Liabilities 341,158,568 239,518,726

638
Captions 31.12.2008 31.12.2007
10. Interest income and similar revenues 18,336,213 12,365,821
20. Interest income and similar charges (9,420,736) (6,222,008)
30. Net interest income 8,915,477 6,143,813
40. Fee and commission income 876,922 689,999
50. Fee and commission expense (131,312) (126,934)
60. Net fee and commission income 745,610 563,065
80. Net trading income (6,137) 6,760
100. Gain (losses) on disposals/repurchases of: 532 24 d) financial liabilities 532 24
120. Net interest and other banking income 9,655,482 6,713,662
130. Net impairment adjustments to: (1,115,242) 138,381 a) loans and advances (1,115,242) 141,729 b) financial assets available for sale – (3,348)
140. Net income from financial activities 8,540,240 6,852,043
150. Administrative costs: (4,321,366) (3,765,543) a) payroll (2,373,178) (1,847,528) b) other administrative costs (1,948,188) (1,918,015)
160. Net provisions for risks and charges (101,000) (65,000)
170. Net adjustments to property, plant and equipment (54,334) (36,031)
180. Net adjustments to intangible assets (8,400) (193)
190. Other operating charges/income 235,631 (162,812)
200. Operating costs (4,249,469) (4,029,579)
240. Gains (losses) on disposals of investments 20 5
250. Profit (loss) from current operations before tax 4,290,791 2,822,469
260. Income taxes on current operations (1,634,572) (1,268,634)
270. Profit (loss) from current operations after tax 2,656,219 1,553,835
290. Net income (loss) for the year 2,656,219 1,553,835
FARBANCA S.p.A.INCOME STATEMENT FOR THE YEAR ENDED 31 DECEMBER 2008in Euro

.

640
NORDEST MERCHANT S.p.A.BALANCE SHEET AS OF 31 DECEMBER 2008in Euro
Assets 31.12.2008 31.12.2007
10. Cash and balances with central banks 131 475
40. Financial assets available for sale 1,969,854 1,559,149
60. Loans and advances 2,920,050 1,737,418
90. Equity investments 2,400,000 2,400,000
100. Property, plant and equipment 101,233 86,036
120. Tax assets 37,598 216,466 a) current 22,500 30,550 b) deferred 15,098 185,916
140. Other assets 18,253 12,921
Total Assets 7,447,119 6,012,465

641
Equity and liabilities 31.12.2008 31.12.2007
10. Payables 1,062,909 711,116
70. Tax liabilities: 221,288 65,523 a) current 88,435 65,523 b) deferred 132,853 –
90. Other liabilities 28,914 169,690
100. Provision for severance indemnities 240,199 178,038
110. Provisions for risks and charges 40,502 140,579 c) other provisions 40,502 140,579
120. Capital stock 2,000,000 2,000,000
160. Reserves 2,747,519 2,317,359
170. Valuation reserves 278,203 –
180. Net income (loss) for the year (+/-) 827,585 430,160
Total Equity and Liabilities 7,447,119 6,012,465

642
NORDEST MERCHANT S.p.A.INCOME STATEMENT FOR THE YEAR ENDED 31 DECEMBER 2008in Euro
Captions 31.12.2008 31.12.2007
10. Interest income and similar revenues 94,432 17,056
20. Interest income and similar charges (1,429) (37)
Net interest income 93,003 17,019
30. Fee and commission income 3,625,594 3,228,766
40. Fee and commission expense (1,846,737) (1,493,871)
Net fee and commission income 1,778,857 1,734,895
50. Dividend and similar income 717,240 198,000
Net interest and other banking income 2,589,100 1,949,914
110. Net impairment adjustments to: (351) 4,089
a) loans and advances – 5,321
b) financial assets available for sale (351) (1,232)
120. Administrative costs: (1,695,957) (1,430,609)
a) payroll (1,362,030) (1,053,483)
b) other administrative costs (333,927) (377,126)
130. Net adjustments to property, plant and equipment (32,677) (34,985)
160. Net provisions for risks and charges – (135,580)
170. Other operating expenses (33,562) (20,894)
180. Other operating income 256,275 234,618
Net profit from operating activities 1,082,828 566,553
200. Gains (losses) on disposals of investments (2,996) (8,881)
Profit (loss) from current operations before tax 1,079,832 557,672
210. Income taxes on current operations (252,247) (127,512)
Profit (loss) from current operations after tax 827,585 430,160
Net income (loss) for the year 827,585 430,160

.

644
NEM SGR S.p.A.BALANCE SHEET AS OF 31 DECEMBER 2008in Euro
Assets 31.12.2008 31.12.2007
10. Cash and balances with central banks 402 336
40. Financial assets available for sale 1,100 –
60. Loans and advances 2,170,301 2,209,425
b) other loans and advances 2,170,301 2,209,425
120. Tax assets 15,857 7,640 a) current 8,674 75 b) deferred 7,183 7,565
140. Other assets 87,987 23,548
Total Assets 2,275,647 2,240,949

645
Equity and liabilities 31.12.2008 31.12.2007
10. Payables 492,387 439,322
70. Tax liabilities: 29,174 157,077 a) current 29,174 157,077
90. Other liabilities 81,092 118,069
120. Capital stock 1,200,000 1,200,000
160. Reserves 47,463 30,590
170. Valuation reserves (7,707) (2,981)
180. Net income (loss) for the year (+/-) 433,238 298,872
Total Equity and Liabilities 2,275,647 2,240,949

646
NEM SGR S.p.A.INCOME STATEMENT FOR THE YEAR ENDED 31 DECEMBER 2008in Euro
Captions 31.12.2008 31.12.2007
10. Fee and commission income 1,746,575 1,632,207
Net fee and commission income 1,746,575 1,632,207
40. Interest income and similar revenues 114,999 86,661
50. Interest income and similar charges (167) –
Net interest and other banking income 1,861,407 1,718,868
120. Administrative costs: (1,314,924) (1,264,748) a) payroll (622,958) (749,319) b) other administrative costs (691,966) (515,429)
170. Other operating expenses (859) (816)
180. Other operating income 124,371 91,829
Net profit from operating activities 669,995 545,133
Profit (loss) from current operations before tax 669,995 545,133
210. Income taxes on current operations (236,757) (246,261)
Profit (loss) from current operations after tax 433,238 298,872
Net income (loss) for the year 433,238 298,872

.

648
NEM DUE SGR S.p.A.BALANCE SHEET AS OF 31 DECEMBER 2008in Euro
Assets 31.12.2008 31.12.2007
10. Cash and balances with central banks 1,147 735
40. Financial assets available for sale 189,623 –
60. Loans and advances 2,009,627 2,364,293 b) Other provisions loans and advances 2,009,627 2,364,293
100. Property, plant and equipment 5,828 6,986
120. Tax assets 18,309 10,794 a) current 9,295 – b) deferred 9,014 10,794
140. Other assets 95,360 228,450
Total Assets 2,319,894 2,611,258

649
Equity and liabilities 31.12.2008 31.12.2007
10. Payables 404,336 602,653
70. Tax liabilities: 65,711 243,403 a) current 65,711 243,403
90. Other liabilities – 191,651
100. Provision for severance indemnities 37,098 20,711
120. Capital stock 1,200,000 1,200,000
160. Reserves 40,839 19,458
170. Valuation reserves (6,978) –
180. Net income (loss) for the year (+/-) 578,888 333,382
Total Equity and Liabilities 2,319,894 2,611,258

650
NEM DUE SGR S.p.A.INCOME STATEMENT FOR THE YEAR ENDED 31 DECEMBER 2008in Euro
Captions 31.12.2008 31.12.2007
10. Fee and commission income 2,157,898 1,903,515
20. Fee and commission expense (96,014) (138,750)
Net fee and commission income 2,061,884 1,764,765
40. Interest income and similar revenues 102,640 49,330
100. Utile/perdita da cessione o riacquisto di: 4,006 – a) Financial assets available for sale 4,006 –
Net interest and other banking income 2,168,530 1,814,095
120. Administrative costs: (1,328,147) (1,207,983) a) payroll (909,493) (944,480) b) other administrative costs (418,654) (263,503)
130. Net adjustments to property, plant and equipment (1,692) (1,147)
170. Other operating expenses (396) (386)
180. Other operating income 64,079 5,003
Net profit from operating activities 902,374 609,582
Profit (loss) from current operations before tax 902,374 609,582
210. Income taxes on current operations (323,486) (276,200)
Profit (loss) from current operations after tax 578,888 333,382
Net income (loss) for the year 578,888 333,382

.

652
IMMOBILIARE STAMPA S.p.A. BALANCE SHEET AS OF 31 DECEMBER 2008in Euro
Assets 31.12.2008 31.12.2007
B) Fixed assets, indicating those under finance lease separately: I. Intangible fixed assets 4) Concessions, licenses, trademarks and similar rights 14,367 7,129 7) Other 23,668 5,414
Total 38,035 12,543 II. Tangible fixed assets 1) Land and buildings 215,627,357 195,334,026 2) Plant and machinery 199,060 210,498 4) Other assets 113,159 165,011 5) Assets under construction and advance payments 3,556,681 2,411,363
Total 219,496,257 198,120,898 III. Financial fixed assets, indicating amounts due within 12 months, separately for each receivables account 1) Equity investments in: d) other companies 4,724,398 4,104,398 2) Receivables: d) due from third parties beyond 12 months 9,088 29,731
Total 4,733,486 4,134,129
Total fixed assets (B) 224,267,778 202,267,570
C) Current assets II. Receivables, indicating amounts due within 12 months separately for each receivables account: 1) Due from customers 25,693 2,033,923 4) Due from parent companies 403,073 594,140 6) Deferred tax assets 38,682 70,707 7) Due from third parties 15,151 3,529
Total 482,599 2,702,299 IV. Liquid funds: 1) Bank and post office accounts 3,348,985 – 3) Cash and cash equivalents 379 275
Total 3,349,364 275
Total current assets (C) 3,831,963 2,702,574
D) Accrued income and prepaid expenses, indicating discounts on loans separately 211,211 173,737
Total accrued income and prepaid expenses (D) 211,211 173,737
Total Assets 228,310,952 205,143,881

653
Liabilities and stockholders’ equity 31.12.2008 31.12.2007
A) Stockholders’ equity: I. Capital stock 125,000,000 125,000,000 II. Additional paid-in capital 69,400,000 69,400,000 IV. Legal reserve 1,588,544 1,427,509 VII. Other reserves, indicated separately – Extraordinary reserve 393,907 393,907 VIII. Retained earnings (accumulated losses) 36,005 33,842 IX. Net income (loss) for the year 2,831,844 3,220,698
Total stockholders’ equity (A) 199,250,300 199,475,956
B) Provisions for risks and charges 2) Provision for taxation 162,826 323,305 3) Other provisions 50,000 46,835
Total provisions for risks and charges (B) 212,826 370,140
C) Provisions for severance indemnities 529,508 631,879
Total provisions for severance indemnities (C) 529,508 631,879
D) Payables, indicating amounts due beyond 12 months separately for each payables account: 3) Due to banks 19,602,502 2,980,595 7) Due to suppliers 1,187,741 633,141 11) Due to parent companies – 222,722 12) Due to tax authorities 33,071 31,812 13) Due to social security and pension institutions 67,747 54,118 14) Other payables – within 12 months 1,458,405 604,352 – beyond 12 months 66,068 61,628
Total payables (D) 22,415,534 4,588,368
E) Accrued expenses and deferred income, indicating premiums on loans separately 5,902,784 77,538
Total accrued expenses and deferred income (E) 5,902,784 77,538
Total Liabilities and Stockholders’ equity 228,310,952 205,143,881
A) MEMORANDUM ACCOUNTS 31.12.2008 31.12.2007 II. Commitments 1) Supply contracts 699,770 216,023 2) Sale of buildings 371,800 3,559,300 3) Sureties received from third parties 1,488,320 820 4) Sureties issued 570,500 –
Total 3,130,390 3,776,143
Total memorandum accounts 3,130,390 3,776,143

654
IMMOBILIARE STAMPA S.p.A. INCOME STATEMENT FOR THE YEAR ENDED 31 DECEMBER 2008in Euro
Captions 31.12.2008 31.12.2007
A) Value of production: 1) Revenues from sales and services 15,219,931 14,599,910 5) Other income and revenues, indicating contributions for operating expenses separately 12,595 878,485
Total value of production (A) 15,232,526 15,478,395
B) Production costs: 6) Raw, ancillary and consumable materials (28,414) (54,373) 7) Services received (2,199,939) (1,858,121) 8) Leases and rentals (49,767) (54,217) 9) Personnel: a) wages and salaries (1,121,591) (1,306,397) b) social security contributions (316,152) (362,358) c) severance indemnities (73,580) (82,379) d) pensions and similar commitments (35,535) (35,270) e) other costs (3,036) (801) 10) Amortization, depreciation and writedowns a) amortization of intangible fixed assets (7,257) (14,607) b) amortization of tangible fixed assets (5,693,305) (5,523,763) 12) Provisions for risks (50,000) (26,735) 14) Other operating expenses (897,644) (933,615)
Total production costs (B) (10,476,220) (10,252,636)
DIFFERENCE BETWEEN VALUE AND COST OF PRODUCTION (A-B) 4,756,306 5,225,759
C) Financial income and charges: 16) Other financial income d) income other than the above, indicating that from subsidiary, associated and parent companies separately 105,744 76,411 17) Interest and other financial charges, indicating those from subisdiary, associated and parent companies separately (351,266) (27,445)
Total financial income and charges (C) (245,522) 48,966
D) Adjustments to financial assets 19) Writedowns b) financial fixed assets (1,256) –
Total adjustments to financial assets (D) (1,256) –
E) Extraordinary income and charges 20) Income, indicating separately gains on disposals not classifiable in line 5) 83,711 29,943 21) Charges, indicating separately losses on disposals not classifiable in line 14), and taxes relating to prior years: (101,785) (19,351) – losses on disposals – (382)
Total extraordinary items (E) (18,074) 10,592
Results before taxes (A - B ± C ± D ± E) 4,491,454 5,285,317 22) Income taxes for the year (current and deferred) (1,659,610) (2,064,619) 23) Net income (loss) for the year 2,831,844 3,220,698

.

656
NUOVA MERCHANT S.p.A.BALANCE SHEET AS OF 31 DECEMBER 2008in Euro
Assets 31.12.2008 31.12.2007
B) Fixed assets, indicating those under finance lease separately: I. Intangible fixed assets 208,351 208,351 – (Amortization) (204,756) (202,302) – (Writedowns) (3,595) –
Total – 6,049
II. Tangible fixed assets 19,709 15,549 – (Depreciation) (15,717) (14,011) – (Writedowns) (3,992) –
Total – 1,538
III. Financial fixed assets, indicating amounts due within 12 months separately for each receivables account 321 1,058 – (Writedowns) – –
Total 321 1,058
Total fixed assets (B) 321 8,645
C) Current assets: II. Receivables, indicating amounts due within months separately for each receivables account: – within 12 months 2,491,915 7,518,071 – beyond 12 months – 275,161
Total 2,491,915 7,793,232
IV. Liquid funds: 185 179
Total 185 179
Total current assets (C) 2,492,100 7,793,411
D) Accrued income and prepaid expenses, indicating discounts on loans separately 572 1,582 Total accrued income and prepaid expenses (D) 572 1,582
Total Assets 2,492,993 7,803,638

657
Liabilities and stockholders’ equity 31.12.2008 31.12.2007
A) Stockholders’ equity: I. Capital stock 120,000 1,100,000 IV. Legal reserve – 12,263 VII. Other reserves, indicated separately 3,235,997 186,907 Extraordinary reserve – 186,907 IX. Net income (loss) for the year (3,511,161) (264,982)
Total stockholders’ equity (A) (155,164) 1,034,188
B) Provisions for risks and charges 10,000 –
Total provisions for risks and charges (B) 10,000 –
C) Provisions for severance indemnities 46,500 147,946
Total provisions for severance indemnities (C) 46,500 147,946
D) Payables, indicating amounts due beyond months separately for each payable account: – within 12 months 2,591,405 6,616,586 – beyond 12 months – –
Total payables (D) 2,591,405 6,616,586
E) Accrued expenses and deferred income, indicating premiums on loans separately 252 4,918
Total accrued expenses and deferred income (E) 252 4,918
Total liabilities and stockholders’ equity 2,492,993 7,803,638
MEMORANDUM ACCOUNTS 31.12.2008 31.12.2007
Contractual risks 2,800,000 –
Total memorandum accounts 2,800,000 –

658
NUOVA MERCHANT S.p.A.INCOME STATEMENT FOR THE YEAR ENDED 31 DECEMBER 2008in Euro
Captions 31.12.2008 31.12.2007
A) Value of production: 1) Revenues from sales and services 152,855 1,620,914 5) Other income and revenues, indicating contributions for operating expenses separately 30,435 24,412
Total value of production (A) 183,290 1,645,326
B) Production costs: 6) Raw, ancillary and consumable materials (1,783) (4,539) 7) Services received (1,211,855) (870,104) 8) Leases and rentals (143,579) (141,834) 9) Personnel a) wages and salaries (1,590,819) (518,833) b) social security contributions (212,237) (206,418) c) severance indemnities (38,563) (40,997) e) other costs (14,927) – 10) Amortization, depreciation and writedowns a) amortization of intangible fixed assets (2,455) (14,350) b) depreciation of tangible fixed assets (1,706) (1,592) c) other amounts written off fixed assets (7,586) – d) writedown of current receivables and of liquid funds (259,800) (70,000) 13) Other provisions (10,000) – 14) Other operating expenses (74,659) (9,923)
Total production costs (B) (3,569,969) (1,878,590)
DIFFERENCE BETWEEN VALUE AND COST OF PRODUCTION (A-B) (3,386,679) (233,264)
C) Financial income and charges: 16) Other financial income a) from long-term receivables, indicating that from subsidiary, associated and parent companies separately 660 – d) income other than the above, indicating that from subsidiary, associated and parent companies separately – 60,294 17) Interest and other financial charges, indicating those from subisdiary, associated and parent companies separately (162,229) (127,957)
Total financial income and charges (C) (161,569) (67,663)
E) Extraordinary income and charges 20) Income, indicating separately gains on disposals not classifiable in line 5) 135,470 – 21) Charges, indicating separately losses on disposals not classifiable in line 14), and taxes relating to prior years – (1,584)
Total extraordinary items (E) 135,470 (1,584)
Results before taxes (A - B ± C ± D ± E) (3,412,778) (302,511) 22) Income taxes for the year (current and deferred) (98,383) 37,529 23) Net income (loss) for the year (3,511,161) (264,982)

.

660
BPVI FONDI SGR S.p.A.BALANCE SHEET AS OF 31 DECEMBER 2008in Euro
Assets 31.12.2008 31.12.2007
10. Cash and balances with central banks 6,337 8,572
40. Financial assets available for sale 13,092,803 10,289,283
60. Loans and advances 8,477,496 10,844,452 a) for portfolio management 1,477,101 1,697,329 b) other loans and advances 7,000,395 9,147,123
90. Equity investments – 300,000
100. Property, plant and equipment 195,478 256,109
110. Intangible assets 198,124 637,072
120. Tax assets 1,231,798 987,279 a) current 485,489 422,660 b) deferred 746,309 564,619
140. Other assets 466,617 666,942
Total Assets 23,668,653 23,989,709

661
Equity and liabilities 31.12.2008 31.12.2007
10. Payables 2,159,298 6,951,499
70. Tax liabilities: 39,075 67,922 a) current – – b) deferred 39,075 67,922
90. Other liabilities 1,990,441 2,946,545
100. Provision for severance indemnities 340,476 191,861
110. Provisions for risks and charges: 601,500 601,500 b) other provisions 601,500 601,500
120. Capital stock 10,000,000 10,000,000
160. Reserves 7,803,779 1,287,359
170. Valuation reserves (180,103) 98,845
180. Net income (loss) for the year (+/-) 914,187 1,844,178
Total Equity and Liabilities 23,668,653 23,989,709

662
BPVI FONDI SGR S.p.A.INCOME STATEMENT FOR THE YEAR ENDED 31 DECEMBER 2008in Euro
Captions 31.12.2008 31.12.2007
10. Fee and commission income 15,861,352 22,130,653
20. Fee and commission expense (7,547,386) (14,961,447)
Net fee and commission income 8,313,966 7,169,206
30. Dividend and similar income 26,211 –
40. Interest income and similar revenues 783,130 530,729
60. Net trading income 29,954 –
100. Gains (losses) on disposal or repurchase of: 149,460 76,833 a) financial assets available for sale 149,460 76,833
Net interest and other banking income 9,302,721 7,776,768
120. Administrative costs: (7,747,861) (4,582,131) a) payroll (3,732,559) (2,590,511) b) other administrative costs (4,015,302) (1,991,620)
130. Net adjustments to property, plant and equipment (85,440) (100,997)
140. Net adjustments to intangible assets (519,698) (364,606)
170. Other operating expenses (107,873) (10,491)
180. Other operating income 689,234 718,990
Net profit from operating activities 1,531,083 3,437,533
190. Profit (loss) from equity investments 10,000 –
Profit (loss) from current operations before tax 1,541,083 3,437,533
210. Income taxes on current operations (626,896) (1,593,355)
Profit (loss) from current operations after tax 914,187 1,844,178
Net income (loss) for the year 914,187 1,844,178

.

664
BPV FINANCE (INTERNATIONAL) PlcBALANCE SHEET AT 31 DECEMBER 2008in Euro
Assets 31.12.2008 31.12.2007
Cash at bank and in hand 23,324,701 448,967
Financial assets 78,150,692 621,108,372
– Held to maturity investments 24,994,800 46,128,553
– Held for trading investments 35,603,733 70,639,915
– Available for sale investments 17,552,159 504,339,904
Loans and advances 420,531,023 65,695,793
Trade and other receivables 6,459,725 8,407,732
Deffered tax asset 9,010,654 4,414,552
Property, plant and equipment 16,131 25,354
Derivative asset – 173,873
Total Assets 537,492,926 700,274,643

665
Liabilities 31.12.2008 31.12.2007
Interest bearing loans and borrowings 469,641,228 596,166,280
Debt securities in issue 22,457,139 23,516,618
Trade and other payables 3,672,402 4,966,457
Derivative liability 549,700 –
Total Liabilities 496,320,469 624,649,355
Net Assets 41,172,457 75,625,288
Capital and reserves
Called up share capital 103,291 103,291
Capital contribution 113,619,364 103,291,380
Available for sale reserve (4,347,417) (30,918,698)
Reveue reserve (34,186,350) –
Profit and loss account (34,016,431) 3,149,315
Shareholders’ funds - equity 41,172,457 75,625,288

666
BPV FINANCE (INTERNATIONAL) PLC INCOME STATEMENT FOR THE YEAR ENDED 31 DECEMBER 2008in Euro
Captions 31.12.2008 31.12.2007
Interest receivable and similar income 32,308,763 35,508,494
Interest payable and similar charges (27,067,884) (29,118,818)
Net interest income 5,240,879 6,389,676
Trading (expense)/income (19,347,332) (938,518)
Other income/expense (24,993,203) (1,324,073)
Administrative expenses (1,650,733) (1,639,066)
Foreign exchange (losses)/gains 19,788 (17,835)
Profit on ordinary activities before taxation (40,730,601) 2,470,184
Tax on profit on ordinary activities 3,564,855 (449,213)
Profit for the financial year (37,165,746) 2,020,971

667
.

668
SERVIZI BANCARI S.p.A.BALANCE SHEET AS OF 31 DECEMBER 2008in Euro
Assets 31.12.2008 31.12.2007
B) FIXED ASSETS I. Intangible fixed assets 4) Concessions, licenses, trademarks and similar rights 21,220 13,420 7) Other 417 424
Total 21,637 13,844
II. Tangible fixed assets 2) Plant and machinery 11,444 16,845 4) Other assets 74,169 131,354
Total 85,613 148,199
III. Financial fixed assets 1) Equity investments in: d) other companies 1,352 1,352 2) Receivables: d) due from third parties 2,253 2,253
Total 3,605 3,605
Total fixed assets (B) 110,855 165,648
C) CURRENT ASSETS II. Loans and advances 1) Due from customers 57,738 443,876 4) Due from parent companies 258,320 1,086,442 4- bis) Due from tax authorities 613,093 – 4- ter) Deferred tax assets 296,149 420,945 5) Due from third parties 33,547 68,778
Total 1,258,847 2,020,041
IV. Liquid funds 1) Bank and post office accounts 2,629,239 3,964,522 3) Cash and cash equivalents 428 1,267
Total 2,629,667 3,965,789
Total current assets (C) 3,888,514 5,985,830
D) Accrued income and prepaid expenses, indicating discounts on loans separately 89,643 13,127
Total accrued income and prepaid expenses (D) 89,643 13,127
Total Assets 4,089,012 6,164,605

669
Liabilities and stockholders’ equity 31.12.2008 31.12.2007
A) STOCKHOLDERS’ EQUITY I. Capital stock 100,000 100,000 IV. Legal reserve 25,144 25,144 VII. Other reserves 503,554 503,526 - Euro rounding reserve – - Extraordinary reserve 399,620 399,589 - Merger surplus 103,937 103,937 VIII. Retained earnings (accumulated losses) 17 17 IX. Net income (loss) for the year 324,026 2,039,631
Total stockholders’ equity (A) 952,741 2,668,318
B) PROVISIONS FOR RISKS AND CHARGES 1) Pensions and similar commitments 24,711 24,711 3) Other – 154,859
Total provisions for risks and charges (B) 24,711 179,570
C) PROVISIONS FOR SEVERANCE INDEMNITIES 1,231,882 1,320,739
Total provision for severance indemnities (C) 1,231,882 1,320,739
D) PAYABLES 7) Due to suppliers 146,933 216,670 11) Due to parent companies 136,065 216,634 12) Due to tax authorities – 498,888 13) Due to social security and pension institutions sociale 312,228 291,799 14) Other payables 1,237,943 724,216
Total payables (D) 1,833,169 1,948,207
E) ACCRUED EXPENSES AND DEFERRED INCOME 46,509 47,771
Total accrued expenses and deferred income (E) 46,509 47,771
Total Equity and Liabilities 4,089,012 6,164,605
A) MEMORANDUM ACCOUNTS 31.12.2008 31.12.2007
II. Sureties 100,000 100,000
Total memorandum accounts 100,000 100,000

670
SERVIZI BANCARI S.p.A. INCOME STATEMENT FOR THE YEAR ENDED 31 DECEMBER 2008in Euro
Captions 31.12.2008 31.12.2007
A) Value of production: 1) Revenues from sales and services 7,552,368 10,511,748 5) Other revenues and income 218,410 265,964
Total value of production (A) 7,770,778 10,777,712
B) Production costs 6) Raw, ancillary and consumable materials (183,672) (208,957) 7) Services received (1,239,242) (1,223,158) 8) Leases and rentals (274,199) (316,543) 9) Personnel: a) wages and salaries (3,856,654) (3,449,535) b) social security contributions (979,806) (920,234) c) severance indemnities (48,126) (180,943) d) pensions and similar commitments (301,983) (160,613) e) other costs (2,830) (5,370) 10) Amortization, depreciation and writedowns a) amortization of intangible fixed assets (9,811) (239,999) b) amortization of tangible fixed assets (66,446) (88,834) c) other amounts written off fixed assets – (47) d) writedown of current receivables – (7,690) 13) Other provisions – (83,459) 14) Other operating expenses (257,560) (297,080)
Total production costs (B) (7,220,329) (7,182,462)
DIFFERENCE BETWEEN VALUE AND COST OF PRODUCTION (A-B) 550,449 3,595,250
C) Financial income and charges 16) Other financial income d) income other than the above - from parent companies 174,007 107,291 17) Interest and other financial charges d) charges other than the above - from parent companies – (4,105) - other (39) (283)
Total financial income and charges (C) 173,968 102,903
E) Extraordinary income and charges 20) Income - other 167,757 769 21) Charges - tax relating to prior years (4,550) (27,621) - other – (48,421)
Total extraordinary items (E) 163,207 (75,273)
Results before taxes (A - B ± C ± D ± E) 887,624 3,622,880 22) Income taxes - Current taxes (438,802) (1,515,104) - Deferred tax assets (124,796) (68,145) 23) Net income (loss) for the year 324,026 2,039,631

.

672
PRESTINUOVA S.p.A.BALANCE SHEET AS OF 31 DECEMBER 2008in Euro
Assets 31.12.2008 31.12.2007
60. Loans and advances 370,217,223 326,694,918
100. Property, plant and equipment 196,999 179,147
110. Intangible assets 4,119,159 4,176,561
120. Tax assets 1,128,242 514,181 a) current 686,726 349,098 b) deferred 441,516 165,083
140. Other assets 928,331 872,290
Total Assets 376,589,954 332,437,097

673
Equity and liabilities 31.12.2008 31.12.2007
10. Payables 320,523,713 280,210,289
70. Tax liabilities: a) current 30,310 – b) deferred 30,310 –
90. Other liabilities 17,677,388 13,946,564
100. Provision for severance indemnities 185,780 141,650
110. Provisions for risks and charges: 100,000 343,603 b) other provisions 100,000 343,603
120. Capital stock 25,263,160 25,263,160
150. Additional paid-in capital 9,631,580 9,631,580
160. Reserves 373,935 142,413
180. Net income (loss) for the year 2,804,088 2,757,838
Total Equity and Liabilities 376,589,954 332,437,097

674
PRESTINUOVA S.p.A.INCOME STATEMENT FOR THE YEAR ENDED 31 DECEMBER 2008in Euro
Captions 31.12.2008 31.12.2007
10. Interest income and similar revenues 25,333,333 21,242,919
20. Interest income and similar charges (14,990,397) (12,357,519)
Net interest income 10,342,936 8,885,400
30. Fee and commission income 1,073,214 1,134,525
40. Fee and commission expense (64,491) (9,710)
Net fee and commission income 1,008,723 1,124,815
Net interest and other banking income 11,351,659 10,010,215
110. Net impairment adjustments to: (1,203,940) (200,777) a) loans and advances (1,203,940) (200,777)
120. Administrative costs: (5,816,744) (4,669,535) a) payroll (3,893,556) (3,066,196) b) other administrative costs (1,923,188) (1,603,339)
130. Adjustments to property, plant and equipment (54,400) (40,339)
140. Adjustments to intangible assets (59,202) (300,688)
160. Net provisions for risks and charges – (27,987)
170. Other operating expenses (23,609) (102,015)
180. Other operating income 448,061 276,501
Net profit from operating activities 4,641,825 4,945,375
200. Gains (losses) on disposals of investments – 104
PROFIT (LOSS) FROM CURRENT OPERATIONS BEFORE TAX 4,641,825 4,945,479
210. Income taxes on current operations (1,837,737) (2,187,641)
PROFIT (LOSS) FROM CURRENT OPERATIONS AFTER TAX 2,804,088 2,757,838
Net income (loss) for the year 2,804,088 2,757,838

.

676
MONFORTE 19 S.R.L.BALANCE SHEET AS OF 31 DECEMBER 2008in Euro
Assets 31.12.2008 31.12.2007
B) Fixed assets, indicating separately: I. Intangible fixed assets 36,625 6,625 – (Amortization) (3,397) (2,047)
Total 33,228 4,578 II. Tangible fixed assets 113,248,922 27,837,842 – (Depreciation) (1,394,509) (709,347)
Total 111,854,413 27,128,495
Total fixed assets (B) 111,887,641 27,133,073
C) Current assets II. Receivables, indicating amounts due within months separately for each receivables account: – within 12 months 849,816 4,581,035 – beyond 12 months 2,297 –
Total 852,113 4,581,035
IV. Liquid funds: 5,036,756 3,056,571
Total 5,036,756 3,056,571
Total current assets (C) 5,888,869 7,637,606
D) Accrued income and prepaid expenses, indicating discounts on loans separately 14,253 7,658
Total accrued income and prepaid expenses (D) 14,253 7,658
Total Assets 117,790,763 34,778,337

677
Liabilities and stockholders’ equity 31.12.2008 31.12.2007
A) Stockholders’ equity: I. Capital stock 10,000 10,000 VII. Other reserves, indicated separately – Shareholder payment for future capital increase 6,100,200 6,100,200 VIII. Retained earnings (accumulated losses) (1,111,210) (28) IX. Net income (loss) for the year (1,684,680) (1,111,182)
Total stockholders’ equity (A) 3,314,310 4,998,990
D) Payables, indicating amounts due beyond months separately for each payables account: – within 12 months 37,324 350,442 – beyond 12 months 114,422,828 29,422,830
Total payables (D) 114,460,152 29,773,272
E) Accrued expenses and deferred income, indicating premiums on loans separately 16,301 6,075
Total accrued expenses and deferred income (E) 16,301 6,075
Total Equity and Liabilities 117,790,763 34,778,337
MEMORANDUM ACCOUNTS 31.12.2008 31.12.2007
III. Commitments
2) Surety received from third parties 4,608,100 3,556,122
Total 4,608,100 3,556,122
Total memorandum accounts 4,608,100 3,556,122

678
MONFORTE 19 S.R.L.INCOME STATEMENT FOR THE YEAR ENDED 31 DECEMBER 2008in Euro
Captions 31.12.2008 31.12.2007
A) Value of production: 1) Revenues from sales and services 942,680 1,338,973 5) Other income and revenues, indicating contributions for operating expenses separately 70 4,168
Total value of production (A) 942,750 1,343,141
B) Production costs: 6) Raw, ancillary and consumable materials (96) (39) 7) Services received (115,892) (42,574) 8) Leases and rentals (100,000) (88,973) 10) Amortization, depreciation and writedowns a) amortization of intangible fixed assets (1,350) (1,333) b) amortization of tangible fixed assets (685,161) (668,186) 14) Other operating expenses (384,599) (37,545)
Total production costs (B) (1,287,098) (838,650)
DIFFERENCE BETWEEN VALUE AND COST OF PRODUCTION (A-B) (344,348) 504,491
C) Financial income and charges: 16) Other financial income d) income other than the above, indicating that from subsidiary, associated and parent companies separately 120,419 60,603 17) Interest and other financial charges, indicating those from subisdiary, associated and parent companies separately (1,583,241) (1,623,239)
Total financial income and charges (C) (1,462,822) (1,562,636)
E) Extraordinary income and charges 20) Income, indicating separately gains on disposals not classifiable in line 5) 7,932 – 21) Charges, indicating separately losses on disposals not classifiable in line 14), and taxes relating to prior years: – (10,247) - losses on disposals – –
Total extraordinary items (E) 7,932 (10,247)
Results before taxes (A - B ± C ± D ± E) (1,799,238) (1,068,392)
22) Income taxes for the year (current and deferred) 114,558 (42,790)
23) Net income (loss) for the year (1,684,680) (1,111,182)

679
ATTESTATION OF THE CONSOLIDATED FINANCIAL STATEMENTS PURSUANT TO ART. 81-TER OF CONSOB REGULATION 11971 DATED 14 MAY 1999 AS AMENDED AND UPDATED
1. The undersigned
– Divo Gronchi, as Managing Director, and – Franco Tonato, as Financial Reporting Manager of Banca Popolare di Vicenza S.c.p.A. attest, also taking account of the provisions of
paragraphs 3 and 4, art. 154-bis of Decree 58 dated 24 February 1998:
• theadequacyinrelationtotheenterprise’scharacteristicsand• theeffectiveapplicationoftheadministrativeandaccountingprocessesforpreparingthe
consolidated financial statements, during 2008.
2. No significant matters have emerged in this regard . Banca Popolare di Vicenza has been obliged - under art. 154-bis of Decree 58/98 - to create the position of “Financial Reporting Officer” because, as part of its European Medium Term Notes programme, it has issued bonds listed on the Luxembourg stock exchange, having chosen Italy as its member state of origin by resolution of the Board of Directors on 6 May 2008. In view of the aforementioned legal requirements, the Board of Directors of Banca Popolare di Vicenza:
• amendedtheBank’sarticlesofassociation(art.39)on3June2008toestablishtheposition of “Financial Reporting Manager”, as well as the required experience that such person must have and the methods of their appointment;
• appointed Franco Tonato, theDeputyGeneralManager in chargeof theFinancialReporting and Equity Investments Department, as Financial Reporting Manager on 17 June2008,afterverifyinghisintegrityandexperienceandhavingobtainedtheconsentof the Board of Statutory Auditors;
• delegateditsfunctionson28August2008regardingtheattestationunderart.154-bisofDecree 58/98 to Divo Gronchi, the Managing Director;
• approvedon23September2008theBPViGroup’sGovernanceandControlModelforaccounting and administrative processes (Organizational and methodological model of the Financial Reporting Manager).
ATTESTATION OF THE FINANCIAL REPORTING MANAGER

680
3. They also attest that:
3.1 the consolidated financial statements:
a. have been prepared in accordance with applicable international accounting standards recognized by the European Union under Regulation (EC) 1606/2002 of the European ParliamentandCouncildated19July2002;
b. correspond to the underlying accounting records and books of account;
c. have been prepared in accordance with the International Financial Reporting Standards adopted by the European Union and with the measures implementing art. 9 of Decree 38/2005 and are able to provide a true and fair view of the issuer’s balance sheet, results of operations and financial position and of the group of companies included in the consolidation;
3.2 the report on operations contains a reliable analysis of performance and the results of operations, as well as of the situation of the issuer and the group of companies included in the consolidation, together with a description of the principal risks and uncertainties to which they are exposed.
Vicenza, 7th April 2008
Managing Director Financial Reporting Manager
Divo Gronchi Franco Tonato

INDEPENDENT AUDITORS’ REPORT


.

BRANCH NETWORK BANCA POPOlARE di ViCENzA

686
REGiSTEREd OFFiCE ANdGENERAl MANAGEMENTi-36100 VicenzaVia Btg. Framarin, 18Tel. (0444) 339111
CENTRAl SERViCES36100 VicenzaVia Btg. Framarin, 22Tel. (0444) 339111Telefax (0444) 329364Teltex 480178 BPVSCESwift BPViiT 22
• Stock Exchange Tel. (02) 62481800 Telefax (02) 29062724
• Exchange office Tel. (02) 62481000 Telefax (02) 29062724
• Gold Tel. (0444) 339133 Telefax (0444) 545982
• Treasury Tel. (02) 62481260 Telefax (02) 29062724
• international Tel. (0444) 339577/339564 Telefax dall’italia 199 1511247455 dall’Estero 0039 0444 537455
BRANCHESProvince of Vicenza• 36100 Vicenza Contrà Porti, 12 Tel. (0444) 906411 Telefax (0444) 320059• 36100 Vicenza - Filiale n. 1 Corso Ss.Felice e Fortunato, 145 Tel. (0444) 327460 Telefax (0444) 321118• 36100 Vicenza - Filiale n. 2 Corso Padova, 42 Tel. (0444) 505466 Telefax (0444) 512273• 36100 Vicenza - Filiale n. 3 Viale delle Fornaci, 2 Tel. (0444) 961047 Telefax (0444) 962075• 36100 Vicenza - Filiale n. 4 Via S. Agostino, 9/11 Tel. (0444) 963223 Telefax (0444) 566999• 36100 Vicenza - Filiale n. 5 Viale Trieste, 335 Tel. (0444) 512655 Telefax (0444) 512403• 36100 Vicenza - Filiale n. 6 Via Btg. Framarin, 20 Tel. (0444) 339197 Telefax (0444) 339563• 36100 Vicenza - Filiale n. 7 Via Vecchia Ferriera, 72 Tel. (0444) 961509 Telefax (0444) 961450
• 36100 Vicenza - Filiale n. 8 Viale dal Verme, 100 Tel. (0444) 927222 Telefax (0444) 927255• 36100 Vicenza - Filiale n. 9 Via Giuriato, 67 Tel. (0444) 301700 Telefax (0444) 301698• 36100 Vicenza - Filiale n. 10 Via F.lli Rosselli, 58 Tel. (0444) 240334 Telefax (0444) 240318• 36100 Vicenza - Filiale n. 11 Via Ca’ Balbi, 309 Tel. (0444) 912733 Telefax (0444) 912742• 36100 Vicenza - Filiale n. 12 Via dell’Oreficeria, 16/A Tel. (0444) 565656 Telefax (0444) 963988• 36100 Vicenza - Filiale n. 13 Via E. Fermi, 130 Tel. (0444) 964694 Telefax (0444) 964697• 36100 Vicenza - Filiale n. 14 Via Marosticana, 345 - loc. Polegge Tel. (0444) 945729 Telefax (0444) 595143• 36100 Vicenza - Filiale n. 15 S.S. Pasubio, 335 - loc. Maddalene Tel. (0444) 980610 Telefax (0444) 980695• 36100 Vicenza - Filiale n. 16 Piazzola Gualdi, 10 Tel. (0444) 320447 Telefax (0444) 326219• 36100 Vicenza - Filiale n. 17 Via zamenhof, 94 Tel. (0444) 914462 Telefax (0444) 914437• 36100 Vicenza - Filiale n. 18 Corso Palladio, 13 Tel. (0444) 325044 Telefax (0444) 321597• 36100 Vicenza - Filiale n. 19 Viale della Pace, 234 Tel. (0444) 304878 Telefax (0444) 304842• 36020 Albettone Piazza Umberto i, 15 Tel. (0444) 790355 Telefax (0444) 790555• 36077 Altavilla Vicentina - Filiale n. 1 Via Vicenza, 232 Tel. (0444) 348833 Telefax (0444) 348848• 36041 Alte di Montecchio M. Via Trieste, 7 Tel. (0444) 698533 Telefax (0444) 698090• 36011 Arsiero Piazza Francesco Rossi, 37 Tel. (0445) 740308 Telefax (0445) 742032• 36071 Arzignano Via Trento, 59 Tel. (0444) 673000 Telefax (0444) 674240• 36071 Arzignano - Filiale n. 1 Viale del lavoro, 39/A Tel. (0444) 477711 Telefax (0444) 675549• 36012 Asiago Piazza G. Carli, 61 Tel. (0424) 64546
Telefax (0424) 462641• 36061 Bassano del Grappa Via Roma, 85 Tel. (0424) 527111 Telefax (0424) 524966• 36061 Bassano - Filiale n. 1 Viale Pecori Giraldi, 24 Tel. (0424) 502405 Telefax (0424) 503998• 36061 Bassano - Filiale n. 2 V. Cellini, 2 - loc. Ca’ Baroncello Tel. (0424) 510280 Telefax (0424) 512263• 36050 Bolzano Vicentino Via zuccola, 3 Tel. (0444) 350034 Telefax (0444) 350775• 36042 Breganze Piazza Mazzini, 27 Tel. (0445) 873133 Telefax (0445) 300373• 36040 Brendola Via Roccolo, 1 Tel. (0444) 400831 Telefax (0444) 601973• 36030 Caldogno Via Risorgimento, 2 Tel. (0444) 585799 Telefax (0444) 905133• 36043 Camisano Vicentino Piazza Umberto i, 11 Tel. (0444) 610170 Telefax (0444) 410489• 36010 Canove di Roana Via Milano Tel. (0424) 692090 Telefax (0424) 692838• 36010 Carrè Piazza 4 Novembre Tel. (0445) 892777 Telefax (0445) 892594• 36050 Cartigliano Piazza Concordia, 14 Tel. (0424) 828541 Telefax (0424) 827354• 36065 Casoni di Mussolente Via Cuccarollo, 1/A Tel. (0424) 573088 Telefax (0424) 573107• 36022 Cassola Via Valsugana, 70 Tel. (0424) 566738 Telefax (0424) 566767• 36030 Castelnovo di isola Vic.na Via S. Antonio, 6 Tel. (0444) 977388 Telefax (0444) 977382• 36010 Cavazzale Via Chiesa, 3 Tel. (0444) 595144 Telefax (0444) 595699• 36072 Chiampo Piazza Stazione, 7 Tel. (0444) 420966 Telefax (0444) 420970• 36010 Chiuppano Via Amabile Peguri, 1 Tel. (0445) 891955 Telefax (0445) 390144• 36073 Cornedo Vic. no Via Monte Verlaldo,16 - loc. Cereda Tel. (0445) 446389 Telefax (0445) 953466• 36051 Creazzo Viale italia, 200
Tel. (0444) 521400 Telefax (0444) 340291• 36056 Cusinati di Tezze sul Brenta S.S. 47- Via Nazionale Tel. (0424) 560011 Telefax (0424) 561452• 36031 dueville Piazza Monza, 39 Tel. (0444) 360400 Telefax (0444) 360438• 36060 Fellette di Romano d’Ezzelino Via Bassanese, 32 Tel. (0424) 512559 Telefax (0424) 512554• 36032 Gallio Piazza Gen. Turba, 3 Tel. (0424) 445171 Telefax (0424) 445415• 36053 Gambellara Piazza Marconi, 5 Tel. (0444) 444622 Telefax (0444) 444125• 36040 Grisignano di zocco Via Serenissima, 3 Tel. (0444) 614558 Telefax (0444) 414358• 36023 longare Via Marconi, 38 Tel. (0444) 953580 Telefax (0444) 953585• 36045 lonigo Via Q. Rossi, 5 Tel. (0444) 830542 Telefax (0444) 831259• 36046 lusiana Viale Europa, 12/A Tel. (0424) 406014 Telefax (0424) 406438• 36034 Malo Via Raffaello, 2 Tel. (0445) 602021 Telefax (0445) 580410• 36035 Marano Vicentino Piazza Silva, 30 Tel. (0445) 621013 Telefax (0445) 560038• 36063 Marostica Piazza Castello, 44 Tel. (0424) 73641 Telefax (0424) 72103• 36040 Meledo di Sarego Via d. Chiesa Tel. (0444) 820355 Telefax (0444) 820430• 36060 Molvena Via Ponticello, 30 Tel. (0424) 411996 Telefax (0424) 411091• 36054 Montebello Vicentino Via Marconi, 15 Tel. (0444) 649033 Telefax (0444) 649472• 36075 Montecchio Maggiore Via S. Valentino Tel. (0444) 696668 Telefax (0444) 491221• 36030 Montecchio Precalcino Via Summano, 12/B Tel. (0445) 864433 Telefax (0445) 334044• 36047 Montegalda Via d. Cattaneo, 30 Tel. (0444) 737100 Telefax (0444) 737213

687
• 36024 Nanto Via Riviera Berica, 73 Tel. (0444) 639955 Telefax (0444) 638437• 36025 Noventa Vicentina Corso G. Matteotti, 84 Tel. (0444) 860177 Telefax (0444) 760030• 36040 Orgiano Via libertà, 1 Tel. (0444) 874100 Telefax (0444) 874617• 36013 Piovene Rocchette Via libertà, 2 Tel. (0445) 650444 Telefax (0445) 550105• 36026 Pojana Maggiore Via Matteotti, 8/A Tel. (0444) 794079 Telefax (0444) 794084• 36021 Ponte di Barbarano Via Riviera Berica, 25 Tel. (0444) 795305 Telefax (0444) 795298• 36050 Pozzoleone Via Roma, 2 Tel. (0444) 462212 Telefax (0444) 462198• 36050 Quinto Vicentino Via Martiri della libertà, 25 Tel. (0444) 357674 Telefax (0444) 357668• 36027 Rosà Via Capitano Alessio, 69 Tel. (0424) 581890 Telefax (0424) 581905• 36028 Rossano Veneto Viale Monte Grappa, 15 Tel. 0424 219682 Telefax 0424 541403• 36070 San Pietro Mussolino Via Risorgimento, 59/B Tel. (0444) 487487 Telefax (0444) 487288• 36030 San Vito di leguzzano Via Roma, 1 Tel. (0445) 519655 Telefax (0445) 519699• 36066 Sandrigo Piazza Vittorio Emanuele, 11 Tel. (0444) 658477 Telefax (0444) 750048• 36014 Santorso Piazzetta Villa Vicentina, 3 Tel. (0445) 640820 Telefax (0445) 640774• 36015 Schio Piazza Garibaldi, 2 Tel. (0445) 529790 Telefax (0445) 531093• 36015 Schio - Filiale n. 1 Via Veneto, 2/B Tel. (0445) 575492 Telefax (0445) 575508• 36015 Schio - Filiale n. 2 Via Riva di Magrè Tel. (0445) 530670 Telefax (0445) 530680• 36040 Sossano Via Roma, 20 Tel. (0444) 888406 Telefax (0444) 885911• 36050 Sovizzo Viale degli Alpini, 11 Tel. (0444) 536384
Telefax (0444) 536619• 36067 Termine di Cassola Viale Venezia, 33 Tel. (0424) 32100 Telefax (0424) 511575• 36016 Thiene Via Trento, 2 Tel. (0445) 854211 Telefax (0445) 363999• 36016 Thiene - Filiale n. 1 Viale del lavoro, 2 Tel. (0445) 369700 Telefax (0445) 368825• 36036 Torrebelvicino Piazza A. Moro Tel. (0445) 570200 Telefax (0445) 570057• 36040 Torri di Quartesolo Via Roma, 33 Tel. (0444) 581933 Telefax (0444) 380293• 36070 Trissino Via dell’industria, 91 Tel. (0445) 491044 Telefax (0445) 491180• 36078 Valdagno Piazza dante, 8 Tel. (0445) 409200 Telefax (0445) 408933• 36010 Velo d’Astico Via Roma, 16 Tel. (0445) 740900 Telefax (0445) 740141• 36020 Villaganzerla Via Piazza, 118 Tel. (0444) 639121 Telefax (0444) 638460• 36030 Villaverla Via Milano, 1 Tel. (0445) 855622 Telefax (0445) 856388• 36010 zanè Via Manzoni, 26 Tel.(0445) 380224 Telefax (0445) 381118• 36050 zermeghedo Via Michelangelo, 3 Tel. (0444) 484099 Telefax (0444) 484222• 36030 zugliano Via Roma, 68 Tel. (0445) 330200 Telefax (0445) 330093Province of Asti• 14100 Asti Piazza Medici, 18 Tel. (0141) 598798 Telefax (0141) 598808Province of Belluno• 32021 Agordo Via XXVii Aprile 1945, 44 Tel. (0437) 640606 Telefax (0437) 640631• 32030 Arten di Fonzaso Piazza San Gottardo, 23 Tel. (0439) 568125 Telefax (0439) 568015• 32041 Auronzo di Cadore Via Roma, 63/A Tel. (0435) 400805 Telefax (0435) 400806• 32100 Belluno Via Vittorio Veneto, 187 Tel. (0437) 9351 Telefax (0437) 931800
• 32100 Belluno - Filiale n. 1 Piazza Martiri, 27/C Tel. (0437) 950807 Telefax (0437) 950726• 32016 Farra d’Alpago Via Matteotti, 75/B Tel. (0437) 46096 Telefax (0437) 454751• 32032 Feltre Viale Monte Grappa, 18/B Tel. (0439) 840813 Telefax (0439) 83035• 32013 longarone Via Marconi, 1 Tel. (0437) 573425 Telefax (0437) 578780• 32026 Mel Via Tempietto, 15/B Tel. (0437) 540240 Telefax (0437) 540257• 32010 Pieve d’Alpago - loc. Paludi Via dell’industria, 6/A Tel. (0437) 989283 Telefax (0437) 989317• 32014 Ponte nelle Alpi Viale dolomiti, 23 Tel. (0437) 990562 Telefax (0437) 990522• 32035 Santa Giustina Via Roma, 15/d Tel. (0437) 859355 Telefax (0437) 859362• 32036 Sedico Piazza della Vittoria, 19/B Tel. (0437) 853109 Telefax (0437) 82548• 32040 Tai di Cadore Piazza Venezia, 14 Tel. (0435) 501538 Telefax (0435) 501540• 32028 Trichiana Via Roma, 35 Tel. (0437) 555571 Telefax (0437) 555564• 32040 Vallesella di Cadore Via Vittorio Veneto, 2 Tel. (0435) 728150 Telefax (0435) 728292Province of Bergamo• 24061 Albano Sant’Alessandro Via Aldo Moro, 8/10 Tel. (035) 583220 Telefax (035) 583231• 24052 Azzano San Paolo Via Trieste, 16 Tel. (035) 534141 Telefax (035) 534079• 24123 Bergamo Viale Giulio Cesare, 69 Tel. (035) 363220 Telefax (035) 345216• 24020 Casnigo Piazza San Giovanni Battista, 30 Tel. (035) 724370 Telefax (035) 724371
• 24020 Cene Via Vittorio Veneto, 1 Tel. (035) 716211 Telefax (035) 716207• 24060 Costa di Mezzate Via Roma, 10 Tel. (035) 683563 Telefax (035) 680772• 24035 Curno Via Terzi di Sant’Agata, 2/4 Tel. (035) 4158011 Telefax (035) 4158034• 24044 dalmine Viale Betelli, 32/34 Tel. (035) 4157211 Telefax (035) 4157298• 24064 Grumello del Monte Via Roma, 95 Tel. (035) 4495411 Telefax (035) 4495440• 24040 lallio Via Mascagni, 2/A Tel. (035) 201191 Telefax (035) 201250• 24044 Mariano al Brembo Piazza Vittorio Emanuele ii, 8 Tel. (035) 502882 Telefax (035) 502664• 24030 Mozzo Piazza Trieste Tel. (035) 4376849 Telefax (035) 4376447• 24027 Nembro Via Roma, 13 Tel. (035) 470241 Telefax (035) 470791• 24022 Nese Via Europa, 67 Tel. (035) 514471 Telefax (035) 513150• 24050 Orio al Serio Via locatelli, 10 Tel. (035) 318780 Telefax (035) 320227• 24010 Petosino Via Martiri della libertà, 51 Tel. (035) 577211 Telefax (035) 577239• 24058 Romano di lombardia Via duca d’Aosta, 44 Tel. (0363) 901832 Telefax (0363) 902867• 24068 Seriate Piazza Giovanni XXiii, 6/A Tel. (035) 301401 Telefax (035) 300396• 24040 Stezzano Piazza libertà, 12 Tel. (035) 4540371 Telefax (035) 4540372• 24047 Treviglio - Filiale n. 1 Piazza Mentana, 1/A Tel. (0363) 312811 Telefax (0363) 312898

688
• 24047 Treviglio - Filiale n. 2 Via de Gasperi, 3 Tel. (0363) 303967 Telefax (0363) 304729• 24040 Verdellino Piazza Affari, 32 Tel. (035) 4820355 Telefax (035) 4820517• 24018 Villa d’Almè Via Roma, 31 Tel. (035) 639860 Telefax (035) 639896Province of Bologna• 40122 Bologna Viale Vicini, 16/18 Tel. (051) 6494777 Telefax (051) 6494761• 40033 Casalecchio di Reno Via Ronzani, 7/40 Tel. (051) 6132829 Telefax (051) 6130484• 40068 San lazzaro di Savena Via Emilia Est, 214 Tel. (051) 465216 Telefax (051) 467416Province of Brescia• 25043 Breno Piazza Vittoria, 3 Tel. (0364) 320822 Telefax (0364) 22219• 25124 Brescia Via Malta, 16 Tel. (030) 2428866 Telefax (030) 2425658• 25125 Brescia - Filiale n. 1 Via Orzinuovi, 46/A Tel. (030) 3462711 Telefax (030) 347305• 25127 Brescia - Filiale n. 2 Via Farfengo, 65 Tel. (030) 2411500 Telefax (030) 2411077• 25125 Brescia - Filiale n. 3 Via Orzinuovi, 82 c/o Mercato Ortofrutticolo Tel. (030) 3541180 Telefax (030) 349862• 25128 Brescia - Filiale n. 4 Via Crocifissa di Rosa, 1 Tel. (030) 390239 Telefax (030) 390774• 25136 Brescia - Filiale n. 5 Via Triumplina, 125 Tel. (030) 2016411 Telefax (030) 2016444• 25128 Brescia - Filiale n. 6 Via Trento, 3 Tel. (030) 3707711 Telefax (030) 3707740• 25128 Brescia - Filiale n. 7 Via San Bartolomeo, 17 Tel. (030) 304122 Telefax (030) 301072• 25124 Brescia - Filiale n. 8 Via Malta, 43 - Fraz. Folzano Tel. (030) 2160720 Telefax (030) 266553• 25122 Brescia - Filiale n. 9 Corso Giuseppe Garibaldi, 14/E Tel. (030) 3754555 Telefax (030) 3752499• 25124 Brescia - Filiale n. 10 Via San zeno, 121 Tel. (030) 3533910 Telefax (030) 3533786
• 25126 Brescia - Filiale n. 11 Via Volturno, 62 Tel. (030) 293176 Telefax (030) 40825• 25031 Capriolo Via Vittorio Emanuele ii, 5 Tel. (030) 7461131 Telefax (030) 7461150• 25030 Castel Mella Via Quinzano, 80/A Tel. (030) 2685911 Telefax (030) 2685935• 25020 Flero Piazza iV Novembre, 105 Tel. (030) 2560233 Telefax (030) 2560235• 25063 Gardone Val Trompia Fraz. inzino Via Matteotti, 71 - inzino Tel. (030) 8911906 Telefax (030) 8911909• 25085 Gavardo Via Quarena, 145 Tel. (0365) 372007 Telefax (0365) 374438• 25016 Ghedi Via XX Settembre, 112 Tel. (030) 9050702 Telefax (030) 9050755• 25064 Gussago Viale italia, 1 Tel. (030) 2523911 Telefax (030) 2524367• 25065 lumezzane Via Monsuello, 29/d Tel. (030) 8921895 Telefax (030) 8922787• 25065 lumezzane - Filiale n. 1 Via Virgilio Montini, 19 Tel. (030) 8925988 Telefax (030) 8925087• 25040 Malonno Via Torre, 10 Tel. (0364) 635579 Telefax (0364) 635028• 25025 Manerbio - Filiale n. 1 Via Roma, 18/20 Tel. (030) 9389711 Telefax (030) 9389712• 25080 Mazzano Via Alcide de Gasperi, 6 Tel. (030) 2120787 Telefax (030) 2120805• 25018 Montichiari Via Trieste, 68 Tel. (030) 9653411 Telefax (030) 9653440• 25034 Orzinuovi Via Giordano Bruno Tel. (030) 944332 Telefax (030) 9941070• 25060 Polaveno Via Tonetti, 27 Tel. (030) 84814 Telefax (030) 8940115• 25011 Ponte San Marco Piazza della Preistoria, 11 Tel. (030) 9980988 Telefax (030) 9980979
• 25037 Pontoglio Piazza XXVi Aprile, 21 Tel. (030) 7471231 Telefax (030) 7376306• 25024 Porzano di leno Via San Martino, 24 Tel. (030) 9048118 Telefax (030) 906499• 25070 Preseglie Via Roma, 58 Tel. (0365) 824313 Telefax (0365) 824030• 25086 Rezzato Via Garibaldi, 1/3 Tel. (030) 2498511 Telefax (030) 2498540• 25030 Roncadelle Via Enrico Mattei, 37/39 Tel. (030) 2583253 Telefax (030) 2583166• 25038 Rovato Corso Bonomelli, 40/42 Tel. (030) 7720311 Telefax (030) 7720398• 25087 Salò Via Montessori, 1 Tel. (0365) 521846 Telefax (0365) 521847• 25010 San Martino della Battaglia Piazza della Concordia, 11 Tel. (030) 9108269 Telefax (030) 9910304• 25068 Sarezzo Via Antonini, 26 Tel. (030) 8935411 Telefax (030) 8935498• 25080 Serle Via Galileo Galilei, 1 Tel. (030) 6896783 Telefax (030) 6910993Province of Como• 22100 Como Piazza Cavour, 24 Tel. (031) 303544 Telefax (031) 309217Province of Ferrara• 44100 Ferrara Via Silvano Balboni, 7 Tel. (0532) 470276 Telefax (0532) 766269Province of Genoa• 16043 Chiavari Corso dante, 39 Tel. (0185) 323400 Telefax (0185) 323074• 16121 Genova Via delle Casaccie, 78/98 Tel. (010) 5762811 Telefax (010) 585908Province of Gorizia• 34071 Cormons Via Matteotti, 44 Tel. (0481) 639270 Telefax (0481) 639350• 34170 Gorizia Corso italia, 45 Tel. (0481) 538902 Telefax (0481) 538905• 34072 Gradisca d’isonzo Piazzale dell’Unità, 20 Tel. (0481) 969605 Telefax (0481) 92240
• 34073 Grado Via Martiri della libertà, 29 Tel. (0431) 877044 Telefax (0431) 877037• 34074 Monfalcone Via duca d’Aosta, 97 Tel. (0481) 413654 Telefax (0481) 414106• 34077 Ronchi dei legionari Via Roma, 94 Tel. (0481) 776451 Telefax (0481) 474600Province of imperia• 18100 imperia Via della Repubblica, 7 Tel. (0183) 299011 Telefax (0183) 299005• 18038 Sanremo Corso Mombello, 33/35 Tel. (0184) 503121 Telefax (0184) 506424Province of Mantua• 46043 Castiglione delle Stiviere Via Cavour Tel. (0376) 670311 Telefax (0376) 631981• 46100 Mantova Corso Vittorio Emanuele, 31 Tel. (0376) 329605 Telefax (0376) 328912• 46019 Viadana Piazza Benedetto Cellini, 9 Tel. (0375) 782266 Telefax (0375) 781077Province of Milan• 20094 Corsico Via Vincenzo Monti, 46 Tel. (02) 4402933 Telefax (02) 45119850• 20123 Milano Via Torino - Ang. Via S. Vito Tel. (02) 864941 Telefax (02) 86450672• 20136 Milano - Filiale n. 1 Via Col di lana, 6 Tel. (02) 8360048 Telefax (02) 8378762• 20154 Milano - Filiale n. 2 Corso Como, 15 Tel. (02) 29010129 Telefax (02) 29010321• 20148 Milano - Filiale n. 3 Via Civitali, 23 Tel. (02) 4039350 Telefax (02) 4075146• 20155 Milano - Filiale n. 4 Via Tolentino, 1 Tel. (02) 316064 Telefax (02) 315709• 20144 Milano - Filiale n. 5 Via San Michele del Carso, 13 Tel. (02) 4694299 Telefax (02) 4694499• 20138 Milano - Filiale n. 6 Viale Ungheria, 20 Tel. (02) 58011002 Telefax (02) 58018062• 20158 Milano - Filiale n. 7 Piazza Schiavone Ang. V.R.M. de Capitani, 14 Tel. (02) 39312917 Telefax (02) 39322534• 20124 Milano - Filiale n. 8 Viale Tunisia, 12 - Ang. Via lecco Tel. (02) 29401695 Telefax (02) 20240606

689
• 20099 Sesto San Giovanni Viale Fratelli Casiraghi, 79 Tel. (02) 24839279 Telefax (02) 24412158• 20059 Vimercate Via luigi Cadorna, 2 Tel. (039) 6260568 Telefax (039) 6084230Province of Modena• 41100 Modena Via Pietro Giardini, 187 Tel. (059) 239307 Telefax (059) 237977• 41049 Sassuolo Via Radici in Piano, 61/63 Tel. (0536) 580399 Telefax (0536) 815494 Province of Padua• 35031 Abano Terme Via Martiri d’Ungheria, 14 Tel. (049) 8602928 Telefax (049) 8602691• 35020 Albignasego Via Roma, 117 Tel. (049) 8626728 Telefax (049) 8626732• 35010 Busa di Vigonza Via Regia, 37 Tel. (049) 8935025 Telefax (049) 8935057• 35010 Cadoneghe Strada del Santo, 17 Tel. (049) 8871951 Telefax (049) 8872654• 35012 Camposampiero Via Rialto, 1 Tel. (049) 9303022 Telefax (049) 9303218• 35010 Carmignano di Brenta Via Roma, 14 Tel. (049) 9430792 Telefax (049) 9430262• 35013 Cittadella Borgo Padova, 6 Tel. (049) 5979343 Telefax (049) 9403578• 35026 Conselve Viale Venezia, 1 Tel. (049) 5384039 Telefax (049) 9501342• 35042 Este Via G.Matteotti, 23 Tel. (0429) 604317 Telefax (0429) 601482• 35015 Galliera Veneta Via Roma, 164 Tel. (049) 5969133 Telefax (049) 5969460• 35010 limena Via del Santo, 4 Tel. (049) 8842956 Telefax (049) 8842163• 35010 loreggia Piazza Papa luciani, 8 Tel. (049) 5793055 Telefax (049) 5794442• 35015 Mottinello di Galliera V. Via Mottinello Nuovo, 31 Tel. (049) 9440066 Telefax (049) 9440301• 35027 Noventa Padovana Via Roma, 1 Tel. (049) 8935936 Telefax (049) 8935940
• 35010 Onara di Tombolo Via Sen. G. Cittadella, 5/A Tel. (049) 5993788 Telefax (049) 5993761• 35121 Padova Via Trieste, 45 Tel. (049) 660222 Telefax (049) 660952• 35139 Padova - Filiale n. 1 Corso Milano, 22 Tel. (049) 656132 Telefax (049) 8756129• 35127 Padova - Filiale n. 2 Corso Stati Uniti, 23 Tel. (049) 6988333 Telefax (049) 8704758• 35133 Padova - Filiale n.3 Via Tiziano Aspetti, 246 Tel. (049) 600849 Telefax (049) 8644462• 35126 Padova - Filiale n. 4 Via Facciolati, 59 Tel. (049) 756008 Telefax (049) 8033060• 35028 Piove di Sacco Via Marconi, 2 Tel. (049) 9701428 Telefax (049) 5842652• 35020 Ponte S. Nicolò Via Volturno, 2 Tel. (049) 8962205 Telefax (049) 8962148• 35030 Rubano Via Rossi, 3/N Tel. (049) 8987272 Telefax (049) 8987274• 35010 Saletto di Vigodarzere Via leonardo da Vinci, 101 Tel. (049) 8849110 Telefax (049) 8849101• 35010 San Giorgio in Bosco Via Valsugana, 86 Tel. (049) 9451053 Telefax (049) 9451085• 35018 San Martino di lupari Via Roma, 68 Tel. (049) 9461288 Telefax (049) 9461261• 35011 Sant’Andrea di Campodarsego Via Caltana, 182 Tel. (049) 9201226 Telefax (049) 9200911• 35010 Sant’Eufemia di Borgoricco Via della Pieve, 43 Tel. (049) 9335454 Telefax (049) 9335144• 35030 Tencarola di Selvazzano Via Padova, 24 Tel. (049) 8687071 Telefax (049) 8687074• 35019 Tombolo Via Roma, 7/A Tel. (049) 9470813 Telefax (049) 9470893• 35010 Trebaseleghe Via C. Menotti, 32 Tel. (049) 9386810 Telefax (049) 9386813Province of Parma• 43043 Borgo Val di Taro Piazzale lauro Grossi, 2 Tel. (0525) 920018 Telefax (0525) 920037
• 43036 Fidenza Via Cornini Malpeli, 13 Tel. (0524) 528180 Telefax (0524) 528140• 43100 Parma Via Emilia Est, 56/B Tel. (0521) 480411 Telefax (0521) 242408• 43100 Parma - Filiale n. 1 Piazzale Santa Croce, 29 Tel. (0521) 207122 Telefax (0521) 231223• 43100 Parma - Filiale n. 2 Via Toscana, 94 Tel. (0521) 460714 Telefax (0521) 460916Province of Pavia• 27020 Alagna Piazza Castello, 15 Tel. (0382) 818137 Telefax (0382) 818129• 27030 Castello d’Agogna Via Novara, 1 Tel. (0384) 256550 Telefax (0384) 256555• 27100 Pavia Via Golgi, 63/A Tel. (0382) 422766 Telefax (0382) 422934• 27020 Sartirana lomellina Via Cavour, 133 Tel. (0384) 800203 Telefax (0384) 800223• 27020 Scaldasole Via Roma, 5 Tel. (0382) 907772 Telefax (0382) 907962• 27029 Vigevano Via Merula, 24/26 Tel. (0381) 88607 Telefax (0381) 75675Province of Piacenza• 29100 Piacenza - Filiale n. 1 Via Medaglie d’Oro, 7 Tel. (0523) 713081 Telefax (0523) 758113Province of Pordenone• 33082 Azzano decimo Via Maestri del lavoro, 28 Tel. (0434) 633438 Telefax (0434) 640898• 33080 Bannia Piazza E. Fermi, 1 Tel. (0434) 560465 Telefax (0434) 957535• 33084 Cordenons Piazza della Vittoria, 36 Tel. (0434) 581285 Telefax (0434) 581275• 33080 Fiume Veneto Via San Francesco, 36/38 Tel. (0434) 564211 Telefax (0434) 561563• 33085 Maniago Piazza italia, 32 Tel. (0427) 733044 Telefax (0427) 733028• 33075 Morsano al Tagliamento Piazza daniele Moro, 3 Tel. (0434) 697014 Telefax (0434) 697839• 33087 Pasiano di Pordenone Via Roma, 102 Tel. (0434) 604077 Telefax (0434) 604078
• 33080 Porcia Piazzetta Conte Silvio di Porcia e Brugnera, 1 Tel. (0434) 923108 Telefax (0434) 591366• 33170 Pordenone Via Martelli, 14 Tel. (0434) 241477 Telefax (0434) 241166• 33080 Prata di Pordenone Via Cesare Battisti, 68 Tel. (0434) 611177 Telefax (0434) 621992• 33077 Sacile Viale lacchin, 64 Tel. (0434) 737208 Telefax (0434) 737209• 33078 San Vito al Tagliamento Piazza del Popolo, 62 Tel. (0434) 875095 Telefax (0434) 875223• 33079 Sesto al Reghena Via degli Olmi, 11/A Tel. (0434) 699010 Telefax (0434) 699292• 33097 Spilimbergo Via Barbacane, 6 Tel. (0427) 926123 Telefax (0427) 419080• 33080 zoppola Via Pancera, 4 Tel. (0434) 574522 Telefax (0434) 574512Province of Ravenna• 48018 Faenza Via Marconi, 32 Tel. (0546) 21075 Telefax (0546) 665531Province of Reggio Emilia•42027 Montecchio Emilia Via Prampolini, 48/50 Tel. (0522) 861312 Telefax (0522) 865531•42100 Reggio Emilia Via Emilia all’Ospizio, 18 Tel. (0522) 580914 Telefax (0522) 454683Province of Rovigo• 45011 Adria Corso Garibaldi, 38/A Tel. (0426) 900514 Telefax (0426) 900878• 45030 Occhiobello Via Eridania, 153/F Tel. (0425) 758267 Telefax (0425) 758347• 45014 Porto Viro Via Risorgimento, 157 Tel. (0426) 320205 Telefax (0426) 323388• 45100 Rovigo Via Sacro Cuore, 5 Tel. (0425) 423853 Telefax (0425) 29822Province of Turin• 10123 Torino Via lagrange, 10 Tel. (011) 5424010 Telefax (011) 539988Province of Trento• 38068 Rovereto Via Cavour, 31 Tel. (0464) 870067 Telefax (0464) 480887

690
Province of Treviso• 31040 Bavaria di Nervesa della B. Via Aldo Moro, 2 Tel. (0422) 882266 Telefax (0422) 882267• 31030 Bessica di loria Via d. Alighieri, 22 Tel. (0423) 471001 Telefax (0423) 471010• 31030 Bigolino Piazza Mons. Guadagnini, 58 Tel. (0423) 981385 Telefax (0423) 982015• 31031 Caerano S. Marco Via A. Gramsci, 9 Tel. (0423) 859679 Telefax (0423) 859680• 31011 Casella d’Asolo Via Tiziano, 150 Tel. (0423) 950860 Telefax (0423) 950861• 31033 Castelfranco Corso XXiX Aprile, 23 Tel. (0423) 423211 Telefax (0423) 423214• 31033 Castelfranco - Filiale n. 1 Borgo Treviso, 159/161 Tel. (0423) 722801 Telefax (0423) 722859• 31033 Castelfranco - Filiale n. 2 loc. Treville Via Castellana, 29 Tel. (0423) 472985 Telefax (0423) 472488• 31033 Castelfranco - Filiale n. 3 Via Brenta, 10 Tel. (0423) 720025 Telefax (0423) 721176• 31033 Castelfranco - Filiale n. 4 Borgo Padova, 34 Tel. (0423) 721902 Telefax (0423) 721774• 31033 Castelfranco - Filiale n. 5 Piazza della Serenissima, 32 Tel. (0423) 722578 Telefax (0423) 744098• 31030 Castello di Godego Via Marconi, 22 Tel. (0423) 469041 Telefax (0423) 469881• 31034 Cavaso del Tomba loc. Caniezza Via San Pio X, 2 Tel. (0423) 543401 Telefax (0423) 543402• 31030 Cison di Valmarino Via iV Novembre, 11 Tel. (0438) 975375 Telefax (0438) 85400• 31010 Col San Martino Via Giarentine, 1 Tel. (0438) 898104 Telefax (0438) 989567• 31015 Conegliano Via XXiV Maggio, 12 Tel. (0438) 415462 Telefax (0438) 415526• 31030 dosson di Casier Piazza leonardo da Vinci, 2 Tel. (0422) 491419 Telefax (0422) 491429• 31050 Fanzolo di Vedelago Via Stazione, 28/A Tel. (0423) 487011 Telefax (0423) 476507
• 31010 Farra di Soligo Via Calnova, 1/A Tel. (0438) 900101 Telefax (0438) 900121• 31010 Fregona Via Mezzavilla Centro, 3 Tel. (0438) 915009 Telefax (0438) 915090• 31040 Guia di Valdobbiadene Strada di Guia, 16 Tel. (0423) 901090 Telefax (0423) 901090• 31036 istrana Piazzale Roma, 91 Est Tel. (0422) 832414 Telefax (0422) 832394• 31037 loria Via Roma, 19 Tel. (0423) 755125 Telefax (0423) 755090• 31021 Mogliano Veneto Piazza Caduti, 38/39 Tel. (041) 5904333 Telefax (041) 5904340• 31044 Montebelluna Via Roma, 51 Tel. (0423) 614165 Telefax (0423) 614173• 31010 Moriago della Battaglia Via A. Moro, 46 Tel. (0438) 890083 Telefax (0438) 890133• 31045 Motta di livenza Via Sante Nardini, 22 Tel. (0422) 861556 Telefax (0422) 860009• 31046 Oderzo Via Spinè, 2 Tel. (0422) 815957 Telefax (0422) 815959• 31050 Onigo di Pederobba Via Case Rosse, 2/A Tel. (0423) 688686 Telefax (0423) 688942• 31038 Paese Via Postumia, 130 Tel. (0422) 450480 Telefax (0422) 450483• 31053 Pieve di Soligo Piazza Caduti nei lager, 1 Tel. (0438) 841859 Telefax (0438) 82045• 31047 Ponte di Piave Via Roma, 24 Tel. (0422) 857986 Telefax (0422) 857987• 31022 Preganziol Via Roma, 4 Tel. (0422) 331564 Telefax (0422) 639070• 31023 Resana Via Castellana, 41 Tel. (0423) 480105 Telefax (0423) 480216• 31039 Riese Pio X Via A. de Gasperi, 5/A Tel. (0423) 483207 Telefax (0423) 454330• 31056 Roncade Piazza i Maggio, 15 Tel. (0422) 841531 Telefax (0422) 841532• 31020 Rua di S. Pietro di Feletto Via Roma, 17/d Tel. (0438) 486997 Telefax (0438) 486997
• 31020 San Fior Via Europa, 67 Tel. (0438) 260303 Telefax (0438) 260265• 31020 San Giacomo di Veglia Piazza Fiume, 37 Tel. (0438) 912080 Telefax (0438) 912111• 31020 San Polo di Piave Via Roma, 60 Tel. (0422) 856688 Telefax (0422) 856689• 31020 San Vendemiano Via Roma, 13 Tel. (0438) 400378 Telefax (0438) 400347• 31020 San zenone degli Ezzelini Via Marconi, 68 Tel. (0423) 968080 Telefax (0423) 968989• 31040 Segusino Viale italia, 229 Tel. (0423) 978971 Telefax (0423) 978977• 31020 Sernaglia della Battaglia Piazza Martiri, 24 Tel. (0438) 966230 Telefax (0438) 966184• 31040 Signoressa di Trevignano Via Feltrina, 1/F-1/G Tel. (0423) 677173 Telefax (0423) 671043• 31058 Susegana Via Conegliano, 96 Tel. (0438) 60813 Telefax (0438) 451511• 31100 Treviso Viale luzzatti, 82 Tel. (0422) 431970 Telefax (0422) 432467• 31100 Treviso - Filiale n. 1 Via G. dannunzio, 17/B Tel. (0422) 591047 Telefax (0422) 540738• 31100 Treviso - Filiale n. 2 Via S. Pelajo, 119 Tel. (0422) 307246 Telefax (0422) 307193• 31100 Treviso - Filiale n. 3 Via Montegrappa, 32 Tel. (0422) 264282 Telefax (0422) 234110• 31100 Treviso - Filiale n. 4 Via 4 Novembre, 84/A Tel. (0422) 546192 Tel. (0422) 546129• 31049 Valdobbiadene Piazza Marconi, 15 Tel. (0423) 970611 Telefax (0423) 972625• 31050 Vedelago Via Crispi, 8 Tel. (0423) 400116 Telefax (0423) 401331• 31020 Vidor Via Capitello, 7 Tel. (0423) 987121 Telefax (0423) 987101• 31050 Villorba Via A. Pacinotti, 1/C Tel. (0422) 608368 Telefax (0422) 918128• 31029 Vittorio Veneto Via dante, 133 Tel. (0438) 940980 Telefax (0438) 940951
Province of Trieste• 34015 Muggia Via Manzoni, 4 Tel. (040) 9278651 Telefax (040) 9278664• 34121 Trieste Via Mazzini, 12 Tel. (040) 662662 Telefax (040) 662002• 34122 Trieste - Filiale n. 1 Piazza San Giovanni, 1 Tel. (040) 662750 Telefax (040) 662796• 34123 Trieste - Filiale n. 2 Via locchi, 26/1 Tel. (040) 313333 Telefax (040) 312323• 34141 Trieste - Filiale n. 3 Via Settefontane, 37 Tel. (040) 9380282 Telefax (040) 9380283• 34133 Trieste - Filiale n. 4 Via Coroneo, 17/E Tel. (040) 3478145 Telefax (040) 630297• 34147 Trieste - Filiale n. 5 Via Flavia, 120 Tel. (040) 281291 Telefax (040) 8320070• 34135 Trieste - Filiale n. 6 Via l. Stock, 4/4 Tel. (040) 420771 Telefax (040) 418247Province of Udine• 33041 Aiello del Friuli Piazza Roma, 19 Tel. (0431) 973011 Telefax (0431) 973200• 33030 Buia Via S. Stefano, 105 Tel. (0432) 965109 Telefax (0432) 965110• 33042 Buttrio Via Cividale, 10 Tel. (0432) 636000 Telefax (0432) 673702• 33052 Cervignano del Friuli Piazza libertà, 16/17 Tel. (0431) 32320 Telefax (0431) 32708• 33043 Cividale del Friuli Via Europa, 2 Tel. (0432) 701055 Telefax (0432) 701105• 33033 Codroipo Via iV Novembre, 5 Tel. (0432) 908688 Telefax (0432) 908677• 33100 Cussignacco Via Verona, 6 Tel. (0432) 602306 Telefax (0432) 602308• 33010 Feletto Umberto Via Udine, 18 Tel. (0432) 573027 Telefax (0432) 573573• 33013 Gemona del Friuli Via dante Alighieri, 207 Tel. (0432) 971496 Telefax (0432) 971525• 33050 Gonars Via A. de Gasperi, 1 Tel. (0432) 992412 Telefax (0432) 992288

691
• 33054 lignano Sabbiadoro Viale Europa, 19/A Tel. (0431) 723011 Telefax (0431) 723069• 33044 Manzano Via San Giovanni, 6/A Tel. (0432) 740046 Telefax (0432) 740225• 33035 Martignacco Via Cividina, 16 Tel. (0432) 678833 Telefax (0432) 678534• 33057 Palmanova Piazza Grande, 2 Tel. (0432) 928300 Telefax (0432) 929754• 33037 Pasian di Prato Via S. Caterina, 23/A Tel. (0432) 699033 Telefax (0432) 69585• 33027 Paularo Via S. Sbrizzai, 12 Tel. (0433) 71056 Telefax (0433) 71062• 33040 Povoletto Via Ermes di Colloredo, 30 Tel. (0432) 679217 Telefax (0432) 664270• 33050 Pozzuolo del Friuli Via della Cavalleria, 13 Tel. (0432) 665050 Telefax (0432) 669788• 33040 Pradamano Via i Maggio, 62 Tel. (0432) 670688 Telefax (0432) 671201• 33040 Premariacco Piazza Marconi, 9 Tel. (0432) 729867 Telefax (0432) 729868• 33038 San daniele del Friuli Via Garibaldi, 11 Tel. (0432) 940906 Telefax (0432) 940924• 33048 San Giovanni al Natisone Piazzetta Brazzà, 5 Tel. (0432) 743296 Telefax (0432) 756331• 33050 San Vito al Torre Via Roma, 27 Tel. (0432) 997001 Telefax (0432) 997727• 33017 Tarcento Via Garibaldi, 5 Tel. (0432) 783915 Telefax (0432) 783923• 33018 Tarvisio Via Roma, 22 Tel. (0428) 41029 Telefax (0428) 41043• 33028 Tolmezzo Piazza XX Settembre, 12 Tel. (0433) 41900 Telefax (0433) 44300• 33019 Tricesimo Piazza Garibaldi, 45 Tel. (0432) 881725 Telefax (0432) 881372• 33100 Udine Via Cavour, 24 Tel. (0432) 516501 Telefax (0432) 516356• 33100 Udine - Filiale n. 1 Viale Europa Unita, 85 Tel. (0432) 503020 Telefax (0432) 501147
• 33100 Udine - Filiale n. 2 Piazzale Chiavris, 36 Tel. (0432) 547200 Telefax (0432) 546222• 33100 Udine - Filiale n. 3 Viale l. da Vinci, 107 Tel. (0432) 402828 Telefax (0432) 400460• 33100 Udine - Filiale n. 4 Viale Forze Armate, 4 Tel. (0432) 581827 Telefax (0432) 284810• 33100 Udine - Filiale n. 5 Via Pozzuolo, 143 Tel. (0432) 532353 Telefax (0432) 532301• 33100 Udine - Filiale n. 6 Via Marghera, 2 Tel. (0432) 503437 Telefax (0432) 512470• 33100 Udine - Filiale n. 7 Via Gemona, 35 Tel. (0432) 229362 Telefax (0432) 229354• 33100 Udine - Filiale n. 8 Viale Vat, 109 Tel. (0432) 471693 Telefax (0432) 471721• 33100 Udine - Filiale n. 9 Piazzale XXVi luglio, 62 Tel. (0432) 534378 Telefax (0432) 534075• 33100 Udine - Filiale n. 10 Via Pradamano, 41/B Tel. (0432) 526153 Telefax (0432) 524363Province of Varese• 21052 Busto Arsizio Via zappellini, 17 Tel. (0331) 677293 Telefax (0331) 670843Province of Venice• 30020 Bibione Corso del Sole, 49 Tel. (0431) 437418 Telefax (0431) 437207• 30021 Caorle Via Strada Nuova, 30 Tel. (0421) 212429 Telefax (0421) 211153• 30020 Cinto Caomaggiore Via Roma, 125 Tel. (0421) 241274 Telefax (0421) 241254• 30016 Jesolo Via Aquileia, 221 Tel. (0421) 630255 Telefax (0421) 371105• 30020 Marcon Via Alta, 55 Tel. (041) 5950663 Telefax (041) 5952177• 30030 Martellago Via Castellana, 40/H Tel. (041) 5402332 Telefax (041) 5402600• 30030 Mellaredo di Pianiga Via Noalese Sud , 44/1 Tel. (041) 5190339 Telefax (041) 5190342• 30020 Meolo Riviera 18 Giugno, 62 Tel. (0421) 345431 Telefax (0421) 345424
• 30174 Mestre Via F.lli Rondina, 3 - P.zza A. Coin Tel. (041) 959952 Telefax (041) 958497• 30172 Mestre - Filiale n. 1 Ca’ Marcello, 67/A Tel. (041) 5310005 Telefax (041) 5316713• 30174 Mestre - Filiale n. 2 Via Terraglio, 17 - c/o Coin Tel. (041) 958054 Telefax (041) 979395• 30034 Mira Via Nazionale, 226 Tel. (041) 4265144 Telefax (041) 4265834• 30035 Mirano Via Gramsci, 54 Tel. (041) 5701500 Telefax (041) 5701320• 30026 Portogruaro Via Martiri della libertà, 109 Tel. (0421) 280496 Telefax (0421) 72299• 30028 San Michele al Tagliamento Via Venudo, 15 Tel. (0431) 521838 Telefax (0431) 521801• 30027 San donà di Piave Corso Silvio Trentin, 75 Tel. (0421) 332188 Telefax (0421) 332180• 30036 Santa Maria di Sala Via Cavin di Sala, 53 Tel. (041) 5760235 Telefax (041) 5760234• 30037 Scorzè Via Venezia, 33 Tel. (041) 5841932 Telefax (041) 5840962• 30019 Sottomarina di Chioggia Viale Veneto, 20 Tel. (041) 5500995 Telefax (041) 5501102• 30039 Stra Piazza O. Tombolan Fava Tel. (049) 9801544 Telefax (049) 9801536• 30020 Stretti di Eraclea Via Cadorna, 21 Tel. (0421) 316500 Telefax (0421) 316496• 30125 Venezia Rialto S. Polo 370/371 (Campo Beccarie) Tel. (041) 5210722 Telefax (041) 5205987• 30125 Venezia S. Croce Sestiere S. Croce, 509 Tel. (041) 2770530 Telefax (041) 2412053• 30124 Venezia S. Marco Calle Goldoni, 4403 Sestiere di S. Marco Tel. (041) 2413240 Telefax (041) 2413237Province of Verona• 37040 Bevilacqua Via Roma, 45/A Tel. (0442) 93666 Telefax (0442) 93650• 37040 Bonavigo Via Trieste, 13/15 Tel. (0442) 670077 Telefax (0442) 670090
• 37051 Bovolone Via Giuseppe Garibaldi, 52/54 Tel. (045) 6901911 Telefax (045) 7100462• 37012 Bussolengo Via Verona, 8/A Tel. (045) 6700377 Telefax (045) 6700504• 37043 Castagnaro Via d. Alighieri, 40 Tel. (0442) 675588 Telefax (0442) 675582• 37014 Castelnuovo del Garda Via Marconi, 17 Tel. (045) 6450895 Telefax (045) 6450089• 37053 Cerea Via Roma, 2 Tel. (0442) 320871 Telefax (0442) 321042• 37044 Cologna Veneta Corso Gua’ dea Piccini, 76 Tel. (0442) 412467 Telefax (0442) 410360• 37030 Colognola ai Colli Via Stra’, 52 Tel. (045) 6151400 Telefax (045) 6151404• 37020 dolcè Via Passo di Napoleone, 1103 E/F/G Tel. (045) 6862896 Telefax (045) 7732655• 37063 isola della Scala Via Marconi, 13 Tel. (045) 7300142 Telefax (045) 7301043• 37017 lazise loc. la Pezza, 4/B Tel. (045) 7581318 Telefax (045) 7581286• 37045 legnago Via duomo, 17 Tel. (0442) 603245 Telefax (0442) 602414• 37054 Nogara Via Maso, 1 Tel. (0442) 510749 Telefax (0442) 89581• 37019 Peschiera del Garda Via Risorgimento, 5/B Tel. (045) 6401612 Telefax (045) 7552340• 37047 Prova di S. Bonifacio Via Prova, 47/C Tel. (045) 6101544 Telefax (045) 6102079• 37034 Quinto di Valpantena Via Valpantena, 31 Tel. (045) 8700769 Telefax (045) 8700818• 37056 Salizzole Via Roma, 53 Tel. (045) 6901444 Telefax (045) 6901448• 37035 San Giovanni ilarione Via Ca’ Rosse, 32 Tel. (045) 7465200 Telefax (045) 7465233• 37057 San Giovanni lupatoto Via Roma, 3 Tel. (045) 8752848 Telefax (045) 9250160• 37036 San Martino Buon Albergo Via Nazionale, 1/C Tel. (045) 995224 Telefax (045) 995434

692
• 37040 Santo Stefano di zimella Via Martiri della libertà, 40 Tel. (0442) 490064 Telefax (0442) 490559• 37067 Valeggio sul Mincio Piazza Vittorio Veneto, 5/C Tel. (045) 7952226 Telefax (045) 6370620• 37122 Verona Corso Cavour, 29 Tel. (045) 8057611 Telefax (045) 8031242• 37138 Verona - Filiale n. 1 Corso Milano, 114 Tel. (045) 8101088 Telefax (045) 8100953• 37135 Verona - Filiale n. 2 largo Perlar, 8/10 Tel. (045) 502090 Telefax (045) 506693• 37131 Verona - Filiale n. 3 Via del Capitel, 3/d Tel. (045) 524635 Telefax (045) 8402458• 37126 Verona - Filiale n. 4 Via Todeschini, 19 Tel. (045) 8350985 Telefax (045) 8350692• 37124 Verona - Filiale n. 5 Via Mameli, 152 Tel. (045) 8309088 Telefax (045) 8309152• 37047 Villabella di S. Bonifacio Crosaron di Villabella, 18 Tel. (045) 7613822 Telefax (045) 7613647• 37069 Villafranca di Verona Corso Vittorio Emanuele ii, 131 Tel. (045) 6305547 Telefax (045) 7903577
• 37062 Villafranca loc. dossobuono Via Cavour, 71 Tel. (045) 8600642 Telefax (045) 8600150
REPRESENTATiVEOFFiCES• Hong Kong Room 1306, Nine Queen’s Road Central - Hong Kong Tel. 00852-21472955 Telefax 00852-21472997• Shanghai Unit 3307b, The Center, No. 989 Changle Road, Xuhui district, Shanghai P.R. China Postcode: 200030 Tel. (86.21) 540754455, 54075456 Telefax (86.21) 54075457• New delhi 1510-12, Narain Manzil 23 Barakhamba Road, New delhi, india Postcode: 110001 Tel. +91-11-41524344/41524345 Telefax +91 11 41524346
SUBSidiARY BANKS• dublin BPV Finance (international) P.l.c. KBC House - 4 George’s dock iFSC - international Financial Service Centre - dublin (ireland) Tel. 00353-1-6720630 Telefax 00353-1-6720633 Swift BPViiE21 E-mail: [email protected]
MiNORiTY PARTiCiPATiONS• Bratislava Volksbank Slovensko A.S. Namestie SNP 15 SK-81000 Bratislava Repubblica Slovacca Tel. 00421-2-59651298 Swift lUBA SK BX Sig. Miroslav Gecik• Bucharest Volksbank Romania S.A. Apolodor Street 42 district 5 RO 050741 - Bucharest - Romania Tel. 004021-4056530 Swift VBBU RO BU Sig. Angelo Manera• Budapest Magyarorszagi Volksbank zrt Rakoczi ut 7 H-1088 Budapest - Ungheria Tel. 0036-1-3286677 Swift MAVO HU HX Sig. ra Kinga Szekelyhidy• ljubljana Banca Volksbank d.d. dunajska 128A SlO-1000 ljubljana - Slovenia Tel. 00386-1-5307596 Swift SlBV Si 2X Sig. Tadej Senk• Praga Volksbank Cz A.S. lazarska 8/13 Cz-12000 Praha 1 - Repubblica Ceca Tel. 00420-234-706827 Swift: VBOE Cz 2X Sig. Giorgio Migliorini• Sarajevo Volksbank BH d.d. Fra Anðela zvizdovica 1 BiH-71000 Sarajevo-Bosnia Erzegovina Tel. 00387-33-250010
Swift: VBSA BA 22 Sig Edin zeco• zagabria Volksbank d.d. Varšavska 9 HR-10000 zagreb - Croazia Tel. 00385-1-6001285 Swift: VBCR HR 22 Sig.ra Sandra Posic
ASSOCiATEd BANKS• Beograd Volksbank A.d. Bulevar M. Pupina, 165g RS-11070 Beograd Serbia Tel. 00381-11-2017083 Swift: VBOE CS BG Sig.ra drapona Cuetkovic• Sliema Volksbank Malta lTd dingli Street, 53 SlM 09 Sliema - Malta Tel. 00356-234-94211 Swift: VBMA MT M3 Sig.ra Jeannette Apap• lviv Volksbank Ukraine Grabovskogo, 11 UA - 79000 lViV Tel. 00380-32-2550279 Sig. Karl Schlagenhaufen

Stampa: Tipografia Rumor, Vicenza


Gruppo Banca Popolare di Vicenza