Balancing hot and cold. - kgh-kongres.rs 5 – cream ... • Ice storage will need precooling of the...
29
multiconsult.no Balancing hot and cold. How to find the optimum delivery temperature for an industrial high temperature ammonia heat pump. Gert Nielsen Industry, Oil and Gas, Bergen Senior Geek Refrigeration and Thermal Systems Analysis
-
Upload
duongthien -
Category
Documents
-
view
218 -
download
3
Transcript of Balancing hot and cold. - kgh-kongres.rs 5 – cream ... • Ice storage will need precooling of the...

multiconsult.no
Balancing hot and cold.
How to find the optimum delivery temperature for an industrial high temperature ammonia heat pump.
Gert NielsenIndustry, Oil and Gas, BergenSenior Geek Refrigeration and Thermal Systems Analysis
multiconsult.no
2
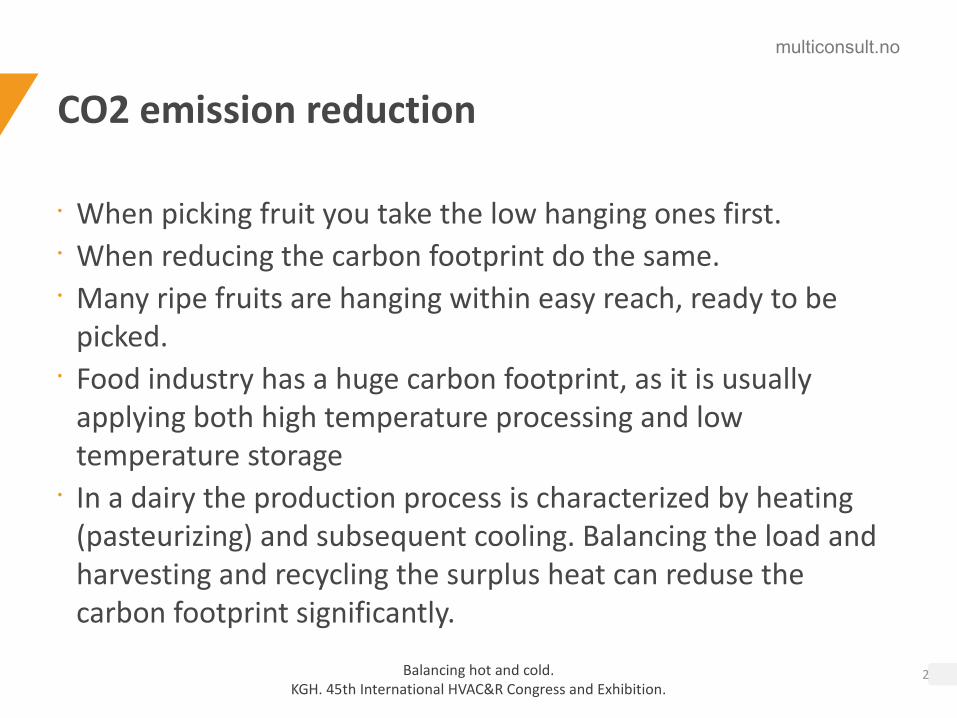
CO2 emission reduction
Balancing hot and cold. KGH. 45th International HVAC&R Congress and Exhibition.
• When picking fruit you take the low hanging ones first.• When reducing the carbon footprint do the same.• Many ripe fruits are hanging within easy reach, ready to be
picked.• Food industry has a huge carbon footprint, as it is usually
applying both high temperature processing and low temperature storage
• In a dairy the production process is characterized by heating (pasteurizing) and subsequent cooling. Balancing the load and harvesting and recycling the surplus heat can reduse the carbon footprint significantly.
multiconsult.no
3
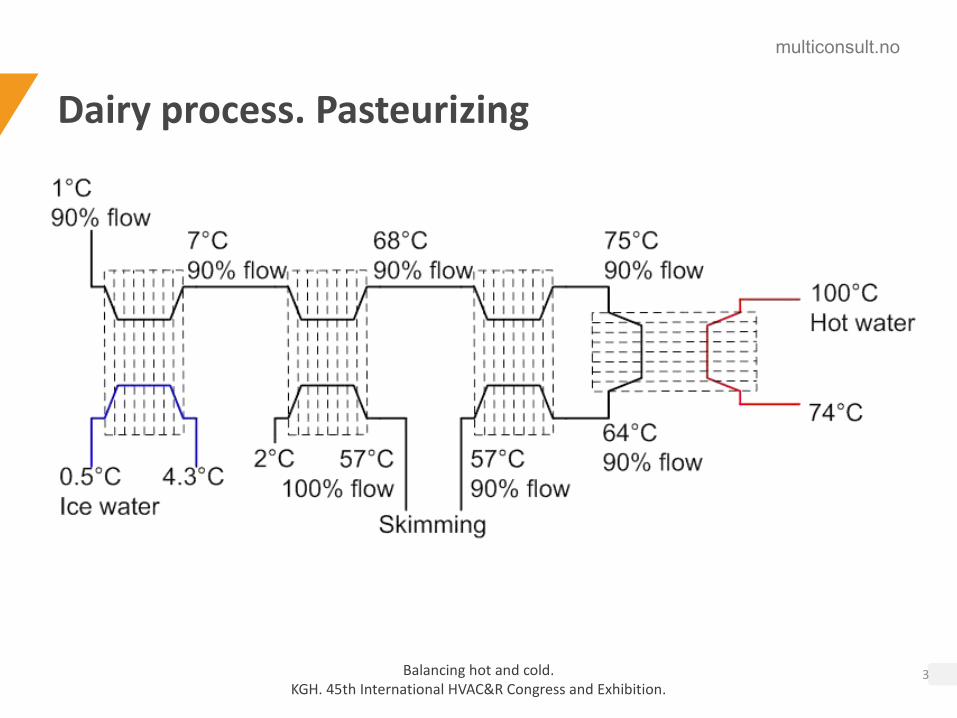
Dairy process. Pasteurizing
Balancing hot and cold. KGH. 45th International HVAC&R Congress and Exhibition.

multiconsult.no
4
Dairy example. Basic facts
Balancing hot and cold. KGH. 45th International HVAC&R Congress and Exhibition.
• Typical comsumption dairy, handling 155 000 000 litres of milk per year.
• Production flow is 600 000 litres/production day, 5 days per week
• The daily influx of milk is 425 000 litres/day 7 days a week.
• The cows can’t bottle up during weekends.• Milk delivery starts at 0500 and continues until 2200.

multiconsult.no
5
Milk reception
Balancing hot and cold. KGH. 45th International HVAC&R Congress and Exhibition.
• Design delivery temperature 8⁰C.
• Storage temperature 2⁰C.
• Design cooling energy 2 855 kWh.

multiconsult.no
6
Milk reception
Balancing hot and cold. KGH. 45th International HVAC&R Congress and Exhibition.
• Each reception station can handle 60 000 litres/h• Worst case. 5 lorries emptying simultaneously.• Each lorry holds 20 000 litres at 8⁰C which is to be cooled to
2⁰C.• Total cold demand : 2 014 kW.• The emptying process lasts 105 minutes.• Average demand : 384 kW• Storage capacity : 545 kWh

multiconsult.no
7
Dairy process
Balancing hot and cold. KGH. 45th International HVAC&R Congress and Exhibition.
Density Heat capacity Flow Run time Start Stop
kg/litre kJ/kgK l/h kg/s kg/24h h
Milk reception 1.033 3.90 433 860 06.00 22.00Pasteurizer 1 – milk (P1) 1.036 4.00 23 750 6.83 196 840 8h 00’ 05.00 13.00Pasteurizer 3 – milk (P3) 1.036 4.00 28 100 8.09 232 893 8h 00’ 05.00 13.00Pasteurizer 4 – milk (P4) 1.036 4.00 28 100 8.09 154 291 5h 18’ 13.00 18.18Pasteurizer 2 – standby water (P2) 1 4.20 15 000 4.17 25 099 1h 40’ 11.00 12.40Pasteurizer 2 – sour milk (P2) 1.062 3.90 15 000 4.43 31 860 2h 00’ 09.00 11.00Pasteurizer 2 – yoghurt. Part 1 (P2) 1.062 3.90 8 900 2.63 44 500 5h 00’ 03.00 08.00Pasteurizer 2 – yoghurt. Part 2 (P2) 1.062 3.90 8 900 2.63 35 600 4h 00’ 13.30 17.30Pasteurizer 5 – cream (P5) 0.996 3.30 4 200 1.16 25 099 6h 00’ 06.00 12.00Pasteurizer 6 – cream/Sour cream (P6) 0.996 3.90 4 700 1.30 37 450 8h 00’ 07.00 15.00Pasteurizer 7 – Juice (P7) 1 4.20 17 000 4.72 119 000 7h 00’ 05.00 12.00Yoghurt storage 1.062 3.90 16 992 5.01 81 774 4h 32’ 10.00 14.32Sour milk Storage 1.033 3.90 14 462 4.15 51 629 3h 27’ 10.00 13.27Raw cream storage 0.996 3.30 6 000 1.66 17 928 3h 00’ 15.00 18.00Pasteurized cream storage 0.996 3.30 4 000 1.11 15 936 4h 00’ 10.00 14.00CIP Milk reception 1 4.20 12 000 3.33 90 000 7h 30’ 22.00 05.30CIP P1 1 4.20 10 000 2.78 20 000 2h 00 13.00 15.00CIP P3 1 4.20 10 000 2.78 20 000 2h 00 13.00 15.00CIP P4 1 4.20 10 000 2.78 20 000 2h 00 18.30 20.30CIP P2 1 4.20 10 000 2.78 20 000 2h 00 17.30 19.30CIP P5 1 4.20 10 000 2.78 20 000 2h 00 12.00 14.00CIP P6 1 4.20 10 000 2.78 20 000 2h 00 15.00 17.00CIP P7 1 4.20 10 000 2.78 20 000 2h 00 12.00 14.00CIP pipes and tanks 1 4.20 10 000 2.78 90 000 9h 00 18.30 03.30

multiconsult.no
8
Dairy process
Balancing hot and cold. KGH. 45th International HVAC&R Congress and Exhibition.

multiconsult.no
9
Dairy process. Cold demand. Temperature levels
Balancing hot and cold. KGH. 45th International HVAC&R Congress and Exhibition.
Ice water
Tin [°C]
Tout[°C]
MarginCold
demand [kW]
Cold energy. [kWh]
T return, ice water
[°C]
Milk reception balanced 8 2 384 2 855 5.6
Pasteurizer 1 – milk (P1) 7 1 10 % 180 1 443 4.3
Pasteurizer 3 – milk (P3) 7 1 10 % 214 1 708 4.3Pasteurizer 4 – milk (P4) 7 1 10 % 214 1 131 4.3Pasteurizer 2 – standby water (P2) 7 2 10 % 96 161 3.6Pasteurizer 5 – cream (P5) 68 10 10 % 245 1 468 39.0Pasteurizer 6 – cream/Sour cream (P6) 32 24 10 % 45 357 5.6Pasteurizer 7 – Juice (P7) 20 5 10 % 327 2 291 10.3Yoghurt storage 43 21 10 % 473 2 144 15.0Sour milk Storage 40 10 10 % 534 1 846 20.3Raw cream storage 10 2 10 % 48 145 5.6Pasteurized cream storage 13 2 10 % 44 177 7.6Total 2 804 15 726

multiconsult.no
10
Dairy process. Cold demands
Balancing hot and cold. KGH. 45th International HVAC&R Congress and Exhibition.

multiconsult.no
11
Dairy process. Cold demand, production and storage
Balancing hot and cold. KGH. 45th International HVAC&R Congress and Exhibition.
• Design demand : 2 400 kW• Design pretext:
One redundant chiller to ensure production during down time, maintenance etc.
Two chillers, 1/3 and 2/3 capacity to ensure good capacity control.
Thermal storage to shave the peak demand. Performance of the smallest chiller 2400/5 = 480 kW. Performance of the larger chiller 2 * 480 = 960 kW. Peak shaved 960 kW. Storage 2 150 kWh + 545 kWh = 2 700 kWh

multiconsult.no
12
Dairy process. Cold demand and production
Balancing hot and cold. KGH. 45th International HVAC&R Congress and Exhibition.

multiconsult.no
13
Dairy process. Cold demand. Temperature levels
Balancing hot and cold. KGH. 45th International HVAC&R Congress and Exhibition.
Ice water
Tin [°C]
Tout[°C]
MarginCold
demand [kW]
Cold energy. [kWh]
T return, ice water
[°C]
Milk reception balanced 8 2 384 2 855 5.6
Pasteurizer 1 – milk (P1) 7 1 10 % 180 1 443 4.3
Pasteurizer 3 – milk (P3) 7 1 10 % 214 1 708 4.3Pasteurizer 4 – milk (P4) 7 1 10 % 214 1 131 4.3Pasteurizer 2 – standby water (P2) 7 2 10 % 96 161 3.6Pasteurizer 5 – cream (P5) 68 10 10 % 245 1 468 39.0Pasteurizer 6 – cream/Sour cream (P6) 32 24 10 % 45 357 5.6Pasteurizer 7 – Juice (P7) 20 5 10 % 327 2 291 10.3Yoghurt storage 43 21 10 % 473 2 144 15.0Sour milk Storage 40 10 10 % 534 1 846 20.3Raw cream storage 10 2 10 % 48 145 5.6Pasteurized cream storage 13 2 10 % 44 177 7.6Total 2 804 15 726

multiconsult.no
14
Dairy process. Cold demand. Temperature and storage
Balancing hot and cold. KGH. 45th International HVAC&R Congress and Exhibition.
• Stratification tank vs. Ice storage.• Ice storage will need precooling of the return water.• Ice storage will need TEVAP = -8⁰C. Stratification will need -3⁰C• Ice storage is smaller, but not as responsive.

multiconsult.no
15
Dairy process. Heat demand
Balancing hot and cold. KGH. 45th International HVAC&R Congress and Exhibition.

multiconsult.no
16
Dairy process. Heat demand and temperature levels
Balancing hot and cold. KGH. 45th International HVAC&R Congress and Exhibition.
Tin [°C]
Tout[°C] Margin
10 %Heat [kW] Energy [kWh]
T return hot water [°C]
Pasteur 1 – milk 75 64 10 % 330.8 2 646 74Pasteur 3 – milk 75 64 10 % 391.4 3 131 74Pasteur 4 – milk 75 64 10 % 391.4 2 074 74Pasteur 2 – sour milk 45 25 10 % 379.7 759 35Pasteur 2 – sour milk (HT) 96 73 10 % 436.6 873 83Pasteur 2 – yoghurt 45 25 10 % 225.3 2 027 35
Pasteur 2 – yoghurt (HT) 96 73 259.1 2 332 83
Pasteur 5 – cream 75 10 10 % 274.2 1 645 20Pasteur 6 – cream/sour cream 70 45 10 % 139.5 1 116 55Pasteur 6 – cream/sour cream (HT) 95 55 10 % 223.1 1 785 65Pasteur 7 – Juice 15 5 10 % 218.2 1 527 15Pasteur 7 – Juice (HT) 90 68 10 % 480.0 3 360 78CIP Milk reception 90 55 10 % 539.0 4 312 65CIP production 95 55 10 % 2 053.3 11 550 65
Total 39 139

multiconsult.no
17
Dairy process. Heat demand and temperature levels
Balancing hot and cold. KGH. 45th International HVAC&R Congress and Exhibition.

multiconsult.no
18
Refrigeration machinery. Efficiency
Balancing hot and cold. KGH. 45th International HVAC&R Congress and Exhibition.

multiconsult.no
19
Dairy process. Surplus heat from cold production
Balancing hot and cold. KGH. 45th International HVAC&R Congress and Exhibition.

multiconsult.no
20
Dairy process. Heat pump efficiency
Balancing hot and cold. KGH. 45th International HVAC&R Congress and Exhibition.

multiconsult.no
21
Dairy process. Heat pump production potential
Balancing hot and cold. KGH. 45th International HVAC&R Congress and Exhibition.
Delivery temp. [°C]
COP Potential heat production [kWh]
86.0 4.52 24 26090.0 3.91 25 42091.5 3.68 25 90098.0 3.09 27 940
multiconsult.no
22
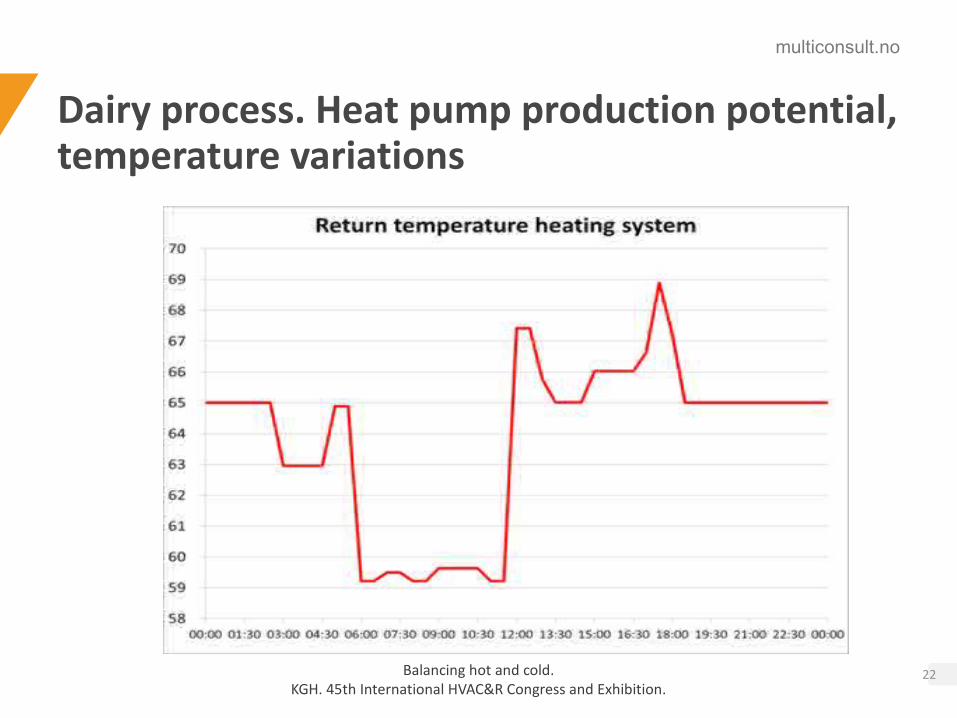
Dairy process. Heat pump production potential, temperature variations
Balancing hot and cold. KGH. 45th International HVAC&R Congress and Exhibition.

multiconsult.no
23
Dairy process. Heat demand and temperature variations
Balancing hot and cold. KGH. 45th International HVAC&R Congress and Exhibition.

multiconsult.no
24
Dairy process. Heat pump production potential, heat demand coverage
Balancing hot and cold. KGH. 45th International HVAC&R Congress and Exhibition.
Delivery temp. [°C]
COP Potential heat production [kWh]
Potential heat demand [kWh]
Relation available heat and heat
demand86.0 4.52 24 260 24 180 100%
90.0 3.91 25 420 28 450 89%
91.5 3.68 25 900 30 050 86%
98.0 3.09 27 940 37 000 76%

multiconsult.no
25
Dairy process. Energy efficiency and CO2 emissions
Balancing hot and cold. KGH. 45th International HVAC&R Congress and Exhibition.
Today 90°C 91.5°C 98°C
Heat demand kWh 39 140 39 140 39 140 39 140Heat delivery from heat pump kWh 25 420 25 900 27 940
Heat delivery from steam boiler 39 140 13 720 13 240 11 200
Boiler efficiency 85 %
Energy supplied to boiler kWh 46 047 16 141 15 576 13 176
Heat pump process COP 3.91 3.68 3.09
Power train efficiency 93 %
Actual COP 3.64 3.42 2.87
Energy supplied to heat pump kWh 6 991 7 568 9 723
Total energy demand per day kWh 46 047 23 132 23 144 22 899Total energy saved per day kWh 22 915 22 903 23 148
Total energy saved per year kWh 5 974 336 5 971 087 6 034 996
Emission Nordic electricity mix 395 g/kWh
Emission reduction tons CO2 2 360 2 359 2 384
Equidistance driven in Touran 1.9D, 2004 model. 155 gCO2/km 15 224 920 15 216 641 15 379 507Car equivalents. Annual distance 15 000 km 1015 1014 1025Lunar round trips 768 800 km 19.8 19.8 20.0

multiconsult.no
26
Dairy process. Heat pump economic efficiency
Balancing hot and cold. KGH. 45th International HVAC&R Congress and Exhibition.
Energy savings Invest HP Pay back HP Invest chillersEquipmen
t totalPayback
equipment
kWh Euro Euro Years Euro Euro Years
II 5 974 336 477 947 1 042 076 2,2 1 112 114 2 154 190 4,5
III 5 971 087 477 687 1 371 198 2,9 996 488 2 367 686 5,0
IV 6 034 996 482 800 2 709 190 5,6 1 009 811 3 719 001 7,7

multiconsult.no
27
Dairy process
Balancing hot and cold. KGH. 45th International HVAC&R Congress and Exhibition.

multiconsult.no
28
Dairy process
Balancing hot and cold. KGH. 45th International HVAC&R Congress and Exhibition.

multiconsult.no
29
Dairy process
Balancing hot and cold. KGH. 45th International HVAC&R Congress and Exhibition.