Balancing Adequacy and Sustainability in an...
12
Balancing Adequacy and Sustainability in an Aging World Richard Jackson Senior Associate Center for Strategic & International Studies 6 th Global Pension & Savings Conference April 2-3, 2014 The World Bank Washington, DC
Transcript of Balancing Adequacy and Sustainability in an...

Balancing Adequacy and Sustainability in an Aging World
Richard Jackson Senior Associate
Center for Strategic & International Studies
6th Global Pension & Savings Conference April 2-3, 2014
The World Bank Washington, DC

Elderly (Aged 60 & Over), as a Percent of the Population in 2010 and 2040
8%
9%
10%
13%
18%
19%
18%
23%
12%
25%
15%
20%
23%
26%
26%
27%
28%
29%
29%
30%
0% 10% 20% 30% 40% 50%
India
Mexico
Brazil
Chile
US
Australia
Russia
UK
China
Sweden
2010
2040
23%
20%
19%
22%
23%
22%
16%
26%
27%
30%
30%
31%
33%
33%
37%
38%
39%
39%
40%
43%
0% 10% 20% 30% 40% 50%
France
Canada
Poland
Netherlands
Switzerland
Spain
Korea
Germany
Italy
Japan
The world stands on the threshold of a stunning demographic transformation.
Source: UN Population Division (UN, 2013)
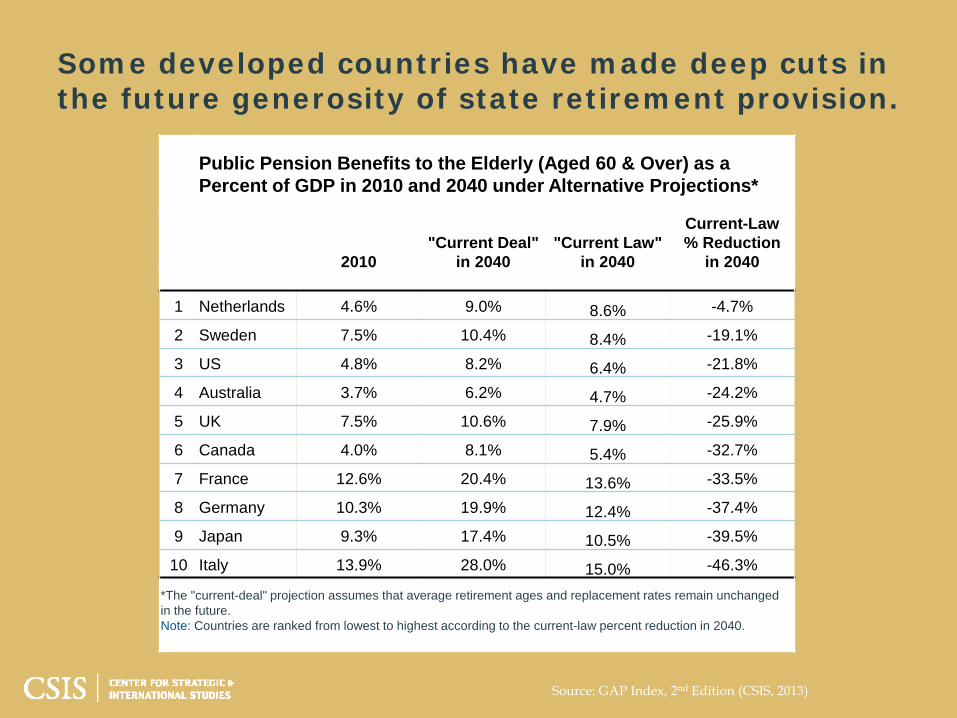
Some developed countries have made deep cuts in the future generosity of state retirement provision.
Source: GAP Index, 2nd Edition (CSIS, 2013)
Public Pension Benefits to the Elderly (Aged 60 & Over) as a Percent of GDP in 2010 and 2040 under Alternative Projections*
2010 "Current Deal"
in 2040 "Current Law"
in 2040
Current-Law % Reduction
in 2040
1 Netherlands 4.6% 9.0% 8.6% -4.7%
2 Sweden 7.5% 10.4% 8.4% -19.1%
3 US 4.8% 8.2% 6.4% -21.8%
4 Australia 3.7% 6.2% 4.7% -24.2%
5 UK 7.5% 10.6% 7.9% -25.9%
6 Canada 4.0% 8.1% 5.4% -32.7%
7 France 12.6% 20.4% 13.6% -33.5%
8 Germany 10.3% 19.9% 12.4% -37.4%
9 Japan 9.3% 17.4% 10.5% -39.5%
10 Italy 13.9% 28.0% 15.0% -46.3%
*The "current-deal" projection assumes that average retirement ages and replacement rates remain unchanged in the future. Note: Countries are ranked from lowest to highest according to the current-law percent reduction in 2040.
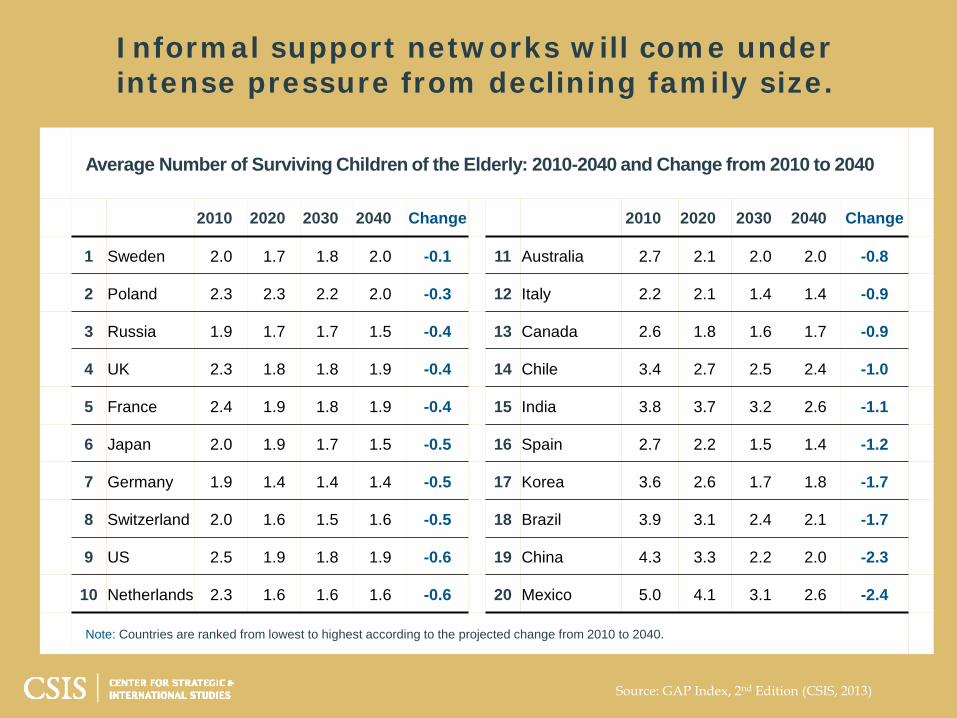
Average Number of Surviving Children of the Elderly: 2010-2040 and Change from 2010 to 2040
2010 2020 2030 2040 Change 2010 2020 2030 2040 Change
1 Sweden 2.0 1.7 1.8 2.0 -0.1 11 Australia 2.7 2.1 2.0 2.0 -0.8
2 Poland 2.3 2.3 2.2 2.0 -0.3 12 Italy 2.2 2.1 1.4 1.4 -0.9
3 Russia 1.9 1.7 1.7 1.5 -0.4 13 Canada 2.6 1.8 1.6 1.7 -0.9
4 UK 2.3 1.8 1.8 1.9 -0.4 14 Chile 3.4 2.7 2.5 2.4 -1.0
5 France 2.4 1.9 1.8 1.9 -0.4 15 India 3.8 3.7 3.2 2.6 -1.1
6 Japan 2.0 1.9 1.7 1.5 -0.5 16 Spain 2.7 2.2 1.5 1.4 -1.2
7 Germany 1.9 1.4 1.4 1.4 -0.5 17 Korea 3.6 2.6 1.7 1.8 -1.7
8 Switzerland 2.0 1.6 1.5 1.6 -0.5 18 Brazil 3.9 3.1 2.4 2.1 -1.7
9 US 2.5 1.9 1.8 1.9 -0.6 19 China 4.3 3.3 2.2 2.0 -2.3
10 Netherlands 2.3 1.6 1.6 1.6 -0.6 20 Mexico 5.0 4.1 3.1 2.6 -2.4
Note: Countries are ranked from lowest to highest according to the projected change from 2010 to 2040.
Informal support networks will come under intense pressure from declining family size.
Source: GAP Index, 2nd Edition (CSIS, 2013)
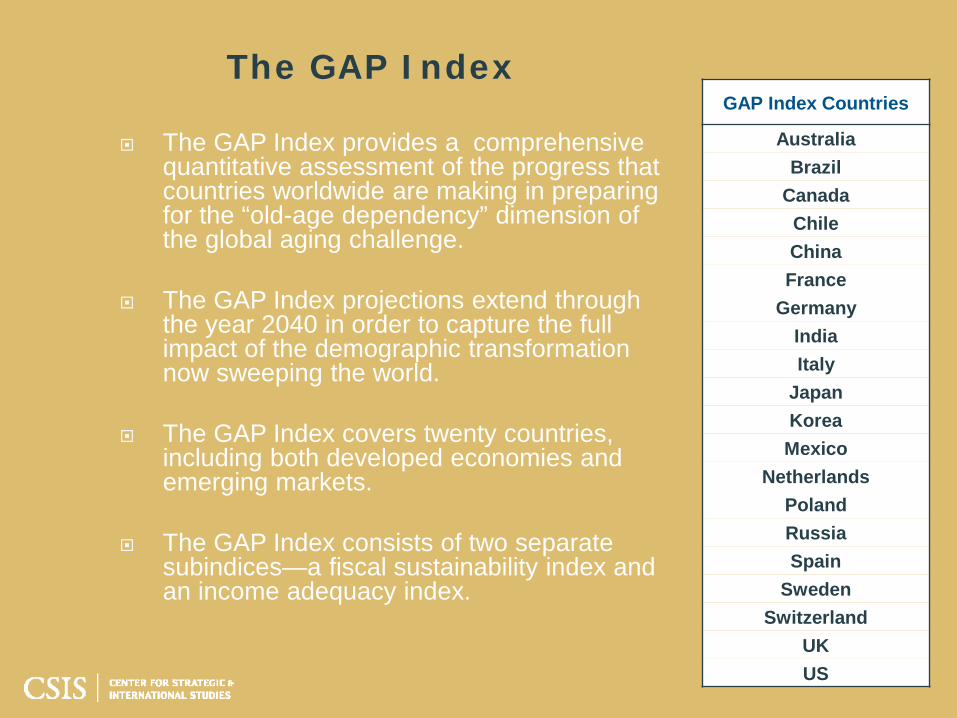
The GAP Index provides a comprehensive quantitative assessment of the progress that countries worldwide are making in preparing for the “old-age dependency” dimension of the global aging challenge.
The GAP Index projections extend through the year 2040 in order to capture the full impact of the demographic transformation now sweeping the world.
The GAP Index covers twenty countries, including both developed economies and emerging markets.
The GAP Index consists of two separate subindices—a fiscal sustainability index and an income adequacy index.
The GAP Index GAP Index Countries
Australia Brazil
Canada Chile China France
Germany India Italy
Japan Korea
Mexico Netherlands
Poland Russia Spain
Sweden Switzerland
UK US
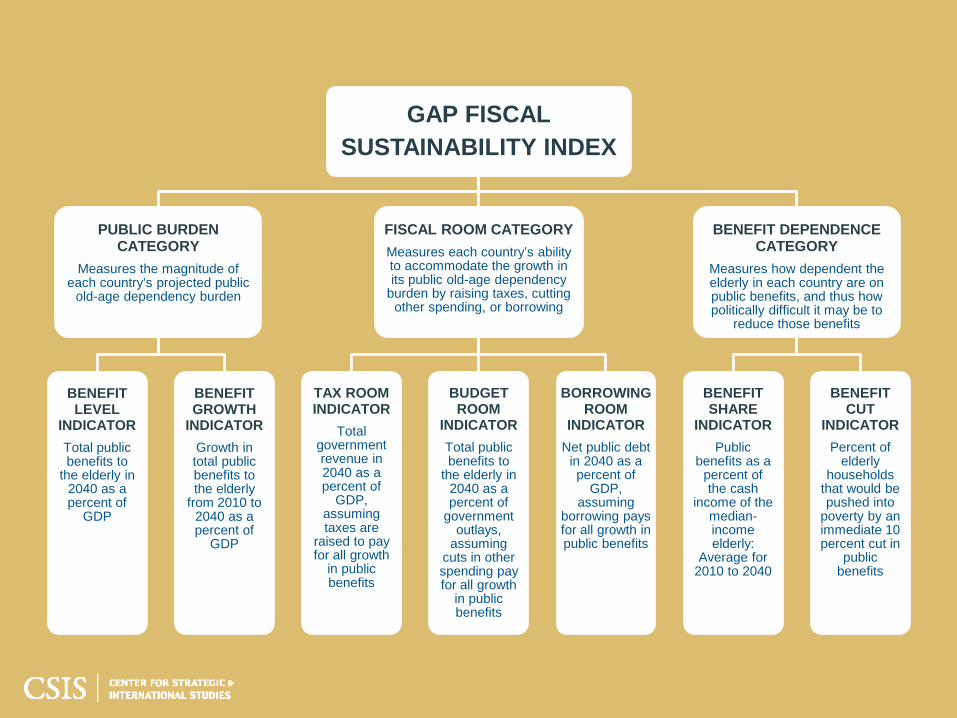
GAP FISCAL SUSTAINABILITY INDEX
PUBLIC BURDEN CATEGORY
Measures the magnitude of each country’s projected public
old-age dependency burden
BENEFIT LEVEL
INDICATOR Total public benefits to
the elderly in 2040 as a percent of
GDP
BENEFIT GROWTH
INDICATOR Growth in total public benefits to the elderly
from 2010 to 2040 as a percent of
GDP
FISCAL ROOM CATEGORY Measures each country’s ability to accommodate the growth in its public old-age dependency
burden by raising taxes, cutting other spending, or borrowing
TAX ROOM INDICATOR
Total government revenue in 2040 as a percent of
GDP, assuming taxes are
raised to pay for all growth
in public benefits
BUDGET ROOM
INDICATOR Total public benefits to
the elderly in 2040 as a percent of
government outlays,
assuming cuts in other spending pay for all growth
in public benefits
BORROWING ROOM
INDICATOR Net public debt
in 2040 as a percent of
GDP, assuming
borrowing pays for all growth in public benefits
BENEFIT DEPENDENCE CATEGORY
Measures how dependent the elderly in each country are on public benefits, and thus how politically difficult it may be to
reduce those benefits
BENEFIT SHARE
INDICATOR Public
benefits as a percent of the cash
income of the median-income elderly:
Average for 2010 to 2040
BENEFIT CUT
INDICATOR Percent of
elderly households
that would be pushed into
poverty by an immediate 10 percent cut in
public benefits
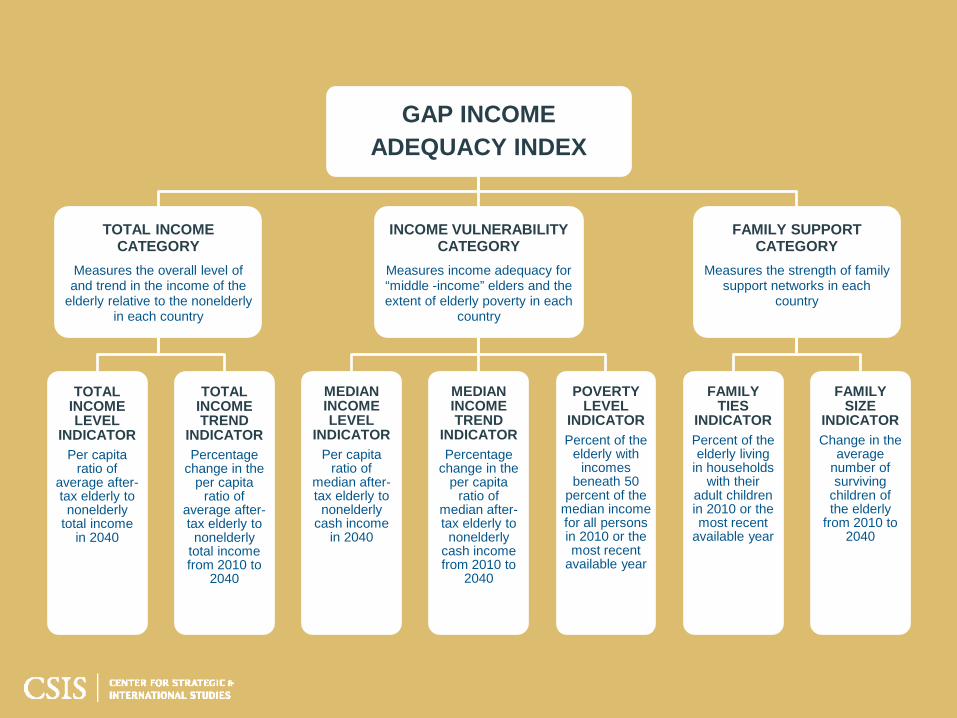
GAP INCOME ADEQUACY INDEX
TOTAL INCOME CATEGORY
Measures the overall level of and trend in the income of the
elderly relative to the nonelderly in each country
TOTAL INCOME LEVEL
INDICATOR Per capita
ratio of average after-tax elderly to nonelderly
total income in 2040
TOTAL INCOME TREND
INDICATOR Percentage
change in the per capita
ratio of average after-tax elderly to nonelderly
total income from 2010 to
2040
INCOME VULNERABILITY CATEGORY
Measures income adequacy for “middle -income” elders and the extent of elderly poverty in each
country
MEDIAN INCOME LEVEL
INDICATOR Per capita
ratio of median after-tax elderly to nonelderly
cash income in 2040
MEDIAN INCOME TREND
INDICATOR Percentage
change in the per capita
ratio of median after-tax elderly to nonelderly
cash income from 2010 to
2040
POVERTY LEVEL
INDICATOR Percent of the
elderly with incomes
beneath 50 percent of the
median income for all persons in 2010 or the most recent
available year
FAMILY SUPPORT CATEGORY
Measures the strength of family support networks in each
country
FAMILY TIES
INDICATOR Percent of the elderly living
in households with their
adult children in 2010 or the most recent
available year
FAMILY SIZE
INDICATOR Change in the
average number of surviving
children of the elderly
from 2010 to 2040
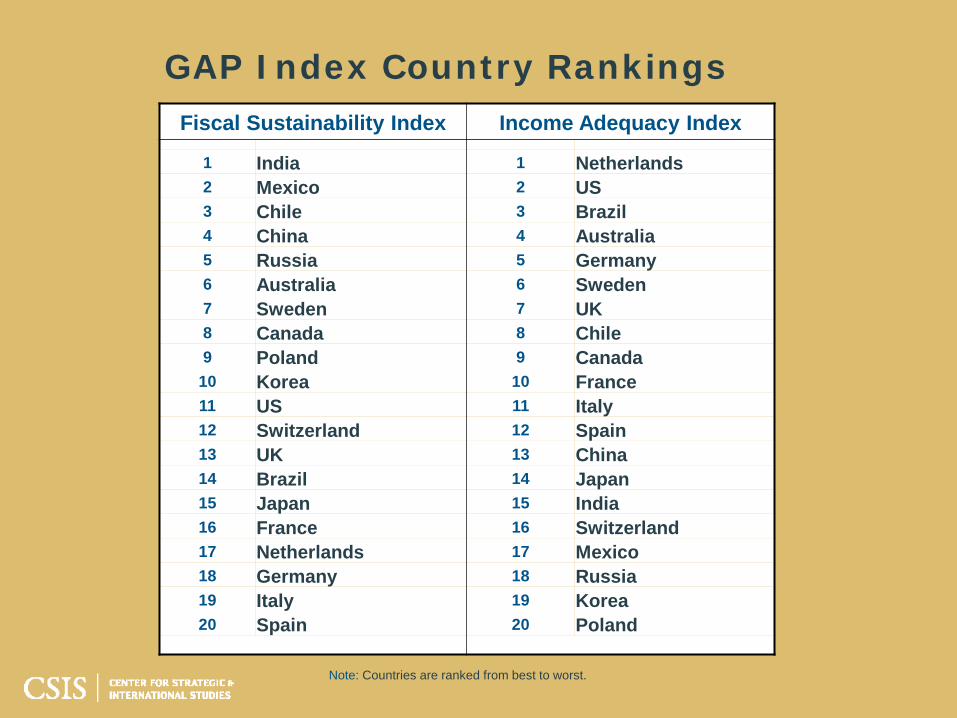
Fiscal Sustainability Index Income Adequacy Index
1 India 1 Netherlands 2 Mexico 2 US 3 Chile 3 Brazil 4 China 4 Australia 5 Russia 5 Germany 6 Australia 6 Sweden 7 Sweden 7 UK 8 Canada 8 Chile 9 Poland 9 Canada
10 Korea 10 France 11 US 11 Italy 12 Switzerland 12 Spain 13 UK 13 China 14 Brazil 14 Japan 15 Japan 15 India 16 France 16 Switzerland 17 Netherlands 17 Mexico 18 Germany 18 Russia 19 Italy 19 Korea 20 Spain 20 Poland
GAP Index Country Rankings
Note: Countries are ranked from best to worst.
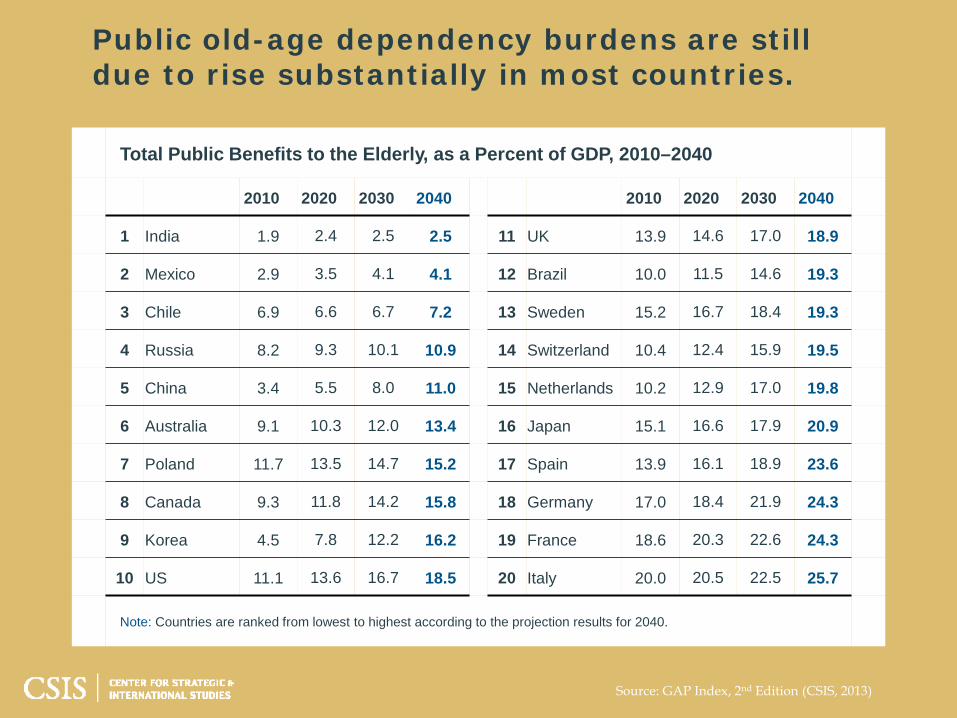
Total Public Benefits to the Elderly, as a Percent of GDP, 2010–2040
2010 2020 2030 2040 2010 2020 2030 2040
1 India 1.9 2.4 2.5 2.5 11 UK 13.9 14.6 17.0 18.9
2 Mexico 2.9 3.5 4.1 4.1 12 Brazil 10.0 11.5 14.6 19.3
3 Chile 6.9 6.6 6.7 7.2 13 Sweden 15.2 16.7 18.4 19.3
4 Russia 8.2 9.3 10.1 10.9 14 Switzerland 10.4 12.4 15.9 19.5
5 China 3.4 5.5 8.0 11.0 15 Netherlands 10.2 12.9 17.0 19.8
6 Australia 9.1 10.3 12.0 13.4 16 Japan 15.1 16.6 17.9 20.9
7 Poland 11.7 13.5 14.7 15.2 17 Spain 13.9 16.1 18.9 23.6
8 Canada 9.3 11.8 14.2 15.8 18 Germany 17.0 18.4 21.9 24.3
9 Korea 4.5 7.8 12.2 16.2 19 France 18.6 20.3 22.6 24.3
10 US 11.1 13.6 16.7 18.5 20 Italy 20.0 20.5 22.5 25.7
Note: Countries are ranked from lowest to highest according to the projection results for 2040.
Public old-age dependency burdens are still due to rise substantially in most countries.
Source: GAP Index, 2nd Edition (CSIS, 2013)
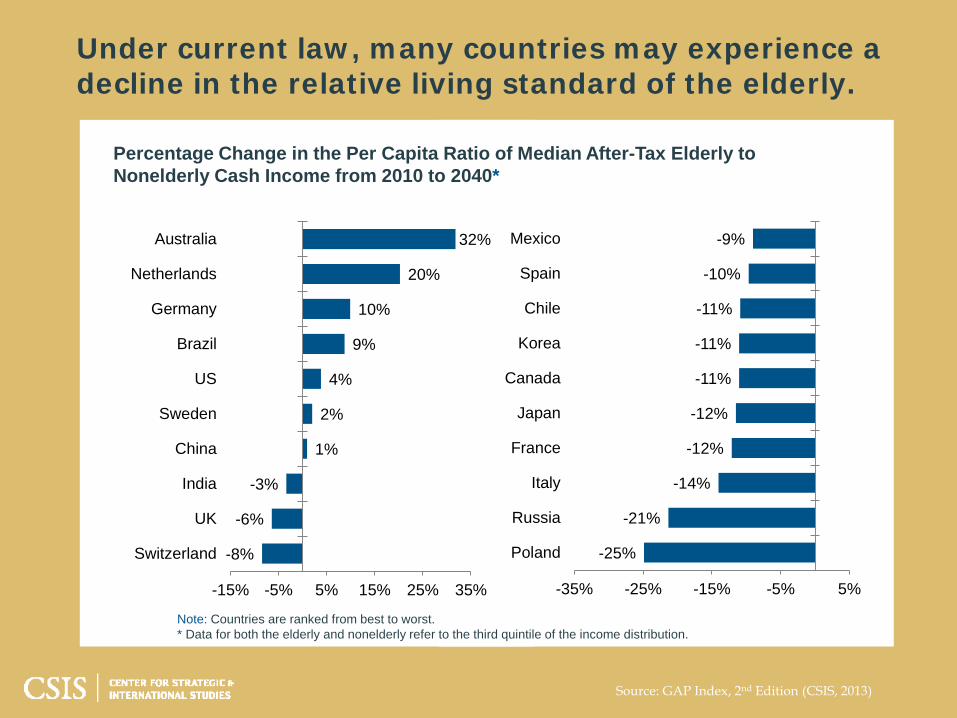
Percentage Change in the Per Capita Ratio of Median After-Tax Elderly to Nonelderly Cash Income from 2010 to 2040*
Note: Countries are ranked from best to worst. * Data for both the elderly and nonelderly refer to the third quintile of the income distribution.
Under current law, many countries may experience a decline in the relative living standard of the elderly.
-8%
-6%
-3%
1%
2%
4%
9%
10%
20%
32%
-15% -5% 5% 15% 25% 35%
Switzerland
UK
India
China
Sweden
US
Brazil
Germany
Netherlands
Australia
-25%
-21%
-14%
-12%
-12%
-11%
-11%
-11%
-10%
-9%
-35% -25% -15% -5% 5%
Poland
Russia
Italy
France
Japan
Canada
Korea
Chile
Spain
Mexico
Source: GAP Index, 2nd Edition (CSIS, 2013)
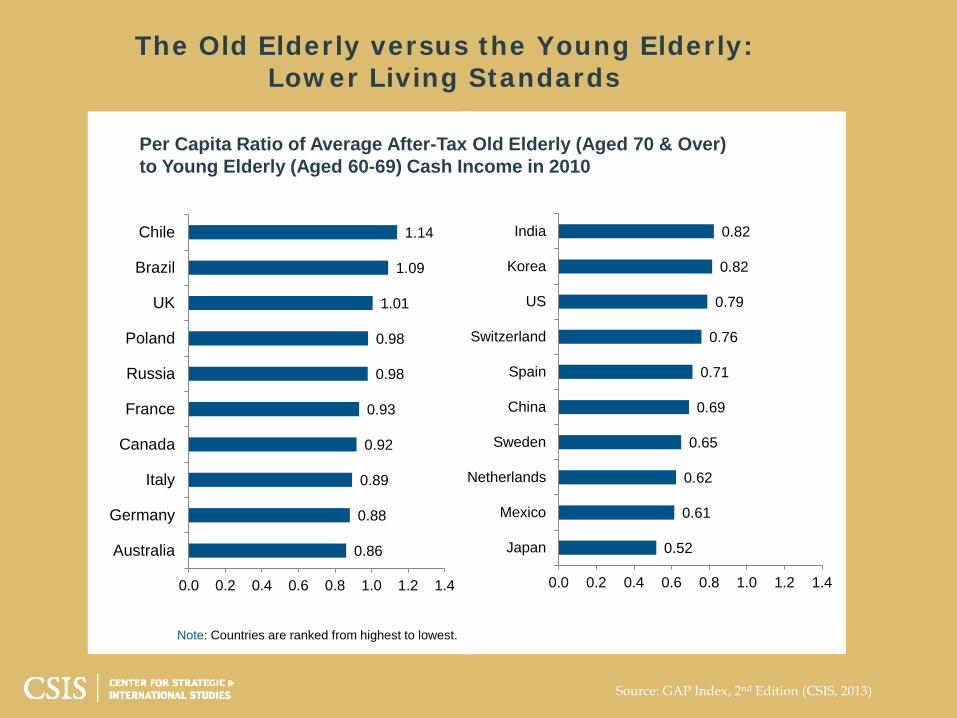
Per Capita Ratio of Average After-Tax Old Elderly (Aged 70 & Over) to Young Elderly (Aged 60-69) Cash Income in 2010
Note: Countries are ranked from highest to lowest.
0.86
0.88
0.89
0.92
0.93
0.98
0.98
1.01
1.09
1.14
0.0 0.2 0.4 0.6 0.8 1.0 1.2 1.4
Australia
Germany
Italy
Canada
France
Russia
Poland
UK
Brazil
Chile
0.52
0.61
0.62
0.65
0.69
0.71
0.76
0.79
0.82
0.82
0.0 0.2 0.4 0.6 0.8 1.0 1.2 1.4
Japan
Mexico
Netherlands
Sweden
China
Spain
Switzerland
US
Korea
India
The Old Elderly versus the Young Elderly: Lower Living Standards
Source: GAP Index, 2nd Edition (CSIS, 2013)
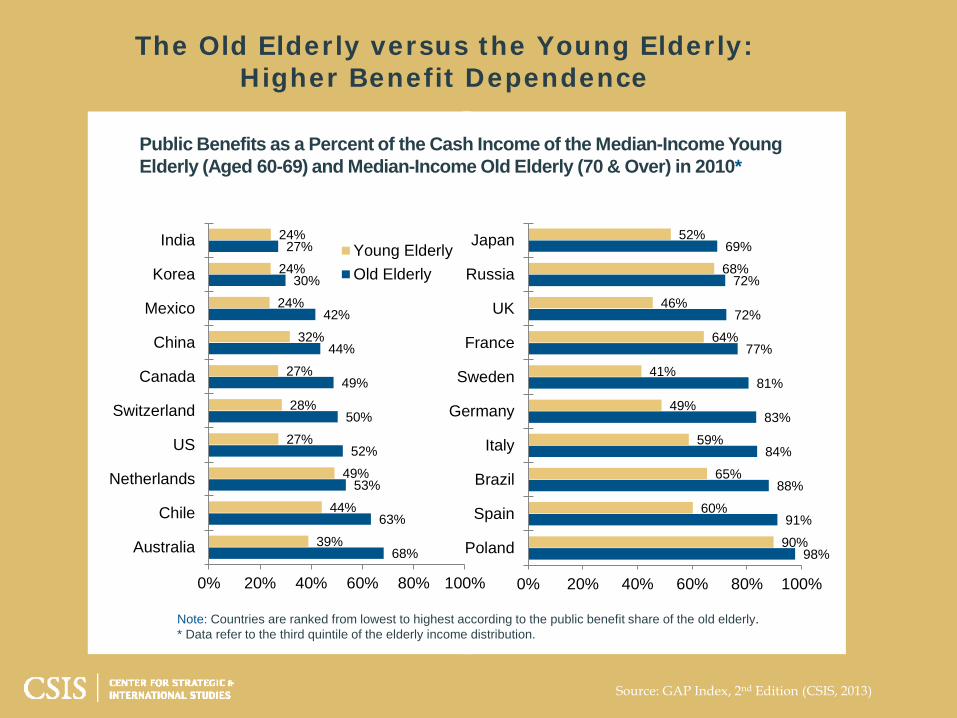
Public Benefits as a Percent of the Cash Income of the Median-Income Young Elderly (Aged 60-69) and Median-Income Old Elderly (70 & Over) in 2010*
Note: Countries are ranked from lowest to highest according to the public benefit share of the old elderly. * Data refer to the third quintile of the elderly income distribution.
68%
63%
53%
52%
50%
49%
44%
42%
30%
27%
39%
44%
49%
27%
28%
27%
32%
24%
24%
24%
0% 20% 40% 60% 80% 100%
Australia
Chile
Netherlands
US
Switzerland
Canada
China
Mexico
Korea
India Young ElderlyOld Elderly
98%
91%
88%
84%
83%
81%
77%
72%
72%
69%
90%
60%
65%
59%
49%
41%
64%
46%
68%
52%
0% 20% 40% 60% 80% 100%
Poland
Spain
Brazil
Italy
Germany
Sweden
France
UK
Russia
Japan
The Old Elderly versus the Young Elderly: Higher Benefit Dependence
Source: GAP Index, 2nd Edition (CSIS, 2013)