BALANCE SHEETS IN THE FINANCIAL RISIS - …macro.soc.uoc.gr/docs/Year/2013/papers/paper_1_173.pdfIn...
27
1 BANK BALANCE SHEETS IN THE FINANCIAL CRISIS D. Giannone, M. Lenza, H. Pill and L. Reichlin Abstract: This paper analyses time series data on the aggregate balance sheet of euro area monetary financial intermediaries (MFIs) from January 1999 to April 2011. In analysing bank behaviour following the failure of Lehman Brothers in September 2008, we find that, after taking into account business cycle conditions: (1) net financial flows among domestic banks have been substituted with central bank intermediation across the Eurosystem balance sheet to an unusual extent as a result of the introduction of the ECB’s non-standard monetary policy measures; (2) the observed decline of MFIs domestic assets and liabilities with respect to non-banks is in line with historical regularities, suggesting that this central bank intermediation helped to insulate financial flows to households and firms from the turmoil in interbank markets; and (3) interbank activity during the post-Lehman period is characterized by an unusual decline of transactions with non-residents (largely offshore banks), which offers motivation for increased central bank cooperation in supporting global liquidity conditions. Keywords: Bank balance sheets, non-standard monetary policy, central banks. JEL codes: E42, E58, F33, F42. * D. Giannone, Université Libre de Bruxelles – ECARES and CEPR, address: Avenue Roosevelt CP 114 Brussels, Belgium; e-mail: [email protected]. M. Lenza, European Central Bank, address: Kaiserstrasse 29, D-60311 Frankfurt am Main, Germany; email: [email protected]. H. Pill, Goldman Sachs, address: 120 Fleet Street, London EC2A 2BB, United Kingdom; e-mail: [email protected]. L. Reichlin, London Business School and CEPR, e-mail: [email protected].
-
Upload
trinhxuyen -
Category
Documents
-
view
213 -
download
0
Transcript of BALANCE SHEETS IN THE FINANCIAL RISIS - …macro.soc.uoc.gr/docs/Year/2013/papers/paper_1_173.pdfIn...

1
BANK BALANCE SHEETS IN THE FINANCIAL CRISIS
D. Giannone, M. Lenza, H. Pill and L. Reichlin
Abstract: This paper analyses time series data on the aggregate balance sheet of euro area monetary financial intermediaries (MFIs) from January 1999 to April 2011. In analysing bank behaviour following the failure of Lehman Brothers in September 2008, we find that, after taking into account business cycle conditions: (1) net financial flows among domestic banks have been substituted with central bank intermediation across the Eurosystem balance sheet to an unusual extent as a result of the introduction of the ECB’s non-standard monetary policy measures; (2) the observed decline of MFIs domestic assets and liabilities with respect to non-banks is in line with historical regularities, suggesting that this central bank intermediation helped to insulate financial flows to households and firms from the turmoil in interbank markets; and (3) interbank activity during the post-Lehman period is characterized by an unusual decline of transactions with non-residents (largely offshore banks), which offers motivation for increased central bank cooperation in supporting global liquidity conditions.
Keywords: Bank balance sheets, non-standard monetary policy, central banks.
JEL codes: E42, E58, F33, F42.
* D. Giannone, Université Libre de Bruxelles – ECARES and CEPR, address: Avenue Roosevelt CP 114 Brussels, Belgium; e-mail:
[email protected]. M. Lenza, European Central Bank, address: Kaiserstrasse 29, D-60311 Frankfurt am Main, Germany; email: [email protected]. H. Pill, Goldman Sachs, address: 120 Fleet Street, London EC2A 2BB, United Kingdom; e-mail: [email protected]. L. Reichlin, London Business School and CEPR, e-mail: [email protected].

2
1. Introduction1
The ongoing financial crisis has refocused the attention of macroeconomists on bank behaviour.
Banks played a central role in the creation and propagation of the financial tensions associated with
the Great Recession of 2008-10. This is especially true in the euro area, where banks continue to play
a predominant role in the intermediation of financial flows from savers to investors.2
In previous work (starting with Lenza et al., 2009), we documented the evolution of European bank
balance sheets – as reflected in euro area money and credit flows – during the financial crisis, with a
focus on the period following the failure of Lehman Brothers in September 2008. In particular, we
explored the impact of the non-standard policy measures introduced by the ECB on the evolution of
key macroeconomic and financial aggregates. On the basis of this analysis, we concluded that these
policy measures played an important role in stabilising euro area financial flows and the wider
macroeconomy, largely by substituting financial markets that had become dysfunctional on account
of information problems with intermediation across the central bank balance sheet.
In this paper we extend and deepen that analysis in two important and interrelated directions.
First, we strive to provide richer and more direct evidence on the nature and impact of substitution
between private interbank activity and central bank intermediation. Such substitution lies at the heart
of our explanation of how the ECB’s non-standard monetary policy measures have worked.3 While
this account of the transmission of the ECB’s actions has become commonplace over the past few
years, empirical analysis offering direct evidence of such substitution is scarce. In our own previous
1 This paper was prepared for the CEPR conference ‘Macroeconomics and financial intermediation: Directions since the crisis’ held in Brussels on 9-10 December 2011. Thanks are due to conference participants and many current and former colleagues at the ECB for helpful comments. The views expressed are our own and should not be attributed to the European Central Bank or to Goldman Sachs.
2 To illustrate, in the euro area about 75% of the external financing of the non-financial corporate sector comes from banks, compared with an equivalent figure of only 25% in the United States.
3 See Trichet (2009) for the ECB’s official accounts of the design and impact of its non-standard measures.

3
work (Giannone et al., 2011a,b; cf. Fahr, et al., 2012; Peersman, 2011), we have largely explored the
macro impact of the non-standard measures in a relatively reduced form manner, while abstracting
from the specific channels of transmission. In this paper, we aim at augmenting this analysis by
offering a more structural empirical account of the transmission process.
Second, building on the analysis of interbank data derived from aggregate euro area bank balance
sheet in Giannone et al. (2012), we analyse behaviour in the interbank market during the post-
Lehman period in a more disaggregated manner. In particular, we distinguish between intra-euro area
bank flows (i.e. transactions between banks resident in the euro area) and transactions with the rest
of the world (to which we argue financial institutions outside the euro area are the main
counterparties). Aside from adding to our understanding of the propagation mechanisms, this
distinction may be important from a policy perspective. In particular, it offers some insight into the
importance of cross-border liquidity provision – such as that provided via inter-central bank foreign
exchange swaps – during the financial crisis. Fahri et al (2011) have argued that such facilities should
become permanent features of the international financial architecture.
To anticipate our results, we provide (what we believe to be) the first direct econometric evidence of
substitution of central bank intermediation for interbank activity owing to the ECB’s non-standard
policy actions. This substitution is substantial, but not one-for-one. We explain this feature of the
data on the basis that the ECB needs to intermediate the necessary net interbank transactions, but not
the much larger set of gross transactions that characterised the euro money market ahead of the
financial crisis. Moreover, we show that transactions with non-residents (we argue, largely with non-
resident financial institutions) have fallen in both a statistically and economically more significant
manner than other interbank transactions. This feature of how the wholesale money market
contracted post-Lehman lends credence to those arguing for greater central bank cooperation in
crisis management.

4
The remainder of the paper is organised as follows. In Section 2 we provide an analytical account of
financial market intermediation focusing on the interbank market. In Sections 3 and 4 we describe
the data and our econometric approach, before presenting and discussing our results in Section 5.
The final section concludes by outlining some of the policy implications of our findings.
2. Analytical framework
Traditionally, banks have served the function of intermediating financial flows from savers to
investors. With financial innovation, intermediation has become more convoluted, a process that
accelerated as the pace of bank credit expansion picked up in 2004-07.
For example, using U.S. flow of funds data Adrian and Shin (2010a,b) demonstrate how intra-
financial sector leverage built up over that period. Focusing on the balance sheets of U.S.
broker/dealers (investment banks), they show how the low level of short-term interest rates and
relatively steep yield curve, in an environment where volatility was perceived as low, encouraged
banks to lend to one another so as to extract some of the ‘carry’ available along the yield curve. Much
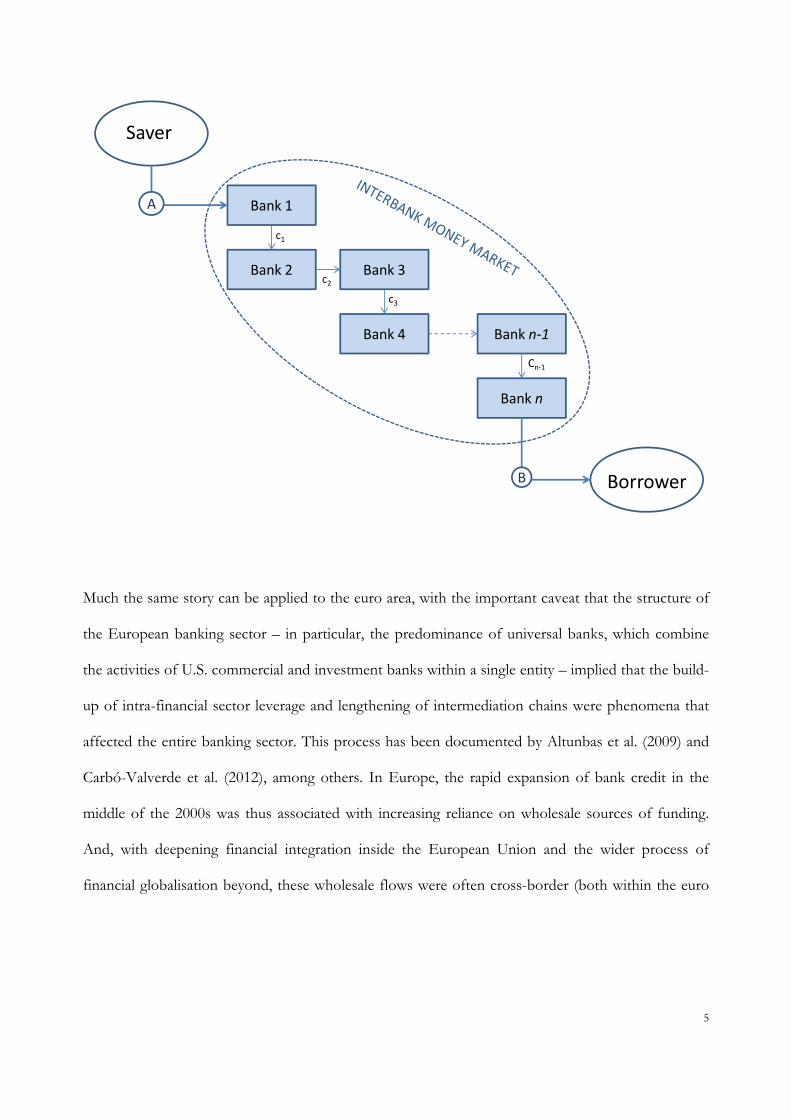
of this financing took the form of repos of securitised assets.4 Adrian and Shin demonstrate how the
build-up of intra-banking sector leverage was associated with the creation of longer intermediation
chains, i.e. the flow of resources from non-bank saver to non-bank borrower passed through an
increasing number of banks (for a stylised representation, see Figure 1).
Figure 1: Stylised representation of interbank money market
4 See Gorton and Metrick (2009).
5
Saver
Borrower
Bank 1
Bank 2 Bank 3
Bank 4 Bank n‐1
Bank n
A
B
c1
c2
c3
Cn‐1
Much the same story can be applied to the euro area, with the important caveat that the structure of
the European banking sector – in particular, the predominance of universal banks, which combine
the activities of U.S. commercial and investment banks within a single entity – implied that the build-
up of intra-financial sector leverage and lengthening of intermediation chains were phenomena that
affected the entire banking sector. This process has been documented by Altunbas et al. (2009) and
Carbó-Valverde et al. (2012), among others. In Europe, the rapid expansion of bank credit in the
middle of the 2000s was thus associated with increasing reliance on wholesale sources of funding.
And, with deepening financial integration inside the European Union and the wider process of
financial globalisation beyond, these wholesale flows were often cross-border (both within the euro

6
area and between the euro area and other jurisdictions, notably London given its status as an
international financial centre).5
Bank funding has thus become less stable in the face of financial and real shocks. Retail deposit
holders (households and non-financial corporations) could be relied upon to maintain a steady level
of funding to support the financing of bank loans through the business cycle. But wholesale funding
from other banks, from the rest of the financial sector (notably shadow banks) and from overseas
tended to be more flighty, imparting a pro-cyclical bias to the expansion of financial intermediation.6
Moreover, the accumulation of intra-financial sector leverage created systemic vulnerability: if one
institution chooses to shrink its balance sheet, the resulting withdrawal of wholesale funding puts
pressure on others to do likewise (and so on). A self-sustaining spiral of forced deleveraging could
ensue (Brunnermeier and Pedersen, 2009).
In order to develop an insight into the behaviour of intra-financial flows during the financial crisis,
we exploit the aggregate bank balance sheet data for the euro area. Traditional monetary and credit
aggregates are derived from the consolidated bank balance sheet.7 The consolidated data net out intra-
MFI positions: in terms of Figure 1, they capture financial flows from the private sector into the
banking system (A) and out again to the private sector (B) (i.e., traditional bank deposits and loans
respectively). But the consolidated data exclude all the intervening transactions among banks (c1 …
cn).8 By contrast, the aggregated bank balance sheet does not net out these interbank transactions:
rather the flow of loans from one bank to another (c1 … cn) are summed and included on the asset
side, while the counterpart deposits (not shown in Figure 1) are included on the liability side. Should
5 See Forster et al. (2011). 6 See Shin and Shin (2011). 7 Strictly we use the balance sheet of euro area monetary financial institutions (MFIs), The MFI sector consists of euro
area credit institutions (essentially banks), plus money market funds and some parts of the government sector (e.g. post office banks). For the purposes of this article, we use ‘banks’ as a synonym for MFIs.
8 By construction, interbank positions should consolidate to zero: a short-term loan from bank X to bank Y is equivalent to a deposit placed by bank Y at bank X.

7
the interbank market seize up (for example, owing to concerns about counterparty credit risk and the
resulting adverse selection, as modelled by Heider et al., 2009), the central bank can step in to
intermediate the underlying flow of financial resources from savers to borrowers across its own
balance sheet (see Figure 2). This is our characterisation of the ECB’s non-standard measures. An
immediate implication of facilitating financial transactions in this way has been a substantial
expansion of the ECB balance sheet.
Figure 2: Stylised representation of central bank intermediation
Saver
Borrower
Bank 1
Bank n
A
B
ECBBALANCE SHEET
recourse to deposit facility
borrowing at repo operations
In essence, the non-standard policy measures represent an attempt to use the central bank as a de facto
central counterparty for wholesale financial transactions. By so doing, the ECB replaces the frozen
private interbank market, ensures that the flow of resources from private sector savers to borrowers
is maintained, and thereby sustains the necessary flow of credit to the real economy. Through these
means, the central bank is able to ensure that disruptions to real economic activity caused by a

8
‘sudden stop’ (Calvo and Reinhart, 2000; Caballero, 2009) in financial flows are minimised. In the
course of intermediating these flows, the central bank’s balance sheet will expand, as recourse to its
refinancing facilities by those banks making the loans is matched by build-up of reserve holdings by
other banks receiving savings deposits.
Shin and Shin (2011) extend the analysis of Adrian and Shin by considering the role played by
offshore money markets in the financing of ‘overborrowing’ episodes in emerging markets
(McKinnon and Pill, 1997, 1998). A large literature is devoted to the analysis of these overborrowing
phenomena: a key stylised fact is that domestic credit expansion increases rapidly in an initial ‘boom’
phase, typically financed by large capital inflows from abroad. In such circumstances – which reflect
experience prior to the Asian financial crisis of the late 1990s or the Mexican tequila crisis earlier in
that decade – when that external financing seizes up, the domestic financial sector collapses,
triggering a ‘bust’ in the real economy.
While the euro area has shown a balanced current account in recent years (and certainly during the
financial crisis) and is thus not dependent on net capital inflows from abroad, the globalisation of
financial markets over recent decades has increased the gross flows of capital between the euro area
and the rest of the world. Unfortunately, our data set does not distinguish between non-resident
banks and non-banks in capturing euro area banks’ transactions with the rest of the world. But we
believe that a large part of these transactions with non-residents reflect transactions with offshore
banks.9 In particular, London’s role as an important financial centre for the euro area would lead to
such an outcome. This conjecture is supported by the close correlation (in both levels and changes)
9 The data show that 70% of total non-resident deposits with euro area banks are deposits by non-resident banks. Of the remaining, non-resident non-banks account for around 25% and governments the remainder. Non-resident banks’ deposits show a protracted decline (from EUR 3150bn to EUR 2300bn) post-Lehman, whereas non-resident non-banks’ deposits revert to trend after an initial post-Lehman fall. These data therefore support our conjecture that the evolution of non-resident flows with the euro area banks in the period of focus in our study is driven strongly by interbank transactions and therefore falls naturally inot our wider analytical framework.

9
between non-resident assets and liabilities of the euro area banks: if London acts as a conduit for
interbank flows from one euro area bank to another, the non-resident assets and liabilities of euro
area banks in aggregate should move closely together. As captured in a stylised manner in Figure 3
(see next page), non-resident transactions complicate the potential role of central bank
intermediation in substituting for interbank transactions. This will be especially important if euro area
bank transactions with non-residents are denominated in currencies other than the euro (see Section
5 of this paper for some evidence on this point). While (at least in principle) the ECB can expand the
euro-denominated portion of its balance sheet without limit so as to substitute central bank
intermediation for bank-to-bank transactions should markets freeze, this is not the case for
transactions in other currencies. The ECB is the ultimate creator of euro liquidity: but it cannot
create dollars or sterling as to providing funding in those currencies to euro area banks should their
market sources of foreign currency financing dry up. This is where central bank cooperation and the
provision of liquidity between central banks in the form of foreign exchange swaps may prove
important. If the Federal Reserve is prepared to supply U.S. dollars to the ECB in large (or even
potentially unlimited) amounts via such FX swaps and the ECB is able to distribute this liquidity to
euro area banks, then the ECB can also intermediate non-resident and/or foreign currency
denominated transactions should the relevant private markets become dysfunctional. This appears to
have proved an important element of the collective central bank response to the financial crisis,
especially in late 2008 and (for euro area banks in particular) in November 2011.
Figure 3: The role of non-resident transactions

10
Saver
Borrower
Bank 1
Bank 2 Bank 3
Bank 4 Bank n‐1
Bank n
INTERBANK MONEY MARKET
A
B
c1
Non‐resident Bank 2
Non‐resident Bank 1
Border
Based on the discussion in the section, two key empirical questions emerge. First, can we find
evidence of substitution from market intermediation into central bank intermediation of interbank
transactions during the financial crisis, which would support our explanation of how the ECB’s non-
standard measures worked? And second, to what extent is the fall in interbank activity concentrated
in transactions with non-resident banks (and in foreign currency), which – other things equal – would
make the ECB’s interventions less effective and require a more cooperative strategy from the wider
international central bank community to support liquidity provision across a range of internationally-
relevant currencies? These are the issues that we address in the empirical analysis that follows.
3. Data and design of the empirical analysis

11
As discussed, our analysis exploits data on the aggregate balance sheet of euro area main financial
institutions (MFIs). We combine these data with macroeconomic indicators for the euro area and
some US indicators to capture the international business cycle. In total we have twenty-five variables
(see Table 1). For the euro area macroeconomy, we include industrial production and
unemployment, prices for goods and assets and interest rates at different maturities and, for the US,
industrial production and the short term interest rate. Balance sheet variables are aggregated in such a
way as to be able to distinguish between assets and liabilities to domestic and to non-resident
counterparties, and between transactions vis-a-vis other banks and central banks (the Eurosystem).
The resident sector includes firms, households, government, other financial institutions (OFI),
insurance companies and pension funds (ICPF) and money market funds (MMF), whereas we do not
have this breakdown for the non-residents. We also include bank equity and capital.
Table 1: Description of the database
Variables Transformations
Industrial production Log-levels
Consumer prices (HICP) Log-levels
Unemployment rate Levels
Producer prices Log-levels
Industrial production, US Log-levels

12
Consumer Prices, US Log-levels
Federal funds rate, US Levels
Euribor 3 months Levels
2 years bond rates Levels
5 years bond rates Levels
10 years bond rates Levels
Stock prices, DJ Eurostoxx Log-levels
Stock prices, banks Log-levels
Credit to residents Log-levels
Credit to non-residents Log-levels
Interbank credit, residents Log-levels
Domestic equity Log-levels
Non-residents equity Log-levels
Other assets Log-levels
Liabilities to residents Log-levels
Liabilities to non-residents Log-levels
Interbank liabilities, residents Log-levels
Liabilites vs Eurosystem Log-levels
Remaining liabilities Log-levels
Capital Log-levels
Note: The resident sector is the sum of disaggreagated data on firms, households, government, other financial institutions (OFI), insurance companies and pension funds (ICPF), money market funds (MMF). This disaggregation is not available for the non-residents sector, which includes both the interbank and the non-bank sectors. In terms of instruments, credit to residents, non-residents and interbank credit is obtained as the sum of loans and debt securities. Liabilities to residents and non-residents are obtained as the sum of deposits and debt securities.
The sample covers the period from January 1999 to April 2011 and thus includes two cycles: the
2008-2009 “Great Recession”; and the slowdown at the start of the millennium, which was milder
and not associated with a financial crisis. The Great Recession has been dated in December 2007 for
the US and in the first quarter of 2008 for the euro area (see the NBER and CEPR chronologies
respectively). The recession thus starts almost a year before the banking crisis triggered by the collapse
of Lehman Brothers in September 2008. After Lehman’s failure, the global recession deepened and
only ended (according to the dating mentioned above) in June 2009. The Great Recession therefore
ranks as the longest and deepest economic downturn since the 1930s.
Financial and macroeconomic developments during this period have interacted in a complex and
dynamic manner. The causal connections between them are unclear. In particular, it difficult to

13
ascertain whether the shrinkage of banks’ balance sheets during the crisis should be attributed to: (1)
the severity of the slowdown; or (2) to some unusual adjustment in the size and composition of
financial intermediation. In the U.S., Chari et al. (2008) take the former view: they claim that the
dynamics of financial indicators can be explained on the basis of business cycle developments and
can be considered “normal’’ once those are taken into account. But most other accounts (e.g. Gorton
and Metrick, 2011) adopt the latter explanation, attributing a leading role to financial factors.
In our analysis we do not aim at establishing causality between financial and real factors. We have a
more modest but nonetheless important goal: to identify changes in the relationship between
financial intermediation and the rest of the euro area economy. Features of this relationship that have
changed during the crisis may potentially be related to a lasting structural change, rather than just to
temporary or cyclical developments. Establishing the stylised facts of this episode is an important
first step in coming to more structural economic explanations of events.
We assess the stability of the relationship between financial intermediation and the rest of the
economy by means of a counterfactual experiment. First, we estimate a dynamic model of the joint
behaviour of bank balance sheet and macroeconomic variables in the pre-crisis data (until August
2008). Second, we then forecast the bank balance sheet variables, conditional on: (1) the economic
relationships prevailing before the Lehman collapse (reflected in the model parameters estimated
using the data until August 2008); (2) the pre-crisis history of all variables; and (3) the observed
outcomes of the subset of variables representing the macroeconomic environment until the end of
the sample in April 2011 (i.e. using as conditioning assumptions the first eight variables in Table 1;
these capture real economic conditions, short term interest rates and consumer and production price
inflation in both the euro area and the U.S.). Finally, we compare the observed path of key bank
balance sheet variables with the simulated distribution of their counterfactual paths. This amounts to

14
using the pre-crisis part of the sample as a “benchmark” against which we analyze more recent
behaviour during the financial crisis.
If the observed path of bank balance sheet variables since Lehman’s failure lies in the tails of the
forecast distributions (or even out of the distribution), we can conclude that developments in the
banking sector during the financial crisis are difficult to reconcile with those in the rest of the
economy. Potentially, this may be due to structural changes in the financial sector brought about by
the crisis. On the contrary, the finding of no significant change is evidence that, although larger in
size, the shocks that have affected the economy in the last four years are similar in nature to those
that have driven the economy in the preceding ten years. Moreover, the transmission of these shocks
has not changed substantially. In other words, if the observed and simulated paths are similar, we
interpret this as evidence that the relative importance of real and financial shocks has remained the
same through the financial crisis, at least once one has conditioned on the introduction of non-
standard monetary policy measures by the ECB, which have served to substitute interbank
transactions with central bank intermediation.
Notice also that, by conditioning on real economy variables, we ensure that we capture the size of
the shocks that would have caused the recent recession if it were due to the shocks that have typically
generated recessions in the euro area. For example, if credit shocks were traditionally associated to a
recession, we would be implicitly conditioning on credit shocks developments from August 2007
onward in order to assess whether such variables have behaved in line with the historical regularities.
4. Econometric Model
Using the data set described in the previous section, we estimate an empirical model of the euro area
economy. Let Xt be the vector including the n variables defined in Table 1 (all variables are in log-

15
levels, except for variables expressed in rates or with negative levels that are in levels). We estimate a
VAR model with p (=13) lags:
Xt = A0+ A1Xt-1 + A2Xt-2 +…+ ApXt-p +et
where et is a normally distributed multivariate white noise with covariance matrix Σ.
The large dimension (n=25 and p=13) of our VAR model implies that we face an issue of overfitting
due to the large number of parameters (“curse of dimensionality”). We address this issue by
shrinking the model's coefficients toward those of the naïve and parsimonious random walk with
drift model, Xit = δi+Xi,t-1+eit. De Mol et al. (2008) and Banbura et al. (2010) have shown that this
approach reduces estimation uncertainty without introducing substantial bias. This is achieved thanks
to the tendency for macro time series to co-move over the business cycle, which creates scope for
the data to point “massively” in the same direction against a naïve prior model that does not allow
for any dynamic interaction. The resulting model offers a parsimonious but reliable estimate of the
complex dynamic interactions among the macro, monetary and financial variables included in the
data set.
More in details, we use a Normal-Inverted Wishart prior centred on a random walk model.
For Σ, the covariance matrix of the residuals, we use an inverted Wishart with scale parameter given
by a diagonal matrix Ψ and d=n+2 degrees of freedom. This is the minimum number of degrees of
freedom that guarantees the existence of the prior mean of Σ, which is equal to Ψ/(d−n−1)= Ψ.
For the constant A0 term we use a flat prior. For the autoregressive coefficients (A1 … Ap), we use
the Minnesota and the sum of coefficients priors originally proposed by Litterman (1980) and Doan
et al. (1984) respectively. For what concerns the Minnesota prior, conditional on the covariance
matrix of the residuals, the prior distribution of the autoregressive coefficients is normal with the
following means and variances:

16
- E[(A1)] = In while E[(A2)] = … = E[(Ap)] = 0n,n
- Cov[(As)ij,(Ar)hm] = λ2 Σ ih/( s2 Ψ ) if m=j and r=s, zero otherwise.
Notice that the variance of this prior distributions decays with the lag, and that coefficients
associated with the same variables and lags in different equations are allowed to be correlated. The
factor 1/s2 is the rate at which the prior variance decreases with increasing lag length and Σij/Ψ ii
accounts for the different scale and variability of the data. Finally, the key hyperparameter is λ, which
controls the scale of all the prior variances and covariances, and effectively determines the overall
tightness of this prior. For λ = 0 the posterior equals the prior and the data do not influence the
estimates. If λ → ∞, on the other hand, posterior expectations coincide with the Ordinary Least
Squares (OLS) estimates.
For what concerns the sum of coefficients priors, the additional one we impose on the autoregressive
coefficients, it is the same as performing “inexact differencing”: i.e., it is a simple modification of the
Minnesota prior involving linear combinations of the VAR coefficients. More precisely, rewrite the
VAR equation in error correction form:
ΔXt = A0−(In −A1 −···−Ap)Yt−1 +B1ΔYt−1 +···+Bp−1ΔYt−p+1 +et.
A VAR in first differences implies the restriction (In − A1 − · · · − Ap) = 0. We follow Doan et al.
(1984) and set a prior that shrinks Π = (In − A1 − · · · − Ap) towards zero. This can be understood as
“inexact differencing” and in the literature it is usually implemented by adding dummy observations.
The tightness of this additional prior is controlled by the hyperparameter μ. As μ goes to infinity the
prior becomes diffuse while, as μ goes to 0, we approach the case of exact differencing which implies
the presence of a unit root in each equation.
Summing up, the setting of these priors depends on the hyperparameters λ, μ and ψ, which reflect
the informativeness of the prior distribution for the model’s coefficients. These parameters have

17
been usually set on the basis of subjective considerations or rules of thumb. We instead follow the
theoretically grounded approach proposed by Giannone et al. (2010). This involves treating the
coefficients of the prior as additional parameters, in the spirit of hierarchical modelling. As hyper
priors we use proper but almost flat distributions.10 In this set up, the marginal likelihood evaluated at
the posterior mode of the hyperparameters is close to its maximum.
The counterfactual exercise is performed as follows. We simulate the model’s parameters from their
full posterior density, hence accounting for the estimation uncertainty of the hyperparameters. This
approach is implemented using a simple Markov chain Monte Carlo algorithm. In particular, we use a
Metropolis step to draw the low dimensional vector of hyperparameters. Conditional on a value of
the hyperparameters, the VAR coefficients can then be drawn from their posterior, which is Normal-
Inverse-Wishart (see Giannone et al., 2010, for the details of this procedure). Since we are interested
in conditioning on the economic relationships prevailing before the Lehman collapse, the posterior is
computed using the data until August 2008.
For any given draw of the model’s parameters from their posterior density, the draws from the
counterfactual exercise are computed as conditional forecasts in which the conditioning information
is given by: (1) the pre-crisis history of all variables in the model; (2) the macroeconomic
developments observed during the crisis; and (3) the observed outcomes of the subset of variables
representing the macroeconomic environment until the end of the sample in April 2011.
The conditional forecasts are obtained using the algorithm developed in Banbura et al. (2012). The
procedure exploits the fact that the Vector Autoregressive model can be cast in a state-space form.
Hence, the conditional forecasts can be computed using Kalman filtering techniques and the
10 As hyperpriors for λ, μ we choose Gamma densities with mode equal to 0.2, 1 and standard deviations equal to 0.4, 1 respectively. Our prior on ψ, i.e. the prior mean of the main diagonal of Σ, is an Inverse- Gamma with scale and shape equal to (0.02)2.

18
counterfactual simulations can be drawn using the simulation smoother of Carter and Kohn (1994).
Finally, all our counterfactual simulations respect the budget constraint for which assets must be
(approximately) equal to liabilities. This is done by retaining only those draws (amongst a total of
10000) that (approximately) respect the budget constraint.
5. Results and discussion
In Table 2 below we describe the bank balance sheet items. We focus on a few important dates in
our sample, i.e. we provide a picture of our stylised bank balance sheet in January 1999, which is the
beginning of our sample; in January of the two crisis years, 2008 and 2009; and in January of the two
years of the recovery, 2010 and 2011.11 The table also reports (for 2009, 2010 and 2011) the 2.5 %
and 97.5 % quantiles of the counterfactual forecast distributions, as a measure of the width of the
distributions. Any developments outside those quantiles, is identified as being ‘unlikely’ given
historical regularities and, hence, it could reflect relevant changes in the features of financial
intermediation.
Table 2: Bank balance sheet items and key ratios
Variables 1999 2008 2009 2010 2011
Credit to residents 7.36 12.47 13.37 13.01 - 13.63
13.37 13.26 -15.01
13.76 13.97 - 17.29
Credit to non-Residents 1.57 4.83 4.53 4.80 - 5.99
4.20 4.96 - 8.01
4.09 5.00 - 11.24
Interbank credit, residents 3.96 7.43 8.11 7.2 - 8.6
7.81 7.03 - 9.79
7.49 7.12 - 12.00
Equity, residents 0.56 1.21 1.18 1.08 - 1.41
1.21 0.95 - 1.73
1.24 0.89 - 2.31
Equity, non-residents 0.08 0.32 0.28 0.23 - 0.43
0.28 0.15 - 0.64
0.30 0.09 - 0.90
Other assets 1.83 3.63 4.63 2.88 - 4.84
3.86 1.89 - 5.14
3.67 1.54 - 7.67
Liabilities to residents 7.77 13.59 14.50 14.15 -14.85
14.83 14.68 - 16.56
15.15 15.37 - 19.06
11 Notice that for 2011 we do not include months beyond April, implying that we exclude the deterioration of financial conditions in the euro area associated with the intensification of the sovereign debt crisis from the middle of that year.

19
Liabilities to non-residents 1.78 5.01 4.69 4.92 - 5.96
4.30 4.79 - 7.09
4.28 4.85 - 9.46
Interbank Liabilities, residents 3.85 7.13 7.70 6.95 - 8.32
7.31 6.81 - 9.66
7.02 6.86 - 12.19
Liabilities to Eurosystem 0.19 0.47 0.78 0.22 - 0.73
0.77 0.09 - 1.17
0.68 0.04 - 2.68
Remaining Liabilities 2.13 3.83 4.52 3.32 - 5.18
3.90 2.56 - 5.55
3.82 2.52 - 8.28
Capital 0.76 1.61 1.77 1.66 - 1.84
1.92 1.67 - 2.13
2.04 1.67 - 2.51
Residents/non residents Liabilities 4.36 2.71 3.09 2.43 - 2.94
3.45 2.25 - 3.26
3.54 1.87 - 3.49
Eurosystem/interbank liabilities, % 4.84 6.58 10.15 2.89 - 9.53
10.52 1.11 - 15.31
9.64 0.40 - 30.82
Note: Thousands of euro billions. The first six items are from the asset sides of banks balance sheets, while items seven to twelve reflect the liabilities side. The last two variables are the ratio of liabilities to resident relative to non-resident counterparts and (100 times) the ratio of liabilities to the eurosystem relative to liabilities to the domestic interbank sector. Red (blue) bold indicates figures below (above) the 2.5 (97.5)% quantile of the forecast distribution.
The key facts revealed by the table can be summarized as follows. Following the onset of financial
crisis, two data features emerge in 2009 which were not expected given macroeconomic conditions: a
drop in credit and liabilities to the non-resident sector; and an increase in Eurosystem intermediation.
The former show a persistent decline, remaining well below the 2.5% quantile of the forecast
distributions until the end of the sample, while the latter is higher than the 97.5% quantile of the
distribution in 2009, but subsequently tends to go closer to the central tendency of the distribution.
Interestingly, assets and liabilities to residents decline “significantly” only in 2011, with a two years
delay after the Lehman-inspired intensification of the financial crisis.12 Interbank credit and liabilities
to residents remain inside the quantiles we report; however they show a marked decline and lie close
to the lower boundaries of the forecast distributions. Notice, also, that the distributions of interbank
variables tend to encompass wide forecast ranges, which is a possible indication that the association
between interbank intermediation and the macro-economy is relatively weak and that the increasing
size of the market can be seen, at least partly, as an exogenous development in financial innovation.
Two key ratios may help to shed further light on the two facts just discussed: the ratio of liabilities to
residents over those to non-residents and the ratio of liabilities to the Eurosystem over domestic
12 On this point see also the evidence by Giannone et al. (2012), based on a different data source and model.

20
interbank liabilities. Below we plot the time series of these ratios since 1999 and, since September
2008, also the distribution of the forecasts. For the sake of comparability with Table 2, the lower
boundaries of the forecast distributions refer to the 2.5 and 97.5% quantiles. Figure 4 shows the ratio
of residents to non-residents liabilities.
Figure 4: Ratio of liabilities to residents over liabilities of non-residents
1999 2001 2003 2005 2007 2009 2011
2.5
3
3.5
4
4.5
5
Note: The blue line describes the observed development in the ratio of liabilities to residents over liabilities to non-residents from January 1999 to April 2011. The figure reports also the distribution of the conditional forecasts (until the 2.5 and 97.5% quantiles) of the ratio.
Since 1999 we have seen a decline in the relative contribution of residents’ funding of banks. This
phenomenon has been associated with the increasing internationalization of European banks, linked
to both financial integration and the increase in the international role of the euro (for some evidence
on this point, see Forster et al., 2011). After a brief stabilization, following the mild recession of
2001, the trend continues until the end of 2008, at which point it is suddenly reversed. What we see

21
since then is not only the pro-cyclicality of a segment of international capital flows (see, for example,
Broner et al., 2011) but also a retrenchment that is not explained by business cycle conditions: the
observed path of the ratio is well below the boundaries of the fanchart.
Unfortunately our data set does not allow us to distinguish between banks and non-banks in that
category. However, we have hints that the bulk in that category is represented by the former. Figure
5 shows quarterly data on loans and deposits for the non resident sector. We can clearly see that the
banks sector is larger in general and it explains the entire decline since 2009. This supports the
conjecture that the ‘sudden stop’ in international capital flows we have seen in the euro area is mostly
explained by bank flows (on this point see also Milesi Ferretti and Tille, 2011).
Figure 5: Decomposition of loans and deposits, non-resident sectors
2,000 2,002 2,004 2,006 2,008 2,010 2,0120
500
1000
1500
2000
2500
3000
3500a) Loans to non-residents
2,000 2,002 2,004 2,006 2,008 2,010 2,0120
500
1000
1500
2000
2500
3000
3500b) Deposits of non-residents
Banks
Non-banks
Note: Quarterly data from 1999Q1 to 2011Q1. Figures are expressed in euro billions. The blue solid line line describes the observed developments in loans to (deposits of) bank while the green dashed line refers to non-banks (excluding government).
Turning to the substitution of market provision of liquidity by the central bank, Figure 6 shows the
ratio between liabilities to the Eurosystem and domestic interbank liabilities. The chart provides a

22
quantitative account of the substitution of interbank activity with central bank intermediation across
the euro-system balance sheet.
Liquidity provision by the Eurosystem has been weakly pro-cyclical, but the sharp increase since
2008 is clearly unusual in the sample. Although the distribution is quite widely spread, occasionally
the values of the ratio in the 2009-2010 period are still above the 97.5% quantiles and, in general,
they lie in the upper tails of the distribution.
Figure 6: Ratio of liabilities to Eurosystem over domestic interbank liabilities
1999 2001 2003 2005 2007 2009 2011
5
10
15
20
25
30
Note: The blue line describes the observed development in the ratio of liabilities to the Eurosystem over liabilities to the domestic interbank sector from January 1999 to April 2011. The figure reports also the distribution of the conditional forecasts (up to the 2.5 and 97.5% quantiles) of the ratio.
The increase in the intermediation role of the Eurosystem and the stability of MFI’s domestic assets
and liabilities are likely to be related. As explained in our earlier discussion, this substitution is less
than one-for-one as the ECB replaces net flows rather than all gross flows. By keeping the inter-bank
market alive the ECB has most likely allowed euro area banks to moderate and delay the contraction
of activities with domestic counterparties.

23
Putting everything together the story we extract from the data is that while the behaviour of deposits
and loans vis-a-vis residents in 2009 and 2010 is in line with business cycle conditions, this is not the
case with the interbank market mostly because of the dynamics of loans and deposits to non-
residents. Rather central bank intermediation has substituted – albeit not one-for-one – for wholesale
transactions, as the Eurosystem has ensured that the necessary net flow of interbank transactions to
maintain the flow of financing to the real economy is maintained by offering its own balance sheet as
a conduit for that intermediation.
We can also use quarterly data to describe the structure of non-resident transactions with euro area
banks. Figure 7 shows that the bulk of the decline is explained: (1) by ‘other banks’, i.e. not the
offshore affiliates of Euro area banks; and (2) by activity in foreign currencies rather than euros. The
unusual decline in interbank transactions observed during the financial crisis is not only driven by
foreign banks, but also by transactions denominated in currencies other than euros. These FX
transactions cannot be intermediated by the ECB without international coordination with foreign
central banks, which can provide access to the other currencies needed to substitute for private
intermediation.
Figure 7: Structure of non-resident transactions with euro area banks

24
-1000
-800
-600
-400
-200
0
200
400
600
800
1000
1990 1993 1996 1999 2002 2005 2008 2011
-1000
-800
-600
-400
-200
0
200
400
600
800
1000
liabilities to other banks in foreign currenciesliabilities to other banks in euroliabilities to related foreign offices in foreign currenciesliabilities to related foreign offices in euro
Note: Source of the chart: ECB Monthly Bulletin, October 2011 (page 76). Data are expressed in terms of annual flows in billions. Source of the data: BIS.
6. Concluding remarks and policy implications
This paper has investigated the behaviour of euro area bank balance sheets during the recent
financial crisis, with a focus on the period following the failure of Lehman Brothers in September
2008.
We base our analysis on a new data set containing monthly information on the aggregate balance
sheet of euro area banks. Our exercise investigates the joint dynamic behaviour of these data with a
set of macroeconomic indicators. A key feature of the data is that they contain information on gross
positions within the banking sector, and can therefore shed light on the behaviour and role of the
interbank market during the financial crisis.
Once we condition on business cycle conditions, we find that some features of financial
intermediation through the euro area banking system replicate the regularities we identify in the pre-
crisis sample. But other features of the data point to a persistent disruption stemming from the crisis.

25
Bank transactions with non-bank residents have remained remarkably stable. As in our previous
work, we interpret this as evidence that the ECB’s non-standard monetary policy measures have been
successful. More specifically, in the post-Lehman period these non-standard measures have served to
insulate the flow of credit to households and firms from the malfunctioning of the financial system
in general, and the interbank money market in particular. In this paper, we show that, since 2009,
central bank intermediation has replaced a large portion of interbank transactions, suggesting that the
Eurosystem has adopted the de facto role of a central counterpart to clear wholesale money market
activity. It has been this substitution that has served to insulate financing flows to the real economy.
We also show that it is bank transactions with non-residents (we believe largely offshore banks) that
saw the most immediate and unprecedented decline after the collapse of Lehman. It is this decline
that is both economically and statistically the most aberrant feature of the post-Lehman data.
Moreover, we provide evidence that this decline mostly reflects a fall in loans and deposits with
foreign banks denominated in currencies other than euros. This is a key feature since, while the ECB
can create euro liquidity without limit to support euro denominated central bank intermediation, its
ability to facilitate intermediation in foreign currency transactions relies on the provision of non-euro
liquidity by the relevant other central banks.
These findings point to the importance of international provision of liquidity during financial crisis.

26
References
Adrian, T. and H-S. Shin (2010a). “Financial intermediaries and monetary economics,” in B.M. Friedman and M. Woodford (eds.) Handbook of Monetary Economics 3(12), pp. 601-650 (Elsevier).
Adrian, T. and H-S. Shin (2010b). “Liquidity and leverage,” Journal of Financial Intermediation 19(3), pp. 418-437.
Altunbas Y., L. Gambacorta and D. Marqués-Ibáñez (2009). “Securitisation and the bank lending channel,” European Economic Review 53(8), pp. 996-1009.
Banbura, M., D. Giannone and M. Lenza (2012). “Kalman-filter based conditional forecast with large dynamic systems: An application to a large euro area VAR,” ECB mimeo.
Banbura, M., D. Giannone and L. Reichlin (2010). “Large Bayesian VARs,” Journal of Applied Econometrics 25, pp. 71-92.
Broner, F., T. Didier, A. Erce and S.L. Schmukler (2011). “Gross capital flows: Dynamics and crises”, World Bank working paper no. 5768.
Brunnermeier, M.K. and L.H. Pedersen (2009). “Market liquidity and funding liquidity,” Review of Financial Studies 22(6), pp. 2201-2238.
Caballero, R.J. (2009) “Sudden financial arrest,” IMF Mundell-Flemming lecture, MIT Department of Economics working paper no. 09-29.
Calvo, G.A. and C. Reinhart (2000). “When capital inflows come to a sudden stop: Consequences and policy options” in P. Kenen and A. Swoboda (eds.) Reforming the international monetary and financial system, Washington, DC: International Monetary Fund, pp. 214-265.
Carbó-Valverde, S., D. Marques-Ibanez and F. Rodríguez-Fernández (2012). “Securitization, credit growth and financial instability: The case of Spain.” Journal of International Money and Finance, forthcoming
Carter, C. K. and R. Kohn (1994). “On Gibbs sampling for state-space models,” Biometrika 81, pp. 541-553.
Chari, V.V., L. Christiano and P.J. Kehoe (2008). “Facts and myths about the financial crisis of 2008,” FRB Minneapolis working paper no. 666.
De Mol, C., Giannone, D. and L. Reichlin (2008). "Forecasting using a large number of predictors: Is Bayesian shrinkage a valid alternative to principal components?," Journal of Econometrics, Elsevier, vol. 146(2), pages 318-328, October.
Doan, T., R. Litterman, and C. A. Sims (1984). “Forecasting and conditional projection using realistic prior distributions,” Econometric Reviews 3, pp. 1-100.
Durre, A. and H. Pill (2012). “Central bank balance sheets as policy tools,” BIS Papers, forthcoming.
ECB (2011). “The supply of money – Bank behaviour and the implications for monetary analysis”. Monthly Bulletin Article, October 2011 (pp. 63-79).
Fahr, S., R. Motto, M. Rostagno, F. Smets and O. Tristani (2010). “Lessons for monetary policy strategies from the recent past,” in M. Jarocinski, F. Smets and C. Thimann (eds.) Approaches to monetary policy revisited: Lessons from the crisis (Frankfurt: European Central Bank), pp. 26-66.
Fahri, E., O. Gourinchas and H. Rey (2011). Reforming the international monetary system, CEPR.
Forster, K., M. Vasardani and M. Ca’Zorzi (2011). “Euro area cross-border financial flows and the global financial crisis,” ECB occasional paper no. 126.
Giannone, D., M. Lenza, H. Pill and L. Reichlin (2011a). “Non-standard monetary policy measures and monetary developments,” in J. Chadha and S. Holly (eds.) Interest rates, prices and liquidity, pp. 195-221 (Cambridge University Press).
Giannone, D., M. Lenza, H. Pill and L. Reichlin (2011b). “Monetary policy and financial stability,” in S. Claessens, D.D. Evanoff, G.G. Kaufman and L.E. Kodres (eds.) Macroprudential regulatory policies: The new road to financial stability? pp. 103-120 (World Scientific: Studies in International Economics 17).
Giannone, D., M. Lenza, H. Pill and L. Reichlin (2012). “The ECB and the interbank market,” CEPR discussion paper no. 8844.
Giannone, D., M. Lenza and G. Primiceri (2010). “Prior selection for vector autoregressions,” ECARES working paper http://homepages.ulb.ac.be/~dgiannon/Draft_GLP_V18.pdf.
27
Giannone, D., M. Lenza and L. Reichlin (2012). "Money, Credit, Monetary Policy and the Business Cycle in the Euro Area," Working Papers ECARES ECARES 2012-008, ULB -- Universite Libre de Bruxelles.
Gorton, G.B. and A. Metrick (2011). “Securitized banking and the run on repo,” Journal of Financial Economics, forthcoming.
Heider, F., M. Hoerova and C. Holthausen (2009). “Liquidity hoarding and interbank market spreads: The role of counterparty risk,” ECB work paper no. 1126.
Lenza, M., H. Pill and L. Reichlin (2010). “Monetary policy in exceptional times,” Economic Policy 62, pp. 295-339.
Litterman, R. B. (1980): “A Bayesian Procedure for Forecasting with Vector Autoregression,” MIT Department of Economics working paper no. 80-12.
McKinnon, R.I. and H. Pill (1997). “Credible economic liberalizations and overborrowing,” American Economic Review 87(2), pp. 189-193.
McKinnon, R.I. and H. Pill (1998). “The overborrowing syndrome: Are East Asian economies different?” in R. Glick (ed.) Managing capital flows and exchange rates: Lessons from the Pacific Basin, Cambridge University Press, pp. 322-355.
Milesi-Ferretti, G. and C. Tille (2011). “The great retrenchment: international capital flows during the global financial crisis,” Economic Policy 26(66), pp. 285-342.
Peersman, G. (2011). “Macroeconomic effects of unconventional monetary policy in the euro area,” CEPR discussion paper no. 8348.
Shin, H-S. and K. Shin (2011). “Procyclicality and monetary aggregates,” NBER working paper no. 16836.
Trichet, J-C. (2009). “The ECB’s enhanced credit support,” address at the University of Munich annual symposium, http://www.ecb.europa.eu/press/key/date/2009/html/sp090713.en.html.