Bad banks choking good banks: simulating balance sheet ... · Bad banks choking good banks:...
30
UCD GEARY INSTITUTE DISCUSSION PAPER SERIES Bad banks choking good banks: simulating balance sheet contagion Saed Khalil Palestine Monetary Authority Birzeit University Stephen Kinsella Kemmy Business School University of Limerick Geary WP2011/26 October 2011 UCD Geary Institute Discussion Papers often represent preliminary work and are circulated to encourage discussion. Citation of such a paper should account for its provisional character. A revised version may be available directly from the author. Any opinions expressed here are those of the author(s) and not those of UCD Geary Institute. Research published in this series may include views on policy, but the institute itself takes no institutional policy positions.
Transcript of Bad banks choking good banks: simulating balance sheet ... · Bad banks choking good banks:...
UCD GEARY INSTITUTE
DISCUSSION PAPER SERIES
Bad banks choking good banks:
simulating balance sheet contagion
Saed Khalil
Palestine Monetary Authority
Birzeit University
Stephen Kinsella Kemmy Business School
University of Limerick
Geary WP2011/26 October 2011
UCD Geary Institute Discussion Papers often represent preliminary work and are circulated to encourage discussion. Citation of such a paper should account for its provisional character. A revised version may be available directly from the author.
Any opinions expressed here are those of the author(s) and not those of UCD Geary Institute. Research published in this series may include views on policy, but the institute itself takes no institutional policy positions.

! 1!
Bad$banks$choking!good$banks:$
simulating*balance*sheet*contagion!
Saed!Khalil1!and!Stephen!Kinsella2!
!
!
Abstract.!We!investigate!the!propagation!of!contagion!through!banks’!balance!
sheets!in!a!two>country!model.!We!simulate!an!increase!in!non>performing!loans!in!
one!bank,!and!study!the!effects!on!other!banks!and!the!macro!economy!of!each!
country.!We!show!that!credit!crunches!destabilize!each!economy!in!the!short!run!
and!in!the!long!run!reduce!potential!output.!We!quantify!this!loss.!!
!
!
Keywords:!Credit!crunch,!contagion,!stock!flow!consistent!models.!
JEL$classification$:$E32;E37;$E51;$G33.!
!
!
!
!
!
!
!
!
!
!
!
!!!!!!!!!!!!!!!!!!!!!!!!!!!!!!!!!!!!!!!!!!!!!!!!!!!!!!!!1!Palestine!Monetary!Authority!and!Birzeit!University.!!!2!University!of!Limerick.!Corresponding!author,[email protected].!

! 2!
1.#Introduction#
!
The!recent!crisis!has!highlighted!the!role!systemic!liquidity!plays!in!spreading!funding!
contagion!through!the!web!of!interlinked!banks!and!other!financial!institutions.!
There!is!a!need!for!models!that!can!identify!counterparty!risk!exposures,!shock!
transmission!processes,!and!other!‘fault!lines’!at!the!systemic!level.!
To!understand!the!role!liquidity!plays!within!interconnected!sets!of!balance!
sheets,!this!paper!studies!the!evolution!of!an!increase!in!non>!performing!loans!in!
one!bank!within!a!two>country,!five>sector!model.!We!find!that!financial!fragility!can!
affect!both!the!short!term!and!long!term!evolution!of!the!economy.!!
! We!define!a!credit!crunch!event!as!a!sudden!shortage!of!loanable!funds!
within!private!banks!that!results!in!a!decline!in!lending!by!those!banks.!Credit!
crunches!can!occur!in!banks!when!there!is!an!unexpected!decline!in!the!value!of!
their!collateral!(for!example!in!the!case!of!Ireland’s!banks!(Kinsella!and!Lyons,!
2011)).!Credit!crunches!can!occur!when!reserve!or!other!macro!prudential!
regulatory!requirements!change,!or!when!governments!impose!direct!credit!controls!
(as!in!the!case!of!Malaysia!in!1998).!Credit!crunches!can,!of!course,!come!from!an!
increase!in!the!risk!of!system>wide!insolvency!(as!witnessed!in!Ireland,!Greece,!and!
Portugal!in!2010!and!2011).!
Empirically,!we!can!see!that!loans!did!indeed!increase!at!a!fast!pace!over!this!
‘bubble’!period,!and!this!squares!with!the!credit!buildup!stories!told!in!the!literature!
(Mizen,!2009).!Figure!1!shows!the!increase!in!non>performing!loans!as!a!percentage!
of!total!gross!loans!in!the!United!States!from!2005!to!2010!on!the!left!axis.!!We!see!
the!rise!and!rise!of!non>performing!loans!over!this!period!clearly,!from!less!than!1%!
of!total!loans!in!2005!to!4.2%!in!2009!to!4.7%!in!2010.!On!the!right!hand!axis!we!see!
the!increase!and!subsequent!decrease!in!total!net!lending!over!the!same!period!
from!765!billion!dollars!in!2005!to!>212!billion!dollars!in!2010.!!
!

! 3!
!Figure#1:Net#lending#and#non4performing#loans#as#a#percentage#of#total#gross#loans#(left#axis).#Sources:#IMF,#
Financial#Soundness#Indicators,#2011#and#Board#of#Governors#of#the#Federal#Reserve#System,#2011.#
! The!causality!of!a!credit!crunch!event!is!still!not!well!understood!(Gai!and!
Kapadia,!2010;!Kindleberger,!1996:!Haldane,!2011).!Current!research!focuses!on!
increases!in!balance!sheet!connectedness!and!complexity,!viewing!the!banking!
system!as!a!directed!graph!or!network!(May!and!Arinaminpathy,!2010;!May!and!
Haldane,!2011,!Gleeson!et$al,!2011).!There!is!of!course!a!longer!thread!of!literature!
on!these!issues.!For!example,!Bernanke!et$al!(1991)!study!leftward!shifts!in!the!
supply!curve!of!bank!loans,!holding!constant!real!interest!rates!and!quality!of!bank!
borrowers.!Kiyotaki!and!Moore!(1997,!2002)!study!the!endogenous!generation!of!
temporary!liquidity!shocks.!!
The!most!often>repeated!causal!story!within!this!literature!is!that!a!badly!
priced!asset!or!asset!class!(for!example,!US!subprime!mortgages)!causes!a!sharp!
increase!in!loan!defaults!which!leads!to!banks!provisioning!for!bad!debts,!which!
reduces!their!equity!capital!and/or!their!reserves!(Whalen,!2002).!The!shock!
increases!the!cost!of!interbank!funding,!causing!a!reduction!in!loans!into!the!real!
economy!and!a!reduction!in!economic!output.!The!feedback!from!drops!in!demand!
for!the!original!asset!to!an!inability!to!re>finance!that!asset!due!to!credit!constraints!
is!quite!clear!in!this!story.!Individual!banks!can!fail,!and!fail!spectacularly,!when!they!
demonstrate!an!inability!to!meet!their!short!run!liabilities,!and!the!impact!on!the!
real!economy!can!be!profound.!
NPL's/!TGL!
-600!
-400!
-200!
0!
200!
400!
600!
800!
1000!
0!0.5!1!
1.5!2!
2.5!3!
3.5!4!
4.5!5!
2005! 2006! 2007! 2008! 2009! 2010!
%"
Net!Lending!
$US
billi
ons

! 4!
There!are!competing!liquidity!crisis!stories!(Koo,!2009;!Eggertson!and!
Krugman,!2010;!Minsky,!1986).!Each!of!these!stories!revolves,!in!some!sense,!around!
a!credit!buildup!within!temporarily!risk>loving!banks!enjoying!lax!regulatory!climates,!
rather!than!individual!householders!making!poor!decisions,!but!the!network!of!
attendant!causal!linkages!is!similar!to!the!first!set!of!stories.!Many!new!papers!study!
flows!of!funds!within!the!financial!system!empirically!(Kastren!and!Kavonius,!2009;!
Mian!and!Sufi,!2010;!Billio!et$al,!2011).!They!find!increased!levels!of!interconnection!
between!banks!increases!the!probability!of!a!credit!crunch!event!markedly!following!
a!contraction!in!liquidity!in!one!bank!that!propagates!across!the!network.!This!is!
balance!sheet!contagion.!
! Our!contribution!is!motivated!by!the!literature,!and!is!threefold!in!this!paper.!!
First,!we!build!and!solve!a!large!two!country,!five!sector!stock!flow!consistent!
macroeconomic!model!in!the!tradition!of!Godley!and!Lavoie!(2007)3.!Rather!than!
focusing!just!on!banks,!or!on!the!economy!as!a!whole,!we!consider!the!
interconnections!between!the!financial!and!real!sides!of!the!economy!in!explicit!
detail.!!
It!should!be!underlined!that!this!is!an!open>economy!model!without$trade!
but!with!international!flows.!In!other!words,!the!balance!of!payments!only!includes!
the!capital!account!balance,!because!we!wish!to!focus!on!the!consequences!of!
interbank!loans!in!a!globalized!world.!There!are!no!exports!(although!there!is!a!
current!account!balance!in!each!country!due!to!interest!payments!to!and!from!the!
other!country),!and!therefore!the!consequences!of!the!credit!crunches!we!simulate!
will!not!take!into!account!the!feedback!effects!on!net!exports.!That!important!
qualification!aside,!the!key!advantage!of!stock!flow!consistent!models!is!the!ability!to!
conduct!an!analysis!of!the!real!and!financial!flows!and!stocks!at!the!‘world’!level!with!
a!comprehensive!description!of!the!main!agents!such!as!households!firms,!central!
banks,!private!banks,!and!governments.!!
Second,!we!simulate!both!a!one>off!increase!in!non>performing!loans,!and!a!
multi>period!increase!in!non>performing!loans.!Many!other!studies—for!example!
Kiyatoki!and!Moore’s!classic!(1997)!study!of!credit!cycles—look!only!at!a!single!credit!
!!!!!!!!!!!!!!!!!!!!!!!!!!!!!!!!!!!!!!!!!!!!!!!!!!!!!!!!3!Eviews!code!for!this!model!is!available!upon!request!from!the!authors.!!

! 5!
event,!which,!while!important,!tends!to!underestimate!the!long!run!effects!of!a!
protracted!credit!crisis!that!the!world!economy!is!currently!experiencing.!Our!model!
is!careful!to!correct!for!this.!!
Third,!we!contribute!to!the!literature!on!imbalances!within!countries!and!
within!its!banking!institutions,!in!the!hope!of!a!more!complete!description!of!these!
important!phenomena.!
! The!rest!of!this!paper!is!laid!out!in!the!standard!way.!Section!2!describes!the!
main!model!equations.!Section!3!gives!the!results,!graphically!and!numerically.!
Section!4!concludes.!!
2.+Model+
Before!describing!the!model’s!balance!sheet,!transaction!matrices!and!behavioral!
equations,!we!first!give!some!intuition!for!the!model’s!supply!shock!transmission!
mechanism!through!the!interbank!loan!market.!!
For!ease!of!exposition,!rather!than!calling!the!countries!‘1’!and!‘2’,!we!call!the!
two!countries!‘France’!and!‘Germany’.!Figure!2!shows!this!mechanism!in!detail.!We!
assume!the!private!banking!sector!in!this!model!is!made!up!of!two!competing!banks!
in!each!country,!regulated!by!a!national!central!bank.!!
Running!from!left!to!right,!we!see!that!bank$A!takes!interbank!loans!from!
bank!B$and!supplies!interbank!loans!to!bank!C.$Bank!B!takes!interbank!loans!from!
bank!D.!Bank!C!a!net!debtor!in!this!market!and!takes!interbank!loans!from!bank!D,!
and!thus!Bank!D,$as!drawn,!is!a!net!creditor!in!this!market.!Each!bank!of!course!has!
to!pay!interest!on!their!interbank!loans!received,!and!they!receive!interest!on!their!
supplied!interbank!loans.!The!banks’!profits!are!made!within!the!differentials!
between!ingoing!and!outgoing!interest!rates.!Part!of!the!profits!will!go!to!households!
who!hold!bank!shares!as!dividends.!The!remainder!is!held!as!retained!earnings!
within!each!bank’s!capital!accounts.!!
In!each!period,!each!bank’s!capital!account!contains!the!change!in!the!bank’s!
assets!and!liabilities,!which!gives!the!new!flows!of!the!bank’s!own!funds!(or!bank!
equities),!retained!earnings,!and!the!value!of!non>performing!loans.!!

! 6!
!Figure#2.#Transmission#mechanism#through#the#interbank#market.#
The!model,!in!general,!is!laid!out!as!follows.!We!interact!two!steady!state—
almost!identical—economies!with!five!sectors!in!each!economy:!households,!firms!
(the!non>financial!sector),!government,!central!bank,!and!private!banks.!Each!sector!
acquires!assets!(+)!and!incurs!liabilities!(>).!!
Again,!the!objective!of!the!paper!is!to!pull!out!the!effects!of!a!credit!supply!
shock!that!precipitates!a!decline!in!the!supply!of!loans!to!the!other!sectors!in!the!
economy.!To!do!this,!we!need!to!describe!the!balance!sheets!of!our!model,!building!
a!relatively!elaborate!trading!schema!within!the!banking!sectors!as!we!do!so,!and!
keeping!the!description!of!the!rest!of!the!economy!as!‘pared!down’!as!possible.!Then!
we!introduce!revaluation!and!transactions!matrices,!and!write!down!the!main!
behavioral!equations!the!model!uses!before!turning!to!our!simulated!results!in!
Section!3.!
! Table!1!shows!the!balance!sheet!for!our!model.!Large!letters!denote!the!
variable!under!study,!for!example,!high>powered!money,!H.!High!powered!money!is!
just!money!issued!by!the!central!bank!and!is!held!by!banks!as!reserves,!either!in!the!
form!of!vault!cash!or!as!deposits!at!the!central!bank,!as!well!as!by!households.!
Subscripts!within!the!table!show!the!destination!sector!of!each!entry,!and!whether!
this!sector!demands!or!supplies!that!quantity.!So!for!example,!in!France,!households!
(h)!have!a!demand!(d)!for!high>powered!money!(+HFra!h,!d),!and!in!Germany,!
!!
France' Germany'!
French!Banking!Sector!
German!Banking!Sector!
Bank!A! Bank!C!
Bank!B! Bank!D!

! 7!
households!(h)!have!a!demand!(d)!for!high!powered!money!!(+HGer!h,!d),!while!the!
French!central!bank!supplies!(s)!this!money!(BHFras!).!!
!
Please$insert$table$1$here.$
!
For!ease!of!exposition!we!suppress!subscripts!and!superscripts!within!
paragraphs.!!
Running!from!left!to!right!in!the!table!and!by!sector,!then,!in!addition!to!
holding!high>powered!money!(+H),!households!also!hold!money!deposits!(+M)!in!
domestic!banks,!local!and!foreign!government!securities!(+B),!and!bank!equities!
(+OF).!Households!can!take!loans!from!domestic!banks!(>L).!The!total!wealth!of!the!
household!sector!is!given!by!(+V).!!
! Firms!own!tangible!assets!in!the!form!of!fixed!capital!(+K).!Firms!take!loans!
from!domestic!banks!(>L).!The!sum!of!their!assets!and!liabilities!gives!the!net!worth!
of!the!firms!at!the!end!of!each!period!(+/>NW).!
The!government!in!each!country!is!a!passive!actor!in!the!system,!and!must!
mechanically!finance!any!deficit!by!selling!treasury!bills,!(B),!both!at!home!and!
abroad.!Each!government!holds!treasury!bills,!as!do!households!and!firms.!!
! The!central!banks!of!both!countries!are!equally!stripped!down!entities,!only!
issuing!money!(H)!and!holding!local!and!foreign!treasury!bills.!!
! We!introduce!a!necessary!complication!in!the!description!of!private!banks!to!
study!interbank!contagion.!Our!four!private!banks!demand!and!supply!loans!
between!one!another!nationally!and!internationally.!!
To!give!a!sense!of!what!is!happening!within!the!model,!we!reintroduce!the!
subscript!and!superscript!notation!briefly.!Bank!A!in!France!creates!a!demand!for!
interbank!loans!from!bank!B$in$France!(BLBb$A$d)!and!supplies!interbank!loans!to!bank!C!
in!Germany!(+LAb$C$s).!Bank!B!in!France!creates!a!demand!for!interbank!loans!from!
bank!D!in!Germany!(BLDb$B$d)!and!supplies!interbank!loans!to!bank!A!in!France!(+LBb$A$
s).!Bank!C!in!Germany!demands!interbank!loans!from!bank!A!in!France!(BLAb$C$d)!and!
from!bank!D!in!Germany!(BLDb$C$d).!Bank!D!supplies!loans!to!bank!B!(+LDb$B$s)!and!to!
bank!C!(+LDb$C$s).!

! 8!
! Table!2!shows!the!revaluation!matrix!for!this!model.!We!see!two!revaluations!
of!fixed!capital!(K)!and!bank!capital!(OF).!Capital!gains!accrue!to!household!wealth,!
whilst!banks’!own!funds!are!treated!as!liabilities.!The!value!of!the!firm’s!fixed!capital!
is!net!of!price!inflation.!!
!
Please$insert$Table$2$here.$
!
! Table!3!shows!the!flows!within!the!sectors!and!between!countries!of!this!
module.!A!plus!sign!(+)!means!the!sources!of!fund,!and!a!minus!sign!(>)!denotes!a!use!
of!those!funds.!!
Firms!have!both!current!and!capital!accounts.!In!its!current!account!the!firm!
describes!its!activities!in!supplying!goods!and!services!(+C)$to!households!and!the!
government!(+G),!and!providing!net!investment!(+I).!The!firm!pays!taxes!(BT)!on!its!
sales,!it!pays!wages!to!households!(>WB)!and!pays!out!interest!on!its!loans!–(r.L)!
while!taking!account!of!depreciation!costs!(Bδ.K).!The!difference!between!sources!
and!uses!of!funds!in!the!firm’s!current!account!is!its!profits!(BF),$transferred!to!
households!that!own!equity!in!the!firm.!
! Households!earn!wages!from!firms!(+WB),!they!pay!income!taxes!to!the!
government!(>T)!and!they!can,!from!time!to!time,!default!on!their!loans.!Households!
pay!interest!r!on!their!performing!loans.!!
Each!government!receives!taxes!(+T)!from!firms!and!households!and!central!
bank’s!profits!(+Fjcb)!and!pays!interest!on!treasury!bills!supplied!to!the!other!sectors!
locally!and!to!the!other!country!(Br.B).!The!sum!of!these!components!determines!the!
public!sector!borrowing!requirements!(PSBR).!As!mentioned!above,!governments!of!
both!countries!meet!their!public!sector!borrowing!requirement!by!issuing!new!
treasury!bills!(+∆B).!
Each!central!bank!receives!interest!on!their!holdings!of!treasury!bills!from!the!
domestic!government!and!from!the!other!country’s!government.!The!sum!of!these!
interest!payments!is!the!central!bank’s!profits,!and!the!profits!of!the!central!bank!are!
transferred!completely!to!the!government.!The!central!bank!is!assumed!to!cover!
new!flows!of!domestic!and!foreign!treasury!bills!by!issuing!high!powered!money!(>
∆H)!to!households!and!to!private!banks.!

! 9!
!
Please$insert$table$3$here.$
!
Private!banks,!in!their!current!account!column,!receive!interest!on!their!loans!
to!households!and!firms,!interest!on!their!holdings!of!treasury!bills,!and!pay!interest!
to!households!for!money!deposits.!Banks!also!receive!and!pay!interest!on!their!
interbank!loans.!We!assume!that!some!households!will!default!on!their!loans,!with!
the!difference!between!outstanding!loans!(L)!and!non>performing!loans!(NPL)!set!to!
5%!initially.!Thus!banks!receive!interest!just!on!performing!loans!(+rilB1$(Lih$dB1BNPL)).!
2.2#Model#equations#
!
Beyond!the!balance,!transaction,!and!revaluation!matrices,!the!model>proper!is!a!set!
of!behavioral!equations!governing!the!motion!of!the!system.!For!ease!of!exposition,!
we!place!the!full!model!description!within!an!appendix!and!present!a!stripped!down!
version!here.!!
! The!real!output!in!each!country!is!the!sum!of!households’!consumption!(c),!
government!expenditure!(g),!and!investment!(i).!This!is!equal!to!the!real!output!of!
the!system!expressed!as!sales,!(s).!!
! ! = ! = ! + ! + !! (1)!
Each!firm’s!pricing!decision!is!a!constant!mark>up!(!)!of!the!unit!cost!(UC),!which!in!turn!is!equal!to!the!wage!bill!(WB)!paid!per!unit!of!sales!(s).!!
! ! = 1+ ! ∗ !"! (2)!
! !" =!"! ! (3)!
The!investment!decision!of!each!firm!is!given!by!the!accounting!identity!of!the!
capital!account!of!the!firm.!The!level!of!employment!in!each!firm!depends!upon!the!
volume!of!sales!in!previous!periods!and!on!the!productivity!of!that!firm.!!
! Household!income!is!given!as!the!sum!of!wages,!profits,!and!interest!on!
financial!assets!held!in!the!previous!period.!Disposable!income!is!just!household!
income!minus!taxes!on!income!and!interest!servicing!on!loans!and!capital!gains.!
Importantly,!the!household!must!service!some!part!of!its!non>performing!loans!also!
if!it!is!a!defaulter.!!

! 10!
We!model!an!income!distribution!by!breaking!society!in!each!country!into!
three!groups.!The!first!group!receives!50%!of!the!disposable!income!of!the!nation.!
This!group!consumes!both!from!their!disposable!income!(yd)!and!from!their!wealth!
built!up!in!previous!periods!(vB1).!Call!Sh1!the!first!group’s!‘share’!of!the!country’s!
disposable!income.!Equation!(4)!shows!the!consumption!function!of!the!first!group!
of!households,!with!!!and!!!denoting!the!marginal!propensities!to!consume!out!of!
disposable!income!and!past!wealth,!respectively.!
! !1 = !! + !ℎ1.!!.!" + !!. !!!! (4)!
The!second!group!in!society!consumes!all!their!share!of!disposable!income!plus!new!
loans!(nl)!obtained!from!banks.!!
! !2 = !ℎ2.!" + !"! (5)!
The!third!group!is!made!up!of!those!households!who!consume!their!share!of!
disposable!income,!so!c3$=$sh3.yd.!We!vary!the!shares!of!income!between!groups!2!
and!3!as!households!default!and!transition!to!group!3.!The!shares!fluctuate!
according!to!the!following!relation:!!
! !ℎ3 = !ℎ3!! + !.∆!"#!
!!!!!!
!!
(6)!
!
where!!
! !ℎ2 = 1− !ℎ1− !ℎ3! (7)!
Here!!!just!transforms!the!proportion!of!non>performing!loans!to!a!percentage.!Each!
household!makes!portfolio!decisions!based!on!the!ratio!of!the!return!on!those!
assets4.!Cash!money!makes!up!a!potion!of!households’!consumption;!households’!
demand!for!loans!is!equal!to!the!supply!of!loans!to!households,!and!flows!of!bank!
equities!are!determined!by!the!differences!between!banks’!retained!earnings!and!
their!non>performing!loans.!
As!mentioned!above,!the!government!of!each!country!is!assumed!to!use!treasury!
bills!and!taxes!to!pay!for!its!expenditure!and!transfers!(interest!on!treasury!bills,!r,!
supplied!for!domestic!and!foreign!markets).!Where!government!expenditure!is!
greater!than!taxation!revenue!(T)!plus!the!profits!of!the!central!bank!(F),!the!shortfall!
!!!!!!!!!!!!!!!!!!!!!!!!!!!!!!!!!!!!!!!!!!!!!!!!!!!!!!!!4!That!is,!incomes!obey!Haig>Simons!conditions!(Godley!and!Lavoie!2007,!pg.!137).!!

! 11!
is!made!up!using!treasury!bills,!so!in!each!period!Δ !! = !"#$.!The!public!sector!borrowing!requirement!(PSBR)!of!the!country!is!given!by!
! !"#$ = ! + !!!!.!!!! − ! + !!" ! (8)!
Central!banks!hold!high>powered!money,!which!they!supply!to!households!and!
banks.!Central!banks!also!hold!treasury!bills!from!both!countries.!The!change!in!
demand!for!domestic!bills!is!dependent!on!flows!of!high>powered!money!and!
foreign!treasury!bills.!The!central!banks’!profits!are!generated!by!interest!earned!on!
treasury!bills!issued.!!
Private!banks!supply!credit!based!on!their!liquidity!and!leverage!ratios!in!any!
given!period.!Each!bank!also!takes!the!change!in!debtor!banks’!liquidity!into!account!
when!deciding!to!make!a!loan.!For!Bank!A,!for!example,!the!loan!equation!is!!
! !! = !!!!!! + !!!! . !"#! − !"#!" + !!!! .∆!"#! ! (9)!
Banks!are!able!to!supply!more!loans!if!their!liquidity!ratio!is!above!a!target!ratio!set!
by!the!central!bank,!and!they!provide!less!loans!if!their!liquidity!ratio!is!lower!than!
the!target!liquidity!ratio.!!
Banks!acquire!vault!cash!as!a!portion!of!money!deposits.!The!change!in!
banks’!own!funds!or!existing!equities!is!equal!to!the!retained!earnings!after!
subtracting$non>performing!loans.$Banks’!demand!for!treasury!bills!is!an!accounting!
identity!determined!in!each!period!by!the!balance!sheet!of!each!bank.!The!
redundant,!or!the!hidden,!equation!in!this!model!is!that!the!central!bank!of!Germany!
supplies!vault!cash!to!bank!D!on!demand.!
3.#Results#
!
After!setting>up!our!model’s!equations!and!identities,!to!start!simulations!we!need!
to!assign!values!for!all!model!parameters!and!stocks.!!Choosing!these!values,!in!part,!
depends!on!some!plausible!stock!to!flow!ratios!and!parameters!(Godley!and!Cripps,!
1982).!!!
These!values!must!ensure!the!model!convergences,!retains!its!consistency,!
and!is!broadly!in!line!with!the!status!quo.!!!
! !

! 12!
! We!simulate!two!different!types!of!shock!to!the!steady!state!of!the!system.!
First,!we!look!at!a!temporary!increase!in!non>performing!loans!and!the!attendant!
effects!on!the!real!economy.!Second,!we!look!at!a!longer!run!of!increasing!non>
performing!loans!and!the!effects!it!has!on!the!real!economy.!!
3.1#Scenario#1:#A#temporary#increase#in#non4performing#loans##!The!first!scenario!assumes!a!onetime!increase!in!French!households’!non>performing!
loans!taken!from!bank!A.!In!the!baseline!scenario!it!is!assumed!that!the!ratio!of!
households!default!loans!forms!5%!of!the!total!loans!stock.!In!the!first!scenario!this!
ratio!is!assumed!to!increase!in!period!15!to!reach!10%!of!total!households’!loans!
from!bank!A.!
The!charts!in!Figure!3!tell!the!story!quite!well.!An!increase!in!non>performing!
loans!leads!to!an!immediate!decline!in!bank!A’s!income!receipts,!which,!predictably,!
effects!bank!A’s!own!funds!negatively.!Bank!A’s!demand!for!treasury!bills!also!
suffers,!and!its!liquidity!declines,!reducing!its!capability!to!supply!loans!to!
households,!firms,!and!of!course!to!supply!loans!to!the!interbank!market.!The!
bottom!panels!in!Figure!3!show!the!evolution!of!the!liquidity!ratios!of!banks!A,!B,!C,!
and!D!after!the!increase!in!non>performing!loans!in!bank!A.!
!
! !
0.188
0.19
0.192
0.194
0.196
0.198
0.2
0.202
0.204
0.206
13 18 23 28 33
%
Periods
Bank A
Bank B
0.194
0.195
0.196
0.197
0.198
0.199
0.2
0.201
0.202
13 18 23 28 33
%
Periods
Bank C
Bank D

! 13!
! !Figure#3:#Simulation#of#a#one4time#increase#in#non4performing#loans#in#Bank#A#in#France.#Top#left#panel:#
evolution#of#bank#liquidity#ratios#in#France.#Top#right#panel:#evolution#of#bank#liquidity#ratios#in#Germany.#
Bottom#left#panel:#Evolution+of+interbank+loans+supply+in+France.+Bottom+right+panel:+evolution+of+interbank+
loan+supply+in+Germany.#
We!can!trace!the!contagion!effects!quite!clearly.!In!the!interbank!loans!market,!the!
decline!in!bank!A’s!liquidity!ratio!forces!the!bank!to!reduce!the!supply!of!interbank!
loans!to!bank!C.!Bank!B!then!becomes!afraid!about!bank!A’s!solvency,!which!may!
affect!bank!A’s!capability!to!fulfill!its!short!and!long!terms!liabilities.!Thus!bank!B!may!
be!affected.!As!a!consequence,!bank!B!decreases!its!interbank!loans!supply!to!bank!
A.!To!be!clear:!Bank!B’s!expectations!cause!the!feedback!from!non>performing!loans!
in!Bank!A!to!a!further!reduction!in!available!credit!lines.!
We!can!see!the!interbank!loans!supplied!in!Germany!after!the!increase!in!
bank!A’s$non!performing!loans.$The!solid!line!shows!the!evolution!of!interbank!loans!
supply!of!bank!D!to!bank!B.!The!dash!line!shows!the!evolution!of!interbank!loans!
supply!of!bank!D!to!bank!C.!As!shown!in!the!figure,!the!supply!of!loans!of!bank!D!to!
bank!C$declines!due!to!the!decline!in!bank!C’s!liquidity.!Bank!C’s!liquidity!ratio!
declines!due!to!the!decline!in!the!received!interbank!loans!from!bank!A.!As!a!
consequence!bank!D$decreases!its!interbank!loans!to!bank!C.!After!that,!bank!B!
decreases!interbank!loans!to!bank!A,!its!liquidity!ratio!increases,!and!due!to!that!
interbank!loans!supplied!to!bank!B!by!bank!D!increases.!
27
27.5
28
28.5
29
29.5
30
13 18 23 28 33
Val
ue
Periods
Bank A to bank C
Bank B to bank A
25.1
25.3
25.5
25.7
25.9
26.1
26.3
13 18 23 28 33
Val
ue
Periods
Bank D to bank B
Bank D to bank C
! 14!
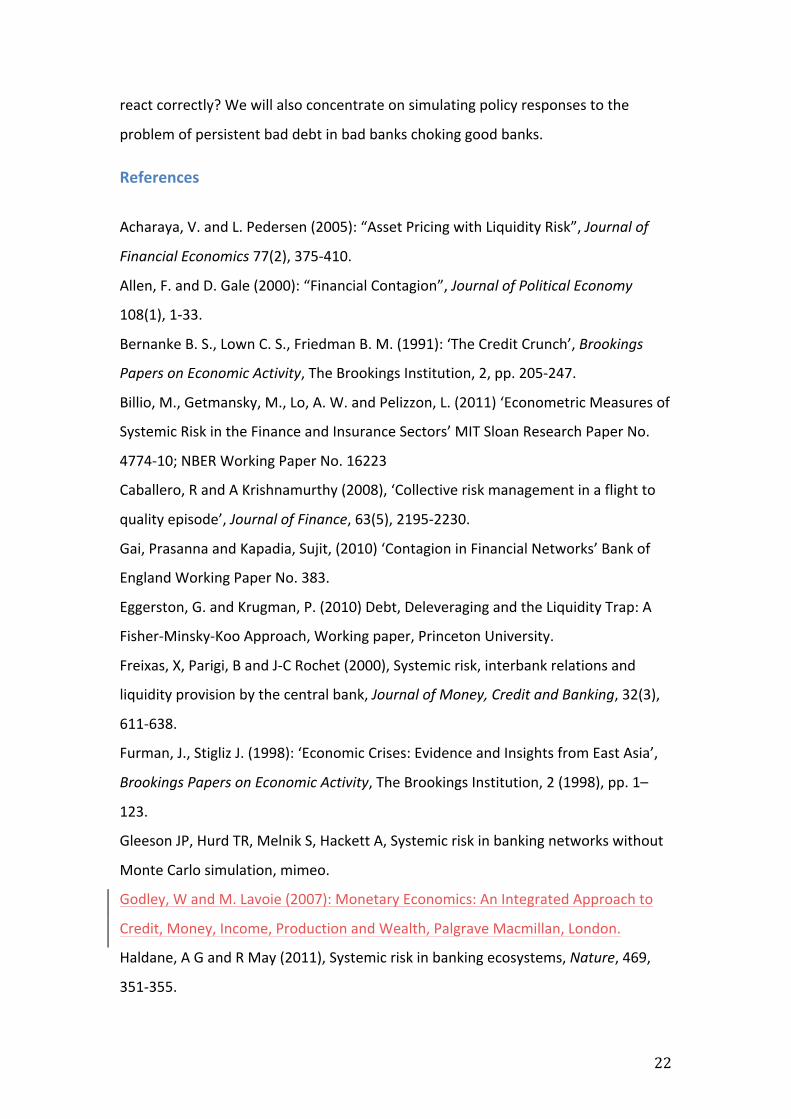
As!mentioned!above,!banks!in!this!model!aim!to!keep!their!liquidity!at!a!
target!level!set!by!the!central!bank.!When!a!bank’s!liquidity!ratio!falls!below!the!
target,!banks!decrease!loans,!causing!a!credit!crunch!in!the!real!economy.!When!a!
bank’s!liquidity!rises!above!the!target,!banks!lend!more!in!a!credit!expansion.!In!this!
scenario,!decreasing!loans!supply!will!lead!to!an!increase!in!bank!liquidity!and!reach!
levels!above!the!target.!With!the!increase!in!bank!liquidity,!banks!start!to!lend!more.!
After!a!certain!period!of!time,!bank!liquidity!starts!to!decline!again!and!thus!lending!
falls,!pulling!out!a!rather!‘Minskyian’!story!from!this!simulation.!This!process!will!
continue!until!banks!find!their!liquidity!ratio!equal!to!the!target!liquidity!ratio.!A!
credit!crunch!will!affect!the!domestic!economy!as!well!as!the!foreign!economy!
through!the!interbank!markets!in!both!countries.!
3.1.1+The+effects+of+a+credit+crunch+on+the+real+economy+
Figure!4!shows!the!evolution!of!real!output!in!both!countries.!We!can!see!that!real!
output!declines!in!both!countries!immediately!after!the!increase!in!non>performing!
loans!of!bank!A!by!households.!
There!are!two!channels!through!which!a!credit!crunch!affects!the!real!
economy!in!both!countries!in!this!model.!The!first!is!through!firms’!investments!and!
the!second!is!through!households’!consumption.!The!decline!in!bank!A’s!liquidity!
leads!to!a!decline!in!its!lending!to!households!and!firms.!The!increase!in!bank!B’s!
liquidity!leads!to!an!increase!in!its!lending!to!firms!and!households.!
We!can!also!see!the!evolution!of!loans!supplied!by!banks!A!and!B!to!firms!and!
households!in!the!first!country.!The!solid!line!in!figure!4!is!the!supply!of!loans!to!
firms!by!bank!A,!the!dashed!line!is!the!supply!of!loans!to!firms!by!bank!B,!the!square!
dotted!line!is!the!supply!of!loans!to!households!by!bank!A,!and!the!round!dots!line!is!
the!supply!of!loans!to!households!by!bank!B.!Clearly!once!the!supply!of!loans!
contracts!the!real!economy!becomes!vulnerable.!The!lower!panel!shows!the!
evolution!of!loans!supplied!by!banks!C!and!D!to!firms!and!households!in!Germany.!
The!rate!of!increase!or!decrease!in!loans!supplied!clearly!follows!the!liquidity!
reduction!in!both!countries.!

! 15!
!
!!
! !
95.4
95.6
95.8
96
96.2
96.4
96.6
96.8
97
97.2
150.2
150.4
150.6
150.8
151
151.2
151.4
151.6
151.8
152
13 18 23 28 33
Vale
Periods
Bank A to firms
Bank B to firms
Bank A to households (right scale)
Bank B to households (right scale) 619
619.5
620
620.5
621
621.5
13 18 23 28 33 38 43 48 53 58
Rea
l Out
put
Periods
France
Germany
112.84
112.85
112.86
112.87
112.88
112.89
112.9
112.91
112.92
112.93
112.94
83.2
83.3
83.4
83.5
83.6
83.7
83.8
83.9
84
84.1
13 18 23 28 33
Vale
Periods
Bank C to households
Bank D to households (right scale)
132.99
133
133.01
133.02
133.03
133.04
133.05
133.06
133.07
133.08
133.09
172.8
172.9
173
173.1
173.2
173.3
173.4
173.5
173.6
173.7
13 18 23 28 33
Vale
Periods
Bank C to firms
Bank D to firms (right scale)

! 16!
! !
Figure#4.#Top+left+panel:+loans+by+Banks+A+and+B+to+firms+and+households.+Top+right+panel:+evolution+of+real+output+in+both+countries.+Middle+left+panel:+lending+by+banks+C+and+D+to+households.+Middle+right+panel:+lending+by+banks+C+and+D+to+firms.+Bottom+left+panel:+changes+in+real+investment+in+both+countries.+Bottom+right+panel:+changes+in+consumption+in+both+countries.##
When!loans!supply!to!firms!decline!investment!decline!and!thus!output.!The!other!
channel!that!affects!real!output!is!household!consumption.!There!are!two!effects!on!
household!consumption,!one!is!direct,!the!indirect.!In!this!model,!income!group!2!
households!are!assumed!to!ask!for!loans!to!cover!part!of!their!consumption.!When!
loans!to!households!go!into!decline,!the!consumption!levels!of!these!households!will!
decline!too,!thus!real!output!falls.!This!is!the!direct!effect.!The!indirect!effect!comes!
from!changes!in!household!disposable!income.!When!loans!supplied!to!firms!decline,!
investment!declines!and!also!consumption—a!further!feedback!through!the!direct!
effects!on!consumption.!This!leads!to!a!decline!in!firms’!sales,!which!leads!to!a!
decline!in!wages!and!profits!and!disposable!income.!Disposable!income!declines!due!
to!the!decline!in!capital!gains—banks’!own!funds—and!increases!due!to!the!increase!
in$non>performing!loans,!but!these!two!elements!tend!to!cancel!each!other.!
These!declines!in!investment,!consumption,!and!output!in!both!continues!
continue!for!several!periods,!then!they!start!to!increase!again!and!reach!higher!
levels!than!the!steady!state!levels!following!changes!in!banks’!behavior!in!lending.!
Subsequently,!then,!each!series!starts!to!decline!again!towards!the!steady!state!
levels!achieved!before!the!imposition!of!the!shock.!!
24.4
24.6
24.8
25
25.2
25.4
25.6
25.8
13 18 23 28 33
Rea
l Inv
estm
ent
Periods
France
Germany
431
431.5
432
432.5
433
433.5
434
434.5
13 18 23 28 33
Rea
l con
sum
ptio
n
Periods
France
Germany

! 17!
Interest!rates!in!the!interbank!markets!and!on!loans!to!firms!and!to!
households!evolve!depending!on!target!bank!profits,!interest!on!assets,!and!stocks!
of!loans!supplied.!When$the!rate!of!non>performing!loans!increases,!banks’!own!
funds!tend!to!decline,!so!bank!liquidity!declines,!and!thus!stocks!of!loans!supplied,!
which!leads!perforce!to!a!decline!in!bank!profits.!!
For!banks!to!keep!their!profits!close!to!their!targets,!they!find!themselves!
needing!to!increase!the!interest!rates!on!loans!supplied!in!each!period.!Figure!5!
shows!the!evolution!of!interest!rates!on!loans!to!households!and!to!firms!in!both!
countries!after!a!one>time!increase!in!bank!A!NPL.!
!
Figure"5:"Evolution)of)loans)interest)rates)in)both)countries.)"
As!shown!in!Figure!5,!bank!A!increases!its!interest!rates!on!loans!much!more!
compared!with!the!other!banks!due!to!the!losses!that!come!from!the!increase!in!NPL!
non!performing!loans,!besides!the!change!in!the!stock!of!loans!supplied.!The!other!
bank!response!is!mainly!due!to!the!change!in!the!stock!of!loans!supplied!to!the!
interbank!markets!and!to!households!and!firms.!Interest!rates!on!interbank!loans!
follow!the!same!pattern!of!the!interest!rates!on!loans!to!households!and!firms.!
0.044
0.045
0.046
0.047
0.048
0.049
0.05
0.051
0
0.01
0.02
0.03
0.04
0.05
0.06
0.07
13 18 23 28 33
%
Periods
Bank A Bank D Bank B (right scale) Bank C (right scale)

! 18!
3.2#The#effects#of#a#multi4period#increase#in#non4performing#loans#
The!second!scenario!assumes!an!increase!in!households’!non>performing!loans!from!
bank!A!for!5!periods!starting!from!period!15.!The!reason!behind!this!scenario!is!to!
see!the!effect!of!a!several!time!increase!in!non>performing!loans!on!the!economy,!
which!may!allow!us!to!generalize!our!results.!!As!before,!the!ratio!of!non>performing!
loans!as!a!share!of!total!households!demand!for!loans!will!increase!from!5.0%!to!
10.0%.!
Figure!6!shows!the!evolution!of!interbank!loans!supply!in!both!countries!after!the!
increase!in!non>performing!loans!of!bank!A!(second!scenario)!compared!with!an!
increase!in!non>performing!loans!for!one!time!only!(our!first!scenario).!
!
Figure"6."Evolution"of"loans"supplied"to"firms"in"both"countries"in"Scenario"1"(single"period"increase"in"bad"loans)"and"Scenario"2"(multiAperiod"increase"in"bad"loans)."#
In!this!figure,!it!should!be!noted!that!the!interbank!loan!supply!is!summed!for!both!
banks!in!the!country,!and!not!for!a!specific!bank!as!in!figures!4!and!5!above.!As!
shown!in!figure!6,!the!effect!of!a!more!than!one!time!increase!in!non>performing!
loans!is!pronounced.!The!credit!supply!shock!has!a!more!negative!effect!on!
interbank!loans!supplied!in!the!second!scenario!compared!with!the!first!scenario!in!
both!countries.!Thus!interbank!lending!takes!more!time!to!return!to!levels!close!to!
the!previous!levels!before!the!shock!in!the!second!scenario!compared!with!the!first!
scenario.!
296
298
300
302
304
306
308
13 18 23 28 33
Valu
e
Periods
France 2nd Sc.
France 1st Sc.
Germany 2nd Sc.
Germany 1st Sc.

! 19!
!!
!
!
Figure"7."Top"left"panel:"effect"of"an"increase"in"the"nonAperforming"loans"of"bank"A"on"loans"supplied"to"firms"in"both"single"and"multiAperiod"scenarios."Top"right"panel:"effect"of"an"increase"in"the"nonAperforming"loans"of"bank"A"on"loans"supplied"to"households"in"both"single"and"multiAperiod"scenarios."Bottom"left"panel:"effect"of"credit"crunch"on"real"output"in"both"single"and"multiAperiod"scenarios."Bottom"right"panel:"effect"of"credit"crunch"on"real"consumption"and"disposable"income"in"both"scenarios"in"France."
Figure!7!shows!the!effect!of!an!increase!in!the!non>performing!loans!of!bank!A!on!
loans!supplied!to!firms!and!households!in!both!countries!in!both!scenarios.!This!
increase!in$non>performing!loans!in!the!second!scenario!has!a!more!negative!effect!
46
48
50
52
54
56
58
60
13 18 23 28 33
Valu
e
Periods
France 2nd Sc.
France 1st Sc.
Germany 2nd Sc.
Germany 1st Sc.
186
188
190
192
194
196
198
13 18 23 28 33
Valu
e
Periods
France 2nd Sc.
France1st Sc.
Germany 2nd Sc.
Germany 1st Sc.
614
615
616
617
618
619
620
621
622
623
13 18 23 28 33 38 43 48 53 58
Rea
l Out
put
Periods
France 2nd Sc.
France 1st Sc.
Germany 2nd Sc.
Germany 1st Sc.
431.5
432
432.5
433
433.5
434
434.5
435
435.5
436
13 18 23 28 33 38 43 48 53 58 Periods
Real consumption 2nd Sc.
Real consumption 1st Sc.
Real Disposable income 2nd Sc.
Real Disposable income 1st Sc.

! 20!
on!loans!supply!compared!with!the!first!scenario!in!both!countries!as!the!case!in!the!
interbank!lending!market.!
When!non>performing!loans!increase!in!bank!A!for!more!than!one!period,!
bank!A!starts!facing!losses!on!its!own!funds.!This!loss!naturally!affects!bank!A’s!
liquidity,!which!ends!up!below!the!target!level!set!by!the!central!bank.!This!forces!
bank!A!to!decrease!loans!supplied!in!the!interbank!market!to!households,!and!to!
firms!to!try!to!regain!its!liquidity!target.!The!deleveraging!attempt!causes!a!marked!
contraction!in!real!economic!output,!investment,!and!consumption,!as!credit!dries!
up.!The!continuation!of!the!higher!levels!of!non>performing!loans!forces!bank!A$to!
continue!decreasing!loans!supplied,!period!after!period.!As!discussed!in!the!first!
scenario,!bank!A’s!credit!crunch!will!spread!to!the!other!domestic!and!foreign!banks!
via!the!same!propagation!mechanism.!!
Figure!7!also!shows!the!real!output!in!both!countries!in!both!scenarios.!The!
credit!crunch!in!both!countries!has!bigger!effects!on!real!output!in!the!second!multi!
period!scenario!compared!with!the!first!scenario.!The!evolution!of!real!output!
follows!the!evolution!of!banking!behavior!in!lending!both!in!the!interbank!lending!
market!and!in!the!domestic!market.!
We!can!also!show!the!evolution!of!real!households’!consumption!and!real!
disposable!income!in!the!first!country!in!the!case!of!the!second!scenario!compared!
with!the!first!scenario.!As!shown!in!the!figure,!real!and!investment!are!affected!in!
the!second!scenario!more!than!in!the!first!scenario.!A!credit!crunch!in!the!first!
country!spreads!to!the!other!country,!which!will!have!a!negative!effect!on!
households’!real!consumption!and!on!real!disposable!income.!!
The!exchange!rate,!which!mediates!between!the!two!economies!in!the!
standard!fashion,!is!also!adversely!affected!in!the!multi>period!scenario,!as!we!can!
see!from!figure!8.!!

! 21!
!
Figure"8."Evolution of the exchange rate in both scenarios#
4.#Conclusion#
The!aim!of!this!paper!is!to!use!simulation!to!study!the!effect!of!a!single!and!multi!
period!increase!in!non>performing!loans!in!a!two>country!setting.!!
The!interactions!between!four!private!banks!are!explicitly!modeled,!as!are!
the!effects!of!two!types!of!credit!contraction!on!the!real!economy.!Through!the!
simulation!study,!we!see!the!evolution!of!a!series!of!bad!loans!on!liquidity!within!
banks,!between!banks,!and!between!the!financial!and!real!sectors!of!the!economy.!!
The!model!is!complex!enough!to!track!the!flows!of!liquidity!between!
individual!banks,!which!is!the!main!contribution!of!the!paper.!!
We!find!that!a!single!period!increase!in!non!performing!loans!in!one!bank!can!
be!compensated!for!quite!easily!by!the!network!of!connections!represented!in!this!
model!by!the!interbank!market.!When!the!increase!in!non>performing!loans!is!long>
lived!however,!interconnection!becomes!a!curse!as!contagion!spreads!to!undamaged!
banks.!This!feeds!back!into!the!real!economies!of!both!our!simulated!economies,!as!
a!decreased!supply!of!loans,!which!reduces!the!real!output!of!each!economy!in!
different!ways.!
In!our!model!we!assumed!that!banks!react!correctly!to!the!decline!in!liquidity!
be!squeezing!loans!supply!to!keep!their!liquidity!in!its!target!level!imposed!by!the!
central!bank,!which!led!banks!to!return!back!to!the!levels!before!the!shock.!This!
highlights!the!important!role!of!central!banks!in!regulating!and!monitoring!banks,!
and!provides!a!direction!for!future!research—what!happens!when!banks!do!not!
0.95 0.955 0.96
0.965 0.97
0.975 0.98
0.985 0.99
0.995 1
1.005
13 18 23 28 33 38 43 48 53 58
Rat
io
Periods
Exchange rate 2nd Sc. Exchange rate 1st Sc.
! 22!
react!correctly?!We!will!also!concentrate!on!simulating!policy!responses!to!the!
problem!of!persistent!bad!debt!in!bad!banks!choking!good!banks.!!
References#!
Acharaya,!V.!and!L.!Pedersen!(2005):!“Asset!Pricing!with!Liquidity!Risk”,!Journal$of$
Financial$Economics$77(2),!375>410.!
Allen,!F.!and!D.!Gale!(2000):!“Financial!Contagion”,!Journal$of$Political$Economy!
108(1),!1>33.!
Bernanke!B.!S.,!Lown!C.!S.,!Friedman!B.!M.!(1991):!‘The!Credit!Crunch’,!Brookings$
Papers$on$Economic$Activity,!The!Brookings!Institution,!2,!pp.!205>247.!
Billio,!M.,!Getmansky,!M.,!Lo,!A.!W.!and!Pelizzon,!L.!(2011)!‘Econometric!Measures!of!
Systemic!Risk!in!the!Finance!and!Insurance!Sectors’!MIT!Sloan!Research!Paper!No.!
4774>10;!NBER!Working!Paper!No.!16223!
Caballero,!R!and!A!Krishnamurthy!(2008),!‘Collective!risk!management!in!a!flight!to!
quality!episode’,!Journal$of$Finance,!63(5),!2195>2230.!
Gai,!Prasanna!and!Kapadia,!Sujit,!(2010)!‘Contagion!in!Financial!Networks’!Bank!of!
England!Working!Paper!No.!383.!
Eggerston,!G.!and!Krugman,!P.!(2010)!Debt,!Deleveraging!and!the!Liquidity!Trap:!A!
Fisher>Minsky>Koo!Approach,!Working!paper,!Princeton!University.!
Freixas,!X,!Parigi,!B!and!J>C!Rochet!(2000),!Systemic!risk,!interbank!relations!and!
liquidity!provision!by!the!central!bank,!Journal$of$Money,$Credit$and$Banking,!32(3),!
611>638.!
Furman,!J.,!Stigliz!J.!(1998):!‘Economic!Crises:!Evidence!and!Insights!from!East!Asia’,!!
Brookings$Papers$on$Economic$Activity,!The!Brookings!Institution,!2!(1998),!pp.!1–
123.!
Gleeson!JP,!Hurd!TR,!Melnik!S,!Hackett!A,!Systemic!risk!in!banking!networks!without!
Monte!Carlo!simulation,!mimeo.!
Godley,!W!and!M.!Lavoie!(2007):!Monetary!Economics:!An!Integrated!Approach!to!
Credit,!Money,!Income,!Production!and!Wealth,!Palgrave!Macmillan,!London.!
Haldane,!A!G!and!R!May!(2011),!Systemic!risk!in!banking!ecosystems,!Nature,!469,!
351>355.!

! 23!
Kinsella,!S.!and!Lyons,!R.!(2011)!‘A!Return!to!Managing!the!Irish!Economy’!in:!Ed!
Burke!and!Ronan!Lyons,!eds.,!Next$Generation$Ireland,!Dublin:!Blackhall!Press,!65–
90.!!
Kindleberger,!C.!(2005)!Manias,$Panics,$and$Crashes:$A$History$of$Financial$Crises,$
New!York:!Palgrave!Macmillan,!5th!ed.!
Kiyotaki,!N.!and!J.!Moore,!(1997):!“Credit!Cycles”,$Journal$of$Political$Economy!105!
(2):!211–248!
Kiyotaki,!N.!and!J.!Moore,!(2002):!“Balance!Sheet!Contagion”,$American$Economic$
Review,!85!(4)!46>50.!
Koo,!R!(2009)!The!Holy!Grail!of!Macroeconomics:!Lessons!from!Japan’s!Great!
Recession.!London:!Wiley.!
Lillo,!F.,!and!J.!D.!Farmer.!(2005)!‘The!Key!Role!of!Liquidity!Fluctuations!in!
Determining!Large!Price!Fluctuations’.Fluctuations$and$Noise$Letters.!5:!L209>L216!
May,!R!and!N!Arinaminpathy!(2010),!Systemic!risk:!the!dynamics!of!model!banking!
systems,!Journal$of$the$Royal$Society$Interface,!46,!823>838!
Mian,!A.!and!Sufi,!A.!(2010)!Household!Leverage!and!the!Recession!of!2007!to!2009,!
IMF!Economic$Review,$58,#74–117.!
Minsky,!H.!(1986)!Stabilizing$an$Unstable$Economy.!New!York:!McGraw>Hill.!!
Mizen!P.!(2009):!‘The!Credit!Crunch!of!2007>2008:!A!Discussion!of!the!
Background,!Market!Reactions,!and!Policy!Responses’,!Federal$Reserve$Bank$$
of$St.$Louis$Review,!90,!pp.!531>67.!
Shin,!H.!S.!(2008):!Risk!and!Liquidity!in!a!Systemic!Context,!Journal$of$Financial$
Intermediation,!17(3),!315>329.!
Wells,!S.!(2004):!“Financial!Interlinkages!in!the!UK!Interbank!Market!and!the!Risk!of!
Contagion,”!Bank!of!England!Working!Paper!230.!
!
!

Table&1:&Balance'Sheet'Matrix'in'France'and'Germany.&
! Germany&Ex.&
Rate&
France&
Sum&Households& Firms& Gov.& C.&
Bank&
Banks& Households& Firms& Gov.& C.&
Bank&
Banks&
A& B& C& D&
Fixed&Capital& ' +KGer' ' ' ' ' EGer' ' +KFra' ' ' ' ' ΣK'
High&Powered&Money& +HGer
h'd' ' ' :HGers' +HA
b'd' +HBb'd' ' +HFra
h'd' ' ' :HFras' +HC
b'd' +HDb'd' 0'
Households&Loans&:LAh'd' ' ' ' +LAh's' ' ' :LCh'd' ' ' ' +LCh's' ' 0'
:LBh'd' ' ' ' ' +LBh's' ' :LDh'd' ' ' ' ' +LDh's' 0'
Firm&Loans&' :LAf'd' ' ' +LAf's' ' ' ' :LCf'd' ' ' +LCf's' ' 0'
' :LBf'd' ' ' ' +LBf's' ' ' :LDf'd' ' ' ' +LII'2f's' 0'
Interbank&Loans& ' ' ' ' :LBb'A'd' +LBb'A's' ' ' ' ' ' :LDb'C''d' +LDb'C's' 0'
Intrabank&loans& ' ' ' ' +LAb'C's' :LDb'B'd' EGer' ' ' ' ' :LAb'C'd' +LDb'B's' 0'
Deposits&+MA
d' ' ' ' :MAs' ' ' +MC
d' ' ' ' :MCs' ' 0'
+MBd' ' ' ' ' :MGerB
s' ' +MICd' ' ' ' ' :MD
s' 0'
Bills1& +BGerh'1'd' ' :BGers' +BGercb'1'd' +BI'1b'd' +BBb'd' EGer' +BGerh'2'd' ' ' +BFracb'2'd' ' ' 0'
Bills2& +BFrah'1''d' ' ' +BFracb'1'd' ' ' EGer' +BFrah'2'd' ' :BFras' +BFracb'2'd' +BCb'd' +BDb'd' 0'
Bank&Capital& +OFA' ' ' ' :OFA' ' ' +OFC' ' ' ' :OFC' ' 0'
+OFB' ' ' ' ' :OFB' ' +OFD' ' ' ' ' :OFD' 0'
Balance& :VGer' :NWGer
f' :NWGerg' ' ' ' EGer' :VFra
' :NWFraf' :NWFra
g' ' ' ' ΣK'
Sum& 0" 0" 0" 0" 0" 0" ' 0" 0" 0" 0" 0" 0" 0"

!
!
Table&2:!Revaluation'Matrix'in'both'economies!
! Germany& France&Sum&Households& Firms&
Banks&Households& Firms&
Banks&I& II& I& II&
Fixed&Capital& ' +∆pGer.kGer:1' ' ' ' +∆pGer.kGer:1' ' ' ∆pGer.kGer:1.E1'+∆p
Fra.kFra:1'
Bank&Capital&
+∆OF'A' ' :∆OF'A' ' +∆OF'C' ' :∆OF'C' ' 0'+∆'OF'B' ' ' :∆'OF'B' +∆'OF'D' ' ' :∆OF'C' 0'

Table&3:!Transactions'Flows'Matrix'in'both'economies!
Country&1& Households& Firms& Gov.& C.&Bank&Banks&
Ex.&Rate&A& B&
Current& Capital& Current& Capital& Current& Capital& &Consumption! :C1d' +C1s' ' ' ' ' ' ' ' 'Gov.!Expen.! ' +G1
s' ' :G1d' ' ' ' ' ' '
Investment! ' +I1' :I1' ' ' ' ' ' ' 'Depreciation! ' :δ1k.'K
1' +δ1k.'K1' ' ' ' ' ' ' '
Taxes! :T1h' :T1f' ' +T1' ' ' ' ' ' 'Wages! +WB1' :WB1' ' ' ' ' ' ' ' 'Entreprene9urial!Profits! +F1f' :F1f' ' ' ' ' ' ' ' '
Bank!Profits!+FDA
b' ' ' ' ' :FAb' +FUAb' ' ' '
+FDBb' ' ' ' ' ' ' :FBb' +FUB
b' 'CB!Profit! ' ' ' +F1cb' :F1cb'
' ' ' ' 'Interest&on& ' ' ' ' ' ' ' ' ' '
Household!Loans!
:rAl:1.''LAh'd:1'
' ' ' ' +rAl:1.''LAh's:1'
' ' ' '
:rBl:1.''LBh'd:1'
' ' ' '' ' +rBl:1.''
LBh's:1'
' '
Households!default!loans!
+rAl:1.''NPLA:1'
' ' ' ' :rAl:1.''NPLA:1'
' ' ' '
+rBl:1.''NPLB:1'
' ' ' '' ' :rBl:1.''
NPLB':1'
' '
Firm!Loans! ' :rAl:1.LAf'd:1' ' ' ' +rAl:1.'
''LAf's:1'' ' ' '
! ' :rBl:1.LBf'd:1' ' ' ' ' ' +rBl:1.''
LBf's:1'' '
Interbank!Loans! ' ' ' ' ' :rBlb:1.''LBb'A'd:1'
' +rBlb:1.''LBb'A's:1'
' '
Intrabank!Loans! ' ' ' ' ' +rAlb:1.' ' :rDlb:1.' ' E1'

'LAb'I'2's:1' LDb'B'd:1'
Deposits!+rAm:1.M
Ad:1' ' ' ' ' :rI'1m:1.'
MI'1s:1'
' ' ' '
+rBm:1.MBd:1' ' ' ' ' ' ' :rBm:1.M
Bs:1' ' '
Bills1! +r1b:1.'B1'h'1'd:1' ' ' :r1b.B
1s:1'
+r1b:1.'B1cb'1'
d:1'+r1b:1.''BI'1
b'd:1'' +r1b:1.''
BBb'd:1'
' E1'
Bills2! +r2b:1.'B2'h'1'd:1' ' ' ' +r2b:1.'B
2cb'1'
d:1'
' ' ' ' E1'
∆&in&the&&stocks&of& ' ' ' ' ' ' ' ' ' '
Household!Loans!+∆LAh'
'd' ' ' ' ' ' :∆LAh'
's' ' ' '
+∆LBh''d' ' ' ' ' ' ' ' :∆LBh'
's' '
Firm!Loans!' ' +∆LAf'
'd' ' ' ' :∆LAf'
's' ' ' '
' ' +∆LBf''d' ' ' ' ' ' :∆LBf'
's' '
Interbank!Loans! ' ' ' ' ' ' +∆LBb'A''d' ' :∆LBb'A''s' '
Intrabank!Loans! ' ' ' ' ' ' :∆LAb'C's' ' +∆LBb'D''d' '
HPM! :∆H1h'd' ' ' ' +∆H1
s' ' :∆HAb'd' ' :∆HB
b'd' '
Deposits!:∆MA
d' ' ' ' ' ' +∆MAd' ' ' '
:∆MBd' ' ' ' ' ' ' ' +∆MB
d' 'Bills1! :∆B1
h'1'd' ' ' +∆B1s' :∆B1
cb'1'd' ' :∆BAb'd' ' :∆BB
b'd' E1'Bills2! :∆B2
h'1'd' ' ' ' :∆B2
cb'1'd' ' ' ' ' E1'
Default!Loans!+NPLA' ' ' ' ' ' :NPLA' ' ' '+NPLB'' ' ' ' ' ' ' ' :NPLB' '
Σ& 0' 0' 0' 0' 0' 0' 0' 0' 0' '&&&&&&&&&

&Table&3:!Transactions'Flows'Matrix'in'both'economies'(Continued)!
Country&2& Households& Firms& Gov.& C.&Banks&Banks&
Sum&C& D&
Current& Capital& Current& Capital& Current& Capital& &Consumption! :C2d' +C2s' ' ' ' ' ' ' ' 0'Gov.!Expen.! ' +G2
s' ' :G2d' ' ' ' ' ' 0'
Investment! ' +I2' :I2' ' ' ' ' ' ' 0'Depreciation! ' :δ2k.'K
2' +δ2k.'K2' ' ' ' ' ' ' '
Taxes! :T2h' :T2f' ' +T2' ' ' ' ' ' 0'Wages! +WB2' :WB1' ' ' ' ' ' ' ' 0'Entreprene9urial!Profits! +F2f' :F2f' ' ' ' ' ' ' ' 0'
Bank!Profits!+FDC
b' ' ' ' ' :FCb' +FUCb' ' ' 0'
+FDDb' ' ' ' ' ' ' :FDb' +FUD
b' 0'CB!Profit! ' ' ' +F2cb' :F2cb'
' ' ' ' 0'Interest&on& ' ' ' ' ' ' ' ' ' '
Household!Loans!
:rCl:1.''LCh'd:1'
' ' ' ' +rCl:1.''LCh's:1'
' ' ' 0'
:rDl:1''LDh'd:1'
' ' ' '' ' +rDl:1.''
LDh's:1'' 0'
Households!default!loans!
+rCl:1.''NPLC:1'
' ' ' ' :rCl:1.''NPLC:1'
' ' ' 0'
+rDl:1.''NPLD:1'
' ' ' '' ' :rDl:1.''
NPLD:1'' 0'
Firm!Loans!' :rCl:1.'L
Cf'd:1' ' ' ' +rCl:1.'
'LCf's:1'' ' ' 0'
' :rDl:1.'LDf'd:1' ' ' ' ' ' +rDl:1.'
'LDf's:1'' 0'
Interbank!Loans! ' ' ' ' ' :rDlb:1.''LDb'C'd:1'
' +rDlb:1.''LDb'C's:1'
' 0'

Intrabank!Loans! ' ' ' ' ' :rAlb:1.'LAb'C'd:1'
' +rDlb:1.'LDb'B's:1'
' 0'
Deposits!+rCm:1.M
Cd:1' ' ' ' ' :rCm:1.''
MCs:1'
' ' ' 0'
+rDm:1.'MDd:1' ' ' ' ' ' ' :rDm:1.M
Ds:1' ' 0'
Bills1! +r1b:1.'B1'h'2'd:1' ' ' ' +r1b:1.B
1cb'2'd:1' ' ' ' ' 0'
Bills2! +r2b:1.'B2'h'2'd:1' ' ' :r2b.B
2s:1' +r2b:1.B
2cb'2'd:1
' +r2b:1.'BC
b'd:1'' +r2b:1.'
BDb'd:1'
' 0'
∆&in&the&&stocks&of& ' ' ' ' ' ' ' ' ' 0'
Household!Loans!+∆LCh'
'd' ' ' ' ' ' :∆LCh'
's' ' ' 0'
+∆LDh''d' ' ' ' ' ' ' ' :∆LDh'
's' 0'
Firm!Loans!' ' +∆LCf'
'd' ' ' ' :∆LCf'
's' ' ' 0'
' ' +∆LDf''d' ' ' ' ' ' :∆LDf'
's' 0'
Interbank!Loans! ' ' ' ' ' ' +∆LDb'C''d' ' :∆LDb'C'
's' 0'
Intrabank!Loans! ' ' ' ' ' ' +∆LAb'C'd' ' :∆LDb'B''s' 0'
HPM! :∆H2h'd' ' ' ' +∆H1
s' ' :∆HCb'd' ' :∆HD
b'd' 0'
Deposits!:∆MC
d' ' ' ' ' ' +∆MCd' ' ' 0'
:∆MDd' ' ' ' ' ' ' ' +∆MD
d' 0'Bills1! :∆B1
h'2'd' ' ' ' :∆B1cb'2'd' ' ' ' ' 0'
Bills2! :∆B2h'2'd
' ' ' +∆B2s' :∆B2
cb'2'd' ' :∆BC
b'd' ' :∆BDb'd' 0'
Default!Loans!+NPLC' ' ' ' ' ' :NPLC' ' ' 0'+NPLD' ' ' ' ' ' ' ' :NPLD' 0'
Σ& 0' 0' 0' 0' 0' 0' 0' 0' 0' 0'
!