Bacteria That Resist Centrifugal Force - STARS
59
University of Central Florida University of Central Florida STARS STARS Honors Undergraduate Theses UCF Theses and Dissertations 2018 Bacteria That Resist Centrifugal Force Bacteria That Resist Centrifugal Force Nickolas Kessler University of Central Florida Part of the Bacteriology Commons Find similar works at: https://stars.library.ucf.edu/honorstheses University of Central Florida Libraries http://library.ucf.edu This Open Access is brought to you for free and open access by the UCF Theses and Dissertations at STARS. It has been accepted for inclusion in Honors Undergraduate Theses by an authorized administrator of STARS. For more information, please contact [email protected]. Recommended Citation Recommended Citation Kessler, Nickolas, "Bacteria That Resist Centrifugal Force" (2018). Honors Undergraduate Theses. 332. https://stars.library.ucf.edu/honorstheses/332
Transcript of Bacteria That Resist Centrifugal Force - STARS

University of Central Florida University of Central Florida
STARS STARS
Honors Undergraduate Theses UCF Theses and Dissertations
2018
Bacteria That Resist Centrifugal Force Bacteria That Resist Centrifugal Force
Nickolas Kessler University of Central Florida
Part of the Bacteriology Commons
Find similar works at: https://stars.library.ucf.edu/honorstheses
University of Central Florida Libraries http://library.ucf.edu
This Open Access is brought to you for free and open access by the UCF Theses and Dissertations at STARS. It has
been accepted for inclusion in Honors Undergraduate Theses by an authorized administrator of STARS. For more
information, please contact [email protected].
Recommended Citation Recommended Citation Kessler, Nickolas, "Bacteria That Resist Centrifugal Force" (2018). Honors Undergraduate Theses. 332. https://stars.library.ucf.edu/honorstheses/332

BACTERIA THAT RESIST CENTRIFUGAL FORCE
by
NICKOLAS GLEN KESSLER
A thesis submitted in partial fulfillment of the requirements
for the Honors in the Major Program in Biomedical Sciences
in the College of Medicine
and in the Burnett Honors College
at the University of Central Florida
Orlando, Florida
Spring Term, 2018
Thesis Chair: Dr. Sean D. Moore

ii
© 2018 Kessler

iii
ABSTRACT
Our lab discovered that approximately 1 in 10,000 Escherichia coli cells in stationary phase remain
in suspension after a high g-force centrifuge event. To establish the mechanism behind this curious
phenotype, multiple mutant strains of E. coli were independently evolved such that the majority of
their populations resisted migration when exposed to high centrifugal forces. Genomic DNA
sequencing of the mutants’ revealed unique, isolated mutations in genes involved in capsule
synthesis and exopolysaccharide (EPS) production. Each mutant exhibits a novel mechanism that
allows them to remain in suspension. The mutants were further characterized by determining their
growth rates, strengths of resistance to various centrifugal forces, the phenotype’s dependence on
a carbon source, and timing of the phenotype’s presentation. The results revealed: comparable
mutant generation times to the wild-type strain, variable resistance to centrifugal force, phenotype
dependence on carbon source, and phenotype presentation during early stationary phase. To
interrogate the mechanism by which these cells stay in suspension the production of EPS was
quantified, and gene knock-outs were performed. Quantification of the EPS revealed
approximately a seventeen-fold increase in EPS in the mutants’ compared to the wild-type strain.
Gene knock-outs revealed the EPS produced can be attached to the outer-membrane or freely
secreted into the media by different mechanisms. In addition, this mechanism was further
confirmed as being responsible for the centrifuge resistant trait by attaching extracted EPS to
polystyrene microspheres. Experimental results show that mutant extracted EPS treated beads
caused increased bead retention in suspension compared to wild-type EPS treated beads. These
results reveal that E. coli is using a novel mechanism to adapt to a new environmental factor
introduced to remove the bacteria. With the discovery of this mechanism and the transferability to

iv
inorganic objects industrial applications are now envisioned where particle sedimentation is
controllable and mixtures remain homogenized by attaching optically transparent biomolecules.

v
ACKNOWLEDGEMENTS
Thank you to my thesis chair, Dr. Sean D Moore, for his knowledge and mentorship throughout
this project. Thank you to all of the members of the Moore lab who also provided help during the
process. This accomplishment would not have been possible without the vast knowledge and
guidance from those before me. Thank you to my wonderful girlfriend Alexia for all of her help
and support each and every day. Lastly, I would like to thank my family: my father for being the
epitome of a role model and inspiration to achieve my dreams, my grandfather for always
encouraging me and teaching me the importance of hard work and dedication, my mother for her
unconditional love, support, and inspirational courage in the face of life’s many adversities.
It is truly a blessing to have such an elite group to learn from.

vi
TABLE OF CONTENTS
LIST OF FIGURES ..................................................................................................................... viii
LIST OF TABLES ......................................................................................................................... ix
LIST OF ACRONYMS/ABBREVIATIONS ................................................................................. x
I. INTRODUCTION ....................................................................................................................... 1
1.1 Escherichia coli .................................................................................................................... 1
1.2 Bacterial evolution ................................................................................................................ 1
1.3 Bacterial persistence ............................................................................................................. 2
1.4 Biofilms................................................................................................................................. 3
1.5 Colanic acid .......................................................................................................................... 3
1.6 Preliminary studies................................................................................................................ 5
II. MATERIALS AND METHODS ............................................................................................... 6
2.1 Research objectives and design ............................................................................................ 6
2.2 Evolving mutants that resist centrifugal force ...................................................................... 6
2.3 Growth rate studies ............................................................................................................... 7
2.4 Strength of resistance ............................................................................................................ 8
2.5 Timing of phenotype expression ........................................................................................... 8
2.6 Growth medium’s effect on phenotype................................................................................. 9
2.7 Genomic DNA ...................................................................................................................... 9
2.8 Exopolysaccharide release .................................................................................................. 10
2.9 Exopolysaccharide quantification ....................................................................................... 11
2.10 Coli genetic stock center ................................................................................................... 12
2.11 Phage-P1 transduction ...................................................................................................... 13
2.12 Polymerase chain reaction ................................................................................................ 15
2.13 Restriction enzyme digest ................................................................................................. 16
2.14 Ethidium bromide gel electrophoresis .............................................................................. 16
2.15 Bio-conjugation of CA ...................................................................................................... 17
III. RESULTS ............................................................................................................................... 18
3.1 Mutants that resist centrifugal force ................................................................................... 18
3.2 Effect of mucoid phenotype on growth rate ....................................................................... 20
3.3 Strength of resistance to centrifugal force .......................................................................... 23

vii
3.4 Effect of growth media on phenotype ................................................................................. 25
3.5 Timing of phenotype presentation ...................................................................................... 27
3.6 DNA sequencing ................................................................................................................. 29
3.7 Exopolysaccharide quantification ....................................................................................... 31
3.8 waaL knock-out .................................................................................................................. 35
3.9 Bio-conjugation................................................................................................................... 37
IV. DISCUSSION ......................................................................................................................... 39
Future studies and applications ................................................................................................. 44
V. REFERENCES......................................................................................................................... 45

viii
LIST OF FIGURES
Figure 1. Structure of colanic acid .................................................................................................. 4
Figure 2. Mutants that resist sedimentation by centrifugal force.................................................. 19
Figure 3. Growth study A600 data .................................................................................................. 21
Figure 4. Generation time equation .............................................................................................. 22
Figure 5. Strength of resistance to centrifugal force ..................................................................... 24
Figure 6. Forced sedimentation of mutant C02 ............................................................................ 24
Figure 7. Growth media’s effect on mutants’ resistance to centrifugal force ............................... 26
Figure 8. Timing of centrifuge resistant phenotype presentation. ................................................ 28
Figure 9. Genomic DNA gel. ........................................................................................................ 30
Figure 10. L-fucose absorbance spectrum and standard curve... .................................................. 32
Figure 11. Total methyl pentose polymer absorbance spectrum. ................................................. 33
Figure 12. Supernatant methyl pentose polymer absorbance spectrum. ....................................... 34
Figure 13. Agarose DNA gel of waaL mutant transduction recipients. ..................................... 36
Figure 14. 1.0 m polystyrene micro-spheres treated with CA extract. ....................................... 38
Figure 15. Absorbance spectrum of 1.0 m polystyrene micro-spheres treated with CA ............ 38
Figure 16. WaaL mechanism of EPS attachment to LPS ............................................................. 42
Figure 17. New predicted EPS covalent attachment model via Wza translocon .......................... 43

ix
LIST OF TABLES
Table 1. Generation times at 30 C ............................................................................................... 22
Table 2. Mutated genes revealed by genomic DNA sequencing of the mutants and the genes’
putative actions. ............................................................................................................................ 30
Table 3. Total methyl pentose polymer concentrations of the mutants and wild-type. ................ 33
Table 4. Supernatant methyl pentose polymer concentration of the mutants and wild-type ........ 34
Table 5. waaL mutants total culture and supernatant methyl pentose polymer concentration... 36

x
LIST OF ACRONYMS/ABBREVIATIONS
EPS – Exopolysaccharide
CA – Colanic Acid
LPS – Lipopolysaccharide
yea* – yeaI, yeaJ’, yrfF A564P (mutant C06)
LB – Lysogeny Broth
RCF – Relative Centrifugal Force
OM – Outer-membrane
cps – capsule synthesis operon

1
I. INTRODUCTION
1.1 Escherichia coli
E. coli is a Gram-negative, rod-shaped prokaryote that can grow in aerobic or anaerobic conditions
and has an optimal growth rate at 37 C [1, 2]. E. coli is often used as a research model because it
is a well understood organism that has a variety of metabolic capabilities, and can synthesize all
cellular components from basic nutrients. Some of E. coli’s other notable qualities ideal for
research studies are its quick generation time, gene uptake abilities, ease of isolation, hardiness,
and low cost requirements [3].
1.2 Bacterial evolution
Environmental pressures can reduce the viability of phenotypically unfit bacteria, allowing cells
with certain characteristics to outcompete and gain reproductive advantage over others. The
evolution and adaptation of a species is a result of genetic variability, favoring an organism best
suited for the environment. This is consistent with Darwin’s theory of natural selection. Small
changes in an organism’s genome due to mutation can potentially lead to a better adapted species.
It is believed that these genetic mutations are present before and occur independently to the
exposure of an environmental factor [4]. This observation seems to be the case with the E. coli
mutants that have been isolated for this study. The mutant strains were isolated by selecting for a
small fraction of the population that expressed the trait that allowed them to remain in suspension
after being subjected to a large centrifugal force [5]. If genetic variants were not present in the
population before the exposure, all the bacterium would sediment in the same manner.

2
Furthermore, this could explain why each mutant isolated, regardless of what centrifugal force was
used to generate the strain, is unique in its resistance to sedimentation.
1.3 Bacterial persistence
Bacterial persistence is a transient physiological response that is present in a small percentage of
the population [6]. Persistence is characterized by a state of reduced growth that allows a small
subset of the bacterial population to survive exposure to unexpected environmental elements [6].
An example of this characteristic is bacterial response to treatment with antibiotics. After exposure
to antibiotics, most bacteria die off, however, due to the presence of cells in the “persistent” state
at the time of exposure, some bacteria survive and remain in this state until reinstated into a
preferable environment. Once these cells are moved to fresh medium, they can resume growth and
form new colonies. Interestingly, these new colonies are not antibiotic resistant. If treated with
another round of antibiotics, they are just as susceptible as before. This supports the notion that
bacterial persistence is a temporary phenotypic state that is either on or off at any given time. On
the other hand, antibiotic resistance is a trait that that is always present in the genome or on a
plasmid, allowing bacteria to have continuous growth in the presence of antibiotics [7]. When
developing the mutants, the small percentage of the population that consistently resisted
sedimentation in the presence of centrifugal force was selected for and isolated. However, if these
cells are carried over to grow a new generation they do not exhibit the centrifuge resistant trait. In
light of this, it is believed that there is a regulatory mechanism at the epigenetic level controlling
this trait. Once the transition to a dominant centrifuge resistant mutant occurred, it seems that these
cells had a permanent change in their genomic DNA to consistently present this trait.

3
1.4 Biofilms
Preliminary observations noted that when the mutants are grown on solid medium, they produce
a colony morphology that is phenotypically distinct from the wild-type. This distinct morphology
has increased biomass and a mucoid-like appearance characteristic of a biofilm. Biofilms consist
of an aggregation of bacterial cells on a surface that produce a protective matrix [8]. They represent
a form of protected growth that give bacteria the ability to maintain a relatively constant local
environment in the presence of changing external conditions. This allows for rapid adaptation to
various environmental factors [9]. Bacterial biofilms cause persistent microbial growth. The
increased exterior bio-mass reduces the interior cells’ exposure to deleterious agents, making these
colonies much harder to remove [8]. Persistent bacterial infections due to biofilm formation are
responsible for chronic infections in the medical field. The increase in bio-mass could decrease the
effectiveness of antibiotics by decreasing the drug’s penetrance, or decreasing the amount of
extracellular material the cell uptakes. This is an area in need of further research because antibiotics
are effective at treating planktonic bacterial infections, but not biofilm infections as seen in the
disease Cystic Fibrosis [8].
1.5 Colanic acid
The increase in colony size, morphological changes, and mucoid appearance seen in the mutants
is characteristic of increased exterior cell biomass. Colanic acid (CA) has been noted to increase
the volume of bacterial biofilms and produce a mucoid colony appearance [10, 11]. However,
unlike biofilms that are composed of a community of cells with varying phenotypic expression,
each cell in the mutant’s population seems to express an individual protective coat believed to be

4
composed of the EPS CA. CA is a repeating poly-anionic hetero-polysaccharide made up of: D-
glucose, L-fucose, L-fucose. Branching off of this backbone chain is a three-unit polysaccharide
consisting of: D-galactose, D-glucuronic acid, and D-galactose. In E. coli, the terminal D-galactose
is thought to contain a pyruvate group attached to positions 4 and 6. The first L-fucose is believed
to be acetylated at position 2 [12]. EPSs like CA have been noted to range in size from 0.5 to 2
mega-Daltons [13].
Figure 1. Structure of colanic acid. Schematic representation of colanic acid repeating polymer.
CA is believed to act as a protective capsule around bacteria that is produced in response to
destabilization of the outer cell membrane, low temperatures, and solid surface growth [10, 14,
15]. It has been observed that production of CA makes bacteria resistant to bacteriophage
infections by decreasing the phage’s ability to reach the cell membrane. In this context, CA
production is a form of bacterial persistence and could be responsible for phage-resistant infections
[10].
5
1.6 Preliminary studies
Our laboratory noted that a small fraction, approximately 1 in 10,000, E. coli cells stay in
suspension after a hard centrifuge event (15,000 RCF, 10 min). It was discovered that using these
bacteria to grow a new culture does not generate a centrifuge resistant strain initially. However,
over multiple generations of reiterating this process this minority phenotype became the majority.
A centrifuge resistant mutant was noted when an uncondensed pellet and an opaque medium was
observed compared to the wild-type post centrifugation. Further investigation revealed that these
cells are not less dense than the surrounding medium and they are not expending energy to swim
against the centrifugal force.
6
II. MATERIALS AND METHODS
2.1 Research objectives and design
To identify the molecular mechanism E. coli is using to resist centrifugal force, multiple mutant
strains were independently evolved such that the majority of the cell population exhibited the
centrifuge resistant trait and mucoid phenotype. Three mutant strains and a wild-type parental
strain were used for experiments. The generation time of each strain was identified to determine if
the phenotype had an effect on growth physiology. To characterize this centrifuge resistant trait,
the strength of each mutant was determined, the effect of different growth media on the phenotype,
and the timing of phenotype’s presentation. Genomic DNA was sequenced to determine mutations
responsible for the mechanism. A colorimetric assay was used to quantify EPS production in the
mutants. Phage P1 transductions were used to knockout genes involved in CA linkage to determine
how CA is associated with the membrane.
2.2 Evolving mutants that resist centrifugal force
E. coli strain BW30270 (CGSC #7925) was used for the evolution experiments. This strain is a
prototrophic lineage of MG1655 and its genome has been sequenced by the Moore lab. E. coli
cells were streaked-out for isolation of colonies on agar prepared with Lysogeny Broth medium
with 5 % sodium chloride (“Lennox”, LB) supplemented with 0.2% glycerol and incubated 18
hours at 30 C. An isolated colony was chosen and inoculated in 10 mL of LB (0.2% glycerol) in
a 125 mL baffled Erlenmeyer flask. For each evolution selection cycle, the culture was then grown
to stationary phase at 30 C in a shaking incubator at 220 rpm for 18 hours. A 1 mL aliquot of the
culture was transferred to a 1.7 mL microcentrifuge tube and centrifuged at 3,250 RCF for 10

7
minutes. 750 L of the supernatant was sampled and dispensed into a freezer stock tube with 250
L of 50 % glycerol. The freezer stock was thoroughly mixed and 200 L of the freezer stock
were used to inoculate a new culture of 10 mL LB-glycerol in a 125 mL flask. Each consecutive
inoculation, after following the protocol above, was noted as a new generation.
This procedure was repeated until the presence of an uncondensed pellet and cloudy supernatant
of bacteria was observed post-centrifugation. At this generation, the sample was streaked on LB
agar and grown at 30 C overnight. A representative colony was then chosen that matched the
dominant phenotype, which was consistently mucoid for each independent lineage. Stocks from
the isolated colony were grown again in parallel to the wild-type parental strain to confirm the
centrifugation phenotype and then given a reference name.
2.3 Growth rate studies
Mutant and the wild-type strains were grown overnight in 10 mL LB-glycerol, 125 mL flasks, 30
C, in a shaking incubator at 220 rpm. After 18 hours of growth, the samples were diluted 1:100
using 990 L of LB-glycerol and 10 L of culture. The samples were vortexed and three
aspirations of 75 L 1:100 dilution and LB blank, was dispensed into a Corning Costar
polystyrene assay plate, 96-well, clear, clear flat bottom, non-treated, with a lid. The 96-well plate
was then inserted into a spectrophotometer and data was obtained using BioTek Gen5 software.
The spectrophotometer measurement settings were: 30 C, slow continuous shake, absorbance
measurement at 600 nm every 5 minutes, over 16 hours.

8
2.4 Strength of resistance
Mutant and wild-type strains were grown up overnight in 10 mL LB-glycerol, in 125 mL flasks,
30 C, in a shaking incubator at 220 rpm for 18 hours. Eleven 1 mL samples of the cultures was
dispensed into a 1.7 mL microcentrifuge tube. The samples were centrifuged at various speeds
calculated by using this radial distance of the sample spot, 0.5 mL mark, from the axis of the
centrifuge. This determined the centrifugal force experienced by the cells where sample
measurements were taken from.
Ten centrifuge spins were performed in 1,000 RCF increments. Starting at 1,000 RCF and ending
at 10,000 RCF. One final centrifuge spin was performed with an experienced force at the 0.5 mL
mark of 15,000 RCF. After centrifugation, 100 L of each sample were aspirated from the 0.5 mL
mark and dispensed into a 96-well plate. The absorbance of the samples was measured at 600 nm
and a LB-glycerol blank was subtracted from these values. The turbidity of each mutant sample at
the 0.5 mL mark was compared to the wild-type at the same position and was used to determine
the “strength” of each of the strains’ resistance to centrifugal force.
2.5 Timing of phenotype expression
2 mL of the Mutants and wild-type cultures grown for 18 hrs in LB-glycerol (0.2%) were used to
inoculate 18 mL of fresh LB-glycerol (0.2%) in a 125 mL flask. After the 1:10 inoculation, cultures
were thoroughly mixed. A 1 mL sample was removed and the flask was placed in a 30 C, shaking
incubator at 220 rpm. 1 mL was subsequently removed every 30 min from the start of incubation.

9
The 1 mL samples were spun at 3,000 RCF for 3 min. 100 L was removed from the 0.5 mL mark
and dispensed into a 96-well plate. Using a spectrophotometer, the OD600 was measured.
2.6 Growth medium’s effect on phenotype
Three different LB broth medias were prepared: LB no supplemental carbon source, LB 0.2%
glycerol, and LB 0.2% glucose. Wild-type and the mutants were separately inoculated into 10 mL
of the three medias mentioned above in a 125 mL flask and grown to stationary phase in a 30 C
shaking incubator at 220 rpm. Three, 1 mL aspirations of each sample removed and dispensed
into a microcentrifuge tube. The samples were spun at 11,000 RCF for 3 min. 75 L were
removed from the 0.5 mL mark of the microcentrifuge tube and dispensed into a 96-well plate,
and the absorbance at 600 nm was measured in spectrophotometer.
2.7 Genomic DNA
Due to the inability to pellet and harvest the mutant cells, a unique genomic DNA extraction
method was adapted for this study. The mutant strains were grown at 30 C, on agar LB-glycerol
plates for 18 hours. Colonies were scraped from the plate using a pipette tip and inserted into a
screw cap microcentrifuge tube with 0.1 mm zirconia/silica disruption beads added up to the 100
L mark on the tube. Cells were re-suspended in 400 L of P1 resuspension buffer (50 mM Tris-
Cl, pH 8.0, 10 mM EDTA, 100 g/mL RNase A).
The cells were placed into a MP FastPrep-24 homogenizing instrument and lysed using the preset
E. coli settings. Samples were spun at full speed for 1 min in a microcentrifuge. The lysing step

10
and full speed spin steps were repeated a second time to ensure thorough cell lysis. The aqueous
phase was removed, avoiding cell debris and beads, then placed in a clean microcentrifuge tube.
500 L of gel melting buffer (5.5 M guanidine thiocyanate, 100 mM acetic acid, potassium-acetate
pH 5.0) were added to the aqueous phase. The sample was vortexed and lightly spun to remove
liquid from the cap.
To the samples, 250 L of isopropanol was added, vortexed, and spun at full speed. The
supernatant was removed carefully, avoiding the cell pellet, and dispensed into a silica column
spin tube and spun at 2,000 RCF for 30 seconds. The sample run-through was pipetted back on top
of the column and spun through the column a second time to increase binding efficiency. The run-
through was then discarded. 200 L of gel melting buffer was added to the column and spun down.
The column was washed three times with 200 L of column wash buffer. 5X column wash buffer
(CWB) was prepared by combining: 20 mM K-HEPES, 100 mM NaCl, 0.1 mM EDTA, pH 8.2.
From the 5X CWB 10 mL was diluted in 40 mL of 95% ethanol, final pH above 7.5. The column
was spun at full speed for 1 min for drying. 50 L of DNA buffer (2.5 mM Tris-Cl pH 8.0, 1 mM
EDTA) was added to the column and spun down. The run-through was added back to the column
a second time for thorough elution of the DNA. Samples of DNA were quantified using a
NanoDrop 3300 Fluorospectrometer and sent for Illumina DNA sequencing.
2.8 Exopolysaccharide release
Mutant and wild-type cultures were inoculated from isolated colonies on agar (LB-glycerol) plates
and grown in 10 mL LB-glycerol in a 125 mL flask at 30 C, in a shaking incubator at 220 rpm

11
for 18 hours. The optical density at 600 nm (OD600) was measured in a 96-well plate to determine
the density of the cultures. The Soosang Kang et al. (1966) protocol for the release of
exopolysaccharides was followed with minor modifications [16]. 3 mL of overnight cultures were
dispensed into large glass test tubes and placed into a boiling H2O bath for 15 min. Once the
samples finished boiling, 1.5 mL of the supernatant was removed and placed into 1.7 mL
microcentrifuge tubes and centrifuged for 10 minutes at 8,000 RCF using a Sorval SS-34 rotor at
room temperature. After centrifugation, the supernatant of each sample was transferred into 3,500
MWCO dialysis tubing (Thermo Scientific) and clamped at the ends. The samples were then
placed into 800 mL of deionized water in a 1 L beaker with a magnetic stir bar. Samples were
dialyzed against deionized H2O (diH2O) for 2 hours and then exchanged for another 800 mL of
diH2O. After another two hours, the diH2O was exchanged a final time and the samples were
dialyzed overnight with stirring. Samples were carefully removed from dialysis tubing taking note
of the volume removed from the bag. A final 50 mL sample of the dialysate was kept for the
standard curve used to quantify CA. A separate methyl pentose quantification control procedure
was performed on the final dialysate exchange and compared to diH2O to confirm thorough free
fucose removal [16].
2.9 Exopolysaccharide quantification
The protocol from Zacharias Dische, (1947) for methyl pentose quantification was followed with
minor modifications for quantification of exopolysaccharide production [17]. Using 10 mL of
dialysate and 0.1 g of L-fucose, a 1% fucose solution was made. From this, a 1:10 dilution of the
1% fucose with dialysate was made, and then subsequent ½ dilutions were made from the 0.1 %

12
fucose solution. The percent fucose samples used for the standard curve were 0.025%, 0.0125%,
0.00625%, 0.003125%, and 0.00156%. The calculated M concentration converted from % fucose
used for the standard curve were: 1520 M, 761 M, 381 M, 190 M, and 95 M respectively.
L-fucose, a methyl pentose, is a constituent of CA [18]. 200 L of the mutant samples and fucose
concentrations were then dispensed into a large glass test tube and mixed with 2.25 mL of 3:1
sulfuric acid to diH2O. The reaction was allowed to cool to room temperature in a diH2O bath. The
samples were then boiled for 10 minutes in a water bath. After boiling, the samples were placed in
a room temperature water bath and cooled to 25 oC. Next, 50 L of 3% cysteine-hydrochloride
were added to the samples and allowed to react for 30 minutes at room temp with intermittent
mixing. 130 L of the samples were then transferred to a quartz cuvette and the absorbance was
measured from 300 nm to 500 nm using a spectrophotometer using the BioTek Gen5 program.
The absorbance values of the fucose solutions were used to make a standard curve [17].
2.10 Coli genetic stock center
E. coli strains with select non-essential genes replaced by kanamycin resistance genes, referred to
as knock-outs, were ordered from the Coli Genetic Stock Center (CGSC). The gene knock-outs
ordered were chosen by proximity to mutated regions noted in the genomic DNA sequences, and
whether the gene was involved in CA synthesis. Strains received from the CGSC were on filter
disks. Agar LB-glycerol plates with approximately 20 g/mL of kanamycin were prepared. The
filter disks were placed on the agar plates with kanamycin selection and wet with 30 L of LB-
glycerol. Using a streaking stick, a streak was made from the disk downward on the plate. A new
stick was used to streak in and out from this line in a zig-zag pattern. Agar plates were placed in

13
37 C incubator overnight. An isolated colony was used to inoculate a 1 mL LB-glycerol with 20
g /mL Kanamycin (kan) culture and placed in a 37 C incubator shaking at 220 rpm. After 18
hours of growth, a freezer stock was made and labeled with the relevant knock-out gene and drug
marker kan. The strain used for this study was rfaL734(del)::kan, also referred to as JW3597-1
[19].
2.11 Phage-P1 transduction
Knock-out strains were streaked for isolation on agar LB-glycerol, kan 20 g/mL plates. These
strains were referred to as donor strains. Mutant wild-type strains were also streaked on agar plates
with drug selection as controls for antibiotic activity and are referred to as recipient strains. An
isolated colony of the donor strain was used to inoculate 1 mL of LB-glycerol, 20 g/mL kan and
grown for 18 hours. 10 L of the overnight cultures were used to inoculate 990 L of P1-LB and
placed in a 37 C incubator shaking at 220 rpm. P1-LB was made by combining 40 mL LB-
glycerol, 200 L 1 M CaCl2, 200 L 2.5 M MgCl2, and 200 L of 20% glucose solution. A 1 mL
mock-culture consisting of 40 L of phage in P1-LB and a mock-infection with 1 mL of culture
were included for comparison [20].
A noticeable turbidity began to appear in the cultures after approximately 1 hour. At this point 40
L of a pre-existing lab stock of P1-phage was added to each sample and were placed back into
the incubator. Once the culture turbidity cleared and the sample looked similar to the mock-culture
control, the samples were removed from the incubator. 75 L of chloroform was added to the

14
samples, vortexed, and let stand for 8 min. The sample was then moved to a microcentrifuge tube
and spun in a centrifuge at max speed for 5 min. The clear supernatant was then aspirated and
moved to a clean microcentrifuge tube. 50 L of chloroform was added to this stock and stored in
a 4 C fridge. This sample was noted as the donor library for the desired knock-out gene and was
labeled with the donor strain and kanamycin-resistance.
The recipient strains, C02, C05, C06, were streaked on agar LB-glycerol plates, without
kanamycin selection. An isolated colony was used to grow a 1 mL LB-glycerol culture overnight
in 37 C incubator shaking at 220 rpm. The culture was transferred to a microcentrifuge tube and
harvested at 3,000 RCF for 3 min. The growth medium was then aspirated and the cells were re-
suspended in 400 L of P1-LB. 100 L of culture was used for each transduction. 100 L of
recipient cells and 100 L of phage library stock were combined in a clean microcentrifuge tube
and rapidly mixed. Samples in the microcentrifuge tubes were then placed into a large flask and
put in a 37 C incubator shaking at 220 rpm. At this point the infection had started and after 30
min of incubation the samples were pulled out of the incubator. Once the samples were removed,
a light spin was used to collect liquid from the top of tube.
Next, 200 L of 1 M Na-citrate and 1 mL of fresh LB-glycerol was added to the samples. The
samples were then placed back into the incubator for 1 hour. After incubation, the tubes were
moved to a microcentrifuge and the cells were harvested at 5,000 RCF for 5 min. The supernatant
was carefully removed using a pipette, without disturbing the cell debris, and discarded. To the
concentrated cells, 100 L of LB-citrate (LB supplemented with 100 mM Na-Citrate pH 5.5) were

15
added. The samples were capped and vortexed to re-suspend the cells. The contents were then
transferred to an agar LB-glycerol plate with 20 g/mL kan and evenly distributed with a spreader.
The plates were placed in a 30 C incubator for 18 hours.
From this plate, 4 colonies were chosen and re-streaked again on a selective agar-glycerol plate
containing 1-5 mM Na-citrate, 20 g/mL kan. One colony was streaked for isolation in each
quadrant. These plates were grown for 18 hours at 30 C. From these plates, an isolated colony
was chosen from each quadrant and suspended in 5 L of diH2O. 1 L of this was used as the
template DNA for a PCR reaction with relevant primers. 100 L of LB-glycerol was then added
to the remaining 4 L and half of this was used to grow an overnight culture under kanamycin
selection. Using the overnight culture, a freezer stock was made [20].
2.12 Polymerase chain reaction
Using the re-streaked transduced cells, grown on agar LB-glycerol with 20 g/mL kan, an isolated
colony was touched with a pipet tip and re-suspended in 5 L of diH2O. A master-mix was
prepared with: 2X OneTaq Hot Start Master Mix with Standard Buffer (New England
BioLabs), diH2O, 200 nM forward primer, 200 nM reverse primer, and 1 L of re-suspended
colony. 25 L was used for each reaction. NEB’s 2X OneTaq Hot Start Master Mix with
Standard Buffer protocol was followed exactly. Primer annealing temperature was calculated using
template nucleotides and NEB’s online calculator. A BIO RAD thermocycler was used for PCR
reaction.

16
Thermocycler settings: Step 1 - 94 C 30 sec, Step 2 – 94 C 30 sec, Step 3 – 53 C 45 sec, Step
4 – 68 C 1 min 40 sec, Step 2, 3, 4 repeated 29 times, Step 5 – 68 C 5 min, Step 6 – 18 C 10
min.
2.13 Restriction enzyme digest
Targeted gene replacement by kanamycin resistance was confirmed using restriction enzyme
digestion. The restriction enzyme Eag 1 (NEB) was used because of its specificity for a cut site
in the kanamycin resistance gene in the transduced mutants. 2 L of the amplified colony PCR
product was mixed with 0.6 L of Eag 1 and placed into a 37 C incubator or 1 hour with periodic
mixing. Samples were then loaded into a 1% agarose gel.
2.14 Ethidium bromide gel electrophoresis
1 g of agarose was dissolved in 100 mL of TBE buffer: 50mM Tris, 50 mM Borate, 0.5 mM
EDTA. The solution was heated in a microwave and mixed until the agarose was completely
dissolved. 7 L of Ethidium Bromide were added to the warm solution and mixed. The solution
was then poured into a casting tray with a twelve well lane comb. The solution was allowed to
cool until it solidified and the comb was removed.
The gel was removed from the casting tray and placed into a BIO-RAD gel electrophoresis tank.
TBE buffer was added to the tank until the gel was submerged and 14 L of Ethidium Bromide
was added to the buffer and mixed. 2 L of Bromophenol Blue load dye and 2 L of each DNA

17
sample were mixed. Bromophenol Blue load dye was prepared by combining: 1 mL 50%
glycerol, 4 L 250 mM EDTA, 1 L 10% SDS, 20 L Bromophenol Blue. The total 4 L mix
was aspirated and dispensed into the corresponding well of the agarose gel. Leads from the
power supply were connected to the tank and power setting was set to 120V. Electrophoresis was
allowed to proceed for 30 min, and the gel was visualized using a proteinsimple imager.
2.15 Bio-conjugation of CA
CA extracted from the mutants and wild-type used for the colorimetric assay were buffer
exchanged using 3500 MWCO dialysis tubing. Samples were dialyzed against 50 mM Na-MES,
and 100 mM NaCl for 2 hrs. 1 mL of CA samples was combined with 100 L of 1:10 dilution of
blue, amine coated, 1.0 m, polystyrene microspheres from Polysciences, Inc. in a 5 mL snap
cap microcentrifuge tube. 1 mL of 50 mM Na-MES, and 100 mM NaCl was added to the CA-
bead reaction. Samples were allowed to react overnight at room temp. Samples were centrifuged
in a swinging bucket centrifuge at 3,200 RCF for 8 min. 100 L were removed from the 1 mL
marked and dispensed into a 96-well plate. The absorbance spectrum was measured from 500 nm
to 700 nm, to quantify the amount of beads in suspension. A photo was taken of tubes post-
centrifugation to visually confirm blue beads stayed in suspension.

18
III. RESULTS
3.1 Mutants that resist centrifugal force
Opaque supernatant and an uncondensed pellet, post-centrifugation, marked the presence of a
mutant. The mutant phenotype was further confirmed by the presence of mucoid like colonies on
agar LB-glycerol plates (Figure 1).

19
A) B)
Figure 2. Mutants that resist sedimentation by centrifugal force. Wild-type and evolved mutants centrifuged at 15,000 RCF for 3 minutes (A).
Mutant mucoid phenotype on agar LB-glycerol (0.2%) (B). Post-centrifugation the mutants’ revealed an opaque supernatant and uncondensed pellet.
The mutant strains were streaked on solid medium plates and revealed a large mucoid colony phenotype compared to wild-type.
20
3.2 Effect of mucoid phenotype on growth rate
A growth study performed on the mutants and wild-type strain to compare the doubling time and
general cell growth physiologies. The mutants’ generation times were comparable to the wild-
type’s.

21
Figure 3. Growth study A600 data. A600 absorbance measured every 5 min for 18 hours at 30 C. Error bars
represent standard deviation from the mean.
0
0.1
0.2
0.3
0.4
0.5
0.6
0.7
0.8
0 100 200 300 400 500
A6
00
Time (min)
Growth Curve
C06
C05
C02
WT

22
Figure 4. Generation time equation. A600 values were Log2 transformed and derived to determine the most linear
region of growth. This region was plotted and fit with the linear equation line. The inverse of the slope from the
equation was used to determine the generation times of the mutants and wild-type.
Wild-type 36.9 min
C02 36.2 min
C05 36.9 min
C06 36.1 min
Table 1. Generation times at 30 C
y = 0.0271x - 6.8938
R² = 0.9993
y = 0.0276x - 6.8694
R² = 0.9998
y = 0.0271x - 6.9972
R² = 0.9987
y = 0.0277x - 7.0045
R² = 0.9994-5.3
-5.2
-5.1
-5
-4.9
-4.8
-4.7
-4.6
-4.5
-4.4
-4.3
60 65 70 75 80 85 90 95
Log
2A
60
0
Time (min)
Generation Time Equation
WT
C02
C05
C06

23
3.3 Strength of resistance to centrifugal force
Pre-spin culture samples (0 RCF) of the mutant have the same amount of colony forming units
(CFU) as the wild-type. Wild-type cells pellet out of suspension immediately at low g-force spins.
C02 progressively sediments out of suspension as the spin speed is increased. C05 and C06 retard
their sedimentation more than C02 at higher spin speeds. However, noting the higher variability at
15,000 RCF indicates that C05 and C06 can be forced to migrate at higher g-force spins, albeit at
a slower rate than C02.

24
Figure 5. Strength of resistance to centrifugal force. Strength is represented by cell density post-centrifugation.
Samples centrifuged at various g-force for 3 min. Sample taken from 0.5 mL mark. A600 measured to determine cell
density. Error bars represent standard deviation from the mean.
Figure 6. Forced sedimentation of mutant C02. Higher g-force spins reveal a clearer supernatant and larger pellet
mass, showing cells can be forced to sediment. C02 samples above were from experiment performed in Figure 4.
0
0.2
0.4
0.6
0.8
1
1.2
0 1,000 2,000 3,000 4,000 5,000 6,000 7,000 8,000 9,000 10,00015,000
A6
00
RCF at 0.5 mL
Culture Absorbace Post-Centrifugation
WT C02 C05 C06

25
3.4 Effect of growth media on phenotype
The availability of a supplemental carbon source in the medium affects the mutants’ ability to
resist centrifugal force. The mutants are the most resistant when grown in LB-glycerol (0.2%).
LB-glucose (0.2%) media significantly diminished the OD600 post-centrifugation in mutant C02
and decreased C05 to a lesser degree. C06 grown in LB-glucose (0.2%) had a negligible effect on
its resistance to centrifugal force. In LB only media, all the mutants’ resistance to centrifugal force
decreased significantly.

26
Figure 7. Growth media’s effect on mutants’ resistance to centrifugal force. Culture grown for 18 hrs. at 30 C
supplemented with different carbon sources. 1 mL samples were centrifuged for 3 min at 11,000 RCF. The OD600 of
samples from the 0.5 mL was measured and used to determine the mutants’ strength of resistance to centrifugal
force.
0
0.1
0.2
0.3
0.4
0.5
0.6
0.7
0.8
0.9
1
LB LB-Glycerol 0.2% LB-Glucose 0.2%
A6
00
Growth media
Growth Media Spin Test
WT C02 C05 C06

27
3.5 Timing of phenotype presentation
Mutants C05 and C06 present the centrifuge resistant phenotype during early stationary phase.
C02 presents the phenotype farther along in stationary phase.

28
Figure 8. Timing of centrifuge resistant phenotype presentation. Stationary phase cultures diluted 1:10.
Immediately after dilution (0 min) mutants still show phenotype by remaining in suspension post-centrifugation. The
centrifuge resistant phenotype increases in strength for mutants C05 and C06 at 210 min. This corresponds to early
stationary phase in whole culture OD600. C02 presents the phenotype further along in stationary phase.
0
0.1
0.2
0.3
0.4
0.5
0.6
0.7
0.8
0.9
1
0 30 60 90 120 150 180 210 240 270 300 330
A6
00
Time (min)
Cell Density Post-Centrifugation
WT C02 C05 C06
0
0.2
0.4
0.6
0.8
1
0 90 120 150 180 210 240 270 300 330
A6
00
Time (min)
Culture Density

29
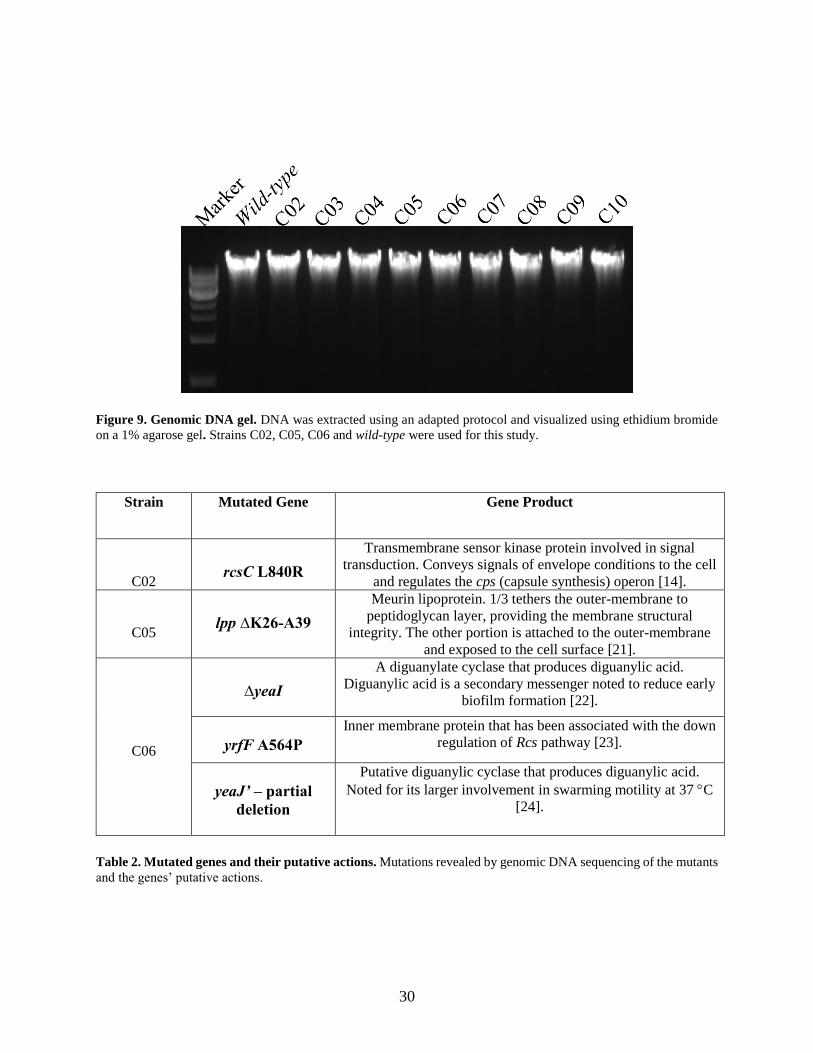
3.6 DNA sequencing
Genomic DNA sequencing of the mutants revealed mutations in regions involved in the regulation
of capsule synthesis, membrane structural integrity, biofilm formations, and swarming motility.
These regions have been noted in their association with capsule synthesis and exopolysaccharide,
CA in particular, in E. coli strain K12. Of the nine mutants that the genomic DNA was extracted,
seven were sent for Illumina sequencing, including a wild-type strain. Of the six mutants, three
were used for this study. Two strains, C02 and C05, were chosen because of their isolated gene
mutations. This mitigated the chances of a confounding gene mutation altering experimental
results. C06 was chosen because of the robustness of its phenotype. The mutations were further
confirmed using primers designed to flank each mutated gene region and PCR amplifying the
product. Samples were sent for Sanger Sequencing and the results were consistent with genomic
Illumina sequence reads (results not shown).
Whole genome sequencing of the mutant strain C02 revealed two mutations: a silent point
mutation in narH (GCC to GCA, alanine) and a missense mutation in rcsC (CTG to CGG, leucine
to arginine). Mutant C05 contains a 42 nucleotides deletion in lpp that removes amino acids Lys26
through Ala39. Strain C06 revealed a total deletion of yeaI, a partial deletion of the front portion
of yeaJ, and a missense mutation in yrfF (GCG to CCG, alanine to proline). The mutants C02 and
C05 from this point will be referred to by their genomic mutations rcsC L840R, lpp K26-A39
respectively. Because of C06’s impractical name of yeaI, yeaJ’, yrfF A564P
it will from now on be referred to as yea*.
30
Figure 9. Genomic DNA gel. DNA was extracted using an adapted protocol and visualized using ethidium bromide
on a 1% agarose gel. Strains C02, C05, C06 and wild-type were used for this study.
Strain Mutated Gene Gene Product
C02 rcsC L840R
Transmembrane sensor kinase protein involved in signal
transduction. Conveys signals of envelope conditions to the cell
and regulates the cps (capsule synthesis) operon [14].
C05 lpp ∆K26-A39
Meurin lipoprotein. 1/3 tethers the outer-membrane to
peptidoglycan layer, providing the membrane structural
integrity. The other portion is attached to the outer-membrane
and exposed to the cell surface [21].
C06
∆yeaI
A diguanylate cyclase that produces diguanylic acid.
Diguanylic acid is a secondary messenger noted to reduce early
biofilm formation [22].
yrfF A564P
Inner membrane protein that has been associated with the down
regulation of Rcs pathway [23].
yeaJ’ – partial
deletion
Putative diguanylic cyclase that produces diguanylic acid.
Noted for its larger involvement in swarming motility at 37 C
[24].
Table 2. Mutated genes and their putative actions. Mutations revealed by genomic DNA sequencing of the mutants
and the genes’ putative actions.

31
3.7 Exopolysaccharide quantification
The mutants produce approximately 17 times more methyl-pentose, a constituent of CA, than the
wild-type strain. Treated methyl pentose has a distinct peak absorbance at 400 nm. A standard
curve was generated using pure L-fucose, a methyl pentose. The standard curve was used to
quantify the amount of methyl pentose polymer in the mutants and wild-type. Each mutant
produces approximately the same amount of methyl-pentose pentose in whole culture preps.

32
A)
B)
Figure 10. L-fucose absorbance spectrum and standard curve. Various L-fucose solutions were made from a 1:1
dilution of a 0.1% L-fucose solution. Absorbance spectrum of the various L-fucose solutions measured using a
spectrophotometer (A). L-fucose solution A400 values were used to generate a standard curve and standard curve
equation (B). The standard equation was used to determine the quantity of methyl pentose in the mutant and wild-
type samples.
0
0.2
0.4
0.6
0.8
1
1.2
1.4
1.6
1.8
2
350 370 390 410 430 450
Abso
rban
ce
Wavelength (nm)
Methyl Pentose Absorbance
1520 µM
761 µM
381 µM
190 µM
95 µM
y = 0.0012x + 0.0168
R² = 0.9957
0
0.2
0.4
0.6
0.8
1
1.2
1.4
1.6
1.8
2
0 200 400 600 800 1000 1200 1400 1600
Abso
rban
ce
[L-fucose] M
L-Fucose Standard Curve

33
Figure 11. Total methyl pentose polymer absorbance spectrum. Mutant and wild type samples grown for 18
hours at 30 C post treatment with colorimetric assay. Each mutant produces approximately the same amount of
methyl pentose polymer. The mutants produce substantially more methyl pentose polymer than the wild-type. Error
bars represent the standard deviation from the mean.
Strain A400 [Methyl Pentose]
Wild-type 0.119 85 M ± 9
C02 (rcsC L840R) 1.714 1414 M ± 64
C05 (lpp K26-A39) 1.701 1404 M ± 56
C06 (yea*) 1.672 1379 M ± 55
Table 3. Total methyl pentose polymer concentrations. Mutant and wild-type methyl pentose concentrations were
calculated using the L-fucose standard curve (figure 10) and the A400 values from the colorimetric assay.
0
0.2
0.4
0.6
0.8
1
1.2
1.4
1.6
1.8
2
350 370 390 410 430 450
Abso
rban
ce
Wavelength (nm)
TotalMutant Methyl Pentose Polymer Absorbance
rcsC L840R
lpp ∆K26-A39
yea*
WT

34
Figure 12. Supernatant methyl pentose polymer absorbance spectrum. Samples were centrifuged for 30 min, at
15,000 RCF. After centrifugation the supernatant was sampled and the quantity of methyl pentose was determined
by performing the colorimetric assay and measuring in a spectrophotometer.
Strain A400 [Methyl Pentose]
Wild-type 0.023 5.2 M ± 13
rcsC L840R 1.191 978 M ± 58
lpp K26-A39 0.657 534 M ± 50
yea* 1.026 844 M ± 55
Table 4. Supernatant methyl pentose polymer concentration. Values calculated using the standard curve equation
in figure 8.
0
0.2
0.4
0.6
0.8
1
1.2
1.4
1.6
1.8
2
350 370 390 410 430 450
Abso
rban
ce
Wavelength (nm)
Supernatant Methyl Pentose Polymer Absorbance
rcsC L840R
yea*
lpp ∆K26-A39
WT

35
3.8 waaL knock-out
Deletion of waaL was confirmed by growth on selective media containing kanamycin medium and
a cut PCR product shown in figure 11. waaL, rcsC L840R had no effect on total methyl pentose
production in mutant rcsC L840R. In mutant lpp K26-A39, waaL deletion substantially reduced
total methyl pentose production from 1404 M ± 56 (lpp K26-A39) to 1144 M ± 59 (waaL,
lpp K26-A39), an approximate 19% decrease. waaL substantially reduced total methyl pentose
production in mutant yea* from 1379 M ± 55 (yea*) to 953 M ± 59 (waaL, yea*), an
approximate 31% decrease.
Supernatant methyl pentose production in waaL, rcsC L840R was not significantly altered.
waaL, lpp K26-A39 changed the supernatant methyl pentose production from 534 M ± 50 (lpp
K26-A39) to 419 M ± 59 (waaL, lpp K26-A39) an approximate 22% decrease. waaL, yea*
had a decrease in supernatant methyl pentose production from 844 M ± 55 (yea*) to 359 M ±
57 (waaL, yea*) a decrease of approximately 57%.

36
Figure 13. Agarose DNA gel of waaL mutant transduction recipients. Wild-type, and rcsC L840R control. Mutant
transduction recipients were PCR amplified using flanking waaL primers. Successful P1 transduction of waaL::kan
was confirmed by growth on selective media and specific restriction digest of the kanamycin resistance gene using
Eag 1. Labeled waaL lanes were used for experiments.
Table 5. waaL total culture and supernatant methyl pentose polymer concentration.
Strain Total [Methyl Pentose] Supernatant [Methyl Pentose]
waaL, rcsC L840R 1519 M ± 59 969 M ± 55
∆waaL, ∆lpp K26-A39 1144 M ± 59 419 M ± 59
∆waaL, ∆yea* 953 M ± 59 359 M ± 57
1,000 bp
500 bp
1,517 bp
1,000 bp
3,000 bp

37
3.9 Bio-conjugation
Blue, amine functionalized, 1.0 m, polystyrene micro-spheres were treated with extracted CA.
Mutant CA extract was able to keep beads in suspension to varying degrees. Mutant yea* kept
the most beads in suspension, followed by rcsC L840R, and then lpp K26-A39. Wild-type
beads treated with CA did not keep beads in suspension. Beads quantities in suspension were
determined by light scattering 500 nm to 700 nm.

38
Figure 14. 1.0 m polystyrene micro-spheres treated with CA extract. Extracted CA samples from the
colorimetric assay were coupled to blue, 1.0 m polystyrene micro-spheres. Photo taken after centrifuging samples
for 8 min at 3,200 RCF.
Figure 15. Absorbance spectrum of 1.0 m polystyrene micro-spheres treated with CA. Samples spun for 8
min at 3,200 RCF. 100 L of sample was measured in a spectrophotometer
0
0.05
0.1
0.15
0.2
0.25
0.3
0.35
0.4
0.45
0.5
500 550 600 650 700
Abso
rban
ce
Wavelength (nm)
1.0 m spheres treated with extracted CA
yea*
rcsC L840R
∆lpp K26-A39
WT
Bead-Buffer
Bead+
buffer Wild-type
rcsC
L840R
∆lpp
K26-A39 yea*

39
IV. DISCUSSION
It is curious that a fraction of bacteria remains in the supernatant after a high centrifugal force
event. However, the mechanism by which these cells remain in the supernatant after exposure to
thousands of centrifugal g-force has never been investigated. In this study the centrifuge resistant
trait was characterized by defining growth conditions, genomic DNA sequencing, quantifying EPS
production, and using gene deletions. The results reveal that these cells are using a novel
mechanism stimulated by independent gene variations to adapt to this new environmental variable.
Preliminary studies revealed that the mutants are not less dense than the medium and are not
actively swimming against the force. The mutants can be forced to sediment by increasing the
centrifugal force and duration of spin, and wild-type cells have been shown to pellet through the
suspension when mixed with the mutants. It seems that the cells are using an energy efficient
method to retard their sedimentation when exposed to centrifugal force. Knowing that altering the
medium with different carbon sources affects the phenotype’s strength, it is believed that there
could be a feedback mechanism regulating this trait dependent on the availability of a carbon
source.
Whole genome sequencing of the centrifuge resistant mutants revealed isolated gene mutations in
the C02 and C05 strains, whereas the presence of three separate gene mutations in the C06 strain
suggests that multiple pathways may be contributing to the production of CA in synergistic
manner.
40
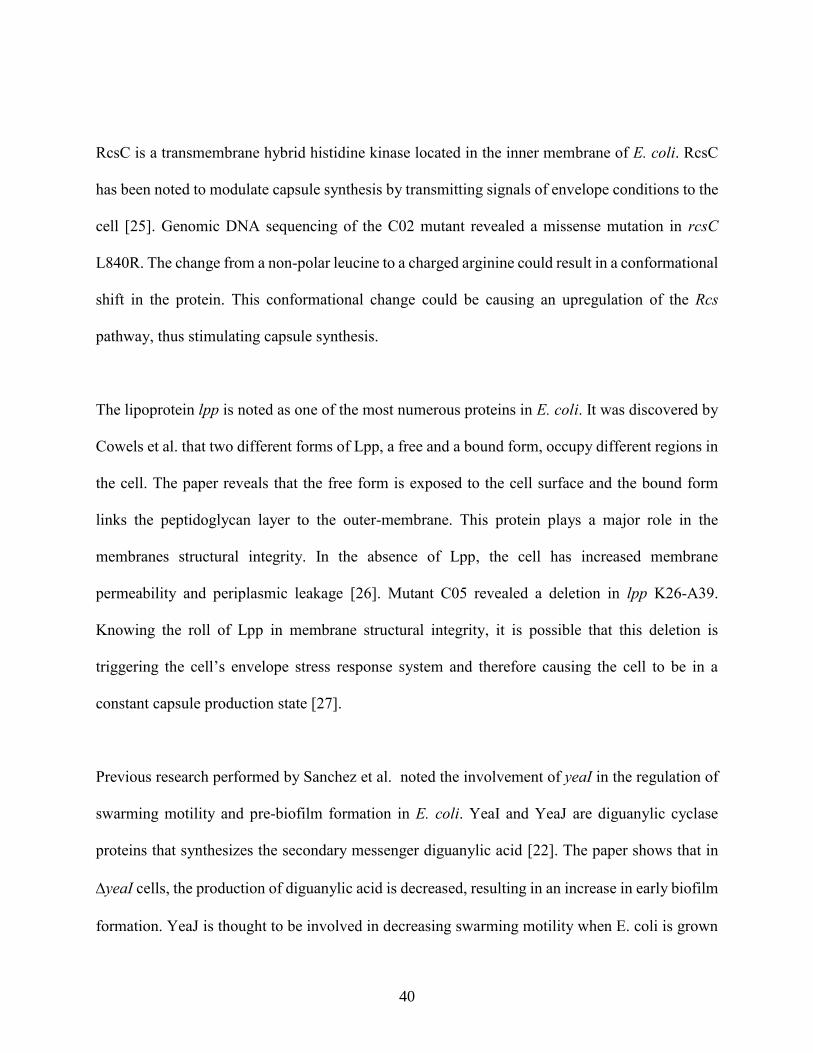
RcsC is a transmembrane hybrid histidine kinase located in the inner membrane of E. coli. RcsC
has been noted to modulate capsule synthesis by transmitting signals of envelope conditions to the
cell [25]. Genomic DNA sequencing of the C02 mutant revealed a missense mutation in rcsC
L840R. The change from a non-polar leucine to a charged arginine could result in a conformational
shift in the protein. This conformational change could be causing an upregulation of the Rcs
pathway, thus stimulating capsule synthesis.
The lipoprotein lpp is noted as one of the most numerous proteins in E. coli. It was discovered by
Cowels et al. that two different forms of Lpp, a free and a bound form, occupy different regions in
the cell. The paper reveals that the free form is exposed to the cell surface and the bound form
links the peptidoglycan layer to the outer-membrane. This protein plays a major role in the
membranes structural integrity. In the absence of Lpp, the cell has increased membrane
permeability and periplasmic leakage [26]. Mutant C05 revealed a deletion in lpp K26-A39.
Knowing the roll of Lpp in membrane structural integrity, it is possible that this deletion is
triggering the cell’s envelope stress response system and therefore causing the cell to be in a
constant capsule production state [27].
Previous research performed by Sanchez et al. noted the involvement of yeaI in the regulation of
swarming motility and pre-biofilm formation in E. coli. YeaI and YeaJ are diguanylic cyclase
proteins that synthesizes the secondary messenger diguanylic acid [22]. The paper shows that in
yeaI cells, the production of diguanylic acid is decreased, resulting in an increase in early biofilm
formation. YeaJ is thought to be involved in decreasing swarming motility when E. coli is grown

41
at 37C on solid medium. In mutant C06, yeaI is fully deleted and yeaJ is partially deleted. Based
on the results from Sanchez et al.’s paper, it is possible that the deletion of yeaI is diminishing the
production of diguanylic acid, thus signaling a transition into a biofilm growth phase. Due to
YeaJ’s high activity at 37C and decreased activity at lower temperatures, it is believed to have
little involvement in C06’s phenotype because these cells were selected at 30C and experiments
were carried out at 30C [24].
Is has been noted by Dominguez-Bernal et al. that yrfF down-regulates the Rcs pathway in
Salmonella. Rcs regulates a multitude of pathways, one of particular note is the capsule synthesis
operon (cps). Interestingly, the deletion of yrfF is lethal [23]. For a cell to survive a yrfF deletion,
the Rcs pathway must also be inactivated. Genomic DNA sequencing of C06 revealed a missense
mutation in yrfF A564P. Due to proline’s unique R-group structure and bulkiness compared to
alanine, it is possible that this caused YrfF’s conformation to shift. If YrfF’s conformation is
altered to a less active or inactive state it could diminish the regulation of Rcs. This would
secondarily cause the upregulation of the cps operon resulting in EPS capsule production.
Because of the distinct mucoid phenotype as well as the mutated genes associated with capsule
synthesis and biofilm formation, it was hypothesized that the mutants are increasing CA
production [28]. Quantification of the total methyl pentose polymer confirmed a hyper-production
of methyl-pentose, a unique sugar in CA. All the mutants produce approximately the same amount
of CA, however, they each differ in their ability to resist centrifugal force. By quantifying the
amount of unattached CA it was discovered that the weakest mutant, rcsC L840R, seems to be
42
freely excreting more CA into the medium than the stronger mutants lpp K26-A39 and yeaI,
yeaJ, yrfF A564P. Based on this result it seems that the mutants that are more robust at resisting
centrifugal force have a higher proportion of CA attached to their cell membranes.
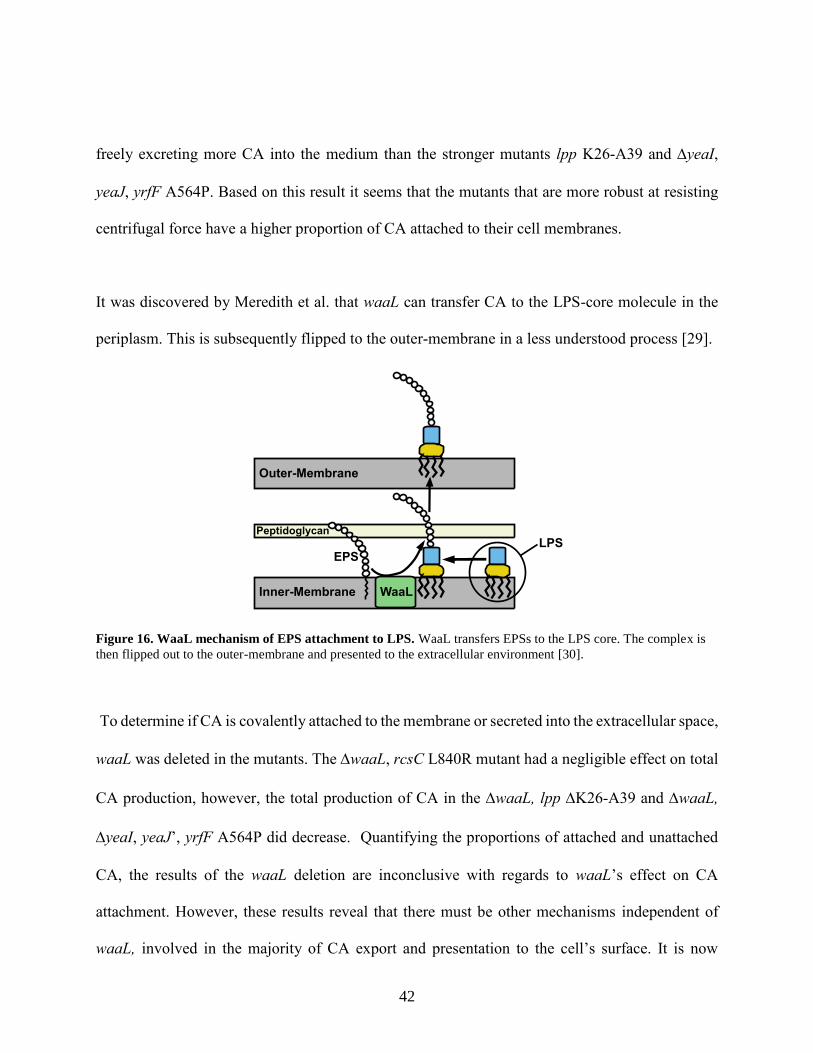
It was discovered by Meredith et al. that waaL can transfer CA to the LPS-core molecule in the
periplasm. This is subsequently flipped to the outer-membrane in a less understood process [29].
Figure 16. WaaL mechanism of EPS attachment to LPS. WaaL transfers EPSs to the LPS core. The complex is
then flipped out to the outer-membrane and presented to the extracellular environment [30].
To determine if CA is covalently attached to the membrane or secreted into the extracellular space,
waaL was deleted in the mutants. The waaL, rcsC L840R mutant had a negligible effect on total
CA production, however, the total production of CA in the waaL, lpp K26-A39 and waaL,
yeaI, yeaJ’, yrfF A564P did decrease. Quantifying the proportions of attached and unattached
CA, the results of the waaL deletion are inconclusive with regards to waaL’s effect on CA
attachment. However, these results reveal that there must be other mechanisms independent of
waaL, involved in the majority of CA export and presentation to the cell’s surface. It is now
WaaLInner-Membrane
Outer-Membrane
LPSPeptidoglycan
EPS

43
hypothesized that the Wza translocon might play a major role in the simultaneous linkage and
export of CA in a continuous fashion, possibly altering between attachment of long CA polymers
to the inner-membrane via undecaprenyl-diphosphate and secretion of CA polymers into the
extracellular space [31]. Based on these results it is now thought that these large EPS polymers are
covalently linked to the inner-membrane and jutting out into the extracellular space, potentially
revamping the conventional thought process that EPSs are linked to the outer-membrane and
exposed to the extracellular environment.
Figure 17. New predicted EPS covalent attachment model via Wza translocon. EPS polymers are
simultaneously built on undecaprenyl-diphosphate and exported out of the cell by Wza. The polymer remains
covalently linked to the undecaprenyl-diphosphate molecule in the inner-membrane. This pathway has the ability to
shed or retain the linkage of this polymer [31].
The extracted CA samples coupled to the polystyrene microspheres revealed that the amount of
beads retained in suspension was not dependent on the concentration of CA. Each strain produced
approximately the same amount of CA, however the CA extracts varied with their ability to keep
Inner-Membrane
Outer-Membrane
Peptidoglycan
Wza
WzcWcaD
EPS
Free EPSAttached EPS

44
the microspheres in suspension. This suggests that the mechanism by which the cell produces CA
and presents CA to the cell membrane might have an effect on its reactivity with other objects.
Future studies and applications
Now that the basis of the mechanism for centrifuge resistance is known, the next step would be to
completely delete the genes responsible for CA production. This would confirm whether CA is
solely responsible for the centrifuge resistant mechanism and could potentially reveal another
mechanism that could compensate for its absence. Another important study is to determine if the
genes involved in centrifuge resistance are dominant or recessive. This could be done by
transforming a plasmid containing wild-type genes into the mutants and seeing which phenotype
results. Determining the inheritance pattern would allow better understanding of how this process
is regulated, and reveal potential ways to control it. Controlling this mechanism could optimize
processes in industrial settings where microbes are utilized.
In light of the variability of the mutants’ CA reactions with the microspheres, the bio-conjugation
reaction needs to be optimized by determining the most reactive functional groups and suitable
reaction conditions. Once the transferability of these optically transparent biomolecules to other
particles is achieved, controlling phase separation of heterogeneous mixtures can be envisioned.
EPS production by this mechanism appears to have the ability to attach EPS to the OM or secrete
EPS into the extracellular medium. Investigating the signals involved in the decision to attachment
EPS or secrete EPS may have implications in the medical field where EPSs are known virulence
factors and cells secreting EPS can have an added advantage of evading a host’s immune system.

45
V. REFERENCES
1. Tenaillon O, Skurnik D, Picard B, Denamur E. 2010. The population genetics of commensal
Escherichia coli. Nat Rev Microbiol 8:207-17.2. Costerton JW, Stewart PS, Greenberg EP.
1999. Bacterial biofilms: a common cause of persistent infections. Science 284:1318-22.
2. Croxen MA, Law RJ, Scholz R, Keeney KM, Wlodarska M, Finlay BB. 2013. Recent advances
in understanding enteric pathogenic Escherichia coli. Clin Microbiol Rev 26:822-80.
3. Barr D. 2016. Research Guides: Lab Rats and More: Model Organisms in Research Today: E.
coli.
4. Luria SE, Delbruck M. 1943. Mutations of Bacteria from Virus Sensitivity to Virus Resistance.
Genetics 28:491-511.
5. Kussell E, Kishony R, Balaban NQ, Leibler S. 2005. Bacterial persistence: a model of survival in
changing environments. Genetics 169:1807-14.
6. Galhardo RS, Hastings PJ, Rosenberg SM. 2007. Mutation as a stress response and the regulation
of evolvability. Crit Rev Biochem Mol Biol 42:399-435.
7. Vogwill T, Comfort AC, Furio V, MacLean RC. 2016. Persistence and resistance as
complementary bacterial adaptations to antibiotics. J Evol Biol 29:1223-33.
8. Costerton, J.W., Stewart, P.S., Greenberg, E.P., 1999. Bacterial biofilms: a common
cause of persistent infections. Science. 284, 1318-1322.
9. Hall-Stoodley L, Costerton JW, Stoodley P. 2004. Bacterial biofilms: from the Natural
environment to infectious diseases. Nature Reviews Microbiology 2:95-108.

46
10. Kim MS, Kim YD, Hong SS, Park K, Ko KS, Myung H. 2015. Phage-encoded colanic acid-
degrading enzyme permits lytic phage infection of a capsule-forming resistant mutant
Escherichia coli strain. Appl Environ Microbiol 81:900-9.
11. Danese PN, Pratt LA, Kolter R. 2000. Exopolysaccharide Production Is Required for
Development of Escherichia coli K-12 Biofilm Architecture.
12. Sutherland IW. 1969. Structural studies on colanic acid, the common exopolysaccharide found in
the enterobacteriaceae, by partial acid hydrolysis. Oligosaccharides from colanic acid. Biochem J
115:935-45.
13. Sutherland I. 2001. Biofilm exopolysaccharides: a strong and sticky framework. Microbiology
147:3-9.
14. Ferrieres L, Clarke DJ. 2003. The RcsC sensor kinase is required for normal biofilm formation in
Escherichia coli K-12 and controls the expression of a regulon in response to growth on a solid
surface. Mol Microbiol 50:1665-82.
15. Sledjeski DD, Gottesman S. 1996. Osmotic shock induction of capsule synthesis in Escherichia
coli K-12. J Bacteriol 178:1204-6.
16. Kang S, Markovitz A. 1967. Induction of capsular polysaccharide synthesis by rho-
fluorophenylalanine in Escherichia coli wild type and strains with altered phenylalanyl soluble
ribonucleic acid synthetase. J Bacteriol 93:584-91.
17. Dische Z, Shettles LB. 1948. A specific color reaction of methylpentoses and a
spectrophotometric micromethod for their determination. J Biol Chem 175:595-603.
18. Schmid J, Sieber V, Rehm B. 2015. Bacterial exopolysaccharides: biosynthesis pathways and
engineering strategies. Front Microbiol 6:496.

47
19. Baba T, Ara T, Hasegawa M, Takai Y, Okumura Y, Baba M, Datsenko KA, Tomita M, Wanner
BL, Mori H. 2006. Construction of Escherichia coli K-12 in-frame, single-gene knockout
mutants: The Keio collection, p 2006 0008, Mol Syst Biol, vol 2.
20. Moore SD. 2011. Assembling new Escherichia coli strains by transduction using phage P1.
Methods Mol Biol 765:155-69.
21. Konovalova A, Silhavy TJ. 2015. Outer membrane lipoprotein biogenesis: Lol is not the end.
Philos Trans R Soc Lond B Biol Sci 370.
22. Sanchez-Torres V, Hu H, Wood TK. 2011. GGDEF proteins YeaI, YedQ, and YfiN reduce early
biofilm formation and swimming motility in Escherichia coli. Appl Microbiol Biotechnol
90:651-8.
23. Dominguez-Bernal G, Pucciarelli MG, Ramos-Morales F, Garcia-Quintanilla M, Cano DA,
Casadesus J, Garcia-del Portillo F. 2004. Repression of the RcsC-YojN-RcsB phosphorelay by
the IgaA protein is a requisite for Salmonella virulence. Mol Microbiol 53:1437-49.
24. Pesavento C, Becker G, Sommerfeldt N, Possling A, Tschowri N, Mehlis A, Hengge R. 2008.
Inverse regulatory coordination of motility and curli-mediated adhesion in Escherichia coli.
Genes Dev 22:2434-46.
25. Sato T, Takano A, Hori N, Izawa T, Eda T, Sato K, Umekawa M, Miyagawa H, Matsumoto K,
Muramatsu-Fujishiro A, Matsuoka S, Hara H. 2017. Role of the inner-membrane histidine kinase
RcsC and outer-membrane lipoprotein RcsF in the activation of the Rcs phosphorelay signal
transduction system in Escherichia coli. Microbiology 163:1071-1080.
26. Cowles CE, Li Y, Semmelhack MF, Cristea IM, Silhavy TJ. 2011. The free and bound forms of
Lpp occupy distinct subcellular locations in Escherichia coli. Mol Microbiol 79:1168-81.

48
27. Laubacher ME, Ades SE. 2008. The Rcs phosphorelay is a cell envelope stress response
activated by peptidoglycan stress and contributes to intrinsic antibiotic resistance. J Bacteriol
190:2065-74.
28. Nassif X, Honore N, Vasselon T, Cole ST, Sansonetti PJ. 1989. Positive control of colanic acid
synthesis in Escherichia coli by rmpA and rmpB, two virulence-plasmid genes of Klebsiella
pneumoniae. Mol Microbiol 3:1349-59.
29. Meredith TC, Mamat U, Kaczynski Z, Lindner B, Holst O, Woodard RW. 2007. Modification of
lipopolysaccharide with colanic acid (M-antigen) repeats in Escherichia coli. J Biol Chem
282:7790-8.
30. Wang X, Quinn PJ. 2010. Lipopolysaccharide: Biosynthetic pathway and structure modification.
Prog Lipid Res 49:97-107.
31. Dong C, Beis K, Nesper J, Brunkan AL, Clarke BR, Whitfield C, Naismith JH. 2006. The
structure of Wza, the translocon for group 1 capsular polysaccharides in Escherichia coli,
identifies a new class of outer membrane protein. Nature 444:226-9.