
BACNEED FOR THE PROJECTkGRounD to tHE …eisdocs.dsdip.qld.gov.au/Sunshine Coast Airport...
34
CONTENTS 2.1 Introduction ..........................................................................18 2.2 Rationale for the Project..................................................18 2.2.1 Operational drivers ..................................................... 19 2.2.2 Social drivers................................................................. 19 2.2.3 Economic drivers......................................................... 21 2.2.4 Consequences of not doing the Project ........... 21 2.3 Existing and forecast aircraft passenger demand........................................................... 22 2.3.1 Historical passenger trends and aircraft movements .................................................... 23 2.3.2 Approach to forecasting ......................................... 24 2.3.3 Forecasting methodology....................................... 25 2.3.4 Baseline, aggressive and conservative forecasts.............................................. 26 2.3.5 Aviation activity forecasts.........................................27 2.3.6 Busy day and busy hour profiles......................... 29 2.3.7 Ultimate runway capacity........................................ 30 2.4 The Sunshine Coast economy...................................... 31 2.4.1 The Sunshine Coast’s competitive advantage .............................................. 31 2.4.2 Gross Regional Product ........................................... 31 2.4.3 Industry contribution to GRP ................................. 31 2.4.4 Number of businesses ............................................. 34 2.4.5 GRP per employee ................................................... 34 2.4.6 Labour market ............................................................. 35 2.5 Policy and context and legislative framework ........ 38 2.5.1 Commonwealth Government ............................... 38 2.5.1.1 Infrastructure Australia (IA) .................... 38 2.5.1.2 Regional Development Australia (RDA) ............................................ 38 2.5.2 State Government...................................................... 38 2.5.2.1 Economic Directions Statement Queensland Airports 2013-2033 ......... 38 2.5.2.2 Queensland State Planning Policy (SPP) ................................................................ 38 2.5.2.3 South East Queensland Regional Plan (SEQRP) ......................................................... 38 2.5.3 Local Government ..................................................... 38 2.5.3.1 Sunshine Coast Council Corporate Plan 2014 ....................................................... 38 2.5.3.2 Regional Economic Development Strategy 2013-2033 ................................... 38 2.5.3.3 Sunshine Coast Planning Scheme .... 38 2.5.4 Government investment (all levels of government) ............................................................ 38 2.6 Economic assessment of the Project ........................ 38 2.6.1 Methodology ................................................................ 39 2.6.1.1 Benefit cost analysis ................................. 39 2.6.1.2 Regional benefits methodology ............ 41 2.6.2 Assessment of net economic benefits of the Project................................................................ 42 2.6.3 Sensitivity analysis on the BCA............................ 45 2.6.4 Assessment of regional economic benefits of Project ...................................................... 45 2.6.5 Local participation ..................................................... 49 2.7 Summary and conclusion .............................................. 49 FIGURES 2.2a Potential destinations with the new runway................. 20 2.2b Chinese consumer travel profile ........................................ 22 2.2c Indian consumer travel profile ............................................ 22 2.3a Historical passenger traffic (FY1992-FY2012) ............. 23 2.3b Historic aircraft movements (FY2007-FY2012) ........... 24 2.3c Historic and forecast passenger movements at Sunshine Coast Airport (1995-2040) ................................27 2.4a Gross Regional Product ........................................................ 32 A2-16 SUNSHINE COAST AIRPORT EXPANSION PROJECT A2 BACKGROUND TO THE PROJECT NEED FOR THE PROJECT
Transcript of BACNEED FOR THE PROJECTkGRounD to tHE …eisdocs.dsdip.qld.gov.au/Sunshine Coast Airport...

Contents
2.1 Introduction ..........................................................................18
2.2 Rationale for the Project ..................................................18 2.2.1 Operational drivers .....................................................19 2.2.2 Social drivers .................................................................19 2.2.3 Economic drivers .........................................................21 2.2.4 Consequences of not doing the Project ...........21
2.3 Existing and forecast aircraft passenger demand........................................................... 22
2.3.1 Historical passenger trends and aircraft movements .................................................... 23
2.3.2 Approach to forecasting ......................................... 24 2.3.3 Forecasting methodology ....................................... 25 2.3.4 Baseline, aggressive and
conservative forecasts .............................................. 26 2.3.5 Aviation activity forecasts .........................................27 2.3.6 Busy day and busy hour profiles ......................... 29 2.3.7 Ultimate runway capacity........................................ 30
2.4 The Sunshine Coast economy...................................... 31 2.4.1 The Sunshine Coast’s
competitive advantage ..............................................31 2.4.2 Gross Regional Product ...........................................31 2.4.3 Industry contribution to GRP .................................31 2.4.4 Number of businesses ............................................. 34 2.4.5 GRP per employee ................................................... 34 2.4.6 Labour market ............................................................. 35
2.5 Policy and context and legislative framework ........ 38 2.5.1 Commonwealth Government ............................... 38 2.5.1.1 Infrastructure Australia (IA) .................... 38 2.5.1.2 Regional Development
Australia (RDA) ............................................ 38 2.5.2 State Government ...................................................... 38
2.5.2.1 Economic Directions Statement Queensland Airports 2013-2033 ......... 38
2.5.2.2 Queensland State Planning Policy (SPP) ................................................................ 38
2.5.2.3 South East Queensland Regional Plan (SEQRP) ......................................................... 38
2.5.3 Local Government ..................................................... 38 2.5.3.1 Sunshine Coast Council Corporate
Plan 2014 ....................................................... 38 2.5.3.2 Regional Economic Development
Strategy 2013-2033 ................................... 38 2.5.3.3 Sunshine Coast Planning Scheme .... 38 2.5.4 Government investment (all levels
of government) ............................................................ 38
2.6 Economic assessment of the Project ........................ 38 2.6.1 Methodology ................................................................ 39 2.6.1.1 Benefit cost analysis ................................. 39 2.6.1.2 Regional benefits methodology ............41 2.6.2 Assessment of net economic benefits
of the Project ................................................................ 42 2.6.3 Sensitivity analysis on the BCA............................ 45 2.6.4 Assessment of regional economic
benefits of Project ...................................................... 45 2.6.5 Local participation ..................................................... 49
2.7 Summary and conclusion .............................................. 49
Figures
2.2a Potential destinations with the new runway ................. 202.2b Chinese consumer travel profile ........................................ 222.2c Indian consumer travel profile ............................................ 222.3a Historical passenger traffic (FY1992-FY2012) ............. 232.3b Historic aircraft movements (FY2007-FY2012) ........... 242.3c Historic and forecast passenger movements at
Sunshine Coast Airport (1995-2040) ................................272.4a Gross Regional Product ........................................................ 32
A2-16 SUNSHINE COAST AIRPORT EXPANSION PROJECT
A2 BACkGRounD to tHE PRojECt
NEED FOR THE PROJECT

2.4b Gross Regional Product growth ........................................ 332.4c Gross Regional Product by top 10 industries ............. 332.4d Business count by top 10 industries ............................... 342.4e Labour force and unemployment rate ............................ 362.4f Employment by occupation ................................................. 362.4g Employed persons by top 10 industries .........................372.6a BCA methodology for the Project .................................... 392.6b time profile of benefits – Project case .......................... 432.6c time profile of undiscounted costs of the
project case (2014 $m)........................................................... 44
tables
2.3a Fixed wind general aviation and helicopter movements (FY2007-FY2012) ............................................. 24
2.3b Passenger movement forecasts: Sunshine Coast Airport (2012-2040) ............................... 29
2.3c Annual aircraft movement forecasts: Sunshine Coast Airport (2012-2040) ............................... 28
2.3d Assumed seats and passengers per commercial aircraft movement: Sunshine Coast Airport (2012-2040) ............................... 29
2.3e Forecast aviation activity for 2012-2040 – runway development scenarios ......................................... 30
2.4a Economic baseline summary.............................................. 322.4b Gross Regional Product per employee .......................... 352.6a Benefit Cost Analysis Parameters..................................... 402.6b Approach to quantifying benefits ...................................... 422.6c overview of benefits estimated in the
Benefit Cost Analysis .............................................................. 432.6d Capital cost estimate summary –
Project case (undiscounted) ................................................ 432.6e Benefit cost analysis ............................................................... 442.6f Benefit cost ratios under different
passenger forecast scenarios ............................................. 452.6g BCRs and nPVs under different induced
demand assumptions – project case ............................. 462.6h BCRs and nPVs under different consumer
surplus quantification proxies ............................................. 462.6i Project – direct construction expenditure ($m) ......... 462.6j Economic impact of the Project –
construction phase ...................................................................472.6k Economic impact of the Project –
operational phase ..................................................................... 482.6l Comparison of economic impacts of the
Project during the operational phase .............................. 48
aPPenDiCes (reFer seParate aPPenDiCes DisK)
A2:A Busy day flight schedules for 2020 and 2040A2:B Long-term forecasts of aviation activity at
Sunshine Coast Airport for 2013 – 2050
glossary
Consumer surplus
A measure of consumer satisfaction which can be measured as the difference between what a consumer would be willing to pay for a good or service compared to what they actually pay.
benefit Cost analysis
An economic evaluation technique that seeks to evaluate costs and benefits of a project or policy change. Benefit Cost Analysis is generally used as a decision making tool to determine whether a project will deliver net benefits. Where benefits outweigh costs, the project has a net benefit to society. In this case, society is defined to be the state of Queensland.
Discount rate the rate by which the value of costs and benefits that accrue in the future are discounted to find an equivalent dollar value expressed in present value terms (today’s dollars). Discounting future costs and benefits recognises that a dollar today is worth more than a dollar at some time in the future. this concept is known as the time value of money. In this analysis, a seven per cent real discount rate has been used consistent with Queensland and Commonwealth guidelines for Benefit Cost Analysis.
economic impact assessment
A tool that seeks to estimate the economic impact a project is likely to generate once a decision has been made to proceed with a project. In this analysis, the impact of the project on employment and gross regional product is assessed.
evaluation year the evaluation or ‘base’ year is the year to which costs and benefits have been discounted to arrive at a Present Value (PV). the base year is usually the same as the price year and should preferably be the year in which the decision on whether to proceed with the project is made so that a decision is made based on the present value of costs and benefits. In this analysis, the evaluation year is 2013.
A2-17environmental impact statement

gross regional Product
Gross Regional Product (GRP) is the measure of the size of a regional economy. It is similar to Gross State Product (GSP) for a state, and Gross Domestic Product (GDP) for a country.
input-output model
An Input/output model uses project-specific data such as capital expenditure, operating expenditure and workforce requirements over the project life-cycle to estimate the economic impact of a project. In this analysis, an Input/output model is used to estimate the contribution of the project to the regional and state economy and to job creation.
local government area (lga)
A Local Government Area (LGA) is a geographical area under the responsibility of an incorporated local government council, or an incorporated Indigenous government council. the LGAs in Australia collectively cover only a part of Australia. the main areas not covered by LGAs are northern parts of South Australia, a large part of the northern territory, the western division of new South Wales, all of the Australian Capital territory and the other territories.
Price year the year in which the monetary value of costs and benefits are expressed. In this analysis, all costs and benefits have been discounted to 2013 dollars (see also evaluation year).
residual value the value of an asset at the end of the economic evaluation period.
2.1 introDuCtion
Airports are a critical part of Australia’s social and economic fabric. the country’s large land mass and relatively long distances between population centres makes its network of airports very important, allowing its citizens to remain physically connected with one another and the rest of the world. In addition, airports have become essential economic enablers.
this is especially evident in regional Australia where the aviation network has been a primary vehicle for sharing the economic benefits and social connectivity around the country.
Sunshine Coast Airport (SCA) provides these benefits to its community and the Sunshine Coast Airport Project (the Project) would enable the airport to continue to support the economic growth of the region for generations to come.
In 2012 Deloitte Access Economics in their report “Connecting Australia” prepared for the Australian Airports Association, found that the airport network:
y Contributed $17.3 billion to the national economy in 2011 – around 1.2 per cent of GDP
y Generated 115,000 FtE jobs
y Was a major enabler of the $35 billion tourism industry that employs around 400,000 Australians
y Would double its passenger patronage levels over the next two decades.
this chapter of the EIS provides details on the:
y Rationale for the Project
y Existing and forecast aircraft and passenger movements at the airport
y Economic implications of the airport expansion.
2.2 rationale For the ProjeCt
the Project is a key development objective of the Sunshine Coast Airport Master Plan 2007 an extract of which is reproduced here:
“The long term strategic development objective for Sunshine Coast Airport is to stimulate and support the growing regional economy of the Sunshine Coast. The execution of this objective requires careful and considered planning including the following key features discussed within the Plan:
y Enhancements to the existing taxiway and apron system to support the expected growth in aviation traffic over the short to medium term
y Access to additional airside land to promote and grow the aviation industry on the Sunshine Coast.
A2-18
background to the project
NEED FOR THE PROJECTA2
SunShIne coaSt aIrport eXpanSIon project

y Terminal development to provide for expected passenger growth, enhanced security requirements, additional commercial opportunities and enhance passenger experiences
y Development of a new runway and associated infrastructure to facilitate new international routes and support the long term aviation growth on the Sunshine Coast
y Long term protection of airspace associated with airport assets.”
the following is an overview of the key operational, social and economic drivers for the Project:
2.2.1 operational drivers
the current Runway (RWY) 18/36 was opened in 1961 and has been instrumental in the development of the Sunshine Coast’s tourism industry, opening up access to both domestic and international markets and contributing to the coast becoming one of Australia’s premiere holiday destinations. However, the design of the current runway in terms of its length and width is also limiting the capacity of the airport to service a wide range of passenger aircraft.
Runway length
the current RWY 18/36 is 1,798 m in length and does not provide enough take-off run to allow the Boeing 737 or the Airbus A320 aircraft, which are the mainstay of the domestic jet Regular Public transport (RPt) fleet, to operate at their maximum take-off weights of around 70 tonnes. In limiting take-off weight, the current runway reduces the destinations that can be viably serviced from SCA.
When operating from RWY 18/36 at SCA, the B737 or A320 aircraft are restricted to destinations on the east coast of Australia when carrying a full complement of passengers. Destinations further afield are not possible without reducing the passenger load and increasing the fuel load. In the case of the current A320 service to Auckland, while the aircraft is capable of flying fully laden from Auckland with 168 passengers, the airline is required to reduce the passenger numbers to 138 for the homeward leg due to the short length of runway at SCA, affecting the yield per flight.
In contrast the Project offers a significantly longer runway at 2,450 m. the same A320 aircraft that on RWY 18/36 needs to operate with a reduced payload to Adelaide or Auckland, will be able to reach all airports in Australia and into the Western Pacific. the new runway is anticipated to have an asset life of up to 100 years.
Runway width
Passenger jet aircraft that currently access SCA from Sydney, Melbourne and Auckland (B737 and A320) are classified by the Civil Aviation Safety Authority (CASA) as “Code 4C” aircraft. the standards for which CASA is responsible in Australia require that such aircraft operate on runways that are 45 m in width, and where possible, are centred within a 300 m wide runway strip.
RWY 18/36 is 30 m wide and sits within a 150 m wide runway strip. this situation arises primarily because of the rapid growth of operations into the airport. the current runway was not designed for aircraft in common usage today.
As a result, the current operation of Code 4C aircraft at SCA occurs under an exemption to the Civil Aviation Safety Regulations (CASR) issued by CASA to permit “narrow runway operations”. the current exemption is due to expire in February 2015. CASA’s advice when last reviewing the exemption in 2012 was that any further extension of the exemption beyond 2015 would in part depend upon SCA demonstrating progress toward compliance with the CASR.
the new runway is therefore proposed to be 45 m wide and centred within a 300 m wide runway strip. As discussed in Chapter A3 – options and Alternatives, the possibility of widening RWY 18/36 was considered but discounted for a number of reasons.
the 45 m runway width also has a significant operational benefit in that it makes the runway accessible to wide-body Code E aircraft favoured by the world’s airlines for medium haul international flights. With this in mind, the Boeing 787 was identified as the design aircraft. It is this increased ability to accommodate wide-bodied aircraft and meet international standards that allows the Sunshine Coast community to not only reach the rest of Australia with direct flights, but also to reach out to new international markets in Asia and beyond (refer Figure 2.2a).
2.2.2 social drivers
RWY 18/36 is aligned on a north/south orientation and aircraft using the runway have been obliged to transit overhead of most of the Sunshine Coast’s eastern suburbs between Currimundi and Coolum. Despite the airport pre-dating much of the urban development on the coast and recent changes to approach procedures on RWY 18/36 (the introduction of GPS based flight procedures) ameliorating these impacts to some extent, the current orientation of the runway requires aircraft to over fly the more densely populated areas of the coast.
the orientation of the existing RWY 18/36 is also poorly aligned to the prevailing south-easterly winds at SCA. Aircraft are required to take off and land into the wind. It is expected that the “into wind” performance of the new runway will be significantly better, reducing the potential for diversions and improving aircraft operational performance.
Diversions occur when a jet aircraft attempts a landing but is unable to complete it due to weather and visibility conditions. In this circumstance the jet aircraft commences a missed approach procedure which either involves circling around and attempting the landing again, or the jet aircraft diverts to a nearby airport. During this procedure additional noise is produced as a result of the thrust required to manoeuvre the aircraft.
In contrast to RWY 18/36, the proposed new RWY 13/31 with its north-west/south-east orientation will mean far fewer people will be living in locations over flown by aircraft and accordingly
A2-19environmental impact statement

A2-20 SUNSHINE COAST AIRPORT EXPANSION PROJECT
bACkgROUNd TO THE PROJECT
NEED FOR THE PROJECTA2
Figure 2.2a: Potential destinations with the new runway
B737
-800
3,90
0 km
A320
/A32
14,
200
km
B777
-200
6,
100
km
B777
-300
6,60
0 km
A330
-200
/300
9,00
0 km
B787
-800
14,5
00 k
mA3
5014
,350
km
Los
Ange
les
USA
Hono
lulu
USA
Abu
Dhab
iUn
ited
Arab
Em
irate
sDuba
iUn
ited
Arab
Em
irate
sM
umba
iIn
dia
Kual
a Lu
mpu
rM
alay
sia
Sing
apor
eSi
ngap
ore De
npas
arIn
done
sia
Man
ilaPh
ilippi
nes
Taip
eiTa
iwanSe
oul
Sout
h Ko
rea
Osak
aJa
pan
Toky
o Ja
pan
Hong
Kon
gCh
ina
Guan
gzho
uCh
ina
Bang
kok
Thai
land
Auck
land
New
Zea
land
Norf
olk
Isla
nd A
ustra
lia
Port
Mor
esby
Papu
a Ne
w G
uine
aHo
niar
aSo
lom
on Is
land
sEs
pirit
u Sa
nto
Vanu
atu
Port
Vila
Vanu
atu
Naur
a Na
uru
Nadi
Fiji
Apia
Sam
oa
Noum
ea N
ew C
aled
onia
Wel
lingt
on N
ew Z
eala
nd
AUST
RALI
A
Mel
bour
ne
Adel
aide
Pert
h
Darw
in
Hoba
rt
Sydn
ey
Chris
tchu
rch
New
Zea
land
Dune
din
New
Zea
land
Quee
nsto
wn
New
Zea
land
SUNS
HINE
COA
ST
Pot
entia
l des
tinat
ions
fro
m S
unsh
ine
Coa
st A
irpo
rt w
ith a
new
Run
way
13/
31
Futu
re p
oten
tial d
estin
atio
nsC
urre
nt d
estin
atio
ns

far fewer people will be likely to experience aircraft noise at intrusive levels. As discussed in Chapter D5 – Social and Visual Impacts, the number of existing dwellings that benefit from the reorientation of the runway exceeds 5,300 by 2040.
2.2.3 economic drivers
the new runway is a critical enabler in the transition of the Sunshine Coast economy from a predominantly inwards focussed supplier of goods and services to a substantially more active participant in the global economy.
It is anticipated that the new runway will facilitate the economy of the Sunshine Coast being positioned to maximise the opportunities that will emerge from the continued growth in prosperity in Asia over the coming century.
As tourism interest from these markets increases with better access, the same can be expected for other sectors of the local economy, notably primary industries with the potential for the export of time sensitive high value food products by air. the provision of professional services to the growing economies of Asia will also be made more viable by direct connections to and from the Sunshine Coast.
the passenger forecasts discussed in this chapter indicate that the added length of the proposed runway combined with the ability to accommodate wide body aircraft would generate an additional 650,000 passengers per annum to SCA from markets that are currently inaccessible to the Sunshine Coast.
Tourism demand from China and India
China and India are well recognised as key source markets for international tourism in Australia. As stated by tourism Australia (India and China 2020 Strategic Plan, 2012):
y China is Australia’s most valuable inbound tourism market contributing $3.26 billion to the economy in 2010 and predicted to contribute $13 billion annually by 2020
y India is Australia’s 10th most valuable inbound tourism market contributing $867 million to the economy in 2011 and predicted to contribute between $1.9 and $2.3 billion annually by 2020.
Growing demand from these markets is a high priority for Australia as outlined in tourism Australia’s whole of Government tourism Australia 2020 Strategy. the strategy recognises that whilst the high Australian dollar and destination competition are key challenges for the industry; the growth in demand for travel and tourism experiences from China and India are key opportunities (tourism 2020 overview, tourism Australia).
Expenditure on tourism is considered discretionary spending and is dependent on household income and wealth. In 2014, China was the world’s fastest growing economy at a 7 per cent growth rate followed by Indonesia, Malaysia and India at 5-6 per cent. By comparison, the uS was only 3 per cent (tourism Forecasts Spring 2013, tourism Research Australia). the middle class in China and India is growing at an unprecedented rate and in the coming decades is
forecast to be one of the main drivers of the global economy. A study by the organisation for Economic Cooperation and Development (oECD) refers to this shift in wealth from west to east as a “new global economic reality” (oECD Development Centre, Working Paper 285, 2010).
the study notes that China’s middle class of 157 million people (12 per cent of its population) is already one of the world’s largest consumers of retail goods such as cars and mobile phones. It also notes that the Indian middle class is predicted to increase from 5-10 per cent of its population or 50 million people today to 580 million in 2025.
the experiences and destinations sought by tourists from China and India are also changing. For example the group travel experience most commonly associated with Chinese travellers is shifting towards more free and independent travel (tourism Australia, new Distribution Strategy). tourism Australia has published research to help understand consumer demand from these markets. Figures 2.2b and 2.2c present a summary of survey responses which shows the factors that Chinese and Indian travellers seek when choosing a destination versus the extent to which Australia is associated with each of these factors.
the Sunshine Coast has a significant competitive advantage and immense potential to become a major holiday destination sought after by international travellers. Expansion of the airport would enable flights to and from Asian destinations and is critical to facilitating tourism growth.
the economic analysis discussed later in the chapter discusses in detail the benefits the project will bring to the Sunshine Coast economy in terms of job creation and contribution to Gross Regional Product.
2.2.4 Consequences of not doing the Project
the implications of not proceeding with the project can be best be summarised as the foregoing of potential benefits the project brings as described in this chapter. In essence the capacity of Sunshine Coast residents and businesses to access new destinations/markets via the airport would remain unchanged and the airport would not meet Sunshine Coast Council’s (SCC) objectives in terms of the airport growing to support a growing Sunshine Coast economy. Added to that lost opportunity however is the potential for SCA over time to lose the exemption from CASA that it currently operates under.
the loss of the exemption would severely constrain airline operations at SCA. the inability to operate code 4C aircraft would restrict operations at SCA to the extent that the airport would become unviable for most airlines. the airport would therefore at best become a smaller regional airport with no international markets, limited domestic markets and higher costs for a much reduced number of travellers.
the effect of downgrading the airport would be a substantial impact to the State, regional and local economies. By 2040, the forecasts indicate that almost 2.4 million passengers per year could be lost to the airport. this significant number of travellers would be forced to commute to alternative airports.
A2-21environmental impact statement

the projected gross regional product contribution of $4.1 billion over the period of 2020 to 2040 (see section 2.6.5) would not be realised if the project did not proceed and the airport was downgraded. there would also be added costs and therefore disincentives for doing business on, or visiting, the Sunshine Coast due to the increased travel costs arising from the loss of direct Regular Passenger transport (RPt) services. In essence, this scenario would cause a substantial and permanent negative impact on the economy of the Sunshine Coast and, in particular, its tourism industry.
2.3 existing anD ForeCast airCraFt anD Passenger DemanD
the following sections describe both the historical trends and aircraft movements at Sunshine Coast Airport as well as the methodology used to determine future passenger
and aircraft movement forecasts associated with the Project. these forecasts are the result of the estimation of a range of factors and how these factors will change in the future. therefore, three scenarios for future aviation activity levels at SCA were assessed to reflect the range of factors included in the estimation, they are:
y Conservative Growth Forecasts
y Baseline Growth Forecasts
y Aggressive Growth Forecasts.
For the purposes of this Environmental Impact Statement (EIS), the baseline forecasts have been adopted for the assessment of impacts of the Project. these baseline air traffic forecasts are a key input to a number of other assessments in the EIS including:
y Economics (this chapter)
y Road traffic (Chapter B14)
80
70
60
50
40
30
20
10
0
22 21 20 19 18 17 16 15 14 13 12 11 10 9 8 7 6 5 4 3 2 1
Ease of obtaining visa
Greatshopping
Romantic destination
The best in luxury accommodation and
facilities
Di�erent and interesting local wildlife
Indigenous experiences Vibrant city
Clean cities / good road infrastructure
Quality accommodation
Exciting eventsFlights with no stop-overs Native or cultural heritage or activities
Spectacular coastal scenery
Great swimming beaches
Friendly and open citizens
Family friendly
World class beauty and natural
environments
Safe
and
secure
Good food, wine, local cuisine and produce
Rich history and heritage
Value for money
Interesting attractions to visit
Asso
ciatio
ns w
ith A
ustra
lia
Importance when selecting a holiday destination
Stre
ngth
Wea
k
Low High
Strengths for Australia
Opportunities for Australia
80
70
60
50
40
30
20
10
0
22 21 20 19 18 17 16 15 14 13 12 11 10 9 8 7 6 5 4 3 2 1
Ease of obtaining visa
Great shopping
Romanticdestination
The best in luxury
accommodation
and facilitiesDifferent and interesting local wildlife
Indigenous experiences
Vibrant city
Clean cities / good road infrastructure
Quality accommodation
Exciting eventsFlights with no stop-overs
Native or
cultural
heritage
or activitiesSpectacular
coastal scenery
Great swimming beaches
Friendly and open citizens
Family friendly
World class beauty and natural
environments
Safe and secure
Good food, wine, local cuisine and produce
Rich historyand heritage
Value for money
Interesting attractions
to visit
Asso
ciatio
ns w
ith A
ustra
lia
Importance when selecting a holiday destination
Stre
ngth
Wea
k
Low High
Strengths for Australia
Opportunities for Australia
Figure 2.2b: Chinese consumer travel profile (Consumer Demand Project, Tourism Australia, 2014)
Figure 2.2c: Indian consumer travel profile (Consumer Demand Project, Tourism Australia, 2014)
A2-22
background to the project
NEED FOR THE PROJECTA2
SunShIne coaSt aIrport eXpanSIon project

y Aircraft emissions (Chapter D4)
y Aircraft noise (Chapter D3).
2.3.1 historical passenger trends and aircraft movements
Figure 2.3a shows significant variation in passenger growth over the past two decades at SCA, from positive growth of 102.2 per cent from FY1993 to FY1994 to negative growth of minus 22.6 per cent from FY2000 to FY2001. In summary:
y Passenger traffic has increased at a Compound Annual Average Growth Rate (CAAGR) of 10.9 per cent from 100,150 total passengers in Financial Year (FY) 1992 to 790,002 in FY2012
y Growth rates have varied significantly over the past two decades
y Passengers were at their highest level in FY2011, at 908,851
y Passenger traffic decreased 14.4 per cent in second half of CY2012 compared to the second half of FY2010 due to changes in airline capacity and other macro-economic factors.
Figure 2.3b shows that RPt aircraft movements have remained relatively stable at around 6,000 annual movements.
General aviation and helicopter activity
As shown in Table 2.3a, fixed wing general aviation operations at SCA have decreased over the past five years while helicopter movements have increased substantially. Helicopter movements have grown largely as a result of increased helicopter training activities at the airport.
Factors affecting airline service
Factors that have affected airline service growth in the past and could continue to affect growth in the future at the airport include:
y Economic growth including population, employment, income and exchange rates
y Airline services including destinations, aircraft types, fares and route strategies
y Airline competition
y Passenger characteristics including purpose for travel and origins and destinations
y tourism patterns including changes in tourism infrastructure and marketing
y Events including natural disasters, economic crises, and investments.
these factors are examined in detail in the forecast analysis sections following.
Source: SCA, July 2012.
-50.0%
-30.0%
-10.0%
10.0%
30.0%
50.0%
70.0%
90.0%
110.0%
130.0%
150.0%
-
200,000
400,000
600,000
800,000
1,000,000
1,200,000
FY19
92
FY19
93
FY19
94
FY19
95
FY19
96
FY19
97
FY19
98
FY19
99
FY20
00
FY20
01
FY20
02
FY20
03
FY20
04
FY20
05
FY20
06
FY20
07
FY20
08
FY20
09
FY20
10
FY20
11
FY20
12
Passenger growth [YOY %; right axis]
Passengers [left axis]
Linear (Passengers [left axis])
Figure 2.3a: Historical passenger traffic (FY1992 – FY2012)
A2-23environmental impact statement

2.3.2 approach to forecasting
the forecasts have been prepared for this EIS based on a review of previous forecasts, the compilation of airport and other data and discussions with relevant local and national stakeholders in the airline and tourism industry associated with the area.
the forecasts represent an update to the 2007 Master Plan Forecast. the forecast takes into account historical data and information available since the previous forecasts were prepared. Subsequent to the publication of the 2007 Master Plan Forecast, the global financial crisis (GFC) has peaked and is in the process of being resolved in most areas of the world, although continued weakness and new issues exist in many regions.
Source: SCA, July 2012.
Figure 2.3b: Historic aircraft movements (FY 2007 – FY 2012)
Table 2.3a: Fixed wing general aviation and helicopter movements (FY2007 – FY2012)
Description
movements Caagr
Fy 2007 Fy 2008 Fy 2009 Fy 2010 Fy 2011 Fy 2012Fy2007~ Fy 2012
General Aviation 29,782 33,202 25,568 20,902 26,814 25,168 -3.3%
Growth 11.5% -23.0% -18.2% 28.3% -6.1%
Helicopter 40,314 52,120 45,300 39,698 44,948 60,302 8.4%
Growth 29.3% -13.1% -12.4% 13.2% 34.2%
total 70,096 85,322 70,868 60,600 71,762 85,470 4.0%
Growth 21.7% -16.9% -14.5% 18.4% 19.1%
Source: Airservices Australia, July 2012
A2-24
background to the project
NEED FOR THE PROJECTA2
SunShIne coaSt aIrport eXpanSIon project

Previous forecasts could only speculate about the depth and length the financial crisis might take. We now see that Australia has weathered the economic storm better than many other nations and air traffic in general has recovered to historical growth rates.
this forecast also takes into account the further evolution of changes in strategy at airlines serving the airport, including the growth in Low Cost Carriers (LCCs) in Australia and the region.
Recent local economic changes are taken into account including the recovery from the global financial crisis and efforts in government and business to improve economic growth on the Sunshine Coast.
2.3.3 Forecasting methodology
Due to the dynamic nature of historical airline traffic at the airport, a unique approach is required to determine potential future growth scenarios for traffic at the airport. Airline traffic at the airport has been subject to significant changes over time, primarily due to airline service changes. therefore, traffic levels have not always followed a traditional correlation with economic activity in the region.
For this reason, both a top-down and a bottom-up approach to developing this forecast update was adopted. the intention has been to understand economic and other macro drivers of growth, micro strategic changes in the airline industry, and local industry and policy changes that could result in changes to future airline traffic at the airport.
As demonstrated by the Forecast Assumptions, passenger and aircraft movement forecasts are the result of the estimation of a range of factors and how these factors will change in the future. therefore three scenarios for future aviation activity levels at SCA were assessed to reflect the range of factors included in the estimation:
y Conservative Growth Forecasts
y Baseline Growth Forecasts
y Aggressive Growth Forecasts.
Whilst the Baseline Growth Forecast is considered the most appropriate for assessment purposes, the actual growth in the passenger and aircraft movements may vary. the range of the Conservative and Aggressive Growth Forecasts provide a sensitivity test for the Baseline Forecasts.
Variation from the Baseline Growth Forecast would not change the reasoning behind the expansion of the airport which is strategically… “to stimulate and support the growing regional economy of the Sunshine Coast.”
For the purposes of the EIS, domestic and international forecasts have been aggregated. Freight has not been considered separately as it is transported in the holds of passenger aircraft. nevertheless, the project offers opportunities to increase freight to international destinations.
Forecast assumptions
In general, compared to earlier forecasts (SCA Forecast Report, 2009), this updated forecast assumes a higher growth rate in the near term. this is based on the assumption that growth will ‘catch up’ after a period of slow and declining growth from the GFC and tiger Airlines departure from SCA. All the forecasts also assume the following:
y An expected level of increase due to multiple large projects in planning stage or underway on the Coast such as the Maroochydore Principal Regional Activity Centre (PRAC), the Sunshine Coast Hospital and other proposed developments
y Some growth in traffic resulting from the continued growth of the resources sector of the Australian economy, for example through introduction of new services to resource sector markets such as Emerald, Mackay and Gladstone
y Expansion of international markets such as the already established new Zealand service, expansion of other trans-tasman services in the long term and growth in tourism from China and other Asian markets
y the important and significant development of the new runway which removes operational constraints and enables expansion of jet traffic after 2020
y General positive growth trends in Asia including korea which Boeing forecasts will have growth rate of 6.7 per cent for the next twenty years.
Top-down macro forecast methodology
Air travel generally correlates closely with overall socio- economic activity in a region, including income and population growth.
these factors have been analysed and used to determine general long term trends in air travel activity that could be expected to occur over time, understanding that these factors only partially explain historical traffic at the airport, creating the need for evaluation of other factors as discussed below.
Bottom-up micro forecast methodology
In addition to socio-economic activity, several other bottom-up factors have been considered for inclusion in the development of forecast scenarios. Evaluation of these factors is based on research regarding local economic changes and opportunities, and discussions with economic stakeholders in the region.
Bottom-up factors evaluated include potential local tourism infrastructure development as well as infrastructure investment in other industries in the region. Potential changes in airline capacity were considered that could capture new and developing markets, as well as traffic currently lost to service providers outside of the Sunshine Coast.
A2-25environmental impact statement

Factors restricting potential future growth were also evaluated including continued constraints at the airport, constraints on other tourism infrastructure and potentially slower growth in other sectors of the economy.
Regression analysis
Regression analysis that was performed in the evaluation of the forecasts was considered to be less than optimal in terms of accuracy due to the fluctuations in the historical data for SCA that the tend to both understate, and over state, potential future values. For example, the dramatic growth that occurred during the last decade at the airport was primarily due to the structural change in the airline industry that brought LCC operations to the airport and greatly expanded the affordability of travel in the area, as well as across the country and region. this was a structural change in the industry rather than a long-term trend.
this LCC structural change has had similar impacts in other places, where traffic has increased dramatically and continued to increase at higher growth rates than the past, but not as high as the initial LCC introductory phase. Additionally, the slow growth that has occurred recently due to operational issues and the withdrawal from SCA of tigerAir, combined with GFC economic effects on air travel are not good predictors of long-term trends at the airport.
2.3.4 baseline, aggressive, and Conservative forecasts
three scenarios for future aviation activity levels at SCA were assessed:
y Baseline growth forecasts
y Conservative growth forecasts
y Aggressive growth forecasts.
Assumptions for the Baseline Growth forecasts
the following assumptions were made for the Baseline Forecast:
y the recent recession will not create long term structural change in the economy, but rather, that the economies of Europe and the united States of America (uSA) will eventually return to rates growth closer to these experienced in the past
y the Australian dollar will weaken slightly from current levels as the difference between the resources sector and the other sectors of the economy is reduced creating more stable, even growth across the Australian economy
y Low cost carrier services will continue to expand throughout Asia and Australia further stimulating increasing demand for travel, noting that the LCC’s impact on growth is less in established LCC markets when compared to new LCC markets
y the larger development projects currently underway or planned come to fruition on the Sunshine Coast
y Demand for long distance commuter (LDC) traffic will grow and be captured through current charter operations as well as newly established RPt to destinations in the region that specialise in the resources section of the economy
y Long-term expansion in international services beyond new Zealand to new markets in China, South East Asia and elsewhere.
Assumptions for the Conservative forecasts
the Conservative Growth Forecasts assume a lower growth rate in traffic due in part to an assumed longer-term continuation of economic difficulties in Europe and uS. the following assumptions were made for the conservative case:
y Continued low economic growth in Europe and the uSA with flow effects to growth rates in China
y Mounting evidence in China suggests that the economy is slowing more dramatically than previously assumed.
y Although it is expected that the country will continue to grow, growth may be at slower rates than forecast in the past
y Continuation of a strong Australian dollar, making destinations outside of Australia more attractive and affordable for travellers than destinations within the country. the strong dollar could also have other potential negative influences on the Australian economy, particularly export sectors
y the airlines ability to quickly respond to market forces is hampered by ongoing financial and industrial relations issues
y other potential negative influences that could result in traffic forecast in the low scenario include continued high and potentially increasing fuel prices and other events such as natural disasters, pandemics, or financial crises.
Assumptions for the Aggressive Growth forecasts
the Aggressive Growth forecasts assume that a significant combination of most of the qualitative and quantitative issues outlined in other scenarios combine in positive ways to elevate the Sunshine Coast to higher levels of economic activity and growth. this scenario assumes that some or most of the large projects on the coast will be completed. Assumptions adopted in the aggressive scenario are:
y Local projects are completed, including the university of the Sunshine Coast hospital, the Maroochydore PRAC, with increased convention centre space and Bruce highway upgrading, both north and South of the Sunshine Coast
y under this scenario it is assumed these projects would, have significant effects on aviation demand, both for domestic and international travel.
All of these projects work symbiotically with airport expansion projects and contribute to a higher level of business and tourism activity:
A2-26
background to the project
NEED FOR THE PROJECTA2
SunShIne coaSt aIrport eXpanSIon project

y Economic growth will be stronger, population growth and workforce participation will be higher, and all of these factors will result in a higher level of growth in airport traffic supporting the activity, as well as an increase in the capture of passenger volume currently leaking to Brisbane.
In terms of airline service, the aggressive growth scenario assumes that international service to new Zealand will become more viable, without operational restrictions, and that other international markets will be opened up with direct services to the Sunshine Coast.
y International growth is assumed to come particularly from new Zealand, as it is already an established origin for international tourists, but more from China and other Asian origins
y China has already grown to become the second largest tourism origin in Australia, and likely will soon be second behind new Zealand. Due to the growth trend of Chinese tourism, and the large population with growing incomes in the country, it is assumed that this will be a large growth origin market for Australia and the Sunshine Coast
y Additionally, some of the Chinese airlines have small- capacity long-haul aircraft (such as 220~280 seat aircraft) that are better suited to the Sunshine Coast’s market size than the large long-haul LCC aircraft (such as Scoot’s 400-seat Boeing 777s) that currently fly to Gold Coast Airport.
2.3.5 aviation activity forecasts
For the purposes of this EIS, the baseline forecasts have been adopted for the assessment of project related impacts.
Passenger movements
Summarised in Figure 2.3c and Table 2.3b, are the annual passenger movements for each of the three forecast scenarios for the forecast period.
Aircraft movements
Table 2.3c summarises the annual aircraft movements for each of the three forecast scenarios for the forecast period
Seats and passengers per commercial aircraft movement
Table 2.3d summarises the seats and passengers per commercial aircraft movement assumed for each of the three forecast scenarios for the forecast period.
Figure 2.3c: Historical and forecast passenger movements: Sunshine Coast Airport (1995-2040)
A2-27environmental impact statement

Table 2.3b: Passenger movements forecasts: Sunshine Coast Airport (2012 – 2040)
actual Forecast Caagr
Passenger movements 2012 2018 2020 2030 2040 2012-2040
Baseline scenario 1,168,449 1,288,215 2,098,367 2,959,954 4.8%
Conservative scenario 943,304 991,058 1,268,639 1,623,965 2.6%
Aggressive scenario 1,185,580 1,332,118 2,385,620 3,704,795 5.7%
Actual 790,002
ForeCast Caagr
Passenger movements (Caagr) 2012-2018 2018-2020 2020-2030 2030-2040 2012-2040
Baseline scenario 6.7% 5.0% 5.0% 3.5% 4.8%
Conservative scenario 3.0% 2.5% 2.5% 2.5% 2.6%
Aggressive scenario 7.0% 6.0% 6.0% 4.5% 5.7%
estimated Forecast Caagr
Busy day passenger movements 2012 2018 2020 2030 2040 2012-2040
Baseline scenario 2,842 4,280 4,700 7,660 10,810 4.9%
Conservative scenario 2,842 3,460 3,620 4,630 5,930 2.7%
Aggressive scenario 2,842 4,350 4,870 8,710 13,540 5.7%
estimated Forecast Caagr
Busy hour passenger movements 2012 2018 2020 2030 2040 2012-2040
Baseline scenario 710 880 870 1,080 1,790 3.4%
Conservative scenario 710 730 720 770 1,140 1.7%
Aggressive scenario 710 880 870 1,230 2,280 4.3%
Table 2.3c: Annual aircraft movement forecasts: Sunshine Coast Airport (2012 – 2040)
actual Forecast Caagr
aircraft movements 2012 2018 2020 2030 2040 2012-2040
Commercial aircraftBaseline scenario 5,559 8,020 8,900 13,660 18,210 4.3%
Conservative scenario 5,559 6,470 6,850 8,260 9,990 2.1%
Aggressive scenario 5,559 8,140 9,210 15,530 22,800 5.2%
General aviation 25,168 27,720 29,370 35,630 35,630 1.3%
Helicopters 60,302 66,420 70,390 85,390 85,390 1.3%
ForeCast Caagr
aircraft movements (Caagr) 2012-2018 2018-2020 2020-2030 2030-2040 2012-2040
Commercial aircraft
Baseline scenario 6.3% 5.3% 4.4% 2.9% 4.3%
Conservative scenario 2.6% 2.9% 1.9% 1.9% 2.1%
Aggressive scenario 6.6% 6.4% 5.4% 3.9% 5.2%
General aviation 1.6% 2.9% 2.0% 0.0% 1.3%
Helicopters 1.6% 2.9% 2.0% 0.0% 1.3%
actual Forecast Caagr
average aircraft movements per day 2012 2018 2020 2030 2040 2012-2040
Commercial aircraft
Baseline scenario 22.0 24.4 37.4 49.9 4.3%
Conservative scenario 17.7 18.8 22.6 27.4 2.1%
Aggressive scenario 22.3 25.2 42.5 62.5 5.2%
Actual 15.2
General aviation 69.0 75.9 80.5 97.6 97.6 1.3%
Helicopters 165.2 182.0 192.8 233.9 233.9 1.3%
A2-28
background to the project
NEED FOR THE PROJECTA2
SunShIne coaSt aIrport eXpanSIon project

Table 2.3d: Assumed seats and passengers per commercial aircraft movement: Sunshine Coast Airport (2012 – 2040)
actual Forecast Caagr
seats per commercial aircraft movements 2012 2018 2020 2030 2040 2012-2040
Baseline scenario 175.0 172.0 170.2 180.7 191.2 0.3%
Conservative scenario 175.0 172.0 170.2 180.7 191.2 0.3%
Aggressive scenario 175.0 172.0 170.2 180.7 191.2 0.3%
actual Forecast
Change in seats per commercial movement 2012 2018 2020 2030 2040
Baseline scenario -3.0 -1.8 10.5 10.5
Conservative scenario -3.0 -1.8 10.5 10.5
Aggressive scenario -3.0 -1.8 10.5 10.5
actual Forecast Caagr
Passengers per commercial movement 2012 2018 2020 2030 2040 2012-2040
Baseline scenario 142.1 146.2 144.7 153.6 162.5 0.5%
Conservative scenario 142.1 146.2 144.7 153.6 162.5 0.5%
Aggressive scenario 142.1 146.2 144.7 153.6 162.5 0.5%
actual Forecast
Commercial aircraft load factors 2012 2018 2020 2030 2040
Baseline scenario 81.2% 85.0% 85.0% 85.0% 85.0%
Conservative scenario 81.2% 85.0% 85.0% 85.0% 85.0%
Aggressive scenario 81.2% 85.0% 85.0% 85.0% 85.0%
2.3.6 busy day and busy hour profiles
In considering airport capacity and forecasting, it is accepted industry practice to plan around a typical or representative busy day rather than the day with the maximum movements.
Methodology
Development of the busy day flight schedules for SCA is based, in part, on the busiest day in a recent month (july 2012). the busy day used for analysis was similar to the IAtA busy day definition of the second busiest day during an average week during the peak month. A more recent day was used, rather than a day in the previous fiscal year since it was similar in volume, but with more recent operational schedules, which was considered more representative of potential future service levels.
the following can be said of the busy day schedules:
y Future busy day flight schedule forecasts were based on the passenger and movement forecasts with appropriate ratios applied
y For busy hour projection, some smoothing of operations was implemented as the Airport operations mature to a more typical operation
y overall, the operations during the forecast busy hour grow, but at a lower rate than passenger movements grow.
the methodology employed is due, in part, to the unique nature of SCA’s current demand and operations, which are primarily focused on serving domestic passengers travelling for leisure purposes and to visit friends and relatives (VFR):
y through the qualitative analysis and build-up of a potential future flight schedule, the forecast assumes growth in business traffic and earlier morning flights with the introduction of overnighting aircraft that will arrive in the later evening, overnight at the airport, and depart in the morning hours
y the schedule also assumes new turboprop aircraft operations to mining sector regions and international jet operations to China and other Asia origins
A2-29environmental impact statement

y As these new and different types of operations are introduced at the airport, further smoothing over time periods during the day will occur and the Busy hour operation levels will grow at a slower rate than overall operations.
Runway development scenarios
Schedules have been produced for three primary runway scenarios (see Chapter A3 – options and Alternatives for more detail on each):
New Runway Scenario. this scenario assumes that a new runway will be built at the airport to accommodate unrestricted narrow-body and wide- body aircraft operations to unlimited domestic and international destinations.
Do Minimum Scenario. this scenario assumes that the airport will do minimum work on the existing runway to avoid future restrictions imposed by CASA that could limit operations to turboprop aircraft only. this scenario is limited to narrow-body and turboprop destinations to domestic and trans-tasman international destinations only.
Do Nothing Scenario. this scenario assumes no runway work is completed and the airport is restricted to primarily turboprop aircraft and jet aircraft smaller than Code 4C soon after the 2020 forecast.
Busy day and busy hour flight schedules
Summarised in Table 2.3e are the busy day and busy hour commercial aircraft movements for each of the three forecast scenarios for the forecast period.
Detailed busy day and busy hour flight schedules for 2020 and 2040 showing aircraft type and potential port of destination are included in Appendix A2:A. Appendix A2:B includes Busy Day and Busy hour flight schedules for all years assessed.
2.3.7 ultimate runway Capacity
the proposed runway configuration of one jet capable runway with turning loops at each end will enable a maximum of 12 RPt take off movements per hour based on the following assumptions:
y RWY 13 is most commonly the duty runway
y A 2.5 km taxiing distance from the RPt apron
y A typical taxying speed of 40 km/h
y An expected runway “occupancy period” of 5 minutes per take off.
this “ultimate” capacity is reduced in practice by weather conditions, the use of RWY 13/31 by general aviation aircraft and the need to avoid wake turbulence between large and small aircraft operations. It should also be noted that the expansion of the RPt apron would see a capacity of 7 Code 4C aircraft, each with a typical turnaround time of 40 minutes reducing the capacity of the expanded airport to a maximum of 10 RPt services per hour.
It is stressed that this is a figure well beyond the likely demand for services as evidenced in the forecasts included in this chapter and beyond the planned capacity of the airport terminal building.
Table 2.3e: Forecast aviation activity for 2012-2040 – runway development scenarios
actual Forecast Caagr
busy day commercial aircraft movements 2012 2018 2020 2030 2040 2012-2040
Average week day 15.0
Baseline scenario (based on average/busy ratio) 20 29 33 50 67 4.4%
Conservative scenario (based on average/busy ratio) 20 24 25 30 36 2.1%
Aggressive scenario (based on average/busy ratio) 20 30 34 57 83 5.2%
actual Forecast Caagr
busy hour commercial aircraft movement 2012 2018 2020 2030 2040 2012-2040
2012 busy hour = 12:00-12:59 5.0
Baseline scenario 5 6 6 9 11 2.9%
Conservative scenario 5 5 5 6 7 1.2%
Aggressive scenario 5 6 6 10 14 3.6%
A2-30
background to the project
NEED FOR THE PROJECTA2
SunShIne coaSt aIrport eXpanSIon project

2.4 the sunshine Coast eConomy
2.4.1 the sunshine Coast’s competitive advantages
It is useful to identify a region’s unique strengths and competitive advantages to identify opportunities for future economic growth. this Section outlines the economic profile of the Sunshine Coast LGA, including the Gross Regional Product (GRP), and leading industries and businesses for employment.
the Sunshine Coast is fortunate to have numerous competitive advantages that can assist in generating economic returns in the future:
y SCA and the Aerospace Precinct: offers daily direct services to Sydney and Melbourne, provided by jetstar, and Virgin Australia. International flights to Auckland are also provided on a twice weekly seasonal basis. the Project will increase capability and opportunities for aircraft support services and training. Caloundra Airport is located 29 km to the south of SCA and caters to helicopters and light aircraft, as well as being home to a number of specialist aviation service providers
y Accessibility: the Bruce Highway and Sunshine Motorway provide the main connections to Brisbane (approximately 1-1.5 hours)
y Agricultural production: the Sunshine Coast produces a variety of agricultural products including, ginger, vegetables, macadamia nuts and a variety of sub-tropical fruits. the climate is well suited to agriculture and the region receives relatively good levels of rainfall
y Existing brand: the Sunshine Coast is a recognised ‘brand’ that represents a clean, natural and beautiful environment. this reputation is well known in Australia and is acknowledged internationally. Brand recognition is incredibly valuable. For many companies or products, the value association with such a strong brand is important
y university of the Sunshine Coast, Central Queensland university, tAFE and Innovation Centre: uSC, CQu and tAFE provide considerable capability in education and skills training. the innovation centre provides a strong platform to grow high technology companies
y Health infrastructure: the Queensland Government is investing $2.03 billion Sunshine Coast university Hospital at kawana. this hospital is due to open with 450 beds in 2016, expanding to 738 beds by 2021. this infrastructure will provide a considerable boost to health sector employment and act as a catalyst for other health related services
y Labour specialisation: the Sunshine Coast has a relatively high labour specialisation in certain sectors (certain types of manufacturing, cultural and recreational services, and health and community services). It also has capabilities in environmental management and marine professional services, information technology and
communications, aviation, and education
y Arts and creativity: the Sunshine Coast is home to potters, painters, leather workers, glass artisans, timber and stone carvers and artisans in precious metals. these businesses also support the Sunshine Coast’s numerous arts and crafts shops, galleries and markets including the Eumundi Markets, which is one of the biggest in Queensland
y Quality of life: the Sunshine Coast has an envious lifestyle and high quality of life featuring diverse natural landscapes including more national parks than any other Queensland region, pristine beaches, and a subtropical climate. Accessibility to the region will be a key element in building on the region’s competitive advantage.
the indicators that underpin the competitive advantages of the Sunshine Coast region including demographic characteristics and the labour market are shown in Table 2.4a and summarised in this section.
2.4.2 gross regional Product
Gross Regional Product (GRP) is the measure of the size of a regional economy. It is similar to Gross State Product (GSP) for a State and Gross Domestic Product (GDP) for a country.
the Sunshine Coast economy is estimated to have recorded GRP of $13.8 billion in the 2010-11 financial year. over a five year period between 2006-07 and 2010-11, the Sunshine Coast economy grew by an average of 7.2 per cent annually (as reflected in Figures 2.4a and 2.4b).
While the Sunshine Coast has declined from a peak growth of 11 per cent in 2007-2008, the Sunshine Coast economy has recorded firmer growth in GRP than the Queensland economy (GSP) since the GFC, except for 2008-09 when the GFC’s affects were most strongly felt on the Sunshine Coast.
2.4.3 industry contribution to grP
the contribution to GRP can be estimated by industry group to understand the relative contribution of each industry group to the regional economy (refer Figure 2.4c). the top ten industry groups on the Sunshine Coast are estimated to account for around 62 per cent of the regional economy.
the construction industry represents the largest contribution to GRP in the Sunshine Coast economy. Having a strong construction sector is often associated with areas that have high levels of population growth, given the demand population growth places on residential development.
Finance, manufacturing and professional services also make important contributions to the Sunshine Coast economy. their significant contributions to GRP are paired with relatively lower levels of employment, indicating that these sectors provide a relatively higher value per employee to the economy.
A2-31environmental impact statement

Table 2.4a: Economic baseline summary
sunshine Coast lga, 2011 total employment employment
Key indicators unit sunshine Coast lga
Employment no. 117,133
unemployed no. 7,318
unemployment rate % 5.9
Gross Regional Product $M 13,815
Population no. 338,427
Population growth (historic) % 3.1
Population growth (forecast) % 2.1
Median age Age 42
Dwelling structure – separate dwellings % 76.6
Dwelling structure – attached dwellings % 23.4
total tourism visitors no. 7,896,000
total expenditure $M 2,188
Average weekly income $ 953
Industry of employment – retail trade no. 25,360
Industry of employment – health care and social assistance no. 21,113
Industry of employment – construction no. 20,859
Industry of employment – accommodation and food service no. 15,869
Industry of employment – manufacturing no. 12,240
Business count no. 34,548
Source: Urbis, AEC Group, ABS
Source: Urbis, ABS
Figure 2.4a: Gross Regional Product
A2-32
background to the project
NEED FOR THE PROJECTA2
SunShIne coaSt aIrport eXpanSIon project

Source: Urbis, AEC Group
Source: Urbis, AEC Group
Figure 2.4c: Gross Regional Product by top 10 industries
Figure 2.4b: Gross Regional Product growth
A2-33environmental impact statement

the relatively high contribution to the economy by retail trade, and accommodation and food services (9.3 per cent and 4.2 per cent of GRP) highlight the strong tourism sector in the region, as these are the two industry sectors that benefit most from tourist visitation. By comparison, at the national level, retail trade and accommodation and food services represents 4.4 per cent and 2.2 per cent to Australian Gross Domestic Product.
2.4.4 number of businesses
Consistent with the GRP figures, the Construction industry has the highest number of businesses of any industry in the region (refer Figure 2.4d). the significantly high number of Construction businesses indicates that these are likely to be mostly small scale businesses, equating to $189,000 in GRP per business.
Rental, Hiring and Real Estate Services is the second largest industry sector by business count though it has a relatively low GRP contribution per business of $126,000. In contrast Financial and Insurance Services has a high GRP contribution per business of $585,000 indicating these are more substantial businesses.
2.4.5 grP per employee
GRP per employee provides an indication of the relative economic productivity of each industry sector. It combines industry sector GRP data with employment data to develop a GRP per employee metric.
When considering the economic benefits of the project, in addition to considering the total number of jobs created, it is important to consider how much GRP each individual employed person will contribute based on their industry. this enables projects to understand the industries that provide the highest GRP per Employee to enable to increase the economic productivity of a region.
As noted previously the industry’s most likely to see stimulus from the Project are Aviation, Retail trade, Accommodation and Food Services, transport, Postal and Warehousing, and Construction.
Both Retail trade, and Accommodation and Food Services are towards the lower end of GRP per employee, while Construction, and transport, Postal and Warehousing provide a moderate benefit. opportunities may exist to improve these industry offerings and GRP per Employee, such as by targeting higher-end tourism or developing a logistics hub.
Source: Urbis, AEC Group
Figure 2.4d: Business count by top 10 industries
A2-34
background to the project
NEED FOR THE PROJECTA2
SunShIne coaSt aIrport eXpanSIon project

Financial and insurance services and mining are currently the largest contributors to GRP per employee in the region. In particular the mining sector is dependent on accessibility into and out of the region. Continuation and potential growth in this sector is likely to leverage off the development of improved local airport infrastructure.
2.4.6 labour market
the labour market analysis of the Sunshine Coast region incorporates the unemployment rate and employment profile by occupation and industry (refer Figures 2.4e and 2.4f).
Unemployment Rate
the unemployment rate on the Sunshine Coast in December 2011 was 6.1 per cent. the unemployment rate on the Sunshine Coast has been consistently above Queensland, which is common with many lifestyle regions. the participation rate, which measures the amount of people in the workforce, was 62.9 per cent in December 2011, lower than Queensland levels, which is again consistent with lifestyle regions.
the Sunshine Coast experienced significant growth in labour force numbers from june 2004 through to june 2008, coinciding with an increase in development activity within the LGA. the labour force peaked in june 2011 at 122,035 workers.
the unemployment rate in the Sunshine Coast softened during the annual period of 2011 to end at 6.1 per cent, coinciding with an increase in the labour force, indicating that the number of new jobs generated during this period was enough to absorb the additional workforce.
Despite a temporary deceleration in 2009 (related to the effects of the GFC), the trend shown by the Sunshine Coast labour force figures between 2004 and 2011 can be described as one of constant growth.
Employment by occupation
2011 Census data is not yet available for employment. Information on the Employment profile for the Sunshine Coast and Queensland has been drawn from internal Sunshine Coast Council reports and statistics for the State Government (office of Economic and Statistical Research).
Table 2.4b: Gross Regional Product per employee
industrygrP ($m)
employed people (no.)
grP/employee ($)
Financial and insurance services 1,284 4,831 265,783
Mining 38 272 139,706
Information media and telecommunications 287 2,195 130,752
Wholesale trade 443 3,494 126,789
Electricity, gas, water and waste services 240 1,938 123,839
Rental, hiring and real estate services 576 5,321 108,250
Agriculture, forestry and fishing 390 4,345 89,758
transport, postal and warehousing 456 5,436 83,885
Professional, scientific and technical services 756 9,683 78,075
Construction 1,522 20,859 72,966
Manufacturing 860 12,240 70,261
Public administration and safety 471 6,978 67,498
Administrative and support services 296 5,217 56,738
Education and training 519 9,170 56,598
Health care and social assistance 1,180 21,113 55,890
Retail trade 1,279 25,360 50,434
other services 240 6,184 38,810
Accommodation and food services 586 15,869 36,927
Arts and recreation services 72 2,510 28,685
Source: AEC Group, Urbis
A2-35environmental impact statement

Source: DEEWR, Small Area Labour Market Data; Urbis
Figure 2.4e: Labour force and unemployment rate
Sunshine Coast Queensland
Source: Census 2011; Prepared by Urbis
Figure 2.4f: Employment by occupation
A2-36
background to the project
NEED FOR THE PROJECTA2
SunShIne coaSt aIrport eXpanSIon project
Generally the Sunshine Coast displays a similar occupation profile to Queensland, with the same ranking for the top three occupations. the major differences are that the Sunshine Coast has:
y A higher proportion of Sales Workers, reflective of the strong retail component of the economy
y A lower proportion of Machinery and operators and Drivers, associated with the lower level of manufacturing occurring on the Sunshine Coast
y A lower percentage of labourers consistent with the low proportion of younger persons in the region.
Employment by industry
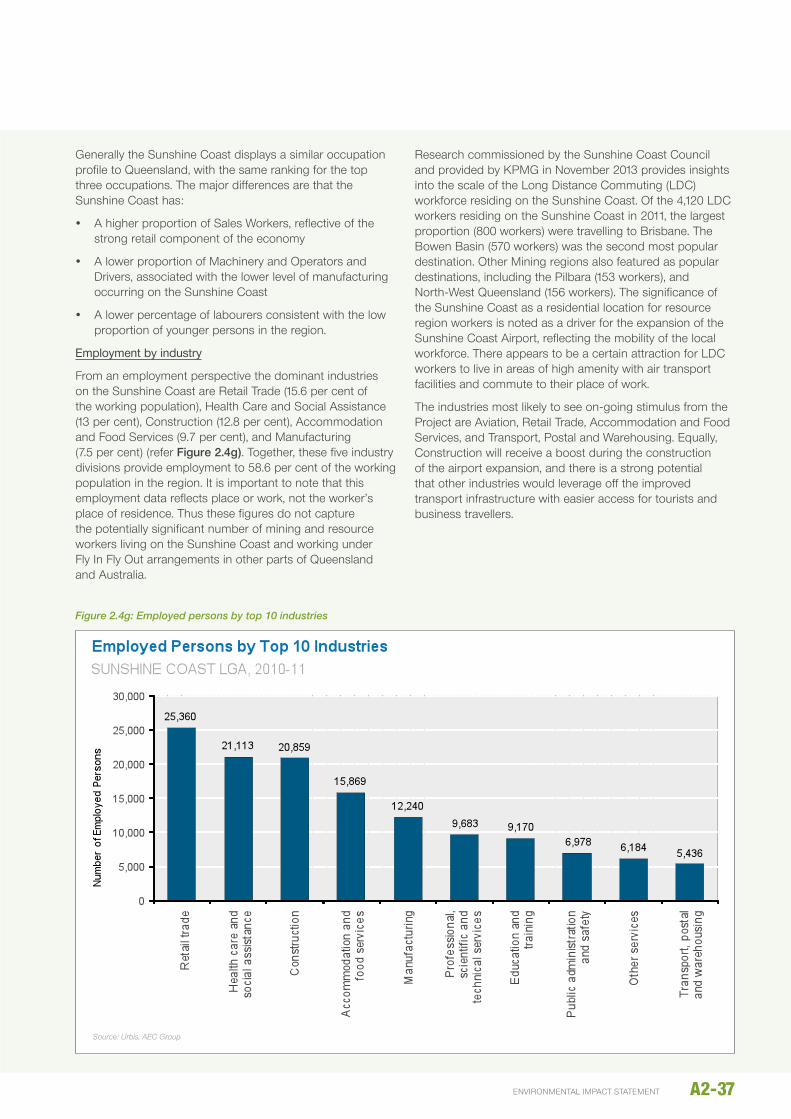
From an employment perspective the dominant industries on the Sunshine Coast are Retail trade (15.6 per cent of the working population), Health Care and Social Assistance (13 per cent), Construction (12.8 per cent), Accommodation and Food Services (9.7 per cent), and Manufacturing (7.5 per cent) (refer Figure 2.4g). together, these five industry divisions provide employment to 58.6 per cent of the working population in the region. It is important to note that this employment data reflects place or work, not the worker’s place of residence. thus these figures do not capture the potentially significant number of mining and resource workers living on the Sunshine Coast and working under Fly In Fly out arrangements in other parts of Queensland and Australia.
Research commissioned by the Sunshine Coast Council and provided by kPMG in november 2013 provides insights into the scale of the Long Distance Commuting (LDC) workforce residing on the Sunshine Coast. of the 4,120 LDC workers residing on the Sunshine Coast in 2011, the largest proportion (800 workers) were travelling to Brisbane. the Bowen Basin (570 workers) was the second most popular destination. other Mining regions also featured as popular destinations, including the Pilbara (153 workers), and north-West Queensland (156 workers). the significance of the Sunshine Coast as a residential location for resource region workers is noted as a driver for the expansion of the Sunshine Coast Airport, reflecting the mobility of the local workforce. there appears to be a certain attraction for LDC workers to live in areas of high amenity with air transport facilities and commute to their place of work.
the industries most likely to see on-going stimulus from the Project are Aviation, Retail trade, Accommodation and Food Services, and transport, Postal and Warehousing. Equally, Construction will receive a boost during the construction of the airport expansion, and there is a strong potential that other industries would leverage off the improved transport infrastructure with easier access for tourists and business travellers.
Source: Urbis, AEC Group
Figure 2.4g: Employed persons by top 10 industries
A2-37environmental impact statement

2.5 PoliCy anD Context anD legislative FrameworK
the future growth of the Sunshine Coast economy will be influenced by decisions made by local, State and the Commonwealth government. this section outlines the current policy directions that are most relevant to the Project:
2.5.1 Commonwealth government
2.5.1.1 Infrastructure Australia (IA)
the key function of IA is to develop a strategic blueprint for the nations long term economic infrastructure needs, including transport, water, energy and communications. the project is an investment in the necessary economic infrastructure central to diversifying the Sunshine Coast Regional economy.
2.5.1.2 Regional Development Australia (RDA)
the RDA Sunshine Coast is one of 55 local RDA committees across Australia. the Sunshine Coast Regional Roadmap 2013-2016 “recognises the positive economic and social implications of the proposed upgrade [of Sunshine Coast Airport] on tourism, mining (FIFo), aviation as well as general export and trade opportunities. the project is essential towards meeting the region’s economic development needs”.
2.5.2 state government
2.5.2.1 Economic Directions Statement Queensland Airports 2013-2033
this statement outlines the State Government’s policy settings to capitalise on the role of airports in supporting Queensland’s economic growth. the statement recognises SCA and the project as of economic significance to the state by virtue of its contribution to tourism, aviation business and employment.
2.5.2.2 The Queensland State Planning Policy (SPP)
the SPP nominates SCA is one of 23 airports of strategic economic significance in Queensland. the SPP establishes a range of land use planning controls intended to protect strategic airports from inappropriate development.
2.5.2.3 South East Queensland Regional Plan (SEQRP)
the SEQRP identifies SCA as an “enterprise opportunity area creating highly skilled jobs in knowledge based industries as a key to economic diversity on the Sunshine Coast”.
2.5.3 local government
2.5.3.1 Sunshine Coast Council (SCC) Corporate Plan 2014
under SCC’s Corporate Plan the expansion of SCA is recognised as one of the priority activities to deliver SCC’s economic goals.
2.5.3.2 Regional Economic Development Strategy 2013-2033
A key component of the economic development strategy is the development of the coast’s economy to be less reliant on local consumption and to generate wealth through export, high-value industries and new investment. the region’s infrastructure will support its participation in the global economy. the expansion of SCA to provide an international gateway to the Sunshine Coast is a fundamental element of the strategy.
In addition the aviation and aerospace industry, further stimulated by the Project, is identified is one of the seven ‘high value’ industries upon which the economic strategy relies.
2.5.3.3 Sunshine Coast Planning Scheme
SCC’s Planning Scheme recognises SCA as a key element of the Coast’s infrastructure. the expansion of the airport has been provided for in the scheme’s strategic planning and development control provisions. the scheme addresses not only the development of the airport itself but also the impact that the airport has upon the lands surrounding it.
2.5.4 government investment (all levels of government)
the following list highlights the major programs and funding priorities of all levels of government that will influence the economy Sunshine Coast region:
y Sunshine Coast Airport Expansion
y Sunshine Coast Light Rail Project
y Maroochydore Principal Activity Centre
y Sunshine Coast Business and technology Precinct
y Sunshine Coast university hospital
y national Broadband network
y Bruce Highway upgrades – both north and south of the Sunshine Coast.
2.6 eConomiC assessment oF the ProjeCt
the economic assessment of the Project has used the baseline passenger forecasts presented in Section 2.3.4.
the Project sees pre-development and feasibility work commencing in 2015, runway construction commencing in 2016 and the new runway becoming operational in 2020.
Existing groups of passengers from the ‘do nothing’ and ‘do minimum’ scenarios continue to fly from the Sunshine Coast. these passengers are also augmented by new passengers (estimated at 650,000 per annum) who now have the opportunity to fly to new destinations from SCA.
A2-38
background to the project
NEED FOR THE PROJECTA2
SunShIne coaSt aIrport eXpanSIon project

the economic assessment considers two separate sets of potential project benefits:
y net Economic Benefits – the use of benefit cost analysis (BCA) techniques to estimate whether the benefits of the Project outweighs the costs from the point of view of the State of Queensland
y Regional Economic Benefits – the use of Input/output modelling techniques to estimate the contribution of the Project to Gross Regional Product and regional employment.
2.6.1 methodology
2.6.1.1 Benefit cost analysis
BCA is a tool that can be used to determine whether the benefits of a proposed project outweigh the costs in present value terms. BCA is often used as a decision-making tool to inform discussions around whether a project should proceed or not. BCA appraises whether the benefits of a project exceed the costs from the point of view of society as a whole.
Inputs to the BCA included:
y Passenger forecasts
y Project construction costs
y Induced consumer demand (based on tFI, 2010).
Figure 2.6a summarises the methodology for undertaking a BCA for the project.
the BCA was undertaken consistent with several guidelines including:
y CASA, Cost Benefit Analysis Procedures Manual, 2010
y Australian transport Council, national Guidelines for transport Systems Management in Australia, 2006
y IA, Better Infrastructure Decision-Making Guidelines, 2010
y Austroad, Guide to Project Evaluation, 2010
y the Department of treasury (QLD), Project Assurance Framework: Guidance Material for Cost Benefit Analysis, 2012.
the measures of net economic worth considered in the BCA are:
y nPV – the present value of the incremental benefits of the Project Case minus the present value of the incremental costs of the Project Case. Projects with a positive nPV have net benefits to society over the appraisal period
y BCR – the ratio of the present value of the incremental benefits of the Project Case to the present value of the incremental costs of the Project Case. Projects with a BCR greater than one have net benefits to society over the appraisal period.
1 2 3
Benefit Cost Analysis framework
4 5 6
7
Define objectives and Project scope
Identify Project options
Identify unquantified costs and benefits
Identify unquantified benefits
Discount future costs and benefits
Undertake sensitivity tests and risk analysis
Indentify preferred option
Preparereport
Identify unquantified costs
3
3
Figure 2.6a: BCA methodology for the Project
A2-39environmental impact statement

the key parameters used in the BCA are listed in Table 2.6a.
Table 2.6a: BCA parameters
Parameter value(s) applied
Discount rate 7 per cent real – as per Infrastructure Australia’s october 2010 “Better Infrastructure Decision-Making guidelines”.
Sensitivity tests (discount rate) 4 and 10 per cent real.As per Infrastructure Australia’s october 2010 “Better Infrastructure Decision-Making guidelines”.
Price year All benefits and costs are estimated in 2013 constant prices.
Evaluation year 2014 – i.e. Year 0 – 2014.
Appraisal period 2014 – 204020 years from the end of the capital investmenti.e. Capital expenditure (including pre-feasibility works) 2014 – 2019, benefits and other impacts 2020 – 2040
Economic appraisal (BCA) Costs and benefits appraised from a community or society perspective (as opposed to the narrower perspective of the project sponsor). Includes relevant and significant impacts that are both internal and external to the project sponsor/service provider, such as environmental effects and travel time savings estimates.
Consumer price index 2.5 per cent (i.e. the middle of the RBA’s target band).
Passenger forecasts Baseline, conservative and aggressive passenger forecasts provided by Leading Edge Aviation Planning Professionals (LEAPP) for the Project Case. A baseline passenger forecast has been provided by LEAPP for the Do Minimum option.
Quantifying project benefits
Project benefits have been quantified by determining the benefits that accrue to society (in this case associated with avoided passenger travel to and from Brisbane airport) with the construction of the new runway. A key assumption in quantifying project benefits is how the forecast passenger numbers presented in Section 2.3.4 are divided into:
y Forecast domestic passengers who transfer from other routes (such as Brisbane Airport) due to the new runway at SCA
y Forecast domestic passengers who are totally new and now choose to fly because a direct service is offered by the Sunshine Coast due to the new runway.
the BCA assumes that 30 per cent of passengers would transfer from Brisbane Airport. this assumption is based on work done by tourism Futures International which found that 70 per cent of passengers under an upgraded Sunshine Coast airport scenario would represent induced demand and 30 per cent would represent transfer from other routes.
Avoided travel costs
Forecast domestic passengers who transfer from other routes (such as Brisbane Airport) would now no longer have to drive between the Sunshine Coast and Brisbane. under the new runway project, these people will experience the benefits of avoiding these travel costs for example through reduced travel time, reduced fuel, avoided accidents and
avoided car pollution. these benefits can be calculated using national guidelines and standard project evaluation parameters for the Project case.
Consumer foregone surplus
the induced demand passengers are those who now choose to fly from SCA because a direct service is offered to their destination. these passengers were previously deterred from travel under the Do nothing scenario but return to the market (and grow in number) with the airport upgrade. these passengers represent an induced demand. In the Do nothing case, these people do not value their trip sufficiently to pay the higher travel costs to drive to or from Brisbane and experience a consumer surplus loss if the Project proceeds.
Applying economic principles, the value of this consumer surplus is, at a maximum, just less than the full cost of the road trip between Brisbane and the Sunshine Coast and at a minimum, only a small fraction of the cost of the road trip between Brisbane and the Sunshine Coast. the reason the value has been determined this way is that currently, the full cost of a road trip is deterring them from travel, so the economic value of their induced demand must be less than this full cost to induce them to travel.
A2-40
background to the project
NEED FOR THE PROJECTA2
SunShIne coaSt aIrport eXpanSIon project

In this BCA it is assumed that the consumer surplus is equal to 25 per cent of the cost of a trip by road between Brisbane and the Sunshine Coast (the figure is tested for robustness in the sensitivity analysis in Section 2.6.3).
Quantifiable Project costs
All costs considered in the BCA are incremental to the Do nothing scenario. that is, expended only as a result of the new works. Project costs have been developed for the Project and include:
y Runway construction costs including development works and construction of access roads and the expanded apron
y Runway and terminal operating costs associated with additional passenger numbers.
operating costs have been estimated by Sunshine Coast Airport and include:
y operating staff costs
y Regular (less than 12 months) repairs and maintenance
y operating purchases and other miscellaneous items associated with the day to day running of the airport.
Other economic impacts not quantified
A fully quantified estimation of the value of impacts has not been included in the BCA as the purpose of this assessment is to focus only on key costs and benefits.
Avoided health and safety impacts
there are assumed to be avoided health and safety impacts (including noise and pollution related impacts) from reduced number of homes within the n70 noise contour. See Chapter D5 for more information.
Property price impacts
there are assumed to be property price impacts (positive and negative) which have not been quantified for this project. these impacts include property price impacts in newly affected areas and would be experienced from the point that new runway plans are announced and shown in public. these impacts may then extend into the construction period and ongoing operating period. However, the plans for the construction of the proposed new runway at SCA have been in public circulation since 1985. therefore, it is reasonable to expect that property price impacts have already been factored into properties deemed to be in an impact zone.
It is noted that an assessment of noise effects has been undertaken on potential impacted property which indicates there may be a small net negative impact across the range of potentially impacted properties (see Chapter D5). this is likely to be outweighed by positive property price impacts resulting from the greater accessibility provided to houses in proximity to the airport with the expanded facilities.
the design of the new runway takes into consideration the importance of minimising the impacts of noise from the Project.
Avoided flight diversions
the current runway at SCA must be operated within specific operational requirements determined by CASA. the length, width and orientation of the runway means that on occasion, flights are diverted from the Sunshine Coast to the Brisbane due to weather conditions. Historically, two per cent of flights have been affected and diverted from the Sunshine Coast due to bad weather (LEAPP, 2012, 26). Previous BCA’s have quantified the benefits of avoiding these diversions under the Project case. this analysis has not attempted to, as it assumes RPt ceases at the SCA under the Do nothing scenario.
2.6.1.2 Regional benefits methodology
to assess the GRP and employment impacts of the project to the local and regional economy, an economic impact assessment has been undertaken. Input-output (I-o) models for Sunshine Coast and Queensland economies have been constructed for this purpose using a range of data sources including ABS census data 2011, Australian national Accounts 2011/12 State Accounts, detailed quarterly labour force estimates 2011/12 and regional population growth.
I-o analysis provides a comprehensive economic framework that is useful in the planning process. Broadly, there are two ways in which the method can be used.
y First, the I-o transactions table provides a numerical picture of the size and shape of the economy and its essential features. It can be used to describe some of the important features of an economy, the interrelationships between sectors and the relative importance of the individual sectors
y Second, I-o analysis provides a standard approach for the estimation of the economic impact of a particular activity. the I-o model is used to calculate industry multipliers that can then be used to estimate economic impacts arising from some change in the local economy or the economic contribution of an existing industry.
the following indicators of economic impact were generated using the I-o economic modelling framework:
y GRP/GSP
y Employment.
GRP/GSP is a measure of the net contribution of an activity to the regional economy. GRP is measured as value of output less the cost of goods and services (including imports) used in producing the output. In other words, it can be measured as the sum of household income, ‘gross operating surplus and gross mixed income net of payments to owner managers’ and ‘taxes less subsidies on products and production’. It represents payments to the primary inputs of production (labour, capital and land). using GRP as a measure of economic impact avoids the problem of double counting that may arise from using value of output for this purpose.
A2-41environmental impact statement

Employment is a measure of the number of working proprietors, managers, directors and other employees, in terms of the number of FtE jobs. Employment is measured by place of remuneration rather than place of residence.
Estimates of economic impact are presented in terms of:
y Direct (or initial) impacts: an estimate of the change in final demand or level of economic activity that is the stimulus for the total impacts
y Indirect (or flow-on) impacts: the sum of production-induced impacts, consumption-induced impacts and offsetting consumption effects
y total impacts: the sum of direct and indirect (flow-on) impacts.
the economic impact model for the Project (Sunshine Coast and QLD economy) was specified in terms of 66 intermediate sectors and can be characterised as a demographic-economic (DECon) model.
2.6.2 assessment of net economic benefits of the Project
Project benefits
the quantified Project benefits include:
y travel savings – comprising travel time and vehicle operating cost savings where passengers avoid commuting between the Sunshine Coast and Brisbane Airport
y Foregone consumer surplus – assumes a group of passengers are deterred from travelling. these passengers forego the satisfaction of a trip that they would have made if they could fly directly into or out of the Sunshine Coast
y Car accident savings – decreased car traffic on the highway between the Sunshine Coast and Brisbane Airport decreases the likelihood of accidents – the cost of which is avoided
y Car pollution savings – decreased car traffic on the highway between the Sunshine Coast and Brisbane Airport decreases the level of pollution emitted – the cost of which is avoided.
Further information on how these have been quantified is provided in Table 2.6b.
the majority of the benefits under the Project case derive from travel savings associated with aircraft passengers not having to drive from the Sunshine Coast to Brisbane Airport (or vice versa) to complete their air travel.
Table 2.6c provides an overview of the key benefits modelled under the Project case. the present value (measured in $2014) of these benefits is also presented for the baseline passenger forecast scenario.
Table 2.6b: Approach to quantifying benefits
benefit item approach to quantifying benefits Data sources
travel savingstravel time
Determine average travel time – assumed 77 minutes between Mudjimba and Brisbane Airport.
Google maps
Establish value of time per car occupant per hour:Business travel – $46.53Private travel - $14.54
Value of travel time – Austroad’s 2012 Project Evaluation Guidelines. 2010 values updated to 2014 dollar values.
Establish proportion of business trips. Sunshine Coast Airport Passenger survey data – LEAPP Report.
travel savingsVehicle operating cost savings
Determine travel distance – assume each journey is 109 km between Mudjimba (central point of Sunshine Coast) and Brisbane Airport.
travel distance – Google maps
Each kilometre travelled costs 25 cents (including fuel, oil, tyres and vehicle maintenance).
Vehicle operating cost per kilometre – Austroad’s 2012 Project Evaluation Guidelines.
1.25 passengers per vehicle Austroad’s, 2011, national Performance Indicators, All day car occupancy rates.
Consumer Surplus Determine volume of passengers deterred from travelling to Sunshine Coast under Do nothing scenario.
tourism Futures International, 2010
A2-42
background to the project
NEED FOR THE PROJECTA2
SunShIne coaSt aIrport eXpanSIon project
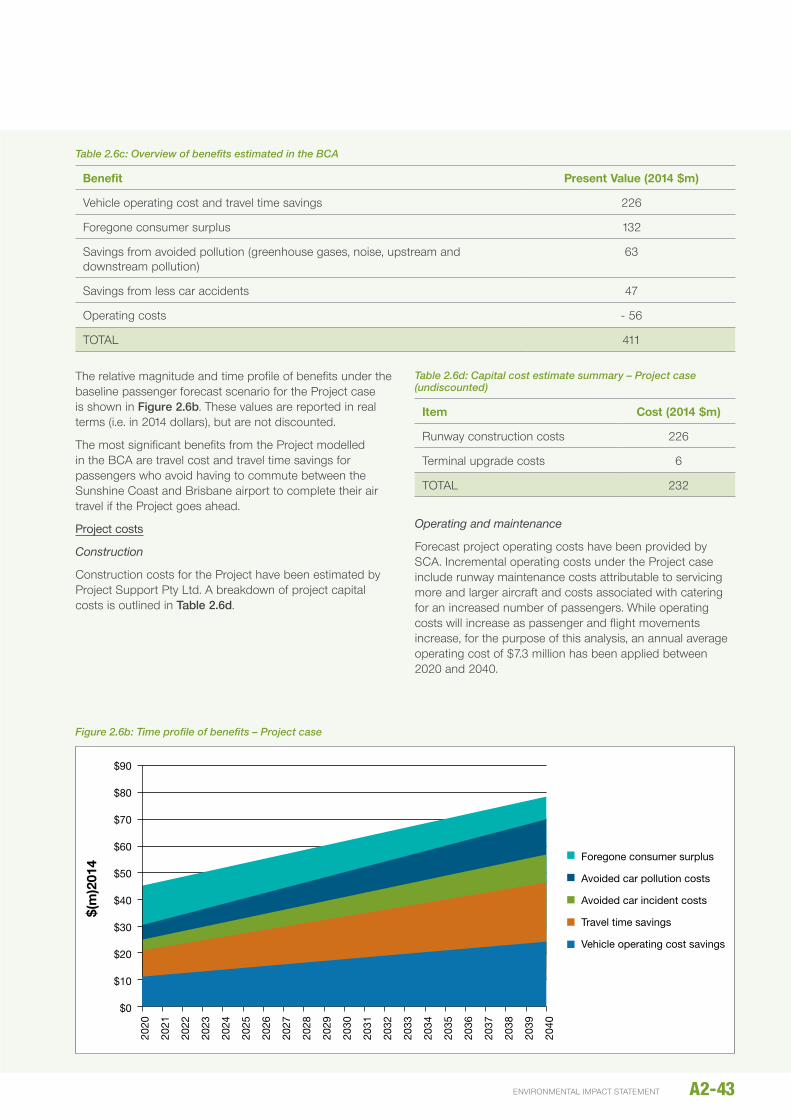
the relative magnitude and time profile of benefits under the baseline passenger forecast scenario for the Project case is shown in Figure 2.6b. these values are reported in real terms (i.e. in 2014 dollars), but are not discounted.
the most significant benefits from the Project modelled in the BCA are travel cost and travel time savings for passengers who avoid having to commute between the Sunshine Coast and Brisbane airport to complete their air travel if the Project goes ahead.
Project costs
Construction
Construction costs for the Project have been estimated by Project Support Pty Ltd. A breakdown of project capital costs is outlined in Table 2.6d.
Table 2.6d: Capital cost estimate summary – Project case (undiscounted)
item Cost (2014 $m)
Runway construction costs 226
terminal upgrade costs 6
totAL 232
Operating and maintenance
Forecast project operating costs have been provided by SCA. Incremental operating costs under the Project case include runway maintenance costs attributable to servicing more and larger aircraft and costs associated with catering for an increased number of passengers. While operating costs will increase as passenger and flight movements increase, for the purpose of this analysis, an annual average operating cost of $7.3 million has been applied between 2020 and 2040.
Table 2.6c: Overview of benefits estimated in the BCA
benefit Present value (2014 $m)
Vehicle operating cost and travel time savings 226
Foregone consumer surplus 132
Savings from avoided pollution (greenhouse gases, noise, upstream and downstream pollution)
63
Savings from less car accidents 47
operating costs - 56
totAL 411
$90
$80
$70
$60
$50
$40
$30
$20
$10
$0
Foregone consumer surplus
Avoided car pollution costs
Avoided car incident costs
Travel time savings
Vehicle operating cost savings
$(m
)201
4
2020
2021
2022
2023
2024
2025
2026
2027
2028
2029
2030
2031
2032
2033
2034
2035
2036
2037
2038
2039
2040
Figure 2.6b: Time profile of benefits – Project case
A2-43environmental impact statement

Residual value
A residual value for the runway has been calculated assuming straight line depreciation between 2020 and 2040. A 60 year asset life for the runway has been assumed which yields, for accounting purposes, a residual value of $26 million (2014 dollars) at the end of the appraisal period in 2040. this value represents the remaining economic life of the infrastructure at the end of the appraisal period.
Summary
the relative magnitude and time profile of costs under the Project Case is shown in Figure 2.6c.
Benefit cost analysis
the Benefit Cost Ratio for the Project Case is summarised below in Table 2.4e.
$80,000,000
$70,000,000
$60,000,000
$50,000,000
$40,000,000
$30,000,000
$20,000,000
$10,000,000
$0
Project operating expenditure
Project capital expenditure
2014
2015
2016
2017
2018
2019
2020
2021
2022
2023
2024
2025
2026
2027
2028
2029
2030
2031
2032
2033
2034
2035
2036
2037
2038
2039
2040
Figure 2.6c: Time profile of undiscounted costs for the Project case (2014$m)*
Table 2.6e: Benefit cost analysis
Category
Project Case total Pv
(Discounted 2014 – 2040)
Project capital costs
Runway construction costs $189 million
terminal and building works $6 million
Residual value (runway) - $26 million
total project capital costs $168 million*†
benefits
Vehicle operating cost and travel time savings $226 million
Foregone consumer surplus $132 million
Savings from less car accidents $47 million
Savings from avoided pollution $63 million
operating costs* - $56 million*
total benefits $411 million†
net Present value (nPv) $243 million
benefit Cost ratio (bCr) 2.45
* Operating costs are included as a negative benefit in the numerator of the benefit-cost ratio calculation consistent with Australian Transport Council (2006, volume 3 p. 75).
† Does not add due to rounding
* Incremental operating costs will increase as passenger numbers increase however the BCA has used an average operating cost in order to create a smoother cost profile
A2-44
background to the project
NEED FOR THE PROJECTA2
SunShIne coaSt aIrport eXpanSIon project

the construction of SCA new runway is expected to deliver a net economic benefit, with a net present value of $243 million and a benefit-cost ratio greater than 1 of 2.45.
2.6.3 sensitivity analysis on the bCa
the economic evaluation of the SCA expansion under the baseline case suggests the project has a positive economic return, with a BCR greater than one. A number of sensitivity tests were undertaken to test the robustness of this result.
Project construction cost contingencies
the runway construction cost estimates undertaken by Project Support Pty Ltd include a $58 million contingency. A contingency is an allowance and not a resource cost and the contingency was therefore not included in the central case BCA.
the contingency reported by Project Support Pty Ltd comprises an additional $58 million in construction costs for the runway. under the baseline LEAPP passenger forecast scenario and at a real discount rate of 7 per cent, the nPV decreases from $255 million to $201 million if this contingency is included. the BCR decreases to 1.96 from 2.45 if the contingency is included. the BCR is quite sensitive to changes in costs given the relatively low costs.
Discount rate
In the central case a real discount rate of 7 per cent is applied. In sensitivity testing, low (4 per cent) and high (10 per cent) values are suggested for the discount rate by Infrastructure Australia. At 4 per cent the BCR is estimated at 4.30, reflecting that future benefits are valued more highly in present terms under the lower discount rate. At a 10 per cent discount rate, the BCR is 1.58, suggesting the project benefits still exceed costs despite the increase in the discount rate.
Passenger forecasts
the passenger forecasts between 2020 and 2040 are a key driver of the benefit stream. Table 2.6f outlines the Benefit Cost Ratios under LEAPP’s three passenger forecast scenarios at a discount rate of 7 per cent.
Table 2.6f: Benefit cost ratios under different passenger forecast scenarios
Passenger forecast benefit Cost ratio
Aggressive 2.83
Baseline 2.45
Conservative 1.43
Table 2.6f shows that the Project would deliver a net economic benefit under all passenger forecast scenarios.
Level of induced demand in passenger forecasts
the central case analysis assumes that 70 per cent of domestic demand is induced demand and therefore deterred from travel under the Do nothing where the Project does not go ahead.
Similarly, this 70 per cent is restored in the Project case.
Due to the relative sensitivity of this variable, sensitivity tests have been undertaken at 60 per cent and 50 per cent levels of induced demand.
Table 2.6g demonstrates the sensitivity of the BCR and nPV to different induced demand/deterred demand assumptions under the baseline LEAPP passenger forecast scenario and at a 7 per cent discount rate. It can be seen from Table 2.6g that the assumption that 70 per cent of domestic passengers are induced and therefore do not make a trip is a conservative assumption. As the number of induced passengers decreases, more people make their journey from Brisbane and incur additional travel costs—the nPV and BCR goes up as a result.
Consumer surplus assumptions
under the Project case (baseline), it has been assumed that the consumer surplus foregone is equal to 25 per cent of the cost of a trip by road between Brisbane and the Sunshine Coast.
Table 2.6h demonstrates the sensitivity of the BCR and nPV to different assumptions around the value of the foregone consumer surplus under the baseline LEAPP passenger forecast scenario and at a 7 per cent discount rate.
Table 2.6h shows that even under the most conservative consumer surplus assumption (i.e. 10 per cent of the cost of a trip to Brisbane), the BCR and nPV is positive at a 7 per cent discount rate.
2.6.4 assessment of regional economic benefits of the Project
to assess the GRP and employment impacts of the proposed Project to the economies of the Sunshine Coast Local Government Area (LGA) and Queensland, an economic impact assessment has been undertaken. Input-output (I-o) models for Sunshine Coast and Queensland economies have been constructed for this purpose.
the Project case involves a capital investment of approximately $232.6 million (excluding contingency allowances and escalation) in total during the construction phase. the construction is proposed to start in mid-2016 and be complete by late 2020.
the operating phase will be characterised by two forms of economic stimulus. the first is the additional expenditure on airport operation (estimated to be $7.3 million per annum), while the second is the expenditure associated with the net increase in visitors to the Sunshine Coast.
this data was used to compile a series of economic impacts in terms of GRP/GSP and employment for the local region and the state using the 2011/12 I-o models for the Sunshine Coast and the State of Queensland. the estimated impacts are reported in the following sections.
For the purposes of economic analysis the duration of the Project is extended to include the planning, approvals and design stages. the construction phase is expected to occur between 2016 and 2020.
A2-45environmental impact statement

Construction phase
the direct expenditures are detailed in Table 2.6i for the Sunshine Coast, elsewhere in Queensland and outside Queensland.
It was assumed that 60 per cent of the capital investment for the design and construction of the airport expansion will occur in the Sunshine Coast region and 28 per cent elsewhere in Queensland. the remaining capital expenditure (12 per cent of the total) will occur outside Queensland (assumptions by Project Support Pty Ltd based on various work packages and an overseas source for the dredge).
the indirect (flow-on) impacts were calculated using the I-o models constructed for this project and they measure the economic effects in other sectors of the economy generated by these direct activities, that is, the multiplier effects. In addition to the assumptions embodied in the input-output model itself, it was necessary to make a number of other general assumptions in estimating the economic impacts:
y to allow for the improvements an across-the-board (all sectors) labour productivity improvement rates of 1 per cent per annum for subsequent years of the construction have been incorporated into the modelling
y When new jobs are created, it should be determined where the people come from to fill those jobs. In some cases the jobs will be taken by previously unemployed locals or by someone who is currently employed locally but whose own job is taken by a previously unemployed local. or the construction phase, it was estimated to be 50 per cent for the local area and 60 per cent for Queensland as a whole.
GRP/GSP
GRP/GSP is a measure of the net contribution of an activity or industry to the regional economy. It represents payments to the primary inputs of production (labour, capital and land) and is a regional/state level equivalent of gross domestic product. Estimates for the design and construction period are provided in Table 2.6j.
During the construction phase, the direct and flow-on GRP impact from the project in the Sunshine Coast region was estimated to be $6.1 million in years 1 and 2, rising to $33.8 million in year 4 before falling to $1.8 million in year 7.
In 2011/12 the GRP in the Sunshine Coast region was approximately $11.5 billion. on this basis, the project would boost GRP by 0.1 per cent in years 1 and 2, 0.3 per cent in year 4 (the peak year of construction expenditure) and 0.02 per cent in year 7.
Table 2.6g: BCRs and NPVs under different induced demand assumptions – Project case
% of induced Demand (passengers deterred under the Do nothing) benefit Cost ratio net Present value (2014 $m)
70% 2.45 243
60% 3.01 336
50% 3.56 429
Table 2.6h: BCRs and NPVs under different consumer surplus quantification proxies
% of cost of trip by road between brisbane and sC benefit Cost ratio net Present value (2014 $m)
50% 3.24 375
25% 2.45 243
10% 1.98 164
Table 2.6i: Project – direct construction expenditure ($m)*
year
1 2 3 4 5 6 7
total2014 2015 2016 2017 2018 2019 2020
Sunshine Coast 6.3 6.3 27.4 42.3 25.8 28.1 2.2 138.6
Elsewhere in Queensland 19.9 19.9 6.9 7.1 5.2 5.6 0.5 65.0
outside Queensland 0.0 0.0 0.0 21.2 3.4 3.9 0.5 29.0
totAL 26.2 26.2 34.3 70.6 34.5 37.7 3.2 232.6
* Excludes escalation and contingency allowances.
A2-46
background to the project
NEED FOR THE PROJECTA2
SunShIne coaSt aIrport eXpanSIon project

For Queensland, the direct and flow-on GRP was estimated to be $27.8 million in years 1 and 2, rising to $45.7 million in year 4 before falling to $2.6 million in year 7. In the context of Queensland’s GSP in 2011/12 ($283.6 billion) (ABS 2012b), the estimated GSP total impact in years 1, 2 and 3 would represent an increase of almost 0.01 per cent, 0.02 per cent in year 4 (the peak year of construction expenditure) and 0.001 per cent in year 7.
Employment (FTE)
Table 2.6j shows that total (direct plus flow-on) employment in the Sunshine Coast region is expected to be 52 FtE in years 1 and 2, rising to 247 FtE in year 4 before falling to 14 FtE in year 7. the direct plus flow-on employment in years 1 and 2 is 0.1 per cent of the estimated employment (FtE) for the Sunshine Coast region for 2011/12 (98,423 FtE), 0.3 per cent in year 4 (the peak year of construction expenditure) and 0.01 per cent in year 7.
For Queensland, direct and indirect employment is expected to be 198 in year 1, increase to 287 FtE in year 4 but fall to 16 FtE in year 7. this would represent a 0.01 per cent increase in employment over 2011/12 levels (around 2.02 million FtE) in years 1 to 6 and 0.001 per cent in year 7.
Operating phase
the economic impact analysis of the operational expenditure of the airport used the following assumptions:
y operational expenditure of $7.3 million on average per year
y net increase in visitors to the Sunshine Coast is based on the airport passenger movements forecast. It was assumed that 70 per cent of passenger growth due to the expansion would represent a net increase in visitation to the Sunshine Coast region (PwC 2010, LEAPP 2012).
the operational expenditure of $7.3 million per annum and the increased visitation data were used to compile a series of economic impacts in terms of GRP/ GSP and employment for the local region and the state using the 2011/12 I-o models for the Sunshine Coast and the State of Queensland.
In addition to the previous assumptions and the assumptions embodied in the input-output model itself, labour productivity improvement rates of 1 per cent per annum have been incorporated into the modelling. Furthermore, the proportion of new jobs that are likely to be filled by previously unemployed locals was estimated to be 50 per cent for the Sunshine Coast region and 60 per cent for Queensland as a whole.
Table 2.6j: Economic impact of the Project – construction phase
year
1 2 3 4 5 6 7
2014 2015 2016 2017 2018 2019 2020
sunshine Coast
gross regional Product ($m)
Direct 3.1 3.1 8.2 13.3 7.7 8.4 0.7
Flow-on 3.0 3.0 13.5 20.5 11.2 12.3 1.1
totAL 6.1 6.1 21.7 33.8 18.9 20.7 1.8
employment (Fte)
Direct 29 29 56 86 51 55 5
Flow-on 23 23 108 161 87 95 8
totAL 52 52 163 247 138 150 14
total Queensland
gross state Product ($m)
Direct 12.4 12.4 10.1 15.4 9.2 10.1 0.9
Flow-on 15.4 15.4 21.4 30.3 18.0 19.7 1.7
totAL 27.8 27.8 31.6 45.7 27.3 29.8 2.6
employment (Fte)
Direct 102 101 60 87 53 58 6
Flow-on 96 95 143 200 115 124 11
totAL 198 196 203 287 167 182 16
A2-47environmental impact statement

the direct and indirect (i.e. flow-on) impacts for the Sunshine Coast region and Queensland are presented in Table 2.6l. these reflect the economic impacts on the Sunshine Coast economy of the Project during the operating period of 2020 to 2040.
GRP/GSP
the direct and flow-on GRP in the Sunshine Coast from the Project is expected to rise from $29 million in 2020 to $312 million in 2040 (one year only). the projected GRP total impact in the peak year represents 2.7 per cent of gross regional product as estimated for 2011/12 ($11.5 billion).
At the state level, the Project is expected to generate additional GSP of $32 million in 2020, rising to $345 million in 2040. note these figures represent annual GSP contributions. In the context of Queensland’s GSP in 2011/12 ($283.6 billion) (ABS 2011b), the estimated GRP total impact in the peak year would represent an increase of 0.12 per cent.
Employment (FTE)
the estimates presented in Table 2.6k show that total (direct plus flow-on) employment in the Sunshine Coast region from the ongoing operation of the proposed Project is expected to rise from 242 FtE in 2020 to 2,231 FtE in 2040. this projected employment impact would boost the region’s total by 2 per cent based on 2011-12 workforce numbers).
At the state level direct and indirect employment is expected to increase from 252 FtE in 2020 to 2,295 by 2040. this represents 0.11 per cent of the state total (2.02 million FtE in 2011/12).
As an overall assessment of regional benefits from the Project, Table 2.6l presents the economic impact assessment for the Project case between 2020 and 2040.
Table 2.6k: Economic impact of the Project – operational phase – baseline scenario
Fiscal year 2020 2030 2040
sunshine Coast
gross regional Product ($m)
Direct 18 142 200
Flow-on 10 79 112
totAL 29 222 312
employment (Fte)
Direct 165 1,211 1,538
Flow-on 78 546 693
totAL 242 1,757 2,231
total Queensland
Gross State Product ($m)
Direct 19 142 200
Flow-on 14 103 145
totAL 32 245 345
employment (Fte)
Direct 165 1,211 1,538
Flow-on 87 598 758
totAL 252 1,809 2,295
Table 2.6l: Comparison of economic impacts of the Project during the operational phase
year
Project Case
sunshine Coast grP ($million) sunshine Coast employment (annual Fte’s)
2020 29 242
2030 222 1,757
2040 312 2,231
totAL 4,096 31,172
N.B: Blue numbers are direct outputs from the model. Black numbers have been derived through applying a linear calculation between modelled numbers.
A2-48
background to the project
NEED FOR THE PROJECTA2
SunShIne coaSt aIrport eXpanSIon project

2.6.5 local participation
If the proposed Project proceeds, the economic suggests that the project will create jobs and contribute positively to GRP.
this section outlines options to encourage local participation in the proposed Project so as to take advantage of these job creation opportunities for locals. opportunities to develop skills are also addressed. the options draw from and are consistent with Queensland Government policies and strategies that aim to encourage local and indigenous participation in government projects and improve workforce skills.
Employing the local workforce
options to provide employment for the local workforce as part of the Project include:
y Making all reasonable efforts to promote the direct involvement of local personnel including through close contact with local employment agencies
y Procurement practices and evaluation of tenders to recognise ‘local content’ or ‘local services’ by having ‘local content’ as an evaluation criterion for tender assessments.
Training the local workforce
Learning and development opportunities are fundamental to empowering the workforce and embedding a corporate culture that improves job satisfaction and facilitates career progression.
options to promote training and learning through this Project include:
y Conforming to the Queensland Government’s target rate of labour hours undertaken on government projects by apprentices and trainees which is 10 per cent
y Conforming to the Queensland Government policy for government projects which requires training undertaken by existing workers to be delivered through recognised training providers and universities so that participants gain recognised qualifications.
these options are prescribed in the Queensland Government’s training policies that apply to Queensland Government building and construction projects over $250 000. these options are also required under the Queensland Code of Practice for the Building and Construction Industry.
2.7 summary anD ConClusion
the economic evaluation of the proposed Project has considered the key costs and benefits and estimated economic impacts including flow-on impacts associated with the proposed project. the analysis has found:
Regional economic benefits
y over the construction period (7 years), the Project case is likely to contribute around $138.6 million to the economy of the Sunshine Coast. Further, project construction is estimated to create approximately 816 (FtE person years) positions either directly or indirectly on the Sunshine Coast alone
y the majority of the economic benefits are estimated to be realised once the Project becomes operational as a result of more tourists visiting the Sunshine Coast. During the operational phase, it is estimated that the Project case will create approximately 2,231 additional FtE positions on the Sunshine Coast alone in 2040
y the Project case is estimated to generate $4.1 billion in additional GRP benefits for the Sunshine Coast region alone over a 20 year period. this additional economic activity is due to the additional goods and services tourists will be consuming on the Sunshine Coast if the Project goes ahead
y In terms of additional annual FtE jobs generated, the Project case is estimated to generate an additional 31,172 annual FtE positions between 2020 and 2040.
Net economic benefit
Project case benefits quantified in the BCA include travel saving benefits of $226 million (in savings in time and vehicle operating costs), consumer surplus benefits of $132 million, avoided environmental externality costs of $63 million and avoided car accident savings of around $47 million.
these and other benefits, in total, exceed the expected whole-of-life costs of the Project over the appraisal horizon to 2040. As a result, the construction of the Project is expected to deliver a net economic benefit, with a net present value of $243 million and a benefit-cost ratio of 2.45.
In conclusion, the existing runway at SCA is subject to a number of capacity constraints due to the width and length of the current runway that could lead to downgrading the airport to only Code 4C aircraft and disallowing commercial jet aircraft. this would come at a significant cost to local and regional economies by discouraging international and domestic tourist visits to the Sunshine Coast through lack of direct access and by reducing competitiveness of doing business on the Sunshine Coast.
A2-49environmental impact statement


