Background Population Modeling GIS Platform Model Results ...
15
Overview 1. Some observations from the field. 2. Utility view: Flores in NTT, Indonesia. 3. ESCO/NGO view: Uganda/Mali 4. Where are the gaps? Model Results Background GIS Platform Population Modeling Solar MicroGrids Talking Points 1
Transcript of Background Population Modeling GIS Platform Model Results ...

Overview 1. Some observations from the field.
2. Utility view: Flores in NTT, Indonesia.
3. ESCO/NGO view: Uganda/Mali
4. Where are the gaps?
Model Results Background GIS Platform Population Modeling Solar MicroGrids Talking Points
1
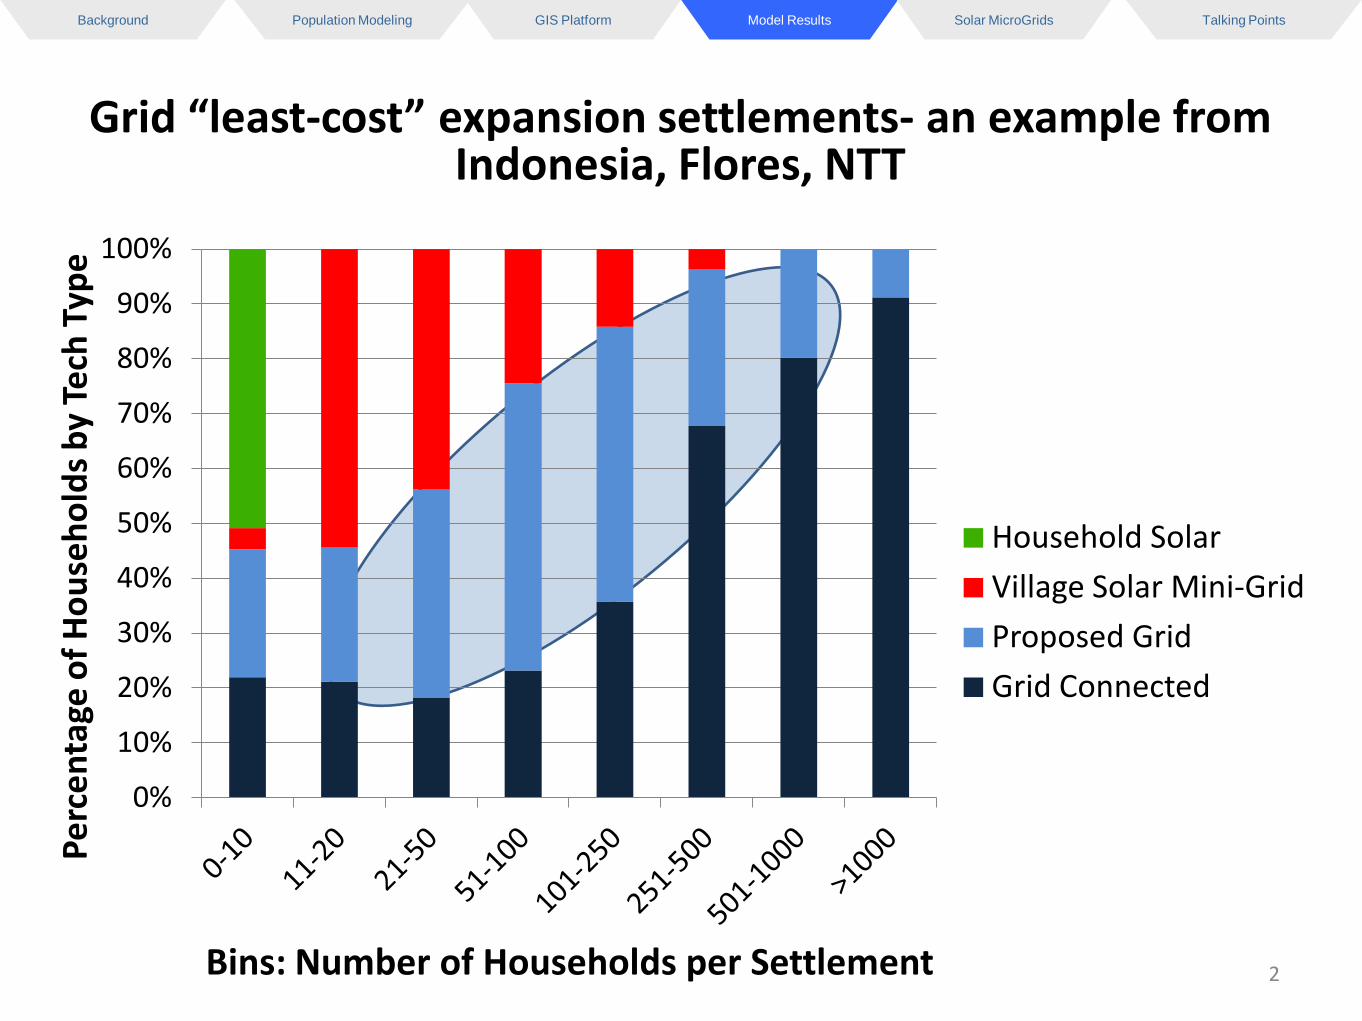
Grid “least-cost” expansion settlements- an example from Indonesia, Flores, NTT
0%
10%
20%
30%
40%
50%
60%
70%
80%
90%
100%
Perc
enta
ge o
f Hou
seho
lds
by T
ech
Type
Bins: Number of Households per Settlement
Household Solar
Village Solar Mini-Grid
Proposed Grid
Grid Connected
Model Results Background GIS Platform Population Modeling Solar MicroGrids Talking Points
2
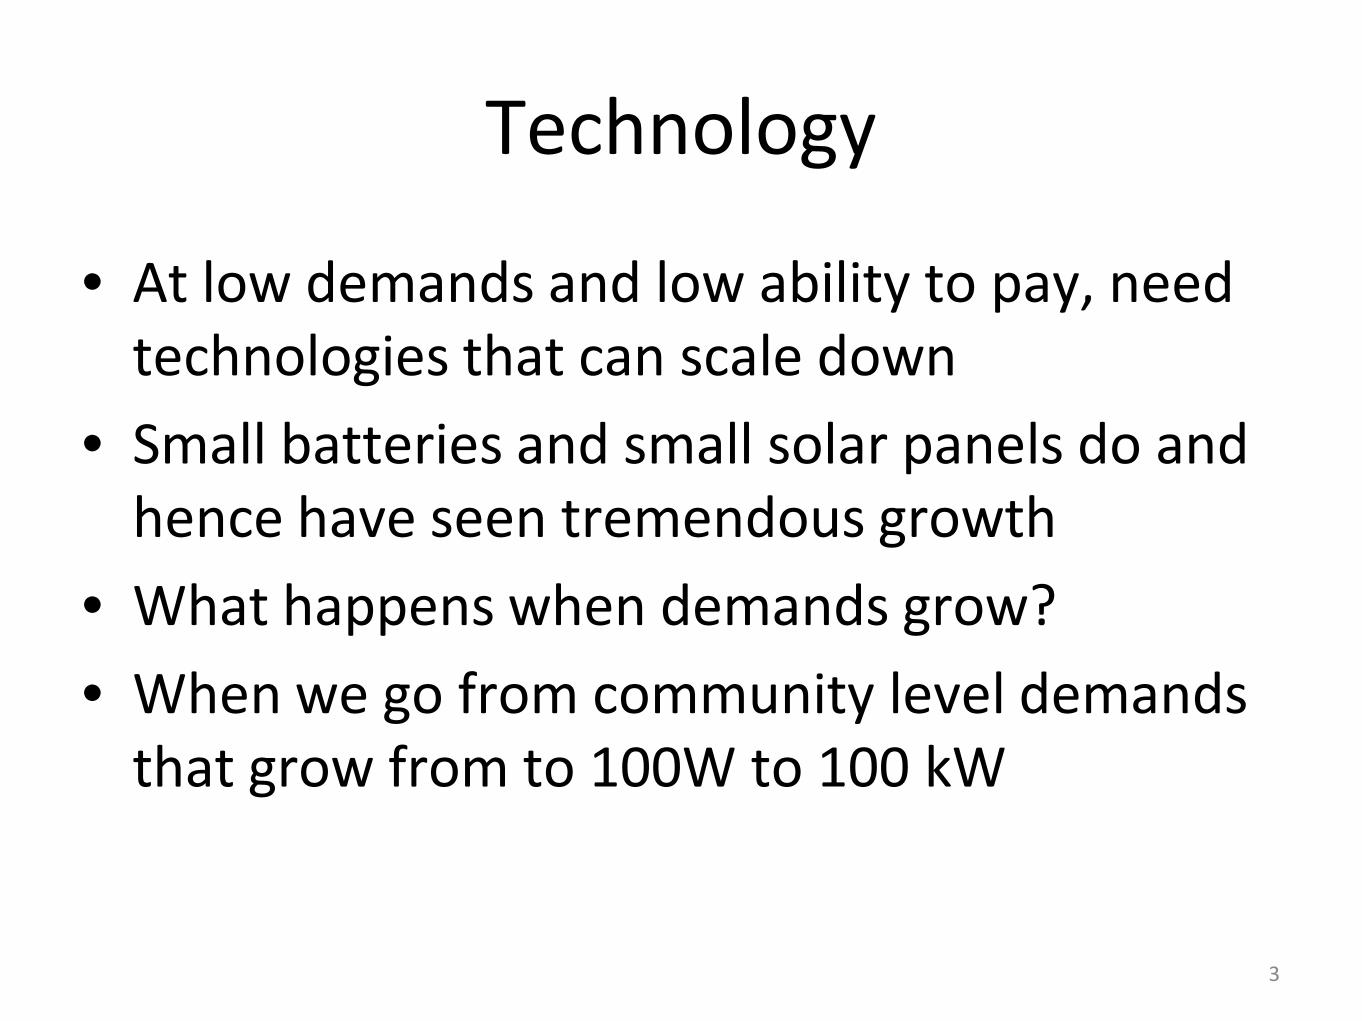
Technology
• At low demands and low ability to pay, need technologies that can scale down
• Small batteries and small solar panels do and hence have seen tremendous growth
• What happens when demands grow?
• When we go from community level demands that grow from to 100W to 100 kW
3
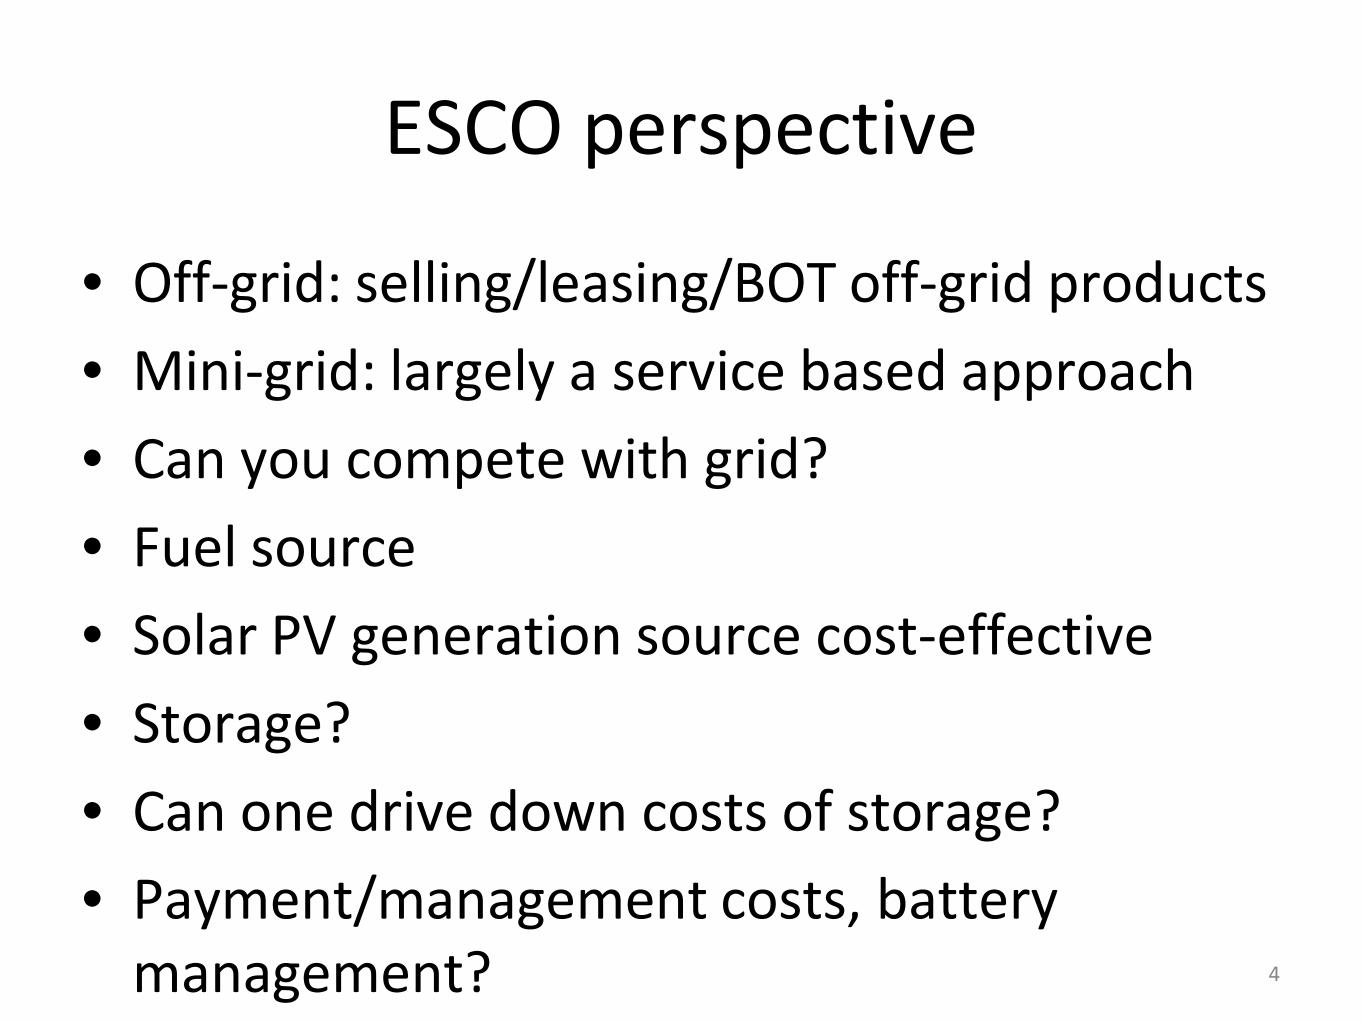
ESCO perspective
• Off-grid: selling/leasing/BOT off-grid products
• Mini-grid: largely a service based approach
• Can you compete with grid?
• Fuel source
• Solar PV generation source cost-effective
• Storage?
• Can one drive down costs of storage?
• Payment/management costs, battery management?
4

MiniGrids: Good News
• PLN leveraging tech/SEFA
• New “service” expectations
• Uptime/flex imp, kWh less
• Efficient appliances
• Utility management tools
• How to prioritize mini-grids?
Model Results Background GIS Platform Population Modeling Solar MicroGrids Talking Points
5

What is solar mini-grid?
• Some experience from the field
• Where diesel costs become > 50 c/kWh, worth considering
• Customer willingness to pay high per kWh price if high “up-time”
• How/when you pay matters
• No upfront cost to customer
• Entrepreneur models possible as well
6
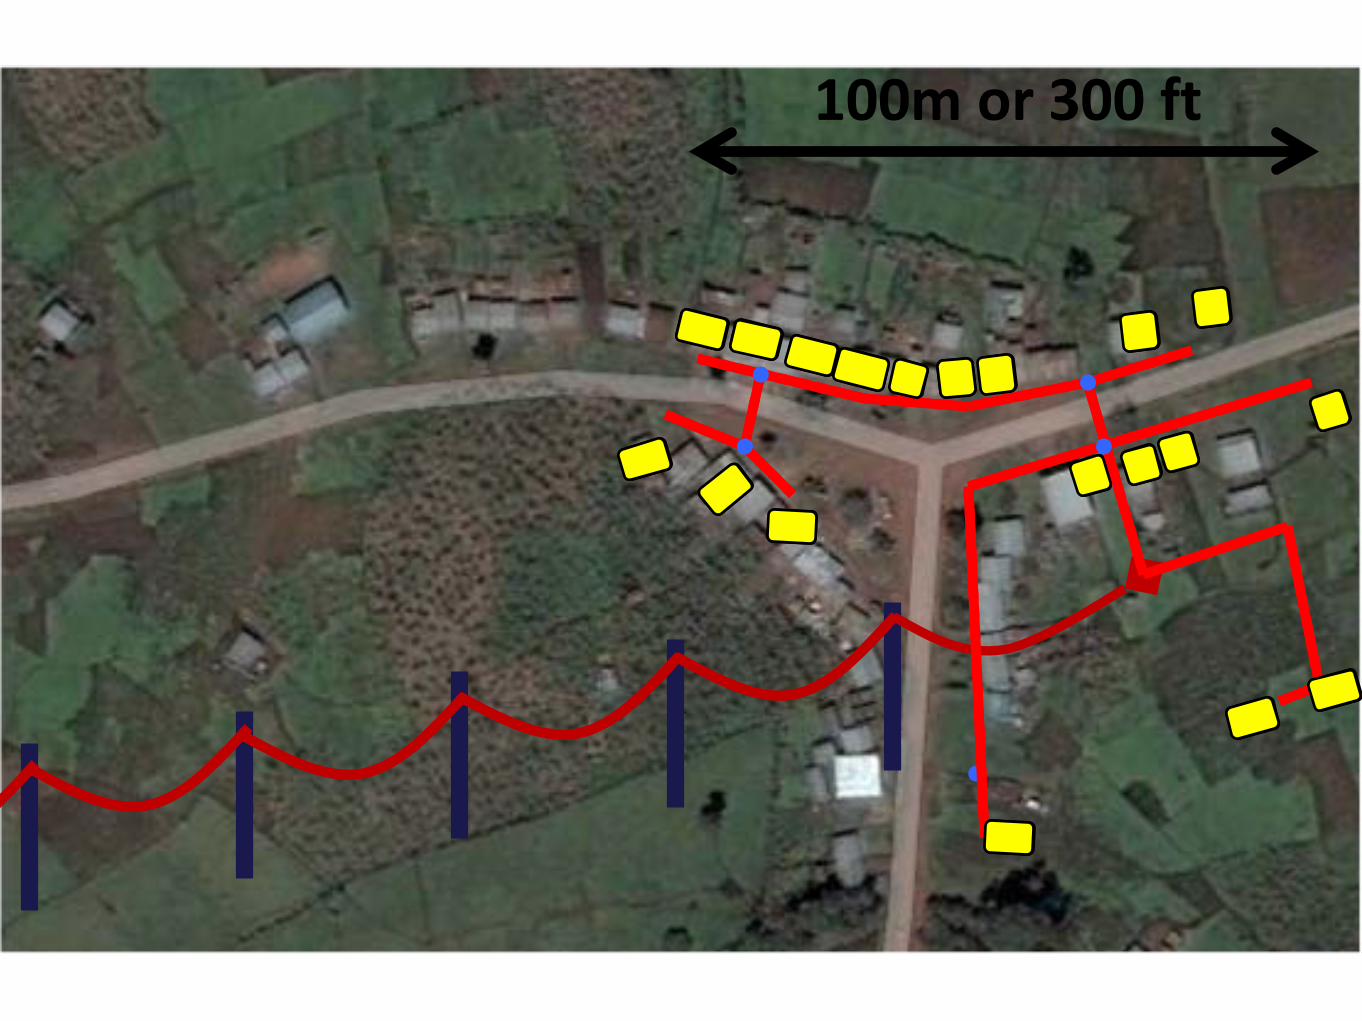
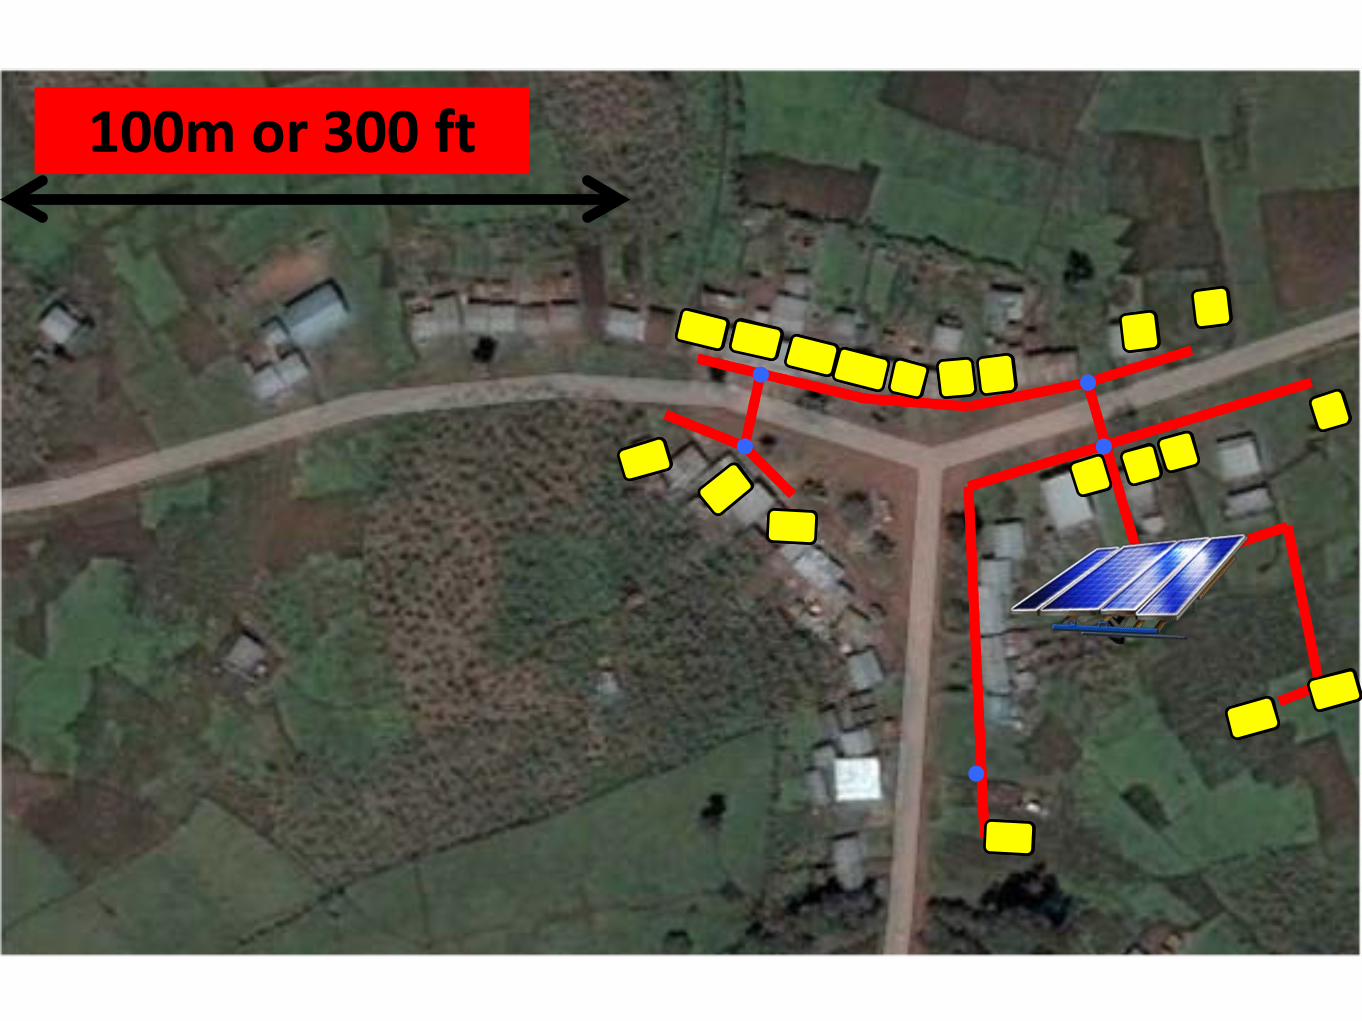
100m or 300 ft
100m or 300 ft
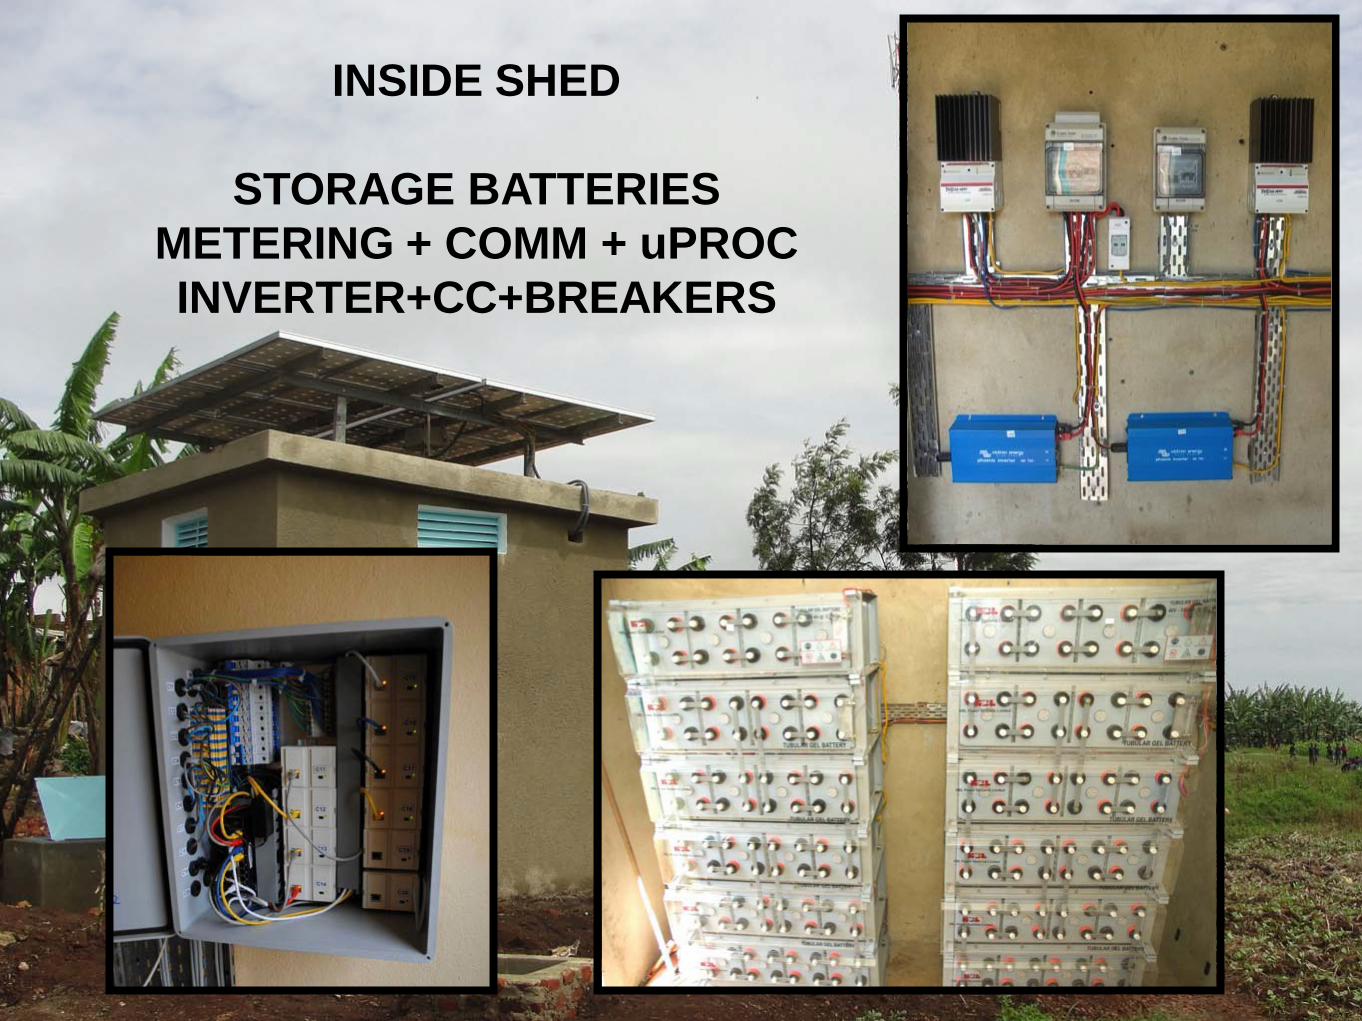
INSIDE SHED
STORAGE BATTERIES METERING + COMM + uPROC INVERTER+CC+BREAKERS


Version 1: 40 cm x 30 cm x 20 cm
From laboratory
To low-cost manufacture
OEM, 10 ch, +/- 0.1W, ethernet
Version 2: 15 cm x 7 cm x 7 cm
10 Consumer System: Smart Metering

Cost vs. Reliability Tradeoff in Solar Power:
Cost / kWh can double in providing the final 10% of reliability
90.0% Reliability
99.9% Reliability
2 X
X
Model Results Background GIS Platform Population Modeling Solar MicroGrids Talking Points
13
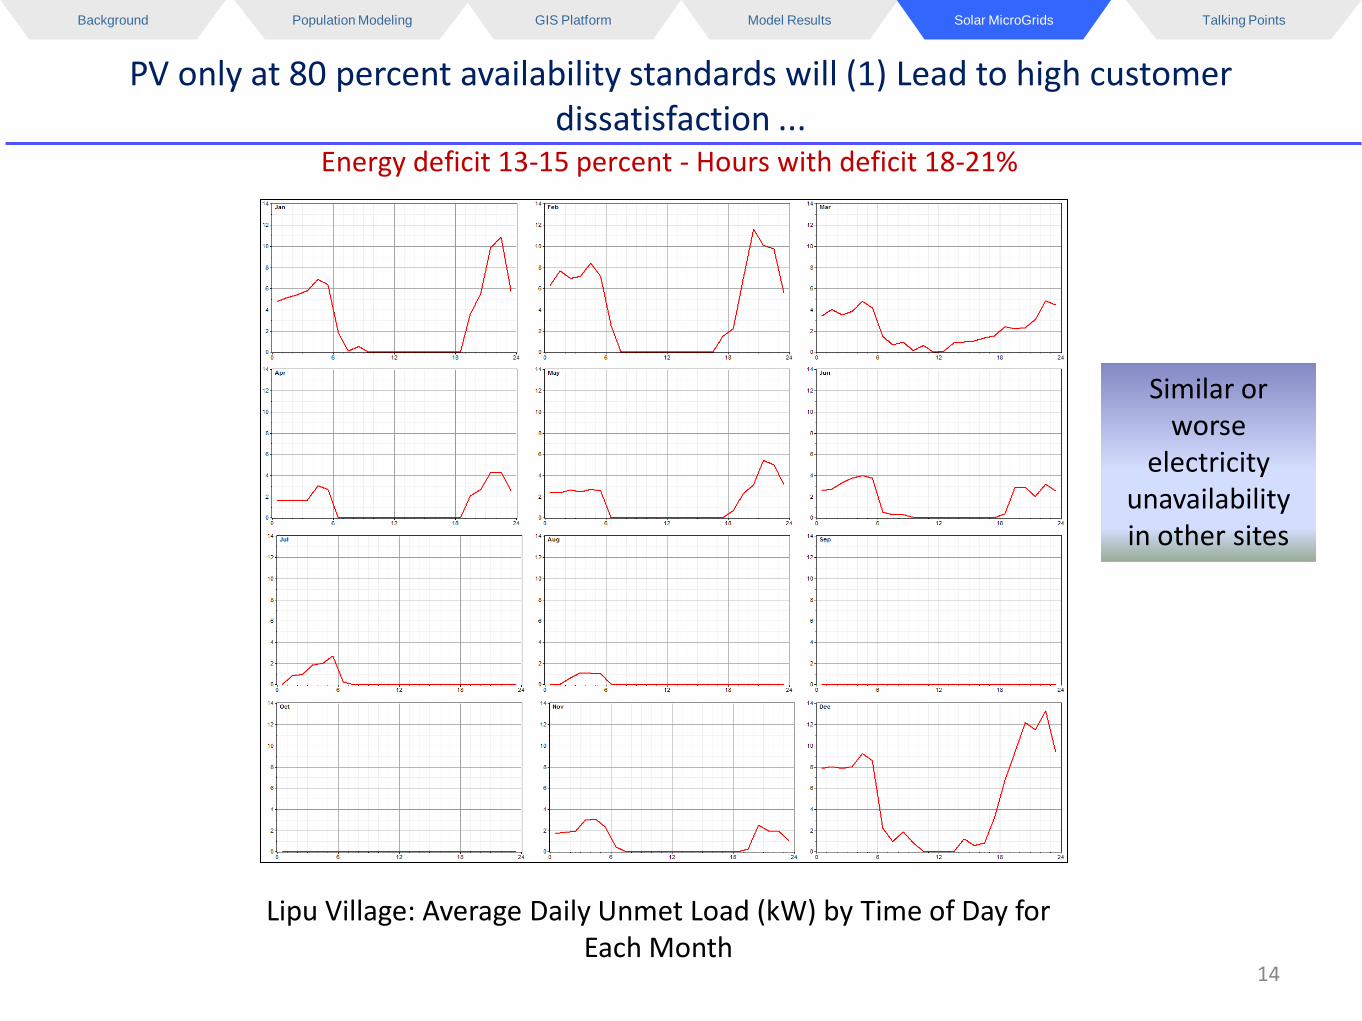
Energy deficit 13-15 percent - Hours with deficit 18-21%
PV only at 80 percent availability standards will (1) Lead to high customer dissatisfaction ...
Lipu Village: Average Daily Unmet Load (kW) by Time of Day for Each Month
Similar or worse
electricity unavailability in other sites
Model Results Background GIS Platform Population Modeling Solar MicroGrids Talking Points
14

Lessons learnt
• Grow with demand
• Could allow service-based models and efficient appliances as opposed to “fixed” kWh tariffs
• Allow smaller frequent irregular payments ….
• Provide verification to Utility of service
• STRICT BATTERY MANAGEMENT SYSTEM
• Time of day pricing, demand/supply mgmt
• Smart-grid in effect