Back to the Basics: Building Essential QI Skills -...
249
Back to the Basics: Building Essential QI Skills Jane Taylor, Ed.D. Michael A. Posencheg, MD
Transcript of Back to the Basics: Building Essential QI Skills -...

Back to the Basics: Building Essential QI Skills
Jane Taylor, Ed.D.
Michael A. Posencheg, MD

Faculty
Jane A. Taylor, Ed.D. Improvement Advisor for
Institute for Healthcare Improvement
Michael Posencheg, MD Improvement Advisor
Institute for Healthcare Improvement
Associate Chief Medical Officer, Value Improvement,
Penn Medicine
Neither presenter has anything to disclose.

IHI Faculty 3
Michael Posencheg, MD, is an attending neonatologist at the Children’s
Hospital of Philadelphia and the Hospital of the University of Pennsylvania
where he is the Medical Director of the Intensive Care Nursery and
Newborn Nursery. He has completed the Improvement Advisor (IA)
program at the IHI (Wave 23) and the Graduate IA program (Wave 30). As
part of his duties as Medical Director, he coordinates quality improvement
projects for his unit and has published on some of those results. He has
recently taken on a new position in the University of Pennsylvania Health
System as an Associate Chief Medical Officer for Value Improvement,
driving spread initiatives across the health system. He is also father of twin
teenage daughters, Hannah and Hayden, 19, and a son, Dylan, 14.

IHI Faculty
I am a loving daughter, sister and friend to many. I
confess that I am a compulsive improver and
innovator and nothing excites me more than
observing learners and those who choose to put their learning to use and
make a better world.

Quick Course Objectives Describe the elements of the Model for Improvement and how it
helps us improve our Systems of Care
Identify the necessary elements to charter an improvement project
and develop an aim statement.
Develop high-leverage change ideas using driver diagrams and
other tools.
Identify a family of measures, including operational definitions, to
drive improvement work.
Develop effective plan-do-study-act cycles that build from small
scale testing to implementation.
Describe the difference between implementation, scale, and spread

System Thinking and The Model for Improvement
6


The Problem…
Sweden’s immediate neighbors
all drove on the right.
Most Swedes drove left-hand
drive vehicles, which led to
more head-on collisions when
driving on the left.
An incredibly unpopular
decision – voted down by
citizens for 40 years.

Högertrafikomläggningen - “The right hand traffic diversion”
Dagen H, or “H day” in Sweden
All at once, a change from driving on the
left to the right.
Major PR campaign
Used different color lines to separate
traffic.
New headlights had to be installed in cars.
All traffic stopped at 4:50. Cars switched
sides and resumed driving at 5:00.
The following Monday, there were 125
accidents, compared to 130-198 on a
usual Monday.

What It Takes To Improve
Will to change the current system
– Strong positive leadership and a realistic appraisal of resources
and barriers
Ideas about changes that will improve the system
– And a theory that links changes to outcomes
Execution of the ideas
– And a way to distinguish successful from unsuccessful changes

The Messiness of Life!
“Some problems are so complex that you have to be highly intelligent and well informed just to be undecided
about them.” --Laurence J. Peter
A good reference on this topic is “Wicked Problems and Social Complexity “ by Jeff Conklin, Ph.D., Chapter 1 in Dialogue Mapping: Defragmenting Projects through Shared Understanding. For more
information see the CogNexus Institute website at http://cognexus.org, 2004.

X Y
(If it was only this simple we would not need QI Teams!)
Patient encounter
with physician
A healthy and satisfied
patient
Is life this simple?

No, it looks more like this…
X3
X2
X1
X5
X4
Y
There are numerous direct effects between the independent variables (the Xs) and the
dependent variable (Y).
Time 1 Time 3 Time 2
Patient Assessment Score (could be health
outcomes, functional status or satisfaction)
In
de
pe
nd
en
t V
ari
ab
les
Coordination of Care
Current health status
Age
Gender
Communication

In this case, there are numerous direct and indirect effects between the independent variables and the dependent variable. For example, X1 and X4 both have direct effects on Y plus there is an indirect effect
due to the interaction of X1 and X4 conjointly on Y.
Y
Actually, it looks like this…
X3
X2
X1
X5
X4
Time 1 Time 3 Time 2 R3
R2
R1
R5
R4
RY
R = residuals or error terms representing the effects of variables
not included in the model.
Coordination of care
Age
Gender
Communication
Patient Assessment Score (could be health outcomes, functional status or satisfaction)
Current health status

It starts by combining two types of
knowledge
SOI Knowledge
Subject Matter Knowledge
Science of Improvement (SOI) Knowledge: The interplay
of the theories of systems, variation, knowledge, and
psychology.
Subject Matter Knowledge: Knowledge basic to the things we do in life. Professional knowledge. Knowledge of work processes.

Knowledge for Improvement
SOI Knowledge
Subject Matter Knowledge
Improvement: Learn to combine subject matter knowledge and SOI knowledge in creative ways to
develop effective changes for improvement.

What is a system?
An interdependent group of:
– People
– Processes
– Items (tools)
…working together toward a common purpose.

Components of a System
Structure …
+ Process …
+ Culture*=Outcome
*Added to Donabedian’s original formulation by R. Lloyd and R. Scoville.
Donabedian, A. (1966). "Evaluating the quality of medical care." Milbank Memorial Fund Quarterly 44(3): Suppl:166-206.
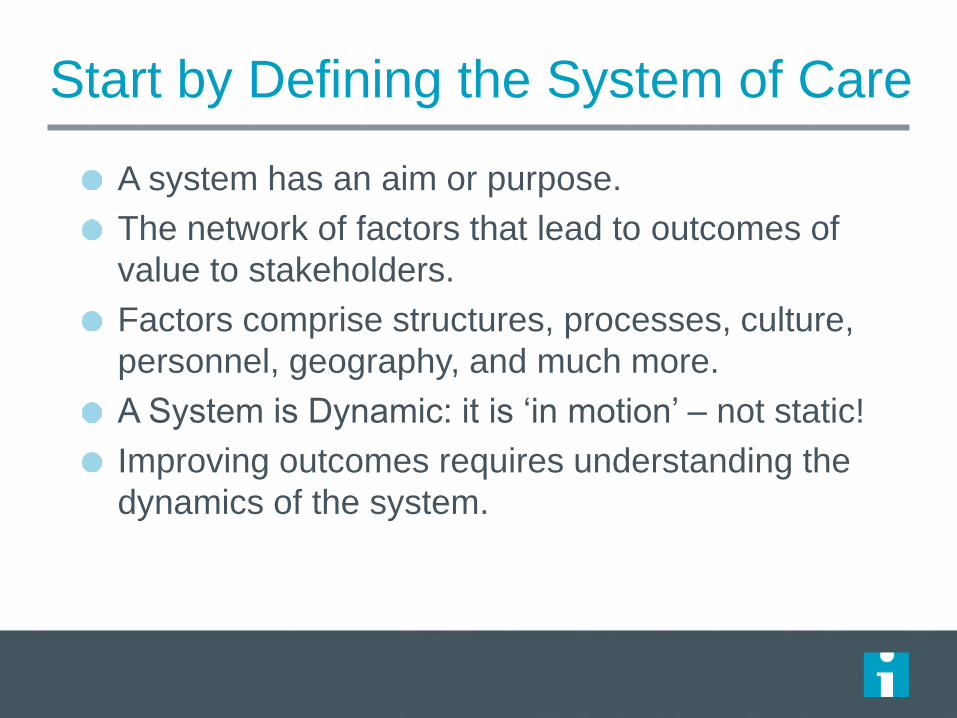
Start by Defining the System of Care
A system has an aim or purpose.
The network of factors that lead to outcomes of
value to stakeholders.
Factors comprise structures, processes, culture,
personnel, geography, and much more.
A System is Dynamic: it is ‘in motion’ – not static!
Improving outcomes requires understanding the
dynamics of the system.

Systems and Patients
“The quality of patients’ experience is the ‘north star’
for systems of care.” –Don Berwick
Unfortunately, many of our healthcare systems do not focus on the patient.

Improving medical care requires
system redesign
“Every system is perfectly designed to get the results it gets.” – Paul Batalden
The definition of insanity is doing the same thing over and over and expecting to get a different result.

1. Pick a number from 3 to 9
2. Multiply your number by 9
3. Add 12 to the result from step 2
4. Add the 2 digits together
5. Divide result of step 4 by 3
6. Convert the
number to a
letter: 1=‘A’,
2=‘B’, etc.
7. Write down the name of a country that begins with the letter
8. Go to the next letter in the alphabet
9. Write down the name of an animal (but not a bird or insect) that begins with that letter
10. Write down the color of that animal.


Other Key Ideas from System Theory
Boundary – size or levels.
Temporal effects – changes may have different impact in
short vs. long term.
Leverage – small changes can produce big effects (ATM
example).
Constraint (or bottleneck) – limits overall performance.
First vs. Second order change
Unintended consequences

Different related approaches

Bar-be-que?

The 5 Key Principles for Improvement
1. Knowing why you need to improve.
2. Having a feedback mechanism to know if improvement is
happening.
3. Developing an effective change that will result in
improvement.
4. Testing a change before attempting to implement.
5. Knowing when and how to make the change permanent.

Now, let’s take a closer look at …
…the Model for Improvement!

Langley, J. et al. The Improvement Guide, Jossey-Bass, 2009.
A Model for Learning and Change
When you combine
the 3 questions with the…
…the Model for
Improvement.
PDSA cycle, you get…

What are we trying to accomplish?
A SMART Aim Statement
Specific
Measurable
Actionable
Realistic
Time-bound
“To increase the percentage of preterm infants (birth weight of <1250g) with a normal NICU admission temperature from 43% to 75% by January 2013.”

How will we know that change is an
improvement?
Outcome Measures
The voice of the
customer or patient.
Reflects the problem
you are trying to
solve.
Describes how your
system is performing
Process Measures
Steps logically linked to
outcome of interest.
Addresses how key parts of
the system is performing.
Balancing Measures
What are the unintended
consequences?
Are there alternate
explanations for your
improvement in outcome?

What change can we make that will
result in improvement?
Driver Diagram
Cause and Effect (Fishbone) Diagram
The Pareto Chart
Process maps; other QI tools
Ideas of change for
PDSA cycles

What is a PDSA Cycle?
W. Edwards Deming

Is useful for both process and product improvement.
Is applicable to all types of organizations.
Is applicable to all groups and levels in an organization.
Facilitates the use of teamwork to make improvements.
Provides a framework for the application of statistical tools
and improvement methods.
Encourages planning to be based on theory.
Emphasizes and encourages the iterative learning process.
Provides a way to empower people in the organization to
take action.
Why this Model for Improvement?

What are we trying to accomplish? Establishing your Aim Jane Taylor

The Improvement Guide, API, 2009
The Model for Learning and Change

Question #1:
What are We Trying to Accomplish?
Aim Statement

“A system is a network of interdependent
components working together toward a
common aim. Every system must have an
aim. Without an aim that is clear to all,
there is no system.”
- W. Edwards Deming, Out of the Crisis
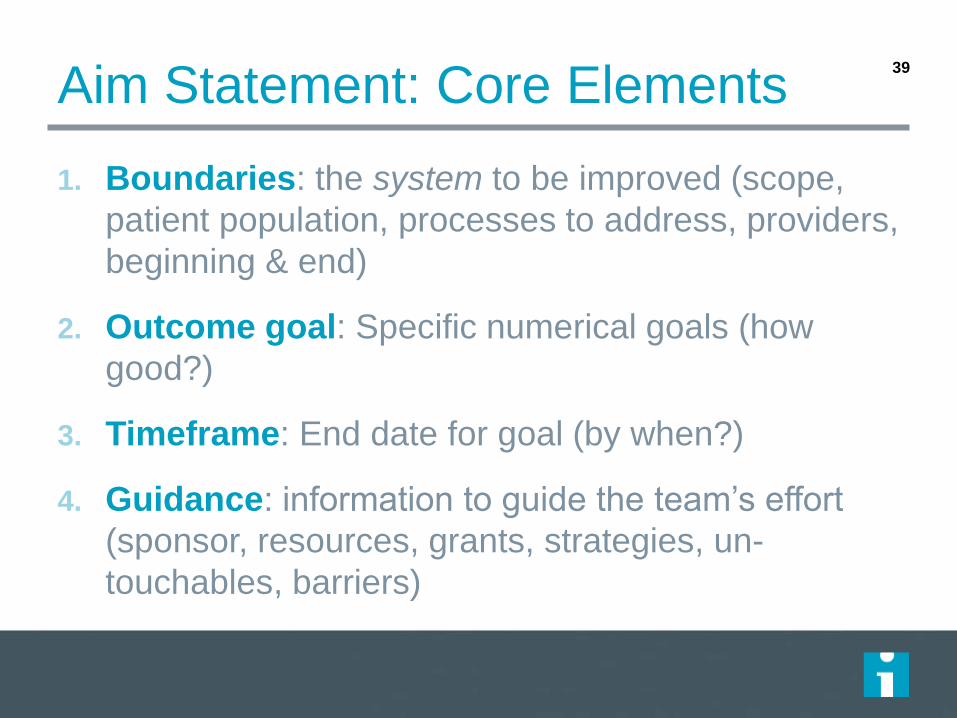
Aim Statement: Core Elements
1. Boundaries: the system to be improved (scope,
patient population, processes to address, providers,
beginning & end)
2. Outcome goal: Specific numerical goals (how
good?)
3. Timeframe: End date for goal (by when?)
4. Guidance: information to guide the team’s effort
(sponsor, resources, grants, strategies, un-
touchables, barriers)
39

Aim Statement: Optional Elements
• Why: describe the importance or benefit to those we serve
• For whom: the customer or those who benefit from the effort
• How: general statement of the team’s approach (standardization, use of a bundle, innovation)
• Baseline performance: measurement starting point when easily available
40

Name of Project:
Project Team:
Background (why?):
Aim Statement:
Guidance or Constraints:
Measures:
Change Ideas or Theory of Change:
Key Questions:

Aim Statement: Example #1
Improve patients reporting they got 6+ hours of sleep per
night from 30% to 60% on 2 North by March 31, 2017. The
team should test a variety of changes, not just those linked
to the environment.
•System: sleep on 2NB
•Goal: 60% of patients report sleeping 6+ hours
•Timeframe: within 6 months (by March 31, 2017)
•Guidance: plan for spread

Aim Statement: Example #2
43
In our clinic, we will reduce wait time to see a provider 25% within 3
months and by 50% within 1 year. We will also ensure that our work
contributes to a sustainable QI infrastructure to support future projects
across all our three clinics.
•System: wait time to see a physician
•Goal: reduce by 25% and then by 50%
•Timeframe: 3 months and then 1 year
•Guidance: Build a sustainable QI infrastructure

Aim Statement: How to Construct
44
• Involve team:
• Engage senior sponsor (no from “on high”)
• Engage team (no lone rangers)
• Must include subject matter experts
• Aim clear and majestic? Could 5 members of the team describe
what you were trying to achieve? Does it catch your breath?
• Focus on issues that are important or strategic to your
organization:
• Understand the current state:
• Current performance
• Problem to solve

Aim Statement: Which problem are we
trying to solve?
“Quiet at Night”
Sleep

46
Aim Statement
Exercise: You Make the
Call!

Aim Statement: You Make the Call!
47
Each table takes an aim; classifies it and rewrites a better aim
Aim Statement Good Bad Ugly
We aim to reduce harm and improve patient safety for all of our patients
By September of 2013 we will improve medication reconciliation by 50 % and
improve checking allergies when prescribing a new medication by 50%.
Our patient satisfaction scores are in the bottom 10% of the national
comparative database we use. As directed by senior management, we need to
get the score above the 50th percentile by the end of the 4th Q of 2013.
We will reduce all types of hospital acquired infections.
According to the consultant we hired to evaluate our medical home, we need to
improve the effectiveness and reliability of preventive care visits and well child
visits. The board agrees, so we will work on these issues this year.
Our most recent data reveal that on the we only track referrals to mental health
35% of the time. We intend to increase this average to 50% by 9/1/13 and to
75% by 3/31/14.

Develop Your Aim Statement
1. The (name of team)
2. intends to accomplish: (This is a general overarching statement describing what you intend to accomplish during the time you work on this
process. The process is identified in the statement and words like improve, reduce, and increase are often used). In healthcare, aims describe how
care for patients will be better (reduced suffering or improved outcomes).
3. by (time frame, i.e., month/year by which you intend to accomplish improvement)
4. for (what group are you doing this for – who is the customer?)
5. because ( the reasons to work on this improvement project)
6. (Optional) Please include any additional guidance: (This may include any constraints, changes that are off limits, or other goals you have for the
project (e.g., building relationships, engaging partners, building improvement capability).)

What changes can we make that will result in improvement? Jane Taylor

The Improvement Guide, API, 2009
The Model for Learning and Change

Changes: Why?
“All improvement will require change, but not all change will result in improvement!”
G. Langley, et al The Improvement Guide. Jossey-Bass Publishers,
San Francisco, 1996: xxi.

Reactive vs. Fundamental Changes
Reactive Changes (First
Order Changes)
– Return the system or
process to prior condition
– Keep the system running
– Solve problems or react
Fundamental Changes
(Second Order Changes)
– Create a new system of
performance
– Design or redesign some
aspect of the system
– Necessary for
improvement beyond
problems
– Alters the system in a
visible, measurable way
– Breakthrough
Source: The Improvement Guide, Chapter 6, p. 116-117

Reactive vs. Fundamental Change 53
More flyers
More training
More resources
More rules
More audits
Finding failures and
removing them
Process redesign
Altering approach to be
more person-centered
Standardization
Hardwiring changes
Changing boundaries of
the system

Ideas for improvement?
Where do they come from?
Literature
Evidence
Experience
Successful organizations or
practitioners that have solved the
problem
Analogous Observation- places
where similar problems have been
solved
What if we can’t find them?
Tap into creativity
Adapt other ideas
Employ logical thinking:
process mapping, flow charting
and the like
54

How might we organize our project on 1 piece of paper?
55

Driver Diagram: Clear and Simple
Visualization

A picture of best current theory of how
to get results
57
Primary
DriversOutcome
Secondary Drivers
(processes, norms,
structures)Changes
Aim:
Expresses
stakeholder
value!
P. Driver
S. Driver 1Change 1
P. Driver
S. Driver 2
S. Driver 3
S. Driver 1
S. Driver 2
Change 2
Change 3
57

58
Increase restaurant ranking from 3 to 4 stars
Food quality
Preparation
Suppliers
Price
Ambiance
Lighting
Layout
Music
Service
Attire
Approach
Example: Improve Restaurant Rating
Outcome Primary Drivers
Secondary Drivers
Measures:
- Star ranking
- Yelp reviews
- Tips
- Profit (balancing)
Process measure:
Tips
• Screen for service in interview
• “At the elbow” coaching • Monthly service review
brainstorming • Scenario planning

A Theory for Weight Loss 59
Primary
DriversOutcome
Secondary
Drivers
Ideas for Process
Changes
AIM:
A New
ME!
Calories In
Limit daily
intake
Track
Calories
Calories
Out
Substitute
low calorie
foods
Avoid
alcohol
Work out 5
days
Bike to
work
Plan
Meals
Drink H2O
Not Soda
drives
drives
drives
drives
drives
drives
drives
drives
Exercise
Fidgiting
Hacky
Sack in
office
“Every system is perfectly designed
to achieve the results that it gets”

Remember that Drivers and
Processes are Linked! 60
Primary
DriversOutcome
Secondary
Drivers
Ideas for
Changes
AIM:
A New
ME!
Calories In
Limit daily
intake
Track
Calories
Calories
Out
Substitute
low calorie
foods
Avoid
alcohol
Work out 5
days
Bike to
work
Plan
Meals
Drink H2O
Not Soda
Exercise
Fidgiting
Hacky
Sack in
office
List days
cooking v.
leftovers
List dishes
to prepare
List
ingredients
Ingredient
on hand?
Add item to
list
Shop from
listNO
YES
Set aside for
meal
Improving the reliability, consistency, usability or efficiency
of processes is central to improving system outcomes
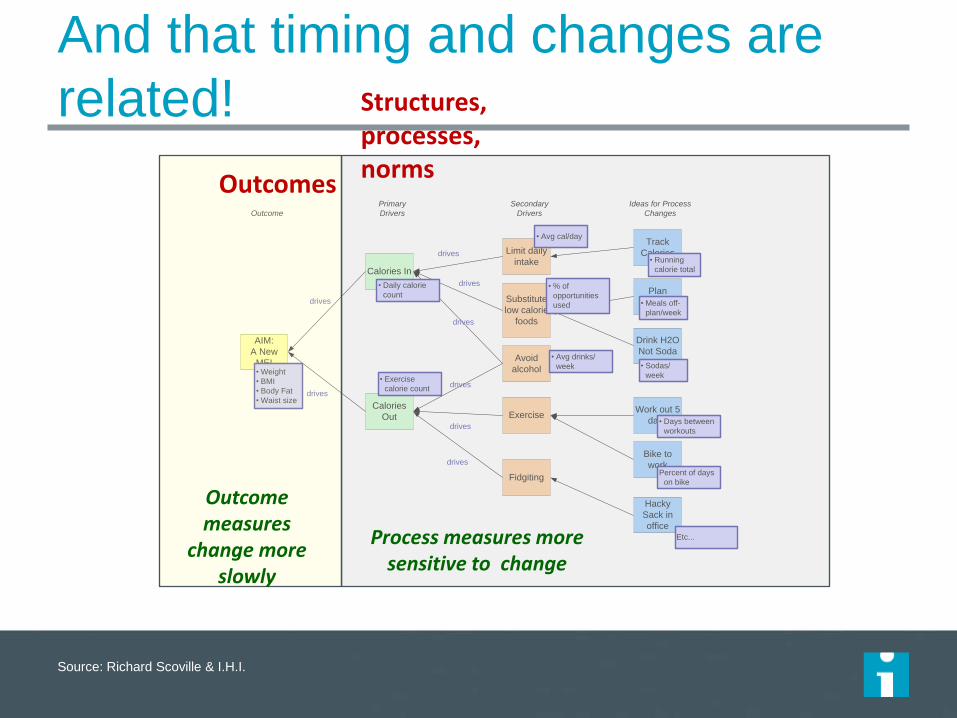
And that timing and changes are
related!
Source: Richard Scoville & I.H.I.
Primary
DriversOutcome
Secondary
Drivers
Ideas for Process
Changes
AIM:
A New
ME!
Calories In
Limit daily
intake
Track
Calories
Calories
Out
Substitute
low calorie
foods
Avoid
alcohol
Work out 5
days
Bike to
work
Plan
Meals
Drink H2O
Not Soda
drives
drives
drives
drives
drives
drives
drives
drives
• Weight
• BMI
• Body Fat
• Waist size
• Daily calorie
count
• Exercise
calorie count
• Days between
workouts
• Avg drinks/
week
• Running
calorie total
• % of
opportunities
used
• Sodas/
week
• Meals off-
plan/week
• Avg cal/day
Exercise
Fidgiting
Hacky
Sack in
office
Percent of days
on bike
Etc...
Outcomes
Structures, processes, norms
Outcome measures
change more slowly
Process measures more sensitive to change

Theory informs testing and in turn
testing refines theory
Provost L, Bennett B. What's your theory? Driver diagram serves as tool for building and testing theories for improvement. Quality Progress. 2015 Jul:36-43.
62

Driver Diagram: How to Develop
1. Gather expertise: expert
meeting, literature review,
interviews
2. Identify key structures,
processes, norms that must
change to achieve the aim
3. Illicit change ideas that have
worked
4. Experts inform specific aim
Remember:
Best working theory to date
and revise as you learn!
Include what is necessary and
sufficient
Creates a shared language
and mental model
63
Disclaimer: Probably wrong
and definitely incomplete
Tony Bryk, President of the Carnegie Foundation for the Advancement of Teaching

How do we use one in practice?
Keep front and center to your work (visually)
Put in pencil, not pen
– Update your theory as you learn
– Select regular points to review
Tie changes and projects to drivers
Use to track progress
Share to communicate and engage others
64

Aim:
Outcome Measures: 1. 2. 3.
Primary Drivers Secondary Drivers
Changes
Next, we have an exercise for you.

Driver Diagram: Exercise – 15 min total
Use templates to sketch out a driver diagram for something you are interested in improving .
Spend about 10 minutes working on this exercise, then share and compare with your neighbors.
Tips: concrete aim with goals? PD and SC as concepts without direction (increase, decrease, reduce, etc)? Changes stated as verbs or actions? Changes testable ideas?
66

Changes: Three Approaches
1. Understanding of processes and systems of
work
2. Creative thinking
3. Adapting known good ideas

Generating Change Ideas

Outcome or
effect
Causes
An Understanding of Processes and Systems of Work


Block Diagram 71
Check-in Process forms
Room patient
Take vitals
Next steps and check-out
Conduct visit
1. Forget to give patient form
2. Forget to collect form from patient
3. Form is too long and patient doesn’t have time to complete
1. Forms not processed until after patient leaves
2. Form takes too long to process and is not done before visit
3. Miss suicidality in forms
1. Form output not added to patient chart
2. Risk of suicidality not noted in chart
1. Behavioral health results not available to provider
2. Provider forgets to look at screening
3. Provider not able to address results (time) health needs
1. Patient forgets to mention referral at check-out
2. No one available for warm hand-off
3. Patient not comfortable making appointment
4. No BH appointments
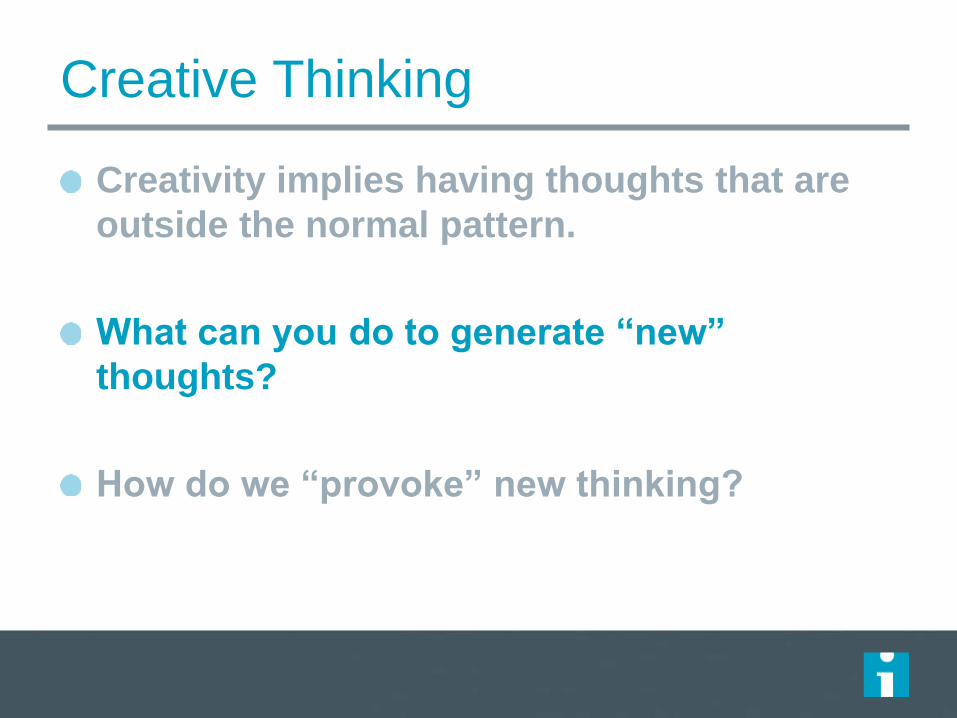
Creative Thinking
Creativity implies having thoughts that are
outside the normal pattern.
What can you do to generate “new”
thoughts?
How do we “provoke” new thinking?

Lateral Thinking of Edward de Bono
Provocation occurs New thought
Logical in hindsight
(after that fact everyone is a genius)
Normal thought
“Provocation has everything to do with experiments in the mind.” Edward de Bono

Creativity exercises that may move
mindsets
Random word; reversal, exaggeration, wishhful thinking,
distortion
List all words you associate with that word:
Generate as many ideas as you can about how this word
could spark an idea about improvement for your project
– (Idea)
– (Idea)
– (Idea)
74

Changes: Three Approaches
1. Understanding of processes and systems of
work
2. Creative thinking
3. Adapting known good ideas

76

Using change concepts
Change concept = A general notion or approach found to be
helpful in developing specific change ideas that result in
improvement
See:
• The Improvement Guide, page 132, for a list of 72 change concepts; Appendix A provides detail on each
• IHI Improvement App

Change Concepts Eliminate Waste
1. Eliminate things that are not used
2. Eliminate multiple entry
3. Reduce or eliminate overkill
4. Reduce controls on the system
5. Recycle or reuse
6. Use substitution
7. Reduce classifications
8. Remove intermediaries
9. Match the amount to the need
10. Use Sampling
11. Change targets or set points
Improve Work Flow
12. Synchronize
13. Schedule into multiple processes
14. Minimize handoffs
15. Move steps in the process close together
16. Find and remove bottlenecks
17. Use automation
18. Smooth workflow
19. Do tasks in parallel
20. Consider people as in the same system
21. Use multiple processing units
22. Adjust to peak demand
Optimize Inventory
23 Match inventory to predicted demand
24 Use pull systems
25 Reduce choice of features
26 Reduce multiple brands of the same item
Change the Work Environment
27. Give people access to information
28. Use proper measurements
29. Take care of basics
30. Reduce de-motivating aspects of pay
system
31. Conduct training
32. Implement cross-training
33. Invest more resources in improvement
34. Focus on core process and purpose
35. Share risks
36. Emphasize natural and logical
consequences
37. Develop alliances/cooperative
relationships
Enhance the Producer/customer relationship
38. Listen to customers
39. Coach customer to use product/service
40. Focus on the outcome to a customer
41. Use a coordinator
42. Reach agreement on expectations
43. Outsource for “Free”
44. Optimize level of inspection
45. Work with suppliers
Manage Time
46. Reduce setup or startup time
47. Set up timing to use discounts
48. Optimize maintenance
49. Extend specialist’s time
50. Reduce wait time
Manage Variation
51. Standardization (Create a
Formal Process)
52. Stop tampering
53. Develop operation definitions
54. Improve predictions
55. Develop contingency plans
56. Sort product into grades
57. Desensitize
58. Exploit variation
Design Systems to avoid mistakes
59. Use reminders
60. Use differentiation
61. Use constraints
62. Use affordances
Focus on the product or service
63. Mass customize
64. Offer product/service anytime
65. Offer product/service
anyplace
66. Emphasize intangibles
67. Influence or take advantage of
fashion trends
68. Reduce the number of
components
69. Disguise defects or problems
70. Differentiate product using
quality dimensions
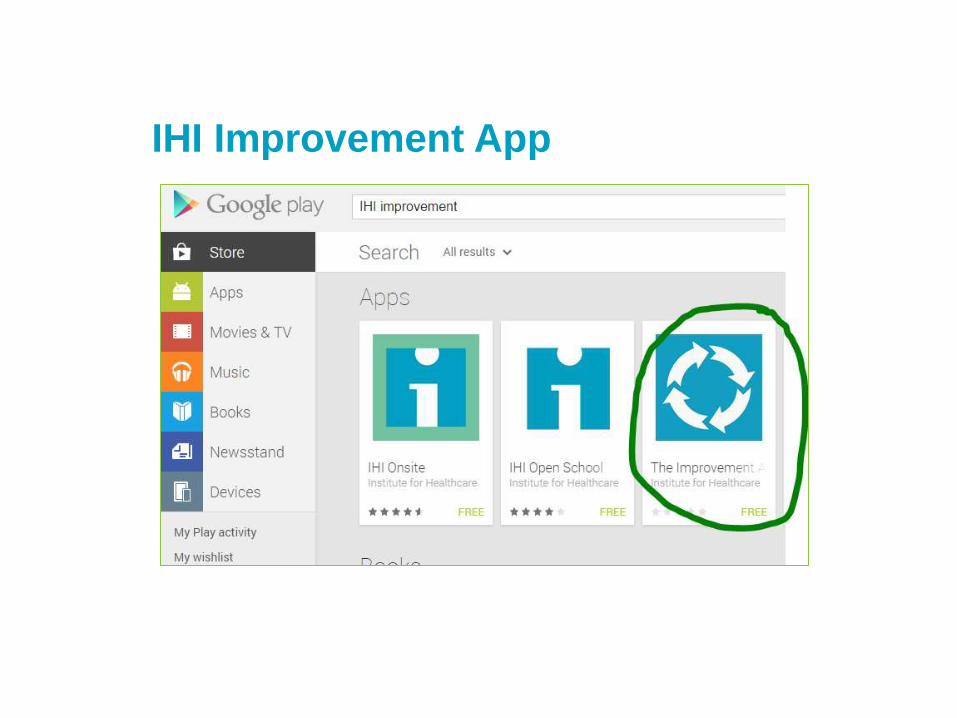
IHI Improvement App
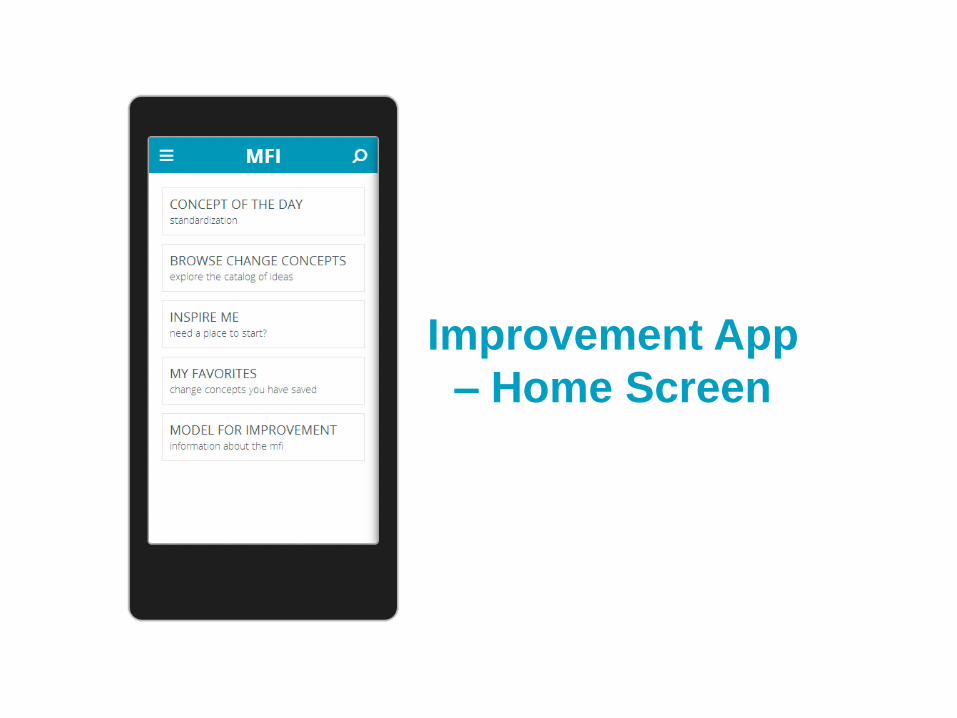
Improvement App
– Home Screen

Give people access to information
Change Concept
Provide two-way “Open Notes” access
Patients own their own medical record
Use teachback for patients that are going
to be discharged
Communicate what you are doing each step of
the way
Change Idea

82
Support staff wellness & resilience
Reward & recognize staff
Keep boxes of Umbrellas ready for rainy days
Work on a staff discount at the local grocery store
Provide a gym stipend
Offer meditation spaces
“Thank you” stickers
Offer dry cleaning service through a vendor
Ask the CEO to send notes of appreciation
Start an “employee of the month” club
Start each meeting with a five minute stretch

83
Generate new ideas
Prioritize new ideas
Test new ideas
Implement new ideas
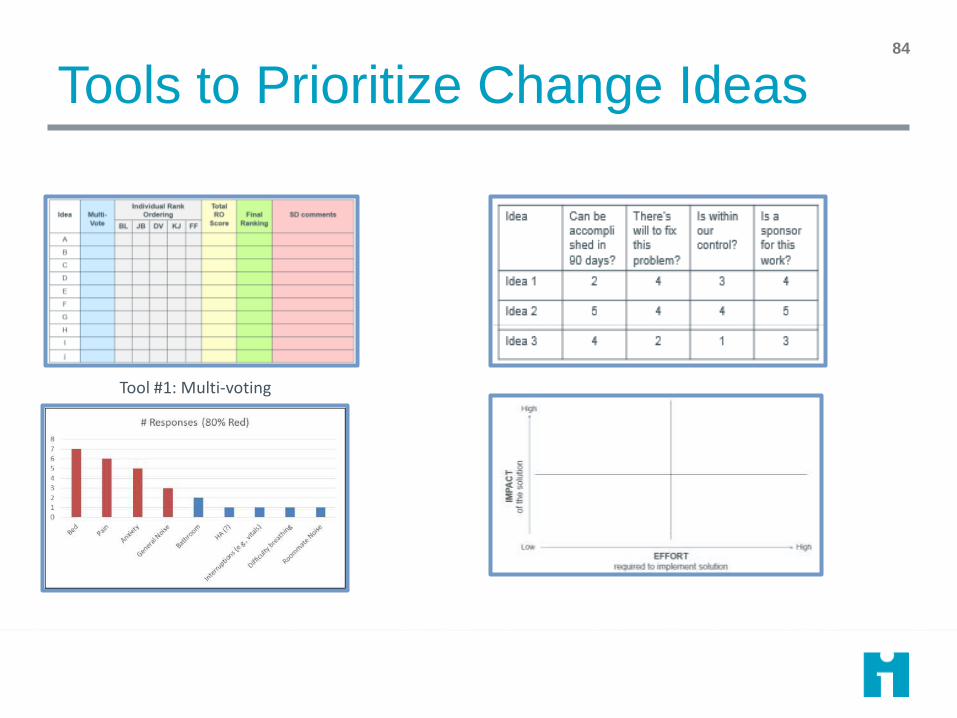
Tools to Prioritize Change Ideas
Tool #1: Multi-voting
84

Pareto Analysis
• A graphical display of the most important factors contributing to a problem
• Based on the Pareto principle: 80% of the effects come from 20% of the causes
85

Prioritization Matrix
Idea Can be accomplished in 90 days?
There’s will to fix this problem?
Is within our control?
Is a sponsor for this work?
Idea 1 2 4 3 4
Idea 2 5 4 4 5
Idea 3 4 2 1 3
1. List the ideas in the row, and the criteria for selection in the columns
2. Rate each idea on a scale of 1-5 (1 being low confidence and 5 being high confidence) for each criterion
3. Analyze which idea has the highest confidence
86

Tool 4: Effort-Impact Grids
• Sort ideas based on high or low effort and high or low importance
• Use quadrants to prioritize change ideas
87

The impact/effort matrix HIGH
IMPACT
LOW IMPACT
HARD EASY
Talk to patients/families about sleep goals
Develop individualized sleep goals as part of care plans
Explain realistic expectations to patients/families
Address all patient/family worries and concerns
Provide access to real time information
Access to mindfulness tools, e.g. meditation, journals, etc.
Use a standard protocol for nighttime (with individualized exceptions based on preferences)
Understand patient/family preferences for nighttime routine
Keep patients awake/stimulated during day
Respond to call lights during day
Develop medication workflow that aligns with sleep goals
Reduce unnecessary interruptions
Limit the amount of light/changes of light in patients room
Reduce noises from equipment and facilities
Change location of nurses station
88

Developing Ideas for Change
Discussion Questions:
• What specific change concepts and related ideas will achieve the Aim?
• What theories and predictions can you make about how these change concepts and ideas will cause improvement?
• Use Force Filed Analysis to evaluate the ideas (see Appendix D for details)
Project:
Change Concept Specific Ideas to
Test
Theories and Predictions as to how
or why this idea will achieve the Aim

Measures and Analysis – Part I

The Improvement Guide, API, 2009
The Model for Learning and Change
When you combine
the 3 questions with the…
…the Model for
Improvement.
PDSA cycle, you get…

Question #2: How Will We Know that a Change is an Improvement?
“You can’t fatten a cow by weighing it” - Palestinian Proverb
Improvement is NOT just about measurement!
However, without measurement you will never be able to know the answer to
question #2 in the MFI.

“I have no data yet. It is a capital mistake to theorise before one has data. Insensibly one begins to twist facts to suit theories,
instead of theories to suit facts.”
Source: Doyle, Sir Arthur Conan (1999-03-01). The Adventures of Sherlock Holmes (p. 3).
(Courtesy of Dr. Imran Aurangzeb, FCCP, Sutter Health)
On the Role of Data!

The Three Faces of
Performance Measurement
Aspect Improvement Accountability Research
Aim Improvement of care
(efficiency &
effectiveness)
Comparison, choice,
reassurance, motivation
for change
New knowledge
(efficacy)
Methods:
• Test Observability
Test observable
No test, evaluate current
performance
Test blinded or controlled
• Bias Accept consistent bias Measure and adjust to
reduce bias
Design to eliminate bias
• Sample Size “Just enough” data, small
sequential samples
Obtain 100% of
available, relevant data
“Just in case” data
• Flexibility of
Hypothesis
Flexible hypotheses,
changes as learning
takes place
No hypothesis
Fixed hypothesis
(null hypothesis)
• Testing Strategy Sequential tests No tests One large test
• Determining if a change is an improvement
Run charts or Shewhart
control charts
(statistical process
control)
No change focus
(maybe compute a
percent change or rank
order the results)
Hypothesis, statistical
tests (t-test, F-test,
chi square), p-values
• Confidentiality of the data
Data used only by those
involved with
improvement
Data available for public
consumption and review
Research subjects’
identities protected

Measurement is central to the
team’s ability to improve! • The purpose of measurement in QI work is for learning not judgment!
• All measures have limitations, but the limitations do not negate their
value for learning.
• You need a balanced set of 3-8 measures reported daily, weekly or
monthly to determine if the process has improved, stayed the same or
become worse.
• These measures should be linked to the team’s Aim.
• Measures should be used to guide improvement and test changes.
• Measures should be integrated into the team’s daily routine and make
use of existing databases.
• Data should be plotted over time on annotate graphs.
• Focus on the Vital Few!

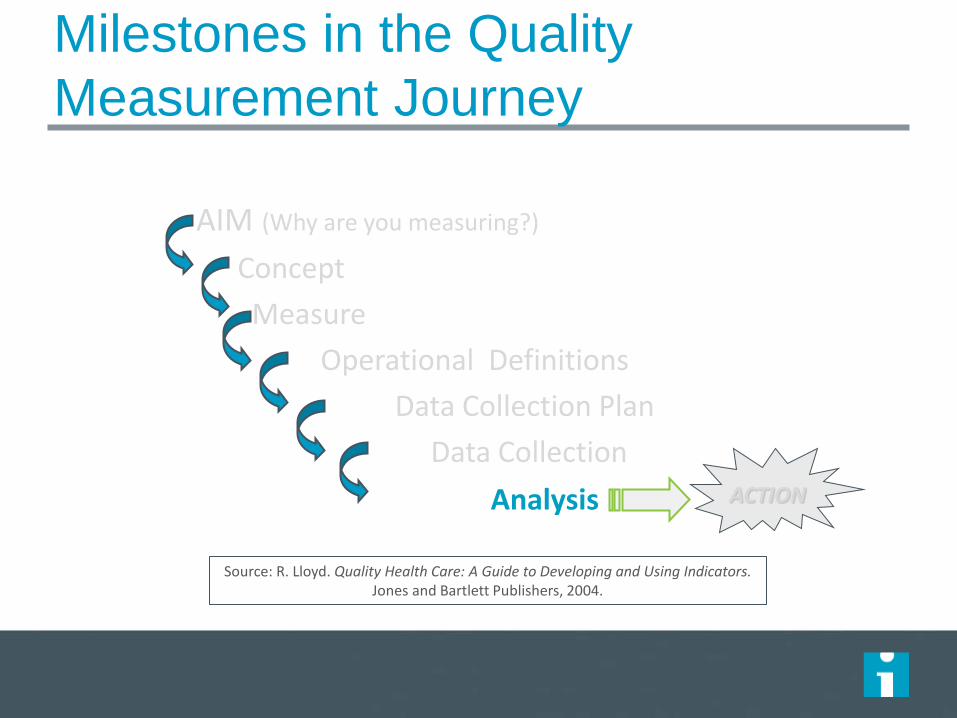
AIM (Why are you measuring?)
Concept
Measure
Operational Definitions
Data Collection Plan
Data Collection
Analysis ACTION
Milestones in the Quality
Measurement Journey
Source: R. Lloyd. Quality Health Care: A Guide to Developing and Using Indicators. Jones and Bartlett Publishers, 2004.

AIM (Why are you measuring?)
Concept
Measure
Operational Definitions
Data Collection Plan
Data Collection
Analysis ACTION
Milestones in the Quality
Measurement Journey
Source: R. Lloyd. Quality Health Care: A Guide to Developing and Using Indicators. Jones and Bartlett Publishers, 2004.

Vision
End Result
Ideal State

These are NOT measures!
Reduce wait times
Improve patient satisfaction
Expand market share
Be more efficient
Increase health and well-being
Reduce waste
Improve our financial situation
Reduce inpatient discharge delays
Enhance Patient education
Deliver safe services
They are part of…

Every concept can have many
measures! Source: R. Lloyd. Quality Health Care: A Guide to Developing and Using Indicators. Jones and Bartlett, 2004.
Concept Potential Measures
Access • Number of days to the next 2nd appointment • Percent of add-ons who can be seen today • Number of walk-in appointments • The number of minutes a caller is on hold before talking to a
staff person • Number of phone calls requesting an appointment this week
Wait Time • Wait time from check-in to discharge • Wait time from check-in to seeing doctor • Time spent with doctor • Time it takes to have follow-up work done in the office (labs,
x-ray, ultra-sound, etc.)
Management of
Diabetes Patients
• Percent of diabetes patients with appropriate eye and foot exams done during an office visit
• Percent of all diabetes patient in glucose control • Percent of patients engaged in self-management goals

Three Types of Measures
• Outcome Measures: Voice of the customer or patient. How is the system performing? What is the result?
• Process Measures: Voice of the workings of the system. Are the parts/steps in the system performing as planned?
• Balancing Measures: Looking at a system from different directions/dimensions. What happened to the system as we improved the outcome and process measures (e.g. unanticipated consequences, other factors influencing outcome)?

Potential Set of Measures for
CLABSIs
Topic
Outcome
Measures
Process
Measures
Balancing
Measures
Reduction in
central line
associated blood
stream infections
CLABSIs per
1000 central line
days by unit
Compliance with
central line
insertion checklist
Hand hygiene rate
Compliance with
hub scrub with
each central line
access
Compliance with
early central line
removal
Need for central
lines to be
replaced
Cost of hand
hygiene supplies
Infiltrates for PIV
usage

AIM (Why are you measuring?)
Concept
Measure
Operational Definitions
Data Collection Plan
Data Collection
Analysis ACTION
Milestones in the Quality
Measurement Journey
Source: R. Lloyd. Quality Health Care: A Guide to Developing and Using Indicators. Jones and Bartlett Publishers, 2004.

The Importance of Operational
Definitions
If data collected differently by different people, or
differently each time collected, it makes it hard to
know whether changes in the data are due to the
changes tested or from inconsistencies in data
collection.

An Operational Definition...
… is a
description, in
quantifiable
terms, of what to
measure and the
steps to follow to
measure it
consistently.
• It gives communicable
meaning to a concept
• Is clear and
unambiguous
• Specifies measurement
methods and equipment
• Identifies criteria

Components of Operational Definition
Developing an operational definition requires agreement on
two things:
1. A method of measurement
– Which device? (clock, wristwatch, stopwatch?)
– To what degree of precision (nearest hour, 5 minutes, minute,
second?)
– For time based measurements, what are the start and end points
2. A set of criteria for judgment
– What is “late”, “error”, “a fall”?
– What counts as an adverse event, like a CLABSI?
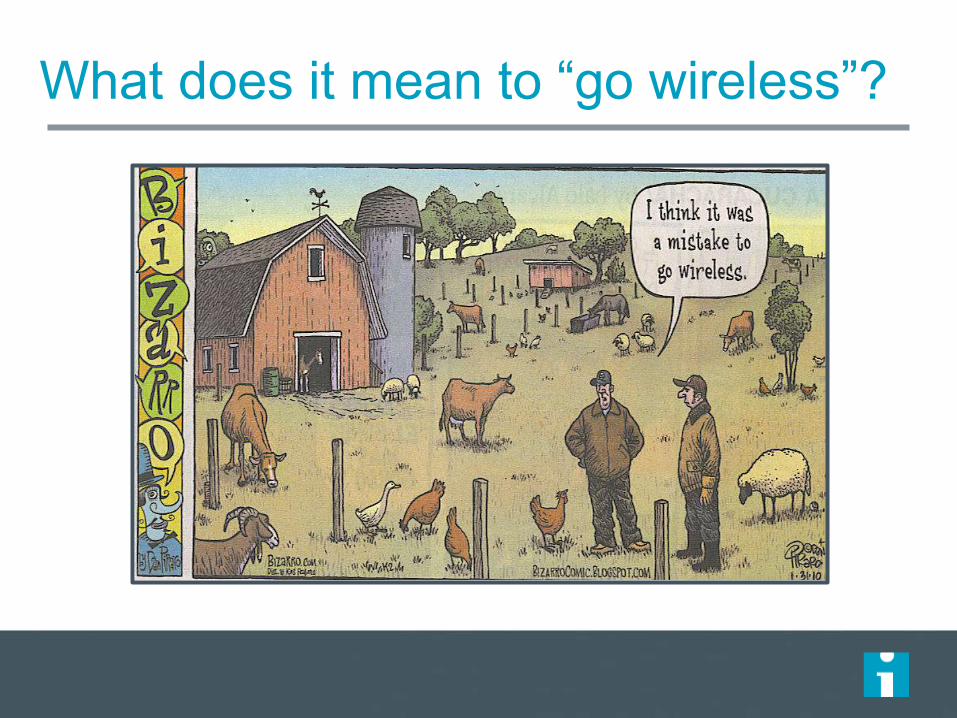
What does it mean to “go wireless”?

?
What is a goal?
The whole ball or half of the ball?

How do you define the following
healthcare concepts?
Medication error
Co-morbid conditions
Teenage pregnancy
Cancer waiting times
Health inequalities
Asthma admissions
Childhood obesity
Patient education
Health and wellbeing
Adding life to years and years to life
Children's palliative care
Safe services
Smoking cessation
Urgent care
Complete history & physical
• Delayed discharges
• End of life care
• Falls (with/without injuries)
• Childhood immunizations
• Complete maternity service
• Patient engagement
• Moving services closer to home
• Successful breastfeeding
• Ambulatory care
• Access to health in deprived areas
• Diagnostics in the community
• Productive community services
• Vascular inequalities
• Breakthrough priorities
• Surgery start time

Example: Medication Error Operational Definition
Measure Name: Percent of medication errors
Numerator: Number of outpatient medication orders with one or more errors. An error is defined as: wrong med, wrong dose, wrong route or wrong patient.
Denominator: Number of outpatient medication orders received by the family practice clinic pharmacy.
Data Collection:
This measure applies to all patients seen at the clinic
The data will be stratified by type of order (new versus refill) and patient age
The data will be tracked daily and grouped by week
The data will be pulled from the pharmacy computer and the CPOE systems
Initially all medication orders will be reviewed. A stratified proportional random sample will be considered once the variation in the process is fully understood and the volume of orders is analyzed.

Operational Definition for measuring a Banana!
1. Create a step-by-step operational definition to capture the concept of “banana size” — Think recipe (step-by-step specific instructions).
2. Measure your banana using the definition, and write down the result and keep it secret!
3. Pass your definition and banana to another table. They will use your definition to measure.
4. Compare results as a group.
© Richard Scoville & I.H.I.

Conclusions:
Developing Operational Definitions
1. Operational definitions are not universal
truths!
2. Operational definitions require
agreement on terms, measurement
methods and decision criteria.
3. Operational definitions need to be
reviewed periodically to make sure
everyone is still using the same
definitions and that the conditions
surrounding each measure have not
changed.

Measures and Analysis – Part II

AIM (Why are you measuring?)
Concept
Measure
Operational Definitions
Data Collection Plan
Data Collection
Analysis ACTION
Milestones in the Quality
Measurement Journey
Source: R. Lloyd. Quality Health Care: A Guide to Developing and Using Indicators. Jones and Bartlett Publishers, 2004.

Key Aspects of Data Collection
• Stratification
• Sampling Methods
• Frequency of Data Collection
• Duration of Data Collection
Source: R. Lloyd. Quality Health Care: A Guide to Developing and Using Indicators. Jones and Bartlett, 2004.
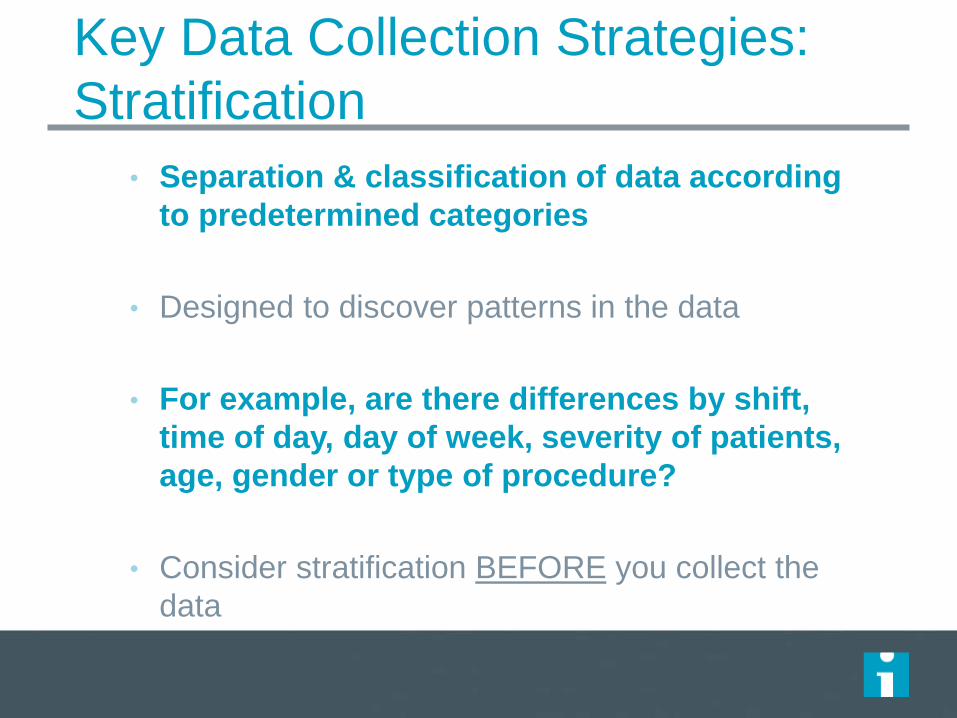
Key Data Collection Strategies:
Stratification
• Separation & classification of data according
to predetermined categories
• Designed to discover patterns in the data
• For example, are there differences by shift,
time of day, day of week, severity of patients,
age, gender or type of procedure?
• Consider stratification BEFORE you collect the
data

Common Stratification Levels
• Age
• Day of week
• Time of day or Shift
• Stat vs routine orders
• Severity of patients
Gender
Co-morbid conditions
Facility or service area
Units within a facility
Socio-economic status

Key Data Collection Strategies:
Sampling Methods
Non-probability Sampling
Methods
• Convenience sampling
• Quota sampling
• Judgment sampling
Probability Sampling Methods
• Simple random sampling
• Stratified random sampling
• Stratified proportional random
sampling
• Systematic sampling
• Cluster sampling
Source: R. Lloyd. Quality Health Care: A Guide to Developing and Using Indicators. Jones and Bartlett Publishers, 2004.

How often and for how long do you
need to collect data? • Frequency – the period of time in which you collect data (i.e., how
often will you dip into the process to see the variation that exists?)
• Moment by moment (continuous monitoring)?
• Every hour?
• Every day? Once a week? Once a month?
• Duration – how long you need to continue collecting data
• Do you collect data on an on-going basis and not end until the
measure is always at the specified target or goal?
• Do you conduct periodic audits?
• Do you just collect data at a single point in time to “check the
pulse of the process”
• Do you need to pull a sample or do you take every occurrence of
the data (i.e., collect data for the total population)

Seek useful measures not perfection
Think about stratification
Use sampling (when appropriate)
Integrate measurement into daily routine
Collect qualitative and quantitative data
Plot data over time
Conclusions:
Data Collection
AIM (Why are you measuring?)
Concept
Measure
Operational Definitions
Data Collection Plan
Data Collection
Analysis ACTION
Milestones in the Quality
Measurement Journey
Source: R. Lloyd. Quality Health Care: A Guide to Developing and Using Indicators. Jones and Bartlett Publishers, 2004.

You have data. Now what do you do
with it?

“If I had to reduce my message for management to
just a few words, I’d say it all had to do with reducing
variation.” W. Edwards Deming
Do you understanding variation conceptually?

The Problem!
Aggregated data presented in tabular formats or with summary statistics, will
not help you measure the impact of process improvement efforts.
Aggregated data can only lead to judgment, not to improvement.

“A phenomenon
will be said to be
controlled when,
through the use of
past experience,
we can predict, at
least within limits,
how the
phenomenon may
be expected to
vary in the future” W. Shewhart. Economic Control of
Quality of Manufactured Product, 1931
Dr. Walter A Shewhart

“What is the variation in one system over time?” Walter A. Shewhart - early 1920’s, Bell Laboratories
time
UCL
Every process displays variation: Controlled variation
stable, consistent pattern of variation “chance”, constant causes
Special cause variation “assignable” pattern changes over time
LCL
Static View
Static Vie
w
Dynamic View

Common Cause Variation
Is inherent in the design of the process
Is due to regular, natural or ordinary causes
Affects all the outcomes of a process
Results in a “stable” process that is predictable
Also known as random or unassignable variation
Special Cause Variation
Is due to irregular or
unnatural causes that are
not inherent in the design of
the process
Affect some, but not necessarily all aspects of the process
Results in an “unstable”
process that is not
predictable
Also known as non-random
or assignable variation
Types of Variation

Common Cause Variation (random variation)
Points equally likely above or below center line
There will be a high data point and a low, but this is
expected
No trends or shifts or other patterns
0
10
20
30
40
50
60
70
80
90
100
3/1/
2008
3/8/
2008
3/15
/200
8
3/22
/200
8
3/29
/200
8
4/5/
2008
4/12
/200
8
4/19
/200
8
4/26
/200
8
5/3/
2008
5/10
/200
8
5/17
/200
8
5/24
/200
8
5/31
/200
8
6/7/
2008
Courtesy of Richard Scoville, PhD, IHI Improvement Advisor

Two Types of Special Causes
Unintentional
When the system is out of
control and unstable due to
unexpected forces
Intentional
When we’re trying
to change the
system
Courtesy of Richard Scoville, PhD, IHI Improvement Advisor
Holding the Gain: Isolated Femur Fractures
0
200
400
600
800
1000
1200
1 4 7 10 13 16 19 22 25 28 31 34 37 40 43 46 49 52 55 58 61 64Sequential Patients
Min
ute
s E
D t
o O
R p
er
Patient
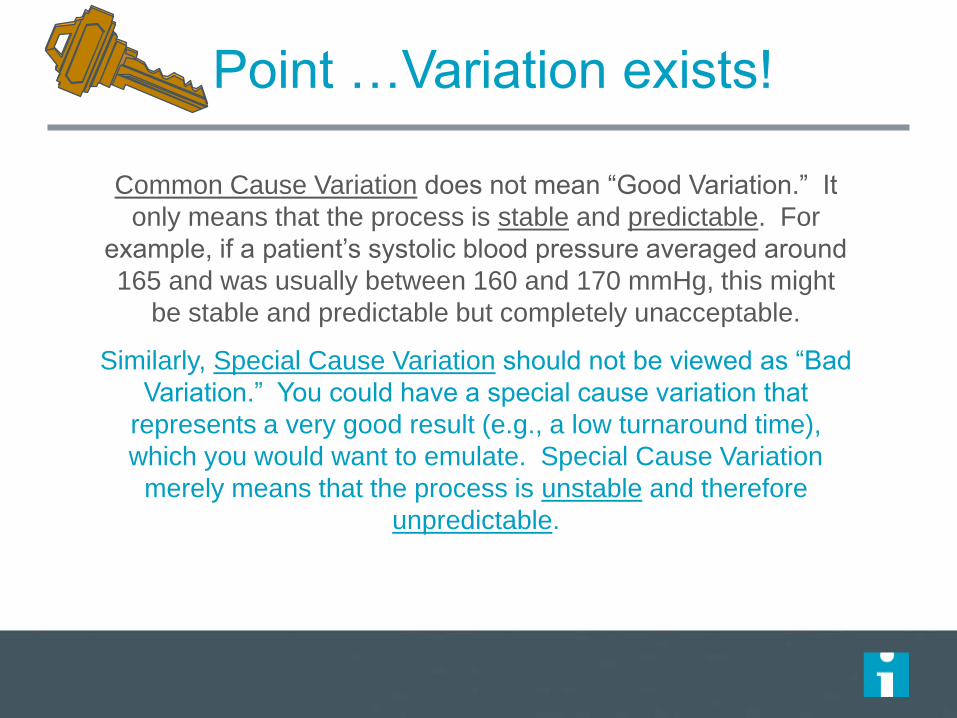
Point …Variation exists!
Common Cause Variation does not mean “Good Variation.” It
only means that the process is stable and predictable. For
example, if a patient’s systolic blood pressure averaged around
165 and was usually between 160 and 170 mmHg, this might
be stable and predictable but completely unacceptable.
Similarly, Special Cause Variation should not be viewed as “Bad
Variation.” You could have a special cause variation that
represents a very good result (e.g., a low turnaround time),
which you would want to emulate. Special Cause Variation
merely means that the process is unstable and therefore
unpredictable.

2 Questions …
131
1. Is the process stable? If so, it is predictable.
2. Is the process capable?
The chart will tell you if the process is stable and therefore, predictable.
You have to decide if the current performance of the process is capable of meeting the target or goal you
have set!

Random Variation
Normal Sinus Rhythm (a.k.a. Random Variation)
Ventricular Fibrillation (a.k.a. Non-Random Variation)
Non-Random Variation Holding the Gain: Isolated Femur Fractures
0
200
400
600
800
1000
1200
1 4 7 10 13 16 19 22 25 28 31 34 37 40 43 46 49 52 55 58 61 64Sequential Patients
Min
ute
s E
D t
o O
R p
er
Patient
Appreciation is extended to Dr. Douglas Brosnan, JD, MD, Vice Chair, Department of Emergency Medicine, Sutter Roseville Inpatient EHR Physician Champion for providing the example of normal sinus rhythm versus ventricular fibrillation.
Finally, find examples that
work for your discipline!

If you don’t understand the variation that
lives in your data, you will be tempted to ...
• Deny the data (It doesn’t fit my view of
reality!)
• See trends where there are no trends
• Try to explain natural variation as special
events
• Blame and give credit to people for things
over which they have no control
• Distort the process that produced the data
• Kill the messenger!

• Leaders understand the different ways that variation is
viewed.
• They explain changes in terms of common causes and special
causes.
• They use graphical methods to learn from data and expect
others to consider variation in their decisions and actions.
• They understand the concept of stable and unstable
processes and the potential losses due to tampering.
• Capability of a process or system is understood before
changes are attempted.
Attributes of a Leader Who
Understands Variation

Do you understanding
variation statistically?
STATIC VIEW
Descriptive Statistics Mean, Median & Mode
Minimum/Maximum/Range Standard Deviation
Bar graphs/Pie charts
DYNAMIC VIEW Run Chart
Control Chart
(plot data over time)
Statistical Process Control (SPC)
Rat
e pe
r 100
ED
Pat
ient
s
Unplanned Returns to Ed w/in 72 Hours
M
41.78
17
A
43.89
26
M
39.86
13
J
40.03
16
J
38.01
24
A
43.43
27
S
39.21
19
O
41.90
14
N
41.78
33
D
43.00
20
J
39.66
17
F
40.03
22
M
48.21
29
A
43.89
17
M
39.86
36
J
36.21
19
J
41.78
22
A
43.89
24
S
31.45
22
Month
ED/100
Returns
u chart
1 2 3 4 5 6 7 8 9 10 11 12 13 14 15 16 17 18 19
0.0
0.2
0.4
0.6
0.8
1.0
1.2
UCL = 0.88
Mean = 0.54
LCL = 0.19

How do we analyze variation for
quality improvement?
Run and Control Charts are the best tools to
determine if our improvement strategies have had the desired
effect.

Process Improvement: Isolated Femur Fractures
0
200
400
600
800
1000
1200
1 4 7 10 13 16 19 22 25 28 31 34 37 40 43 46 49 52 55 58 61 64Sequential Patients
Min
ute
s E
D t
o O
R p
er
Patient
Holding the Gain: Isolated Femur Fractures
0
200
400
600
800
1000
1200
1 4 7 10 13 16 19 22 25 28 31 34 37 40 43 46 49 52 55 58 61 64Sequential Patients
Min
ute
s E
D t
o O
R p
er
Patient
3. Determine if we are holding the gains
Current Process Performance: Isolated Femur Fractures
0
200
400
600
800
1000
1200
1 4 7 10 13 16 19 22 25 28 31 34 37 40 43 46 49 52 55 58 61 64Sequential Patients
Min
ute
s E
D t
o O
R p
er
Patient
Three Uses of Statistical Process Control Charts
2. Determine if a change is an improvement
1. Make process performance visible

Run Chart
Graphical display of data plotted in some type of order.
Also has been called a time series or a trend chart.

Case1
0
2
4
6
8
10
12
1 2 3 4 5 6 7 8 9 10 11 12 13 14
Dela
y T
ime (
hrs
)
Make Change
Before and After Test
8
3
0
1
2
3
4
5
6
7
8
9
10
1 2
De
lay T
ime
(h
rs)
Before Change (measure on Week 4)
After Change (measure on week 11)
Change made between week 7 and week 8
Why Use A Run Chart?

Case 2
0
2
4
6
8
10
12
1 2 3 4 5 6 7 8 9 10 11 12 13 14
Dela
y T
ime (
hrs
)
Case 3
0
2
4
6
8
10
12
1 2 3 4 5 6 7 8 9 10 11 12 13 14
Dela
y T
ime (
hrs
)
Case 5
0
2
4
6
8
10
12
1 2 3 4 5 6 7 8 9 10 11 12 13 14
Dela
y T
ime (
hrs
)
Make
Change
Case 4
0
2
4
6
8
10
12
1 2 3 4 5 6 7 8 9 10 11 12 13 14
Dela
y T
ime (
hrs
)
Make
Change
Make
Change
Case 6
0
2
4
6
8
10
12
1 2 3 4 5 6 7 8 9 10 11 12 13 14
Dela
y T
ime (
hrs
)
Make
Change
Make
Change
Evidence that change tested result in an improvement?

Case 2
0
2
4
6
8
10
12
1 2 3 4 5 6 7 8 9 10 11 12 13 14
De
lay
Tim
e (h
rs)
Case 3
0
2
4
6
8
10
12
1 2 3 4 5 6 7 8 9 10 11 12 13 14
De
lay
Tim
e (h
rs)
Case 5
0
2
4
6
8
10
12
1 2 3 4 5 6 7 8 9 10 11 12 13 14
Del
ay T
ime
(hrs
)
Make
Change
Case 4
0
2
4
6
8
10
12
1 2 3 4 5 6 7 8 9 10 11 12 13 14
De
lay
Tim
e (
hrs
)
Make
Change
Make
Change
Case 6
0
2
4
6
8
10
12
1 2 3 4 5 6 7 8 9 10 11 12 13 14
Del
ay T
ime
(hrs
) Make
Change
Make
Change
Random Variation
Headed down before change.
Where begin?
Change did not hold
Improvement: before change
(between week 4 & 5)
Week 4 not typical of process

We Can Learn a Lot with a Simple
Tool… What do you observe here? What would your question be?
Page 68

How do we analyze a Run Chart
“How will I know what the Run Chart is
trying to tell me?”
It is actually quite easy:
1. Determine the number of runs.
2. Then apply the 4 basic run chart rules decide if your data reflect random or non-random variation.

How do we count the number of runs?
What is a Run?
• One or more consecutive data points on the same side of the
Median
• Do not include data points that fall on the Median
First, you need to determine
the number of Runs
• Draw a circle around each run and count the number of circles you
have drawn
• Count the number of times the sequence of data points crosses
the Median and add “1”

1 2 3 4 5 6 7 8 9 10 11 12 13 14 15 16 17 18 19 20 21 22 23 24 25 26 27 28 29
Point Number
Po
un
ds
of
Re
d B
ag
Wa
ste
3.25
3.50
3.75
4.00
4.25
4.50
4.75
5.00
5.25
5.50
5.75
6.00
Median=4.610
Points on the Median
(don’t count these when counting the number of runs)
Run Chart: Medical Waste Determine the number of runs on this chart

1 2 3 4 5 6 7 8 9 10 11 12 13 14 15 16 17 18 19 20 21 22 23 24 25 26 27 28 29
Point Number
Po
un
ds
of
Re
d B
ag
Wa
ste
3.25
3.50
3.75
4.00
4.25
4.50
4.75
5.00
5.25
5.50
5.75
6.00
Median=4.610
Points on the Median
(don’t count these when counting the number of runs)
14 runs
Run Chart: Medical Waste Determine the number of runs on this chart

Run Chart Rules for
Non-Random Patterns
Source: The Data Guide by L. Provost and S. Murray, Jossey-Bass Publishers, 2011.
A Shift: 6 or more
An astronomical
data point
Too many or too few runs
A Trend
5 or more

1 2 3 4 5 6 7 8 9 10 11 12 13 14 15 16 17 18 19 20 21 22 23 24 25 26 27 28 29
Point Number
Po
un
ds
of
Re
d B
ag
Wa
ste
3.25
3.50
3.75
4.00
4.25
4.50
4.75
5.00
5.25
5.50
5.75
6.00
Median=4.610
Points on the Median
(don’t count these when counting the number of runs)
14 runs
Run Chart: Medical Waste
Apply the Run Chart Rules

Rule #3:
Too few or too many runs
Use this table by first calculating the number of "useful observations" in your data set. This is done by subtracting the number of data points on the median from the total number of data points. Then, find this number in the first column. The lower number of runs is found in the second column. The upper number of runs can be found in the third column. If the number of runs in your data falls below the lower limit or above the upper limit then this is a signal of a special cause. # of Useful Lower Number Upper Number Observations of Runs of Runs 14 4 12 15 5 12 16 5 13 17 5 13 18 6 14 19 6 15 20 6 16 21 7 16 22 7 17 23 7 17 24 8 18 25 8 18 26 9 19 27 10 19 28 10 20 29 10 20 30 11 21
Total data points
So, for 27 useful
observations we should
have between 10 and 19 runs
Two data points on the median = 27 useful observations
Source: Swed, F. and Eisenhart, C. (1943) “Tables for Testing Randomness of Grouping in a Sequence of Alternatives.” Annals of Mathematical Statistics. Vol. XIV, pp. 66-87, Tables II and III.

Why are Shewhart Charts preferred
over Run Charts? Because Control Charts…
1. Are more sensitive than run charts
– A run chart cannot detect special causes that
are due to point-to-point variation (median
versus the mean)
– Tests for detecting special causes can be
used with control charts
2. Have the added feature of control limits, which
allow us to determine if the process is stable
(common cause variation) or not stable (special
cause variation).
3. Can be used to define process capability.
4. Allow us to more accurately predict process
behavior and future performance.

Jan01 Mar01 May01 July01 Sept01 Nov01 Jan02 Mar02 May02 July02 Sept02 Nov02
Month
Nu
mb
er
of
Co
mp
lain
ts
5.0
10.0
15.0
20.0
25.0
30.0
35.0
40.0
45.0
50.0
A
B
C
C
B
A
UCL=44.855
CL=29.250
LCL=13.645
Elements of a Shewhart Chart
X (Mean)
Me
asu
re
Time
An indication of a special cause
(Upper Control Limit)
(Lower Control Limit)

Variables Data
Attributes Data Defects
(occurrences only)
Defectives (occurrences plus non-occurrences)
Nonconforming Units Nonconformities
The choice of a Shewhart Chart depends
on the Type of Data you have collected
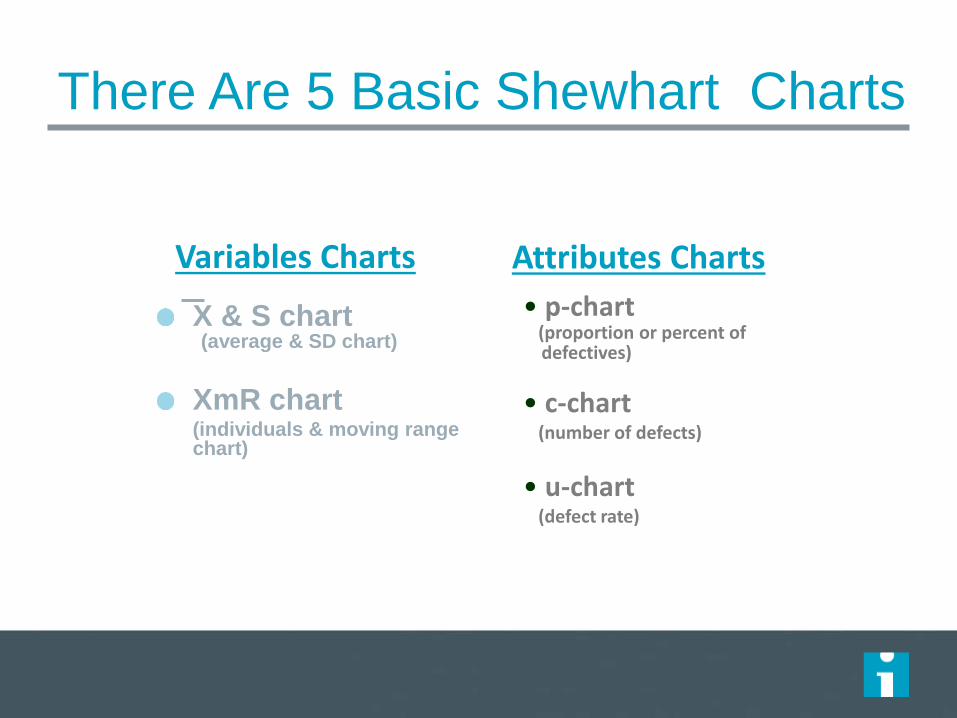
There Are 5 Basic Shewhart Charts
X & S chart (average & SD chart)
XmR chart (individuals & moving range
chart)
Variables Charts Attributes Charts
• p-chart
(proportion or percent of defectives)
• c-chart
(number of defects)
• u-chart
(defect rate)

The Shewhart Chart Decision Tree
Variables Data Attributes Data
More than one
observation per
subgroup?
X bar & S XmR
Is there an equal area of
opportunity?
Occurrences & Non-
occurrences?
p-chart u-chart c-chart
Decide on the type of data
Yes
Yes
Yes
No
No
The percent of Defective Units
The number of Defects
The Defect Rate Individual Measurement
Average and Standard Deviation
No
Source: R. Lloyd. Quality Health Care: A Guide to Developing and Using Indicators. Jones and Bartlett, 2004.

5 Rules for Determining a Special Cause in
Control Charts
1. A single point outside the control limits
2. A run of eight or more points in a row above or below
the center line
3. Six consecutive points in a row increasing (trend up) or
decreasing (trend down)
4. Two out of three consecutive points near a control
limit (outer one third of chart)
5. Fifteen consecutive points in a row near the center
line (inner one third of the chart

Provost, L and Murray, S. The Health Care Data Guide: Learning from Data for Improvement. San Francisco: Jossey-Bass, 2011. Page 116.

“Special Cause” in Run vs. Control Charts
Rule Run Charts Control Charts
Consecutive increasing or decreasing points
5 6
Number of points on the same side of the center line.
6 8
Astronomical point One “unusual” point One outside the UCL or LCL
Points around the center line
Too few or too many crossings of center line
15 around the inner third
2 out of 3 in the outer third N/A Yes
Center line Median Mean
Control Limits No Yes (+/- 3 ~SD)

Your next move…
…to gain more knowledge about Shewhart Charts (a.k.a. control charts)
PDSA Testing

PDSA
P Please
D Do
S Something
A Anything!

The PDSA Cycle
Now, let’s review the
PDSA part of the MFI and
tests of change
Langley, J. et al. The Improvement Guide, Jossey-Bass, 2009.

1939
The Deming Wheel 1. Design the product (with appropriate tests). 2. Make it; test it in the production line and in the laboratory. 3. Sell the product. 4. Test the product in service, through market research. Find out what
user think about it and why the nonusers have not bought it.
1950
Development of the Shewhart Cycle
1986
Source: Moen, R. and Norman, C. “Circling Back” Quality Progress, November 2010: 22-28.
Walter A. Shewhart (1891 – 1967)

Deming’s Sketch of the
Shewhart Cycle - 1985
Walter Shewhart (1891 – 1967)

The PDSA Cycle for Learning and Improvement (a practical application of the scientific method)
Plan• Objective
• Questions &
predictions
• Plan to carry out:
Who?When?
How? Where?
Do• Carry out plan
• Document
problems
• Begin data
analysis
Act• Ready to
implement?
• Try something
else?
• Next cycle
Study• Complete data
analysis
• Compare to
predictions
• Summarize
What will happen if we
try something different?
Let’s try it! Did it work?
What’s next?

You actually do PDSAs every day!

Act Plan
Study Do
Plan, Do, Study, Act Cycle

Act
Plan Objective
Questions and
predictions (why)
Plan to carry out the cycle
(who, what, where, when)
Study Do
Plan, Do, Study, Act Cycle
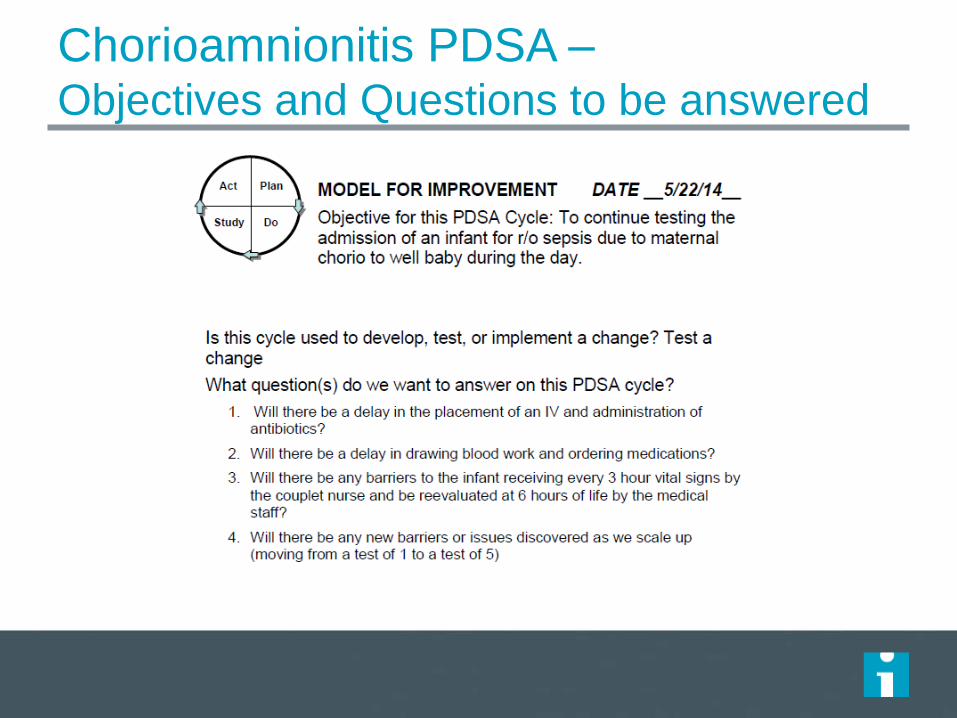
Chorioamnionitis PDSA – Objectives and Questions to be answered

Chorioamnionitis PDSA – Plan

Chorioamnionitis PDSA –
Plan and Predictions

Data Collection Form

Act Plan
Study
Do Carry out the plan
Document problems
and unexpected
observations
Begin analysis of
the data
Plan, Do, Study, Act Cycle

Chorioamnionitis PDSA – Do it!

Act Plan
Study Complete the
analysis of the data
Compare data to
predictions
Summarise what
was learned
Do
Plan, Do, Study, Act Cycle

Chorio – Study it! What did we learn?

Act
What changes
are to be made?
Next cycle?
Plan
Study Do
Plan, Do, Study, Act Cycle

Chorioamnionitis – Act?
What to do next?

On the basis of what is learned from any
cycle, a change might be:
• Implemented as is (adopt)
• Dropped (abandon)
• Modified (adapt)
• Increased in scope
(expand)
• Test under other
conditions

Repeated Use of the PDSA Cycle
Hunches
Theories Ideas
Changes That Result in
Improvement
A P
S D
A P
S D
Very Small
Scale Test
Follow-up
Tests
Wide-Scale Tests
of Change
Implementation of
Change
1) What are we trying to accomplish?
2) How will we know that a change is an
improvement?
3) What change can we make
that will result in improvement?
Sequential building of knowledge under a wide
range of conditions

Using a PDSA ramp to test change –
Chorio
Admit one
chorio baby to
well-baby.
Expand to 5 patients during the
day.
All babies between 8 and 5
during the week.
Include babies born
on nights and
weekends.
Include all patients including those on
Family Med service.
All improvement requires change, but not
all change is an improvement!

Aim: To increase the spin time of your coin.
Test: Best technique, best surface, best conditions.
Make iterative spin tests to determine best
combination of conditions to get results.
• Appoint a spinner
• Appoint a timekeeper
• Appoint a recorder
• Document PDSAs on
worksheet
• Plot the time of each spin
onto the run chart
• Complete 10 cycles or more!
(15 min)

PDSAs to Increase Spin Time
Then use the summary sheet

The Sequence of
Improvement requires PDSAs
Sustaining improvements and Spreading changes to other locations
Developing a change
Implementing a change
Testing a change
Theory and Prediction
Test under a variety of conditions
Make part of routine operations

To Be Considered a Real Test
Test was planned, including a plan for collecting
data
Plan was carried out and data were collected
Time was set aside to analyze data and study the
results
Action was based on what was learned

Guidance for Testing a Change
Concept
A test of change should answer a specific question!
A test of change requires a theory and a prediction!
Start testing on a small scale (1 patient, 1 day, 1 admit, 1 physician)
Collect data over time (by hour, day week or month)
Build knowledge sequentially with multiple PDSA cycles for each idea.
Include a wide range of conditions in the sequence of tests.
Document your tests with a PDSA form
Set aside time to analyze the data from the PDSA test, study the results
and use the insights to guide the team’s actions.
Don’t confuse a task with a test!

How big of a test of change?
Current Situation Resistant Indifferent Ready
Low Confidence
that current
change idea will
lead to
Improvement
Cost of
failure
large
Very Small
Scale Test
Very Small
Scale Test
Very Small
Scale Test
Cost of
failure
small
Very Small
Scale Test
Very Small
Scale Test
Small Scale
Test
High
Confidence that
current change
idea will lead to
Improvement
Cost of
failure
large
Very Small
Scale Test
Small Scale
Test
Large Scale
Test
Cost of
failure
small
Small Scale
Test
Large Scale
Test
Implement

Failed Test…Now What?
Be sure to distinguish the reason:
• Change was not executed properly
• Change was executed, but not effective (wrong idea)
If the prediction was wrong it was not a failure!
• Change was executed but did not result in improvement.
• Local improvement was small and did not impact the
entire process of interest.
• In either case, we’ve improved our understanding of the
system and learned!

The Value of “Failed” Tests
“I did not fail one thousand times; I
found one thousand ways how not to
make a light bulb.”
Thomas Edison

Skin to
Skin
Rooming in Feeding
cues
Alt feeding methods/
supplementation
Working in Parallel on Multiple
Change Ideas or Drivers
A P
DS
A
P
D
S
APD
S
AP
DS
A P
DS
A
P
D
S
APD
S
AP
DS
A P
DS
A
P
D
S
APD
S
AP
DS
A P
DS
A
P
D
S
APD
S
AP
DS

Implementing, Sustaining, and Spread

Questions to improve impact
How do we move from testing to making the change
permanent? (Implementation)
How do we hold the gains from improvement over time?
(Sustainability)
How do we improve more quickly across a system?
– How do we engage individuals to adopt changes identified
elsewhere? (Spread)
– How do we build the infrastructure to allow adoption of changes
in different contexts? (Scale-up).
– How do we expose or provoke system barriers (Scale-up)

Sustaining improvements and Spreading changes to other locations
Developing a change
Implementing a change
Testing a change
Theory and Prediction
Test under a variety of conditions
Make part of routine operations
The sequence of improvement 193

Creating a new system 194
Improvement Hold Gains Results at Scale
Design for Scale
Improvement
Hold Gains
Get Results at Scale
Old way: Sequential Approach
New way: Parallel Approach

Improvement Sequence: Definitions
Test – Try and adapt ideas to learn what works in
your system
Implement – Make a change a permanent part of
the day to day operation of the system
Sustain – Hold the gains of improvement
Spread – Have individuals adopt the changes
Scale-up – Overcoming the structural issues that
arise during spread
195
Langley J. Nolan K. et al. Improvement Guide. 2nd Edition, 2009

Improving Long-Term Impact
Human Reaction to Change
Technical Aspects of Change
Nature of the Change

Implementation How do we move from testing to making the change permanent?
197

Expectation for… Testing Implementation
Failure 20 – 25% ~5%
Surprises (i.e., variance from predictions)
High Low
Number of people affected
Few Many
Resistance Low High
Redesign of existing processes (e.g., job descriptions)
No Yes
New resources needed No Yes
Time needed to run PDSA
Fast Slow

How big of a test of change?
Current Situation Resistant Indifferent Ready
Low Confidence
that current
change idea will
lead to
Improvement
Cost of
failure
large
Very Small
Scale Test
Very Small
Scale Test
Very Small
Scale Test
Cost of
failure
small
Very Small
Scale Test
Very Small
Scale Test
Small Scale
Test
High
Confidence that
current change
idea will lead to
Improvement
Cost of
failure
large
Very Small
Scale Test
Small Scale
Test
Large Scale
Test
Cost of
failure
small
Small Scale
Test
Large Scale
Test
Implement
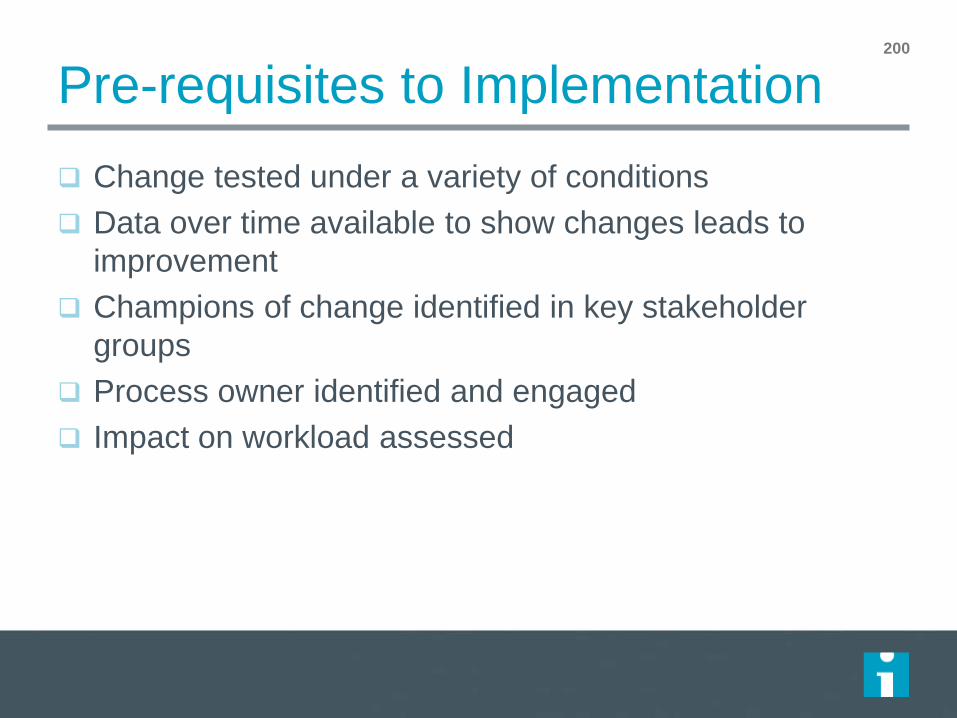
Pre-requisites to Implementation
Change tested under a variety of conditions
Data over time available to show changes leads to
improvement
Champions of change identified in key stakeholder
groups
Process owner identified and engaged
Impact on workload assessed
200

Technical strategies for implementation
Continue to use PDSA cycles
Three approaches when planning PDSA’s 1. “Just do it”
2. Parallel approach
3. Sequential approach a) One at a time with all staff
b) All at one time with selected staff
Improvement Guide, pages 176-179
201
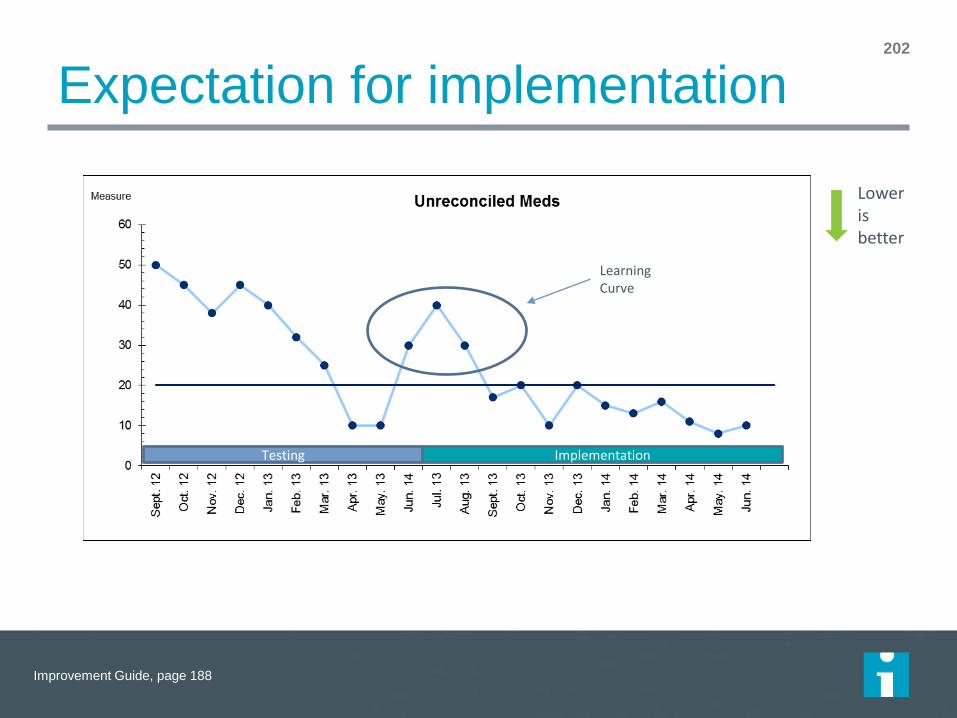
Expectation for implementation 202
Testing Implementation
Lower is better
Learning Curve
Improvement Guide, page 188

Sustainability – Holding the Gains How do we hold the gains from improvement over time?
203

Discussion
Think of a time in your experience when
an improvement was implemented. Are the
gains from that change still there?
– If yes, what was done that resulted in the
gains being held?
– If no, why did the gains fail to be held? What
got in the way?

Technical Aspects
Measurement
Ownership
Communication and Training
Hardwiring and Standardization
Assessment of Workload


SC Costs with Control Limits
12
13
14
15
16
17
18
19
20
21
22
Ja
n-0
2
Fe
b-0
2
Ma
r-0
2
Ap
r-0
2
Ma
y-0
2
Ju
n-0
2
Ju
l-0
2
Au
g-0
2
Se
p-0
2
Oct-
02
No
v-0
2
De
c-0
2
Ja
n-0
3
Fe
b-0
3
Ma
r-0
3
Ap
r-0
3
Ma
y-0
3
Ju
n-0
3
Ju
l-0
3
Au
g-0
3
Se
p-0
3
Oct-
03
No
v-0
3
De
c-0
3
SC
Co
sts
as %
of
To
tal C
osts
Not holding gain;
Things getting worse
Act to correct
Old system
New system
Measurement: Quality control 207
Do we have the data (process and outcome)? Do we look at it? Do we know what to do?

Ownership http://www.ihi.org/resources/Pages/IHIWhitePapers/Sustaining-Improvement.aspx

Communication and training
Awareness to decision (communication)
Decision to action:
– Peer-to-peer
– “At the elbow” or mentoring
– Ongoing technical support or hotline
– Learning + Action
– Address mindsets + technicalities
Consider training for existing and new employees (e.g.,
onboarding)
209
More soon!

Training: How matters
What do adults retain after three months?
– Lecture-based training (e.g., presentations, videos,
demonstrations, discussions) = 10%
– Learn by doing (e.g., role plays, simulations, case studies) =
65%
– Practice what was learned in the workplace = ~100%
210
IBM research; Whitmore, “Coaching for Performance.”
http://www.aascu.org/corporatepartnership/McKinseyReport2.pdf

Hardwiring the change
Make it easy to do the right thing and hard to do the wrong thing
Sample methods: – Standardization and accountability for following standard work
– Documentation
– Remove “old way”
– Reduce reliance on human memory (affordances, defaults)
– Tend to resources: forms, equipment, etc.
211

Managing sustainability 212

Spread and Scale-up How do we improve more quickly across a system?
213

Your Project
214
Spread: Having individuals adopt the changes
Scale-up: Overcoming the structural issues
that arise during spread

Technical Aspects
Spread and scale-up aim
Plans
– Workplan
– Communication
– Measurement for uptake of changes and the outcomes
Project manager (25 – 50% FTE for high complexity)
Infrastructure

Process Measure 216
1 X X X X X Coumadin
2 X X X X X PCAs
3 X X X Plan
4 X X Plan X X
5 X X Plan Plan X
Lovenox
Heparin
7 X Plan Plan X
8 X Plan X X X
Hazard
Areas
Exec
WalksUnit
Briefings
HFE
BriefingsSite FMEAReconci-
liation
X Plan
X = At least one unit implementing the change
6 X X
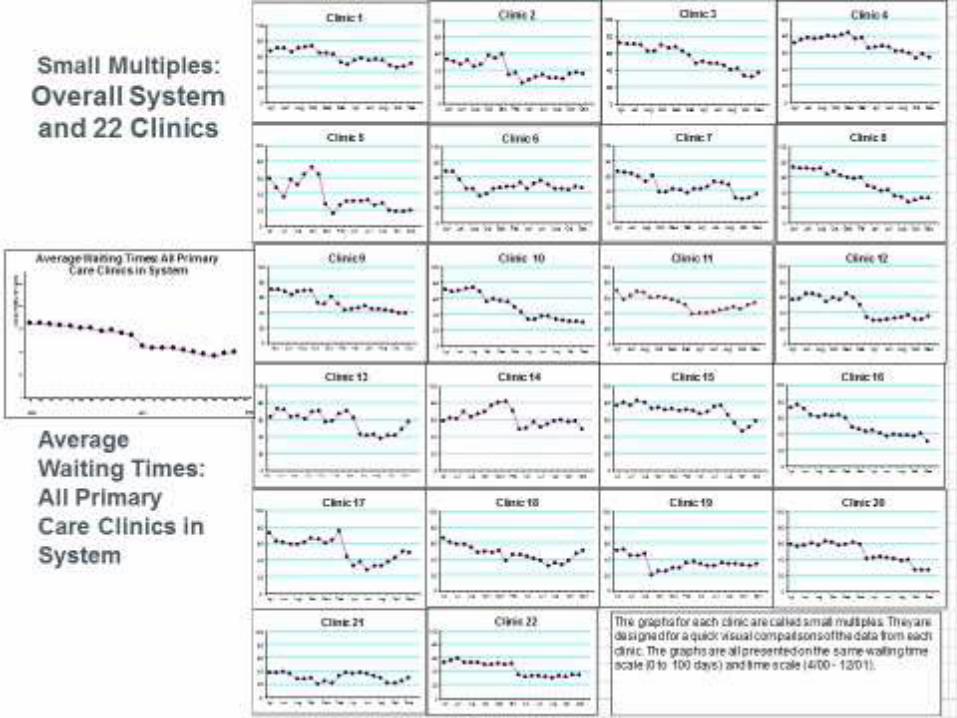
217

The Scale-up Framework 218
Adoption
Mechanisms
Set-up Build Scalable
Unit
Test Scale-
Up Go to Full-Scale
Support
Systems
Phases of
Scale-up
Best
Practice
exists
New Scale-
up Idea
Leadership, communication, social networks, culture of urgency and persistence
Learning systems, data systems, infrastructure for scale-up, human capacity for scale-up, capability for scale-up,
sustainability

Scale-up framework
Change Areas 5 25 125 625 3125
Asking What Matters Physician
asks at
primary care
visit
PA asks during
vital signs
Pre-visit
planning
??? ???
Documenting What
Matters
Pen and
paper
Standardized
form
Whiteboard EHR ???
Sharing What Matters Physician
head
Form in record Care team
meeting
??? ???
Updating What
Matters
N/A N/A Pre-visit
planning
??? ???
Learning System N/A Team Meeting Champion Database ???
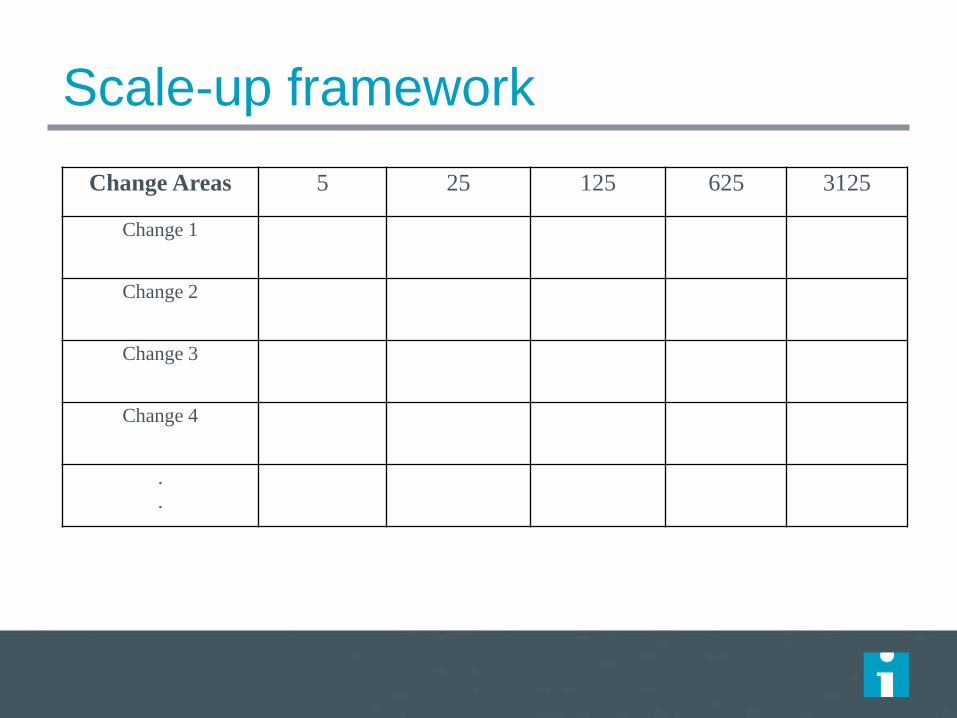
Scale-up framework
Change Areas 5 25 125 625 3125
Change 1
Change 2
Change 3
Change 4
.
.

Improving Long-Term Impact
Human Reaction to Change
Technical Aspects of Change
Nature of the Change

Attributes of an idea that facilitate adoption
Rogers, E. M. (2003). Diffusion of innovations. New York, Free Press.
222
Relative Advantage
Simple Trialable Compatible Observable
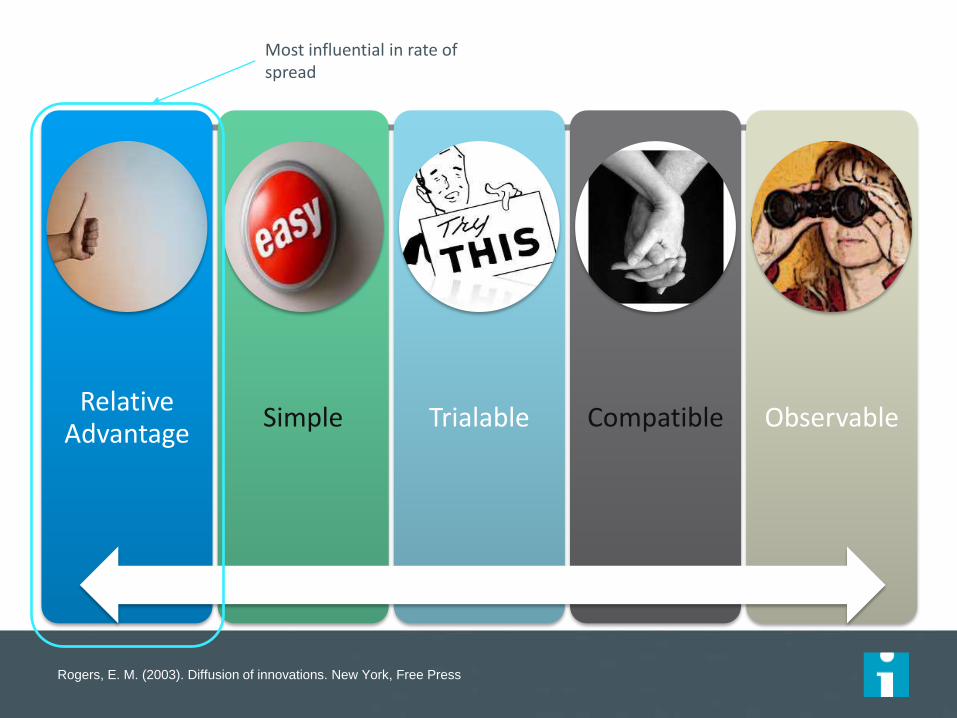
Rogers, E. M. (2003). Diffusion of innovations. New York, Free Press.
223
Relative Advantage
Simple Trialable Compatible Observable
Most influential in rate of spread

Attribute Score (1 – 5)
Actions to Take
Relative advantage (i.e., how strong is the evidence that the change is better than the old way)
Compatibility with current system (i.e., how well does it fit the current structure, values, and practices)
Simplicity of the change (i.e., how easy is the change to adopt)
Testability (i.e., can people try it)
Observability (i.e., can people see it before trying it)
Hard core, soft periphery (i.e., to what extent can individuals customize to their context)
P224
Worksheet: Assess the Readiness of an Idea for Rapid
Spread Change/Improvement/Intervention: ________________________________________

Improving Long-Term Impact
Human Reaction to Change
Technical Aspects of Change
Nature of the Change

Human reaction to change
How people react to change - differently
The message: why and how
The messenger
Other levers
What if people still won’t change

How people react to change
Resistance: an emotional or behavioral response to real or imagined threats to the work routine
Apathy: feeling or showing little or no interest
Compliance: publicly acting in accord with social pressure while privately disagreeing
Conformance: a change in behavior or belief as a result of real or imagined group pressure
Commitment: the state of being bound emotionally or intellectually to a course of action
Improvement Guide, page 186
227

The message: why
What motivates you doesn’t motivate employees (~20%
across dimensions)
Motivations differ. Customize the message
– Company
– Society
– Customer
– Personal gain
– Working team
228

The message: why (example)
Company: survive the new payment environment.
Society: Team-based care is the future of health care—
better health at lower cost. This is vital given that health
care is too much of the GDP and chronic conditions are
continuing to rise.
Customer: Team-based care creates better outcomes
for our patients.
Personal gain: go home on time without home-work
Working team: care will be coordinated with greater
communication, and problem solving
229

The message: as leaders you will
Create dissatisfaction with current state
Relentlessly communicate direction
Express excessive faith in success
Empathize with anxiety
Make it personal: – Logistical implications of change (e.g., where will I sit)
– Clear message on what I will be doing differently
– How will this make my job easier?
230
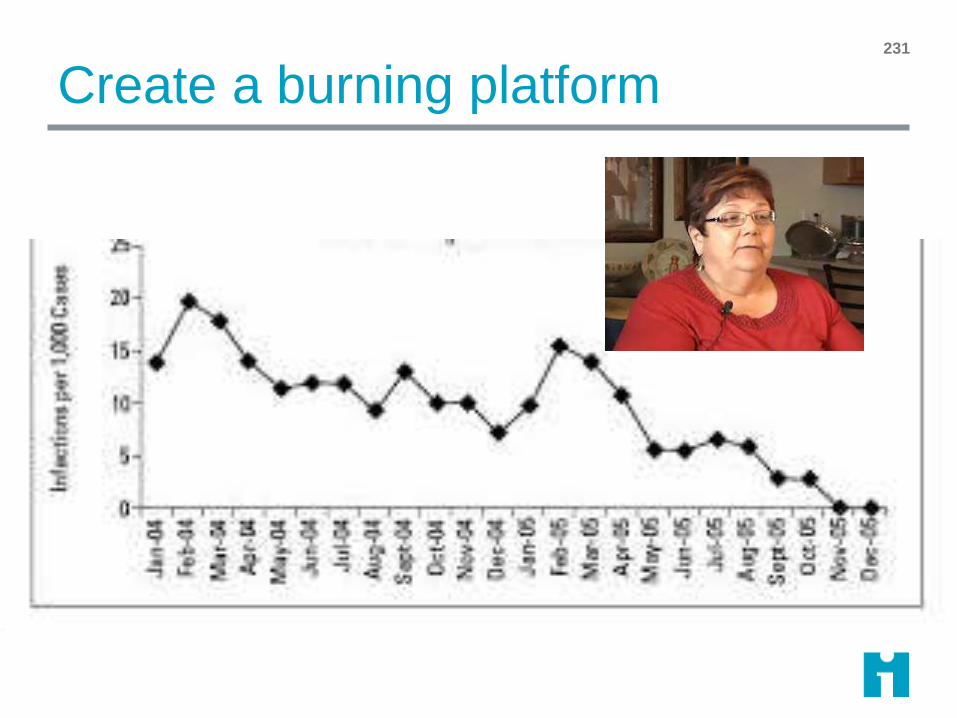
Create a burning platform 231

The message: how
Adapted from Sarah W. Fraser
232
Raise
Awareness
Shape
Behavior
General
Publications • Flyers
• Newsletters
• Videos
• Articles
• Posters
Personal
Touch • Letters
• Cards
• Postcards
Interactive
Activities • Telephone
Peer-to-Peer • Communities
of practice
• Shadowing
• Visits
• Mentoring
Public
Events • Fairs
• Conferences
• Exhibitions
• Meetings

The messengers
Include influencers/opinion leaders
To identify opinion leaders:
Testing teams should be front and center
Understand the nature of networks

Adopter Categories
Innovators
Early
Adopters
Early
Majority
Late
Majority Traditionalists
2.5% 13.5% 34% 34% 16%
Source: Rogers, 1995
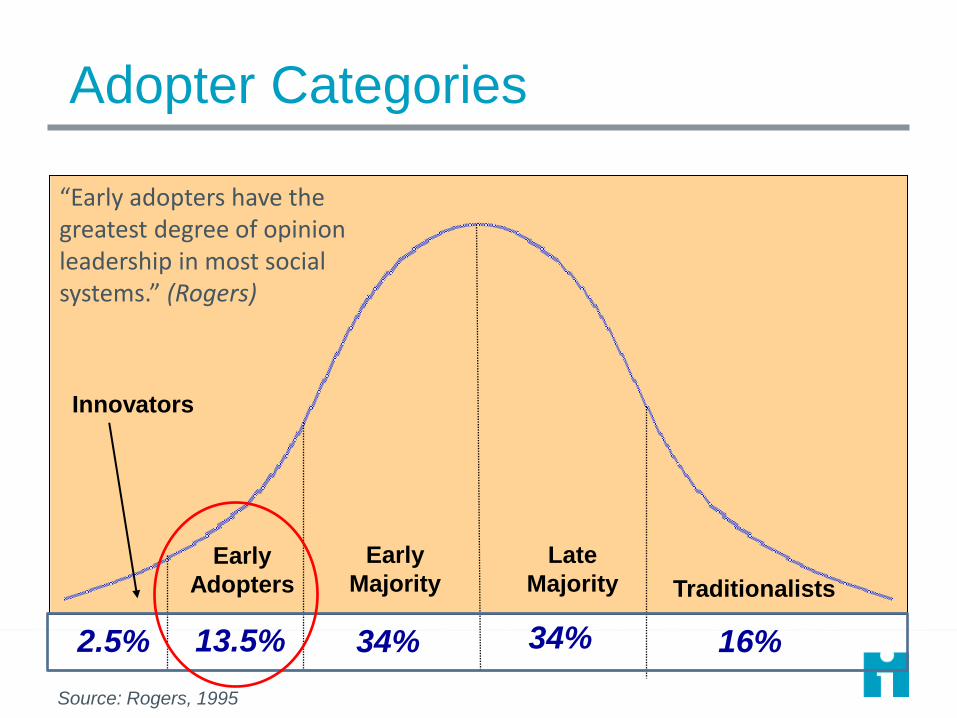
Adopter Categories
Innovators
Early
Adopters
Early
Majority
Late
Majority Traditionalists
2.5% 13.5% 34% 34% 16%
Source: Rogers, 1995
“Early adopters have the greatest degree of opinion leadership in most social systems.” (Rogers)

Leverage the recognition economy 236

What if people still won’t change? 237

“Dr. Edwards Deming gave us
a body of knowledge with "the
foreboding name “a System of
Profound Knowledge.” “Profound”
denotes the deep insight that this
knowledge provided into how to
make changes that will result in
improvement in a variety of
settings.
“System” denotes the emphasis on
the interaction of the components
rather than on the components
themselves.”
Langley, J. et al. The Improvement Guide, Jossey-Bass Publishers, 2009,
page xxiv.
The Science of Improvement is grounded in
Deming’s System of Profound Knowledge

The Lens of Profound Knowledge
Appreciation
of a system
Understanding Variation
Theory of Knowledge
Human
Behavior
“The system of profound
knowledge provides a lens. It provides a new map of theory by which to understand and optimize our organizations.” (Deming, Out of the Crisis)
It provides a theory of
management.

Appreciation for a System
• Interdependence, dynamism of the parts
• The world is not deterministic
• Direct, indirect and interactive variables
• The system must have an aim
• The whole is greater than sum of the parts
Understanding Variation
• Variation is to be expected!
• Common or special causes of variation
• Data for judgment or improvement?
• Ranking, tampering & performance management
• Potential sampling errors
Theory of Knowledge
• What theories drive the system?
• Can we predict?
• Learning from theory and
experience
• Operational definitions (what does
a concept mean?)
• PDSAs for learning and
improvement
Human Behavior
• Interaction between people
• Intrinsic versus extrinsic motivation
• Beliefs, values & assumptions
• What is the Will to change?
What insights might be obtained by looking through the
Lens of Profound Knowledge?

What have we learned today?
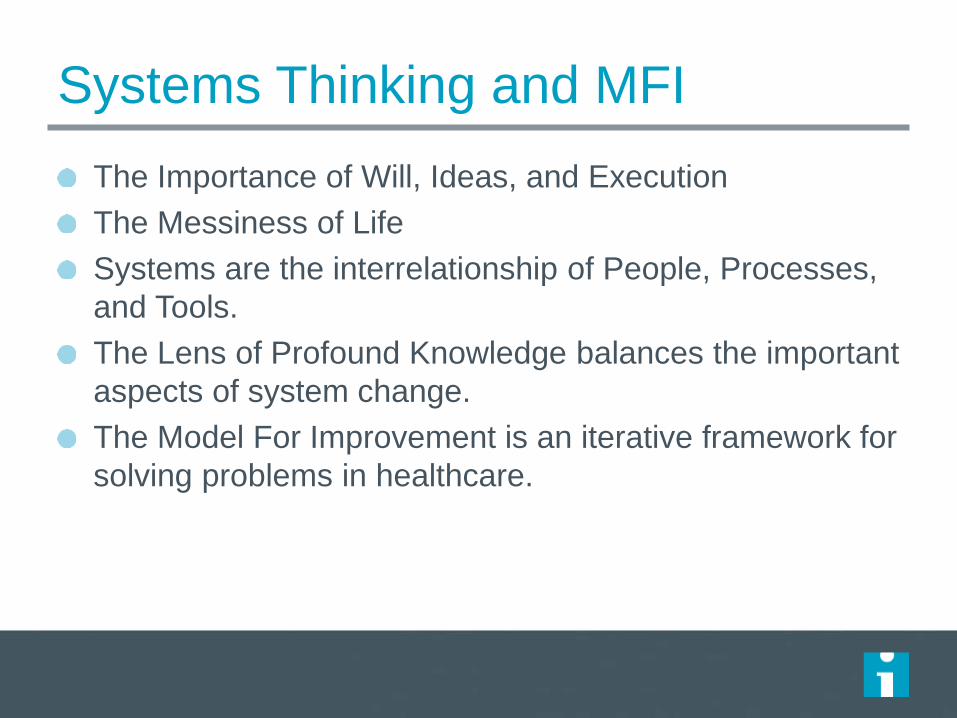
Systems Thinking and MFI
The Importance of Will, Ideas, and Execution
The Messiness of Life
Systems are the interrelationship of People, Processes,
and Tools.
The Lens of Profound Knowledge balances the important
aspects of system change.
The Model For Improvement is an iterative framework for
solving problems in healthcare.

Aim Statements
Aim statements provide the team with a shared
understanding of the scope and scale of the project.
Aim statements should include:
– the system/boundaries
– how much?
– by when
– any guidance
If at all possible, make your AIM statements about
outcomes your patient cares about.
The Charter and aim are living breathing documents.

Change Ideas
There are three ways to generate change ideas:
– View system or process
– Creativity
– Learn from others
Driver diagrams:
– Provides a theory about how you think your systems works or
changes you can make to influence the outcomes you care
about.
– You can “hang” your measures on your driver diagram.
There are may tools to prioritize change ideas once you
have a number of ideas.

Measures and Operational Definitions
It is how you know change is resulting in improvement!
A balanced set of measures.
Data collection and display depends on why you are collecting data. – Data for improvement is about learning not judgment.
Build data collection into your daily work.
Clear operational definitions ensures you are getting quality data.
QI data should be analyzed in run or control charts.
Understanding variation – common vs. special cause – allows for appropriate interpretation.

PDSA Cycle
An iterative tool for learning and accumulating
knowledge.
Start small and build degree of belief by testing in
increasing scale and under varying conditions.
PDSA cycles can and should be used for developing,
testing, implementing and spreading changes.
PDSA “ramps” are used to address changes for each
driver.
The value of failed tests cannot be underestimated!

Implementation and Spread
Make sure you are really ready for implementation and use PDSA cycles. Implementation is not the time for failure!
Sustainability requires:
– Measurement
– Ownership
– Communication and training
– Hardwiring the change
– Assessment of workload
As you spread, consider:
– The technical infrastructure issues
– Adoption or human side of change
Aligning with senior leadership and strategic goals for the organization is essential.

What questions do you have?

Thank you!
Good luck with your
Quality Journey!


![116410-PEGA-357(04P-C) Parts List [Feb-1989 ref. 16126]](https://static.fdocuments.in/doc/165x107/577c81581a28abe054ac762d/116410-pega-35704p-c-parts-list-feb-1989-ref-16126.jpg)