Bab 1 (p3)
67
© 2012 McGraw-Hill Education (Asia) Cost Behavior: Analysis and Use Chapter 3
-
Upload
kim-rae-ki -
Category
Education
-
view
82 -
download
1
Transcript of Bab 1 (p3)
© 2012 McGraw-Hill Education (Asia)
Cost Behavior: Analysis and Use
Chapter 3
McGraw-Hill Education (Asia) Garrison, Noreen, Brewer, Cheng & YuenMcGraw-Hill/Irwin Slide 2
Learning Objective 1
Understand how fixed and variable costs behave and how to use them to predict
costs.
McGraw-Hill Education (Asia) Garrison, Noreen, Brewer, Cheng & YuenMcGraw-Hill/Irwin Slide 3
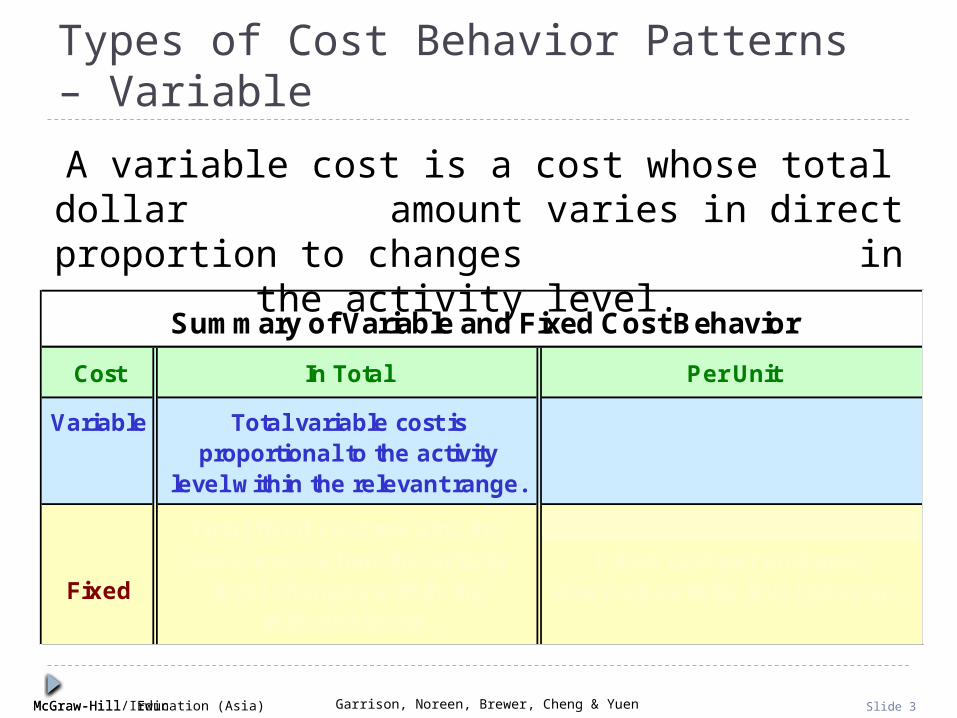
Summary of Variable and Fixed Cost Behavior
Cost In Total Per Unit
Variable Total variable cost is Variable cost per unit remainsproportional to the activity the same over wide ranges
level within the relevant range. of activity.
Total fixed cost remains thesame even when the activity Fixed cost per unit goes
Fixed level changes within the down as activity level goes up. relevant range.
A variable cost is a cost whose total dollar amount varies in direct proportion to changes
in the activity level.
Types of Cost Behavior Patterns – Variable
McGraw-Hill Education (Asia) Garrison, Noreen, Brewer, Cheng & YuenMcGraw-Hill/Irwin Slide 4
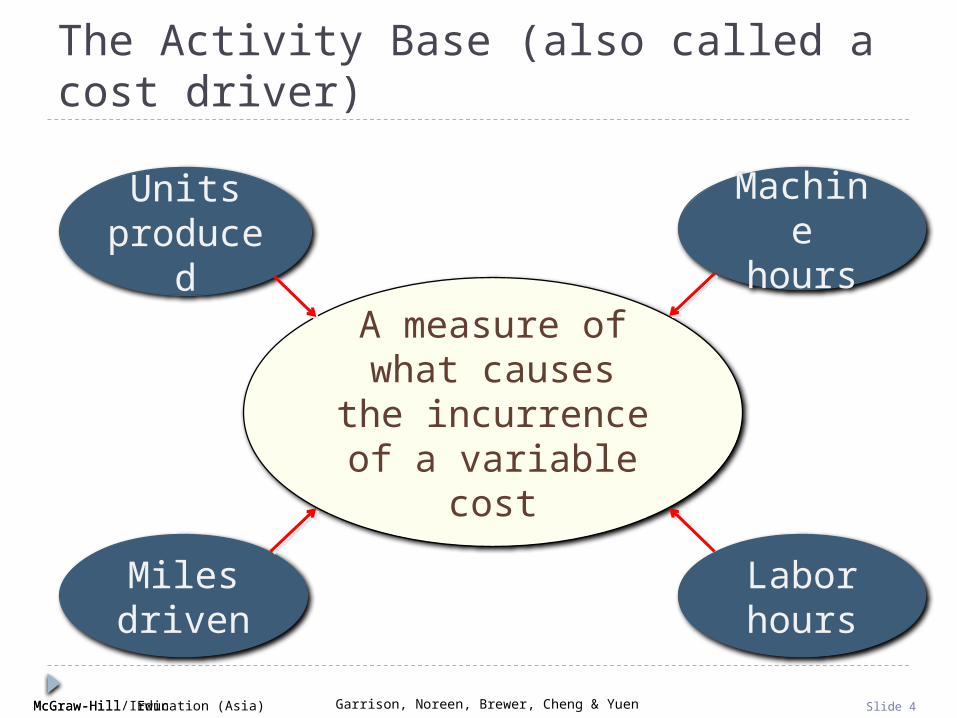
The Activity Base (also called a cost driver)
A measure of what causes the
incurrence of a variable cost
Unitsproduced
Miles driven
Machine hours
Labor hours

McGraw-Hill Education (Asia) Garrison, Noreen, Brewer, Cheng & YuenMcGraw-Hill/Irwin Slide 5
Minutes Talked
Tota
l Ove
rage
C
harg
es o
n C
ell
Pho
ne B
ill
True Variable Cost – An Example
As an example of an activity base, consider overage charges on a cell phone bill. The activity base is the number of minutes used above the
allowed minutes in the calling plan.

McGraw-Hill Education (Asia) Garrison, Noreen, Brewer, Cheng & YuenMcGraw-Hill/Irwin Slide 6
Summary of Variable and Fixed Cost Behavior
Cost In Total Per Unit
Variable Total variable cost is Variable cost per unit remainsproportional to the activity the same over wide ranges
level within the relevant range. of activity.
Total fixed cost remains thesame even when the activity Fixed cost per unit goes
Fixed level changes within the down as activity level goes up. relevant range.
Variable costs remain constant if expressed on a per unit basis.
Types of Cost Behavior Patterns – Variable
McGraw-Hill Education (Asia) Garrison, Noreen, Brewer, Cheng & YuenMcGraw-Hill/Irwin Slide 7
Minutes Talked
Per
Min
ute
Ove
rage
Cha
rge
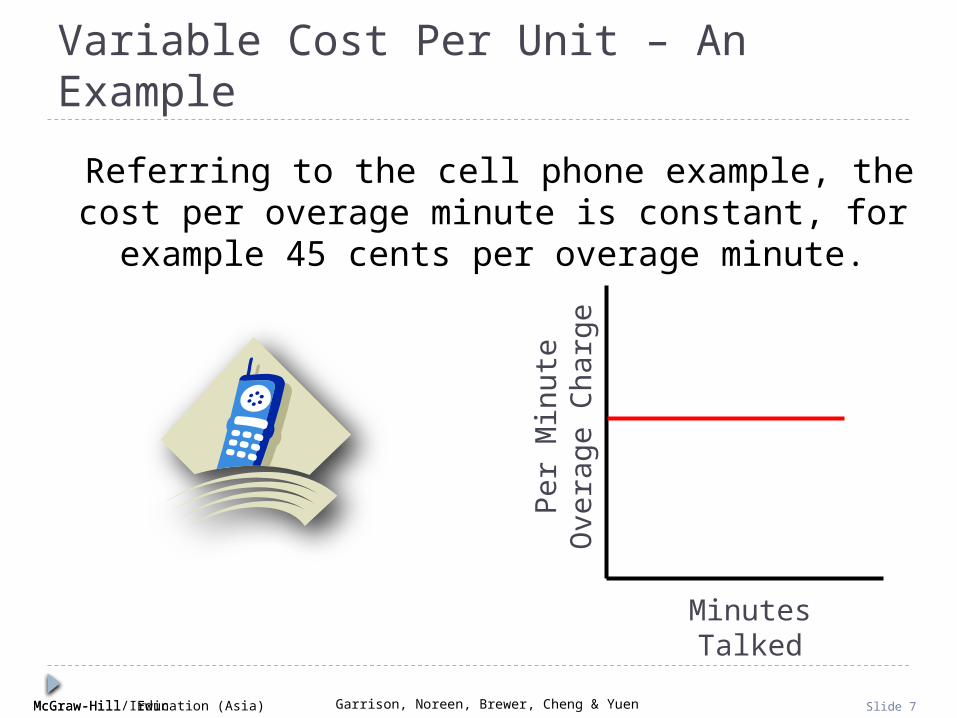
Variable Cost Per Unit – An Example
Referring to the cell phone example, the cost per overage minute is constant, for example 45 cents per
overage minute.

McGraw-Hill Education (Asia) Garrison, Noreen, Brewer, Cheng & YuenMcGraw-Hill/Irwin Slide 8
Extent of Variable CostsThe proportion of variable costs differs across organizations.
For example . . .
A public utility like Florida Power and Light,
with large investments in equipment, will tend to have
fewer variable costs.
A public utility like Florida Power and Light,
with large investments in equipment, will tend to have
fewer variable costs.
A manufacturing companylike Black and Deckerwill often have many
variable costs.
A manufacturing companylike Black and Deckerwill often have many
variable costs.
A merchandising companylike Wal-Mart
usually has a highproportion of variable costs,
like cost of sales.
A merchandising companylike Wal-Mart
usually has a highproportion of variable costs,
like cost of sales.
Some service companies have high variable costs,
while other service companies have high
fixed costs.
Some service companies have high variable costs,
while other service companies have high
fixed costs.

McGraw-Hill Education (Asia) Garrison, Noreen, Brewer, Cheng & YuenMcGraw-Hill/Irwin Slide 9
Examples of Variable Costs
1. Merchandising companies – cost of goods sold.
2. Manufacturing companies – direct materials, direct labor, and variable overhead.
3. Merchandising and manufacturing companies – commissions, shipping costs, and clerical costs such as invoicing.
4. Service companies – supplies, travel, and clerical.

McGraw-Hill Education (Asia) Garrison, Noreen, Brewer, Cheng & YuenMcGraw-Hill/Irwin Slide 10
Volume
Cos
t
True Variable Costs
The amount of a true variable cost used during the period varies in direct proportion to the activity level. The overage charge on a cell phone bill was one example of a true variable cost.
Direct material is another example of a cost that behaves in a true variable pattern.
Helen Roybark
Slide 10 NotesAdded second sentence to match Slide 10 Lecture Notes.Deleted "Now let's look at what are known as step-variable costs." Added a line between sentences.

McGraw-Hill Education (Asia) Garrison, Noreen, Brewer, Cheng & YuenMcGraw-Hill/Irwin Slide 11
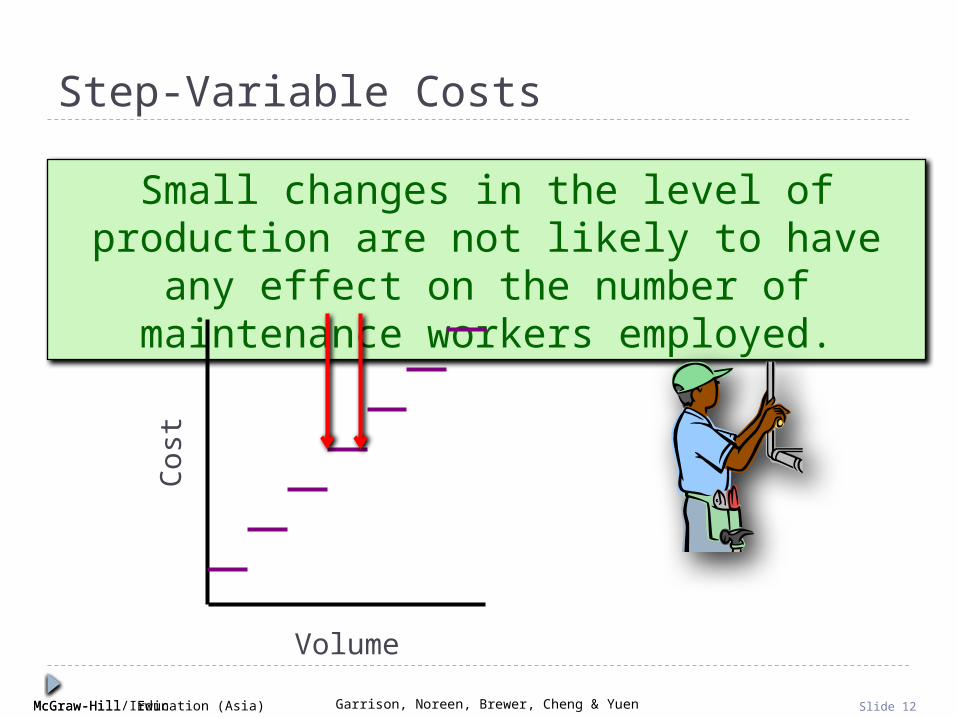
Step-Variable Costs
A step-variable cost is a resource that is obtainable only in large chunks (such as maintenance workers) and whose costs change only in response to fairly wide
changes in activity.
Volume
Cos
t
McGraw-Hill Education (Asia) Garrison, Noreen, Brewer, Cheng & YuenMcGraw-Hill/Irwin Slide 12
Step-Variable Costs
Small changes in the level of production are not likely to have any effect on the number of
maintenance workers employed.
Volume
Cos
t
McGraw-Hill Education (Asia) Garrison, Noreen, Brewer, Cheng & YuenMcGraw-Hill/Irwin Slide 13
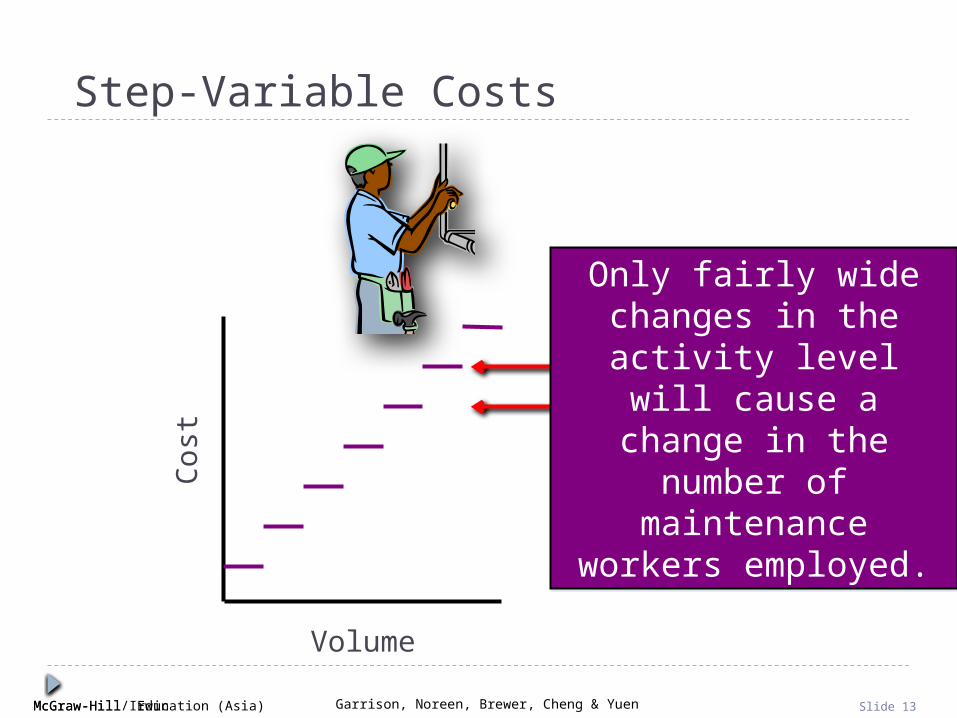
Step-Variable Costs
Volume
Cos
t
Only fairly wide changes in the activity level will cause a change in the
number of maintenance workers employed.
Only fairly wide changes in the activity level will cause a change in the
number of maintenance workers employed.

McGraw-Hill Education (Asia) Garrison, Noreen, Brewer, Cheng & YuenMcGraw-Hill/Irwin Slide 14
RelevantRange
A straight line closely
approximates a curvilinear
variable cost line within the
relevant range.
A straight line closely
approximates a curvilinear
variable cost line within the
relevant range.
Activity
Tota
l Cos
t
Economist’sCurvilinear Cost
Function
The Linearity Assumption and the Relevant Range
Accountant’s Straight-Line Approximation (constant
unit variable cost)

McGraw-Hill Education (Asia) Garrison, Noreen, Brewer, Cheng & YuenMcGraw-Hill/Irwin Slide 15
Summary of Variable and Fixed Cost Behavior
Cost In Total Per Unit
Variable Total variable cost is Variable cost per unit remainsproportional to the activity the same over wide ranges
level within the relevant range. of activity.
Total fixed costs remain thesame even when the activity Fixed cost per unit goes
Fixed level changes within the down as activity level goes up. relevant range.
A fixed cost is a cost whose total dollar amount remains constant as the activity level changes.
Types of Cost Behavior Patterns – Fixed
McGraw-Hill Education (Asia) Garrison, Noreen, Brewer, Cheng & YuenMcGraw-Hill/Irwin Slide 16
Number of Minutes Used within Monthly Plan
Mon
thly
Bas
ic
Cel
l Pho
ne B
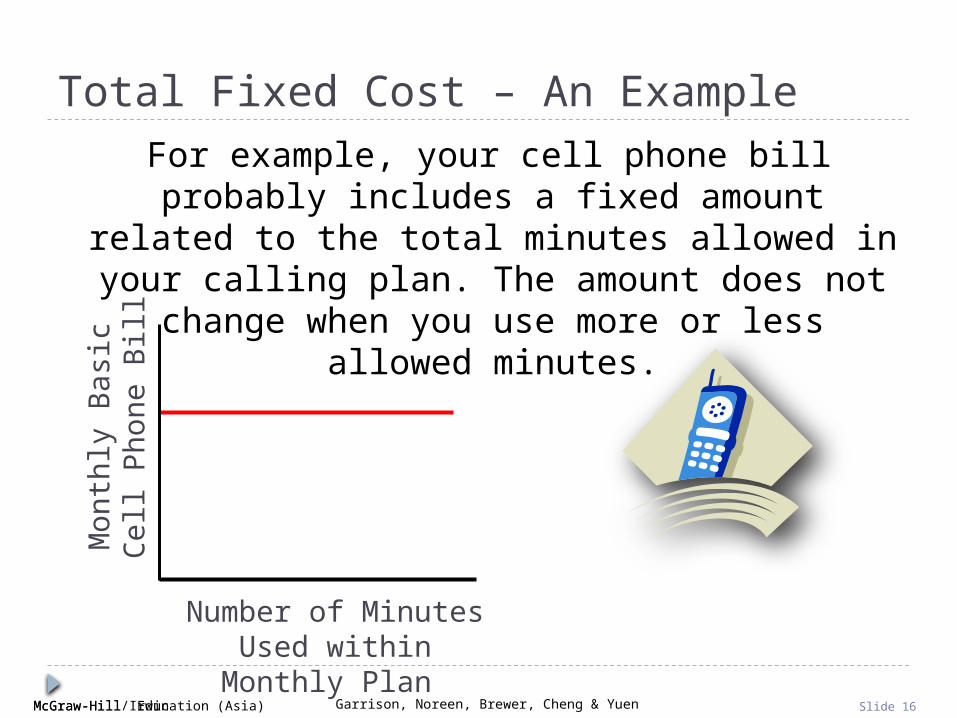
illTotal Fixed Cost – An Example
For example, your cell phone bill probably includes a fixed amount related to the total minutes allowed in
your calling plan. The amount does not change when you use more or less allowed minutes.
McGraw-Hill Education (Asia) Garrison, Noreen, Brewer, Cheng & YuenMcGraw-Hill/Irwin Slide 17
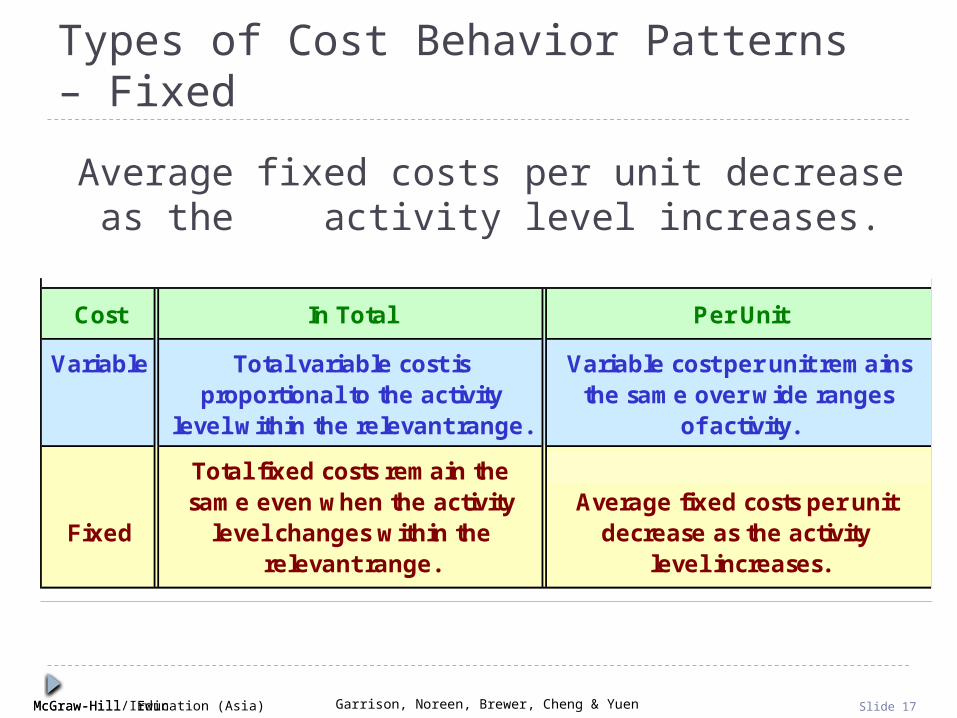
Cost In Total Per Unit
Variable Total variable cost is Variable cost per unit remainsproportional to the activity the same over wide ranges
level within the relevant range. of activity.
Total fixed costs remain thesame even when the activity Average fixed costs per unit
Fixed level changes within the decrease as the activity relevant range. level increases.
Average fixed costs per unit decrease as the activity level increases.
Types of Cost Behavior Patterns – Fixed

McGraw-Hill Education (Asia) Garrison, Noreen, Brewer, Cheng & YuenMcGraw-Hill/Irwin Slide 18
Number of Minutes Used within Monthly Plan
Cos
t Per
Cel
l Pho
ne C
all
Fixed Cost Per Unit Example
For example, the fixed cost per minute used decreases as more allowed minutes are used.
McGraw-Hill Education (Asia) Garrison, Noreen, Brewer, Cheng & YuenMcGraw-Hill/Irwin Slide 19
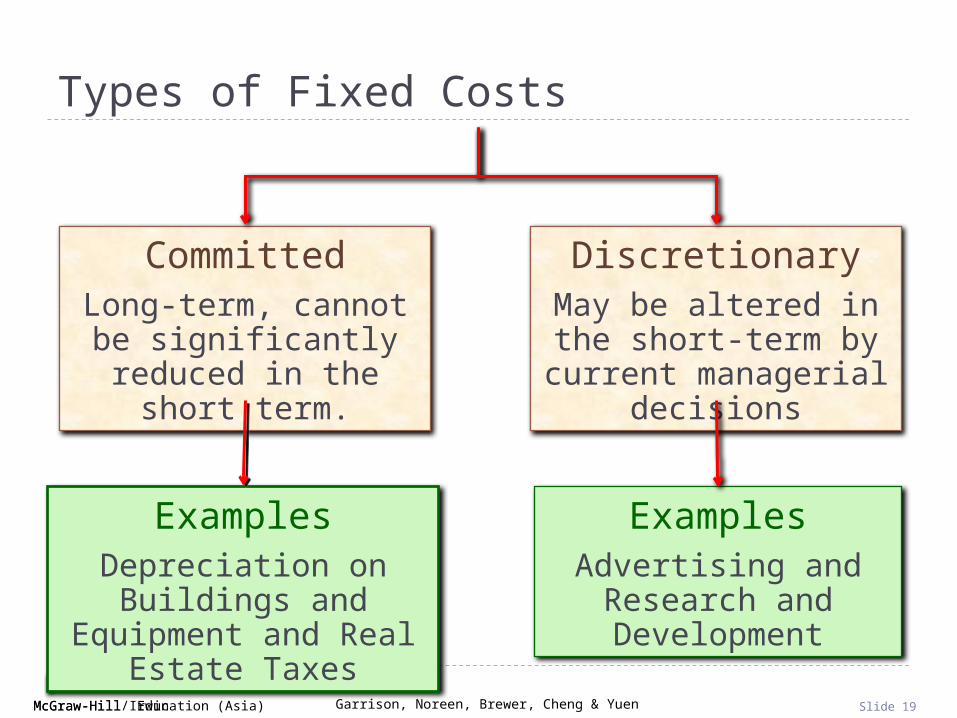
ExamplesAdvertising and Research and Development
ExamplesDepreciation on Buildings and Equipment and Real
Estate Taxes
Types of Fixed Costs
DiscretionaryMay be altered in the short-term by current managerial decisions
CommittedLong-term, cannot be
significantly reduced in the short term.

McGraw-Hill Education (Asia) Garrison, Noreen, Brewer, Cheng & YuenMcGraw-Hill/Irwin Slide 20
The Trend Toward Fixed Costs
The trend in many industries is toward greater fixed costs relative to variable costs.
As machines take overmany mundane taskspreviously performed
by humans, “knowledge workers”
are demanded fortheir minds rather
than their muscles.
Knowledge workerstend to be salaried,highly-trained and
difficult to replace. Thecost of compensating
these valued employeesis relatively fixed
rather than variable.1
McGraw-Hill Education (Asia) Garrison, Noreen, Brewer, Cheng & YuenMcGraw-Hill/Irwin Slide 21
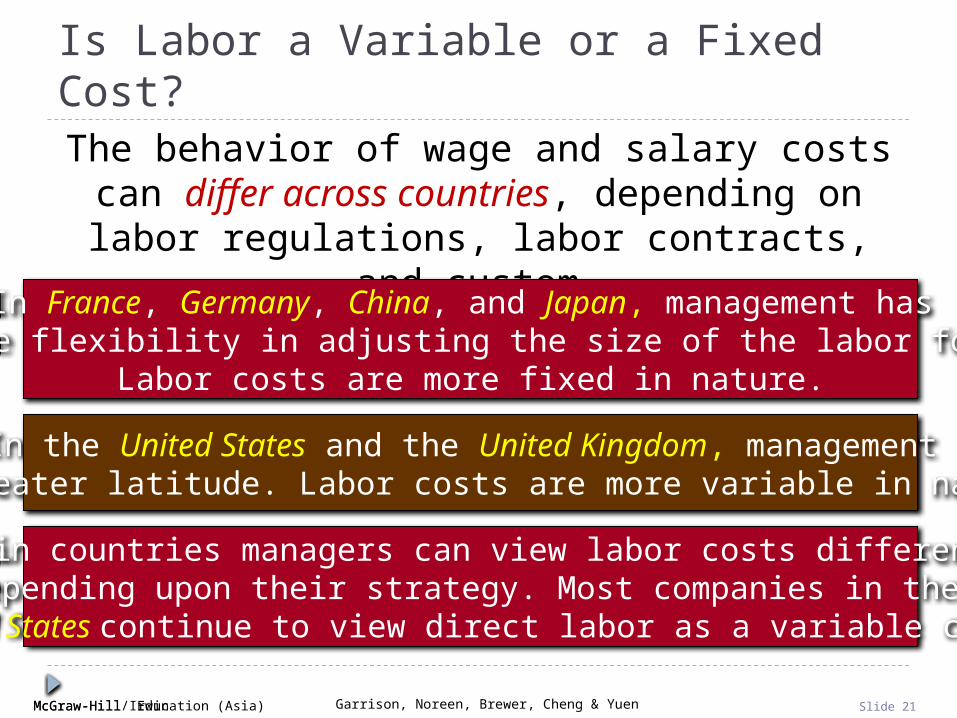
Is Labor a Variable or a Fixed Cost?The behavior of wage and salary costs can differ across countries, depending on labor regulations,
labor contracts, and custom.
In France, Germany, China, and Japan, management has little flexibility in adjusting the size of the labor force.
Labor costs are more fixed in nature.
In the United States and the United Kingdom, management has greater latitude. Labor costs are more variable in nature.
Within countries managers can view labor costs differentlydepending upon their strategy. Most companies in the
United States continue to view direct labor as a variable cost.

McGraw-Hill Education (Asia) Garrison, Noreen, Brewer, Cheng & YuenMcGraw-Hill/Irwin Slide 22
Ren
t C
ost
in T
hous
ands
of
Dol
lars
0 1,000 2,000 3,000 Rented Area (Square Feet)
0
30
60
Fixed Costs and the Relevant Range
90
Relevant
Range
The relevant range of activity for a fixed cost is the range of activity over which the graph of the
cost is flat.
McGraw-Hill Education (Asia) Garrison, Noreen, Brewer, Cheng & YuenMcGraw-Hill/Irwin Slide 23
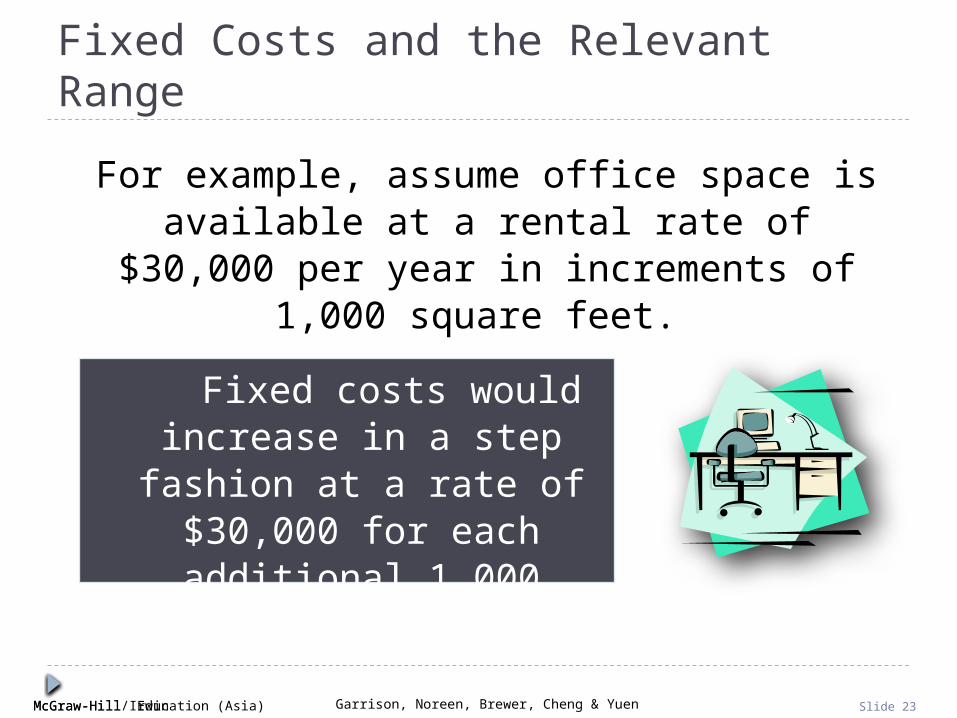
Fixed Costs and the Relevant Range
Fixed costs would increase in a step fashion at a rate of $30,000 for each additional
1,000 square feet.
For example, assume office space is available at a rental rate of $30,000 per year in increments of
1,000 square feet.
McGraw-Hill Education (Asia) Garrison, Noreen, Brewer, Cheng & YuenMcGraw-Hill/Irwin Slide 24
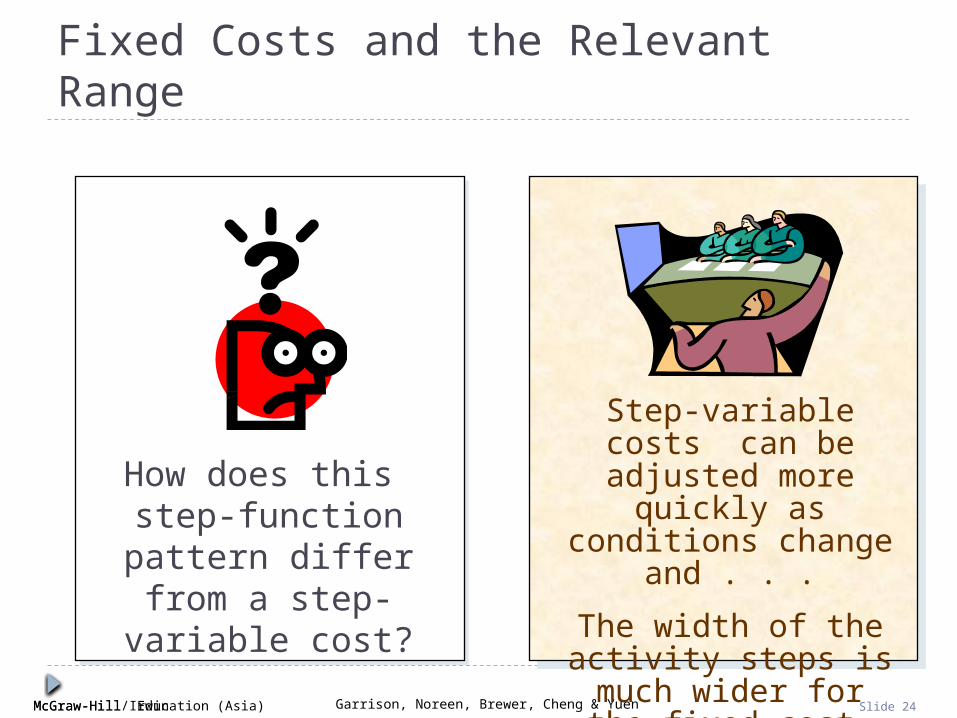
How does this step-function
pattern differ from a step-variable cost?
Step-variable costs can be adjusted more quickly as conditions
change and . . .
The width of the activity steps is much wider for
the fixed cost.
Fixed Costs and the Relevant Range
McGraw-Hill Education (Asia) Garrison, Noreen, Brewer, Cheng & YuenMcGraw-Hill/Irwin Slide 25
Quick Check
Which of the following statements about cost behavior are true?
a. Fixed costs per unit vary with the level of activity.
b. Variable costs per unit are constant within the relevant range.
c. Total fixed costs are constant within the relevant range.
d. Total variable costs are constant within the relevant range.
McGraw-Hill Education (Asia) Garrison, Noreen, Brewer, Cheng & YuenMcGraw-Hill/Irwin Slide 26
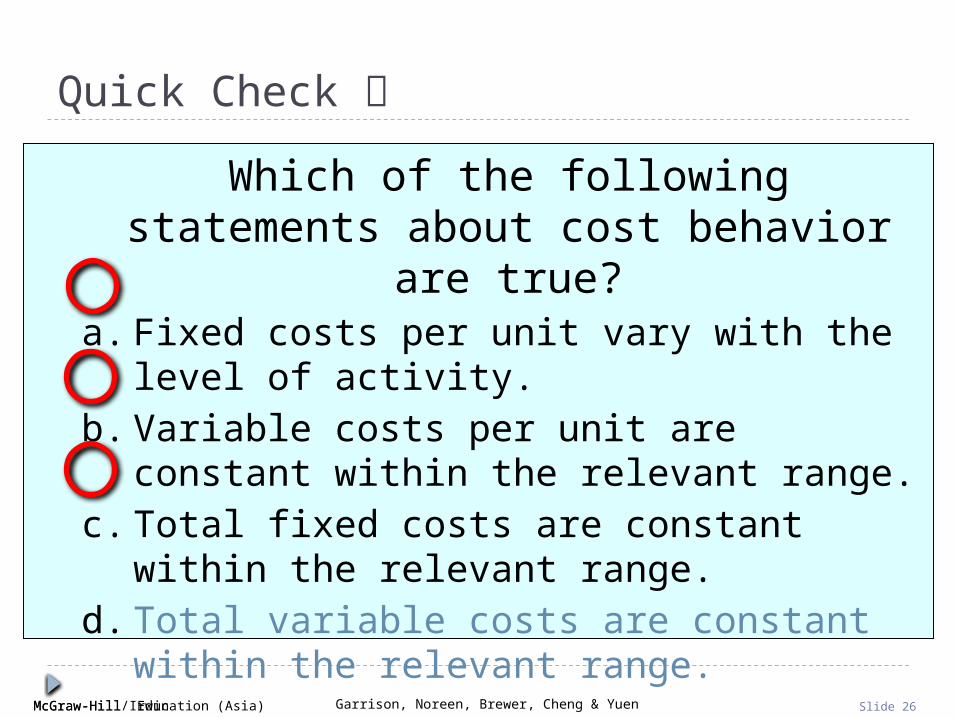
Which of the following statements about cost behavior are true?
a. Fixed costs per unit vary with the level of activity.
b. Variable costs per unit are constant within the relevant range.
c. Total fixed costs are constant within the relevant range.
d. Total variable costs are constant within the relevant range.
Quick Check
Helen Roybark
Slide 26 NotesChanged the notes to read "Answer d" and added commas after the words "increases, "range," and "decreases."
McGraw-Hill Education (Asia) Garrison, Noreen, Brewer, Cheng & YuenMcGraw-Hill/Irwin Slide 27
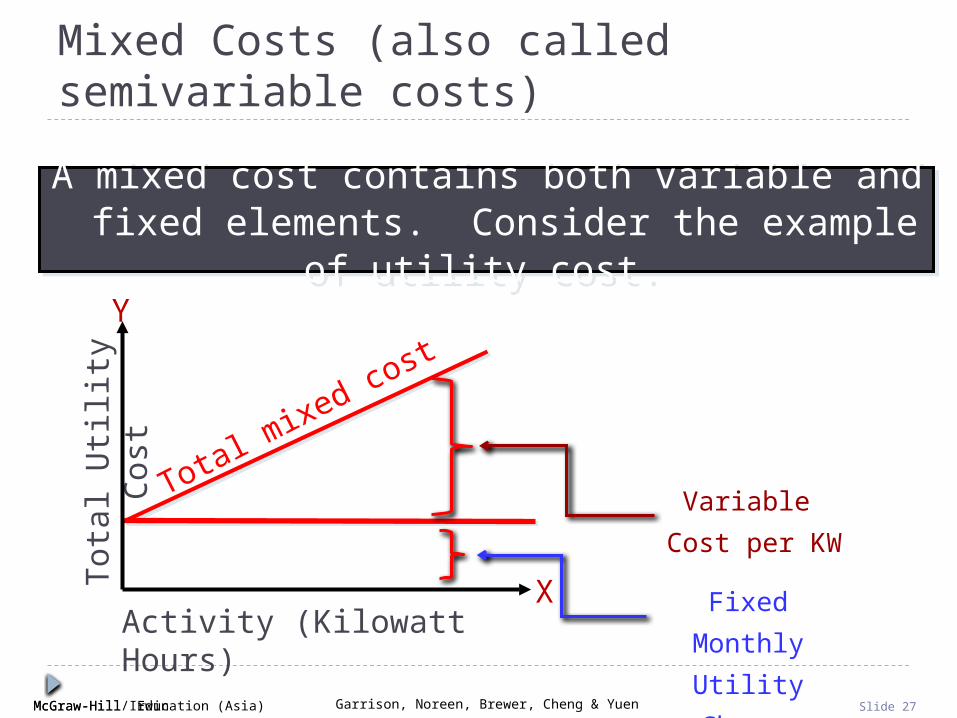
Fixed Monthly
Utility Charge
Variable
Cost per KW
Activity (Kilowatt Hours)
Tota
l Util
ity C
ost
X
Y
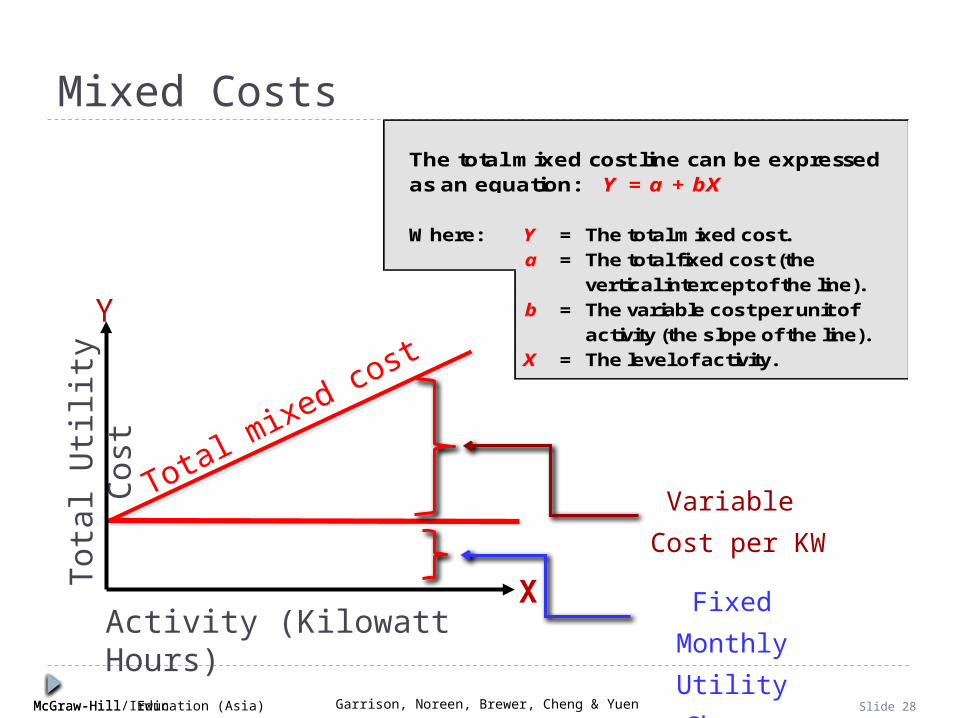
A mixed cost contains both variable and fixed elements. Consider the example of utility cost. A mixed cost contains both variable and fixed elements. Consider the example of utility cost.
Mixed Costs (also called semivariable costs)
Total mixed cost
McGraw-Hill Education (Asia) Garrison, Noreen, Brewer, Cheng & YuenMcGraw-Hill/Irwin Slide 28
Mixed Costs The total mixed cost line can be expressed as an equation: Y = a + bX
Where: Y = The total mixed cost.
a = The total fixed cost (the
vertical intercept of the line).
b = The variable cost per unit of
activity (the slope of the line).
X = The level of activity.
Fixed Monthly
Utility Charge
Variable
Cost per KW
Activity (Kilowatt Hours)
Tota
l Util
ity C
ost
X
Y
Total mixed cost

McGraw-Hill Education (Asia) Garrison, Noreen, Brewer, Cheng & YuenMcGraw-Hill/Irwin Slide 29
Mixed Costs – An Example
If your fixed monthly utility charge is $40, your variable cost is $0.03 per kilowatt hour, and your
monthly activity level is 2,000 kilowatt hours, what is the amount of your utility bill?
If your fixed monthly utility charge is $40, your variable cost is $0.03 per kilowatt hour, and your
monthly activity level is 2,000 kilowatt hours, what is the amount of your utility bill?
Y = a + bX
Y = $40 + ($0.03 × 2,000)
Y = $100

McGraw-Hill Education (Asia) Garrison, Noreen, Brewer, Cheng & YuenMcGraw-Hill/Irwin Slide 30
Analysis of Mixed Costs
In account analysis, each account is classified as either variable or fixed based
on the analyst’s knowledge of how the account behaves.
In account analysis, each account is classified as either variable or fixed based
on the analyst’s knowledge of how the account behaves.
The engineering approach classifies costs based upon an industrial
engineer’s evaluation of production methods, and material, labor and
overhead requirements.
The engineering approach classifies costs based upon an industrial
engineer’s evaluation of production methods, and material, labor and
overhead requirements.
Account Analysis and the Engineering ApproachAccount Analysis and the Engineering Approach

McGraw-Hill Education (Asia) Garrison, Noreen, Brewer, Cheng & YuenMcGraw-Hill/Irwin Slide 31
Why and how to reduce fixed costs or switch them to variable costs?
Typical fixed costs: production facilities, rentals, employees salaries and related benefits and utilities
Converting them into variable may reduce risk of financial commitment and provide flexibility of capacity utilisation
Outsourcing Business with fast and regular change and/or large varieties of
products most likely will benefit from this approach e.g. Nike and Apple
Non-core business functions with lower value-add to majority customers e.g. call centers for enquiries, 3rd party logistics, broker-dealers’ securities back office operations
Offshoring Honda and Toyota Thailand plants HSBC back office functions in China

McGraw-Hill Education (Asia) Garrison, Noreen, Brewer, Cheng & YuenMcGraw-Hill/Irwin Slide 32
Learning Objective 2
Use a scattergraph plot to diagnose cost behavior.

McGraw-Hill Education (Asia) Garrison, Noreen, Brewer, Cheng & YuenMcGraw-Hill/Irwin Slide 33
Plot the data points on a graph (Total Cost Y vs. Activity X).
Plot the data points on a graph (Total Cost Y vs. Activity X).
0 1 2 3 4
*
Mai
nten
ance
Cos
t1,
000’
s of
Dol
lars
10
20
0
***
**
**
*
*
Patient-days in 1,000’s
X
Y
The Scattergraph Method

McGraw-Hill Education (Asia) Garrison, Noreen, Brewer, Cheng & YuenMcGraw-Hill/Irwin Slide 34
The Scattergraph Method
Draw a line through the data points with about anequal numbers of points above and below the line. Draw a line through the data points with about an
equal numbers of points above and below the line.
0 1 2 3 4
*
Mai
nten
ance
Cos
t1,
000’
s of
Dol
lars
10
20
0
***
**
**
*
*
Patient-days in 1,000’s
X
Y
McGraw-Hill Education (Asia) Garrison, Noreen, Brewer, Cheng & YuenMcGraw-Hill/Irwin Slide 35
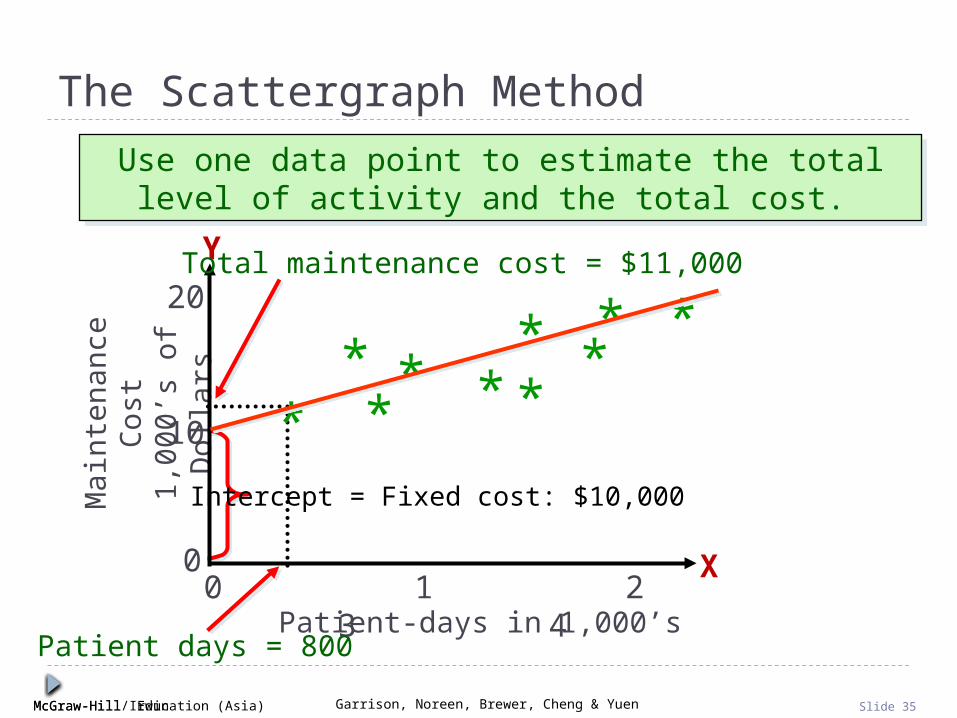
The Scattergraph Method
Use one data point to estimate the total level of activity and the total cost.
Use one data point to estimate the total level of activity and the total cost.
Intercept = Fixed cost: $10,000
0 1 2 3 4
*
Mai
nten
ance
Cos
t1,
000’
s of
Dol
lars
10
20
0
***
**
**
*
*
Patient-days in 1,000’s
X
Y
Patient days = 800
Total maintenance cost = $11,000
McGraw-Hill Education (Asia) Garrison, Noreen, Brewer, Cheng & YuenMcGraw-Hill/Irwin Slide 36
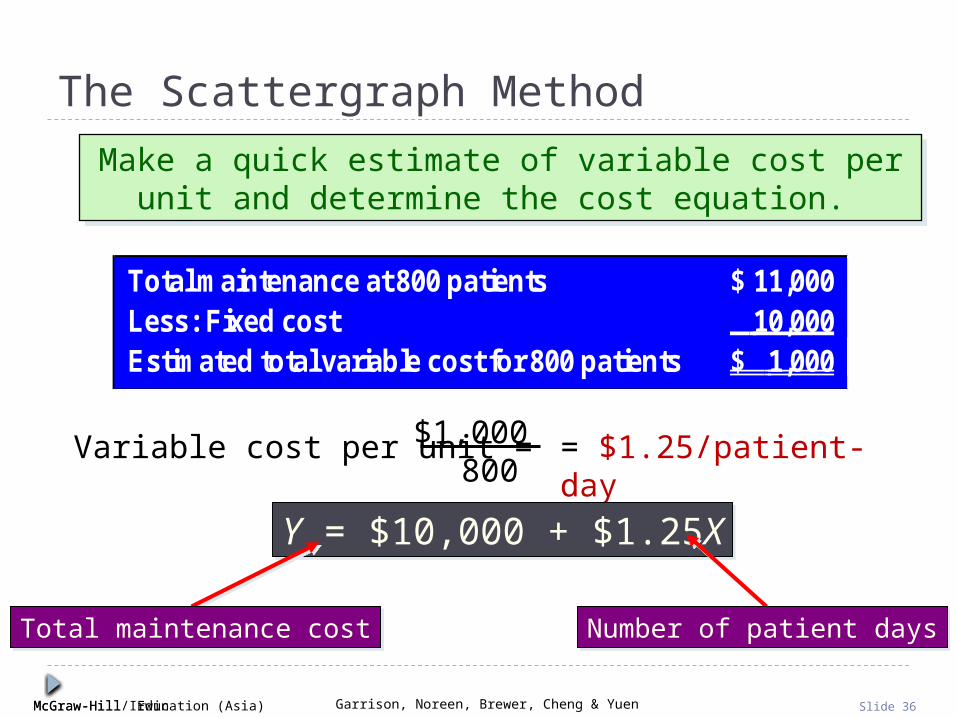
The Scattergraph Method
Make a quick estimate of variable cost per unit and determine the cost equation.
Make a quick estimate of variable cost per unit and determine the cost equation.
Variable cost per unit = $1,000 800
= $1.25/patient-day
Y = $10,000 + $1.25XY = $10,000 + $1.25X
Total maintenance at 800 patients 11,000$ Less: Fixed cost 10,000 Estimated total variable cost for 800 patients 1,000$
Total maintenance costTotal maintenance cost Number of patient daysNumber of patient days
McGraw-Hill Education (Asia) Garrison, Noreen, Brewer, Cheng & YuenMcGraw-Hill/Irwin Slide 37
Learning Objective 3
Analyze a mixed cost using the high-low method.

McGraw-Hill Education (Asia) Garrison, Noreen, Brewer, Cheng & YuenMcGraw-Hill/Irwin Slide 38
The High-Low Method – An Example
Assume the following hours of maintenance work and the total maintenance costs for six months.

McGraw-Hill Education (Asia) Garrison, Noreen, Brewer, Cheng & YuenMcGraw-Hill/Irwin Slide 39
The High-Low Method – An Example
The variable cost per hour of
maintenance is equal to the change
in cost divided by the change in hours.
The variable cost per hour of
maintenance is equal to the change
in cost divided by the change in hours.
= $6.00/hour$2,400
400
McGraw-Hill Education (Asia) Garrison, Noreen, Brewer, Cheng & YuenMcGraw-Hill/Irwin Slide 40
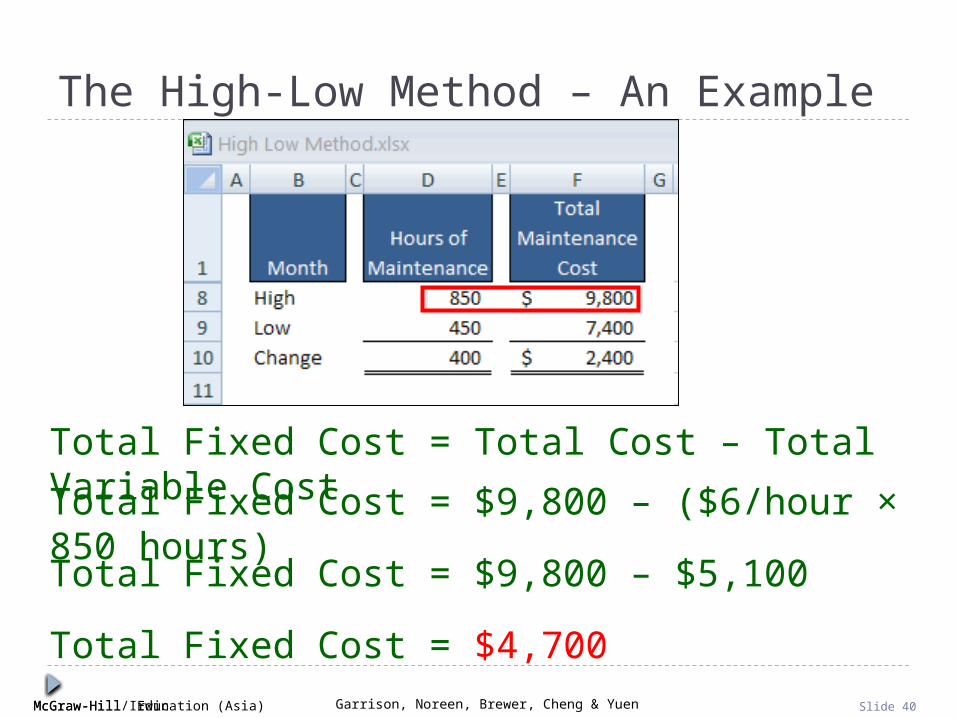
The High-Low Method – An Example
Total Fixed Cost = Total Cost – Total Variable Cost
Total Fixed Cost = $9,800 – ($6/hour × 850 hours)
Total Fixed Cost = $9,800 – $5,100
Total Fixed Cost = $4,700

McGraw-Hill Education (Asia) Garrison, Noreen, Brewer, Cheng & YuenMcGraw-Hill/Irwin Slide 41
The High-Low Method – An Example
Y = $4,700 + $6.00XThe Cost Equation for Maintenance

McGraw-Hill Education (Asia) Garrison, Noreen, Brewer, Cheng & YuenMcGraw-Hill/Irwin Slide 42
Quick Check
Sales salaries and commissions are $10,000 when 80,000 units are sold, and $14,000 when 120,000 units are sold. Using the high-low method, what is the variable portion of sales salaries and commission?
a. $0.08 per unit
b. $0.10 per unit
c. $0.12 per unit
d. $0.125 per unit
Sales salaries and commissions are $10,000 when 80,000 units are sold, and $14,000 when 120,000 units are sold. Using the high-low method, what is the variable portion of sales salaries and commission?
a. $0.08 per unit
b. $0.10 per unit
c. $0.12 per unit
d. $0.125 per unit
McGraw-Hill Education (Asia) Garrison, Noreen, Brewer, Cheng & YuenMcGraw-Hill/Irwin Slide 43
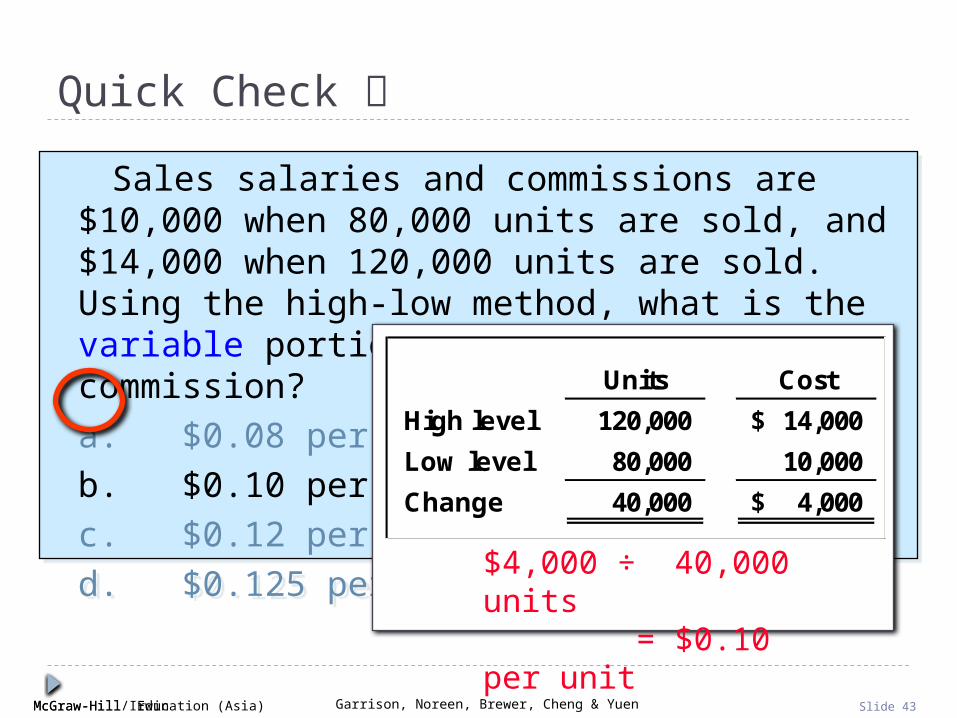
Sales salaries and commissions are $10,000 when 80,000 units are sold, and $14,000 when 120,000 units are sold. Using the high-low method, what is the variable portion of sales salaries and commission?
a. $0.08 per unit
b. $0.10 per unit
c. $0.12 per unit
d. $0.125 per unit
Sales salaries and commissions are $10,000 when 80,000 units are sold, and $14,000 when 120,000 units are sold. Using the high-low method, what is the variable portion of sales salaries and commission?
a. $0.08 per unit
b. $0.10 per unit
c. $0.12 per unit
d. $0.125 per unit
Quick Check
$4,000 ÷ 40,000 units = $0.10 per unit
Units Cost
High level 120,000 14,000$
Low level 80,000 10,000
Change 40,000 4,000$

McGraw-Hill Education (Asia) Garrison, Noreen, Brewer, Cheng & YuenMcGraw-Hill/Irwin Slide 44
Quick Check
Sales salaries and commissions are $10,000 when 80,000 units are sold, and $14,000 when 120,000 units are sold. Using the high-low method, what is the fixed portion of sales salaries and commissions?
a. $ 2,000
b. $ 4,000
c. $10,000
d. $12,000
Sales salaries and commissions are $10,000 when 80,000 units are sold, and $14,000 when 120,000 units are sold. Using the high-low method, what is the fixed portion of sales salaries and commissions?
a. $ 2,000
b. $ 4,000
c. $10,000
d. $12,000
McGraw-Hill Education (Asia) Garrison, Noreen, Brewer, Cheng & YuenMcGraw-Hill/Irwin Slide 45
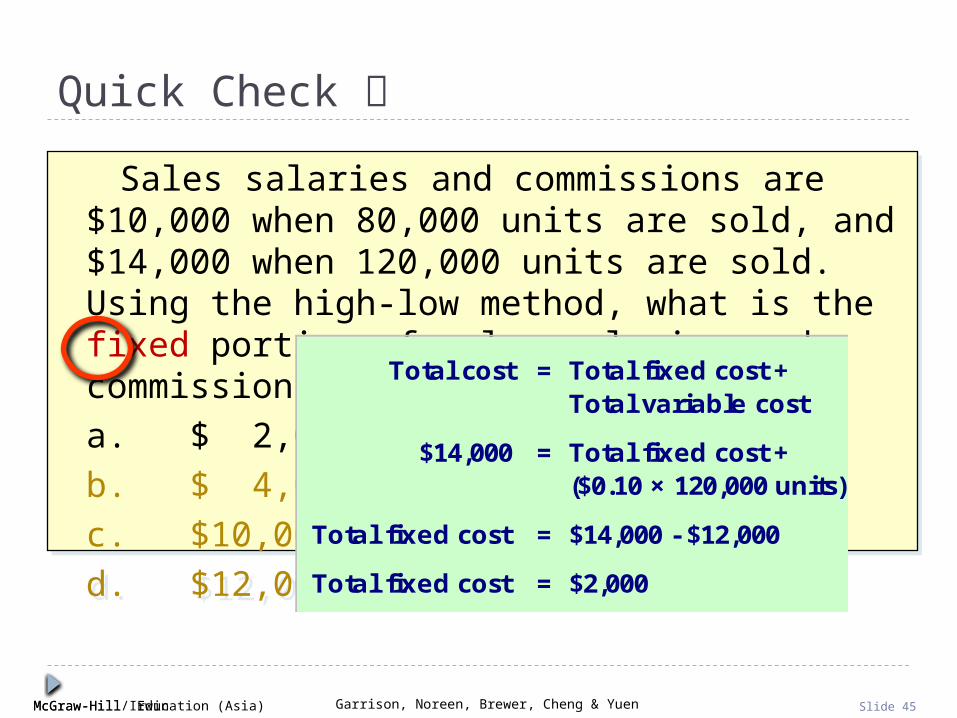
Sales salaries and commissions are $10,000 when 80,000 units are sold, and $14,000 when 120,000 units are sold. Using the high-low method, what is the fixed portion of sales salaries and commissions?
a. $ 2,000
b. $ 4,000
c. $10,000
d. $12,000
Sales salaries and commissions are $10,000 when 80,000 units are sold, and $14,000 when 120,000 units are sold. Using the high-low method, what is the fixed portion of sales salaries and commissions?
a. $ 2,000
b. $ 4,000
c. $10,000
d. $12,000
Quick Check
Total cost = Total fixed cost + Total variable cost
$14,000 = Total fixed cost +($0.10 × 120,000 units)
Total fixed cost = $14,000 - $12,000
Total fixed cost = $2,000

McGraw-Hill Education (Asia) Garrison, Noreen, Brewer, Cheng & YuenMcGraw-Hill/Irwin Slide 46
Least-Squares Regression Method
A method used to analyze mixed costs if a scattergraph plot reveals an approximately linear
relationship between the X and Y variables.
This method uses all of thedata points to estimatethe fixed and variablecost components of a
mixed cost.
This method uses all of thedata points to estimatethe fixed and variablecost components of a
mixed cost.The goal of this method isto fit a straight line to thedata that minimizes the
sum of the squared errors.
The goal of this method isto fit a straight line to thedata that minimizes the
sum of the squared errors.
McGraw-Hill Education (Asia) Garrison, Noreen, Brewer, Cheng & YuenMcGraw-Hill/Irwin Slide 47
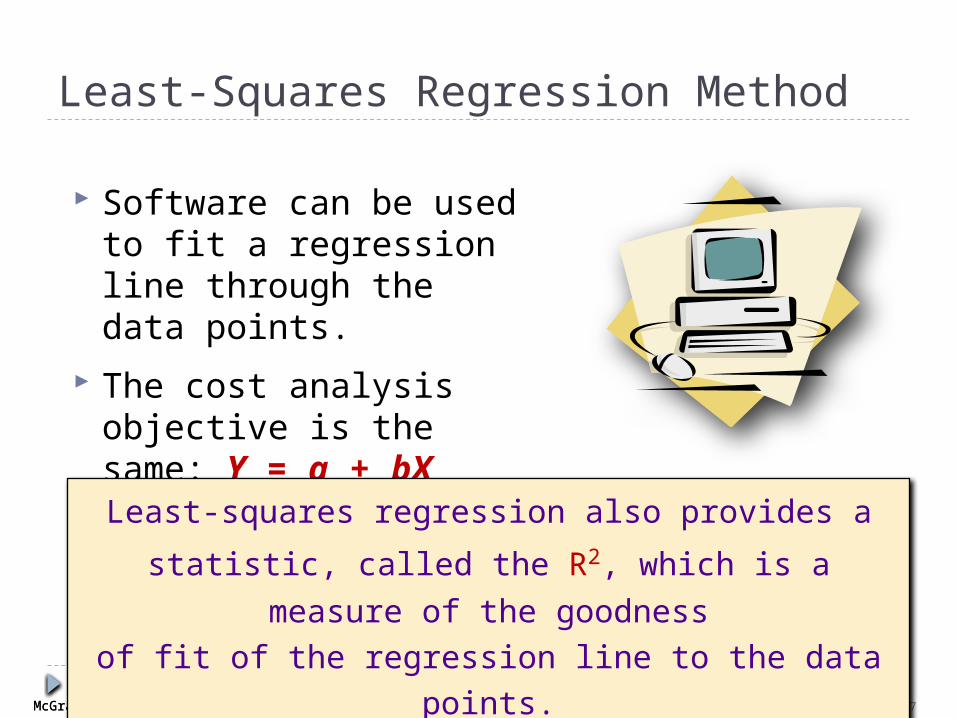
Least-Squares Regression Method
Software can be used to fit a regression line through the data points.
The cost analysis objective is the same: Y = a + bX
Least-squares regression also provides a statistic, called
the R2, which is a measure of the goodness
of fit of the regression line to the data points.
McGraw-Hill Education (Asia) Garrison, Noreen, Brewer, Cheng & YuenMcGraw-Hill/Irwin Slide 48
0 1 2 3 4
Tota
l Cos
t
10
20
0
Activity
****
**
****
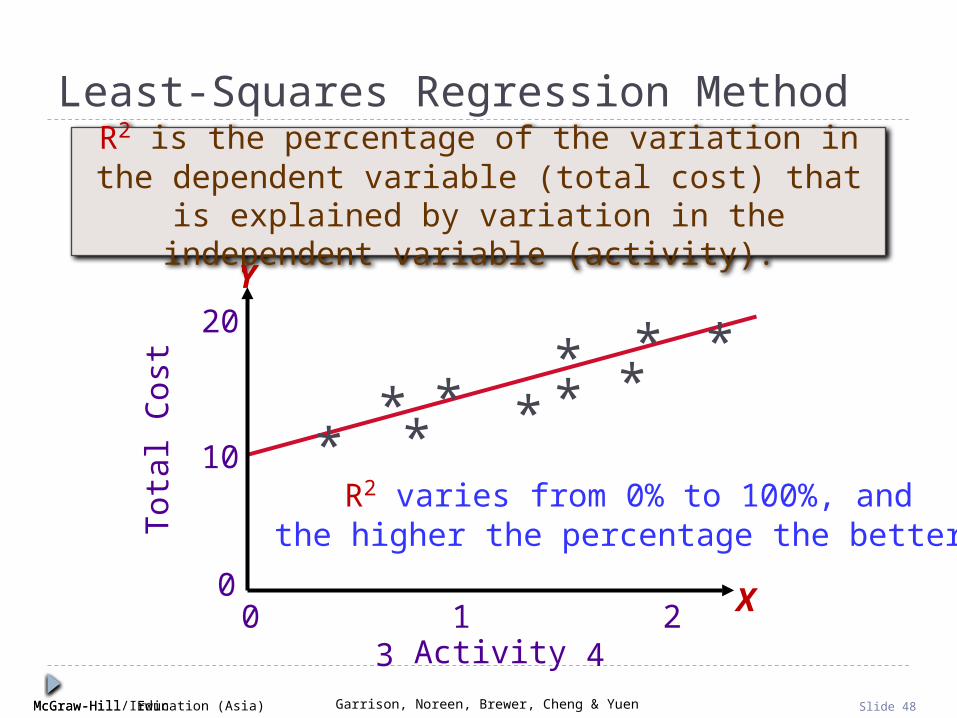
Least-Squares Regression Method
R2 is the percentage of the variation in the dependent variable (total cost) that is explained by variation in the
independent variable (activity).
R2 varies from 0% to 100%, andthe higher the percentage the better.
X
Y
McGraw-Hill Education (Asia) Garrison, Noreen, Brewer, Cheng & YuenMcGraw-Hill/Irwin Slide 49
Comparing Results From the Three Methods
The three methods just discussed provide slightly different estimates of the fixed and
variable cost components of the mixed cost.
This is to be expected because each method uses differing amounts of the data points to
provide estimates.
Least-squares regression provides the most accurate estimate because it uses all the data
points.
McGraw-Hill Education (Asia) Garrison, Noreen, Brewer, Cheng & YuenMcGraw-Hill/Irwin Slide 50
Learning Objective 4
Prepare an income statement using the contribution format.

McGraw-Hill Education (Asia) Garrison, Noreen, Brewer, Cheng & YuenMcGraw-Hill/Irwin Slide 51
Let’s put our knowledge of cost behavior to work
by preparing a contribution
format income statement.
The Contribution Format

McGraw-Hill Education (Asia) Garrison, Noreen, Brewer, Cheng & YuenMcGraw-Hill/Irwin Slide 52
The Contribution Format
Total Unit
Sales Revenue 100,000$ 50$
Less: Variable costs 60,000 30
Contribution margin 40,000$ 20$
Less: Fixed costs 30,000
Net operating income 10,000$
The contribution margin format emphasizes cost behavior. Contribution margin covers fixed costs
and provides for income.
The contribution margin format emphasizes cost behavior. Contribution margin covers fixed costs
and provides for income.
McGraw-Hill Education (Asia) Garrison, Noreen, Brewer, Cheng & YuenMcGraw-Hill/Irwin Slide 53
Uses of the Contribution Format
The contribution income statement format is used as an internal planning and decision-making tool.
We will use this approach for:
1.Cost-volume-profit analysis (Chapter 4).
2.Budgeting (Chapter 10).
3.Segmented reporting of profit data (Chapter 13).
4.Special decisions such as pricing and make-or-buy analysis (Chapter 14).

McGraw-Hill Education (Asia) Garrison, Noreen, Brewer, Cheng & YuenMcGraw-Hill/Irwin Slide 54
The Contribution Format
Comparison of the Contribution Income Statement with the Traditional Income Statement
Traditional Approach Contribution Approach (costs organized by function ) (costs organized by behavior )
Sales 100,000$ Sales 100,000$ Less cost of goods sold 70,000 Less variable expenses 60,000 Gross margin 30,000$ Contribution margin 40,000$ Less operating expenses 20,000 Less fixed expenses 30,000 Net operating income 10,000$ Net operating income 10,000$
Used primarily forexternal reporting.
Used primarily bymanagement.
© 2012 McGraw-Hill Education (Asia)
Least-Squares Regression Computations
Appendix 3A

McGraw-Hill Education (Asia) Garrison, Noreen, Brewer, Cheng & YuenMcGraw-Hill/Irwin Slide 56
Learning Objective 5
Analyze a mixed cost using the least-squares
regression method.

McGraw-Hill Education (Asia) Garrison, Noreen, Brewer, Cheng & YuenMcGraw-Hill/Irwin Slide 57
Simple Regression Analysis – An Example
Matrix, Inc. wants to know its average
fixed cost and variable cost per unit.
Using the data to the right, let’s see how to do a regression using
Microsoft Excel.
Matrix, Inc. wants to know its average
fixed cost and variable cost per unit.
Using the data to the right, let’s see how to do a regression using
Microsoft Excel.
McGraw-Hill Education (Asia) Garrison, Noreen, Brewer, Cheng & YuenMcGraw-Hill/Irwin Slide 58
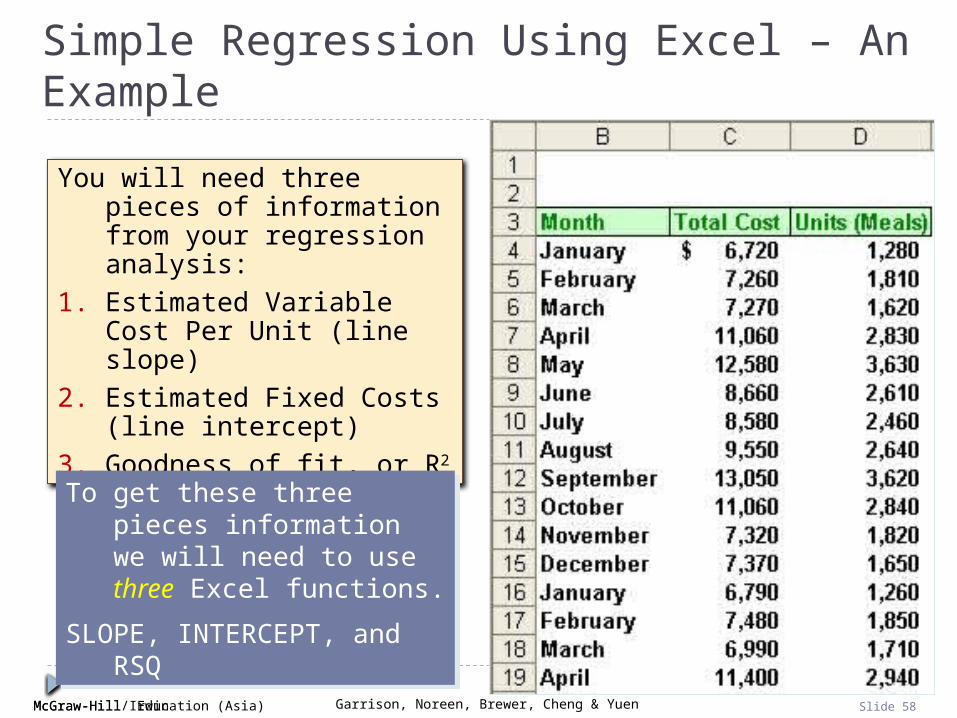
Simple Regression Using Excel – An Example
You will need three pieces of information from your regression analysis:
1. Estimated Variable Cost Per Unit (line slope)
2. Estimated Fixed Costs (line intercept)
3. Goodness of fit, or R2
To get these three pieces information we will need to use three Excel functions.
SLOPE, INTERCEPT, and RSQ
To get these three pieces information we will need to use three Excel functions.
SLOPE, INTERCEPT, and RSQ
McGraw-Hill Education (Asia) Garrison, Noreen, Brewer, Cheng & YuenMcGraw-Hill/Irwin Slide 59
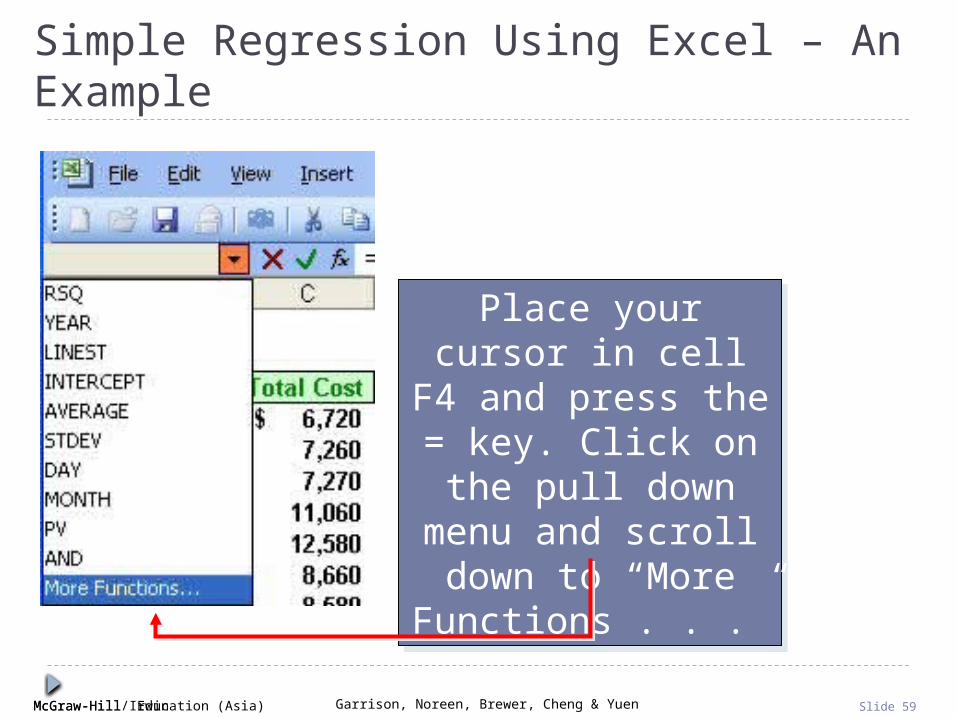
Simple Regression Using Excel – An Example
Place your cursor in cell F4 and press the
= key. Click on the pull down menu and scroll down to “More
Functions . . .”
Place your cursor in cell F4 and press the
= key. Click on the pull down menu and scroll down to “More
Functions . . .”

McGraw-Hill Education (Asia) Garrison, Noreen, Brewer, Cheng & YuenMcGraw-Hill/Irwin Slide 60
Scroll down to the “Statistical”,
functions. Now scroll down the
statistical functions until you
highlight “SLOPE”
Simple Regression Using Excel – An Example
McGraw-Hill Education (Asia) Garrison, Noreen, Brewer, Cheng & YuenMcGraw-Hill/Irwin Slide 61
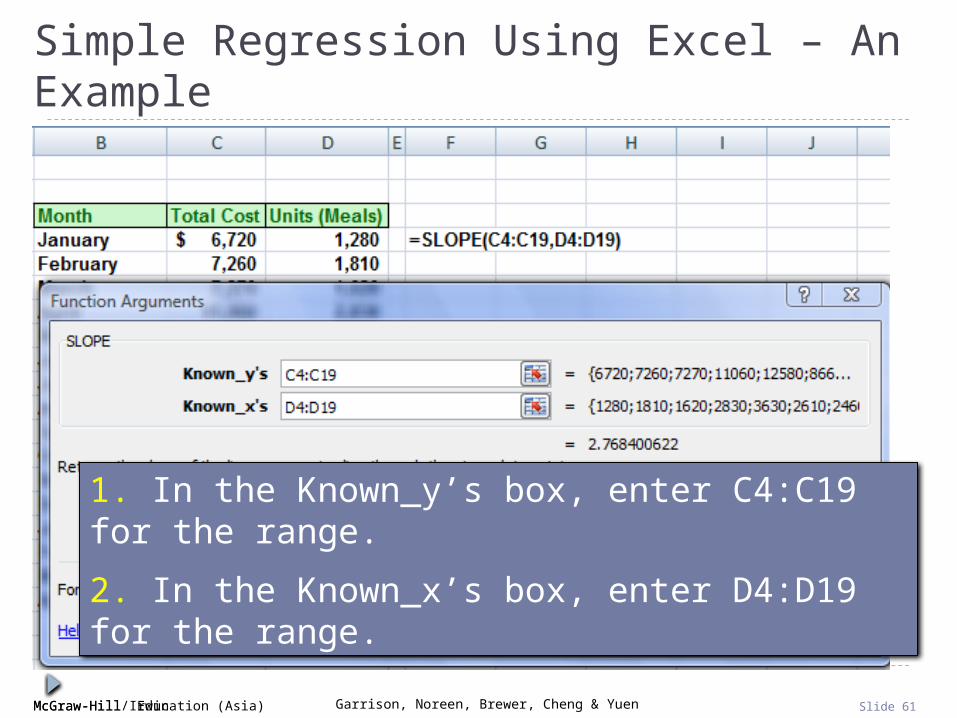
1. In the Known_y’s box, enter C4:C19 for the range.
2. In the Known_x’s box, enter D4:D19 for the range.
Simple Regression Using Excel – An Example
McGraw-Hill Education (Asia) Garrison, Noreen, Brewer, Cheng & YuenMcGraw-Hill/Irwin Slide 62
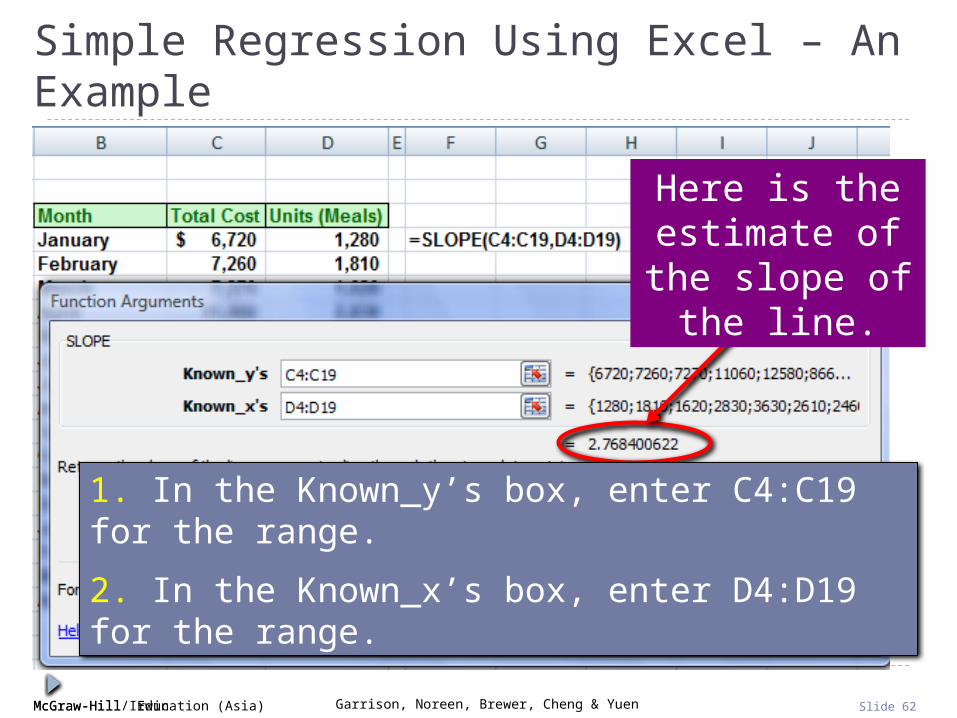
Here is the estimate of the
slope of the line.
Simple Regression Using Excel – An Example
1. In the Known_y’s box, enter C4:C19 for the range.
2. In the Known_x’s box, enter D4:D19 for the range.
McGraw-Hill Education (Asia) Garrison, Noreen, Brewer, Cheng & YuenMcGraw-Hill/Irwin Slide 63
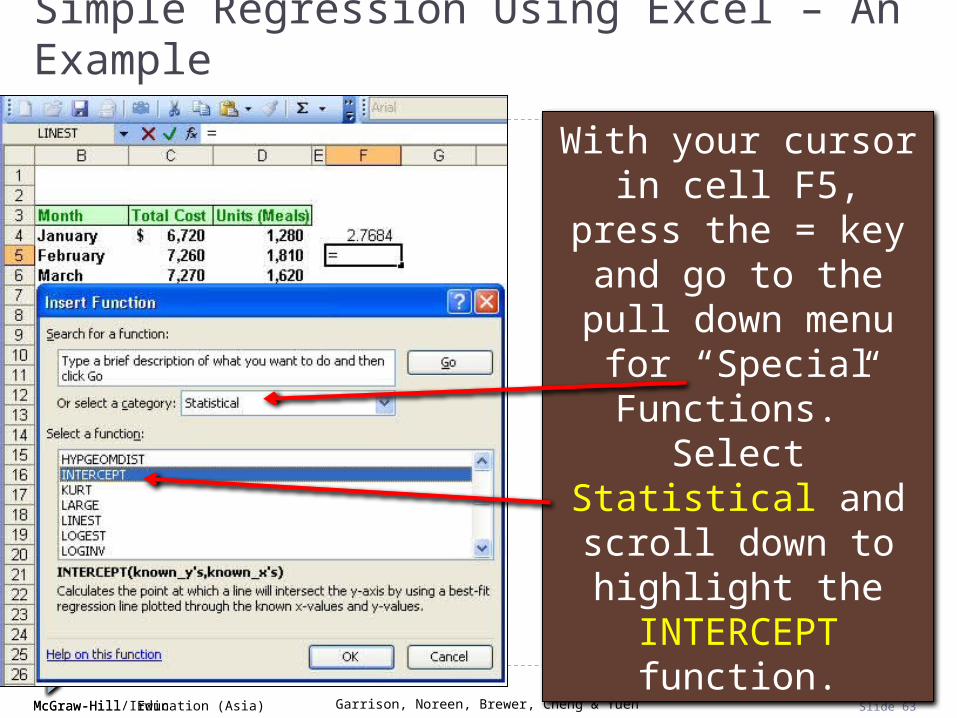
With your cursor in cell F5, press the =
key and go to the pull down menu for
“Special Functions.” Select Statistical and
scroll down to highlight the
INTERCEPT function.
Simple Regression Using Excel – An Example

McGraw-Hill Education (Asia) Garrison, Noreen, Brewer, Cheng & YuenMcGraw-Hill/Irwin Slide 64
1. In the Known_y’s box, enter C4:C19 for the range.
2. In the Known_x’s box, enter D4:D19 for the range.
Here is the estimate of the
fixed costs.
Simple Regression Using Excel – An Example

McGraw-Hill Education (Asia) Garrison, Noreen, Brewer, Cheng & YuenMcGraw-Hill/Irwin Slide 65
Finally, we will determine the “goodness of fit”, or R2, by
using the RSQ function.
Simple Regression Using Excel – An Example
McGraw-Hill Education (Asia) Garrison, Noreen, Brewer, Cheng & YuenMcGraw-Hill/Irwin Slide 66
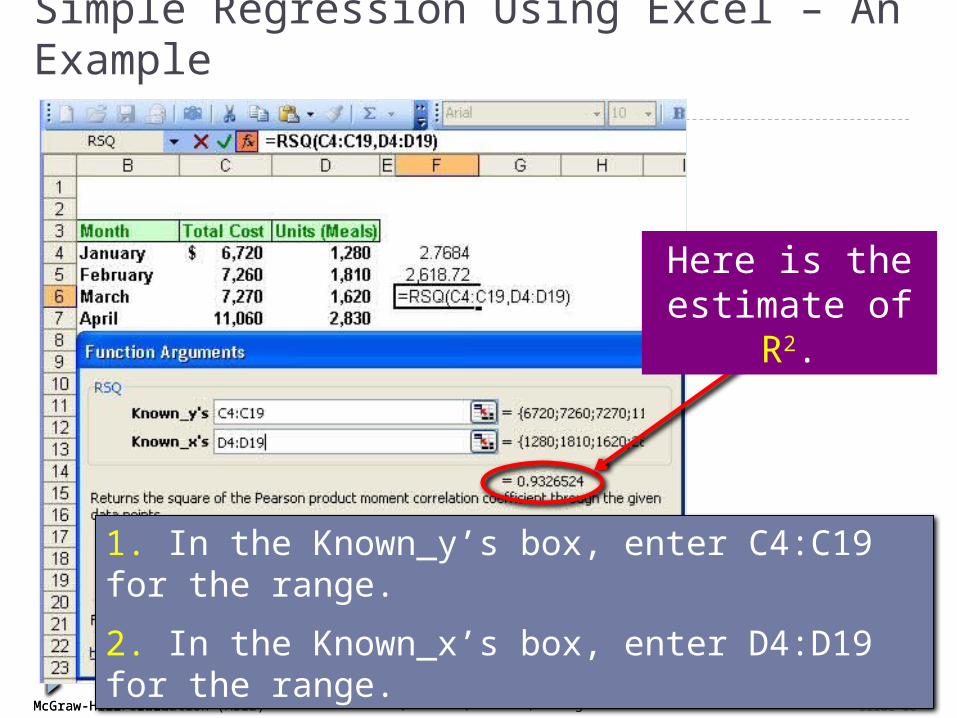
1. In the Known_y’s box, enter C4:C19 for the range.
2. In the Known_x’s box, enter D4:D19 for the range.
Here is the estimate of R2.
Simple Regression Using Excel – An Example
McGraw-Hill Education (Asia) Garrison, Noreen, Brewer, Cheng & YuenMcGraw-Hill/Irwin Slide 67
End of Chapter 3