B Rouan - repository.nwu.ac.za
117
Improving the ventilation of deep-level gold mines by simulating inactive sections 1 Improving the ventilation of deep-level gold mines by simulating inactive sections B Rouan orcid.org/ 0000-0001-6757-9086 Dissertation accepted in fulfilment of the requirements for the degree Master of Engineering in Mechanical Engineering at the North West University Supervisor: Dr H Brand Graduation: June 2021 Student number: 33665877
Transcript of B Rouan - repository.nwu.ac.za
Improving the ventilation of deep-level gold mines by simulating inactive sections
1
Improving the ventilation of deep-level gold mines
by simulating inactive sections
B Rouan
orcid.org/ 0000-0001-6757-9086
Dissertation accepted in fulfilment of the requirements for the
degree Master of Engineering in Mechanical Engineering at the
North West University
Supervisor: Dr H Brand
Graduation: June 2021
Student number: 33665877
Improving the ventilation of deep-level gold mines by simulating inactive sections
i
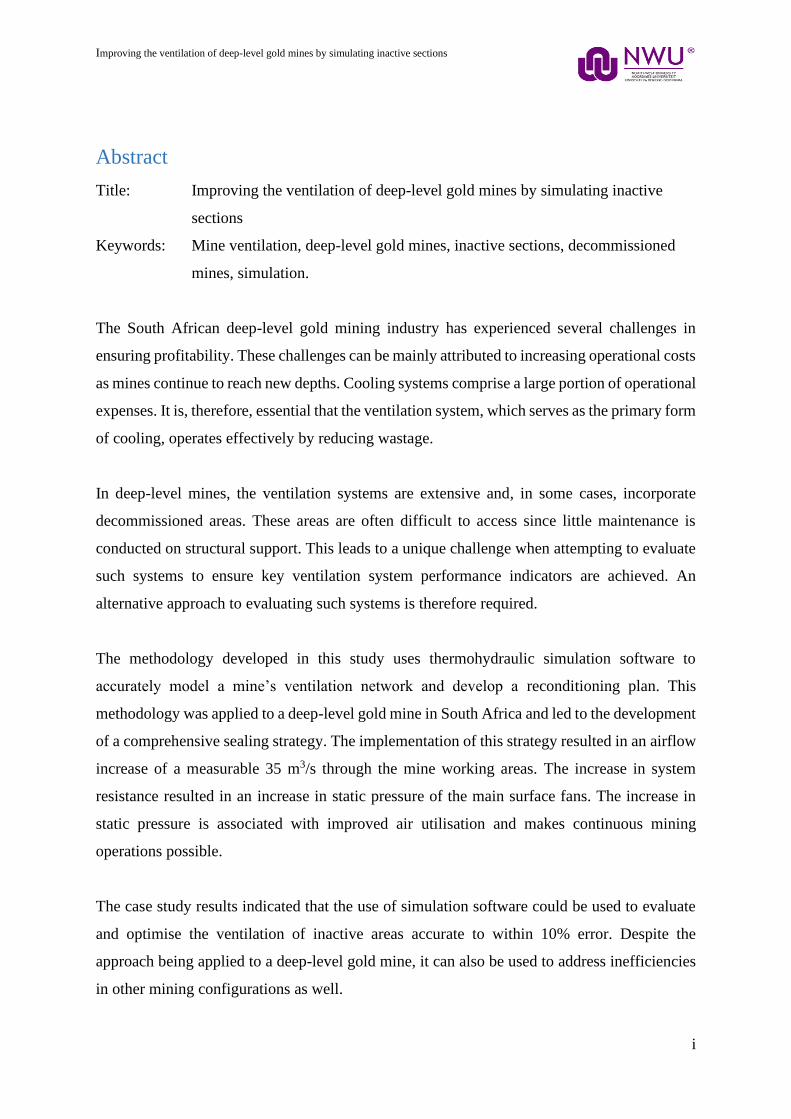
Abstract
Title: Improving the ventilation of deep-level gold mines by simulating inactive
sections
Keywords: Mine ventilation, deep-level gold mines, inactive sections, decommissioned
mines, simulation.
The South African deep-level gold mining industry has experienced several challenges in
ensuring profitability. These challenges can be mainly attributed to increasing operational costs
as mines continue to reach new depths. Cooling systems comprise a large portion of operational
expenses. It is, therefore, essential that the ventilation system, which serves as the primary form
of cooling, operates effectively by reducing wastage.
In deep-level mines, the ventilation systems are extensive and, in some cases, incorporate
decommissioned areas. These areas are often difficult to access since little maintenance is
conducted on structural support. This leads to a unique challenge when attempting to evaluate
such systems to ensure key ventilation system performance indicators are achieved. An
alternative approach to evaluating such systems is therefore required.
The methodology developed in this study uses thermohydraulic simulation software to
accurately model a mine’s ventilation network and develop a reconditioning plan. This
methodology was applied to a deep-level gold mine in South Africa and led to the development
of a comprehensive sealing strategy. The implementation of this strategy resulted in an airflow
increase of a measurable 35 m3/s through the mine working areas. The increase in system
resistance resulted in an increase in static pressure of the main surface fans. The increase in
static pressure is associated with improved air utilisation and makes continuous mining
operations possible.
The case study results indicated that the use of simulation software could be used to evaluate
and optimise the ventilation of inactive areas accurate to within 10% error. Despite the
approach being applied to a deep-level gold mine, it can also be used to address inefficiencies
in other mining configurations as well.

Improving the ventilation of deep-level gold mines by simulating inactive sections
ii
Acknowledgements
I would like to acknowledge and thank the following people whose contributions were
critical to the success of this study.
Enermanage for funding of the projects.
My parents Johan and Hanlie Rouan for always believing in me and supporting me in my
decisions.
My fiancée Yolande Lourens for all the love, late night support and encouragement over
weekends while completing this study.
Finally, I would like to thank God for providing me the knowledge, people and means to have
completed this dissertation.
Improving the ventilation of deep-level gold mines by simulating inactive sections
iii
Table of Contents
Abstract ....................................................................................................................................... i
Acknowledgements .................................................................................................................... ii
List of Figures ............................................................................................................................ v
List of Tables ......................................................................................................................... viii
Nomenclature ............................................................................................................................ ix
List of Abbreviations ................................................................................................................. x
Chapter 1: INTRODUCTION.................................................................................................... 1
1.1 Preamble ...................................................................................................................... 1
1.2 Gold Mining in South Africa ...................................................................................... 1
1.3 The Cost of Mining ..................................................................................................... 3
1.4 Literature of Ventilation of Deep-Level Mines in South Africa ................................. 5
1.4.1 Deep-level mine ventilation (network overview) ...................................................... 5
1.4.2 Main surface fans ....................................................................................................... 7
1.4.3 Utilising decommissioned mine ventilation systems............................................... 11
1.4.4 Ventilation network analysis ................................................................................... 14
1.4.5 Simulation software for ventilation ......................................................................... 19
1.4.6 Optimisation of ventilation networks ...................................................................... 22
1.4.7 Summary of significant literature ............................................................................ 27
1.5 Need for Study .......................................................................................................... 28
1.6 Problem Statement and Study Objective ................................................................... 29
1.7 Overview of Dissertation .......................................................................................... 29
Chapter 2: A NEW APPROACH TO EVALUATING DECOMMISSIONED MINE
VENTILATION SYSTEMS .................................................................................................... 31
2.1 Overview ........................................................................................................................ 31
2.2 A Method for Mine Ventilation Analysis Using Simulation ......................................... 32
Improving the ventilation of deep-level gold mines by simulating inactive sections
iv
2.3 Expectation from implementation of methodology ....................................................... 47
2.4 Conclusion ...................................................................................................................... 48
Chapter 3: RESULTS .............................................................................................................. 50
3.1 Introduction .................................................................................................................... 50
3.2 Case Study Results ......................................................................................................... 50
3.2.1 Reconditioning of mines A’s ventilation network ................................................... 50
3.2.2 Application of method ............................................................................................. 52
3.2.2 Interpretation of results ............................................................................................ 76
3.3 Validation ....................................................................................................................... 78
3.4 Conclusion ...................................................................................................................... 79
Chapter 4: CONCLUSION ...................................................................................................... 80
4.1 Summary ........................................................................................................................ 80
4.2 Limitations and Recommendations ................................................................................ 81
References ................................................................................................................................ 82
Appendix A: LIST OF VENTILATION CONTROL DEVICES AND DEFINITIONS ........ 91
Appendix B: EQUIPMENT USED IN A MANUAL VENTILATION SURVEY ................. 92
Appendix C: SCALABLE METHOD FOR VENTILATION NETWORKS ......................... 98
Appendix D: PTB SIMULATION LEVEL LAYOUTS ......................................................... 99
Appendix E: PTB TUNNEL NODE INPUTS ....................................................................... 105
Appendix F: SYSTEM RESISTANCE CURVE OF SEALING PLAN ............................... 106
Improving the ventilation of deep-level gold mines by simulating inactive sections
v
List of Figures
Figure 1 Top 10 gold-producing countries in the world [4] ...................................................... 1
Figure 2 Average electricity consumption per mining process at a deep-level mine [16] ........ 3
Figure 3 Eskom tariff increase from 2007 [18] ......................................................................... 4
Figure 4 Representation of a mine's ventilation network [29] ................................................... 6
Figure 5 Example of a fan's performance curve and fan curve characteristics [40] .................. 8
Figure 6 Fan performance curve showing operating point movement ...................................... 9
Figure 7 Fan operating points for different speeds [39] .......................................................... 10
Figure 8 Cross-sectional area of a deep-level mine in South Africa [52] ................................ 12
Figure 9 Methodology for optimising a ventilation network using simulation software ........ 31
Figure 10 Two-dimensional DXF layout of a single level of a mine ...................................... 33
Figure 11 Three-dimensional DXF layout of a single level .................................................... 34
Figure 12 Representation of a ventilation volume survey ....................................................... 37
Figure 13 Representation of static pressure with a U-tube manometer ................................... 38
Figure 14 Fan characteristics for simulation software ............................................................. 39
Figure 15 Coordinate input into PTB....................................................................................... 41
Figure 16 Example of a sealing plan reducing complexity on a station level ......................... 45
Figure 17 Example of how a sealing plan can improve air utilisation ..................................... 46
Figure 18 Expected fan performance results ........................................................................... 48
Figure 19 Simplified cross section view representation of the case study mine ..................... 51
Figure 20 Active levels for case study mine ............................................................................ 54
Figure 21 Mine A surface fan characteristic curve .................................................................. 55
Figure 22 55L auxiliary fan curve ........................................................................................... 57
Figure 23 Main surface fan for Mine A ................................................................................... 59
Improving the ventilation of deep-level gold mines by simulating inactive sections
vi
Figure 24 Baseline conditions on the main fan’s curve ........................................................... 60
Figure 25 55L auxiliary fan operating point ............................................................................ 61
Figure 26 Paper layout of a level in Mine A ............................................................................ 62
Figure 27 Isometric view of the simulation model .................................................................. 63
Figure 28 39L layout ................................................................................................................ 67
Figure 29 43L layout ................................................................................................................ 68
Figure 30 45L layout ................................................................................................................ 69
Figure 31 47L layout ................................................................................................................ 69
Figure 32 49L layout ................................................................................................................ 70
Figure 33 System resistance curves for each seal .................................................................... 71
Figure 34 Vane anemometer [98] ............................................................................................ 92
Figure 35 Whirling hygrometer [98] ........................................................................................ 92
Figure 36 Laser distance meter [98] ........................................................................................ 93
Figure 37 Barometer [98] ......................................................................................................... 93
Figure 38 Traverse method in mine airways [99] .................................................................... 93
Figure 39 Puff-Puff method ..................................................................................................... 94
Figure 40 Pitot tube schematic [100] ....................................................................................... 95
Figure 41 Vertical U-tube manometer [101] ........................................................................... 95
Figure 42 Pitot tube traverse method [20] ............................................................................... 96
Figure 43 Pitot tube measuring points in round ducting [20] .................................................. 97
Figure 44 Scalable method for mine ventilation networks ...................................................... 98
Figure 45 39L volume survey point ......................................................................................... 99
Figure 46 43L volume survey point ......................................................................................... 99
Figure 47 45L volume survey point ......................................................................................... 99
Figure 48 47L volume survey points ..................................................................................... 100
Improving the ventilation of deep-level gold mines by simulating inactive sections
vii
Figure 49 49L volume survey points ..................................................................................... 100
Figure 50 39L layout of simulation ....................................................................................... 100
Figure 51 43L layout of simulation ....................................................................................... 100
Figure 52 45L layout of simulation ....................................................................................... 101
Figure 53 47L layout of simulation ....................................................................................... 101
Figure 54 49L layout of simulation ....................................................................................... 101
Figure 55 51L layout of simulation ....................................................................................... 101
Figure 56 53L layout of simulation ....................................................................................... 102
Figure 57 55L layout of simulation ....................................................................................... 102
Figure 58 57L layout of simulation ....................................................................................... 102
Figure 59 59L layout of simulation ....................................................................................... 103
Figure 60 61L layout of simulation ....................................................................................... 103
Figure 61 63L layout of simulation ....................................................................................... 103
Figure 62 64L layout of simulation ....................................................................................... 104
Figure 63 Hydraulic calculate in PTB ................................................................................... 105
Figure 64 Enlarged graph of resistance curve of sealing plan ............................................... 106
Improving the ventilation of deep-level gold mines by simulating inactive sections
viii
List of Tables
Table 1 Six of the top 10 deepest mines in the world [11] ........................................................ 2
Table 2 Ventilation survey measuring parameters ................................................................... 15
Table 3 Applicable literature matrix ........................................................................................ 27
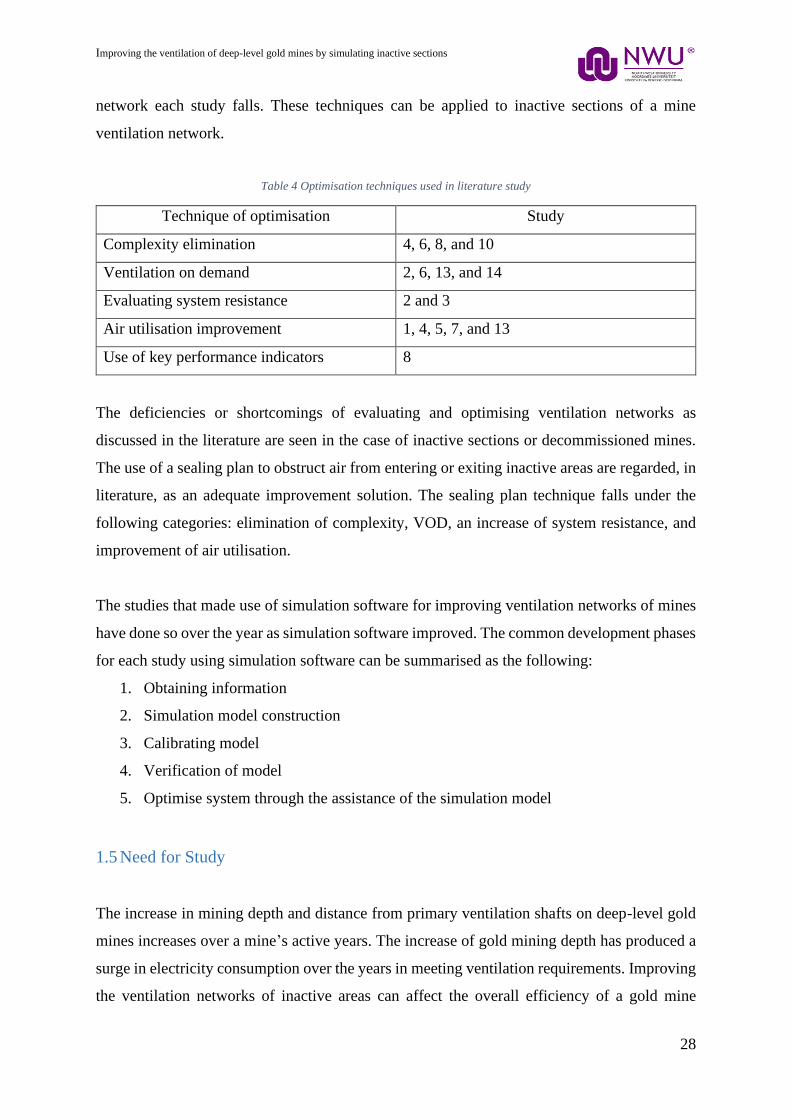
Table 4 Optimisation techniques used in literature study ........................................................ 28
Table 5 Fan characterisation conditions .................................................................................. 55
Table 6 Mine A main fan specification.................................................................................... 56
Table 7 Volume survey data for Mine A ................................................................................. 57
Table 8 Values for PTB simulation main surface fans ............................................................ 64
Table 9 Baseline simulation results for surface fans static pressure ........................................ 65
Table 10 Baseline simulation results for upper mine levels .................................................... 66
Table 11 Simulation optimisation results of the surface fans .................................................. 71
Table 12 Simulated airflow points ........................................................................................... 73
Table 13 55L auxiliary fan simulation results ......................................................................... 73
Table 14 Order of seals built .................................................................................................... 74
Table 15 Simulation results for changed optimisation plan ..................................................... 75
Table 16 Measured fan static pressure for each seal ................................................................ 75
Table 17 Implemented results for the static pressure of the 55L auxiliary fans ...................... 76
Table 18 Results accuracy ....................................................................................................... 77
Table 19 Equipment used in a ventilation survey .................................................................... 92
Table 20 Pitot tube measuring points [20] ............................................................................... 96
Improving the ventilation of deep-level gold mines by simulating inactive sections
ix
Nomenclature
Symbol Description Units
Q Airflow quantity m³/s
P Barometric pressure kPa
Fp Fan power kW
R South African currency Rands
V Velocity m/s
A Area m²
A Ampere A
Improving the ventilation of deep-level gold mines by simulating inactive sections
x
List of Abbreviations
GDP Gross Domestic Product
DMR Department of Mineral Resources
LOM Life of mine
UC Upcast shaft
DC Downcast shaft
Pa Pascal
kW kilowatt
kPa kilopascal
km kilometre
m³/s Cubic meters per second
DB Dry bulb
WB Wet bulb
VOD Ventilation on Demand
VSD Variable speed drive
FOG Fall of Ground
DXF Drawing eXchange Format
3D Three dimensional
PTB Process ToolBox
SI-Units International System of Units
RAW Return airway
GCS Geographic coordinate system
L Level
KPI Key Performance Indicator
CAD Computer Aided Design
IGV Internal Guide Vanes
VRT Virgin Rock Temperature
GUI Graphical User Interface
Improving the ventilation of deep-level gold mines by simulating inactive sections
1
Chapter 1: INTRODUCTION
1.1 Preamble
Chapter 1 highlights the status of the gold mining industry in South Africa and forms the
literature study for the dissertation. The focus is directed at the inner workings of deep-level
gold mine ventilation networks and the analysis thereof. The use of simulation software and
optimisation of ventilation networks are also discussed. The chapter concludes with a problem
statement and an overview of the chapter.
1.2 Gold Mining in South Africa
South Africa has the second largest gold reserve in the world when referring to ore deposits
that are economically viable to extract [1]. Since the first discovery of gold in June 1884,
underground mines have been the primary supply of 95% of gold in South Africa [2]. The gold
mining industry forms 6.8% of the total Gross Domestic Product (GDP) of the country and
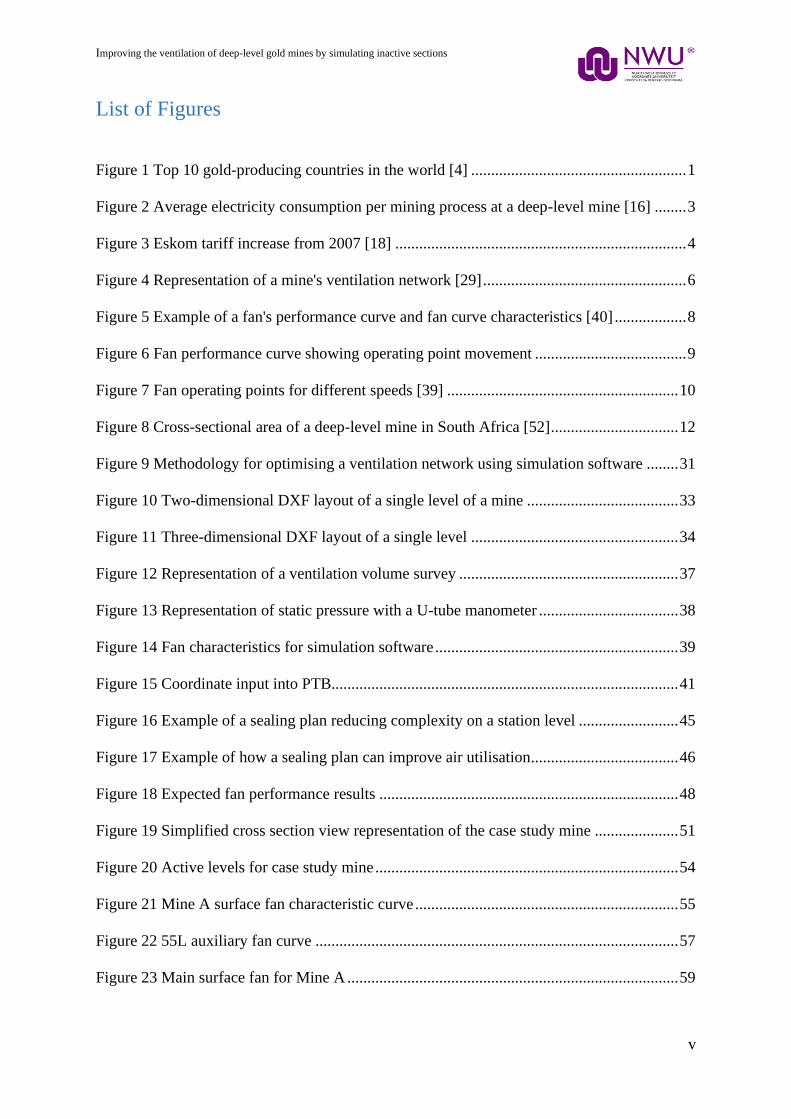
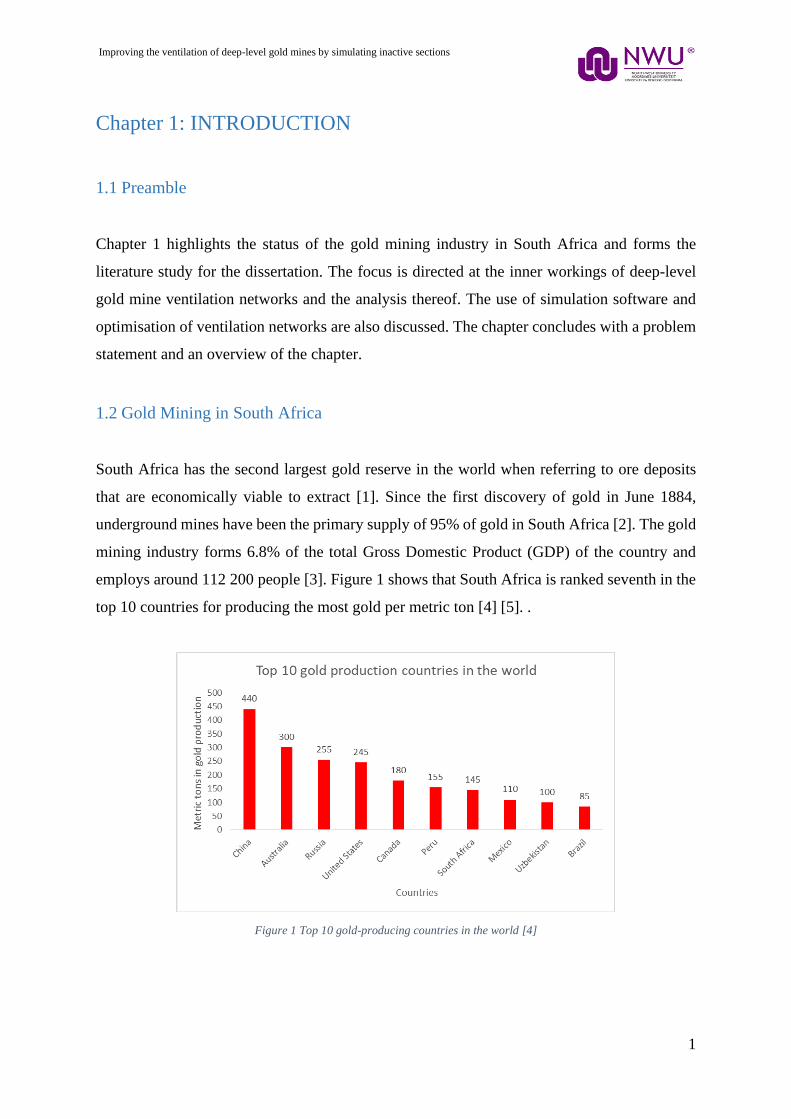
employs around 112 200 people [3]. Figure 1 shows that South Africa is ranked seventh in the
top 10 countries for producing the most gold per metric ton [4] [5]. .
Figure 1 Top 10 gold-producing countries in the world [4]
Improving the ventilation of deep-level gold mines by simulating inactive sections
2
The global production of gold has increased over the years with continuous mining practice
improvements, yet, the South African contribution has been decreasing. Numerous
socioeconomic factors contributed to the decline of gold production in South-Africa. As seen
in Figure 1, South Africa was in the seventh place for gold production in the year 2018 where
once was amongst the top two. South Africa has produced 83% less gold in 2018 than it did in
1980 [6]. This is mainly because of the following [7] [8]:
• The rand-dollar exchange rate,
• high production costs like rises in wages, rises in electricity cost etc.
• frequent employee strikes, and
• depth at which gold is mined from.
The depletion of shallow ore reserves in South Africa has forced the gold mining industry to
exploit of reefs at ever-increasing depths [9]. It was already forecasted in the 1960s that by the
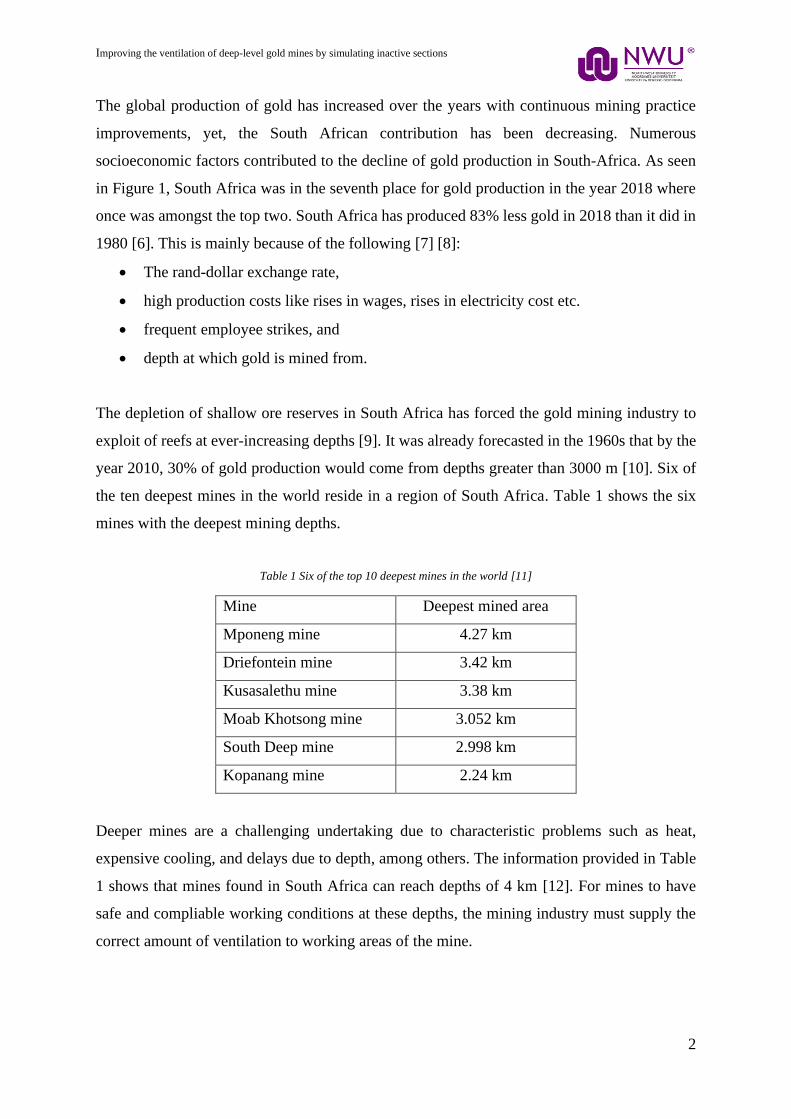
year 2010, 30% of gold production would come from depths greater than 3000 m [10]. Six of
the ten deepest mines in the world reside in a region of South Africa. Table 1 shows the six
mines with the deepest mining depths.
Table 1 Six of the top 10 deepest mines in the world [11]
Mine Deepest mined area
Mponeng mine 4.27 km
Driefontein mine 3.42 km
Kusasalethu mine 3.38 km
Moab Khotsong mine 3.052 km
South Deep mine 2.998 km
Kopanang mine 2.24 km
Deeper mines are a challenging undertaking due to characteristic problems such as heat,
expensive cooling, and delays due to depth, among others. The information provided in Table
1 shows that mines found in South Africa can reach depths of 4 km [12]. For mines to have
safe and compliable working conditions at these depths, the mining industry must supply the
correct amount of ventilation to working areas of the mine.
Improving the ventilation of deep-level gold mines by simulating inactive sections
3
The optimisation of ventilation networks of mines can have a large impact on the cost-
effectiveness of a mine. Up to 47% of the total electricity usage in the mining industry comes
from the gold sector [13]. This illustrates the vast amount of energy that is needed for
production and processing in gold mines. As a result, the practice of using simulation software
to optimise ventilation networks have increased over the years [14].
1.3 The Cost of Mining
The cost of mining in South-Africa has risen over the past years and optimisation of services
has become ever important. Some mines are deemed as unprofitable or marginal due to their
declining production numbers [15]. The high operating costs and decreasing production
necessitate mines to either reduce operational costs or increase production rates.
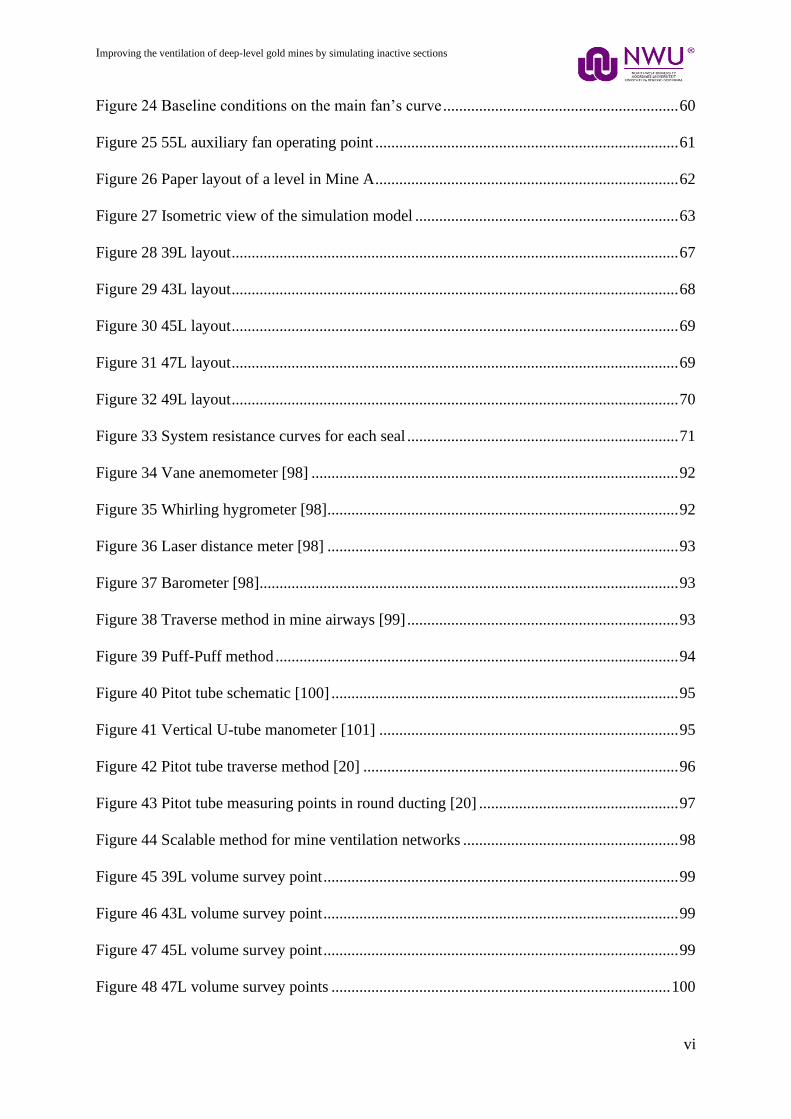
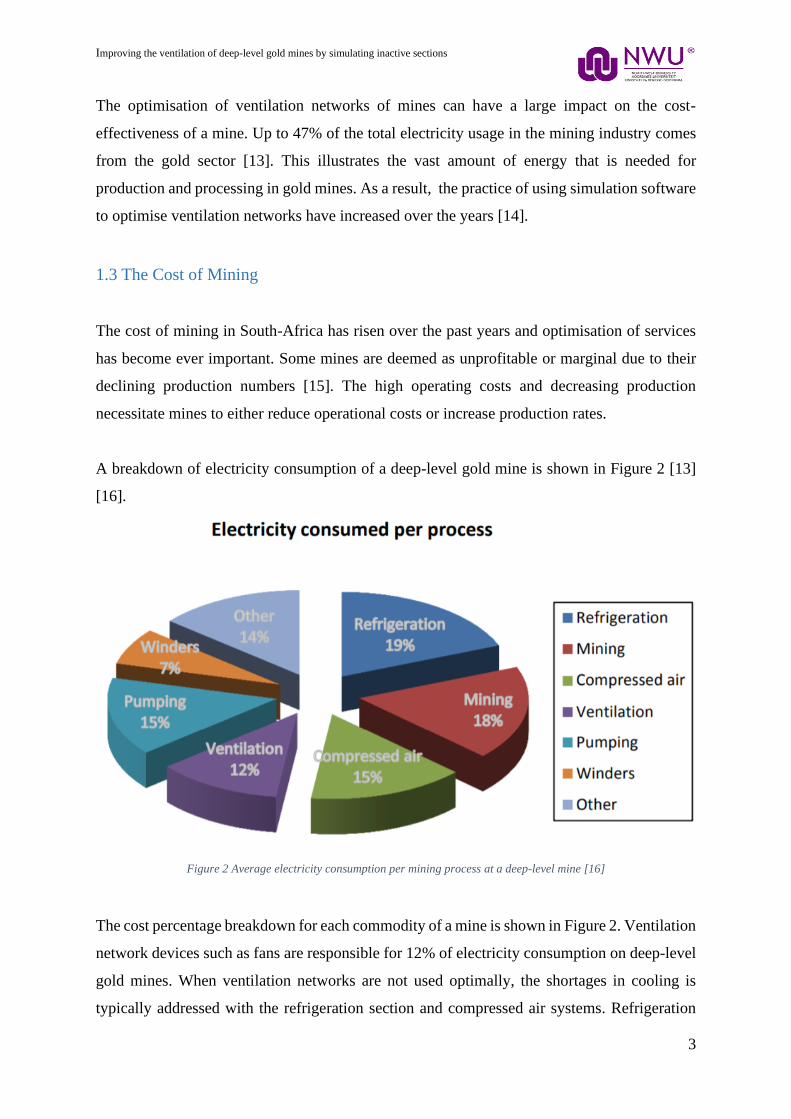
A breakdown of electricity consumption of a deep-level gold mine is shown in Figure 2 [13]
[16].
Figure 2 Average electricity consumption per mining process at a deep-level mine [16]
The cost percentage breakdown for each commodity of a mine is shown in Figure 2. Ventilation
network devices such as fans are responsible for 12% of electricity consumption on deep-level
gold mines. When ventilation networks are not used optimally, the shortages in cooling is
typically addressed with the refrigeration section and compressed air systems. Refrigeration

Improving the ventilation of deep-level gold mines by simulating inactive sections
4
and compressed air make up 34% of electricity consumption. Therefore, the ventilation
network can have an expensive impact on the mine’s networks.
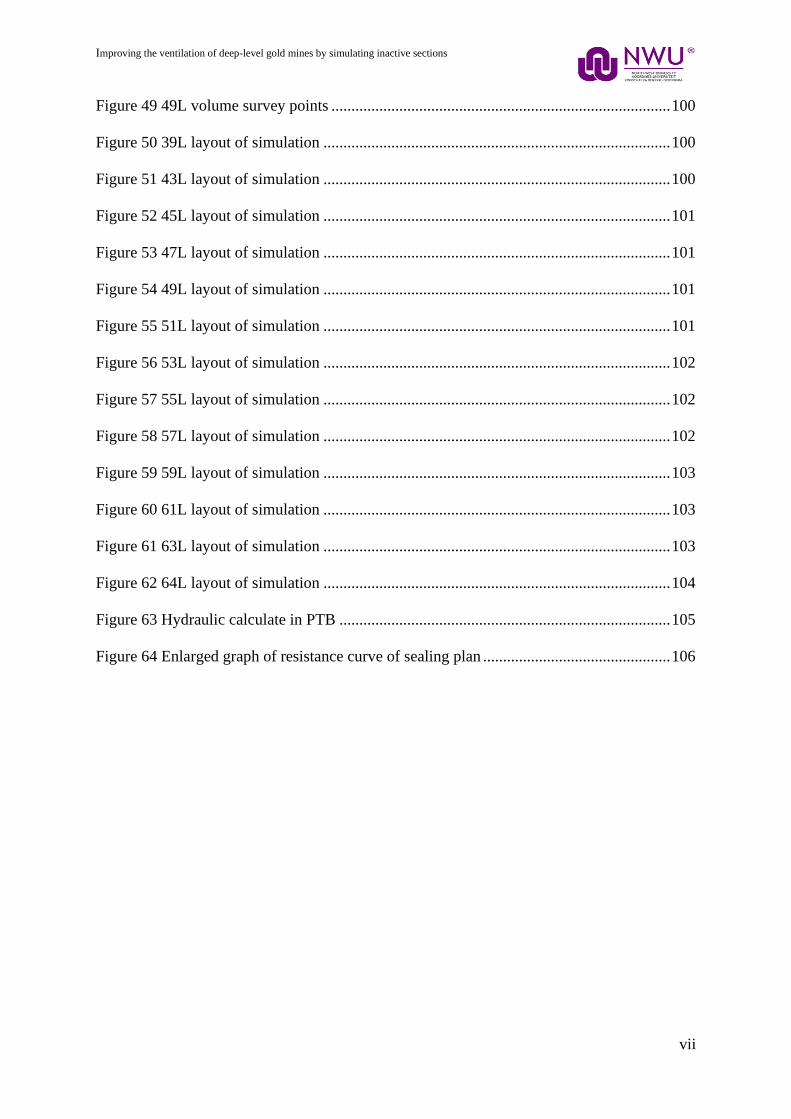
In South Africa, there has also been a steep increase in electricity tariffs. With Eskom
producing 95% of South Africa’s electricity and with the rise of electricity costs, as seen in
Figure 3. South Africa has a high production costs with regards to energy, compared to other
countries in the same industry due to high electricity costs [17].
Figure 3 Eskom tariff increase from 2007 [18]
As seen in the figure the cost of electricity has risen by 356% from 2007 to 2018. This increase
is more than double the inflation of a 10-year period. The rise in electricity cost has necessitated
energy-saving project and cost reduction initiatives lest gold mines in South Africa stand the
risk of becoming non-competitive in an ever-competitive market [19].
A ventilation network is the primary form of cooling in a deep-level gold mine. When a
ventilation network is not optimally utilised the abuse of other expensive systems, like
compressed air and refrigeration, can take place [20]. Thus, a ventilation network can be a large
contributor to unwanted operational costs [21].
0
10
20
30
40
50
60
70
80
90
100
2003 2005 2007 2009 2011 2013 2015 2017 2019
cen
t
Year
Average price from 2003 to 2018/19 (cent/kWh)
Average standard tariff price Mining sector
Improving the ventilation of deep-level gold mines by simulating inactive sections
5
Although the optimisation of a mine ventilation network has the longest lead time, the impact
of the project is the most noticeable in sustaining a competitive and profitable mine [19].
1.4 Literature of Ventilation of Deep-Level Mines in South Africa
1.4.1 Deep-level mine ventilation (network overview)
Ventilation can be described as a system that will deliver airflows in enough quantity and
quality [22]. Ventilation has high importance to the occupational health and safety of
underground workers. A continuous supply of good quality air is essential to supply fresh air
and dilute fumes and toxic gases [23]. Ventilation is also necessary for removing heat in deep-
level mines [24] [25]. Designing an effective mine ventilation system is crucial to the safe and
efficient operation of underground mines [21] [11].
Gold mines in South Africa commonly practice narrow reef sequential mining [26] [27]. The
narrow reef refers to the vain-like ore body that is found underground containing the gold
reserves. The sequential mining technique refers to the mining method where multiple areas
are mined and developed simultaneously [28]. This method of mining requires ventilation
networks to supply fresh air to multiple working areas simultaneously.
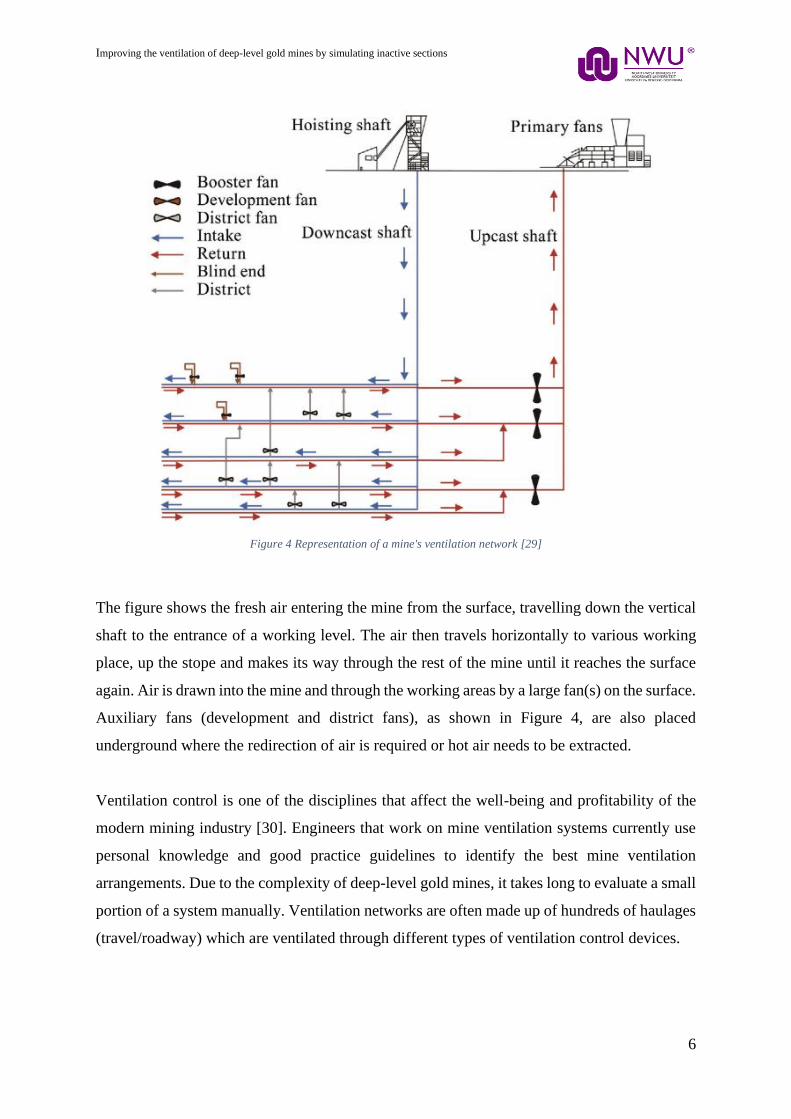
Deep-level gold mine ventilation networks consist of multiple airways for travelling, supplying
fresh air, and returning hot air. A simplified ventilation network for a deep-level gold mine is
shown in Figure 4.
Improving the ventilation of deep-level gold mines by simulating inactive sections
6
Figure 4 Representation of a mine's ventilation network [29]
The figure shows the fresh air entering the mine from the surface, travelling down the vertical
shaft to the entrance of a working level. The air then travels horizontally to various working
place, up the stope and makes its way through the rest of the mine until it reaches the surface
again. Air is drawn into the mine and through the working areas by a large fan(s) on the surface.
Auxiliary fans (development and district fans), as shown in Figure 4, are also placed
underground where the redirection of air is required or hot air needs to be extracted.
Ventilation control is one of the disciplines that affect the well-being and profitability of the
modern mining industry [30]. Engineers that work on mine ventilation systems currently use
personal knowledge and good practice guidelines to identify the best mine ventilation
arrangements. Due to the complexity of deep-level gold mines, it takes long to evaluate a small
portion of a system manually. Ventilation networks are often made up of hundreds of haulages
(travel/roadway) which are ventilated through different types of ventilation control devices.
Improving the ventilation of deep-level gold mines by simulating inactive sections
7
Examples of control devices [31] [32] include:
1. Regulators
2. Airlocks
3. Brattices
4. Stopping
5. Overcast and undercast systems
6. Ducts
7. Main fans
8. Secondary or booster fans
9. Development or auxiliary fans
A definition for each ventilation control device can be found in Appendix A.
Although ventilation control devices help with the flow of air through the mine, the main
supply of ventilation airflow is supplied by the main, or primary, surface fans. Engineers use
these to create a controlled flow of fresh air to all the working areas. Each mine should have at
least one fan of comparatively large capacity to control main underground air currents. This is
very often seen in mines across South Africa where mine networks keep expanding to new
depths and distances to reach ore reserves.
With the continual increase of mining depths and expanding mine networks comes an increase
in the mine’s resistance and system pressure [33] [34]. New working areas can be difficult to
properly ventilate due to the increase of the system resistance.
1.4.2 Main surface fans
Main fans draw fresh air into the mine and contaminated air out of the mine. Main fans can be
installed on the downcast (intake) airshaft, upcast (return) airshaft, or both [31] . They are found
either on the surface or underground and can be axial, centrifugal, or mixed [35]. Explained
below;
• Axial fans are high-performance variable and fixed pitch fans.
• Centrifugal fans are high-efficiency aerofoil and backward-curved fans.
• Mixed refers to the use of both an axial and centrifugal fan.
Improving the ventilation of deep-level gold mines by simulating inactive sections
8
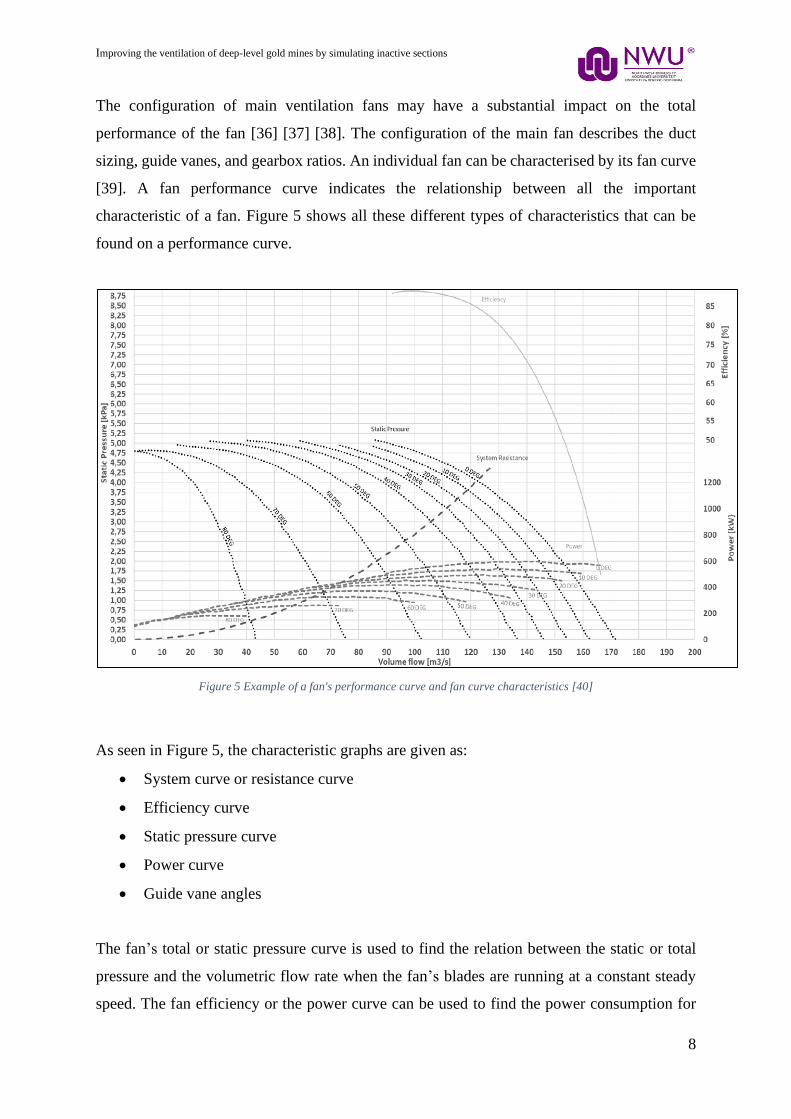
The configuration of main ventilation fans may have a substantial impact on the total
performance of the fan [36] [37] [38]. The configuration of the main fan describes the duct
sizing, guide vanes, and gearbox ratios. An individual fan can be characterised by its fan curve
[39]. A fan performance curve indicates the relationship between all the important
characteristic of a fan. Figure 5 shows all these different types of characteristics that can be
found on a performance curve.
Figure 5 Example of a fan's performance curve and fan curve characteristics [40]
As seen in Figure 5, the characteristic graphs are given as:
• System curve or resistance curve
• Efficiency curve
• Static pressure curve
• Power curve
• Guide vane angles
The fan’s total or static pressure curve is used to find the relation between the static or total
pressure and the volumetric flow rate when the fan’s blades are running at a constant steady
speed. The fan efficiency or the power curve can be used to find the power consumption for
Improving the ventilation of deep-level gold mines by simulating inactive sections
9
the fan at a specific point of airflow. Figure 6 shows the fan power curve plotted against the
volumetric flow rate.
Figure 6 Fan performance curve showing operating point movement
The guide vane’s position is also plotted on this curve shown in Figure 6. Guide vanes are
usually found at the inlet or outlet of a fan and are stationary [41]. Inlet guide vanes can be
used as an energy management system where it can help mines to reduce energy consumption
during off-shift periods [42]. The red marker on Figure 6 indicates an example where the guide
vane angle is at 0%, and at the specific operating point, the fan providing 210 m3/s at a static
pressure of 3.75 kPa. Each guide vane angle has a different static pressure curve on the figure.
The blue dot, which indicates the fan power for the corresponding flow rate and guide vane
position, at this point it is set at 940 kW.
The combination of all the aerodynamic resistance in a system is represented by the system
curve (system resistance curve) [39] [43]. Many factors can play a role in the resistance of a
ventilation network and some of these factors are [44]:
• Water accumulation
• Fall of ground (FOG)
• Haulage support structures
• Machinery
Improving the ventilation of deep-level gold mines by simulating inactive sections
10
• Haulage wall roughness
• Air velocity
The system curve will respond according to the red arrows shown in Figure 6. The friction
coefficient of the tunnels is dependent on the rock face conditions. Mines have different ways
to line rock faces to decrease the risk of rock face crumbling and fall of ground, like shot-create
and cement. There are also possibilities of haulages that can collapse due to age and humid
conditions, and this is more likely to happen in decommissioned mines.
For a system with a higher resistance, the operating point will move upwards and to the left on
the static pressure curve. An increased system resistance indicates that the air supplied to a
mine is reaching the desired areas [45]. When the system resistance is less, the point of
operation will move lower and to the right on the static pressure curve; this will result in an
increase in airflow and a decrease in static pressure over the fan [46].
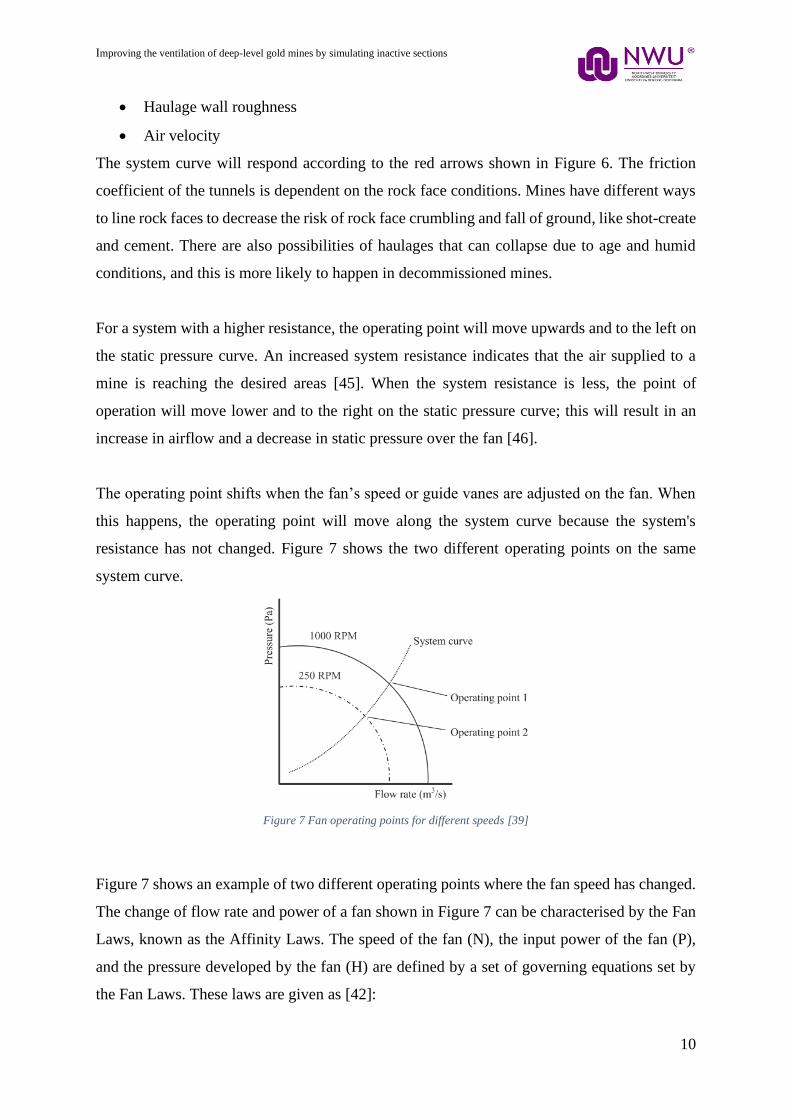
The operating point shifts when the fan’s speed or guide vanes are adjusted on the fan. When
this happens, the operating point will move along the system curve because the system's
resistance has not changed. Figure 7 shows the two different operating points on the same
system curve.
Figure 7 Fan operating points for different speeds [39]
Figure 7 shows an example of two different operating points where the fan speed has changed.
The change of flow rate and power of a fan shown in Figure 7 can be characterised by the Fan
Laws, known as the Affinity Laws. The speed of the fan (N), the input power of the fan (P),
and the pressure developed by the fan (H) are defined by a set of governing equations set by
the Fan Laws. These laws are given as [42]:
Improving the ventilation of deep-level gold mines by simulating inactive sections
11
𝑄1
𝑄2=
𝑁1
𝑁2
𝐻1
𝐻2= (
𝑁1
𝑁2)²
𝑃1
𝑃2= (
𝑁1
𝑁2)³
The subscript 1 is associated with the original conditions and subscript 2 with the resulting
variables from change in the fan speed. However, this law will only be valid when the fan is
analysed as a separate system. When a fan is analysed as part of a system, the fan laws will
result in the incorrect analysis [47]. This is due to the resistance that is applied to the fan when
analysed as part of a system. Usually, the reduction in fan speed will result in an overestimation
of power savings [48] [47].
The information that can be gathered using fan curves and fan analysis for the primary fans
enables mines and engineers to make an accurate prediction of the conditions of a mine. Not
only do fans help to predict the underground conditions of a mine but they can also be used in
combination with simulation software. This is used as a possible alternative method for
analysing ventilation networks of decommissioned mines.
1.4.3 Utilising decommissioned mine ventilation systems
In the 1960s, the Free State province in South Africa experienced a boom in the gold mining
industry, and the town Welkom hosted most of the surrounding mines [49]. There were
multiple mines in the area and in close proximity. Since then, however, most of the mines have
closed and now form part of ventilation networks of active mines.
Inactive mines areas are kept operational at the expense of active mines for future mining needs.
Decommissioned mines are kept operational for the sake of planned underground expansion of
the mining networks. The advantage of utilising a decommissioned mine in way is that there is
already an existing ventilation infrastructure. Sinking a shaft of about 2 km will cost between
R6.6 billion and R9.4 billion and may take a minimum of 18 months to complete [50]. On the
Improving the ventilation of deep-level gold mines by simulating inactive sections
12
other hand, an inactive mine can be used for much less capital expenditure. Thus, using existing
mines and older shafts is more feasible in the sense of time and money management [51].
Decommissioned mines that are used by active mines usually serve as an additional escape
route or service shaft. The services that can be supplied by inactive mines are as follows:
• Ventilation – Extra fresh air supply or act as return airways (RAWs).
• Dewatering – Pump station utilised for dewatering purposes
• Compressed air – If the infrastructure is still available
• Escape route – May serve as an additional escape route for emergencies
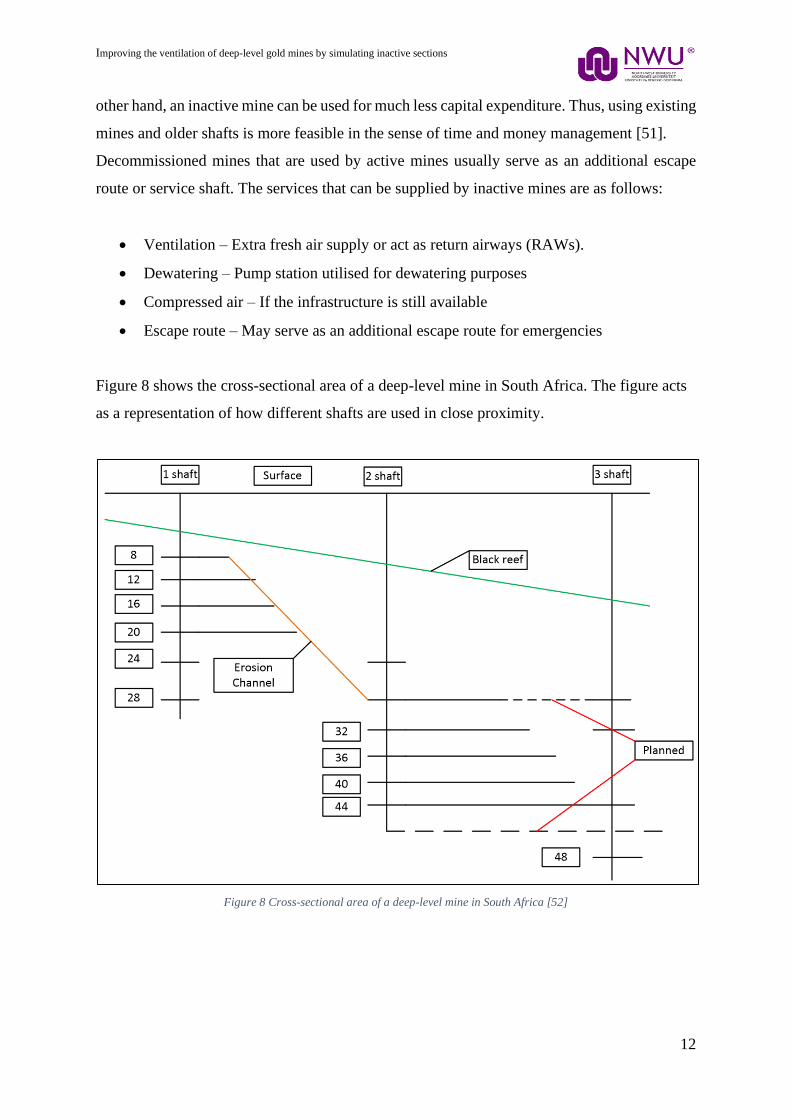
Figure 8 shows the cross-sectional area of a deep-level mine in South Africa. The figure acts
as a representation of how different shafts are used in close proximity.
Figure 8 Cross-sectional area of a deep-level mine in South Africa [52]
Improving the ventilation of deep-level gold mines by simulating inactive sections
13
As a result of the reef dip, the different shafts make it possible to access working areas faster
and easier by decreasing travel time. The extra shafts are also used for ventilation to ensure an
adequate distribution of fresh air is achieved.
The downfall of using a decommissioned mine’s ventilation network is that some of the areas
may be inaccessible. Due to the rock deterioration over time, the integrity of the walls and roof
of the mine may be compromised in that they could fail and cause a fall of ground [53]. These
mines are also subject to high temperatures and a high possibility for dangerous gases like
carbon monoxide and methane due to poor ventilation.
The following is a summary of how different researchers investigated the use and
reconditioning of decommissioned mines. The headings discussed for each research study are
as follows:
• Title.
• Summary of the study and how it focused on decommissioned mines.
1. Title [54]: An investigation into the impact of mine closure and its associated cost on
life of mine planning and resource recovery.
Summary: The article seeks to quantify the value that may be lost in the event that a mine
closure plan is not adequately considered in the life-of-mine plan. To demonstrate this, the
paper uses the case study to investigate the effect of closure on many aspects of the mine’s
design. The results of the study show that mining operation may benefit from an extended
life of mine due to the time value of a mine.
The article shows that with adequate mine planning, the life of mine can be extended for
deep-level gold mines. The planning can also ensure resource recovery and profitability of
mining operations. Extending the life of mine for the use of an active mine will ensure an
increase in cost effectiveness planning. This relates to the study of using a decommissioned
mine as an additional ventilation shaft for a nearby active deep-level gold mine. However,
the study does not include how an inactive mine section can be utilised for extending the
life of mine for an active mine.
Improving the ventilation of deep-level gold mines by simulating inactive sections
14
2. Title [55]: The design of push-pull primary and secondary ventilation system and a
vertically split intake exhaust ventilation shaft.
Summary: The paper describes an unusual set of circumstances that led to a selection of
vertically split ventilation shaft for a major mine expansion. The study looks at a
Ventilation-on-Demand (VOD) system as where ventilation is required at new working
areas. An unusual push-pull district ventilation system was utilised in the study. Factors
that have an impact on the choice of ventilation design and risk management associated
with the design are described in the paper.
The unusual case study used in the paper makes it a good literature piece for studying
decommissioned mine ventilation networks. The paper correlates with this study due to the
ventilation that is needed for a mine that is expanding. The VOD system follows the same
path to where ventilation networks change to meet ventilation requirements. The study also
raises the value of having a considerable size main surface fans and the impact that the
shaft resistance has on the fans. The problems encountered in the case study are also a
problem that could be encountered in inactive mining sections.
The studies above show that there are many solutions for optimising ventilation for an
expanding mine, for example, fans and ventilation control devices. In some cases, making use
of a secondary shaft will help ventilate new areas that are a substantial distance from the
primary vent shaft. Due to the inaccessibility of decommissioned mines, studies have omitted
ventilation network analysis techniques for inactive or decommissioned areas.
1.4.4 Ventilation network analysis
Ventilation network analysis is focused on the interactive behaviour of airflows within the
connected branches of an integrated network [21]. Ventilation network analysis is a generic
term for multiple techniques that enables mines to determine and predict airflow [22]. Any
operating mine is a dynamic system with continuous workings and development where
ventilation analysis should be a routine and continuous process [56]. The ventilation network
analysis of a mine is part of ventilation planning [56].
Improving the ventilation of deep-level gold mines by simulating inactive sections
15
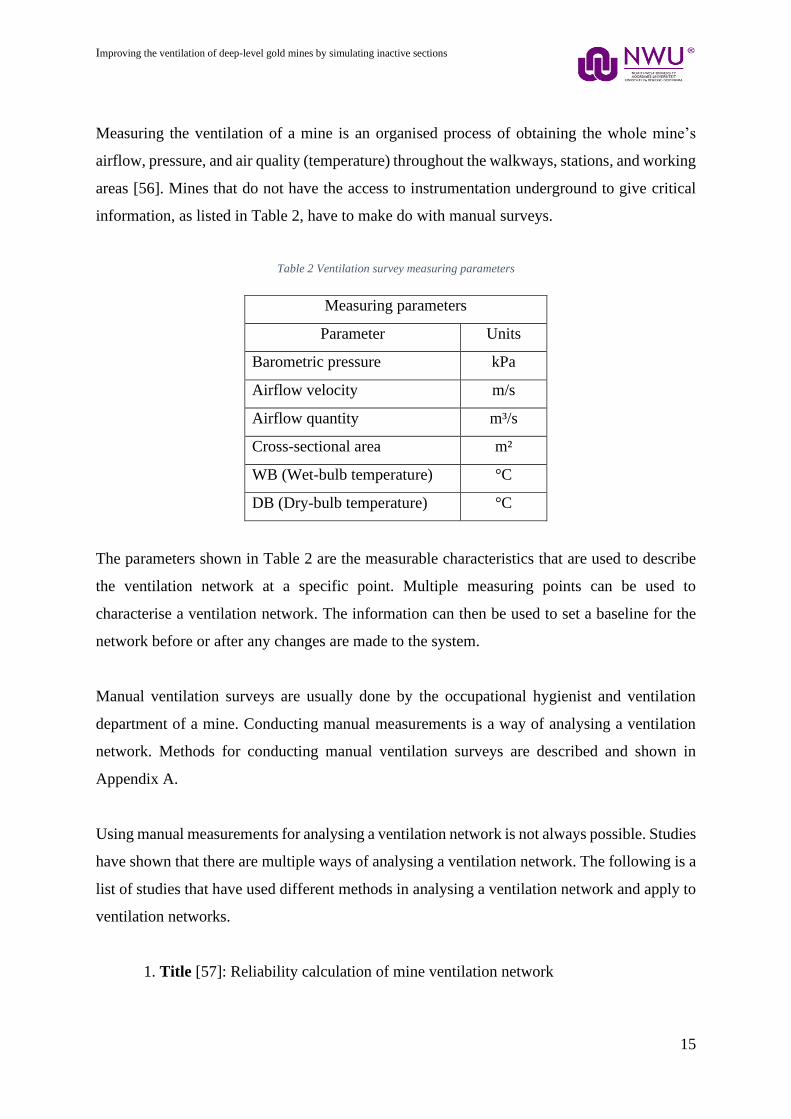
Measuring the ventilation of a mine is an organised process of obtaining the whole mine’s
airflow, pressure, and air quality (temperature) throughout the walkways, stations, and working
areas [56]. Mines that do not have the access to instrumentation underground to give critical
information, as listed in Table 2, have to make do with manual surveys.
Table 2 Ventilation survey measuring parameters
Measuring parameters
Parameter Units
Barometric pressure kPa
Airflow velocity m/s
Airflow quantity m³/s
Cross-sectional area m²
WB (Wet-bulb temperature) °C
DB (Dry-bulb temperature) °C
The parameters shown in Table 2 are the measurable characteristics that are used to describe
the ventilation network at a specific point. Multiple measuring points can be used to
characterise a ventilation network. The information can then be used to set a baseline for the
network before or after any changes are made to the system.
Manual ventilation surveys are usually done by the occupational hygienist and ventilation
department of a mine. Conducting manual measurements is a way of analysing a ventilation
network. Methods for conducting manual ventilation surveys are described and shown in
Appendix A.
Using manual measurements for analysing a ventilation network is not always possible. Studies
have shown that there are multiple ways of analysing a ventilation network. The following is a
list of studies that have used different methods in analysing a ventilation network and apply to
ventilation networks.
1. Title [57]: Reliability calculation of mine ventilation network
Improving the ventilation of deep-level gold mines by simulating inactive sections
16
Summary: The research paper discusses the reliability of a ventilation network and
how it can be calculated using a mathematical model. The study uses the disjoint
Boolean algebra method to calculate the reliability of ventilation branches with regards
to resistance change, air pressure changes, and random disturbance. The reliability
calculations show that the changes made in a ventilation network are predictable.
The reliability of a mine ventilation network is a measurable index and is the probability
of a mine ventilation network meeting all requirements. The designing and managing
of mine ventilation networks can be a predictable process if the network is analysed
correctly.
Relevance: The study showed how a mathematical model could be used to predict the
resistance change and air pressure change in a mine ventilation network. This could be
applied to a ventilation network when the resistance is unknown.
2. Title [58]: Application of depth-first search method in finding recirculation in mine
ventilation system.
Summary: The research paper looks at analysing the recirculation of airflow in a
ventilation network by using a method called “depth-first”. The recirculation of air can
induce a concentration of contaminated air and cause the ventilation network to be less
effective. The method is implemented through MATLAB in the form of storing
information in a matrix [59].
The method used in the study is a representation of how simulation software can be
used for analysing ventilation networks. The method can be used to improve the
effectiveness of ventilation networks underground.
Relevance: The study shows how the recirculation of air can reduce the efficiency of a
ventilation network. The method of searching for recirculation could be applied to
inactive areas to be sealed off and improve the efficiency of the network.
3. Title [60]: The analysis of ventilation and cooling requirements for mines.
Improving the ventilation of deep-level gold mines by simulating inactive sections
17
Summary: The method presented in the article for analysing ventilation and cooling
requirements has been developed based on experience gained on several mines in
South-Africa. The method dealt with important factors that have a bearing on the
ventilation and cooling requirements of gold mines.
The study categorises active mines with the objective to extend the mining operation
by using existing facilities for long-term planning as type B mines, for the interest of
the study. Type B mines are associated with existing mines where the object is to extend
mining operations into new ground and often to greater depth, the aim is to make the
best possible use of the existing facilities and to define the additional infrastructure
required. The flow diagram in the study shows that analysis of the total airflow through
the mine is required for type B mines. The research paper goes into detail on how to
create a model and to assess the practicality of the model through airflow.
Relevance: The study gives an adequate guideline on how to analyse a ventilation
network and the requirements for a ventilation network. The guideline could be
implemented on a ventilation improvement strategy to improve cooling through
ventilation control.
4. Title [61]: Analysis of mine ventilation systems using operations research methods.
Summary: The study focuses on using a programmed model to analyse and optimise
locations for ventilation control devices. The overall cost was minimised through
different proposed models. The primary purpose is reducing the cost and the
mathematical models were developed to achieve this.
The analysing of the optimal placement of ventilation control devices can explain how
airflow can be natural or controlled. The study explains how the resistance of a mine
can have an impact on the flow of air. This can also explain how control devices have
an impact on the ventilation network.
Improving the ventilation of deep-level gold mines by simulating inactive sections
18
Relevance: The study uses a programming algorithm for finding the best suitable
position for ventilation control devices. The objective is to minimise the power
consumption needed to produce the required ventilation airflow. The method of placing
ventilation control devices to reduce the power consumption could be applied on
decommissioned or inactive mining areas.
5. Title [62]: The use of 3D simulation system in mine ventilation management.
Summary: This study, simulation software is used to analyse the effect of operational
changes on a complex mine. The simulation software enables users to provide reliable
data for decision making. The process of developing and using a 3D mine ventilation
simulation can be used to analyse a ventilation network.
Relevance: The study produces good evidence on how simulation software can be used
to analyse ventilation networks. The simulation software gives reliable data for decision
making and can be used for improving ventilation networks.
6. Title [63]: Evaluating complex mine ventilation operational changes through
simulation.
Summary: In this study puts forward a methodology for the development of a
ventilation simulation. The ventilation simulation is used to evaluate the impact of
operational changes on a ventilation system. The method allows for improved
ventilation analysis and decision making. This method can be applied to develop a
reconditioning plan for a mine’s ventilation network.
Relevance: The case study used in the article validates the use of key performance
indicators (KPSs) in analysing service delivery. The use of KPIs can be used on
ventilation network analysis where minimal data of the network is available. The
methodology developed in the study could be applied to inactive or decommissioned
mines for developing a simulation model.
Improving the ventilation of deep-level gold mines by simulating inactive sections
19
Analysing a ventilation network not only consists of measurable data but also the correct tools
to make informed discussions. The literature above shows that making use of mathematical
models and simulation software can also be a viable solution for analysing ventilation
networks. However, sometimes areas are too dangerous to enter and collect information for the
purpose of simulation analysis and therefore decommissioned areas need to be analysed with
an alternative approach.
1.4.5 Simulation software for ventilation
Technological advances over the past few decades have brought to light new opportunities to
the international mining industry. Examples of new technology to assist in the mining industry
is simulation software for ventilation networks. It is therefore not surprising that it becomes
essential for ventilation engineers to design and plan ventilation networks to a high degree of
accuracy [64].
It is a complex task to control a mine’s ventilation network. Whether it is to design the
ventilation network or restructure its current operations, the use of specialised software is
required [65] [66]. There is a huge advantage to making use of simulation software, considering
the various number of situations that can occur in a mining operation. From a ventilation
network point of view, the advantages can be summarised as the following [67] [68] [69]:
• Computer simulations can aid in making the right decisions.
• Simulations provide modern exploration possibilities based on the three-dimensional
(3D), virtual model of the existing mining network.
• Engineers and engineering teams can use the simulation software to explore and
evaluate new operating procedures or methods without having to incur the huge capital
costs of experimenting with the existing or real system.
• Computer simulations can help in the initial design phase and in preparing the
restructuring of the network as well.
• Can help with existing and potential problem diagnostics.
Studies have also shown that simulations that use thermo-hydraulic solvers can be used as a
verification technique in operational changes [70] [71] [72] [62]. A thermo-hydraulic solver
considers the pressure drops and temperature variation of an airway and includes the effects of
water [73]. When using simulation software, the level of the data required should also be taken
Improving the ventilation of deep-level gold mines by simulating inactive sections
20
into account [63] The following is a discussion on the different types of ventilation simulation
software that are available.
Process Toolbox (PTB)
Process Toolbox is a transient thermal-hydraulic system simulation and optimisation tool that
enables the user to design, analyse, and optimise system performance [74]. The system’s
network is constructed through system pressure nodes and pipes specifying the flow path.
Process Toolbox uses Drawing eXchange Format (DXF) to build a 3D model of a mine’s
ventilation network [20]. These models can be built on separate layers and connected on later
stages of the building process. PTB also lets the user work with other services in a mine, for
example service water and compressed air and cooling systems.
The following is a list of the features and capabilities of the PTB software [75]:
• The simulation platform has a graphical user interface (GUI) to configure systems
intuitively on a drag-and-drop interface.
• Pressure drops are calculated in the pipes and the thermal-hydraulic properties in the
pressure nodes.
• The gas flow solver is a compressible quasi-steady-state semi-implicit solver.
• The liquid flow solver is an incompressible quasi-steady-state semi-implicit solver.
• The steam flow solver is a two-phase compressible quasi-steady-state semi-implicit
solver.
• The system platform has a component library for fast and easy system configuration.
• The optimisation solver minimises the specified objective value for steady-state and
transient systems or processes considering the optimisation variables and constraints
for any number of time periods and period size.
• The system component inputs, optimisation variables, and optimisation constraints and
outputs automatically expand to match the specified number of time periods.
Vuma-3D
Vuma is a network software used by engineers and practitioners, where the simulation program
is specifically designed to assist underground ventilation control. The software is also used to
design, plan and operate mine ventilation systems. Vuma is an interactive program that allows
Improving the ventilation of deep-level gold mines by simulating inactive sections
21
the steady state simulation of airflow, thermodynamics of air and dust and gas emissions in
underground mines. The 3D model is constructed using DXF files [64].
Ventism
Ventism is a simulation software that is based on an independent platform for mine ventilation
implementation software. The 3D model is created by importing data basis from other mine
design software or ventilation software into the system. With the help of AutoCAD (computer-
aided design) graphic software and DXF’s the model can be created [76] [77].
3D-CANVENTS
3D-Canvent presents a new approach to the automation of simulation software. The software
uses subroutines and macros to increase efficiency and reduce the level of complexity. Creating
the model involves a complex process, which implies a large volume of activity [69] [2].
All the simulation software incorporates thermo-hydraulic solvers, which can solve
incompressible flow. Each simulation software has a certain level of accuracy that is
measurable. The accuracy of the simulation setup can be measured by using the baseline
simulation and verifying the results with the actual collected data from the mine. One of the
most effective methods for calculating or measuring the model setup is by using the mean
absolute error (MAE), according to Friedenstein, Cilliers, and van Rensburg [78]. The MAE
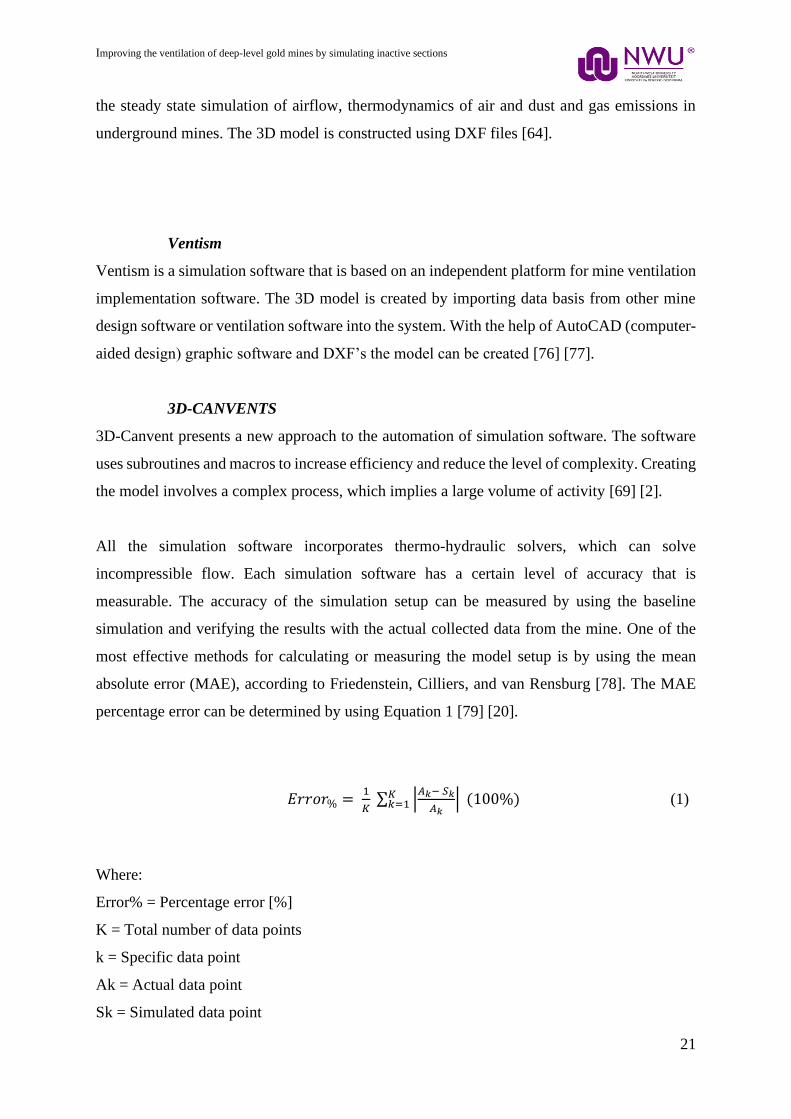
percentage error can be determined by using Equation 1 [79] [20].
𝐸𝑟𝑟𝑜𝑟% = 1
𝐾 ∑ |
𝐴𝑘− 𝑆𝑘
𝐴𝑘| (100%)𝐾
𝑘=1 (1)
Equation 1 Error%
Where:
Error% = Percentage error [%]
K = Total number of data points
k = Specific data point
Ak = Actual data point
Sk = Simulated data point
Improving the ventilation of deep-level gold mines by simulating inactive sections
22
Equation 1 can therefore be a valuable technique for evaluating ventilation simulation models.
Simulation software is a tool used that is not only capable of analysing ventilation networks
but can also be utilised for optimisation projects and planning. The optimisation of a mine’s
ventilation system can be classified into two categories [24]:
• The optimisation of internal adjustment of ventilation networks to select the optimal
parameters to one determined by the ventilation system scheme [80].
• The optimisation of the whole ventilation network [81] [82] [83].
With the large technological advances that have been made with simulation software, the
software enables engineers to analyse and optimise mine systems much more efficiently.
Inaccessible ventilation networks with minimal data can be analysed using software
simulations as an alternative approach.
The software package used further in the dissertation is Process Toolbox (PTB). PTB was
selected as the simulation software due to the following reasons:
• The software is available for use.
• Familiarity with software.
• The capability to analyse compressible flow.
• Capability to analyse incompressible flow for deep-level mines.
• The level of data required to use the software.
• The software incorporates a thermo-hydraulic solver.
1.4.6 Optimisation of ventilation networks
The optimisation of a ventilation network of a mine is a combination of complicated
optimisation problems, which can be described as a path optimisation problem. For over many
years and multiple research papers, there have been many proposed algorithms for optimising
a mine’s ventilation network [84]. Some of these methods are for example the critical path
method, the Hardy Cross method and other more efficient approximation methods [14].
Improving the ventilation of deep-level gold mines by simulating inactive sections
23
Advanced programming techniques have been used to optimise the modelling techniques for
improving computing efficiency [70]. These methods are described as:
The Hardy Cross method
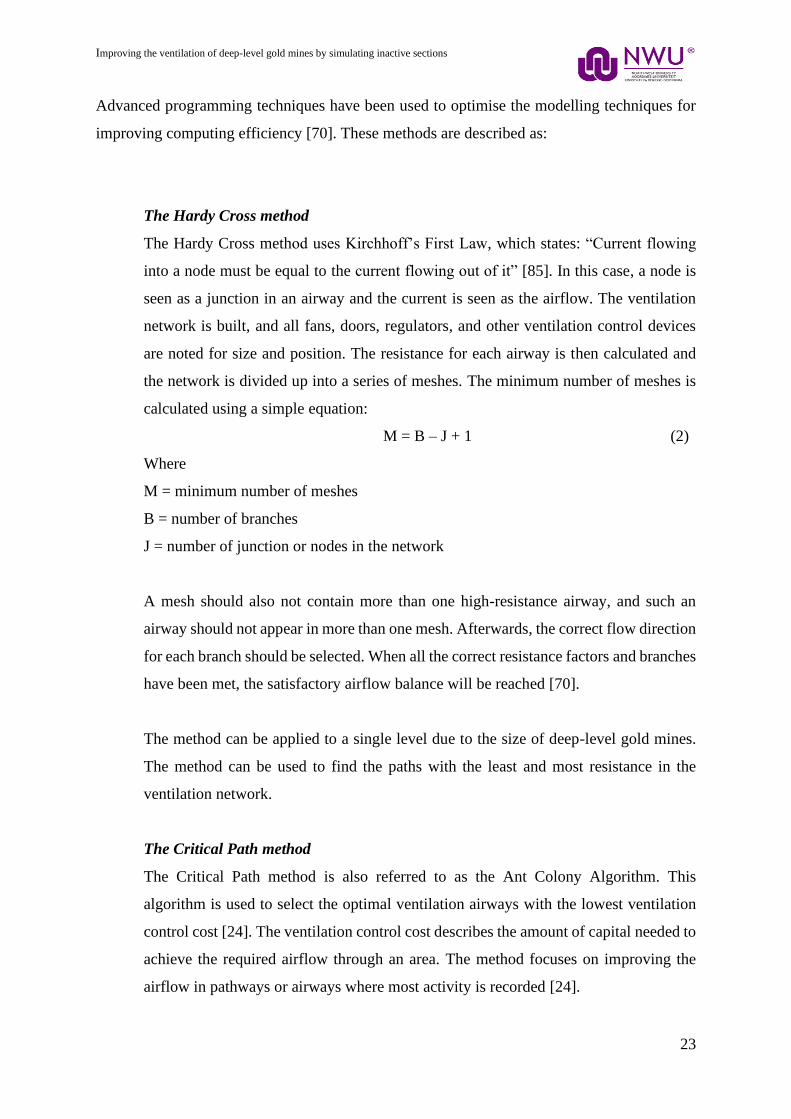
The Hardy Cross method uses Kirchhoff’s First Law, which states: “Current flowing
into a node must be equal to the current flowing out of it” [85]. In this case, a node is
seen as a junction in an airway and the current is seen as the airflow. The ventilation
network is built, and all fans, doors, regulators, and other ventilation control devices
are noted for size and position. The resistance for each airway is then calculated and
the network is divided up into a series of meshes. The minimum number of meshes is
calculated using a simple equation:
M = B – J + 1 (2)
Where
M = minimum number of meshes
B = number of branches
J = number of junction or nodes in the network
A mesh should also not contain more than one high-resistance airway, and such an
airway should not appear in more than one mesh. Afterwards, the correct flow direction
for each branch should be selected. When all the correct resistance factors and branches
have been met, the satisfactory airflow balance will be reached [70].
The method can be applied to a single level due to the size of deep-level gold mines.
The method can be used to find the paths with the least and most resistance in the
ventilation network.
The Critical Path method
The Critical Path method is also referred to as the Ant Colony Algorithm. This
algorithm is used to select the optimal ventilation airways with the lowest ventilation
control cost [24]. The ventilation control cost describes the amount of capital needed to
achieve the required airflow through an area. The method focuses on improving the
airflow in pathways or airways where most activity is recorded [24].
Improving the ventilation of deep-level gold mines by simulating inactive sections
24
The Critical Path Method is a method that can also be used to simplify a ventilation
network and reduce the complexity thereof. A complex level with multiple travel ways
and airways can be reduced to only the critical paths used in the level. This is due to
the critical path being the largest contributor to airflow supply with the least ventilation
control [24].
The mining industry is only made possible through investments of large capital funds. Thus,
mines are looking into short- and long-term optimisation strategies due to shifting mining
activities and the cost implications [86]. As discussed in the previous section of the study, the
use of simulation software is a viable and suitable tool to use for optimising a ventilation
network. The following is a summary of how different simulation software has been used to
optimise a ventilation network of a mine.
The following headings are discussed for each research study:
• Title
• Summary of the study and how the simulation software was used in optimisation.
1. Title [76]: Study of coal mine ventilation system optimisation based on Ventism
Summary: The simulation software Ventism is used to identify airways or tunnels in a
coal mine with higher-than-normal resistance. These airways are then reconditioned to
produce a lower resistance that is more suitable and will result in higher quality airflow.
Thus, using the Ventism optimisation software in ventilation design is practical. The
simulation software simulated the impact of reducing the system resistance of the mine
network.
Relevance: The study shows that simulation software can help in simulating
operational changes of a mine. Simulation software can therefore be used in simulating
inactive sections of a mine for an improvement plan.
2. Title [87]: Estimating underground mine ventilation friction factors from low-
density 3D data acquired by a moving LiDAR.
Improving the ventilation of deep-level gold mines by simulating inactive sections
25
Summary: The study shows how a LiDAR scanner is used to help in the aid of
improving and optimising ventilation models and simulations. The article goes into
more detail about the new technique used in estimating underground drift friction
factors by using 3D data obtained by a small mobile LIDAR scanner.
The use of new technology can increase the accuracy at which simulation models are
created. A more accurate simulation will help to give precise results and help engineers
to make more sustainable decision regarding mining operations underground.
Relevance: The use of new technology on analysing and creating ventilation simulation
models is used in the article. The study illustrates the implementation of new methods
in constructing simulation models, which could apply to mines that are too dangerous
for entry.
3. Title [70]: Optimization of complex mine ventilation systems with computer
network modelling.
Summary: The article discusses the mathematical models and techniques used in
ventilation models that are used in the industry. It also discusses the use of ventilation
simulation models in making engineering decisions and multi-million-dollar
implementations, like adding cooling systems, for a mine ventilation system. The
decision making through simulation is a large focal point in the mining industry as the
cost of projects are extremely expensive.
Relevance: The study shows that the use of simulation on complex mine ventilation
networks can be used for evaluating optimisation projects. Simulation software can be
used for improving ventilation on deep-level gold mines due to their high complexity.
4. Title [88]: An integrated approach towards the optimization of ventilation, air
cooling and pumping requirements for hot mines.
Improving the ventilation of deep-level gold mines by simulating inactive sections
26
Summary: In this study, an analytical simulation was used to create an optimisation
schedule for a mine ventilation network. The study shows that the use of simulation
models is vital. The ventilation network was optimised by implementing ventilation of
demand (VOD). Variable speed drives (VSDs) were used to vary the amount of air
supplied to underground.
Relevance: Air quantities can be optimised by using VSDs on main surface fans. The
impact of surface fans on the ventilation network can thereby be monitored. The process
for the development of the simulation model can be applied to the simulation model for
a decommissioned mine.
5. Title [89]: Improving the ventilation system at Rosh Pinah zinc mine.
Summary: In this study, a simulation was used to improve the underground ventilation
conditions of a zinc mine. It showed that simulation can be used to optimise the
ventilation and improve underground conditions. The desired airflows were achieved
by swapping out the fan size. The airflow was also redirected to achieve optimal air
usage.
Relevance: The optimisation techniques used can be applied to a decommissioned
mine to improve the utilisation of air.
6. Title [90]: The integration of mine simulation and ventilation simulation to develop
a ‘Life-Cycle’ mine ventilation system.
Summary: The study focuses on the integration of the ventilation optimisation and
planning that goes into the overall life cycle of the mine. Simulation software can
provide efficient primary ventilation systems. The VOD method was applied to reduce
the power consumed by the fans.
Relevance: The study incorporates techniques for optimisation into the design of the
ventilation network. The process to incorporate VOD into a ventilation system can be
applied to a decommissioned mine that only requires certain areas to be ventilated.
Improving the ventilation of deep-level gold mines by simulating inactive sections
27
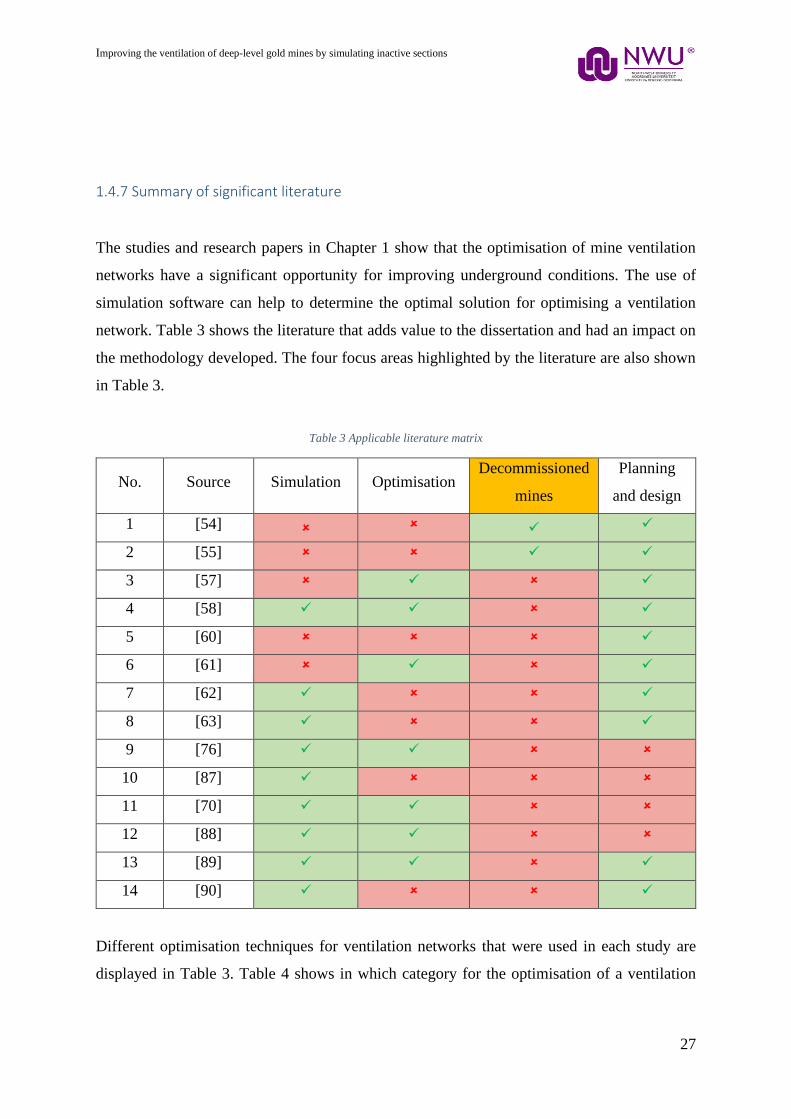
1.4.7 Summary of significant literature
The studies and research papers in Chapter 1 show that the optimisation of mine ventilation
networks have a significant opportunity for improving underground conditions. The use of
simulation software can help to determine the optimal solution for optimising a ventilation
network. Table 3 shows the literature that adds value to the dissertation and had an impact on
the methodology developed. The four focus areas highlighted by the literature are also shown
in Table 3.
Table 3 Applicable literature matrix
No. Source Simulation Optimisation Decommissioned
mines
Planning
and design
1 [54] ✓ ✓
2 [55] ✓ ✓
3 [57] ✓ ✓
4 [58] ✓ ✓ ✓
5 [60] ✓
6 [61] ✓ ✓
7 [62] ✓ ✓
8 [63] ✓ ✓
9 [76] ✓ ✓
10 [87] ✓
11 [70] ✓ ✓
12 [88] ✓ ✓
13 [89] ✓ ✓ ✓
14 [90] ✓ ✓
Different optimisation techniques for ventilation networks that were used in each study are
displayed in Table 3. Table 4 shows in which category for the optimisation of a ventilation
Improving the ventilation of deep-level gold mines by simulating inactive sections
28
network each study falls. These techniques can be applied to inactive sections of a mine
ventilation network.
Table 4 Optimisation techniques used in literature study
Technique of optimisation Study
Complexity elimination 4, 6, 8, and 10
Ventilation on demand 2, 6, 13, and 14
Evaluating system resistance 2 and 3
Air utilisation improvement 1, 4, 5, 7, and 13
Use of key performance indicators 8
The deficiencies or shortcomings of evaluating and optimising ventilation networks as
discussed in the literature are seen in the case of inactive sections or decommissioned mines.
The use of a sealing plan to obstruct air from entering or exiting inactive areas are regarded, in
literature, as an adequate improvement solution. The sealing plan technique falls under the
following categories: elimination of complexity, VOD, an increase of system resistance, and
improvement of air utilisation.
The studies that made use of simulation software for improving ventilation networks of mines
have done so over the year as simulation software improved. The common development phases
for each study using simulation software can be summarised as the following:
1. Obtaining information
2. Simulation model construction
3. Calibrating model
4. Verification of model
5. Optimise system through the assistance of the simulation model
1.5 Need for Study
The increase in mining depth and distance from primary ventilation shafts on deep-level gold
mines increases over a mine’s active years. The increase of gold mining depth has produced a
surge in electricity consumption over the years in meeting ventilation requirements. Improving
the ventilation networks of inactive areas can affect the overall efficiency of a gold mine
Improving the ventilation of deep-level gold mines by simulating inactive sections
29
positively. Thus, there exists a need for optimising inactive areas in a deep-level gold mine to
improve ventilation networks.
1.6 Problem Statement and Study Objective
Inactive sections of decommissioned mine ventilation networks can form part of a
neighbouring mine’s ventilation system. Neighbouring active mines use decommissioned
mines as part of their ventilation system in utilising them as additional RAWs. Large portions
of decommissioned mines have inactive sections still receiving fresh air. The objective of this
study is therefore to simulate the inactive areas to analyse how the airflow through these
sections can be improved. Based on this simulation, a sealing plan must subsequently be
developed and implemented ultimately to improve the flow through active mining sections.
1.7 Overview of Dissertation
A summary of each section in the dissertation is as follows:
Chapter 1
Chapter 1 provided an overview of the current situation of gold mining in South Africa. The
chapter also served as a literature study for the dissertation and highlighted the focus points of
the dissertation. The need for improved ventilation systems, which serves as the primary form
of cooling, was emphasised in the literature. The chapter concluded with a problem statement
and set out the need for the study.
Chapter 2
Chapter 2 introduces a method for evaluating decommissioned or inactive areas of mine
ventilation systems. The chapter goes into detail on how simulation software is used and
provides a guide for the optimisation process. Different types of data that can be collected from
mines are also described, which form part of improving ventilation system of deep-level gold
mines through simulation.
Chapter 3

Improving the ventilation of deep-level gold mines by simulating inactive sections
30
Chapter 3 describes a case study where a decommissioned mine’s ventilation system was
optimised. The simulation was built, and an optimisation solution was developed. The results
for the implemented plan and validation thereof are also discussed.
Chapter 4
Chapter 4 concludes the study and discusses the limitations and further recommendations for
the developed method.
Improving the ventilation of deep-level gold mines by simulating inactive sections
31
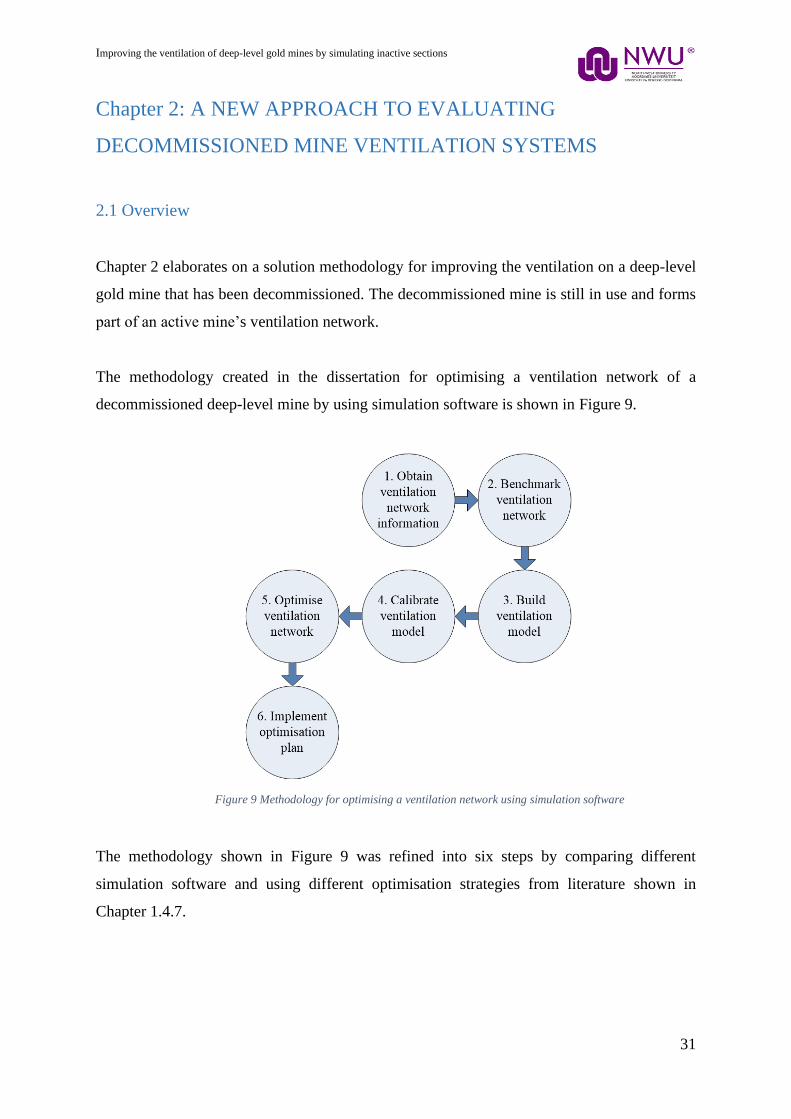
Chapter 2: A NEW APPROACH TO EVALUATING
DECOMMISSIONED MINE VENTILATION SYSTEMS
2.1 Overview
Chapter 2 elaborates on a solution methodology for improving the ventilation on a deep-level
gold mine that has been decommissioned. The decommissioned mine is still in use and forms
part of an active mine’s ventilation network.
The methodology created in the dissertation for optimising a ventilation network of a
decommissioned deep-level mine by using simulation software is shown in Figure 9.
Figure 9 Methodology for optimising a ventilation network using simulation software
The methodology shown in Figure 9 was refined into six steps by comparing different
simulation software and using different optimisation strategies from literature shown in
Chapter 1.4.7.
Improving the ventilation of deep-level gold mines by simulating inactive sections
32
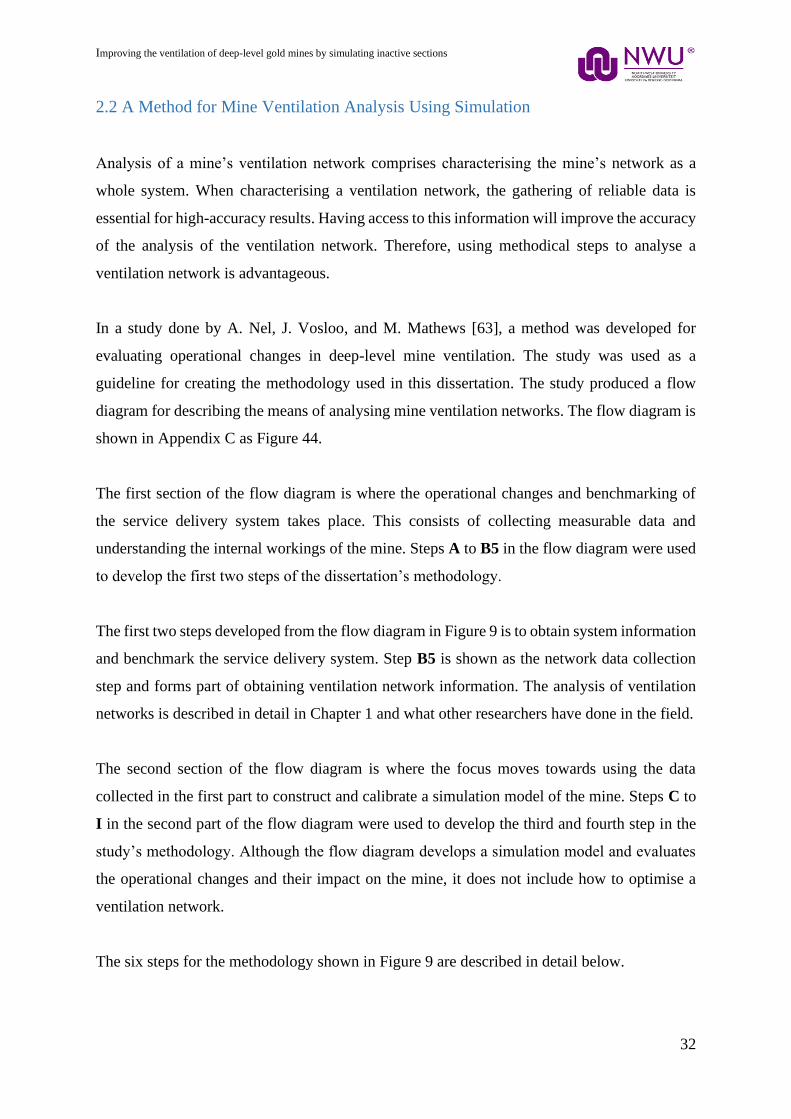
2.2 A Method for Mine Ventilation Analysis Using Simulation
Analysis of a mine’s ventilation network comprises characterising the mine’s network as a
whole system. When characterising a ventilation network, the gathering of reliable data is
essential for high-accuracy results. Having access to this information will improve the accuracy
of the analysis of the ventilation network. Therefore, using methodical steps to analyse a
ventilation network is advantageous.
In a study done by A. Nel, J. Vosloo, and M. Mathews [63], a method was developed for
evaluating operational changes in deep-level mine ventilation. The study was used as a
guideline for creating the methodology used in this dissertation. The study produced a flow
diagram for describing the means of analysing mine ventilation networks. The flow diagram is
shown in Appendix C as Figure 44.
The first section of the flow diagram is where the operational changes and benchmarking of
the service delivery system takes place. This consists of collecting measurable data and
understanding the internal workings of the mine. Steps A to B5 in the flow diagram were used
to develop the first two steps of the dissertation’s methodology.
The first two steps developed from the flow diagram in Figure 9 is to obtain system information
and benchmark the service delivery system. Step B5 is shown as the network data collection
step and forms part of obtaining ventilation network information. The analysis of ventilation
networks is described in detail in Chapter 1 and what other researchers have done in the field.
The second section of the flow diagram is where the focus moves towards using the data
collected in the first part to construct and calibrate a simulation model of the mine. Steps C to
I in the second part of the flow diagram were used to develop the third and fourth step in the
study’s methodology. Although the flow diagram develops a simulation model and evaluates
the operational changes and their impact on the mine, it does not include how to optimise a
ventilation network.
The six steps for the methodology shown in Figure 9 are described in detail below.
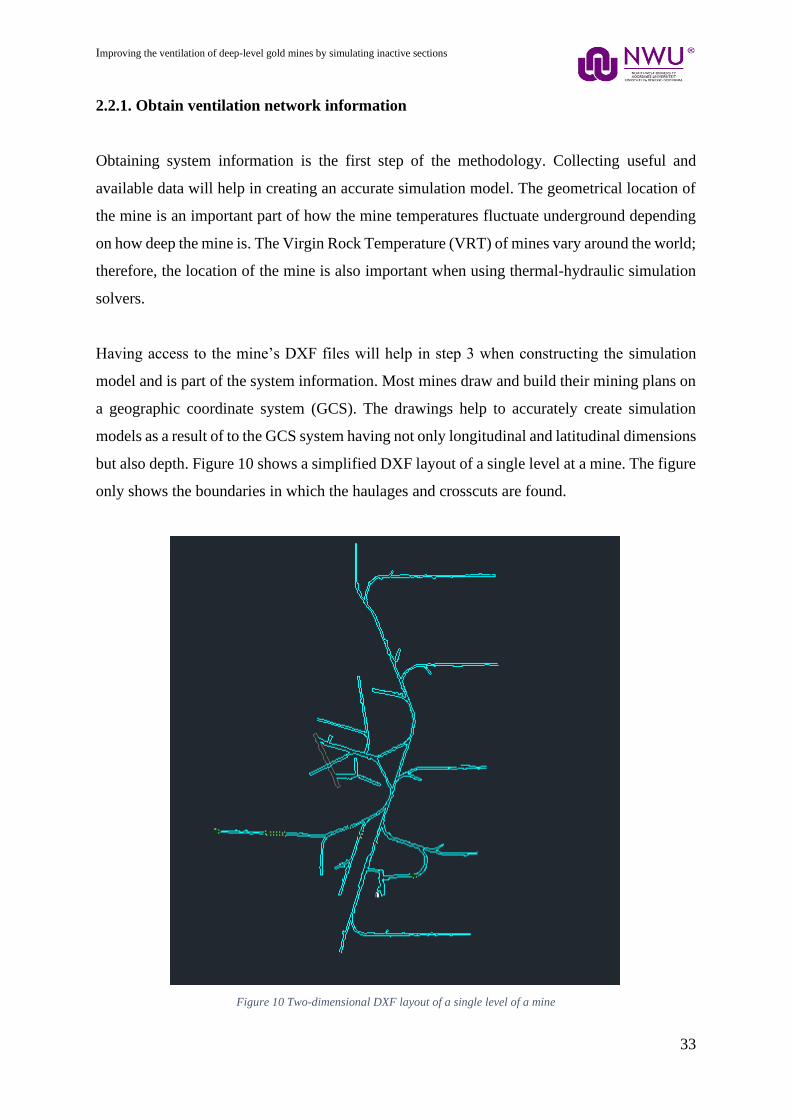
Improving the ventilation of deep-level gold mines by simulating inactive sections
33
2.2.1. Obtain ventilation network information
Obtaining system information is the first step of the methodology. Collecting useful and
available data will help in creating an accurate simulation model. The geometrical location of
the mine is an important part of how the mine temperatures fluctuate underground depending
on how deep the mine is. The Virgin Rock Temperature (VRT) of mines vary around the world;
therefore, the location of the mine is also important when using thermal-hydraulic simulation
solvers.
Having access to the mine’s DXF files will help in step 3 when constructing the simulation
model and is part of the system information. Most mines draw and build their mining plans on
a geographic coordinate system (GCS). The drawings help to accurately create simulation
models as a result of to the GCS system having not only longitudinal and latitudinal dimensions
but also depth. Figure 10 shows a simplified DXF layout of a single level at a mine. The figure
only shows the boundaries in which the haulages and crosscuts are found.
Figure 10 Two-dimensional DXF layout of a single level of a mine
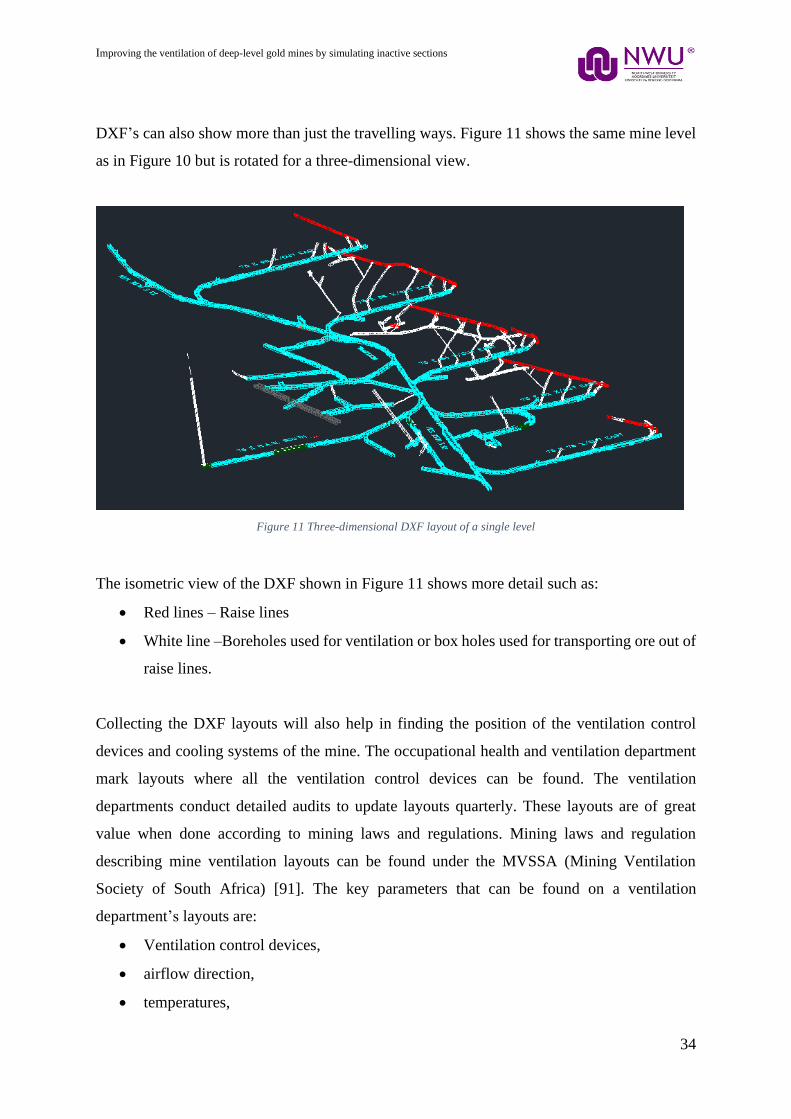
Improving the ventilation of deep-level gold mines by simulating inactive sections
34
DXF’s can also show more than just the travelling ways. Figure 11 shows the same mine level
as in Figure 10 but is rotated for a three-dimensional view.
Figure 11 Three-dimensional DXF layout of a single level
The isometric view of the DXF shown in Figure 11 shows more detail such as:
• Red lines – Raise lines
• White line –Boreholes used for ventilation or box holes used for transporting ore out of
raise lines.
Collecting the DXF layouts will also help in finding the position of the ventilation control
devices and cooling systems of the mine. The occupational health and ventilation department
mark layouts where all the ventilation control devices can be found. The ventilation
departments conduct detailed audits to update layouts quarterly. These layouts are of great
value when done according to mining laws and regulations. Mining laws and regulation
describing mine ventilation layouts can be found under the MVSSA (Mining Ventilation
Society of South Africa) [91]. The key parameters that can be found on a ventilation
department’s layouts are:
• Ventilation control devices,
• airflow direction,
• temperatures,

Improving the ventilation of deep-level gold mines by simulating inactive sections
35
• air mass flow,
• fresh air intakes,
• return air ways and
• barometric pressure.
The key parameters found in the ventilation department will be required to enable
benchmarking. Using the layouts with the information provided by them is an adequate way to
obtain system information, especially when underground visits are not possible.
Simulation model accuracy is dependent on the type of data and information collected.
Different levels of data are found at a mine, ranging from low-level to high-level data. Mines
have network systems available called SCADA systems. Due to decommissioned mines having
limited information and literature available the obtaining of information or data can be difficult.
The following is a list and description of the level of data that can be acquired from a mine
[20].
SCADA data: The Supervisory Control and Data Acquisition (SCADA) system of a mine uses
a network to collect data and data communication for supervision. Controlling and managing
complex systems is the main goal of the SCADA network. The data collected by the system is
stored and can be accessed to view operating conditions and mining trends. SCADA data can
produce accurate simulation due to the large amount of data that the system can recall and
produce.
Low-level data: Low-level data can produce the most accurate simulation models. This is the
most detailed data available from the mine. The data includes airflow quantities, temperature,
and barometric pressure, which forms the key measuring characteristic of ventilation. Low-
level data can be found on a mine’s SCADA system if the mine is equipped with
instrumentation to supply the level of data.
Intermediate-level data: Intermediate data can be described as a data level that gives the status
of a subsection. An example of this in a mining environment would be to only have data for
the intake and return conditions of a mine’s levels. This data will help in constructing a mass
balance of the mine.
Improving the ventilation of deep-level gold mines by simulating inactive sections
36
High-level data: Using high-level data does not produce the highest accuracy when used. This
type of data only characterises KPIs of a mine ventilation network. A KPI is a quantifiable
measure that is used to gauge or compare performance in terms of meeting strategic and
operational goals [92]. Therefore, KPIs must be aligned with the objectives.
The KPIs of mines vary since ventilation networks of mines are not all the same. Examples of
KPIs of a mine ventilation network are total airflow into the mine, surface fan airflow
quantities, average haulage airflow, average face velocity, average stope airflow, auxiliary
fans, and main surface fans.
Manual measured data: Manual measurements are also only possible where it is safe to enter,
and this can be a constraint for decommissioned mines or areas. When or where SCADA data
is unavailable, the data needed can be collected through manual measurements. Conducting
manual measurements can yield a high accuracy simulation in ideal conditions. Data from
SCADA can be wrong due to uncalibrated equipment or instrumentation, but it can be verified
with manual measurements. It is always good engineering practice to do sanity checks on
collected data for increased accuracy on simulations.
Since mines are highly active and changing, the use of manual measurements cannot give a full
profile of underground changes since they are instantaneous measurements [20]. However, this
method of data collecting is an adequate method for benchmarking the service delivery system.
The techniques and methods used in manual measurements are described in detail in Section
1.2 under ventilation network analysis.
2.2.2. Benchmark ventilation network
Benchmarking the service delivery and ventilation network is an iterative process. A mine’s
network data is required when creating and calibrating a simulation model. Benchmarking the
service delivery, in this case the ventilation system of a mine, can be done in different ways.
The benchmarking is dependent on the type of data that is available to the user. Table 2 in
Chapter 1 shows the different parameters that can be used for benchmarking a ventilation
network and creating a baseline simulation model.
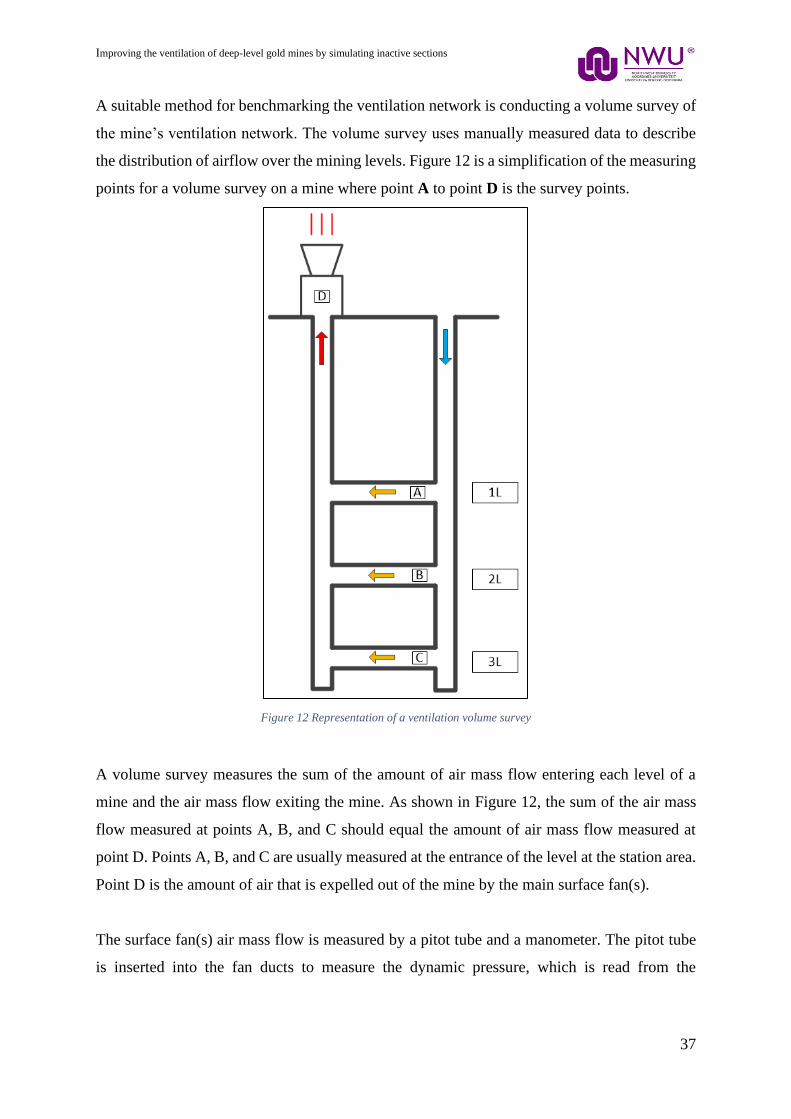
Improving the ventilation of deep-level gold mines by simulating inactive sections
37
A suitable method for benchmarking the ventilation network is conducting a volume survey of
the mine’s ventilation network. The volume survey uses manually measured data to describe
the distribution of airflow over the mining levels. Figure 12 is a simplification of the measuring
points for a volume survey on a mine where point A to point D is the survey points.
Figure 12 Representation of a ventilation volume survey
A volume survey measures the sum of the amount of air mass flow entering each level of a
mine and the air mass flow exiting the mine. As shown in Figure 12, the sum of the air mass
flow measured at points A, B, and C should equal the amount of air mass flow measured at
point D. Points A, B, and C are usually measured at the entrance of the level at the station area.
Point D is the amount of air that is expelled out of the mine by the main surface fan(s).
The surface fan(s) air mass flow is measured by a pitot tube and a manometer. The pitot tube
is inserted into the fan ducts to measure the dynamic pressure, which is read from the
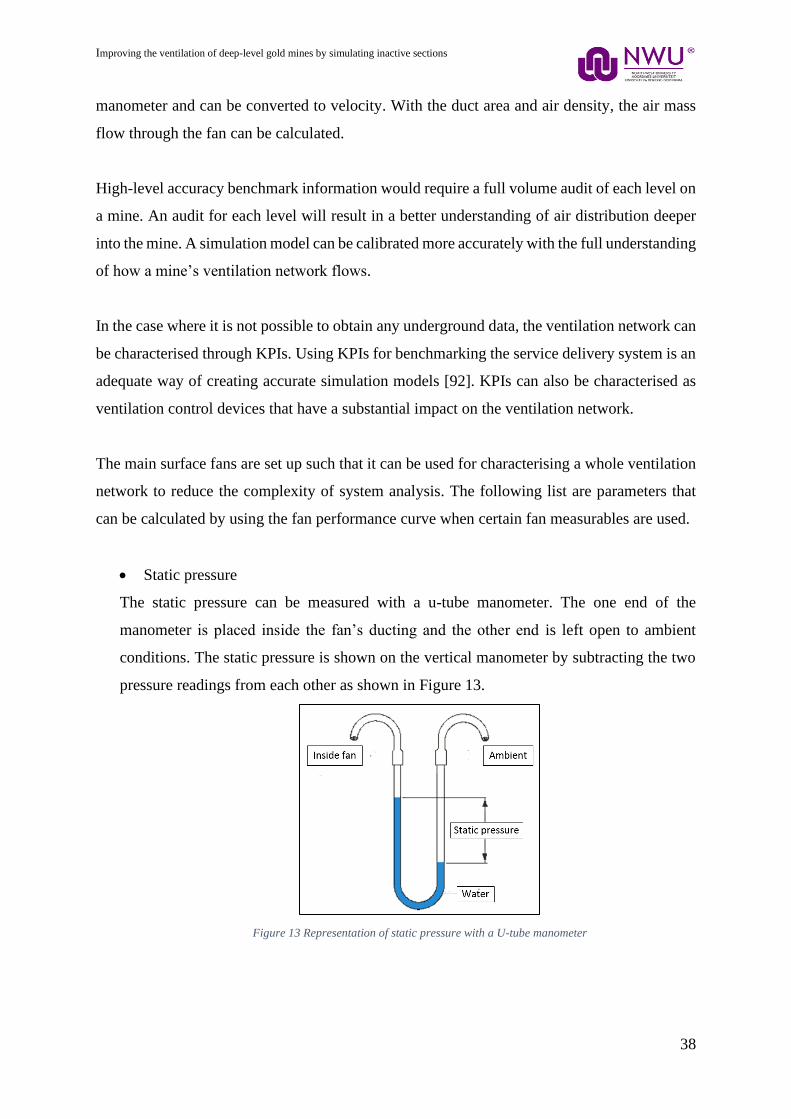
Improving the ventilation of deep-level gold mines by simulating inactive sections
38
manometer and can be converted to velocity. With the duct area and air density, the air mass
flow through the fan can be calculated.
High-level accuracy benchmark information would require a full volume audit of each level on
a mine. An audit for each level will result in a better understanding of air distribution deeper
into the mine. A simulation model can be calibrated more accurately with the full understanding
of how a mine’s ventilation network flows.
In the case where it is not possible to obtain any underground data, the ventilation network can
be characterised through KPIs. Using KPIs for benchmarking the service delivery system is an
adequate way of creating accurate simulation models [92]. KPIs can also be characterised as
ventilation control devices that have a substantial impact on the ventilation network.
The main surface fans are set up such that it can be used for characterising a whole ventilation
network to reduce the complexity of system analysis. The following list are parameters that
can be calculated by using the fan performance curve when certain fan measurables are used.
• Static pressure
The static pressure can be measured with a u-tube manometer. The one end of the
manometer is placed inside the fan’s ducting and the other end is left open to ambient
conditions. The static pressure is shown on the vertical manometer by subtracting the two
pressure readings from each other as shown in Figure 13.
Figure 13 Representation of static pressure with a U-tube manometer

Improving the ventilation of deep-level gold mines by simulating inactive sections
39
• System resistance
System resistance can be calculated by using the fan performance curve. This process is
described in more detail in Chapter 1.4.2.
• Power
If an ammeter is installed on the fan the measured amps can be converted to power. The
conversion from amps to power can be done by multiplying the measured amps by the input
voltage.
• Volume flow rate
The volume flow rate can be measured manually as described in Chapter 1.4.4. If manual
measurements are not possible the volume flow rate can be read off by using the power
value and static pressure.
The fan characteristic that should stay constant to be able to obtain the values is the guide vane
angle if there are any. The fan resistance curve will be the most valuable for benchmarking the
system, as this curve describes the total resistance of the ventilation network. In the software
PTB, the set-up for the surface fans required three points from the fan performance curve. The
three points that can be selected are shown in Figure 14.
Figure 14 Fan characteristics for simulation software
Improving the ventilation of deep-level gold mines by simulating inactive sections
40
The three points that are selected each reads the static pressure, flow for the specific pressure
and efficiency rating at the specific flow. The points that are selected should contain the
baseline operating point for the surface fan.
2.2.3. Build ventilation model
Step 3 will result in a theoretical model of the mine’s ventilation network. The model will only
be a representation of how the ventilation network of the mine should function in an ideal
world. However, this is not the case since multiple variables play a role in the mine. The model
therefore requires to be calibrated so that it can be used for optimisation projects.
Building the simulation can begin once the required data has been obtained and is found to be
satisfactory. When selecting a simulation software package to use, the level of the solution
should be considered. High accuracy results can be achieved by using a 3D software package
that incorporates a thermal-hydraulic solver and solves mass balances. The simulation software
package that was selected to use for the dissertation was PTB. The reasons that PTB was
selected are explained in Chapter 1.
The mining network can be assembled in the simulation software by using the DXF files and
data collected in the previous steps. In the unusual case where DXF files are not available,
perhaps due to a mine’s age, the GCS system can be used. Figure 15 shows how the coordinates
are entered into the PTB simulation software.
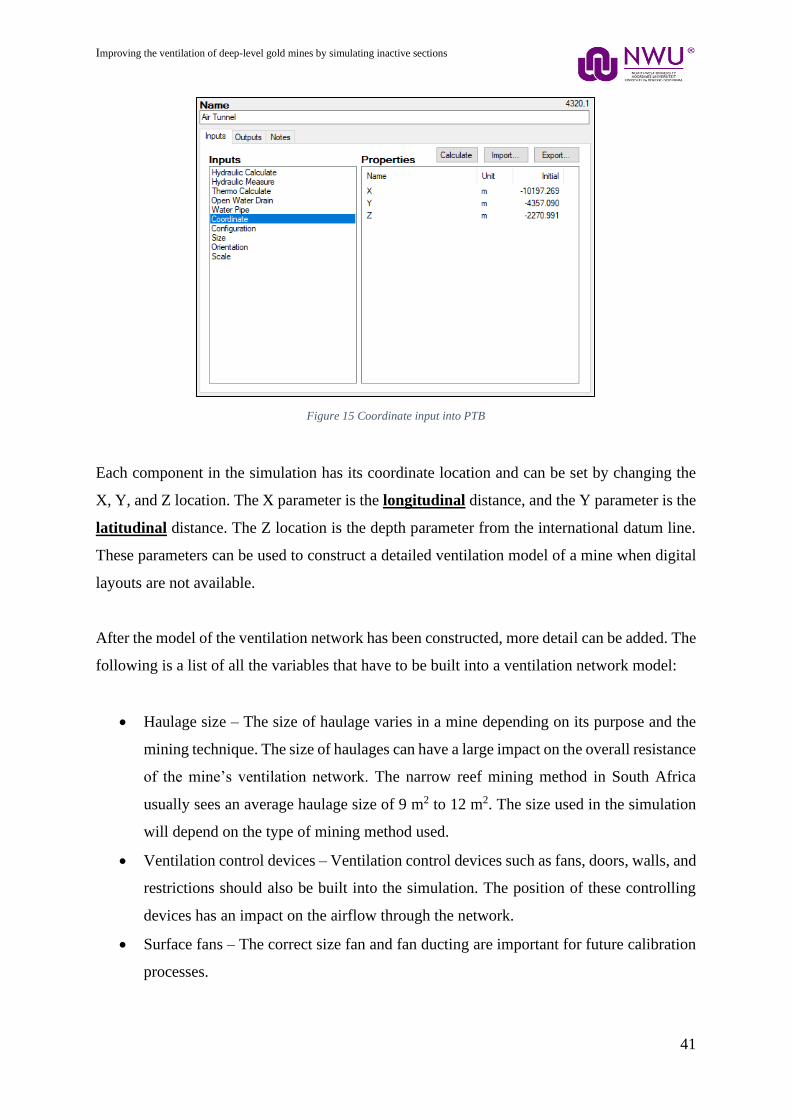
Improving the ventilation of deep-level gold mines by simulating inactive sections
41
Figure 15 Coordinate input into PTB
Each component in the simulation has its coordinate location and can be set by changing the
X, Y, and Z location. The X parameter is the longitudinal distance, and the Y parameter is the
latitudinal distance. The Z location is the depth parameter from the international datum line.
These parameters can be used to construct a detailed ventilation model of a mine when digital
layouts are not available.
After the model of the ventilation network has been constructed, more detail can be added. The
following is a list of all the variables that have to be built into a ventilation network model:
• Haulage size – The size of haulage varies in a mine depending on its purpose and the
mining technique. The size of haulages can have a large impact on the overall resistance
of the mine’s ventilation network. The narrow reef mining method in South Africa
usually sees an average haulage size of 9 m2 to 12 m2. The size used in the simulation
will depend on the type of mining method used.
• Ventilation control devices – Ventilation control devices such as fans, doors, walls, and
restrictions should also be built into the simulation. The position of these controlling
devices has an impact on the airflow through the network.
• Surface fans – The correct size fan and fan ducting are important for future calibration
processes.
Improving the ventilation of deep-level gold mines by simulating inactive sections
42
The mining model created in the simulation software can be described as the mine skeleton.
The mine skeleton is a representation of the mine’s ventilation system and is an uncalibrated
model.
2.2.4. Calibrate ventilation model
The next step is selecting boundary points in the simulation for calibrating the simulation
model. The boundary points serve as individual constraints for each parameter that is simulated.
Simulation boundaries are determined through the selected KPIs of the ventilation system.
The calibration process is an iterative process that uses the collected data from previous steps.
An average operating point can be programmed into the model for the first iteration. The
calibration process consists of multiple iterations. The different parameters to consider for
calibration are air mass flow, barometric pressures, temperature and humidity. The following
details how the parameters can be calibrated in a simulation model:
Air mass flow and barometric pressure
There is a direct correlation between air mass flow and barometric pressure and as such need
to be calibrated simultaneously. Both the air mass flow and barometric pressure are affected
by depth. The resistance of a mine plays a substantial role in the airflow through the mine.
Resistance can be adjusted for obtaining the correct flow through tunnels, ducting, and shafts.
The correlation between resistance and airflow is as follows:
Higher system resistance = Lower airflow = Higher pressure difference
Lower system resistance = Higher airflow = Lower pressure difference
The PTB simulation software uses a friction coefficient and tunnel fraction to meet the required
resistance. A more accurate way to achieve the correct resistance is by increasing or decreasing
the friction coefficient of the tunnels, but only when the area of the haulages in the mine are
accurately built into the simulation software.
Changing the resistance of a mine’s area that cannot be entered is extremely challenging. In
this event, selecting a KPI to indicate the calibration level of the area is useful. Fans and main
Improving the ventilation of deep-level gold mines by simulating inactive sections
43
fans play the largest role in the air mass flow and barometric pressure of the mine, as stated in
Chapter 1. A fan’s operating point can be adjusted to produce the needed pressure and airflow.
Given the characteristics of primary fans and their impact on a ventilation system, they can be
a useful KPI of the whole ventilation system.
Temperature and humidity
The temperature calibration can follow a step-by-step process. The process for calibrating the
temperature is as follows:
1. Calculate the VRT [93] – The VRT is a constant for any fixed location. The constant
takes into account the area of the mine, depth of the level, and age of the haulage.
This will produce the heat added to the mine from the rock faces.
2. Add additional heat contributors – Mechanised equipment, lights, and personnel are
a part of heat generators in a mine [94]. Each component contributes to the heat
pickup and can therefore be added to the simulation model. Heat loads done on a
mine can produce the total heat added to the system by different components [95].
The humidity can be calibrated by adjusting the amount of moisture that is added by
components to the air of the system. Humidity is a ratio that can be calculated on a
psychometric chart between the dry-bulb and wet-bulb temperature at a certain pressure.
Therefore, the humidity is already produced once the wet-bulb temperature, dry-bulb
temperature, and barometric pressure have been calibrated.
In the PTB simulation software, the heat added to the system is adjusted through the tunnels
that make up the simulation model. The following is a list of the parameters that can be set and
changed for calibration:
• Virgin rock temperature – (ºC/m)
• Rock specific heat – (kJ/kg/ºC)
• Wet area fraction
• Heat – Used to add heat to the system from additional heat contributors.
The simulation accuracy of the calibrated model must be verified by comparing the simulated
data with the actual data. To verify the model’s calibration accuracy, the MAE method is used,
as shown in Equation 2. The points measured should correspond to the points in the simulation
Improving the ventilation of deep-level gold mines by simulating inactive sections
44
within a 10% error margin for the simulation to be deemed adequate and have accurate results
for optimisation [96] [97].
2.2.5. Optimise ventilation network
The focus of the dissertation is on improving a deep-level gold mine’s ventilation network by
simulating inactive sections. Previous literature shows that using simulation software is a
suitable method for optimising a ventilation network. Comparing the current ventilation system
with its ideal conditions will help to identify inefficiencies. An efficient system provides the
required amount of air at the defined working areas and travelling ways without using excessive
electrical power.
The impact of the optimisation plan can be evaluated by implementing an optimisation plan in
the simulation model. The simulation software makes it easy to evaluate possible optimisation
solutions.
The following subsection discusses how a ventilation network can be optimised.
Complexity elimination
The extensive size of ventilation networks makes it an ideal area to reduce or eliminate
complexity. Complexity elimination can be done in various ways, from reducing the ventilation
control devices to reducing the number of airways used. A sealing plan is such a method used
for reducing complexity when areas are inactive or have been mined out. Figure 16 shows an
example of how a sealing plan can reduce complexity in a mine.
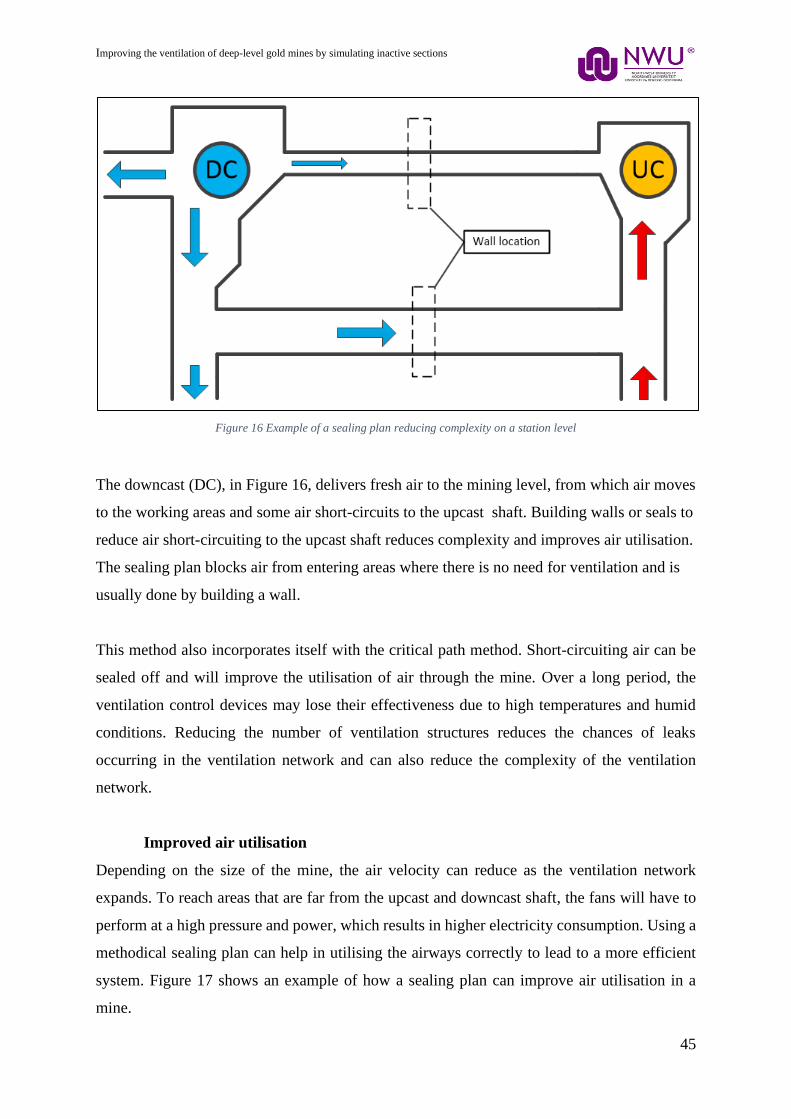
Improving the ventilation of deep-level gold mines by simulating inactive sections
45
Figure 16 Example of a sealing plan reducing complexity on a station level
The downcast (DC), in Figure 16, delivers fresh air to the mining level, from which air moves
to the working areas and some air short-circuits to the upcast shaft. Building walls or seals to
reduce air short-circuiting to the upcast shaft reduces complexity and improves air utilisation.
The sealing plan blocks air from entering areas where there is no need for ventilation and is
usually done by building a wall.
This method also incorporates itself with the critical path method. Short-circuiting air can be
sealed off and will improve the utilisation of air through the mine. Over a long period, the
ventilation control devices may lose their effectiveness due to high temperatures and humid
conditions. Reducing the number of ventilation structures reduces the chances of leaks
occurring in the ventilation network and can also reduce the complexity of the ventilation
network.
Improved air utilisation
Depending on the size of the mine, the air velocity can reduce as the ventilation network
expands. To reach areas that are far from the upcast and downcast shaft, the fans will have to
perform at a high pressure and power, which results in higher electricity consumption. Using a
methodical sealing plan can help in utilising the airways correctly to lead to a more efficient
system. Figure 17 shows an example of how a sealing plan can improve air utilisation in a
mine.
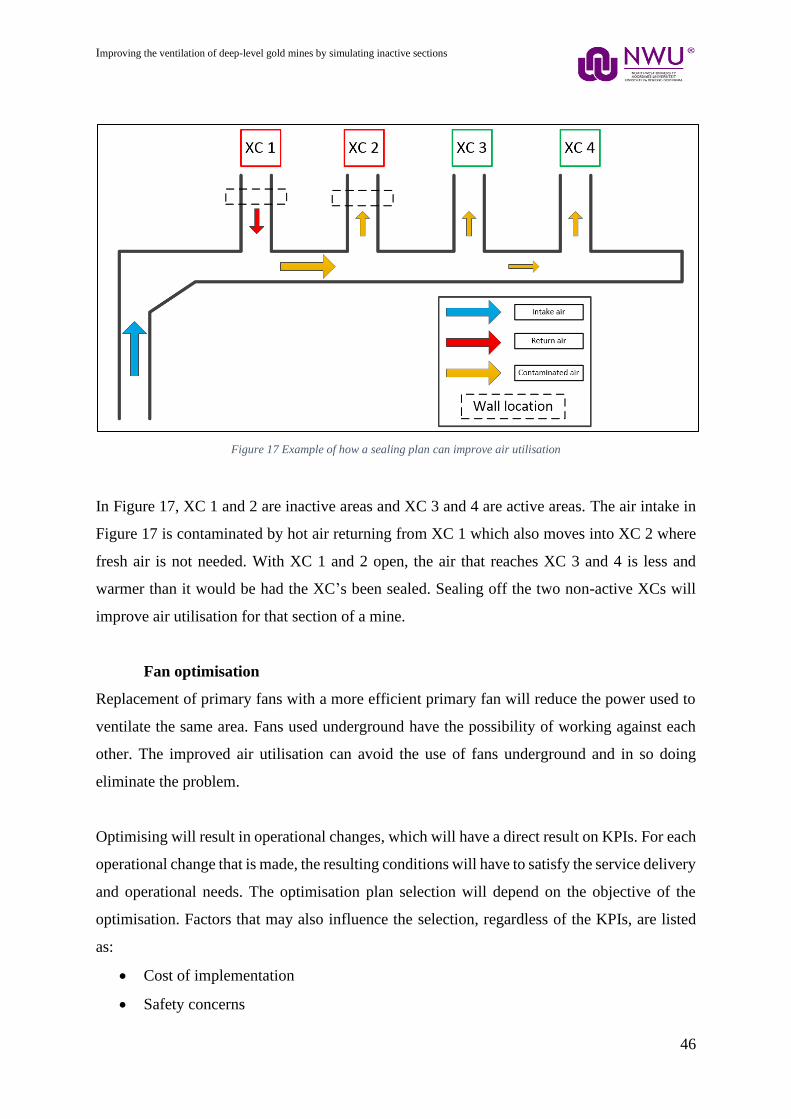
Improving the ventilation of deep-level gold mines by simulating inactive sections
46
Figure 17 Example of how a sealing plan can improve air utilisation
In Figure 17, XC 1 and 2 are inactive areas and XC 3 and 4 are active areas. The air intake in
Figure 17 is contaminated by hot air returning from XC 1 which also moves into XC 2 where
fresh air is not needed. With XC 1 and 2 open, the air that reaches XC 3 and 4 is less and
warmer than it would be had the XC’s been sealed. Sealing off the two non-active XCs will
improve air utilisation for that section of a mine.
Fan optimisation
Replacement of primary fans with a more efficient primary fan will reduce the power used to
ventilate the same area. Fans used underground have the possibility of working against each
other. The improved air utilisation can avoid the use of fans underground and in so doing
eliminate the problem.
Optimising will result in operational changes, which will have a direct result on KPIs. For each
operational change that is made, the resulting conditions will have to satisfy the service delivery
and operational needs. The optimisation plan selection will depend on the objective of the
optimisation. Factors that may also influence the selection, regardless of the KPIs, are listed
as:
• Cost of implementation
• Safety concerns

Improving the ventilation of deep-level gold mines by simulating inactive sections
47
• Ease of implementation
2.2.6. Implement optimisation plan
The optimisation plan that is developed for optimising a deep-level gold mine’s ventilation
network will be implemented and evaluated. After implementation, the plan must be validated
to see if it was successful. The plan can be revisited and changed if necessary to achieve the
set goals of the strategy.
2.3 Expectation from implementation of methodology
The objective of this dissertation is to improve a deep-level gold mine’s ventilation network.
The expected results section is a prediction of the outcomes for a possible case study that
involves a decommissioned or inactive area in a mine. The expected results are derived from
the literature study in Chapter 1.
The challenge with inactive sections of mines it that there is little to no information available
to benchmark the ventilation network. Conducting manual measurement audits underground
can also be challenging or not feasible due to health and safety concerns. Using the main
surface fans as a KPI to benchmark the ventilation network is a suggested option for
benchmarking the system and evaluating the impact of the proposed reconditioning plan. The
expected results will be shown by the simulation software together with whether the
reconditioning plan for the mine’s network is feasible.
The implementation of a reconditioning plan for the ventilation network is expected to improve
air utilisation. Figure 18 shows the expected outcome of the fan performance curve from the
reconditioning plan.
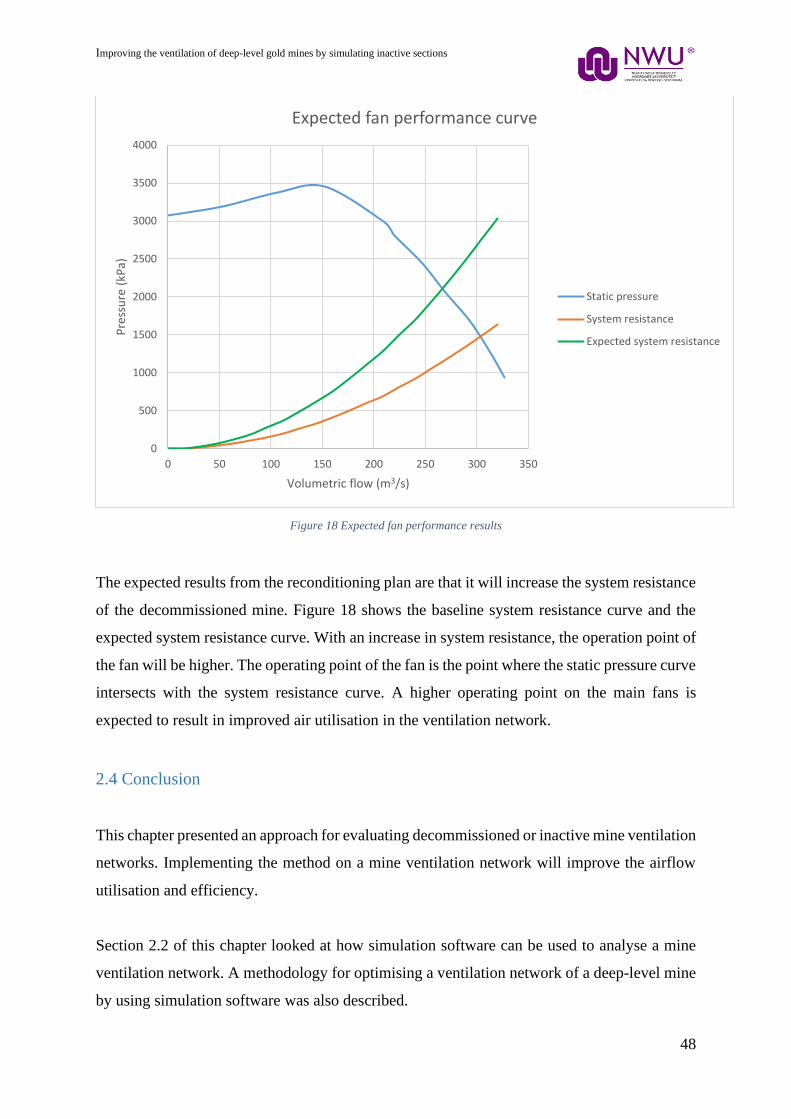
Improving the ventilation of deep-level gold mines by simulating inactive sections
48
Figure 18 Expected fan performance results
The expected results from the reconditioning plan are that it will increase the system resistance
of the decommissioned mine. Figure 18 shows the baseline system resistance curve and the
expected system resistance curve. With an increase in system resistance, the operation point of
the fan will be higher. The operating point of the fan is the point where the static pressure curve
intersects with the system resistance curve. A higher operating point on the main fans is
expected to result in improved air utilisation in the ventilation network.
2.4 Conclusion
This chapter presented an approach for evaluating decommissioned or inactive mine ventilation
networks. Implementing the method on a mine ventilation network will improve the airflow
utilisation and efficiency.
Section 2.2 of this chapter looked at how simulation software can be used to analyse a mine
ventilation network. A methodology for optimising a ventilation network of a deep-level mine
by using simulation software was also described.
0
500
1000
1500
2000
2500
3000
3500
4000
0 50 100 150 200 250 300 350
Pre
ssu
re (
kPa)
Volumetric flow (m3/s)
Expected fan performance curve
Static pressure
System resistance
Expected system resistance

Improving the ventilation of deep-level gold mines by simulating inactive sections
49
Section 2.3 indicated the expected results from the use of main surface fans as the KPI.
Improving the ventilation of deep-level gold mines by simulating inactive sections
50
Chapter 3: RESULTS
3.1 Introduction
Chapter 3 applies the method discussed in Chapter 2 to a deep-level gold mine’s ventilation
network. Simulation software is used to construct a model of the mine and evaluate the
optimisation plan set out for optimising the ventilation network. The mine that was selected as
the case study is a decommissioned deep-level gold mine in South Africa. The optimisation
plan for reconditioning the mine’s ventilation network was implemented on the case study mine
and then evaluated.
3.2 Case Study Results
The section of Chapter 2 discusses the case study used for the dissertation and the results that
were obtained. The results that were obtained was used to evaluate the use of simulation
software to optimise the ventilation network. Included in the results are the volumes that were
achieved and not the cost impact of the optimisation. The cost impact or reduction was not
evaluated in the dissertation.
3.2.1 Reconditioning of mines A’s ventilation network
A decommissioned deep-level gold mine’s ventilation network in South Africa was selected as
a case study. A simplified representation of the cross section view of the case study mine is
shown in Figure 19.
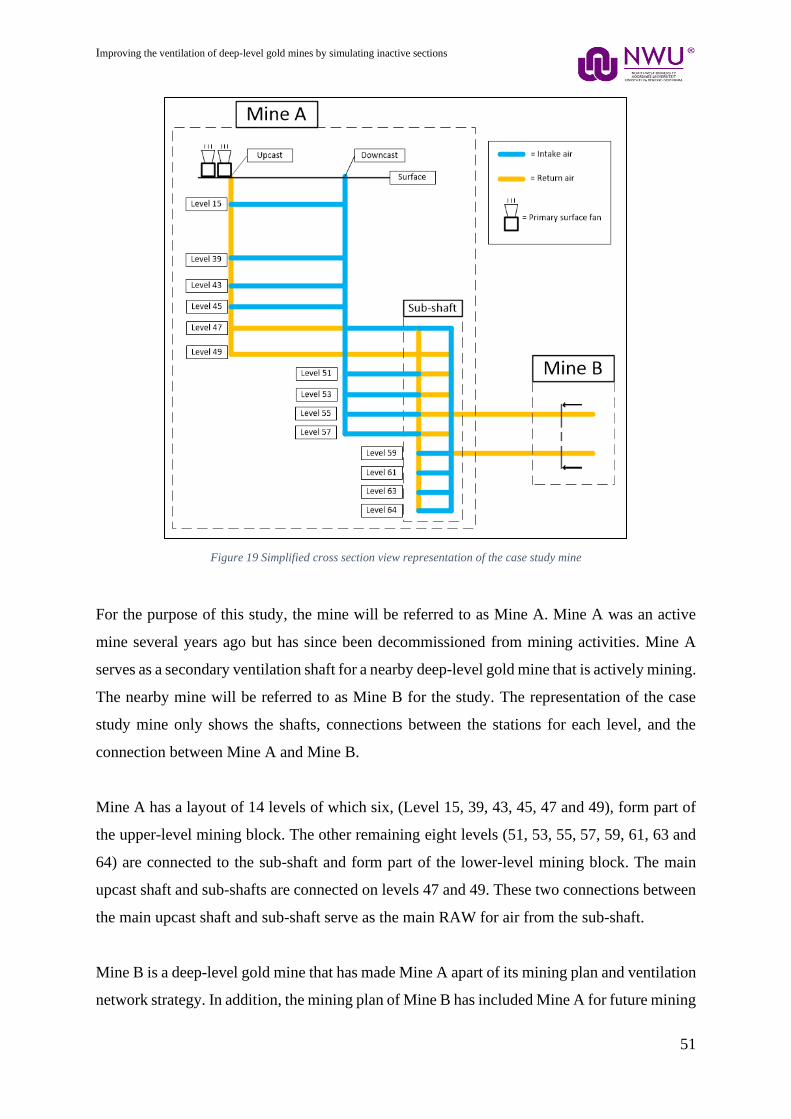
Improving the ventilation of deep-level gold mines by simulating inactive sections
51
Figure 19 Simplified cross section view representation of the case study mine
For the purpose of this study, the mine will be referred to as Mine A. Mine A was an active
mine several years ago but has since been decommissioned from mining activities. Mine A
serves as a secondary ventilation shaft for a nearby deep-level gold mine that is actively mining.
The nearby mine will be referred to as Mine B for the study. The representation of the case
study mine only shows the shafts, connections between the stations for each level, and the
connection between Mine A and Mine B.
Mine A has a layout of 14 levels of which six, (Level 15, 39, 43, 45, 47 and 49), form part of
the upper-level mining block. The other remaining eight levels (51, 53, 55, 57, 59, 61, 63 and
64) are connected to the sub-shaft and form part of the lower-level mining block. The main
upcast shaft and sub-shafts are connected on levels 47 and 49. These two connections between
the main upcast shaft and sub-shaft serve as the main RAW for air from the sub-shaft.
Mine B is a deep-level gold mine that has made Mine A apart of its mining plan and ventilation
network strategy. In addition, the mining plan of Mine B has included Mine A for future mining
Improving the ventilation of deep-level gold mines by simulating inactive sections
52
ventilation needs. Mine B’s plan is to extend mining activities towards the decommissioned
mine in the near future. These advances have made it all the more feasible to use Mine A as a
ventilation shaft. The two mines are connected by two levels, and these levels are level 55 and
level 59. However, old mining areas that are inactive are still open on other levels with
connecting raises.
Mine B also has two auxiliary fans on 55L that is positioned inside the RAW. The two fans are
used to return air from Mine B to Mine A. Optimising Mine A’s ventilation network will
contribute to the effectiveness of using it as a ventilation shaft for Mine B. The ventilation
network of Mine A is analysed and evaluated in the following section to optimise the system.
3.2.2 Application of method
The method shown in Figure 9 was applied to the ventilation network of Mine A. A simulation
model was constructed and used to evaluate a proposal to optimise the ventilation network. The
following section provides a step-by-step discussion of how the method was applied to the
case study mine.
1. Obtain ventilation network information
Mine A is an old mine that has been active since the 1920s. The mine’s layout has never been
captured onto computer software and is only available on paper because of the lifespan of the
mine. Building the layouts for each level made it difficult due to there not being DXF files.
The paper layouts do have a latitudinal and longitudinal line that were used to obtain key points
for each level. These key points made it possible to construct an accurate model in PTB.
Mine A has also fallen victim to an issue that many gold mines in South-Africa face. Illegal
miners migrate and occupy old working areas in gold mines. The occupying of the mine by
illegal miners have made it a security risk for going underground and consequently conducting
manual measurements is difficult. Due to the illegal miners, a deteriorating mine, and unsafe
conditions, collecting of ventilation information about the mine was a challenge.
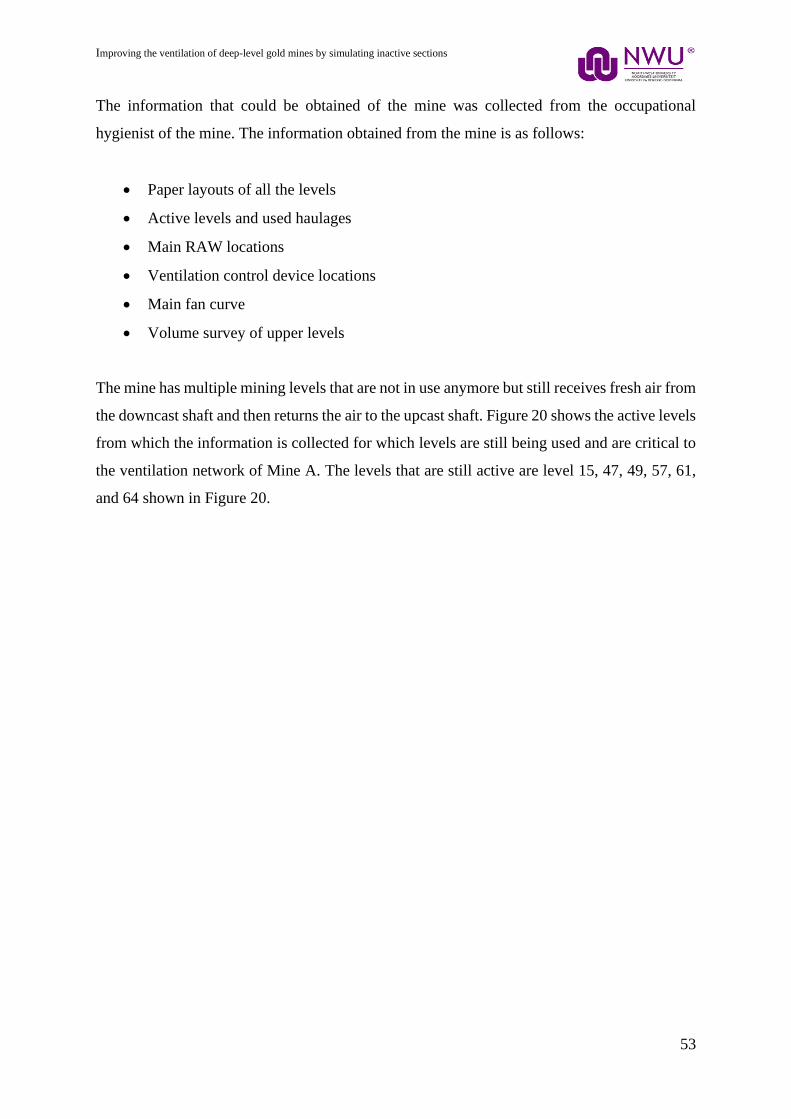
Improving the ventilation of deep-level gold mines by simulating inactive sections
53
The information that could be obtained of the mine was collected from the occupational
hygienist of the mine. The information obtained from the mine is as follows:
• Paper layouts of all the levels
• Active levels and used haulages
• Main RAW locations
• Ventilation control device locations
• Main fan curve
• Volume survey of upper levels
The mine has multiple mining levels that are not in use anymore but still receives fresh air from
the downcast shaft and then returns the air to the upcast shaft. Figure 20 shows the active levels
from which the information is collected for which levels are still being used and are critical to
the ventilation network of Mine A. The levels that are still active are level 15, 47, 49, 57, 61,
and 64 shown in Figure 20.
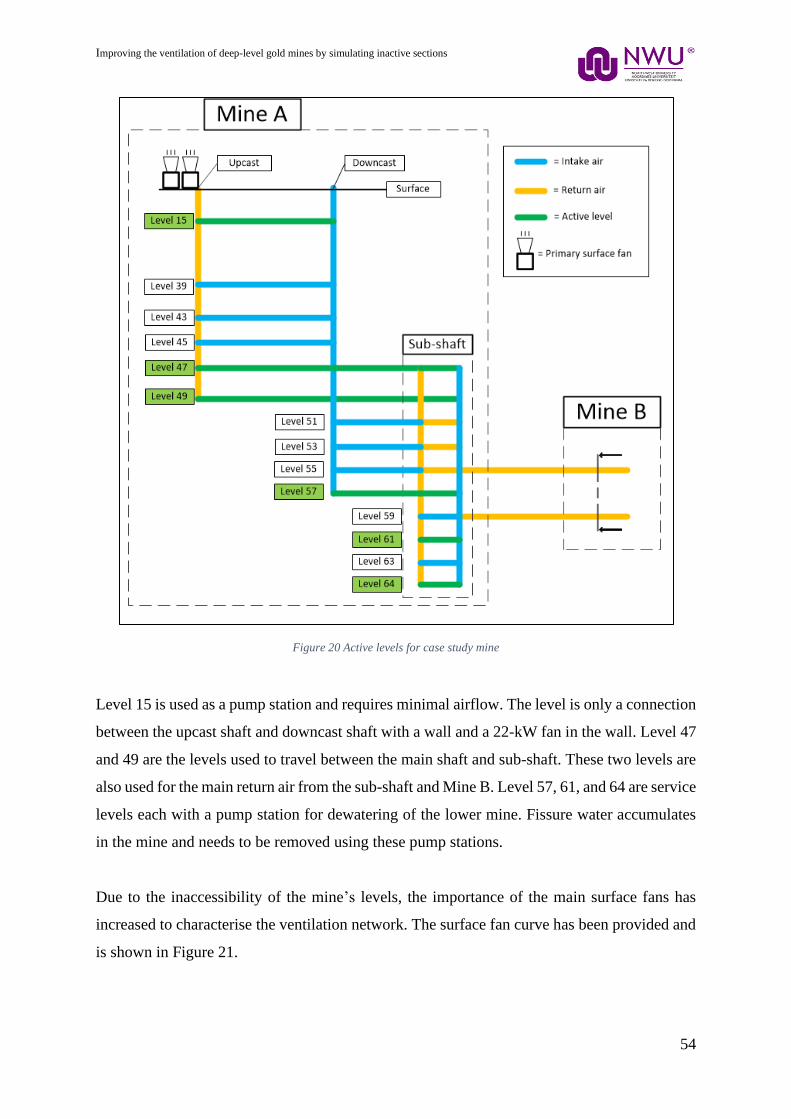
Improving the ventilation of deep-level gold mines by simulating inactive sections
54
Figure 20 Active levels for case study mine
Level 15 is used as a pump station and requires minimal airflow. The level is only a connection
between the upcast shaft and downcast shaft with a wall and a 22-kW fan in the wall. Level 47
and 49 are the levels used to travel between the main shaft and sub-shaft. These two levels are
also used for the main return air from the sub-shaft and Mine B. Level 57, 61, and 64 are service
levels each with a pump station for dewatering of the lower mine. Fissure water accumulates
in the mine and needs to be removed using these pump stations.
Due to the inaccessibility of the mine’s levels, the importance of the main surface fans has
increased to characterise the ventilation network. The surface fan curve has been provided and
is shown in Figure 21.
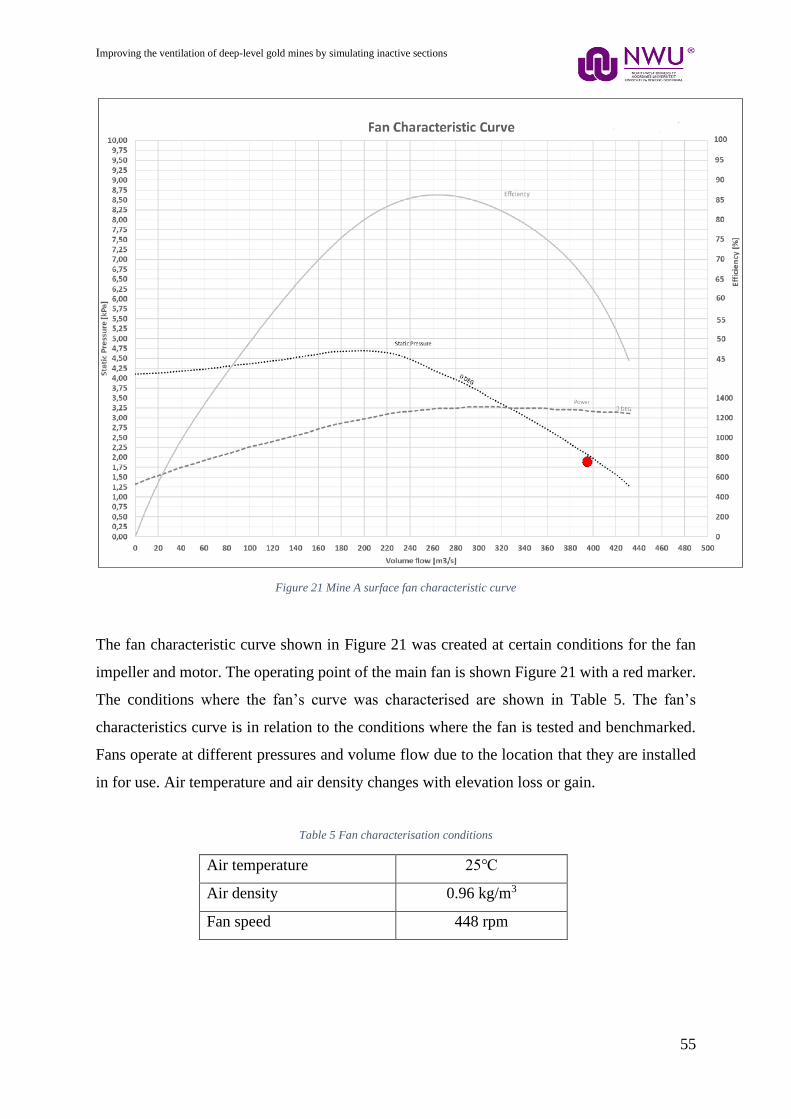
Improving the ventilation of deep-level gold mines by simulating inactive sections
55
Figure 21 Mine A surface fan characteristic curve
The fan characteristic curve shown in Figure 21 was created at certain conditions for the fan
impeller and motor. The operating point of the main fan is shown Figure 21 with a red marker.
The conditions where the fan’s curve was characterised are shown in Table 5. The fan’s
characteristics curve is in relation to the conditions where the fan is tested and benchmarked.
Fans operate at different pressures and volume flow due to the location that they are installed
in for use. Air temperature and air density changes with elevation loss or gain.
Table 5 Fan characterisation conditions
Air temperature 25℃
Air density 0.96 kg/m3
Fan speed 448 rpm
Improving the ventilation of deep-level gold mines by simulating inactive sections
56
From the fan characteristics curve, the fan specifics were calculated and are shown in Table 6.
The fan specification shown in the table was measured as the baseline conditions of the fan.
The information is used to calibrate the model in later steps of the methodology.
Table 6 Mine A main fan specification
Parameter Unit Value
Design operating flow m3/s 390
Design operating pressure kPa 1.9
Design operating shaft power kW 1360
Design fan efficiency % 55
Design operating RPM rpm 454
Design operating density Kg/m3 0.92
Rated motor power HP 2000
Rated motor power kW 1491.4
Maximum motor amps A 151
Design motor RPM rpm 744
A volume survey was done on the upper mining level of Mine A. The volume survey could
only be done on 39L to 49L due to safety concerns and ease of access. Table 7 shows all the
information that was collected on the volume survey. The location of all the measurements is
shown on simulation layouts in Figure 45 to Figure 49 under Appendix .
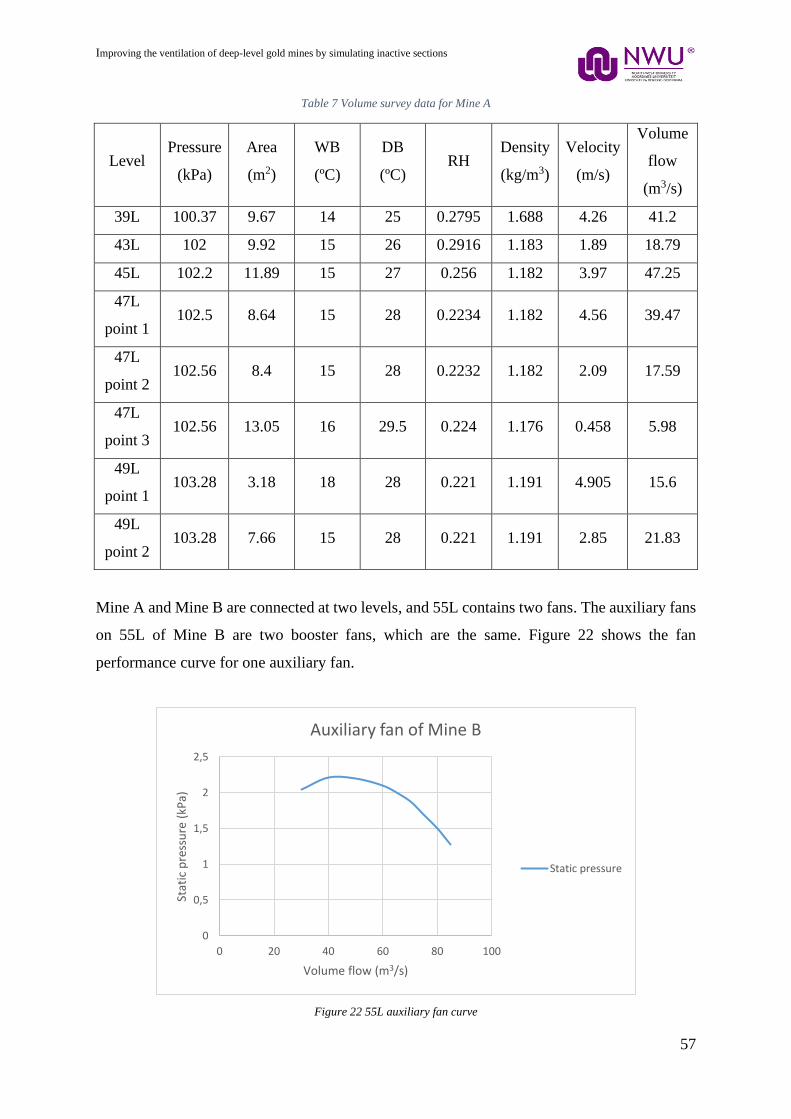
Improving the ventilation of deep-level gold mines by simulating inactive sections
57
Table 7 Volume survey data for Mine A
Level Pressure
(kPa)
Area
(m2)
WB
(ºC)
DB
(ºC) RH
Density
(kg/m3)
Velocity
(m/s)
Volume
flow
(m3/s)
39L 100.37 9.67 14 25 0.2795 1.688 4.26 41.2
43L 102 9.92 15 26 0.2916 1.183 1.89 18.79
45L 102.2 11.89 15 27 0.256 1.182 3.97 47.25
47L
point 1 102.5 8.64 15 28 0.2234 1.182 4.56 39.47
47L
point 2 102.56 8.4 15 28 0.2232 1.182 2.09 17.59
47L
point 3 102.56 13.05 16 29.5 0.224 1.176 0.458 5.98
49L
point 1 103.28 3.18 18 28 0.221 1.191 4.905 15.6
49L
point 2 103.28 7.66 15 28 0.221 1.191 2.85 21.83
Mine A and Mine B are connected at two levels, and 55L contains two fans. The auxiliary fans
on 55L of Mine B are two booster fans, which are the same. Figure 22 shows the fan
performance curve for one auxiliary fan.
Figure 22 55L auxiliary fan curve
0
0,5
1
1,5
2
2,5
0 20 40 60 80 100
Stat
ic p
ress
ure
(kP
a)
Volume flow (m3/s)
Auxiliary fan of Mine B
Static pressure
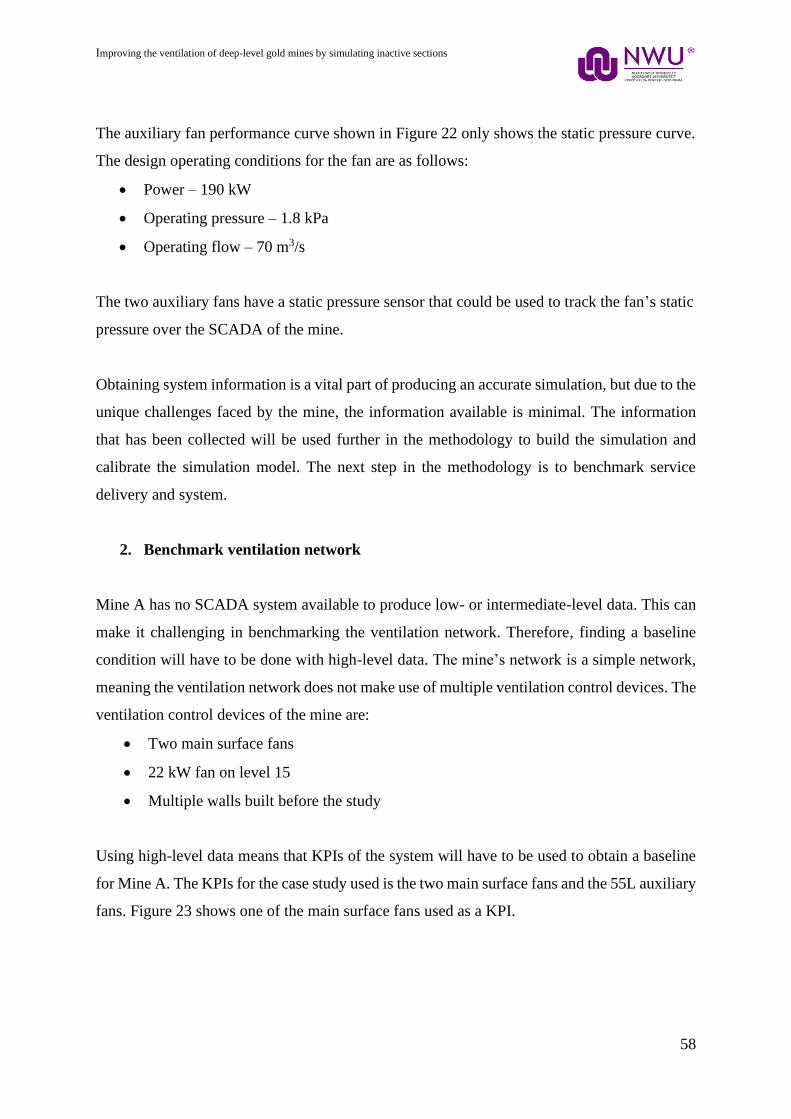
Improving the ventilation of deep-level gold mines by simulating inactive sections
58
The auxiliary fan performance curve shown in Figure 22 only shows the static pressure curve.
The design operating conditions for the fan are as follows:
• Power – 190 kW
• Operating pressure – 1.8 kPa
• Operating flow – 70 m3/s
The two auxiliary fans have a static pressure sensor that could be used to track the fan’s static
pressure over the SCADA of the mine.
Obtaining system information is a vital part of producing an accurate simulation, but due to the
unique challenges faced by the mine, the information available is minimal. The information
that has been collected will be used further in the methodology to build the simulation and
calibrate the simulation model. The next step in the methodology is to benchmark service
delivery and system.
2. Benchmark ventilation network
Mine A has no SCADA system available to produce low- or intermediate-level data. This can
make it challenging in benchmarking the ventilation network. Therefore, finding a baseline
condition will have to be done with high-level data. The mine’s network is a simple network,
meaning the ventilation network does not make use of multiple ventilation control devices. The
ventilation control devices of the mine are:
• Two main surface fans
• 22 kW fan on level 15
• Multiple walls built before the study
Using high-level data means that KPIs of the system will have to be used to obtain a baseline
for Mine A. The KPIs for the case study used is the two main surface fans and the 55L auxiliary
fans. Figure 23 shows one of the main surface fans used as a KPI.

Improving the ventilation of deep-level gold mines by simulating inactive sections
59
Figure 23 Main surface fan for Mine A
Figure 23 shows one of the two surface fans. The access hatch next to the fan ducting was used
to take manual measurements with a pitot tube. In Appendix B it is shows how to use a pitot
tube. A pitot tube with manometer is used to measure the dynamic pressure and static pressure
of the fan. The pressures, however, could not be measured due to the conditions inside the fan’s
ducting. The air that is returned from underground is saturated and causes blockages inside the
pitot tube.
The cause for the humid air in the surface fan ducting is due to high temperature and water
accumulation underground. The only measurement that could be taken is the static pressure of
the surface fans. The static pressures of the two surface fans were measured as 1.88 kPa and
1.89 kPa. Due to the unique circumstances of the mine, the mine’s ventilation network will be
characterised with the use of the main surface fans. The static pressure taken from the main
surface fans will serve as the baseline state of the mine. Figure 24 shows the baseline conditions
for the main surface fans.
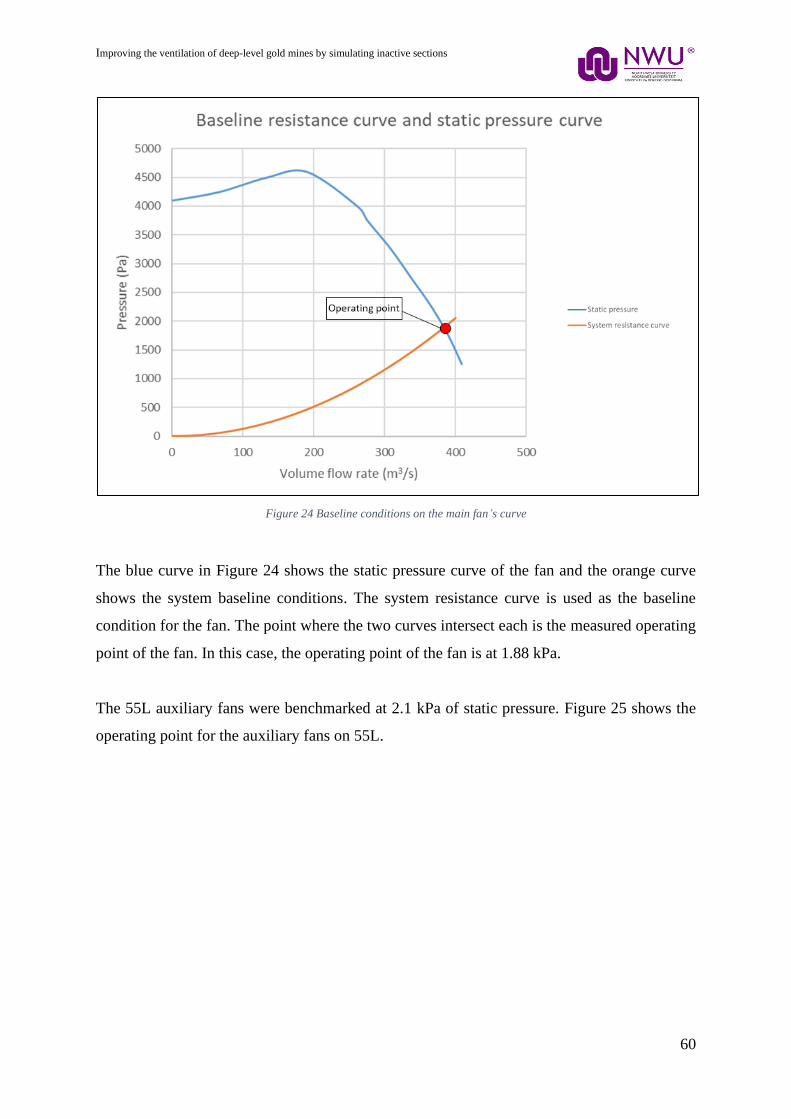
Improving the ventilation of deep-level gold mines by simulating inactive sections
60
Figure 24 Baseline conditions on the main fan’s curve
The blue curve in Figure 24 shows the static pressure curve of the fan and the orange curve
shows the system baseline conditions. The system resistance curve is used as the baseline
condition for the fan. The point where the two curves intersect each is the measured operating
point of the fan. In this case, the operating point of the fan is at 1.88 kPa.
The 55L auxiliary fans were benchmarked at 2.1 kPa of static pressure. Figure 25 shows the
operating point for the auxiliary fans on 55L.
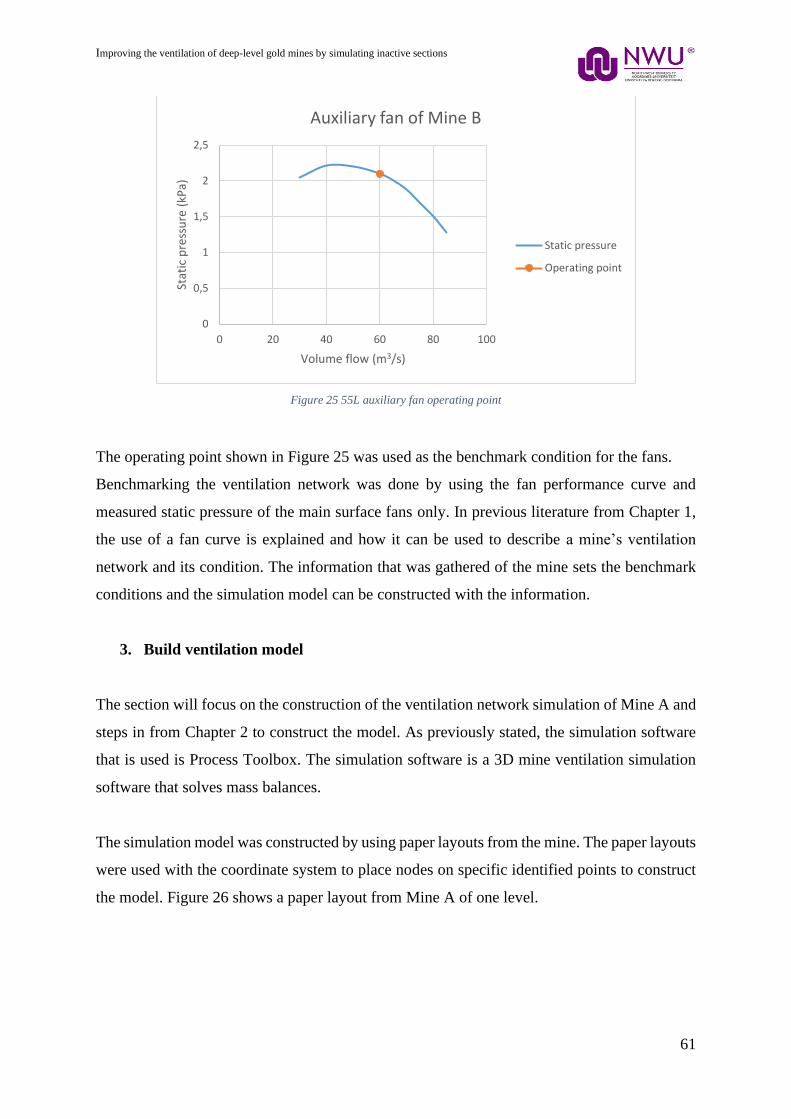
Improving the ventilation of deep-level gold mines by simulating inactive sections
61
Figure 25 55L auxiliary fan operating point
The operating point shown in Figure 25 was used as the benchmark condition for the fans.
Benchmarking the ventilation network was done by using the fan performance curve and
measured static pressure of the main surface fans only. In previous literature from Chapter 1,
the use of a fan curve is explained and how it can be used to describe a mine’s ventilation
network and its condition. The information that was gathered of the mine sets the benchmark
conditions and the simulation model can be constructed with the information.
3. Build ventilation model
The section will focus on the construction of the ventilation network simulation of Mine A and
steps in from Chapter 2 to construct the model. As previously stated, the simulation software
that is used is Process Toolbox. The simulation software is a 3D mine ventilation simulation
software that solves mass balances.
The simulation model was constructed by using paper layouts from the mine. The paper layouts
were used with the coordinate system to place nodes on specific identified points to construct
the model. Figure 26 shows a paper layout from Mine A of one level.
0
0,5
1
1,5
2
2,5
0 20 40 60 80 100
Stat
ic p
ress
ure
(kP
a)
Volume flow (m3/s)
Auxiliary fan of Mine B
Static pressure
Operating point
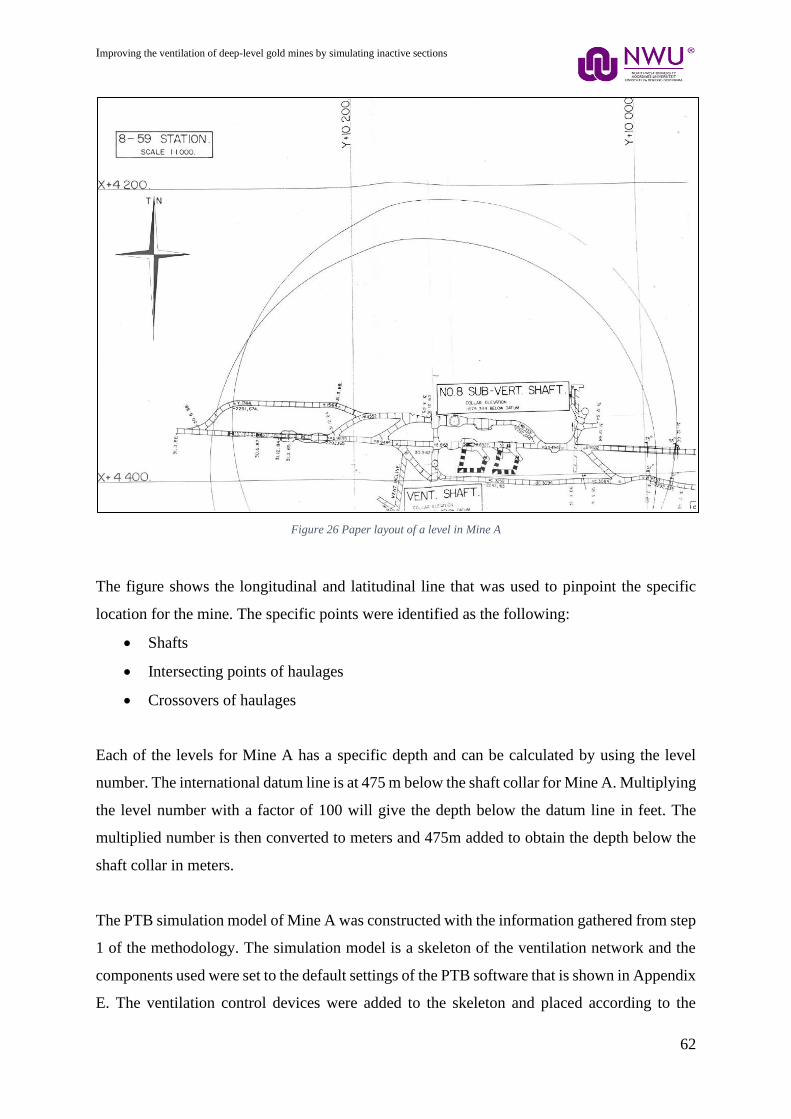
Improving the ventilation of deep-level gold mines by simulating inactive sections
62
Figure 26 Paper layout of a level in Mine A
The figure shows the longitudinal and latitudinal line that was used to pinpoint the specific
location for the mine. The specific points were identified as the following:
• Shafts
• Intersecting points of haulages
• Crossovers of haulages
Each of the levels for Mine A has a specific depth and can be calculated by using the level
number. The international datum line is at 475 m below the shaft collar for Mine A. Multiplying
the level number with a factor of 100 will give the depth below the datum line in feet. The
multiplied number is then converted to meters and 475m added to obtain the depth below the
shaft collar in meters.
The PTB simulation model of Mine A was constructed with the information gathered from step
1 of the methodology. The simulation model is a skeleton of the ventilation network and the
components used were set to the default settings of the PTB software that is shown in Appendix
E. The ventilation control devices were added to the skeleton and placed according to the
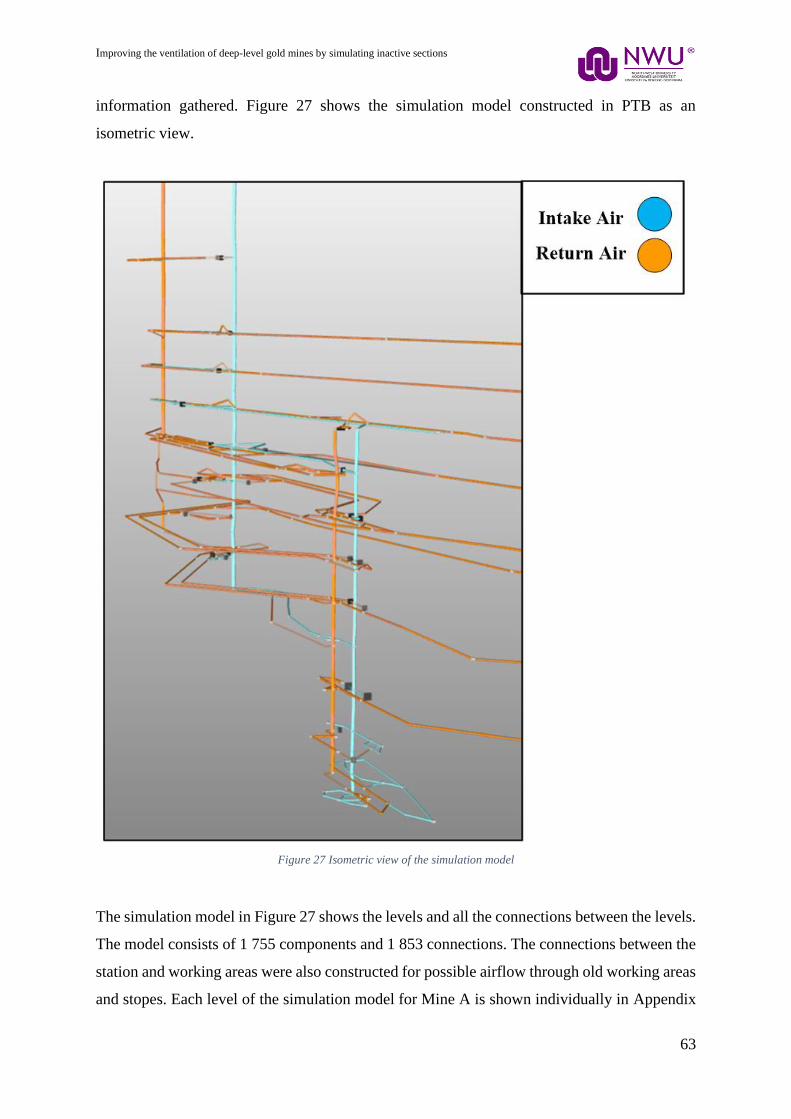
Improving the ventilation of deep-level gold mines by simulating inactive sections
63
information gathered. Figure 27 shows the simulation model constructed in PTB as an
isometric view.
Figure 27 Isometric view of the simulation model
The simulation model in Figure 27 shows the levels and all the connections between the levels.
The model consists of 1 755 components and 1 853 connections. The connections between the
station and working areas were also constructed for possible airflow through old working areas
and stopes. Each level of the simulation model for Mine A is shown individually in Appendix
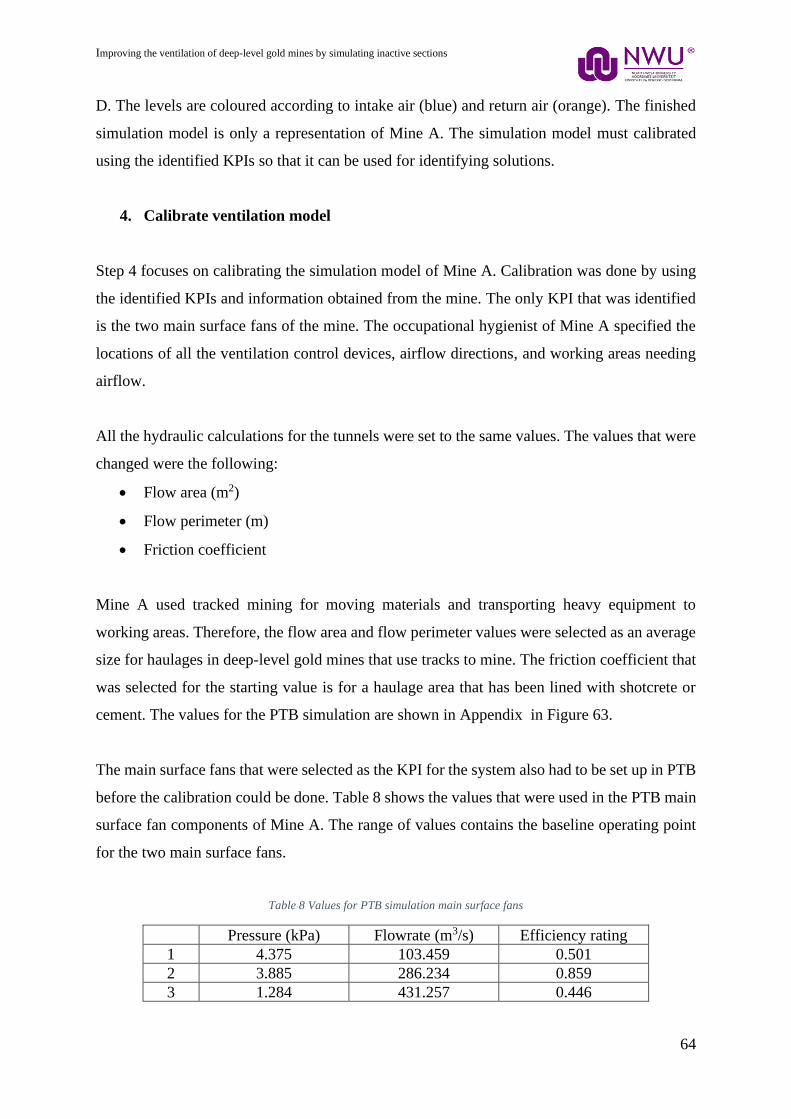
Improving the ventilation of deep-level gold mines by simulating inactive sections
64
D. The levels are coloured according to intake air (blue) and return air (orange). The finished
simulation model is only a representation of Mine A. The simulation model must calibrated
using the identified KPIs so that it can be used for identifying solutions.
4. Calibrate ventilation model
Step 4 focuses on calibrating the simulation model of Mine A. Calibration was done by using
the identified KPIs and information obtained from the mine. The only KPI that was identified
is the two main surface fans of the mine. The occupational hygienist of Mine A specified the
locations of all the ventilation control devices, airflow directions, and working areas needing
airflow.
All the hydraulic calculations for the tunnels were set to the same values. The values that were
changed were the following:
• Flow area (m2)
• Flow perimeter (m)
• Friction coefficient
Mine A used tracked mining for moving materials and transporting heavy equipment to
working areas. Therefore, the flow area and flow perimeter values were selected as an average
size for haulages in deep-level gold mines that use tracks to mine. The friction coefficient that
was selected for the starting value is for a haulage area that has been lined with shotcrete or
cement. The values for the PTB simulation are shown in Appendix in Figure 63.
The main surface fans that were selected as the KPI for the system also had to be set up in PTB
before the calibration could be done. Table 8 shows the values that were used in the PTB main
surface fan components of Mine A. The range of values contains the baseline operating point
for the two main surface fans.
Table 8 Values for PTB simulation main surface fans
Pressure (kPa) Flowrate (m3/s) Efficiency rating
1 4.375 103.459 0.501
2 3.885 286.234 0.859
3 1.284 431.257 0.446
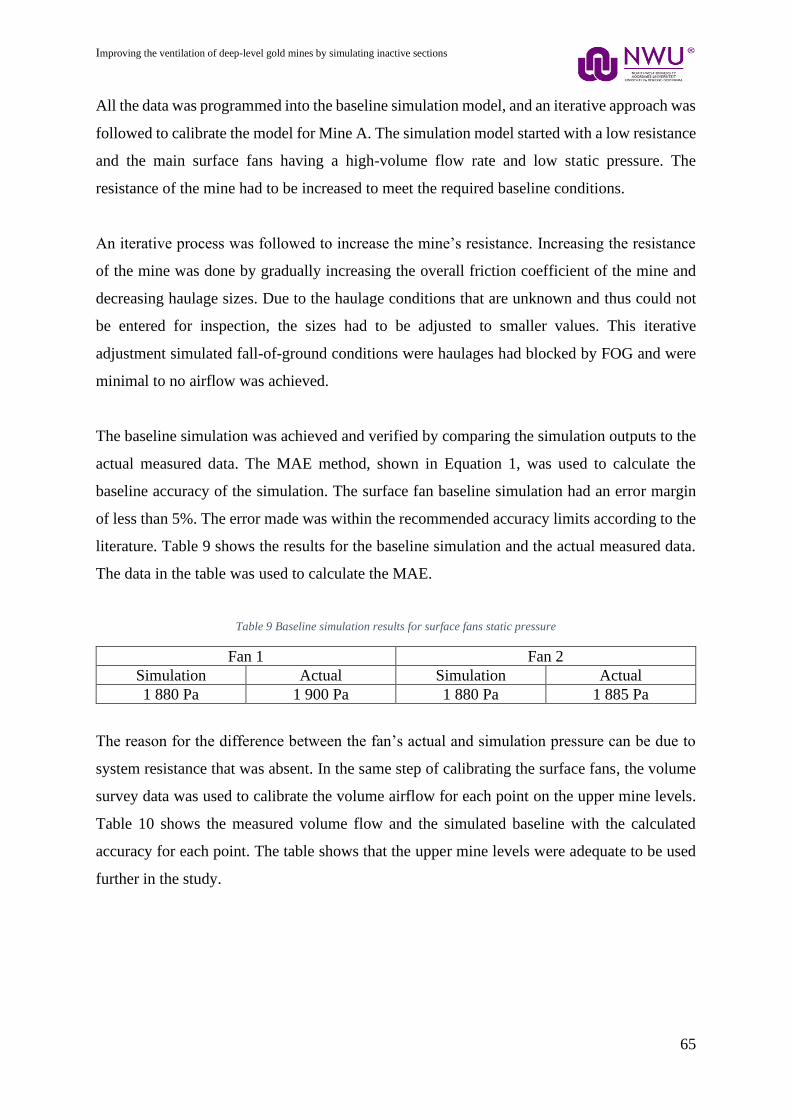
Improving the ventilation of deep-level gold mines by simulating inactive sections
65
All the data was programmed into the baseline simulation model, and an iterative approach was
followed to calibrate the model for Mine A. The simulation model started with a low resistance
and the main surface fans having a high-volume flow rate and low static pressure. The
resistance of the mine had to be increased to meet the required baseline conditions.
An iterative process was followed to increase the mine’s resistance. Increasing the resistance
of the mine was done by gradually increasing the overall friction coefficient of the mine and
decreasing haulage sizes. Due to the haulage conditions that are unknown and thus could not
be entered for inspection, the sizes had to be adjusted to smaller values. This iterative
adjustment simulated fall-of-ground conditions were haulages had blocked by FOG and were
minimal to no airflow was achieved.
The baseline simulation was achieved and verified by comparing the simulation outputs to the
actual measured data. The MAE method, shown in Equation 1, was used to calculate the
baseline accuracy of the simulation. The surface fan baseline simulation had an error margin
of less than 5%. The error made was within the recommended accuracy limits according to the
literature. Table 9 shows the results for the baseline simulation and the actual measured data.
The data in the table was used to calculate the MAE.
Table 9 Baseline simulation results for surface fans static pressure
Fan 1 Fan 2
Simulation Actual Simulation Actual
1 880 Pa 1 900 Pa 1 880 Pa 1 885 Pa
The reason for the difference between the fan’s actual and simulation pressure can be due to
system resistance that was absent. In the same step of calibrating the surface fans, the volume
survey data was used to calibrate the volume airflow for each point on the upper mine levels.
Table 10 shows the measured volume flow and the simulated baseline with the calculated
accuracy for each point. The table shows that the upper mine levels were adequate to be used
further in the study.
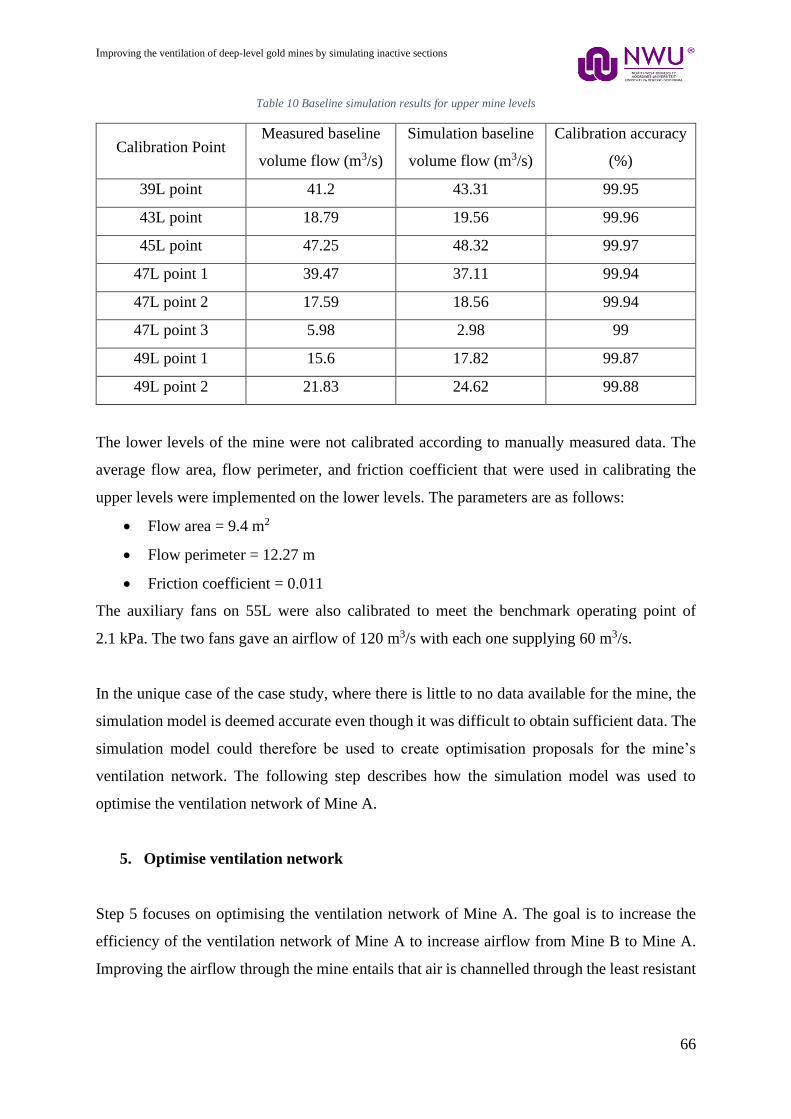
Improving the ventilation of deep-level gold mines by simulating inactive sections
66
Table 10 Baseline simulation results for upper mine levels
Calibration Point Measured baseline
volume flow (m3/s)
Simulation baseline
volume flow (m3/s)
Calibration accuracy
(%)
39L point 41.2 43.31 99.95
43L point 18.79 19.56 99.96
45L point 47.25 48.32 99.97
47L point 1 39.47 37.11 99.94
47L point 2 17.59 18.56 99.94
47L point 3 5.98 2.98 99
49L point 1 15.6 17.82 99.87
49L point 2 21.83 24.62 99.88
The lower levels of the mine were not calibrated according to manually measured data. The
average flow area, flow perimeter, and friction coefficient that were used in calibrating the
upper levels were implemented on the lower levels. The parameters are as follows:
• Flow area = 9.4 m2
• Flow perimeter = 12.27 m
• Friction coefficient = 0.011
The auxiliary fans on 55L were also calibrated to meet the benchmark operating point of
2.1 kPa. The two fans gave an airflow of 120 m3/s with each one supplying 60 m3/s.
In the unique case of the case study, where there is little to no data available for the mine, the
simulation model is deemed accurate even though it was difficult to obtain sufficient data. The
simulation model could therefore be used to create optimisation proposals for the mine’s
ventilation network. The following step describes how the simulation model was used to
optimise the ventilation network of Mine A.
5. Optimise ventilation network
Step 5 focuses on optimising the ventilation network of Mine A. The goal is to increase the
efficiency of the ventilation network of Mine A to increase airflow from Mine B to Mine A.
Improving the airflow through the mine entails that air is channelled through the least resistant
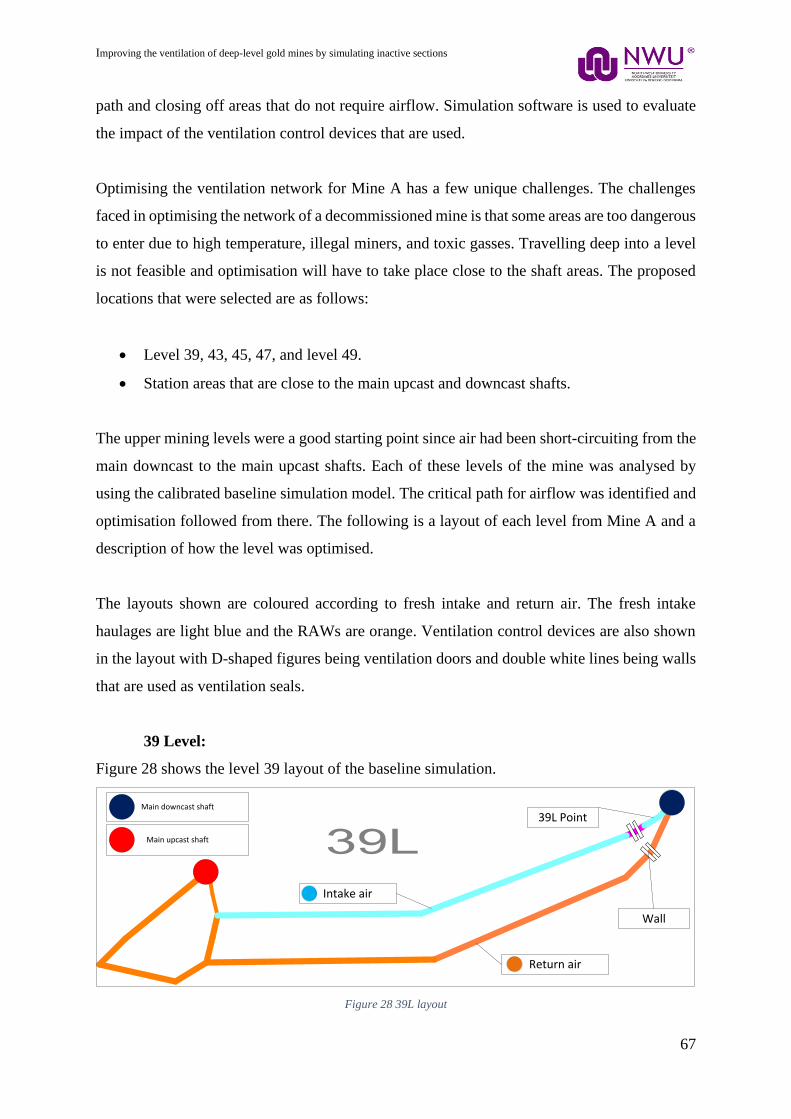
Improving the ventilation of deep-level gold mines by simulating inactive sections
67
path and closing off areas that do not require airflow. Simulation software is used to evaluate
the impact of the ventilation control devices that are used.
Optimising the ventilation network for Mine A has a few unique challenges. The challenges
faced in optimising the network of a decommissioned mine is that some areas are too dangerous
to enter due to high temperature, illegal miners, and toxic gasses. Travelling deep into a level
is not feasible and optimisation will have to take place close to the shaft areas. The proposed
locations that were selected are as follows:
• Level 39, 43, 45, 47, and level 49.
• Station areas that are close to the main upcast and downcast shafts.
The upper mining levels were a good starting point since air had been short-circuiting from the
main downcast to the main upcast shafts. Each of these levels of the mine was analysed by
using the calibrated baseline simulation model. The critical path for airflow was identified and
optimisation followed from there. The following is a layout of each level from Mine A and a
description of how the level was optimised.
The layouts shown are coloured according to fresh intake and return air. The fresh intake
haulages are light blue and the RAWs are orange. Ventilation control devices are also shown
in the layout with D-shaped figures being ventilation doors and double white lines being walls
that are used as ventilation seals.
39 Level:
Figure 28 shows the level 39 layout of the baseline simulation.
Main downcast shaft
Main upcast shaft
39L Point
Wall
Intake air
Return air
Figure 28 39L layout
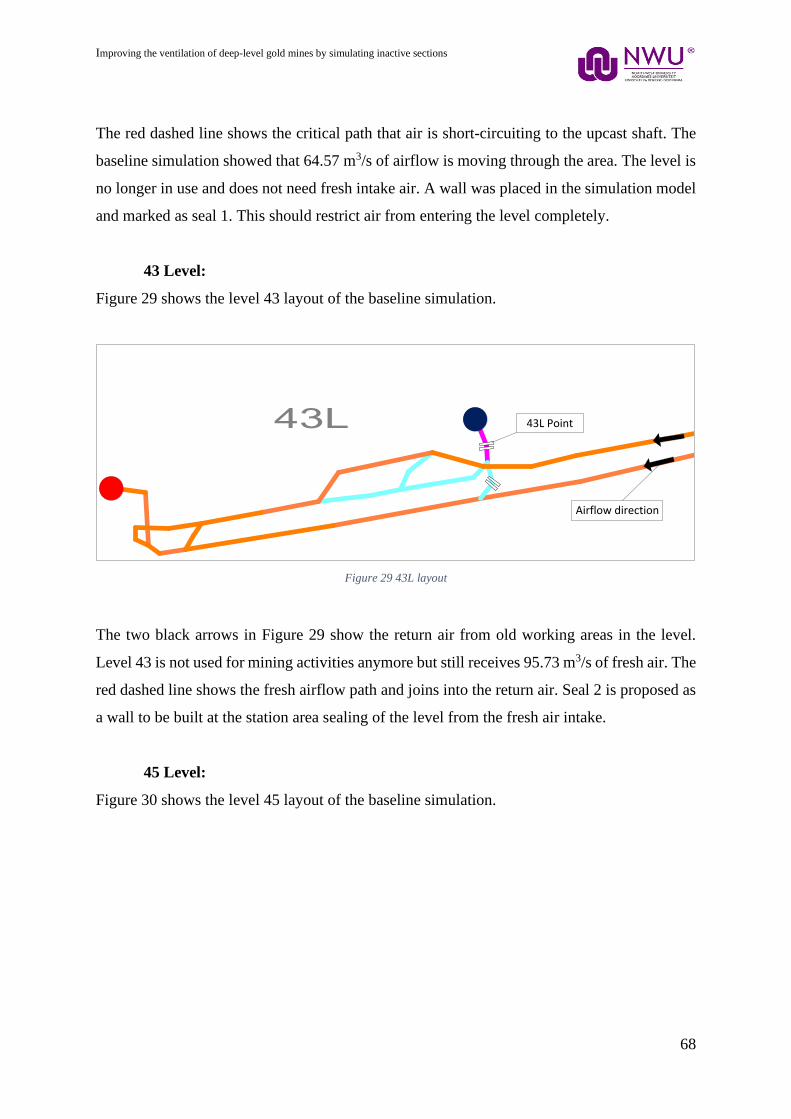
Improving the ventilation of deep-level gold mines by simulating inactive sections
68
The red dashed line shows the critical path that air is short-circuiting to the upcast shaft. The
baseline simulation showed that 64.57 m3/s of airflow is moving through the area. The level is
no longer in use and does not need fresh intake air. A wall was placed in the simulation model
and marked as seal 1. This should restrict air from entering the level completely.
43 Level:
Figure 29 shows the level 43 layout of the baseline simulation.
43L Point
Airflow direction
Figure 29 43L layout
The two black arrows in Figure 29 show the return air from old working areas in the level.
Level 43 is not used for mining activities anymore but still receives 95.73 m3/s of fresh air. The
red dashed line shows the fresh airflow path and joins into the return air. Seal 2 is proposed as
a wall to be built at the station area sealing of the level from the fresh air intake.
45 Level:
Figure 30 shows the level 45 layout of the baseline simulation.
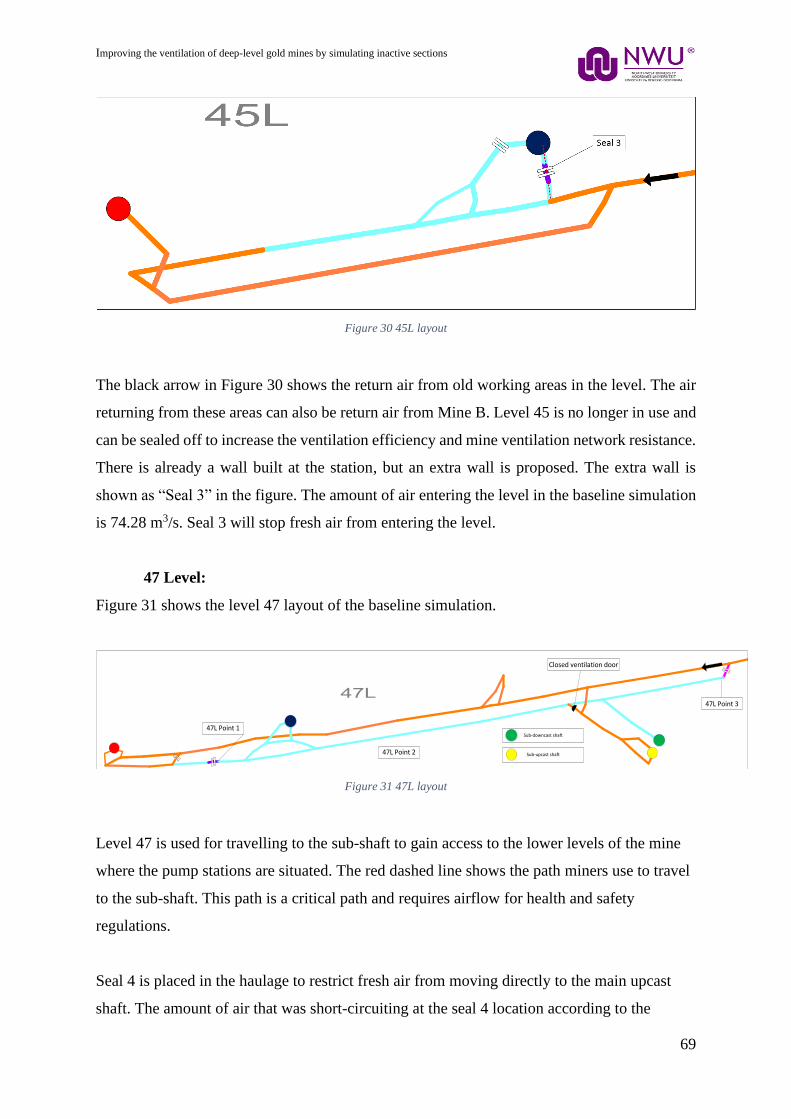
Improving the ventilation of deep-level gold mines by simulating inactive sections
69
Figure 30 45L layout
The black arrow in Figure 30 shows the return air from old working areas in the level. The air
returning from these areas can also be return air from Mine B. Level 45 is no longer in use and
can be sealed off to increase the ventilation efficiency and mine ventilation network resistance.
There is already a wall built at the station, but an extra wall is proposed. The extra wall is
shown as “Seal 3” in the figure. The amount of air entering the level in the baseline simulation
is 74.28 m3/s. Seal 3 will stop fresh air from entering the level.
47 Level:
Figure 31 shows the level 47 layout of the baseline simulation.
47L Point 1
47L Point 2
47L Point 3
Sub-downcast shaft
Sub-upcast shaft
Closed ventilation door
Figure 31 47L layout
Level 47 is used for travelling to the sub-shaft to gain access to the lower levels of the mine
where the pump stations are situated. The red dashed line shows the path miners use to travel
to the sub-shaft. This path is a critical path and requires airflow for health and safety
regulations.
Seal 4 is placed in the haulage to restrict fresh air from moving directly to the main upcast
shaft. The amount of air that was short-circuiting at the seal 4 location according to the
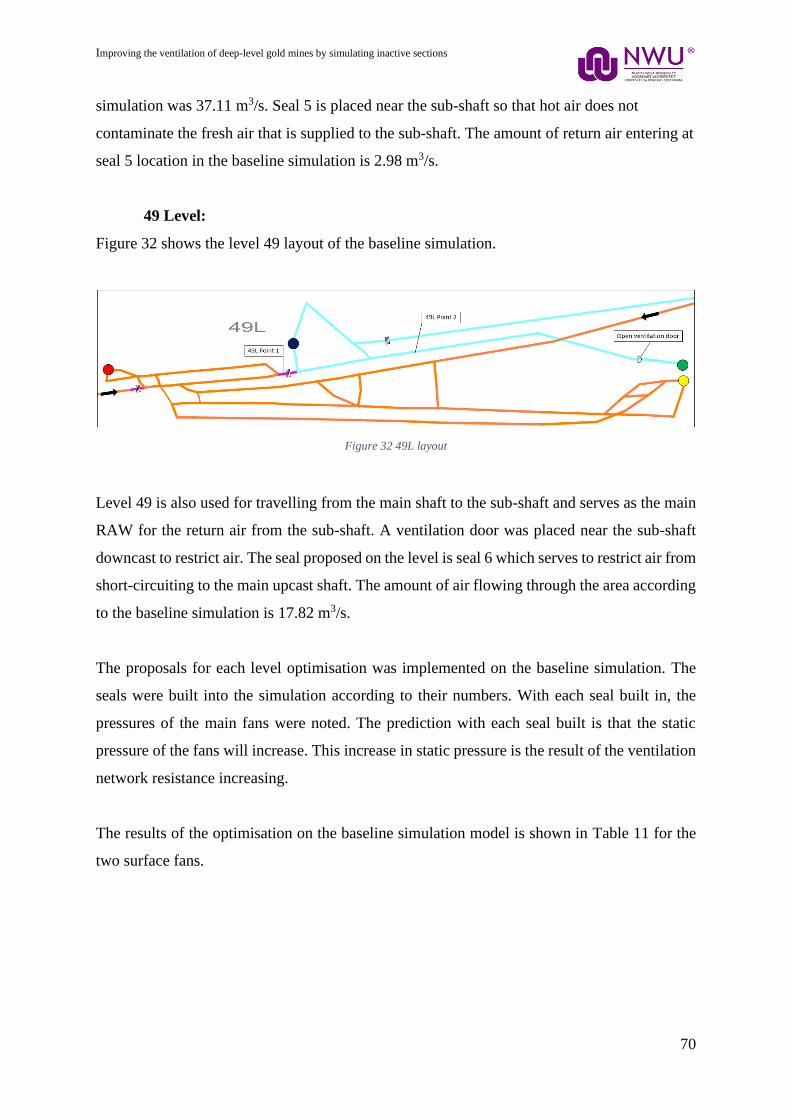
Improving the ventilation of deep-level gold mines by simulating inactive sections
70
simulation was 37.11 m3/s. Seal 5 is placed near the sub-shaft so that hot air does not
contaminate the fresh air that is supplied to the sub-shaft. The amount of return air entering at
seal 5 location in the baseline simulation is 2.98 m3/s.
49 Level:
Figure 32 shows the level 49 layout of the baseline simulation.
Figure 32 49L layout
Level 49 is also used for travelling from the main shaft to the sub-shaft and serves as the main
RAW for the return air from the sub-shaft. A ventilation door was placed near the sub-shaft
downcast to restrict air. The seal proposed on the level is seal 6 which serves to restrict air from
short-circuiting to the main upcast shaft. The amount of air flowing through the area according
to the baseline simulation is 17.82 m3/s.
The proposals for each level optimisation was implemented on the baseline simulation. The
seals were built into the simulation according to their numbers. With each seal built in, the
pressures of the main fans were noted. The prediction with each seal built is that the static
pressure of the fans will increase. This increase in static pressure is the result of the ventilation
network resistance increasing.
The results of the optimisation on the baseline simulation model is shown in Table 11 for the
two surface fans.
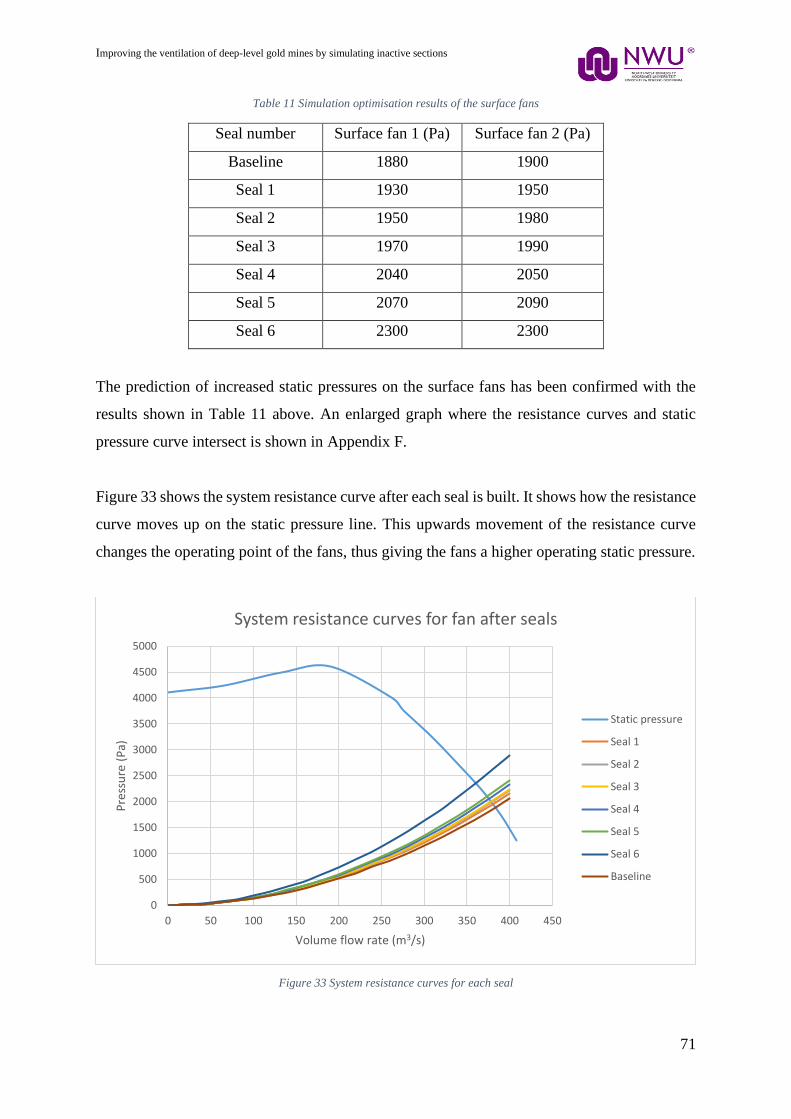
Improving the ventilation of deep-level gold mines by simulating inactive sections
71
Table 11 Simulation optimisation results of the surface fans
Seal number Surface fan 1 (Pa) Surface fan 2 (Pa)
Baseline 1880 1900
Seal 1 1930 1950
Seal 2 1950 1980
Seal 3 1970 1990
Seal 4 2040 2050
Seal 5 2070 2090
Seal 6 2300 2300
The prediction of increased static pressures on the surface fans has been confirmed with the
results shown in Table 11 above. An enlarged graph where the resistance curves and static
pressure curve intersect is shown in Appendix F.
Figure 33 shows the system resistance curve after each seal is built. It shows how the resistance
curve moves up on the static pressure line. This upwards movement of the resistance curve
changes the operating point of the fans, thus giving the fans a higher operating static pressure.
Figure 33 System resistance curves for each seal
0
500
1000
1500
2000
2500
3000
3500
4000
4500
5000
0 50 100 150 200 250 300 350 400 450
Pre
ssu
re (
Pa)
Volume flow rate (m3/s)
System resistance curves for fan after seals
Static pressure
Seal 1
Seal 2
Seal 3
Seal 4
Seal 5
Seal 6
Baseline
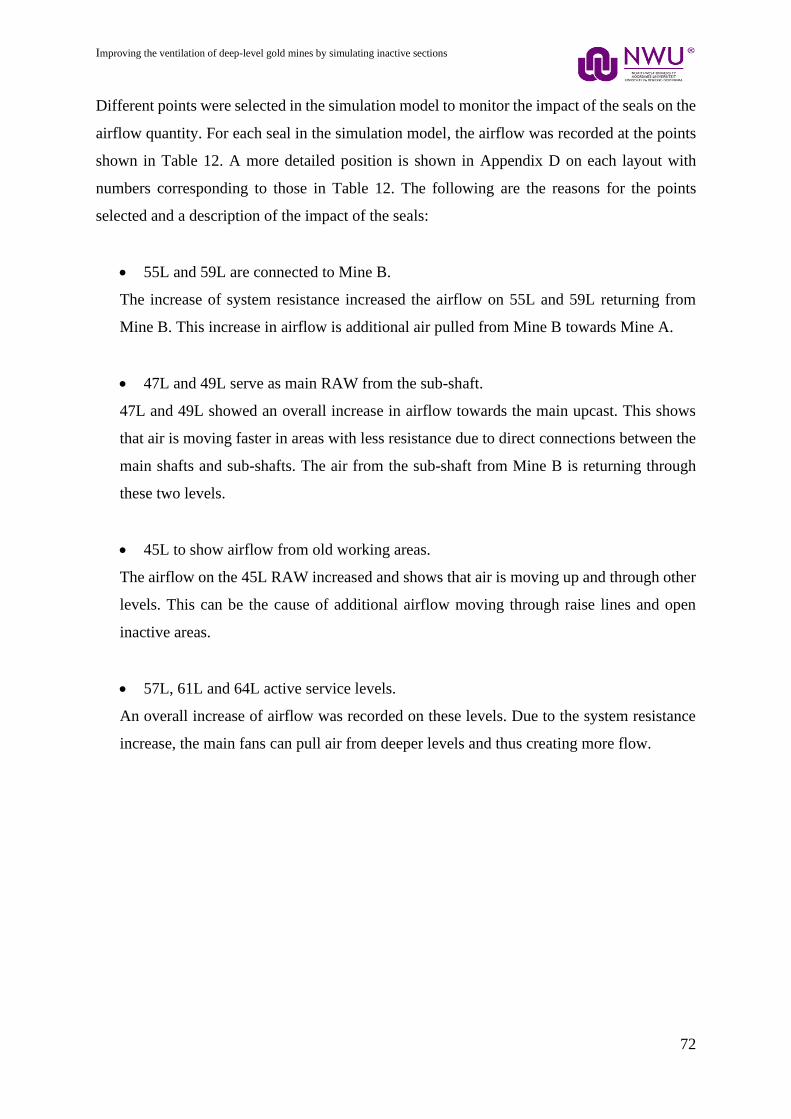
Improving the ventilation of deep-level gold mines by simulating inactive sections
72
Different points were selected in the simulation model to monitor the impact of the seals on the
airflow quantity. For each seal in the simulation model, the airflow was recorded at the points
shown in Table 12. A more detailed position is shown in Appendix D on each layout with
numbers corresponding to those in Table 12. The following are the reasons for the points
selected and a description of the impact of the seals:
• 55L and 59L are connected to Mine B.
The increase of system resistance increased the airflow on 55L and 59L returning from
Mine B. This increase in airflow is additional air pulled from Mine B towards Mine A.
• 47L and 49L serve as main RAW from the sub-shaft.
47L and 49L showed an overall increase in airflow towards the main upcast. This shows
that air is moving faster in areas with less resistance due to direct connections between the
main shafts and sub-shafts. The air from the sub-shaft from Mine B is returning through
these two levels.
• 45L to show airflow from old working areas.
The airflow on the 45L RAW increased and shows that air is moving up and through other
levels. This can be the cause of additional airflow moving through raise lines and open
inactive areas.
• 57L, 61L and 64L active service levels.
An overall increase of airflow was recorded on these levels. Due to the system resistance
increase, the main fans can pull air from deeper levels and thus creating more flow.
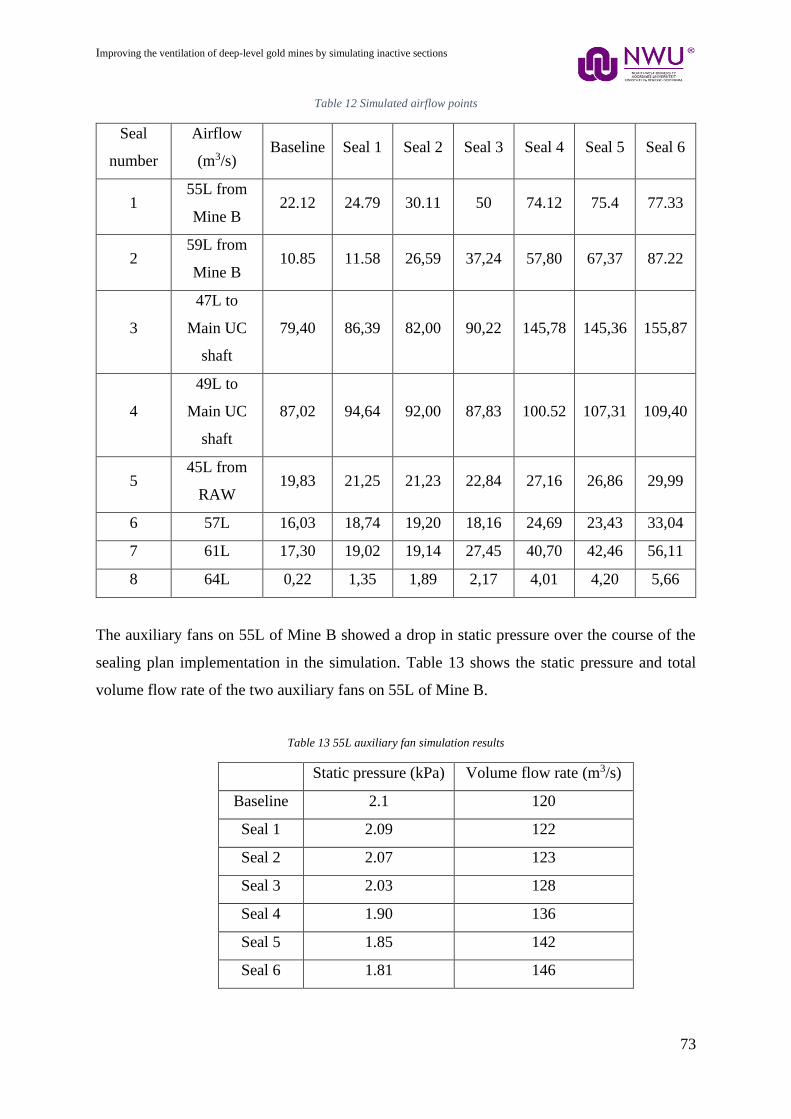
Improving the ventilation of deep-level gold mines by simulating inactive sections
73
Table 12 Simulated airflow points
Seal
number
Airflow
(m3/s) Baseline Seal 1 Seal 2 Seal 3 Seal 4 Seal 5 Seal 6
1 55L from
Mine B 22.12 24.79 30.11 50 74.12 75.4 77.33
2 59L from
Mine B 10.85 11.58 26,59 37,24 57,80 67,37 87.22
3
47L to
Main UC
shaft
79,40 86,39 82,00 90,22 145,78 145,36 155,87
4
49L to
Main UC
shaft
87,02 94,64 92,00 87,83 100.52 107,31 109,40
5 45L from
RAW 19,83 21,25 21,23 22,84 27,16 26,86 29,99
6 57L 16,03 18,74 19,20 18,16 24,69 23,43 33,04
7 61L 17,30 19,02 19,14 27,45 40,70 42,46 56,11
8 64L 0,22 1,35 1,89 2,17 4,01 4,20 5,66
The auxiliary fans on 55L of Mine B showed a drop in static pressure over the course of the
sealing plan implementation in the simulation. Table 13 shows the static pressure and total
volume flow rate of the two auxiliary fans on 55L of Mine B.
Table 13 55L auxiliary fan simulation results
Static pressure (kPa) Volume flow rate (m3/s)
Baseline 2.1 120
Seal 1 2.09 122
Seal 2 2.07 123
Seal 3 2.03 128
Seal 4 1.90 136
Seal 5 1.85 142
Seal 6 1.81 146
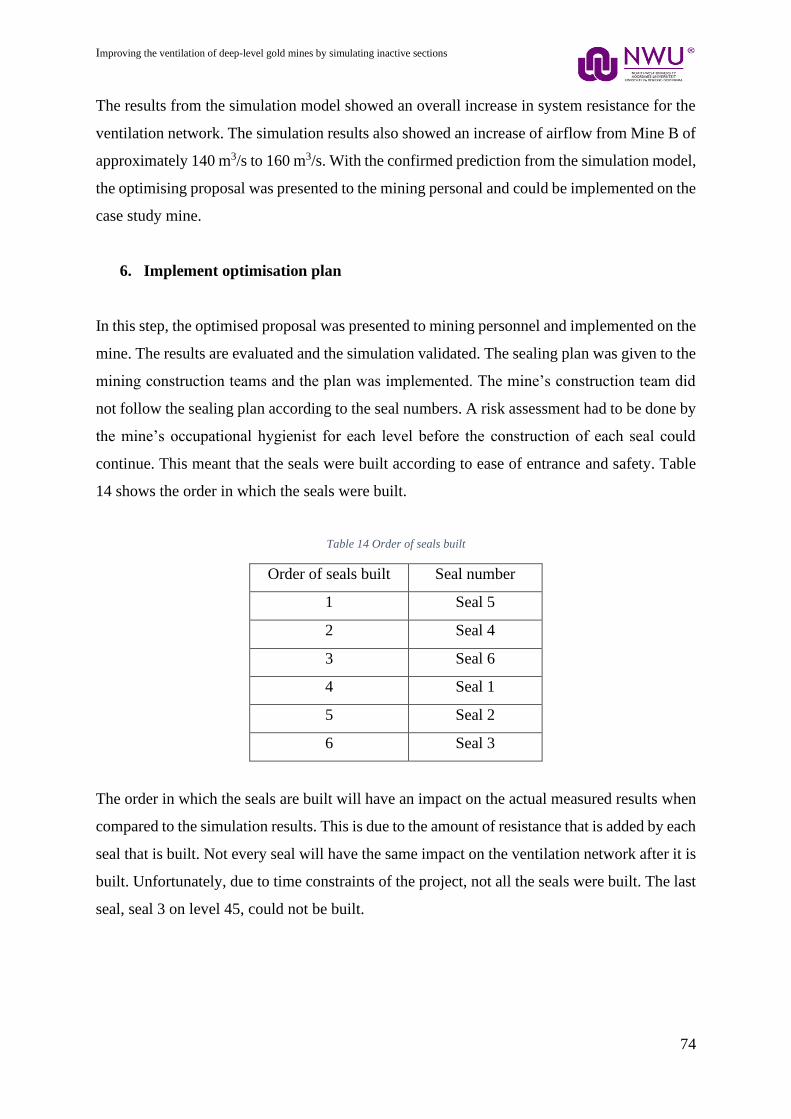
Improving the ventilation of deep-level gold mines by simulating inactive sections
74
The results from the simulation model showed an overall increase in system resistance for the
ventilation network. The simulation results also showed an increase of airflow from Mine B of
approximately 140 m3/s to 160 m3/s. With the confirmed prediction from the simulation model,
the optimising proposal was presented to the mining personal and could be implemented on the
case study mine.
6. Implement optimisation plan
In this step, the optimised proposal was presented to mining personnel and implemented on the
mine. The results are evaluated and the simulation validated. The sealing plan was given to the
mining construction teams and the plan was implemented. The mine’s construction team did
not follow the sealing plan according to the seal numbers. A risk assessment had to be done by
the mine’s occupational hygienist for each level before the construction of each seal could
continue. This meant that the seals were built according to ease of entrance and safety. Table
14 shows the order in which the seals were built.
Table 14 Order of seals built
Order of seals built Seal number
1 Seal 5
2 Seal 4
3 Seal 6
4 Seal 1
5 Seal 2
6 Seal 3
The order in which the seals are built will have an impact on the actual measured results when
compared to the simulation results. This is due to the amount of resistance that is added by each
seal that is built. Not every seal will have the same impact on the ventilation network after it is
built. Unfortunately, due to time constraints of the project, not all the seals were built. The last
seal, seal 3 on level 45, could not be built.
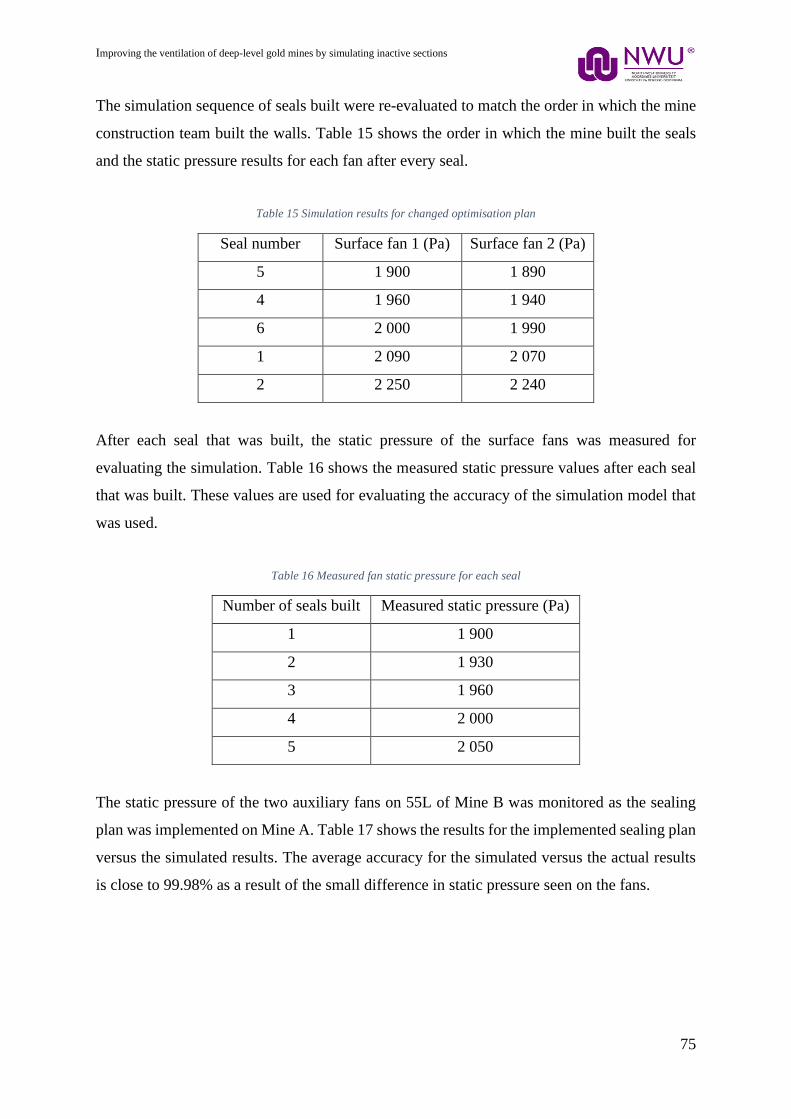
Improving the ventilation of deep-level gold mines by simulating inactive sections
75
The simulation sequence of seals built were re-evaluated to match the order in which the mine
construction team built the walls. Table 15 shows the order in which the mine built the seals
and the static pressure results for each fan after every seal.
Table 15 Simulation results for changed optimisation plan
Seal number Surface fan 1 (Pa) Surface fan 2 (Pa)
5 1 900 1 890
4 1 960 1 940
6 2 000 1 990
1 2 090 2 070
2 2 250 2 240
After each seal that was built, the static pressure of the surface fans was measured for
evaluating the simulation. Table 16 shows the measured static pressure values after each seal
that was built. These values are used for evaluating the accuracy of the simulation model that
was used.
Table 16 Measured fan static pressure for each seal
Number of seals built Measured static pressure (Pa)
1 1 900
2 1 930
3 1 960
4 2 000
5 2 050
The static pressure of the two auxiliary fans on 55L of Mine B was monitored as the sealing
plan was implemented on Mine A. Table 17 shows the results for the implemented sealing plan
versus the simulated results. The average accuracy for the simulated versus the actual results
is close to 99.98% as a result of the small difference in static pressure seen on the fans.
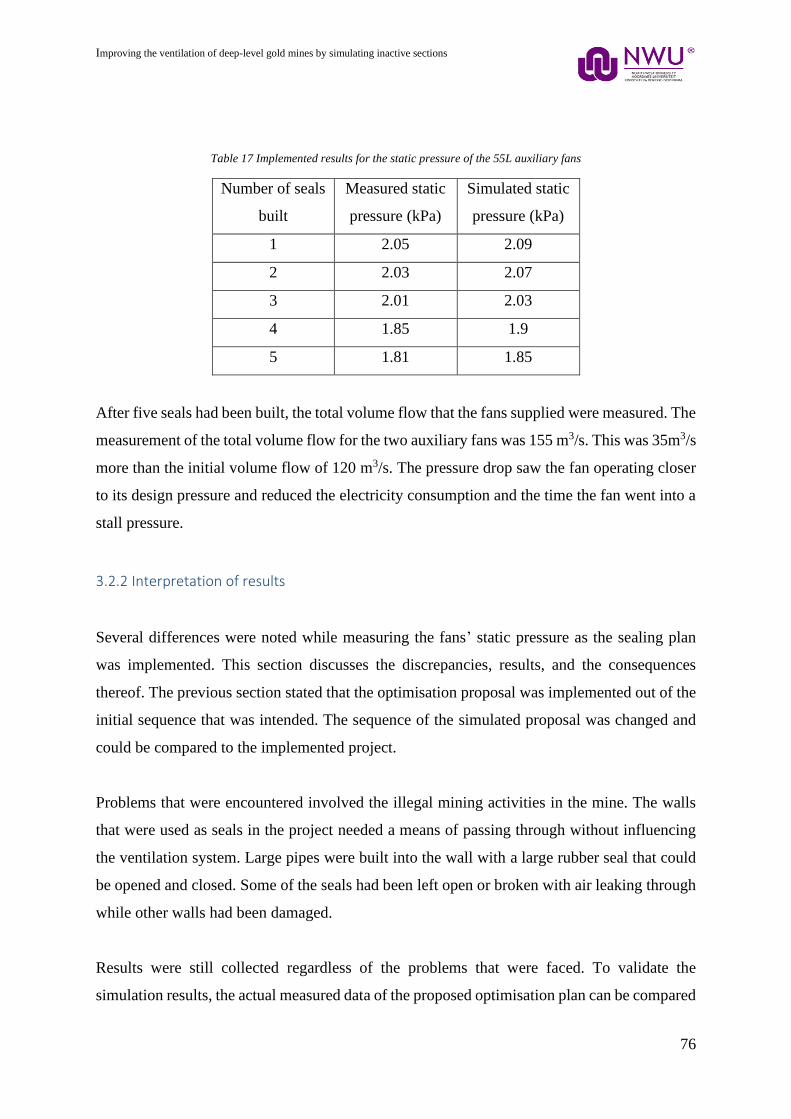
Improving the ventilation of deep-level gold mines by simulating inactive sections
76
Table 17 Implemented results for the static pressure of the 55L auxiliary fans
Number of seals
built
Measured static
pressure (kPa)
Simulated static
pressure (kPa)
1 2.05 2.09
2 2.03 2.07
3 2.01 2.03
4 1.85 1.9
5 1.81 1.85
After five seals had been built, the total volume flow that the fans supplied were measured. The
measurement of the total volume flow for the two auxiliary fans was 155 m3/s. This was 35m3/s
more than the initial volume flow of 120 m3/s. The pressure drop saw the fan operating closer
to its design pressure and reduced the electricity consumption and the time the fan went into a
stall pressure.
3.2.2 Interpretation of results
Several differences were noted while measuring the fans’ static pressure as the sealing plan
was implemented. This section discusses the discrepancies, results, and the consequences
thereof. The previous section stated that the optimisation proposal was implemented out of the
initial sequence that was intended. The sequence of the simulated proposal was changed and
could be compared to the implemented project.
Problems that were encountered involved the illegal mining activities in the mine. The walls
that were used as seals in the project needed a means of passing through without influencing
the ventilation system. Large pipes were built into the wall with a large rubber seal that could
be opened and closed. Some of the seals had been left open or broken with air leaking through
while other walls had been damaged.
Results were still collected regardless of the problems that were faced. To validate the
simulation results, the actual measured data of the proposed optimisation plan can be compared
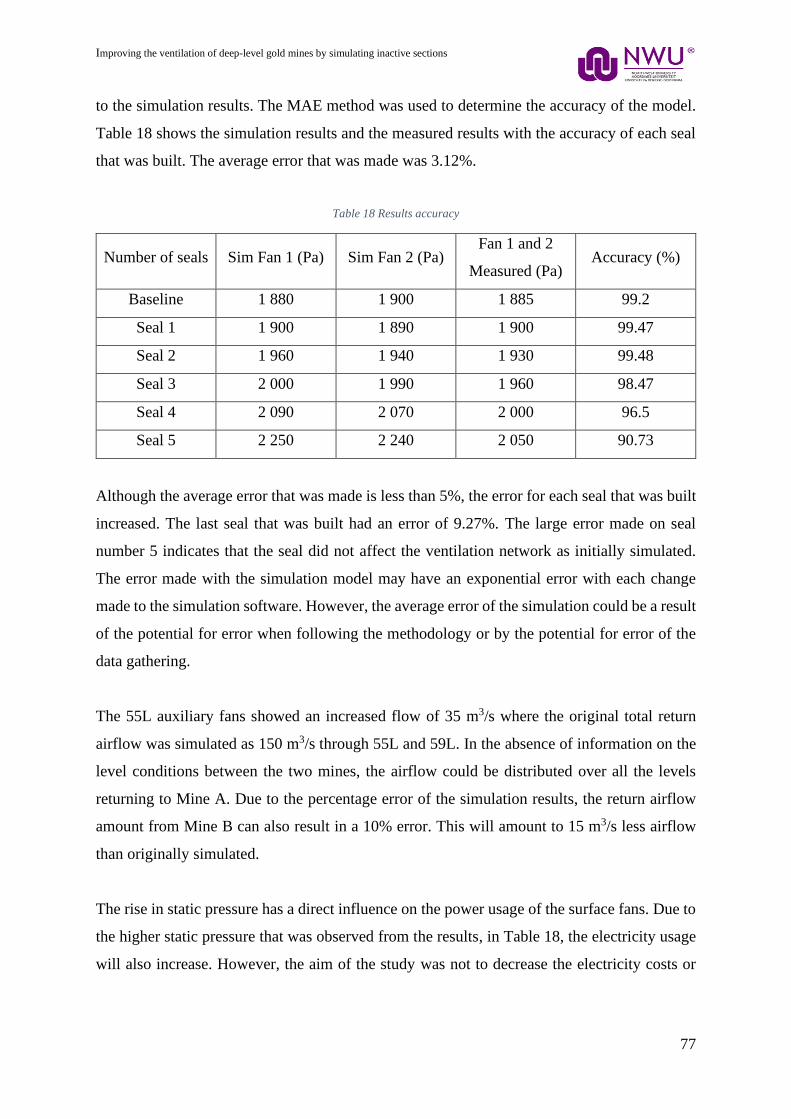
Improving the ventilation of deep-level gold mines by simulating inactive sections
77
to the simulation results. The MAE method was used to determine the accuracy of the model.
Table 18 shows the simulation results and the measured results with the accuracy of each seal
that was built. The average error that was made was 3.12%.
Table 18 Results accuracy
Number of seals Sim Fan 1 (Pa) Sim Fan 2 (Pa) Fan 1 and 2
Measured (Pa) Accuracy (%)
Baseline 1 880 1 900 1 885 99.2
Seal 1 1 900 1 890 1 900 99.47
Seal 2 1 960 1 940 1 930 99.48
Seal 3 2 000 1 990 1 960 98.47
Seal 4 2 090 2 070 2 000 96.5
Seal 5 2 250 2 240 2 050 90.73
Although the average error that was made is less than 5%, the error for each seal that was built
increased. The last seal that was built had an error of 9.27%. The large error made on seal
number 5 indicates that the seal did not affect the ventilation network as initially simulated.
The error made with the simulation model may have an exponential error with each change
made to the simulation software. However, the average error of the simulation could be a result
of the potential for error when following the methodology or by the potential for error of the
data gathering.
The 55L auxiliary fans showed an increased flow of 35 m3/s where the original total return
airflow was simulated as 150 m3/s through 55L and 59L. In the absence of information on the
level conditions between the two mines, the airflow could be distributed over all the levels
returning to Mine A. Due to the percentage error of the simulation results, the return airflow
amount from Mine B can also result in a 10% error. This will amount to 15 m3/s less airflow
than originally simulated.
The rise in static pressure has a direct influence on the power usage of the surface fans. Due to
the higher static pressure that was observed from the results, in Table 18, the electricity usage
will also increase. However, the aim of the study was not to decrease the electricity costs or

Improving the ventilation of deep-level gold mines by simulating inactive sections
78
usage but rather to improve ventilation network efficiency. The improvement in ventilation
network of Mine A can potentially increase productivity and the LOM for Mine B.
Considering the minimal data that was available and the amount of data that could be collected
with manual measurements, the resulting error that was made can be deemed as acceptable.
This validates using the methodology on a decommissioned deep-level gold mine’s ventilation
network where this level of accuracy is required.
3.3 Validation
The case study that was selected for the dissertation had unique challenges where very limited
information was available. The limited access to underground measurements made the process
in constructing a simulation model difficult. Benchmarking a ventilation network usually
requires a large quantity of information. Entering the mine to take manual measurements was
limited due to health and safety risks. Thus, alternative methods were used to evaluate the
ventilation network of the mine.
In the dissertation, the case study mine’s ventilation network was constructed into a simulation
model. A large portion of the mine’s network is inactive and inaccessible for obtaining the
necessary data. The ventilation model was constructed using averaged data from a volume
survey that was done on the upper levels of the mine. The simulation model was calibrated
according to the main surface fans, which served as the key performance indicators, and a few
underground measured points.
After calibration, the simulation model was validated, and the airflow evaluated through the
inactive sections. A sealing plan was developed to reduce fresh airflow into inactive sections.
The sealing plan increased the ventilation network resistance, which impacted the main surface
fans. The main surface fans had an increase in static pressure due to the increase in system
resistance.
The sealing plan was implemented on the case study mine, where the simulation results could
be verified with measured data from the KPIs. This dissertation shows that by using simulation
Improving the ventilation of deep-level gold mines by simulating inactive sections
79
software, a mine’s ventilation network can be evaluated and improved. With this software,
unknown or inaccessible areas in mines can be characterised by using KPIs.
The mining industry in South-Africa has made use of multiple energy-saving projects to reduce
electricity costs and operational expenses. Improving the ventilation networks of mines by
simulating inactive sections can improve the productivity and extend the life of mine. The
dissertation focused on the improvement of ventilation for decommissioned deep-level gold
mines. The alternative methodology is not only limited to the deep-level gold mining industry
but can be applied to shallow mines. The methodology developed in the dissertation can be
applied to any underground mine that uses fans as the main source of ventilation supply.
3.4 Conclusion
This section concludes Chapter 3 of the study and provides a summary of the results of applying
the methodology created to a case study mine.
In section 3.2.1, the case study mine was explained and a figure shows the cross-sectional view
of the case study mine.
In section 3.2.2, the methodology for reconditioning a decommissioned mine’s ventilation
network was applied to the case study mine. The ventilation network was benchmarked by
using the surface fans as the KPIs and the baseline simulation was constructed. The simulation
software was used to create a proposal for optimising the ventilation network of the mine. The
proposal was implemented, and the results verified and evaluated according to the simulation
results.
In section 3.3, the validation of simulation software to improve ventilation networks was
discussed.
Improving the ventilation of deep-level gold mines by simulating inactive sections
80
Chapter 4: CONCLUSION
4.1 Summary
This dissertation explored the different methods for optimising deep-level gold mine
ventilation networks. It found that simulation software is an accurate method for modelling a
mine’s ventilation network and evaluating optimisation projects. However, there little literature
was available on decommissioned mines and no literature on the reconditioning of the
ventilation networks of decommissioned mines.
As mines move further away from primary ventilation shafts, the use of decommissioned mines
has been made part of the South-African mining industry to decrease operational and capital
costs. Active mines have incorporated neighbouring decommissioned mines as part of their
ventilation networks towards an increase of their life of mine. However, due to the deteriorating
ventilation networks of decommissioned mines, the efficiency of the ventilation network is
very low.
The solution for improving the ventilation networks of decommissioned mines was identified
and the design for a method that could be implemented on any current ventilation network was
discussed and formulated. The method makes use of simulation software to construct the
mine’s ventilation network. A sealing plan was produced as the optimisation plan for the case
study mine. The simulation software was used to evaluate the optimisation plan before
implementing it on the mine.
The method was tested on a decommissioned deep-level gold mine in South Africa (Mine A)
through implementation. The results obtained showed an increase in the main fan pressures of
165 Pa, which was the result of increased ventilation network resistance. The increased
resistance indicates that air is only reaching the desired areas. The measurable results showed
an increase of 35 m3/s and a 0.29 kPa drop in booster fan pressure. This was associated with
an improvement in ventilation network efficiency.
The dissertation shows, that there is value added to the deep-level gold mining industry through
using simulation software to evaluate inactive sections. The mining industry can benefit largely
Improving the ventilation of deep-level gold mines by simulating inactive sections
81
from improving inactive sections of ventilation networks through sealing plans and ventilation
control devices.
It is concluded that implementing this study’s designed method by using the main fans as a
KPI to characterise a ventilation network is achievable. Hence, the main objective of this study,
which is to improve the ventilation network of a deep-level gold mine by simulating inactive
sections, was achieved.
4.2 Limitations and Recommendations
Throughout this dissertation, various limiting factors regarding the method were identified.
Given that the method is designed for a large amount of data access, the case study had limiting
factors. These limiting factors were the following:
• Mine paper layouts and incomplete mine layouts
• Limited underground access
• Limited underground measurements
• Illegal miners
The unavailability of underground measurements made it difficult to measure the impact of the
sealing plan that was developed. The sealing plan was also implemented in a different sequence
than initially set out due to the safety risk involved in the case study mine.
Given that the goal of the study was to improve the ventilation network and increase airflow
from an active mine, an additional optimisation method may be developed to increase the
amount of airflow. Underground auxiliary fans can be used to increase the airflow to a desirable
amount. The use of airflow restriction may be helpful to decrease an abundance of airflow.
Thus, further development of this study’s method towards a generic model for all mining
ventilation networks may yield pleasing results.
Improving the ventilation of deep-level gold mines by simulating inactive sections
82
References
[1] D. Nell, “Optimising production through improving the efficiency of mine compressed
air networks with limited infrastructure,” Masters dissertation, North West University,
2017.
[2] D. Cioclea, “Diminishing the explosion risk at Jiu Valley’s coal underground mines by
computerized management of ventilation networks,” Journal of the University of
Petrosani Mining Engineering ER, vol. 6, no. 2, pp. 12-18, 2011.
[3] Africa Mineral Council of South, “Integrated annual review 2017,” Chamber of mines of
South Africa, Johannesburg, 2017.
[4] J. Burton, “World Atlas,” 05 June 2019. [Online]. Available:
https://www.worldatlas.com/articles/top-14-gold-producers-in-the-world.html.
[Accessed 12 January 2020].
[5] N. Nattrass, “The Crisis in South African Gold Mining,” World development, vol. 23, no.
5, pp. 857-868, 1995.
[6] Statistics of South Africa, “Stats SA,” 15 February 2019. [Online]. Available:
http://www.statssa.gov.za/?p=11921. [Accessed 12 January 2020].
[7] R. v. d. Berg, “South African Hostory Online,” 19 October 2011. [Online]. Available:
https://www.sahistory.org.za/article/discovery-gold-1884. [Accessed 03 January 2020].
[8] Mineral Council of South Africa, “SA gold mining,” Mineral counsil of South Africa,
[Online]. Available: https://www.mineralscouncil.org.za/sa-mining/gold. [Accessed 12
January 2020].
[9] D.F. Malan, F.R.P. Basson, “Ultra-deep mining: The increased potential of squeezing
conditions,” The Journal of The South African Institute of Mining and Metallurgy, pp.
353-364, 1998.
[10] R. Johnson; J.K. Schweitzer,, “Mining at ultra-depth : evaluation of alternatives,” in
NARMS'96 : North American rocks mechanics symposium. A regional conference of
ISRM, Quebec, 1996.
[11] Verdict media limited, “Mining technology,” 11 June 2019. [Online]. Available:
https://www.mining-technology.com/features/feature-top-ten-deepest-mines-world-
south-
Improving the ventilation of deep-level gold mines by simulating inactive sections
83
africa/#:~:text=Mponeng%20gold%20mine%20in%20South,a%20depth%20of%203.4
km.. [Accessed 12 August 2020].
[12] T. Tholana, P.N. Neigo, “Trends in productivity in the South African gold mining
industry,” The Journal of The Southern African Institute of Mining and Metallurgy, vol.
116, no. 3, pp. 238-290, 2016.
[13] N. Minnaar, “Living lifestyle,” 26 September 2016. [Online]. Available:
http://www.living-lifestyle.co.za/how-is-gold-found-and-extracted/. [Accessed 11
August 2020].
[14] E. D. Souza, “Application of ventilation management programs for improved mine,”
International Journal of Mining Science and Technology, vol. 27, no. 4, pp. 647-650,
2017.
[15] J. H. Marais, “An integrated approach to optimise energy consumption of mine
compressed air systems,” Ph.D. thesis, North-West University, 2012.
[16] A. Botha, “Optimising the demand of a mine water reticulation system to reduce
electricity consumption,” M.Eng. thesis, Dept. Mech. Eng., North-West University,
2010.
[17] L. F. v. d. Zee, “Modelling of electricity cost risks and opportunities in the gold mining
industry,” Ph.D. thesis, North-West University, 2014.
[18] S. Moolman, “Power Optimal,” 29 September 2019. [Online]. Available:
https://www.poweroptimal.com/350-increase-decade-expensive-electricity-south-
africa-compared-countries/. [Accessed 31 July 2020].
[19] E. Ernst and B. Young, “Productivity in mining,” BMC, United Kingdom, 2017.
[20] R. Fair, “Optimisation of mine secondary fan systems,” M.Eng Dissertation, North West
University, 2019.
[21] E. Acuna, I. Lowndes, “A review of primary mine ventilation system optimization,”
Interfaces, vol. 44, no. 2, pp. 163-175, 2014.
[22] K. Wallace, B. Prosser, J. Stinnette, “The practice of mine ventilation engineering,”
International Journal of Mining Science and Technology, vol. 25, no. 2, pp. 165-169,
2015.
Improving the ventilation of deep-level gold mines by simulating inactive sections
84
[23] D. Michaud, “Underground mine ventilation,” 25 October 2016. [Online]. Available:
https://www.911metallurgist.com/blog/underground-mine-ventilation. [Accessed 16
August 2020].
[24] G. Wei, “Optimization of mine ventilation system based on bionics algorithm,” Procedia
Engineering, vol. 26, no. 1, pp. 1614-1619, 2011.
[25] J. Cheng,, “Assement of mine ventilation system reliability using random simulation
method,” Enviromental Engineering and Management Journal, vol. 15, no. 4, pp. 841-
850, 2016.
[26] S. Bluhm and M. Biffi, “Variations in ultra-deep, narrow reef stoping configuration and
the effects on cooling and ventilation,” The Journal of The South African Institute of
Mining and Metallurgy, vol. 101, no. 3, pp. 127-134, May/June 2001.
[27] F. Fourie; P. Valicek; G. Krafft; J. Sevenoaks, “Narrow-reef mechanized mining layout
at Anglo American Platinum,” Journal of the Southern African Institute of Mining and
Metallurgy, vol. 117, no. 3, pp. 263-274, 2017.
[28] M.F. Handley, J.A.J. de Lange, F. Essrich, and J.A. Banning, “A reveiw of the sequential
grid mining method employed at Elandsrand Gold MIne,” The Journal of The South
African Institute of MIning and Metallurgy, vol. 100, no. 3, pp. 157-168, 2000.
[29] D. J. de Villiers, M. J. Mathews, P. Maré, M. Kleingeld, and D. Arndt, ““Evaluating the
impact of auxiliary fan practices on localised subsurface ventilation,” Int. J. Min. Sci.
Technol, vol. 3, no. 29, pp. 2-10, 2019.
[30] A.M. Donoghue, M.J. Sinclair, G.P. Bates, “Heat exhaustion in a deep underground,”
occupational & Enviromental Medicine Journal, vol. 57, no. 3, pp. 165-174, 2000.
[31] J. C. Tien,, “Practical mine ventilation engineering,” Interec publishing company, vol. 1,
no. 3, pp. 20-32, 1999.
[32] D.J Brake, C.A Nixon, “Design and operational aspects in the use of booster, circuit and
auxiliary fan systems,” Proceedings of the 11th U.S./North American Mine Ventilation
Symposium - 11th U.S./North American Mine Ventilation Symposium, pp. 543-553, 2006.
[33] J.M. Wempen, F. Calizaya, R.D. Peterson, M.G. Nelson, “Evaluating the use of booster
fans in two underground coal mines,” Mining Engineering, vol. 63, no. 6, pp. 115-119,
2011.

Improving the ventilation of deep-level gold mines by simulating inactive sections
85
[34] J. Tien, “Mine ventilation systems,” in Practical Mine Ventilation Engineering,
Missouri, Intertec Publishing Co., 1999, pp. 162-183.
[35] “AirEng Industrial fans and Blowers,” 2016. [Online]. Available:
https://www.aireng.com.au/products/mining-fans/primary-
fans/#:~:text=Primary%20(also%20called%20Main)%20Fans,on%20the%20surface%2
0or%20underground.. [Accessed 17 August 2020].
[36] E. De Souza, “Improving the energy efficiency of mine fan assemblages,” Applied
Thermal Engineering, vol. 90, pp. 1092-1097, 2015.
[37] C. J. P. Venter, The effect of controlling main ventilation fan inlet guide vanes for a deep
level platinum mine to reduce electrical costs, North West University: M.Eng.
Dissertation, 2017.
[38] X. Chen, W. Chu, H. Zhang, X. Li, “Numerical study on inlet angle of guide vane in
recess vaned casing treatment,” Aerospace Science and Technology, vol. 93, 2019.
[39] A. Chatterjee, L. Zhang, X. Xia, “Optimization of mine ventilation fan speeds according
to ventilation on demand and time of use tariff,” Applied Energy, vol. 146, pp. 65-73,
2015.
[40] “Axair Fans UK Limited,” Finding The Duty Point & Operating Point, 2019. [Online].
Available: https://www.axair-fans.co.uk/all-technical-information/duty-point-operating-
point/. [Accessed 4 April 2020].
[41] C. S.L.DixonB, “Chapter 7 Centrifugal pumps, Fans, and Compressors,” in Fluid
Mechanics and Thermodynamics of Turbomachinery, Cambridge, Elsevier, 2010, pp.
217-263.
[42] R. Papar, A. Szady, V. Martin, and A. Mckane, “Increasing energy efficiency of mine
ventilation systems,” Lawrence Berkeley-National, pp. 611-617, 1999.
[43] J. Sui, L. Yang, Z. Zhu, H. Fang, H. Zhen, “Mine ventilation optimization analysis and
airflow control based on harmony annealing search,” Journal of Computers, vol. 6, no.
6, pp. 1270-1277, 2011.
[44] D.H. Diering, “Tunnels under pressure in an ultra-deep,” The Journal of The South
African Institute of Mining and Metallurgy, pp. 319-324, 2000.
[45] J. McLoone, “Flidflow,” Fluid flow, 9 August 2019. [Online]. Available:
https://fluidflowinfo.com/fan-performance-and-fan-
Improving the ventilation of deep-level gold mines by simulating inactive sections
86
laws/#:~:text=The%20system%20resistance%20curve%20can,identify%20the%20actu
al%20duty%2Dpoint.. [Accessed 12 September 2020].
[46] M. Singh; M. Jradi and H.R Shaker, “Monitoring and evaluation of building ventilation
system fans operation using performance curves,” Energy and Built Environment, vol. 1,
no. 3, pp. 307-318, 2020.
[47] S.Sjöström, E.Klintenäs, P.Johansson, J.Nyqvist, “Optimized model-based control of
main mine ventilation air flows with minimized energy consumption,” International
Journal of Mining Science and Technology, vol. 30, no. 4, pp. 533-539, 2020.
[48] R. Carlson, “The correct method of calculating energy savings to justify adjustable
frequency drives on pumps,” in Industry applications society 46th annual petroleum and
chemical industry conference, San Diego, CA, 1999.
[49] I. Vegter, “IRR,” The Star, 26 March 2019. [Online]. Available:
https://irr.org.za/media/welkom-to-a-world-where-mining-dies-the-star. [Accessed 16
August 2020].
[50] J. d. Lange, “City Press,” News24, 22 February 2016. [Online]. Available: https://city-
press.news24.com/Business/deep-ore-mining-goes-cutting-edge-20160219. [Accessed
28 April 2020].
[51] F. Yagodkin, M. Pleshko, A. Prokopov, “Perspective scheme equipment ultra-deep
shafts,” Procedia Engineering, vol. 206, pp. 293-298, 2017.
[52] S. Smith, “Gold Flieds,” South African operations - Driefontein Gold Mine, 2008.
[Online]. Available: https://www.goldfields.com/reports/rr_2008/sa_driefontein.php.
[Accessed 28 April 2020].
[53] J. Burghardt, “Abandoned and inactive mine safety training – Underground mine
hazards,” National Park Service Geologic Resources Division, 2003.
[54] M. Nehring; X. Cheng, “An investigation into the impact of mine closure and its
associated,” Journal of Cleaner Production, vol. 127, pp. 228-239, 2016.
[55] D. Brake, “The design of push-pull primary and secondary ventilation systems and a
vertically-split intake-exhaust ventilation shaft,” in North American Mine Ventilation
Symposium, United States, 2010.
[56] M. J. McPherson, “Ventilation Surveys,” in Subsurface Ventilation Engineering,
Berkley, 1993, pp. Chapter 6 1-33.
Improving the ventilation of deep-level gold mines by simulating inactive sections
87
[57] L. Wenguia, X. Xianpinga, X. Houzaob, C. Chaoa, Y. Xiaoyua, S. Meiweia, W. Tinjuna,
L. Jiangonga, T. Xingyua, “Reliability calculation of mine ventilation network,”
International Symposium on Safety Science and Technology, vol. 84, pp. 752-757, 2014.
[58] H. An, J. Shi, X. Wang and L. Lyu, “Application of depth-first search method in finding
recirculation in mine ventilation system,” The civil engineering journal, vol. 3, no. 24,
pp. 286-295, 2017.
[59] J. Pearl, Intelligent search strategies for computer problem solving addison, Michigan:
AddisonWesley Publishing Company, 1984.
[60] J. van der Walt; E.M. de Kock and L.K. Smith, “The analysis of ventilation and cooling
requirements for mines,” The Southern African Institute of Mining and Metallurgy, vol.
83, no. 2, pp. 25-34, 1983.
[61] X.S. Wu and E. Topuz, “Analysis of Mine Ventilation Systems Using Operations
Research Methods,” Pergamon, vol. 5, no. 4, 1998.
[62] F. Wei, F. Zhu, and H. Lv, “The use of 3D simulation system in mine ventilation
management,” Procedia Engineering, vol. 26, pp. 1370-1379, 2011.
[63] A. J. H. Nel, J. C. Vosloo, and M. J. Mathews, “Supplementary file for : Evaluating
complex mine ventilation operational changes through simulation.,” J. Energy South.
Africa, vol. 29, no. 3, pp. 22-32, 2018.
[64] S J Bluhm, W M Marx, F H von Glehn, M Biffi, “Vuma mine ventilation software,”
Journal of the Mine Ventilation Society of South Africa, vol. 54, no. 3, pp. 65-72, 2001.
[65] C.O. Karacan, “Modeling and prediction of ventilation methane emissions of U.S.
longwall mines using supervised artificial neural networks,” International Journal of
Coal Geology, vol. 73, pp. 371-387, 2008.
[66] Şuvar M., Cioclea D., Gherghe I., Păsculescu V., “Advanced software for mine
ventilation networks solving,” Environmental Engineering and Management Journal,
vol. 11, pp. 1235-1239, 2012.
[67] O.S Asfour ., M.B. Gadi , “A comparison between CFD and Network models for
predicting wind-driven ventilation in buildings,” Building and Environment, vol. 42, pp.
4079-4085, 2007.
[68] C.K. Kocsis, R. Hall, S.G. Hardcastle , “South African Institute of Mining and
Metallurgy,” Application of Computers and Operations Research in the Minerals
Improving the ventilation of deep-level gold mines by simulating inactive sections
88
Industries, 2003. [Online]. Available:
http://www.saimm.co.za/Conferences/Apcom2003/22 3-Kocsis.pdf. [Accessed 06 April
2020].
[69] M. Șuvar, C. Lupu, V. Arad, D. Cioclea, V. Păsculescu, N. Mija, “Computerized
simulation of mine ventilation network for sustainable decision making process,”
Environmental Engineering and Management Journal, vol. 13, no. 6, pp. 1445-1451,
2014.
[70] E De Souza, “Optimization of complex mine ventilation systems with computer network
modelling,” IFAC Proceedings Volumes, pp. 323-329, 2007.
[71] P. Maré, Novel simulations for energy management of mine cooling systems, North West
University: PhD Thesis, 2017.
[72] A. Nikolaev, N. Alymenko, A. Kamenskikh, S. Fet, and V. Nikolaev, “Results of
modelling of mine ventilation with air curtain installed into downcast and upcast shafts,”
Perm J. Pet. Min. Eng., vol. 26, pp. 1370-1379, 2011.
[73] E. S. Menon, Transmission Pipeline Calculations and Simulations Manual, Oxford:
Elsevier Inc., 2014.
[74] D. Nell, “Practical determination of heat loads for existing deep level gold mines,” P.hD
Thesis, North-West University, 2020.
[75] D. Arndt, “Process toolbox Thermal hydraulic simulation tool,” Enermanage, Pretoria,
2016.
[76] J. ZHANG , C. SUO, “Study of coal mine ventilation system optimization based on
ventsim,” in MATEC Web of Conferences 44, Beijing, 2016.
[77] M. Morar, A. Matei, and R. Dragoescu, “Efficiency of complex ventilation networks,”
Annals of the University of Ptrosani, Mining Engineering., vol. 9, pp. 183-192, 2018.
[78] B. Friedenstein, C. Cilliers, J. Van Rensburg, “Simulating operational improvements on
mine compressed air systems,” S. Afr. J. Ind. Eng., vol. 29, no. 3, pp. 69-81, 2018.
[79] J. Watkins, “Trade-off between simulation accuracy and complexity for mine
compressed air systems,” M. Eng Dissertation, North West University, 2018.
[80] X. Xianping, Z. Zicheng, “Research development of ventilation system optimization
design for mining,” Xinjiang Nonferrous Metal, vol. 4, pp. 14-19, 1995.
Improving the ventilation of deep-level gold mines by simulating inactive sections
89
[81] Y. Zhongming, W. Yuguang, “Application of analyzing hierarchy procedures to
optimization of mining ventilation system,” J. of Guizhou University of Technology, vol.
26, pp. 62-69, 1997.
[82] W. Weidong, J. Guoxun, W. Jianping, “The application of grey relevancy analyzing
method in ventilation system scheme,” Journal of China Coal Mining Society, vol. 26,
no. 6, pp. 290-293, 2001.
[83] X. Xianping, F. Changgen and Z. Zicheng, “Research on fuzzy optimization for mining
ventilation systems,” Journal of China Coal Mining Society, vol. 24, pp. 397-382, 1999.
[84] X. Wenxun, X. Jinxing, “Modern optimization computation method,” in Tsinghua
University Press, Beijing, 1999.
[85] K. Charles, A. Sadiku and M.N.O. Sadiku, “Basic Laws,” in Fundamentals of Electric
Circuits, New York, McGraw Hill, 2013.
[86] L. Campeau, M. Gamache, “Short-term planning optimization model for underground
mines,” Computers and Operations Research, vol. 2, no. 2, pp. 50-65, 2019.
[87] C. Watson, J. Marshall, “Estimating underground mine ventilation friction factors from
low density 3D data acquired by a moving LiDAR,” International Journal of Mining
Science and Technology, vol. 28, no. 4, pp. 657-662, 2018.
[88] R. Weber-Youngman, “An intergrated approach towards the optimization of ventilation,
air cooling and pumping requirements for hot mines,” PhD Thesis, North West
University, 2005.
[89] E. Develo, M. Pillalamarry and E. Garab, “Improving the ventilation system at Rosh
Pinah zinc mine,” Journal of South African Institute of Mining and Metallurgy, vol. 116,
no. 4, pp. 301-305, 2016.
[90] C.K Koscis, R. Hall, and S.G. Hardcastle, “The integration of mine simulation and
ventilation simulation to develop a 'Life-Cycle' mine ventilation system,” South African
Institute of Mining and Metallurgy, vol. 13, no. 6, pp. 223-229, 2003.
[91] Mining Ventilation Society of South Africa,, “MVSSA,” 2021. [Online]. Available:
https://mvssa.co.za/. [Accessed 15 02 2021].
[92] M. Jahangirian, S.J.E. Taylor, T. Young and S. Robinson, “Key performance indicators
for successful simulation projects,” Journal of the Operational Research Society, vol. 68,
pp. 747-765, 2017.
Improving the ventilation of deep-level gold mines by simulating inactive sections
90
[93] M.Q.W. Jones, “Virgin rock temperatures and geothermal gradients in the Bushveld
Complex,” Journal of the Southern African Institute of Mining and Metallurgy, vol. 118,
no. 7, pp. 671-680, 2018.
[94] T. Maurya, K. Karena, H. Vardhan, M. Aruna, “Potential Sources of Heat in
Underground Mines,” Procedia Earth and Planetary Science, vol. 11, pp. 463-468, 2015.
[95] R. Anderson, E DeSouza, “Heat stress management in underground mines,”
International Journal of Mining Science and Technology, vol. 27, no. 4, pp. 651-655,
2017.
[96] A. de Myttenaere, B. Golden, B. Le Grand, F. Rossi, “Mean Absolute Percentage Error
for regression models,” Neurocomputing, vol. 192, pp. 38-48, 2016.
[97] J. Glimm; S. Hou; Y. Lee; D.H. Sharp; and K. Ye, “Sources of uncertainty and error in
the simulation pf flow in porous media,” Computational & Applied Mathematics, vol.
23, pp. 2-3, 2004.
[98] G. Warne, “AMS Haden,” BN AMS Haden Technology Solutions, 2019. [Online].
Available: https://www.amshaden.co.za/observer-kit/. [Accessed 8 April 2020].
[99] Unknown, “Measurements of Airflow and Mine-wide Monitoring,” 11 February 2002.
[Online]. Available: http://web.mst.edu/~tien/218/Lab3-measure.pdf. [Accessed 8 April
2020].
[10
0]
H. Bengton, “Bright hub engineering,” [Online]. Available:
https://www.brighthubengineering.com/hydraulics-civil-engineering/58382-how-to-
measure-fluid-velocity-with-a-pitot-tube/. [Accessed 8 April 2020].
[10
1]
B. Mayur, “Mayur Instruments,” The application of a manometer, 2012. [Online].
Available: http://www.mayurlevelindicators.com/manometer.html. [Accessed 8 April
2020].
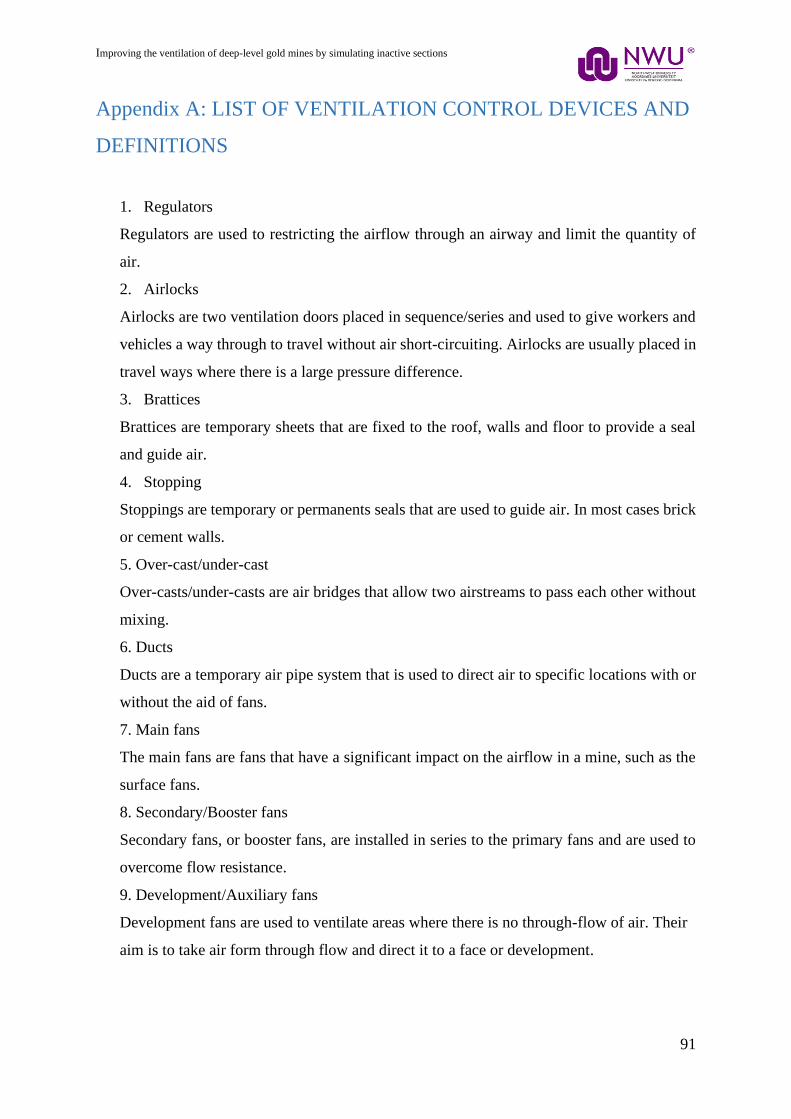
Improving the ventilation of deep-level gold mines by simulating inactive sections
91
Appendix A: LIST OF VENTILATION CONTROL DEVICES AND
DEFINITIONS
1. Regulators
Regulators are used to restricting the airflow through an airway and limit the quantity of
air.
2. Airlocks
Airlocks are two ventilation doors placed in sequence/series and used to give workers and
vehicles a way through to travel without air short-circuiting. Airlocks are usually placed in
travel ways where there is a large pressure difference.
3. Brattices
Brattices are temporary sheets that are fixed to the roof, walls and floor to provide a seal
and guide air.
4. Stopping
Stoppings are temporary or permanents seals that are used to guide air. In most cases brick
or cement walls.
5. Over-cast/under-cast
Over-casts/under-casts are air bridges that allow two airstreams to pass each other without
mixing.
6. Ducts
Ducts are a temporary air pipe system that is used to direct air to specific locations with or
without the aid of fans.
7. Main fans
The main fans are fans that have a significant impact on the airflow in a mine, such as the
surface fans.
8. Secondary/Booster fans
Secondary fans, or booster fans, are installed in series to the primary fans and are used to
overcome flow resistance.
9. Development/Auxiliary fans
Development fans are used to ventilate areas where there is no through-flow of air. Their
aim is to take air form through flow and direct it to a face or development.
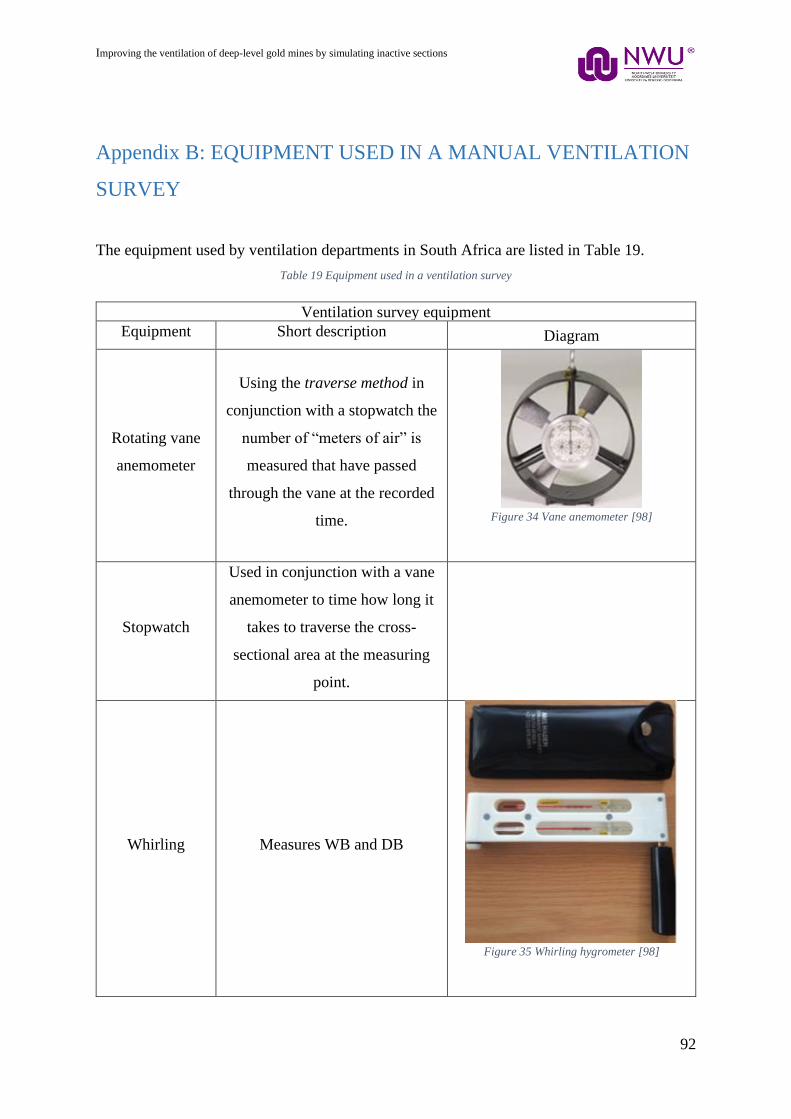
Improving the ventilation of deep-level gold mines by simulating inactive sections
92
Appendix B: EQUIPMENT USED IN A MANUAL VENTILATION
SURVEY
The equipment used by ventilation departments in South Africa are listed in Table 19.
Table 19 Equipment used in a ventilation survey
Ventilation survey equipment
Equipment Short description Diagram
Rotating vane
anemometer
Using the traverse method in
conjunction with a stopwatch the
number of “meters of air” is
measured that have passed
through the vane at the recorded
time.
Figure 34 Vane anemometer [98]
Stopwatch
Used in conjunction with a vane
anemometer to time how long it
takes to traverse the cross-
sectional area at the measuring
point.
Whirling Measures WB and DB
Figure 35 Whirling hygrometer [98]
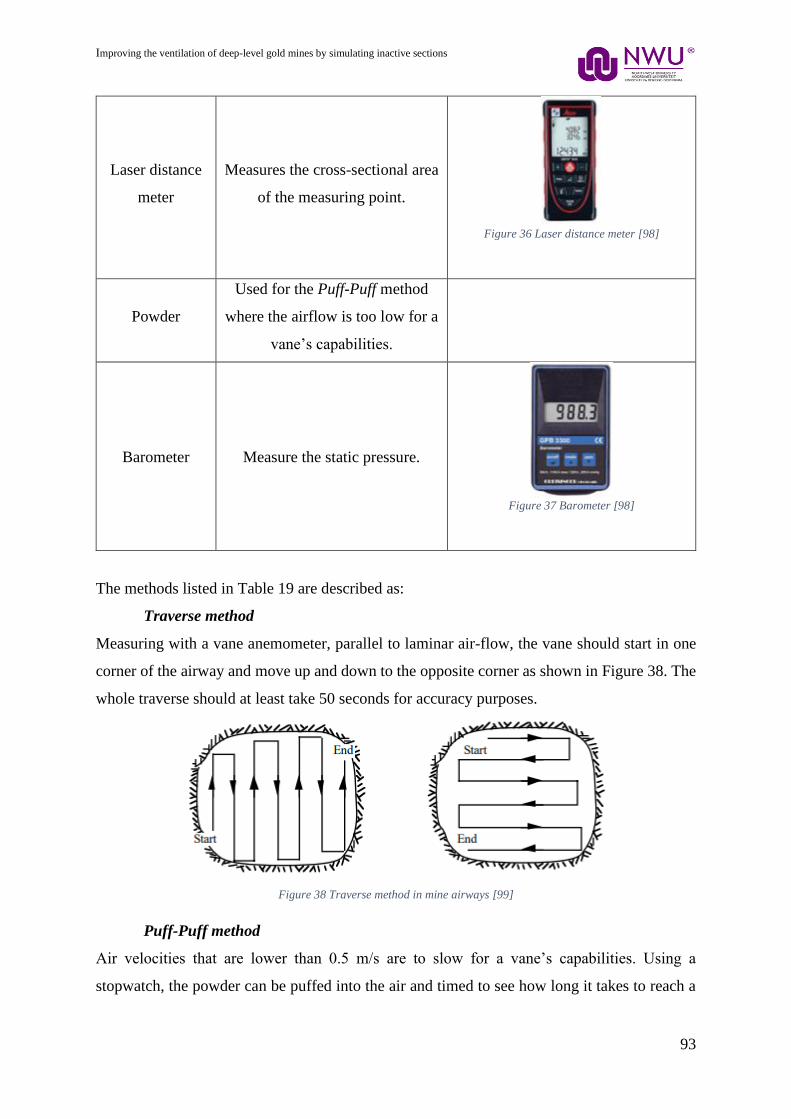
Improving the ventilation of deep-level gold mines by simulating inactive sections
93
Laser distance
meter
Measures the cross-sectional area
of the measuring point.
Figure 36 Laser distance meter [98]
Powder
Used for the Puff-Puff method
where the airflow is too low for a
vane’s capabilities.
Barometer Measure the static pressure.
Figure 37 Barometer [98]
The methods listed in Table 19 are described as:
Traverse method
Measuring with a vane anemometer, parallel to laminar air-flow, the vane should start in one
corner of the airway and move up and down to the opposite corner as shown in Figure 38. The
whole traverse should at least take 50 seconds for accuracy purposes.
Figure 38 Traverse method in mine airways [99]
Puff-Puff method
Air velocities that are lower than 0.5 m/s are to slow for a vane’s capabilities. Using a
stopwatch, the powder can be puffed into the air and timed to see how long it takes to reach a
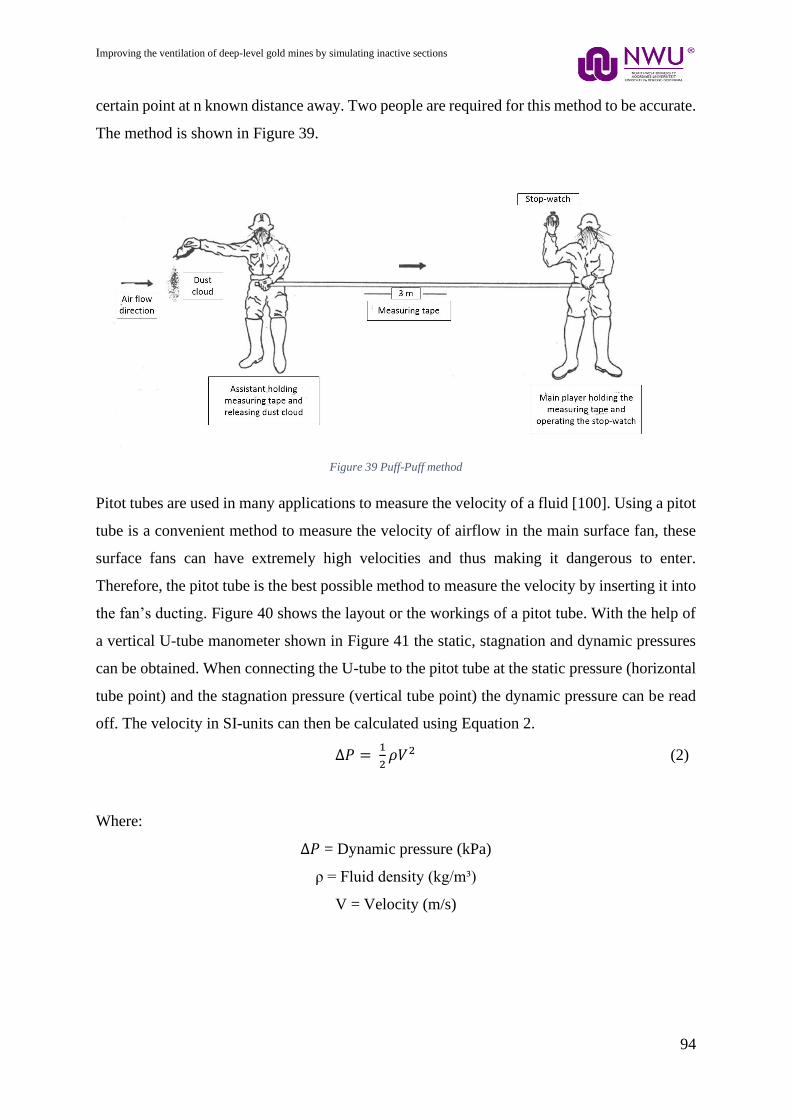
Improving the ventilation of deep-level gold mines by simulating inactive sections
94
certain point at n known distance away. Two people are required for this method to be accurate.
The method is shown in Figure 39.
Figure 39 Puff-Puff method
Pitot tubes are used in many applications to measure the velocity of a fluid [100]. Using a pitot
tube is a convenient method to measure the velocity of airflow in the main surface fan, these
surface fans can have extremely high velocities and thus making it dangerous to enter.
Therefore, the pitot tube is the best possible method to measure the velocity by inserting it into
the fan’s ducting. Figure 40 shows the layout or the workings of a pitot tube. With the help of
a vertical U-tube manometer shown in Figure 41 the static, stagnation and dynamic pressures
can be obtained. When connecting the U-tube to the pitot tube at the static pressure (horizontal
tube point) and the stagnation pressure (vertical tube point) the dynamic pressure can be read
off. The velocity in SI-units can then be calculated using Equation 2.
∆𝑃 = 1
2𝜌𝑉2 (2)
Equation 2 Dynamic pressure
Where:
∆𝑃 = Dynamic pressure (kPa)
ρ = Fluid density (kg/m³)
V = Velocity (m/s)
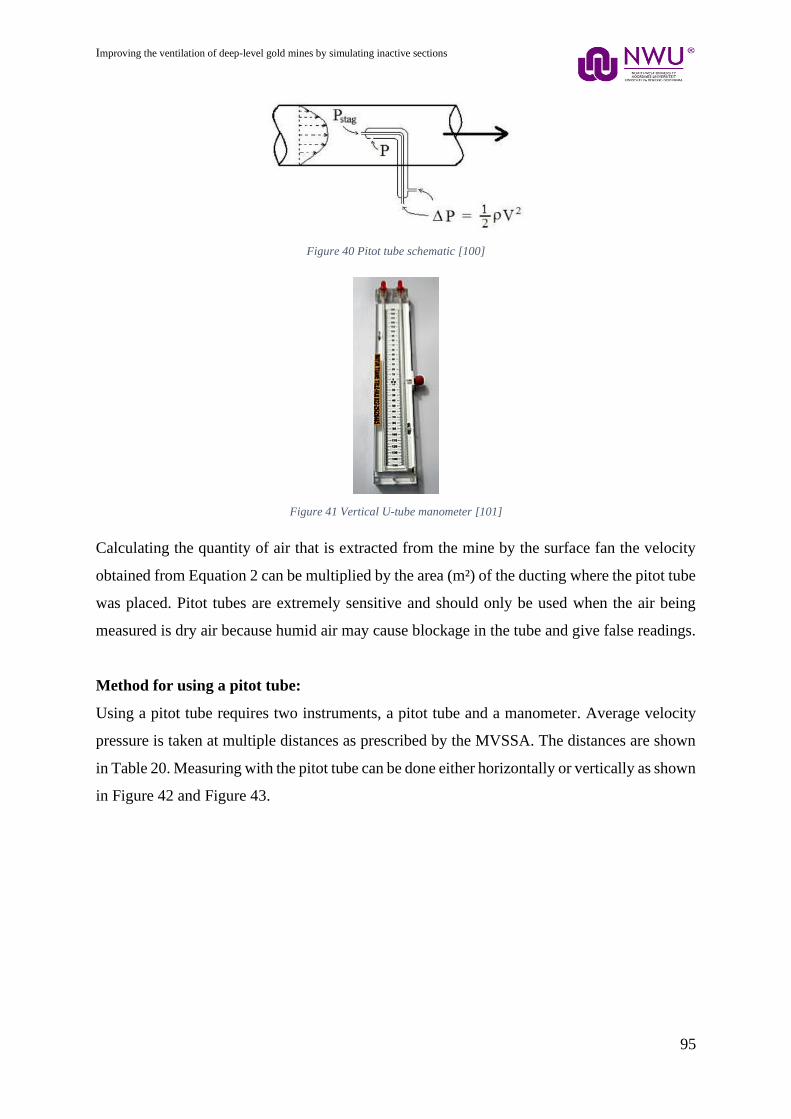
Improving the ventilation of deep-level gold mines by simulating inactive sections
95
Figure 40 Pitot tube schematic [100]
Figure 41 Vertical U-tube manometer [101]
Calculating the quantity of air that is extracted from the mine by the surface fan the velocity
obtained from Equation 2 can be multiplied by the area (m²) of the ducting where the pitot tube
was placed. Pitot tubes are extremely sensitive and should only be used when the air being
measured is dry air because humid air may cause blockage in the tube and give false readings.
Method for using a pitot tube:
Using a pitot tube requires two instruments, a pitot tube and a manometer. Average velocity
pressure is taken at multiple distances as prescribed by the MVSSA. The distances are shown
in Table 20. Measuring with the pitot tube can be done either horizontally or vertically as shown
in Figure 42 and Figure 43.
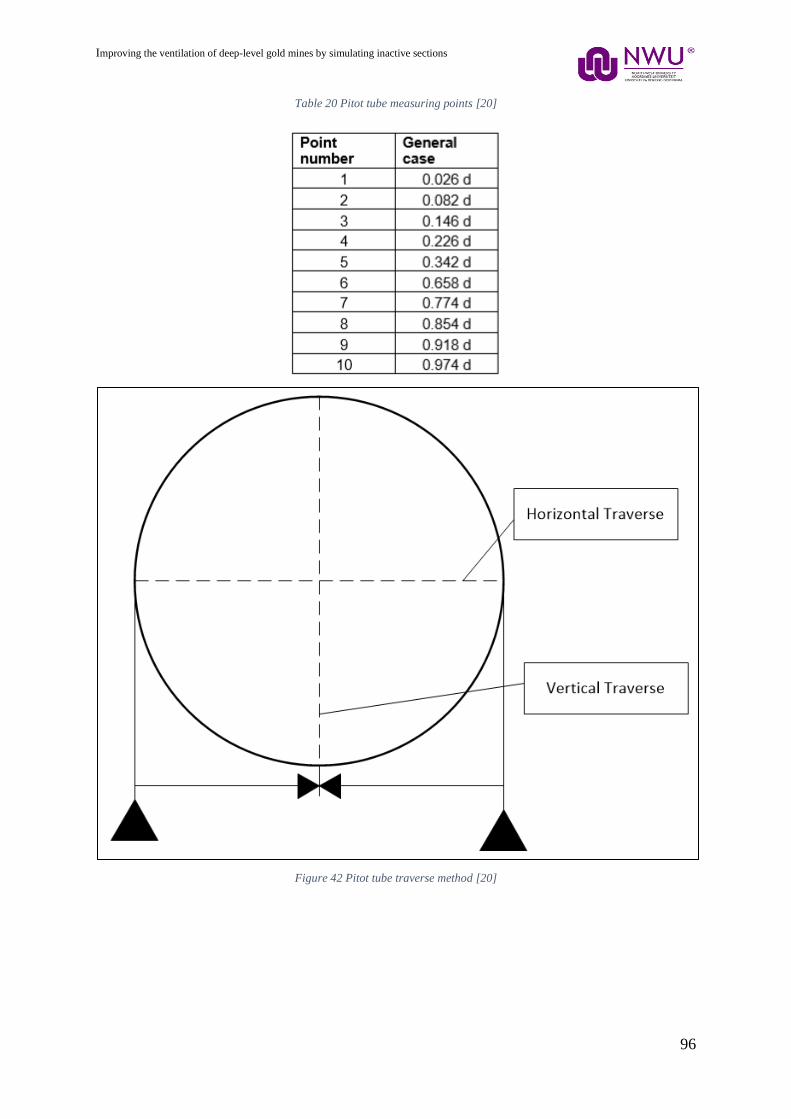
Improving the ventilation of deep-level gold mines by simulating inactive sections
96
Table 20 Pitot tube measuring points [20]
Figure 42 Pitot tube traverse method [20]

Improving the ventilation of deep-level gold mines by simulating inactive sections
97
Figure 43 Pitot tube measuring points in round ducting [20]
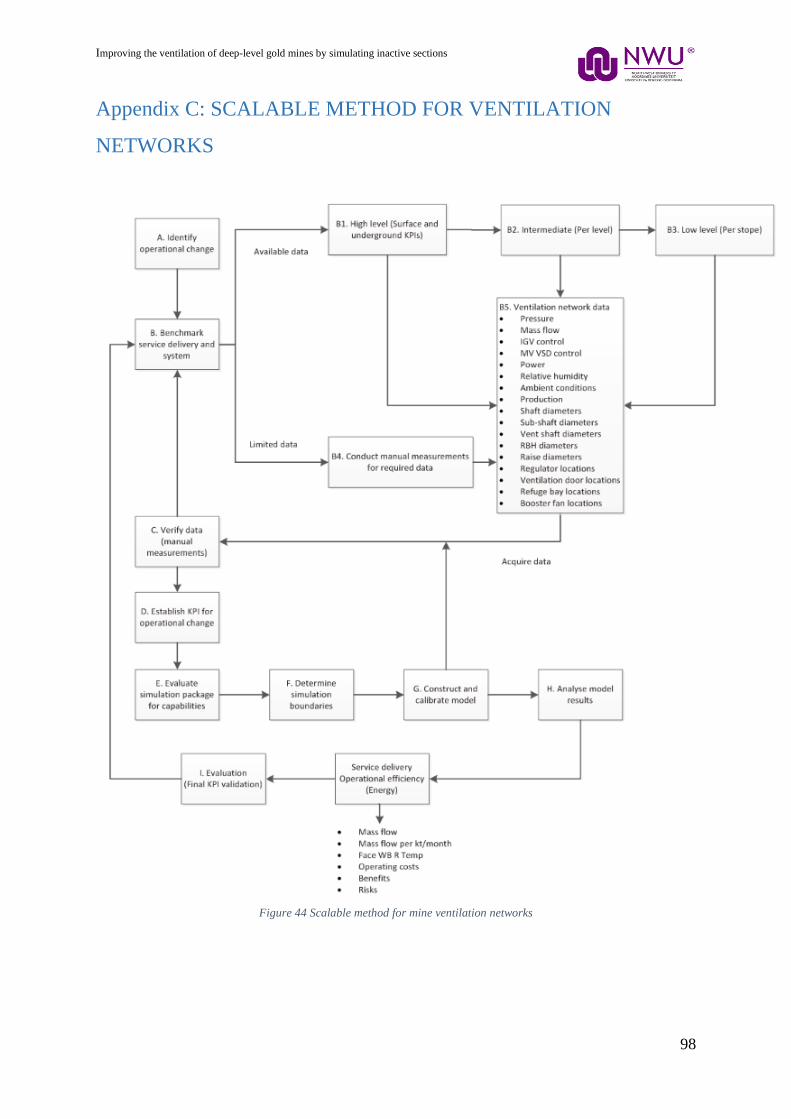
Improving the ventilation of deep-level gold mines by simulating inactive sections
98
Appendix C: SCALABLE METHOD FOR VENTILATION
NETWORKS
Figure 44 Scalable method for mine ventilation networks
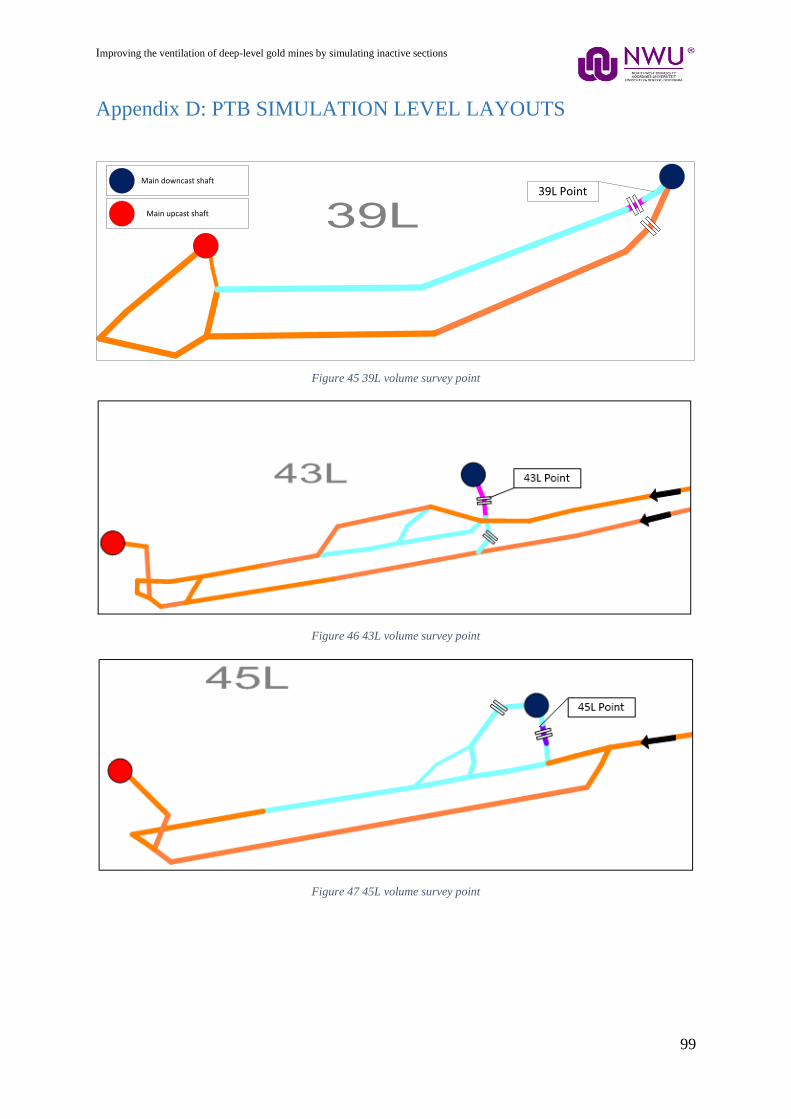
Improving the ventilation of deep-level gold mines by simulating inactive sections
99
Appendix D: PTB SIMULATION LEVEL LAYOUTS
Main downcast shaft
Main upcast shaft
39L Point
Figure 45 39L volume survey point
Figure 46 43L volume survey point
Figure 47 45L volume survey point
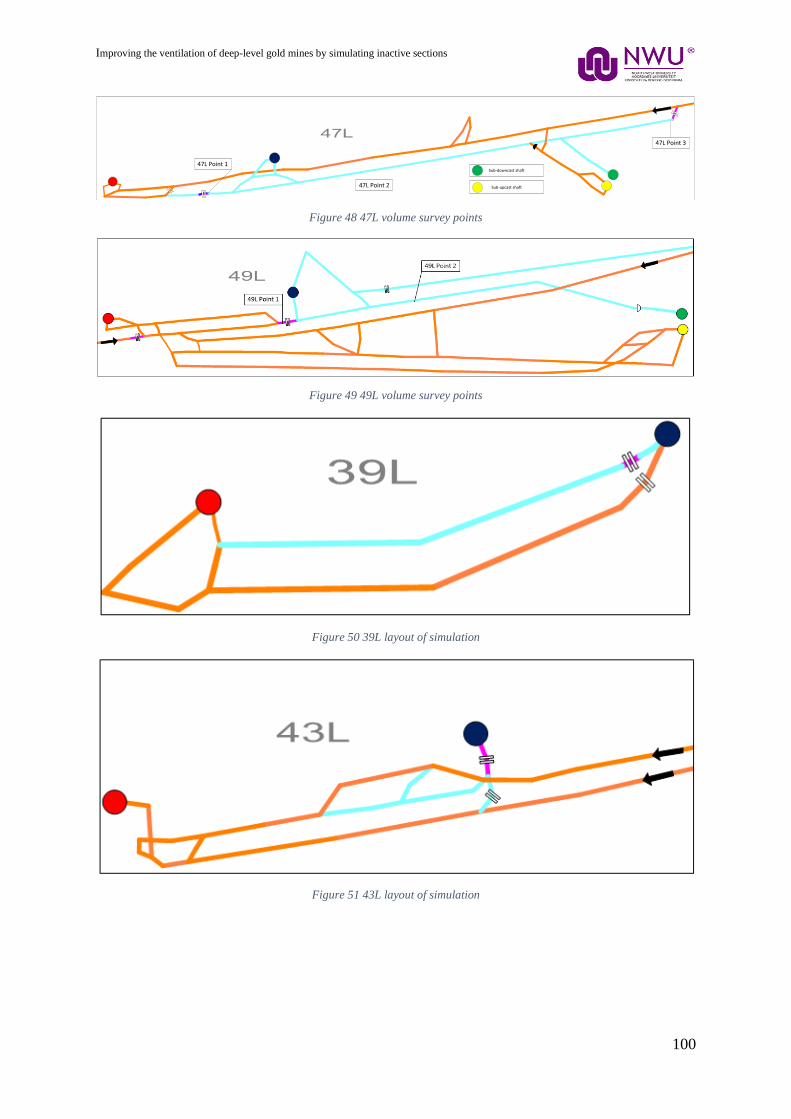
Improving the ventilation of deep-level gold mines by simulating inactive sections
100
47L Point 1
47L Point 2
47L Point 3
Sub-downcast shaft
Sub-upcast shaft
Figure 48 47L volume survey points
Figure 49 49L volume survey points
Figure 50 39L layout of simulation
Figure 51 43L layout of simulation

Improving the ventilation of deep-level gold mines by simulating inactive sections
101
Figure 52 45L layout of simulation
Figure 53 47L layout of simulation
Figure 54 49L layout of simulation
Figure 55 51L layout of simulation
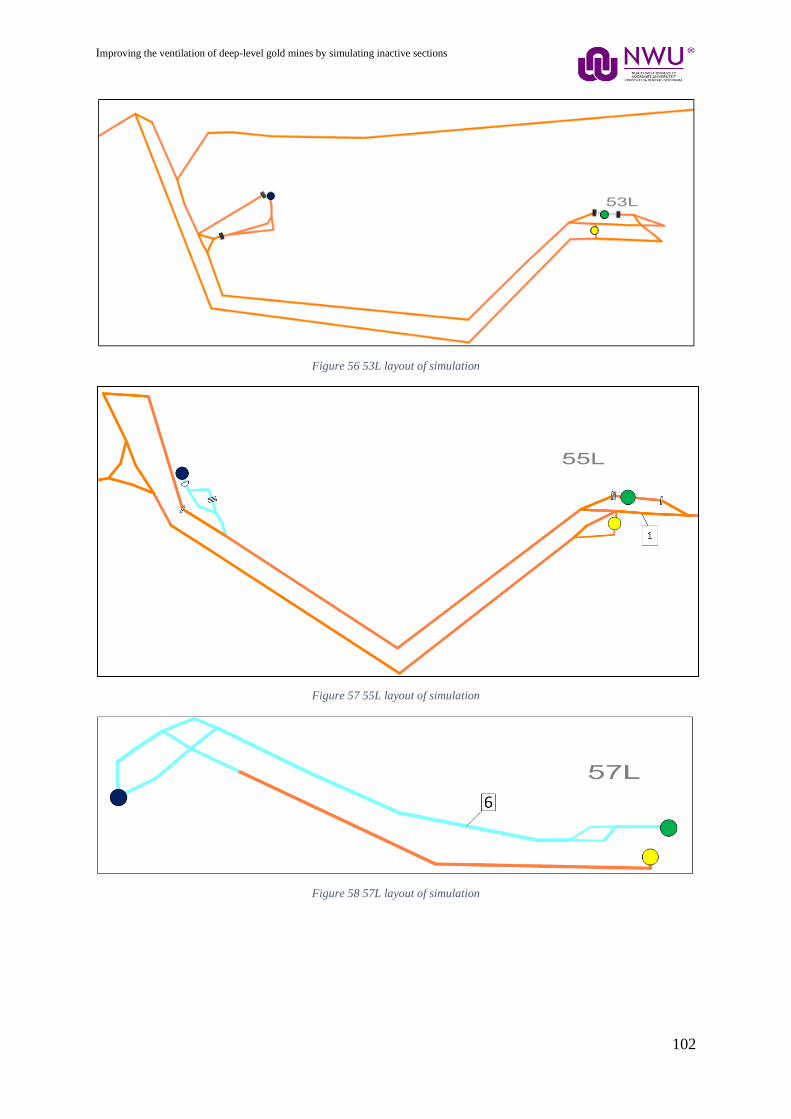
Improving the ventilation of deep-level gold mines by simulating inactive sections
102
Figure 56 53L layout of simulation
Figure 57 55L layout of simulation
Figure 58 57L layout of simulation
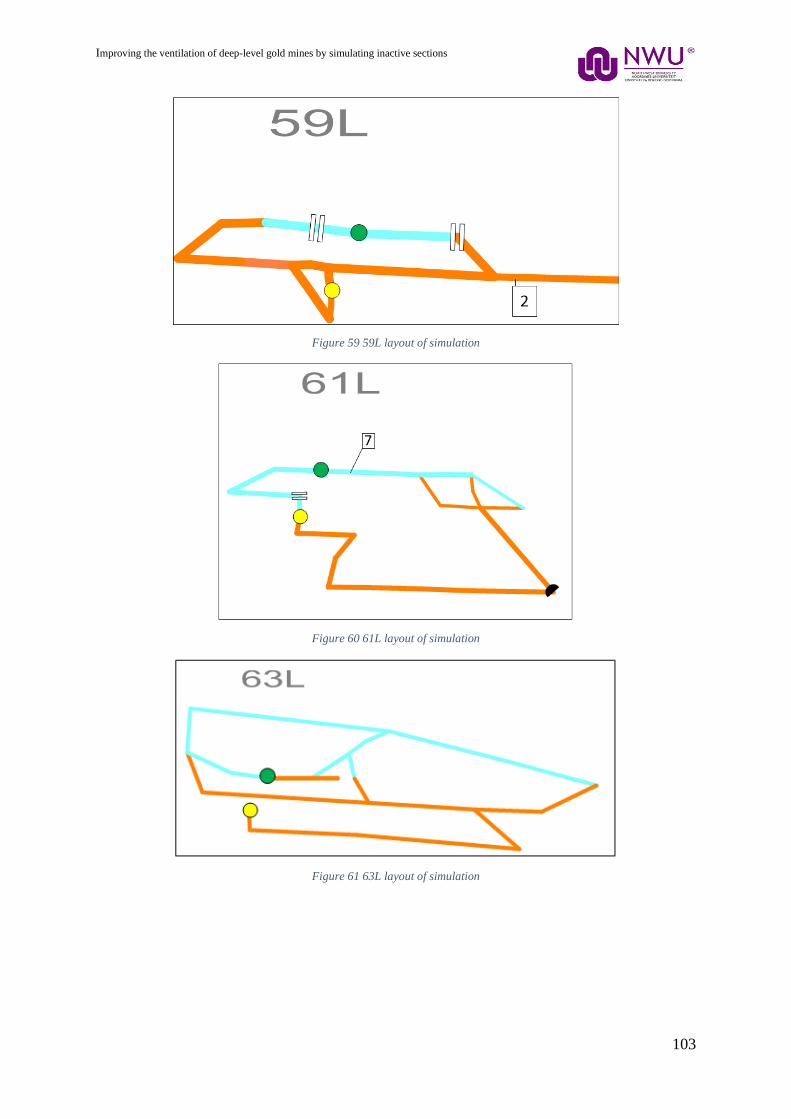
Improving the ventilation of deep-level gold mines by simulating inactive sections
103
Figure 59 59L layout of simulation
Figure 60 61L layout of simulation
Figure 61 63L layout of simulation
Improving the ventilation of deep-level gold mines by simulating inactive sections
104
Figure 62 64L layout of simulation
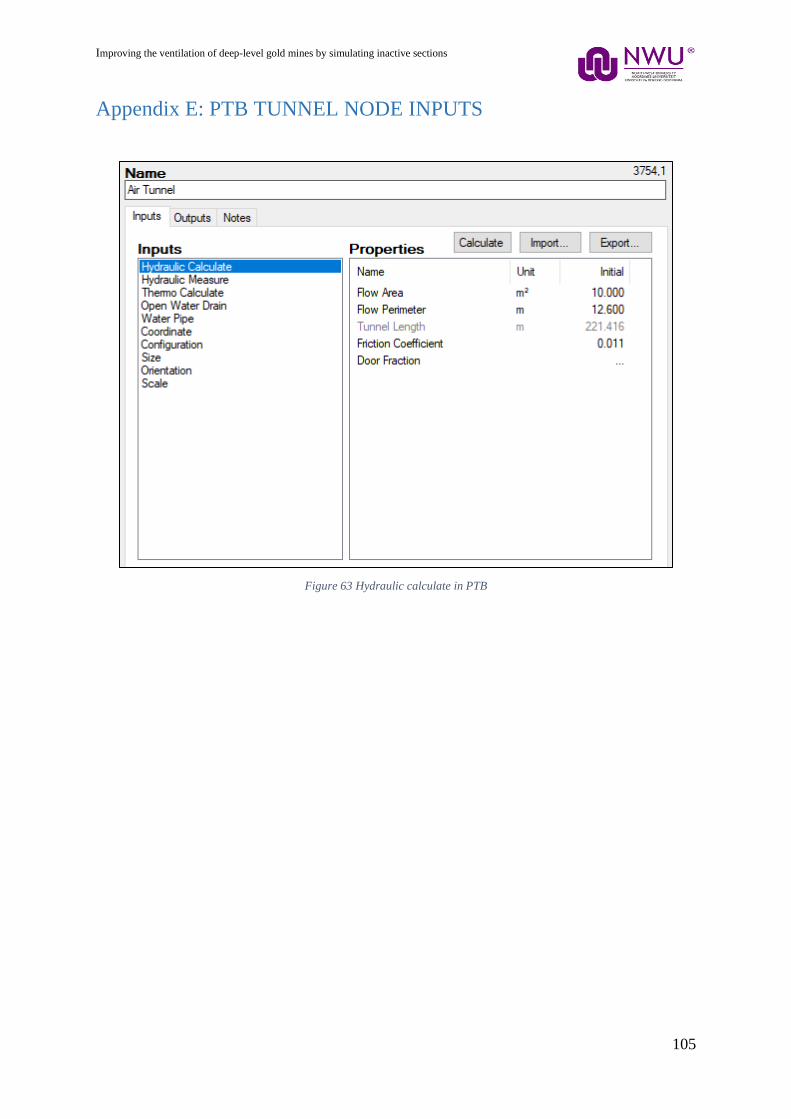
Improving the ventilation of deep-level gold mines by simulating inactive sections
105
Appendix E: PTB TUNNEL NODE INPUTS
Figure 63 Hydraulic calculate in PTB

Improving the ventilation of deep-level gold mines by simulating inactive sections
106
Appendix F: SYSTEM RESISTANCE CURVE OF SEALING PLAN
Figure 64 Enlarged graph of resistance curve of sealing plan
1000
1200
1400
1600
1800
2000
2200
2400
2600
340 350 360 370 380 390 400 410
Pre
ssu
re (
Pa)
Volume flow rate (m3/s)
Resistance curves for sealing plan
Static pressure
Seal 1
Seal 2
Seal 3
Seal 4
Seal 5
Seal 6
Baseline