
B HSVA Report No. 1663 - itdemokrati.nu · REPORT H AMBURGISCHE S CHIFFBAU-V ERSUCHS A NSTALT T HE...
166
R EPOR T HAMBURGISCHE SCHIFFBAU-VERSUCHSANSTALT ▪ THE HAMBURG SHIP MODEL BASIN HSVA Report No. 1663 Research Study on the Sinking Sequence and Evacuation of the MV Estonia - Final Report Client: VINNOVA Hamburg, May 05, 2008
Transcript of B HSVA Report No. 1663 - itdemokrati.nu · REPORT H AMBURGISCHE S CHIFFBAU-V ERSUCHS A NSTALT T HE...

REPORT
HA
MB
UR
GIS
CH
E S
CH
IFFB
AU
-VE
RS
UC
HS
AN
STA
LT ▪
TH
E H
AM
BU
RG
SH
IP M
OD
EL
BA
SIN
HSVA Report No. 1663
Research Study on the Sinking Sequence and Evacuation of the MV Estonia
- Final Report
Client: VINNOVA
Hamburg, May 05, 2008

HSVA Report No. 1663
for The Swedish Governmental Agency for Innovation Systems
VINNOVA
VINNOVA file reference number 2005-02901.
Research Study on the Sinking Sequence and Evacuation of the MV Estonia
- Final Report
(HSVA Auftrags Nr. 625007)
Hamburg, May 05, 2008 HAMBURGISCHE SCHIFFBAU- Prepared by: VERSUCHSANSTALT GmbH Dr. P. Valanto J. Friesch

Seakeeping & Manoeuvring
ii
Document Control Sheet
1. ISBN
2. Type of Report Final Report
3.
4. Report Title Research Study on the Sinking Sequence and Evacuation of the MV Estonia
6. End of Project 05.05.2008
5. Authors (Family Name, First Name(s)) Valanto, P.
7. Publication Date 05.05.2008 9. Originator's Report No.
HSVA Report No. 1663 10. File Reference No.
2005 - 02901 11. No. of Pages 158 + vii
8. Performing Organisation(s) (Name, Address, Web-Page) Hamburgische Schiffbau-Versuchsanstalt GmbH Bramfelder Straße 164 D-22305 Hamburg Germany www.hsva.de
2. No. of References 51 14. No. of Tables 19
13. Sponsoring Agency (Name, Address)
The Swedish Governmental Agency for Innovation Systems (VINNOVA), VINNOVA, SE-10158 Stockholm, Sweden
15. No. of Figures 96
16. Supplementary Notes 17. Presented at (Title, Place, Date) 18. Abstract The sinking process of the MV Estonia was investigated with numerical simulation of the motions of the damaged ship in seaway together with the coupled simulation of the flooding of the vehicle deck. Model tests were used to determine the roll damping coefficients. Hydrostatic analysis was used to provide preliminary information before the motion simulation of the damaged ship. The later phases of the sinking process, in which the dynamic ship roll motion plays a smaller role, were investigated with hydrostatic analysis. The evacuation of the ship under the influence of ship motions in seaway was simulated using both empirical ship list and computed ship motions. The study of the survivors’ testimonies indicated that the accident started earlier than reported in the official investigation report after the accident, i.e. in the JAIC Final Report. The simulation of the sinking process yields a heeling process of the ship, which is similar to that reconstructed on the basis of the survivors’ testimonies. The results of the evacuation simulations correlate favorably with the findings of the divers, who investigated the inner spaces of the wreck after the accident. Altogether the results of the analysis carried out show a similar sinking sequence to the one worked out already by the official investigation after the accident. Some more details could be added in, and explanations provided for, the most probable presently known course of events during the accident. 19. Keywords MV Estonia, sinking sequence, evacuation 20. Publisher
21. Price

Seakeeping & Manoeuvring
iii
Acknowledgments We have not started our investigations from nothing. The MV Estonia accident was already investigated earlier, and more than that heavily disputed. The JAIC Final Report formed a basis, which let us to trace back to the original material: mainly to the survivors’ testimonies and of course to the ship’s drawings. The additional original material, new interviews of survivors, copies of original documents and photographs provided by the GGE and others were taken into consideration. After the JAIC report was published good questions on the MV Estonia accident were put forward by Anders Björkman and Knut Carlqvist, among others. Interesting suggestions for the cause of the accident were provided by Jutta Rabe, Werner Hummel and Peter Holtappels in their writings. These articles, books and other written contributions have certainly enlarged our perspective and thus contributed to all the considerations we carried out in the course of this project. During our effort to provide realistic and reliable answers to these questions and suggestions the following individuals provided invaluable help: Paul Crawford (Rolls-Royce, UK), Pekka Heikkinen (Helsinki University, Institute of Seismology), Veli-Matti Junnila, (Ship Consulting Ltd., Turku, Finland), Christian Jungblut (Hamburg), Tuomo Karpppinen (Finnish Accident Investigation Board), Jouko Nuorteva (Naval Research Center of Finland), Bengt Schager (Schager-Profil, Sweden) and Mikael Öun (Sweden). This investigation started with the study of the accident scenario. Based on this, a synoptic time schedule was compiled by the TUHH. Preliminary hydrostatic analysis and a pre-selection of the accident scenarios were carried out by TUHH before the actual HSVA simulations. Also the later phases of the actual sinking process were investigated by the TUHH. This work was carried out by Felix-Ingo Kehren and Stefan Krüger in TUHH. Most of the actual simulations of the ship behavior until near capsize or sinking and the evacuation simulations were carried out by Petri Valanto of HSVA, manager of the project. Into these simulations flowed all the preparation work of the evacuation model of the MV Estonia by Tim Meyer-König, Sven Hebben, and Hubert Klüpfel of TraffGo HT GmbH, the hydrostatic calculations by Michael Wächter of SDC GmbH, and the model tests carried out by Arndt Schumacher and Norman Ludwig in the HSVA. In the HSVA CAD-Office Miroslav Zoricic and Norbert Kohlmetz made an up-to-date version of the ship lines and provided input data for the HSVA ROLLS simulation program. Henning Grashorn computed the ship dynamic sinkage and trim with the program SHALLO. The financial support of the Swedish Governmental Agency for Innovation Systems (VINNOVA) is gratefully acknowledged. All work presented was conducted with a grant from VINNOVA, under the file reference number 2005-02901. The responsibility for the content lies alone on the authors of the project reports.
Seakeeping & Manoeuvring
iv
List of Project Reports Krüger, S., Kehren, F.-I. (2007) Research Study of Sinking Sequence of MV Estonia, Mile Stone 1 (M1), “Accident Scenario”, Technische Universität Hamburg-Harburg, Institut für Entwerfen von Schiffen, und Schiffssicherheit. Krüger, S., Kehren, F.-I. (2008) Research Study of Sinking Sequence of MV Estonia, Work Package 7, “Hydrostatic Analyses of the Later Phases of the Capsizing and Sinking of the MV Estonia”, Technische Universität Hamburg-Harburg, Institut für Entwerfen von Schiffen, und Schiffssicherheit. Ludwig, N. (2006) MV Estonia – Forced Roll damping Tests, HSVA Report S544/06, Hamburg. 28 pp. Meyer-König, T., Klüpfel, H., Hebben, S. (2007) Ro-Pax Ferry Estonia – Evacuation Analysis, Final Report, Project No.: 3-6-17 TraffGo HT GmbH, Flensburg. Valanto, P. (2008) Research Study on the Sinking Sequence and Evacuation of the MV Estonia – Final Report, HSVA Report No. 1663, Hamburgische Schiffbau-Versuchsanstalt GmbH (HSVA), Hamburg. Conference papers Valanto, P. (2007) New Research into the MV Estonia Disaster, Proceedings of the 10’th International Ship Stability Workshop in Hamburg, August 30-31, 2007. Abbreviations DNV Det Norske Veritas, a classification society ECR Engine Control Room ENE East-northeast FAIB Finnish Accident Investigation Board GGE German Group of Experts HSVA Hamburg Ship Model Basin IACS International Association of Classification Societies JAIC Joint Accident Investigation Commission MVZ Main Vertical Zone Pax. Passenger SOLAS Safety of Life at Sea SPF Swedish Board of Psychological Defense STAB Ship Stability –Conference SW Southwest TUHH Hamburg University of Technology Person Identities Passenger and crew names and names of other with the accident associated persons are not revealed in this report. Instead a code is used. The persons can be identified based on a confidential list Witness Key.xls shared by the HSVA- and SSPA- Consortia. In general: P# Passenger # C# Crew member # E# External #

Seakeeping & Manoeuvring
v
Table of Contents 1 Introduction 01
1.1 The MV Estonia Accident 01 1.2 On the Investigation 04 1.3 Preliminary Analysis 07 1.4 The Bow Visor Failure 07 1.5 Open or Closed Ramp 10
1.5.1 The dilemma 10 1.5.2 The testimonies from the ECR 11 1.5.3 The ECR-time 13 1.5.4 The Real time 13 1.5.5 Conclusions 14
1.6 Course of Events of the MV Estonia Accident 15 1.7 The Orientation of the MV Estonia in Space shortly before Sinking 20
2 Simulation of the Ship Motions and Flooding of the Vehicle Deck -
Preliminary Cases 24 2.1 Starting Point for the Simulations 24
2.1.1 Ship list to starboard 24 2.1.2 Track of the vessel 24 2.1.3 Start of the accident 25 2.1.4 Disconnection of the bow visor 25
2.2 Numerical Simulation of the Initial Phases of the Accident 27 2.2.1 Initial scenario 0-A: Visor and ramp both 1 m open 27 2.2.2 Initial scenario 0-B: Without visor, ramp 1 m open 28 2.2.3 Scenario 1: Without visor, ramp fully open 28
2.3 Discussion 29 2.4 The Sudden Heel 30
2.4.1 Introduction 30 2.4.2 Turn to port 31
2.5 Water on Vehicle Deck – Water onto Deck 1 33 2.6 Summary of the Investigated Preliminary Cases 37 2.7 U-turn – The Final Test Case 40 2.8 Conclusions 44
3 Simulation of the Ship Motions and Flooding of the Vehicle Deck 46
3.1 Introduction 46 3.2 Ship Behavior on a Track having a Turning Diameter of 5.74 Lbp 46 3.3 Ship Behavior on a Track having a Turning Diameter of 2.87 Lbp 48 3.4 Ship Behavior with Drift and Cargo Shift 55
3.4.1 The HSVA-TUHH scenario 55 3.4.2 The JAIC scenario 59 3.4.3 Other initial directions 59
3.5 Comparison with a Turn to Starboard 61 3.5.1 Introduction 61 3.5.2 Turn to starboard 62 3.5.3 Turn to port 62

Seakeeping & Manoeuvring
vi
3.5.4 Discussion 62 3.6 Conclusions 63
4 Later Phases of the Sinking Sequence 66
4.1 Introduction 66 4.2 Calculation Procedure 66 4.3 Ventilation Ducts 69
4.3.1 General 69 4.3.2 Ventilation of the vehicle deck 69 4.3.3 Ventilation through center casing 70 4.3.4 Ventilation ducts at the ship sides 70
4.4 Results of the Hydrostatic Analysis 71 4.5 Conclusions 74
5 Introduction to the Investigation on the Evacuation 76
6 Ship Evacuation Modeling with AENEAS 78
6.1 Introduction 78 6.2 Enlargement of the Program AENEAS to handle Roll and Pitch Motions 79 6.3 Evacuation Scenarios – Overview 81 6.4 Scenario 1 – IMO Night Case 81 6.5 Scenario 2 – IMO Day Case 82 6.6 Scenario 3 – Real Passenger Distribution on the MV Estonia 82 6.7 Floor Plan of the MV Estonia 83 6.8 Persons - Overview 83 6.9 Passenger and Crew Distribution – IMO Night Case 85 6.10 Passenger and Crew Distribution – IMO Day Case 86 6.11 Real Case Passenger and Crew Distribution, Walking Speeds and
Reaction Times 87 6.11.1 Person distribution 87 6.11.2 Persons’ ages – walking speeds 88 6.11.3 Reaction times 92
6.12 Evacuation Routes 96 6.12.1 Case 1 and 2 – IMO Night and Day Case 96 6.12.2 Real Case 97
6.13 Description of the Model and Simulation Rationale 101 7 Evacuation Simulations 102
7.1 Introduction 102 7.2 Effect of the Static Heel Angle on the Evacuation Time of the MV Estonia 102 7.3 Evacuation Simulations using Empirical Ship Motion Data 104 7.4 Comparison with the IMO standard Night Case for the MV Estonia 107 7.5 Evacuation Simulation of the MV Estonia using Non-Standard
Population Properties 109 7.6 Comparison of the Evacuation Simulations with the Real Evacuation
on the MV Estonia 112 7.7 Escape of the Three Members of the Crew from the Engine
Control Room 113
Seakeeping & Manoeuvring
vii
7.7.1 Escape from the ECR under ship list according to the TUHH 114 7.7.2 Escape from the ECR under ship list according to the JAIC 115 7.7.3 Escape from the ECR under ship motions according to the
HSVA ROLLS simulation 116 7.8 Conclusions 117
7.8.1 Introduction 117 7.8.2 The IMO day/Night Case and the reality of the MV Estonia
Evacuation 7.8.3 Evacuation in a heeled ship 118 7.8.4 The evacuation of the crew members from the ECR 119 7.8.5 Evacuation simulation as a part of the disaster Investigation 119
8 Conclusions 120
8.1 Introduction 120 8.2 The way to the MV Estonia Accident 121 8.3 The Accident Scenario 122 8.4 The Heeling and Sinking Process 123 8.5 Evacuation 126 8.6 Discussion – Suggestions - Recommendations 128
References 130 Appendix 1: Method of Simulation 132 Appendix 2: Motion of Water on Vehicle Deck and in Compartments 139 Appendix 3: Input Data for Simulations 145 Appendix 3: Wave Spectrum, Wave Period and Ship Response 155

Seakeeping & Manoeuvring
1
1 Introduction 1.1 The MV Estonia Accident The Estonian-flagged Ro-Ro passenger ferry MV Estonia, shown in Figure 1, departed from Tallinn on 27 September 1994 approximately at 19:15 for a scheduled voyage to Stockholm. The route is shown in Figure 2. Officially she carried 989 people, 803 of whom were passengers. The ship left harbor with all four main engines running. When she was clear of the harbor area full service speed was set. The engine setting was maintained up to the accident. The wind was southerly, 8-10 m/s. Visi-bility was good, with rain showers. The voyage proceeded normally. Sea conditions along the Estonian coast were moderate, but became more rough when the ship left the sheltered waters. The ship had a slight starboard list due to a combination of athwart-ships ship weight disposition, cargo disposition and wind pressure on the port side. As the voyage continued the wind velocity increased gradually and the wind veered to southwest. Visi-bility was generally more than 10 nautical miles. At midnight the wind was south-westerly 15-20 m/s with a significant wave height of 3-4 m. The rolling and pitching of the vessel increased gradually, and some passen-gers became seasick. At about 00:25 the MV ESTONIA reached a waypoint at position 59°20´ N, 22°00´ E and from there headed true course 287°. The speed was about 15 knots and the vessel encountered
Fig. 1 The Ro-Ro passenger ferry MV Estonia (JAIC, 1997).
Fig. 2 The route and accident site of the MV Estonia(JAIC,1997).
Seakeeping & Manoeuvring
2
the seas on her port bow. Due to increasing rolling, the fin stabilizers were extended, but it is not absolutely certain, whether the starboard stabilizer really became extended. During his scheduled round on the vehicle deck the seaman of the watch (C16)1 heard around 00:46 a heavy crash from the bow area, something like metal hitting against metal. He informed the Second Officer B (C47) about what he had heard and was ordered to try to find out what had caused the crash. He did so and according to his several testimonies everything seemed to be normal. His call with a walkie-talkie to the bridge was overheard: According to the testimonies of two crew members (C6, C15) the seaman of the watch had said to the bridge that there was quite a lot of water on the vehicle deck. Perhaps this was normal. Further observations of unusual noise, 2-3 heavy bangs from the ship bow, were made by passengers at about 00:55-01:00. Obviously the loose bow visor was hammering against the forepeak deck and the bow ramp. The Third Engineer in the ECR heard the bangs. Shortly afterwards he felt that the ship was developing a list and went to look at the monitor showing the bow ramp. He saw that water was forcing in at the sides of the ramp. The ramp was in a closed or almost closed position. When the seaman of the watch returned from his round, he caught up the master and entered the bridge just behind him at 00:58. The heavy blows at the bow were being reported to the bridge by telephone just when he entered the bridge. The captain asked how many engines were running and commented that they were already one hour late. Shortly afterwards the seaman of the watch was sent down by the Second Officer A (C48) to the car deck to find out the cause of the sounds reported to the bridge. After leaving the bridge he went to the information desk on the Deck 5. There he experienced the sudden large heeling (at 01:02) and did not anymore manage to reach the vehicle deck. According to JAIC (1997) at 01:00 the watch on the bridge was taken over by the Second Officer A (C48) and the Fourth Officer (C49). After being relieved the Second Officer B (C47) and Third Officer (C50) left the bridge, but may have returned later. At around 01:00-01:02 the ship heeled suddenly and heavily to starboard. Bottles and glasses were falling off from shelves in the bars. Originally fixed heavy pieces of furniture broke loose, started to slide toward starboard and crashed somewhere. Bags were sliding against the cabins doors, and the alarm clock of passenger P92, dropped from a cabin table, the battery got out, and the clock stopped at 00:02 Swedish time, that is, 01:02 on the ship’s time. At an early phase of the accident, perhaps around 00:55-01:05, the bow visor separated from the ship and tilted over the stem. The ramp was probably pulled fully open, allowing large amounts of water to enter the vehicle deck and to flow onto both sides of the center casing. Very rapidly the ship took on a heavy starboard list due to the water flowing on to the vehicle deck and due to the ship starting to turn to port. As a consequence the water sloshed on the vehicle deck towards starboard against the port side wall of the center casing and against the starboard side plating of the ship. Some water splashed or leaked into the staircases in the center casing and flowed down to the cabin areas on Deck 1. This caused further concern among the passengers already alarmed by the noises from the bow and the sudden large heeling motions of the ship. 1 The code refers to the confidential list Witness Key.xls shared by the two consortia.
Seakeeping & Manoeuvring
3
Passengers started to rush up the staircases and panic developed at many places. Some passengers got showers in the staircases inside the center casing, when they started upwards from Deck 1, as the staircase was constructed so that water from the staircase platform on level Deck 2 could flow down as a water curtain on the persons in the stairs below. Many passengers were trapped in their cabins and had little or no chance of getting out in time. About 237-310 persons onboard succeeded in abandoning the ship. An overwhelming majority of them headed to the higher port side of the vessel. Lifejackets were distributed by some individual crew members to those passengers, who managed to reach the boat deck. Persons, who got out of the ship, jumped or were washed into the sea. Some managed to climb into life rafts, which had been released from the vessel. No lifeboats could be launched due to the heavy list. As most people went to the higher port side, the life saving equipment on the starboard side was rendered useless. About half of the persons, who succeeded in abandoning the ship, survived the elements on the rafts or in the sea having a water temperature of 10°-11° centigrade and about 4 m high waves. Perhaps at about 01:20 a weak female voice called “Häire, häire, laeval on häire” the Estonian words for “Alarm, alarm, there is alarm on the ship”, over the public address system. Just a moment later an internal alarm for the crew was transmitted over the public address system. A first Mayday call of the MV Estonia was received at 01:22, about 37 minutes after the seaman of the watch had reported a heavy crash behind the closed bow ramp on the vehicle deck. A second Mayday call was transmitted shortly afterwards and by 01:24 14 ship- and shore-based radio stations, including the Maritime Rescue Co-ordination Centre (MRCC) in Turku, had received the Mayday calls (JAIC, 1997). At about this time all four main engines had already stopped. Also the main generators had stopped somewhat later and the emergency generator had started automatically, supplying power to essential equipment and to limited lights in public areas and on deck. The ship was now drifting more or less in beam seas. The list to starboard increased further and water had started to enter the accommodation decks. Flooding of the accommodation continued progressively as more windows broke under the water pressure and the starboard side of the ship was completely submerged at about 01:30. During the final stage of flooding the list was more than 90 degrees. The ship sank with a stern trim, and disappeared from the radar screens of ships in the area at about 01:50. During the night and early morning, helicopters and assisting ships rescued 138 people, of whom one later died in hospital. During the day and on the two following days 92 bodies were recovered. Most of the missing persons accompanied the vessel to the seabed. The wreck was found in international waters within Finland’s Search and Rescue Region, resting on the seabed at a water depth of about 80 m with a heading of 95° and a starboard list of about 120°. The visor was missing and the ramp was partly open. The position of the wreck is 59°22,9´ N, 21°41,0´ E. The visor, which has been recovered, was located at 59°23,0´ N, 21°39,2´ E, about one nautical mile west of the wreck. This description of the course of events is partly based on the JAIC Final Report (1997). It is modified to fit in some individual testimonies and it of course reflects the HSVA-Consortium view of the course of events.

Seakeeping & Manoeuvring
4
1.2 On the Investigation The MV Estonia sank on September 28, 1994 in the Baltic Sea on its way from Tallinn to Stockholm. According to official documents at least 852 human lives were lost in this accident, which makes it one of the worst in the European maritime history. The Joint Accident Investigation Commission (JAIC) published its report few years after the accident in 1997. This report gives a picture of the accident, which understandably is not complete and appears also partly controversial. The discussion on the MV Estonia has not calmed down after all these years and perhaps as a consequence the Swedish Government authorized a new study in 2005. For this reason the Swedish Governmental Agency for Innovation Systems VINNOVA has commissioned two consortia, commonly referred to as the HSVA-Consortium and the SSPA-Consortium, to investigate the sinking sequence of the MV Estonia in the night of 27th - 28th of September 1994. Since March 2006 these two consortia with their partners are carrying out research independently of each other on the MV Estonia accident. This report contains a description of the work carried out by the HSVA-Consortium and presents its findings in the Research Study of the Sinking Sequence of the MV Estonia for the Swedish Governmental Agency for Innovation Systems. The two partners in this consortium are the Hamburg Ship Model Basin HSVA (coordinator), and the Hamburg University of Technology TUHH, Institute of Ship Design and Ship Safety. Invaluable contributions to this research were provided by the consortium subcontractors the TraffGo HT GmbH in Flensburg and the Ship Design and Consult (SDC) GmbH in Hamburg. Since the beginning of the investigation by JAIC various organizations have carried out hydrostatic analyses of the capsizing and the consequent sinking of the vessel. The later hydrostatic analyses did not provide results essentially deviating from the earlier ones. Therefore in the HSVA investigation beside hydrostatic analysis also simulation of the ship motions together with the flooding of the vehicle deck is carried out. In addition simulation of the evacuation process of passengers and crew under the influence of the ship motions is used to throw light on the accident. The ultimate goal of this investigation is to shed light on the sinking sequence of the Ro-Ro passenger ferry MV Estonia and to explain the underlying causes for its loss, in order to improve the maritime safety of this in general very successful ship type in Swedish and international waters. The evacuation analysis will help to establish as complete picture of the MV Estonia accident as possible. In our analysis with evacuation software AENEAS, which has the capability to account for the ship motions, the actual crew and passenger population of the MV Estonia at the time of the accident is modeled. The simulation of the evacuation on the MV Estonia can also help to increase our knowledge of such processes in a real accident case in general. This is important for improving passenger ship safety. There are a few factors in the accident process, which are mutually dependent. (1) The vessel had somehow in the available time to cover the distance of about one nautical mile between the locations of the bow visor and the wreck, given by the fact that these lie on the bottom of the sea, as shown in Figure 3. The re-constructed ship route and speed have to fulfill this condition. (2) These last two factors influence also the ship motion behavior, as this depends

Seakeeping & Manoeuvring
5
also on the relative wave direction and ship speed. (3) The ship motion behavior influences the evacuation process. (4) The evacuation simulation under the influence of the ship motions has to give an approximately correct number of persons abandoning the ship (ca. 240-310) as in the real case. Thus the evacuation process defines certain limits mainly for the ship roll motion behavior: A too long and low time-history of the heeling angle leads to more persons abandoning the ship than in reality took place. A too short and high time-history of the heeling angle leads to too few persons abandoning the ship. Thus the evacuation simulations also help in re-constructing the time-history of the ship motions by closing out unrealistic alternatives. Evacuation simulations are also used to analyze the escape of the three members of the crew from the Engine Control Room (ECR). The correct interpretation of their testimonies is important, as they are the last persons who saw the bow ramp closed in the early phase of the accident. This investigation started in March 2006 and ends in May 2008. It has two concrete goals: to give light (1) on the sinking sequence of the MV Estonia, and (2) on the evacuation process on the MV Estonia. It is beyond the financial resources available to carry out an exhaustive study of all possible damage scenarios. This has two consequences (1): We needed to rely on the work carried out by other investigators. (2) The HSVA-Consortium needed to concentrate in investigating the most plausible damage scenarios, which turned out to be that the structures of the bow visor failed, and the ramp opened letting large quantities of water onto the vehicle deck. There are lots of evidence suggesting that this took place. Our investigation does not close out any other damage scenarios, which we have not investigated, as we have considered them less likely than the investigated one. The HSVA-Consortium research is strongly based on survivors’ testimonies (SPF, FAIB), physical facts, and numerical analysis. The very early survivors’ statements have been given somewhat more emphasis than the later ones. However, some later interviews carried out by the interest groups working on MV Estonia have given some additional information often supporting our conclusions based on the early testimonies. As our investigations are to great extent based on numerical modeling of various processes in the damaged ship, it is of crucial importance that the assumptions used in the modeling are as correct as possible. For this reason we have also given the argumentation on how we have reached the conclusions on what most likely took place. It is further pointed out that our simulations are reconstructions of certain processes during the accident. If we succeed in describing these processes with our simulations and our results match the known facts on the accident, it means that we have shown a plausible explanation of what with a high likelihood happened. We cannot exclude any other, in our opinion less likely scenario, which, however, possibly could lead to a sinking process as described by the survivors. We are, however, at the end of this study not aware of such another plausible accident scenario, which should be investigated further. The HSVA-Consortium investigation is limited to the ship sinking sequence and evacuation process. Structural failure processes related to the MV Estonia during the accident are not a part of this investigation.

Seakeeping & Manoeuvring Seakeeping & Manoeuvring
6
Visor
Dropped material
Wreck
Fig. 3 Map of the sea floor deposits based on the sonar measurements in October 1994. The locations of the MV Estonia wreck, visor and areas ofdebris dropped from the MV Estonia are shown with red color. Map: courtesy of Dr. Nuorteva (1995) .

Seakeeping & Manoeuvring
7
1.3 Preliminary Analysis The hydrostatic analyses by JAIC (1997), Jasionowski (2001) and recently also Krüger and Kehren (2007) all indicate that a significant amount of water had to come onto the vehicle deck, otherwise the reported large heeling angles could not be reached. This can be considered to be a solid technical fact, regardless of how the water entered the vehicle deck. For this water two technically possible ingress ways must be considered: (1) The water entered the vehicle deck from the openings left by the damaged visor and ramp; (2) The water entered the vehicle deck from the compartments below. This would imply that these compartments were heavily flooded, that is, almost full before the water could enter the vehicle deck above. Some of the survivors’ testimonies relating to the early phases of the accident state that there was some water on the floor in the passenger compartments below the vehicle deck. None of the testimonies state that there was really very much water in these compartments: No heavy wading, no difficulties to pass the wet areas. Thus the alternative 2 above is highly unlikely. If then the alternative 1 would be valid, it must be explained how the water could come from the vehicle deck into the compartments below, in the early phase of the accident, as reported by the survivors. In this phase of the accident the heeling angle was still relatively small or moderate and the amount of water on the vehicle deck was not yet very large. According to elementary hydrostatic analysis this amount of water would accumulate to the starboard side of the vehicle deck, and its level would not reach possible openings in the center casing. This was the first item investigated by the HSVA with the numerical simulations. The results were published as a STAB conference paper by Valanto (2007). These early simulations show clearly that it is possible that the water on the decks below the vehicle deck came through the staircases in the center casing from the vehicle deck exposed to waves through ramp opening. In view of this the alternative (1), namely that the water entered the vehicle deck from the openings left by the damaged visor and ramp, is considered as the most likely one. 1.4 The Bow Visor Failure This investigation on the sinking sequence of the MV Estonia is based on the fact that the ship lost its bow visor, which finally led to the loss of the watertight integrity of the vessel. The MV Estonia had a vulnerable bow visor and ramp arrangement, in which the visor was connected into the ramp in a box-like housing. Such an arrangement was common in the Baltic ferries in the 1970s and 1980s (Hänninen, 2007, p. 164). After the accident the bow visor was found on the sea bottom about one nautical mile west of the wreck. The positions of the wreck and the visor are shown in the map “Sea Floor Deposits” in Figure 3. The map is based on the sonar measurements carried out after the accident in 1994. Thus after the detachment of the bow visor the vessel must have advanced and drifted without the visor at least the mentioned one nautical mile. Considering the original course of the vessel, the location of the visor and that of the wreck, it drifted probably more than the one nautical mile. The speed of the damaged vessel towards the end of its sinking process must have been rather low. Therefore, based on the distance between the visor and the
Seakeeping & Manoeuvring
8
wreck and the low speed of the vessel, the visor cannot have detached from the vessel in the late phases of the accident, but relatively early. The MV Estonia accident took place in seaway having a significant wave height of about 4-4.5 m. This is nothing very extraordinary in the Baltic Sea. For comparison it can be said that storms with significant wave height of more than 7 m are met in the northern Baltic Proper. Since the MV Estonia accident the highest measured individual wave in this area of the Baltic Sea amounts to about 14 m in height. It is beyond a reasonable doubt that the bow visor was lost due to sea loads. The JAIC Final Report gives sufficiently detailed evidence of the process of the MV Estonia (ex. Viking Sally, Meyer Werft GmbH Newbuilding No. 590) bow visor loss due to sea loads. It is further noteworthy that the near sister ship of the MV Estonia, namely Diana II, (Meyer Werft GmbH Newbuilding No. 592) got damages on its bow visor in heavy weather on 14th of January, 1993, that is, about 20 months before the MV Estonia accident took place (JAIC Suppl. No. 525). Further in connection with the rescue operations related to the MV Estonia accident on 27th-28th of September 1994 the MV Silja Europa (Meyer Shipyard Newbuilding No. 627) got damages due to sea loads onto its bow doors (JAIC Suppl. No. 526). The JAIC Final Report lists altogether 16 bow visor damages, which occurred during the years 1973-1994 in the Baltic Sea on vessels built by various European shipyards. These individual damages were in general not reported to authorities and collected and thus no conclusions were drawn. The requirements of the different classification society rules concerning bow visor strength were unspecific at the time of the MV Estonia’s construction. This reflects also the state of knowledge on the magnitude of the wave loads at the time the MV Viking Sally, that is, later the MV Estonia, was built. A good overview of the general development of typical bow flare angles in Ro-Ro passenger ferries and of the IACS- recommendations for design loads from early eighties to late nineties, and of the revised DNV-requirements is given by Kanerva (1999). According to Hänninen (2007) the MV Estonia was not the only case in which the design of the bow arrangement was vulnerable and the actually constructed strength insufficient. Thus the MV Estonia case was not a separate failure, but a rather culmination point for earlier safety problems in the Baltic ferry traffic. Hänninen studied the social and systemic processes in the marine community of the ship owners, the shipbuilders, the regulatory agencies and on the other hand ship operators and ship crews, which led into reduced safety level of these vessels in the Baltic Sea, with the known consequences. During this study, “it became evident that the poor safety of vessels was a systematic problem in the shipping industry and that the development of the Estonia accident was linked to the social and cultural structures of the whole industry” (Hänninen, 2007, p. 311). Further information can be found in the quoted doctoral dissertation “Negotiated Risks – The Estonia Accident and the Stream of Bow Visor Failures in the Baltic Ferry Traffic” by Hänninen (2007). The explosion theories as a cause for the accident suggested by the GGE (Holtappels and Hummel, 1999, 2006) were studied in the initial phase of the present study with a great interest. In the survivors’ testimonies, however, no support for an explosion hypothesis was
Seakeeping & Manoeuvring
9
found. Neither do the records of the Institute of Seismology of the Helsinki University, which had a seismic recording station near the coast in the night of 27-28.09.1994, support the detonation theory. The recordings show the impact caused by the MV Estonia (stern) hitting the seabed, but there is nothing in the recordings, which could be interpreted as a detonation. Many of the survivors’ testimonies report about metallic noise and bangs little before or around 01:00. Metallic noise is clearly metallic noise, but in view of the translations between Estonian, Swedish and finally English languages it can well be asked what is a “bang” in these languages. Here GGE (Enclosure 16) interview with crew member C16 is helpful: In the Estonian, as well as in the related Finnish, a bang “pauk” can be used to describe a sudden loud noise, e.g. when a firearm is fired, but exactly as well it can be used to describe the noise caused by somebody slamming a door closed. There are, however, other arguments against the interpretation of these noises as being a result of an explosion. Beside a sharp loud noise an explosion would cause a sharp shockwave in the floating elastic steel structure of a Ro-Ro passenger ferry. For example larger wave impacts on the bow can often be felt on the ship by passengers much further back. No such a sharp shockwave has been reported by the survivors. An explosion would also cause a flash of light. It could in addition cause a pressure wave in air inside the ship. And shortly afterwards a slight (burnt) smell or odor could be sensed in the air. Depending on the type, size and location of the explosive charge, many of the mentioned phenomena related to the explosion would perhaps not come into being or remain unnoticed by the passengers and crew. However, most survivors’ testimonies do not describe any other phenomena related to the bangs or blows than the (metallic) noise and the associated vibration or shaking of the structures. No testimonies describing a flash of light, pressure wave in the air or a burn smell were found. No testimonies suggesting an explosion onboard as a reason for the catastrophe were found. The German magazine Der Spiegel presented two test pieces taken from the front bulkhead of the wreck of the MV Estonia in August 2000 to the Federal Institute for Materials Research and Testing (BAM, Bundesanstalt für Materialforschung und –prüfung, Berlin) asking the question “May indications of a detonation be found on the test pieces?” After the investigations the BAM gave a very clear answer “With regard to both test pieces indications of a detonation could not be found; thus the above query of the customer has to be answered with no. All investigated microstructural features indicate deformation by mechanical loading” (BAM, 2001). The GGE (Holtappels and Hummel, 1999, 2006) makes a significant effort in trying to establish the fact that the visor and the ramp were distorted, twisted or bent and did not anymore close properly before the accident. This is undoubtedly possible. After all, the near sister ship Diana II had experienced bow visor damages already earlier in heavy weather in the southern Baltic Sea. This would also explain the need for temporary repairs necessary to recover the functionality of the visor and ramp. These repairs may not always have been carried out with sufficient professionalism leading to reduced strength. The recent technical report “M/V Estonia Bow arrangement collapse – Sequence of events” by Carlsson (2007) outlines the sequence of events leading to the bow arrangement collapse. Some important findings of this study can be summarized as follows (Carlsson, 2007):
Seakeeping & Manoeuvring
10
• The bow visor locking devices and hinges were broken by the forces exerted due to severe
sea loads. The visor shell plating damage and corresponding damage to hull structure and bulbous bow indicate that as the visor detached, it fell forward colliding with the bulbous bow and stem post (ice knife). The resulting damage indicates that the visor fell off prior to the vessel reaching a significant heel.
• The ramp remained closed and secured during the night of the accident until it was forced
open by the visor, prior to the complete detachment of the visor from the vessel. • The ramp remained partially open with broken lockings, port hinges and actuating
cylinders until the visor detached from the hull. • The ramp fully opened crashing down onto the tank top when the visor completely
detached from the vessel. • The ramp main structure and secondary stiffeners are heavily deformed, buckled and bent
due to sea loads to such an extent that the forward part of the ramp could touch and rest on the bulbous bow. This may explain why the ramp did not detach from the vessel after the detachment of the visor, when the fully open ramp became exposed to heavy sea loads.
• When the heel of the vessel is approximately 90° and the vessel trims stern down the bow
ramp starts to close under its own gravity. This sequence of events and explanation of damage to the bow area is based on the actual damage pattern and upon strength calculations, technical assessment and extensive experience of bow arrangement design (Carlsson, 2007). In view of all the information available on the MV Estonia case it is difficult to come into any other conclusion than that it is most likely that the MV Estonia bow visor failed due to sea loads in the night of 27th-28th of September, 1994. Therefore it is also one of the starting points for this investigation. The technical report by Carlsson made available towards the end of the HSVA-investigation in December 2007 gives further support to this conclusion made already earlier during the course of the HSVA-Consortium work. 1.5 Open or Closed Ramp 1.5.1 The dilemma The position of the ramp during the course of the accident is an important factor influencing the sinking process. Unfortunately the issue is also somewhat controversial. 1. The three crew members (C7, C33, C36) in the Engine Control Room (ECR) state in
many of their testimonies that the ramp was closed little before they left the ECR, and that the water was spraying onto the vehicle deck at the sides of the ramp, more on the starboard side than on the port side. In the more recent interviews by M. Kurm these three persons confirm their earlier views about the ramp position.
Seakeeping & Manoeuvring
11
2. When abandoning the vessel, just before jumping into water the passengers P3 and P34 climbed down a more or less vertical grid structure at the ship bow, which undoubtedly was the damaged underside of the ramp in the bow on the ship heeled to about 90° or more. The passenger P34 states that the ramp was in a closed or almost closed position.
3. The ramp is in almost closed position on the wreck resting on the sea bottom with heeling
angle of about 120-130°. 4. The JAIC Final Report states that when the visor detached from the ship it pulled the ramp
completely open. 5. The recent report by Carlsson (2007) states that the ramp was pulled completely open by
the visor when the visor detached from the ship. 6. The very first numerical simulations carried out by the HSVA indicate that in order of the
sinking process to realize, as it is known from all empirical evidence, it is very likely that the ramp must have been at least part time practically completely open.
When the ship heels to 90° and has a slight stern trim, a freely pivoting ramp starts to close under its own weight, that is, due to gravity. When the heeling angle still increases from the 90° the rotating moment due to gravity acting on the ramp increases. This has two consequences: (1) According to simple mechanics, in the situation in which the two passengers P3 and P34 (Point 2 above) climb down the underside of an almost closed or closed ramp, the ramp indeed can very well be in this position depending on the exact heeling angle and trim. The higher the heeling angle above 90° was, the higher the probability that the ramp was closed or almost closed, regardless of what position the ramp had earlier. (2) The ramp is known to be almost closed in the wreck (Point 3 above), which is exactly as it should be according to basic mechanics. Thus with points 2 and 3 we do not have any disagreement between observations and the laws of mechanics. At the end of the sinking process the ramp should be in a closed or near closed position on the wreck, regardless of what position the ramp earlier had. The confirmed testimonies from the three crew members in the ECR (Point 1) do pose a problem. They do not self-evidently fit together with the conclusions by JAIC (Point 4), with the conclusions by Carlsson based on the damaged structures of the bow arrangement (Point 5), and with the numerical simulations by the HSVA (Point 6) of the vehicle deck flooding. 1.5.2 The Testimonies from the ECR The testimonies from the members of the crew in the ECR can be considered to be literally correct. They can also be considered to be false, but only if there is other evidence available, which is heavy enough to overrule them. They can also be considered to be somewhat erroneous, as the observations were made by humans in mortal danger in an emergency situation and as the testimonies were made possibly under stress or conflict of interests. What definitely should not be done with the testimonies is to ignore them. In the two empirical curves of the ship list by JAIC and TUHH, shown in Figure 10, the sudden large initial heeling the vessel experienced in the very beginning is not shown. There

Seakeeping & Manoeuvring
12
are, however, a large number of survivors, who describe the sudden heel itself, and also how heavy, often initially fixed objects broke loose, started to move, and crashed somewhere, as the ship heeled to starboard. These observations cannot be ignored. Considering the initial large heeling angle of the ship and the fact that according to many survivors the ship stabilized for some time after the initial heel to a more moderate heeling angle the following interpretation of the course of events is adopted here: At 00:55-01:00 hours many passengers heard 2-3 heavy bangs from the bow. Obviously the loose bow visor hammered against the ramp and the forepeak deck. The interval between the two bangs the Third Engineer C36 in ECR heard is less than a minute (Kurm/C36, 2007). After some time the Third Engineer felt that the ship was developing a list, stood up, went to the control board and looked into the monitor. He saw that water was forcing in at the sides of the ramp. The ramp was in closed or almost closed position. The Third Engineer C36 looked at the clock on the engine (control) room wall. In the interview (Kurm/C36, 2007) the Third Engineer C36 was asked the question “When exactly did you look at the clock?” C36 testifies (Kurm/C36, 2007): “I looked at the clock when I stood in front of the monitor and I saw water coming in. It was about two to four minutes after I heard the two heavy blows.” But these heavy blows were reported to the bridge already at 00:58 (C16 in Turku 29.09.1994). Let’s assume the blows took place 00:56-00:57 at the latest. This would imply that the Third Engineer looked at the clock two to four minutes later, around 00:58-00:01, at the latest. The time the clock in the ECR showed was 01:13-01:14 ( Kurm/C36, 2007). In the very early interview on 28.09.1994 at 12:00 in Turku (by T.Laan) C36 testified that at about 01:00 he felt two, double, hard blows against the bow. In his later interviews the time of these blows is either later or is not mentioned. In the interview on 29.9.1994 at 10:00 in Hospital in Turku (by B. Englund, Finnish criminal police) the Third Engineer C36 testified: “At 01:15 two strong waves hit the ship, which really could be felt in the ship. I have never earlier felt such a strong blow against a ship. The ship was running almost against the waves, so the force of the waves hit the bow. I looked instantly at the monitor (in the ECR) and noticed that there is water coming in at the bow. The water ingress was enormous, because the picture became unclear, while obviously the camera was at least in part under the water coming in. The effect (of the water) was also instant, because the ship started right away to heel 2-3° more towards right. From a walkie-talkie I heard how the seaman of the watch (C16), who was at that time on the vehicle deck, told the officer on watch on the bridge that there is water on the vehicle deck.” (Translation from the Finnish protocol by the present author). This testimony is a description of a massive water ingress, with an instant heeling as a consequence and nothing is mentioned about a closed ramp, which emerges in the testimonies of C36 for the first time in the interview on 03.10.1994 in Tallinn. It is also quite sure that the seaman of the watch C16 was not on the vehicle deck at 01:15, but around 00:45. It is the opinion of the HSVA-Consortium that the accident started around 01:00-01:02, that is, the large sudden heels occurred, instead of starting around 01:15 as stated by the JAIC. The blows were heard a few minutes earlier than the sudden heeling occurred.

Seakeeping & Manoeuvring
13
According to the Third Engineer C36 at 01:20 somebody at the bridge called and asked, whether it would be possible to pump water to the port side ballast tank (Kurm/C36, 2007). This time can be assumed to be based on the ECR clock, and it is 6-7 minutes after C36 first looked at the ECR clock. The following conclusion is drawn here: The Third Engineer C36 was still in ECR 6-7 minutes past the time 00:58-00:01, that is, at 01:04-01:08 (ECR time 01:20). This somebody who called from the bridge was 4th Officer C49 (C36, interview at Landvetter, 1995), whose watch duty had just started at 01:00. The ship heeled heavily at 01:02. It is not very likely that the bridge waited 18 minutes until 01:20 before they asked the Third Engineer C36 in the ECR to try to pump ballast in order to stabilize the ship. The Third Engineer C36 testifies further that the Motorman C7 came into ECR right after he had looked at the monitor and started to contact the bridge. If ‘right after’ is assumed to mean one minute, this would be then around 00:59-01:02. According to C36 (Kurm/C36, 2007), the Motorman C7 and the Systems Engineer C33 were in the engine (control) room maximum ten minutes. It is thus interpreted here that they left 01:09-01:12 at the latest (at ECR time 01:23-01:24). It is further known that C36 left the ECR somewhat after C7 and C33. Now we have two alternative times for the different actions of the crew members and their observations. They are treated separately below. 1.5.3 The ECR-Time It is assumed that the Motorman C7 and the Systems Engineer C33 left the ECR 01:23-01:24 o’clock at ECR-time. According to JAIC the list was then 38-40° and increased rapidly thereafter. According to TUHH the list would be around 60° at this time increasing rapidly with time. Based on simple considerations on the necessary friction between shoe soles and ship floors (decks) or staircase surfaces it is highly unlikely that any of these crew members in the ECR would have managed to climb up the route inside the engine casing to Deck 8 and further upwards to the port side guard rail of the a ship having such a list. This route inside the engine casing is not a specially constructed emergency route, but consists of steep inclined stairs and small platforms in between, according to the Jos. L. Meyer drawing No S590, MA500 dated originally 15.09.1979. See Figures 63-64. Other testimonies state that C7 and C33 were in a life-raft already at 01:27, that is, they would have managed to get from the ECR to the Deck 8, further to Deck 7, up to the port side guard rail on the Deck 7 and into a raft in 3-4 minutes. This is extremely unlikely, if not fully impossible in the prevailing conditions. In view of this it is highly unlikely that the observation by the Third Engineer C36 about the time based on the ECR clock would be correct. This does not necessarily imply that C36 made incorrect observations or statements, it is also possible that the ECR clock did not show the right time. 1.5.4 The Real Time It is assumed that the Motorman C7 and the Systems Engineer C33 left the ECR at 01:09-01:12 at real time. According to JAIC the list was then 0°, but would start to increase rapidly
Seakeeping & Manoeuvring
14
in a few minutes, which also shows that the JAIC’s assumption of the start of the accident at 01:14 is likely to be too late. According to TUHH the list was about 35° increasing at this phase very slowly. In both cases, with JAIC or TUHH time-history of ship list, it can be assumed that the crew members would have had a realistic chance to climb the route through the engine casing and succeed in getting to open decks. Even with this starting time it would not be self-evident that the three crew members C7, C33 and C36 would succeed. It should be kept in mind that from the Deck 1 cabin areas, on the same level as the ECR, only about 21 people out of about 190 got out of the ship. These people started just after the sudden large heel in a real hurry, many of them half-naked. The Third Engineer C36 testifies that he left the engine (control) room when the list was certainly over 30° (Kurm/C7, 2007). The Motorman C7 says (Kurm/C7, 2007): “When the engines had stopped and the list was about 30° I left the engine room together with C33.” It is further known that the device showing the ship heel in the ECR was limited to values 30° port – 30° starboard. Thus the heeling angle could have also been higher. According to the Systems Engineer C33 (Kurm/C33, 2007) the ECR table broke loose at its welds, after which he left the engine (control) room with the Motorman C7. If the sudden large heeling in the beginning was very massive the ECR table may have broken loose already then, as many initially fixed items on Deck 5 in and around the Karaoke Bar did in the very beginning. This can be interpreted so that they left already just after the sudden large heel in the beginning. C33 and C7 got into same life raft as the Seaman of the Watch C16. This raft was on the higher port side of the ship. Thus at least they were still able to get upwards to the guard rail on the port side of the Deck 7. The list may have been around 30-35°, not really more. 1.5.5 Conclusions Based on the given arguments, it is assumed here as a working hypothesis that C36 saw the water coming in at the sides of the almost closed ramp about two to four minutes after the two heavy blows, that is, the closed ramp was last observed around 00:58-01:01. With this interpretation of time the Third Engineer’s testimony about the closed ramp is not in conflict with other evidence. His testimony as such is not refuted, but his perception of time based on the ECR clock is. It is, however, noteworthy that in the very early testimonies of the Third Engineer C36 there is a massive ingress of water on to the vehicle deck making the camera picture unclear as the camera got wet. And in the later testimonies water was spraying at the sides of the closed ramp. Also the occurring times of individual events did not remain unchanged, but the events were postponed about 14 min. It is an open question when did the engines actually stop? If the first sudden heeling was massive enough, they might have stopped already during the first large heeling movements. There is no reason to doubt the observations of the crew members as such, e.g. that somebody left after the engine(s) had stopped, or that there was a 2-3 seconds long moment of darkness, when the auxiliary engines stopped and before the emergency engine started, when the Systems Engineer C33 and the Motorman C7 had just reached the Deck 6 in the stairs in the engine casing (C33, Turku 29.09.94 by T. Laan). Some passengers have stated that it became strangely silent after the sudden big heel. Would it be possible that the main engines tripped
Seakeeping & Manoeuvring
15
already during the sudden big heel? If so, most items given in the ECR crew statements would fit quite well with everything else: the testimonies of passengers and the analyses carried out. 1.6 Course of Events of the MV Estonia Accident The following course of events is mostly directly based on the survivors’ testimonies. The few time references based on the ECR clock, however, were modified, as the escape of the crew members from the ECR must have taken place earlier than described in their testimonies, as elaborated in Chapter 1.5. All time references are given in Estonian time, that is, in ship’s time. Notations like “(C16, 03.10.94, Tallinn)” refer to the person’s (in this case crew member 16) testimony on the given date and place. At ~19:15 on 27.09.1994: Departure from Tallinn The MV Estonia left Tallinn around 19:15. The vehicle deck had a full deck payload. The ship was incorrectly loaded. The port side heeling tank was full in order to compensate the built-in unbalance in the ship due to the center casing having an offset to starboard and the incorrectly loaded vehicles on the vehicle deck. The cars were not lashed. The lashing of trailers was probably finished after the ship’s departure. Heavy weather was expected. At 00:30 on 28.09.1994: Way point The MV Estonia reached a waypoint and changed its course from 262° to 287°, the fin stabilizers were taken into use. At 00:30 … 01:02: Wave loads pound the visor Wave loads were damaging the locks and hinges of the visor and also its pivoting arms (deck beams). The visor could move somewhat forward and its ramp housing could load the top edge of the ramp. The ramp became slowly loose in its connections to the ship, but it was in closed or almost closed position. The leakage of water at the sides of the ramp increased. This situation was observed by the crew in the ECR at the monitors. It is possible that there was already quite a lot of water on the vehicle deck. At 00:45: Crash behind the ramp heard – Water on the vehicle deck The AB Seaman C16 (C16, 03.10.94, Tallinn) was on the vehicle deck just in front of ramp and heard a crash from behind it. According to him everything was fine on the vehicle deck at that time. After the accident another crew member C15 overheard a discussion in the hospital according to which the AB Seaman C16 was on the vehicle deck and had said into walkie-talkie that there was lots of water on vehicle deck and they should abandon the ship (C15, 30.09.94, Bromma). The AB Seaman C16 obviously never returned to the vehicle deck later on, thus it can be assumed that he made this call with the walkie-talkie around 00:45. At 00:46 … 00:51: The AB Seaman C16 on the vehicle deck Before the blows or crashes at the bow were heard, the Third Engineer C36 in the ECR saw the AB Seaman C16 in the monitor viewing the vehicle deck. This was about 01:00-01:05 according to the Third Engineer (C36, 3.10.94, Tallinn). This time reading by the Third Engineer C36 is probably based on the clock on the ECR wall, which gives C36 time readings
Seakeeping & Manoeuvring
16
of about 14 minutes late. The real time should be now 00:46-00:51, which matches quite well the statements of the AB Seaman C16. At 00:46: Narrow water jet at the side of a closed ramp The three crew members Motorman C7, Systems Engineer C33 and Third Engineer C36 reported seeing water coming in on the monitor showing the ramp. In the first interview Motorman C7 said: At 00:46 there is a narrow water flow or jet at the bow ramp’s right side. At 00:55 … 01:00, more likely at 00:56-00:57: Two to three heavy blows heard from the bow – scraping sound. Many passengers heard 2-3 heavy blows or bangs from the bow: Obviously the loose visor was hammering against the ramp and the forepeak deck, detached from the ship bow and collided with the advancing ship when in water. Many survivors heard a scraping sound just after the blows, as the ship ran over the visor, which could not sink fast enough not to be hit by the advancing ship bow. It is easy to show with simple calculations that the collision with the visor was inevitable. The interval between the two bangs the Third Engineer C36 heard was less than a minute (Kurm/C36, 2007). The AB Seaman C16 arrived to the nautical bridge at 00:58. Just at this moment the Second Officer had received a telephone call from below, saying that strange blows have been heard from below (C16, 29.09.1994, Turku). It is assumed here that the blows took place 00:56-00:57 at the latest. At 00:58 … 01:01: The bow ramp last time seen in closed position The ramp was last time seen to be closed or almost closed in the monitor viewing the car deck. The ECR clock shows 01:13-01:14. (see Chapter 1.5) The Third Engineer C36 looked at the monitor only once, in the beginning. Later on the list did not allow him to move freely. The rapidly increasing list, however, is difficult to explain without the ramp opening. Therefore it is assumed here that the ramp must have opened very soon after the Third Engineer C36 had seen it on the monitor. It is very likely that the visor pulled the ramp completely open, when the visor detached from the vessel. It is further possible that the waves moved the ramp between a fully open and almost closed position. At 00:59 … 01:01: Watertight doors close The Systems Engineer C33 (C33, 29.09.1994, Turku) heard the blows, presumably at 00:56-00:57. After 1-2 minutes from the first blow he started to run towards the ECR, that is, at 00:57-00:59. We can assume here that the Systems Engineer C33 arrived around 00:58-01:00. According to C33 about 1 minute after his arrival in the ECR the watertight doors closed, that is, at 00:59-01:01. At 01:02: The large sudden heel The large sudden heel made the alarm clock of passenger P92 to drop on to cabin floor and to stop when the battery dropped out. At 01:02 … 01:05: The ship starts to turn to port The ship started to turn to port and suddenly heeled 2-3 times deeply to starboard. Afterwards the ship did not right itself, but a significant list remained. Many passengers have reported these large heels. According to passenger P79 the ship “fell abruptly to about 40°/45°”. According to another passenger P83 (P83, 05.10.95, Södertälje) posters or figures were hanging at 45° inclination on the walls.

Seakeeping & Manoeuvring
17
The survivors’ testimonies do not give a one uniform picture about the big heel. Obviously the experiences have been very different, also depending on location of the observing person in the ship just at that moment. Based on the reports of loose items starting to slide on the floors and also on reports of originally fixed pieces of furniture starting move in bars it can be concluded that the heeling angle could well be more than 20-30°. In the GGE interview the passenger P76 himself considered the heeling angle to reach 20-25° in the beginning and maybe 15° at the second heeling. He said further that before the big heel the white water (foam and spray from waves) could reach the windows of the Deck 5. “But during the heel I felt as if she lay over violently enough for this window part to become submerged” and further “The heel was so incredibly violent, I mean.” If we further believe another passenger P9, the (main) engines stopped only 1-2 minutes later. All this happened very rapidly, when the heeling angle was very high. If we calculate the heeling angle of the MV Estonia, at which the center of the windows on Deck 5 submerge in calm water, we get about 45°. If we consider that the center of a window submerges only when there is a wave crest (wave height 4.2 m) just behind it, the heeling angle becomes about 40°. Before the main engines stopped or their speed was reduced, the ship had already heeled considerably to starboard. In this situation the port side propeller is not anymore completely submerged even in calm sea (see HSVA Report S544, Fig. 15) and in waves it is even less. Thus the port side engines had a tendency to race as a result of the diminishing load from the propeller. It is possible that the engine revolutions and pitch were reduced at this moment. The crew member C45 got the impression based on hearing and feeling the ship that the propeller pitch was in zero position, as reported by him (GGE Encl. No. 13.193). It is, however, not quite sure whether the navigation bridge was at this moment really operational and able to reduce the propeller pitch. Outside at the ship stern on Deck 6 one passenger (P28) lost his balance and fell on the deck due to the sudden heel. After he had got back on to his feet again he noticed that the ship had turned (Schager, 2006). At least the following persons noticed that the ship was turning: passengers P28, P79, P14, P30 and the MV Mariella officer E1. The survivors say neither whether the turning or heeling started first, nor whether there was any causality between these two. The HSVA simulations show that such a massive sudden heel to the outer side can at least partly be a result of a start of the turn, when there is water on the vehicle deck and the vessel is in a suitable wave pattern of irregular seas. It is noteworthy that the ship did not right itself, but a significant list remained. The ship continued turning, its speed reduced and therefore due to decreasing centrifugal acceleration the ship righted itself somewhat. As the speed reduced the bow wave decreased strongly together with the dynamic sinkage of the vessel at the bow, thus the water inflow rate onto the vehicle deck reduced. The ship turned about 180° or little less. Somebody must have steered the ship towards the return course. Thus the bridge was not totally disabled, but excluding the call to the Third Engineer C36 in the ECR, nothing is known about the activities on the bridge until the first Mayday was sent at 01:22.
Seakeeping & Manoeuvring
18
During the sudden heeling things kept dropping out of shelves and various originally fixed pieces of furniture slid towards the starboard side. Many survivors started their escape at this time. At 01:04 … 01:08 (ECR time 01:20) Bridge: Stabilize the ship. The 4th Officer on the navigation bridge asked the Third Engineer C36 in the ECR to try to pump ballast in order to stabilize the ship. At 01:06 … 01:12 (ECR clock shows 01:18-01:24): The main engines stop The table in the ECR broke free from its welds and the engine(s) stopped before the Systems Engineer C33 and the Motorman C7 left the ECR at the latest 1:09-01:12. This statement gets some support from passenger P9, who observed that the (main) engines stopped only 1-2 minutes after the last blows at the bow. It is, however, also possible that passenger P9 sensed only the reduction in engine revolutions (P9, 01.10.94, -). At 01:06 … 01:12: The crew members C7 and C33 leave the ECR The Motorman C7 and the Systems Engineer C33 left the ECR at 01:09-01:12 at the latest in real time. This is based on interpretation of the survivors’ testimonies. According to the evacuation simulations the Motorman C7 and the Systems Engineer C33 left the ECR at 01:06-01:07 at the latest. (see Chapter 7.7) At 01:10 … 01:20: Alarm in Estonian A weak female voice gave an alarm in Estonian “Häire, häire, laeval on häire…” Most survivors heard the announcement when they were already out on open deck or well on the way up. About half of those who succeeded in getting on to the open decks survived, of those who were still inside far less. This implies that if you were still inside the ship when the alarm in Estonian was given, your chances to survive were already rather low. Instantly afterwards another message “Mr Skylight number one and number two” was given for the crew. At 01:12 … 01:21: The auxiliary engines stop The crew members C7 and C33 were at this time on the level of Deck 6 in the engine casing on the way up. They described a short moment of darkness when the auxiliary engines stopped and the emergency generator started. At 01:22 - 01:24: Mayday-call, black-out The MV Estonia sent a Mayday call, reported a black-out and a 20°-30° list. At 01:15 … 01:25: Crew members C7 and C33 reach open deck Crew members C7 and C33 got out of the engine casing and reached the open deck. C7 did not see the bilge keel when he went to the guard rail on the port side. He also did not describe any particular difficulties in reaching the guard rail. This suggests that the heeling angle at this moment was below 30°-35°. At 01:27 (ECR time 01:41): Crew members C7, C33, and C16 are already in a raft. The Motorman C7 and the Systems Engineer C33 were already in a life raft together with the AB Seaman C16, among other survivors.

Seakeeping & Manoeuvring
19
At 01:30: Last message Last message from the bridge of the MV Estonia to other ships was broken up while being transmitted. At 01:31: The ship list 90° The passenger P49 walked on the ship side, when the vessel had a 90° list, broke through a window and broke his watch at 01:31. At 01:35: The clock on the bridge stopped The clock on the bridge stopped at 01:35. Probably the clock got under water. At 01:35 … 01:40: List 125-140° Passenger P92 was sitting astride on the bilge keel and was facing towards the stern. The stern of the ship started to sink. He took four photographs with his Olympus pocket camera using a flash in order to attract the attention of the ships visible in a distance. Based on the two succeeded photographs one can coarsely evaluate the ship list to be about 125°-140°. The ship stern was pointing towards 301°-325°. See Chapter 1.7. Shortly afterwards he was flushed away from the bilge keel into the sea by a wave coming from the stern of the ship. Thus the ship was in this moment already rather deep in the water. At 01:40-01:48: MV Estonia on one spot. The last page of the GGE Enclosure 24.394 shows a hand-written plot of the movements of the rescue vessels made in Utö: The map contains also one position for the MV Estonia and under it the text in Finnish: “klo 01:40 ESTONIA katosi(?) Tutkalta klo 01.48” That is: “at 01:40 ESTONIA, disappeared from radar at 01:48 ” There is only one position marked for the MV Estonia between 01:40-01:48 in the map detail shown in Figure 4. See also the similar Figure 17.1 of the JAIC Final Report (1997) reproduced as Figure 8. This supports other information suggesting that the ship stern was already at the sea bottom around 01:40 and that the drifting of the vessel had stopped. The current turns the ship, pivoting the ship around its stern on the sea bottom, towards its final orientation on the sea bottom. At 01:48 … 01:52: The MV Estonia sinks The MV Estonia disappeared from the radar screens of the Utö military base and that of the MV Mariella. As the MV Estonia sank stern first and not in a horizontal position, it means that
Fig. 4 Extract of a map showing the movementsof the rescue vessels (GE Encl. 24.394).
Seakeeping & Manoeuvring
20
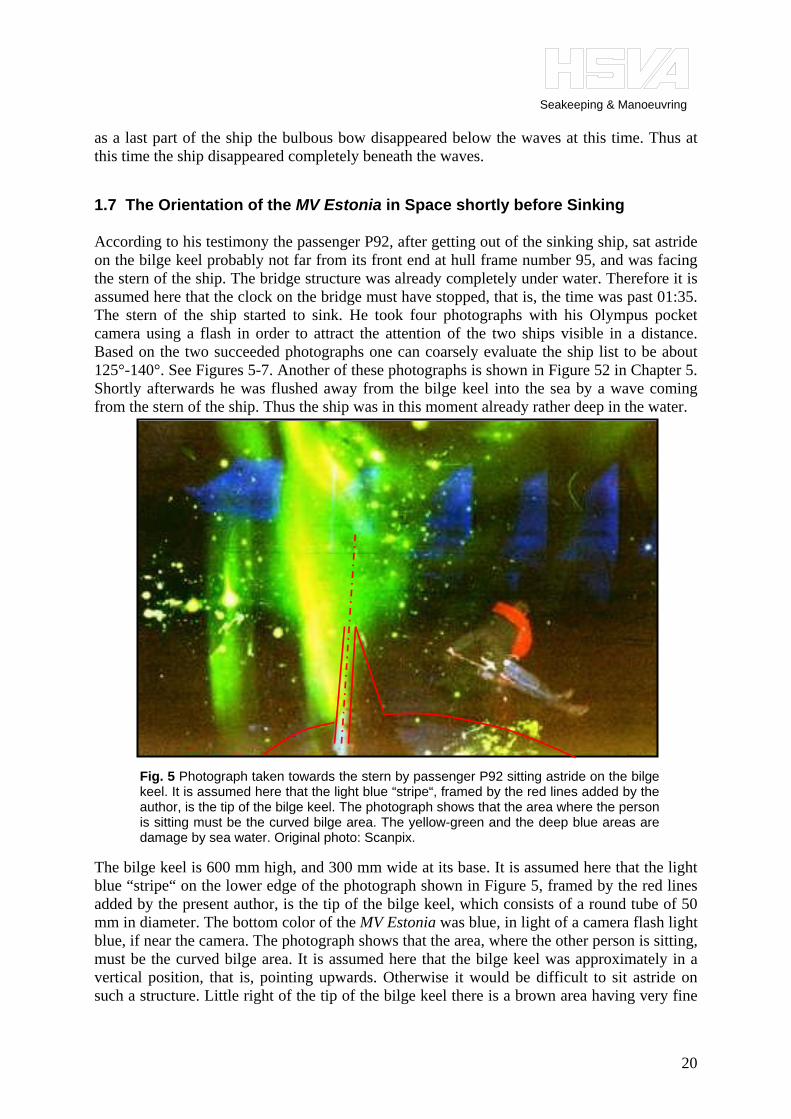
as a last part of the ship the bulbous bow disappeared below the waves at this time. Thus at this time the ship disappeared completely beneath the waves. 1.7 The Orientation of the MV Estonia in Space shortly before Sinking According to his testimony the passenger P92, after getting out of the sinking ship, sat astride on the bilge keel probably not far from its front end at hull frame number 95, and was facing the stern of the ship. The bridge structure was already completely under water. Therefore it is assumed here that the clock on the bridge must have stopped, that is, the time was past 01:35. The stern of the ship started to sink. He took four photographs with his Olympus pocket camera using a flash in order to attract the attention of the two ships visible in a distance. Based on the two succeeded photographs one can coarsely evaluate the ship list to be about 125°-140°. See Figures 5-7. Another of these photographs is shown in Figure 52 in Chapter 5. Shortly afterwards he was flushed away from the bilge keel into the sea by a wave coming from the stern of the ship. Thus the ship was in this moment already rather deep in the water.
The bilge keel is 600 mm high, and 300 mm wide at its base. It is assumed here that the light blue “stripe“ on the lower edge of the photograph shown in Figure 5, framed by the red lines added by the present author, is the tip of the bilge keel, which consists of a round tube of 50 mm in diameter. The bottom color of the MV Estonia was blue, in light of a camera flash light blue, if near the camera. The photograph shows that the area, where the other person is sitting, must be the curved bilge area. It is assumed here that the bilge keel was approximately in a vertical position, that is, pointing upwards. Otherwise it would be difficult to sit astride on such a structure. Little right of the tip of the bilge keel there is a brown area having very fine
Fig. 5 Photograph taken towards the stern by passenger P92 sitting astride on the bilgekeel. It is assumed here that the light blue “stripe“, framed by the red lines added by theauthor, is the tip of the bilge keel. The photograph shows that the area where the personis sitting must be the curved bilge area. The yellow-green and the deep blue areas aredamage by sea water. Original photo: Scanpix.
Seakeeping & Manoeuvring
21
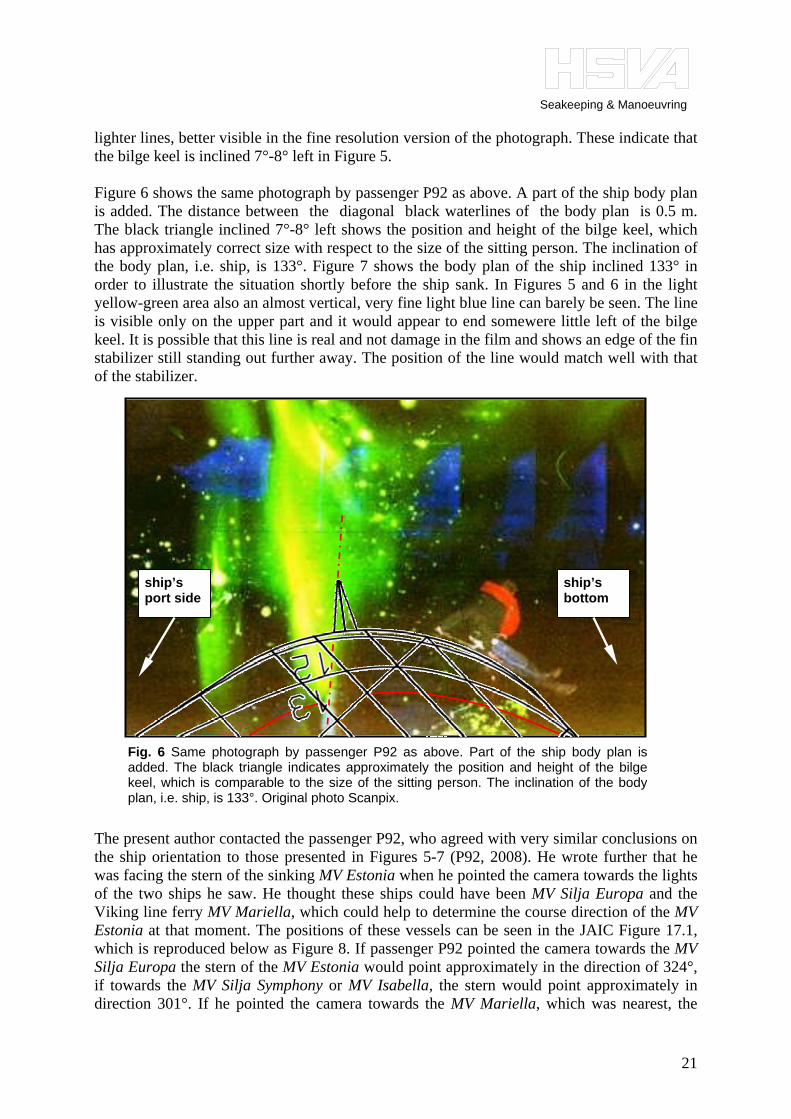
lighter lines, better visible in the fine resolution version of the photograph. These indicate that the bilge keel is inclined 7°-8° left in Figure 5. Figure 6 shows the same photograph by passenger P92 as above. A part of the ship body plan is added. The distance between the diagonal black waterlines of the body plan is 0.5 m. The black triangle inclined 7°-8° left shows the position and height of the bilge keel, which has approximately correct size with respect to the size of the sitting person. The inclination of the body plan, i.e. ship, is 133°. Figure 7 shows the body plan of the ship inclined 133° in order to illustrate the situation shortly before the ship sank. In Figures 5 and 6 in the light yellow-green area also an almost vertical, very fine light blue line can barely be seen. The line is visible only on the upper part and it would appear to end somewere little left of the bilge keel. It is possible that this line is real and not damage in the film and shows an edge of the fin stabilizer still standing out further away. The position of the line would match well with that of the stabilizer.
The present author contacted the passenger P92, who agreed with very similar conclusions on the ship orientation to those presented in Figures 5-7 (P92, 2008). He wrote further that he was facing the stern of the sinking MV Estonia when he pointed the camera towards the lights of the two ships he saw. He thought these ships could have been MV Silja Europa and the Viking line ferry MV Mariella, which could help to determine the course direction of the MV Estonia at that moment. The positions of these vessels can be seen in the JAIC Figure 17.1, which is reproduced below as Figure 8. If passenger P92 pointed the camera towards the MV Silja Europa the stern of the MV Estonia would point approximately in the direction of 324°, if towards the MV Silja Symphony or MV Isabella, the stern would point approximately in direction 301°. If he pointed the camera towards the MV Mariella, which was nearest, the
ship’s port side
ship’s bottom
Fig. 6 Same photograph by passenger P92 as above. Part of the ship body plan isadded. The black triangle indicates approximately the position and height of the bilgekeel, which is comparable to the size of the sitting person. The inclination of the bodyplan, i.e. ship, is 133°. Original photo Scanpix.
Seakeeping & Manoeuvring
22
stern of the MV Estonia would have pointed in the direction 22°, which is here considered unlikely. The two former orientation angles also appear plausible considering that the ship was drifting in a current in the direction east-northeast (ENE), and had been drifting in the southwest (SW) wind when still properly afloat.
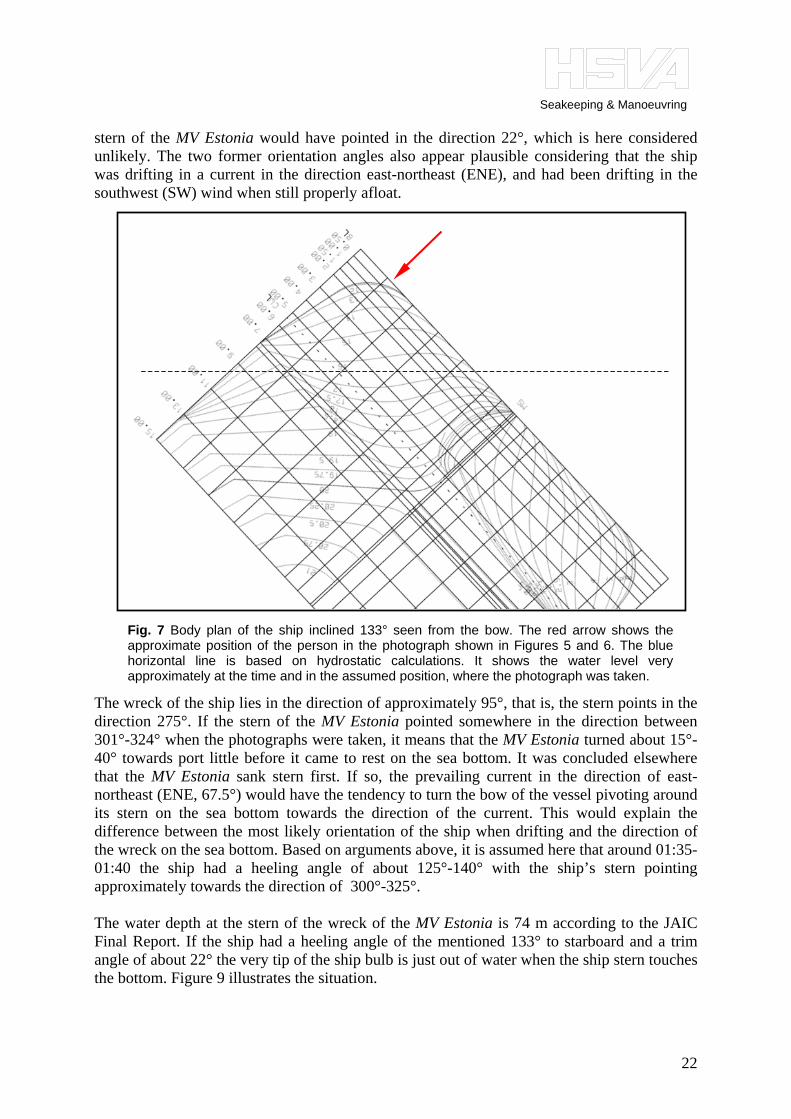
The wreck of the ship lies in the direction of approximately 95°, that is, the stern points in the direction 275°. If the stern of the MV Estonia pointed somewhere in the direction between 301°-324° when the photographs were taken, it means that the MV Estonia turned about 15°-40° towards port little before it came to rest on the sea bottom. It was concluded elsewhere that the MV Estonia sank stern first. If so, the prevailing current in the direction of east-northeast (ENE, 67.5°) would have the tendency to turn the bow of the vessel pivoting around its stern on the sea bottom towards the direction of the current. This would explain the difference between the most likely orientation of the ship when drifting and the direction of the wreck on the sea bottom. Based on arguments above, it is assumed here that around 01:35-01:40 the ship had a heeling angle of about 125°-140° with the ship’s stern pointing approximately towards the direction of 300°-325°. The water depth at the stern of the wreck of the MV Estonia is 74 m according to the JAIC Final Report. If the ship had a heeling angle of the mentioned 133° to starboard and a trim angle of about 22° the very tip of the ship bulb is just out of water when the ship stern touches the bottom. Figure 9 illustrates the situation.
Fig. 7 Body plan of the ship inclined 133° seen from the bow. The red arrow shows theapproximate position of the person in the photograph shown in Figures 5 and 6. The bluehorizontal line is based on hydrostatic calculations. It shows the water level veryapproximately at the time and in the assumed position, where the photograph was taken.

Seakeeping & Manoeuvring
23
301°
324°22°
Fig. 8 The figure shows the tracks of some vessels during and after the accident. The tracks arebased on radar observations (JAIC). Three possible viewing directions of the passenger P92’scamera are also shown.
Z
Fig. 9 The MV Estonia with a heeling angle of 133° to starboard and a trim of 20°. The vessel musthave turned about 15-40° to port before it came to rest on the sea bottom.

Seakeeping & Manoeuvring
24
2 Simulation of the Ship Motions and Flooding of the Vehicle Deck- Preliminary Cases
2.1 Starting Point for the Simulations 2.1.1 Ship list to starboard A new time sequence of the course of the events during the accident in form of ship’s list as a function of time was established purely on the basis of the survivors’ testimonies by the TUHH, the second partner in the HSVA–Consortium. This sequence of the ship’s list is one of the crucial facts to be reproduced with the motion simulation of the damaged ship. Figure 10 shows the new time-history of the list of the MV Estonia together with the list development according to the JAIC. There is a clear difference between these two time-histories. The HSVA consortium believes that the actual accident started earlier, around 01:00, and not at 01:14 as stated by JAIC. The values of list in the TUHH-curve are based on subjective observations made by the survivors. It is possible that the actual values of list were at certain points somewhat lower than those felt and reported by the survivors.
2.1.2 Track of the vessel Figure 11 reproduced from the JAIC Final Report (1997) shows the MV Estonia’s track during the last hour. The red circles and ellipsoid mark areas, where the visor, an unknown object and various loose items lay on the seabed, based on sonar measurements carried out in October 1994 (Nuorteva, 1995). A corresponding map of the sea floor deposits obtained with
Fig. 10 Development of list to starboard during the MV Estonia accident.
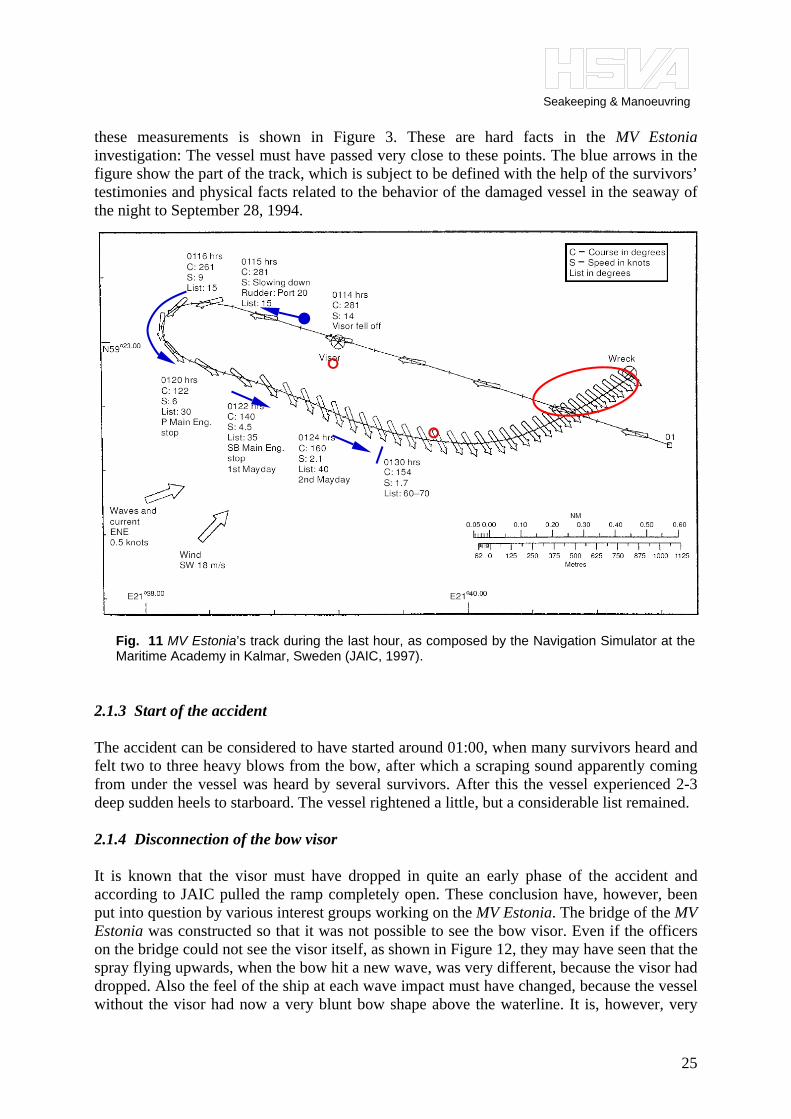
Seakeeping & Manoeuvring
25
these measurements is shown in Figure 3. These are hard facts in the MV Estonia investigation: The vessel must have passed very close to these points. The blue arrows in the figure show the part of the track, which is subject to be defined with the help of the survivors’ testimonies and physical facts related to the behavior of the damaged vessel in the seaway of the night to September 28, 1994.
2.1.3 Start of the accident The accident can be considered to have started around 01:00, when many survivors heard and felt two to three heavy blows from the bow, after which a scraping sound apparently coming from under the vessel was heard by several survivors. After this the vessel experienced 2-3 deep sudden heels to starboard. The vessel rightened a little, but a considerable list remained. 2.1.4 Disconnection of the bow visor It is known that the visor must have dropped in quite an early phase of the accident and according to JAIC pulled the ramp completely open. These conclusion have, however, been put into question by various interest groups working on the MV Estonia. The bridge of the MV Estonia was constructed so that it was not possible to see the bow visor. Even if the officers on the bridge could not see the visor itself, as shown in Figure 12, they may have seen that the spray flying upwards, when the bow hit a new wave, was very different, because the visor had dropped. Also the feel of the ship at each wave impact must have changed, because the vessel without the visor had now a very blunt bow shape above the waterline. It is, however, very
Fig. 11 MV Estonia’s track during the last hour, as composed by the Navigation Simulator at theMaritime Academy in Kalmar, Sweden (JAIC, 1997).
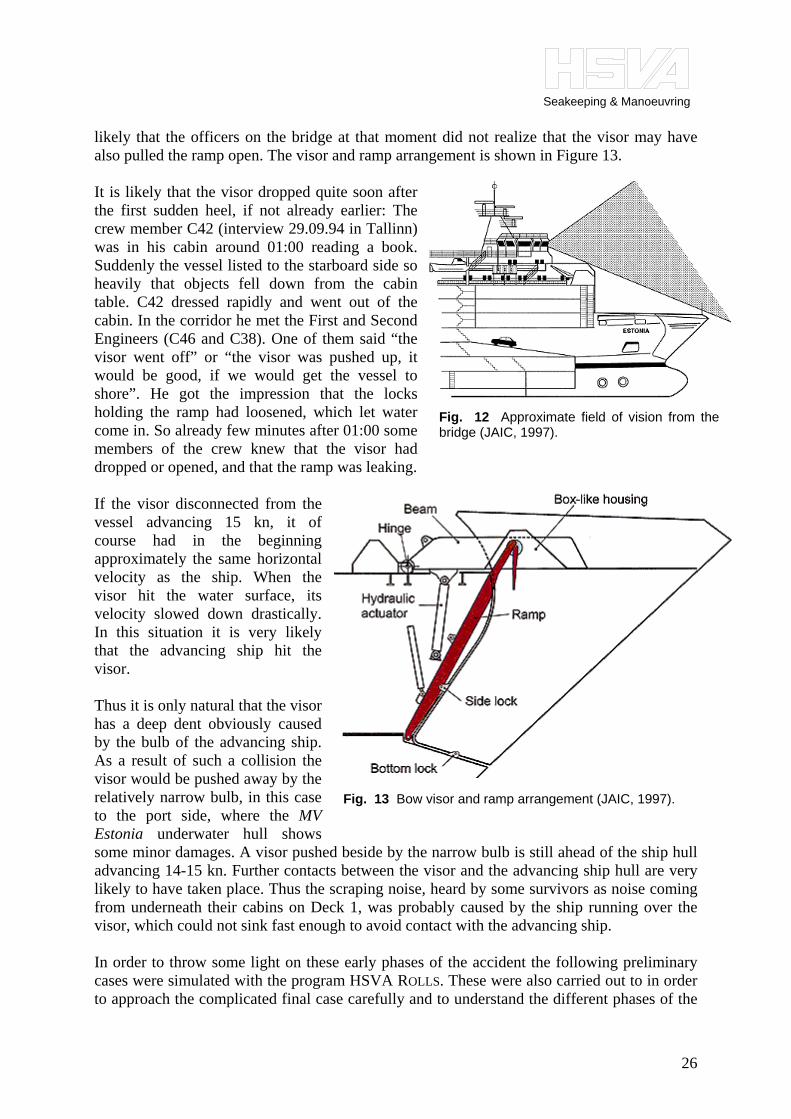
Seakeeping & Manoeuvring
26
likely that the officers on the bridge at that moment did not realize that the visor may have also pulled the ramp open. The visor and ramp arrangement is shown in Figure 13. It is likely that the visor dropped quite soon after the first sudden heel, if not already earlier: The crew member C42 (interview 29.09.94 in Tallinn) was in his cabin around 01:00 reading a book. Suddenly the vessel listed to the starboard side so heavily that objects fell down from the cabin table. C42 dressed rapidly and went out of the cabin. In the corridor he met the First and Second Engineers (C46 and C38). One of them said “the visor went off” or “the visor was pushed up, it would be good, if we would get the vessel to shore”. He got the impression that the locks holding the ramp had loosened, which let water come in. So already few minutes after 01:00 some members of the crew knew that the visor had dropped or opened, and that the ramp was leaking. If the visor disconnected from the vessel advancing 15 kn, it of course had in the beginning approximately the same horizontal velocity as the ship. When the visor hit the water surface, its velocity slowed down drastically. In this situation it is very likely that the advancing ship hit the visor. Thus it is only natural that the visor has a deep dent obviously caused by the bulb of the advancing ship. As a result of such a collision the visor would be pushed away by the relatively narrow bulb, in this case to the port side, where the MV Estonia underwater hull shows some minor damages. A visor pushed beside by the narrow bulb is still ahead of the ship hull advancing 14-15 kn. Further contacts between the visor and the advancing ship hull are very likely to have taken place. Thus the scraping noise, heard by some survivors as noise coming from underneath their cabins on Deck 1, was probably caused by the ship running over the visor, which could not sink fast enough to avoid contact with the advancing ship. In order to throw some light on these early phases of the accident the following preliminary cases were simulated with the program HSVA ROLLS. These were also carried out to in order to approach the complicated final case carefully and to understand the different phases of the
Fig. 12 Approximate field of vision from thebridge (JAIC, 1997).
Fig. 13 Bow visor and ramp arrangement (JAIC, 1997).

Seakeeping & Manoeuvring
27
vessel’s behavior during its final run. A short description of the program and the modeling as applied in the MV Estonia case can be found in Appendices 1-4. 2.2 Numerical Simulation of the Initial Phases of the Accident 2.2.1 Initial scenario 0-A: Visor and ramp both 1 m open The MV Estonia runs on the course 287° in a sea state having a significant wave height of 4.2 m and significant period of 8.0 s. The waves come at 45° from the port bow quarter. The visor is loose in its position: There is a 1 m high horizontal gap between the visor and the ship shell just below the visor. The ramp has been pulled 1 m open at its upper end. This scenario is plausible as an initial scenario. The triangular shaped openings between the ramp and its frame on both sides of the ramp were modeled in the motion computations of the damaged ship with the program ROLLS. The effect of the somewhat opened visor on the inflow rate was estimated, in absence of other sources, with the experimental results by SSPA (2007). These suggest that the inflow rate would be reduced by 70 percent in comparison with the situation without the visor. Simulation result: In this scenario the inflow rate of about 10-20 m³/min is relatively small from the point of view of the ship stability. However, also this amount certainly appears considerable for an observer on the vehicle deck or somebody observing this via a TV-monitor, like the crew in the engine control room did. The water accumulates slowly on the vehicle deck; in ca. 26 min the list of the ship reaches 10°. The list increases gradually as the water volume on the vehicle deck increases. If no corrective action were taken, the ship would be in danger to capsize after more than 3 hours. Figure 14 illustrates the situation. The water volumes shown in Figures 14-20 are computational water volumes, which must be multiplied with the permeability (0.82) to get the real values of the water volume on the vehicle deck. This scenario may have taken place before the ramp opened, but not for very long, as the gradually increasing list, e.g. 7° after 10 min, would have been noticed sooner or later by the crew. The simulation does not indicate any sudden heeling or other sudden ship motions. The flooding rate in this scenario is
too slow for it to be the final scenario for the flooding of the vehicle deck. The scenario can be true for the
very initial phase of the accident, but not for very long, as the slowly increasing list would have been observed by the crew.
Fig. 14 Roll angle and computational water volume on the vehicle deck when both the visor and ramp are about 1 m open.

Seakeeping & Manoeuvring
28
2.2.2 Initial scenario 0-B: Without visor, ramp 1 m open The MV Estonia runs on the course 287° in a sea state having a significant wave height of 4.2 m and significant period of 8.0 s. The visor has dropped away. The ramp has been pulled open 1 m at its upper end. This scenario is not plausible according to JAIC, as there is nothing which can hold the ramp in this partially open position. It is, however, favored by some interest groups working on the MV Estonia case, perhaps because the ramp at the wreck resting on the seabed is approximately in this position. Simulation result: In this scenario the inflow rate of about 70-80 m³/min is considerable from the point of view of the ship stability and certainly appears massive for an observer on the vehicle deck or on a TV-monitor. In addition in this case the airflow at the open gaps beside the ramp consisting of the ship speed and a component of the wind outside may have speeded the finer water spray coming in up to about 20 m/s or more. The water accumulates on the vehicle deck; in ca. 10 min the list of the ship reaches 15°. The list increases monotonously as the water volume on the vehicle deck increases. If no action were taken, the ship would be in danger to capsize in about 40 minutes. Due to the gradually increasing list the situation would have been noticed by the crew relatively soon. Even after a considerable list there would have been enough time to take action against the water inflow on to the vehicle deck. The simulation does not indicate any sudden heeling or other sudden ship motions. Figure 15 illustrates the situation. This scenario is difficult from the point of view of the ramp position. The wave forces the ramp would encounter in this inclined position would be considerable, thus no weak support can hold the ramp in this partially open position. The ramp weights about 12.5 tons. It is, however, light enough to be moved by the waves the ship encountered in the night of the accident. The flooding rate is perhaps
somewhat too low for this scenario to be the final scenario for the flooding of the vehicle deck. The inflow to the vehicle deck could
hardly remain unnoticed by the crew. In this scenario the ship gets a list of 14-15° in 10 min. After this observation the crew would still have had sufficient time to take action against the inflow. This scenario does not fit to the known technical facts reported by the JAIC.
2.2.3 Scenario 1: Without visor, ramp fully open The MV Estonia runs on the course 287° in a sea state having a significant wave height of 4.2 m and significant period of 8.0 s. The visor has dropped away. The ramp has been pulled fully open. This scenario is the early phase of the accident scenario according to JAIC.
Fig. 15 Roll angle and computational watervolume on the vehicle deck without visor whenthe ramp is about 1 m open.

Seakeeping & Manoeuvring
29
Simulation result: In this scenario the computed inflow rates vary between 300-700 m³/min, which are of course relatively high also from the point of view of the ship stability. This scenario is very likely to have taken place, but not for very long, as the increasing list, over 10° in three to four minutes would certainly have been noticed by the crew. If no corrective action had been taken, the ship would have been in severe danger to capsize in little more than 10-20 minutes, which did not happen. The likely further progressive flooding of the vessel leading to sinking is at the moment not considered. Notice that the curve in Figure 16 describing the water volume on the vehicle deck has a somewhat rougher look than the earlier curves shown in Figures 5-6: This is due to the open bow ramp, which allows more water sloshing in and out of the vehicle deck than in the earlier cases with the bow ramp only about 1 m open. The flooding rate is suitable for
this scenario to be the main scenario for the flooding of the vehicle deck. The inflow to the vehicle would
certainly be noticed by the crew. In this scenario the ship gets a list of over 10° in 3-4 minutes. If the crew in this scenario would not rapidly slow down or turn the ship, it would capsize. This scenario can be considered in generally to fit with most testimonies by survivors and to known technical facts.
2.3 Discussion The JAIC Final Report assumes that the waves hit the visor and made it to break loose. The visor was banging against the ship structures, and after a while it fell off pulling the ramp completely open. Through the open ramp an enormous amount of water flowed on to the vehicle deck and the ship heeled. This scenario is plausible also in view of the preliminary simulation results above provided that the following two questions can be answered: (1) What caused the sudden heel described by many survivors? The survivors` testimonies
appear to indicate that one first heard strange “metallic” noises from the bow (two to three heavy blows), second some scraping noises appearing to come from underneath the ship hull, and third one experienced sudden, violent heeling to starboard. Some survivors explain that they expected the ship to straighten and to roll back towards the other side, but this never happened. After the sudden heel to starboard the ship straightened somewhat, but a significant list remained.
(2) How can the described scenario be combined with the statements of the three crew
members in the ECR, who reported they saw water spraying on both sides of the closed
Fig. 16 Roll angle and computational watervolume on the vehicle deck without visor whenthe ramp is fully open.
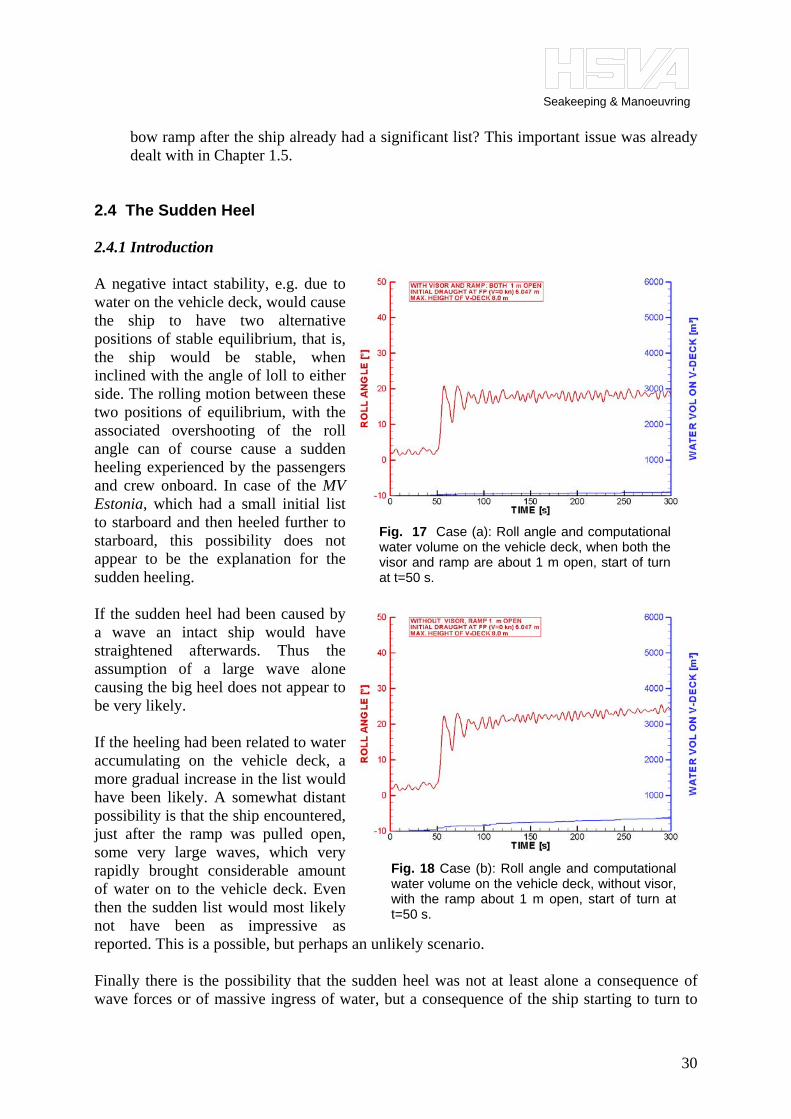
Seakeeping & Manoeuvring
30
bow ramp after the ship already had a significant list? This important issue was already dealt with in Chapter 1.5.
2.4 The Sudden Heel 2.4.1 Introduction A negative intact stability, e.g. due to water on the vehicle deck, would cause the ship to have two alternative positions of stable equilibrium, that is, the ship would be stable, when inclined with the angle of loll to either side. The rolling motion between these two positions of equilibrium, with the associated overshooting of the roll angle can of course cause a sudden heeling experienced by the passengers and crew onboard. In case of the MV Estonia, which had a small initial list to starboard and then heeled further to starboard, this possibility does not appear to be the explanation for the sudden heeling. If the sudden heel had been caused by a wave an intact ship would have straightened afterwards. Thus the assumption of a large wave alone causing the big heel does not appear to be very likely. If the heeling had been related to water accumulating on the vehicle deck, a more gradual increase in the list would have been likely. A somewhat distant possibility is that the ship encountered, just after the ramp was pulled open, some very large waves, which very rapidly brought considerable amount of water on to the vehicle deck. Even then the sudden list would most likely not have been as impressive as reported. This is a possible, but perhaps an unlikely scenario. Finally there is the possibility that the sudden heel was not at least alone a consequence of wave forces or of massive ingress of water, but a consequence of the ship starting to turn to
Fig. 18 Case (b): Roll angle and computationalwater volume on the vehicle deck, without visor,with the ramp about 1 m open, start of turn att=50 s.
Fig. 17 Case (a): Roll angle and computationalwater volume on the vehicle deck, when both thevisor and ramp are about 1 m open, start of turnat t=50 s.

Seakeeping & Manoeuvring
31
port initiated by the officers on the bridge. This is regarded as a plausible hypothesis for the sudden heeling motion and will be investigated further. In their testimonies the survivors P28 and P30 describe a turn to port. The P28 also describes how the ship heeled so heavily to starboard that furniture inside started to move. The person P28 also fell on the deck due to a sudden heeling motion (Schager, 2006). A HSVA technician on the full-scale trials of the MV Viking Sally, that is, later the MV Estonia, experienced something quite similar. He was on the upper deck, when the ship started a Zigzag-maneuver: He remembers he had difficulties to stay on his feet and he heard how objects were falling down from tables and shelves, because of the sudden heeling due to the start of the turn. 2.4.2 Turn to port The location of the visor, the debris dropped from the ship listing heavily and the position and orientation of the wreck quite strongly hint that the ship made a turn to port, before it capsized and sank. See Figure 11 for illustration of the vessel’s track according to JAIC. In addition the second officer (E1) on watch onboard the MV Mariella tracking MV Estonia that night saw in the corner of his eye on the radar screen the track of a hasty, sharp turn to port made by MV Estonia. It is also very plausible to assume that the officers on the bridge of the MV Estonia decided to make a turn to port. They may not have been fully aware of what was wrong with the ship, but they certainly knew that something had changed. Strange noises from the bow had been report-ed to the bridge. They may have known that they had water on the vehicle deck. If they were in contact with crew members in the engine control room, at worst these could have told that plenty of water sprayed onto the vehicle deck on both sides of the closed ramp. Even if the officers on the bridge had assumed that the visor had broken or dropped away, it is not likely that they could at this situation have the knowledge that the falling visor could pull the ramp
Fig. 19 Case (c): Roll angle and computationalwater volume on the vehicle deck, without visor,ramp fully open, start of turn at t=50 s. Firstrealization of random waves.
Fig. 20 Case (c): Roll angle and computationalwater volume on the vehicle deck, without visor,ramp fully open, start of turn at t=50 s. Secondrealization of random waves.

Seakeeping & Manoeuvring
32
fully open. A turn to port would bring the wind and the waves to the starboard side. This would have a straightening effect on the ship’s list. In this light the turn to port appears a plausible measure to try to improve the situation of the ship. It is well known that when a ship starts a sudden turn to port, an overshooting of the heeling angle to starboard takes place. This overshooting can in certain conditions be quite significant, e.g. objects can slide on tables and drop down. There is, however, very little information available of how large this overshooting angle can be on a ship in seaway, when there is water on the vehicle deck. The water on the deck accumulates to the starboard side due to the sudden heeling and also due to the centrifugal acceleration caused by the turning of the ship. Thus the officers on the bridge may themselves have been surprised of the magnitude of the heeling that now followed. It is perhaps not absolutely sure whether the ship ramp opened before or after the ship started its turning maneuver. Therefore the sudden heeling motion due to the sharp turn to port was simulated in three basic situations:
a) The ship with both the loose visor and the bow ramp 1 m open. b) The ship without visor and the bow ramp 1 m open. c) The ship without visor and the bow ramp completely open.
In all cases the ship speed amounts to 15 kn, the steady turning diameter of the ship’s turn is 2.9 (2.87) ship lengths (Lbp) (JAIC Suppl. No. 523, 1996; SSPA, 2007). The full centrifugal acceleration due to the turn is reached in 14 seconds from the start of the turn. It is well known from tests and analysis that an undamaged ship would heel over to the outer side of the turn. In the beginning a large oscillation (overshoot) takes place. After a while the static heel balances the centrifugal acceleration acting on the ship. This situation lasts as long as the ship turns. Thus the heeling angle is not returning to zero. This was also noticed by some of the MV Estonia survivors in their testimonies, even if they did not know the reason for the sudden heeling. In the Case (a) the simulations provide a step of 18-19° in the heeling angle curve, the heel angle reaches 20° and remains high, as shown in Figure 17. The transient (roll) oscillations after the step dampen rapidly. The water inflow on to the vehicle deck is not strongly influenced by the increased heel of the vessel, and the ship list remains practically constant. The water volume on the vehicle deck is in this particular case small. The situation has an almost quasistatic character and does not appear to correspond as well with the survivors’ testimonies as the Case (c) below. If the simulation for the case (a) is carried out without the visor, we have the Case (b) and the curves look in the beginning very similar, with the exception that the additional heeling increases the inflow onto the vehicle deck and the ship would be in danger to capsize later on. For this reason, even if problematic from the point of view of the ramp position, this scenario cannot be closed out from further considerations as the main scenario. In the Case (c) the step is a little higher (19°-22°) leading to a momentary heeling angle of up to 26°. The water sloshing on the vehicle deck is likely to contribute to the magnitude of the sudden heeling motion. In this case the inflow through the completely open bow increases due

Seakeeping & Manoeuvring
33
to the sudden heel. Figures 19 and 20 illustrate the case with two different random wave realizations used in the simulations. The actual magnitude of the sudden heeling motion depends on the ship’s actual position in the waves, ship speed, rate of turning, height of the center of gravity and also how rapidly the ship starts to turn. Further the amount of water on the vehicle deck and its motion can influence the situation. For these reasons the three cases in Figures 17 to 20 should be taken only as examples. It should be taken into consideration that the survivors’ estimates of the felt heeling angle getting up to 40-45° may be possible. Person P28 explained further that after the initial overshooting he could see a metal plate stick out of the hull (the stabilizer fin) on the port side. This implies a heeling angle of at least ca. 15°-18°, which is not far from the few examples shown above in Figures 17-20. The following conclusions can be drawn based on the simulations carried out: A sharp turn to port gives a plausible explanation to the sudden heeling motion of the ship
reported by the survivors. The amount of water on the vehicle deck, as shown in Figures 17-20, appears to
contribute to the magnitude of the sudden heeling motion.
2.5 Water on the Vehicle Deck - Water onto Deck 1 Many survivors coming up from their cabins on Deck 1 reported water either on the Deck 1, or on the way up in the staircases in the center casing, when they were passing Deck 2, that is, the vehicle deck. One of the important questions in the case of the MV Estonia is, how did the water come on to Deck 1, the next deck below the vehicle deck? This question is crucial from the point of view of the damage scenario. Either the water came from the vehicle deck as JAIC has suggested, or it came from somewhere deeper down, as suggested e.g. by the GGE (Holtappels and Hummel, 1999). The survivors from the Deck 1 reported encounters with relative small amounts of water on their way out of their cabins just after the sudden heel, that is, when the ship still had a relatively moderate list. Elementary hydrostatic considerations indicate that a relatively high list is needed before the water reaches the likely openings in the center casing and can flow further down on to Deck 1. This would take place quite late in the course of the accident, thus the persons from Deck 1 would hardly have had time to escape. When the initial flow onto the vehicle deck is considered taking into account the water dynamics and the ship geometry, or the purely geometric considerations in Figure 21, the situation looks different. Based on these simple considerations it is difficult to assume that no water would flow onto the port side of the center casing, and further down onto Deck 1. It is thus likely that at least in the beginning when the ship had a small list to starboard some water flowed also to the port side of the vehicle deck. The numerical simulation of the motion of the ship and of the water on the vehicle deck supports the latter arguments and gives a more refined picture than the hydrostatic analysis.

Seakeeping & Manoeuvring Seakeeping & Manoeuvrin
34
Fig. 21 Extract of the Jos L. Meyer Drawing No S590-02/3 showing the front part of the vehicle deck. If the ship has no list, about 80 percent of waterat the ramp opening comes in at head seas on the port side of the centerline of the center casing, and only 20 percent on the starboard side. If weassume an even water distribution on the transverse direction on the vehicle deck just in front of the center casing about 57 percent of water flows tothe port side of the center casing and about 43 percent to the starboard side. If the ship advances at the speed 15 kn and the ramp suddenly opens, the incoming waves hit the front face of the center casing with a considerable momentum in about 3.5 seconds.
57 %
43 %
20 %
80 %
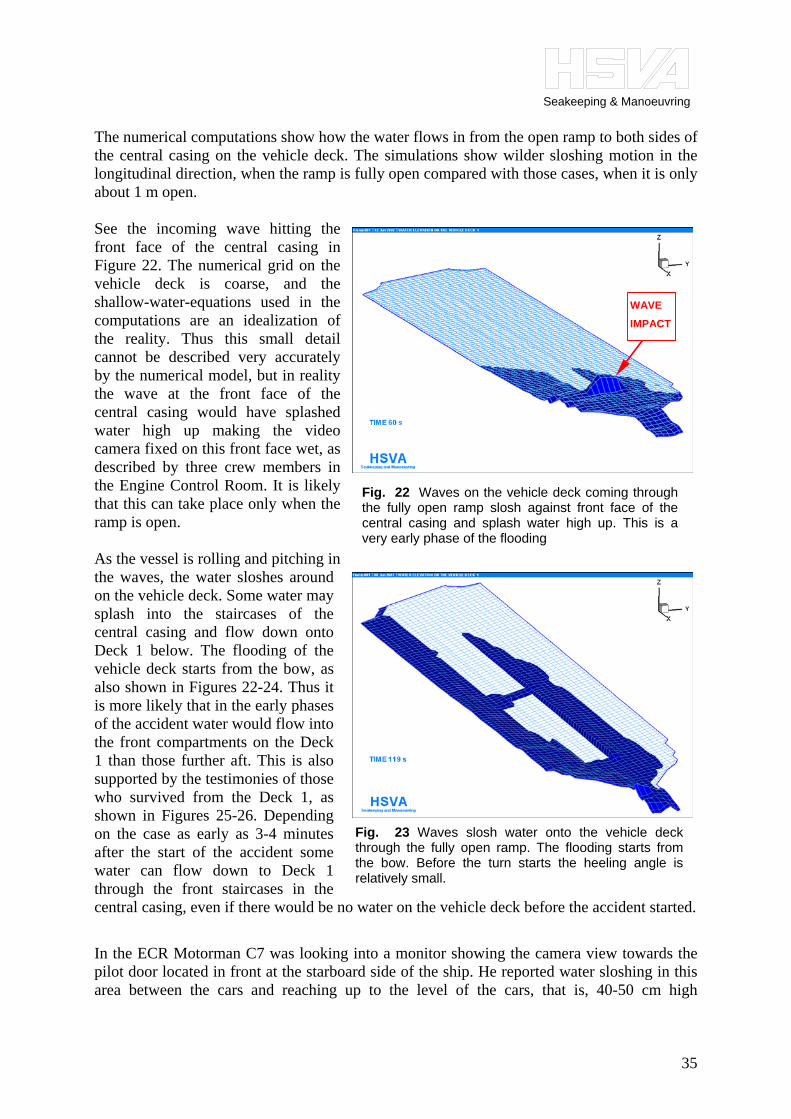
Seakeeping & Manoeuvring
35
The numerical computations show how the water flows in from the open ramp to both sides of the central casing on the vehicle deck. The simulations show wilder sloshing motion in the longitudinal direction, when the ramp is fully open compared with those cases, when it is only about 1 m open. See the incoming wave hitting the front face of the central casing in Figure 22. The numerical grid on the vehicle deck is coarse, and the shallow-water-equations used in the computations are an idealization of the reality. Thus this small detail cannot be described very accurately by the numerical model, but in reality the wave at the front face of the central casing would have splashed water high up making the video camera fixed on this front face wet, as described by three crew members in the Engine Control Room. It is likely that this can take place only when the ramp is open. As the vessel is rolling and pitching in the waves, the water sloshes around on the vehicle deck. Some water may splash into the staircases of the central casing and flow down onto Deck 1 below. The flooding of the vehicle deck starts from the bow, as also shown in Figures 22-24. Thus it is more likely that in the early phases of the accident water would flow into the front compartments on the Deck 1 than those further aft. This is also supported by the testimonies of those who survived from the Deck 1, as shown in Figures 25-26. Depending on the case as early as 3-4 minutes after the start of the accident some water can flow down to Deck 1 through the front staircases in the central casing, even if there would be no water on the vehicle deck before the accident started. In the ECR Motorman C7 was looking into a monitor showing the camera view towards the pilot door located in front at the starboard side of the ship. He reported water sloshing in this area between the cars and reaching up to the level of the cars, that is, 40-50 cm high
Fig. 23 Waves slosh water onto the vehicle deckthrough the fully open ramp. The flooding starts fromthe bow. Before the turn starts the heeling angle isrelatively small.
Fig. 22 Waves on the vehicle deck coming throughthe fully open ramp slosh against front face of thecentral casing and splash water high up. This is avery early phase of the flooding
WAVE
IMPACT
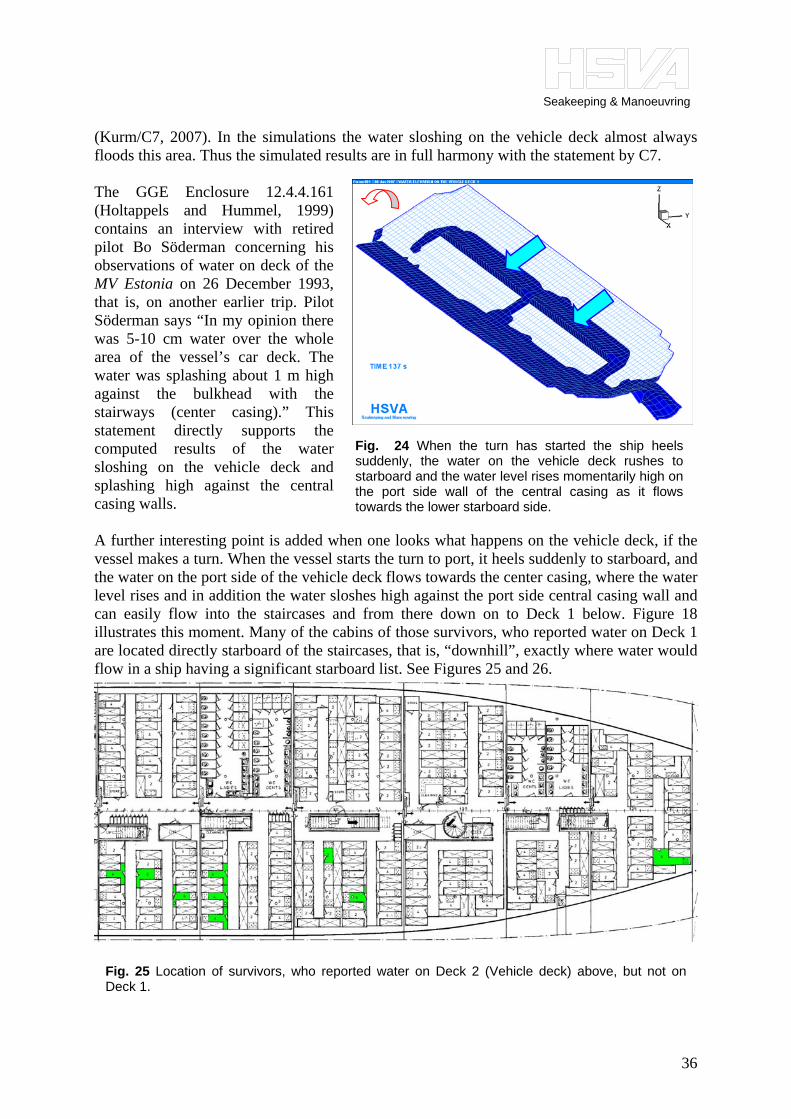
Seakeeping & Manoeuvring
36
(Kurm/C7, 2007). In the simulations the water sloshing on the vehicle deck almost always floods this area. Thus the simulated results are in full harmony with the statement by C7. The GGE Enclosure 12.4.4.161 (Holtappels and Hummel, 1999) contains an interview with retired pilot Bo Söderman concerning his observations of water on deck of the MV Estonia on 26 December 1993, that is, on another earlier trip. Pilot Söderman says “In my opinion there was 5-10 cm water over the whole area of the vessel’s car deck. The water was splashing about 1 m high against the bulkhead with the stairways (center casing).” This statement directly supports the computed results of the water sloshing on the vehicle deck and splashing high against the central casing walls. A further interesting point is added when one looks what happens on the vehicle deck, if the vessel makes a turn. When the vessel starts the turn to port, it heels suddenly to starboard, and the water on the port side of the vehicle deck flows towards the center casing, where the water level rises and in addition the water sloshes high against the port side central casing wall and can easily flow into the staircases and from there down on to Deck 1 below. Figure 18 illustrates this moment. Many of the cabins of those survivors, who reported water on Deck 1 are located directly starboard of the staircases, that is, “downhill”, exactly where water would flow in a ship having a significant starboard list. See Figures 25 and 26.
Fig. 25 Location of survivors, who reported water on Deck 2 (Vehicle deck) above, but not onDeck 1.
Fig. 24 When the turn has started the ship heelssuddenly, the water on the vehicle deck rushes tostarboard and the water level rises momentarily high onthe port side wall of the central casing as it flowstowards the lower starboard side.

Seakeeping & Manoeuvring
37
The following conclusions can be drawn: Water flows in from the opening at the bow to both sides of the center casing on the
vehicle deck. Thus in this case this dynamic distribution of water is different than a hydrostatic one, according to which the water accumulates solely on the starboard side of the vehicle deck. Therefore values of list estimated hydrostatically for a given amount of water on the vehicle deck, are in this case likely to be somewhat too high.
If the ramp was open, it is likely that incoming waves hit the front face of the center
casing splashing water high towards the camera fixed on this face possibly making the camera wet, as described by the crew members in ECR.
The flooding of the vehicle deck started from the bow. As the ship was rolling and
pitching in the waves, it is likely that some water splashed or flooded into the staircases in the central casing and flowed further down in to the front compartments on Deck 1.
The sudden heeling motion caused a momentary high water level on the port side of the
center casing. This most likely contributed to water being able to flow down to the front compartments on Deck 1. This matches well with the testimonies of the survivors, who came up from Deck 1 just after the sudden heel and encountered water on the way up.
2.6 Summary of the Investigated Preliminary Cases The following initial damage cases were investigated in irregular seas of 4.2 m significant wave height and period of 8.0 s. In the first four cases the ship speed is 15 kn and the relative wave direction –135°, that is, the waves come from the port bow quarter.
WATER FLOWS DOWN IN THE STAIRS NO WATER ?
Fig. 26 Location of survivors, who reported water on Deck 1, and their likely escape routes. Thetwo yellow cabins are alternative locations for one person escaping from Deck 1. The person hadeither the cabin number 1069 or 1096.

Seakeeping & Manoeuvring
38
1 With visor and ramp both 1 m open The flooding rate in this scenario is too slow for it to be the final scenario for the
flooding of the vehicle deck. The scenario can be true for the very initial phase of the accident, but not for very long,
as the slowly increasing list would have been observed by the crew. 2 Without visor, ramp 1 m open The flooding rate is perhaps somewhat too slow for this scenario to be the final scenario
for the flooding of the vehicle deck. The inflow to the vehicle deck could hardly remain unnoticed by the crew. In this
scenario the ship gets a list of 14-15° in 10 min. After this observation the crew would still have had sufficient time to take action against the water ingress.
This scenario does not fit to the known technical facts reported by the JAIC.
3 Without visor, ramp fully open The flooding rate is suitable for this scenario to be the final scenario for the flooding of
the vehicle deck. The inflow to the vehicle
would certainly be noticed by the crew. In this scenario the ship gets a list of over 10° in 3-4 minutes. If the crew in this scenario would not rapidly slow down or turn the ship, it would capsize. This scenario can be considered in general to fit with most testimonies by survivors and to known technical facts.
Water flows in from the
opening at the bow to both sides of the center casing on the vehicle deck. Thus in this case the dynamic distribution of water is more balanced than a hydrostatic distribution would be. Therefore values of list estimated hydrostatically for a given amount of water on the vehicle deck are in this case likely to be somewhat too high.
Fig. 27 Waves on the vehicle deck coming in through the open bow (fully open ramp) slosh against front face of the centralcasing and splash water high up. The colors show the waterheight and the vectors the flow direction and speed.

Seakeeping & Manoeuvring
39
If the ramp was open, it is likely that incoming waves hit the front face of the center casing splashing water high towards the camera fixed on this face making the camera wet, as described by the crew members in the ECR. See Figure 27.
The flooding of the vehicle deck started from the bow. As the ship was rolling and
pitching in the waves, it is likely that some water splashed or flooded into the staircases in the center casing and flowed further down into the front compartments on Deck 1 already at the early phases of the accident.
4 The start of the ship turning motion as the reason for the sudden heel in the three initial damage cases The start of the ship turning motion as the reason for the sudden heel reported by many survivors was investigated for all the three initial damage cases listed above: A sharp turn to port gives a plausible explanation to the sudden heeling motion of the
ship reported by the survivors. The amount of water on the vehicle deck appears to contribute to the magnitude of the
sudden heeling motion. The sudden heeling motion caused a momentary high water level on the vehicle deck on
the port side of the central casing. This most likely contributed to water being able to flow down to the front passenger compartments on Deck 1. This is in good agreement with the testimonies of the survivors, who came up from Deck 1 just after the sudden heel and encountered water on the way up.
5 Return of the ship after the turn The following case was studied: The ship advances at the speed of 6 kn without visor, ramp fully open, and has no other leaks. The ship has turned 180°, that is, the waves come from the starboard stern quarter. The ship has about 2000 tons of water on the vehicle deck and it advances straight ahead. This case was investigated to find out how the vessel would behave after the turn to port. Water sloshed in and out of the vehicle deck, or water flowed slowly out due to the pitch
motions of the ship. No gradual large heeling or sinking of the vessel took place.
The main reason for the gradual egress of water from the vehicle deck are the pitch
motions of the ship, which make the water on the vehicle deck to slosh in the longitudinal direction of the ship. This water has a considerable linear momentum. When the water flows to the narrowing bow part of the vehicle deck, its level can rise due to its momentum, like the level of incoming tide rises on a narrowing river. This contributes to the water egress. Neither the sloshing nor the rise of water level at the bow part of the vehicle deck can be modeled hydrostatically.

Seakeeping & Manoeuvring
40
2.7 U-turn - the Final Test Case In preparation for the final simulations the following more complete damage scenario was investigated: The ship advances without visor with fully open ramp at 15 kn straight ahead, turns 180° to port with a turning diameter of 5.74 Lbp. During the turn the speed slows down to 6 kn. After the turn the ship continues straight ahead with 6 kn on a return course. At the start of the simulation the relative wave direction is –135°, that is, the waves come at 45° from the port bow quarter. This case was first studied with no other leaks than the open bow. The chosen large turning diameter for this test case is twice a value measured by SSPA, (2007), which agree well with the empirical data for similar vessels given in (JAIC Suppl. No. 523). In general it can be said that the situation with the fully open ramp was extremely dangerous. When the waves come from the port bow quarter and the vessel advances at the speed of 15 kn, the water ingress to the vehicle deck is large. Turning away from the waves and perhaps even more the reduction of speed reduce this inflow significantly. The change of direction influences the ship motions in waves. The reduction of speed has three important effects: (1) The inflow velocity of the water on the open ramp is reduced; (2) The dynamic trim and sinkage of the ship due to ship speed decreases at the bow from 0.26 m to 0 as the speed reduces from 15 kn to zero. (3) The height of the bow wave on both sides of the open ramp, which depends on the ship speed squared, is strongly reduced. Specially the last two factors cause a very significant reduction in the inflow onto the vehicle deck. When the vessel has turned its bow away from the waves and reduced speed, the water on the vehicle deck sloshes around, but no significant gain appears to take place. In the cases computed, when the waves come from the starboard stern quarter, that is, the vessel has turned 180°, the pitching motion of the slowly advancing vessel makes the water on the vehicle deck to slosh also in the longitudinal direction and the water has a tendency to gradually flow out of the vehicle deck. The following phenomenon takes place: When the water on the vehicle deck moves forward as the vessel pitches bow down, it comes into the narrowing bow part of the vehicle deck and its level rises, like the level of water rises, when tide comes up a narrowing river. This phenomenon helps the egress of water. As the vehicle deck is higher than the sea level outside, the water is gradually sloshed out of the vehicle deck. In case the vessel encounters larger waves, these can of course bring water into the vehicle deck, but this does not change the overall tendency of the water to flow gradually out. In view of this it can be concluded that if the vessel had no further openings, through which water could enter the ship, and the water on the vehicle deck did not flow down to the compartments below, the vessel would have either capsized rapidly or it would have managed to turn away from the waves and reduce speed with the consequence of surviving a longer period and actually improving its situation. The MV Estonia’s behavior fits to neither of these two cases. Therefore further leaks or openings have to be added to model its behavior. When further leaks are considered the situation changes: When the vessel starts to turn to port with the initial speed of 15 kn the water ingress is high. In addition the ship heel caused by the turning and the related centrifugal acceleration move the water on the vehicle deck towards the outer starboard side of the turn. The heeling angle can easily increase to over 40°. This is more than sufficient to start the two following processes:
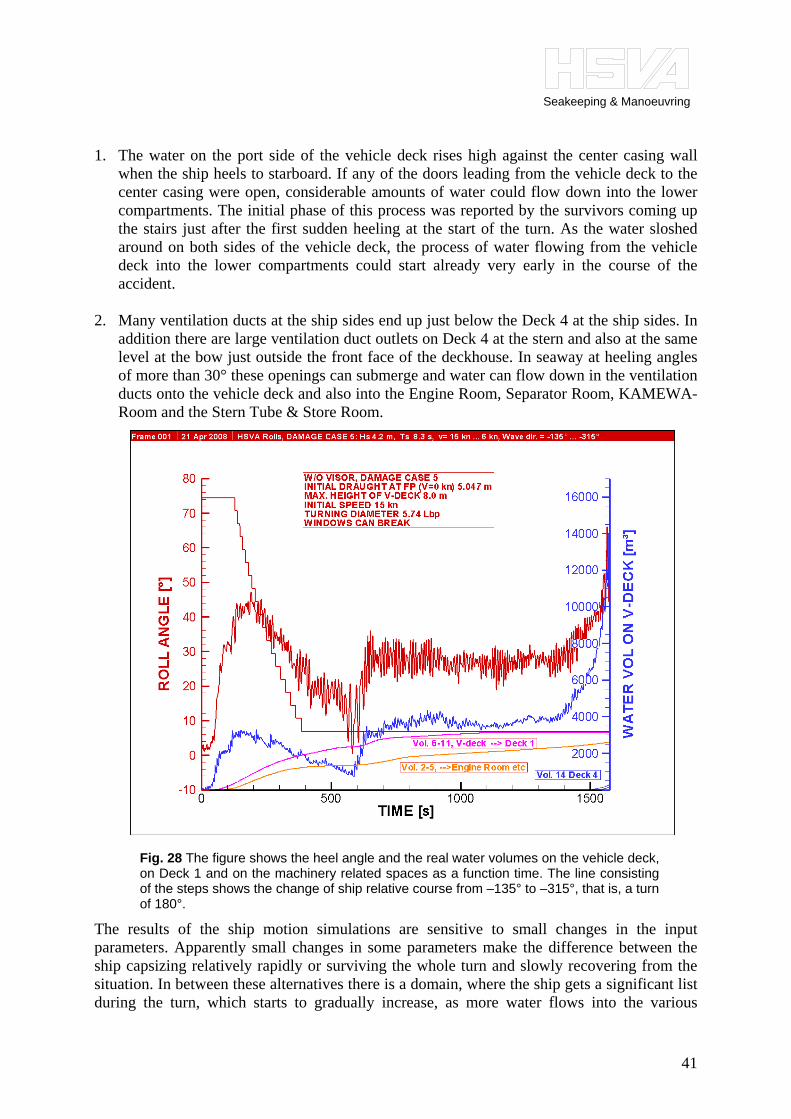
Seakeeping & Manoeuvring
41
1. The water on the port side of the vehicle deck rises high against the center casing wall
when the ship heels to starboard. If any of the doors leading from the vehicle deck to the center casing were open, considerable amounts of water could flow down into the lower compartments. The initial phase of this process was reported by the survivors coming up the stairs just after the first sudden heeling at the start of the turn. As the water sloshed around on both sides of the vehicle deck, the process of water flowing from the vehicle deck into the lower compartments could start already very early in the course of the accident.
2. Many ventilation ducts at the ship sides end up just below the Deck 4 at the ship sides. In
addition there are large ventilation duct outlets on Deck 4 at the stern and also at the same level at the bow just outside the front face of the deckhouse. In seaway at heeling angles of more than 30° these openings can submerge and water can flow down in the ventilation ducts onto the vehicle deck and also into the Engine Room, Separator Room, KAMEWA- Room and the Stern Tube & Store Room.
The results of the ship motion simulations are sensitive to small changes in the input parameters. Apparently small changes in some parameters make the difference between the ship capsizing relatively rapidly or surviving the whole turn and slowly recovering from the situation. In between these alternatives there is a domain, where the ship gets a significant list during the turn, which starts to gradually increase, as more water flows into the various
Fig. 28 The figure shows the heel angle and the real water volumes on the vehicle deck,on Deck 1 and on the machinery related spaces as a function time. The line consistingof the steps shows the change of ship relative course from –135° to –315°, that is, a turnof 180°.
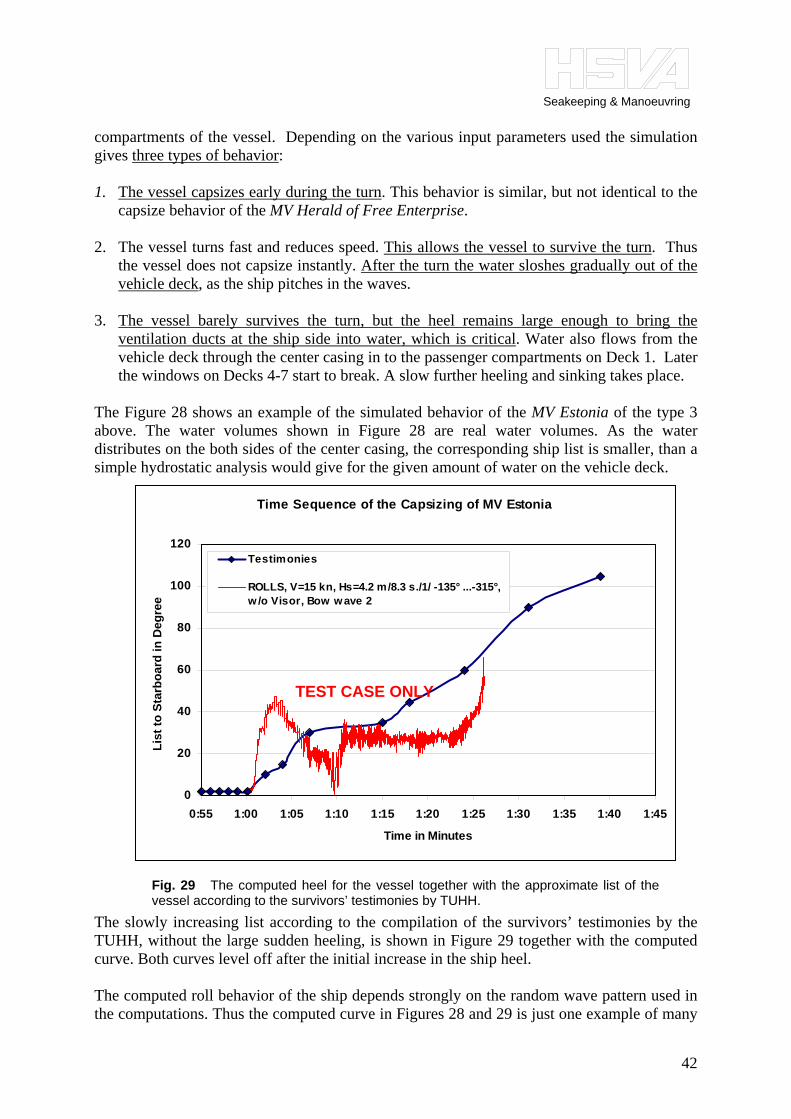
Seakeeping & Manoeuvring
42
compartments of the vessel. Depending on the various input parameters used the simulation gives three types of behavior: 1. The vessel capsizes early during the turn. This behavior is similar, but not identical to the
capsize behavior of the MV Herald of Free Enterprise. 2. The vessel turns fast and reduces speed. This allows the vessel to survive the turn. Thus
the vessel does not capsize instantly. After the turn the water sloshes gradually out of the vehicle deck, as the ship pitches in the waves.
3. The vessel barely survives the turn, but the heel remains large enough to bring the
ventilation ducts at the ship side into water, which is critical. Water also flows from the vehicle deck through the center casing in to the passenger compartments on Deck 1. Later the windows on Decks 4-7 start to break. A slow further heeling and sinking takes place.
The Figure 28 shows an example of the simulated behavior of the MV Estonia of the type 3 above. The water volumes shown in Figure 28 are real water volumes. As the water distributes on the both sides of the center casing, the corresponding ship list is smaller, than a simple hydrostatic analysis would give for the given amount of water on the vehicle deck.
The slowly increasing list according to the compilation of the survivors’ testimonies by the TUHH, without the large sudden heeling, is shown in Figure 29 together with the computed curve. Both curves level off after the initial increase in the ship heel. The computed roll behavior of the ship depends strongly on the random wave pattern used in the computations. Thus the computed curve in Figures 28 and 29 is just one example of many
Time Sequence of the Capsizing of MV Estonia
0
20
40
60
80
100
120
0:55 1:00 1:05 1:10 1:15 1:20 1:25 1:30 1:35 1:40 1:45
Time in Minutes
List
to S
tarb
oard
in D
egre
e
Testimonies
ROLLS, V=15 kn, Hs=4.2 m/8.3 s./1/ -135° ...-315°,w /o Visor, Bow wave 2
Fig. 29 The computed heel for the vessel together with the approximate list of thevessel according to the survivors’ testimonies by TUHH.
TEST CASE ONLY

Seakeeping & Manoeuvring
43
possible time-histories of the roll motion. The behavior is sensitive to the discharge ratios used in describing the flow through the various openings, see the Appendix 3. The ventilation ducts at the ship sides ending just below the Deck 4 play an important role on the heeling and sinking process by letting water into the compartments below the vehicle deck. Also the breaking of the side windows on Decks 4-7 is important, as it can result in gradual loss of buoyancy and righting moment during and after the turn. There are two main window types on the ship sides: The smaller windows 400 mm x 800 mm with glass thickness 10 mm, and larger windows 600 mm x 1500 mm also with glass thickness 10 mm. The failure criteria for these windows is given in Appendix 3. Figure 30 illustrates the order at which the windows break at the ship side: • Four large-window groups in the stern and middle on Decks 4-7 of the ship break before
the first small-window group in the middle of Deck 4 breaks. • All large-window groups in the stern and middle on Decks 4-7 of the ship break before the
first small-window group in the bow of Deck 4 breaks. • In this test case the windows do not break instantly, but take some time for the breaking
process. The order at which the windows break according to the simulations contributes to the vessel sinking at stern first.
The simulations of this final test case show altogether that it is well possible that the heeling and sinking process took approximately place as suggested in the JAIC Final Report, which, however, does not explain in detail how the heeling and sinking process could take place the way it did. Beside the open ramp letting water onto the vehicle deck: (1) Water on the vehicle deck could flow down onto Deck 1 through the center casing; (2) The ventilation ducts at the ship sides could let water into the spaces below the vehicle deck; (3) Windows on Decks 4-7 could break and let water in. No additional leaks or holes on the watertight hull were needed in the computations to obtain a ship behavior similar to that described by the survivors.
Fig. 30 The order the windows break in the simulations is shown with the coloredrectangles: First red, next orange, then yellow and green and at last blue.

Seakeeping & Manoeuvring
44
Pilot door It has been suggested by some interested parties that the pilot door on the starboard side could have been opened by the crew to let water out of the vehicle deck, and that the open pilot door could have contributed to the flooding of the vehicle deck. Therefore this detail was also included in the simulations and its effect was briefly investigated. It is, however, emphasized that the survivors’ testimonies do not report or suggest that the pilot door would have been open. One simulation with an open pilot door was carried out: When the heel is relatively small the pilot door can drain some water from the vehicle deck. If the ship heels over a large amount of water can flow in through the open pilot door, which in the simulated case resulted in the capsize of the vessel. This result is not in agreement with the known facts on the accident. Stern ramp The GGE (Holtappels and Hummel, 1999) suggests that the starboard stern ramp was kept slightly open by the crew in order to drain flood water from the vehicle deck already before the loss of the bow visor. In the survivors’ testimonies there is no direct information on this item. Some continuous hydraulic noise, which could not be turned off and reported by some survivors, has been interpreted by the GGE as a running hydraulic pump needed to keep the starboard stern ramp ajar (slightly open). One simulation with a stern ramp 1 m open was carried out: When the heel is relatively small the ajar stern ramp drained some water from the vehicle deck. If the heeling becomes large of course additional water can flow in through the slightly open stern ramp, which can speed up the heeling process. As the flow rates through a slightly open stern ramp are small, it is unlikely that the stern ramp could have significantly contributed into the accident. 2.8 CONCLUSIONS The investigation with the motion simulation of the damaged ship including the sloshing of water on the vehicle deck gives plausible explanations on the following issues: When water was sloshing on the vehicle deck, limited amounts of water could flow down
on to Deck 1 trough the front staircases in the center casing already at early phases of the accident. The sudden heel to starboard probably contributed to this.
In view of the water being able to flow from the vehicle deck down to Deck 1 at the early
phases of the accident, the assumption of damage deeper down on the hull as a cause for the water on Deck 1 appears superfluous.
The sudden heel is probably related to the start of the turn of the vessel initiated by the
officers on the bridge. The scenario of the visor and ramp being loose, let’s say both about 1 m open, is not likely
to be the main flooding scenario for the vehicle deck. The inflow rate appears to be too small for this. This implies that the visor dropped off relatively early and did not hang on the vessel until the ship heeled to near or over 90°.

Seakeeping & Manoeuvring
45
The main flooding of the vehicle deck probably took place, after the visor had dropped, either trough the completely open bow ramp or through the bow ramp at least about 1 m open, when the ship was turning.
The computations show that beside the water ingress through the open bow ramp there
must have been other openings letting water into the ship. When the flow through the side ducts ending just below Deck 4 and the flow from the vehicle deck into the center casing and further down onto Deck 1 were allowed, a ship behavior similar to the that of the MV Estonia, as known from the available evidence, could be hindcasted with the HSVA ROLLS. This speaks for the plausibility of the assumptions made.
The order at which the ship’s side windows break in the simulations probably contributed
to the ship sinking at stern first.
Seakeeping & Manoeuvring
46
3 Simulation of the Ship Motions and Flooding of the Vehicle Deck 3.1 Introduction After the simulation of the U-turn maneuver with speed reduction down to 6 kn as explained in Chapter 2.7 was successful, a few more complete “final cases” were investigated. It is assumed that the MV Estonia was advancing approximately at 15 kn in the direction of 287°, when the visor dropped off and pulled the ramp completely open. This is the starting point for the simulations. Based on survivors’ testimonies and the location of the items dropped from the MV Estonia on the sea bottom as shown in Figure 3, it is most likely that the vessel made a turn to port, heeled heavily to starboard and its speed slowed down. After the turn the vessel must have advanced and later drifted with a heavy list approximately into the direction of ENE (east-northeast) as the location of the items dropped from the vessel and that of the wreck on the sea bottom clearly show. The diameter of the turning maneuver is not exactly known. The simulations were started with two different diameters: (1) The diameter of the large turn is assumed to be 5.74 Lbp, and (2) that of the small turn is assumed to be 2.87 Lbp. The latter value can be considered as a realistic minimum turning diameter for the MV Estonia type of vessel of the building period in question (JAIC Suppl. No. 523). The relative wave direction is –135° before the vessel starts to turn, that is, the waves come at 45° from the port bow quarter. In all cases the significant wave height is 4.2 m and the significant wave period 8.3 s. JONSWAP-spectrum with a parameter γ having the value 3.3 was used to describe the sea state. See Appendix 4. The ship tracks were constructed based on the locations of the visor, the debris and the wreck on the seabed. The ship must have passed through or stopped very close to these points. The turning diameters used are in general based on the empirical data on vessels like the MV Estonia given by the JAIC Suppl. no. 523 and also SSPA (2007). The speed reduction of the ship is based on plausible engineering assumptions and also on SSPA (2007). The assumed drifting speeds due to wind, waves and current are empirical. When the initial ship speed is chosen, and the length of the track and the time spent on it are given, the leeway in defining the ship speed along the track is quite limited. The tracks are also results of the ship motions simulations: Most tracks shown in this chapter lead to ship behavior similar to that described by the survivors, whereas not all simulated tracks did this. 3.2 Ship Behavior on a Track having a Turning Diameter of 5.74 Lbp The track of the vessel is shown in Figure 31 and a corresponding time-history of the roll angle of the vessel is shown in Figure 32. The dots in the curve in Figure 31 show the points, where the vessel in the simulation changes direction. Between these points the vessel runs on a straight course. The speed dependent (continuous) centrifugal heeling and the effect of the centrifugal acceleration on the water on the vehicle deck are of course properly modeled in the simulation during the whole turning without any discontinuities. The simulation shows that the vessel continued approximately two minutes on a straight course assuming that the bow ramp was completely open. A clearly shorter time is not likely as the vessel would in this case survive. A clearly longer time would lead to a rapid capsize of the vessel, which did not take place. Many simulations were carried out with slightly varied
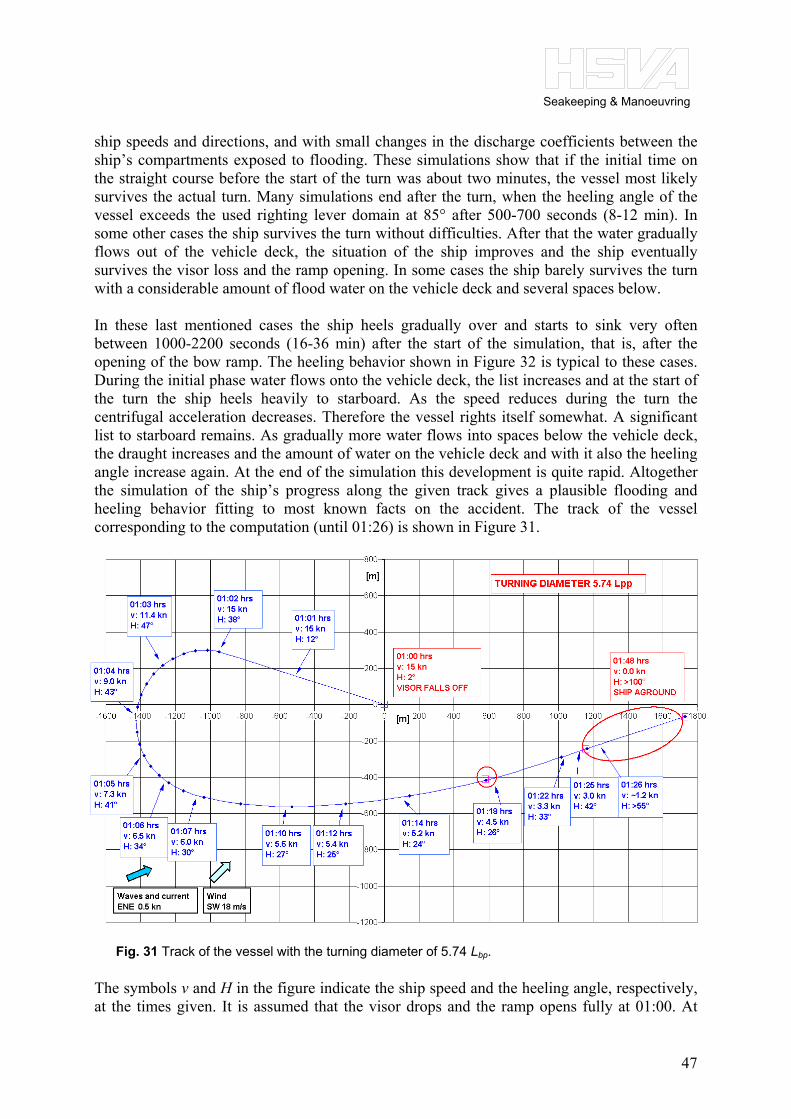
Seakeeping & Manoeuvring
47
ship speeds and directions, and with small changes in the discharge coefficients between the ship’s compartments exposed to flooding. These simulations show that if the initial time on the straight course before the start of the turn was about two minutes, the vessel most likely survives the actual turn. Many simulations end after the turn, when the heeling angle of the vessel exceeds the used righting lever domain at 85° after 500-700 seconds (8-12 min). In some other cases the ship survives the turn without difficulties. After that the water gradually flows out of the vehicle deck, the situation of the ship improves and the ship eventually survives the visor loss and the ramp opening. In some cases the ship barely survives the turn with a considerable amount of flood water on the vehicle deck and several spaces below. In these last mentioned cases the ship heels gradually over and starts to sink very often between 1000-2200 seconds (16-36 min) after the start of the simulation, that is, after the opening of the bow ramp. The heeling behavior shown in Figure 32 is typical to these cases. During the initial phase water flows onto the vehicle deck, the list increases and at the start of the turn the ship heels heavily to starboard. As the speed reduces during the turn the centrifugal acceleration decreases. Therefore the vessel rights itself somewhat. A significant list to starboard remains. As gradually more water flows into spaces below the vehicle deck, the draught increases and the amount of water on the vehicle deck and with it also the heeling angle increase again. At the end of the simulation this development is quite rapid. Altogether the simulation of the ship’s progress along the given track gives a plausible flooding and heeling behavior fitting to most known facts on the accident. The track of the vessel corresponding to the computation (until 01:26) is shown in Figure 31.
The symbols v and H in the figure indicate the ship speed and the heeling angle, respectively, at the times given. It is assumed that the visor drops and the ramp opens fully at 01:00. At
Fig. 31 Track of the vessel with the turning diameter of 5.74 Lbp.
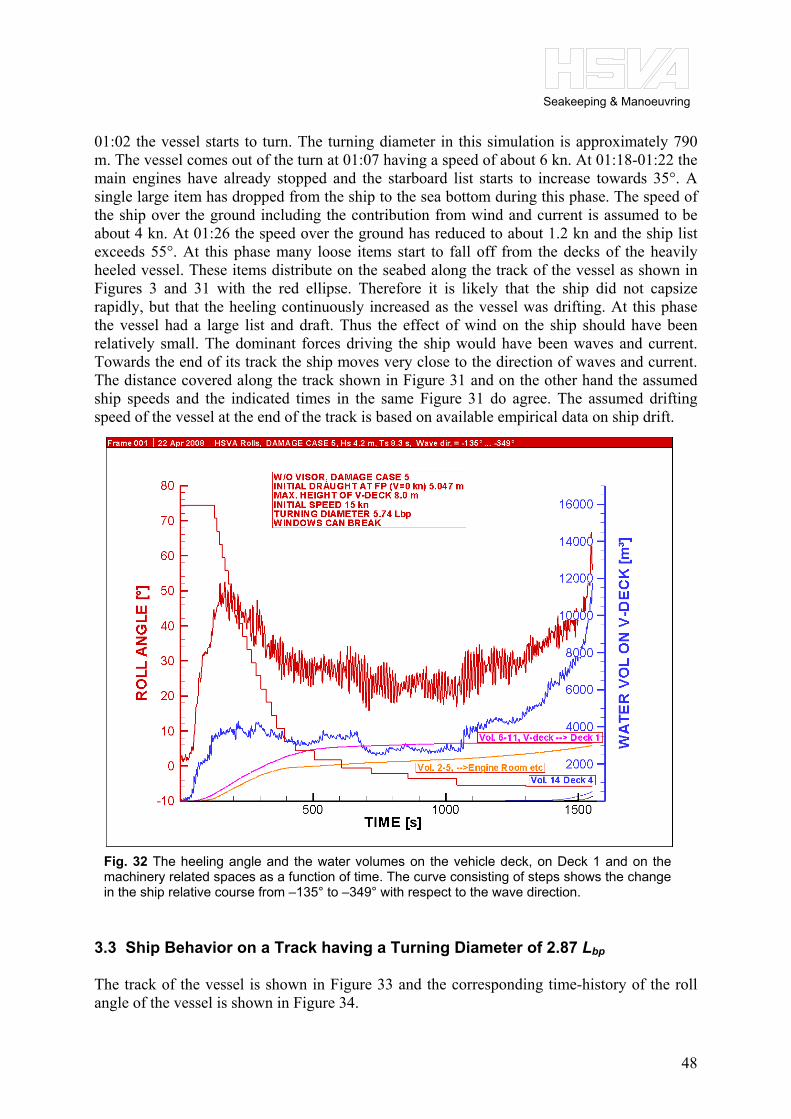
Seakeeping & Manoeuvring
48
01:02 the vessel starts to turn. The turning diameter in this simulation is approximately 790 m. The vessel comes out of the turn at 01:07 having a speed of about 6 kn. At 01:18-01:22 the main engines have already stopped and the starboard list starts to increase towards 35°. A single large item has dropped from the ship to the sea bottom during this phase. The speed of the ship over the ground including the contribution from wind and current is assumed to be about 4 kn. At 01:26 the speed over the ground has reduced to about 1.2 kn and the ship list exceeds 55°. At this phase many loose items start to fall off from the decks of the heavily heeled vessel. These items distribute on the seabed along the track of the vessel as shown in Figures 3 and 31 with the red ellipse. Therefore it is likely that the ship did not capsize rapidly, but that the heeling continuously increased as the vessel was drifting. At this phase the vessel had a large list and draft. Thus the effect of wind on the ship should have been relatively small. The dominant forces driving the ship would have been waves and current. Towards the end of its track the ship moves very close to the direction of waves and current. The distance covered along the track shown in Figure 31 and on the other hand the assumed ship speeds and the indicated times in the same Figure 31 do agree. The assumed drifting speed of the vessel at the end of the track is based on available empirical data on ship drift.
3.3 Ship Behavior on a Track having a Turning Diameter of 2.87 Lbp The track of the vessel is shown in Figure 33 and the corresponding time-history of the roll angle of the vessel is shown in Figure 34.
Fig. 32 The heeling angle and the water volumes on the vehicle deck, on Deck 1 and on themachinery related spaces as a function of time. The curve consisting of steps shows the changein the ship relative course from –135° to –349° with respect to the wave direction.

Seakeeping & Manoeuvring
49
Fig. 33 Track of the vessel with the turning diameter of 2.87 Lbp
Fig. 34 The heeling angle and the water volumes on the vehicle deck, on Deck 1 and on themachinery related spaces as a function time. The line consisting of the steps shows thechange of ship relative course from –135° to –349°.

Seakeeping & Manoeuvring
50
Fig. 35 The heeling angle and the water volumes on the vehicle deck, on Deck 1and on the machinery related spaces as a function time. The ship speed is about 1kn higher than in the previous Figure 34. The ship capsizes before it gets out of theturn.
Fig. 36 The heeling angle and the water volumes on the vehicle deck, on Deck 1and on the machinery related spaces as a function time. The ship speed is about0.5 kn lower than in Figure 34. The ship survives the turn and the water flows out ofthe vehicle deck.

Seakeeping & Manoeuvring
51
The simulation shows that the vessel continued approximately two and a half minutes on a straight course assuming that the bow ramp was completely open. As the turning diameter is smaller (2.87 Lbp) the vessel turns faster away from the waves and its speed reduces faster than in the previous case having a larger turning diameter. Therefore the time before the ship has to start to turn, in order to avoid capsize, can in this case be a little longer than in the case with the larger turning diameter. A clearly shorter time is not likely as the vessel would in this case survive. Many simulations show that if the initial time before the start of the turn was about two and a half minutes, the vessel most likely survives the actual turn. The behavior is altogether similar to the one along the track with the larger turning diameter. The behavior of the ship is sensitive to the speed during the turn. Figure 35 shows a simulation with the ship speed elevated about 1 kn: The ship capsizes before it gets out of the turn. Figure 36 shows the ship behavior when the speed is about 0.5 kn slower in the original case shown in Figure 34. The ship survives the turn and the time thereafter: The water on the vehicle deck flows gradually out as the slowly advancing vessel is pitching in waves coming from the starboard stern quarter or stern. These three types of behavior shown in Figures 34-36 were described already in Chapter 2.7. The modeling of the effects of the ship speed on the water ingress are explained in Appendix 3.
Another almost identical track as in Figure 33 is shown in Figure 37. The only difference is made by the slightly higher speeds, when the ship comes out of the curve. The corresponding time-history of the roll angle of the vessel is shown in Figure 38. In this case the ship survives about 9 minutes longer than in the very similar case shown in Figure 34.
Fig. 37 Track of the vessel with the turning diameter of 2.87 Lbp

Seakeeping & Manoeuvring
52
Figures 39a and 39b show screenshots of the flooding of the vehicle deck at different moments of time during the simulation corresponding to the case of the smaller turning diameter shown in Figures 33-34. It can be seen how the incoming water sloshes high against the front face of the center casing and flows onto both sides of the center casing starting from the bow.
Fig. 38 The heeling angle and the water volumes on the vehicle deck, on Deck 1 and on themachinery related spaces as a function time. The line consisting of the steps shows the change inthe ship relative course from –135° to –349°.
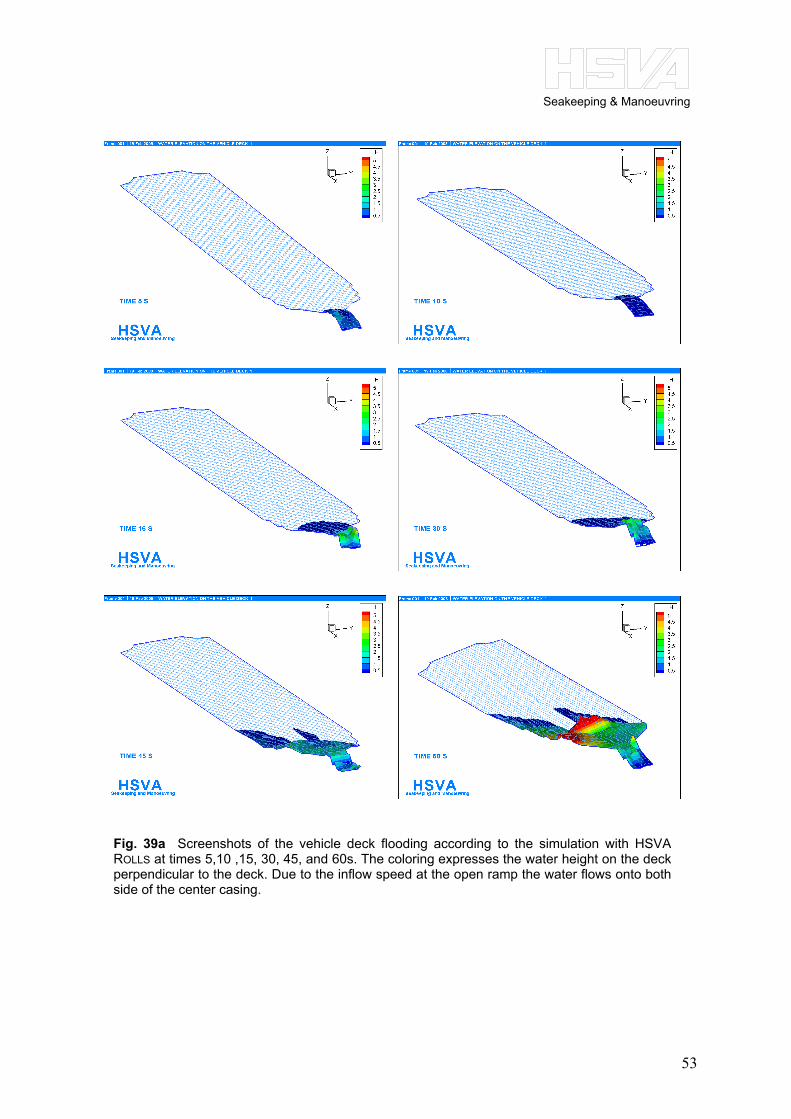
Seakeeping & Manoeuvring
53
Fig. 39a Screenshots of the vehicle deck flooding according to the simulation with HSVAROLLS at times 5,10 ,15, 30, 45, and 60s. The coloring expresses the water height on the deckperpendicular to the deck. Due to the inflow speed at the open ramp the water flows onto bothside of the center casing.

Seakeeping & Manoeuvring
54
Fig. 39b Screenshots of the vehicle deckflooding according to the simulation withHSVA ROLLS at times 90, 120, 180, 240, 300,360 and 400 s. The coloring expresses thewater height on the deck perpendicular to thedeck.

Seakeeping & Manoeuvring
55
3.4 Ship Behavior with Drift and Cargo Shift 3.4.1 The HSVA –TUHH scenario After the previous cases two additional factors influencing the case were included in the ship motion simulations: (1) The whole vehicle deck cargo of 1100 tons is assumed to shift laterally 0.4 m to starboard. (2) The drifting of the vessel due to wind, waves and current. Three cases were simulated: two with the initial speed of 15 kn and one with the initial speed of 14.4 kn. Lower initial speeds did not result in time histories of roll similar to the one described by the survivors. The two curves with initial speed 15 kn show only small differences in ship course and speed.
Figures 40 and 41 present one of the cases with initial speed 15 kn. Figure 42 shows the time history of heel for the case with lower initial speed of 14.4 kn. The track of the vessel for the latter is not shown, but does not essentially deviate from the one for the higher speed shown in Figure 41. Figure 43 shows the three computed time-histories of the ship heel together with three curves showing the development of the ship’s list as a function of time based on the survivors’ testimonies. The lowest one is the JAIC-curve, the two upper curves are the HSVA- and the TUHH-curves. The difference between these two latter ones is that in the HSVA-curve the sudden large heel in the very beginning of the time-history is included. In addition the HSVA-curve rises somewhat steeper at the very end.
Fig. 40 The heeling angle and the water volumes on the vehicle deck, on Deck 1and on the machinery related spaces as a function time. The shift of cargo and shipdrifting are included in the simulation. The initial speed is 15 kn.

Seakeeping & Manoeuvring
56
Fig. 42 The heeling angle and the water volumes on the vehicle deck, on Deck 1and on the machinery related spaces as a function time. The shift of cargo and shipdrifting are included in the simulation. Initial speed 14.4 kn.
Fig. 41 Track of the vessel. The ship drift due to wind, waves and current is shown.
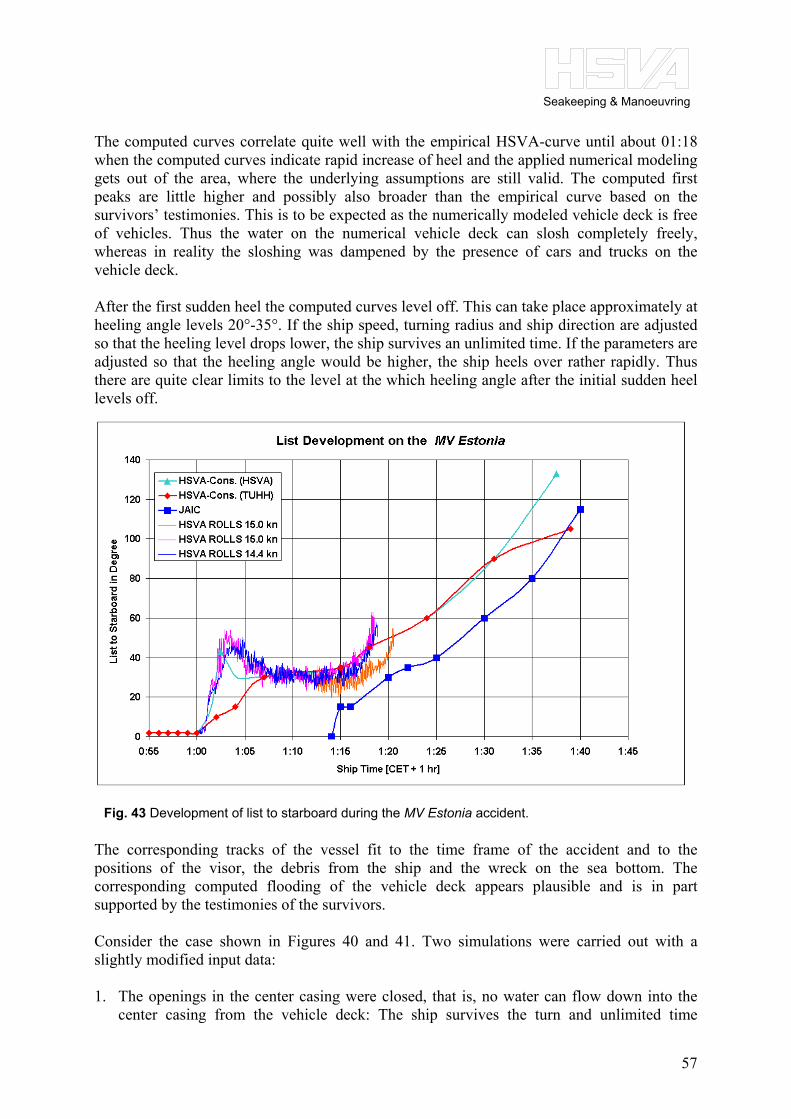
Seakeeping & Manoeuvring
57
The computed curves correlate quite well with the empirical HSVA-curve until about 01:18 when the computed curves indicate rapid increase of heel and the applied numerical modeling gets out of the area, where the underlying assumptions are still valid. The computed first peaks are little higher and possibly also broader than the empirical curve based on the survivors’ testimonies. This is to be expected as the numerically modeled vehicle deck is free of vehicles. Thus the water on the numerical vehicle deck can slosh completely freely, whereas in reality the sloshing was dampened by the presence of cars and trucks on the vehicle deck. After the first sudden heel the computed curves level off. This can take place approximately at heeling angle levels 20°-35°. If the ship speed, turning radius and ship direction are adjusted so that the heeling level drops lower, the ship survives an unlimited time. If the parameters are adjusted so that the heeling angle would be higher, the ship heels over rather rapidly. Thus there are quite clear limits to the level at the which heeling angle after the initial sudden heel levels off.
The corresponding tracks of the vessel fit to the time frame of the accident and to the positions of the visor, the debris from the ship and the wreck on the sea bottom. The corresponding computed flooding of the vehicle deck appears plausible and is in part supported by the testimonies of the survivors. Consider the case shown in Figures 40 and 41. Two simulations were carried out with a slightly modified input data: 1. The openings in the center casing were closed, that is, no water can flow down into the
center casing from the vehicle deck: The ship survives the turn and unlimited time
Fig. 43 Development of list to starboard during the MV Estonia accident.

Seakeeping & Manoeuvring
58
thereafter. Relatively little water flows initially onto the vehicle deck. Already during the turn most of the water flows gradually out of the vehicle deck. As the ship heeling keeps relatively low, also no significant amount of water flows in through the ventilation ducts at the ship sides.
2. All ventilation ducts on the ship sides leading onto the vehicle deck and into the spaces
below, and usually ending just below the Deck 4 were closed, whereas the water on the vehicle deck could flow into compartments below through the openings in the center casing. In this case the ship develops a large sudden heel during the turn, but survives the turn and thereafter. The water on the vehicle deck starts to flow out as the ship turns.
These simulations with the small modifications in the input data indicate that the vessel would have had better chances to survive: • If the fire doors in the center casing would not have let water from the vehicle deck into
the center casing and further down into the compartments below the vehicle deck. • If the ventilation ducts at the ship side would not have let water onto the vehicle deck and
into the engine room related spaces below the vehicle deck Thus the water flow down into the center casing from the vehicle deck and the flow through the side ducts into the spaces below the vehicle deck contributed to the loss of the MV Estonia.
Fig. 44 The heeling angle and the water volumes on the vehicle deck, on Deck 1 andon the machinery related spaces as a function time. The shift of cargo and ship driftingare included in the simulation. Initial speed 15.5 kn. The initial course of the ship is255°.

Seakeeping & Manoeuvring
59
3.4.2 The JAIC scenario According to the JAIC the visor dropped off at 01:14, that is, 14 minutes later than assumed in this study. It can be questioned under which conditions it is possible for the ship to reach the wreck position at about 01:40 during the available time. In the HSVA computations the vessel needs about 2-3 minutes on a straight track with speed 15-14.4 kn to get a necessary volume of water onto the vehicle deck in order to result in a ship behavior as described by the survivors. For the JAIC-scenario to be valid the ship has to run the turn and thereafter at relatively high speed. In addition to the drifting speed due to wind, waves and current should be at least 1.5 kn during the whole available time, also when the ship is already deep in the water heeled over 90° and provides only a small smooth part of the underwater hull for the wind to take action on. Based on the considerations on the initial speed of the vessel on the track, the drifting speed, and the available time between 01:14 and 01:40, the JAIC`s starting time 01:14 can perhaps not be closed out, but it can be considered to be less plausible than the earlier starting time at 01:00, which leaves more time for the development of the accident. 3.4.3 Other initial directions The survivors’ testimonies contain very little accurate information about the course of the ship just before and during the accident. All previous cases above were computed using the initial course of 287°, which corresponds to a normal route of the MV Estonia towards Stockholm.
Also another more northern route has been suggested for the MV Estonia after the accident, even if the survivors’ testimonies and other available material on the course of the MV Estonia do not support this. This route could imply that the MV Estonia was traveling
Fig. 45 Track of the vessel. Also the ship drift due to wind, waves and current is shown.

Seakeeping & Manoeuvring
60
approximately towards west or west-southwest. For this reason one case with the initial course of 255° was computed. The results are illustrated in Figures 44 and 45. With this initial course the ship needs a higher speed of 15.5 kn for about three minutes on the straight track and thereafter a relatively large to turn also with relatively high speed for the water ingress on the vehicle deck to be sufficient to cause a high heeling angle. Even though the initial speed is higher than in the previous cases the development of the first sudden heel takes longer, about 4-5 minutes. This does not correspond very well with the descriptions by the survivors. From the point of view of the simulated results this scenario with an initial course of 255° would be possible, but less likely than the case with the initial ship course of 287°. There is, however, no reason to assume that the ship initial course deviated essentially from the mentioned 287°.
RAPID WATER INGRESS, WHEN WAVES COME FROM PORT SIDE STERN QUARTER
Fig. 46 The heeling angle and the water volumes on the vehicle deck, on Deck 1 andon the machinery related spaces as a function time. The shift of cargo and ship driftingare included in the simulation. Initial speed is 15.0 kn. The shorter curves show thebehavior when the ship turns to starboard, the finer and longer curves show thebehavior when it turns to port. Each step in the additional curve describes a 10 °change in the ship’s course.
STB TURN WAVE DIR. < 45° FROM THE STERN
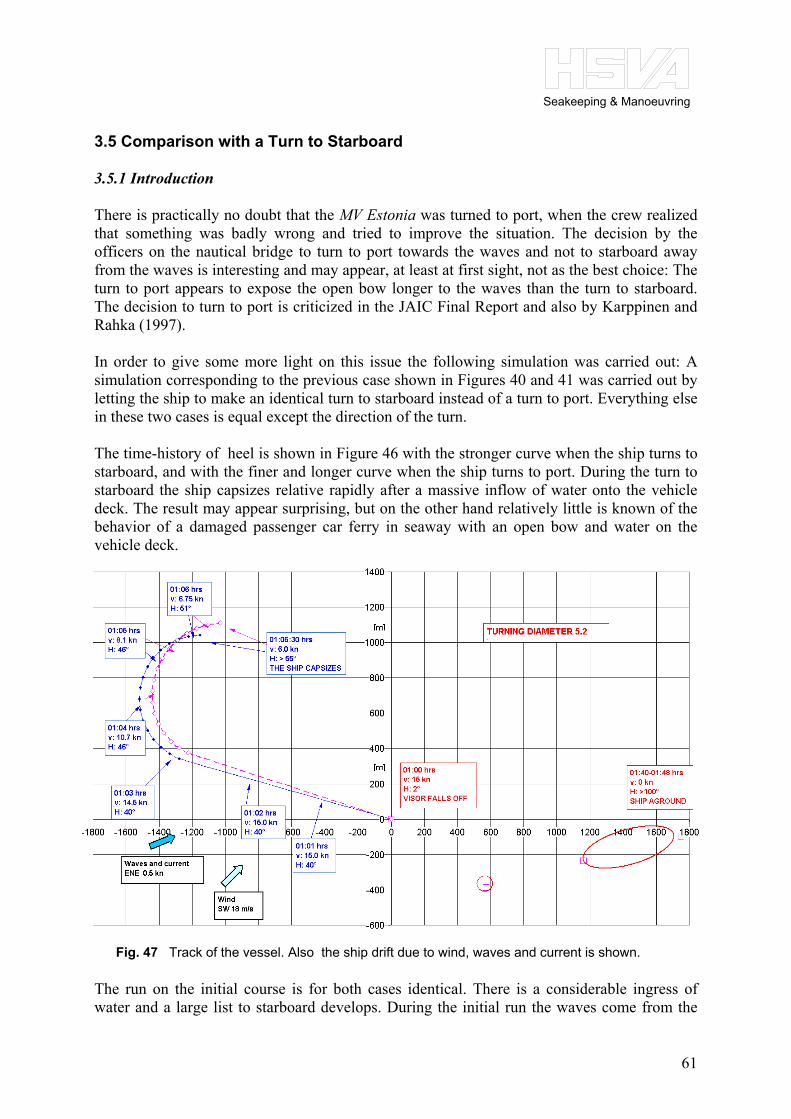
Seakeeping & Manoeuvring
61
3.5 Comparison with a Turn to Starboard 3.5.1 Introduction There is practically no doubt that the MV Estonia was turned to port, when the crew realized that something was badly wrong and tried to improve the situation. The decision by the officers on the nautical bridge to turn to port towards the waves and not to starboard away from the waves is interesting and may appear, at least at first sight, not as the best choice: The turn to port appears to expose the open bow longer to the waves than the turn to starboard. The decision to turn to port is criticized in the JAIC Final Report and also by Karppinen and Rahka (1997). In order to give some more light on this issue the following simulation was carried out: A simulation corresponding to the previous case shown in Figures 40 and 41 was carried out by letting the ship to make an identical turn to starboard instead of a turn to port. Everything else in these two cases is equal except the direction of the turn. The time-history of heel is shown in Figure 46 with the stronger curve when the ship turns to starboard, and with the finer and longer curve when the ship turns to port. During the turn to starboard the ship capsizes relative rapidly after a massive inflow of water onto the vehicle deck. The result may appear surprising, but on the other hand relatively little is known of the behavior of a damaged passenger car ferry in seaway with an open bow and water on the vehicle deck.
The run on the initial course is for both cases identical. There is a considerable ingress of water and a large list to starboard develops. During the initial run the waves come from the
Fig. 47 Track of the vessel. Also the ship drift due to wind, waves and current is shown.

Seakeeping & Manoeuvring
62
port bow quarter (45 ° from bow, 135° from stern). See the track of the vessel in Figure 41. In both cases the cargo shift takes place towards starboard. The vertical black line in Figure 46 shows the point at which the ship has turned 90° from its original course. At this point the waves come for the starboard turn from the port stern quarter and for the turn to port from the starboard bow quarter, as shown in Figure 41. 3.5.2 Turn to starboard The centrifugal acceleration has a tendency to balance the ship, that is, to reduce the large initial list to starboard. This effect decreases very rapidly as the ship speed slows down in the turn. Already when the ship has turned 45° it is in beam seas with the waves coming from the port side. The ship speed is still considerable. The pitching motions of the ship are small, and the water ingress is a little larger than in the turn to port side. After the ship has turned about 90° to starboard, away from the waves, these come from the port stern quarter and the water ingress grows very rapidly in comparison with the turn to port. The length of the waves having the wave period of 8.3 s is about 107.6 m. The ship length between perpendiculars Lbp is 137.4 m. When the waves come at 38.5° from the stern the ship length and the wave length along the ship waterline match perfectly. The ship’s encounter period with waves is relative large, and the pitching motions are small. 3.5.3 Turn to port The centrifugal acceleration has a tendency to increase the heeling angle, which can be seen in Figure 46 just after the ship has started to turn. Notice that the associated water ingress is slightly lower than when the ship turns to starboard. When the ship has turned 45°, it is in head seas. The ship speed is still considerable. The pitching motions of the ship are large, and the water ingress is lower than in the turn to starboard. The pitching motions have a tendency to reduce the water on the vehicle as some water flows easier out. At the black vertical line in Figure 40 the ship has turned 90° and the waves come from the starboard bow quarter and somewhat later from the starboard beam. Now with lower speed the water ingress is relatively small. 3.5.4 Discussion The water ingress on the vehicle deck is dominated directly by the inflow speed of the water onto the deck, which is approximately equal to the ship speed. The orbital velocity of the water particles is relatively small in comparison with the ship speed. In addition the draft of the ship including the trim and sinkage and the height of the bow wave, which all depend ship speed, strongly influence the water ingress (see Appendix 3). Further the ship motions and the righting lever in waves depend on the direction of the ship in waves. These influence also the behavior of the water on the vehicle deck.

Seakeeping & Manoeuvring
63
When the ship turns to starboard the open bow gets faster “away from the waves”, which means that the inflow speed is about only the speed of the ship. When the ship turns to port and faces the waves directly from the bow, the inflow speed is the speed of the ship added with the average orbital velocity of the waves above the vehicle deck level. This difference is quite small and it is not modeled with HSVA ROLLS, but in principle it favors the turn to starboard. The turn to port brings the ship into head seas, which leads to larger pitching motions than the turn to starboard. This appears to result in lower total water ingress. This is the most likely reason why in this case the turn to port appears to be safer. Thus in this particular case the advantage to have the waves from the bow outweighs the disadvantage of having to turn longer before reaching a relatively safe situation of having the waves from the side together with a slow speed. This individual example should not be generalized, but on the basis of the computations it can be said that it is not at all clear that the MV Estonia should have turned to starboard instead of turning to port, like it probably did, in order to save the ship. There is very little reliable information available, empirical or computed, how to best handle a damaged ship in seaway, when there is plenty of water on the open vehicle deck. This does not change the fact that a turn into starboard until the ship is in beam seas and no further together with a rapid reduction of speed would appear to be a very plausible way to improve the situation of the vessel. 3.6 Conclusions A sufficiently high initial speed is needed to cause a sufficient amount of water to flow
onto the vehicle deck and the first sudden heel to appear in the simulated ship roll motion. The speed of 14.2 kn or higher was needed in the computations with the program HSVA ROLLS to cause the first sudden heel to appear.
In the simulations the ship gets a significant heel to starboard due to the water flowing
on the vehicle deck already before the ship has started its turn. The simulations show that the vessel continued approximately 2 - 3 minutes on a
straight course after the ramp had opened completely, as assumed in this study. After the mentioned 2-3 minutes the vessel must have turned away from the waves and
reduced speed. Otherwise it would have capsized. In the simulations with different turning diameters the ship was running on the initial
straight course between 2 and 3 minutes, before the turning started. If the times on the initial straight course were set longer, the amount of water on the vehicle deck increased and the ship capsized quite rapidly, if shorter, less water flowed in and the ship survived. These time values show the tremendous vulnerability of a vessel like MV Estonia to a serious damage exposing the ship’s vehicle deck to open seas: The difference between a rapid capsize and survival can be as low as about 30 seconds on the initial course and speed with the ramp open.
Seakeeping & Manoeuvring
64
The maximum time on the initial course before the turn depends on the initial inflow. If the ramp has been moving up and down during this phase, as suggested by the SSPA (2007) model tests, the time on the straight course can somewhat increase or decrease, but nothing fundamentally changes.
The time-histories of the heeling angle shown in the figures have a high peak just in the
beginning, as the ship speed is high, the vessel starts to turn, and there is already water on the vehicle deck. This high heeling value is caused by at least three factors: (1) The turning of the vessel; (2) the chosen random wave pattern realization; (3) the amount of accumulated water on the vehicle deck. The generated wave pattern has influence, as the ship with the open ramp meets only about 15-25 waves until it has to start to turn away. This is a small number. Thus neither the computed water ingress during this time is independent on the random seed used, nor was the water ingress onto MV Estonia’s vehicle deck independent on the random waves it happened to meet on its last voyage.
According to the simulations the water appears to flow onto both sides of the long
center casing. Thus the dynamic water distribution on the vehicle deck is more balanced than a classical hydrostatic analysis would give, in which all water would accumulate strictly on the lowest area of the deck, that is, to the starboard side of the vessel. If the water is distributed on both sides of the center casing, the list caused by a given amount of water is in reality somewhat smaller than what a classical hydrostatic analysis would give.
In the simulations we have assumed certain discharge coefficients and certain flow
patterns, e.g. from vehicle deck to the spaces below through the openings in the center casing. It can well be discussed how much water flowed through the ventilation ducts at the ship sides onto the vehicle deck, how much into the spaces below the vehicle deck ( e.g. engine room spaces), and how much water flowed from the vehicle deck through the center casing into the spaces below. It is beyond the financial framework of this study to model all possibilities exhaustively. There is, however, little doubt that water flowed into the spaces below the vehicle deck, most likely both through the ventilation ducts at the ship sides and from the vehicle deck through the openings in the center casing at the vehicle deck level. Otherwise the modeled behavior of the ship correlating quite well with the survivors testimonies would not have taken place as described.
The Figures 32, 34, 36, 38 and 40 show also how the spaces below the vehicle deck fill.
These spaces are divided into two groups: (1) Pax Compartments and the Proviant Room, which can be flooded by the water on the vehicle deck via the openings in the center casing; (2) The Engine Room itself and related spaces, which can be flooded by ventilation ducts on the ship sides. As there is water sloshing on the vehicle deck almost from the very start of the accident, also the group 1 compartments below the vehicle can have a considerable water ingress via the center casing relatively early during the course of the accident. The Engine Room related spaces can be flooded only via the ventilation ducts on ship sides. The outlets of these ducts are located just below Deck 4 and enter water only when the ship has a considerable heeling angle. The ingress of water to the Engine Room related spaces is therefore likely to start later and is somewhat slower than to the spaces flooded by water entering from vehicle deck via the center casing.

Seakeeping & Manoeuvring
65
The water flow down into the center casing from the vehicle deck and the flow through the side ducts into the spaces below the vehicle deck contributed to the loss of the MV Estonia.
In his testimony the passenger P76 describes how the window just outside the Karaoke
Bar on Deck 5 was partly submerged during the sudden initial heel. The simulations show this also. This implies that (1) The ventilation duct openings at the ship side just below the Deck 4 had a hydrostatic pressure head of more than 3 m; (2) The large windows on Deck 4 were loaded near to their estimated breaking load.
The absolute breaking load of the windows could be estimated only crudely. Thus the
moment of time the windows break is not very accurate. As, however, the larger windows are structurally much weaker than the smaller windows, it is very clear that when the vessel heels to the side and the windows immerse, the larger windows break first. As the larger windows are located in the stern and middle of the ship this fact contributes to the vessel sinking stern first.
The chosen initial speed (~15 kn) sets a limit to the length of the track traveled by the
ship between the assumed time of the visor drop ~01:00 and the time of sinking ~01:48. The location of the visor, those of the various items dropped from the vessel and that of the wreck define the points at which the vessel must have passed or stopped at. Therefore the vessel must have had a track very similar to those shown in Figures 31, 33, 37 and 41.
Items that dropped from the ship distributed along the track of the vessel as shown with
the red ellipse in Figure 3, and in all figures showing the ship’s track. Therefore it is likely that the ship did not heel over rapidly, but that the heeling continuously increased as the vessel was drifting.
The computed results: ship motion, flooding of the vehicle deck, flow of water into
compartments below, the time spent on the track fit quite well to the survivors’ testimonies and other known facts on the accident. Therefore it is not likely that the MV Estonia accident scenario would have been essentially different than the one modeled numerically here.
In view of the available time between the start of the accident with the ramp opening
and the grounding and final sinking at 01:40-01:48, the starting time of the JAIC scenario (01:14) appears less likely than the earlier time of 01:02, as the time available for the development of the accident and the transit along the most likely ship track are with the JAIC starting time perhaps too short.
Based on the numerical simulations it is unlikely that the MV Estonia could have turned
to starboard. Based on the numerical simulations the MV Estonia could also have had a initial course
just before the accident of about 255°. The development of the ship heel does not correspond well as with the survivors’ testimonies as the one obtained with the initial course of 287°.

Seakeeping & Manoeuvring
66
4 Later Phases of the Sinking Sequence 4.1 Introduction In the framework of this project the TUHH carried out preliminary hydrostatic analysis and a pre-selection of the accident scenarios before the HSVA carried out more detailed simulations of the ship motions together with the simulation of the flooding of the vehicle deck with the program HSVA ROLLS. This latter modeling is not anymore very accurate at larger heeling angles in excess of about 50-60°. At this point the ship has already a considerable amount of flooding water on the vehicle deck and in other compartments, which provide a large hydrodynamic damping to ship motions. For these reasons the later phases of the sinking sequence were investigated hydrostatically. This should be accurate enough as the hydro-dynamic effects on the ship motions play a minor role in the later phases of the sinking process. This chapter deals with the hydrostatic modeling of the later phases of the sinking sequence by TUHH with the program ARCHIMEDES II and is directly based on the TUHH-report by Krüger and Kehren (2008). The TUHH investigations were planned and carried out fully independently. Also different methods and programs were used by the HSVA and the TUHH. If and when the TUHH- and HSVA- results match, this is a result of correct modeling of the physics related to the sinking of the MV Estonia, not of fitting any results together. 4.2 Calculation Procedure The preliminary hydrostatic analysis by TUHH showed clearly that water on the vehicle deck is a key-factor in the sinking sequence of the MV Estonia. The time the water entered the vehicle deck was between 01:00 and 01:02 hours Estonian time. The beginning of the calculations of the sinking sequence is set to 01:00 Estonian time. Would the beginning be one or two minutes later, the whole sinking sequence would start later according to this time offset. One result of preliminary hydrostatic analysis was that most likely a mass of more than 1500 tons of water on the vehicle deck caused a hydrostatic list of about 30°. In this second part of the TUHH investigation the focus is on the later phases of the sinking sequence of the MV Estonia, starting from the quasi-static equilibrium floating condition at the list of little more than 30°. Each calculation step corresponds to a time step, mostly with an increment of 30 seconds. For each time step of the sinking sequence of the vessel, the momentary equilibrium floating condition is calculated by the added mass method. Based on the determined inflow rates of a flooded compartment or group of compartments, the filling level of these compartments is calculated, which results in an additional mass. During the calculation procedure, the fluid in the compartments is allowed to move freely, until a final equilibrium with respect to draft, trim and heel is reached. The calculation procedure is based on the algorithm ARCHIMEDES II originally developed by Prof. Söding at the former Institut für Schiffbau, Universität Hamburg, where also additional algorithms have been programmed to handle large scale flooded compartments. The advantage of using this software package instead of commercially available codes lies in the fact that one has a
Seakeeping & Manoeuvring
67
full access to the FORTRAN source code, which allows additional features to be programmed, if required, and a direct check whether the computed equilibrium conditions are fully converged and therefore realistic. The hydrostatic moments related to the partly filled tanks are included in the determination of the hydrostatical stiffness matrix. Before the iteration of the equilibrium floating condition starts, the initial masses of all partly flooded (or filled) compartments are determined, and the initial condition is treated like a fixed mass item in the load case weight data. During each step of the iteration, the filling levels of all partly filled compartments are computed based on the momentary values of trim and heel. For these momentary filling levels the fluid hydrostatic moments with respect to all three coordinates x, y, z are determined. These moments are then summed up for all elements of the hydrostatical stiffness matrix. A three-dimensional Newton-iteration, which starts with guessed initial values for draft, trim and heel, is then used to find the equilibrium floating condition. The equilibrium floating condition is defined by the difference between solid masses and moments and hydrostatical masses and moments being close to zero (0.001m for draft, 1.0E-5 rad for trim and 2.0E-5 rad for heel). Once the equilibrium floating condition has been determined, the hydrostatic stiffness matrix is calculated for this floating condition. This is done by computing the derivatives of masses and moments with respect to small alterations in draft, trim and heel in all relevant combinations. Whenever these derivatives are computed, all hydrostatic moments in all compartments are accurately accounted for. In the second step after the determination of the equilibrium floating condition, the righting levers are computed for a given heel, but on a free trimming basis, where also the fluid is allowed to move freely in all partly filled tanks or compartments. Based on the equilibrium floating condition, the actual freeboard of all relevant openings, both external and internal, with respect to the relevant fluid level, either outside ship or the actual compartment filling, is determined. This allows the computation of the actual pressure level on that opening and the filling stage for the next step. The application of the lost buoyancy method, which is typically preferred for damage stability calculations, is not applicable for this type of problem, where intermediate stages of flooding have to be determined. As the added mass method is used throughout the whole calculation procedure, care should be taken that all righting or trimming levers, metacentric heights etc. do actually refer to the momentary values of the ship’s mass. The whole calculation procedure is based on algorithms, which are used in similar calculations of intact and damage stability problems, and which have already been approved by several statutory authorities. The following calculation procedure is adopted for the sinking process of the MV Estonia:
• Calculate the freeboard of all relevant openings that lead to a further flooding, either with respect to the sea surface outside the ship or to an internal fluid level for a momentary floating condition given by draft, trim and heel.
• Calculate the pressure height and the inflow rate into the flooded compartment(s).
Seakeeping & Manoeuvring
68
• Calculate the momentary filling for all momentarily flooded compartments and the actual amount of water in these compartments for the next time step. It may be possible that a compartment is now 100% filled or a new compartment may additionally be flooded.
• For the assumed filling condition of all compartments involved in the momentary time
step, calculate the momentary equilibrium floating condition, the hydrostatic stiffness matrix and additionally, the righting levers. The momentary equilibrium in trim is determined allowing all fluids to move freely.
• For this floating condition, the freeboards of the relevant openings are determined
again and the next iteration step is performed. The procedure starts from the submergence of the first opening until a final sinking of the MV Estonia can be assumed.
The inflow-rates of water through the ventilation ducts, the collapsed windows and doors and in the final stage as well through the bow-opening is calculated with the Torricelli Theorem as follows
2 cos( ) ,m A ghρμ ϕ= (1) in whichρ is the density of sea water, here 1.004 t/m³. The 0.59 ,dvoμ ϕ ψ= = where 0.9656dvoϕ = , which is the decrease of velocity at outflow.
,2
SA with AA
πψ ψπ
= → ∞ ⇒ =+
where AS is the cross sectional area of the inflow (jet), A the cross sectional area of the opening (orifice), g the acceleration of gravity, h the vertical difference of outside to inside water level, at first inflow in ventilation ducts the vertical distance from inflow to outlet, and φ the heeling angle; only used at first inflow of ventilation ducts, otherwise left out. In the following hydrostatic calculations, the hydrostatic model is modified compared to the model used in the preliminary analysis: In this investigation the bow visor is removed from the model and subtracted from the mass distribution of the light ship weight. The longitudinal center of gravity of the bow visor is assumed to be at 140.2 m from the After Perpendicular (AP), and the mass of the bow visor is assumed to be 60.0 tons according to the JAIC Final Report. Other technical details influencing the sinking sequence, like the window and door collapse loads, the arrangement of the ventilation ducts, the cargo shift etc. can be found in the TUHH-report by Krüger and Kehren (2008). In the later phase of the sinking, especially in the compartments below the vehicle deck, the situation of entrapped air needs to be considered. The water ingress in compartments, which have entrapped air, will not stop completely, but it will compress the air in the compartment

Seakeeping & Manoeuvring
69
depending on the hydrostatical pressure at the opening of inflow. In order to calculate the possible amount of water flowing into a compartment having entrapped air is calculated according to the gas law of Boyle-Mariotte. By an isothermal assumption of the situation during the sinking of the MV Estonia, the volume decreases proportionally to the increasing pressure, with:
12 1
2
,pV Vp
= (2)
where V1 is the volume of entrapped air at the moment of the air lock, V2 the final volume of entrapped air at considered time step. p1 is the pressure of entrapped air at the moment of the air lock, and p2 final pressure of entrapped air at the considered time step. With these calculation procedures a quasi-static approach is used to calculate the later phases of the sinking sequence. 64 calculation steps were used with a time-increment of 30 seconds to model the later phases of the sinking process. The calculations were carried out for calm water. 4.3 Ventilation Ducts 4.3.1 General The ventilation system of the MV Estonia has a major influence on her sinking sequence. From this point of view it can be divided into three main parts: (1) the ventilation of the vehicle deck, (2) the ventilation with air intake at the vessel’s sides just below Deck 4, and (3) the ventilation through the center casing. A detailed description of all ventilation ducts modeled can be found in the TUHH report by Krüger and Kehren (2008). All watertight (WT) doors below the vehicle deck were closed. All doors leading from the vehicle deck to the center casing were assumed to be closed. 4.3.2 Ventilation of the vehicle deck An important part of the ventilation of the vehicle deck is carried out by the aft and front wing houses on both sides of the vessel. Each wing house has four large ventilation pipes in it. All pipes have a diameter of 1131 mm, which yields a cross-sectional area of 1.0 m² for each pipe. These pipes can also be seen in Figures A10-A12 in Appendix 3, which show the openings modeled in the HSVA ROLLS simulations. Between the frames 55 and 56, 80 and 80a, 80a and 80b, 89 and 90, respectively, there are additional air intakes installed on both sides of the ship. Each of these ducts has a cross sectional area of 0.16 m². The aft wing house of the MV Estonia is connected to the vehicle deck through a wire mesh door, which does not form a barrier for water flow. Thus water can easily flow into the aft wing house from the vehicle deck. The ventilation duct, which supplies the aft wing house and the steering gear room with fresh air, separates 2.1 m above the vehicle deck level into a

Seakeeping & Manoeuvring
70
part for the wing house ending at the level of the separation, and into a part for the steering gear room. The cross-sectional area of the duct ending in the steering gear compartment is 0.07 m². At an advanced stage of the flooding water on vehicle deck reaching the height of about 2.1 m in the wing house can flow from vehicle deck in the aft wing house, in the ventilation duct and finally down into the steering gear compartment. 4.3.3 Ventilation through center casing Ventilation ducts through the center casing provide ventilation for the following compartments below the vehicle deck: the Engine Control Room, the Workshop, all compartments with cabins and both compartments of the Sauna area on Deck 0 and the Auxiliary Engine Room. The center casing is not located symmetrically on the centerline, but between 300 mm and 2700 mm on the starboard side. The compartments below the vehicle deck, that is, the bulkhead deck, were designed watertight. Thus each compartment in longitudinal direction has watertight doors to the adjacent compartments. Consequently in case of a capsize to the starboard side on even keel these compartments can be flooded just about half their volume because of the air tackled inside – excluding holes in the shell below Margin Line. 4.3.4 Ventilation ducts at the ship sides There are eight ventilation ducts at the ship sides in the aft and middle part of the ship leading onto the vehicle deck and into the compartments below. The following table gives an overview of all ventilation ducts at the ship sides: Table 1 Overview of the side ventilation openings
Connected compartment Ship’s side Area of inlet in m² Frame Stern Tube/ Store Room PS and STB 0,28 26...27 KaMeWa PS and STB 0,28 37...38 Separator Room PS only 0,28 40...41 Store (Provision) PS and STB 0,08 43...44 Store (Provision) PS and STB 0,08 44...45 Separator Room PS and STB 0,28 46...47 Separator Room PS only 0,28 47...48 Separator Room PS and STB 0,28 49...50 Car Deck PS and STB 0,16 55...56 Main Engine Room PS and STB 0,28 64...65 Main Engine Room PS and STB 0,28 65...66 Car Deck PS and STB 0,16 80...80a Car Deck PS and STB 0,16 80a...80b Car Deck PS and STB 0,16 89...90 Sewage Treatment PS only 0,32 90...91 Sewage Treatment PS only 0,32 93...94 All hydrostatical calculations carried out on the sinking of the MV Estonia of course take into account the so-called “Wassersperre” in the vertical ventilation ducts at the ship sides, that is, a metal sheet to reduce spray coming into the duct .

Seakeeping & Manoeuvring
71
4.4 Results of the Hydrostatic Analysis Based on the analysis of the survivors’ testimonies Krüger and Kehren concluded that in the time slot between 01:00 and 01:02 Estonian time, two or three metallic bangs were heard by several passengers and crew members at different locations on the MV Estonia. Also they connected these metallic bangs with a loss of the watertight integrity of the vehicle deck of the ferry. In the few minutes that followed, the amount of about 1500 tons of sea water accumulated on the vehicle deck and led to a quasi-static equilibrium floating condition of about 30° list to starboard side. This list is in line with the reports of the survivors. The water entered via the bow opening, but it can be assumed that a certain unknown amount of water had already accumulated on the vehicle deck before the bow ramp opened. As the speed of the ship reduced, consequently, both the bow wave and the dynamic sinkage decreased, as well as the water inflow rate onto the vehicle deck. As a consequence of this chain of events, the MV Estonia reached an equilibrium floating condition associated with a steady list of about 30°.
When the bow visor was lost, this resulted in an increased stern trim, which impeded the water flow out of the vehicle deck. This and the initial trim down by stern have a strong influence on the final sinking scenario. The initial amount of water flowing onto the vehicle deck reduced the stern trim of the MV Estonia slightly, but during the whole sinking sequence of the vessel a stern trim remained. During the phase from about 01:09 to 01:18 the ship had a relatively steady list. The average
Fig. 48 Comparison of the development of list according to hydrostatic calculations by TUHH andsurvivors’ testimonies.
“PLATEAU“

Seakeeping & Manoeuvring
72
water ingress on the vehicle deck was during this time about 20 t to 40 t per minute. Through a ventilation duct in the aft starboard side wing house water could flow into the Steering Gear Room on Deck 1. Due to its very aft position a relatively small amount of water contributed to the stern trim of the vessel. The water entering the vehicle deck increased the list further. The increasing list as well as the increasing stern trim led then to the submerging of the starboard side ventilation openings located just below Deck 4. Several compartments were ventilated by these side ventilation ducts like the vehicle deck, the Main Engine Room, the Separator Room and others. This was the beginning of a domino-effect, in which more and more water entered the MV Estonia through these openings and spread further into the ship. This caused again an increase of list and trim, because the side ventilation openings were located in the aft part of the vessel. Additionally, in the aft part of the vessel the windows had a larger size and lower collapse loads than those in the forward part. When the hydrostatic pressure on such a window or a door corresponding to its collapse load is exceeded, the window or door bursts and allows for further water ingress. At about 01:22 the first window or group of windows collapsed on Deck 4. As a result of this process the compartments above the vehicle deck were flooded consecutively. After reaching the heeling angle of nearly 80°, the openings of the ventilation ducts through the center casing and the engine casing submerged.
The increase in the trim slowed down, as more and more of the forward compartments began to flood. This can be seen in Figure 49. From 01:39 onwards the trim increased rapidly until 01:43, when the the stern of the vessel hit the sea bed. The MV Estonia sank stern first at a list of more than 120° to starboard and consequently hit the seabed with the top of Deck 9 first. This is an explanation for both, (1) the completely intact port side of the stern of the vessel,
Fig. 49 Development of trim according to hydrostatic calculations by TUHH.

Seakeeping & Manoeuvring
73
and (2) the penetration of the MV Estonia into the sea bed, almost upto the centerline. This corresponds well with the observations of the diving company Rockwater, which surveyed the vessel after its sinking. The MV Estonia had a residual buoyancy of about 5700 tons when its stern hit the sea bed at 01:43, that is, 9 minutes before the last radar-contact with the MV Estonia was lost at 01:52. Extrapolation of the water ingress according to the TUHH calculations shows that the MV Estonia would completely disappear from the sea surface at about 01:50 or 01:51. It is worth noticing that many survivors report of walking on the port side shell plating of the MV Estonia. The time corridor of the heeling angle being approximately between 80° to 100°, in which walking on the vessel’s side is likely to be possible, lasted about 6 or 7 minutes, as shown in Figure 48. This particular part of the curve is indicated with the sign “plateau” in Figure 48. This time is long in comparison with the relatively short overall sinking time, and is most likely an explanation for the many observations by the survivors during this period.
The development of the ship’s list over time as computed by the TUHH is roughly in line with the testimonies of the survivors, as shown in Figure 48. This physically plausible sinking scenario suggests that the real sinking took place more or less or like the TUHH calculations show. It was further found that during all calculation steps the individual equlibrium floating conditions were stable. This means that the vessel would have floated for a long time at any of these equilibrium floating positions in case the water ingress would have been stopped. As a consequence it can be stated that the vessel did not capsize rapidly or turn upside down, a fact which is also in good agreement with the position of the vessel on the ground.
Fig. 50 Development of the total mass of the MV Estonia over time.

Seakeeping & Manoeuvring
74
The development of the total mass of the MV Estonia as a function of time in Figure 50 shows a monotonous increase in the mass of the vessel. An acceleration of the sinking sequence beginning at about 01:30 can also be seen. This is in line with the testimonies of the survivors. This increase in the ship mass can also be seen as mass of water inflow per time step in Figure 51, which shows the average inflow per time step. The detailed data sheets to each floating position is given in the TUHH–report by Krüger and Kehren (2008).
4.5 Conclusions Based their investigations and calculations Krüger and Kehren (2007, 2008) come to the following conclusions: The loss of the MV Estonia can be associated with a chain of events, where the particular combination of events led consecutively and irreversibly to the sinking of the ferry:
• Once the watertight integrity of the bow was lost, this enabled large volumes of water to enter the vehicle deck. The fact that these large volumes of water actually entered the vehicle deck was due to the reduced freeboard to the vehicle deck as a consequence of the forward speed and the related dynamic effects.
• When once a critical amount of water had entered the vehicle deck, this led to a drastic
reduction of initial stability of the ship, which resulted in a rapidly increasing heel until an intermediate equilibrium floating condition of about 30° was reached. Due to this rapidly increasing heel, it was hardly possible for people to escape the ship.
Fig. 51 Mass of Water Inflow as a function of time for the later phase of the sinking process.

Seakeeping & Manoeuvring
75
• During this intermediate equilibrium, additional flooding took place, where the side ventilation system played the dominant role. Once the side ventilation openings were submerged, this resulted in a domino-effect, where more and more water could enter the ship. Due to this water ingress, heel and trim increased until the vessel then finally sank.
Consequently, the following conclusions for the general safety of RoRo- Passenger Ships can be drawn from the MV Estonia accident. These conclusions focus on the avoidance of the above mentioned event chain:
• First, the watertight integrity of all design elements of the vehicle deck of RoRo-Passenger Ferries must be assured under all possible design conditions. This does especially hold for all design elements exposed to sea loads. For future designs, especially for such designs, where it may be expected that high loads might occur, it is the TUHH recommendation to carry out investigations on the actual loading scenarios based on first principles as well as on the structural response of the design element in order to ensure that under all relevant operational conditions the watertight integrity of the vehicle deck is assured.
• Second, it was found by the TUHH investigations that a core safety element of a Ro-
Ro passenger ferry in case of a loss of its watertight integrity is in fact a sufficient freeboard from the waterline in that equilibrium floating condition to the vehicle deck. This design element prevents massive water ingress into the ship and, consequently, a rapidly increasing heel due to reduced or even negative initial stability. Preventing a rapidly increasing heel is a core element of allowing passengers and crew to escape from the ship (if necessary). Whenever modifications of the existing damage stability requirements for Ro-Ro passenger ferries are discussed, these findings need to be taken into account.
• Third, it was found that from that moment on, when the side ventilation ducts were
submerged, the vessel would irreversibly sink. In this respect, it can be recommended to better take into account such a situation in the ship design or to ensure by appropriate assumptions during the damage stability assessment of Ro-Ro passenger ferries that there is always sufficient freeboard to openings, through which a massive progressive flooding can take place.
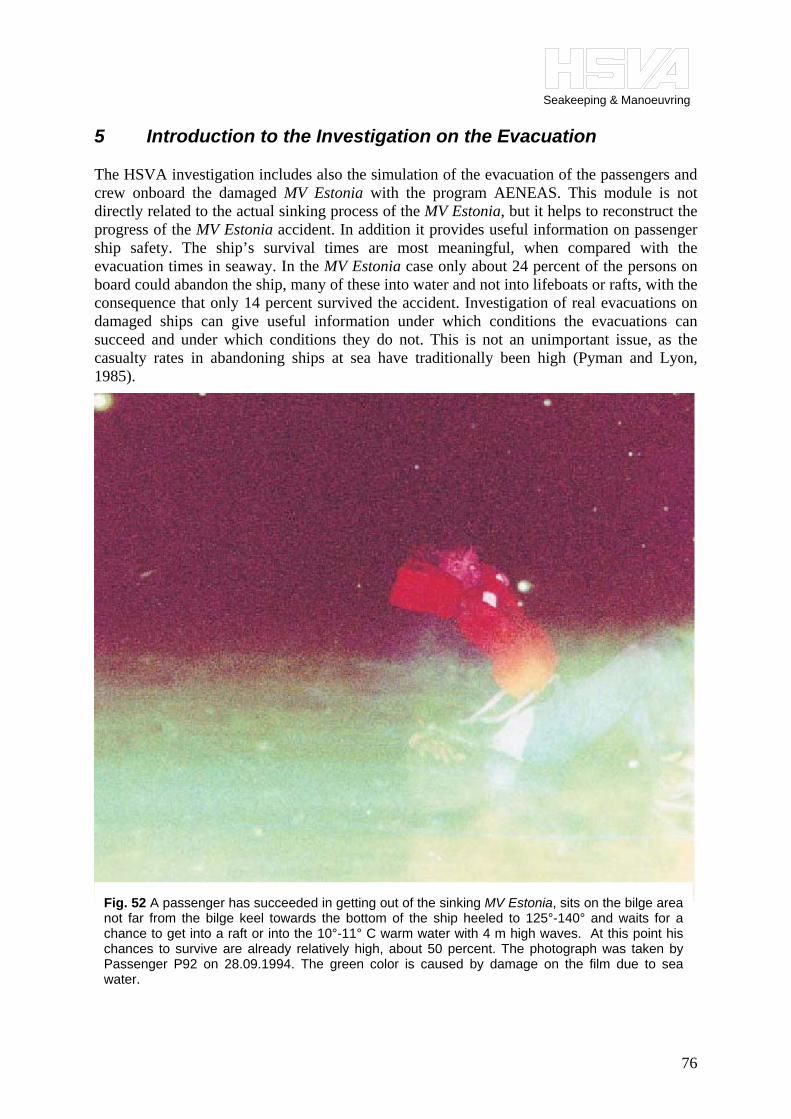
Seakeeping & Manoeuvring
76
5 Introduction to the Investigation on the Evacuation The HSVA investigation includes also the simulation of the evacuation of the passengers and crew onboard the damaged MV Estonia with the program AENEAS. This module is not directly related to the actual sinking process of the MV Estonia, but it helps to reconstruct the progress of the MV Estonia accident. In addition it provides useful information on passenger ship safety. The ship’s survival times are most meaningful, when compared with the evacuation times in seaway. In the MV Estonia case only about 24 percent of the persons on board could abandon the ship, many of these into water and not into lifeboats or rafts, with the consequence that only 14 percent survived the accident. Investigation of real evacuations on damaged ships can give useful information under which conditions the evacuations can succeed and under which conditions they do not. This is not an unimportant issue, as the casualty rates in abandoning ships at sea have traditionally been high (Pyman and Lyon, 1985).
Fig. 52 A passenger has succeeded in getting out of the sinking MV Estonia, sits on the bilge areanot far from the bilge keel towards the bottom of the ship heeled to 125°-140° and waits for achance to get into a raft or into the 10°-11° C warm water with 4 m high waves. At this point hischances to survive are already relatively high, about 50 percent. The photograph was taken byPassenger P92 on 28.09.1994. The green color is caused by damage on the film due to seawater.
Seakeeping & Manoeuvring
77
The program AENEAS is a leading-edge passenger evacuation simulation program that fulfills IMO requirements for evacuation simulation of RoPax vessels. This computer tool was developed by the classification society Germanischer Lloyd (GL) and TraffGo GmbH in Germany for the performance based assessments of evacuation processes in compliance with the IMO Circ. 1033. During 2004-2006 the commercially available program AENEAS was enlarged to include the effects of ship motions (roll and pitch) on the evacuation process (Valanto, 2006). Empirical dependence of the walking speed on the ship inclination angles is used. The empirical data up to 20° is extended with the use of typical values of the limiting friction coefficient between pedestrians shoes and ship floors, which put an end to all pedestrian motion at higher angles of inclination. Different empirical walking speed reduction functions are used for longitudinal and transverse stairs and floor, respectively. Also the transverse acceleration on the decks due to ship rolling and the drift caused by the inclination of ship floors on the agent (= passenger model) behavior is taken into account. As an input the program AENEAS uses the time-histories of the roll and pitch motions calculated by the ship motion simulation program HSVA Rolls. It is also possible to use time-histories measured in model tests or re-constructed ones based on survivors’ testimonies as an input. The implementation of ship motions in AENEAS by TraffGo HT GmbH is elaborated in (Valanto, 2006). Thus for the case of the MV Estonia we take the most likely accident scenarios, compute the time-histories of the roll and pitch until “capsize”, obtain the times to “capsize”, and simulate the evacuation under the influence of the roll and pitch motion of the ship. This gives us useful information about the time frame of the evacuation, the weaknesses in the evacuation process and possible bottlenecks in the ship interior design itself. Further, the MV Estonia case can serve as a test case for software used in evacuation simulation of ships in distress. This approach can help in understanding what takes place in such a situation. It can provide better information for the maritime authorities of the coastal states on how to respond, and for rules development in IMO.

Seakeeping & Manoeuvring
78
6 Ship Evacuation Modeling with AENEAS 6.1 Introduction Evacuation analyses performed according to the advanced method described in IMO MSC/Circ. 1033 have become state of the art for passenger ships. One of the programs routinely used for such evacuation analyses is AENEAS, which is based on a microscopic model for pedestrian motion. A microscopic model for pedestrian motion contains two basic principles: (1) The floor plan is represented in detail; (2) The population consists of individual persons influencing each other while moving according to the egress routes towards the specified goals. Microscopic models are able to include both, internal (psychological) and external (structural) factors in an appropriate way (Petersen et al., 2003). Discrete microscopic models, in which the floor plan is divided into cells, are well suited for doing fast computations of systems consisting of many entities. Therefore the simulation of a passenger ship can be simulated effectively in a standard PC. For this purpose, the general arrangement (GA) plan is projected onto a grid of quadratic cells, the area of one cell thereby representing the space which one person requires in a densely populated area. Taking all persons into account, an easy-to-understand and realistic simulation of the mustering and evacuation procedure can be achieved. The evacuation software AENEAS was developed for performance based assessments of evacuation concepts in compliance with the IMO regulations stated in MSC/Circ. 1033. The AENEAS model is based on a so-called cellular automation that incorporates a high-speed algorithm and delivers results, which agree well with experimental data (Petersen et al., 2003).
The floor plan of a ship deck is discretized into a regular grid of square cells, each representing the average space a person occupies. The size of the cells is derived from research by Weidmann (1992), relating pedestrian flow to individual space requirements.
Fig. 53 Example of a discretization of the floor plan.

Seakeeping & Manoeuvring
79
When the flow stops due to high densities, an average person occupies approximately 0.16 m². Thus the edge length of the corresponding square becomes 0.4 m, which is also sufficient for general discretization of the structure. By using various cell types like accessible floor, doors, and stairs as well as non-accessible cells representing obstacles and walls the general arrangement can be represented in detail. Passengers and crew are represented by so called agents. These are models of individual persons with properties ranging from walking speed to stochastically distributed characteristic properties like dawdling or swaying. Similar to a movement on a chessboard, the agents move across the accessible cells towards their assigned destination interacting with others, avoiding obstacles (non accessible cells), and being simultaneously influenced by their individual parameters. In AENEAS the program user defines the routes the agents are going to follow during the simulation. According to this input, a so-called guiding potential is distributed through the geometry, by which the agents assigned to this route determine their direction of movement. When reaching their destination the agents are considered saved and are eliminated from the simulation. The simulation results are of a stochastic nature, hence 500 simulation runs are performed to obtain a reliable result. The analysis generates a range of possible outcomes with favorable and unfavorable realizations of each evacuation scenario. According to IMO MSC/Circ. 1033, the relevant evacuation realization is the one delivering an evacuation time bigger than 95% of all realizations. This realization is saved and used for further analysis. A simulation tool like AENEAS offers new opportunities not only for the assessment of evacuation durations to demonstrate compliance with IMO requirements, but also for the optimization of geometrical layouts. While undoubtedly providing valuable insight into passenger behavior in evacuation situations, the program AENEAS is not modeling any extraordinary circumstances, like panic, darkness or presence of smoke or water in the ship interior. Human behavior in all its complexity cannot be fully represented by computer models. Consequently the assessment of the computed evacuation times needs to be done with care. Even real life observations during evacuations will not be entirely reproducible as the population composition is different on every journey, even on the same ship (Petersen et al., 2003). 6.2 Enlargement of the Program AENEAS to handle Roll and Pitch Motions In order to investigate evacuation processes on a damaged RoPax ship in seaway, that is, in a ship moving in all six degrees of freedom, and which due to the leakage is bound to become inclined to one side, AENEAS was developed further to account for the ship motions. Relatively simple empirical dependencies of the passenger walking speeds on the roll and pitch angles of the ship were implemented in the program code by TraffGo HT during 2004-2006. The empirical data and the model formulations implemented in AENEAS can also be found in the report by Valanto (2006) or in a very brief form in the conference paper by Meyer-König et al. (2005). Empirical data was used as much as possible in modeling the speed reduction of the persons on board due to ship inclination (static heel, trim). As hardly any empirical data beyond the inclination of 20° were found, rational judgment with the help of many geometric drawings

Seakeeping & Manoeuvring
80
were used to shape the further path of the speed reduction curves, at maximum up to the slope of 45°. Another important factor taken into account in determining the curves is the coefficient of friction (COF) between pedestrian shoe soles and various floor or deck materials. After all, the limiting factor to walking on steep surfaces is exactly friction. For a normal range of COF, it is generally true for walking that the higher the value of the coefficient of friction is, the lower the possibility of slipping. The smaller the value, the greater the danger. For conventional shoes, a concrete floor-surface also when painted will yield a coefficient value that is high enough (about 0.7) to preclude the reasonable probability of slipping. A treated steel surface would provide the same value for friction coefficient when dry. Linoleum or similar surface generally yields a lower friction coefficient, in same cases high enough (about 0.5) to be safe, and in other cases low enough (of the order of 0.3) to be dangerous, especially when wet. Low-loop carpets can provide higher friction coefficients against the shoe sole, but there is no guarantee that the carpet stays fixed when loaded by passengers walking on it in an inclined ship. The JAIC Final Report on the Estonia disaster mentions some rubber mats getting loose, as the inclination increased (JAIC, 1997). There are also some differences in the COF between the different floor or deck coatings and leather or rubber (Neoprene) soles. The leather soles tend to give lower values of friction than the soles made of typical synthetic materials. The significance of the COF increases when the ship deck gets an inclination. Even if the COF values given depend on the method of measurement, they still give an indication of the angle at which walking or standing on the inclined deck is not anymore possible, as the friction cannot anymore compensate the tangential force due to the inclination and acceleration of gravity. The friction coefficient μ is related to the limiting inclination angle ϕ as follows
sin( ) tan( ) .cos( )N
F mgF mgμ ϕμ ϕϕ= = = (10)
The given values of COF (0.7, 0.5, 0.3) yield the following limiting angles of inclination: 35°, 27°, and 17°, respectively. On a modern passenger ship we can assume that the decks as such are not slippery, which would mean that at the inclination of the 30°-35° the passengers would not anymore be able to advance without using handrails or other support. An example of the several speed reduction curves used in AENEAS is shown in Figure 54 for a transverse corridor. Based on the empirical data and the above mentioned values of friction coefficients it is assumed that the normal movement of pedestrians stops, when the slope angle of a laterally tilted corridor exceeds 35°, as shown in Figure 54. It is possible to advance slowly in a corridor having a higher lateral tilt, but not in a normal walking position. In an emergency situation the persons in the corridor would have in general a strong motivation to advance. Thus the present model allows the movement up to 45 ° of lateral tilt, however, with a very slow speed. In order to approach the topic conservatively, AENEAS’ agents will be able to move with 5 percent of the maximum speed between 35° and 45° and stop, if the angle increases even further.
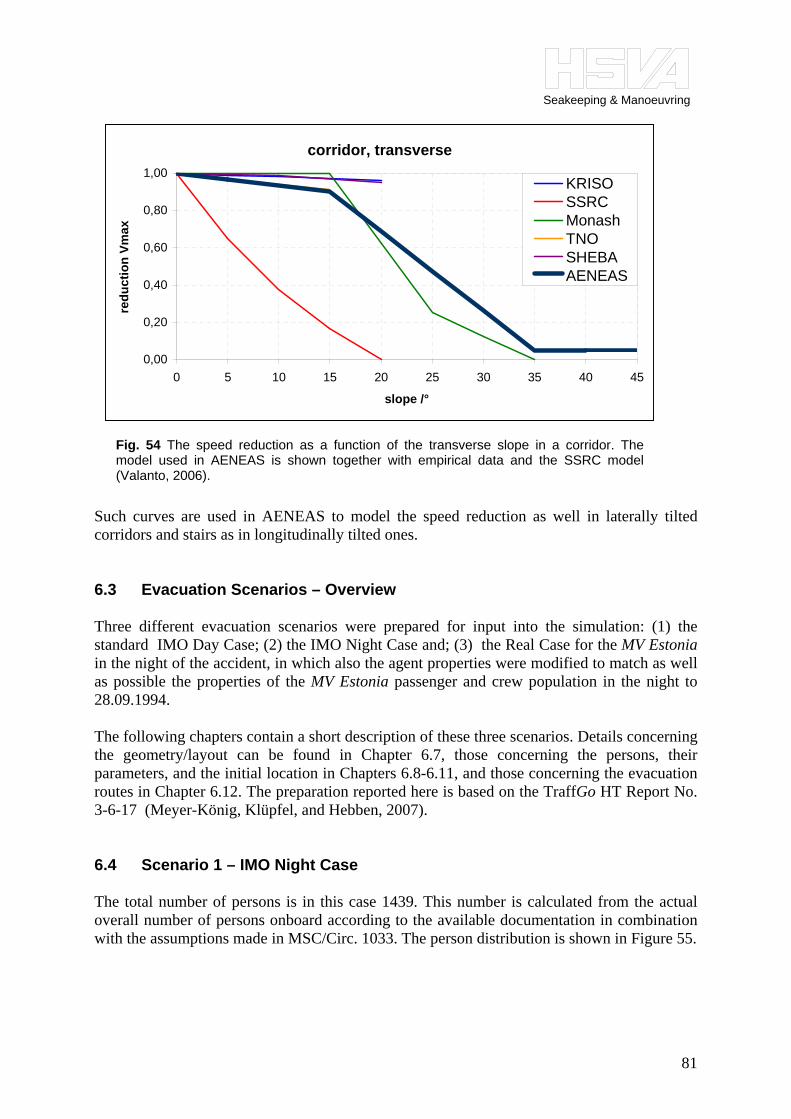
Seakeeping & Manoeuvring
81
Such curves are used in AENEAS to model the speed reduction as well in laterally tilted corridors and stairs as in longitudinally tilted ones. 6.3 Evacuation Scenarios – Overview Three different evacuation scenarios were prepared for input into the simulation: (1) the standard IMO Day Case; (2) the IMO Night Case and; (3) the Real Case for the MV Estonia in the night of the accident, in which also the agent properties were modified to match as well as possible the properties of the MV Estonia passenger and crew population in the night to 28.09.1994. The following chapters contain a short description of these three scenarios. Details concerning the geometry/layout can be found in Chapter 6.7, those concerning the persons, their parameters, and the initial location in Chapters 6.8-6.11, and those concerning the evacuation routes in Chapter 6.12. The preparation reported here is based on the TraffGo HT Report No. 3-6-17 (Meyer-König, Klüpfel, and Hebben, 2007). 6.4 Scenario 1 – IMO Night Case The total number of persons is in this case 1439. This number is calculated from the actual overall number of persons onboard according to the available documentation in combination with the assumptions made in MSC/Circ. 1033. The person distribution is shown in Figure 55.
corridor, transverse
0,00
0,20
0,40
0,60
0,80
1,00
0 5 10 15 20 25 30 35 40 45
slope /°
redu
ctio
n Vm
ax
KRISOSSRCMonashTNOSHEBAAENEAS
Fig. 54 The speed reduction as a function of the transverse slope in a corridor. Themodel used in AENEAS is shown together with empirical data and the SSRC model(Valanto, 2006).

Seakeeping & Manoeuvring
82
ROUTES NAME TYPE PERSONS ELEMENTS 1 Crew A Crew 8 29 2 Crew A_b Crew 3 17 3 Crew B Crew 4 27 4 Crew C Crew 1 42 5 MVZ A Pax 568 322 6 MVZ B Pax 704 368 7 MVZ C Pax 151 149 6.5 Scenario 2 – IMO Day Case In this case the total number of persons amounts to 1406. This number is calculated from the actual overall number of persons onboard according to the available documentation in combination with the assumptions made in MSC/Circ. 1033. The person distribution is shown in Figure 56.
ROUTES NAME TYPE PERSONS ELEMENTS 1 Crew A Crew 2 29 2 Crew A_b Crew 1 17 3 Crew B Crew 16 27 4 Crew C Crew 17 28 5 Crew C_b Crew 12 25 6 MVZ A Pax 78 72 7 MVZ B Pax 415 107 8 MVZ C Pax 865 115 6.6 Scenario 3 – Real Passenger Distribution on the MV Estonia The simulation input for the Real Case was prepared according to the survivors’ testimonies, cabin numbering and ship drawings. In the real case, the overall number of persons onboard is 989. The following table lists the persons as simulated. The person distribution in the ship is illustrated in Figure 57.
ROUTES NAME TYPE PERSONS ELEMENTS 1 MVZ A Pax 424 271 2 MVZ B Pax 311 167 3 MVZ C Pax 254 131
Table 2: Routes defined in Scenario 1 – Night Case
Table 3: Routes defined in Scenario 2 – Day Case
Table 4: Groups and routes for the real case. There are 989 persons altogether. The specification of specific crew routes is not necessary, since assembly is not simulated.
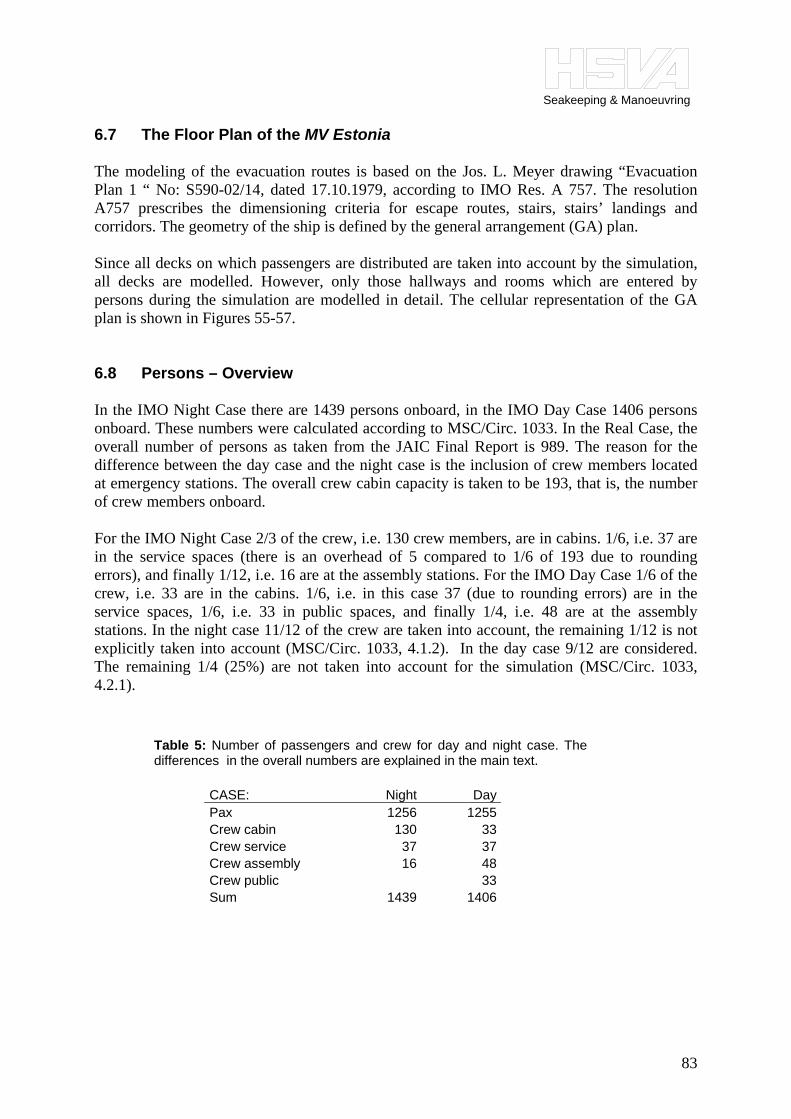
Seakeeping & Manoeuvring
83
6.7 The Floor Plan of the MV Estonia The modeling of the evacuation routes is based on the Jos. L. Meyer drawing “Evacuation Plan 1 “ No: S590-02/14, dated 17.10.1979, according to IMO Res. A 757. The resolution A757 prescribes the dimensioning criteria for escape routes, stairs, stairs’ landings and corridors. The geometry of the ship is defined by the general arrangement (GA) plan. Since all decks on which passengers are distributed are taken into account by the simulation, all decks are modelled. However, only those hallways and rooms which are entered by persons during the simulation are modelled in detail. The cellular representation of the GA plan is shown in Figures 55-57. 6.8 Persons – Overview In the IMO Night Case there are 1439 persons onboard, in the IMO Day Case 1406 persons onboard. These numbers were calculated according to MSC/Circ. 1033. In the Real Case, the overall number of persons as taken from the JAIC Final Report is 989. The reason for the difference between the day case and the night case is the inclusion of crew members located at emergency stations. The overall crew cabin capacity is taken to be 193, that is, the number of crew members onboard. For the IMO Night Case 2/3 of the crew, i.e. 130 crew members, are in cabins. 1/6, i.e. 37 are in the service spaces (there is an overhead of 5 compared to 1/6 of 193 due to rounding errors), and finally 1/12, i.e. 16 are at the assembly stations. For the IMO Day Case 1/6 of the crew, i.e. 33 are in the cabins. 1/6, i.e. in this case 37 (due to rounding errors) are in the service spaces, 1/6, i.e. 33 in public spaces, and finally 1/4, i.e. 48 are at the assembly stations. In the night case 11/12 of the crew are taken into account, the remaining 1/12 is not explicitly taken into account (MSC/Circ. 1033, 4.1.2). In the day case 9/12 are considered. The remaining 1/4 (25%) are not taken into account for the simulation (MSC/Circ. 1033, 4.2.1).
CASE: Night DayPax 1256 1255Crew cabin 130 33Crew service 37 37Crew assembly 16 48Crew public 33Sum 1439 1406
Table 5: Number of passengers and crew for day and night case. The differences in the overall numbers are explained in the main text.

Seakeeping & Manoeuvring
84
CASE: RealPax 803Crew 186Sum 989
The survivor information used by the HSVA is based on the person lists obtained at SPF and contains 796 passengers and 193 members of the crew. The table above shows the values of the “Final Report” of the Joint Accident Investigation Commission. The differences between the former and the latter source (-7 passengers, +7 crew members) appears to be only in the definition between crew members and passengers. The following Table 7 shows the person distribution for the crew in service spaces. Their actual numbers are calculated according to MSC/Circ. 1033 as fractions of the overall crew numbers. The maximum capacity of the service spaces for crew is 64.
Deck Frame Room MVZ max cap. Night Day
H 9 Bridge A 3 2 2 F 7 55-59 Jail C 1 1 1 F 7 60-65 Workshop B 1 1 1 F 7 68 Laundry B 2 1 1 E 6 Cabins A 1 1 0 E 6 59-87 Dancing, Bar, Arcade B 5 4 2 E 6 59-87 a la carte B 3 2 3 E 6 04-33 Dining C 6 1 3 E 6 33-59 Galley, Scullery C 6 3 3 D 5 Cabins A 1 1 0 D 5 80k-s Information B 2 2 1 D 5 59-80q super market B 2 0 2 D 5 33-47 Milk Bar, Grill C 2 2 2 D 5 04-40 Cafeteria C 6 2 2 C 4 Cabins A 1 1 0 C 4 Cabins B 1 1 0 C 4 80m-87 Information B 3 1 2 C 4 Cabins C 1 1 0 C 4 43 Office C 1 0 1 C 4 5 to 45 Bar, Pantry, Night, Cinema C 3 2 3 A 2 Car Deck A 1 1 1
Tween 1 53-80e Main Eng. Control B 3 2 2 Tween Cabins A 1 1 0 Tween 1 0-53 Prov C 4 2 3 Tween 1 Workshop B 2 1 1 Tank 0 87-120 Bar, Grill, Pool A 2 1 1
Sum: 64 37 37
Table 6: Overall number of passenger and crew for the real case. The details are described in the main text and the following table.
Table 7: Crew in service spaces. This table shows the details for the third row (crew service) in the previous table.
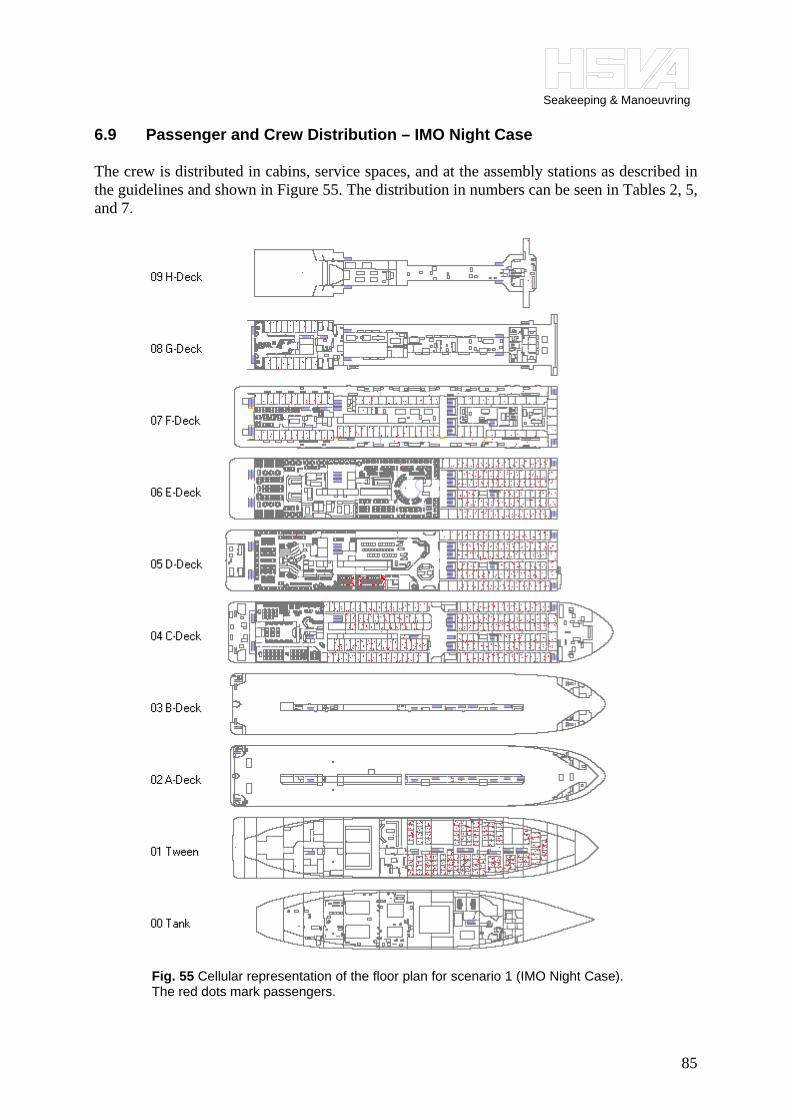
Seakeeping & Manoeuvring
85
6.9 Passenger and Crew Distribution – IMO Night Case The crew is distributed in cabins, service spaces, and at the assembly stations as described in the guidelines and shown in Figure 55. The distribution in numbers can be seen in Tables 2, 5, and 7.
Fig. 55 Cellular representation of the floor plan for scenario 1 (IMO Night Case).The red dots mark passengers.
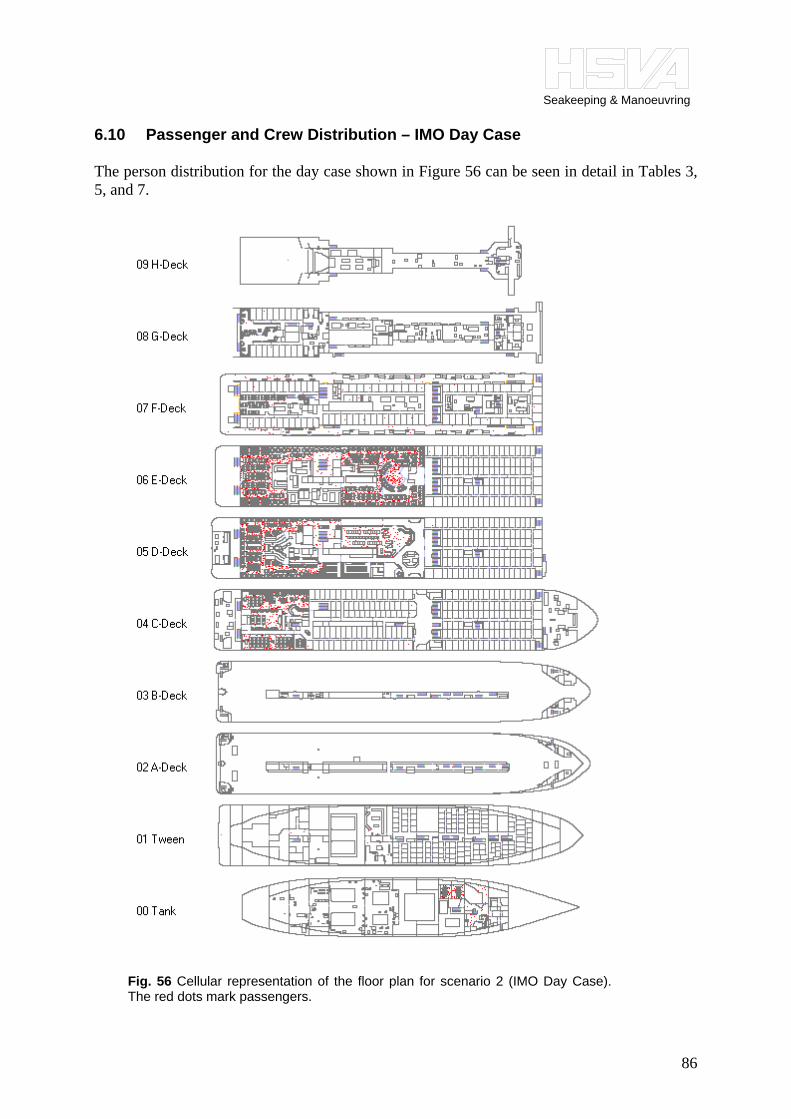
Seakeeping & Manoeuvring
86
6.10 Passenger and Crew Distribution – IMO Day Case The person distribution for the day case shown in Figure 56 can be seen in detail in Tables 3, 5, and 7.
Fig. 56 Cellular representation of the floor plan for scenario 2 (IMO Day Case).The red dots mark passengers.

Seakeeping & Manoeuvring
87
6.11 Real Case Passenger and Crew Distribution, Walking Speeds and Reaction Times 6.11.1 Person distribution The person distribution for the real case is shown below in Figure 57 and can be seen in detail in Tables 4, 6, and 7.
Fig. 57 Initial distribution of persons for the Real Case on 28.09.1994. Thereare 989 persons altogether (crew and passengers).
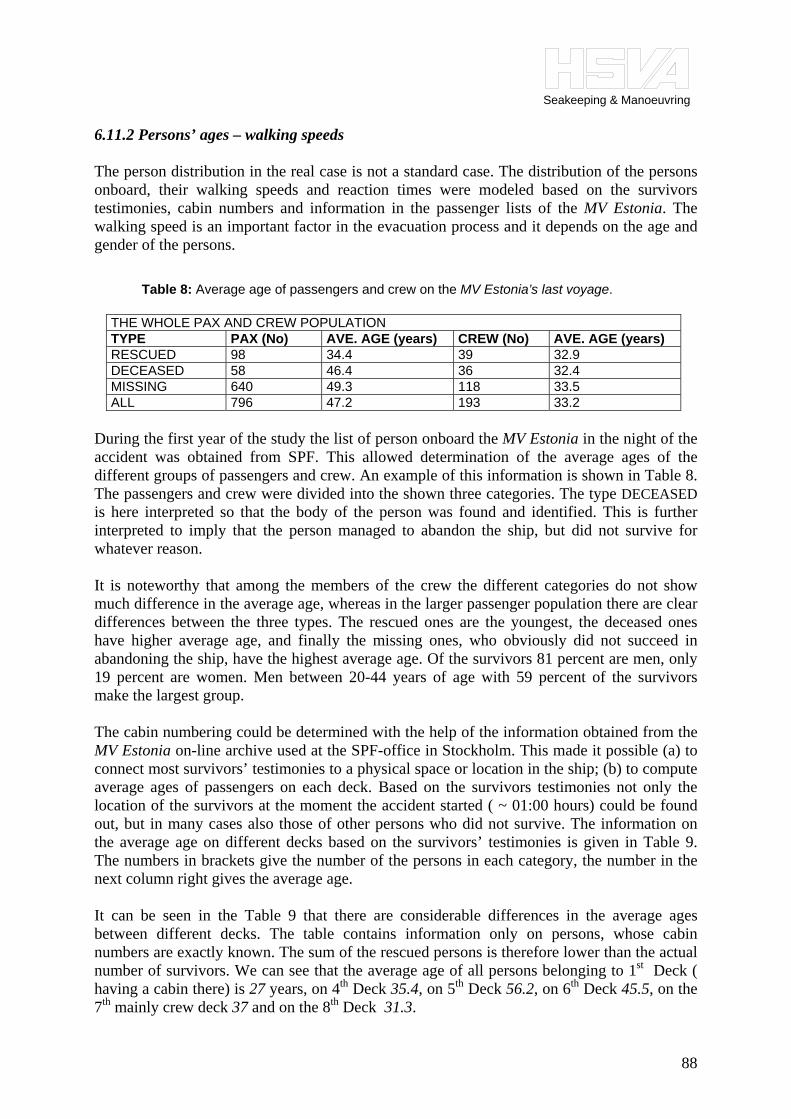
Seakeeping & Manoeuvring
88
6.11.2 Persons’ ages – walking speeds The person distribution in the real case is not a standard case. The distribution of the persons onboard, their walking speeds and reaction times were modeled based on the survivors testimonies, cabin numbers and information in the passenger lists of the MV Estonia. The walking speed is an important factor in the evacuation process and it depends on the age and gender of the persons.
THE WHOLE PAX AND CREW POPULATION TYPE PAX (No) AVE. AGE (years) CREW (No) AVE. AGE (years) RESCUED 98 34.4 39 32.9 DECEASED 58 46.4 36 32.4 MISSING 640 49.3 118 33.5 ALL 796 47.2 193 33.2
During the first year of the study the list of person onboard the MV Estonia in the night of the accident was obtained from SPF. This allowed determination of the average ages of the different groups of passengers and crew. An example of this information is shown in Table 8. The passengers and crew were divided into the shown three categories. The type DECEASED is here interpreted so that the body of the person was found and identified. This is further interpreted to imply that the person managed to abandon the ship, but did not survive for whatever reason. It is noteworthy that among the members of the crew the different categories do not show much difference in the average age, whereas in the larger passenger population there are clear differences between the three types. The rescued ones are the youngest, the deceased ones have higher average age, and finally the missing ones, who obviously did not succeed in abandoning the ship, have the highest average age. Of the survivors 81 percent are men, only 19 percent are women. Men between 20-44 years of age with 59 percent of the survivors make the largest group. The cabin numbering could be determined with the help of the information obtained from the MV Estonia on-line archive used at the SPF-office in Stockholm. This made it possible (a) to connect most survivors’ testimonies to a physical space or location in the ship; (b) to compute average ages of passengers on each deck. Based on the survivors testimonies not only the location of the survivors at the moment the accident started ( ~ 01:00 hours) could be found out, but in many cases also those of other persons who did not survive. The information on the average age on different decks based on the survivors’ testimonies is given in Table 9. The numbers in brackets give the number of the persons in each category, the number in the next column right gives the average age. It can be seen in the Table 9 that there are considerable differences in the average ages between different decks. The table contains information only on persons, whose cabin numbers are exactly known. The sum of the rescued persons is therefore lower than the actual number of survivors. We can see that the average age of all persons belonging to 1st Deck ( having a cabin there) is 27 years, on 4th Deck 35.4, on 5th Deck 56.2, on 6th Deck 45.5, on the 7th mainly crew deck 37 and on the 8th Deck 31.3.
Table 8: Average age of passengers and crew on the MV Estonia’s last voyage.

Seakeeping & Manoeuvring
89
BASED ON SURVIVOR INFORMATION ON EACH DECK (NUMBER) | AVERAGE AGE
ADJUSTED AV. AGE
DECK RESCUED DECEASED MISSING ALL ALL 1 (29) 28.4 (2) 29 (14) 23.8 (45) 27.0 35 4 (29) 31.2 (5) 46 (13) 40.6 (47) 35.4 47 5/Air Chairs (6) 51.0 (-) - (3) 66 (9) 56.2 64/33 6 (19) 43.0 (5) 45.4 (6) 53.5 (30) 45.5 56 7 (26) 36.5 (1) 37 (5) 39.8 (32) 37 36 8 (4) 31.8 (-) - (2) 30.5 (6) 31.3 28 SUM (113) (13) (43) (169)
Thus obviously many somewhat younger people preferred the Deck 1 (4-person cabins, cheaper). The highest average age is found on Deck 5. The cabins on this deck provide the easiest access to the shopping areas and restaurants without the need to use stairs. The differences in the average age between different decks are mainly based on the ages of the persons having known cabins numbers (169), which make only about 17 percent of the whole population (989). The age differences are, however, plausible: It can be easily be understood that depending on their age the passengers would have different preferences with respect to their deck of choice. The average age of the survivors is naturally lower than the average age of the total population onboard. Therefore for the input data the average ages on decks needed to be adjusted so that at the end the known average ages of total passenger and crew populations are reached. These adjusted ages on different decks are given on the most right column of the Table 9. According to the official lists there were 796 passengers in the ship. The real amount of passengers may have been somewhat higher. The ship drawings show 1256 beds in cabins and air-chairs (deck seats) in two separate rooms available for passengers. An even filling rate for persons in cabins and in these two mentioned rooms was assumed. This leads to an approximate filling rate of 0.63375 passengers per one bed in a cabin or air-chair. The Table 10 below shows the number of passengers on each deck, the extrapolated number of them in cabins and elsewhere based on the testimonies, and the average age of the cabin passengers on each deck. The percentages of persons in cabins are also mainly based on the reported location of the survivors on each deck. As the location and information is based only on the survivors, which make only 14 percent of all persons on board, the results is of course an extrapolation and thus subject to relatively large errors. The resulting distribution is, however, very similar to the IMO Night Case with the exception that a relatively small fraction of the passengers were still in the Karaoke bar, Night Club and Casino and in the other public spaces nearby. Figures 55 and 57 showing the passenger locations in the IMO Night Case and the Real Case, respectively, illustrate the situation.
Table 9: Average age of persons having cabins on different decks on the MV Estonia.

Seakeeping & Manoeuvring
90
PASSENGERS DECK BEDS /
CHAIRS FILLING RATE
PAX IN CABINS [%]
IN CABINS [-]
ELSE-WHERE
AV. AGE
1 358 0.63375 227 82.4 187 40 35 2-3 V-DECK 4 BOW 204 0.63375 129 85.2 110 19 47 4 MIDSHIP 200 0.63375 127 85.0 108 19 47 5 BOW 212 0.63375 134 85.1 114 20 64 5 AIR CH. 70 0.63375 44 70.5 31 13 33 6 212 0.63375 134 61.2 82 53 56 SUM 1256 0.63375 796 632 164 47.2 CREW DECK BEDS CREW 7 131 131 84.4 111 20 36 8 38 38 84.4 32 6 28 OVERFLOW TO DECK 4
24 24 72.0 17 7 26
SUM 193 193 160 33 33.2 The age distribution of the persons on the decks is modeled in this real case as it influences the walking speeds, which in general may have an effect on the evacuation results. The walking speed dependence on person’s age given in the IMO Circular 1033 is used. The walking speed depends on the age and gender of the person: Male persons have a higher walking speed than female persons and young adults advance in general a little faster than older ones. Figure 58 illustrates the situation.
Figure 59 shows the assumed average ages of passengers and crew on different decks.
Table 10: Arrangement of passengers and crew on the MV Estonia ( extrapolation).
Female
Male
0 10 20 30 40 50 60 70 0
1.0
2.0
Age (years)
Walking speed (m/s)
Fig. 58 Walking speeds as a function of age and gender.
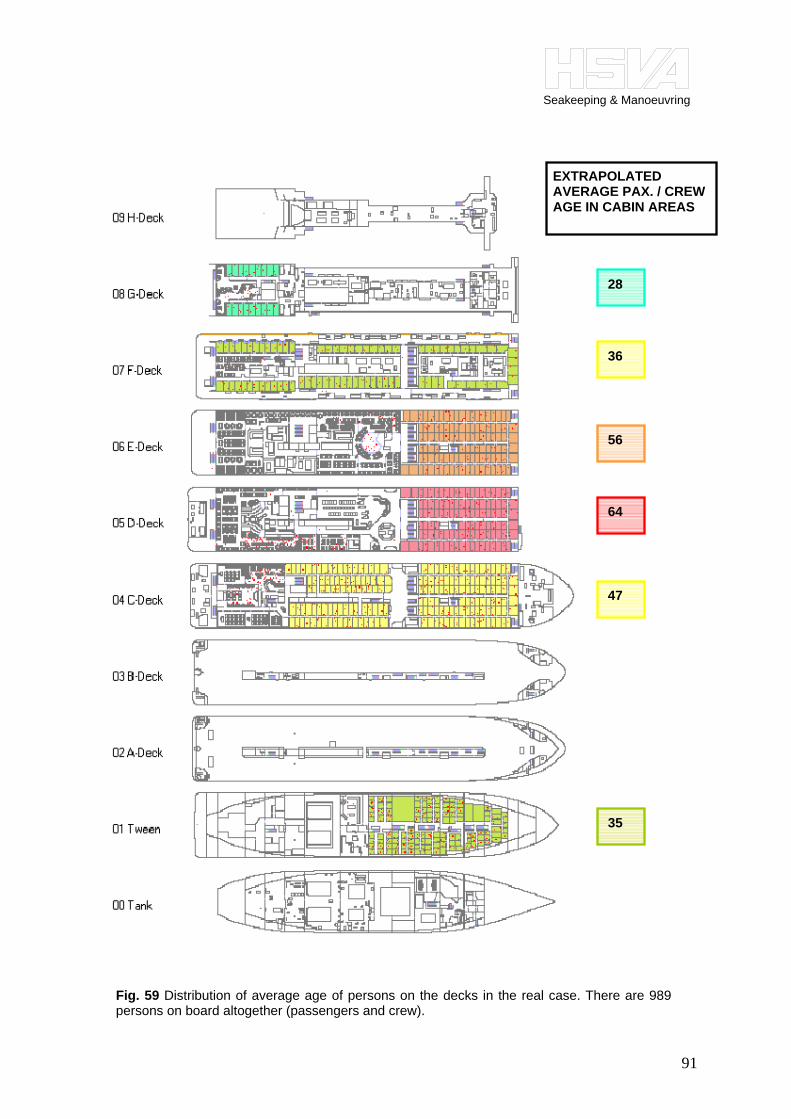
Seakeeping & Manoeuvring
91
35
28
56
EXTRAPOLATED AVERAGE PAX. / CREW AGE IN CABIN AREAS
64
47
36
Fig. 59 Distribution of average age of persons on the decks in the real case. There are 989persons on board altogether (passengers and crew).

Seakeeping & Manoeuvring
92
6.11.3 Reaction times Another factor used in modeling the MV Estonia population is the reaction time of the passengers. Three different reaction time distributions for the persons onboard were used for the MV Estonia case: (1) On Deck 1 and on the front part of Deck 4 many survivors reported of hearing noises from the bow and some also from the vehicle deck above or below. The persons in these areas were considered to be concerned of their safety and thus also pre-warned: Therefore their reaction times were set rather short. It is noteworthy that many of the survivors, who left their cabins in this area, where not fully dressed. At least these persons were in a hurry as they left. (2) For the passengers awake in public spaces we have set a little longer reaction time than for the previous group. These people were assumed not to be pre-warned and not initially acutely concerned of their safety. (3) The people in their cabins outside the areas of the Group 1 were assumed not to be pre-warned by the noises from the bow or vehicle deck, and possibly asleep. A longer reaction time than in the two other cases was set. The distribution of the applied reaction times in the ship are illustrated in Figure 60. In this connection it is useful to check, where did the rescued persons or persons who succeeded in abandoning the ship come from. If we assume an even filling rate of passengers in the cabins (0.63375) we can coarsely evaluate the percentage of passengers survived on each area. This is shown in Table 11.
DECK- LOCATION PAX/CREW (assumed number)
ABANDONED SHIP [No] (as known)
ABANDONED SHIP [%] (as known)
1 Cabins in the bow 187 21 11.2 4 Cabins in the bow 110+9 21 17.6 4 Cabins in the middle 108+8 10 8.6 5 Cabins in the bow 114 4 3.5 5 Air Chairs 31 3 9.7 6 Cabins in the bow 82 13 15.9 7 Cabins (crew) 111 23 20.7 8 Cabins (crew) 32 2 6.3 1-9 Public spaces 197 ~66 ~33 SUM 989 163 16.5
The sum of persons who abandoned the ship is in Table 11 smaller than what is generally assumed to be true (~240-310). Therefore the percentages in Table 11 are relative and meaningful only when compared with each other. They do give some information on the relative abandoning rate depending on the location just before the sudden heeling motions. This table shows high rates for Deck 7 and Deck 4 in the bow and low rates on Deck 4 middle and a very low rate on Deck 5 cabin areas. Persons, mainly crew, on Deck 7 had many advantages: (a) short distance to the ship port side guard rail on the same deck; (b) the possibility to leave the cabin through cabin windows, which was done by many crew members; (c) young age. The passengers on Deck 4 in the bow section were probably pre-warned by the noises coming from the bow. The difference to the middle section on Deck 4 is remarkable. The cabin compartment on Deck 5 has the lowest rate. The average age on this area was probably high
Table 11: Estimated percentages of persons on each deck who succeeded in abandoning the ship.

Seakeeping & Manoeuvring
93
(~64). The youngest survivor from this area was 49 years old. These differences in the success rate of abandoning the ship can perhaps be explained with the age distribution on decks and the different reaction times on different parts of the ship. Persons in the public spaces, many of them in or at the Karaoke Bar with approximate average age of 38 years, were younger than the passengers in general. They could leave these areas as groups, which provided the possibility for mutual help. These persons had the highest success rate in abandoning the ship. The total sum of the persons who abandoned the ship represents known persons. This number is bound to be lower than the most likely number of person who succeeded in getting to open decks. Further details on the person distribution in the real case can be found in the following Tables 12-13. They explain the distribution of passengers and crew.
passengers crew
cabin elsewhere, e.g. public
spaces
0 Tank 0 0 1 Tween 187 40 2 A 0 0 3 B 0 0 4 C - Bow 110 19
C - Mid 108 19 5 D 114 20
D-Air seats 31 13 6 E 82 53 7 F 111 20 8 G 32 6
additional added to Deck C 17 7 9 H
Sum 989 632 164 160 33
Table 12 shows the distribution of passengers and crew for each deck. The additional row shows the number of crew members that had to be added to deck C, as the cabins for the crew on Decks 7 and 8 were already fully occupied, in order to reach the required overall crew number. As not all persons onboard were in cabins, but also in corridors, on decks and public spaces, these persons needed to be located somewhere. Table 13 below shows for each deck the extrapolated the passenger locations on decks based on the known locations, the number of known locations, and the difference between these two numbers and the room name where they were put into and to which group they belong in the simulation.
Table 12: Person distribution for the real case (passengers and crew). The overall number of passengers is 796 and the overall number of crew is 193, together 989.

Seakeeping & Manoeuvring
94
All individual survivors, whose original location is known, have been modelled as a separate (one person) groups in AENEAS. Thus these agents representing these survivors have the original location, the gender and the age of the survivor in question. Thus it is possible to trace such an agent in the simulation, and compare this information with known facts.
Deck Extrapolation Known Difference Location, number cabins else-
where cabins else-
where cabins else-
where (difference, elsewhere)
Group (simulation) 8 (G)
32 6 2 1 30 5 Crew Day room
5 G G-Deck MVZ C – G Crew Day room
Deck Extrapolation Known Difference Location, number cabins elsew. cabins elsew. cabins elsew. (elsewhere)
Group (simulation) 7 (F)
111 20 19 5 92 15 Crew Day room
8 G F-Deck MVZ C – G Crew Day room
Crew Mess 7 F F-Deck MVZ C – G Crew MessDeck Extrapolation Known Difference Location, number
cabins elsew. cabins elsew. cabins elsew. (elsewhere) Group (simulation)
Over-flow crew
17 7 0 3 17 4 Casino 1 E C-Deck Crew MVZ B – E Casino
Cinema 3 C C-Deck Crew MVZ C – C Cinema
Deck Extrapolation Known Difference Location, number cabins elsew. cabins elsew. cabins elsew. (elsewhere)
Group (simulation) 6 (E)
82 53 14 7 68 46 Casino 1 E E-Deck MVZ B – E Casino/Baltic
Baltic Bar 30 E E-Deck MVZ B – E Casino/Baltic
Pub Admiral
15 D E-Deck MVZ C – D Pub Admiral
Deck Extrapolation Known Difference Location, number cabins elsew. cabins elsew. cabins elsew. (elsewhere)
Group (simulation) 5 (D)
114 20 7 15 107 5 Cafeteria Neptun
5 D D-Deck MVZ C – D Neptun
Deck Extrapolation Known Difference Location, number cabins elsew. cabins elsew. cabins elsew. (elsewhere)
Group (simulation) 5 (D) Air Chairs
31 13 6 13 25 0 - 0 - [-]
Deck Extrapolation Known Difference Location, number cabins elsew. cabins elsew. cabins elsew. (elsewhere)
Group (simulation) 4 (C) Bow 110 19 21 2 89 17 Night Club 10 C C-Bow MVZ C – Night Club Pub
Admiral 7 D C-Bow MVZ C – D Pub
Admiral Deck Extrapolation Known Difference Location, number
cabins elsew. cabins elsew. cabins elsew. (elsewhere) Group (simulation)
4 (C) Mid 108 19 9 5 99 14 Pub
Admiral 7 D C-Mid MVZ C – D Pub
Admiral Night Club 7 C C-Mid MVZ C – C Night Club Deck Extrapolation Known Difference Location, number Group (simulation)
cabins elsew. cabins elsew. cabins elsew. (elsewhere) 1 (A) Tween 187 40 34 0 153 40 Night Club 25 C Tween–MVZ C – C Night Club Cinema 15 C Tween-MVZ C – C Cinema The following Figure 60 shows the applied reaction times of the persons onboard for the real case.
Table 13: The extrapolation of the passenger locations on decks.

Seakeeping & Manoeuvring
95
Fig. 60 Distribution of (initial) reaction times of the persons in the real case. There are 989 persons on board altogether (crew and passengers).
REACTION TIME [s](NORMAL DISTRIB.)
MIN MAX MEAN
5 65 35
5 65 35
30 150 90
30 270 150
SOURCE OF NOISE

Seakeeping & Manoeuvring
96
6.12 Evacuation Routes 6.12.1 Cases 1 and 2 – IMO Night and Day Case The route definition is shown in the following Figure 61. The routes are identical for the day and night cases.
Fig. 61 Egress routes for cases 1 and 2. The evacuation routes are indicatedby red arrows. Few routes starting from crew cabins are blue, but merge inthe corridor into the same red egress route.
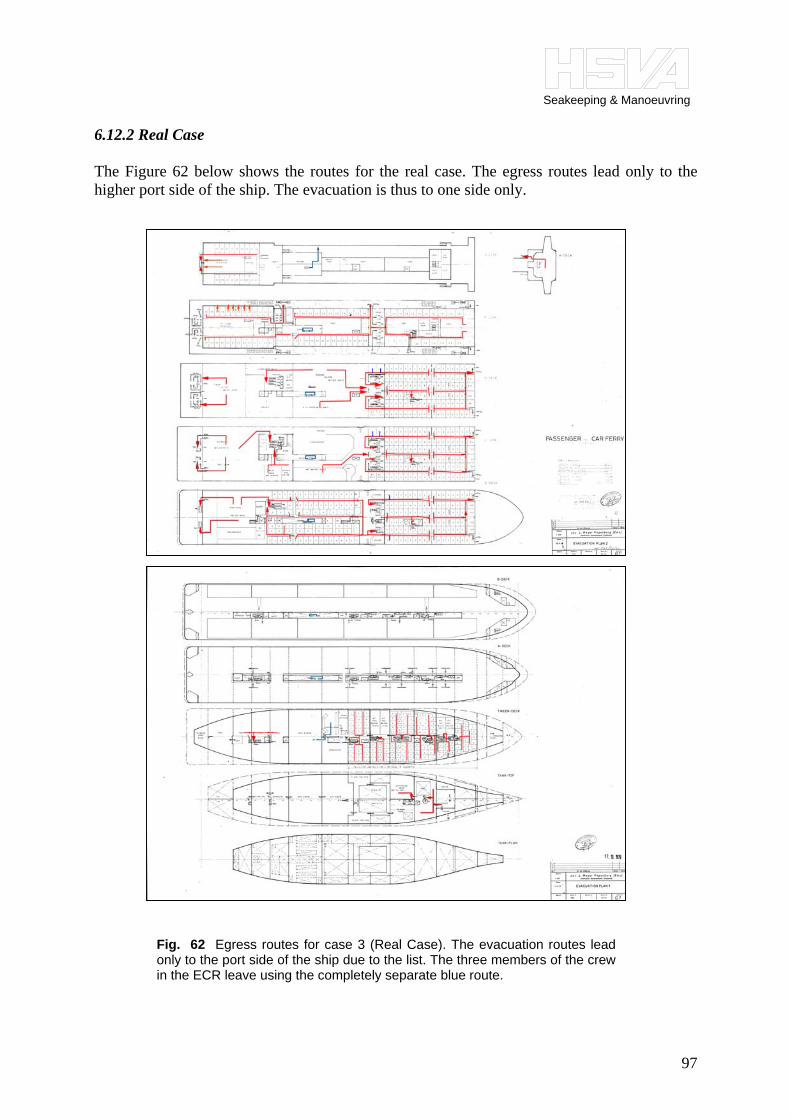
Seakeeping & Manoeuvring
97
6.12.2 Real Case The Figure 62 below shows the routes for the real case. The egress routes lead only to the higher port side of the ship. The evacuation is thus to one side only.
Fig. 62 Egress routes for case 3 (Real Case). The evacuation routes leadonly to the port side of the ship due to the list. The three members of the crewin the ECR leave using the completely separate blue route.

Seakeeping & Manoeuvring
98
The red egress routes in the Real Case are similar to those in the IMO Night and Day cases, but lead only to the higher port side of the vessel. The MV Estonia evacuation was in practice one-sided. Most survivors decided to get to the higher port side. There are only few individuals, who dived deep into the sea or were swept overboard by the waves to the starboard side of the vessel. Some of the crew members left their cabins on Deck 7 through the cabin windows directly on to the Deck 7. This is shown as additional red arrows pointing out through the cabin windows s at the stern on Deck 7. The three members of the crew in the ECR left using another completely separate route through the engine room and upwards from Deck 1 to Deck 8 using the steep stairs and platforms in between inside the engine casing leading to the funnel. This route is shown with blue color in Figure 62. These stairs and platforms are illustrated in detail in Figures 63 and 64.
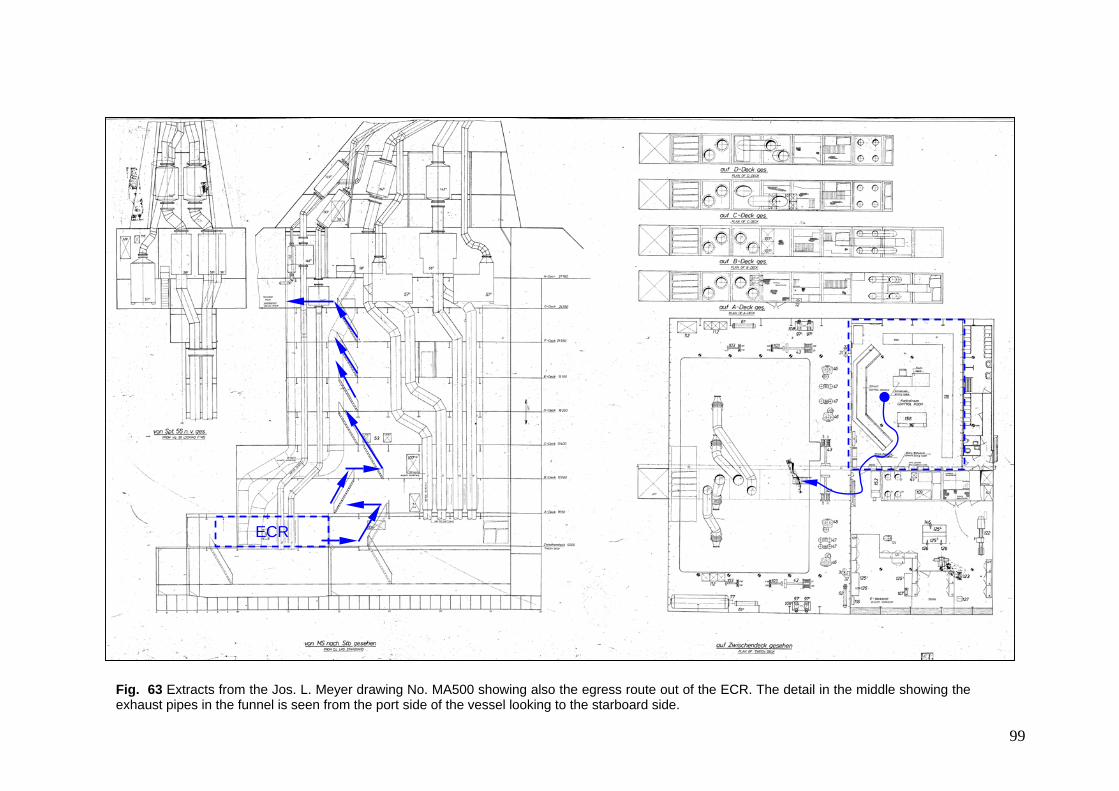
Seakeeping & Manoeuvring Seakeeping & Manoeuvring
99
Fig. 63 Extracts from the Jos. L. Meyer drawing No. MA500 showing also the egress route out of the ECR. The detail in the middle showing theexhaust pipes in the funnel is seen from the port side of the vessel looking to the starboard side.
ECR

Seakeeping & Manoeuvring Seakeeping & Manoeuvring
100
Fig. 64 Extracts from the Jos. L. Meyer drawing No. MA500 showing also the upper parts of the egress route out of the ECR in detail.

Seakeeping & Manoeuvring
101
6.13 Description of the Model and Simulation Rationale The analysis comprises two steps:
1. [500] simulation runs to obtain a distribution of evacuation durations. 2. Detailed analysis to examine the evacuation pattern for the simulation run yielding the
95% evacuation duration of the distribution obtained in step 1 and the associated density distribution.
For step 1, the results are presented as distribution diagram (frequency of simulation runs with a particular time vs. duration) and as temporal development of numbers of persons reaching a muster station (evacuation curves). For step 2, the time dependent progress of the evacuation progress per egress route can be shown together with the animations. Density plots give an overview of the complete evacuation progress. They are used to accentuate areas, where congestion occurs. In order to interpret the plot correctly, it is important to understand the underlying mechanism used to determine the density: Making use of the discrete grid, the density for one cell is determined by looking at the cell in question and its neighbouring. In the example, an area of 1.44 m² (corresponding to 9 cells) is occupied by 5 persons, giving a density value of 3.5 P/m².
For highlighting areas of significant congestion, the following procedure is applied: According to the IMO MSC/Circ. 1033, a significant congestion occurs if the local density is higher than 4 P/m² during 10% of the evacuation duration. Calculating the density for the cells after every time step, the value is compared with the marginal value of 4 P/m². If the calculated value is higher, the counter of the appropriate cell is increased by one. At the end of the simulation run the counters of all cells show how often the marginal value was exceeded. This value is then visualized by a colour distribution ranging from green to red. In all density plots shown the red cells mark areas where significant congestion according to the definition of IMO MSC/Circ. 1033 occurred, while green cells mark areas with minimal congestion.
Fig. 65 Example for the density calculation in acellular grid.

Seakeeping & Manoeuvring
102
7 Evacuation Simulations 7.1 Introduction To the author’s knowledge this the first time ever a simulation of an evacuation under the influence of ship motions is used to investigate a real accident at sea. For this reason a relatively careful or gradual approach was chosen. Three different types of evacuation simulation were carried out: (1) Under different angles of ship list; (2) using empirical ship motion data of the accident, that is, re-constructed ship motion data based on the survivors’ testimonies; (3) using ship motion data of the accident as simulated with the program HSVA ROLLS. All these give light to different aspects of the evacuation and together they should give the best answers available. 7.2 Effect of the Static Heel Angle on the Evacuation Time of the MV Estonia Before starting to run evacuation simulations with AENEAS under the influence of the ship motions a few evacuation cases with different values of ship list were simulated to illustrate the effect of a steady heeling angle on the evacuation performance of the passengers and crew. The simulations were run for 989 persons onboard, positioned in cabins and public spaces as known in the MV Estonia on 28.09.1994 just before 01:00. The person distribution is shown in Figure 57. The persons on board have standard population properties. The evacuation is one-sided to the higher port side only, as in the MV Estonia Real Case. The computed evacuation times at different heeling angles are shown as curves in Figure 66. The small steady heeling angles do not cause significant problems to the passengers. When
Fig. 66 Evacuation times of the MV Estonia with different angles of list. Mean, maximum,minimum and 95 percentile curves of the 500 simulations are shown.

Seakeeping & Manoeuvring
103
the heeling angle reaches 15° the evacuation time starts to show clear increase and beyond the heeling angle of 20° the evacuation time increases very rapidly with the heeling angle. Simultaneously the evacuation time distribution becomes significantly wider, that is, the difference between the shortest and the longest evacuation time of all passengers becomes larger. The main reason for such a difference in the evacuation times is the distribution of the passenger properties. Thus a “fit” person near the lifeboats needs a very short time to reach them, whereas a “weak” person very far away from the lifeboats needs a long time to reach them. When the angle of heel increases the agent properties gain in importance, as it becomes more strenuous to advance on the inclined decks and corridors. If we limit the time for the evacuation in the simulation, especially at higher heeling angles the weaker agents further away from the exits do not anymore reach them in the given time constraint. This behavior corresponds well with the experience. The Estonia accident report (JAIC, 1997) shows in Table 7.12 the relative percentages of the survived passengers: The highest survival rate of 43 percent was reached by men in the age group of 20-24 years. Men over 54 years, women and children of all ages show considerably lower survival rates. Simplifying we can say that at 20° of heel the evacuation time (taken as the 95 percentile) is more than three times that of an intact ship in calm water. At inclinations beyond the 20° it becomes increasingly difficult to get out of the ship, the progress on the inclined decks and stairs becomes more strenuous, and the time for the effort increases very rapidly. According to the carefully considered modeling used in AENEAS most passenger movement on decks and corridors in the direction of the slope stops at the angle of 30°. Conclusions
• The evacuation time grows moderately up to the heel angle 15°, and thereafter increasingly rapidly.
• At the 20° of heel the evacuation time up to embarkation stations is more than three times the evacuation time of an intact ship in calm water.
• At the inclinations beyond the 20° it becomes increasingly difficult to get out of the ship, and the differences inside the passenger/crew populations increase rapidly. The less fit will lag behind, which leads to the survival of the fittest.
• At the heel angle 30° most ordinary pedestrian movement in the ship becomes impossible, strenuous individual efforts to climb out of the ship may continue, but these cannot be regarded as an effective way of evacuation.
• Evacuation analysis of an inclined ship may show possible bottlenecks in the passenger flow, which are not revealed in an evacuation analysis of a ship in calm water, that is, having a zero angle of heel.
• In an emergency it is important to carry out the evacuation early enough, when the inclination of a damaged ship is still sufficiently low. Evacuation of a ship having a large heeling angle can be very difficult.
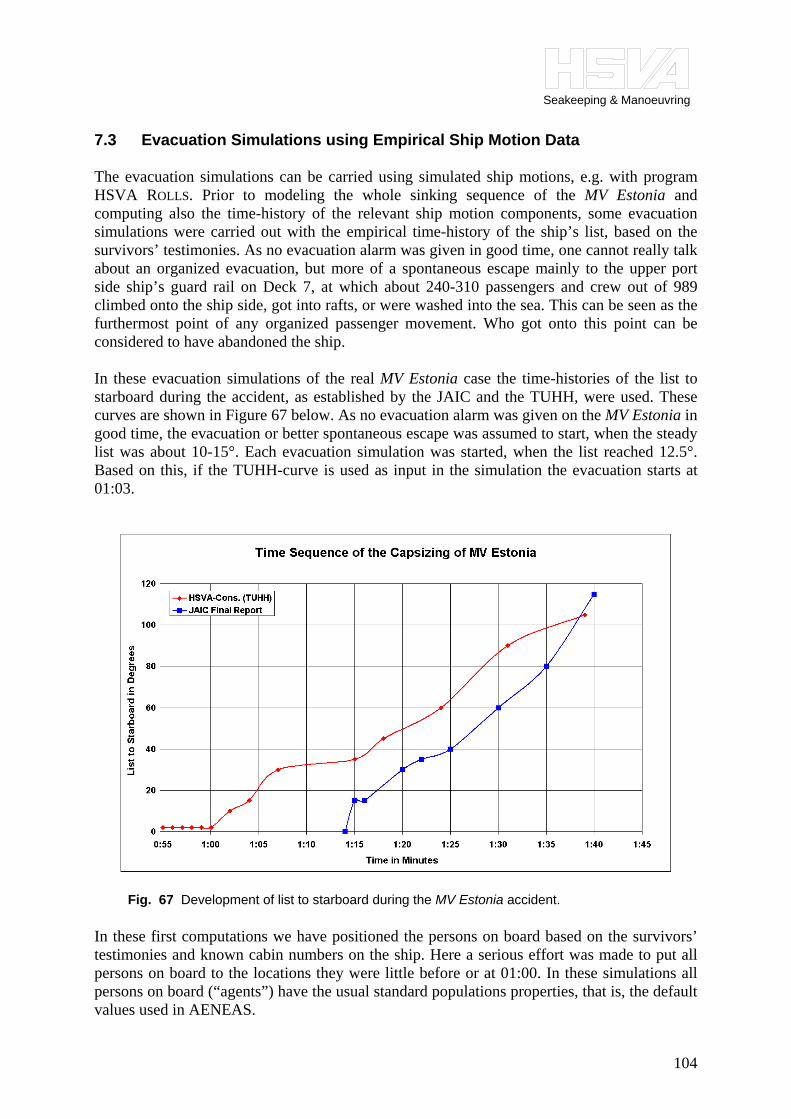
Seakeeping & Manoeuvring
104
7.3 Evacuation Simulations using Empirical Ship Motion Data The evacuation simulations can be carried using simulated ship motions, e.g. with program HSVA ROLLS. Prior to modeling the whole sinking sequence of the MV Estonia and computing also the time-history of the relevant ship motion components, some evacuation simulations were carried out with the empirical time-history of the ship’s list, based on the survivors’ testimonies. As no evacuation alarm was given in good time, one cannot really talk about an organized evacuation, but more of a spontaneous escape mainly to the upper port side ship’s guard rail on Deck 7, at which about 240-310 passengers and crew out of 989 climbed onto the ship side, got into rafts, or were washed into the sea. This can be seen as the furthermost point of any organized passenger movement. Who got onto this point can be considered to have abandoned the ship. In these evacuation simulations of the real MV Estonia case the time-histories of the list to starboard during the accident, as established by the JAIC and the TUHH, were used. These curves are shown in Figure 67 below. As no evacuation alarm was given on the MV Estonia in good time, the evacuation or better spontaneous escape was assumed to start, when the steady list was about 10-15°. Each evacuation simulation was started, when the list reached 12.5°. Based on this, if the TUHH-curve is used as input in the simulation the evacuation starts at 01:03.
In these first computations we have positioned the persons on board based on the survivors’ testimonies and known cabin numbers on the ship. Here a serious effort was made to put all persons on board to the locations they were little before or at 01:00. In these simulations all persons on board (“agents”) have the usual standard populations properties, that is, the default values used in AENEAS.
Fig. 67 Development of list to starboard during the MV Estonia accident.
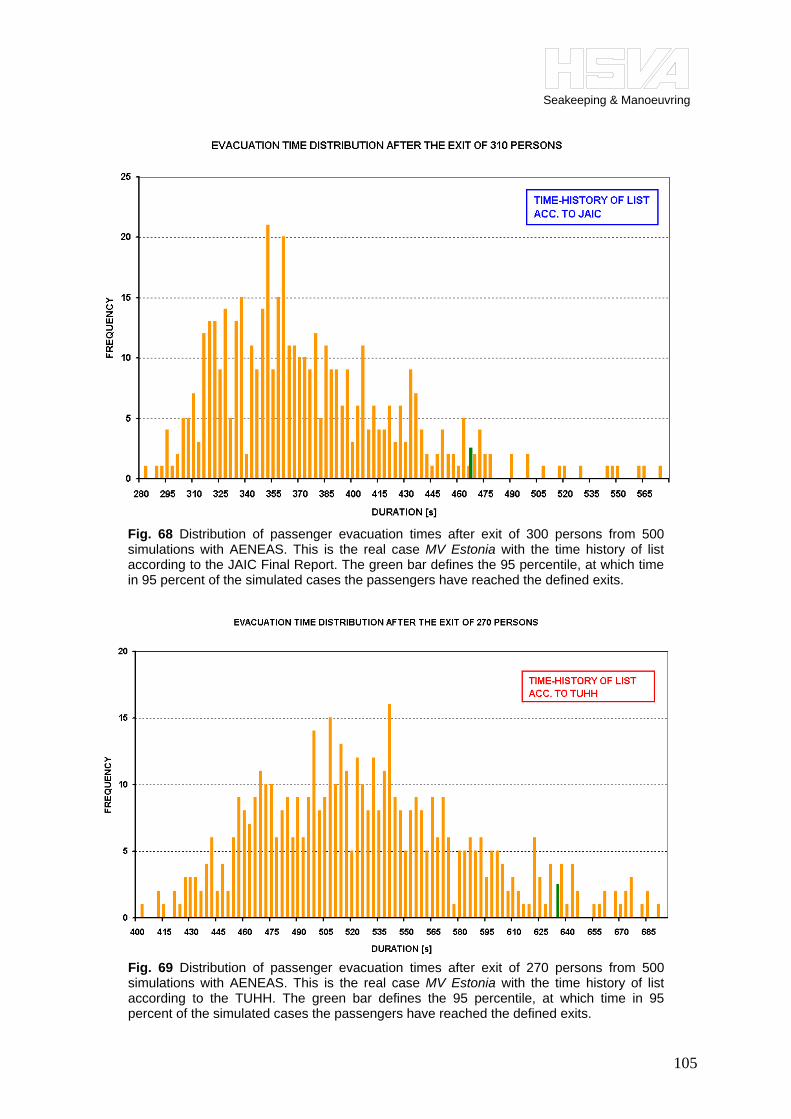
Seakeeping & Manoeuvring
105
Fig. 68 Distribution of passenger evacuation times after exit of 300 persons from 500simulations with AENEAS. This is the real case MV Estonia with the time history of listaccording to the JAIC Final Report. The green bar defines the 95 percentile, at which timein 95 percent of the simulated cases the passengers have reached the defined exits.
Fig. 69 Distribution of passenger evacuation times after exit of 270 persons from 500simulations with AENEAS. This is the real case MV Estonia with the time history of list according to the TUHH. The green bar defines the 95 percentile, at which time in 95percent of the simulated cases the passengers have reached the defined exits.
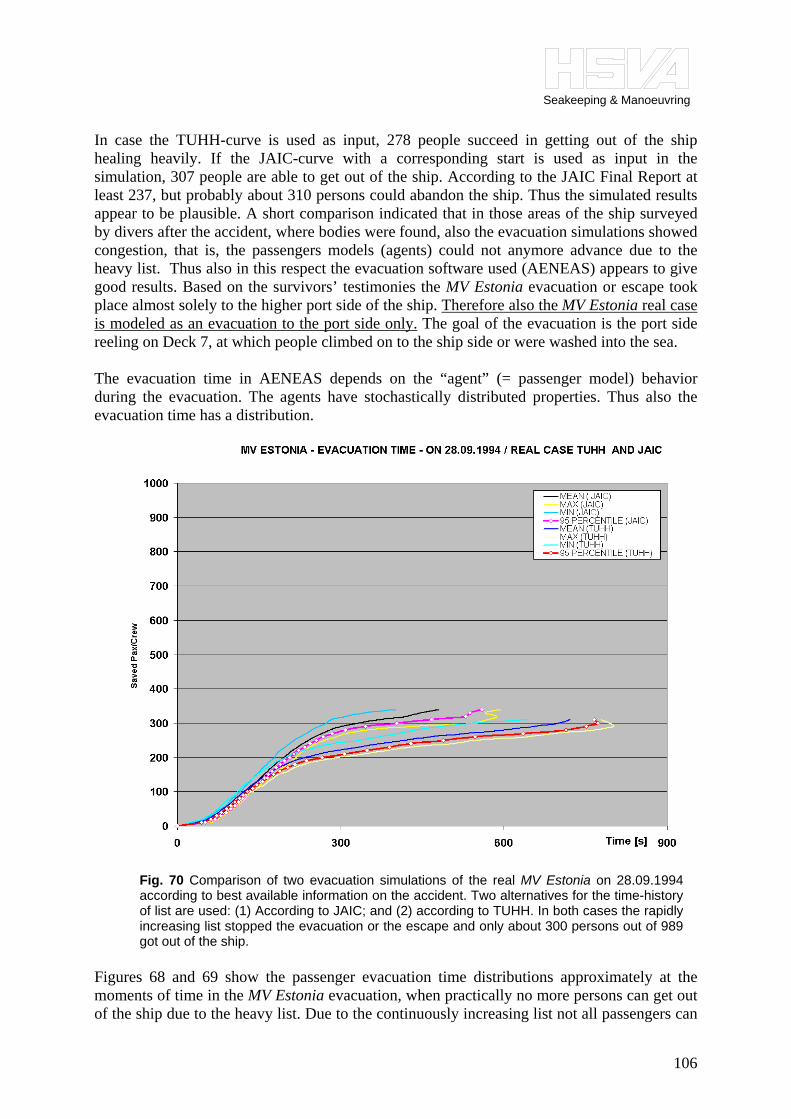
Seakeeping & Manoeuvring
106
In case the TUHH-curve is used as input, 278 people succeed in getting out of the ship healing heavily. If the JAIC-curve with a corresponding start is used as input in the simulation, 307 people are able to get out of the ship. According to the JAIC Final Report at least 237, but probably about 310 persons could abandon the ship. Thus the simulated results appear to be plausible. A short comparison indicated that in those areas of the ship surveyed by divers after the accident, where bodies were found, also the evacuation simulations showed congestion, that is, the passengers models (agents) could not anymore advance due to the heavy list. Thus also in this respect the evacuation software used (AENEAS) appears to give good results. Based on the survivors’ testimonies the MV Estonia evacuation or escape took place almost solely to the higher port side of the ship. Therefore also the MV Estonia real case is modeled as an evacuation to the port side only. The goal of the evacuation is the port side reeling on Deck 7, at which people climbed on to the ship side or were washed into the sea. The evacuation time in AENEAS depends on the “agent” (= passenger model) behavior during the evacuation. The agents have stochastically distributed properties. Thus also the evacuation time has a distribution.
Figures 68 and 69 show the passenger evacuation time distributions approximately at the moments of time in the MV Estonia evacuation, when practically no more persons can get out of the ship due to the heavy list. Due to the continuously increasing list not all passengers can
Fig. 70 Comparison of two evacuation simulations of the real MV Estonia on 28.09.1994according to best available information on the accident. Two alternatives for the time-historyof list are used: (1) According to JAIC; and (2) according to TUHH. In both cases the rapidlyincreasing list stopped the evacuation or the escape and only about 300 persons out of 989got out of the ship.

Seakeeping & Manoeuvring
107
get out of the ship. Therefore it is not possible to show the evacuation times for the whole evacuation of all the members of passengers and crew. Figure 70 shows the evacuation curves for time-history assumptions of JAIC and of TUHH. Even if the development of list according to JAIC and according to TUHH are somewhat different, in both cases the number persons succeeding in getting out of the ship remains below 350 out of all 989 persons on board in all simulations. 7.4 Comparison with the IMO standard Night Case for the MV Estonia A comparison of the advanced evacuation simulation of the IMO Standard Night Case with the real MV Estonia evacuation case shows some interesting results: The standard IMO Night and Day Cases can provide useful information in the ship design phase, of an idealized evacuation process of a standard population on a ship interior, which is fixed in space having zero trim and list. Thus potential bottlenecks for evacuation in the interior layout can be found out. The real evacuation cases can, however, significantly differ from the standard IMO cases.
Figure 71 illustrates the symmetric evacuation of the IMO Night Case (1439 Persons) to both sides of the MV Estonia and the asymmetric evacuation of the MV Estonia (989 Persons) to the port side as in real case, however, without ship motions included. Standard population
Fig. 71 Comparison of the evacuation simulation of the standard IMO Night Case on MV Estoniaand simulation of the real MV Estonia on 28.09.1994 without list. The IMO Night Case evacuationis symmetric to both sides of ship. In the real MV Estonia case the evacuation is asymmetric tothe port side only.

Seakeeping & Manoeuvring
108
properties were used. For purposes of comparison the initial reaction time in both cases is equal. It is easy to see that the groups of curves deviate from each other only relatively insignificantly. The one-sided evacuation proceeds little slower than the IMO Night Case to both sides, as it should. Figure 72 shows the comparison between the IMO Night Case and the real MV Estonia evacuation simulation with the ship list development based on the JAIC Final Report. The upper curve shows the evacuation process in the IMO standard Night Case. Such an information is available when a new vessel is designed, built and classified. The lower curve shows approximately how the evacuation proceeded during the MV Estonia accident. The increasing ship list practically stops the evacuation and only about 300 persons of the 989 are able to get out. These two curves show the “design case” and what turned out to be the reality in case of the MV Estonia. The difference is considerable.
Conclusions: • An evacuation to one-side only is likely to proceed only non-essentially more slowly
than an evacuation to both sides of the ship.
• The rapidly increasing ship list has a remarkable effect on the evacuation process, slowing it down to the extent that only about 300 persons (~ 30 percent) succeed in getting out of the ship.
MV ESTONIA - EVACUATION TIME - ON 28.09.1994 / JAIC AND AS IMO NIGHT CASE
0
200
400
600
800
1000
1200
1400
1600
0 300 600 900 1200 1500Time [s]
Sav
ed P
ax/C
rew
MEAN ( IMO NC)MAX (IMO NC)MIN (JAIC)95 PERCENTILE (JAIC)MEAN (JAIC)MAX (JAIC)MIN (JAIC)95 PERCENTILE (JAIC)
DIFFERENCE: - REAL POP. VS IMO STANDARD POP. - ONE SIDED EVAC. VS SYMM. EVAC. - SHIP LIST ACC. JAIC FINAL REPORT
Fig. 72 Comparison of the evacuation simulation of the standard IMO Night Case on MVEstonia and simulation of the real MV Estonia on 28.09.1994 according to best availableinformation on the accident. In the real case the rapidly increasing list of the vessel stoppedthe evacuation or the escape and only about 300 persons out of 989 got out of the ship. TheIMO standard case without ship heel does not reflect this problem.

Seakeeping & Manoeuvring
109
7.5 Evacuation Simulation of the MV Estonia using Non-Standard Population Properties
A suitable ship motion history computed with the program HSVA ROLLS, described in Chapter 3.4.1, and shown in Figures 40 and 73 was used as an input into AENEAS and the first evacuation simulations were carried out. About 530 passengers got out. Therefore the ship heeling angles in the time-history were elevated with 2.5 degrees. When this modified time-history of the ship motion curve was used as input, in average about 280 persons could abandon the ship. The former result is too optimistic, but the latter is a very feasible result fitting well with the known facts on the accident, namely that about 240-310 persons succeeded in abandoning the ship. Figure 74 illustrates this case.
In these simulations also the 163 persons, who are known to have abandoned the ship, were modeled with digital agents having correct walking speeds and initial locations. A single evacuation simulation run leading to the exit of 296 persons from the ship was carried out, in which the following situation arose: Of the mentioned 163 agents only 57 could abandon the ship in the simulation. That is, many of the digital agents representing the real persons who abandoned the ship, did not succeed to do this in the simulation. Next an individual evacuation simulation leading to exit of 530 persons from the ship was carried out using the original ship motion curve in Figure 73. The following situation arose: Of the mentioned 163 agents only 96 could abandon the ship in the simulation, even if the overall number of persons abandoning the ship was too high (530). On the first glance these results appear poor. They, however, give us an important message: Those real persons who
Fig. 73 Time-history of roll used as a basis curve for the input in the evacuation simulations.
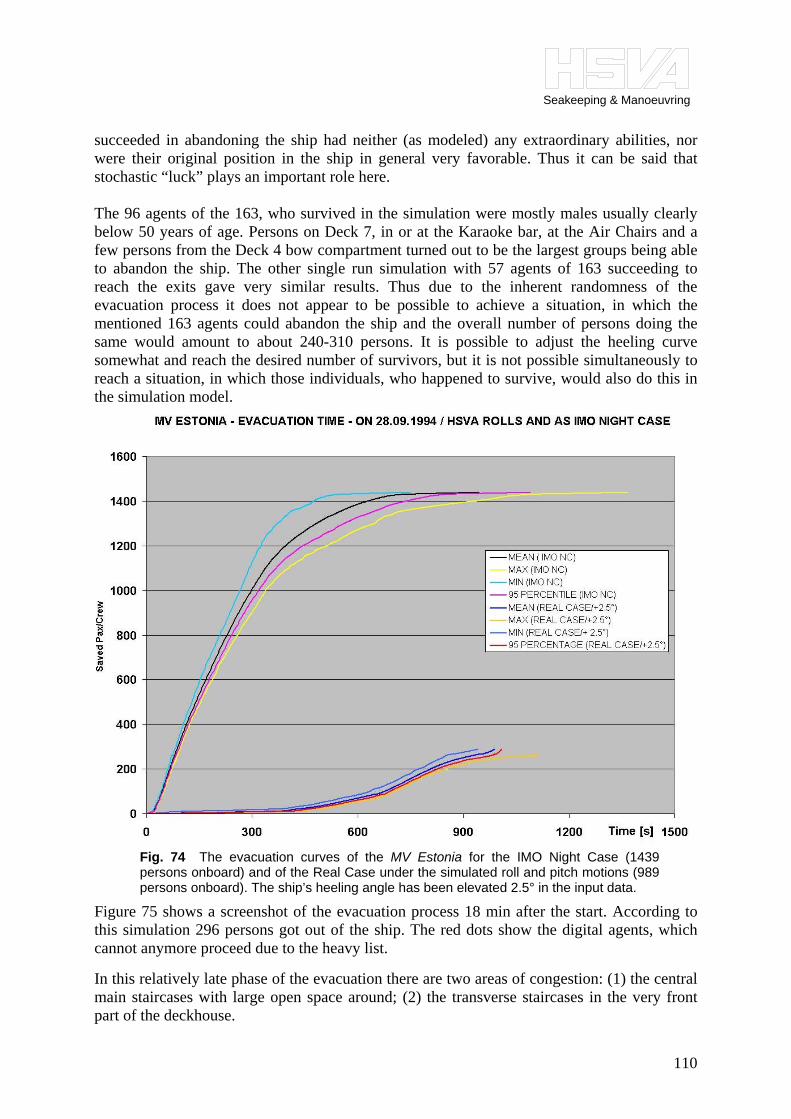
Seakeeping & Manoeuvring
110
succeeded in abandoning the ship had neither (as modeled) any extraordinary abilities, nor were their original position in the ship in general very favorable. Thus it can be said that stochastic “luck” plays an important role here. The 96 agents of the 163, who survived in the simulation were mostly males usually clearly below 50 years of age. Persons on Deck 7, in or at the Karaoke bar, at the Air Chairs and a few persons from the Deck 4 bow compartment turned out to be the largest groups being able to abandon the ship. The other single run simulation with 57 agents of 163 succeeding to reach the exits gave very similar results. Thus due to the inherent randomness of the evacuation process it does not appear to be possible to achieve a situation, in which the mentioned 163 agents could abandon the ship and the overall number of persons doing the same would amount to about 240-310 persons. It is possible to adjust the heeling curve somewhat and reach the desired number of survivors, but it is not possible simultaneously to reach a situation, in which those individuals, who happened to survive, would also do this in the simulation model.
Figure 75 shows a screenshot of the evacuation process 18 min after the start. According to this simulation 296 persons got out of the ship. The red dots show the digital agents, which cannot anymore proceed due to the heavy list. In this relatively late phase of the evacuation there are two areas of congestion: (1) the central main staircases with large open space around; (2) the transverse staircases in the very front part of the deckhouse.
Fig. 74 The evacuation curves of the MV Estonia for the IMO Night Case (1439persons onboard) and of the Real Case under the simulated roll and pitch motions (989persons onboard). The ship’s heeling angle has been elevated 2.5° in the input data.

Seakeeping & Manoeuvring
111
Fig. 76 The central staircases.
(1) The main staircases are a central point in the evacuation routes, a congestion there may be unavoidable. The stairs are correctly laid in the longitudinal direction. The large open space around the stairs is difficult to cross at higher values of ship list. Thus on the basis of the evacuation simulation one could expect that the escape of many passengers ended up right here.
(2) The staircases at the front part of the deckhouse are built in transverse direction as shown in Figure 75. Usually staircases have an overall effective rise of about 30°. If the ship heels 20-30° the overall angle of a transverse staircase becomes 50-60°. Such a staircase forms in effect a dead end in the escape route. In the evacuation simulation, however, the agents cannot make a decision to change the escape route, if this turns out to be impassable. In reality most of those passengers, who tried this route must either have kept trying, got stuck between steep parts of the staircase or turned back and tried another route possibly ending up behind the other passengers. Thus the prerequisites for an effective evacuation in this area were not very good. Based on the
Fig. 75 A Screenshot of the evacuation process 18 min after the start. The red dots show thedigital agents, which cannot anymore proceed due to the heavy list or congestion.

Seakeeping & Manoeuvring
112
simulations it can be expected that the escape of a significant number of passengers ended up here at the transverse staircases in the front part of the passenger compartments on Decks 4-6. Evacuation of a ship with a large list or heeling angle is undoubtedly very slow and can be difficult. Two areas are particularly difficult to pass in the MV Estonia having a significant list:
• Large open areas: halls, lobbies etc.
• Transverse staircases 7.6 Comparison of the Evacuation Simulations with the Real Evacuation on
the MV Estonia Figure 77 shows the number of victims found by divers according to the JAIC Final Report (1997). The areas surveyed by divers are indicated with green color. The numbers in the figure show the number of victims in different areas, The letters X in the Figure 77 indicate locations of uncounted number of victims. It should be kept in mind that around 680-750
Fig. 77 Number of victims in the areas surveyed by divers (JAIC, 1997).

Seakeeping & Manoeuvring
113
victims remained inside. Thus each of the decks shown in Figure 77 should contain about approximately 135-150 victims. The areas surveyed by the divers form only small part of the decks. Thus no conclusions should be drawn on the number of victims on other areas. The surveyed areas show a large number of victims in the large open space around the central staircases, very much like indicated by the evacuation simulations. Several victims on different decks were found around the transverse staircases, which with increasing heeling became impassable. In the real case many of the persons trying to use the transverse staircases may have changed their evacuation route and tried to get out via the central staircases, whereas in the evacuation simulation this change of route is not possible. Therefore the evacuation simulation is likely to show more victims in this area than what was found in the wreck. Figure 77 shows also 10 victims in few cabins amidships on the port side of the Deck 7, actually not far from the exits to open Deck 7. This found is somewhat astonishing and is also not predicted by the evacuation simulations. As possible reasons can be mentioned: (1) The persons got hurt in these cabins due to the sudden initial heel; (2) Loose items or those broken free blocked cabin doors. Opening a cabin door inwards in the cabin is in such a situation difficult. If there is no rail to hold on, the person trying to pull the door open can actually block the door him- or herself. 7.7 Escape of the Three Members of the Crew from the Engine Control Room The three members of the crew in the ECR play an important role in the MV Estonia investigation as they are the last persons, who saw the bow ramp in a closed or almost closed position. Their testimonies contain many details, which can hardly be invented, and appear mostly plausible, but the occurring times of certain individual events given in them conflict with some other testimonies and some results of analysis presented here. Therefore the last possible starting time of their escape from the ECR is of great interest. For this reason their escape from the ECR through the Engine Room and up the staircase system inside the engine casing up to Deck 8 was modeled with AENEAS. These crew members have a separate egress route illustrated in Figures 62-64. This route leads to Deck 8, that is, one deck higher than the Deck 7, where passengers and other members of the crew were heading to. These three crew members are all completely separately modeled in AENEAS as three one person groups. This allows their individual walking speeds depending on their gender and age to be modeled properly according to IMO Circ. 1033. Their individual reaction times, which represent their initial waiting times after the assumed start of the general evacuation (escape of passengers) until they left the ECR, were varied in order to establish the last possible moment they could leave the ECR and still get onto the open Deck 8 before this became impossible due to the increasing heeling angle of the ship.
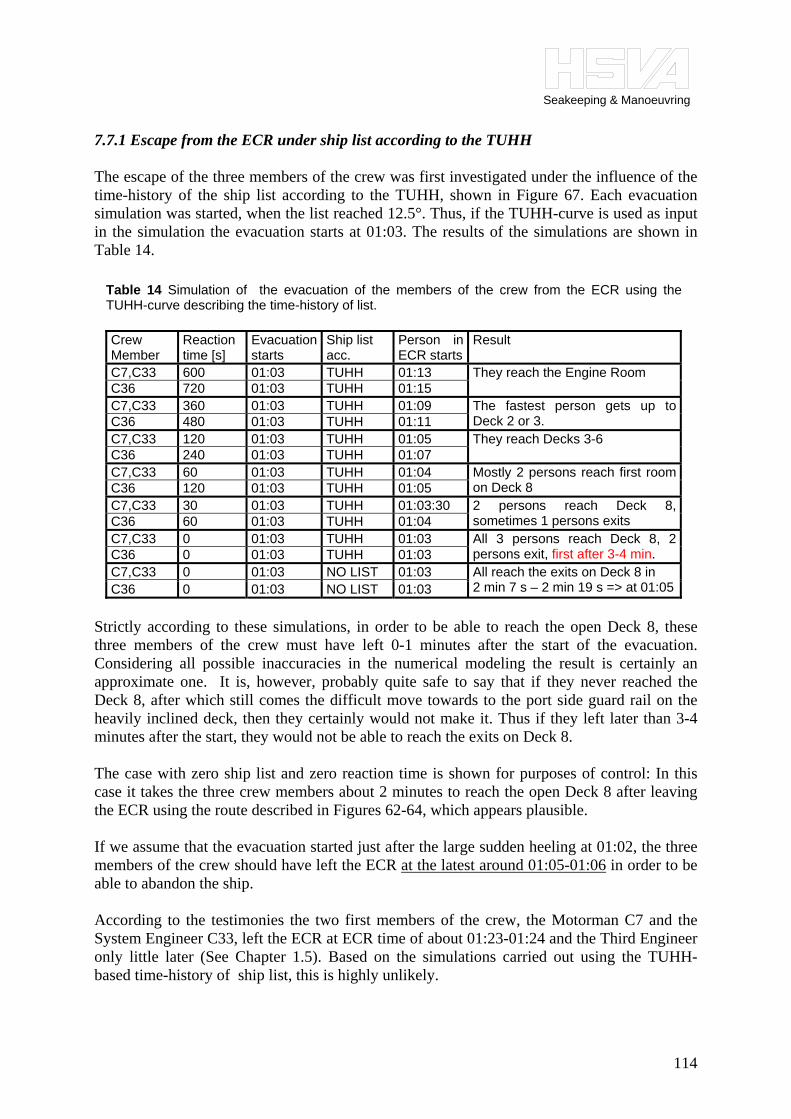
Seakeeping & Manoeuvring
114
7.7.1 Escape from the ECR under ship list according to the TUHH The escape of the three members of the crew was first investigated under the influence of the time-history of the ship list according to the TUHH, shown in Figure 67. Each evacuation simulation was started, when the list reached 12.5°. Thus, if the TUHH-curve is used as input in the simulation the evacuation starts at 01:03. The results of the simulations are shown in Table 14.
Crew Member
Reaction time [s]
Evacuation starts
Ship list acc.
Person in ECR starts
Result
C7,C33 600 01:03 TUHH 01:13 C36 720 01:03 TUHH 01:15
They reach the Engine Room
C7,C33 360 01:03 TUHH 01:09 C36 480 01:03 TUHH 01:11
The fastest person gets up to Deck 2 or 3.
C7,C33 120 01:03 TUHH 01:05 C36 240 01:03 TUHH 01:07
They reach Decks 3-6
C7,C33 60 01:03 TUHH 01:04 C36 120 01:03 TUHH 01:05
Mostly 2 persons reach first room on Deck 8
C7,C33 30 01:03 TUHH 01:03:30 C36 60 01:03 TUHH 01:04
2 persons reach Deck 8, sometimes 1 persons exits
C7,C33 0 01:03 TUHH 01:03 C36 0 01:03 TUHH 01:03
All 3 persons reach Deck 8, 2 persons exit, first after 3-4 min.
C7,C33 0 01:03 NO LIST 01:03 C36 0 01:03 NO LIST 01:03
All reach the exits on Deck 8 in 2 min 7 s – 2 min 19 s => at 01:05
Strictly according to these simulations, in order to be able to reach the open Deck 8, these three members of the crew must have left 0-1 minutes after the start of the evacuation. Considering all possible inaccuracies in the numerical modeling the result is certainly an approximate one. It is, however, probably quite safe to say that if they never reached the Deck 8, after which still comes the difficult move towards to the port side guard rail on the heavily inclined deck, then they certainly would not make it. Thus if they left later than 3-4 minutes after the start, they would not be able to reach the exits on Deck 8. The case with zero ship list and zero reaction time is shown for purposes of control: In this case it takes the three crew members about 2 minutes to reach the open Deck 8 after leaving the ECR using the route described in Figures 62-64, which appears plausible. If we assume that the evacuation started just after the large sudden heeling at 01:02, the three members of the crew should have left the ECR at the latest around 01:05-01:06 in order to be able to abandon the ship. According to the testimonies the two first members of the crew, the Motorman C7 and the System Engineer C33, left the ECR at ECR time of about 01:23-01:24 and the Third Engineer only little later (See Chapter 1.5). Based on the simulations carried out using the TUHH- based time-history of ship list, this is highly unlikely.
Table 14 Simulation of the evacuation of the members of the crew from the ECR using the TUHH-curve describing the time-history of list.
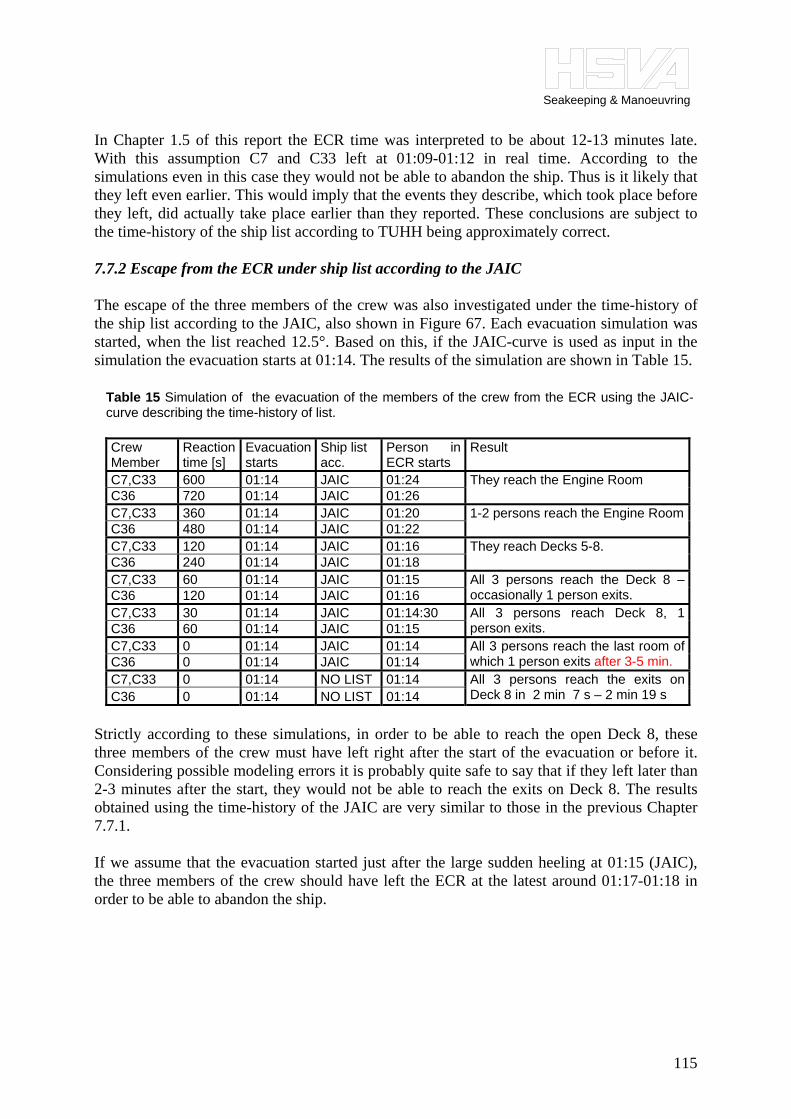
Seakeeping & Manoeuvring
115
In Chapter 1.5 of this report the ECR time was interpreted to be about 12-13 minutes late. With this assumption C7 and C33 left at 01:09-01:12 in real time. According to the simulations even in this case they would not be able to abandon the ship. Thus is it likely that they left even earlier. This would imply that the events they describe, which took place before they left, did actually take place earlier than they reported. These conclusions are subject to the time-history of the ship list according to TUHH being approximately correct. 7.7.2 Escape from the ECR under ship list according to the JAIC The escape of the three members of the crew was also investigated under the time-history of the ship list according to the JAIC, also shown in Figure 67. Each evacuation simulation was started, when the list reached 12.5°. Based on this, if the JAIC-curve is used as input in the simulation the evacuation starts at 01:14. The results of the simulation are shown in Table 15.
Crew Member
Reaction time [s]
Evacuation starts
Ship list acc.
Person in ECR starts
Result
C7,C33 600 01:14 JAIC 01:24 C36 720 01:14 JAIC 01:26
They reach the Engine Room
C7,C33 360 01:14 JAIC 01:20 C36 480 01:14 JAIC 01:22
1-2 persons reach the Engine Room
C7,C33 120 01:14 JAIC 01:16 C36 240 01:14 JAIC 01:18
They reach Decks 5-8.
C7,C33 60 01:14 JAIC 01:15 C36 120 01:14 JAIC 01:16
All 3 persons reach the Deck 8 – occasionally 1 person exits.
C7,C33 30 01:14 JAIC 01:14:30 C36 60 01:14 JAIC 01:15
All 3 persons reach Deck 8, 1 person exits.
C7,C33 0 01:14 JAIC 01:14 C36 0 01:14 JAIC 01:14
All 3 persons reach the last room of which 1 person exits after 3-5 min.
C7,C33 0 01:14 NO LIST 01:14 C36 0 01:14 NO LIST 01:14
All 3 persons reach the exits on Deck 8 in 2 min 7 s – 2 min 19 s
Strictly according to these simulations, in order to be able to reach the open Deck 8, these three members of the crew must have left right after the start of the evacuation or before it. Considering possible modeling errors it is probably quite safe to say that if they left later than 2-3 minutes after the start, they would not be able to reach the exits on Deck 8. The results obtained using the time-history of the JAIC are very similar to those in the previous Chapter 7.7.1. If we assume that the evacuation started just after the large sudden heeling at 01:15 (JAIC), the three members of the crew should have left the ECR at the latest around 01:17-01:18 in order to be able to abandon the ship.
Table 15 Simulation of the evacuation of the members of the crew from the ECR using the JAIC-curve describing the time-history of list.

Seakeeping & Manoeuvring
116
7.7.3 Escape from the ECR under ship motions according to the HSVA ROLLS simulation The escape of the three members of the crew was also investigated under the time-history of the ship list according to the HSVA ROLLS simulation, shown in Figure 73. The time-history of the roll motion is elevated with 2.5° as explained in Chapter 7.5. In the simulation the evacuation starts at 01:03. The results are shown in Table 16.
Crew Member
Reaction time [s]
Evacuation starts
Ship list acc.
Person in ECR starts
Result
C7,C33 600 01:03 ROLLS 01:13 C36 720 01:03 ROLLS 01:15
They reach the Engine Room, Deck 2, rarely Deck 2 in 14-16 min.
C7,C33 360 01:03 ROLLS 01:09 C36 480 01:03 ROLLS 01:11
All 3 reach the Engine Room, rarely 1 per-son reaches Deck 4 in 14-16 min.
C7,C33 120 01:03 ROLLS 01:05 C36 240 01:03 ROLLS 01:07
2 persons reach Deck 3-5, rarely 1 person reaches Deck 6 in 14-16 min.
C7,C33 60 01:03 ROLLS 01:04 C36 120 01:03 ROLLS 01:05
2 persons reach Deck 7, often 1 pers. Deck 8, rarely 1 exists after 15 min.
C7,C33 30 01:03 ROLLS 01:03:30 C36 60 01:03 ROLLS 01:04
1 person reaches Deck 6- 7, usually 2 persons exit on Deck 8 in 12-15 min.
C7,C33 0 01:03 ROLLS 01:03 C36 0 01:03 ROLLS 01:03
All 3 persons reach Deck 8, 2-3 persons exit after 14-16 min.
C7,C33 0 01:03 NO LIST 01:03 C36 0 01:03 NO LIST 01:03
All reach the exits on Deck 8 in 2 min 7 s – 2 min 19 s ~ at 01:05
Strictly according to these simulations, in order to be able to reach the open Deck 8, these three members of the crew must have left 1-2 minutes after the start of the evacuation. Considering possible modeling errors it is probably quite safe to say that if they left later than 3-4 minutes after the start, they would not be able to reach the exits on Deck 8. Notice that in this case the large sudden heel in the time-history of the heel significantly slows down the escape from the ECR. If they left the ECR instantly with out any delay, they probably got out 14-16 min later, that is, at 01:17-01:19. If they left two minutes after the start of the evacuation at 01:03, they would reach open Deck 8 after 01:19-01:21, if at all. If we assume that the evacuation started just after the large sudden heeling at 01:03, the three members of the crew should have left the ECR at the latest around 01:06-01:07 in order to be able to abandon the ship, that is, the 3-4 minutes after the start of the accident. When the slightly elevated time-history of the ship roll motion is used as input in the evacuation software AENEAS, about 280 persons succeed in abandoning the ship in the simulation. This corresponds well with known facts on the accident. Thus using the evacuation modeling to study the escape of the three members of the crew from the ECR should be quite reliable. It is very difficult to find a way how one could explain the testimonies of the crew members C7, C33 and C36 without moving them backwards in time, so that they left the ECR starting at latest at 01:06-01:07.
Table 16 Simulation of the evacuation of the members of the crew from the ECR using a computed time-history of the roll- and pitch-motions of the ship.

Seakeeping & Manoeuvring
117
7.8 Conclusions 7.8.1 Introduction The MV Estonia got a large list relatively fast. It cannot be excluded that in very similar circumstances it could have also capsized. In the ship motion simulations it is very easy to get this result with only small changes in the input data. If the ship had capsized, the casualty rate would have been even higher than the 86 percent, it is now.
• The ship got rapidly a list over 20°, after which the lifeboats could not be launched.
• The ship list reached angle 25-35° in a short time, after which it was very difficult to get out of the ship.
• Persons, who waited for an alarm or instructions by public announcements of what to
do, left in general too late.
• Of those, who abandoned the ship into life rafts and into water, about 50 percent survived.
Almost all persons on board went to higher port side of the vessel. This rendered 50 percent of the life saving appliances meaningless. In case of the MV Estonia this was probably not a great problem, as only about 237-310 persons of the total 989 persons on board got onto Deck 7 and abandoned the ship. If this number had been higher, there would also have been a shortage of life vests. Some survivors jumped into water, specially those who got into the starboard side of the ship. In some cases when hitting the water surface the life vest got loose or off. An example of the life vests onboard the MV Estonia can be seen in Figure 52. They are perhaps not optimally designed for jumping into the sea in an emergency. At least 21 persons are known to have abandoned the Deck 1 below the vehicle deck, which is farthest away from the Boat Deck 7. The real number is likely to be higher. A crude estimate of the number of persons on Deck 1 gives 190, which yields a minimum abandoning rate estimate of 11 percent for the passengers on Deck 1. According to the survivors’ testimonies they were pre-warned by the noises, already concerned of their safety and left in a hurry, many of them half-naked, just after the sudden large heeling motion of the ship. Without this pre-warning the survival rate from this area would have been even lower. The average ages of the persons on different decks were extrapolated from the survivors’ ages having cabins on these decks and adjusted to the yield correct average ages for the ship passenger and crew populations. Even if the extrapolated results are not totally reliable, they give an indication that there can be significant differences in the age distribution of passengers on different decks. It would be possible to take such features into account in the ship interior design. The age differences between the different decks can be at least one partially explaining factor to the very low survival rate of the passengers in cabins on Deck 5, where the average age

Seakeeping & Manoeuvring
118
was estimated to be 64 years: Only 4 persons are known to have abandoned their cabins on Deck 5: Based on this we get a minimum abandoning rate estimate of only about 4 percent. 7.8.2 The IMO Day/Night Case and the reality of the MV Estonia evacuation The standard IMO Day- and Night Cases for advanced evacuation simulation are undoubtedly useful in ship design. The difference between the evacuation simulation according to the IMO Night Case, i.e. without ship list, and the real MV Estonia case is considerable, as also shown in Figure 72: The increasing ship list can significantly slow down or stop the evacuation process. Even if the MV Estonia is perhaps an extreme case, it can well be asked whether the IMO evacuation criteria should also deal with situations of non-zero ship list. In view of the MV Estonia case this can be seen as particularly important for vessels, which can rapidly develop a large list. 7.8.3 Evacuation in a heeled ship According to measured test data the walking speed of the pedestrians usually reduces moderately when the floor inclination increases, until about 20° inclination upwards. After this angle the walking speed tends to reduce rapidly until 30-35°. At this point the friction between shoes and usual deck or floor surfaces is not always sufficient to provide adequate traction for walking motion. When the inclination still increases, it becomes impossible to advance without additional support. Handrails breaking loose in such an emergency situation do not make the situation better. Below some problems in common ship interior design features are briefly commented. Large open spaces Some informative testimonies of the survivors, the evacuation simulations with AENEAS and the location and number of victims observed by the divers on the wreck after the accident clearly show that large open spaces form a serious obstacle for the evacuation in a heavily listed ship. Transverse stairs Transverse stairs in an evacuation route, like the ones next to the cabin compartments in the bow part of the MV Estonia, can easily become a dead end in the route when the ship list increases. This is shown by the evacuation simulations and the observations of the divers. Longitudinal corridors As the ship list increases it becomes increasingly difficult to advance in corridor tilted sideways, as one cannot anymore walk in an upright position. The open cabin doors in the lower side wall of the tilted corridor must be jumped over or passed somehow. This was mentioned by at least one survivor. Cabins where the floor was inclined downwards towards the cabin door Loose items, bags etc., in cabins slid towards the lowest point and often blocked the cabin door opening inwards. This is stated by several survivors. Some survivors managed to throw such items into the shower/toilet compartment beside the cabin door, before they could open the cabin door. It is further known that if the cabin area just in front of the door does not have a good hand rail or other support, it is very difficult for a person hold his/her own weight on

Seakeeping & Manoeuvring
119
the inclined floor and simultaneously pull the cabin door open towards him/herself. In this situation some of the MV Estonia survivors in the cabins on the Deck 7 either decided to get out of the window directly onto deck 7, or to break the cabin door. The previous is possible for relatively thin persons, the latter for heavy, strong persons. Neither can be considered as a normal way of evacuation, but they show the difficulty with the cabin door. Cabins where the floor was inclined upwards towards the cabin door The difficulty is to get to the door against the slope. It is known from the survivors’ testimonies that this caused overwhelming difficulties to some passengers now missing. Deck 7 – Boat Deck It was not possible to launch the life boats due to the large list. Most passengers did not manage to release and make the life rafts to open. The crew assistance was not always available. 7.8.4 The evacuation of the crew members from the ECR The departure of the crew from the ECR below the vehicle was simulated with the program AENEAS using the time-histories of the ship list according to TUHH, according to JAIC and according to a ship roll and pitch motions computed with the program HSVA ROLLS. In the last case the ship roll motion data was elevated 2.5° in order for the evacuation simulation to give the correct number of persons abandoning the ship. These simulations indicate that if the three crew members left later than 3-4 minutes after the start of the evacuation, their escape from the ECR would probably not succeed. Thus according to the evacuation simulations the three crew members must have left the ECR at 01:06-01:07 at the latest. This is earlier than what they themselves reported. 7.8.5 Evacuation simulation as a part of the disaster investigation The evacuation simulation complements the information provided by the survivors’ testimonies. Simulations illustrate the evacuation process and can help in interpreting the testimonies, which are in general subjective reflecting survivors’ individual experiences. The testimonies are also sometimes in conflict which each other and sometimes with physical facts. The survivors’ testimonies are quite short, and more useful information from them could have been gained with more detailed interviews. Above we have used the evacuation study to gain information on how the evacuation proceeded in order to give light on the MV Estonia accident and also for purposes of more general ship safety. The evacuation simulations show very clearly the bottlenecks in the evacuation process. There is a clear correlation between the areas of congestion according to the evacuation simulation and the location of victims found by the divers.

Seakeeping & Manoeuvring
120
8 Conclusions 8.1 Introduction The ship list as a function of time was first determined by TUHH based on the survivors` testimonies. This curve as such is plausible and good for comparison with the hydrostatic analysis of the ship behavior. For comparison with the simulations with the HSVA ROLLS, the initial sudden heel described by many survivors was included in the HSVA-curve together with the somewhat higher heeling angle at the end based on the photograph of passenger P92. See the curves in Figure 78. The numerical modeling of the sinking sequence was done in two parts. The early phase was modeled with the program HSVA ROLLS capable of modeling the ship motions while turning together with the dynamic flooding and sloshing of the water on the vehicle deck. After the heeling angle of about 50°-60° this modeling gets out the domain, where it is still accurate. The later phase of the sinking sequence was modeled hydrostatically by the TUHH using the program ARCHIMEDES II. The use of hydrostatic modeling for the later phase should be sufficiently accurate as the dynamics effects play a minor role in the later phase of the sinking process.
As one can see in Figure 78 the curves computed with the HSVA ROLLS and the ARCHIMEDES II cover the whole sinking sequence, and correlate satisfactorily with the two empirical curves established by the HSVA-Consortium.
Fig. 78 The development of list on the MV Estonia reconstructed from the survivors’ testimoniesand computed with numerical models.

Seakeeping & Manoeuvring
121
One of the curves computed with the HSVA ROLLS was used as input in the evacuation simulation program AENEAS. As this first result was too optimistic with about 530 persons abandoning the ship, the roll motion curve was elevated with 2.5°, that is, about 8 percent. After this elevation in the input data the evacuation simulation gives about 280 persons abandoning the ship, which correlates well with the known facts of the accident. These numerical models together with other known facts on the accident were used to give best available information on the course of the accident. In the following paragraphs the main results and conclusions are listed. The HSVA-Consortium investigation was limited to the ship sinking sequence and evacuation process. Structural failure processes related to the MV Estonia during the accident were not part of this investigation. 8.2 The Way to the MV Estonia Accident The ship did not fulfill all SOLAS requirements regarding the extension of the collision bulkhead above the bulkhead deck, that is, the vehicle deck. According to JAIC it was common amongst the Finnish and Swedish maritime administrations to accept the ramp as an extension of the collision bulkhead, even when the ramp was located too much forward in the bow and not as required by SOLAS. This was a practical solution for the ferries traveling in the coastal waters between Finland and Sweden. According to Luhmann (2008) this exemption, however, should have been withdrawn by the authorities for the new trade Stockholm-Tallinn, as part of the route was located outside coastal waters. A much more relevant point in the course of the accident is the interlocking between the bow visor and ramp, which was common in the Baltic ferries in the 1970s and 1980s. In a Ro-Ro passenger ferry like MV Estonia the ramp can be interpreted as the extension of the collision bulkhead. The collision bulkhead is a watertight transverse bulkhead in the fore part of the ship extending to the bulkhead deck. Its purpose is to prevent ingress of sea water in case of breach or rupture on the ship shell at the bow. Thus the collision bulkhead together with its extension is meant to be a second barrier against ingress of sea water. Approval of such a bow arrangement by the maritime authorities, in which the failure of the bow visor leads to damage to, or the failure of, the extension of the collision bulkhead (i.e. ramp) exposing the vehicle deck to open sea, is not only in conflict with the purpose of the SOLAS regulations, but shows also limited understanding of issues related to ship stability. Technically the interlocking of the ramp with the bow visor may be regarded as an unfavorable design detail with respect to ship safety, in particular if the ship and the system of bow visor and ramp are or were in a poor maintenance condition. Such designs were, however, common in the Baltic ferries in the 1970s and 1980s until the MV Estonia accident. The SOLAS requirements accepted in 1995 after the accident explicitly require the extension of the collision bulkhead to be so arranged as to preclude the possibility of the bow door causing damage to it in case of damage to, or detachment of, a bow door. Also the requirements of the different classification society rules concerning bow visor strength were very unspecific at the time of the MV Estonia’s design and construction. This reflects also the state of knowledge on the magnitude of the wave loads at the time the MV

Seakeeping & Manoeuvring
122
Viking Sally, that is, later the MV Estonia, was built. The design load criteria applicable and used in construction of the bow visor structures of the MV Estonia were thus not adequate, with the knowledge of today. The hull form of the MV Estonia was not very good in view of sea loads. It had an extreme bow flare just (0-2 m) above the waterline at the bow. Above the knuckle line the flare is not extreme, but it is still considerable. This bow form certainly contributed to the high wave impact loads the vessel experienced in heavy seas. The bow visor extends also somewhat below the knuckle line. The MV Estonia running on the more exposed Tallinn–Stockholm route was subject to higher wave loads than most other Baltic ferries running between Finland and Sweden. It may also have run slightly faster in trying to keep its schedule in bad weather. The nautical officers on the bridge did not reduce speed when they got the information on the strange noises or the heavy metallic blows from the bow. The reduction of speed would have radically reduced the wave loads on the bow and, if the ramp was already open, also reduced the inflow of water on to the vehicle deck. Had the crew acted otherwise, the accident would probably not have been fully prevented, but it is very likely that the number of lives lost would have been reduced. Due to the incorrect loading in Tallinn the port side heeling tank was full. As the sudden heeling took place, the list could not be compensated even partially with the heeling tanks. The consequences are known. The JAIC Final Report lists altogether 16 bow visor damages, which occurred during the years 1973-1994 in the Baltic Sea on vessels built by various European shipyards. These individual damages were in general not reported to authorities and collected and thus no conclusions were drawn. Thus the MV Estonia case was not a separate failure, but a rather culmination point for the safety problems in the Baltic ferry traffic. If this information would have been collected and analyzed, preventive measures could have been taken before the MV Estonia accident and not after it. 8.3 The Accident Scenario The accident can be considered to have started already around 01:00 with the loss of the bow visor. It is very likely that already before, the ramp was leaking, letting water onto the vehicle deck, not least because the bow visor and ramp structures were slowly breaking. The location of the visor, those of the debris from the vessel and that of the wreck on the seabed, together with the survivors’ testimonies clearly show that the vessel made a turn to port. Most likely already before the turn the vessel had heeled strongly to starboard as a consequence of the massive inflow of water onto the vehicle deck. The heeling of the vessel was at least partly related to the turning of the vessel. As a result of the reducing speed the centrifugal acceleration reduced and the ship righted itself somewhat. The heeling during the turning was so massive that the ventilation ducts ending at the ship side just below the Deck 4 submerged, and water could flow down into several compartments below the vehicle deck. Simultaneously some water was flowing from the vehicle deck into the center casing and further down into the passenger compartments below the vehicle deck. The draught of the ship increased, which further increased the flow onto the vehicle deck through the opening at the bow. At some point the strength of the windows at the ship side was exceeded and the windows started to break causing the heeling further to increase. Little before starting finally

Seakeeping & Manoeuvring
123
to sink the vessel probably had a list of about 125°-140° to starboard. The ventilation ducts on the port side of the vessel, which submerge very late, allowed so much rest air from the watertight spaces below the vehicle deck to escape that the vessel could sink. According to the calculations of the HSVA-Consortium the vessel could sink with closed WT-doors under the vehicle deck. 8.4 The Heeling and Sinking Process The accident can be considered to have started already around 01:00 with the loss of the
bow visor and not at 01:14 as stated by the JAIC. The bow visor detached from the MV Estonia as a result of structural failures in the deck
beams and locking systems of the visor. The structural failures were most likely caused by wave loads, which are normal
operational loads. The survivors’ testimonies and most other evidence support neither the hypothesis of the visor loss being caused by an explosion, nor by a collision with a submarine.
Due to the interlocking of the visor and the ramp just behind it, it is very likely that the
visor pulled the ramp open as it fell down. Many survivors heard a scraping sound just after the heavy blows from the bow, as the
ship run over the visor, which could not sink fast enough not to be hit by the advancing ship bow.
The scenario of the visor and ramp being loose, let’s say both about 1 m open, is not likely
to be the main flooding scenario for the vehicle deck. The inflow rate appears to be too small for this. This implies that the visor dropped off relatively early and did not hang on the vessel until the ship heeled to near or over 90°.
The three crew members in the ECR were the last persons who saw the bow ramp closed
during the initial phase of the accident. Therefore their testimonies are important for re-constructing the course of events. Based on the survivors’ testimonies, the results of the evacuation simulations, and the approximate casualty rates of passengers on each deck it is concluded here that the crew members must have left the ECR earlier than reported by themselves and also by the JAIC. The events they describe in their testimonies thus took place earlier than reported by the JAIC. With this interpretation of the testimonies from the ECR the conflict between them and on the other hand the testimonies of other survivors and the results of the analysis carried out in this study could be to great extent removed.
The Third Engineer C36 saw in a monitor in the ECR water coming in at the sides of the
almost closed ramp about two to four minutes after the two heavy blows were generally heard on the ship. It was concluded in Chapter 1.5 that the closed ramp was last time observed by the Third Engineer around 00:58-01:01, which is at a very early phase of the accident. It is very likely that the ramp opened very soon after this time.
Seakeeping & Manoeuvring
124
After the visor fell the vessel advanced straight ahead approximately 2-3 minutes on its original course until it turned to port. During this time a large amount of water flowed onto the vehicle deck onto both sides of the center casing and the ship heeled to starboard. It is likely that there was water on vehicle deck already before the visor fell off.
When water was sloshing on the vehicle deck, limited amounts of water could flow down
on to Deck 1 through the staircases in the front part of the center casing already at early phases of the accident, as reported by the survivors. The sudden heel to starboard probably contributed to this.
In view of this early water flow on to Deck 1 through the center casing, the assumption of
damage deeper down on the hull as a cause for the water on Deck 1 appears superfluous. A relatively high speed is needed to cause a sufficient amount of water to flow onto the
vehicle deck in order for the first sudden heel to appear in the simulated ship roll motion. The speed of 14.2 kn or higher was needed in the computations with the program HSVA ROLLS to cause the first sudden heel to appear.
After the mentioned 2-3 minutes the vessel must have turned away from the waves and
reduced speed. Otherwise it would most likely have capsized. The simulations show the high vulnerability of a vessel like MV Estonia to a serious
damage exposing the ship’s vehicle deck to open seas: The difference between a rapid capsize and survival can be as low as about 30 seconds on the initial course and speed with the ramp open.
The sudden heel is probably also related to the start of the turn of the vessel initiated by
the officers on the bridge. The computed time-histories of the heeling angle shown in the figures show a high peak
just in the beginning, when the ship speed is high, the vessel starts to turn, and there is already water on the vehicle deck. This high heeling angle is caused by at least three factors: (1) the turning rate of the vessel; (2) the chosen random wave pattern realization; (3) the amount of accumulated water on the vehicle deck.
In the simulations the compartments below the vehicle deck can have a considerable water
ingress via the center casing relatively early during the course of the accident. The Engine Room related spaces can be flooded at this phase only via the ventilation ducts on ship sides. The inlets of these ducts are located just below Deck 4 and they submerge below the sea surface only when the ship has a considerable heeling angle. The ingress of water to the Engine Room related spaces is therefore likely to start later and is somewhat slower than to the spaces flooded by water entering from vehicle deck via the center casing.
The water flow down into the center casing from the vehicle deck and the flow through
the side ducts into the spaces below the vehicle deck significantly contributed to the loss of the MV Estonia.
The hydrostatic analysis of the TUHH showed that from that moment on, when the side
ventilation duct inlets were submerged, the vessel would irreversibly sink.

Seakeeping & Manoeuvring
125
In his testimony the passenger P76 describes how the window just outside the Karaoke
Bar on Deck 5 was partly submerged during the sudden initial heel. The simulations show this, too. This implies that (1) The ventilation duct openings at the ship side just below the Deck 4 had a hydrostatic pressure head of more than 3 m; (2) The large windows on Deck 4 were loaded near to their estimated breaking load.
The absolute breaking load of the windows could be estimated only crudely. Thus the
computed moment of time the windows break is not very accurate. As, however, the larger windows are structurally much weaker than the smaller ones, it is very clear that when the vessel heels to the side and the windows submerge, the larger windows break first. As the larger windows are located in the stern and middle of the ship this fact contributes to the vessel sinking stern first.
The location of the visor, those of the various items dropped from the vessel and that of
the wreck on the sea bottom define the points, above which the vessel must have passed or stopped at. Therefore the vessel must have had a track very similar to those shown in Figures 31, 33, 37 and 41.
Items that dropped from the ship distributed along the track of the vessel over a significant
distance as shown with the red ellipse in Figure 3 and in all figures showing the ship’s track. Therefore it is likely that towards the end of its track the ship, while drifting slowly, did not heel over rapidly dropping many items on one spot, but that the heeling continuously increased as the vessel was drifting.
Shortly before the MV Estonia sank, it had a heeling angle of approximately 125-140° to
starboard. The stern of the vessel probably pointed approximately in the direction of 300°-325°, which is plausible considering the effect of the SW wind on the drifting ship. The ship sank stern first and was mostly likely turned, pivoting around its stern on the sea bottom, towards port by the current, until it reached its final position on the sea bottom. The wreck of the ship lies in the direction of about 95°, that is, its stern points approximately in the direction of 275°.
The computed results: ship motions, flooding of the vehicle deck, flow of water into
compartments below, the time spent on the track, etc. fit quite well to the survivors’ testimonies and other known facts on the accident. Therefore it is not very likely that the real MV Estonia accident scenario would have been essentially different than the one modeled numerically here.
The behavior of the vessel is crudely similar to that already described in the JAIC Final
Report. Our analysis reveals details, which in general support the conclusions made already by the JAIC. There is, however, a certain leeway in the accident scenario: It cannot e.g. be said exactly, how high the speed of the vessel was just before the start of the accident, or what was the turning radius of the vessel during the turn to port. In this respect the real accident scenario cannot be defined as accurately as described in the JAIC Final Report. Slight deviations from the course of events presented by the JAIC, or in this report as well, are possible. A certain uncertainty in details remains, even if the described scenario as a whole is the most likely one presently known.
Seakeeping & Manoeuvring
126
8.5 Evacuation There were at least 989 passengers and crew onboard the MV Estonia. Of these about 237-
310 abandoned the ship, and 137 survived. The MV Estonia got a large list relatively fast. It cannot be excluded that in very similar
circumstances the ship could also have capsized. In the ship motion simulations it is very easy to get this result with only small changes in the input data. If the ship had capsized, it can be argued that the casualty rate would have been even higher than the 86 percent, it is now.
No organized evacuation took place. This could have helped many passengers to abandon
the ship. The ship got very rapidly a list over 20°, after which the lifeboats could not be lowered.
The ship list reached angles 25-35° in a short time, after which it was very difficult to get
out of the ship. Persons, who waited for an alarm or instructions by public announcements of what to do,
left in general too late. Of those, who abandoned the ship into life rafts and into water, about 50 percent survived.
It was not possible to lower the life boats due to the large list. Most passengers did not
manage to release and make the life rafts to open. The crew assistance was not always available.
Almost all persons on board went to the higher port side of the vessel. This rendered 50
percent of the life saving appliances meaningless. In case of the MV Estonia this was probably not a problem, as only about 237-310 persons of the total 989 persons onboard got onto Deck 7 and abandoned the ship. According to the JAIC Final Report the ship had 2298 life vests for adults and 200 for children onboard, which should have been enough for the persons onboard even in a one-sided evacuation.
At least 21 persons are known to have abandoned the ship starting from the Deck 1 below
the vehicle deck, which is furthest away from Boat Deck 7. The real number is likely to be somewhat higher. A crude estimate of the number of persons on Deck 1 gives 190, which yields a minimum abandoning rate estimate of 11 percent for the passengers on Deck 1. According to the survivors’ testimonies they were pre-warned by the noises, already concerned of their safety and left in a hurry, many of them half-naked, just after the sudden large heeling motion of the ship. Without this pre-warning the abandoning rate from this area would have been even lower than the current 11 percent. The minimum ship average abandoning rate is 24 percent.
The average ages of the persons on different decks were extrapolated from the survivors’
ages having cabins on these decks and adjusted to yield correct average ages for the ship passenger and crew populations. Even if these extrapolated results are not totally reliable, they give an indication that there can be significant differences in the age distribution of

Seakeeping & Manoeuvring
127
passengers on different decks. It would be possible to take such features into account in the ship interior design.
The passenger age differences between the different decks can be at least one partially
explaining factor to the very low survival rate of the passengers in cabins on Deck 5, where the average age was estimated to be 64 years: Only 4 persons are known to have abandoned their cabins on Deck 5, youngest of them being 49 years old: Based on this we get a minimum abandoning rate estimate of only about 4 percent.
Testimonies of the survivors, the evacuation simulations with AENEAS and the location
and number of victims observed by the divers on the wreck clearly show that large open spaces form a serious obstacle for an evacuation in a heavily listed ship.
Transverse stairs in an evacuation route, like the ones next to the cabin compartments in
the bow part of the MV Estonia, can easily become a dead end in the route when the ship list increases. This is shown by the evacuation simulations and the observations of the divers.
As the ship list increases it becomes increasingly difficult to advance in longitudinal
corridors tilted sideways, as one cannot anymore walk in an upright position. The open cabin doors in the lower side wall of the tilted corridor must be jumped over or passed somehow.
Certain differences between the results of the evacuation simulations and the known facts
on the accident suggest that it was probably very difficult to get out of the cabins. It is possible that a considerable number of persons in cabins were either injured or trapped permanently inside the cabins as a consequence of the first sudden heel.
In cabins, where the floor was inclined downwards towards the cabin door, loose items,
bags etc., slid towards the lowest point and often blocked the cabin door opening inwards. It is further known that if the cabin area just in front of the door does not have a good
hand rail or other support, it is very difficult for a person hold his/her own weight on the inclined floor and simultaneously pull the cabin door open towards him/herself.
In cabins, where the floor was inclined upwards towards the cabin door, the difficulty is to
get to the door against the slope. It is known from the survivors’ testimonies that this caused overwhelming difficulties to some passengers now missing.
The standard IMO Day- and Night Cases for advanced evacuation simulation are
undoubtedly useful in ship design. The difference between the evacuation simulation according to the IMO Night Case, i.e. without ship’s list, and the real MV Estonia case is, however, considerable. The increasing ship list can significantly slow down or stop the evacuation process. Even if the MV Estonia is perhaps an extreme case, it can well be asked whether the IMO evacuation criteria should also deal with situations of non-zero ship list. In view of the MV Estonia case this can be seen as particularly important for vessels, like Ro-Ro passenger ferries, which can rapidly develop a large list.
Seakeeping & Manoeuvring
128
8.6 Discussion – Suggestions - Recommendations The watertight integrity of the vehicle deck of a Ro-Ro passenger ferry must be assured under all possible design conditions. Krüger and Kehren (2008) recommend to investigate the actual loading scenarios based on first principles together with an analysis of the structural response of the design element in question in order to ensure that under all relevant operational conditions the watertight integrity of the vehicle deck is assured. It would be possible to provide the crews with diagrams showing the recommended maximum speed in a given sea state in order not to mechanically overload the bow door structures in ferries. It is not self-evident that the crew knows at which ship speed in a certain seaway the sea loads can exceed the design loads of the ship structures.
It was further found that a core safety element of a Ro-Ro passenger ferry in case of a loss of its watertight integrity is in fact a sufficient freeboard from the waterline in that equilibrium floating condition to the vehicle deck. A sufficient freeboard prevents massive water ingress into the ship and, consequently, a rapidly increasing heel. Prevention of the rapidly increasing heel is a necessary condition for a successful evacuation of the passengers and crew. Whenever modifications of the existing damage stability requirements for Ro-Ro passenger ferries are discussed, this technical fact should be kept in mind. In an ideal case the vehicle deck and ship should be designed so that in a possible damage case the ship’s list does not exceed a certain maximum value, above which an orderly evacuation is not anymore possible. All life saving appliances (LSA) should function properly at least until this defined angle of list. There are various ways to achieve this, of which a high freeboard is only one. A potential water inflow onto the vehicle deck depends very strongly on the ship speed and on the freeboard to the opening or leak. If the bow doors are regarded as potential openings, locating them somewhat higher in the ship structure could improve safety. The freeboard of the vehicle deck opening at the bow of the MV Estonia was about 2.8 m. If it had been e.g. one meter more, that is 3.8 m, the amount of water ingress on the vehicle deck would have been radically smaller and the changes of the MV Estonia to survive considerably higher. Due to the bow wave a high freeboard on the bow is more important than elsewhere along the waterline. The evacuation possibilities of passengers in a ship having a heavy list should be significantly improved: It is somewhat concerning that the evacuation or escape of the passengers and crew in a ship with a list of more than 25°-35° is either very slow or impossible. The MV Estonia case shows that if the vessel has a large open vehicle deck, such an angle can be reached very rapidly, if there is a massive inflow of water onto the vehicle deck. When the MV Estonia’s list exceeded a certain limit the engines shut down automatically, because the lubrication systems did not anymore work properly. Thus the (auxiliary) engines providing electrical power tripped, when they could have been most needed. Without sufficient electrical power the possibilities of the crew to influence the course of accident were rather limited. Engines, which would keep running at higher heeling angles, could provide better changes for the crew to rescue the ship and the passengers to evacuate.

Seakeeping & Manoeuvring
129
A real evacuation may be one-sided to the higher side only. The number and location of life saving appliances should be such that also in a one-sided evacuation no shortage is faced. About 50 percent of the persons who got out of the ship survived. If life boats could have been lowered at ship list in excess of 20° the casualty rate could have been considerably lower. Some rafts turned upside down in seaway. The overwhelming reasons for the casualties were drowning, hypothermia and a combination of both. This is not new. Evacuation into water in the Baltic Sea is for most of the year not likely to end well. According to the best available information the MV Estonia had heeling tanks connected with a cross-flooding duct in between. In the duct there was a valve, which could be opened to let water from one tank to another. In addition the ship was equipped with a system that opened this valve automatically, when the WT-doors were centrally closed. It is further known that this system could be switched off, whereas it is not known, whether this system was in operation in the night of the accident. Therefore it was not taken into account in the HSVA-Consortium analysis. If the system was in operation, it may have contributed to the MV Estonia disaster as follows: The ship was incorrectly loaded, the port side heeling tank was full, the starboard one empty. When the ship got a heavy list to starboard, it can be expected that somebody on the bridge tried to close all WT-doors, with the consequence that the valve in the cross-flooding duct opened. Thus water from the higher port side heeling tank would flow down to the lower starboard side heeling tank and increase the heeling angle of about 8°. This would have had two adverse effects: It would lead to increased difficulties in abandoning the ship and also to earlier tripping of the auxiliary engines generating power. The automatic connection of the opening of the valve in the cross-flooding duct to the closing of the WT-doors is here regarded as a potentially dangerous system. The purpose of this investigation has been to throw light on the MV Estonia accident in September 1994. Some information provided by this investigation is new, but certainly not all, as we have come to similar conclusions than previous researchers. Some recommendations on ship safety were made in this study. In general some findings of the past MV Estonia investigations have already been included in the actual international regulations related to ship safety. According to Luhmann, Meyer Shipyard, (2008) such are, e.g. the “water on deck” requirement of the Stockholm Agreement, the handling of cross-flooding valves, the availability of LSA in severe conditions of list and trim, the location of the collision bulkhead and the height of downflooding points from the vehicle deck. The regulations have also otherwise been updated since the delivery of the vessel in 1980. In the framework of this study it has not been possible to check, whether similar changes as discussed here have after the accident been included in the actual rules related to ship safety or are under the discussion at IMO level. If so, some of the recommendations or suggestions given may be obsolete from the point of view of updating rules. Their technical validity remains.

Seakeeping & Manoeuvring
130
REFERENCES BAM (2001), Bundesanstalt für Materialforschung und –prüfung, English Summary of the
report ”Werkstoffuntersuchungen an Vergleichsblechen und Prüfstücken aus Schiffbaustahl” (Material investigation on comparative plates and specimens of a shipbuilding steel), Federal Institute of Materials Research and Testing, Investigation Report No BAM- V.3/187.
Carlsson, J.-O. (2007) M/V Estonia Bow-Arrangement Collapse - Sequence of Events, Technical Report, MacGREGOR (SWE) AB.
FAIB, The Accident Investigation Board of Finland. (Onnettomuustutkintakeskus). Transcripts of the Testimonies of the Survivors and other Persons related to the MV Estonia accident.
Holtappels, P., Hummel, W., (1999) “The German Group of Experts (GGE)”, Investigation Report on the capsizing on 28th September 1994 in the Baltic Sea of the Ro-Ro Passenger Vessel MV Estonia.
Holtappels, P., Hummel, W., (2006) “The German Group of Experts (GGE)”, Investigation Report Update on the capsizing on 28th September 1994 in the Baltic Sea of the Ro-Ro Passenger Vessel MV Estonia.
Hänninen, H. (2007) Negotiated Risks – The Estonia Accident and the Stream of Bow Visor Failures in the Baltic Ferry Traffic, Helsinki School of Economics doctoral dissertation, Report A-300.
JAIC (1997) Final Report on the Capsizing on 28 September 1994 in the Baltic Sea of the Ro-Ro Passenger Vessel MV ESTONIA. The Joint Accident Investigation Commission of Estonia, Finland, and Sweden.
JAIC Suppl. No. 523, (1996) Rintala, S. and Karppinen, T., MV Estonia Accident Investigation - Numerical predictions of the water inflow to the car deck, Technical Report VALC174, VTT Manufacturing Technology, Espoo 1996.
JAIC Suppl. No. 525, (1994) Laur, U., Damage to the bow visor locking devices of passenger car ferry “DIANA II” in January, 1993, and preliminary conclusions i.r.o. the loss of the bow visor of m.v. “ESTONIA” in September 28th , 1994. Tallinn 1994.
JAIC Suppl. No. 526, (1994) Lehtola, K., Damage to the Bow of the SILJA EUROPA at the Time of the Accident Involving the ESTONIA 28.9.1994.
Jasionowski, A., Vassalos, D. (2001) Shedding Light into the Loss of MV Estonia. Lerning from marine Incidents II, London UK, The Royal Institution of naval Architects.
Kanerva, M. (1999) Design for Safety, Current Practice for Ro-Ro Passenger Ferries, WEGEMT Design for Safety Conference, University of Strathclyde, Ship Stability Research Centre, Glasgow, UK.
Karppinen, T., Rahka, K. (1998) Investigation and causes of the sinking of MV Estonia, Technology, Law and Insurance, 1998 3, 149-162.
Krüger, S., Kehren, F.-I. (2007) Research Study of Sinking Sequence of MV Estonia, Mile Stone 1 (M1), “Accident Scenario”, Technische Universität Hamburg-Harburg, Institut für Entwerfen von Schiffen, und Schiffssicherheit.
Seakeeping & Manoeuvring
131
Krüger, S., Kehren, F.-I. (2008) Research Study of Sinking Sequence of MV Estonia, Work Package 7, “Hydrostatic Analyses of the Later Phases of the Capsizing and Sinking of the MV Estonia”, Technische Universität Hamburg-Harburg, Institut für Entwerfen von Schiffen, und Schiffssicherheit.
Kurm/C7 (2007) Interview of the crew member C7 by Margus Kurm. Kurm/C33 (2007) Interview of the crew member C33 by Margus Kurm. Kurm/C36 (2007) Interview of the crew member C36 by Margus Kurm. Luhmann, H. , Meyer Shipyard (2008), Personal Communication. Ludwig, N. (2006) MV Estonia – Forced Roll damping Tests, HSVA Report S544/06,
Hamburg. 28 pp. Meyer-König, T., Klüpfel, H., Hebben, S. (2007) Ro-Pax Ferry Estonia – Evacuation
Analysis, Final Report, Project No.: 3-6-17 TraffGo HT GmbH, Flensburg. Meyer-König, T., Valanto, P., Povel, D. (2005). Implementing Ship Motion in ANEAS.
Proceedings of the 5th International Conference on Pedestrian and Evacuation Dynamics, Vienna, 13 p.
Nuorteva, J. (1995) Sea Floor Deposits, A Map to JAIC Supplement 501 No. 501. Petersen, U., Meyer-König, T., Klüpfel, H., Schreckenberg, M. (2003). Ship Evacuation
Modelling. Proceedings of the 2nd International Conference on Pedestrian and Evacuation Dynamics, Greenwich, UK, pp. 209-219.
Pyman, M., Lyon, P. (1985). Casualty Rates in Abandoning Ships. Joint Meeting of The Royal Institution of Naval Architects and The Nautical Institute on January 17, 1985. RINA.
P92, MV Estonia Survivor, Passenger P92, (2008) Personal communication. Schager, B. (2006) Personal Communication. SPF, National Board of Psychological Defence of Sweden (Styrelsen för psykologiskt försvar,
SPF), Estoniasamlingen. Transcripts of the Testimonies of the Survivors and other Related Persons.
SSPA (2007) Allenström, B., Thorsson, S.: MV Estonia – Manoeuvring tests and Bow Ramp Flooding tests. SSPA Report 4006 4100-1.
Valanto, P. (2006) Time-Dependent Survival Probability of a Damaged Passenger Ship II – Evacuation in Seaway and Capsizing. HSVA Report No 1661, Hamburgische Schiffbau-Versuchsanstalt GmbH, Available on www.hsva.de.
Valanto, P. (2007) New Research into the MV Estonia Disaster, Proceedings of the 10’th International Ship Stability Workshop in Hamburg, August 30-31, 2007.
Weidmann, U. (1992). Transporttechnik der Fußgänger, Transporttechnische Eigenschaften des Fußgängerverkehrs, Literaturauswertung; Schriftreihe des IVT 90, ETH Zürich, January 1992.
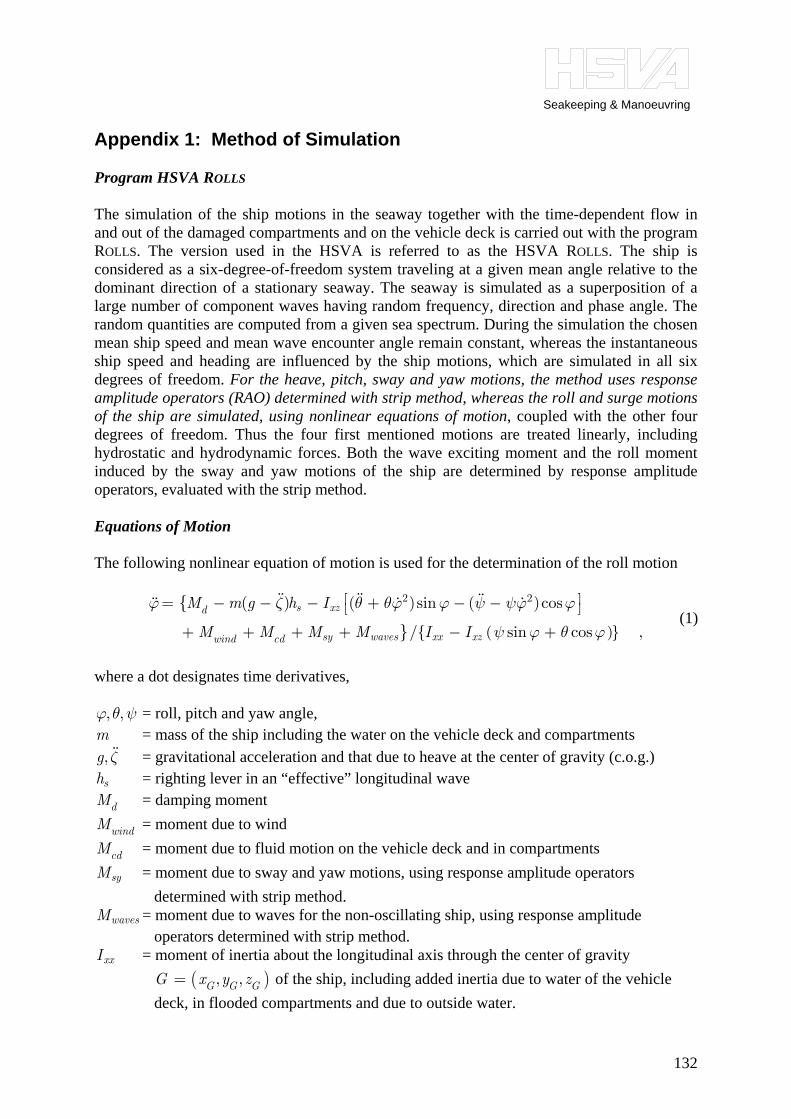
Seakeeping & Manoeuvring
132
Appendix 1: Method of Simulation Program HSVA ROLLS The simulation of the ship motions in the seaway together with the time-dependent flow in and out of the damaged compartments and on the vehicle deck is carried out with the program ROLLS. The version used in the HSVA is referred to as the HSVA ROLLS. The ship is considered as a six-degree-of-freedom system traveling at a given mean angle relative to the dominant direction of a stationary seaway. The seaway is simulated as a superposition of a large number of component waves having random frequency, direction and phase angle. The random quantities are computed from a given sea spectrum. During the simulation the chosen mean ship speed and mean wave encounter angle remain constant, whereas the instantaneous ship speed and heading are influenced by the ship motions, which are simulated in all six degrees of freedom. For the heave, pitch, sway and yaw motions, the method uses response amplitude operators (RAO) determined with strip method, whereas the roll and surge motions of the ship are simulated, using nonlinear equations of motion, coupled with the other four degrees of freedom. Thus the four first mentioned motions are treated linearly, including hydrostatic and hydrodynamic forces. Both the wave exciting moment and the roll moment induced by the sway and yaw motions of the ship are determined by response amplitude operators, evaluated with the strip method. Equations of Motion The following nonlinear equation of motion is used for the determination of the roll motion
( )
2 2( ) ( )sin ( )cos
/{ sin cos } ,
{
}s xzd
sy waves xx xzwind cd
M m g h I
M M M M I I
ϕ ζ θ θϕ ϕ ψ ψϕ ϕ
ψ ϕ θ ϕ
⎡ ⎤= − − − + − −⎣ ⎦+ + + + − +
(1)
where a dot designates time derivatives, , ,ϕ θ ψ = roll, pitch and yaw angle, m = mass of the ship including the water on the vehicle deck and compartments ,g ζ = gravitational acceleration and that due to heave at the center of gravity (c.o.g.) sh = righting lever in an “effective” longitudinal wave
dM = damping moment
windM = moment due to wind
cdM = moment due to fluid motion on the vehicle deck and in compartments
syM = moment due to sway and yaw motions, using response amplitude operators determined with strip method. wavesM = moment due to waves for the non-oscillating ship, using response amplitude operators determined with strip method.
xxI = moment of inertia about the longitudinal axis through the center of gravity ( ), ,G G GG x y z= of the ship, including added inertia due to water of the vehicle deck, in flooded compartments and due to outside water.

Seakeeping & Manoeuvring
133
xzI = product of inertia relating to the center of gravity G of the ship, including also the added inertia due to water on vehicle deck, in flooded compartments and due to outside water. The nonlinear damping moment dM is expressed as ,Ld QM d dϕ ϕ ϕ= − − (2)
where Ld and Qd are coefficients depending on Froude’s number and can be estimated according to the method of Blume (1979), or they can be determined in scale model tests. The effect of bilge keels is taken into account following the methods of Gadd (1964) and Martin (1958). The wind moment can be estimated according to Blendermann (1986). The response amplitude operators for syM and wavesM have been calculated for the draught and trim of static equilibrium floating position of the damaged ship with the strip method by Kirsch (1969), Grim and Schenzle (1969), before starting the simulation. During the simulation at each time instant the moments syM and wavesM are determined using a superposition of terms due to all the regular wave components of which the wave spectrum is composed. The derivation of Eq. (1) can be found e.g. in Valanto (2006). Righting Levers in Seaways For computing righting levers sh due to the ship’s heel in a hydrostatic pressure field under the wavy water surface, Grim’s effective wave concept (1961), in the form modified by Söding (1982) is used. The height Z of the wavy water surface along the vertical plane through the longitudinal ship axis is approximated in the form ( )( , ) ( ) ( ) ( )cos 2 / EZ x t a t b t x c t xπ λ= + + (3) in the region of ship length using the method of least squares of errors. The length between perpendiculars ppL is used as length of the effective wave Eλ . Grim showed that the response amplitude operators between regular waves and the quantities of a(t), b(t), and c(t) in Eq. (3) can be computed easily. Using these transfer functions together with the heave and pitch transfer functions, the mean ship immersion, its trim relative to (undisturbed) instantaneous water surface within the ship’s length, and the effective regular wave height within the ship’s length, are computed for every time step during the simulation. The righting lever is interpolated from tables computed before starting the simulation, depending on these three quantities and the heel angle. Computation of Linear Responses to the Seaway The quantities syM , wavesM in Eq. (1), a(t), b(t), and c(t) in Eq. (3), as well as heave, pitch, sway, and yaw motions, are needed to determine the roll moment. All these quantities depend linearly on the seaway and they are determined with the strip method. The linear responses of the ship are computed at each time instant t using the superposition of the terms due to all regular wave components.
Seakeeping & Manoeuvring
134
( )cos
1
ˆ ˆ( ) Re[ ( , ) ] ,n n nG
Ni w t k
n r n nn
r t Y e ξ μζ ω μ −
== ⋅ ⋅∑ (4)
where: n = index of regular wave components of which the seaway is composed Re = real part of the complex number nω = frequency of regular wave component n nμ = encounter angle of the regular wave component n, nμ μ= (constant) for a long
crested seaway. nk = wave number 2 /n gω= Gξ = position of the center of gravity of the ship in the ξ -direction of the inertial system.
n̂ζ = complex amplitude of the regular wave component n. It is computed from the wave spectrum S with ˆ 2 ( , ) ni
n n n n nS e ξζ ω μ ω μ= Δ Δ (5)
where nε is a random phase angle uniformly distributed between 0 and 2π . The nω are chosen at random, uniformly distributed in intervals of breadth ωΔ .
r̂Y = complex response amplitude operator between the response r and regular wave, determined with a strip method. Motion of Water on Deck and in Compartments Special emphasis in the present HSVA version of the program ROLLS is placed on simulating realistically the motion of water on deck. Two different methods of computing the internal water flow are used, depending on the height of the water. The change between these two methods can be made automatically during the simulation according to the actual situations of the deck or compartments in question. The method for open decks or tanks having a low fill is based on the solution of the shallow-water-equations using the Glimm’s method, which is essentially a random choice method using a numerical grid on the deck. The method for deeply filled tanks assumes that the surface of the liquid is an oblique plane. The fluid motion is approximated by that of a point mass concentrated in the center of gravity of the fluid mass. In the simulations the time is advanced in small increments. The rate of inflow and outflow of water through any opening is estimated from the motion of the internal and the external water surface relative to the openings at each time step. The openings can be located at the shell of a ship or at internal subdivisions between compartments; they may be intended as openings, or they may be produced by damage, e.g. due to a collision. The variations of mass, the center of gravity and moment of inertia of the ship due to the inflow and outflow are considered by varying the above quantities. The forces and moments due to the interior fluid motion in partly flooded rooms and on the vehicle deck are also determined ( cdM ) and added to the other moments due to wave excitation, wind etc. The formulations for the numerical methods used to obtain the fluid motion in tanks and decks are given in Appendix 2

Seakeeping & Manoeuvring
135
Fig. A1 The numerical grid used to model the fluid motion on the vehicle deck andon the open ramp. Notice the center casing in the middle.
Fig. A2 The fully open ramp leading to the vehicle deck.
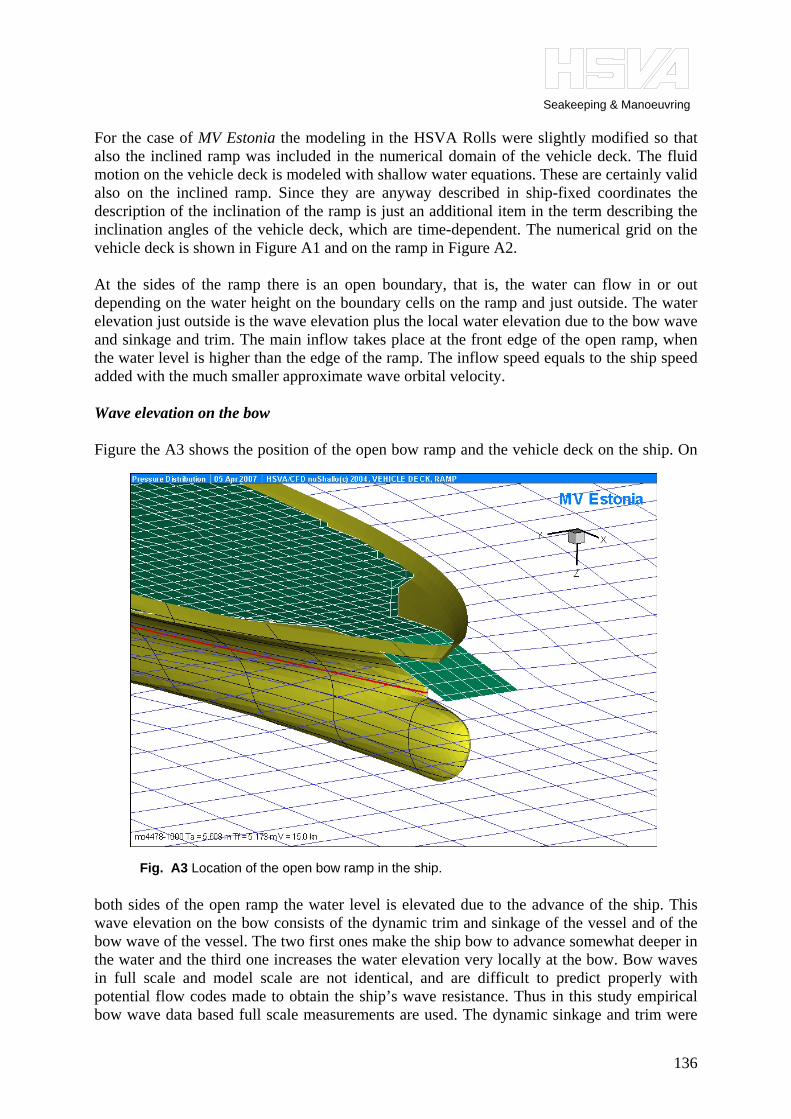
Seakeeping & Manoeuvring
136
For the case of MV Estonia the modeling in the HSVA Rolls were slightly modified so that also the inclined ramp was included in the numerical domain of the vehicle deck. The fluid motion on the vehicle deck is modeled with shallow water equations. These are certainly valid also on the inclined ramp. Since they are anyway described in ship-fixed coordinates the description of the inclination of the ramp is just an additional item in the term describing the inclination angles of the vehicle deck, which are time-dependent. The numerical grid on the vehicle deck is shown in Figure A1 and on the ramp in Figure A2. At the sides of the ramp there is an open boundary, that is, the water can flow in or out depending on the water height on the boundary cells on the ramp and just outside. The water elevation just outside is the wave elevation plus the local water elevation due to the bow wave and sinkage and trim. The main inflow takes place at the front edge of the open ramp, when the water level is higher than the edge of the ramp. The inflow speed equals to the ship speed added with the much smaller approximate wave orbital velocity. Wave elevation on the bow Figure the A3 shows the position of the open bow ramp and the vehicle deck on the ship. On
both sides of the open ramp the water level is elevated due to the advance of the ship. This wave elevation on the bow consists of the dynamic trim and sinkage of the vessel and of the bow wave of the vessel. The two first ones make the ship bow to advance somewhat deeper in the water and the third one increases the water elevation very locally at the bow. Bow waves in full scale and model scale are not identical, and are difficult to predict properly with potential flow codes made to obtain the ship’s wave resistance. Thus in this study empirical bow wave data based full scale measurements are used. The dynamic sinkage and trim were
Fig. A3 Location of the open bow ramp in the ship.
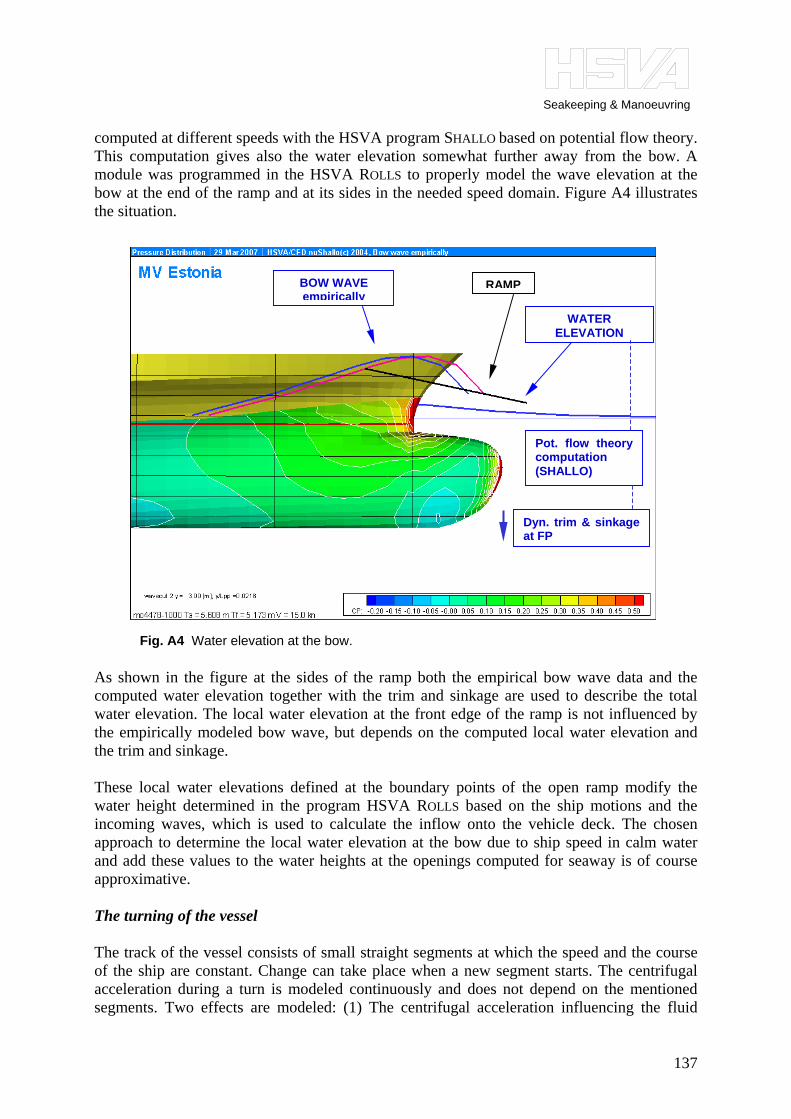
Seakeeping & Manoeuvring
137
computed at different speeds with the HSVA program SHALLO based on potential flow theory. This computation gives also the water elevation somewhat further away from the bow. A module was programmed in the HSVA ROLLS to properly model the wave elevation at the bow at the end of the ramp and at its sides in the needed speed domain. Figure A4 illustrates the situation.
As shown in the figure at the sides of the ramp both the empirical bow wave data and the computed water elevation together with the trim and sinkage are used to describe the total water elevation. The local water elevation at the front edge of the ramp is not influenced by the empirically modeled bow wave, but depends on the computed local water elevation and the trim and sinkage. These local water elevations defined at the boundary points of the open ramp modify the water height determined in the program HSVA ROLLS based on the ship motions and the incoming waves, which is used to calculate the inflow onto the vehicle deck. The chosen approach to determine the local water elevation at the bow due to ship speed in calm water and add these values to the water heights at the openings computed for seaway is of course approximative. The turning of the vessel The track of the vessel consists of small straight segments at which the speed and the course of the ship are constant. Change can take place when a new segment starts. The centrifugal acceleration during a turn is modeled continuously and does not depend on the mentioned segments. Two effects are modeled: (1) The centrifugal acceleration influencing the fluid
RAMPBOW WAVEempirically
WATER ELEVATION
Dyn. trim & sinkage at FP
Pot. flow theorycomputation (SHALLO)
Fig. A4 Water elevation at the bow.

Seakeeping & Manoeuvring
138
motion on the vehicle deck; (2) The heeling moment on the ship due to the centrifugal acceleration. This acceleration acts on the center of mass of the vessel, that is, on the center of gravity. The moment lever is the vertical distance between the center of gravity and the half of the ship draft. Of these two factors the latter is more powerful, it heels the ship, which causes the water on the vehicle deck to flow starboard. The lateral acceleration on the water itself has only a small effect. The centrifugal acceleration and its effects are started in the HSVA ROLLS with a help of a sinusoidal numerical ramp, which has an effective length of about 14 seconds. This time corresponds to the minimum time to move a rudder from midship to port or starboard and is based on the SOLAS requirements. When the vessel starts to turn there is a dynamic overshooting of the heeling angle before the heeling reaches a more steady value during the turn. If we ignore for the moment the water on the vehicle deck, we can evaluate a coarse minimum value for this steady heeling angle during the turn. An elementary check for the steady heeling value can estimated with moment equation
2v(KG T/2) cos( ) g GMsin( ) .r
− ⋅∇ρ ⋅ ϕ = ∇ρ ⋅ ϕ (6)
Assuming ship speed v of 15 kn, turning radius r of 1.435 Lbp, height of the center of gravity KG 10.62 m, draft T 5.4 m, and the transverse metacentric height GM 1.19 m and gravitational acceleration g 9.81 m/s² we get 11.6° for the steady heeling angle during the turn, when there is no water on the vehicle deck. In a situation during the initial overshooting of the heeling angle at the start of the turn, when there is water on the vehicle deck, and when the ship is in a suitable wave pattern we can expect significantly higher temporary heeling values as the estimated 11°-12° for the steady turn.
Seakeeping & Manoeuvring
139
REFERENCES Blendermann, W. (1986) Windkräfte am Schiff. Institut für Schiffbau der Universität
Hamburg. Bericht Nr. 467. Blume, P. (1979) Experimentelle Bestimmung von Koeffizienten der wirksamen
Rolldämpfung und ihre Anwendung zur Abschätzung extremer Rollwinkel. Schiffstechnik 25/1, 3-29.
Gadd, G. E. (1964) Bilge Keels and Bilge Vanes. National Physical Lab., Ship Division, Report 64.
Grim, O. (1961) Beitrag zu dem Problem der Sicherheit des Schiffes im Seegang. Schiff und Hafen, No. 6.
Grim, O., and Schenzle, P. (1969) Der Einfluß der Fahrtgeschwindigkeit auf die Torsionsbelastung eines Schiffes im Seegang, Institut für Schiffbau der Universität Hamburg, Bericht Nr. 241.
JAIC Suppl. No. 504 (1996) Karppinen, T., Rantanen, A., MV Estonia Accident Investigation – Stability calculations, Technical Report VALC177, VTT Manufacturing Technology, Espoo.
Kirsch. M. (1969) Die Berechnung der Bewegungsgrößen der gekoppelten Tauch- und Stampfbewegungen nach der erweiterten Streifentheorie vom Grim und die Berechnung der Wahrscheinlichkeit für das Überschreiten bestimmter Schranken durch diese Größen, Institut für Schiffbau der Universität Hamburg, Bericht Nr. 241.
Ludwig, N. (2006) MV Estonia – Forced Roll damping Tests, HSVA Report S544/06, Hamburg. 28 pp.
Martin, M. (1958) Roll Damping due to Bilge Keels. Iowa Institute of Hydraulic Research, Report Contr. No. 1611 (01).
Söding, H. (1982) Leckstabilität im Seegang. Institut für Schiffbau der Universität Hamburg, Bericht Nr. 429, Hamburg.
Valanto, P. (2006) Time-Dependent Survival Probability of a Damaged Passenger Ship II – Evacuation in Seaway and Capsizing. HSVA Report No 1661, Hamburgische Schiffbau-Versuchsanstalt GmbH, Available on www.hsva.de.
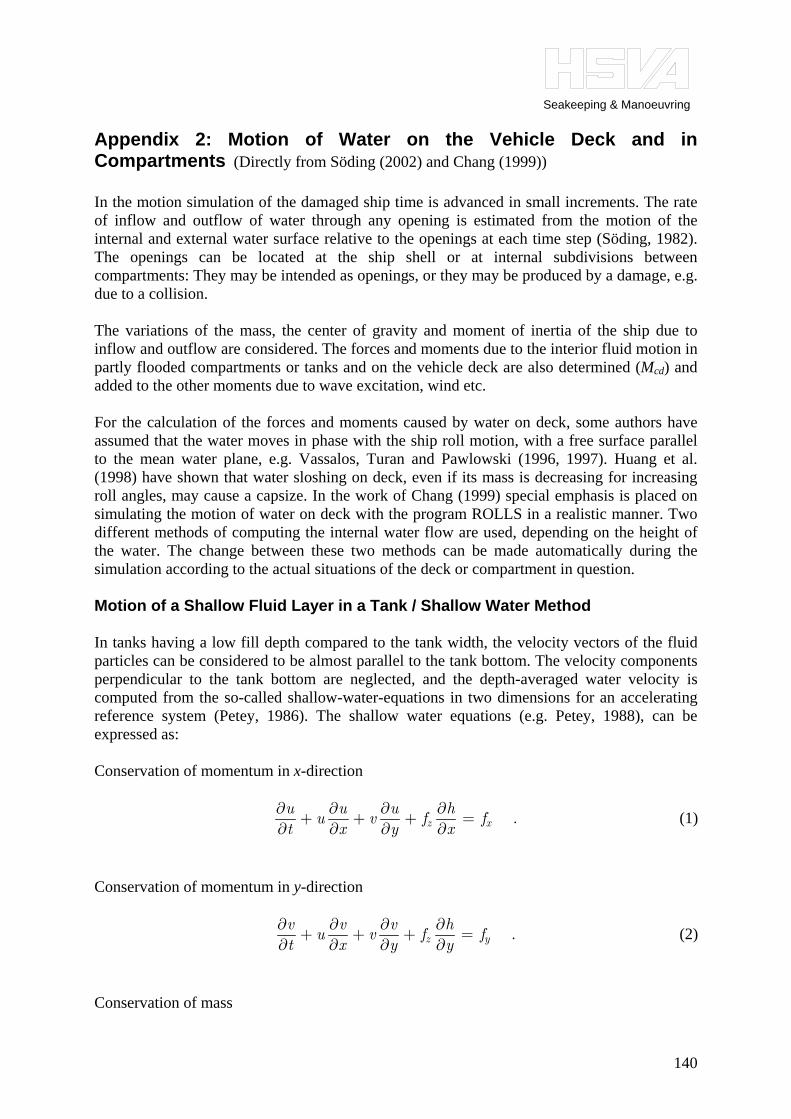
Seakeeping & Manoeuvring
140
Appendix 2: Motion of Water on the Vehicle Deck and in Compartments (Directly from Söding (2002) and Chang (1999)) In the motion simulation of the damaged ship time is advanced in small increments. The rate of inflow and outflow of water through any opening is estimated from the motion of the internal and external water surface relative to the openings at each time step (Söding, 1982). The openings can be located at the ship shell or at internal subdivisions between compartments: They may be intended as openings, or they may be produced by a damage, e.g. due to a collision. The variations of the mass, the center of gravity and moment of inertia of the ship due to inflow and outflow are considered. The forces and moments due to the interior fluid motion in partly flooded compartments or tanks and on the vehicle deck are also determined (Mcd) and added to the other moments due to wave excitation, wind etc. For the calculation of the forces and moments caused by water on deck, some authors have assumed that the water moves in phase with the ship roll motion, with a free surface parallel to the mean water plane, e.g. Vassalos, Turan and Pawlowski (1996, 1997). Huang et al. (1998) have shown that water sloshing on deck, even if its mass is decreasing for increasing roll angles, may cause a capsize. In the work of Chang (1999) special emphasis is placed on simulating the motion of water on deck with the program ROLLS in a realistic manner. Two different methods of computing the internal water flow are used, depending on the height of the water. The change between these two methods can be made automatically during the simulation according to the actual situations of the deck or compartment in question. Motion of a Shallow Fluid Layer in a Tank / Shallow Water Method In tanks having a low fill depth compared to the tank width, the velocity vectors of the fluid particles can be considered to be almost parallel to the tank bottom. The velocity components perpendicular to the tank bottom are neglected, and the depth-averaged water velocity is computed from the so-called shallow-water-equations in two dimensions for an accelerating reference system (Petey, 1986). The shallow water equations (e.g. Petey, 1988), can be expressed as: Conservation of momentum in x-direction
.z xu u u hu v f ft x y x
∂ ∂ ∂ ∂+ + + =∂ ∂ ∂ ∂
(1)
Conservation of momentum in y-direction
.z yv v v hu v f ft x y y
∂ ∂ ∂ ∂+ + + =∂ ∂ ∂ ∂
(2)
Conservation of mass

Seakeeping & Manoeuvring
141
( ) ( ) 0 .h uh vht x y
∂ ∂ ∂+ + =∂ ∂ ∂
(3)
The boundary conditions for a square tank with a length l and width b are:
( , ) 0 /2 ,
( , ) 0 /2 ,
u x y for x l
v x y for y b
= = ±
= = ±
where u and v denote the velocities of a fluid particle relative to the moving frame attached to the tank in x- and y-direction, respectively. The fluid depth h is measured in z-direction, and t denotes time. The terms fx, fy, and fz are the x-,y- and z-components of the body forces including gravity, centrifugal and Coriolis acceleration. These depend on the ship motions and the position of the tank in the ship and are computed anew for each step of the integration in time (Söding, 1982, Dillingham, 1981). The shallow-water equations are solved numerically by dividing the tank bottom or the deck into a number of rectangular cells of equal size. For each pair of adjacent cells a so-called Riemann problem is solved for every time step of the simulation: An analytical solution is used to approximate the time development of the flow starting from a fluid of different surface height and horizontal velocity in two adjacent cells, assuming constant velocity and surface height in each cell at the beginning. This analytical development is used to approximate the flow in the vicinity of the borderline between the two cells at a later time, but before other cells are influenced. This is repeated for all cell boundaries and for longitudinal and transverse flow (Söding, 2002). Glimm’s method, which is essentially a random choice method, is used to obtain he solution of Equations (1)-(3). This method is able to deal with frequently occurring cases of hydraulic jumps and of partially dry tank bottom or deck, which is also visible in Figure A5. The shallow water equations and the Glimm’s method do not model the situation, when the fluid in the tank hits the tank ceiling. This can take place only with very large roll angles. For this reason, if the average water fill depths are larger than about 25 percent of the tank width, or if the heel angle exceeds 25°, another method, that is, a deep water method is used in program ROLLS.
Fig. A5 A momentary water elevation on the vehicle deckduring the time integration of the numerical solution.

Seakeeping & Manoeuvring
142
Fluid Motion in deeply filled Tanks / Deep Water Method In this method the free surface of the liquid is assumed to be an oblique plane, since the greatest natural period of the fluid oscillation is much smaller than the dominant period of the ship motions in this case. The fluid motion is approximated by that of a point mass concentrated in the center of gravity of the fluid mass. This point mass can move on a curve described by the vector ( )Tx ϕ in ship fixed coordinates. The curve is determined by volumetric calculations before starting the simulation. Its shape depends on the fluid volume and the surface inclination Tϕ relative to the tank. A single degree of freedom equation of motion of the free surface of the fluid is derived from Lagrange’s equation, while the obliqueness of the free surface against the x-axis is neglected. The motion of the approximating mass point is described in ship fixed coordinate system: thus a number of terms result from the ship acceleration and rotation. The equation of motion (Söding, 2002) is
22
1 222 / .T T T T
T T K T TT T T T
dx dx d x dxT T x g T Td d d d
ϕ ξ ϕ ϕϕ ϕ ϕ ϕ
− ⎛ ⎞ ⎛ ⎞= − − + + +⎜ ⎟ ⎜ ⎟
⎝ ⎠ ⎝ ⎠ (4)
Here Kξ is the acceleration of the ship-fixed coordinate origin; T is the transformation matrix between the ship-fixed and the inertial coordinates, which depends on the rotation angles of the ship, and (0,0, )Tg g= is the vector of gravitational acceleration represented in the inertial system. Of the 5 terms in parentheses the weight term g is most important, whereas the last two terms corresponding to the Coriolis and centrifugal force are negligible. Additionally a damping is assumed especially if the tank contains internal structures (Söding, 1982, Petey 1988):
1
2
[ ],
T
SS K
TT k T
S
T
dx T T x gd
Dddxd
ξϕ
ϕ ϕ
ϕ
−⎡ ⎤− +⎢ ⎥
⎣ ⎦= − −⎛ ⎞⎜ ⎟⎝ ⎠
(5)
where Tϕ is the oblique angle of the liquid free surface against the y-axis, as shown in Figure A6. A dot designates time derivatives. TM represents and transpose of a matrix M.
( , , )TS S S Sx x y z= is the position vector of center of gravity of the liquid, see Figure A13. The
term Kd is the critical damping of the liquid on deck or in compartments and can be expressed as 2 / ,Kd g i= (6) where
2 2( ) ( ) .S S
T T
dy dzid dϕ ϕ
= + (7)

Seakeeping & Manoeuvring
143
The coefficient D of the damping depends on the obstacles to the flow on deck and in compartments, e.g. stiffeners, web frames, swash bulkheads etc.; D is kept constant during the simulation. The relation between the inertial system ( , , )Tξ ξ η ζ= and the system attached to the ship
( , , )Tx x y z= is .KT xξ ξ= + (8) where Kξ is the origin of the ship-fixed coordinate system (see Figure A13).
cos cos sin cos sin cos sin cos cos sin sin sinsin cos sin sin sin cos cos cos sin sin sin cos ,
sin sin cos cos cosT
ψ θ ϕ ψ θ ϕ ψ ϕ ψ θ ϕ ψψ θ ϕ ψ θ ϕ ψ ϕ ψ θ ϕ ψ
θ ϕ θ ϕ θ
− +⎡ ⎤⎢ ⎥= + −⎢ ⎥
−⎢ ⎥⎣ ⎦
(9)
where ,ϕ θ and ψ denote , respectively, roll, pitch and yaw angles. Equation (5) can be solved in the time domain using the Runge-Kutta integration scheme. For a block-shaped tank the values of Sy and Sz depending on Tϕ will be calculated analytically during the simulation. For other tank shapes the position of the center of gravity of water ( , , )S S Sx y z is interpolated from tables, computed before starting the simulation as functions of Tϕ and the volume of water in each tank. The force K , which acts on the ship due to the water motion, is expressed in the coordinate system fixed to the ship as follows: 1[ ] ,TK m T g b−= − (10) where Tm is the mass of water. The term b denotes the absolute (i.e. relative to the inertial system) acceleration of the center of gravity S of the water, expressed in the ship-fixed coordinate system. References Chang, B-C. (1999) On the Survivability of Damaged Ro-Ro Vessels Using a Simulation
Method. Institut für Schiffbau der Universität Hamburg, Bericht Nr. 597. Dillingham, J. (1981) Motion Studies of a Vessel with Water on Deck, Marine Technology,
Vol. 18 No. 1, 1981. Huang, J., Cong, J., Grochowalski, S., Hsiung, C.C. (1998) Capsize Analysis for Ships with
Water Shipping On and Off the Deck. Twenty-Second Symposium on Naval Hydrodynamics, August 9-14, 1998, Washington, D.C.
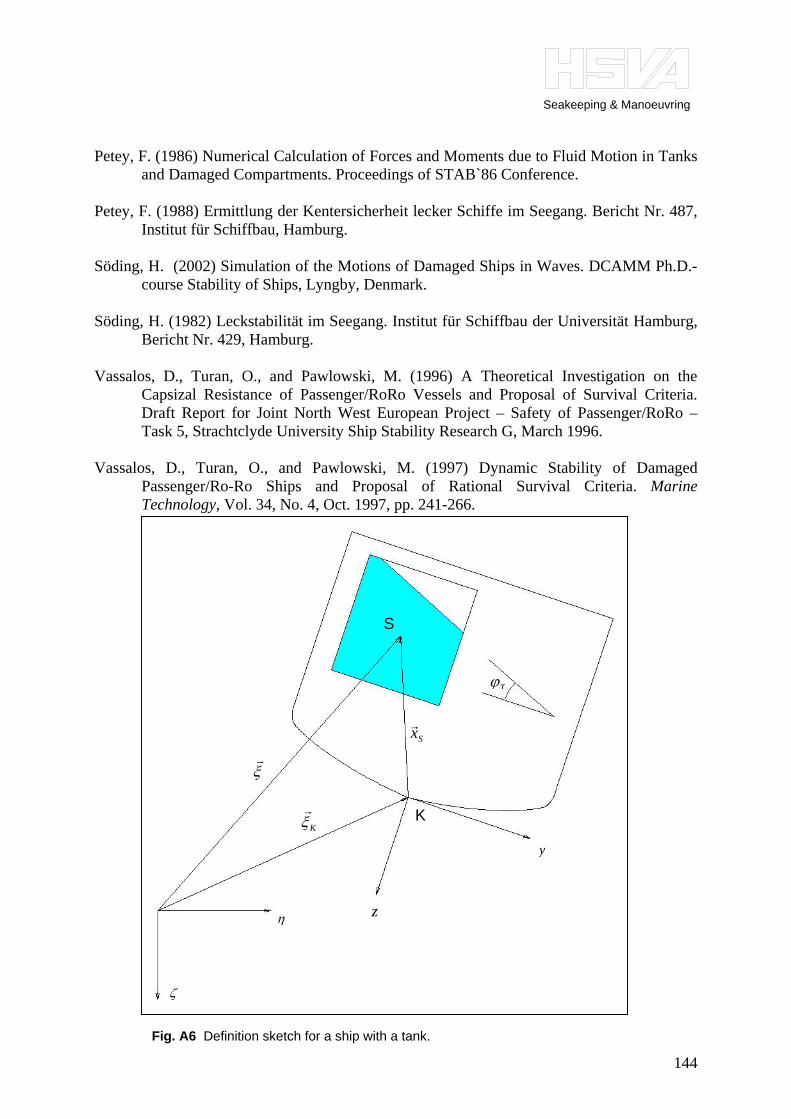
Seakeeping & Manoeuvring
144
Petey, F. (1986) Numerical Calculation of Forces and Moments due to Fluid Motion in Tanks
and Damaged Compartments. Proceedings of STAB`86 Conference. Petey, F. (1988) Ermittlung der Kentersicherheit lecker Schiffe im Seegang. Bericht Nr. 487,
Institut für Schiffbau, Hamburg. Söding, H. (2002) Simulation of the Motions of Damaged Ships in Waves. DCAMM Ph.D.-
course Stability of Ships, Lyngby, Denmark. Söding, H. (1982) Leckstabilität im Seegang. Institut für Schiffbau der Universität Hamburg,
Bericht Nr. 429, Hamburg. Vassalos, D., Turan, O., and Pawlowski, M. (1996) A Theoretical Investigation on the
Capsizal Resistance of Passenger/RoRo Vessels and Proposal of Survival Criteria. Draft Report for Joint North West European Project – Safety of Passenger/RoRo – Task 5, Strachtclyde University Ship Stability Research G, March 1996.
Vassalos, D., Turan, O., and Pawlowski, M. (1997) Dynamic Stability of Damaged
Passenger/Ro-Ro Ships and Proposal of Rational Survival Criteria. Marine Technology, Vol. 34, No. 4, Oct. 1997, pp. 241-266.
Tϕ
S
y
z η
ζ
ξ
Sx
Kξ K
Fig. A6 Definition sketch for a ship with a tank.

Seakeeping & Manoeuvring
145
Appendix 3: Input Data for Simulations The Ship The MV Estonia was built as a the MV Viking Sally in 1979-1980 by Meyer Shipyard in Germany. The vessel had a maximum capacity of 2000 passengers. For reasons of
convenience the Estline company later reduced the maximum number of passengers to 1456, which corresponded to the number of beds and rest chairs on the ship. In 1985 a ducktail was added to the ship to improve the hydrodynamic properties of the hull. The ship design has the following main dimensions:
Lbp, Length between perpendiculars 137.4 m B, Moulded breadth 24.2 m D, Depth to freeboard deck 7.65 m Td, Design draught 5.4 m D∇ , Design draft displacement 11930 m3
Passengers on 28.09.1994 796 Crew on 28.09.1994 193
Geometry Description Description of the original ship form and that of the duck tail was prepared by the HSVA CAD-Office with the program NAPA. The description of the internal compartments was prepared with the program package NAPA by Ship Design and Consult GmbH (SDC). This allows a quick and easy preparation of input data for the time-domain simulation with the program HSVA ROLLS as well as for other parts of pre-processing, like equivalent righting levers in seaway, transfer functions of ship loads and motions, and hydrostatic calculations. Hydrostatic Calculations – Loading Condition As the MV Estonia is intact in the beginning of the simulations no hydrostatic damage calculations were performed. The floating position of the ship were determined with the program NAPA by the SDC based on the positions given in JAIC Suppl. No 504 (1996) for
Table A1 : Main dimensions of the MV Estonia.
Fig. A7 Side view of the MV Estonia.
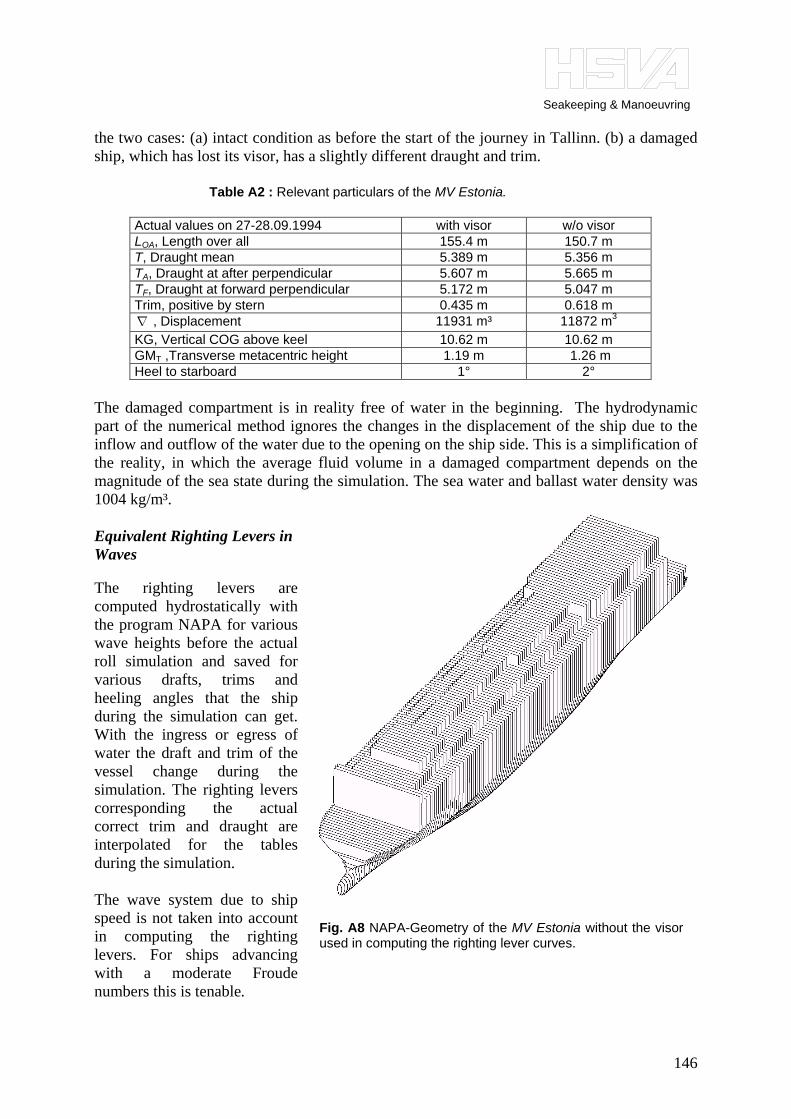
Seakeeping & Manoeuvring
146
the two cases: (a) intact condition as before the start of the journey in Tallinn. (b) a damaged ship, which has lost its visor, has a slightly different draught and trim.
Actual values on 27-28.09.1994 with visor w/o visor LOA, Length over all 155.4 m 150.7 m T, Draught mean 5.389 m 5.356 m TA, Draught at after perpendicular 5.607 m 5.665 m TF, Draught at forward perpendicular 5.172 m 5.047 m Trim, positive by stern 0.435 m 0.618 m ∇ , Displacement 11931 m³ 11872 m3 KG, Vertical COG above keel 10.62 m 10.62 m GMT ,Transverse metacentric height 1.19 m 1.26 m Heel to starboard 1° 2°
The damaged compartment is in reality free of water in the beginning. The hydrodynamic part of the numerical method ignores the changes in the displacement of the ship due to the inflow and outflow of the water due to the opening on the ship side. This is a simplification of the reality, in which the average fluid volume in a damaged compartment depends on the magnitude of the sea state during the simulation. The sea water and ballast water density was 1004 kg/m³. Equivalent Righting Levers in Waves The righting levers are computed hydrostatically with the program NAPA for various wave heights before the actual roll simulation and saved for various drafts, trims and heeling angles that the ship during the simulation can get. With the ingress or egress of water the draft and trim of the vessel change during the simulation. The righting levers corresponding the actual correct trim and draught are interpolated for the tables during the simulation. The wave system due to ship speed is not taken into account in computing the righting levers. For ships advancing with a moderate Froude numbers this is tenable.
Table A2 : Relevant particulars of the MV Estonia.
Fig. A8 NAPA-Geometry of the MV Estonia without the visorused in computing the righting lever curves.

Seakeeping & Manoeuvring
147
Equivalent righting levers in waves are needed by the program ROLLS and were calculated using the NAPA-description of the ship form. The mentioned two ship geometries, namely with and without the visor, were used. Almost the whole superstructure and deckhouse of the ship were taken into account when determining the righting levers, as shown in Figure A8. This is proper for determining the righting levers for dynamic simulation of the ship motions, but not in general for hydrostatic stability calculations. The righting levers for ROLLS were determined up to the angle 85°. Figure A9 shows the righting levers for initial draft and trim. The blue curve corresponds to the ship geometry in Figure A8, which shows the ship geometry without the visor and without the stern part having large openings. The latter can be seen in Figure A7.
Viscous Roll Damping The viscous roll damping coefficients corresponding the Eq. (2) in Appendix 1 were determined with model tests. See the HSVA Report S544/06 (Ludwig, 2006). Description of Damaged Compartments or Compartments into which Water Can Enter For the numerical simulations with the program HSVA ROLLS we need the dependencies of the volume and the position of the center of mass of the flood water in each compartment on the height of the flood water in the compartment and as a function of the heeling and trim angles. These dependencies including also dependence on the trim were delivered by SDC. Following permeabilities were used for the damaged compartments: Vehicle deck 0.82, Engine Room 0.85, all other spaces 0.95. The value for the vehicle deck reflects the situation, in which the water is dynamically sloshing on the vehicle deck, and does not yet penetrate the vehicles. It is assumed that this takes place only gradually.
Fig. A9 Righting lever curves for the MV Estonia

Seakeeping & Manoeuvring
148
Direction of Wind and Waves The MV Estonia heeled against the wind towards the end of the port turn and obviously never recovered from this situation. Earlier ship motion simulations until capsize have shown that the effect of the wave direction is of course very significant, but the presence or direction of wind has a considerably smaller influence on the roll motions. Therefore in the simulations the direction of the waves is taken accurately account. As the wind does not have a such a strong influence it is left away from the simulations. Ventilation ducts leading to the vehicle deck and to several compartments below Several ventilation ducts end outside on the ship shell just below the Deck 4. When the ship reaches a heeling angle of about 30° in the seaway having a significant wave height of about 4.2 m, the water starts to flow down into these ventilation ducts onto the vehicle deck and into the compartments below: Stern Tube & Store Room (892, T1310), KAMEWA Room (893, T1210), Separator Room (851, T1110), Main Engine Room (853, T1010). See Figure A10. In addition there are large ventilation ducts leading from the vehicle deck to outside on Deck 4 at the stern and at the bow to the forecastle deck (level of Deck 4). It is evident that a considerable amount of water could enter the compartments below the vehicle deck through these ducts. See Figures A11-A12. Leaking Doors between Center Casing and the Vehicle deck Survivors coming up from the Deck 1 reported water in the center casing stairs at the level of the vehicle deck and in the bow compartments on Deck 1. For this reason it is assumed that some of the doors between the staircases in the center casing and the vehicle deck were either open or broken or they were leaking considerably. It is, however, not known which doors may have been open, damaged or leaking. Therefore all six port side doors modeled in the center casing have a discharge coefficient, which is one third (0.2) of the usual value (0.6). Thus it is assumed that there is a 33 percent overall leakage in these doors. See Figure A13. Summary of Leaks and Discharge Coefficients The following openings and discharge coefficients shown in the Table A3 were used in the final test case in Chapter 2.7 and in the final simulations reported in Chapter 3. The leaks 1-17 describe the edges of the open ramp. Large discharge coefficient values are used. These leaks let water onto the vehicle deck, that is, into Room 001. Each leak corresponds to an element of the numerical grid for the solution of the shallow water equations on the vehicle deck and ramp shown in Figures A1 and A2. The discharge coefficient 0.9 on the ramp is considered appropriate as there is really no other blocking effects than the top surface of the ramp itself. At the ramp sides a discharge coefficient value of 0.7 is used. The leaks 18-25 describe the ventilation ducts at the ship sides leading onto the vehicle deck and to several spaces below. In general for openings like a door, window, or a fully open inlet into a ventilation duct a discharge coefficient of 0.6 can be considered suitable, and this value would be used in the HSVA ROLLS. In the MV Estonia the ventilation ducts at ship sides
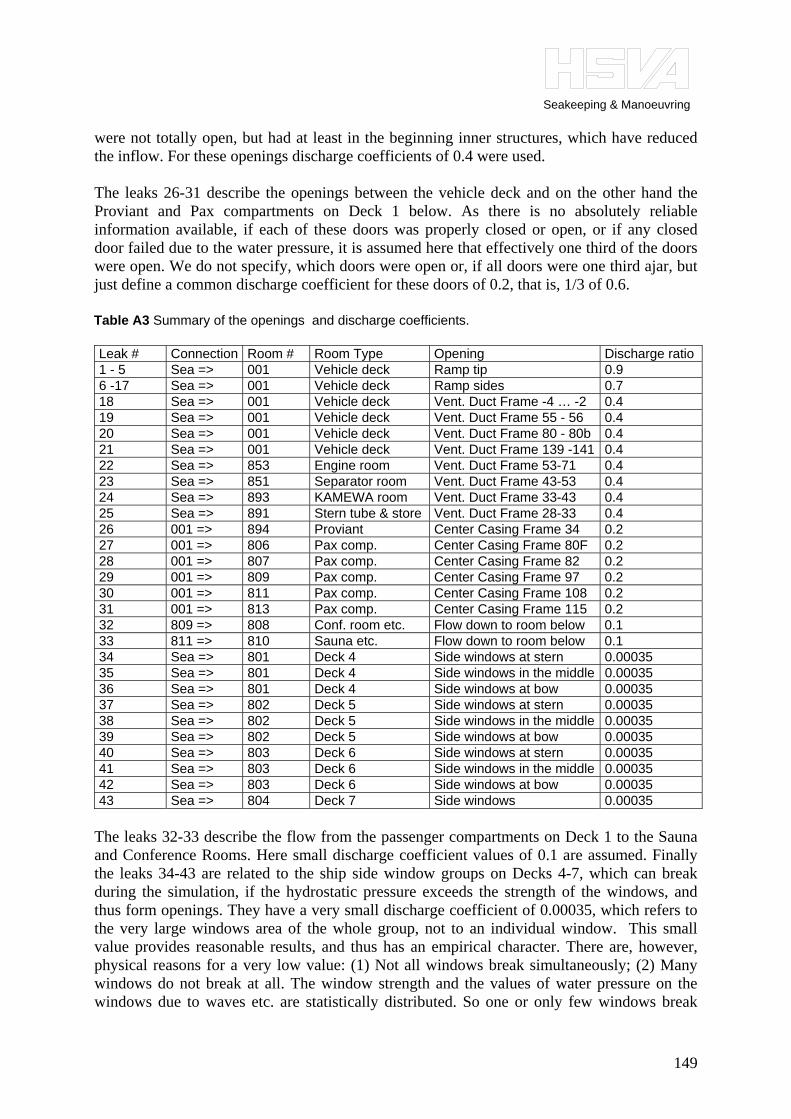
Seakeeping & Manoeuvring
149
were not totally open, but had at least in the beginning inner structures, which have reduced the inflow. For these openings discharge coefficients of 0.4 were used. The leaks 26-31 describe the openings between the vehicle deck and on the other hand the Proviant and Pax compartments on Deck 1 below. As there is no absolutely reliable information available, if each of these doors was properly closed or open, or if any closed door failed due to the water pressure, it is assumed here that effectively one third of the doors were open. We do not specify, which doors were open or, if all doors were one third ajar, but just define a common discharge coefficient for these doors of 0.2, that is, 1/3 of 0.6.
Leak # Connection Room # Room Type Opening Discharge ratio 1 - 5 Sea => 001 Vehicle deck Ramp tip 0.9 6 -17 Sea => 001 Vehicle deck Ramp sides 0.7 18 Sea => 001 Vehicle deck Vent. Duct Frame -4 … -2 0.4 19 Sea => 001 Vehicle deck Vent. Duct Frame 55 - 56 0.4 20 Sea => 001 Vehicle deck Vent. Duct Frame 80 - 80b 0.4 21 Sea => 001 Vehicle deck Vent. Duct Frame 139 -141 0.4 22 Sea => 853 Engine room Vent. Duct Frame 53-71 0.4 23 Sea => 851 Separator room Vent. Duct Frame 43-53 0.4 24 Sea => 893 KAMEWA room Vent. Duct Frame 33-43 0.4 25 Sea => 891 Stern tube & store Vent. Duct Frame 28-33 0.4 26 001 => 894 Proviant Center Casing Frame 34 0.2 27 001 => 806 Pax comp. Center Casing Frame 80F 0.2 28 001 => 807 Pax comp. Center Casing Frame 82 0.2 29 001 => 809 Pax comp. Center Casing Frame 97 0.2 30 001 => 811 Pax comp. Center Casing Frame 108 0.2 31 001 => 813 Pax comp. Center Casing Frame 115 0.2 32 809 => 808 Conf. room etc. Flow down to room below 0.1 33 811 => 810 Sauna etc. Flow down to room below 0.1 34 Sea => 801 Deck 4 Side windows at stern 0.00035 35 Sea => 801 Deck 4 Side windows in the middle 0.00035 36 Sea => 801 Deck 4 Side windows at bow 0.00035 37 Sea => 802 Deck 5 Side windows at stern 0.00035 38 Sea => 802 Deck 5 Side windows in the middle 0.00035 39 Sea => 802 Deck 5 Side windows at bow 0.00035 40 Sea => 803 Deck 6 Side windows at stern 0.00035 41 Sea => 803 Deck 6 Side windows in the middle 0.00035 42 Sea => 803 Deck 6 Side windows at bow 0.00035 43 Sea => 804 Deck 7 Side windows 0.00035
The leaks 32-33 describe the flow from the passenger compartments on Deck 1 to the Sauna and Conference Rooms. Here small discharge coefficient values of 0.1 are assumed. Finally the leaks 34-43 are related to the ship side window groups on Decks 4-7, which can break during the simulation, if the hydrostatic pressure exceeds the strength of the windows, and thus form openings. They have a very small discharge coefficient of 0.00035, which refers to the very large windows area of the whole group, not to an individual window. This small value provides reasonable results, and thus has an empirical character. There are, however, physical reasons for a very low value: (1) Not all windows break simultaneously; (2) Many windows do not break at all. The window strength and the values of water pressure on the windows due to waves etc. are statistically distributed. So one or only few windows break
Table A3 Summary of the openings and discharge coefficients.
Seakeeping & Manoeuvring
150
first. The water flows in through these newly formed openings and spreads relatively evenly also on the inner side of the windows not yet broken. This pressure head on the inner side at least partially balances the outer pressure on these windows. This process can slow down the failure rate of the windows, and probably also limits the number of the windows broken altogether. In the simulation the flood water flows freely into the ship compartments. A necessary condition for this is that the air in the compartments can flow out. The space on the vehicle deck is well ventilated through ventilation ducts on both sides of the ship. The at least partly open ramp provides additional ventilation. The Engine Room itself and the engine related other spaces were ventilated through several ventilation ducts on both sides of the ship. Thus when there was a water inflow on one side, a perfect outflow of air was provided through the ventilations ducts on the other side. The passenger compartments below the vehicle deck are considered here to be sufficiently ventilated, if not otherwise, then at least due to doors left open by fleeing passengers. Figures A10-A12 illustrate the modeled leaks. The Failure Criteria for the Windows It is very likely that some of the windows on the deckhouse failed when the ship heeled and the windows were temporarily or continuously under water. At these later phases of the heeling process the ship speed was already quite low. Therefore it is unlikely that the windows on the starboard side of the deckhouse would have failed due to wave or slamming impacts. Here our opinion clearly deviates from that in the JAIC final report, which mentions mainly the wave impacts as a potential cause for the window failure. In this study it is assumed that the windows broke due to hydrostatic pressure as the ship heeled and the windows immersed into the waves. In the numerical model a window breaks when the pressure head taken from the middle of the window to the wavy irregular free water surface above exceeds a certain critical value typical for the window type in question. In the test simulations the window breaking was delayed, but in the final simulations the windows break instantly, when the water pressure exceeds the threshold value. The ship windows made by most ship window manufactures satisfy the ISO Standard 3903 “ Shipbuilding and marine structures – ordinary rectangular windows”. The ISO Standard 3903 was established in 1977 and revised in 1993. The building yard’s drawing number S590-26-12 “ General Arrangement 4, Fensterplan 3”, dated 1980-02-01, gives the following dimensions to the windows on the ship sides: smaller windows 400 mm x 800 mm with glass thickness 10 mm, and larger windows 600 mm x 1500 mm also with glass thickness 10 mm. The ISO standard 3903 gives for these two window dimensions the following maximum allowable (uniform) pressures ~40.65 kPa and ~16.15 kPa, respectively. As the glass thickness is equal in both windows, it is clear that the larger windows are considerably weaker than the smaller windows. The breaking pressure or load for the windows should be clearly higher than the maximum allowable pressure. Therefore it is assumed here that the breaking load is twice the maximum allowable pressure load. Thus in the numerical model the smaller windows (400 x 800) break, when the hydrostatic pressure head amounts to 8.2 m and the larger windows (600x1500) break, when the hydrostatic pressure head amounts to 3.3 m.

151
Fig. A10 Location of the ventilation ducts to the vehicle deck and to several spaces below the vehicle deck. Based on Jos. L. Meyer Drawing No: S590-64/1.
V-DECK SUPPLY VENTILATOR DUCTS
VEHICLE DECK VENTILATOR DUCTS
SEPARATOR ROOM DUCTS
KAMEWA ROOM DUCTS
STERN TUBE/ STORE ROOM DUCTS
V-DECK EXHAUST VENTILATOR DUCTS
V-DECK VENTI-LATOR DUCTS
MAIN ENGINE ROOM DUCTS
V-DECK VENTI-LATOR DUCTS

152
VEHICLE DECK - SUPPLY VENTILATORS
Fig. A11 Location of the supply ventilators to the vehicle deck. Based on Jos. L. Meyer Drawing No: S590-64/1.

153
VEHICLE DECK - EXHAUST VENTILATORS
Fig. A12 Location of the vehicle deck exhaust ventilators on the C-Deck. Based on Jos. L. Meyer Drawing No: S590-64/1.

154
FIRE DOORS
FIRE DOORS
FIRE DOOR FIRE DOOR
FIRE DOOR FIRE DOOR
Fig. A13 Location of the fire doors in the center casing to the vehicle deck. Based on Jos. L. Meyer Drawing No: S590-02/3.
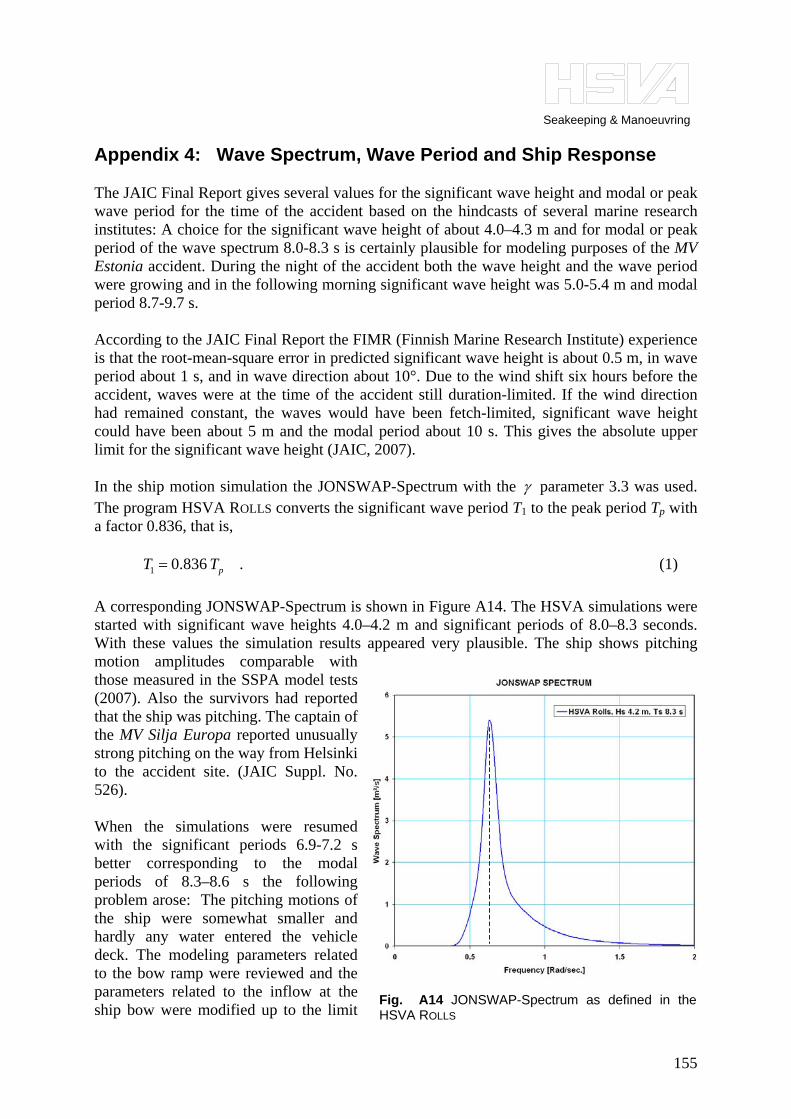
Seakeeping & Manoeuvring
155
Appendix 4: Wave Spectrum, Wave Period and Ship Response The JAIC Final Report gives several values for the significant wave height and modal or peak wave period for the time of the accident based on the hindcasts of several marine research institutes: A choice for the significant wave height of about 4.0–4.3 m and for modal or peak period of the wave spectrum 8.0-8.3 s is certainly plausible for modeling purposes of the MV Estonia accident. During the night of the accident both the wave height and the wave period were growing and in the following morning significant wave height was 5.0-5.4 m and modal period 8.7-9.7 s. According to the JAIC Final Report the FIMR (Finnish Marine Research Institute) experience is that the root-mean-square error in predicted significant wave height is about 0.5 m, in wave period about 1 s, and in wave direction about 10°. Due to the wind shift six hours before the accident, waves were at the time of the accident still duration-limited. If the wind direction had remained constant, the waves would have been fetch-limited, significant wave height could have been about 5 m and the modal period about 10 s. This gives the absolute upper limit for the significant wave height (JAIC, 2007). In the ship motion simulation the JONSWAP-Spectrum with the γ parameter 3.3 was used. The program HSVA ROLLS converts the significant wave period T1 to the peak period Tp with a factor 0.836, that is, 1 0.836 .pT T= (1) A corresponding JONSWAP-Spectrum is shown in Figure A14. The HSVA simulations were started with significant wave heights 4.0–4.2 m and significant periods of 8.0–8.3 seconds. With these values the simulation results appeared very plausible. The ship shows pitching motion amplitudes comparable with those measured in the SSPA model tests (2007). Also the survivors had reported that the ship was pitching. The captain of the MV Silja Europa reported unusually strong pitching on the way from Helsinki to the accident site. (JAIC Suppl. No. 526). When the simulations were resumed with the significant periods 6.9-7.2 s better corresponding to the modal periods of 8.3–8.6 s the following problem arose: The pitching motions of the ship were somewhat smaller and hardly any water entered the vehicle deck. The modeling parameters related to the bow ramp were reviewed and the parameters related to the inflow at the ship bow were modified up to the limit
Fig. A14 JONSWAP-Spectrum as defined in theHSVA ROLLS

Seakeeping & Manoeuvring
156
of not being plausible in order to increase the water ingress at the bow. This provided only very limited improvement and was given up. The explanation to this modeling problem can at least partly be seen in the Response Amplitude Operators (RAO) for pitch and heave based on strip theory and used by the HSVA ROLLS.
Figure A15 shows the magnitude of the response amplitude operator consisting of real and imaginary parts for pitch used by HSVA ROLLS. The wave periods 6.9-7.2 s lead to wave length of about 74-81 m according to classical wave theory, whereas the originally used
Fig. A16 The Response Amplitude Operator for heave motion.
Fig. A15 The Response Amplitude Operator for pitch motion.
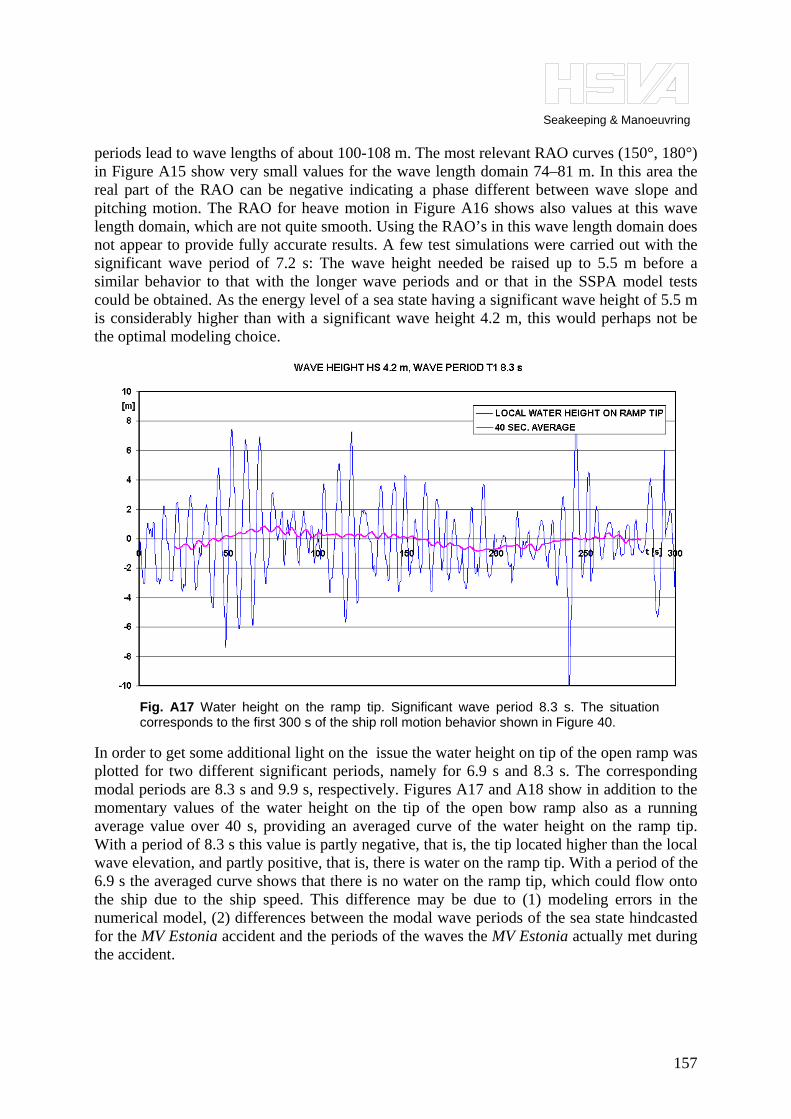
Seakeeping & Manoeuvring
157
periods lead to wave lengths of about 100-108 m. The most relevant RAO curves (150°, 180°) in Figure A15 show very small values for the wave length domain 74–81 m. In this area the real part of the RAO can be negative indicating a phase different between wave slope and pitching motion. The RAO for heave motion in Figure A16 shows also values at this wave length domain, which are not quite smooth. Using the RAO’s in this wave length domain does not appear to provide fully accurate results. A few test simulations were carried out with the significant wave period of 7.2 s: The wave height needed be raised up to 5.5 m before a similar behavior to that with the longer wave periods and or that in the SSPA model tests could be obtained. As the energy level of a sea state having a significant wave height of 5.5 m is considerably higher than with a significant wave height 4.2 m, this would perhaps not be the optimal modeling choice.
In order to get some additional light on the issue the water height on tip of the open ramp was plotted for two different significant periods, namely for 6.9 s and 8.3 s. The corresponding modal periods are 8.3 s and 9.9 s, respectively. Figures A17 and A18 show in addition to the momentary values of the water height on the tip of the open bow ramp also as a running average value over 40 s, providing an averaged curve of the water height on the ramp tip. With a period of 8.3 s this value is partly negative, that is, the tip located higher than the local wave elevation, and partly positive, that is, there is water on the ramp tip. With a period of the 6.9 s the averaged curve shows that there is no water on the ramp tip, which could flow onto the ship due to the ship speed. This difference may be due to (1) modeling errors in the numerical model, (2) differences between the modal wave periods of the sea state hindcasted for the MV Estonia accident and the periods of the waves the MV Estonia actually met during the accident.
Fig. A17 Water height on the ramp tip. Significant wave period 8.3 s. The situationcorresponds to the first 300 s of the ship roll motion behavior shown in Figure 40.

Seakeeping & Manoeuvring
158
It can be asked why did the accident start exactly when it started, and not let’s say, half an hour later. The ship was on straight course. A likely explanation for the start of the accident or continuation of the failure process of the bow visor structures is that the ship encountered some higher, perhaps also longer waves, which triggered the failure process anew. In this situation it was considered feasible to adjust the wave period somewhat in order to obtain as plausible results as in the initial simulations and a ship behavior more similar to that in the SSPA Model tests (2007) and as reported by the survivors and in JAIC Suppl. No. 526.
For the reasons presented also the final the ship motions simulations with the HSVA ROLLS were carried out with the significant wave height of 4.2 m and significant period 8.3 s. When the ship has a forward speed it meets the waves with an encounter frequency, which depends not only on the wave frequency or wave period, but also on the ship speed and its direction with respect to waves. Also these parameters are not known very accurately.
Fig. A18 Water height on the ramp tip. Significant wave period 6.9 s.


![Hearth Money Rolls [1663] for Co ... - Adams Family DNAadamsfamilydna.com/wp-content/uploads/2013/02/1663-Hearth-Money...Hearth Money Rolls [1663] for Co. Londonderry [T307] [Sorted](https://static.fdocuments.in/doc/165x107/5b4b8a967f8b9a5c278ce123/hearth-money-rolls-1663-for-co-adams-family-money-rolls-1663-for-co-londonderry.jpg)

![[Frontiers in Bioscience 16, 1663-1674, January 1, 2011 ... › a1a2 › 2bf5cf072987... · [Frontiers in Bioscience 16, 1663-1674, January 1, 2011] 1663 Inflammatory markers and](https://static.fdocuments.in/doc/165x107/5f03c4f17e708231d40aae1b/frontiers-in-bioscience-16-1663-1674-january-1-2011-a-a1a2-a-2bf5cf072987.jpg)


