AXIS… · Axis Bank remains well-capitalised (Tier-1 ratio of 13%, CET1 ratio of 11.9%) to fund...
15
Transcript of AXIS… · Axis Bank remains well-capitalised (Tier-1 ratio of 13%, CET1 ratio of 11.9%) to fund...


2
Page
AXIS BANK
INDUSTRY CMP Recommend Add on dips to
Sequential Targets
Time Horizon
DATE 27th Aug 2018
BFSI - Pvt. Bank Rs 640
Buy at CMP and add on
declines Rs 567-577 Rs 735 and
Rs 815
Rs 531
3-4 Quarters
Strengthening retail franchise – increasing granularity
Deteriorating asset quality turning around
Shift in focus towards higher rated corporates Comfortable capital adequacy ratio
Investors may sell 60-65% of their holdings on first target being achieved and later keep a stoploss of first target for the balance holdings, in case the second target takes time to be achieved. Investors may also maintain Rs 531 as level below which investment position needs to be reviewed, including the possibility to exit

3
Page
HDFC Scrip Code AXIBANEQNR
BSE Code 532215
NSE Code AXISBANK
Bloomberg AXSB IN
CMP 1-Jun-18 631.8
Equity Capital (Rs mn) 5136.5
Face Value (Rs) 2
Eq- Share O/S (mn) 2568.3
Market Cap (Rs bn) 1622.6
Book Value (Rs) 247.2
Avg.52 Wk Volume 8,680,000
52 Week High 643.5
52 Week Low 447.8
Shareholding Pattern % (Jun-2018)
Promoters 25.1
Institutions 62.3
Non Institutions 12.6
Total 100.0
FUNDAMENTAL ANALYST
Atul Karwa [email protected]
Company Profile: Axis Bank is the third largest private sector bank in India. The Bank offers the entire spectrum of financial services to customer segments covering Large and Mid-Corporates, MSME, Agriculture and Retail Businesses. With its 3,779 domestic branches (including extension counters) and 12,834 ATMs across the country as on 30th June 2018, the network of Axis Bank spreads across 2,211 cities and towns, enabling the Bank to reach out to a large cross-section of customers with an array of products and services. The Bank also has ten overseas offices with branches at Singapore, Hong Kong, Dubai (at the DIFC), Shanghai and Colombo; representative offices at Dubai, Abu Dhabi, Dhaka and Sharjah and an overseas subsidiary at London, UK. Investment rationale: • Deteriorating asset quality turning around • Strengthening retail franchise – increasing granularity • Shift in focus towards higher rated corporates • Bancassurance tie-ups to prop up revenues • Comfortable capital adequacy ratio Concerns: • Uncertainty at top management level • Increase in NPA levels • Limited value unlocking potential • Competition from peers View and valuation: Axis Bank remains well-capitalised (Tier-1 ratio of 13%, CET1 ratio of 11.9%) to fund ~17% asset growth over the next two years. Bank has made significant investments to ride the next growth cycle (post near term asset quality challenges) with strong capitalization and expanding liability franchise (3,779 branches). With an improving outlook on fresh slippages/credit costs, we expect earnings to start normalizing from 2HFY19 onward. The bank is in the process to find and appoint its new CEO (Ms. Shikha Sharma’s term ends in Dec-18) and it remains a key monitorable. A new CEO could bring a fresh thrust/perspective to the Banks growth plans. At the current levels the worst seems to have been priced in and the bank is available at attractive valuations compared to other similarly placed Banks. Fundamental positives like high CASA ratio, distribution network, Franchise value and high and growing share of retail loans are key positives. Its RoA and RoE could revive to healthy levels from the current low levels by FY20. The stock is currently trading at 2.4x FY20E ABC. We feel investors could buy the stock at the CMP and add on declines to Rs 567-577 band (2.1x FY20E ABV) for sequential targets of Rs 735 (2.7x FY20E ABV) and Rs 815 (3.0x FY20E ABV) in 2-3 quarters.
4
Page
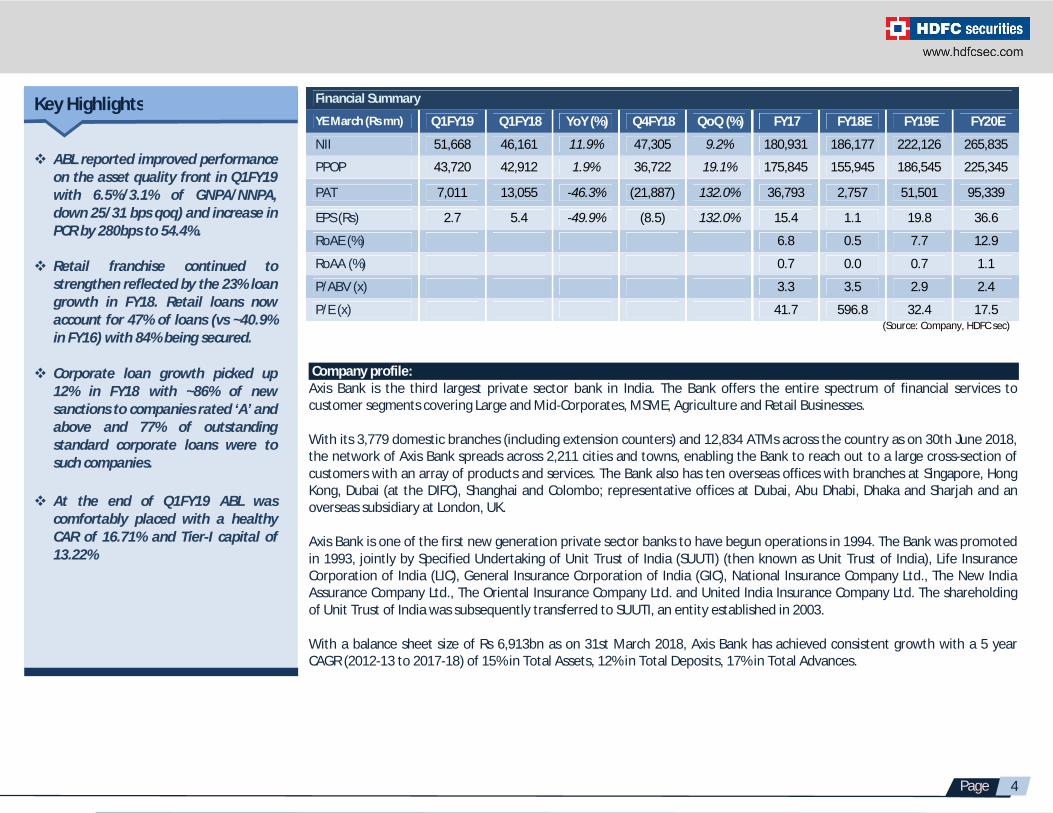
Financial Summary
YE March (Rs mn) Q1FY19 Q1FY18 YoY (%) Q4FY18 QoQ (%) FY17 FY18E FY19E FY20E
NII 51,668 46,161 11.9% 47,305 9.2% 180,931 186,177 222,126 265,835
PPOP 43,720 42,912 1.9% 36,722 19.1% 175,845 155,945 186,545 225,345
PAT 7,011 13,055 -46.3% (21,887) 132.0% 36,793 2,757 51,501 95,339
EPS (Rs) 2.7 5.4 -49.9% (8.5) 132.0% 15.4 1.1 19.8 36.6
RoAE (%) 6.8 0.5 7.7 12.9
RoAA (%) 0.7 0.0 0.7 1.1
P/ABV (x) 3.3 3.5 2.9 2.4
P/E (x) 41.7 596.8 32.4 17.5
Key Highlights
ABL reported improved performance on the asset quality front in Q1FY19 with 6.5%/3.1% of GNPA/NNPA, down 25/31 bps qoq) and increase in PCR by 280bps to 54.4%.
Retail franchise continued to
strengthen reflected by the 23% loan growth in FY18. Retail loans now account for 47% of loans (vs ~40.9% in FY16) with 84% being secured.
Corporate loan growth picked up
12% in FY18 with ~86% of new sanctions to companies rated ‘A’ and above and 77% of outstanding standard corporate loans were to such companies.
At the end of Q1FY19 ABL was
comfortably placed with a healthy CAR of 16.71% and Tier-I capital of 13.22%
(Source: Company, HDFC sec)
Company profile: Axis Bank is the third largest private sector bank in India. The Bank offers the entire spectrum of financial services to customer segments covering Large and Mid-Corporates, MSME, Agriculture and Retail Businesses. With its 3,779 domestic branches (including extension counters) and 12,834 ATMs across the country as on 30th June 2018, the network of Axis Bank spreads across 2,211 cities and towns, enabling the Bank to reach out to a large cross-section of customers with an array of products and services. The Bank also has ten overseas offices with branches at Singapore, Hong Kong, Dubai (at the DIFC), Shanghai and Colombo; representative offices at Dubai, Abu Dhabi, Dhaka and Sharjah and an overseas subsidiary at London, UK. Axis Bank is one of the first new generation private sector banks to have begun operations in 1994. The Bank was promoted in 1993, jointly by Specified Undertaking of Unit Trust of India (SUUTI) (then known as Unit Trust of India), Life Insurance Corporation of India (LIC), General Insurance Corporation of India (GIC), National Insurance Company Ltd., The New India Assurance Company Ltd., The Oriental Insurance Company Ltd. and United India Insurance Company Ltd. The shareholding of Unit Trust of India was subsequently transferred to SUUTI, an entity established in 2003. With a balance sheet size of Rs 6,913bn as on 31st March 2018, Axis Bank has achieved consistent growth with a 5 year CAGR (2012-13 to 2017-18) of 15% in Total Assets, 12% in Total Deposits, 17% in Total Advances.

5
Page
Well Diversified Branch Network in India Total Business Has Grown At CAGR of 15.3% (FY13-FY18)
(Source: Company, HDFC Sec)
Subsidiaries Axis Finance Ltd., the Bank’s fast growing NBFC that caters to the unique financing requirement of retail and wholesale customers. It reported 54% YoY growth in total loans with 64% growth in retail loans. Axis Finance’s net profit increased by 27% to Rs 2.09bn in FY18 and contributed 44% to total subsidiaries’ earnings. Axis Capital, the Bank’s institutional equities and investment banking franchise has been the leader in equity and equity linked deals over last decade and had another great year with 42% market share of the IPO market. Axis Capital reported PAT of Rs 1.39bn in FY18 and contributed 29% to the total earnings of the subsidiaries. Axis AMC and Axis Securities continued to contribute towards the Bank’s Retail Franchise building strategy and strengthen the bond with its customers. Axis AMC (75% stake by Axis Bank and 25% by Schroders Singapore) reported 45% YoY growth in average AUM with 26% growth in total number of folios. It reported PAT of Rs 430mn and contributed 9% to total subsidiaries’ earnings. Axis Securities, one of the fastest growing brokerage firms in India reported 33% growth in cumulative client base to 1.84mn in FY18 and contributed Rs 604mn, i.e. 13% to subsidiaries’ net profits. Axis Bank acquired Freecharge in Oct-2017, one of the India’s leading digital payment companies that has a current user base of 61.5mn, GMV of over Rs 20bn and ~110mn transactions. The Bank believes that the Freecharge’s unique value proposition in the digital payments space and the strength of its acquisition engine would help to build the Axis franchise further and create significant value for the Bank. The post-acquisition activities at Freecharge remain on track with total payment volumes up 36% and monthly active users increasing by 44% during the period October 2017 to March 2018. The subsidiary reported a loss of Rs 281mn in FY18. A.TReDs Limited, the Bank’s (67%) subsidiary that was set up in partnership with m-Junction, was one of the three entities allowed by RBI to set up the Trade Receivables Discounting System (TReDS), an electronic platform for facilitating cash flows for MSMEs. The Bank’s digital invoice discounting platform ‘Invoicemart’ for MSMEs has done exceptionally well with market share of nearly 43% among all TReDS platforms. It currently has more than 350 participants on the platform and has clocked more than Rs 4.10bn in financed throughput as of FY18 by e-discounting nearly 14,300 invoices.
6
Page
(Rs mn) % holding Dividend Recd Total Asset Turnover Profit Axis Capital 100.0 1,418 13,613 4,345 1,388 Axis Private Equity 100.0 - 40 2 (3) Axis Trustee Services 100.0 163 729 384 202 Axis AMC 75.0 - 5,045 7,525 430 Axis Finance Ltd 100.0 1,460 66,765 7,215 2,094 Axis Securities Ltd 100.0 235 5,367 9,505 604 FreeCharge 100.0 - 1,497 195 (281) A.TreDs Ltd 67.0 - 191 16 (78)
Investment rationale
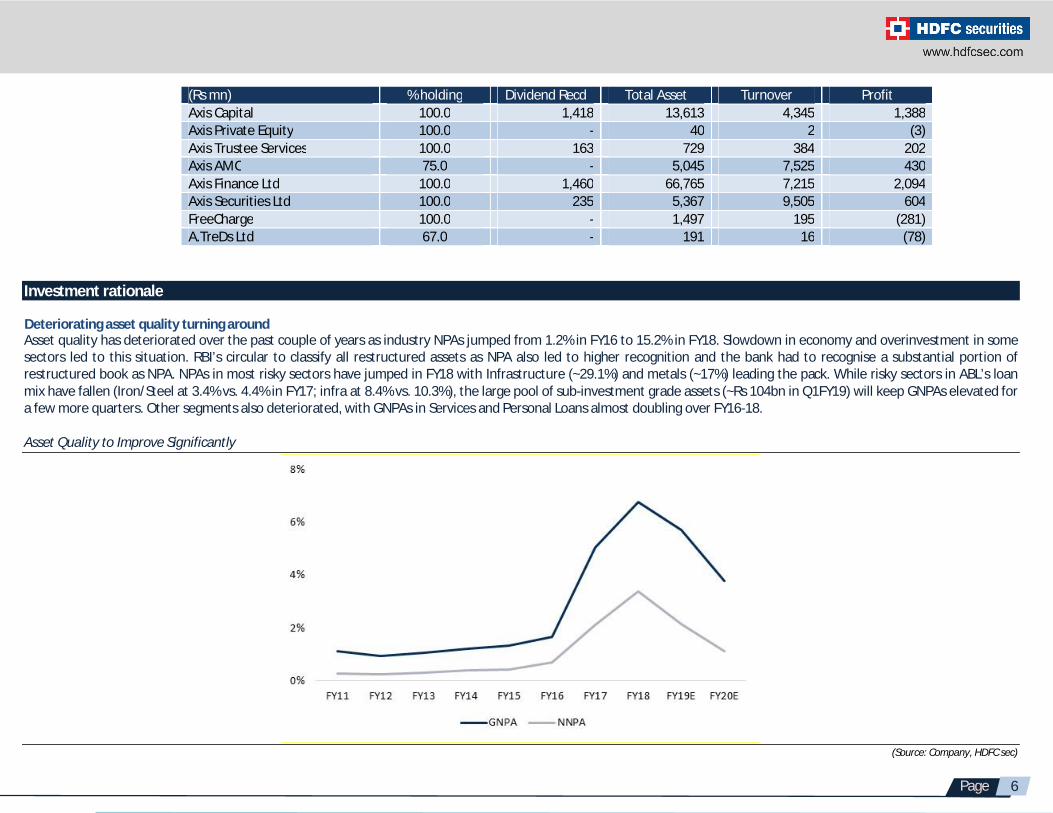
Deteriorating asset quality turning around Asset quality has deteriorated over the past couple of years as industry NPAs jumped from 1.2% in FY16 to 15.2% in FY18. Slowdown in economy and overinvestment in some sectors led to this situation. RBI’s circular to classify all restructured assets as NPA also led to higher recognition and the bank had to recognise a substantial portion of restructured book as NPA. NPAs in most risky sectors have jumped in FY18 with Infrastructure (~29.1%) and metals (~17%) leading the pack. While risky sectors in ABL’s loan mix have fallen (Iron/Steel at 3.4% vs. 4.4% in FY17; infra at 8.4% vs. 10.3%), the large pool of sub-investment grade assets (~Rs 104bn in Q1FY19) will keep GNPAs elevated for a few more quarters. Other segments also deteriorated, with GNPAs in Services and Personal Loans almost doubling over FY16-18. Asset Quality to Improve Significantly
(Source: Company, HDFC sec)

7
Page
However, the Bank reported improved performance on the asset quality front in Q1FY19 with 6.5% gross NPA (down 25 bps qoq) and 3.1% (down 31 bps qoq) net NPA. Slippages remained high at 3.9%, but declined sequentially. The bank has increased its provision coverage by 280 bps qoq to 54.4% in Q1FY19. New NPA formation in the corporate book continues to be from BB and below book (~88%). The bank has indicated that it had significantly tightened its retail NPA recognition platform in recent quarters, which has resulted in higher than normalized slippages in the retail book. The vulnerable pool in the non-NPA book is down significantly from 8.9% of net customer assets in Q1FY17 to 2.5% in Q1FY19. The share of ‘BB and below’ accounts is ~4% of loans which is only marginally higher than the previous quarter. This means that the long and painful corporate impairment cycle seems to be getting closer to its end. The management is expecting one more quarter of elevated slippages. The management has guided that credit costs will get normalized in the 2HFY19 and might be in the vicinity of 100-110 bps. With slippages moderating from H2FY19, recoveries/upgradations of accounts and resolutions under NCLT we expect asset quality to improve significantly by FY20. Strengthening retail franchise – increasing granularity The bank’s retail franchise continued to strengthen reflected by the 23% loan growth in FY18. Retail loans now account for 47% of loans (vs ~40.9% in FY16) with 84% being secured. Impressively, ~50% of incremental retail loans were sourced through branches, with existing deposit customers contributing to ~72% of the incremental retail loans, reflecting strong cross sell franchise. Retail deposits grew by ~13% in FY18 with the share of savings account and retail term deposits at ~84% following sustained branch addition (399 branches in FY18). Share of top 20 advances dropped to 10.3% in FY18 from ~11.2% in FY17. Superior growth in Retail loan product distribution achieved by deepening business relationships within existing branches, coupled with expansion in new geographies, where the Bank already had seasoned branches. Share of retail loans have grown from ~25% in FY11 to ~49% in FY18
(Source: Company, HDFC Sec)

8
Page
Strong retail fee income growth The increasing granularity of the loan book and higher share of retail loans has led to strong growth in retail fee income. Fee income grew by 12.5% YoY in FY18. Within that the core retail fee income increased by 22.3% YoY in FY18 to Rs 42.6bn accounting for 48% of the total fee income. This trend has continued in FY19 as well with core retail fee income growing by a healthy 18% YoY in Q1FY19 (as compared to 6% YoY overall fee income growth) and contributing to 61% of the total fee income. Shift in focus towards higher rated corporates In the corporate segment, the Bank’s strategic focus in recent years has been towards building a higher rated lending book, increase the share of working capital loans and reducing the concentration risk. During FY18, the Bank’s corporate loan growth picked up to 12% as compared to flat growth in FY17 with working capital loans growing by 63% YoY. In FY18, ~86% of new sanctions in the corporate book were to companies rated ‘A’ and above and 77% of outstanding standard corporate loans were to such companies. The move towards lower risk assets is also reflected in lower RWA/asset which declined from 81% in FY17 to 77% in FY18. In terms of the off-balance sheet exposure too there has been consistent decline as overall contingent liabilities to asset declined to 106% (from 111% in FY17) with drop across derivatives, guarantees and acceptances. The credit equivalent amount (CEA) proportion also fell to 15.5% (17.4% in FY17). Subsidiaries performance continues to improve in Q1FY19 The subsidiaries of Axis Bank continue to perform well. The bank subsidiaries have started a scale to a level where they are now able-complements to the bank’s overall strategy. The loan book of Axis Finance grew by 47% YoY in Q1FY19 to Rs 68.2bn with retail loans accounting for 18% of the loan book Axis Capital executed 9 transactions during the first quarter including a QIP and OFS and 3 advisory deals. Axis Securities which has also one of the highest mobile adoption rates in the country with over 60% of the volumes coming from mobile. Its cumulative client base rose
29% YoY to 1.9mn in Q1FY19. Axis AMC, the mutual fund business continues to perform well. The AMC reported 25% YoY growth in average AUM for the first quarter led by 32% rise in number of
clients’ folio. The banks’ digital invoice discounting platform Invoicemart has done exceedingly well in its first few quarters of existence and now enjoy the market share of about 40%
among all platforms. It has clocked more than Rs 6.6bn in finance throughput by e-discounting of 29,000 invoices. Freecharge has seen strong customer acquisition which has increased to 3x of its old levels, monthly active user numbers are up significantly and spend per user is up 46%. Bancassurance tie-ups to prop up revenues Axis Bank entered into a corporate agency agreement with Life Insurance Corporation of India the largest public sector Life Insurance Company in Jul-2016. Prior to that Axis Bank had an exclusive tie-up with Max Life Insurance to distribute its insurance products. The tie-up would enable ABL to combine and utilise the synergies for enhancing customer satisfaction. Besides life insurance, ABL has tied up with Tata AIG to offer general insurance and Apollo Munich for health insurance products. ABL holds a 4.99% stake in Max Life Insurance. As per media reports the bank was looking to acquire a life insurance company. With insurance sector in a sweet spot and NPA trouble abating, the bank might revive its plans to enter into the insurance space. LIC is one of the promoters of the bank and holds 13.62% stake. Treasury income could be higher Profit from sale of investments declined by 58% in FY18 to Rs 13,251mn on account of higher interest rates. Due to the possibility of further hikes, we have taken a conservative figure of Rs 7,500mn profit from treasury operations in FY19 and FY20. However, interest rates may decline towards the latter half of FY19 or in FY20 which could boost income from treasury.
9
Page
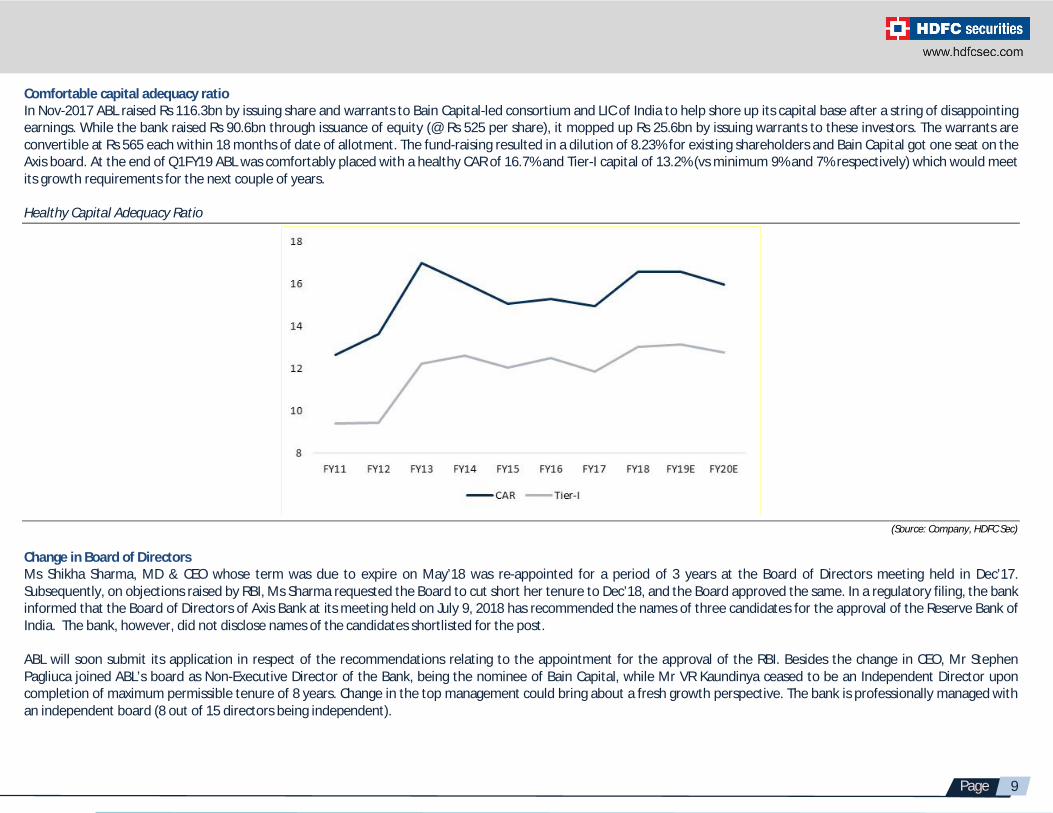
Comfortable capital adequacy ratio In Nov-2017 ABL raised Rs 116.3bn by issuing share and warrants to Bain Capital-led consortium and LIC of India to help shore up its capital base after a string of disappointing earnings. While the bank raised Rs 90.6bn through issuance of equity (@ Rs 525 per share), it mopped up Rs 25.6bn by issuing warrants to these investors. The warrants are convertible at Rs 565 each within 18 months of date of allotment. The fund-raising resulted in a dilution of 8.23% for existing shareholders and Bain Capital got one seat on the Axis board. At the end of Q1FY19 ABL was comfortably placed with a healthy CAR of 16.7% and Tier-I capital of 13.2% (vs minimum 9% and 7% respectively) which would meet its growth requirements for the next couple of years. Healthy Capital Adequacy Ratio
(Source: Company, HDFC Sec) Change in Board of Directors Ms Shikha Sharma, MD & CEO whose term was due to expire on May’18 was re-appointed for a period of 3 years at the Board of Directors meeting held in Dec’17. Subsequently, on objections raised by RBI, Ms Sharma requested the Board to cut short her tenure to Dec’18, and the Board approved the same. In a regulatory filing, the bank informed that the Board of Directors of Axis Bank at its meeting held on July 9, 2018 has recommended the names of three candidates for the approval of the Reserve Bank of India. The bank, however, did not disclose names of the candidates shortlisted for the post. ABL will soon submit its application in respect of the recommendations relating to the appointment for the approval of the RBI. Besides the change in CEO, Mr Stephen Pagliuca joined ABL’s board as Non-Executive Director of the Bank, being the nominee of Bain Capital, while Mr VR Kaundinya ceased to be an Independent Director upon completion of maximum permissible tenure of 8 years. Change in the top management could bring about a fresh growth perspective. The bank is professionally managed with an independent board (8 out of 15 directors being independent).

10
Page
Q1FY19 result review ABL reported 23% YoY growth in core operating profits as NPA recoveries aided margins. NII grew by 11.9% YOY to Rs 51.7bn, PPOP was up 1.9% YoY to Rs 43.7bn and PAT de-grew 46.3% YoY to Rs 7bn. Core fee income increased 30% YoY. Bank continued on stress recognition path with gross slippages moderating significantly to Rs 43.37bn (4.3% annualised) and 88% of corporate slippages coming from the erstwhile identified ‘BB & Below’ pool. PCR recovered to ~54.4% (+282bps QoQ) and including written off accounts, it now stands at 69% (+400bps QoQ). On operating front, while faster growth in term deposits (+19% YoY) impacted the funding costs, the asset repricing will follow in coming quarters as ~72% of MCLR linked book is <6month tenor. Detailed tenure-wise breakup of MCLR-linked book indicates NIM in FY19 would broadly be maintained at FY18 levels. Management reiterated guidance of normalization of credit costs to ~100-110 bps in 2HFY19.
Rs mn Q1FY19 Q1FY18 YoY (%) Q4FY18 QoQ (%) Interest Income 127,770 110,525 15.6% 117,712 8.5% Interest Expenses 76,102 64,364 18.2% 70,407 8.1% Net Interest Income 51,668 46,161 11.9% 47,305 9.2% Non interest income 29,250 29,998 -2.5% 27,887 4.9% Total Income 80,918 76,160 6.2% 75,191 7.6% Operating Expenses 37,198 33,248 11.9% 38,469 -3.3% Pre Provisioning Profit 43,720 42,912 1.9% 36,722 19.1% Provisions & Contingencies 33,377 23,420 42.5% 71,795 -53.5% Profit Before Tax 10,343 19,492 -46.9% (35,073) 129.5% Provision for Tax 3,333 6,436 -48.2% (13,186) 125.3% PAT 7,011 13,055 -46.3% (21,887) 132.0% GNPA 6.52% 5.03% 149 bps 6.77% -25 bps NNPA 3.09% 2.30% 73 bps 3.40% -31 bps
Concerns Uncertainty at top management level The change in CEO has brought in an element of uncertainty for the time being which might cap its valuation in the near term. It has been seen in the past that the incoming CEO/MD resorts to kitchen sinking in the first 1/2 quarters of taking charge. Although the likelihood of this happening in ABL is less due to the cleanup post the RBI diktat and review, it still remains an overhang for the near term. Increase in NPA levels The bank suffered due to sharp deterioration in asset quality in FY18. The performance has started to improve from Q1FY19 but due to exposure to some stressed sectors like power further deterioration cannot be ruled out. Agri and SME advances could emerge as the new stress points. ABL has a 13.4% and 4.2% exposure to SME and agriculture respectively. Any delay in NCLT resolution process could also hamper recovery by the Bank and delay the growth revival.

11
Page
Limited value unlocking potential ABL does not have any insurance subsidiary of its own. Barring Axis Finance its other subsidiaries are not very big in size. This gives limited value unlocking potential for the bank through listing of subsidiaries as compared to some of its peers. Competition from peers Most of the banks and SFBs are now focusing on retail and SME segment for growth. Higher competition with peers could impact it NIMs. Slowdown in economy Deterioration of macro environment can result in higher slippages and slowdown in business growth. Lack of credit demand In the event of demand for credit lying low, lack of pricing power can impact its margins adversely. View and valuation
Axis Bank remains well-capitalised (Tier-1 ratio of 13.2%, CET1 ratio of 11.9%) to fund ~17% asset growth over the next two years. Bank has made significant investments to ride the next growth cycle (post near term asset quality challenges) with strong capitalization and expanding liability franchise (3,779 branches). With an improving outlook on fresh slippages/credit costs, we expect earnings to start normalizing from 2HFY19 onward. The bank is in the process to find and appoint its new CEO (Ms Shikha Sharma’s term ends in Dec-18) and it remains a key monitorable. A new CEO could bring a fresh thrust/perspective to the Banks growth plans. At the current levels the worst seems to have been priced in and the bank is available at attractive valuations compared to other similarly placed Banks. Fundamental positives like high CASA ratio, distribution network, Franchise value and high and growing share of retail loans are key positives. Its RoA and RoE could revive to healthy levels from the current low levels by FY20. The stock is currently trading at 2.4x FY20E ABV. We feel investors could buy the stock at the CMP and add on declines to Rs 567-577 band (2.1x FY20E ABV) for sequential targets of Rs 735 (2.7x FY20E ABV) and Rs 815 (3.0x FY20E ABV) in 2-3 quarters. Peer Comparison
Bank CMP (Rs)
NII (Rs bn)
NIM (%)
EPS (Rs)
ABV (Rs)
P/E (x)
P/ABV (x)
RoE (%)
RoA (%)
GNPA (%)
NNPA (%)
Axis 640 51.7 3.46 36.6 269.0 17.5 2.38 12.90 1.13 3.80 1.13 ICICI 330 61.0 3.19 18.0 143.1 18.3 2.31 10.10 1.11 6.34 2.59 SBI 299 218.0 2.80 23.1 169.9 12.9 1.76 9.10 0.54 5.99 2.82 Indusind 1928 21.2 3.92 95.2 526.0 20.3 3.67 19.20 1.85 1.00 0.31 Yes 374 22.2 3.30 21.7 156.0 17.2 2.40 15.90 1.30 1.60 0.60
All figures are for FY20; CMP and EPS in Rs; NIM, RoA, RoE, GNPA and NNPA in % Source: HDFCSec Research, street estimates (for Yes Bank)

12
Page
Financial Statements
Rs mn FY16 FY17 FY18 FY19E FY20E Interest Income 4,09,880 4,45,422 4,57,803 5,46,924 6,42,871 Interest Expenses 2,41,551 2,64,490 2,71,626 3,24,798 3,77,036 Net Interest Income 1,68,330 1,80,931 1,86,177 2,22,126 2,65,835 Non interest income 93,715 1,16,913 1,09,671 1,20,678 1,37,750 Fee Income 67,076 70,283 77,299 90,403 1,05,457 Treasury Income 10,186 31,738 13,252 7,500 7,500 Total Income 2,62,044 2,97,844 2,95,848 3,42,803 4,03,585 Operating Expenses 1,01,008 1,21,999 1,39,903 1,56,258 1,78,241 PPoP 1,61,036 1,75,845 1,55,945 1,86,545 2,25,345 Provision & Contingencies 37,099 1,21,170 1,54,729 1,15,510 93,842 Profit Before Tax 1,23,938 54,676 1,216 71,035 1,31,502 Provision for Tax 41,701 17,883 -1,541 19,535 36,163 PAT 82,237 36,793 2,757 51,501 95,339
Rs mn FY16 FY17 FY18 FY19E FY20E Share Capital 4,775 4,790 5,133 5,213 5,213 Reserves & Surplus 5,26,883 5,52,835 6,29,320 6,92,650 7,71,190 Shareholder funds 5,31,658 5,57,625 6,34,453 6,97,863 7,76,403 Deposits 35,79,676 41,43,788 45,36,227 52,98,350 62,52,053 Borrowings 9,92,264 10,50,309 14,80,161 15,27,840 16,51,763 Other Liab & Prov. 1,51,079 2,62,955 2,62,455 2,82,119 3,23,406 SOURCES OF FUNDS 52,54,676 60,14,677 69,13,296 78,06,172 90,03,625 Cash & Bank Balance 3,33,254 5,02,562 4,34,549 3,82,304 3,75,905 Investment 12,20,062 12,87,934 15,38,761 16,74,726 19,19,555 Advances 33,87,737 37,30,693 43,96,503 51,65,891 60,95,751 Fixed Assets 35,232 37,469 39,717 41,703 43,788 Other Assets 2,78,391 4,56,019 5,03,766 5,41,549 5,68,626 TOTAL ASSETS 52,54,676 60,14,677 69,13,296 78,06,172 90,03,625
Profit & Loss
Balance Sheet
13
Page
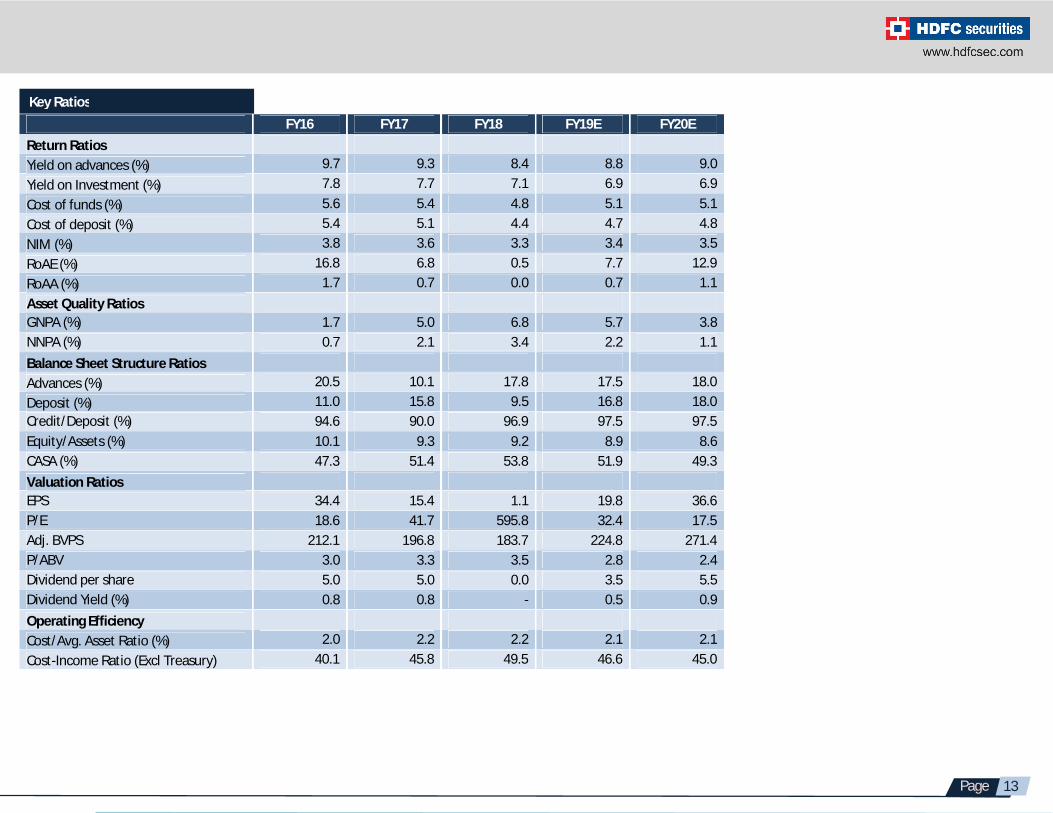
FY16 FY17 FY18 FY19E FY20E Return Ratios Yield on advances (%) 9.7 9.3 8.4 8.8 9.0 Yield on Investment (%) 7.8 7.7 7.1 6.9 6.9 Cost of funds (%) 5.6 5.4 4.8 5.1 5.1 Cost of deposit (%) 5.4 5.1 4.4 4.7 4.8 NIM (%) 3.8 3.6 3.3 3.4 3.5 RoAE (%) 16.8 6.8 0.5 7.7 12.9 RoAA (%) 1.7 0.7 0.0 0.7 1.1 Asset Quality Ratios GNPA (%) 1.7 5.0 6.8 5.7 3.8 NNPA (%) 0.7 2.1 3.4 2.2 1.1 Balance Sheet Structure Ratios Advances (%) 20.5 10.1 17.8 17.5 18.0 Deposit (%) 11.0 15.8 9.5 16.8 18.0 Credit/Deposit (%) 94.6 90.0 96.9 97.5 97.5 Equity/Assets (%) 10.1 9.3 9.2 8.9 8.6 CASA (%) 47.3 51.4 53.8 51.9 49.3 Valuation Ratios EPS 34.4 15.4 1.1 19.8 36.6 P/E 18.6 41.7 595.8 32.4 17.5 Adj. BVPS 212.1 196.8 183.7 224.8 271.4 P/ABV 3.0 3.3 3.5 2.8 2.4 Dividend per share 5.0 5.0 0.0 3.5 5.5 Dividend Yield (%) 0.8 0.8 - 0.5 0.9 Operating Efficiency Cost/Avg. Asset Ratio (%) 2.0 2.2 2.2 2.1 2.1 Cost-Income Ratio (Excl Treasury) 40.1 45.8 49.5 46.6 45.0
Key Ratios

14
Page
1-year Forward P/ABV
0
200
400
600
800
1000
Mar-12 Jan-13 Nov-13 Sep-14 Jul-15 May-16 Mar-17 Jan-18 Nov-18
Price 1.5x 2.0x 2.5x 3.0x 3.5x
1-year Price Chart
15000
20000
25000
30000
35000
300
400
500
600
700
Aug-17 Oct-17 Dec-17 Feb-18 Apr-18 Jun-18 Aug-18
Axis Bank BSE Bankex

15
Page
Fundamental Research Analyst: Atul Karwa ([email protected]) HDFC securities Limited, I Think Techno Campus, Building - B, "Alpha", Office Floor 8, Near Kanjurmarg Station, Opp. Crompton Greaves, Kanjurmarg (East), Mumbai 400 042 Phone: (022) 3075 3400 Fax: (022) 2496 5066 Compliance Officer: Binkle R. Oza Email: [email protected] Phone: (022) 3045 3600 SEBI Registration No.: INZ000186937 (NSE, BSE, MSEI, MCX) |NSE Trading Member Code: 11094 | BSE Clearing Number: 393 | MSEI Trading Member Code: 30000 | MCX Member Code: 56015 | AMFI Reg No. ARN -13549, PFRDA Reg. No - POP 04102015, IRDA Corporate Agent Licence No.-HDF2806925/HDF C000222657 , Research Analyst Reg. No. INH000002475, CIN-U67120MH2000PLC152193. Website: www.hdfcsec.com Email:[email protected]. Disclosure: I, (Atul Karwa, MMS), authors and the names subscribed to this report, hereby certify that all of the views expressed in this research report accurately reflect our views about the subject issuer(s) or securities. HSL has no material adverse disciplinary history as on the date of publication of this report. We also certify that no part of our compensation was, is, or will be directly or indirectly related to the specific recommendation(s) or view(s) in this report. Research Analyst or his/her relative or HDFC Securities Ltd. does not have any financial interest in the subject company. Also Research Analyst or his relative or HDFC Securities Ltd. or its Associate does not have beneficial ownership of 1% or more in the subject company at the end of the month immediately preceding the date of publication of the Research Report. Further Research Analyst or his relative or HDFC Securities Ltd. or its associate does not have any material conflict of interest. Any holding in stock – No This report has been prepared by HDFC Securities Ltd and is meant for sole use by the recipient and not for circulation. The information and opinions contained herein have been compiled or arrived at, based upon information obtained in good faith from sources believed to be reliable. Such information has not been independently verified and no guaranty, representation of warranty, express or implied, is made as to its accuracy, completeness or correctness. All such information and opinions are subject to change without notice. This document is for information purposes only. Descriptions of any company or companies or their securities mentioned herein are not intended to be complete and this document is not, and should not be construed as an offer or solicitation of an offer, to buy or sell any securities or other financial instruments. This report is not directed to, or intended for display, downloading, printing, reproducing or for distribution to or use by, any person or entity who is a citizen or resident or located in any locality, state, country or other jurisdiction where such distribution, publication, reproduction, availability or use would be contrary to law or regulation or what would subject HSL or its affiliates to any registration or licensing requirement within such jurisdiction. If this report is inadvertently send or has reached any individual in such country, especially, USA, the same may be ignored and brought to the attention of the sender. This document may not be reproduced, distributed or published for any purposes without prior written approval of HSL. Foreign currencies denominated securities, wherever mentioned, are subject to exchange rate fluctuations, which could have an adverse effect on their value or price, or the income derived from them. In addition, investors in securities such as ADRs, the values of which are influenced by foreign currencies effectively assume currency risk. It should not be considered to be taken as an offer to sell or a solicitation to buy any security. HSL may from time to time solicit from, or perform broking, or other services for, any company mentioned in this mail and/or its attachments. HSL and its affiliated company(ies), their directors and employees may; (a) from time to time, have a long or short position in, and buy or sell the securities of the company(ies) mentioned herein or (b) be engaged in any other transaction involving such securities and earn brokerage or other compensation or act as a market maker in the financial instruments of the company(ies) discussed herein or act as an advisor or lender/borrower to such company(ies) or may have any other potential conflict of interests with respect to any recommendation and other related information and opinions. HSL, its directors, analysts or employees do not take any responsibility, financial or otherwise, of the losses or the damages sustained due to the investments made or any action taken on basis of this report, including but not restricted to, fluctuation in the prices of shares and bonds, changes in the currency rates, diminution in the NAVs, reduction in the dividend or income, etc. HSL and other group companies, its directors, associates, employees may have various positions in any of the stocks, securities and financial instruments dealt in the report, or may make sell or purchase or other deals in these securities from time to time or may deal in other securities of the companies / organizations described in this report.
HSL or its associates might have managed or co-managed public offering of securities for the subject company or might have been mandated by the subject company for any other assignment in the past twelve months. HSL or its associates might have received any compensation from the companies mentioned in the report during the period preceding twelve months from t date of this report for services in respect of managing or co-managing public offerings, corporate finance, investment banking or merchant banking, brokerage services or other advisory service in a merger or specific transaction in the normal course of business. HSL or its analysts did not receive any compensation or other benefits from the companies mentioned in the report or third party in connection with preparation of the research report. Accordingly, neither HSL nor Research Analysts have any material conflict of interest at the time of publication of this report. Compensation of our Research Analysts is not based on any specific merchant banking, investment banking or brokerage service transactions. HSL may have issued other reports that are inconsistent with and reach different conclusion from the information presented in this report. Research entity has not been engaged in market making activity for the subject company. Research analyst has not served as an officer, director or employee of the subject company. We have not received any compensation/benefits from the subject company or third party in connection with the Research Report.
This report is intended for non-Institutional Clients only. The views and opinions expressed in this report may at times be contrary to or not in consonance with those of Institutional Research or PCG Research teams of HDFC Securities Ltd. and/or may have different time horizons.
Disclaimer : HDFC securities Ltd is a financial services intermediary and is engaged as a distributor of financial products & services like Corporate FDs & Bonds, Insurance, MF, NPS, Real Estate services, Loans, NCDs & IPOs in strategic distribution partnerships. Investment in securities market are subject to market risks, read all the related documents carefully before investing. Customers need to check products &features before investing since the contours of the product rates may change from time to time. HDFC securities Ltd is not liable for any loss or damage of any kind arising out of investments in these products. Investments in Equity, Currency, Futures & Options are subject to market risk. Clients should read the Risk Disclosure Document issued by SEBI & relevant exchanges & the T&C on www.hdfcsec.com before investing. Equity SIP is not an approved product of Exchange and any dispute related to this will not be dealt at Exchange platform.