2017 Pillar 3 report - rabobank.com · Pillar 3 report 2017 5 1.oncise Risk Statement C COMMON...
96
2017 Pillar 3 report
Transcript of 2017 Pillar 3 report - rabobank.com · Pillar 3 report 2017 5 1.oncise Risk Statement C COMMON...

2017 Pillar 3 report

Pillar 3 report 2017 2
Contents
Forward-looking statements 3
1. Concise Risk Statement 5
2. Introduction 6
3. About Rabobank 7
4. Risk management 16
5. Capital management 24
6. Credit Risk 29
7. Securitisation 54
8. Operational risk 58
9. Market risk 61
10. Liquidity risk 70
11. Remuneration 77
12. Global systemically important banks – 12 indicators 82
13. Declaration Managing Board 83
14. Appendices 84

Pillar 3 report 2017 3
Forward-looking statements
Examples of such forward-looking statements include, but are
not limited to: projections or expectations of the Group’s future
financial position including profit attributable to provisions,
economic profit, dividends, capital structure, expenditures
or any other financial items or ratios; statements of plans,
objectives or goals of the Group or its management including
in respect of certain synergy targets; statements about the
future business and economic environments in the Netherlands
and elsewhere including, but not limited to, future trends
in interest rates, foreign exchange rates, credit and equity
market levels and demographic developments; statements
about competition, regulation, disposals and consolidation or
technological developments in the financial services industry;
and statements of assumptions underlying such statements.
Factors that could cause actual business, strategy, plans
and/or results to differ materially from the plans, objectives,
expectations, estimates and intentions expressed in such
forward-looking statements made by the Group or on its behalf
include, but are not limited to: general economic and business
conditions in the Netherlands and internationally; inflation,
deflation, interest rates and policies of the Dutch Central
Bank, the European Central Bank and other G8 central banks;
fluctuations in exchange rates, stock markets and currencies;
the ability to access sufficient funding to meet the Group’s
liquidity needs; changes to the Group’s credit ratings; the ability
to derive cost savings and other benefits; changes in customer
preferences; changes to borrower or counterparty credit quality;
instability in the global financial markets, including Eurozone
instability and the impact of any sovereign credit rating
This document contains certain forward-looking statements with respect to the business, strategy and plans of Rabobank Group and its current goals and expectations relating to its future financial condition and performance. Statements that are not historical facts, including statements about Rabobank Group or its directors’ and/or management’s beliefs and expectations, are forward-looking statements. Words such as ‘believes’, ‘anticipates’, ‘estimates’, ‘expects’, ‘intends’, ‘aims’, ‘potential’, ’will’, ‘would’, ‘could’, ‘considered’, ‘likely’, ‘estimate’ and variations of these words and similar future or conditional expressions are intended to identify forward-looking statements but are not the exclusive means of identifying such statements. By their nature, forward looking statements involve risk and uncertainty because they relate to events and depend upon circumstances that will or may occur in the future.
downgrade or other sovereign financial issues; technological
changes and risks to cyber security; natural and other disasters,
adverse weather and similar contingencies outside the Group’s
control; inadequate or failed internal or external processes,
people and systems; acts of war, other acts of hostility, terrorist
acts and responses to those acts, geopolitical, pandemic or
other such events; changes in laws, regulations, taxation,
accounting standards or practices; regulatory capital or
liquidity requirements and similar contingencies outside the
Group’s control; the policies and actions of governmental or
regulatory authorities in the Netherlands, the European Union
(EU), the US or elsewhere, including the implementation of key
legislation and regulation; the implementation of the draft EU
crisis management framework directive and banking reform,
following the recommendations made by the Independent
Commission on Banking; the ability to attract and retain senior
management and other employees; actions or omissions by
the Group’s directors, management or employees including
industrial action; the extent of any future impairment charges
or write-downs caused by, but not limited to, depressed asset
valuations, market disruptions and illiquid markets; market-
related trends and developments; exposure to regulatory
or competition scrutiny, legal proceedings, regulatory
or competition investigations or complaints; changes in
competition and pricing environments; the inability to hedge
certain risks economically; the adequacy of loss reserves; the
actions of competitors, including nonbank financial services
and lending companies; and the success of the Group in
managing the risks of the foregoing.

Pillar 3 report 2017 4
Rabobank Group may also make or disclose written and/or oral
forward-looking statements in reports filed with or furnished to
the US Securities and Exchange Commission, Rabobank Group
annual reviews, half-year announcements, proxy statements,
offering circulars, prospectuses, press releases and other written
materials, and in oral statements made by the directors, officers
or employees of Rabobank Group to third parties, including
financial analysts. Except as required by any applicable law
or regulation, the forward-looking statements contained in
this document are made as of the date hereof, and Rabobank
Group expressly disclaims any obligation or undertaking to
release publicly any updates or revisions to any forward looking
statements contained in this document to reflect any change
in Rabobank Group’s expectations with regard thereto or any
change in events, conditions or circumstances on which any
such statement is based.

Pillar 3 report 2017 5
1. Concise Risk Statement
COMMON EQUITY TIER 1 RATIOCOMMENTARYPer 1 January 2017 the CET1-ratio decreased from 14.0%
to 13.7% due the phase-in of CRD IV. In January 2017 the
CET1-ratio increased 0.8% due to the issuance of Rabobank
Certificates. In the remainder of 2017 the CET1-ratio increased
0.8% due to the inclusion of net profit (after payments on
capital instruments). The reduction of risk weighted assets and
other movements resulted in an increase of the CET1-ratio of
0.5%, ending up at 15.8% as per 31 December 2017. The fully
loaded CET 1 ratio was 15.5% on 31 December 2017.
TOTAL CAPITAL RATIOCOMMENTARYThe total capital-ratio increased 1.2% in 2017 from 25.0% to
26.2%, mainly as a consequence of the higher CET1 capital,
partly compensated by negative FX movements on FX capital
instruments.
LEVERAGE RATIOCOMMENTARYOur fully loaded leverage ratio amounted to 5.4% as per
December 2017 (4.6% as per December 2016). The change
in leverage ratio was mainly due to increased Tier 1 capital
and a reduction of the leverage exposure. We expect that the
leverage ratio will further increase in the coming years.
Transitional Common Equity Tier 1 ratio (CET1)(2016: 14%)
Leverage ratio(2016: 5.5%)
Transitional Tier 1 Capital Ratio(2016: 17.6%)
Total Risk Weighted Exposure Amounts(2016: 211.2 bn)
Transitional Total Capital Ratio(2016: 25%)
Loan impairment charges(2016: 7 bps)
15.8%
6%
18.8%
198.2 bn
26.2%
-5 bps

Pillar 3 report 2017 6
2. Introduction
Rabobank operates under the CRD IV capital framework which
came into force at the start of 2014. CRD IV constitutes the Basel
framework which seeks to align regulatory requirements with
the economic principles of risk management. The CRD IV was
implemented into Dutch law as amendments to the ‘Wet op het
financieel toezicht’ and further accompanying regulations. Pillar
3 requirements under CRD IV are designed to promote market
discipline through the disclosure of key information about risk
exposures and risk management processes. Rabobank’s 2017
year-end disclosures are prepared in accordance with the CRD
IV requirements and associated guidelines of the European
Banking Authority (EBA) technical standards, in force as of
31 December 2017.
The information in Pillar 3 has not been audited by Rabobank’s
Group external auditors. However, the Pillar 3 disclosures
are subject to the Rabobank’s Group internal controls and
validation mechanisms, to provide assurance over the
information disclosed in this report as well as with regards to
compliance with laws and regulations.
The implementation of CRD IV is subject to transitional
arrangements. By 1 January 2019 all CET1 capital deductions
should be phased in and the non-eligible Tier 1 capital
instruments will be phased out by 1 January 2022. Consequently,
Rabobank’s capital position is presented by applying the
transitional arrangements. Rabobank also disclosed the end-
point CRD IV rules (i.e. fully loaded basis) for informational
purposes.
This document presents the consolidated Capital Adequacy and Risk Management report (hereafter referred to as Pillar 3) of Rabobank Group (‘Rabobank’) as at 31 December 2017.
In addition to the changes required under CRD IV, there remain
ongoing regulatory developments. Rabobank keeps monitoring
them closely and assessing their impact.
The remainder of this report contains:
• Chapter 3: About Rabobank;
• Chapter 4: The approach of risk management, the
organisation and the risk management
framework;
• Chapter 5: Capital management, regulatory and economic
capital and key capital ratios;
• Chapter 6: Credit Risk (including counterparty credit risk)
and equities in the banking book;
• Chapter 7: Securitisation in the Rabobank portfolio;
• Chapter 8: Operational risk management;
• Chapter 9: Market risk and interest rate risk framework;
• Chapter 10: Liquidity risk management framework and
measurement;
• Chapter 11: Remuneration principles and policy of
Rabobank.

3. About Rabobank2017 Rabobank at a glance
Growing a better world togetherMission
More than 8.5 million customers
1.2 million international customers**7.3 million Dutch customers*
Dutch private mortgages€ 193 billion
22%
Private savings€ 117 billion
34%
86%
Private sector lending totrade, industry and services
€ 81.2 billion
39%
Private sector lendingto Food & Agri € 36.9 billion
446offices
13,635FTEs
1.9million
members
1,967ATMs
0.8million
commercial customers
389offices***
7,909FTEs***
6.5million private
customers
Example value chain
€ 60.9billion
private sector lending to
Food & Agri***
€ 38.4billion
private sectorlending to trade,
industry and services***
* Local Rabobanks and Obvion ** Direct Banking, Indonesia and RNA *** The Netherlands not included
Farm inputs Farming Manufacturing/processing Trade Retail Food serviceDistribution
Banking for the Netherlands102 local Rabobanks
Market shares
Banking for Food40 countries

Pillar 3 report 2017 8
Rabobank
General Members’ Council
Supervisory Board
Managing Board
Domestic Retail Banking - local Rabobanks
Retail clients
Mariëlle Lichtenberg
Business clients
Kirsten Konst
Wholesale, Rural & Retail Support units
Wholesale
Jan van Nieuwenhuizen
Rural & Retailinternational
Berry Marttin
CEO
Wiebe Draijer
CFO
Bas Brouwers
CIOO
Ieko Sevinga
CRO
Petra vanHoeken
CHRO
Janine Vos
Obvion DLLBPDACC loan
managementlimited
Rabobank organisation chart
DTO
Bart Leurs
3.1. Mission and Vision
MissionOur mission is: Growing a better world together. This is what
we stand for and what we aim to achieve through boldness,
ingenuity and decisiveness.
Envision: The Rabobank storyIn October 2017 we launched a new brand positioning to
underline our mission Growing a better world together.
This is the story behind the mission.
Rabobank is committed to making the difference as a cooperative, customer-driven bank, in the Netherlands and around the world. We aim to be a courageous, socially responsible bank, championing customer issues that have a major societal impact. And we want to be the Netherlands’ most customer-driven bank and leading in Food & Agri. In October 2017 we launched a new global brand positioning to underline our mission Growing a better world together.
Envision a group of entrepreneurs getting together 120 years ago.
With a bit of ingenuity and a dash of boldness, these go-getters
established a cooperative bank. Founded on solidarity,
pragmatism and professionalism.
Envision a different society than today’s. Nothing is for certain
anymore, while flexibility and autonomy have become
a challenge. We want customers to feel confident, to be
themselves and to feel they belong. With our business expertise,
our capital and our networks, our employees act as a compass
that our clients can depend on to guide them.
About Rabobank

Pillar 3 report 2017 9
Banking for the NetherlandsWe feel a strong connection with our customers and members.
We prosper when our customers prosper. As a cooperative bank,
we want to make a clear contribution to meeting the challenges
the Netherlands will face in the years ahead.
Our approach to this can be categorised under four headings:
food, self-sufficiency, entrepreneurship and local living
environment. Our presence at the heart of local society, combined
with our financial capabilities, network and knowledge, enables
us to address relevant local and regional topics and so contribute
to sustainable welfare and prosperity in the Netherlands of
tomorrow.
Banking for FoodFood security concerns us all. In 2050, the world population
will have increased by two billion people to nearly ten billion,
many of whom will have twice as much income to spend.
To meet the resulting increased demand for food, global food
production will have to increase by at least 60%, while at
the same time arable land and natural resources are already
nearing their limits. The Food & Agri value chain will have to
produce more with less to ensure long-term sustainability and
economic viability.
We want to make a sustainable contribution to the global Food
& Agri sector by helping increase the availability of food and
access to food, promoting healthy nutrition and enhancing
stability of the food industry. In our strategy we emphasise
access to finance, networks and knowledge and connect
producers, consumers, government bodies and the public in
the wider food issues.
Envision everyone in the world having enough food to eat
healthily. We share what we know and whom we know with
our clients. That way, everyone benefits from our roots and
experience in Food & Agri. And the world becomes better for it.
Envision the Netherlands being one of the most prosperous
countries, where people are happy to live, work and do
business. Being at the heart of society means we invest and
innovate together with clients. Truly and sincerely. With respect
for each other and the environment for the long term. With
everything done as it should.
Envision all dreams also being opportunities. Technology can
take us anywhere. And it can bring us together. Always quickly
and personally. The bank is for the benefit of our clients and
the results are for the benefit of society. Together we become
stronger.
Envision we could make a difference. All of us together.
Growing a better world together.
VisionWe are committed to making the difference as a cooperative,
customer-driven bank, in the Netherlands and leading in
Food & Agri around the world. To achieve this, we have
two strategic focus areas: Banking for the Netherlands and
Banking for Food. We want to make a substantial contribution
to welfare and prosperity in the Netherlands and to feeding
the world sustainably. The visions outlined in Banking for the
Netherlands and Banking for Food define our focus and provide
a joint understanding of what it means to be a client-focused
cooperative. Sustainability forms an integral part of both
these visions.
Growing a better world together
Banking for the Netherlands
Excellent customer focusStrategy
Vision
Mission
Meaningful cooperative Rock-solid bank Empowered employees
Banking for Food

Pillar 3 report 2017 10
Our conclusions in a nutshell:
• Client preferences are changing rapidly and significantly.
Increasingly, face-to-face contact is being replaced by
digital interaction. We therefore invest in the quality of
our (digital) services and invest in further innovation to
improve client services. The same trend is very visible in the
online distribution of goods, including food, with a high
impact in food and other chains. In the Food & Agri sector
the consumer’s influence is growing; ‘from farm to fork’ is
becoming ‘from fork to farm.
• Technology is leading to significant innovation and disruption.
This calls for a proactive, efficient client approach and provides
us with opportunities to combine online services with
personal attention. Our clients see the arrival of technology
impacting their businesses as well – varying from the arrival
of drones at the farm to use of data for all of our clients.
• To meet client needs, we will proactively monitor innovations
in, and related to, the financial (fintech) and agribusiness
(agtech) industry and we will enter into strategic partnerships.
• New players in the financial industry like financial start-ups
pressure us to critically evaluate our way of doing business.
• Driven by the current economy, low interest rate environment
and other factors, we need to continue to operate on a cost-
effective basis and improve our cost to income ratio.
• There is ample opportunity to further leverage our research
and sector knowledge and national/international network
to the benefit of our clients and environment. In our
international Food & Agri activities the international trade
including growth of a middle class in emerging countries
create opportunities by linking regions.
• Regulators and new regulation and legislation (such as the
recently announced reform of Basel III accords) are having a
growing impact on the ways in which banks can provide their
services and it influences our business model.
• Global population growth, ageing and the growing middle
class will change demand for food in both volume and
qualityterms. This will be an important driver of growth for
our clients serving the world of food and we will continue to
support them.
• Climate change is a bitter reality. Despite the intentions and
ambitions of the Paris climate accord, the world is warming
up, with risks for the environment, the food security of people
and communities, and with that to the UN Sustainable
Development Goals ambitions to reduce hunger and poverty
in the world.
• The global trend of urbanisation continues unabated,
especially in the Netherlands. Some 55% of the world’s
population currently live in cities, a number expected to
rise to around 70% in 2050. There are growing differences
between urban and rural areas in terms of the composition of
the demographics and the economy.
3.2. Strategic cornerstones
With our knowledge, networks and finance, we strive to
enable clients to make autonomous decisions and to act with
flexibility and independence. We want clients to feel confident,
be themselves and feel they belong. Our strategy is founded
on four cornerstones: excellent client focus, meaningful
cooperative, rock-solid bank, and empowered employees.
These four cornerstones permeate all of our actions, priorities,
KPIs, values and behaviors.
Four cornerstonesExcellent customer focusWe aim to be a leading bank in which being client-driven is
deeply embedded. Current and future client requirements can
be fully satisfied through good advice, transparent products
and digital, convenient and innovative services.
Meaningful cooperativeWe translate social developments into specific contributions
for the long term. Cooperative banking means acting as a
forward-looking social compass that actively involves members,
employees and clients and connects them in a network, with
each other and with Rabobank. We take a stand on social issues
that matter to clients and stakeholders.
Rock-solid bankRabobank remains a model of stability, reliability and solidity.
Our services are delivered efficiently at competitive cost levels
and we are continuing to optimise the balance sheet. We are
doing the right things well, or even exceptionally well, with
everyone taking ownership, remaining conscious of risks and
operating as professionals.
Empowered employeesOur employees are proud and driven, manifesting professionalism,
vitality and a capacity for change. They feel empowered to
represent Rabobank, and are inspired by what we want to be.
Top talent wants to work, develop and stay at Rabobank.
All our employees want to grow and make each other better.
Learning is the key.
3.2.1. Key trends and developmentsEvery year we analyse external trends and developments that
affect our work. In the year 2017 we saw many trends in terms
of consumer behaviour, technology, innovation, market players,
regulations, the economy and society. All these ongoing trends
and developments present a number of opportunities and
challenges for Rabobank and its clients.

Pillar 3 report 2017 11
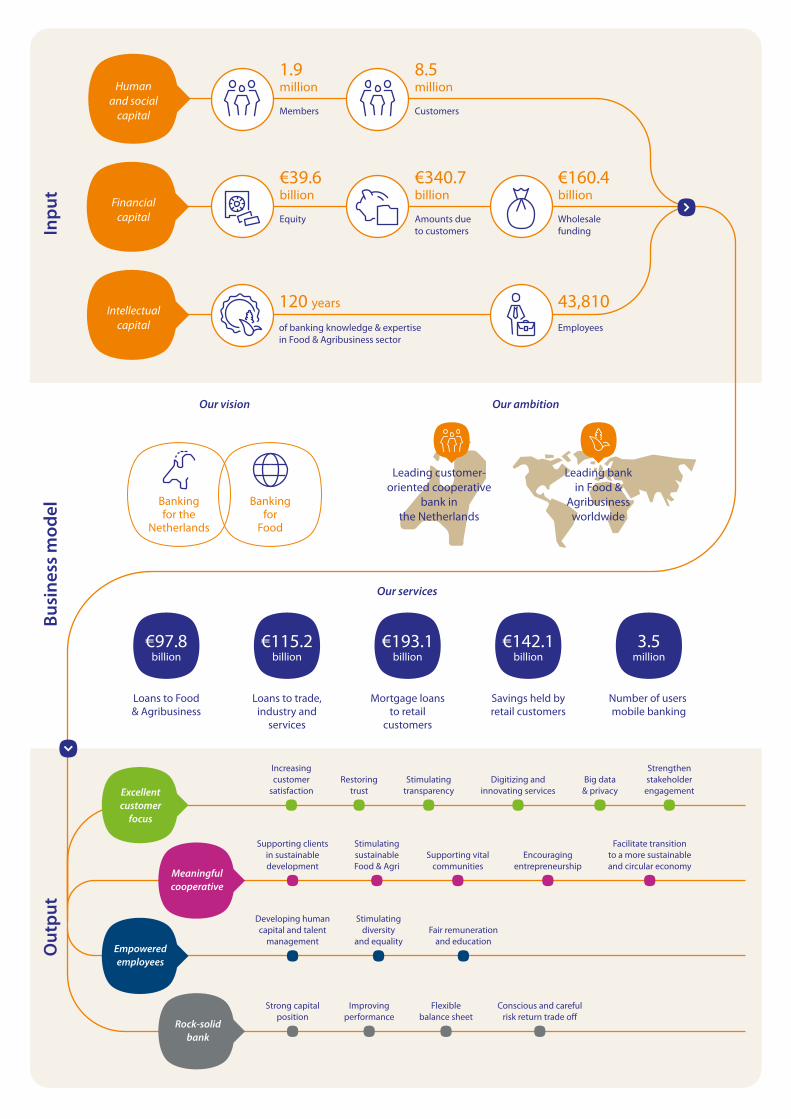
Human and social capitalWith the execution of our strategy, Rabobank remains focused
on human capital and empowering employees by encouraging
continuous learning, professionalism and entrepreneurship.
As a client-focused cooperative bank with 1.9 million members,
8.5 million clients and over 43,810 thousand employees,
Rabobank takes its role as a socially responsible bank seriously.
We participate in many local, sector and supply chain initiatives
and support both businesses and private clients, as we continue
to actively promote sustainability.
Intellectual capitalRabobank’s intellectual capital input encompasses 120 years
of banking knowledge and expertise in Food & Agri. We utilise
our knowledge base to offer clients innovative products and
services in line with ongoing economic changes and social
trends. Rabobank offers knowledge and financial resources to
clients worldwide. We will continue to follow our value creation
model as we execute our strategy, allowing us to remain a
meaningful cooperative and a rock-solid bank with excellent
client focus and empowered employees.
Financial resourcesRabobank offers financial resources to customers worldwide.
Our products and services include banking, capital management,
leasing, insurance and real estate. With 39.6 billion in equity,
340.7 billion in deposits from customers and 160.4 billion in
wholesale funding, Rabobank is a rock-solid bank with strong
financial capital and liquidity buffers for financial solidity and
high ratings.
Rabobank is committed to creating value for our stakeholders
and society at large. In today’s world with changing client
behaviour, technological developments and a complex
economic environment, value is created through enduring
relationships with all stakeholders and responding to client
needs efficiently.
Our value creation model gives a transparent view of our ability
to create value over the short, medium and long term. Our value
creation begins with three key inputs: human and social capital,
intellectual capital and financial resources. These inputs lead to
our business model, including Rabobank’s mission, vision and
strategy. Finally, the output and impact section of the value
creation model is structured according to our 18 material topics
derived from the materiality matrix. By making progress on
material topics, we work towards selected UN Sustainable
Development Goals (SDGs). In our value creation model, we
have linked the material topics with specific SDGs.
• Our fast-changing world demands ever more flexibility and
autonomy – a challenge for many people in many societies.
The global population is expected to grow to nearly 10 billion
people by 2050. Western economies are experiencing limited
growth.
• Geopolitical unrest is undiminished.
• Vulnerability and uncertainty in society are on the increase.
At the same time, society requires the business community
in general, and banks in particular, to act in a social
responsible way.
3.2.2. Stakeholder engagementGiven these far-reaching trends and disruptions we are fully
convinced there is a solid yet evolving place for a cooperative
client-focused Rabobank, with the intent to serve clients on
their significant issues with material societal impact. We are
strongly aware of the social role we play as a provider of financial
services and of our social responsibility as a cooperative
organisation. Banks play a crucial role in payments and lending
to private individuals, businesses and other institutions, so we
are also closely involved in matters that affect the economy and
society at large.
We are committed to a strategic, constructive and proactive
dialogue with all our stakeholders: clients, members, employees,
investors, non-governmental organisations, government
agencies, media, politicians and supervisory bodies and other
banks. We engage with them by means of Member Councils,
client feedback platforms, client and employee surveys,
participation in sector initiatives, and other means. Our Managing
Board Members meet with clients, stakeholders and employees
to discuss progress on Rabobank’s strategy, receive their feedback
and discuss general developments in the financial sector and
those specific to Rabobank.
This engagement gives us a clear view of what our stakeholders
believe is important and how they see Rabobank’s role and
contribution to society. As such, we base the list of material
reporting topics in this report on the dialogues we had during
the year with our stakeholder groups.
3.2.3. Value creationKey inputs fuel our strategy and business model, allowing us to
fulfil our mission and vision, and maximise both our output and
our impact on members, clients, the society and our employees.
Pillar 3 report 2017 12
Out
put
Leading customer-oriented cooperative
bank inthe Netherlands
Empoweredemployees
Mortgage loansto retail
customers
120 years
of banking knowledge & expertisein Food & Agribusiness sector
Loans to trade,industry and
services
Savings held byretail customers
Number of users mobile banking
Inpu
tBu
sine
ss m
odel
Humanand social
capital
Financialcapital
Intellectualcapital
1.9million
8.5million
Members Customers
€340.7billion
Amounts dueto customers
€39.6billion
Equity
€160.4billion
Wholesalefunding
43,810Employees
Bankingfor the
Netherlands
Bankingfor
Food
Our vision Our ambition
Leading bankin Food &
Agribusinessworldwide
Our services
Loans to Food& Agribusiness
€97.8billion
€115.2billion
€193.1billion
€142.1billion
3.5million
Excellentcustomer
focus
Meaningfulcooperative
Rock-solidbank
Increasingcustomer
satisfactionRestoring
trustStimulating
transparencyBig data
& privacy
Strengthenstakeholder
engagementDigitizing and
innovating services
Supporting clientsin sustainabledevelopment
StimulatingsustainableFood & Agri
Supporting vitalcommunities
Encouragingentrepreneurship
Facilitate transitionto a more sustainableand circular economy
Developing humancapital and talent
management
Stimulatingdiversity
and equalityFair remuneration
and education
Strong capitalposition
Improvingperformance
Flexiblebalance sheet
Conscious and carefulrisk return trade o�

Pillar 3 report 2017 13
3.2.4. Sustainable Development GoalsRabobank feels a responsibility to make a meaningful
contribution to achieving the 17 UN Sustainable Development
Goals. Our ‘Banking for Food’ and ‘Banking for the Netherlands’
vision and our Sustainability Programme ‘Sustainably Stronger
Together’ programme help us achieve our contribution to the
SDGs. The infographic illustrates how we are working towards
reaching the goals. The goals to which we are making a primary
contribution are enlarged in the infographic.The link with our
visions Banking for Food and Banking for the Netherlands is also
shown. For more information see ‘Theme Report: Rabobank’s
contribution to the Sustainable Development Goals’.
3.2.5. Performance indicatorsWe have translated our mission, vision and strategy to a number
of KPIs. The table below shows the strategic KPIs. An elaborate
overview of these KPIs and our sustainable ambitions can be
found in appendix 2 of Annual Report 2017. Progress on these
KPIs is measured with information obtained from both inside
and outside the organisation.
Cornerstones KPI 2017 20161
Excellent Customer Focus Net Promotor Score private customerss in the Netherlands 53 36
Customer Effort Score private customers in the Netherlands 66 67
Net Promotor Score Private Banking customers in the Netherlands 50 41
Customer Effort Score Private Banking customers in the Netherlands 65 68
Net Promotor Score Corporate customers in the Netherlands 43 30
Customer Effort Score Corporate customers in the Netherlands 49 51
Number of users Mobile Banking (x 1,000) 3,518 3,079
Amount of sustainable products and services (in millions):- Total sustainable Financing- Sustainable assets under management and assets held in custody- Sustainable funding- Sustainable transactions supervised
18,6104,0303,5016,236
18,7913,8352,9855,750
Meaningful cooperative Sustainability performance recorded of all our larger corporate clients in a client photoNumber and percentage of client photos:Local RabobanksWholesale offices
14,192 (98.4%)1,413 (72.5%)
14,502 (99%)1,533 (85%)
Reptrak pulse score 69.5 66.1
Percentage of our annual profit invested in social initiatives on a not-for-profit basis through the Rabobank Group and the Rabobank Foundation
2.5% 2.9%
Number of agricultural value chain visions and active participation in roundtables or similar initiatives
2 visions and 9 roundtables
2 visions and 9 roundtables
Number of supported small-scale farmer organisations in developing countries 260 278
Empowered employees Gender diversity Supervisory Board MaleFemale
63
63
Gender diversity Managing Board MaleFemale
64
61
Gender diversity Managing Board -1 MaleFemale
5924
4214
Gender diversity Managing Board -2 MaleFemale
294101
27790
Organisational Health Index 61 56
Rock-solid bank Cost/income ratio 71.3 70.9
Fully loaded Common Equity Tier 1 ratio 15.5 13.5
1 The 2016 NPS Advisor and CES figures have been restated due to
a clarification regarding the scope. In addition, the NPS and CES
figures have been measured for a 12 month period instead of solely
measuring the fourth quarter, as was conducted in 2016.
Pillar 3 report 2017 14
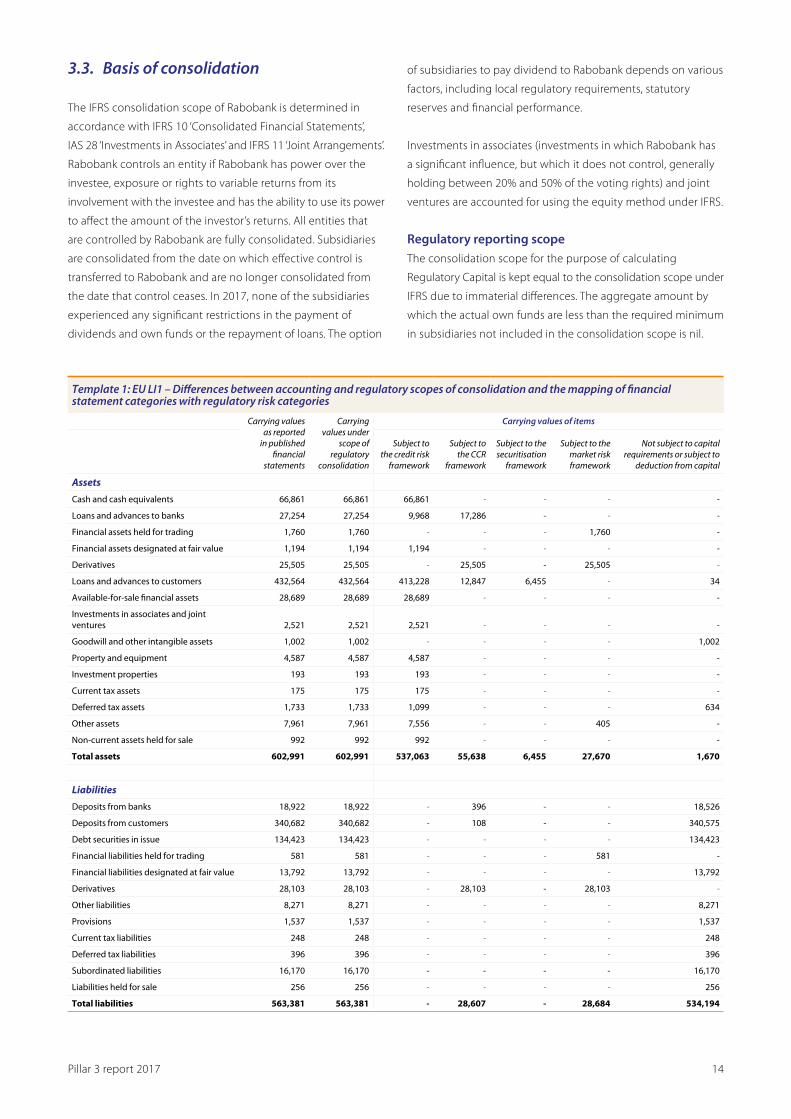
3.3. Basis of consolidation
The IFRS consolidation scope of Rabobank is determined in
accordance with IFRS 10 ‘Consolidated Financial Statements’,
IAS 28 ‘Investments in Associates’ and IFRS 11 ‘Joint Arrangements’.
Rabobank controls an entity if Rabobank has power over the
investee, exposure or rights to variable returns from its
involvement with the investee and has the ability to use its power
to affect the amount of the investor’s returns. All entities that
are controlled by Rabobank are fully consolidated. Subsidiaries
are consolidated from the date on which effective control is
transferred to Rabobank and are no longer consolidated from
the date that control ceases. In 2017, none of the subsidiaries
experienced any significant restrictions in the payment of
dividends and own funds or the repayment of loans. The option
of subsidiaries to pay dividend to Rabobank depends on various
factors, including local regulatory requirements, statutory
reserves and financial performance.
Investments in associates (investments in which Rabobank has
a significant influence, but which it does not control, generally
holding between 20% and 50% of the voting rights) and joint
ventures are accounted for using the equity method under IFRS.
Regulatory reporting scopeThe consolidation scope for the purpose of calculating
Regulatory Capital is kept equal to the consolidation scope under
IFRS due to immaterial differences. The aggregate amount by
which the actual own funds are less than the required minimum
in subsidiaries not included in the consolidation scope is nil.
Template 1: EU LI1 – Differences between accounting and regulatory scopes of consolidation and the mapping of financial statement categories with regulatory risk categories
Carrying values as reported
in published financial
statements
Carrying values under
scope of regulatory
consolidation
Carrying values of items
Subject to the credit risk
framework
Subject to the CCR
framework
Subject to the securitisation
framework
Subject to the market risk framework
Not subject to capital requirements or subject to
deduction from capital
AssetsCash and cash equivalents 66,861 66,861 66,861 - - - -
Loans and advances to banks 27,254 27,254 9,968 17,286 - - -
Financial assets held for trading 1,760 1,760 - - - 1,760 -
Financial assets designated at fair value 1,194 1,194 1,194 - - - -
Derivatives 25,505 25,505 - 25,505 - 25,505 -
Loans and advances to customers 432,564 432,564 413,228 12,847 6,455 - 34
Available-for-sale financial assets 28,689 28,689 28,689 - - - -
Investments in associates and joint ventures 2,521 2,521 2,521 - - - -
Goodwill and other intangible assets 1,002 1,002 - - - - 1,002
Property and equipment 4,587 4,587 4,587 - - - -
Investment properties 193 193 193 - - - -
Current tax assets 175 175 175 - - - -
Deferred tax assets 1,733 1,733 1,099 - - - 634
Other assets 7,961 7,961 7,556 - - 405 -
Non-current assets held for sale 992 992 992 - - - -
Total assets 602,991 602,991 537,063 55,638 6,455 27,670 1,670
LiabilitiesDeposits from banks 18,922 18,922 - 396 - - 18,526
Deposits from customers 340,682 340,682 - 108 - - 340,575
Debt securities in issue 134,423 134,423 - - - - 134,423
Financial liabilities held for trading 581 581 - - - 581 -
Financial liabilities designated at fair value 13,792 13,792 - - - - 13,792
Derivatives 28,103 28,103 - 28,103 - 28,103 -
Other liabilities 8,271 8,271 - - - - 8,271
Provisions 1,537 1,537 - - - - 1,537
Current tax liabilities 248 248 - - - - 248
Deferred tax liabilities 396 396 - - - - 396
Subordinated liabilities 16,170 16,170 - - - - 16,170
Liabilities held for sale 256 256 - - - - 256
Total liabilities 563,381 563,381 - 28,607 - 28,684 534,194

Pillar 3 report 2017 15
- Komatsu Financial France S.A.S. (95.0%)
- Komatsu Financial Germany GmbH (95.0%)
- Komatsu Financial Italy S.p.A. (97.2%)
- LSVP VI Cayman Trust (12.0%)
- National Microfinance Bank Tanzania (34.9%)
- Banco Regional S.A.E.C.A. (42.6%)
- SBC Fintech NYC (46.1%)
3.4. Accounting and risk principles
The accounting principles are in accordance with IFRS as
adopted by the EU and are described in the Consolidated
Financial Statements 2017 of Rabobank Group. The risk
principles are set out in the relevant risk chapters. Unless
otherwise stated, all amounts are in millions of euros.
3.5. Enhanced Disclosure Task Force (EDTF) recommendations
The Enhanced Disclosure Task Force (EDTF), established by the
Financial Stability Board (FSB), presented recommendations
to improve the transparency of reporting by banks. Rabobank
embraces the EDTF principles except where the disclosure
is to be classified as proprietary or if the disclosure is not
relevant for Rabobank. Appendix 14.5 contains an overview
of the 32 recommendations of the EDTF. This overview also
includes a reference to the documents and pages where
the recommendations are discussed. As such, the EDTF
recommendations are discussed in the Annual Report 2017,
the Consolidated Financial Statements 2017 or this Capital
Adequacy and Risk Management Report 2017.
Template 2: EU LI2 – Main sources of differences between regulatory exposure amounts and carrying values in financial statements
Items subject to
TotalCredit risk
frameworkCCR
frameworkSecuritisation
frameworkMarket risk framework
1 Assets carrying value amount under the scope of regulatory consolidation (as per template EU LI1) 601,321 537,063 55,638 6,455 27,670
2 Liabilities carrying value amount under the regulatory scope of consolidation (as per template EU LI1) 29,188 - 28,607 - 28,684
3 Total net amount under the regulatory scope of consolidation 572,133 537,063 27,031 6,455 (1,014)
4 Off-balance-sheet amounts 90,014 83,097 - 6,917 -
5 Other assets - - - - -
6 Differences due to prudential filters - - - - -
7 Differences between financial statements and exposure values due to valuation and netting (26,677) (9,853) (18,558) - 4,332
8 Exposure amounts considered for regulatory purposes 635,470 610,307 8,473 13,372 3,318
The main differences between the carrying value of assets
under the scope of regulatory consolidation and the exposure
amounts considered for regulatory purposes can be explained by
the inclusion of the off-balance sheet liabilities in the exposure
amounts for regulatory purposes, valuation differences on loan
loss allowances, the exclusion of items that are capital deducted
and the different valuation of derivatives due to netting rules
and collateral.
Disclosure of Article 7 waivered subsidiariesFor Rabobank’s subsidiaries De Lage Landen International B.V.,
Rabohypotheekbank N.V., Rabo Groenbank B.V. and FHG Bank
N.V., each included in the supervision on a consolidated basis
of Rabobank, the exemptions pursuant to Article 7 CRR are
applicable, pursuant to which these subsidiaries are exempted
from the application of certain regulatory requirements under
the CRR on an individual basis. To be eligible for exemption,
these subsidiaries meet the relevant criteria regarding the
prompt transfer of own funds or repayment of liabilities
between Rabobank and these subsidiaries, the guarantee of
commitments entered into by these subsidiaries by Rabobank
and the prudent management, risk evaluation, measurement
and control procedures as covered by Rabobank.
Direct and indirect holdings of the capital of financial sector entities that are deducted or risk-weightedRabobank risk weights the following entities for a total amount
of 2,167 (2016: 2,096). As per 31 December 2017, no financial
sector entities have been deducted from capital.
- Achmea B.V. (29.2%)
- Arise B.V. (25.0%)
- Banco Cooperativo Sicredi (24.6%)
- Currence Holding BV (30.1%)
- Banco Finterra (15.3%)

Pillar 3 report 2017 16
4. Risk management
4.1. Risk Approach
Risk strategyRabobank’s mission ‘Growing a better world together’
underlines our cooperative roots and dedication to enable our
customers in achieving their ambitions. In its strategy Rabobank
defines priorities, objectives and targets including a capital
strategy. Rabobank’s risk strategy supports management in the
realisation of the business objectives by defining boundaries
within which the business must operate. An important starting
point for the risk strategy is that banking is about taking risks.
Each time business opportunities are discussed and decisions
are taken, risks are assessed against expected return. Without
taking risks no (profitable) banking activities are possible.
Therefore, not only accepting but also striving for a certain
degree of risk is a necessity.
The risk strategy is established at group level, is aligned with
the corporate strategy and describes the risk priorities that
Rabobank needs to manage to achieve its strategic plan. The
risk strategy is further detailed in a number of strategic risk
statements. These statements provide a high-level appetite
towards risks with material impact to this strategy and serve as
starting point for the more specific risk appetite per risk type.
Rabobank’s risk strategy is focused on the following goals:
• Support business in delivering excellent and appropriate
customer focus.
• Protect profit and profit growth: Rabobank’s business
strategy is strongly related to its cooperative roots, achieving
a healthy profit generation and at the same time realising a
high standard in serving its members, clients and society..
• Maintain a solid balance sheet: Sound balance sheet
ratios are essential to ensuring continuity in servicing our
customers under sustainable and favourable conditions.
Rabobank Group operates a prudent approach to risk with rigorous management controls to keep the bank safe, support the sustainable risk strategy and minimise losses within risk appetite. Rabobank has installed a strong risk function and maintains a risk management framework to identify and escalate emerging risks and to take decisions based on a conscious and careful risk-return trade-off in line with the risk strategy that should remain within risk appetite.
• Protect identity and reputation: A solid reputation is
essential to maintaining stakeholders’ fundamental trust in
the bank.
• Make healthy risk-return decisions: Make transparent
choices related to where capital and resources can be used
most efficiently or appropriately with respect to sectors or
concentrations.
These goals are strongly interwoven and fully dependent
on maintaining sound governance and a strong risk culture
throughout the organisation. Delivery of long-term customer
value requires a solid balance sheet, minimalising funding costs
and supporting the bank’s profitability and reputation. In return,
maintaining a solid balance sheet requires a healthy profitability
and a sound reputation.
Risk cultureRabobank implemented the of three lines of defence model,
which ensures risk management activities are an integral
part of business steering and our culture. Rabobank expects
all employees to focus on long-term relationships with our
customers, and to always act in their best interest. Employees
are expected to be aware of risks and dilemma’s in their day to
day work, to carefully consider the interests of all stakeholders,
to always be honest and reliable, and to take responsibility
for their actions. Desirable behaviour is encouraged and
undesirable behaviour is corrected. Rabobank creates an
environment in which risks and dilemmas can be openly
discussed and tunnel vision or group thinking is avoided in
daily decision processes. Learning from mistakes is part of
our approach to risk management. We strive to avoid making
the same mistake twice by removing the causes and sharing
experiences. This is complemented with risk awareness and
compliance training programs for all employees. Risk culture
is assessed by management teams and follow-up actions are
taken and monitored as part of regular steering.

Pillar 3 report 2017 17
Significant risks and developmentsRabobank keeps track of external developments and closely
monitors the risks that might affect the achievement of
organisational objectives. Regular and structural top-down
and bottom-up risk assessments are performed to identify
various types of risks, and specific stress tests are conducted
to calculate the impact of adverse scenarios. An integrated
overview of the main risks, the changes to them and the
measures taken to address them are regularly discussed in the
Managing Board and Supervisory Board. Banking is all about
taking and managing risks. When we do business, explore
options or take decisions, we continually assess risks.
Every day, Rabobank takes informed risk decisions on engaging
with (new) customers, granting credit, entering into interest
rate contracts and providing other services to customers.
To manage the material risks, risk and control processes are
designed to ensure that the risks incurred remain within the
bank’s risk appetite and that risk and return are appropriately
matched. These processes cover the regular banking risk types:
credit risk, market risk, interest rate risk, liquidity risk, operational
risks, including compliance risk and business risk. In addition,
we acknowledge that we currently face uncertain, volatile and
partially adverse market circumstances that create, among
others, the following risks for the bank:
• Market conditions: The sustained low interest rate
environment and low growth impacts our performance,
and competition for funding is fierce. Customer behaviour
is rapidly changing and digital innovation is increasing
competition from new entrants.
• Execution capacity: To achieve the desired results in a
complex environment with legacy systems and challenging
change-management of projects requires different
competences as we transition from being a physical only
bank to a more digital oriented bank.. This puts considerable
pressure on scarce resources as we overhaul our IT landscape
and improve data quality.
• Culture & conduct: The fragile balance in public trust is
quickly disturbed. Our employees are expected to adhere to
our values and act according to regulations. Furthermore,
legalisation on the client relationship is increasing. We need
to better anticipate market developments especially in sectors
where we are the market leader. This requires decisions to be
based not only on a rational approach, but also more intuitive
approaches like being open to internal challenges.
• Geopolitics: Geopolitical developments can drastically
change global dynamics. Negative impacts from regulatory
developments such as Basel IV and other emerging regulatory
requirements put a strain on resources. It costs a lot to
Risk AppetiteRabobank’s risk strategy is embedded in a number of strategic
risk statements directly linked to the Strategic Framework
2016-2020. These statements define the boundaries of
the risk appetite within which we must operate. The Risk
Appetite Statement (RAS) further specifies the Strategic Risk
Statements and define the levels and types of risk Rabobank
is willing to accept in order to achieve its business objectives.
It articulates Rabobank’s desired level of overall risk exposure
both quantitatively and qualitatively and is used in all business
activities to assess the desired risk profile against the risk-reward
profile of a given activity.
Risk appetite is, among other things, defined in terms of
• core-tier 1 capital and return on capital
• credit risk
• single obligor and concentration limits for asset classes
and sectors
• market risk
• interest rate risk in the banking book
• operational risk
• liquidity risk
The risk appetite at Rabobank Group level is an integral part
of the bank’s strategy. Entity-specific risk appetite statements
further specify the Group risk appetite at entity level. The risk
appetite is embedded across Rabobank Group within principles,
policies, indicators, limits and controls. The Risk Appetite
Statement is reviewed and updated annually or more frequently
following internal or external events with material impact.
The RAS is monitored by benchmarking the actual risk profile
against the risk appetite and discussed on a quarterly basis in
the Managing Board and Supervisory Board Risk Committee.
This ensures that day-to-day operations are executed within the
boundaries set by the business and risk strategy. Breaches of the
Risk Appetite will result in immediate action at the appropriate
management level.
Risk reportingEntity management teams and the Managing Board are enabled
to monitor and continuously manage their risks based on risk
reports. Risk reports primarily consist of key risk indicators as
described in the Risk Appetite Statement. For every risk type,
indicators and thresholds are defined to effectively manage the
risk profile within the risk appetite. Risk measurement per risk
type will be discussed in the specific risk chapters.

Pillar 3 report 2017 18
2. Functional expertise: risk management framework, policies,
delivery of support to the business, monitoring of group risk
exposures, models and data:
a. Risk Analytics: CRO treasury role, interest rate risk, funding
& liquidity risk, maintenance and development of models
for credit, provisioning and ALM, project management and
risk management systems;
b. Integrated Risk: capital risk management and stress testing,
risk framework and governance including group risk
appetite and risk committees, top risks, group integrated
risk reporting, regulatory oversight, supervisory relations,
recovery & resolution planning and group insurances.
c. Credit: development and implementation of credit and
provisioning policies, credit approval and credit risk
monitoring and reporting (e.g. portfolio, concentrations,
country limits), transactional risk committees, monitoring of
credit risk capital calculation;
d. Financial Restructuring & Recovery (FR&R): recovery and
restructuring of credit for clients at risk of financial distress,
accountability for provisioning and signoff related policies;
e. Operational Risk: group expertise centre on operational
risk, risk control framework (RCF), policies and procedures
management (PPM) including Policy House Portal, IT risk,
business continuity management (BCM), crisis management
and outsourcing including cloud solutions.
3. Staff department CLR Office: support CLR units, projects
and business control.
In carrying out its duties, the Risk Management function works
in close cooperation with business management. Specific
interaction, alignment and shared responsibilities exist with:
• Compliance (part of the CLR domain) has responsibilities
with regard to Compliance Risk in relation to the Compliance
Themes as defined in the Rabobank Compliance Charter.
The Risk Management function provides frameworks for
group-wide risk-appetite, risk identification, taxonomy,
risk assessment, incident registration and monitoring.
Compliance amongst others participates in new business /
product approval committees.
• Legal (part of CLR domain) has the primary responsibility
for advising on legal matters and legal risk management,
including litigation management. Risk Management and
Legal have a joint responsibility in monitoring of potential
and materialised legal risks and assessing applications of
new regulatory regimes via the Regulatory Oversight team
and in the case of resolution planning. Furthermore they
align on communication with regulators and risk framework
documentation. Legal participates in new business / product
approval committees.
implement new regulations and there are still differences
between supervisory interpretations in independent
jurisdictions.
• Data & Service disruption: Cyber threats are increasingly
sophisticated and attacks are more frequent, which requires
increased legislation and attention to security risks, vendor
management and continuity. A new hybrid IT bank landscape
with expanding cloud initiatives is changing the role of the IT
department and posing challenges to the governance.
• Sustainability: Climate change, including its effect on the
food chain, can influence financial stability through insurance
liabilities and the value of financial assets and real estate. New
financial risks emerge from the energy transition towards a
lower carbon economy.
4.2. Risk management organisation
The main role of the Risk Management function is to support
the organisation in the realisation of its business objectives by
defining boundaries for taking risks within which the business
must operate and by delivering a risk management framework
to identify, assess and manage the risks the business incur in
their activities. In carrying out its duties, the Risk Management
function maintains its balance between independence from the
business lines whilst closely cooperating with the business.
Every Rabobank employee is involved in addressing and
managing risks on a daily basis. Rabobank has adopted the
‘three lines of defence’ concept to provide clarity on the
responsibilities for risk and control activities. This clarity of
responsibilities results in coordinated, efficient and effective risk
and control activities throughout the bank.
The Risk Management function at group level is organised in
units which can be divided in the following groups:
1. Network / Business domains: implementation and
enforcement of the risk framework, provide boundaries,
challenge and oversight within entities/subsidiaries and CRO
role for all risk types:
a. Risk Retail NL;
b. Risk Wholesale Rural & Retail includes market risk policies
and methodologies and second line monitoring of WRR,
Treasury (only partly) and Portfolio Management;
c. Risk IT & Operations (CIOO) includes Digital Transformation
Office, staff and support functions, model risk oversight and
model validation.
Pillar 3 report 2017 19
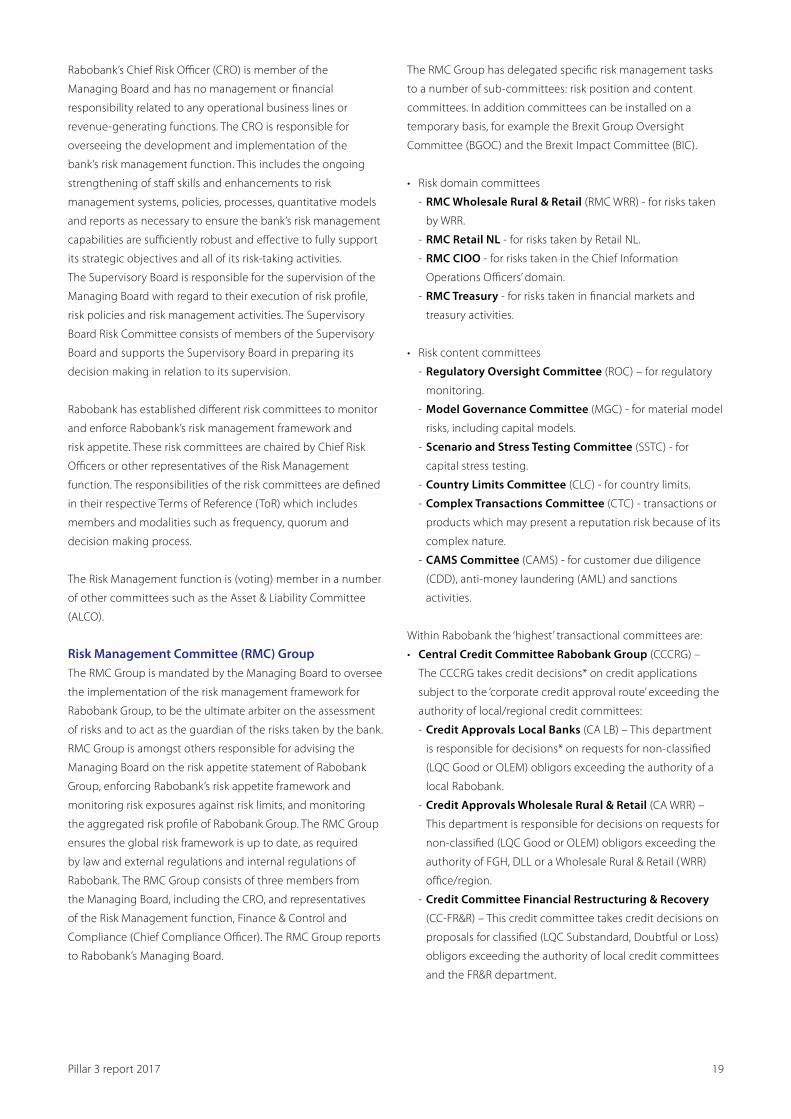
The RMC Group has delegated specific risk management tasks
to a number of sub-committees: risk position and content
committees. In addition committees can be installed on a
temporary basis, for example the Brexit Group Oversight
Committee (BGOC) and the Brexit Impact Committee (BIC).
• Risk domain committees
- RMC Wholesale Rural & Retail (RMC WRR) - for risks taken
by WRR.
- RMC Retail NL - for risks taken by Retail NL.
- RMC CIOO - for risks taken in the Chief Information
Operations Officers’ domain.
- RMC Treasury - for risks taken in financial markets and
treasury activities.
• Risk content committees
- Regulatory Oversight Committee (ROC) – for regulatory
monitoring.
- Model Governance Committee (MGC) - for material model
risks, including capital models.
- Scenario and Stress Testing Committee (SSTC) - for
capital stress testing.
- Country Limits Committee (CLC) - for country limits.
- Complex Transactions Committee (CTC) - transactions or
products which may present a reputation risk because of its
complex nature.
- CAMS Committee (CAMS) - for customer due diligence
(CDD), anti-money laundering (AML) and sanctions
activities.
Within Rabobank the ‘highest’ transactional committees are:
• Central Credit Committee Rabobank Group (CCCRG) –
The CCCRG takes credit decisions* on credit applications
subject to the ‘corporate credit approval route’ exceeding the
authority of local/regional credit committees:
- Credit Approvals Local Banks (CA LB) – This department
is responsible for decisions* on requests for non-classified
(LQC Good or OLEM) obligors exceeding the authority of a
local Rabobank.
- Credit Approvals Wholesale Rural & Retail (CA WRR) –
This department is responsible for decisions on requests for
non-classified (LQC Good or OLEM) obligors exceeding the
authority of FGH, DLL or a Wholesale Rural & Retail (WRR)
office/region.
- Credit Committee Financial Restructuring & Recovery
(CC-FR&R) – This credit committee takes credit decisions on
proposals for classified (LQC Substandard, Doubtful or Loss)
obligors exceeding the authority of local credit committees
and the FR&R department.
Rabobank’s Chief Risk Officer (CRO) is member of the
Managing Board and has no management or financial
responsibility related to any operational business lines or
revenue-generating functions. The CRO is responsible for
overseeing the development and implementation of the
bank’s risk management function. This includes the ongoing
strengthening of staff skills and enhancements to risk
management systems, policies, processes, quantitative models
and reports as necessary to ensure the bank’s risk management
capabilities are sufficiently robust and effective to fully support
its strategic objectives and all of its risk-taking activities.
The Supervisory Board is responsible for the supervision of the
Managing Board with regard to their execution of risk profile,
risk policies and risk management activities. The Supervisory
Board Risk Committee consists of members of the Supervisory
Board and supports the Supervisory Board in preparing its
decision making in relation to its supervision.
Rabobank has established different risk committees to monitor
and enforce Rabobank’s risk management framework and
risk appetite. These risk committees are chaired by Chief Risk
Officers or other representatives of the Risk Management
function. The responsibilities of the risk committees are defined
in their respective Terms of Reference (ToR) which includes
members and modalities such as frequency, quorum and
decision making process.
The Risk Management function is (voting) member in a number
of other committees such as the Asset & Liability Committee
(ALCO).
Risk Management Committee (RMC) GroupThe RMC Group is mandated by the Managing Board to oversee
the implementation of the risk management framework for
Rabobank Group, to be the ultimate arbiter on the assessment
of risks and to act as the guardian of the risks taken by the bank.
RMC Group is amongst others responsible for advising the
Managing Board on the risk appetite statement of Rabobank
Group, enforcing Rabobank’s risk appetite framework and
monitoring risk exposures against risk limits, and monitoring
the aggregated risk profile of Rabobank Group. The RMC Group
ensures the global risk framework is up to date, as required
by law and external regulations and internal regulations of
Rabobank. The RMC Group consists of three members from
the Managing Board, including the CRO, and representatives
of the Risk Management function, Finance & Control and
Compliance (Chief Compliance Officer). The RMC Group reports
to Rabobank’s Managing Board.

Pillar 3 report 2017 20
and regulatory requirements. Model results are back-tested
against historical loss data. Where relevant, external benchmark
studies are used to support the calibration of parameters.
Models require formal internal approval before implementation
and use is allowed. Final internal approval for the (continued)
use of a model is obtained from the Model Governance
Committee (MGC), a subcommittee of the Risk Management
Committee (RMC) Group. External approval, when required, is
obtained from the regulator.
Credit risk modelsThe bank uses internal models to estimate Probability of Default
(PD), Loss Given Default (LGD) and Exposure at Default (EAD)
parameters. These models are embedded in the credit approval
and internal reporting processes and are used to measure the
credit risk in exposures to individual clients and portfolios.
The same parameters are also used to calculate risk-adjusted
return on capital, Pillar 2 framework capital and the minimum
regulatory capital requirements under the Basel Advanced
Internal Ratings Based (AIRB) approach.
Operational risk modelsOperational risk loss events are systematically collected and
analysed on a bank-wide basis. Operational risk assessments
are key in systematically assessing operational risks in ongoing
business and in proposed changes. Progress on outstanding
operational risk issues is monitored through issue management
and action tracking. Operational risk exposures are analysed and
reported to senior management to support decision-making.
Market risk modelsValue-at-Risk (VaR) models are used to measure market risk of
exposures in both the banking and the trading book. Value-
at-Risk is used for the internal monitoring and reporting of
positions relative to the limits determined in the risk appetite.
In addition to VaR, other instruments to measure market risk
are used as well; (e.g. Equity at Risk, Income at Risk, basis point
value and sensitivity and stress scenarios).
4.4.2. Capital stress testingCapital stress testing is an important risk management tool
that provides a forward looking assessment of risk and assists
in the optimisation of risk capital. It enables the exploration
of vulnerabilities in business models whilst overcoming the
limitations of risk models and historical data. At Rabobank,
stress testing forms an essential part of the risk management
framework. Stress tests are used to measure the impact of
extreme, but plausible events. Where necessary, measures in
line with Rabobank’s Risk Appetite are taken on the basis of
stress tests results.
• Credit Committee Financial Institutions (CCFI) – The CCFI
takes credit decisions on proposals exceeding the authority
of Credit FI. This department is responsible for the risk
management of exposure on financial institutions.
• Loan Loss Provision Committee (LLPC) – The LLPC monitors
the development of qualified credit and asset portfolios
and recommends on provisions for obligors exceeding the
authority of local credit committees, to the Managing Board.
4.3. Risk management framework
Rabobank Group maintains a risk management framework to
identify, assess, manage, monitor and report risks. Risk policies
are assessed annually to determine if risk mitigation and
the management of risks is sufficient. The risk management
framework supports decisions based on a conscious and careful
risk-return trade-off in line with the defined strategy and within
Risk Appetite.
The mission of the Risk Management function is to enable the
bank to achieve its strategic goals within its risk appetite and to
make sure risk is everybody’s business. The Risk Management
function ensures the financial stability and continuity of
Rabobank by monitoring its risk profile and ensuring that risk
management activities are executed effectively and efficiently
in line with legislation and best practices in the market.
The vision of the Risk Management function is to advise the
business and support them in managing risk, act as the guardian
of the risk profile of Rabobank by identifying risks and initiating
mitigating actions with empowered employees, satisfied clients
and in partnership with internal and external stakeholders.
4.4. Risk Measurement
4.4.1. Risk models and model validationRabobank develops and uses risk models for most risk types.
The models for credit, market and operational risk are the
most widely used. Models are developed by the modelling
departments in close cooperation with the relevant business
and risk experts. In principle, models are reviewed annually.
The models are the basis for internal measures of risk (Pillar 2
framework) and are at the same time key inputs for calculation
of the minimum regulatory capital requirements according
to the Basel-3 framework. All internal models are validated
by the independent Model Validation department. Validation
guidelines are specified to ensure objectivity, consistency,
transparency and continuity. Models are validated according
to these principles and reviewed against internal requirements

Pillar 3 report 2017 21
and external scenarios both macro-economic and non-
macroeconomic factors are taken into account. The macro-
economic factors include economic growth, unemployment,
inflation, interest rates, share prices and real estate prices to
mention a few. The outlook of the macro economic variables
over the stress periods are provided by Rabo Research.
Once a scenario is generated, quantitative stress test models are
used to determine the impact of the scenario on the financials
of Rabobank. The balance sheet, risk exposure amounts and
profit & loss statement and their components are stressed
in order to assess the resilience to withstand the impact of a
scenario. In order to stress these different components, stress
testing focuses on different types of risk, each with their own
stress test model. The main stress test models focus on credit
risk, market risk, net interest income, operational risk and non-
interest income The stress test models are subject to review
from model validation. The scenario variables and methodology
is applied to the portfolio based on the models.
There is a review and challenge of the results with experts and
business. As part of the stress test process, various potential
management actions are identified, that could be taken to
mitigate the impact of stress. There is robust governance
process in place via the STC and RMC with regards to review of
stress testing methodology, results and the proposed actions.
Once the results are approved there is an evaluation of the
process of the stress test and learning points from the stress test
are shared within the organization. There is constant monitoring
of issues to improve the process. In 2017 there was increased
focus on the distribution and further use of result within the
business for understanding the vulnerabilities within the sector/
region/ portfolio and support steering.
Stress test governanceGiven the importance of stress testing in terms of sound risk
management and regulatory compliance, the stress testing
process and governance warrants the involvement of senior
management up to the Group Managing Board of Rabobank.
The Group Managing Board of Rabobank is ultimately responsible
for the Rabobank Stress Testing Framework and its execution,
while the Risk Management Committee Group (RMC) acts as the
delegated principal. Specific tasks of the RMC regarding capital
stress testing are delegated to the Stress Test Committee (STC).
In addition to that in 2017 a new committee was set-up, the
Scenario & Stress Test Committee (SSTC), which has the mandate
to overlook on all the Rabobank’s wide scenario related
activities including IFRS 9, capital planning and Stress testing.
Stress test activitiesStress tests occur in many forms and levels with different
scopes. The current types of stress tests that are executed within
Rabobank can be categorised by a variety of determinants:
• By scope (firm-wide, thematic/BU transcending, business unit,
local capital stress test,regulation)
• By initiator (external versus internal);
• By type (bottom-up, top-down, reverse stress test).
Within capital stress testing, the impact of severe but plausible
scenarios on the financial position of Rabobank is evaluated.
Stress test processThe overall stress test process can be summarised as shown in
Figure 1. Scenarios consist of, amongst others, a set of regular
macroeconomic scenarios, thematic, regulator-provided
scenarios, scenarios generated as a result of risk identification,
reverse scenarios, and ad hoc scenarios. Scenarios are chosen
by the SSTC based on the relevance and plausibility, top risks
are used as an input in these sessions. In the various internal
1. Governance
6. Data and supporting infrasctructure
2. Scenario generation
3. Methodology 4. Execution 5. Use of results
Top-down ST
Bottom-up ST
Reverse ST

Pillar 3 report 2017 22
Financial institutions have to hold a certain minimum required
amount – Minimum Required Eligible Liabilities (MREL) – to
have sufficient loss-absorbing and re-capitalisation capacity
available to overcome challenging periods and to ensure for an
orderly resolution that minimise impacts on financial stability,
maintains the continuity of critical functions and avoids
exposing public funds (and taxpayers) to loss.
On 23 November 2016 the European Commisssion released its
legislative proposal to amend the CRR and CRD IV. To ensure
consistency between the proposed TLAC requirements (CRR2)
and the MREL requirements, revisions to the BRRD were
proposed as well. The proposal introduces a provision to set
an ‘internal MREL’ requirement, equivalent to internal TLAC.
The legislative process is ongoing and expected to be further
formalized in the course of 2018.
Basel IV• In December 2017 the Basel Committee finalised the Basel
III reform (also referred to as Basel IV by the industry). This
reform complements the initial phase of the Basel III reforms
announced in 2010 (and implemented in the CRR/CRD IV in
2014) as a response to the global financial crisis. The 2017
reform seeks to restore credibility in the calculation of risk
weighted assets (RWAs) and improve the comparability of
banks’ capital ratios. Main features of the reform:
- Revisions to the standardised approaches for calculating
credit risk, market risk, credit value adjustments (CVA) and
operational risk
- Constraints on the use of internal model approaches, by
placing limits on certain inputs used to calculate capital
requirements under the internal ratings-based (IRB)
approach for credit risk and by removing the use of internal
model approaches for CVA risk and for operational risk
- The introduction of an output floor, which limits the
benefits banks can derive from using internal models to
calculate minimum capital requirements. Banks’ calculations
of RWAs generated by internal models cannot, in aggregate,
fall below 72.5% of the risk-weighted assets computed by
standardised approaches
- Global systematically important banks (G-SIBs) are subject
to higher leverage ratio requirements
• The implementation date is set at 1 January 2022 with a phase
in period of 5 years. National supervisors have the discretion
to cap the increase in a bank’s total RWAs, resulting from the
application of the output floor, at 25% during the phase-in
period. Any such cap will be removed on 1 January 2027
Results are used for sound risk management within Rabobank,
this includes in links to the: budget, capital plan, risk appetite
statement, integrated risk report, recovery and resolution
plans. Clear governance, data and supporting infrastructure are
essential in the stress test process.
In 2017 an internal firm-wide stress test was performed as part
of the SREP process. In addition, an internal firm-wide stress test
with the ECB interest rate spike was performed on the mid-year
figures; a thematic stress test was performed on the SME
portfolio, and two reverse stress tests were executed. Finally,
several business unit and local stress tests including regulatory
stress tests were also performed.
In 2017 there was focus on the stress testing credit risk part for
alignment to IFRS 9 and budgets.
Rabobank is also busy with preparation of the upcoming 2018
EBA stress test.
4.5. (Regulatory) Developments
Ongoing regulatory reforms require tremendous efforts of our
organization. During 2017 Rabobank executed a number of
large regulatory change projects (amongst others MiFID II, PSD
II, GDPR, Stress Testing) working towards compliancy dates in
2018. Developments with respect to IFRS 9, MREL, Basel IV and
BCBS239 will be discussed in more detail.
IFRS 9In July 2014, the International Accounting Standards Board
published IFRS 9 Financial Instruments as the replacement for
IAS 39 Financial Instruments: Recognition and Measurement.
The new standard becomes effective on 1 January 2018 and
was endorsed by the EU in November 2016. IFRS 9 governs the
accounting methods used for the majority of our statement
of financial positions and consists of three main areas:
Classification and Measurement, Impairments and Hedge
Accounting.
During 2017 Rabobank has progressed with the implementation
of IFRS 9 towards the effectiveness date of 1 January 2018. For
further information regarding the requirements and impact of
IFRS 9 we refer to our financial statements of 2017.
MRELFollowing the financial crises of 2007/2008, the FSB’s
recommended a framework on recovery and resolution
measures. In April 2014 the European countries accepted the
Bank Recovery & Resolution Directive (BRRD) which largely
reflected FSB’s framework. The BRRD went into full force as per
1st of January 2016.

Pillar 3 report 2017 23
BCBS239BCBS239 requirements have already prompted serious efforts to
realize enhanced risk reporting. These initiatives focus on overall
improvement of data quality, aggregation and risk-reporting
timeliness. Such improved reports would enable Rabobank
to make decisions faster, based on more transparent and
consistent data, and improve the quality of fact-based decisions.
In addition, real-time risk reporting would help banks identify
potential risks even sooner, allowing a more timely response.
Rabobank expects to be compliant by 1 January 2019.
• These Basel proposals need to be transposed into European
law. Europe will start this process in 2019 and the proposals
could be adjusted to better reflect the European situation.
The ultimate impact of Basel IV remains uncertain for the next
coming years given the inclusion of national discretions in
the proposals and the potential European changes.
• It is uncertain whether the Basel reforms will lead to
adjustments on the Pillar 2 requirement, the Pillar 2 guidance
and the Combined Buffer requirements. Obviously, the Basel
III reforms have a significant impact on Rabobank’s capital
ratios itself and the management actions (on either the asset
or liability side of the balance sheet) that will be taken to
respond to the new rules.

Pillar 3 report 2017 24
5. Capital management
5.1. Capital Management
The capital management framework supports the overall
strategy of Rabobank to maximise long-term risk-adjusted
returns on invested capital, guided by the following objectives:
1. A viable capital strategy in line with the overall business
strategy, risk strategy, and supply side constraints
2. A feasible mid-term capital plan including an optimal capital
allocation in line with risk appetite
3. Compliance with regulatory capital requirements and
alignment of capital projections with regulatory guidance
and expectation
4. Enabling risk-adjusted capital-based performance
management to support the achievement of capital ratio
targets
5. Enabling achievement of capital target ratios (a minimum
CET ratio of 14%, and a minimum Total Capital ratio of 25%) in
line with the capital strategy plan
6. Accurate measurement and reporting of capital usage
according to regulatory requirements and internal standards
7. Ongoing monitoring of capital limits and enforcement of
compliance if breaches occur
8. Ensuring optimal mix of available capital across the group in
light of regulatory requirements, capital market expectations
and capital costs
Capital risk appetite is set by the Board, reflecting the Group’s
strategic plan, regulatory capital constraints and market
expectations. It is defined by a number of minimum capital
ratios in normal and stressed conditions. Capital is actively
managed and regulatory ratios are a key factor in Rabobank’s
planning process and stress analyses. The capital plan is tested
for capital adequacy using sensitivity analysis and a range of
stress scenarios covering adverse economic conditions as well
as other adverse factors that could impact Rabobank. Rabobank
maintains a Recovery Plan which sets out a range of potential
mitigating actions that could be taken in response to a stress
event.
This chapter describes the capital management, the Regulatory requirements of Rabobank, the Pillar 2 capital framework and the development of the capital ratios. The CRR (CRD IV) framework defines capital requirements for banks as the absolute minimum amount of capital required to cover the financial risks that a bank faces. For Pillar 1 this is expressed in three major risk types: credit, operational and market risk.
The Managing Board has ultimate responsibility for ensuring
that Rabobank maintains the targeted minimum capital levels
above the minimum prudential capital levels as set by the
European Central Bank (ECB).
In the yearly Internal Capital Adequacy Assessment Process
(ICAAP), Rabobank assesses the capital adequacy in the context
of the current and foreseeable business and environment where
it operates in and the associated risk exposures as part of the
Supervisory Review and Evaluation process.
The main differences are the regulatory and transitional
adjustments in qualifying capital following CRR, such as
intangibles, deferred tax assets, the Internal Ratings Based (IRB)
shortfall and the phasing out of non-eligible additional Tier 1
capital instruments. The Tier 2 subordinated debt is accounted
for as a liability under IFRS. Table 1 provides an overview of the
changes in the different qualifying capital components.
Table 1: Reconciliation of qualifying capital with IFRS capital
Qualifying capital IFRS capital
Retained earnings 26,777 26,777
Expected dividends (54)
Rabobank Certificates 7,440 7,440
Non-controlling interests 26 475
Reserves (1,401) (1,401)
Regulatory adjustments (2,050)
Transitional adjustments 525
Common Equity Tier 1 capital 31,263
Trust preferred securities IV 394
Capital Securities 5,925
CRDIV compliant Capital Securities 2,728
Grandfathered instruments 3,590
Non-controlling interests 6
Regulatory adjustments (88)
Transitional adjustments (295)
Tier 1 capital 37,204
Subordinated debt 14,896
Non-controlling interests 7
Regulatory adjustments (89)
Transitional adjustments (95)
Tier 2 capital 14,719
Total IFRS equity/qualifying capital 51,923 39,610

Pillar 3 report 2017 25
Template 4: EU OV1 – Overview of RWAs
RWAs
Minimum capital
requirements
1 Credit risk (excluding CCR) 157,730 12,618
Article 438(c)(d)
2 Of which the standardised approach 18,748 1,500
Article 438(c)(d)
3 Of which the foundation IRB (FIRB) approach
4,554 364
Article 438(c)(d)
4 Of which the advanced IRB (AIRB) approach
130,095 10,408
Article 438(d)
5 Of which equity IRB under the simple risk-weighted approach or the IMA
4,334 347
Article 107 Article 438(c)(d)
6 CCR 3,618 289
Article 438(c)(d)
7 Of which mark to market 659 53
Article 438(c)(d)
8 Of which original exposure - -
9 Of which the standardised approach - -
10 Of which internal model method (IMM)
2,001 160
Article 438(c)(d)
11 Of which risk exposure amount for contributions to the default fund of a CCP
63 5
Article 438(c)(d)
12 Of which CVA 896 72
Article 438(e)
13 Settlement risk - -
Article 449(o)(i)
14 Securitisation exposures in the banking book (after the cap)
1,862 149
15 Of which IRB approach 49 4
16 Of which IRB supervisory formula approach (SFA)
992 79
17 Of which internal assessment approach (IAA)
822 66
18 Of which standardised approach - -
Article 438 (e)
19 Market risk 3,750 300
20 Of which the standardised approach 433 35
21 Of which IMA 3,318 265
Article 438(e)
22 Large exposures - -
Article 438(f)
23 Operational risk 25,890 2,071
24 Of which basic indicator approach - -
25 Of which standardised approach - -
26 Of which advanced measurement approach
25,890 2,071
Article 48 and Article 60
27 Amounts below the thresholds for deduction (subject to 250% risk weight)
5,418 433
Article 500
28 Floor adjustment - -
29 Total 198,269 15,861
A detailed breakdown of CET1, T1 and T2, and additional
information about the CET1, T1 and T2 capital instruments
can be found in appendix 14.1.
Table 2: Overview of changes in qualifying capital.
Overview of changes in qualifying capital
Qualifying capital at 1 January 2017 CRD IV 52,873
Opening Common Equity Tier 1 capital at 1 January 2017 29,618
Retained earnings 1,068
Expected dividend 6
Rabobank Certificates 1,492
Non-controlling interests 1
Reserves (1,513)
Regulatory adjustments 1,253
Transitional adjustments (661)
Closing Common Equity Tier 1 capital at 31 December 2017 31,263
Opening additional Tier 1 capital at 1 January 2017 7,461
Capital Securities and grandfathered instruments (1,871)
Regulatory & transitional adjustments 352
Closing additional Tier 1 capital at 31 December 2017 5,941
Closing Tier 1 capital at 31 December 2017 37,204
Opening Tier 2 capital at 1 January 2017 15,794
Subordinated debt (1,198)
Regulatory & transitional adjustments 123
Closing Tier 2 capital at 31 December 2017 14,719
Qualifying capital at 31 December 2017 51,923
A general overview of the main features of the Common Equity
Tier 1 and additional Tier 1 instruments and Tier 2 instruments is
available in appendix 14.2.
5.2. Regulatory Capital
Rabobank is using the most advanced calculation methods
for calculating the Regulatory Capital (RC) requirements under
Basel III and CRR (CRD IV) for credit, market and operational
risks. The policy of Rabobank is aimed at applying the IRB
approach for its credit portfolio as much as possible.
Template 4 presents an overview of the Regulatory Capital
requirements and the Risk Weighted Exposure Amounts (RWEA)
at 31 December 2017 for the different risk types. The largest part
of the capital requirement relates to credit risk (85%). Market risk
accounts for 2% of the capital requirements and operational risk
comprises 13% of the Regulatory Capital requirements.

Pillar 3 report 2017 26
At year-end 2017, the Regulatory Capital requirement of
Rabobank Group was 15.9 (2016: 16.9) billion. The Regulatory
Capital requirement for credit risk decreased mainly due to
the reduction of exposure and increased asset quality. The
appreciation of the euro also contributed to a lower regulatory
capital. The Regulatory Capital requirement for market risk
and operational risk is in line with the Regulatory Capital
Requirement as per year-end 2016. A more granular overview of
the capital requirements can be found in appendix 14.2 (added
separately) (CRR 438c,d).
5.3. Renewed Pillar 2 capital framework
The relevant rules and regulations related to the capital
adequacy process of EU banks are addressed in the CRR/
CRD IV comprehensive frameworks. These frameworks are the
EU legal translation of the banking guidelines suggested by
the Basel Committee - the so-called Basel III standards from
December 2010. CRR/CRD IV lays out a three-pillar approach to
risk and capital management: the Pillar I on minimum capital
requirements of credit, market and operational risk; Pillar 2
about supervisory review process (SREP); and Pillar 3 on market
discipline, where banks disclose to the public their overall risk
profiles.
Pillar 2, the focus of this section, describes the mandatory
processes for both banks and regulators to fulfill the capital
adequacy requirements. The main areas that fall under this Pillar
are: risks considered under Pillar I that are not fully or adequately
captured by the prescribed methodologies; risks that are not
considered in the Pillar I capital requirements (e.g. interest rate
risk); and external factors to the bank (e.g. market conditions).
In order to adequately assess the capital resources needed
to cover the risks inherent in its current activities, Rabobank
renewed its Pillar 2 modelling landscape. The renewed Pillar 2
capital framework entered into effect as of 1 January 2017 and
covers all those areas where Rabobank is of the opinion that
the regulatory framework does not address the risk, or does
not adequately address the risk. Rabobank developed mostly
statistical approaches and methodologies that: (1) challenge
regulatory capital requirements; (2) cover risks not addressed in
CRR/CRD IV; and (3) identify possible future events or changes
in the market conditions that could impact Rabobank’s strategic
planning. The renewed Pillar 2 modelling landscape was fully
coordinated with Rabobank’s supervisors and reflects the
changing regulatory environment and similar developments in
the industry.
The outputs of the renewed Pillar 2 models are used for various
purposes within the bank, such as deal acceptance and pricing,
strategy and planning of the firm’s operations, and performance
evaluation. Moreover, the regulators and supervisors view
the level of capitalization as one of their key instruments to
supervise Rabobank. Therefore, the renewed Pillar 2 capital
framework promotes a sound and effective risk management
culture within Rabobank, ensuring adequate capital levels
to support business growth, maintain depositor and creditor
confidence and comply with regulatory requirements.
Figure 2: Pillar 1 and Pillar 2 capital
Credit and transfer risk 64%
Operational risk 10%
Other risks 8%
Interest rate and market risk 18%
Pillar 2 capital by risk typeat year-end 2017
At year-end 2017, the total Pillar 1 and Pillar 2 capital of
Rabobank Group amounted to 20.8 (2016: 22.1) billion.
Qualifying capitalThe available qualifying capital of 51.9 (2016: 52.9) billion, the
bank retains to compensate for potential losses, was above the
level of the total external and internal capital requirements.
This buffer underlines the financial solidity of Rabobank Group.
5.4. Capital ratios
The CRR and CRD IV jointly constitute the European
implementation of the Basel capital and liquidity agreement of
2010. CRR provides CET1 deductible items such as intangible
non-current assets, deferred tax assets and the Internal Ratings
Based (IRB) shortfall. These adjustments will be phased in
gradually during the period 2014-2018.

Pillar 3 report 2017 27
The total required (end state) CET1 ratio therefore amounts
to 11.75%, excluding the Pillar 2 guidance. The required (end
state) total capital amounts to 15.25%. This is the required
(end state) CET1 ratio plus 3.5% Pillar 1 requirement for
additional Tier 1 and Tier 2. In addition to these ratios, there
will be a countercyclical buffer of up to 2.5% which may be
imposed by the supervisor. Almost all supervisors have set their
countercyclical buffer at 0% as per 1 January 2018.
The actual capital ratios of Rabobank exceeds these minimum
capital ratios.
Our current (transitional based) capital ratios and targets
are higher than the minimum capital requirements. It is our
ambition to maintain a strong capital position. Rabobank has
the following capital ambition as per the end of 2020:
• Minimum CET1 ratio of 14%;
• Minimum Total capital ratio of 25%.
Leverage ratioThe leverage ratio is defined as Tier 1 capital divided by a non-
risk-based measure of the on- and off balance sheet items. The
information to be disclosed is calculated in accordance with
the amendments made in the CRR calculations as laid down in
Commission Delegated Regulation (EU) 2015/62 of 10 October
2014. The fully loaded leverage ratio on 31 December 2017
stood at 5.4% (2016: 4.6%). The fully loaded leverage ratio is the
leverage ratio if the provisions of the new regulations are fully
applied. The actual leverage ratio on 31 December 2017 stood
at 6.0% (2016: 5.5%). The regulatory minimum level for the
leverage ratio is 3%. The actual leverage ratio was at a higher
level than the fully loaded leverage ratio at year-end 2017 as
various adjustments will be gradually applied to the capital
over the coming years in accordance with the regulations.
In line with the endorsed implementing technical standards
with regard to disclosure of the leverage ratio for institutions,
according to Regulation (EU) No 575/2013 of the European
Parliament and of the Council, Rabobank uses the specific EBA-
templates as basis for the presentation of its leverage ratio as
per 31 December 2017.
For the summary reconciliation of accounting assets and
leverage ratio exposures we refer to appendix 14.3.
The benefit of our MREL eligible capital bufferRabobank wants to mitigate the MREL eligible capital risk for
our creditors and depositors as much as possible. We therefore
hold a large buffer of equity and subordinated debt that will
absorb losses first in the event of a bail-in. Only after this buffer
has been used senior creditors, whose claims are not covered
by collateral, will need to contribute in the unlikely event of a
bail-in.
The fully loaded Common Equity Tier 1 ratio was 15.5% on
31 December 2017. Fully loaded is the CET1 ratio where based
on all CRR (CRD IV) regulation being fully applied. In line with
the regulatory requirements various adjustments in capital will
be phased in during the period 2014-2018 in the CET1 capital.
Therefore, the current CET1-ratio is higher than the fully loaded
CET1-ratio.
The Tier 1 instruments that were issued by Rabobank before
2014 do not meet the new requirements of the CRR. For these
instruments, grandfathering is applicable. This means that
these instruments will, in line with the regulatory requirements,
gradually be phased out of equity. In 2017, the Tier 1 ratio
increased by 1.2 percentage points to 18.8% (17.6%), mainly
due to the higher CET1 capital. The capital ratio rose by 1.2
percentage points to 26.2% (25.0%), also mainly due to the
higher CET1 capital.
Table 3: Capital ratios
Capital ratios
At 31 December 2017
At 31 December 2016
Risk Weighted Exposure Amount 198,269 211,226
Total Common Equity Tier 1 capital 31,263 29,618
Total Tier 1 capital 37,204 37,079
Total qualifying capital 51,923 52,873
Common Equity Tier 1 ratio 15.8% 14.0%
Tier 1 ratio 18.8% 17.6%
Capital ratio 26.2% 25.0%
Rabobank must comply with the minimum capital ratios as
stipulated under law. Effective 1 January 2014, the minimum
required percentages are determined on the basis of CRD IV/
CRR. The legal buffers below are applicable as from 2016. These
buffers will gradually increase until the year 2019. Rabobank is
already allowing for these changes in its capital planning. The
table below shows the minimum legal buffers under CRD IV/CRR.
Table 4: Minimum capital buffer
Minimum CET1 buffer
2017 2018 2019
Pillar 1 requirement 4.5% 4.5% 4.5%
Pillar 2 requirement 1.75% 1.75% 1.75%
Capital conservation buffer 1.25% 1.875% 2.5%
Systemic risk buffer 1.5% 2.25% 3.0%
Total required CET1 ratio 9.0% 10.375% 11.75%
Actual 15.8%

Pillar 3 report 2017 28
We define our MREL eligible capital buffer as qualifying capital
plus the non-qualifying part of the grandfathered additional
Tier 1 instruments and the amortised part of Tier 2 with a
remaining maturity of at least one year. In 2017, FX effects had
a limited negative impact on our MREL eligible capital buffer.
The buffer decreased from 53.7 billion to 53.2 billion. This
corresponds to 26.8% (2016: 25.4%) of risk-weighted assets.
Table 5: MREL eligible capital buffer (in billion)
MREL Eligible Capital buffer
Amounts in billions31 December
201731 December
2016
Qualifying Capital 51.9 52.9
Non qualifying grandfathered Additional Tier 1 0.0 0.0
Amortised Tier 2 > 1 year 1.3 0.8
MREL Eligible Capital buffer 53.2 53.7
Risk-weighted assets 198.3 211.2
MREL Eligible Capital buffer / risk-weighted assets 26.8% 25.4%

Pillar 3 report 2017 29
6. Credit Risk
6.1. Credit Risk management
Credit acceptanceRabobank’s prudent credit acceptance policy is typified by
careful assessment of customers and their ability to repay the
loan that was issued (continuity perspective). As a result, the
loan portfolio has an acceptable risk profile even in less than
favourable economic circumstances. Rabobank aims to have
long-term relationships with customers that are beneficial for
both the client and the bank. An important starting point in
acceptance policy for business loans is the ‘know your customer’
principle. This means that the bank only issues loans to business
customers whose management Rabobank considers to be
ethical and competent. In addition, Rabobank closely monitors
developments in the business sectors in which its customers
operate and can properly assess the financial performance of
its customers. Corporate sustainability also means sustainable
financing. Sustainability guidelines have been established for
use in the credit process.
Although credit is usually granted on the cash flow generating
potential of the client or project, collateral will improve the
position of the bank in case a client defaults. Collateral can
be independent of the client’s business and/or obtained from
the client’s business. Rabobank has outlined its policies for
collateral valuation and management in the Global Standard
Credit Risk Mitigation. Compliant to CRR 181 1.(e) all (eligible)
collateral is valued at market value or less than market value
and the collateral value is monitored frequently. The collateral
is sufficiently liquid and its value over time is sufficiently stable
Credit risk is defined as the risk of the bank facing an economic loss because the bank’s counterparties cannot fulfil their contractual obligations. Credit risk management within the bank is governed by the bank-wide central credit risk policy and further detailed in underlying specific credit risk standards and procedures. The primary responsibility for managing and monitoring credit risk lies with the business as the first line of defence. The business is required to identify, assess and manage, monitor and report potential weaknesses in the credit risk portfolios. Monitoring takes place on an ongoing basis to limit credit risk exposures to a level in line with the business line’s risk appetite. In addition, risk in the credit portfolio is measured and monitored at bank-wide level and on entity level on a monthly basis and by quarterly and ad-hoc portfolio reporting and analysis, with specific attention to risk developments and concentrations.
to provide appropriate credit protection. Within the Rabobank
policy framework each type of collateral is addressed separately.
The main types of collateral that are recognised by Rabobank
are real estate, inventory (such as equipment, machinery, stock
etc.), commodities, receivables and guarantees. The quality
of the collateral is assessed in the initial credit request, and is
evaluated within the credit revision process. The frequency of
revaluation depends on the credit quality of the client and on
the type of collateral and is in line with the requirements set in
the CRR.
The main types of guarantors are governments, local authorities,
(central) banks and corporate entities. For institutions, insurance
undertakings and export credit agencies, a minimum rating is
required.
Credit committees and credit approvalRabobank has various levels of credit committees. Very large
loans are approved by the Central Credit Committee Rabobank
Group (CCCRG), which is chaired by the CRO. Most loans are
subject to approval by a lower level credit committee. The credit
authority amounts are periodically reviewed and are higher at
each higher level of credit committee. Entities have their own
local credit committees which are organised along the lines of
the committees at the central level. Some loans that exceed the
local authority can be approved by credit analysts on Rabobank
Credit Group level through a four- or six-eyes procedure. Their
duties and responsibilities are clearly defined in a charter. In
general, the Local Credit Committee is chaired by the general
manager, with the head of credit risk management as vice-

Pillar 3 report 2017 30
Key benefits are a more efficient credit approval process,
improved internal monitoring and reporting of credit risk.
Another important metric is the Risk Adjusted Return On Capital
(RAROC) for a transaction as part of the credit application. This
enables credit risk officers and committees to make better
informed credit decisions.
The IRB approach uses the Probability of Default (PD), Loss
Given Default (LGD), Exposure at Default (EAD) and Maturity (M)
as input for the regulatory capital formula, where:
Risk metric Abbreviation Description
Probability of Default PD (%) The likelihood that a counterparty will default within one year. This is a forward looking measure.
Loss Given Default LGD (%) The estimate of the economic loss in the situation of a default, expressed as a percentage of the Exposure at Default (EAD).
Exposure at Default EAD (EUR) The expected exposure in case a counterparty defaults.
Maturity M(t) The remaining expected maturity.
The Risk-Weighted Exposure Amount (RWA) and the Expected
Loss (EL) are calculated based on these parameters. The RC
requirements are calculated as 8% of RWA.
The differences between the actual IRB provision made for the
related exposure and the EL is adjusted for in the capital base.
The negative difference (when the EL amount is larger than
the provision amount) is defined as the Internal Ratings Based
Shortfall. According to CRR (CRD IV) rules, the shortfall amount
is deducted from the CET1 capital, AT1 capital and T2 capital.
For the deduction from the CET1 Capital a transition scheme
applies and the deduction moves from AT1 and T2 to CET1.
The shortfall amount at the end of 2017 was 950.
Off-balance sheet financial instrumentsGuarantees and standby letters of credit which Rabobank
provides to third parties in the event a client cannot fulfil its
obligations vis-à-vis these third parties, are exposed to credit
risk. Documentary and commercial letters of credit and written
undertakings by Rabobank on behalf of clients authorise third
parties to draw bills against Rabobank up to a present amount
subject to specific conditions. These transactions are secured
by the delivery of the underlying goods to which they relate.
Accordingly, the risk exposure of such an off-balance sheet
instrument is lower than that of an on-balance sheet exposure,
(e.g. a direct loan). Obligations to grant loans at specific rates
of interest during a fixed period of time are recognised under
credit granting liabilities and accounted for as such unless these
commitments do not extend beyond the period expected to
chairman. The charter also specifies the required members and
regulates the proper representation by front office and credit
risk management. Credit committee members are appointed
based on their position in the organisation, knowledge,
experience and management responsibilities. Rabobank
considers it a priority that the credit committees are comprised
of high level (senior) management representation with a
significant level of experience in the respective credit area.
The credit committees play a key role in ensuring consistency
among Rabobank standards of credit analysis, compliance with
the overall Rabobank credit policy and consistent use of the
rating models. The credit policy sets the parameters and remit
of each committee, including the maximum amount they are
allowed to approve for limits or transactions. Policies are also
in place which restrict or prohibit certain counterparty types
or industries. As a rule, all counterparty limits and internal
ratings are reviewed once a year (corporate clients) at a
minimum. Where counterparties are assigned a low loan quality
classification, they are reviewed on a more frequent basis. Credit
committees may request for more frequent reviews as well.
6.2. Credit Risk measurement
Credit Risk Measurement FrameworkInternal credit models are used to estimate PD, LGD and EAD
parameters. Rabobank uses different modelling methodologies
for the different portfolios. Ranging from statistical models to
expert-based models, and taking into account quantitative and
qualitative risk drivers. The credit risk parameters are used in the
calculation of the capital requirements.
Decisions that determine the level of credit risk accepted by
Rabobank are not only based on quantitative information or
model output. Practical and conceptual limitations of metrics
and models using a qualitative approach including expert
judgment and critical analysis are also taken into account.
After obtaining permission from the Dutch Central Bank,
Rabobank has been using the most advanced methods for
capital calculations since 1 January 2008. Rabobank applies the
Internal Ratings Based (IRB) approach for the vast majority of
its credit portfolio (including retail) to calculate its regulatory
capital requirements according to CRR (CRD IV). The IRB
approach is the most sophisticated and risk-sensitive of the CRR
(CRD IV) approaches for credit risk, allowing Rabobank to make
use of its internal rating methodologies and models. Rabobank
combines CRR (CRD IV) compliance activities with a Pillar 2
framework. The approach represents key risk components for
internal risk measurement and risk management processes.

Pillar 3 report 2017 31
Each RRR is associated with a range for the PD in basis points
and an average PD in basis points (see next table). The RRR
for a specific counterparty is determined based on internally
developed credit risk models. These models are developed by
taking into account various risk factors including the sector,
country, size of the counterparty and type of counterparty.
When using the credit risk model, specific customer information
is entered, such as general customer behaviour, customer
financial data and market data. The credit risk models are used
as a credit decision supporting tool. The outcome of the credit
risk model is used as a starting point for determining the RRR.
Model results are combined with professional judgment and
risk management (e.g. credit committee) to take into account
relevant and material information, including those aspects which
are not (sufficiently) taken into account by the credit risk model.
External agencies’ credit ratings do not imply a specific PD,
although one can observe a default frequency for each
Standard & Poor’s (S&P) grade. The observed default frequency
is a backward-looking measure of PD. By matching the observed
default frequencies of the S&P grades with the average default
probabilities of associated internal RRR, a mapping has been
obtained from the external ratings by S&P to our internal ratings
for reference purposes.
Rabobank mapping table internal and external ratings
Internal rating PD min % PD max % External Rating Equivalent
R00 - 0.00 zero-risk
R01 - 0.02 AAA
R02 0.02 0.02 AA+
R03 0.02 0.03 AA
R04 0.03 0.05 AA-
R05 0.05 0.06 A+
R06 0.06 0.09 A
R07 0.09 0.12 A-
R08 0.12 0.17 BBB+
R09 0.17 0.27 BBB
R10 0.27 0.41 BBB-
R11 0.41 0.61 BB+
R12 0.61 0.92 BB+/BB
R13 0.92 1.37 BB
R14 1.37 2.06 BB-
R15 2.06 3.09 B+
R16 3.09 4.63 B+/B
R17 4.63 6.95 B
R18 6.95 10.42 B-
R19 10.42 15.63 B-/CCC+
R20 15.63 99.99 CCC+/worse
D1 100 100 Default
D2 100 100 Default
D3 100 100 Default
D4 100 100 Default
be needed to perform appropriate underwriting, in which case
they are considered to be transactions conforming to standard
market conventions.
Rabobank is exposed to credit risk when it promises to grant
lending facilities. The size of such exposure at risk is less than
the total of the unused commitments, as promises to grant
credit facilities are made subject to the clients meeting certain
conditions that apply to loans. Rabobank monitors the term
to expiry of credit promises, as long-term commitments
are generally associated with a higher risk than short-term
commitments.
One-obligor principleFor exposures that, under Basel regulations, qualify as corporate
exposures, exposure is measured at client group level, in line
with the one-obligor principle as defined by Rabobank. The
one-obligor principle implicates that the total of the approved
exposure limit(s) of a debtor is combined with the exposure
limits of the other debtors of the same client group within all
entities. The client group of debtors includes debtors belonging
to an economic unity in which legal entities and companies are
organisationally connected, as well as majority shareholders of
that economic unity.
Concentration riskRabobank applies concentration risk mitigation on, for
example, asset classes, sector and country level. For its asset
classes Rabobank has determined a risk appetite, expressed
in exposure, percentage of defaults and loan impairment
charges. Furthermore, exposure limits are set on a sector and
country level as well. Single name concentrations are limited on
exposure and loss at default (LAD) and are monitored closely.
Risk classification and internal rating systemAn important element in the risk analysis for credit applications
is the classification of the credit risk by assigning an internal
rating to each credit counterparty. This is a borrower rating
reflecting the likelihood of a counterparty becoming unable to
repay the loan or to fulfil other debt obligations to Rabobank.
Together with the introduction of the Basel II framework,
Rabobank developed the Rabobank Risk Rating (RRR) master
scale, comprising 21 performing ratings (R0-R20) and 4 default
ratings (D1-D4). The performing ratings correspond with the PD
of the client. The D1-D4 ratings represent default classifications.
D1 represents a minimum of 90 days of arrears, D2 a high
probability that the debtor is unlikely to pay, D3 that the debtor
is unable to meet its obligations and foreclosure is required,
and D4 is the status of bankruptcy. In accordance with this
approach, all D-ratings constitute the total defaulted exposure.

Pillar 3 report 2017 32
According to the ‘three lines of defence’ model Audit Rabobank
operates as the third line of defence within Rabobank Group.
The scope of work of Audit Rabobank is to:
• Provide independent assurance, advice and insights to
the Managing Board, the Supervisory Board and other
senior management of Rabobank Group on the quality and
effectiveness of the Group’s internal control, risk management
and governance systems and processes (including models),
thereby helping the boards and management protect the
organisation and its reputation.
• Provide, for internal purposes only and to be relied upon by
the external auditor, independent assurance on selected data
included in financial statements, the In Control Statement,
Integrated Report and KPI’s, regulatory reporting and the
credit provisions (financial audits).
Future Model LandscapeRabobank is undergoing an exercise to improve its Credit Risk
model landscape beyond the credit lifecycle improvements
coming from frequent monitoring and back testing. The
improvement of the Credit Model Landscape will address the
existing IRB models and make it possible that the Credit models
are in line with recently published regulatory requirements
(such as the TRIM guide) and the models will be enhanced to
serve the business more effectively contributing the strategical
objectives of Rabobank.
In 2017 Rabobank has redeveloped the Dutch retail models
and also improved its underlying credit model processes and
governance to enhance the model landscape in preparation for
the TRIM exercise. The following goals have been reached:
• The model Life Cycle has been redefined covering the end-
to-end model development process.
• Two major IRB models have been rebuilt and internally
validated (Residential Mortgages and SME Retail covering
50% of the portfolio with a considerable improvement in
predictive power and business use)
• All IFRS 9 models have been completed to allow advanced
calculations of provisioning. All adjustment have been made
on the basis of the new IRB models.
• Preparations have started to allow more IRB model
development during next years.
The IRB portfolio’s average RRR is around R12 (PD between
0.61% and 0.92%). For 3% of the portfolio (based on gross
carrying values), the commitments are not fully met. If such a
situation is expected an adequate allowance will be formed for
this part of the portfolio.
The IRB models calculate a client PD, which is subsequently
mapped to the RRR. For the IRB advanced portfolio, each
entity/type of credit facility has its own LGD models, which
are based upon the Rabobank LGD principles. Estimates for PD
and LGD, together with the exposure value (EAD), feed into the
calculation of EL and unexpected loss (UL). The latter is used to
determine regulatory and economic capital requirements.
Quality assurance credit risk modelsModel governanceThe Model Governance Committee (MGC) has the responsibility
to sign-off on credit risk models before implementation (for
De Lage Landen (DLL) a separate arrangement on model
validations is in place). Before MGC sign-off is requested, all
models are validated by an independent Model Validation team.
Implemented models are reviewed on at least an annual basis
including back testing of predictions against realizations.
The Model Validation team assesses model performance
annually, based on statistical review complemented with
an in-depth analysis of model risks arising from changes in
model internal and external changes. For example, there can
be relevant changes in internal model usage, business model,
changes in external regulations and market conditions. This
periodic validation aims to assess the quality of the model in
terms of prudence, methodology, validity of key assumptions,
fit-for-purpose and compliance. The overall conclusions on
performance of the models are reported to the MGC with a
recommendation to either extend the usage of the model, or to
redevelop the model if necessary. If models are tested as non-
prudent, the MGC is informed and decides on an appropriate
capital add-on until the model is recalibrated to a prudent level.
Besides these internally reviewed risk models, there are some
risk models that are periodically reviewed by external parties
under supervision of the Model Validation team. Assumptions
used in our models are not disclosed as these are considered
proprietary.

Pillar 3 report 2017 33
The table below gives an overview of the most important models by exposure class, including a model description and methodology.
Asset Class ModelNumber of important Models
Calibration data Model description and methodology
Sovereigns (CGCB) PD 1 > 7 years An expert-based developed model, supported by benchmarks and internal data using economic structure, economic policy, liquidity position and foreign debt as key risk drivers.
LGD 1 > 7 years An expert-based developed model, supported by benchmarks and internal data using ability to pay, debtors view on foreign private creditors, negotiating power as key risk drivers.
EAD 1 > 7 years An expert-based developed model, supported by benchmarks and internal data using product type as key risk driver.
Public Sector Entitities
PD 1 > 7 years An expert-based developed model. A notching methodology is used with the Sovereign rating as a starting point. It includes based on PSE type, support government, economic fundamentals, politics and governance, debt structure and burden, ability to raise taxes as key risk drivers.
LGD 1 > 7 years An expert-based developed model, using collateral type, product type as key risk drivers.
EAD 1 > 7 years An expert-based developed model differentiated by facility type.
Financial Institutions PD 1 > 7 years An expert-based developed model, supported by benchmarks, own default estimates on external rating data and internal data. The model is using country risk, financial and business risk drivers and warning signals as key risk drivers.
LGD 1 > 7 years An expert-based developed model, supported by benchmarks and internal data using Seniority, secured/unsecured, legal position in debtors country, strength, industry performance/type, macro-economic performance as key risk drivers.
EAD 1 > 7 years An expert-based developed model, supported by benchmarks and internal data using product type as key risk driver.
Corporate - SME PD 7 > 7 years Statistical developed models, scorecard methodology, using financial risk ratios and business risk drivers, warning signals as key risk drivers.
LGD 4 > 7 years Expert-based developed models, supported by internal data using Collateral type, (local) legal framework, UCP and unpledged assets as key risk drivers.
EAD 4 > 7 years Statistical and expert-based developed models using facility types, business type and region as key risk drivers for the CCFs.
Corporate - Other PD 1 > 7 years An expert-based developed model, supported by benchmarks and internal data using financial risk and business risk drivers, warning signals as key risk drivers.
LGD 1 > 7 years An expert-based developed model, supported by benchmarks and internal data using collateral type, (local) legal framework, UCP and unpledged assets as key risk drivers.
EAD 1 > 7 years Statistical and expert based developed models using facility types, business type and region as key risk drivers for the CCFs.
Corporate - SL PD 3 > 7 years An expert-based developed model, supported by internal data using Risk drivers specific for project finance, IPRE and Trade Finance as key risk drivers.
LGD 2 > 7 years An expert-based developed model, supported by internal data using an extension with specific risk factors for specialized lending.
EAD 2 > 7 years An expert-based developed model, supported by benchmarks and internal data using specific conversion factors per type of specialized lending.
Residential Real Estate
PD 1 > 7 years A statistical developed model, supported by benchmarks and internal data using business entity, loan-to-income, Loan-to-value, seasoning, credit records, product types as key risk drivers.
LGD 1 > 7 years A statistical developed model, supported by benchmarks and internal data using business entity, loan-to-value, product types as key risk drivers.
EAD 1 > 7 years A statistical developed model, supported by benchmarks and internal data using business entity and product type as key risk drivers.
Retail - Other (SME and non-SME)
PD 2 > 7 years Statistical developed models, using financial risk and business risk drivers, warning signals, and transaction characteristics as key risk drivers.
LGD 2 > 7 years Statistical developed models, using loan-to-value, business line, facility type, seasoning as key risk drivers.
EAD 2 > 7 years Statistical developed models, using business line, facility type as key risk drivers.
Other Models for leasing, purchased receivables, structured finance and transfer event risk.
Credit risk reportingCredit risk reporting is based on the product administration
systems and the rating systems, which hold PD, LGD and EAD
information. Risk reporting is reconciled with financial reporting
data both at entity and Group level. Risk Management compiles
a Credit Quarterly Rabobank (CQR) report on the developments
in the credit portfolio, which is distributed among senior
management. Key risk indicators in this quarterly credit risk
report such as PD, EAD, LGD, EC and EL, are used to monitor
developments within the portfolio. Furthermore, trends in
loan impairment charges, loan impairment allowances, non-
performing loans, and number and amount of exposures are
analysed by Financial Restructuring & Recovery (FR&R). Another
important periodic report is the quarterly loan impairment report.
Risk Management Credit (RM Credit) provides insight into the
risk in order to make it possible for Rabobank to optimise the
balance between credit risk, capital usage and returns. RM
Credit is a centre of competence for all credit activities in which
risk-return considerations play a role. FR&R has a specific focus
on the substandard and non-performing part of the portfolio.

Pillar 3 report 2017 34
Template 7: EU CRB-B – Total and average net amount of exposures
Net value of exposures at the
end of the period
Average net exposures over
the period
1 Central governments or central banks 93,371 100,523
2 Institutions 20,140 23,253
3 Corporates 207,507 217,517
4 Of which: Specialised lending 22,901 23,530
5 Of which: SMEs 72,900 73,888
6 Retail 249,963 252,091
7 Secured by real estate property 219,221 221,412
8 SMEs 20,727 20,751
9 Non-SMEs 198,493 200,661
10 Qualifying revolving - -
11 Other retail 30,742 30,751
12 SMEs 25,496 25,496
13 Non-SMEs 5,246 5,254
14 Equity 3,724 3,874
15 Total IRB approach 574,704 597,259
16 Central governments or central banks 2,415 2,596
17 Regional governments or local authorities
- -
18 Public sector entities - -
19 Multilateral development banks - -
20 International organisations - -
21 Institutions 1,350 1,380
22 Corporates 11,060 11,820
23 Of which: SMEs 2,758 2,834
24 Retail 5,910 6,430
25 Of which: SMEs 4,483 4,732
26 Secured by mortgages on immovable property
5,411 5,596
27 Of which: SMEs 1,887 3,257
28 Exposures in default 1,225 1,178
29 Items associated with particularly high risk
19 29
30 Covered bonds - -
31 Claims on institutions and corporates with a short-term credit assessment
- -
32 Collective investments undertakings - -
33 Equity exposures - -
34 Other exposures - -
35 Total standardised approach 27,390 29,028
36 Total 602,094 626,286
Narrative template 7: The main movement in on-balance
exposure in 2017 is a 65 billion reduction in IRB exposure,
mainly in Corporates (minus 30 billion) and Central
Governments & Central Banks (minus 20 billion). Part of this
reduction is related to methodological refinements as of mid-
2017. Also the strong Euro has had an effect on the portfolio
size.
(Template 21 will be supplied as an appendix)
Narrative template 21: Rabobank does not use credit derivatives
to hedge under the credit risk framework, therefore there is no
effect on RWAs.
IRB and Standardised Approach exposuresThe policy of Rabobank is aimed at applying the IRB approach
for its credit portfolio as much as possible. A few exceptions
can be made to this policy. The criteria used to assess when the
IRB approach does not need to be applied for a credit portfolio
are included in the ‘Global standard on partial use of the
Standardised Approach’. In this policy document a distinction is
made between portfolios on which the Standardised Approach
(SA) is permanently applied - as they are immaterial in size and
risk - and portfolios for which SA is temporarily applied. Within
the portfolios for which SA is permanently applied, a distinction
is made between portfolios for which the credit risk is nil or very
limited (e.g. some central governments) and portfolios falling
under discretionary approval of DNB for using the SA, for which
specific limits are prescribed.
6.2.1. Credit portfolioWeighted on gross carrying values Rabobank is IRB compliant
for 96% of its credit portfolio exposures (this includes a limited
exposure on IRB foundation). A full 100% IRB coverage will
never be reached, since the SA has been chosen for some
portfolios as described in the previous paragraph. In general
the IRB coverage is particularly high for the portfolios in the
Netherlands and in the wholesale portfolios outside the
Netherlands. Some parts of the international retail portfolios
abroad are under SA. As of 31 December 2017, in terms of EAD
Rabobank has the following exposures per approach: AIRB 550.1
billion, FIRB 4.9 billion and SA 22.6 billion.
The following templates provide an overview of Rabobank’s IRB
exposures in terms of carrying amounts and EAD. Furthermore,
in some templates the risk-weighted exposure amount, the PD,
the LGD and the exposure-weighted average risk weight are
shown.

Pillar 3 report 2017 35
Template 5: EU CR10 – IRB (specialised lending and equities)
Specialised lending
Regulatory categories Remaining maturityOn- balance-
sheet amountOff-balance-
sheet amount Risk weightExposure
amount RWAsExpected
losses
Category 1 Less than 2.5 years 50%
Equal to or more than 2.5 years 70%
Category 2 Less than 2.5 years 70%
Equal to or more than 2.5 years 90%
Category 3 Less than 2.5 years 115%
Equal to or more than 2.5 years 115%
Category 4 Less than 2.5 years 250%
Equal to or more than 2.5 years 250%
Category 5 Less than 2.5 years -
Equal to or more than 2.5 years -
Total Less than 2.5 years
Equal to or more than 2.5 years
Equities under the simple risk-weighted approach
CategoriesOn- balance-
sheet amountOff-balance-
sheet amount Risk weightExposure
amount RWAsCapital
requirements
Exchange-traded equity exposures 743 - 190% 743 1,413 113
Private equity exposures 109 - 290% 109 315 25
Other equity exposures 704 - 370% 704 2,607 209
Total 1,557 - 1,557 4,334 347
Narrative template 5: The first part of the template is reported
empty as Rabobank is not calculating its own funds requirements
for specialized lending according to the slotting approach, but
applies the LGD/PD approach in accordance with Art 153 (5) CRR.
Template 23: EU CR8 – RWA flow statements of credit risk exposures under the IRB approach
RWA amounts Capital requirements
1 RWAs as at the end of the previous reporting period
2 Asset size
3 Asset quality
4 Model updates
5 Methodology and policy
6 Acquisitions and disposals
7 Foreign exchange movements
8 Other
9 RWAs as at the end of the reporting period 122,809 9,825
Narrative template 23: As of 31 December 2017, Rabobank
reports for the first time in the new EBA template format.
As a result only the RWA amounts and capital requirements
as of 31 December 2017 are reported.

Pillar 3 report 2017 36
Weighted average PD and LGD IRB Advanced and IRB Foundation
Country Weighted average PD Weighted average LGD
IRB Advanced The Netherlands 4.0% 23.2%
Other European countries 2.1% 29.5%
North America 2.7% 27.2%
Latin America 9.2% 28.1%
Asia 6.5% 29.3%
Australia 2.7% 15.5%
Other 1.3% 1.7%
Total 3.8% 23.8%
IRB Foundation The Netherlands 0.2% 45.0%
Other European countries 4.8% 43.8%
North America 0.2% 45.0%
Latin America 1.0% 45.0%
Asia 1.2% 45.2%
Australia 0.1% 45.0%
Other 5.7% 45.0%
Total 2.0% 45.0%
Grand Total 3.7% 24.0%
In this template the category ‘other’ includes exposures
that are not labeled with a ‘country of risk’ (e.g. multilateral
organizations).
Template 24: Rabobank performs its backtesting on a model
level. This methodology deviates from the specifications of
template 24 which requires an analysis by exposure class.
As a result, the 2017 data for EBA template 24 is not available.
Rabobank has already started to make modifications in the
reporting process in order to report template 24 including an
analysis by exposure class in future Pillar 3 reports.
The following templates provide an overview of Rabobank’s
Standardised Approach exposures.
Template 19: EU CR4 – Standardised approach – Credit risk exposure and CRM effects
Exposures before CCF and CRM Exposures post CCF and CRM RWAs and RWA density
Exposure classesOn-balance-sheet
amountOff-balance-sheet
amountOn-balance-sheet
amountOff-balance-sheet
amount RWAs RWA density
1 Central governments or central banks 2,415 - 2,783 - 4,099 147%
2 Institutions 1,350 - 1,350 - 351 26%
3 Corporates 6,613 4,447 6,613 581 7,099 99%
4 Retail 4,987 924 4,987 287 3,704 70%
5 Secured by mortgages on immovable property 4,919 492 4,550 234 2,068 43%
6 Exposures in default 1,224 1 1,224 1 1,398 114%
7 Higher-risk categories 19 - 19 - 29 150%
8 Total 21,526 5,864 21,526 1,103 18,748 83%
Narrative template 19: In 2017 a 2.9 billion rise in on-balance
exposure for which the Standardised Approach is applied was
observed, mainly in the exposure classes Corporates, Retail and
Secured by mortgages on immovable property.

Pillar 3 report 2017 37
With respect to exposures weighted applying the Standardised
Approach that are rated, Rabobank uses the following External
Credit Assessment Institutions (ECAIs): Standard & Poor’s and
Moody’s. Both External Credit Assessment Institutions are used
for the exposure classes Central Governments & Central Banks,
and Institutions. Futhermore, for securitizations the External
Credit Assessment Institution Fitch is used (securitizations are
not in scope for template 20).
Template 20: EU CR5 – Standardised approach
Risk weight
TotalOf which unratedExposure classes 0% 2% 4% 10% 20% 35% 50% 70% 75% 100% 150% 250% 370% 1250% Others Deducted
1 Central governments or central banks
1,056 - - - 51 - 48 - - 4 - 1,624 - - - - 2,783 1,624
2 Regional governments or local authorities
- - - - - - - - - - - - - - - - - -
3 Public sector entities
- - - - - - - - - - - - - - - - - -
4 Multilateral development banks
- - - - - - - - - - - - - - - - - -
5 International organisations
- - - - - - - - - - - - - - - - - -
6 Institutions - - - - 1,151 - 156 - - 43 - - - - - - 1,350 1,247
7 Corporates - - - - - - - - - 7,194 - - - - - - 7,194 7,194
8 Retail - - - - - - - - 5,274 - - - - - - - 5,274 5,274
9 Secured by mortgages on immovable property
- - - - - 3,350 829 - - 605 - - - - - - 4,784 4,784
10 Exposures in default
- - - - - - - - - 877 347 - - - - - 1,224 1,224
11 Higher-risk categories
- - - - - - - - - - 19 - - - - - 19 19
12 Covered bonds - - - - - - - - - - - - - - - - - -
13 Institutions and corporates with a short-term credit assessment
- - - - - - - - - - - - - - - - - -
14 Collective investment undertakings
- - - - - - - - - - - - - - - - - -
15 Equity - - - - - - - - - - - - - - - - - -
16 Other items - - - - - - - - - - - - - - - - - -
17 Total 1,056 - - - 1,202 3,350 1,034 - 5,274 8,723 366 1,624 - - - - 22,629 21,367
Narrative template 20: The rise in Standardised Approach
exposure is mainly related to the exposure class Secured by
mortgages on immovable property, which translates in a rise
in risk weight categories 35% and 50%. Furthermore, a rise
in exposure on Institutions led to a further rise in risk weight
category 50%.

Pillar 3 report 2017 38
The following templates provide an overview of Rabobank’s IRB
and Standardised Approach exposures showing more detail on
the geographical, maturity and counterparty type breakdown.
Geographical breakdown of exposures
Template 8: EU CRB-C – Geographical breakdown of exposures
Net value
The Netherlands Other EU
North America Latin America Asia Australia
Other Countries Total
1 Central governments or central banks 67,672 14,129 8,609 329 953 1,536 143 93,371
2 Institutions 12,019 2,056 2,243 161 3,184 58 419 20,140
3 Corporates 93,856 24,294 45,612 7,941 10,866 24,596 342 207,507
4 Retail 231,844 7,217 9,067 1,053 - 781 - 249,963
5 Equity 2,963 227 221 201 92 - 20 3,724
6 Total IRB approach 408,354 47,923 65,752 9,684 15,095 26,972 924 574,704
7 Central governments or central banks 1,746 29 345 2 115 178 - 2,415
8 Regional governments or local authorities
- - - - - - - -
9 Public sector entities - - - - - - - -
10 Multilateral development banks - - - - - - - -
11 International organisations - - - - - - - -
12 Institutions 16 112 246 85 35 856 - 1,350
13 Corporates 1,418 2,968 2,639 3,480 321 235 - 11,060
14 Retail 1,968 2,035 444 192 754 517 - 5,910
15 Secured by mortgages on immovable property
3,364 300 1,624 - - 123 - 5,411
16 Exposures in default 208 519 36 425 35 2 - 1,225
17 Items associated with particularly high risk
- 19 - - - - - 19
18 Covered bonds - - - - - - - -
19 Claims on institutions and corporates with a short-term credit assessment
- - - - - - - -
20 Collective investments undertakings - - - - - - - -
21 Equity exposures - - - - - - - -
22 Other exposures - - - - - - - -
23 Total standardised approach 8,719 5,981 5,334 4,184 1,260 1,911 1 27,390
24 Total 417,074 53,905 71,086 13,868 16,354 28,883 925 602,094
Narrative template 8: Compared to end of 2016 the main
movements were a decrease in IRB exposure in Asia and a rise in
SA exposure in The Netherlands.
The countries on which Rabobank has exposure and that are
mapped to ‘Other Countries’ are Aruba, Curacao, Guernsey,
Isle of Man, Jersey, Cayman Islands, Macau, St. Pierre and
Miquelon, Serbia, St. Maarten, Trinidad and Tobago, British Virgin
Islands, Western Samoa, Bermuda, BES-islands and Bahamas.
Furthermore, due to the limited exposure the region Africa is
reported in the column ‘other’.
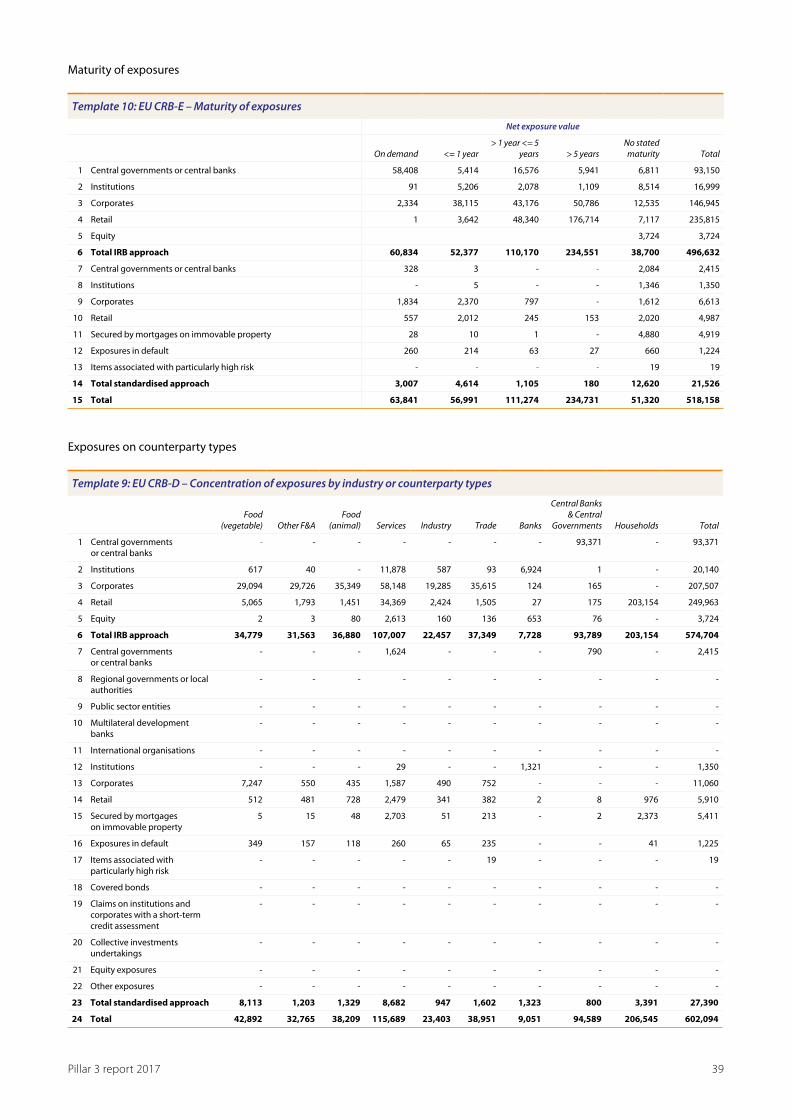
Pillar 3 report 2017 39
Maturity of exposures
Template 10: EU CRB-E – Maturity of exposures
Net exposure value
On demand <= 1 year> 1 year <= 5
years > 5 yearsNo stated maturity Total
1 Central governments or central banks 58,408 5,414 16,576 5,941 6,811 93,150
2 Institutions 91 5,206 2,078 1,109 8,514 16,999
3 Corporates 2,334 38,115 43,176 50,786 12,535 146,945
4 Retail 1 3,642 48,340 176,714 7,117 235,815
5 Equity 3,724 3,724
6 Total IRB approach 60,834 52,377 110,170 234,551 38,700 496,632
7 Central governments or central banks 328 3 - - 2,084 2,415
8 Institutions - 5 - - 1,346 1,350
9 Corporates 1,834 2,370 797 - 1,612 6,613
10 Retail 557 2,012 245 153 2,020 4,987
11 Secured by mortgages on immovable property 28 10 1 - 4,880 4,919
12 Exposures in default 260 214 63 27 660 1,224
13 Items associated with particularly high risk - - - - 19 19
14 Total standardised approach 3,007 4,614 1,105 180 12,620 21,526
15 Total 63,841 56,991 111,274 234,731 51,320 518,158
Exposures on counterparty types
Template 9: EU CRB-D – Concentration of exposures by industry or counterparty types
Food (vegetable) Other F&A
Food (animal) Services Industry Trade Banks
Central Banks & Central
Governments Households Total
1 Central governments or central banks
- - - - - - - 93,371 - 93,371
2 Institutions 617 40 - 11,878 587 93 6,924 1 - 20,140
3 Corporates 29,094 29,726 35,349 58,148 19,285 35,615 124 165 - 207,507
4 Retail 5,065 1,793 1,451 34,369 2,424 1,505 27 175 203,154 249,963
5 Equity 2 3 80 2,613 160 136 653 76 - 3,724
6 Total IRB approach 34,779 31,563 36,880 107,007 22,457 37,349 7,728 93,789 203,154 574,704
7 Central governments or central banks
- - - 1,624 - - - 790 - 2,415
8 Regional governments or local authorities
- - - - - - - - - -
9 Public sector entities - - - - - - - - - -
10 Multilateral development banks
- - - - - - - - - -
11 International organisations - - - - - - - - - -
12 Institutions - - - 29 - - 1,321 - - 1,350
13 Corporates 7,247 550 435 1,587 490 752 - - - 11,060
14 Retail 512 481 728 2,479 341 382 2 8 976 5,910
15 Secured by mortgages on immovable property
5 15 48 2,703 51 213 - 2 2,373 5,411
16 Exposures in default 349 157 118 260 65 235 - - 41 1,225
17 Items associated with particularly high risk
- - - - - 19 - - - 19
18 Covered bonds - - - - - - - - - -
19 Claims on institutions and corporates with a short-term credit assessment
- - - - - - - - - -
20 Collective investments undertakings
- - - - - - - - - -
21 Equity exposures - - - - - - - - - -
22 Other exposures - - - - - - - - - -
23 Total standardised approach 8,113 1,203 1,329 8,682 947 1,602 1,323 800 3,391 27,390
24 Total 42,892 32,765 38,209 115,689 23,403 38,951 9,051 94,589 206,545 602,094

Pillar 3 report 2017 40
Narrative template 9: The decrease in the portfolio during
2017 is mainly related to the sectors Governments, Trade
and Services, and to a lesser degree to Other F&A and
Food (vegetables).
Template 18: EU CR3 – CRM techniques – Overview
Exposures unsecured – Carrying amount
Exposures secured
Exposures secured by collateral
Exposures secured by financial guarantees
Exposures secured by credit derivatives
1 Total loans 162,141 322,543 307,268 15,275
2 Total debt securities 28,304 1,446 1,350 97
3 Total exposures 190,445 323,989 308,618 15,371
4 Of which defaulted 4,758 7,832 7,428 404
6.2.2. Troubled debtPast due, non-performing loans, impairments and loan impairment allowancesFor the purpose of reporting, Rabobank distinguishes several
types of troubled loans, like for example:
• Past due loans: Interest, repayments or overdrafts on a loan
have been due for payment for more than one day.
• Non-performing loans: Loans that at least satisfy one of the
following criteria. Material exposures which are more than
90 days past due or the debtor is assessed as unlikely to pay
its credit obligations in full without realisation of collateral,
regardless of the existence of any past due amount or the
number of days past due.
• Impaired loans: Loans that at least satisfy one of the following
criteria. Material exposures which are more than 90 days
past due or the debtor is assessed as unlikely to pay its credit
obligations in full without realisation of collateral, regardless
of the existence of any past due amount or the number
of days past due. Within the Rabobank portfolio past-due
exposures of more than 90 days that are not considered
impaired can occur when these exposures are not material.
NB: Within Rabobank, the Basel II default definitions are used for
identifying a loan impairment allowance. However, exit criteria for
forborne non-performing exposure are stricter than for impaired
exposure. Furthermore, recovered forborne non-performing
exposure is bound by more rigorous inflow criteria and can be
labelled as non-performing exposure once more, even if the
impaired criteria are not being met. The new Definition of
Default (DoD) according to EBA guidelines, published in 2016,
has been implemented in December 2017. This definition also
includes the strict exit criteria for forborne defaulted exposure.
Cured (returned to performing): A facility is returned to performing
(cured) when all exit criteria for non-performing are met.
Restructured exposure: A distressed sale or a distressed
restructuring has occurred that likely results into a credit-related
economic loss, for example involving remission, subordination
or postponement of principal, interest or fee (re-)payments.
Loan impairment allowancesAfter a loan has been granted, continuous credit management
takes place. New financial and non-financial information is
assessed. The bank ascertains whether the client complies
with the agreement made and whether it can be expected
that this will be the case in the future. If this is expected not
to be the case, credit management is stepped up, monitoring
becomes more frequent, and a closer eye is kept on credit
terms. Guidance is provided by a special department for larger
and more complex loans: Financial Restructuring & Recovery
(FR&R). If it is likely that a debtor will be unable to pay the
amounts owed to Rabobank in accordance with the contractual
obligations, this will give rise to an impairment (impaired loan).
If necessary, an allowance is formed that is charged to income.
The loan impairment allowance consists of three components:
• Specific allowance: For individual impaired loans a specific
allowance is determined. The size of the specific allowance
is the difference between the carrying amount and the
recoverable amount, which is the present value of the
expected cash flows, including amounts recoverable under
guarantees, collateral and unencumbered assets, discounted
at the original effective interest rate of the loans. If a loan is
not collectible it is written-off from the allowance. Specific
provisioning for every change that impacts the P&L by 7.5 or
more is dealt with by the Loan Loss Provisioning Committee.
• Collective allowance: In addition to the assessment of
individual loans, for retail exposures a collective assessment
is made if it is not economically justified to recognize the
loss on an individual basis. In these cases the collective
assessment is made based on homogenous groups of loans
with a similar risk profile with the purpose of identifying the
need to recognise a loan impairment allowance.
• IBNR (Incurred But Not Reported): For exposures in the
portfolio that are impaired, but not yet recognized as such a
general allowance is taken. This allowance is taken because
there is always a mismatch period between an event causing

Pillar 3 report 2017 41
Expected Loss data for provisioningExpected Loss is a key risk component for determining the
bank’s general and collective allowances. EL parameters are
used to determine general and collective allowances, adjusted
in conformity with IFRS rules. The outcome is benchmarked
with an alternative methodology, which uses historical
provisioning data.
Credit quality of exposures
* In the CRR definition all Rabobank loan impairment charges
are labelled specific.
a default of a client and the moment the bank becomes
aware of the default. The allowance will be determined based
on Expected Loss (EL) data resulting from the Economic
Capital models.
Specific and collective loan losses for the period comprise
actual losses on loans minus recoveries. Recoveries regard
written-back amounts from actual losses in previous years.
Template 11: EU CR1-A – Credit quality of exposures by exposure class and instrument
Gross carrying values of
Defaulted exposures
Non-defaulted exposures
Specific credit risk
adjustment
General credit risk
adjustmentAccumulated
write-offs
Credit risk adjustment charges
of the period*Net values(a+b-c-d)
1 Central governments or central banks - 93,372 (1) - (4) 93,371
2 Institutions 481 19,724 (65) - (1) 20,140
3 Corporates 11,826 198,690 (3,010) - (776) 207,507
4 Of which: Specialised lending 2,600 21,087 (785) - (207) 22,901
5 Of which: SMEs 5,785 68,438 (1,323) - (282) 72,900
6 Retail 3,151 247,899 (1,088) - (424) 249,963
7 Secured by real estate property 2,188 217,531 (498) - (111) 219,221
8 SMEs 1,310 19,746 (329) - (34) 20,727
9 Non-SMEs 878 197,785 (169) - (77) 198,493
10 Qualifying revolving - - - - - -
11 Other retail 963 30,368 (589) - (313) 30,742
12 SMEs 878 25,150 (531) - (300) 25,496
13 Non-SMEs 85 5,219 (58) - (13) 5,246
14 Equity - 3,724 - - - 3,724
15 Total IRB approach 15,458 563,410 (4,164) - (1,206) 574,704
16 Central governments or central banks - 2,415 - - - 2,415
17 Regional governments or local authorities - - - - - -
18 Public sector entities - - - - - -
19 Multilateral development banks - - - - - -
20 International organisations - - - - - -
21 Institutions - 1,350 - - - 1,350
22 Corporates 1,756 11,082 (1,018) - (595) 11,820
23 Of which: SMEs 4 2,765 (8) - (1) 2,761
24 Retail 747 5,937 (308) - (213) 6,375
25 Of which: SMEs 168 4,505 (64) - - 4,609
26 Secured by mortgages on immovable property - 5,411 - - - 5,411
27 Of which: SMEs - 1,887 - - - 1,887
28 Exposures in default 2,503 - (1,278) - (806) 1,225
29 Items associated with particularly high risk - 19 - - - 19
30 Covered bonds - - - - - -
31 Claims on institutions and corporates with a short-term credit assessment
- - - - - -
32 Collective investments undertakings - - - - - -
33 Equity exposures - - - - - -
34 Other exposures - - - - - -
35 Total standardised approach 2,503 26,214 (1,326) - (807) 27,390
36 Total 17,961 589,623 (5,490) - (2,013) (190) 602,094
37 Of which: Loans 17,481 472,490 (5,287) - (1,997) 484,684
38 Of which: Debt securities 29,750 - 29,750
39 Of which: Off- balance-sheet exposures 480 83,659 (204) - (16) 83,936

Pillar 3 report 2017 42
Narrative template 11: In 2017 defaulted exposure rose due
to 17,961. Specific credit risk adjustments amounted to minus
190 in 2017, compared to plus 310 in 2016. This is mainly due
to the ongoing favorable economic conditions in our domestic
market. Furthermore, the specific credit risk adjustment
decreased from 7.5 billion to 5.5 billion in the course of 2017
due to 2 billion in write-offs.
Template 12: EU CR1-B – Credit quality of exposures by industry or counterparty types
Gross carrying values of
Defaulted exposures
Non-defaulted exposures
Specific credit risk adjustment
General credit risk adjustment
Accumulated write-offs
Credit risk adjustment charges
Net values(a +b-c-d)
1 Food (animal) 2,930 35,530 (251) (18) 38,209
2 Food (vegetable) 1,797 41,445 (350) (9) 42,892
3 Industry 897 22,943 (437) (87) 23,403
4 Other F&A 816 32,240 (291) (15) 32,765
5 Services 6,845 111,322 (2,478) (1,208) 115,689
6 Governments & Central Banks 1 94,591 (3) (4) 94,589
7 Banks 27 9,047 (23) (1) 9,051
8 Households 1,007 205,770 (232) (7) 206,545
9 Trade 3,641 36,735 (1,425) (664) 38,951
10 Total 17,961 589,623 (5,490) (2,013) (190) 602,094
Narrative template 12: Improvements in specific credit risk
adjustments were observed within Services (a.o. healthcare
& social assistance, scientific & technical services and
transportation) and Trade (a.o. real estate financing and
retail trade).
Template 13: EU CR1-C – Credit quality of exposures by geography
Gross carrying values of
Defaulted exposures
Non-defaulted exposures
Specific credit risk adjustment
General credit risk adjustment
Accumulated write-offs
Credit risk adjustment charges
Net values(a+ b -c-d)
1 The Netherlands 12,818 407,664 (3,408) - (895) 417,074
2 Other EU 2,108 53,062 (1,265) - (894) 53,905
3 North America 830 70,450 (195) - (101) 71,086
4 Latin America 1,108 13,021 (261) - (49) 13,868
5 Asia 559 16,063 (268) - (34) 16,354
6 Australia 520 28,456 (93) - (40) 28,883
7 Other countries 18 908 (1) - - 925
8 Total 17,961 589,623 (5,490) - (2,013) (190) 602,094
Narrative template 13: Growth in the Dutch and overall
European economy improved the portfolios in The Netherlands,
but also in European Union countries outside The Netherlands.
Specific credit risk adjustments decreased.

Pillar 3 report 2017 43
Template 17: EU CR2-B – Changes in the stock of defaulted and impaired loans and debt securities
Gross carrying value defaulted
exposures
1 Opening balance
2 Loans and debt securities that have defaulted or impaired since the last reporting period
3 Returned to non-defaulted status
4 Amounts written off
5 Other changes
6 Closing balance 17,961
Narrative template 17: As of 31 December 2017, Rabobank reports
for the first time in the new EBA template format. As a result only
the defaulted exposure as of 31 December 2017 is reported.
6.2.3. ForbearanceThe forbearance portfolio consists of Rabobank customers
for whom forbearance measures have been put in place,
which comprises of concessions to debtors facing or about
to face difficulties in meeting their financial commitments.
A concession refers to either of the following measures:
• Modification of the previous terms and conditions of a
contract for which the debtor is considered unable to comply
with due to its financial difficulties (i.e. troubled debt) to allow
for sufficient debt service ability that would not have been
granted had the debtor not been in financial difficulties.
• Total or partial refinancing of a troubled loan contract that
would not have been granted if the debtor had not been in
financial difficulties.
Examples include postponements of repayments and
extensions of the term of a facility. The rationale for the focus
on this portfolio derives from the concerns of the European
supervisory authorities about the deterioration of the quality
of the portfolio during the crisis; it was feared that forbearance
measures might camouflage this deterioration of the portfolio
as debtors are able to meet their financial obligations for longer
periods as a result of the concessions.
The identification of forbearance measures for the corporate
portfolio is based on the current Loan Quality Classification (LQC)
framework. This Rabobank framework divides the loan portfolio
into the categories: Good, OLEM, Substandard, Doubtful and Loss.
Template 14: EU CR1-D – Ageing of past-due exposures
Gross carrying values
≤ 30 days > 30 days ≤ 60 days > 60 days ≤ 90 days > 90 days ≤ 180 days > 180 days ≤ 1 year > 1 year
1 Loans 3,797 710 945 683 1,022 2,881
2 Debt securities - - - - - -
3 Total exposures 3,797 710 945 683 1,022 2,881
Narrative template 14: The overall improvement in the quality of
the portfolio resulted in a shift towards the maturity categories
of 90 days and below.
* In the CRR definition all Rabobank loan impairment charges
are labelled specific.
Template 16: EU CR2-A – Changes in the stock of general and specific credit risk adjustments
Accumulated specific credit
risk adjustment
Accumulated general
credit risk adjustment*
1 Opening balance 7,542
2 Increases due to amounts set aside for estimated loan losses during the period
1,549
3 Decreases due to amounts reversed for estimated loan losses during the period
(1,587)
4 Decreases due to amounts taken against accumulated credit risk adjustments
(2,014)
5 Transfers between credit risk adjustments -
6 Impact of exchange rate differences (114)
7 Business combinations, including acquisitions and disposals of subsidiaries
-
8 Other adjustments 115
9 Closing balance 5,490
10 Recoveries on credit risk adjustments recorded directly to the statement of profit or loss
(152)
11 Specific credit risk adjustments directly recorded to the statement of profit or loss
Not applicable for Rabobank
The loan impairment charges are formed by the net addition
(1,549 minus 1,587 ) minus recoveries after write-offs (152 ), and
amounted to minus 190.
At minus 190, loan impairment charges actually contributed to
operating profit, which is atypical. In 2016 an amount of 310 was
charged to the income statement, which was already a year with
very low loan impairment charges. Improvements were
observed in nearly all business segments. This is mainly due to
the ongoing favourable economic conditions in our domestic
market, leading to limited additions and high releases of existing
loan loss allowances, particularly in the domestic retail banking
business and in real estate.

Pillar 3 report 2017 44
profile, defining and keeping exposures within acceptable
risk/reward ratios, making use of an efficient credit approval
process. The bank’s uses a comprehensive framework of basic
principles for credit risk management: policies, standards,
guidelines, rules and regulations and common practice. Risk
Appetite Statements, internal organization and credit approval,
booking and reporting processes are also an integral part of
this framework. Counterparty Credit Risk is managed on basis
of this strategy and framework and specific credit procedures
related to Counterparty Credit Risk exposures are in place for
risk management purposes i.e. related to central counterparties
(CCPs) and clearing brokers, agency business, requirements
based on counterparty sector or tenors.
Credit limits on Counterparty Credit Risk exposures CRR Art 439 (a)Exposures arising from Counterparty Credit Risk are subject
to on-going monitoring against specific limits set up at
counterparty level for derivatives and repo and securities
financing products. Check against limits is also required prior to
execution of any new transaction. These limits are part of the
overall credit limit of a counterparty. The limits are determined
by considering parameters such as counterparty rating, close
out netting documentation, collateral documentation, product
restrictions and regulatory requirements. The amount of the
limit is also dependent on Rabobank’s overall risk appetite.
Internally Rabobank measures exposure as the replacement
cost at given time points over the life of the transaction under
the assumption that market rates move adversely. Rabobank
uses a Monte Carlo simulation at 97.5% confidence level for
The three categories Substandard, Doubtful and Loss form the
classified portfolio. Forbearance measures only apply to this
classified portfolio. If forbearance measures are applied to a
debtor, the debtor is by definition dealt with by the FR&R
department. Items in the forbearance category must be reported
and monitored for up to two years after recovery. This period of
two years is referred to as ‘Forborne under probation’.
Template 15: EU CR1-E – Non-performing and forborne exposures
Gross carrying amount of performing and non-performing exposures
Accumulated impairment and provisions and negative fair value
adjustments due to credit risk
Collaterals and financial guarantees
received
Of which performing
but past due > 30 days
and <= 90 days
Of which performing
forborne
Of which non-performingOn performing
exposuresOn non-performing
exposures
On non- performing
exposures
Of which forborne
exposures
Of which defaulted
Of which impaired
Of which forborne
Of which forborne
Of which forborne
10 Debt securities 29,750 - - - - - - - - - - - -
20Loans and advances 489,971 1,711 3,575 18,315 17,481 17,481 9,142 613 13 4,674 2,602 10,778 -
30Off-balance-sheet exposures 84,139 - 349 476 480 480 303 - - 204 - 3 633
Narrative template 15: Increasingly prudent credit risk
management has led to a more strict setting of non-performance,
especially for files with low or zero provisioning levels, having
a non-recurring impact on the level of NPLs in 2017 and 2018.
As a result the level of non-performing loans increased.
6.3. Specific counterparty credit risk
Counterparty Credit Risk (CCR) arises from the credit risk
in transactions such as repo and securities financing, and
derivatives. It is the risk that a counterparty will default on a
transaction prior to the expiration of the contract and will be
unable to make all contractual payments. In this section we
present disclosure requirements as set out in Article 439 of CRR
575/2013 and EBA Pillar 3 disclosures requirements, both from a
qualitative and quantitative point of view.
6.3.1. Qualitative information Counterparty Credit Risk and credit risk mitigationThis section captures requirements as set out in EBA
guidelines related to Table 3: EU CCRA – Qualitative disclosure
requirements related to CCR and Table 7: EU CRC – Qualitative
disclosure requirements related to CRM techniques in the
context to Counterparty Credit Risk exposures.
Risk Management objectives and policies CRR Art 435 (1) (a)Rabobank focusses its credit risk strategy on the following
goals: develop and implement a robust credit risk governance
framework; maintain a credit portfolio with a manageable risk

Pillar 3 report 2017 45
in additional margin calls under existing netting agreements.
The overall impact is considered to be limited under current
conditions. As per December 2017 one notch downgrade of
Rabobank credit rating for OTC derivative translates into around
18.7 of additional posted collateral.
Counterparty Credit Risk Mitigation CRR Art 439 (b) / CRR Art 453 (a) (b) (c) (d) (e)Rabobank uses a wide range of credit mitigation techniques
to reduce Counterparty Credit Risk. Management of collateral
is detailed in specific procedures and controls for Markets and
Treasury (Trading) units covering eligibility, calls, bookings,
monitoring or dispute resolution. Rabobank also monitors
re-use of collateral following requirements in CRR 575/2013.
In the case of derivatives, the principal form of credit mitigation
used is close out netting and collateral agreements. Rabobank
has a strong preference for the International Swaps and
Derivatives Association (ISDA) and Credit Support Annex
(CSA) for derivative portfolios. Where the counterparties are
subject to bilateral margining requirements by European
Market Infrastructure Regulation (EMIR) or Dodd-Frank Act
(DFA), ISDA and CSA agreement must be in place. For the
purposes of exposure calculation, only transactions governed
by a clean netting/collateral agreement, with positive legal
opinion from the legal department, will be netted and subject
to further reduction by any collateral held under CSA clauses.
Rabobank also uses a number of other derivative risk mitigation
techniques to limit exposure or the tenor of specific trades, e.g.
break clauses or MTM resets. The setting of the main parameters
of a collateral agreement are geared to a low or zero threshold,
daily margining, and acceptable collateral being cash or highly
rated government/ supra national debt paper (cash and AA- or
better rated government bonds). Collateral is valued in terms of
market value and haircuts are applied based on collateral type,
residual maturity and currency. At year end 92% of bilateral
derivative trades are covered by means of documented netting
agreements, and 33% are also subject to Credit Support Annex
clauses. Cash collateral received represents approximately
97% the total CSA collateral received. In the course of the year
Rabobank has moved to apply margin rules on non-centrally
cleared derivatives following EMIR requirements and expects to
bring initial margin requests on these deals by 2019.
Security finance transactions are entered into on a collateralized
basis with financial institutions (including pension funds) under
industry standard agreements (e.g. GMRA, GMSLA). Collateral
arrangements for repo and securities financing transactions
are evidenced under the terms of the legal master agreement
and embedded in the terms of each individual transaction.
The type of collateral to be held and the criteria to be adhered
to are set out in the credit procedure and monitored via the
control framework with a focus on: correlation between the
calculating Potential Future Exposure (PFE) for the majority of
the portfolio. The exposure will take into account netting and
collateral when agreements are enforceable in the relevant
jurisdictions.
Regulatory treatment of counterparty credit exposuresRabobank uses since 2011 the Internal Model Method (IMM) to
calculate Exposure-At-Default (EAD) for regulatory purposes for
the majority of the portfolio. Portfolios currently not under IMM
follow Mark-to-Market method and are expected to migrate to
IMM in the near term.
The same Monte Carlo simulation used to calculate PFE, is
the basis for EAD calculations under IMM. The IMM model has
been extended with a separate Credit Value Adjustment (CVA)
capital model. This model is based on the advanced CVA Risk
methodology. The CVA addresses potential deterioration in
the creditworthiness of a counterparty. Mitigation effects from
collateral and netting on Counterparty Credit Risk exposures
are incorporated when agreements are enforceable in the
relevant jurisdiction. Effect of collateral is recognised in
derivatives as well as repo and securities financing transactions
within the stochastic process for IMM calculations. Internal
stochastic models are validated and annually back tested by
comparing the simulated results with the realised results. Any
observed inefficiencies will be taken into account in the model
recalibration.
Wrong-way risk CRR Art 439 (c)Specific wrong-way risk arises when the exposure on derivatives
and repo/securities financing transactions is correlated with
the creditworthiness of the counterparty. General wrong-way
risk refers to the correlation of likelihood of default by
counterparties is positively correlated with general market risk
factors.
Internal policies dictate for certain products that correlations
between the counterparty and the underlying asset should
be avoided. Correlations between the counterparty exposure
and collateral posted should be avoided as well. As part
of Rabobank’s stress testing framework, wrong-way risk is
addressed for all counterparties by calibrating the parameters
on a stressed period with respect to our counterparties and
assessing the impact on their EAD. Next to this, qualitative (e.g.
based on the risk factor stress scenarios) and counterparty’s
exposure profile analysis are performed to gain additional
insight into the general wrong-way risk towards counterparties.
Impact of Rabobank rating downgrade on collateral CRR Art 439 (d)The impact of a Rabobank rating downgrade for the Over-
The-Counter (OTC) derivatives is reported on a monthly basis
from a liquidity perspective. A rating downgrade could derive

Pillar 3 report 2017 46
clearing member’ (NCM) CCP status. This means that Rabobank
is required to use clearing brokers in order to clear the trades via
a CCP and is required to post initial and variation margin to the
clearing broker.
6.3.2. Quantitative information Counterparty Credit Risk and credit risk mitigationTemplate 25: EU CCR1 - Analysis of CCR exposure by approach CRR Art 439 (f)The template 25 provides an overview of EAD and RWA related
to exposures subject to Counterparty Credit Risk framework
(excluding CVA and exposures cleared through CCP). As
mentioned, Rabobank uses the IMM approach for the majority
of the portfolio, with some exposures under Mark-to-Market
method. Collateral in case of repo/SFT exposures is modelled
within the IMM process, therefore, no amounts are reported
under Simple, Comprehensive or VaR method in the template
below. Rabobank makes use of the multiplier prescribed in CRR
(α = 1.4).
Template 25: EU CCR1 - Analysis of CCR exposure by approach
Notional
Replacement cost/ current
market value
Potential future credit
exposure EEPE MultiplierEAD
Post CRM RWAs
Mark to market 1,615 128 1,743 653
Original exposure
Standardised approach
IMM (for derivatives and SFTs) 4,627 1.4 6,477 1,933
Of which securities financing transactions 758 1.4 1,061 147
Of which derivatives and long settlement transactions 3,869 1.4 5,417 1,787
Of which from contractual cross-product netting
Financial collateral simple method (for SFTs)
Financial collateral comprehensive method (for SFTs)
VaR for SFTs
Total 1,615 128 4,627 8,220 2,587
In the course of the year there has been a 31% drop on the
exposures treated under MtM method and served from the
Domestic Retail Banking business driven by maturity of existing
contracts. Other changes in the year did not have material
impact in terms of total EAD under Internal Model Method
as exposures are in most of the cases subject to netting and
collateralisation.
Template 26: EU CCR2 – CVA capital chargeFor OTC derivatives credit valuation adjustments (CVA) are made
to reflect expected credit losses related to the non-performance
risk of a given counterparty. A CVA is determined per
counterparty and is dependent on expected future exposure
taking into account collateral, netting agreements and other
relevant contractual factors, default probability and recovery
rates. The CVA calculation is based on available market data
including credit default swap (CDS) spreads. Where CDS spreads
counterparty and the collateral (wrong-way risk); the liquidity
of the collateral; cash out limits on a counterparty basis; and
collateral concentration limitations. Collateral is posted either
directly by/to Rabobank or via agent and is valued in terms of
market value where haircuts are used to absorb any market
movements. Equity collateral represents more than 69%
of collateral received in this type of deals, issued mainly by
corporates in OECD countries.
Central counterparties (CCP)Rabobank is clearing an increasing number of trades via central
counterparties (CCP), either directly or via clearing brokers (41%
of derivatives with external parties are either cleared directly
via CCPs or via brokers). Where Rabobank trades Over-The-
Counter (OTC) products it is usually a direct member of the
CCP. This implies that besides the initial and variation margin
Rabobank also is required to contribute to the default fund. For
most exchange-traded products (ETP), Rabobank has a ‘non-

Pillar 3 report 2017 47
Template 27: EU CCR8 - Exposures to CCPs
EAD post CRM RWAs
Exposures to QCCPs (total) 63
Exposures for trades at QCCPs (excluding initial margin and default fund contributions); of which 252
(i) OTC derivatives 119
(ii) Exchange-traded derivatives 130
(iii) SFTs 3
(iv) Netting sets where cross-product netting has been approved -
Segregated initial margin -
Non-segregated initial margin -
Prefunded default fund contributions 110
Alternative calculation of own funds requirements for exposures 63
Exposures to non-QCCPs (total)
Exposures for trades at QCCPs (excluding initial margin and default fund contributions); of which
(i) OTC derivatives
(ii) Exchange-traded derivatives
(iii) SFTs
(iv) Netting sets where cross-product netting has been approved
Segregated initial margin
Non-segregated initial margin
Prefunded default fund contributions
Alternative calculation of own funds requirements for exposures
Template 28: EU CCR3 – Standardised approach – CCR
exposures by regulatory portfolio and risk
Standardised Approach is applied in exceptional cases to
exposures where no PD and LGD models are available since
June 2017. The exposures can be considered not material,
representing just 1.5% of Risk Weighted Assets under
Counterparty Credit Risk framework. It concerns mainly
exposures to Corporate SMEs and Retail. Retail exposure class
is applied to Corporate SMEs when the total exposure has
declined below a threshold level. The template on the next
page presents EAD amounts per Risk Weight applied.
are not available relevant proxies are used. Rabobank uses
the CVA advanced approach, as required to institutions using
IMM model is for CCR and Market Risk VaR. CVA is calculated
for required counterparties using the most conservative stress
period and base on 10 day credit spread shocks, applying a 99%
confidence interval and a 10-day equivalent holding period.
Template 26: EU CCR2 - CVA capital charge
Exposure value RWAs
Total portfolios subject to the advanced method 2,121 896
(i) VaR component (including the 3× multiplier) 45
(ii) SVaR component (including the 3× multiplier) 850
All portfolios subject to the standardised method
Based on the original exposure method
Total subject to the CVA capital charge 2,121 896
Compared to year 2016, there is a decrease on the Exposure
value and RWA’s on CVA charges (year 2016 was 2,298 and 1,454
respectively, 38% decrease in terms of own fund requirements).
The decrease is driven by a reduction in the positions to
Financial Institutions and in the VaR, due to scenario changes,
where large market movements dropped off from the one year
calculation window.
Template 27: EU CCR8 – Exposures to CCPsRabobank clears mainly derivatives but also repo/SFT deals
through major CCPs, recognised as Qualifying Central
Counterparty by European Securities and Market Authority
(ESMA). The bank makes use of the ‘alternative calculation’
method prescribed in CRR Article 310 of EU Regulation
575/2013 and applies a minimum floor of 5 (63 RWA) on the
own funds requirements to these exposures. In the template
below, EAD value of trade exposures and funded default
contribution is also presented for information purposes only as
capital charge is captured in the floor amount (RWA remain left
blank in the template). Initial margin posted to CCPs is kept in
bankruptcy remote accounts and therefore does not represent
exposure.
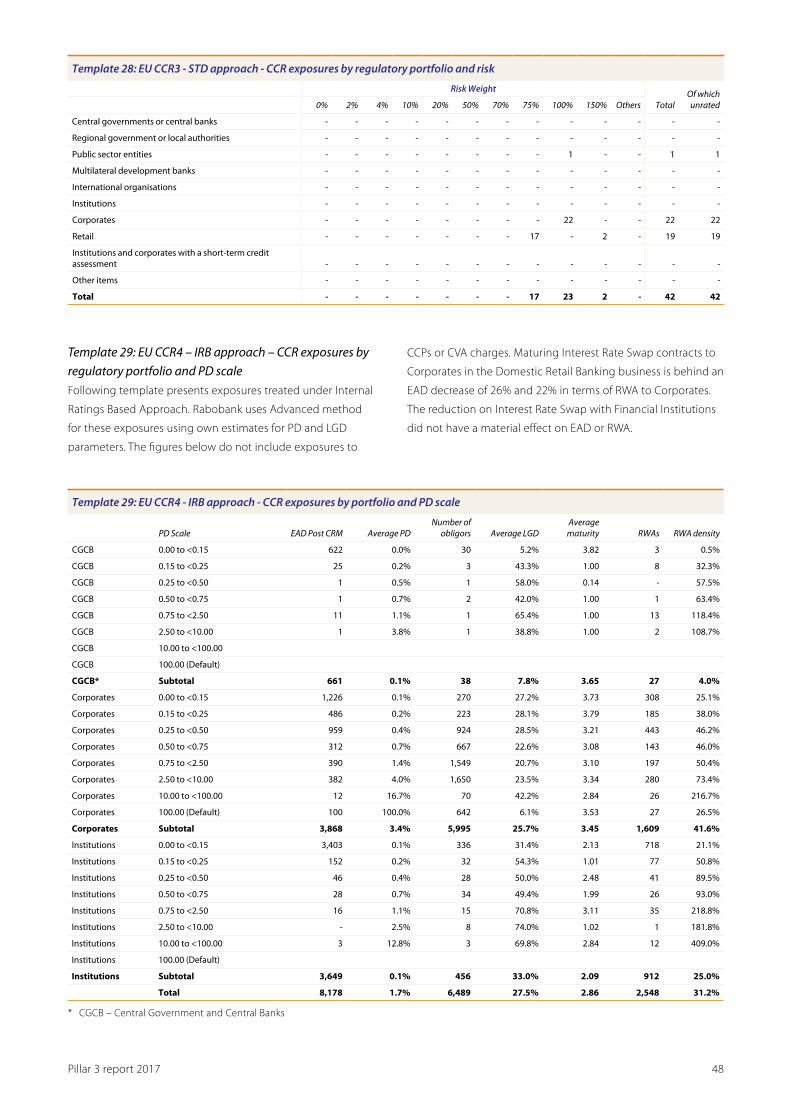
Pillar 3 report 2017 48
CCPs or CVA charges. Maturing Interest Rate Swap contracts to
Corporates in the Domestic Retail Banking business is behind an
EAD decrease of 26% and 22% in terms of RWA to Corporates.
The reduction on Interest Rate Swap with Financial Institutions
did not have a material effect on EAD or RWA.
Template 28: EU CCR3 - STD approach - CCR exposures by regulatory portfolio and risk
Risk Weight
TotalOf which unrated0% 2% 4% 10% 20% 50% 70% 75% 100% 150% Others
Central governments or central banks - - - - - - - - - - - - -
Regional government or local authorities - - - - - - - - - - - - -
Public sector entities - - - - - - - - 1 - - 1 1
Multilateral development banks - - - - - - - - - - - - -
International organisations - - - - - - - - - - - - -
Institutions - - - - - - - - - - - - -
Corporates - - - - - - - - 22 - - 22 22
Retail - - - - - - - 17 - 2 - 19 19
Institutions and corporates with a short-term credit assessment - - - - - - - - - - - - -
Other items - - - - - - - - - - - - -
Total - - - - - - - 17 23 2 - 42 42
Template 29: EU CCR4 – IRB approach – CCR exposures by regulatory portfolio and PD scaleFollowing template presents exposures treated under Internal
Ratings Based Approach. Rabobank uses Advanced method
for these exposures using own estimates for PD and LGD
parameters. The figures below do not include exposures to
Template 29: EU CCR4 - IRB approach - CCR exposures by portfolio and PD scale
PD Scale EAD Post CRM Average PDNumber of
obligors Average LGDAverage maturity RWAs RWA density
CGCB 0.00 to <0.15 622 0.0% 30 5.2% 3.82 3 0.5%
CGCB 0.15 to <0.25 25 0.2% 3 43.3% 1.00 8 32.3%
CGCB 0.25 to <0.50 1 0.5% 1 58.0% 0.14 - 57.5%
CGCB 0.50 to <0.75 1 0.7% 2 42.0% 1.00 1 63.4%
CGCB 0.75 to <2.50 11 1.1% 1 65.4% 1.00 13 118.4%
CGCB 2.50 to <10.00 1 3.8% 1 38.8% 1.00 2 108.7%
CGCB 10.00 to <100.00
CGCB 100.00 (Default)
CGCB* Subtotal 661 0.1% 38 7.8% 3.65 27 4.0%
Corporates 0.00 to <0.15 1,226 0.1% 270 27.2% 3.73 308 25.1%
Corporates 0.15 to <0.25 486 0.2% 223 28.1% 3.79 185 38.0%
Corporates 0.25 to <0.50 959 0.4% 924 28.5% 3.21 443 46.2%
Corporates 0.50 to <0.75 312 0.7% 667 22.6% 3.08 143 46.0%
Corporates 0.75 to <2.50 390 1.4% 1,549 20.7% 3.10 197 50.4%
Corporates 2.50 to <10.00 382 4.0% 1,650 23.5% 3.34 280 73.4%
Corporates 10.00 to <100.00 12 16.7% 70 42.2% 2.84 26 216.7%
Corporates 100.00 (Default) 100 100.0% 642 6.1% 3.53 27 26.5%
Corporates Subtotal 3,868 3.4% 5,995 25.7% 3.45 1,609 41.6%
Institutions 0.00 to <0.15 3,403 0.1% 336 31.4% 2.13 718 21.1%
Institutions 0.15 to <0.25 152 0.2% 32 54.3% 1.01 77 50.8%
Institutions 0.25 to <0.50 46 0.4% 28 50.0% 2.48 41 89.5%
Institutions 0.50 to <0.75 28 0.7% 34 49.4% 1.99 26 93.0%
Institutions 0.75 to <2.50 16 1.1% 15 70.8% 3.11 35 218.8%
Institutions 2.50 to <10.00 - 2.5% 8 74.0% 1.02 1 181.8%
Institutions 10.00 to <100.00 3 12.8% 3 69.8% 2.84 12 409.0%
Institutions 100.00 (Default)
Institutions Subtotal 3,649 0.1% 456 33.0% 2.09 912 25.0%
Total 8,178 1.7% 6,489 27.5% 2.86 2,548 31.2%
* CGCB – Central Government and Central Banks

Pillar 3 report 2017 49
Template 30: EU CCR7 – RWA flow statements of CCR exposures under the IMMRabobank reports for the first time in the new EBA template
format. As a result only the RWA amounts and capital
requirements as of 31 December 2017 are included in this table.
Template 30: EU CCR7 – RWA flow statements of CCR exposures under the IMM
RWA amountsCapital
requirements
RWAs at the end of the previous reporting period - -
Asset size - -
Credit quality of counterparties - -
Model updates (IMM only) - -
Methodology and policy (IMM only) - -
Acquisitions and disposals - -
Foreign exchange movements - -
Other - -
RWAs at the end of the reporting period 1,933 155
Template 31: EU CCR5-A – Impact of netting and collateral held on exposures values CRR Art 439 (e)Template 31 provides a quantitative analysis of counterparty
credit risk that arises from its derivatives and repo and securities
financing transactions. This quantifies notional derivatives
exposure, including whether derivatives are OTC or traded
on recognized exchanges. Where the derivatives are OTC, it
shows how much is settled via a CCP. For repos and securities
the collateral benefit is taken into account in the Positive
or Negative Fair Value. Therefore the Netted Current Credit
Exposure equals the Net Credit Exposure.
Financial term Definition
Gross positive fair value Sum of all aggregate positive MTM values for each counterparty in each netting agreement before any benefit is given for offsetting negative MTM values on the same netting pool. Prudent Valuation Adjustments are not taken into consideration, since they are applied on total level against capital, not on trade level.
Netting benefits The netting benefits applicable to each netting agreement are derived by referencing the impact of negative MTM values but only to the extent that positive MTM exists. Netting benefit recognised only when legally enforceable netting agreement is in place.
Netted current credit exposure The gross positive fair value less netting benefits for each netting agreement produces the netted current credit exposure.
Collateral held The offset arising from collateral held to collateralize the netted current credit exposure is quantified on a netting pool basis. Collateral benefit is only recorded for collateral held and only to the extent that positive netted current credit exposure exists. Collateral consists of cash and eligible securities. Collateral is modelled in the Internal Model Method to calculate EAD.
Collateral held with no impact on the exposure
Collateral held in excess of the positive net current exposure after applying collateral with no further effect on the exposure (overcollateral).
Net credit exposure The netted current credit exposure less the collateral benefit for each netting agreement produces the net credit exposure. Net credit exposure contains as well non-bankruptcy remote Initial Margin placed for exchange traded products and CCPS. Over collateral posted as part of CSA agreements is also captured here.
EAD Exposure At Default as calculated and reported following CRR guidelines, using Mark-to-Market method or Internal Model Method.
Template 31: EU CCR5-A – Impact of netting and collateral held on exposure values
Gross positive fair value or net carrying
amountNetting benefits
Netted current credit
exposureCollateral
held
Collateral held with no
impact on exposure
Net credit exposure Notional
Derivatives 87,207 77,716 9,490 6,205 211 3,653 2,977,441
Derivatives - CCP 62,182 62,152 30 13 - 29 2,155,468
Derivatives - ETP 137 80 57 - - 154 59,245
Derivatives - under netting agreements 24,676 15,484 9,191 6,192 211 3,258 749,073
Derivatives - Gross 212 - 212 - - 212 13,656
Repo / SFTs 16,717 15,999 718 - - 718 -
Repo/STF - under netting agreement 16,717 15,999 717 - - 717 -
Repo/SFT - gross - - - - - - -
Total 103,924 93,715 10,208 6,205 211 3,653 2,977,441
Compared to end 2016 there is a decrease on the derivative
exposures under netting agreements, driven from matured
of contracts in the Domestic Retail Banking business and
reduction in exposures to Financial Institutions on Interest Rate
Swaps used for hedging purposes.
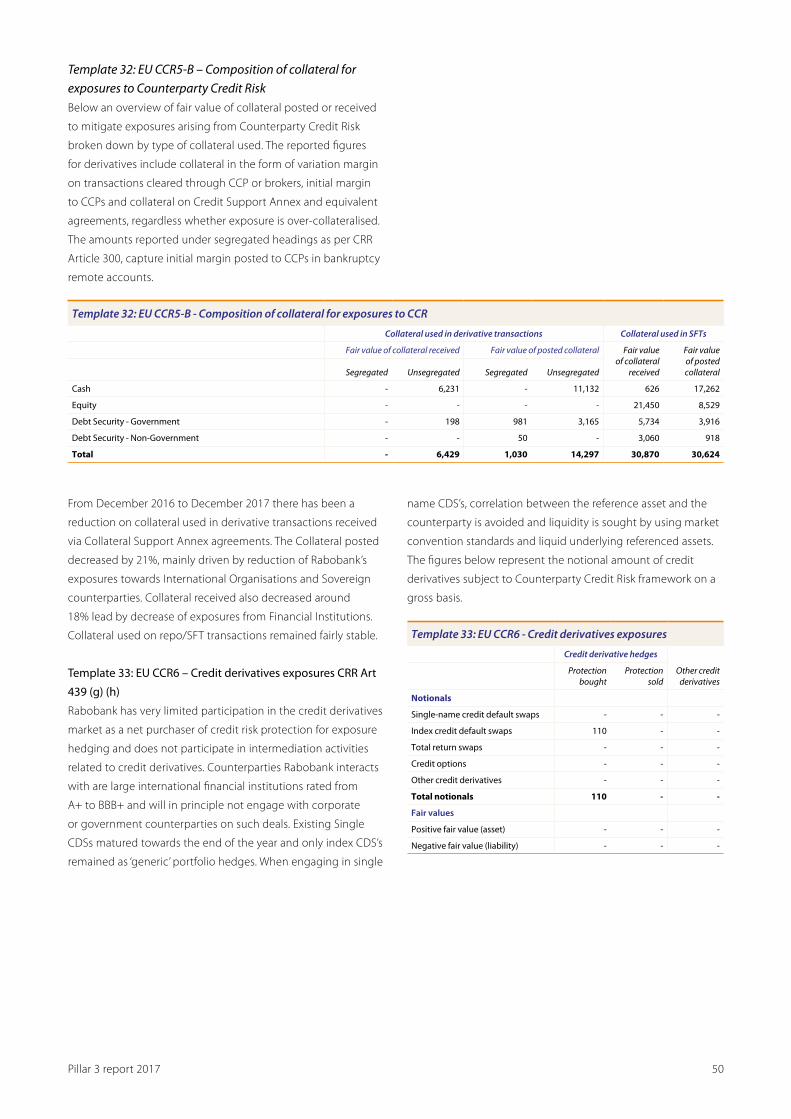
Pillar 3 report 2017 50
Template 32: EU CCR5-B – Composition of collateral for exposures to Counterparty Credit RiskBelow an overview of fair value of collateral posted or received
to mitigate exposures arising from Counterparty Credit Risk
broken down by type of collateral used. The reported figures
for derivatives include collateral in the form of variation margin
on transactions cleared through CCP or brokers, initial margin
to CCPs and collateral on Credit Support Annex and equivalent
agreements, regardless whether exposure is over-collateralised.
The amounts reported under segregated headings as per CRR
Article 300, capture initial margin posted to CCPs in bankruptcy
remote accounts.
Template 32: EU CCR5-B - Composition of collateral for exposures to CCR
Collateral used in derivative transactions Collateral used in SFTs
Fair value of collateral received Fair value of posted collateral Fair value of collateral
received
Fair value of posted collateralSegregated Unsegregated Segregated Unsegregated
Cash - 6,231 - 11,132 626 17,262
Equity - - - - 21,450 8,529
Debt Security - Government - 198 981 3,165 5,734 3,916
Debt Security - Non-Government - - 50 - 3,060 918
Total - 6,429 1,030 14,297 30,870 30,624
From December 2016 to December 2017 there has been a
reduction on collateral used in derivative transactions received
via Collateral Support Annex agreements. The Collateral posted
decreased by 21%, mainly driven by reduction of Rabobank’s
exposures towards International Organisations and Sovereign
counterparties. Collateral received also decreased around
18% lead by decrease of exposures from Financial Institutions.
Collateral used on repo/SFT transactions remained fairly stable.
Template 33: EU CCR6 – Credit derivatives exposures CRR Art
439 (g) (h)
Rabobank has very limited participation in the credit derivatives
market as a net purchaser of credit risk protection for exposure
hedging and does not participate in intermediation activities
related to credit derivatives. Counterparties Rabobank interacts
with are large international financial institutions rated from
A+ to BBB+ and will in principle not engage with corporate
or government counterparties on such deals. Existing Single
CDSs matured towards the end of the year and only index CDS’s
remained as ‘generic’ portfolio hedges. When engaging in single
name CDS’s, correlation between the reference asset and the
counterparty is avoided and liquidity is sought by using market
convention standards and liquid underlying referenced assets.
The figures below represent the notional amount of credit
derivatives subject to Counterparty Credit Risk framework on a
gross basis.
Template 33: EU CCR6 - Credit derivatives exposures
Credit derivative hedges
Other credit derivatives
Protection bought
Protection sold
Notionals
Single-name credit default swaps - - -
Index credit default swaps 110 - -
Total return swaps - - -
Credit options - - -
Other credit derivatives - - -
Total notionals 110 - -
Fair values
Positive fair value (asset) - - -
Negative fair value (liability) - - -

Pillar 3 report 2017 51
6.4. Developments in loan portfolios
6.4.1. Residential mortgage loansHousing market characterised by high confidence and low interest ratesThe housing market
Growth in the Dutch housing market continued unabated in
2017. Both the House Price Index and the number of residential
property transactions rose compared to 2016. High consumer
confidence, low interest rates and favourable economic
conditions contributed to these developments. Mortgage
interest rates are expected to remain low for the time being.
Market share
Rabobank’s share of the Dutch mortgage market increased
to 22.0% (2016: 20.5%) of new mortgage production in 2017
(source: Dutch Land Registry Office (Kadaster)). The local
Rabobanks’ market share rose to 18.0% (2016: 17.3%) and
Obvion’s increased to 4.0% (2016: 3.2%).
Mortgage loan portfolio
The quality of Rabobank’s residential mortgage loan portfolio
remained very high thanks to the recovery of the Dutch
economy and the strong Dutch housing market. In 2017,
financing backed by the National Mortgage Guarantee
(Nationale Hypotheek Garantie, (NHG)) remained relatively
stable at 20.0% of the mortgage loan portfolio. The weighted
average indexed loan-to-value (LTV) of the mortgage loan
portfolio is 69% per 31 December 2017.
Loan impairment charges and write-offs mortgage loan
portfolio
Loan impairment charges relating to residential mortgage loans
amounted to minus 0.1 million (0 basis points) in 2017, which
is lower than in 2016. Improved asset quality helped keep loan
impairment charges low, as shown by the positive development
of the non-performing loans ratio.
Residential mortgage loans
31 December 2017
31 December 2016
Mortgage portfolio 193,110 195,909
Weighted-average LTV 69% 69%1
Non-performing loans (amount) 1,112 1,526
Non-performing loans (in % of total mortgage loan portfolio) 0.58% 0.78%
More-than-90-days arrears 0.34% 0.48%
Share NHG portfolio 20.0% 20.6%
Loan impairment allowances 169 227
Coverage ratio based on non-performing loans 15% 15%
Loan impairment charges - 9
Loan impairment charges (in basis points, including non-recurring effects) 0.0 0.5
Write-offs 77 119
1 As a result of a change in the method for determining the current
indexed LTV, the current LTV is not comparable to the LTV at year-end
2016.
6.4.2. Commercial real estateThe commercial real estate market strongly improved in 2017.
Due to healthy GDP-growth, demand for real estate increased
in all segments resulting in a decline of vacancy levels in
offices, retail and industrial real estate. This decrease of vacancy
is further improved due to the transformation of outdated
buildings to new functions, especially housing. After offices, this
trend now also occurs in retail and industrial real estate. Due
to a shortage in housing, investors still favor rental housing,
especially in the segment between 700-1000 euro (monthly
rent). Last year investment volumes in rental housing attained
approximately 3.5 billion.
After several years, the real estate market shows more balance,
resulting in a shortage of prime assets, increasing rents in most
segments (especially in larger cities) and a recovery of values
and yields. In total, on the investment side, 2017 became a
record year with almost 20 billion of new investments. As in
recent years, foreign investors still dominate the market.
However, demand by local investors is increasing. Net initial
yields decreased in all sectors, related to both low interest
rates and investor confidence in the Dutch real estate market.
However, future challenges are expected. Rising interest rates
will have consequences on yields. Furthermore, investments
in sustainability, re-use of outdated buildings and innovations
need to be adopted to ensure stable investments.

Pillar 3 report 2017 52
Rabobank’s commercial real estate portfolio in the Netherlands
was historically managed by FGH Bank and the local Rabobanks.
In 2015, it was announced that the core clients of FGH
Bank would be integrated into Rabobank, consolidating all
knowledge, expertise and network in the field of commercial
real estate financing within both FGH Bank and Rabobank. In
2017 this integration was finalized. In view of this consolidation
of expertise, In November 2016, Rabo Real Estate Finance
was launched. At minus 253 (minus 28) in 2017, specific loan
impairment charges for the combined domestic Rabobank
commercial real estate portfolio were negative, confirming the
ongoing improvement of the quality of the portfolio.
Net loan portfolio(new methodology)
Gross non-performing loans
Loan impairment allowance
Loan impairment charges Write-offs
31 December 2017
Total property investments 21,706 3,237 906 (188) 227
Total property development 1,145 403 185 (65) 42
Total commercial real estate 22,851 3,640 1,090 (253) 269
31 December 2016
Total commercial real estate 23,750 4,625 1,482 (28) 375
Nearly the entire commercial real estate portfolio outside
the Netherlands is provided by ACC Loan Management.
This portfolio is being gradually scaled down. In 2017 there
was a small addition of the loan impairment allowance.
6.5. Country risk
With respect to country risk, a distinction is made between
collective debtor risk and transfer risk. Collective debtor risk is
the risk that a large number of debtors in a particular country
will all be unable to fulfil their obligations owing to the same
cause, (e.g. war, political or social unrest, natural disasters, or
government policy that fails to create macro-economic and
financial stability). Transfer risk is the risk that payments in
non-local currency could in any way be hindered or prohibited
due to insufficient availability of non-local currency financial
resources (economic transfer risk), and/or to unwillingness of
the government (political transfer risk) to permit the non-local
currency outflow of financial resources.
Rabobank uses a country limit system to manage collective
debtor risk and transfer risk. After careful review, relevant
countries are given an internal country risk rating, after which,
general limits and transfer limits are set. Transfer limits are
introduced based on the net transfer risk, which is defined
as total loans granted less loans granted in local currency,
guarantees, other collateral obtained to cover transfer risk
and a deduction related to the reduced weighting of specific
products. The limits are allocated to the local BUs, which are
themselves responsible for the day-to-day monitoring of
loans that have been granted and for reporting on this to
Risk Management. At Rabobank Group level, the country risk
outstanding is reported to the Risk Management Committee
(RMC Group) and the Country Limit Committee (CLC).
Special Basel II parameters, specifically EATE (Exposure at
Transfer Event), PTE (Probability of Transfer Event) and LGTE
(Loss Given Transfer Event), are used to calculate the additional
capital requirement for transfer risk. These calculations are made
in accordance with internal guidelines and cover all countries
where transfer risk is relevant.
Based on the concept of country of ultimate risk, the collective
debtor risk for non-industrial non-OECD countries stood at 23.4
(2016:28.4) billion at year-end 2017. The net ultimate transfer
risk before allowances for these countries amounted to 13.9
(2016: 17.5) billion at year-end 2017, which corresponds to 2.3%
(2016: 2.6%) of total assets. Total assets were 603.0 (2016: 662.3)
billion. The total allowance for ultimate country risk amounted
to 354 (2016: 471), which corresponds to 6.5% (2016: 6.2%) of
the total allowance of 5,490 (2016: 7,542).
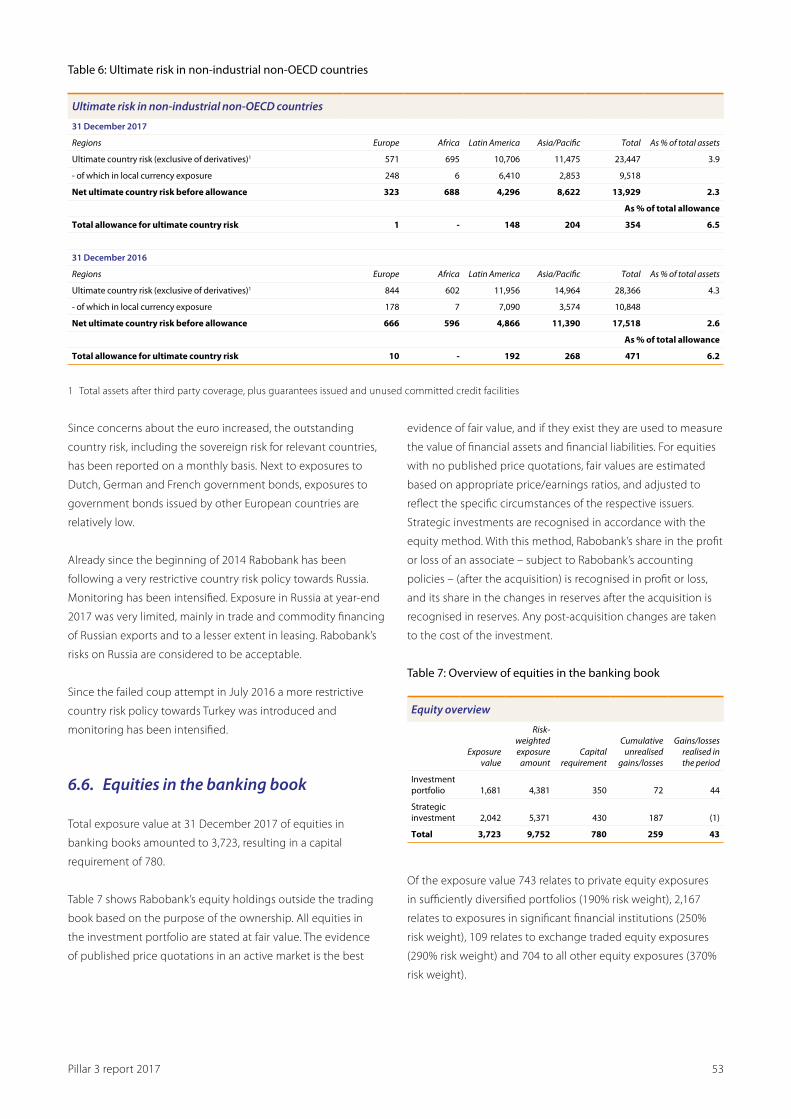
Pillar 3 report 2017 53
Table 6: Ultimate risk in non-industrial non-OECD countries
Ultimate risk in non-industrial non-OECD countries
31 December 2017
Regions Europe Africa Latin America Asia/Pacific Total As % of total assets
Ultimate country risk (exclusive of derivatives)1 571 695 10,706 11,475 23,447 3.9
- of which in local currency exposure 248 6 6,410 2,853 9,518
Net ultimate country risk before allowance 323 688 4,296 8,622 13,929 2.3
As % of total allowance
Total allowance for ultimate country risk 1 - 148 204 354 6.5
31 December 2016
Regions Europe Africa Latin America Asia/Pacific Total As % of total assets
Ultimate country risk (exclusive of derivatives)1 844 602 11,956 14,964 28,366 4.3
- of which in local currency exposure 178 7 7,090 3,574 10,848
Net ultimate country risk before allowance 666 596 4,866 11,390 17,518 2.6
As % of total allowance
Total allowance for ultimate country risk 10 - 192 268 471 6.2
1 Total assets after third party coverage, plus guarantees issued and unused committed credit facilities
evidence of fair value, and if they exist they are used to measure
the value of financial assets and financial liabilities. For equities
with no published price quotations, fair values are estimated
based on appropriate price/earnings ratios, and adjusted to
reflect the specific circumstances of the respective issuers.
Strategic investments are recognised in accordance with the
equity method. With this method, Rabobank’s share in the profit
or loss of an associate – subject to Rabobank’s accounting
policies – (after the acquisition) is recognised in profit or loss,
and its share in the changes in reserves after the acquisition is
recognised in reserves. Any post-acquisition changes are taken
to the cost of the investment.
Table 7: Overview of equities in the banking book
Equity overview
Exposure value
Risk-weighted exposure
amountCapital
require ment
Cumulative unrealised
gains/losses
Gains/losses realised in the period
Investment portfolio 1,681 4,381 350 72 44
Strategic investment 2,042 5,371 430 187 (1)
Total 3,723 9,752 780 259 43
Of the exposure value 743 relates to private equity exposures
in sufficiently diversified portfolios (190% risk weight), 2,167
relates to exposures in significant financial institutions (250%
risk weight), 109 relates to exchange traded equity exposures
(290% risk weight) and 704 to all other equity exposures (370%
risk weight).
Since concerns about the euro increased, the outstanding
country risk, including the sovereign risk for relevant countries,
has been reported on a monthly basis. Next to exposures to
Dutch, German and French government bonds, exposures to
government bonds issued by other European countries are
relatively low.
Already since the beginning of 2014 Rabobank has been
following a very restrictive country risk policy towards Russia.
Monitoring has been intensified. Exposure in Russia at year-end
2017 was very limited, mainly in trade and commodity financing
of Russian exports and to a lesser extent in leasing. Rabobank’s
risks on Russia are considered to be acceptable.
Since the failed coup attempt in July 2016 a more restrictive
country risk policy towards Turkey was introduced and
monitoring has been intensified.
6.6. Equities in the banking book
Total exposure value at 31 December 2017 of equities in
banking books amounted to 3,723, resulting in a capital
requirement of 780.
Table 7 shows Rabobank’s equity holdings outside the trading
book based on the purpose of the ownership. All equities in
the investment portfolio are stated at fair value. The evidence
of published price quotations in an active market is the best

Pillar 3 report 2017 54
For transactions originated after 1 January 2011, compliance
with CRR (CRD IV) is warranted by a) retaining the first loss
positions and, if necessary, other tranches with the same
or more severe risk positions than those transferred or sold
to investors with a minimum of 5% of securitised assets or
randomly selected assets that would otherwise have been
securitised or b) retaining 5% of the notes placed with external
investors. A certain amount of liquidity risk in securitisation
transactions is retained by Rabobank by acting as liquidity
facility provider in all of its own asset securitisation transactions.
Contingent liquidity risk in securitisation swaps has been
identified and is taken into account in the liquidity risk
management framework, see also Chapter 10 Liquidity Risk.
Given the current rating of Rabobank Group, the role as account
bank is also fulfilled by Rabobank. The processes in place to
monitor the changes in credit risk of securitised assets do not
differ from those for non-securitised assets. See Chapter 6
Credit Risk for more information. Interest rate risk for own asset
securitisation positions are intercompany positions, and are
irrelevant for the interest rate risk position at a Group level.
7. Securitisation
7.1. Own asset securitisation (originator role)
Within Rabobank Group, own asset securitisation is used by
Obvion (STORM and STRONG), De Lage Landen (US and LEAP)
and Coöperatieve Rabobank U.A. (traditional securitisation
of Dutch mortgages and synthetic securitization of loans to
corporates). Own asset securitisations that do not achieve
significant risk transfer (SRT) are classified as securitization
exposures and are reported as originator exposures. As per
31 December 2017 Rabobank has achieved SRT for a total
amount of 4.2 billion.
One securitisation transaction is set up to improve liquidity
ratios and create collateral for the ECB. This transaction does not
mitigate credit risk exposure and is retained by Rabobank in full,
and Rabobank is still holding capital for the underlying assets
amounting to 50 billion as per 31 December 2017.
Securitisation transactions are compliant with the European
Capital Requirements Regulations on solvency requirements
for credit risk. Compliance with the Regulation is documented
and signed-off by the internal legal department and the
control department. Securitisation transactions can be initiated
by subsidiaries and at Group level. All transactions received
an approval of the ALCO Group and the applicable credit
committee Rabobank.
Rabobank management integrates securitisation in Rabobank Group’s long-term funding and capital strategy. In selling and carrying various financial assets, Rabobank is active in own asset securitisation, sponsor transactions and investor transactions. Financial assets are sometimes sold to Special Purpose Vehicles (SPVs), which then issue securities to investors. Rabobank follows the IFRS regulations with regard to the consolidation of SPVs. When Rabobank consolidates SPVs, it is irrelevant whether the transactions are treated as sales or financing. Investor positions are classified as financial assets. Assets which could be securitised in the near future are still accounted for in the banking book, as it is uncertain if and when those assets will be securitised. Further details of the Rabobank accounting policies with regard to securitisation transactions are provided in the Rabobank Group Consolidated Financial Statements 2017, note 2.9 and note 50. With respect to securitisations, Rabobank uses the following External Credit Assessment Institutions (ECAIs): Fitch Ratings, Standard & Poor’s, Moody’s and DBRS. These ECAIs are used for all investor positions and own asset securitisations. There is no policy to use specific ECAIs for specific exposures or transactions. This is determined on a case-by-case basis.
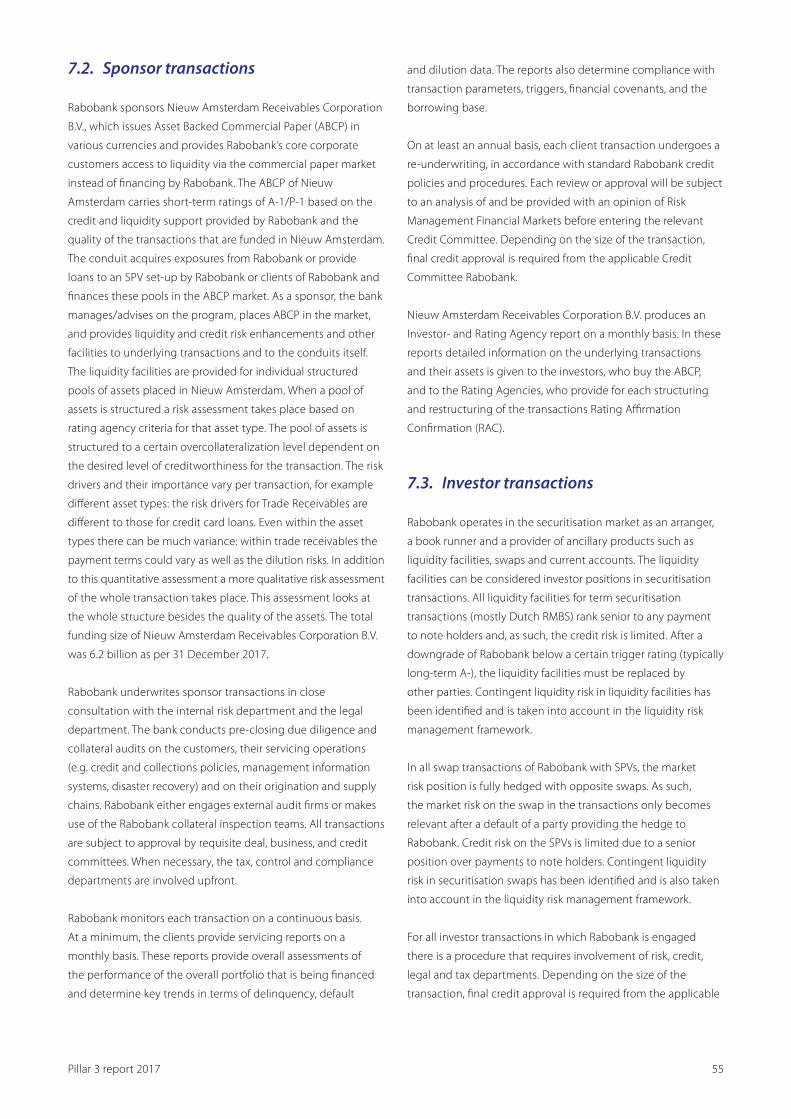
Pillar 3 report 2017 55
and dilution data. The reports also determine compliance with
transaction parameters, triggers, financial covenants, and the
borrowing base.
On at least an annual basis, each client transaction undergoes a
re-underwriting, in accordance with standard Rabobank credit
policies and procedures. Each review or approval will be subject
to an analysis of and be provided with an opinion of Risk
Management Financial Markets before entering the relevant
Credit Committee. Depending on the size of the transaction,
final credit approval is required from the applicable Credit
Committee Rabobank.
Nieuw Amsterdam Receivables Corporation B.V. produces an
Investor- and Rating Agency report on a monthly basis. In these
reports detailed information on the underlying transactions
and their assets is given to the investors, who buy the ABCP,
and to the Rating Agencies, who provide for each structuring
and restructuring of the transactions Rating Affirmation
Confirmation (RAC).
7.3. Investor transactions
Rabobank operates in the securitisation market as an arranger,
a book runner and a provider of ancillary products such as
liquidity facilities, swaps and current accounts. The liquidity
facilities can be considered investor positions in securitisation
transactions. All liquidity facilities for term securitisation
transactions (mostly Dutch RMBS) rank senior to any payment
to note holders and, as such, the credit risk is limited. After a
downgrade of Rabobank below a certain trigger rating (typically
long-term A-), the liquidity facilities must be replaced by
other parties. Contingent liquidity risk in liquidity facilities has
been identified and is taken into account in the liquidity risk
management framework.
In all swap transactions of Rabobank with SPVs, the market
risk position is fully hedged with opposite swaps. As such,
the market risk on the swap in the transactions only becomes
relevant after a default of a party providing the hedge to
Rabobank. Credit risk on the SPVs is limited due to a senior
position over payments to note holders. Contingent liquidity
risk in securitisation swaps has been identified and is also taken
into account in the liquidity risk management framework.
For all investor transactions in which Rabobank is engaged
there is a procedure that requires involvement of risk, credit,
legal and tax departments. Depending on the size of the
transaction, final credit approval is required from the applicable
7.2. Sponsor transactions
Rabobank sponsors Nieuw Amsterdam Receivables Corporation
B.V., which issues Asset Backed Commercial Paper (ABCP) in
various currencies and provides Rabobank’s core corporate
customers access to liquidity via the commercial paper market
instead of financing by Rabobank. The ABCP of Nieuw
Amsterdam carries short-term ratings of A-1/P-1 based on the
credit and liquidity support provided by Rabobank and the
quality of the transactions that are funded in Nieuw Amsterdam.
The conduit acquires exposures from Rabobank or provide
loans to an SPV set-up by Rabobank or clients of Rabobank and
finances these pools in the ABCP market. As a sponsor, the bank
manages/advises on the program, places ABCP in the market,
and provides liquidity and credit risk enhancements and other
facilities to underlying transactions and to the conduits itself.
The liquidity facilities are provided for individual structured
pools of assets placed in Nieuw Amsterdam. When a pool of
assets is structured a risk assessment takes place based on
rating agency criteria for that asset type. The pool of assets is
structured to a certain overcollateralization level dependent on
the desired level of creditworthiness for the transaction. The risk
drivers and their importance vary per transaction, for example
different asset types: the risk drivers for Trade Receivables are
different to those for credit card loans. Even within the asset
types there can be much variance: within trade receivables the
payment terms could vary as well as the dilution risks. In addition
to this quantitative assessment a more qualitative risk assessment
of the whole transaction takes place. This assessment looks at
the whole structure besides the quality of the assets. The total
funding size of Nieuw Amsterdam Receivables Corporation B.V.
was 6.2 billion as per 31 December 2017.
Rabobank underwrites sponsor transactions in close
consultation with the internal risk department and the legal
department. The bank conducts pre-closing due diligence and
collateral audits on the customers, their servicing operations
(e.g. credit and collections policies, management information
systems, disaster recovery) and on their origination and supply
chains. Rabobank either engages external audit firms or makes
use of the Rabobank collateral inspection teams. All transactions
are subject to approval by requisite deal, business, and credit
committees. When necessary, the tax, control and compliance
departments are involved upfront.
Rabobank monitors each transaction on a continuous basis.
At a minimum, the clients provide servicing reports on a
monthly basis. These reports provide overall assessments of
the performance of the overall portfolio that is being financed
and determine key trends in terms of delinquency, default

Pillar 3 report 2017 56
approach cannot be used and is only applicable to exposures
within an ABCP. The outcome of the IAA is an internal rating for
the liquidity facilities. Nieuw Amsterdam and the underlying
transactions are analysed, and the commercial paper is rated by
the rating agencies (Moody’s and Standard & Poor’s). For a more
detailed explanation on the liquidity facilities please see section
7.2 above. When a pool of assets is structured and placed in the
conduit, new commercial paper is given out. The specific pool is
fully supported by the liquidity facility.
7.5. Risk measurement
Table 8: Total outstanding exposure securitised by Rabobank
Total outstanding exposure securitised by Rabobank and subject to the securitisation framework by exposure type excluding fully retained securitisation transactions
Own assetsThird party assets
(sponsor deals) Total
Traditional securitisations
- Residential mortgages 69,051 - 69,051
- Loans to corporates or SMEs - 6,249 6,249
- Leasing 180 - 180
Subtotal 69,231 6,249 75,480
Synthetic securitisations
- Corporate loans 4,182 - 4,182
Total portfolio 73,413 6,249 79,662
Table 9: Impaired/past-due assets securitised
Impaired/past-due assets securitised by Rabobank and losses recognised during the current period, broken down by exposure type
Past due Losses
Traditional securitisations
- Residential mortgages 90.3 (53.2)
- Loans to corporates or SMEs - (0.7)
- Leasing 1.4 (0.7)
Subtotal 91.7 (54.6)
Synthetic securitisations - -
- Corporate loans - -
Total portfolio 91.7 (54.6)
Credit Committee Rabobank. On an annual basis, the liquidity
facilities are reviewed and renewed. For swap transactions, the
underlying market risk in the portfolios is monitored closely,
with typical daily valuation. Transaction analysis is based on
trustee reports, rating agency reports and industry-wide
reports. From these reports information is gathered on the
overall performance of the transaction, the development of
credit enhancement, trends in delinquencies and defaults, and
performance versus trigger levels.
Besides the aforementioned asset backed securitisation (ABS)
transactions, Rabobank holds a limited amount in trade
receivable securitisations and a very limited number of ABS in
its run-off portfolio. All these individual securities are subject to
an annual credit review. As long as they do not have an external
rating, these carry an internal credit rating that shows the implied
creditworthiness according to the assessment of RM FM.
Rabobank has established a strong governance framework
around the non-core portfolios. Any portfolio activity is subject
to approval from the Risk Management Committee. Members of
this committee are senior staff from various banking disciplines.
As all investor positions are swapped to floating, the interest
rate risk is relatively small.
7.4. Regulatory Capital approaches
All of Rabobank’s securitisation positions in own asset
securitisation transactions and investor positions are reported
using the Internal Ratings Based (IRB) approach. For investor
positions the Rating Based Method is applied. For Corporate
Tranched Purchased Receivables, Rabobank applies the
Supervisory Formula Approach. Market risk is reported using the
Standardised Approach.
The Internal Assessment Approach (IAA) has been approved
and rolled out for Nieuw Amsterdam transactions. Solvency
calculations for a given transaction will be dependent on
the protections built into each transaction and the funding
requirements for the liquidity facility. IAA calculations should
be confirmed with RM FM early in the renewal process so that
accurate solvency calculations are used. This methodology
is used to assign a risk weight to a securitisation exposure
where a direct rating based approach or inferred rating based
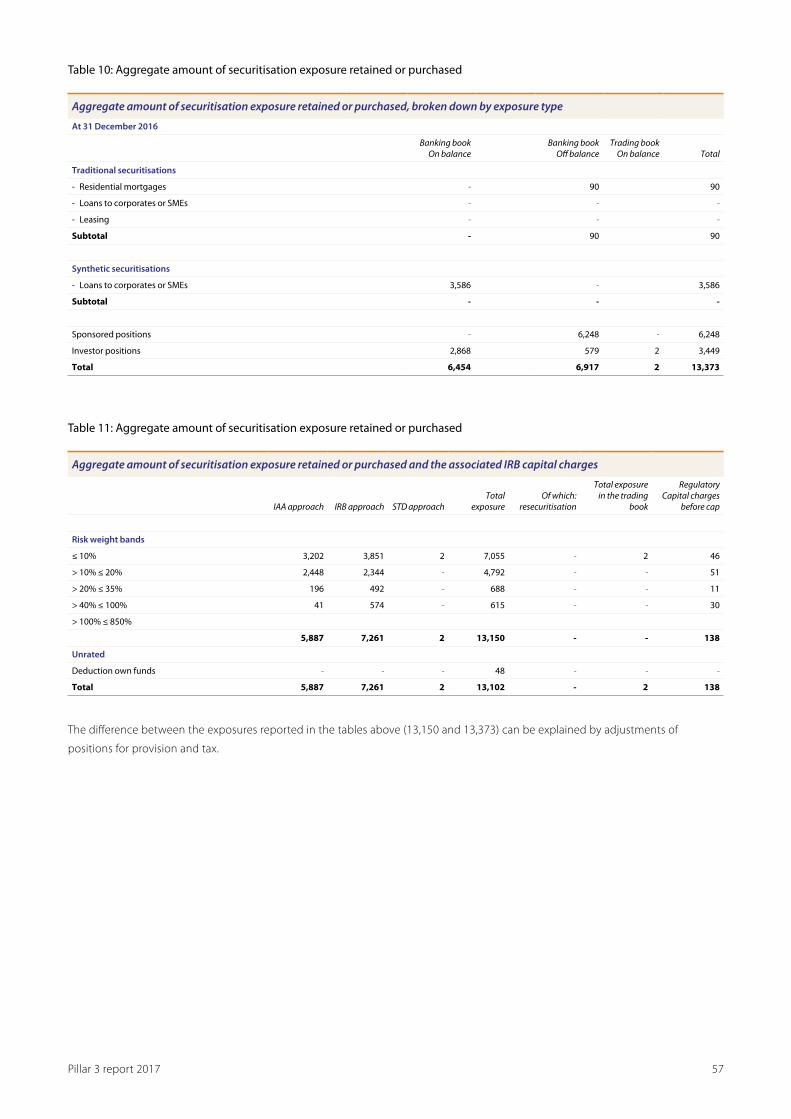
Pillar 3 report 2017 57
Table 10: Aggregate amount of securitisation exposure retained or purchased
Aggregate amount of securitisation exposure retained or purchased, broken down by exposure type
At 31 December 2016
Banking book On balance
Banking book Off balance
Trading book On balance Total
Traditional securitisations
- Residential mortgages - 90 90
- Loans to corporates or SMEs - - -
- Leasing - - -
Subtotal - 90 90
Synthetic securitisations
- Loans to corporates or SMEs 3,586 - 3,586
Subtotal - - -
Sponsored positions - 6,248 - 6,248
Investor positions 2,868 579 2 3,449
Total 6,454 6,917 2 13,373
Table 11: Aggregate amount of securitisation exposure retained or purchased
Aggregate amount of securitisation exposure retained or purchased and the associated IRB capital charges
IAA approach IRB approach STD approachTotal
exposureOf which:
resecuritisation
Total exposure in the trading
book
Regulatory Capital charges
before cap
Risk weight bands
≤ 10% 3,202 3,851 2 7,055 - 2 46
> 10% ≤ 20% 2,448 2,344 - 4,792 - - 51
> 20% ≤ 35% 196 492 - 688 - - 11
> 40% ≤ 100% 41 574 - 615 - - 30
> 100% ≤ 850%
5,887 7,261 2 13,150 - - 138
Unrated
Deduction own funds - - - 48 - - -
Total 5,887 7,261 2 13,102 - 2 138
The difference between the exposures reported in the tables above (13,150 and 13,373) can be explained by adjustments of
positions for provision and tax.

Pillar 3 report 2017 58
8. Operational risk
8.1. Operational Risk Management framework
Rabobank Group has applied the Advanced Measurement
Approach (AMA) to calculate operational risk capital
requirements. Rabobank’s capital model undergoes continuous
incremental changes were deemed applicable to safeguard
alignment of the model.
The operational risk model of Rabobank includes the following
elements:
• Internal data;
• External data from consortium;
• Scenario analyses; and
• Business environment and internal control factors (BEICFs).
The option to reduce capital requirements through insurance
mitigation or other risk-transfer instruments is currently not used.
The internal loss data is captured from the mandatory reporting
on operational losses of 10,000 euro and higher. Incident
reporting is signed-off by management and validated by the
Operational Risk function of the entity for quality assurance.
Internal loss data is used in the capital model for defining
frequency distributions and for calculating capital per entity.
The external loss data is based on quarterly reports from a
data consortium that specialises in operational risk loss data
collection. External loss data is reviewed on relevance and
suitability for the Rabobank organisation before being added to
the capital model. Consortium data is used in the capital model
for defining severity distributions.
Operational risk (OpRisk) is an integral part of doing business. Operational Risk Management (ORM) within Rabobank is aimed at having a healthy balance between the exposure to these risks and tools to manage these risks. The objective of ORM is to identify, measure, mitigate and monitor operational risk, and promote risk awareness and a healthy risk culture within Rabobank. Risk quantification and awareness helps management to set priorities in their actions and allocate people and resources thus enabling the bank to deliver full customer focus. Within Rabobank, operational risk is defined as the risk of losses resulting from inadequate or failed internal processes, people and systems or from external events, including potential reputational consequences.
Rabobank has developed a number of loss scenarios which
are used to substantiate and benchmark the model based
on internal and external historical data. An example is an
external fraud related scenario, which estimates the probability
and impact for Rabobank of the execution of unauthorised
transactions.
BEICFs are based on reports available at Group level or from
the entities. BEICFs are annually gathered using multiple risk
identification methods. The BEICFs are used in the capital model
as incentive to adjust the modelled capital. Rabobank uses the
following BEICFs:
• Business Environment and Internal Control factor assessments
at Group level;
• Scenario program at Group level (as stated above);
• Risk and control self-assessment at entity level; and
• Indicators for key risks and controls at entity level.
A schematic overview of Rabobank’s capital model is presented
in Figure 3.
Managing operational risksThe Rabobank Group Risk Management Committee
periodically has OpRisk on its agenda and is responsible
for ratifying the operational risk policy and its parameters
at Rabobank Group level. The primary responsibility for the
management of operational risk lies within the business,
as it should be fundamentally woven into their strategic
and day-to-day decision-making. Within the group entities,
risk management committees have an important role in
identifying and monitoring the operational risks of the entity.

Pillar 3 report 2017 59
These responsibilities are supported by Risk Management,
which provides oversight, tools, expertise and challenge to the
group entities and transparency throughout the Group and
towards senior management. The Group department of OpRisk/
RCF (Risk Control Framework) reports quarterly to the RMC
Per business unit, business line and event type
Per business line and event type
Incident frequency distributions
• Poisson distribution
• Average frequencies determined using weighting method
Stand-alone Annual loss distributions
• Combination of frequency distribution and severity
distribution using Monte Carlo
Incident severity distributions
• Body: Empirical distribution
• Tail: Parameterised distribution
Diversified Annual loss distribution Group
• Aggregation of stand-alone Annual loss distributions
using copula approach
Per business unit
Internal loss data
Internal loss+
External loss+
Scenario data
Incident frequency distributions
Incident severity distributions
Stand-alone Annual loss distributions
Diversified Annual loss distribution Group RC and EC Group
RC and EC BUs
Figure 3: Capital model
Group on Risk appetite and other developments with impact
for the group wide OpRisk profile.
Rabobank recognises the following operational risk types in line
with regulatory and industry practice:
Risk type Definition Management actions
Fraud Risk that an internal or external party obtains an undue personal benefit at the expense of our organisation (or at the expense of a customer or client whose property we are responsible for safeguarding).
Rabobank has implemented measures on all levels in the organisation to mitigate this risk, including scanning of electronic banking and Know-your-customer (KYC) policies.
System Failure(IT Risk)
Risk that infrastructure or systems fail, possibly leading to business disruption, creating a financial impact. Also the risk of losses arising from systems intrusion and invasion, online data fraud or deception schemes for profit, external identity theft through system intrusion and skimming or electronic eavesdropping.
Maintaining a well-functioning and secure IT environment is crucial to the performance of Rabobank. To this end there is a specific IT risk management team within OpRisk.
Clients, Products and Business Practices
The risk of not exercising due care in dealings with clients and customers, conduct and contract breaches by the organisation and its staff, conflicts of interest, inappropriate products and business practices, as well as compliance or governance breaches.
Various measures have been implemented to deal with this area, including a Product Approval Process.
Execution, Delivery and Process Management
The risk of direct and indirect losses incurred when a prearranged operational task or transaction is executed improperly. Includes transactional errors, non-transactional errors and errors relating to client or customer service delivery and includes errors or mistakes arising from reference data issues.
As this category is a part of the day-to-day operations of Rabobank, primary responsibility lies with the entities units, as they are the first line of defence.
Business Disruption (Business Continuity)
The risk of impact to the organisation which disrupt its ability to continue to deliver Rabobank products and services at acceptable predefined levels.
Although Business Continuity Management (BCM) is not recognised as a specific Operational risk, OpRisk has close links with BCM. Within Rabobank, a specific BCM organisation liaises with the entities for effective management of risks.
Damage to Physical Assets and Injury
The risk of losses attributable to natural disaster, wilful injury or accident/negligence, entailing significant property damage, contamination or physical injury.
This category is primary managed by Business Continuity, Security and amongst others by assessing specific risks and controls in the Rabobank Scenario Program and Risk Assessments.
Employment Practices and Workplace Safety
The risk of losses arising from acts inconsistent with laws or agreements governing employment, employee health or safety, or from diversity or discrimination events involving internal employees.
This category is managed by the first line of defence supported by second line functions such as HR, Compliance, Legal and Operational Risk Management.
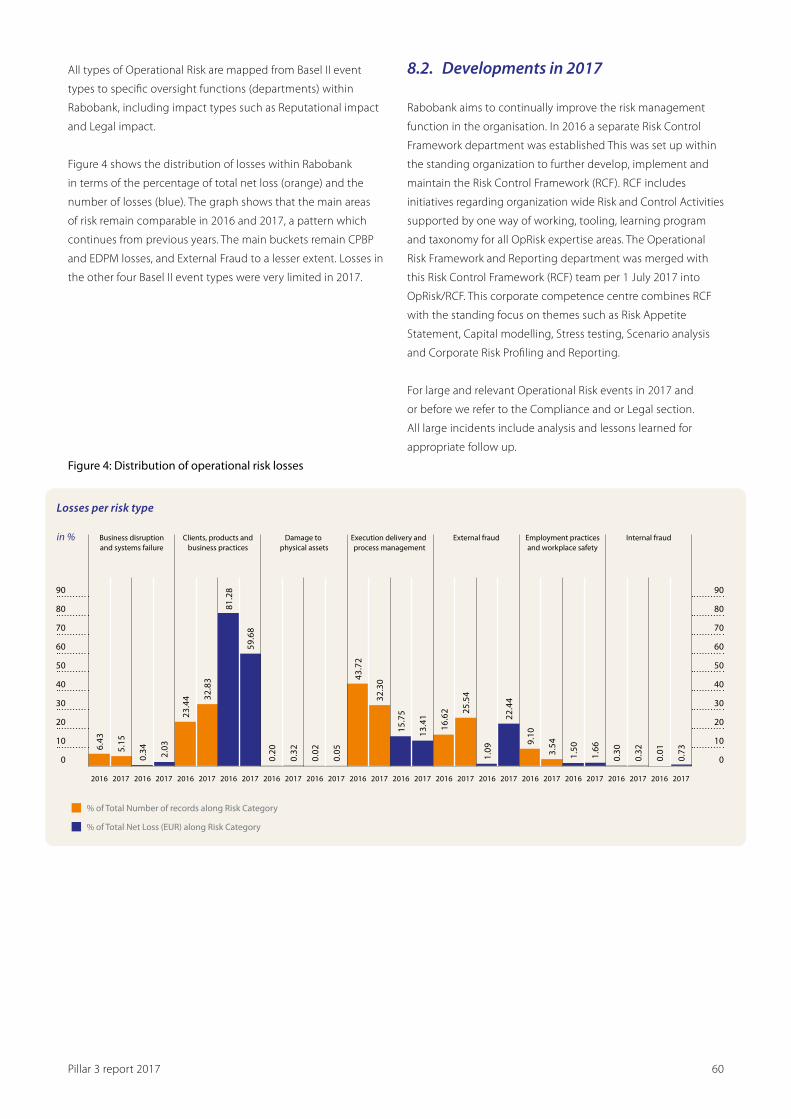
Pillar 3 report 2017 60
All types of Operational Risk are mapped from Basel II event
types to specific oversight functions (departments) within
Rabobank, including impact types such as Reputational impact
and Legal impact.
Figure 4 shows the distribution of losses within Rabobank
in terms of the percentage of total net loss (orange) and the
number of losses (blue). The graph shows that the main areas
of risk remain comparable in 2016 and 2017, a pattern which
continues from previous years. The main buckets remain CPBP
and EDPM losses, and External Fraud to a lesser extent. Losses in
the other four Basel II event types were very limited in 2017.
8.2. Developments in 2017
Rabobank aims to continually improve the risk management
function in the organisation. In 2016 a separate Risk Control
Framework department was established This was set up within
the standing organization to further develop, implement and
maintain the Risk Control Framework (RCF). RCF includes
initiatives regarding organization wide Risk and Control Activities
supported by one way of working, tooling, learning program
and taxonomy for all OpRisk expertise areas. The Operational
Risk Framework and Reporting department was merged with
this Risk Control Framework (RCF) team per 1 July 2017 into
OpRisk/RCF. This corporate competence centre combines RCF
with the standing focus on themes such as Risk Appetite
Statement, Capital modelling, Stress testing, Scenario analysis
and Corporate Risk Profiling and Reporting.
For large and relevant Operational Risk events in 2017 and
or before we refer to the Compliance and or Legal section.
All large incidents include analysis and lessons learned for
appropriate follow up.
% of Total Number of records along Risk Category
% of Total Net Loss (EUR) along Risk Category
Losses per risk type
in %
60
70
80
90
50
40
30
20
10
0
60
70
80
90
50
40
30
20
10
0
2016 2017 2016 2017 2016 2017 2016 2017 2016 2017 2016 2017 2016 2017 2016 2017 2016 2017 2016 2017 2016 2017 2016 2017 2016 2017 2016 2017
6.43
5.15
0.34 2.03
23.4
4 32.8
3
81.2
8
59.6
8
0.20
0.32
0.02
0.05
43.7
2
32.3
0
15.7
5
13.4
1
16.6
2 25.5
4
1.09
22.4
4
9.10
3.54
1.50
1.66
0.30
0.32
0.01
0.73
Business disruptionand systems failure
Clients, products andbusiness practices
Damage to physical assets
Employment practicesand workplace safety
Execution delivery and process management
External fraud Internal fraud
Figure 4: Distribution of operational risk losses

Pillar 3 report 2017 61
9. Market risk
Section Description Key risk indicators Monitoring
9.1 Market risk trading environment
Market risk arising from the bank’s trading activities. Rabobank’s trading activities are customer driven or for the purpose of the bank’s own balance sheet management.
Value at Risk, event risk, interest rate delta
Daily
9.2 Interest rate risk banking environment
Interest rate risk arising from the bank’s activities not related to trading. This occurs mainly within the retail banking business as a result of the difference in interest rate fixing periods between assets and liabilities and implicit options in various customer products.
Equity at Risk, Income at Risk, basis point sensitivity
Weekly/Monthly
9.3 Currency risk banking environment
Currency risk arising from the bank’s activities not related to trading. This mainly concerns translation risk resulting from capital invested in foreign operations.
None Monthly
Within the trading environment, the most significant types of
market risk are: interest rate risk (including basis risk), credit
spread risk and currency risk. Risk positions acquired from
clients can either be redistributed to other clients or managed
through risk transformation (hedging). The trading desks
are also acting as a market-maker for secondary markets (by
providing liquidity and pricing) in interest rate derivatives and
debt, including Rabobank Bonds and Rabobank Certificates.
Market risk in the trading environment is managed and
monitored on a daily basis within the trading market risk
framework. This framework contains all derivatives in trading
books, as well as the loan syndication books, the short term
funding books, securities finance & repo books and the bond
trading books. A prudent limit and control framework is in
place.
Within the banking environment the most significant type of
market risk is interest rate risk. Rabobank is mainly exposed
to interest rate risk in the banking environment as a result of
(1) mismatches between the repricing period of assets and
liabilities and (2) embedded optionality in client products.
Rabobank is also exposed to currency risk in the banking
environment. This currency risk is mainly translation risk on
capital invested in foreign activities. Other non-trading currency
risks are mostly hedged.
Market risk is the risk that the bank’s earnings and/or economic value may be negatively affected by changes in interest rates or market prices. Exposure to a certain degree of market risk is inherent in banking and creates the opportunity to realise profit and value. In the management and monitoring of market risk, a distinction is made between market risk in the trading environment and market risk in the banking environment. The various market risks are discussed in the sections below.
Where market risk in the trading environment is managed
within the trading market risk framework, market risk in the
banking environment is managed and monitored within the
Asset & Liability Management (ALM) framework. The exposures
covered by the ALM framework are far more stable than the
exposures in the trading market risk framework. Therefore, they
are managed and monitored on a weekly and/ or monthly basis.
A large part of the structural interest rate and currency risks
arising from the banking activities are transferred through
internal derivative transactions to the trading environment.
Within the trading environment these risks are for the most part
hedged in the market.
It is not possible to make a direct link between the items on
the bank’s balance sheet and the various figures for market
risk. This is because the bank’s balance sheet only contains
transactions with third parties. The published market risk figures
for the trading books are based on both transactions with third
parties and transactions with internal parties in the banking
environment. The same applies to the disclosed interest rate
and currency risk figures for the banking books, which are
based on both transactions with third parties and transactions
with internal parties in the trading environment.
Pillar 3 report 2017 62
Monitoring of market risk exposures occurs on portfolio level,
business unit level (where applicable) and for Rabobank
cosolidatedConsolidated against the approved Limit and
Controls structures or approved Risk Appetite Statement.
Any limit excesses need to follow the defined sign off and
reporting procedure. Regular risk reporting to Risk Management
Committees and senior management is in place to ensure the
communication of key risk developments takes place. Risk
developments that require ad hoc attention are communicated
accordingly outside the regular reporting cycle.
Regulatory CapitalStandardised Approach Regulatory Capital charges are
calculated for positions in the Trade & Commodity Finance (TCF)
department and for FX positions which are both categorised as
non-trading.
For portfolios that have been categorised as trading book, own
funds requirements are being calculated within the Market
Risk Solvency Framework. The VaR, stressed VaR, Incremental
Risk Charge (IRC) and Risk Weightings for Securitisations (RWS)
are used in the calculation of Regulatory Capital for market risk
in the trading portfolios. Rabobank has the approval to use
the Internal Method Approach (IMA) and specific risk for all
portfolios relevant for the trading book. The VaR, stressed VaR
and IRC are calculated using the Internal Method Approach
(IMA), while the Standardised Approach is used for the RWS.
This methodology is based on the standardised approach,
already used for the banking book, which applies a fixed risk
weight to a position based on rating, seniority, granularity and
product type (securitisation or re-securitisation). All banks for
which IMA is approved are required to use the Standardised
Approach of RWS. Also under the standardised approach are
the positions in Collective Investment Units (CIU). A confidence
interval of 99% and a holding period of 10 days is used for the
VaR and stressed VaR in the calculation of the Regulatory Capital
of the trading portfolios. All assumptions in the RC models are
subject to periodic review and validation ensuring validity of all
model assumptions and correctness of underling premises.
Finally, a capital charge is calculated for Risks Not In Model
(RNIM). Next to the significant risks covered in the VaR and IRC
models, Rabobank has a RNIM framework in place to capture
risks that are not adequately covered in those models. Risk
factors included in RNIM are amongst others some basis and
volatility risks. Risk not in the models are checked frequently
and added to the RNIM framework. RNIM are frequently
reviewed to assess if inclusion in the model is possible.
The capital charge on 29 December 2017 amounts to 7.5
(RWA: 94 ) and is reported in template 4 under the Advanced
IRB (AIRB) approach.
9.1. Trading Market Risk
Market Risk arises from the risk of losses on trading book
positions affected by movements in interest rates, equities,
credit spreads, currencies and commodities. Risk positions
acquired from clients can either be redistributed to other clients
or managed through risk transformation (hedging). The trading
desks are also acting as a market-maker for secondary markets
(by providing liquidity and pricing) in interest rate derivatives
and debt, including Rabobank Bonds and Rabobank Certificates.
Market risk in the trading environment is monitored daily within
the market risk framework. Rabobank’s market risk is relatively
small as evidenced by the low Risk Weighted Exposure Amounts
(RWEA) compared to that of credit risk and, to a lesser extent,
operational risk.
9.1.1. Trading Market Risk frameworkThe trading market risk framework is put in place to measure,
monitor and manage market risk in the trading books. Market
Risk is governed by the Market Risk Policy and the Market Risk
Standard. The Management Board determines Rabobank’s risk
appetite and its risk limits on an annual basis. A cascading limit
structure with an increasing granularity of limits is implemented
from Rabobank consolidated level down to business units
Markets and Treasury and portfolio level. The Limit and Control
Structures (LCS) defines the trading strategy, explains the
objective and the nature of trading and hedging activities
which a business unit or a portfolio is allowed to perform. In
addition to the LCS, a number of other elements exist. Among
others, the market risk functional document, a set of well
documented and monitored internal procedures and the new
business/product approval process, provide the input for the
identification, thorough monitoring and managing of material
risks within the trading books. Hedging risk and the continuing
effectiveness off hedges are covered in section 2.3, page 178 of
the annual report.
On consolidated level, the risk appetite is defined for VaR, event
risk and interest rate delta. In addition to the VaR limits, an
extensive system of other limits and trading controls for each
book is in place to ensure that risks that offset each other, or
which are not covered by the VaR framework are not overlooked.
These controls include tenor basis swap risk, commodity and
equity cash delta, interest rate (IR) delta bucket limits, notional
limits and FX exposure limits.. In order to weigh the risk of
‘abnormal’ market conditions, the effects of certain extreme
events (event risk) are calculated daily. These extreme events
can be historical events or plausible hypothetical scenarios.
Market Risk Exposures are calculated on a daily basis according
to the approved methodologies for the respective risk measure.
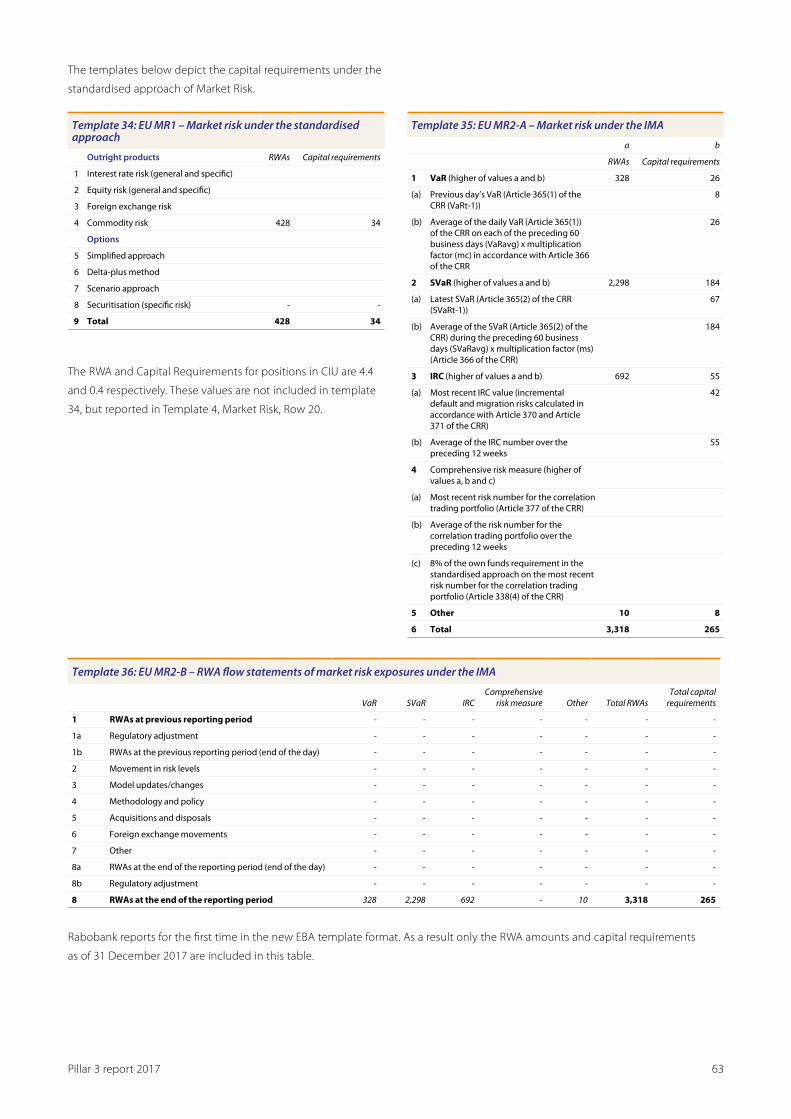
Pillar 3 report 2017 63
The templates below depict the capital requirements under the
standardised approach of Market Risk.
Template 34: EU MR1 – Market risk under the standardised approach
Outright products RWAs Capital requirements
1 Interest rate risk (general and specific)
2 Equity risk (general and specific)
3 Foreign exchange risk
4 Commodity risk 428 34
Options
5 Simplified approach
6 Delta-plus method
7 Scenario approach
8 Securitisation (specific risk) - -
9 Total 428 34
The RWA and Capital Requirements for positions in CIU are 4.4
and 0.4 respectively. These values are not included in template
34, but reported in Template 4, Market Risk, Row 20.
Template 35: EU MR2-A – Market risk under the IMA
a b
RWAs Capital requirements
1 VaR (higher of values a and b) 328 26
(a) Previous day’s VaR (Article 365(1) of the CRR (VaRt-1))
8
(b) Average of the daily VaR (Article 365(1)) of the CRR on each of the preceding 60 business days (VaRavg) x multiplication factor (mc) in accordance with Article 366 of the CRR
26
2 SVaR (higher of values a and b) 2,298 184
(a) Latest SVaR (Article 365(2) of the CRR (SVaRt-1))
67
(b) Average of the SVaR (Article 365(2) of the CRR) during the preceding 60 business days (SVaRavg) x multiplication factor (ms) (Article 366 of the CRR)
184
3 IRC (higher of values a and b) 692 55
(a) Most recent IRC value (incremental default and migration risks calculated in accordance with Article 370 and Article 371 of the CRR)
42
(b) Average of the IRC number over the preceding 12 weeks
55
4 Comprehensive risk measure (higher of values a, b and c)
(a) Most recent risk number for the correlation trading portfolio (Article 377 of the CRR)
(b) Average of the risk number for the correlation trading portfolio over the preceding 12 weeks
(c) 8% of the own funds requirement in the standardised approach on the most recent risk number for the correlation trading portfolio (Article 338(4) of the CRR)
5 Other 10 8
6 Total 3,318 265
Template 36: EU MR2-B – RWA flow statements of market risk exposures under the IMA
VaR SVaR IRCComprehensive
risk measure Other Total RWAsTotal capital
requirements
1 RWAs at previous reporting period - - - - - - -
1a Regulatory adjustment - - - - - - -
1b RWAs at the previous reporting period (end of the day) - - - - - - -
2 Movement in risk levels - - - - - - -
3 Model updates/changes - - - - - - -
4 Methodology and policy - - - - - - -
5 Acquisitions and disposals - - - - - - -
6 Foreign exchange movements - - - - - - -
7 Other - - - - - - -
8a RWAs at the end of the reporting period (end of the day) - - - - - - -
8b Regulatory adjustment - - - - - - -
8 RWAs at the end of the reporting period 328 2,298 692 - 10 3,318 265
Rabobank reports for the first time in the new EBA template format. As a result only the RWA amounts and capital requirements
as of 31 December 2017 are included in this table.

Pillar 3 report 2017 64
Table 12
VaR (1 day, 97.5%)
Interest Credit Currencies Shares Commodities Diversification Total
2017 – 29 December 2.9 0.8 0.2 0.0 0.1 (0.8) 3.1
2017 – average 3.4 0.8 0.2 0.0 0.2 0.0 3.8
2017 – Highest 4.7 1.3 1.2 0.1 2.4 0.0 4.9
2017 – Lowest 2.6 0.6 0.0 0.0 0.1 0.0 3.0
2016 – 30 December 4.5 0.6 0.4 0.0 0.2 (1.5) 4.3
2016 – average 4.1 1.1 0.2 0.2 0.2 0.0 4.4
2016 – highest 6.3 1.7 0.7 0.7 0.8 0.0 6.9
2016 – lowest 3.3 0.6 0.1 0.0 0.1 0.0 3.5
Internal VaR ModelThe internal VaR model forms a key part of Rabobank’s market
risk framework. Rabobank has opted to apply a VaR model
based on historical simulation for which one year of historical
data is used with no weighting scheme, which is updated
daily. A drawback of using historical simulations is that it does
not necesserily take into account all possible future market
movements. The approved IMA model covers all the trading
activities mentioned in paragraph 9.1. These activties are
predominantly located in the Markets and Treasury business
units of Rabobank. The risk factors covered are interest rate, FX,
equity,commodity and credit.
For internal risk management purposes, Rabobank has opted
for a confidence level of 97.5% and a time horizon of one day.
The VaR used in the calculation of the capital requirement for
market risk uses a confidence interval of 99% and a holding
period of 10 days as prescribed by the regulator. Rabobank has
chosen for 97.5% as this provides a more stable measure which
is more suitable for monitoring trading postions with daily
monitoring than is the case with higher confidence intervals. In
addition, Rabobank complements VaR with stress testing to look
at stressed market circumstances. This approach becomes less
appropriate when using VaR with higher confidence intervals.
For the 99%, 10 day VaR calculation used in the calculation
of the capital requirement, Rabobank uses 10 day market
risk shocks, with overlapping periods. No scaling is applied.
Rabobank uses a single model which combines general and
specific risk in the aggragation. In the calculation of VaR,
relative or absolute shocks are used to determine the potenitial
movements in risk facotrs. Whether relative or abosolte shocks
are applied, depends on the risk factor. Rabobank uses Full
Revalation in the calculation of VaR. For linear interest rate and
FX products, delta approximation is used.
Due to Rabobank’s strategy of client risk redistribution, risk
transformation (hedging) and the low secondary market
activity, the real market risk exposure of the trading portfolio
is well within the risk appetite boundaries. Table 12 shows the
development of market risk during 2017, as measured by the
VaR with a one day holding period and 97.5% confidence level.
In 2017, the VaR fluctuated between 3.0 and 4.9, the average
being 3.8. On 29 December 2017, the consolidated VaR was 3.1.
This relatively limited position was well within the internal VaR
limit. Also during the year, the VaR was well within the limit.
Changes in VaR have been driven by client related deals and
volatility in the financial markets.
Stressed Value at Risk (stressed VaR)According to the regulations stressed VaR replicates a VaR
calculation for the bank’s current portfolio using historical
scenarios based on a one year stressed period. The period
that Rabobank uses for stressed VaR runs from 5 June 2008
until 4 June 2009. This was the most stressful year during the
recent global financial crisis. Analysis showed that historical
market data movements in this period generated the largest
losses given the positions in Rabobank’s trading portfolios. The
stressed VaR period is reviewed every month. In case it appears
that market movements in another historical one year period
cause the largest losses, the stressed VaR period is changed to
that period. The period has not changed during the year.

Pillar 3 report 2017 65
Template 37: EU MR3 IMA values for trading portfolios
VaR (10 day 99%)
1 Maximum Value 19
2 Average Value 12
3 Minimum Value 6
4 Period End 8
SVaR (10 day 99%)
5 Maximum Value 84
6 Average Value 64
7 Minimum Value 48
8 Period End 66
IRC (99.9%)
9 Maximum Value 77
10 Average Value 54
11 Minimum Value 33
12 Period End 42
Comprehensive risk capital charge (99.9%)
13 Maximum Value
14 Average Value
15 Minimum Value
16 Period End
The Comprehensive Risk Capital charge is not applicable to
Rabobank as it does not have a correlation trading portfolio.
Back testingBack testing is a risk management technique to evaluate
the quality and accuracy of internal VaR models. In essence,
back testing is a routine comparison of model generated risk
measures (daily VaR) with the subsequent trading outcomes
(hypothetical or actual Profit & Loss). It is expected that the
calculated VaR will be larger than all but a certain fraction of
the trading outcomes, where this fraction is determined by the
confidence level assumed by the VaR measure.
Among others, the performance of the VaR model is dependent
on the risk factors covered by the VaR framework, the accuracy
of the methodology applied and on the quality of the market
data used to generate the historical scenarios. Inaccuracies in
these items can lead to an abnormal number of outliers which
could be an indication of inadequate quality of the internal
model. Another source for outliers are technical issues. Using
back tests, the quality of the VaR model can be assessed, both
in terms of the distributional assumptions, historical market
data validation and transaction or position registration. In line
with regulation, Rabobank uses the 99% confidence level, 1-day
holding period VaR for the purpose of back testing. Back tests
are carried out at consolidated level and at book level, using
both actual P&L and hypothetical P&L. Back testing results
are reported to the regulator on a quarterly basis. Outliers are
reported and individually analysed if they exceed an operational
threshold (50,000 for books with a VaR smaller or equal 500,000,
and 0.15 times VaR for books with a VaR larger than 500,000).
Rabobank uses a 99%, 10-day holding period for SVAR where
the 10 day SVaR is directly modelled in similar fashion to
the 99%, 10-day VaR used in the calculation of the capital
requirement for market risk. Full Revalation is used in the
calculation of SVaR. For linear interest rate and FX products,
delta approximation is used.
Incremental Risk ChargeThe Incremental Risk Charge (IRC) captures credit risk in the
trading portfolio that is not captured in the VaR. This risk arises
from the fact that the issuers of bonds, the reference name of
Credit Default Swaps or other issuer risk related products that
Rabobank holds in its trading portfolio might default or suffer
from a rating migration. This can result in a loss for Rabobank.
Rabobank uses a transition-matrix based asset value model
to calculate IRC. The current issuer risk portfolio is used as a
starting point. The transition-matrix is estimated using statistical
models on migration and default data. Rabobank uses the
regulatory floor of 3 months as liquidity horizon, (i.e. it is
assumed that positions cannot be sold within three months in
stressed circumstances).
A Monte Carlo simulation results in possible 4 outcomes of
losses due to defaults and migrations in the portfolio within
three months. The input parameters to the model are EADs
based on MTM, short term PDs estimated from 1 year PDs,
migration matrices, LGD per issuer type, migration losses and
regulatory prescribed IRB correlations. Under the constant risk
assumption Rabobank adds the outcomes of four 3-month
profit and losses to arrive at a one year loss. The resulting
99.9% worst observation from the profit and loss distribution
represents the IRC Regulatory Capital. Template 37 shows, the
period end, mean, highest and the lowest IRC amount during
2017.
Extensive stress testing and sensitivity analysis is performed
as part of periodic model review. It includes, but is not limited
to, correlation, LGD and PD scenarios, as well as impact from
adverse market scenarios and liquidity assumptions. The IRC
models are validated according to the process set out in section
4.4.1, page 84 of this document.

Pillar 3 report 2017 66
calculation is derived from the yield curves which are used to
value the trades. By doing so Rabobank also aims to achieve
maximum correlation between the actual profit or loss and
hypothetical profit or loss figures.
Rabobank has improved its valuation by including the
Cheapest-to-deliver option that often appears in CSA contracts.
Stress testingRabobank recognises that VaR, due to its underlying statistical
assumptions, must be complemented by stress testing for
a more complete risk assessment. Stress testing is used to
measure events that are not captured by the VaR model. It is
instrumental in gauging the impact of extreme, yet plausible
predefined moves in market risk factors on the P&L of individual
trading and investment portfolios. Rabobank designed a large
number of global scenarios based on book composition and
current macro/economic financial markets situations. Risk
drivers captured by these scenarios include among other
things: tenor basis swap spreads, interest rates, credit spreads,
volatility and interest rate rotation. The shocks applied are
determined using historical calibration or are based on expert
judgment. The scenarios are global and homogeneous for all
geographical regions.
Rabobank uses sensitivity stress scenarios for the following risk
factor categories:
• Interest rates;
• Interest rate volatility;
• Interest rate curve rotation;
• Credit spreads;
• Commodities;
• Commodity volatility;
• FX rates;
• FX volatility;
• Equities;
• Equity volatility;
• Treasury spreads;
• Inflation related products;
• Tenor basis swap spreads;
• Bond - CDS spread.
In each sensitivity stress scenario extreme shocks for one
particular risk factor category are applied. These shocks
generally represent up- and downward movements in the risk
factors. A book’s sensitivity is examined daily by applying all
relevant sensitivity scenarios with an aim to report a maximum
negative result as exposure under a trading control. The size
of the shocks depends on, among other things: different
asset classes, sectors, regions and liquidity horizons. Liquidity
horizons vary between 10 and 120 days, depending on the
type of asset and risk factor. The liquidity horizon provides an
The number of outliers over a rolling window of one year
determines an additional charge to the capital multiplier used
on the VaR and stressed VaR in the RC calculation. If the number
of outliers on consolidated level exceeds a given number based
on the 99% confidence level of the VaR measure, a capital
multiplier has to be applied. In 2017, there were zero actual and
zero hypothetical P&L outliers which exceeded the consolidated
VaR. On 29 December, there is no additional charge for
Rabobank as the number of outliers was below the threshold of
4 CRR (CRD IV).
Template 38: MR4 Comparison of VaR estimates with gains/lossesin millions of euros
8
7
6
5
4
3
2
1
0
Jan Feb Mar Apr May June July Aug Sep Oct Nov Dec
ValuationThe valuation of the trading portfolio positions is based on, or
derived from, observable prices or curve inputs. The availability
of observable prices or curve inputs varies by product and
market, and may change over time. In some markets or for
certain products, observable prices or inputs are not available,
and fair value is determined using valuation techniques
appropriate for the particular product. The data sources are
consistent between various products and independent of any
Rabobank activity. If in exceptional cases, in a start-up phase,
curves are not independently maintained, a minimum of a
monthly independent validation is a requisite. These curves
will be subject to a yearly review in order to define if database
providers have caught up with the market evolution and
allow independent monitoring in the future. The department
accountable for the valuation process is independent of the
front office.
Rabobank aims to include all liquid inputs of its valuation
models as risk factors in its market risk models and to achieve
maximum alignment between the valuation and risk models.
For instance, for interest rate portfolios a large variety of
forecasting and discounting curves are used to value the
products within them. All these curves are treated as separate
risk factors in the risk models. The historical yield curve data
which is used to generate the historical scenarios for the VaR

Pillar 3 report 2017 67
9.2. Non-trading Interest Rate Risk
Interest rate risk in the banking book at Rabobank is mainly
caused by:
• Maturity mismatches between loans and funds entrusted.
Rabobank provides mortgages and commercial loans with
long fixed-interest terms. These mortgages and loans are
partly financed by customers’ savings, customers’ current
account balances and partly with funding provided by
professional money market and capital market players;
• Quotation risk. The majority of homebuyers with a mortgage
proposal will pay the lowest of two rates: the rate offered or
the rate when the loan is effectively drawn down;
• Prepayment risk. Customers wishing to repay or to refinance
their loans early are not always required to pay an early
redemption fee;
• Withdrawal risk. A large proportion of the customer credit
balances in current accounts, payment accounts and savings
accounts is callable on demand.
These risk factors in the banking book are influenced by
customer decisions regarding roll over, early termination or the
term of interest rate fixing. These decisions, also called customer
behaviour, are an important determining factor with respect
to interest rate risk in the banking environment. Whereas
interest rate risk in the trading environment depends on the
contract terms of each transaction, in the banking environment
assumptions regarding behaviour play a larger role. Measuring,
understanding and anticipating customer behaviour is therefore
key in managing interest rate risk in the banking book.
9.1.2. Non-trading Interest Rate Risk frameworkRabobank accepts a certain level of interest rate risk in the
banking environment. This follows from investment of the
bank’s own funds as well as from the transformation function
of the bank, i.e. enabling firms and individuals to make longer-
term capital investments funded by shorter-term entrusted
deposits and savings. At the same time, the bank seeks to avoid
any material unexpected swings in earnings and economic
value caused by interest rate movements. Therefore, the
Managing Board, under supervision of the Supervisory Board,
determines the interest rate risk appetite and the corresponding
limits on an annual basis. Within these targets, the treasury
departments within the bank are in charge of the steering
of interest rate risk in the banking books. They manage this
exposure through funding and hedging transactions. Reports
on the actual exposure to interest rate risk in the banking books
are submitted to the responsible Asset & Liability Management
and Risk Management committees on a monthly basis. The
actual exposure is also periodically, (i.e. on a quarterly basis),
reported to the supervisory authorities.
estimate of the amount of days it takes to liquidate a position
in the market or replace a hedging position in times of stress.
For less liquid treasuries, corporate bonds and products with
optionality the horizon is longer.
In addition to these sensitivity scenarios, Rabobank also uses
real historical and hypothetical scenarios to gain insight into
the impact of such scenarios on the P&L of the trading book. In
these stress scenarios multiple risk factor categories are shocked
at the same time.
On 29 December 2017, the event risk amounted to 111 well
within the set limit. Rabobank’s event risk is largely determined
by the tenor basis swap position, which comes from non-client
facing positions of a more strategic nature which are classified
as permitted proprietary trading activities outside the United
States under the Volcker Rule.
Table 13: Event Risk
Event risk
2017 – 29 December 111
2017 – average 101
2017 – highest 116
2017 – lowest 86
Interest Rate DeltaThe Interest Delta indicates how the value of positions changes
if the relevant yield curve shows a parallel increase by 1 basis
point. These positions are shown in Table 14 for each key
currency in the Rabobank portfolio as per 29 December 2017.
Table 14: Interest Rate Delta
Interest Rate Delta
EUR 0.5
USD 0.0
CHF 0.1
Other 0.1
Total 0.7

Pillar 3 report 2017 68
Table 15: Modified Duration
MD
31 December 2017
31 December 2016
Modified Duration (%) Group level in EUR 2.0% 1.4%
Split by main currencies
Modified Duration (%) – EUR 2.3% n/a
Modified Duration (%) – USD -3.4% n/a
Risk Appetite and developments relating to EaRThe key measure used by Rabobank to manage interest rate
risk from an earnings perspective is the EaR. The EaR is the
largest deviation in negative terms of the expected net interest
income in the next 12 months as a result of different interest
rates scenarios. The limit for this measure was 500 in 2017.
The EaR analysis does not take into account active management
intervention, but it does use baseline volume projections from
the business.
Table 16: Earnings at Risk
EaR
31 December 2017
31 December 2016
Earnings at Risk 148 82
Split by main currencies
Earnings at Risk – EUR 104 n/a
Earnings at Risk – USD 37 n/a
In 2017, Rabobank’s net interest income suffers the most under
an interest rate downward scenario throughout the year. On
31 December 2017 the EaR ended up at 148, higher than the
EaR of 82 in 2016. This is mainly caused by a larger assumed
downward shock of the EUR yield curve (25bps in December
2017 vs 10bps in December 2016). The change of the size
of the downward shock is mainly caused by a change in the
methodology.
9.3. Non-trading currency risk
Currency risk is the risk that the bank’s financial result and/
or economic value could be negatively affected by changes
in exchange rates. The bank distinguishes two types of non-
trading currency risks: (i) Currency risk in the banking books and
(ii) Foreign Exchange (‘FX’) translation risk.
9.1.3. Risk measurementRabobank uses three standard measures for measuring,
managing and controlling the interest rate risk in the banking
book arising from changes in the level of interest rates:
• Modified Duration (MD),
• Basis Point Value (BPV), and
• Earnings at Risk (EaR).
The BPV of equity per maturity is used to control and
manage the risk of changes in the shape of the yield curve.
These measures are also used to express the Risk Appetite of
Rabobank.
In addition to the three standard measures of interest rate risk
in the banking books, Rabobank regularly analyses the effect
of one or more macroeconomic scenarios on its earnings and
economic value. The results of this analysis are important for
integrated interest rate risk management purposes and are
included in reports to senior management. Furthermore, the
amount of capital required to compensate for the effect of
unfavourable interest rate developments is calculated on the
basis of historical scenarios.
Risk Appetite and developments related to MD and BPV of equityThe key risk indicator used by Rabobank to manage interest
rate risk from the perspective of economic value is the Modified
Duration. The MD shows the percentage decline in the
economic value of equity if interest rates rise by 1 percentage
point. For 2017, the Managing Board determined a risk appetite
with a lower limit of 0% and an upper limit of 6%. The overall
modified duration in the banking book is the net result of the
client transactions in the various assets and liabilities business
lines (‘natural position’) as well as the funding and hedging
transactions by Treasury. Treasury operates within a strategic
mandate and risk appetite set by the Managing Board and
monitored by Risk Management. On a monthly basis, the
Asset and Liability Committee (ALCO), which includes the CFO
and CRO of the bank, reviews the interest rate and liquidity
targets and positions in the context of business and market
developments. The overall IRRBB (MD and EaR) position is
managed across all currencies. Due to the relatively small USD
position, uncommon specialized contracts (e.g. USD 350 million
of 100-year bonds) can have a profound impact on the MD
position in USD-terms. This is taken into account in the existing
risk framework. No limits were breached in the presented
situation as of year-end 2017.

Pillar 3 report 2017 69
Currency risk in the banking booksCurrency risk in the banking books, is the risk where currency
cash flow commitments and receivables in the banking books
are unhedged. As a result, it could have an adverse impact on
the financial results and/or financial position of the Group, due
to movements in exchange rates. Banking Books should be fully
hedged.
FX Translation riskTranslation risk is the risk that foreign exchange rate fluctuations
will adversely affect the translation of assets and liabilities
of operations – denominated in foreign currency – into the
functional currency of the parent company when consolidating
financial statements. Translation risk reveals in Rabobank’s
equity position as well as in its capital ratios.
Rabobank manages its translation risk with regard to its CET1
ratio by deliberately taking positions including deliberately not
or only partly closing positions. As a result of these (remaining)
structural positions the impact of exchange rate fluctuations on
Rabobank’s CET1 ratio is limited.
FX Translation risk and currency risk in the Banking books are
covered by the Foreign Exchange Risk Policy Global Standard
on Foreign Exchange Rabobank Group (‘Standard’). The policy
Standard is designed in order to protect the Rabobank Group
CET1 ratio against the effects of exchange rate movements.
Potential future FX movements of structural positions including
the FX Capital Securities are measured within the internal Pillar 2
capital. Potential future FX movements of structural positions
including the FX Capital Securities are measured within the
internal Pillar 2 capital.
Pillar 3 report 2017 70
Liquidity risk is the risk that the bank will not be able to meet all of its payment obligations on time, as well as the risk that the bank will not be able to fund increases in assets at a reasonable price. This could happen if, for instance, customers or professional counterparties suddenly withdraw more funds than expected which cannot be absorbed by the bank’s cash resources, by selling or pledging assets in the market or by borrowing funds from third parties. Maintaining a comfortable liquidity position and retaining the confidence of both professional market parties and retail customers have proved crucial, ensuring unimpeded access to the public money and capital markets for Rabobank.
10. Liquidity risk
10.1. Liquidity risk management framework
Rabobank’s policy is to finance client assets using stable funding,
that is, funds entrusted by customers and long-term wholesale
funding. Responsibility for the day-to-day management of the
liquidity position, the raising of professional funding on the
money and capital markets, and the management of the
structural position lies with the Treasury department.
Liquidity risk management is based on three pillars. The first
sets strict limits for the maximum outgoing cash flows for
different maturities within the wholesale banking business.
Rabobank measures and reports on a daily basis what
incoming and outgoing cash flows are expected during the
next twelve months. Limits have been set for these outgoing
cash flows, including limits and controls per currency. Detailed
plans (the contingency funding plans) have been drawn
up for contingency funding to ensure the bank is prepared
for potential crisis situations. Periodic operational tests are
performed on these plans.
The second pillar is to maintain a substantial high-quality buffer
of liquid assets. Besides cash balances held at central banks,
liquid securities can be used to pledge to central banks, in
repo transactions or be sold directly in the market to generate
liquidity immediately. The size and quality of the liquidity
buffer is aligned with the risk Rabobank is exposed to resulting
from our balance sheet. In addition, Rabobank has securitised
a portion of the mortgage loan portfolio internally, which is
pledged to the central bank, thereby serving as an additional
liquidity buffer. Since this concerns a retained securitisation, it is
not reflected on the consolidated balance sheet.
The third pillar for managing liquidity risk is to have a solid credit
rating, high capital levels and a prudent funding policy. Rabobank
takes various measures to avoid becoming overly dependent on
a single source of funding. These measures include balanced
diversification of funding sources with respect to maturity,
currencies, investors, geography and markets, a high degree of
unsecured funding (and therefore limited asset encumbrance)
and an active and consistent investor relations policy.
10.2. Risk measurement
Liquidity positionRabobank’s liquidity buffer remained robust in 2017. The total
liquidity buffer at 31 December 2017 measured in ‘High Quality
Liquid Assets’ (HQLA) was 86 (2016: 103) billion. The decrease
(in absolute terms) of the liquidity buffer is in line with a lower
net cash outflow due to a reduction of wholesale funding,
and is mainly visible in a lower amount of cash held at central
banks. The group consolidated liquidity buffer does take into
account transfer and inconvertibility restrictions. The European
Commission Delegated Act ‘Liquidity Coverage Ratio’ (DA
LCR) became a regulatory requirement as of 1 October 2015.
With 123% (2016: 130%) as per 31 December 2017 Rabobank
complies with the minimum 100% requirement as set by De
Nederlandsche Bank (DNB), the Dutch central bank. During
2017 Rabobank complied with the 100% requirement. Per
31 December 2017 the ‘Net Stable Funding Ratio’ (NSFR) as
monitored by the Basel Committee, is 119% (2016: 121%), which
is comfortably above the future requirement of 100%.
The central bank liquidity value of unencumbered retained
RMBS decreased by 8 billion, resulting from a slight increase
in the standard ECB haircut for retained RMBS and increased
TLTRO-II participation.

Pillar 3 report 2017 71
The table below provides an overview of the average LCR
composition, calculated as the average of the 12 month-end
LCR positions preceding the end of each calendar quarter. The
table contains 15 data points, covering the period October 2016
until December 2017.
Table 17: Liquidity buffer
Liquidity buffer
31 December 2017
31 December 2016
Liquidity value Liquidity value
Level 1 assets
Cash and withdrawable central bank reserves, excluding reserve requirements 57,853 75,399
Level 1 securities 23,104 26,297
Total stock of Level 1 assets 80,957 101,696
Level 2 assets 4,587 1,008
HQLA liquidity buffer 85,544 102,703
Central bank eligible retained RMBS 30,562 38,286
Total liquidity buffer 116,106 140,989
Template EU LIQ1
Total unweighted value (average) Total weighted value (average)
Quarter: Q1 2017 Q2 2017 Q3 2017 Q4 2017 Q1 2017 Q2 2017 Q3 2017 Q4 2017
Number of data points used: 6 9 12 12 6 9 12 12
High-quality liquid assets1 Total high-quality liquid assets (HQLA) 103,426 99,285 97,494 93,087
Cash-outflows2 Retail deposits and deposits from small business
customers, of which: 167,955 167,782 167,418 166,475 13,414 13,715 13,807 14,197
3 Stable deposits 104,550 103,859 103,509 101,886 5,227 5,193 5,175 5,094
4 Less stable deposits 61,386 61,237 60,939 60,746 7,682 7,850 7,889 8,142
5 Unsecured wholesale funding 129,839 127,688 126,613 125,507 71,925 70,102 69,725 68,544
6 Operational deposits (all counterparties) and deposits in networks of cooperative banks - - - - - - - -
7 Non-operational deposits (all counterparties) 119,113 118,303 117,348 117,118 61,199 60,717 60,460 60,154
8 Unsecured debt 10,726 9,385 9,265 8,389 10,726 9,385 9,265 8,389
9 Secured wholesale funding 2,621 2,250 2,612 2,487
10 Additional requirements 61,175 59,482 57,957 56,113 16,518 15,927 15,250 14,355
11 Outflows related to derivative exposures and other collateral requirements 11,732 11,244 10,613 9,748 11,732 11,244 10,613 9,748
12 Outflows related to loss of funding on debt products - - - - - - - -
13 Credit and liquidity facilities 49,443 48,238 47,344 46,365 4,785 4,683 4,638 4,606
14 Other contractual funding obligations 2,909 2,991 3,147 3,378 2,909 2,991 3,147 3,378
15 Other contingent funding obligations 62,586 61,963 61,796 61,361 3,129 3,098 3,090 3,068
16 Total cash outflows 110,516 108,083 107,632 106,029
Cash-inflows17 Secured lending (eg reverse repos) 20,243 20,733 21,987 23,727 17,193 17,410 17,668 18,743
18 Inflows from fully performing exposures 18,698 18,069 17,333 16,536 12,455 12,158 11,739 11,329
19 Other cash inflows 3,949 3,620 3,635 3,470 3,949 3,620 3,635 3,470
EU-19a (Difference between total weighted inflows and total weighted outflows arising from transactions in third countries where there are transfer restrictions or which are denominated in non-convertible currencies) 184 216 205 175
EU-19b (Excess inflows from a related specialised credit institution) - - - -
20 Total cash inflows 42,891 43,428 47,070 49,056 33,414 32,972 32,837 33,367
EU-20a Fully exempt inflows 42,891 43,097 46,143 47,507 33,414 32,972 32,837 33,367
EU-20b Inflows Subject to 90% Cap - - - - - - - -
EU-20c Inflows Subject to 75% Cap - - - - - - - -
21 Liquidity buffer 103,426 99,285 97,494 93,087
22 Total net cash outflows 77,102 75,112 74,795 72,662
23 Liquidity coverage ratio (%) 134% 132% 130% 128%
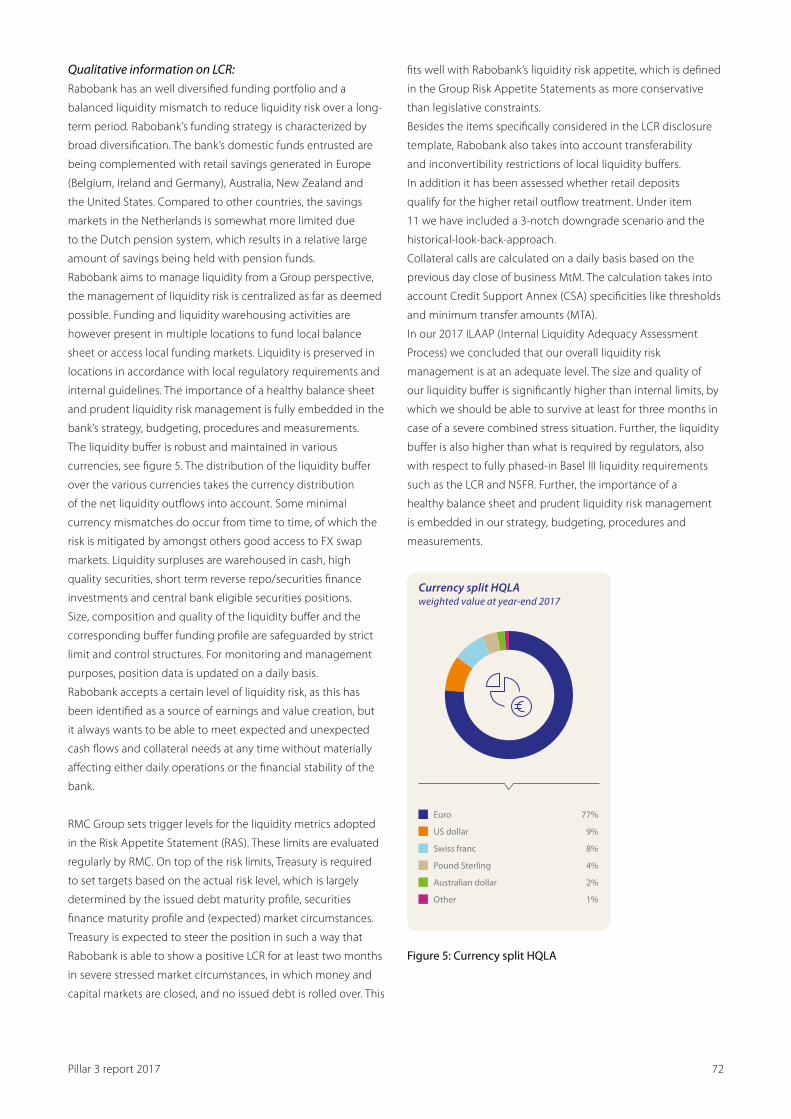
Pillar 3 report 2017 72
fits well with Rabobank’s liquidity risk appetite, which is defined
in the Group Risk Appetite Statements as more conservative
than legislative constraints.
Besides the items specifically considered in the LCR disclosure
template, Rabobank also takes into account transferability
and inconvertibility restrictions of local liquidity buffers.
In addition it has been assessed whether retail deposits
qualify for the higher retail outflow treatment. Under item
11 we have included a 3-notch downgrade scenario and the
historical-look-back-approach.
Collateral calls are calculated on a daily basis based on the
previous day close of business MtM. The calculation takes into
account Credit Support Annex (CSA) specificities like thresholds
and minimum transfer amounts (MTA).
In our 2017 ILAAP (Internal Liquidity Adequacy Assessment
Process) we concluded that our overall liquidity risk
management is at an adequate level. The size and quality of
our liquidity buffer is significantly higher than internal limits, by
which we should be able to survive at least for three months in
case of a severe combined stress situation. Further, the liquidity
buffer is also higher than what is required by regulators, also
with respect to fully phased-in Basel III liquidity requirements
such as the LCR and NSFR. Further, the importance of a
healthy balance sheet and prudent liquidity risk management
is embedded in our strategy, budgeting, procedures and
measurements.
Euro 77%
Swiss franc 8%
Pound Sterling 4%
Australian dollar 2%
Other 1%
US dollar 9%
Currency split HQLAweighted value at year-end 2017
Figure 5: Currency split HQLA
Qualitative information on LCR:Rabobank has an well diversified funding portfolio and a
balanced liquidity mismatch to reduce liquidity risk over a long-
term period. Rabobank’s funding strategy is characterized by
broad diversification. The bank’s domestic funds entrusted are
being complemented with retail savings generated in Europe
(Belgium, Ireland and Germany), Australia, New Zealand and
the United States. Compared to other countries, the savings
markets in the Netherlands is somewhat more limited due
to the Dutch pension system, which results in a relative large
amount of savings being held with pension funds.
Rabobank aims to manage liquidity from a Group perspective,
the management of liquidity risk is centralized as far as deemed
possible. Funding and liquidity warehousing activities are
however present in multiple locations to fund local balance
sheet or access local funding markets. Liquidity is preserved in
locations in accordance with local regulatory requirements and
internal guidelines. The importance of a healthy balance sheet
and prudent liquidity risk management is fully embedded in the
bank’s strategy, budgeting, procedures and measurements.
The liquidity buffer is robust and maintained in various
currencies, see figure 5. The distribution of the liquidity buffer
over the various currencies takes the currency distribution
of the net liquidity outflows into account. Some minimal
currency mismatches do occur from time to time, of which the
risk is mitigated by amongst others good access to FX swap
markets. Liquidity surpluses are warehoused in cash, high
quality securities, short term reverse repo/securities finance
investments and central bank eligible securities positions.
Size, composition and quality of the liquidity buffer and the
corresponding buffer funding profile are safeguarded by strict
limit and control structures. For monitoring and management
purposes, position data is updated on a daily basis.
Rabobank accepts a certain level of liquidity risk, as this has
been identified as a source of earnings and value creation, but
it always wants to be able to meet expected and unexpected
cash flows and collateral needs at any time without materially
affecting either daily operations or the financial stability of the
bank.
RMC Group sets trigger levels for the liquidity metrics adopted
in the Risk Appetite Statement (RAS). These limits are evaluated
regularly by RMC. On top of the risk limits, Treasury is required
to set targets based on the actual risk level, which is largely
determined by the issued debt maturity profile, securities
finance maturity profile and (expected) market circumstances.
Treasury is expected to steer the position in such a way that
Rabobank is able to show a positive LCR for at least two months
in severe stressed market circumstances, in which money and
capital markets are closed, and no issued debt is rolled over. This

Pillar 3 report 2017 73
Table 18: Funding mix
Access to funding
in billions of eurosat year-end
2017at year-end
2016
Funds entrusted 335.1 347.5
Domestic retail banking business 228.8 223.3
- Private individuals 133.6 131.1
- Other customers 95.2 92.2
Domestic non-retail banking 47.7 52.7
International 58.5 71.5
- Private individuals 27.4 28.9
- Other customers 31.1 42.7
Interbank funding 18.5 21.6
TLTRO 5.0 2.0
Repos 0.5 0.6
Wholesale funding 160.4 188.9
Short-term debt securities 37.7 45.8
- Of which CD/CP 33.8 42.0
- Of which ABCP 3.9 3.8
Long-term wholesale funding 122.7 143.1
- Of which Medium Term Notes 86.7 109.2
- Of which RMBS and other ABS 17.3 17.1
- Of which covered bonds 2.5 0.0
- Of which subordinated debt securities 16.1 16.9
Euro 52%
Australian dollar 7%
Pound Sterling 6%
Japanese yen 4%
Other 9%
US dollar 22%
Unsecured long-term bondsby currency, at year-end 2017
Figure 6: Unsecured long-term bonds by currency.
Of the HQLA liquidity buffer 67% (2016: 73%) consists of
deposits at central banks, mainly held at the DNB, the Federal
Reserve Bank of New York, the Swiss National Bank and the
Bank of England. The most liquid category of the buffer (Level 1
assets) constitutes approximately 95% of the HQLA buffer (and
70% of the total buffer). The liquidity buffer reported contains
unencumbered assets only and is managed by the Treasury
department. In addition to the HQLA buffer, a significant
amount of central bank eligible, retained unencumbered
RMBS notes, secured by residential mortgages originated
by Rabobank, is held as a buffer for liquidity purposes.
Furthermore, Rabobank has a portfolio of short-term secured
financing transactions, secured mostly by equity (28.2 billion),
that can be terminated or liquidated at short notice. Of this
portfolio, 6.9 billion is eligible for inclusion in the HQLA liquidity
buffer. The remaining 21.3 billion is not included in the Liquidity
buffer table.
Funding strategyThe bank’s funding strategy strives for diversification of funding
in terms of products, tenor, markets and currencies. As part of
the Strategic Framework 2016-2020, Rabobank aims to reduce
its wholesale funding. In 2017, wholesale funding outstanding
decreased from 189 billion to 160 billion, also impacted by
exchange rates. The table below shows the various funding
sources. The domestic retail banking business is to a large
extent funded by deposits from retail customers. In 2017, funds
entrusted by customers of the domestic retail banking business
increased, mainly due to an increase in current accounts and
savings from small businesses and corporates. Funds entrusted
by customers of the domestic non-retail banking business
decreased, mostly due to a decrease in deposits from non-
financial customers. Funds entrusted received internationally
decreased, this decrease can be observed in all segments and is
partly caused by exchange rate changes.

Pillar 3 report 2017 74
In 2017, Rabobank raised 9.8 billion of senior unsecured long-term funding in 15
different currencies. By operating on a global scale, the bank aims to avoid becoming
too reliant on a single source of funding. The average maturity of the newly raised
unsecured long-term funding is approximately 6.2 years (2016: 5.6 years). Of the
total wholesale funding more than 31 billion will mature after five years or more
as of year-end 2017. Rabobank is a frequent and flexible issuer of short-term debt
securities and has seen a solid inflow of funds in the past years, reflecting its solid
creditworthiness. The maturity of the short-term debt has increased in the past twelve
months. Per year-end 2017 the average maturity of short-term issued debt was 128
(2016: 114) days.
In May 2017 Rabobank added covered bonds to its funding mix. 2.5 billion was raised
through bonds covered by Dutch residential mortgages. Issuing covered bonds further
diversifies and optimises Rabobank’s funding composition. During 2017 Rabobank
increased the participation in the Targeted Long-Term Refinancing Operation-II
(TLTRO-II) from 2 billion to 5 billion.
Additional contractual obligations in case of a rating downgradeIn the event of a downgrade of Rabobank’s credit rating, the bank could be required to
provide additional collateral or be faced with an outflow of liquidity. The table below
shows the potential maximum outflow if the rating of Rabobank deteriorates by one,
two or three notches.
Table 19: Potential maximum outflow of liquidity
Potential maximum outflow of liquidity
31 December 2017
Funding Derivatives Other Total
Rating downgrade:
1 notch 1,188 19 176 1,383
2 notch 552 388 1,211 2,151
3 notch 1,120 1,389 265 2,774
Total for 3 notches 2,860 1,796 1,652 6,308
The table shows a split between funding, derivatives and other instruments. Funding
instruments include fixed-term deposits, bonds, loans and professional funding with
rating triggers. Derivatives can also contain rating triggers that result in additional
liquidity risk. In some cases, a rating trigger may have been agreed on services
provided to clients. For instance, a Letter of Credit or a guarantee on behalf of a client
granted by Rabobank may contain a rating trigger. Under certain circumstances, the
beneficiary of this guarantee may request that the guaranteed sum be paid out if the
rating of Rabobank drops. This initial outflow is recognised under ‘Other’. As a result
Rabobank has a direct claim on the customer for whom the guarantee was provided.
Asset encumbranceIn certain cases, assets on the bank’s balance sheet are encumbered. The EBA considers
an asset encumbered if it has been pledged or tied-up and is subject to any form of
arrangement to secure, collateralise or credit enhance any transaction from which it
cannot be freely withdrawn. As such, pledged assets that are subject to any restrictions
in withdrawal, such as assets that require prior approval before withdrawal or
replacement by other assets, should be considered encumbered.
Remaining maturity date calendar,long-term wholesale fundingat year-end 2017, in billions of euros
25
20
15
10
5
0
2018
2019
2020
2021
2022
2023
2024
2025
2026
2027
2027
+
Remaining maturity date calendar,short-term debt securitiesat year-end 2017, in billions of euros
15
10
5
0
< 1 week
1 week - 1 month
2 - 3 months
4 - 6 months
7 - 12 months
> 12 months
Figure 7: Maturity date calendar

Pillar 3 report 2017 75
On 31 December 2017, 54 (2016: 54) billion of the assets of
Rabobank’s balance sheet were encumbered. The on-balance
sheet asset encumbrance primarily comprises mortgages
and other loans used in securitisations. Furthermore assets
are encumbered as a result of mandatory minimum reserve
requirements and margining of derivative exposures.
The tables below provide an overview of the asset
encumbrance position of Rabobank. The values reported are
median values computed over the preceding four quarters. All
totals are reported using the median-of-the-sums method.
Table 20: Encumbered assets
Assets
Based on median values, computed over the 4 quarters preceding year-end 2017
Carrying amount of encumbered
assets
Fair value of encumbered
assets
Carrying amount of unencumbered
assets
Fair value of unencumbered
assets
Assets of the reporting institution 56,767 566,565
Loans on demand 4,308 70,577
Equity instruments - - 1,493 1,491
Debt securities 6,910 6,910 24,702 24,708
Loans and advances others than loans on demand 44,153 414,807
Other assets 356 55,530
Securities received in reverse repo transactions are not
recognised on the balance sheet. For asset encumbrance
reporting, these securities are considered as collateral received.
Most of the collateral swaps and repurchase agreements that
Rabobank performs are conducted using securities received in
security finance transactions. These so-called re-used securities
are therefore reported as encumbered collateral received. On
31 December 2017 the total asset encumbrance related to
collateral received was 13 (2016: 12) billion.
Table 21: Collateral received
Collateral received
Based on median values, computed over the 4 quarters preceding year-end 2017
Fair value of encumbered
collateral received or own
debt securities issued
Fair value of collateral
received or own debt securities
issued available for encumbrance
Collateral received by the reporting institution 13,163 34,773
Loans on demand - 363
Equity instruments 7,980 24,410
Debt securities 5,305 4,821
Loans and advances others than loans on demand - -
Other collateral received - 5,443
Own debt securities issued other than own covered bonds or ABSs 1 22
The total asset encumbrance per 31 December 2017 was 68
(2016: 65) billion. This includes both assets of Rabobank and
asset encumbrance following encumbered collateral received.
The slight increase in encumbrance can mainly be explained
by an increase in secured funding and the TLTRO participation.
The median asset encumbrance, measured over the last four
quarters, was 10.5% (9.3%). The median asset encumbrance,
measured over the balance sheet of Rabobank, was 9.1% (8.3%).

Pillar 3 report 2017 76
Importance of asset encumbrance for RabobankRabobank has encumbered a small part of its loan portfolio
for issuing covered bonds and asset-backed securities (ABS)
like residential mortgage-backed securities (RMBS) and asset-
backed commercial paper (ABCP). The pool of assets that
secures these transactions exceeds the value of the issued
securities, meaning that the securities are overcollateralised.
Rabobank has also pledged assets to fulfil mandatory minimum
reserve requirements. These pledged assets cannot be freely
withdrawn on a continuous basis and are therefore considered
encumbered. Furthermore, assets are encumbered for
repurchase agreements and collateral swaps. These transactions
are generally conducted using securities received in reverse
repo transactions. As a result, the associated encumbrance
generally relates to re-used collateral. Rabobank participates in
TLTRO, for which assets are pledged as collateral. Finally, a large
portion of Rabobank’s encumbrance results from collateral
posted to secure derivatives transactions, which contain credit
support annexes or initial margin requirements.
Rabobank has a low level of asset encumbrance, which results
from prudential balance sheet management. The evolution
in the level of asset encumbrance over time is limited and is
mainly driven by variation in assets pledged due to market
value variations of derivatives. The assets reported under ‘Other
assets’ in the Assets table mainly relate to derivatives, real estate,
and property and deferred tax. The majority of this positon is
not available for encumbrance. Rabobank has debt securities
encumbered between branches resulting from intercompany
repo transactions. Given that these branches are consolidated
within the same legal entity, the intragroup asset encumbrance
is considered to be negligible.
The following table combines the previous two tables
combined, along with their associated liabilities, showing
that the majority of Rabobank’s asset encumbrance can be
associated with derivatives and funding (issued debt), which
as per year end 2017 amounted to 13 billion and 25 billion,
respectively.
Table 22: Matching liabilities
Matching liabilities
Based on median values, computed over the 4 quarters preceding year-end 2017
Matching liabilities,
contingent liabilities or
securities lent
Assets, collateral received and own debt securities issued other
than covered bonds and ABSs encumbered
Carrying amount of selected financial liabilities 49,606 51,822
Derivatives 14,060 14,060
Repurchase agreements 1,142 1,140
Collateralised deposits other than repurchase agreements 9,484 11,189
Debt securities issued 23,790 24,630
of which: asset-backed securities issued 21,511 21,664
Other sources of encumbrance 17,950 18,317
Total sources of encumbrance 67,324 69,947

Pillar 3 report 2017 77
11.2. Group Remuneration Policy
11.2.1. ScopeBuilding on the Vision on Remuneration, the Group Remuneration
Policy applies to all business lines and subsidiary organisations
of Rabobank Group, in the Netherlands and abroad. The Group
Remuneration Policy underlines our striving for a meticulous,
restrained and sustainable remuneration policy, and contains at
least the minimum requirements to be satisfied in the area of a
risk-mitigated remuneration policy under applicable national
and international laws and regulations. Every year the Group
Remuneration Policy is evaluated and adjusted. As from
1 January 2017, the deferral scheme was altered into a pro rata
vesting scheme (instead of cliff vesting). Also, a 5-years deferral
scheme was introduced for senior management.
11.2.2. GovernanceThe remuneration policy describes the monitoring processes
with regard to remuneration and the responsibility and
competencies of the Supervisory Board of Rabobank, as the main
supervisory body within the organisation. The Supervisory Board
has the ultimate supervisory function with regard to the design
and implementation of the Group Remuneration Policy and
is responsible for its approval after adoption by the Managing
Board. For any material exception of the Group Remuneration
Policy, the approval of the Supervisory Board is mandatory.
The Supervisory Board had 13 meetings in 2017, including
extra meetings (plus 5 sessions for continuing professional
education and several private sessions). The decisions of the
Supervisory Board concerning remuneration are prepared by the
Remuneration & HR Committee, a standing committee of the
Supervisory Board. In performing its duties, the Remuneration &
HR Committee is supported by the Rabobank Group Monitoring
Committee (MC RG), which operates at Group level and in which
the various monitoring functions (HR, Compliance, Control, Risk
Management) are represented.
To secure the proper implementation of the Group
Remuneration Policy, including the involvement of the
monitoring functions, Monitoring Committees also have been
established at the level of group entities and subsidiaries. These
Monitoring Committees report to the local Supervisory Boards,
and to the MC RG.
11. Remuneration
11.1. General principles for remuneration
Rabobank Group has a meticulous, well-managed and
sustainable remuneration policy which is in keeping with the
strategy, the willingness to take risks, the cooperative objectives
and the core values of Rabobank. The remuneration policy is
customer-orientated and takes into consideration the long-term
interests of the bank, the international context of the markets in
which Rabobank Group is active and also the general interest.
This Group Remuneration Policy has been drawn up based on
the bank’s cooperative identity.
As a cooperative bank, Rabobank is sailing its own – relatively
moderate – course when it comes to defining pay levels. Our
aim is to pay no more than the median level within the relevant
market for established businesses and jobs, based on total
reward. In general, variable pay within Rabobank makes up
a relatively small proportion of total reward and is no longer
existent for the majority of functions in the organisation.
Nevertheless, Rabobank must be able to attract, retain, and
motivate the right people with the right capabilities at the right
time, leading to a (slightly) different choice of pay mix in some
environments and markets.
The key principles that are core to our remuneration policy
have been included in our Vision on Remuneration. This vision
applies across all Rabobank entities, including Rabobank and its
member banks within the Netherlands, affiliates and businesses
within the Netherlands and abroad.
This chapter describes the Group Remuneration Policy of Rabobank Group.

Pillar 3 report 2017 78
11.2.3.3 Remuneration rules for Identified StaffA group of 439 positions is indicated at the start of 2017 as
Identified Staff positions: employees in these positions may
have a material influence on the risk profile of Rabobank. During
the year, 18 positions were added, so in total 457 Identified
Staff positions were in scope. Within Rabobank Group the main
risks are credit, market and operational risks. Following EBA
guidelines, Rabobank identified material risktakers based on
qualitative and quantitative criteria, including the 0.3% highest
paid employees.
Fixed remuneration is only cash based. Job-evaluation leads
to a function scale for each position. Each function scale is
accompanied by a salary scale. Market value allowances can
be awarded as a fixed component of the salary if the situation
in the labour market gives rise to it. These allowances are
granted and defined for the term during which the job is
held. The amount paid in the market value allowance is fixed
and irrevocable for the term during which the job and the
associated responsibilities are held.
Strict remuneration regulations apply to the group of Identified
Staff. Any variable remuneration awarded to these employees, is
based on the outcome of a mix of performance objectives, with
objectives at Group level (20%), business level (minimum 20%)
and individual level (minimum 20%). In 2017 the objectives
at Group level related to the ROIC of Rabobank Group and
customer satisfaction Group-wide. In total, no more than 50% of
the objectives of Identified Staff have a financial nature.
The distribution between Group, group entity and individual
targets described above, involves a minimum requirement
applicable for each Identified Staff employee who receives
variable remuneration. The final weighting of these targets
per employee depends on the function and activities of the
employee. Therefore, the applicable Monitoring Committee will
monitor the quality and distribution at the individual level in
order to ensure that there is an appropriate balance which does
not induce undesirable incentives.
Due to the different ways in which variable remuneration is
determined within Rabobank Group, the way in which the
Performance Management framework is elaborated may differ
between the subsidiaries and group entities. When a bonus
pool approach is used, the required distribution of performance
objectives will also be accounted for.
Performance management objectives are set individually, taking
strategic and year plans into account. Targets for Identified Staff
at Group level are set top-down. Any deviation from the above
must be fully described and then approved by the Supervisory
Board in accordance with the exceptions procedure.
11.2.3. ContentThe Group Remuneration Policy contains specific provisions
for (1) all employees, (2) staff in monitoring functions and (3)
Identified Staff.
11.2.3.1 Remuneration rules for all employeesThe remuneration of all employees are subject to a number of
rules and prohibitions. Thus, for example, guaranteed bonuses
are restricted and there will be no reward for failure.
The Managing Board is authorized to reclaim, either in whole
or in part, the variable pay which has already been paid to both
employees and former employees (‘claw back’), if:
• the payment was made based on incorrect or misleading
information regarding the achievement of performance
targets which formed the basis of the variable pay or
concerning the circumstances on which the variable pay was
made dependent;
• it concerns fraudulent actions by the employee in question;
• it concerns participation in or responsibility for conduct that
has led to considerable loss and/or damage to the reputation
of Rabobank Group and/or the subsidiary or group entity;
and/or
• the employee did not meet applicable standards regarding
ability and correct conduct.
11.2.3.2 Remuneration rules for monitoring functionsThe remuneration of Identified Staff in a control role, referred
to as monitoring functions (HR, Control, Risk Management,
Compliance, Legal and Internal Audit), is bound by strict
conditions. This ensures their independence with regard to
their monitoring role. For monitoring functions the following
requirements are applicable:
• the amount of the fixed pay of employees in a monitoring
function will be sufficient to guarantee that Rabobank Group
can attract qualified and experienced employees;
• in the allocation between fixed and variable pay, fixed pay is
preferred and variable pay, if any, is always less than 50% of
fixed pay;
• objectives for awarding variable pay are predominantly
function-related. Financial criteria are not based on the
financial results of the entity being monitored by the
employee in the monitoring function;
• variable pay is only paid to employees in monitoring
functions when at least 50% of the specific job-related targets
were met, so as to emphasize the appropriate performance of
the functional role.

Pillar 3 report 2017 79
In 2013 Rabobank stopped paying variable pay completely
for the members of the Managing Board without offering any
compensation in fixed pay or otherwise. For most Executives,
variable pay was stopped in 2014. Payment of variable
remuneration to other Identified Staff takes place over a period
long enough to adequately take risks into account, related
to the underlying business activities. Therefore, a significant
proportion of at least 40% of the variable remuneration is
conditional and deferred for all Identified Staff. The deferred
part of the variable pay vests for all Identified Staff in equal parts
during three years after the end of the relevant performance
period, provided that (i) the participant is still employed by
Rabobank Group at that time, and (ii) the ex-post evaluation
does not give cause to adjust the deferred part of the variable
pay (malus). For senior management, the deferred part of the
variable pay vests in equal parts during five years after the end
of the relevant performance period.
With respect to the application of malus the following
assessment framework is applied to all Identified Staff:
• proof of material errors by the employee;
• award of the variable pay on the basis of incorrect, misleading
information or as a result of fraudulent conduct by the
relevant employee;
• participation in or responsibility for conduct that has led to
considerable loss and/or damage to the reputation of the
Rabobank Group;
• proof of the employee not meeting the applicable standards
with respect to ability and correct conduct;
• overall financial performance. The minimum requirement is
that after award and payment of variable pay, Rabobank’s
CET1 capital ratio must be at or above the threshold laid
down under the applicable legislation (Basel). If and to the
extent that this minimum requirement is not met, variable
pay will not be awarded or paid (in full);
• a significant breach in risk management;
• a significant negative change in the CET1 capital of Rabobank.
Of both the direct part and the deferred part of the variable pay
of Identified Staff, 50% is awarded in cash (cash component).
The other 50% is awarded in the form of an instrument
(instrument component, i.e. the Deferred Remuneration Note
(DRN)). The value of a DRN is linked to the price of a Rabobank
Certificate, registered at NYSE Euronext. For two Identified Staff
employed at Real Estate an alternative instrument applies.
Rabobank offers no fixed or variable pay in the form of options
or shareholding rights to employees.
Guaranteed variable remuneration is only permitted in the form
of a welcome bonus in the first year of employment. Welcome
bonuses can only be awarded if Rabobank has a strong and
solid capital basis.
Severance payments must be demonstrably related to the
performance of the employee over time. For daily policy-makers
(‘Dagelijks Beleidsbepalers’) severance payments are capped at
a maximum of 100% of the fixed pay on an annual basis.
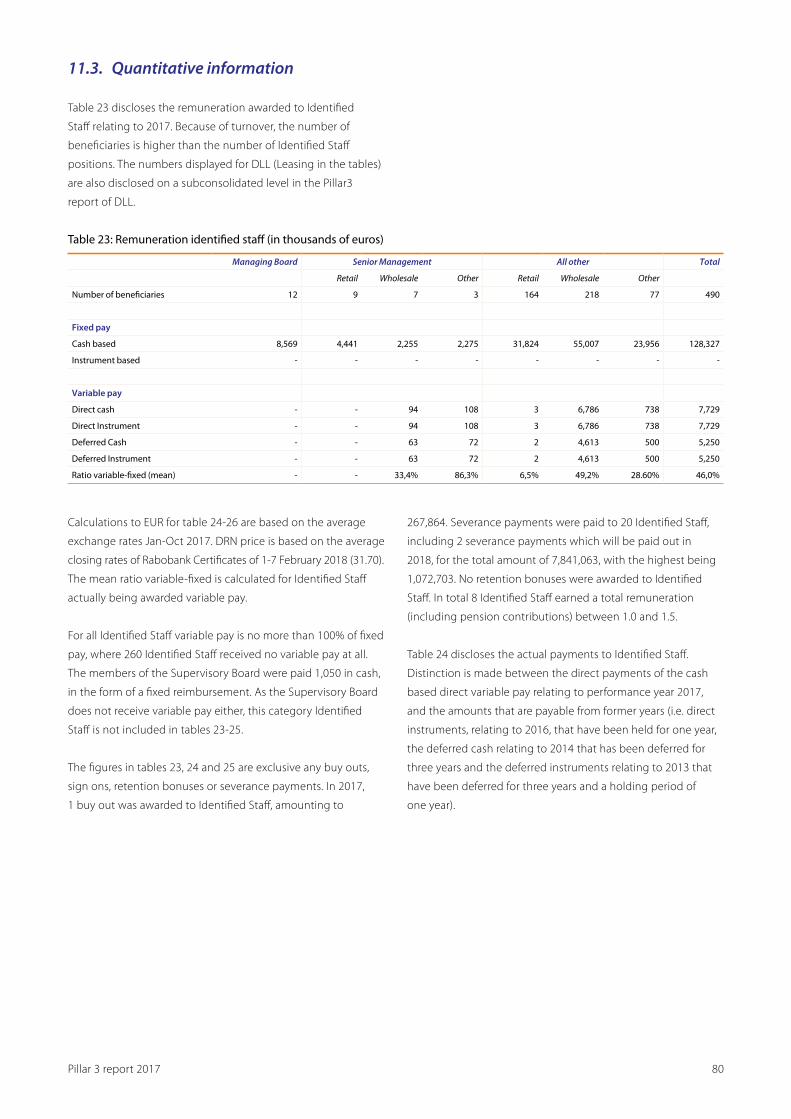
Pillar 3 report 2017 80
11.3. Quantitative information
Table 23 discloses the remuneration awarded to Identified
Staff relating to 2017. Because of turnover, the number of
beneficiaries is higher than the number of Identified Staff
positions. The numbers displayed for DLL (Leasing in the tables)
are also disclosed on a subconsolidated level in the Pillar3
report of DLL.
Table 23: Remuneration identified staff (in thousands of euros)
Managing Board Senior Management All other Total
Retail Wholesale Other Retail Wholesale Other
Number of beneficiaries 12 9 7 3 164 218 77 490
Fixed pay
Cash based 8,569 4,441 2,255 2,275 31,824 55,007 23,956 128,327
Instrument based - - - - - - - -
Variable pay
Direct cash - - 94 108 3 6,786 738 7,729
Direct Instrument - - 94 108 3 6,786 738 7,729
Deferred Cash - - 63 72 2 4,613 500 5,250
Deferred Instrument - - 63 72 2 4,613 500 5,250
Ratio variable-fixed (mean) - - 33,4% 86,3% 6,5% 49,2% 28.60% 46,0%
Calculations to EUR for table 24-26 are based on the average
exchange rates Jan-Oct 2017. DRN price is based on the average
closing rates of Rabobank Certificates of 1-7 February 2018 (31.70).
The mean ratio variable-fixed is calculated for Identified Staff
actually being awarded variable pay.
For all Identified Staff variable pay is no more than 100% of fixed
pay, where 260 Identified Staff received no variable pay at all.
The members of the Supervisory Board were paid 1,050 in cash,
in the form of a fixed reimbursement. As the Supervisory Board
does not receive variable pay either, this category Identified
Staff is not included in tables 23-25.
The figures in tables 23, 24 and 25 are exclusive any buy outs,
sign ons, retention bonuses or severance payments. In 2017,
1 buy out was awarded to Identified Staff, amounting to
267,864. Severance payments were paid to 20 Identified Staff,
including 2 severance payments which will be paid out in
2018, for the total amount of 7,841,063, with the highest being
1,072,703. No retention bonuses were awarded to Identified
Staff. In total 8 Identified Staff earned a total remuneration
(including pension contributions) between 1.0 and 1.5.
Table 24 discloses the actual payments to Identified Staff.
Distinction is made between the direct payments of the cash
based direct variable pay relating to performance year 2017,
and the amounts that are payable from former years (i.e. direct
instruments, relating to 2016, that have been held for one year,
the deferred cash relating to 2014 that has been deferred for
three years and the deferred instruments relating to 2013 that
have been deferred for three years and a holding period of
one year).

Pillar 3 report 2017 81
Table 24: Actual payments to Identified Staff
(in thousands of euros)
Managing Board Senior Management All other Total
Retail Wholesale Other Retail Wholesale Other
Cash, over 2017 - - 94 108 3 6,600 738 7,543
Cash, over former years - 8 106 51 38 4,470 1,194 5,867
Instrument, over 2017 - - - - - - - -
Instruments, over former years 7 130 175 157 402 7,979 2,657 11,507
Malus and claw backNo amounts of malus (withdrawal of conditional amounts)
and claw back (withdrawal of unconditional, but not yet paid
amounts) are applied to Identified Staff members in 2017.
For one Identified Staff member, the awarding of variable
pay regarding performance year 2017 as well as paying out
outstanding variable pay, is suspended, awaiting the results of
a current investigation. For 5 other Identified Staff, the payment
of deferred amounts from performance year 2014 is suspended,
awaiting the results of a current investigation.
Table 25 shows the outstanding deferred compensation for
Identified Staff. Vested amounts are unconditional, but subject
to a holding period of one year. The unvested amounts are
conditional, and may be subject to malus in the future.
Table 25: Total amount of outstanding deferred compensation
Identified Staff (in thousands of euros)
Managing Board Senior Management All other Total
Retail Wholesale Other Retail Wholesale Other
Cash, vested - - - - - - - -
Cash, unvested - 89 222 275 102 17,118 2,708 20,514
Instrument, vested - 10 229 173 51 9,558 2,056 12,077
Instruments, unvested - 103 249 306 118 18,889 3,088 22,753
Exceptions to the Group Remuneration PolicyThe Supervisory Board has agreed to apply the GRP of 2016
instead of the GRP 2017 for two employees at Real Estate.
For those Identified Staff employees an alternative instrument
applies, and at least 50% of their variable remuneration is
deferred.
For three Identified Staff members with terminated
employment agreements, the Supervisory Board agreed upon
the remaining of their conditional variable pay, that will be paid
out at the end of the deferral period, whilst taking into account
the retention period, unless claw back is applied.

Pillar 3 report 2017 82
The Basel Committee published a document in July 2013 titled ‘Global systemically important banks: updated assessment methodology and the higher loss absorbency requirement’. This document cites 12 indicators based on which banks can be classified as systemically important on a global scale. The document indicates that banks with a leverage ratio exposure exceeding 200 billion have to disclose at least these 12 indicators.
12. Global systemically important banks – 12 indicators
The size indicators as at 31 December 2017 will be available
online in April 2018 on www.rabobank.com/annualreports.

Pillar 3 report 2017 83
The Managing Board of Rabobank declares that the risk management arrangements of Rabobank are adequate and assures that the risk management systems put in place are adequate to Rabobank’s profile and strategy.
13. Declaration Managing Board
Managing BoardWiebe Draijer, Chairman
Bas Brouwers, CFO
Petra van Hoeken, CRO
Kirsten Konst, Member
Bart Leurs, Member
Mariëlle Lichtenberg, Member
Berry Marttin, Member
Jan van Nieuwenhuizen, Member
Ieko Sevinga, Member
Janine Vos, Member

Pillar 3 report 2017 84
14. Appendices
14.1. Transitional own funds disclosure template
Common Equity Tier 1 capital: instruments and reserves (A) (B) (C)
Amount at disclosure
date
Regulation (eu) no 575/2013 article reference
Amounts subject to pre- regulation (eu) no 575/2013
treatment or prescribed residual amount of regulation
(eu) no 575/ 2013
1 Capital instruments and the related share premium accounts 7,440 26 (1), 27, 28, 29, EBA list 26 (3)
of which: Rabobank Certificates 7,440 EBA list 26 (3)
of which: Instrument type 2 EBA list 26 (3)
of which: Instrument type 3 EBA list 26 (3)
2 Retained earnings 25,214 26 (1) (c)
3 Accumulated other comprehensive income (and other reserves, to include unrealised gains and losses under the applicable accounting standards)
(1,402) 26 (1)
3a Funds for general banking risk 26 (1) (f)
4 Amount of qualifying items referred to in Article 484 (3) and the related share premium accounts subject to phase out from CET1
486 (2)
Public sector capital injections grandfathered until 1 January 2018 483 (2)
5 Minority Interests (amount allowed in consolidated CET1) 105 84, 479, 480 79
5a Independently reviewed interim profits net of any foreseeable charge or dividend 1,509 26 (2)
6 Common Equity Tier 1 (CET1) capital before regulatory adjustments 32,865
Common Equity Tier 1 (CET1) capital: regulatory adjustments
7 Additional value adjustments (negative amount) (168) 34, 105
8 Intangible assets (net of related tax liability) (negative amount) (802) 36 (1) (b), 37, 472 (4) 200
9 Empty Set in the EU
10 Deferred tax assets that rely on future profitability excluding those arising from temporary differences (net of related tax liability where the conditions in Article 38 (3) are met) (negative amount)
(339) 36 (1) (c), 38, 472 (5) 85
11 Fair value reserves related to gains or losses on cash flow hedges 42 33 (a)
12 Negative amounts resulting from the calculation of expected loss amounts (760) 36 (1) (d), 40, 159, 472 (6) 190
13 Any increase in equity that results from securitised assets (negative amount) 32 (1)
14 Gains or losses on liabilities valued at fair value resulting from changes in own credit standing
592 33 (b)
15 Defined-benefit pension fund assets (negative amount) (5) 36 (1) (e), 41, 472 (7) 1
16 Direct and indirect holdings by an institution of own CET1 instruments (negative amount)
(16) 36 (1) (f), 42, 472 (8)
17 Holdings of the CET1 instruments of financial sector entities where those entities have reciprocal cross holdings with the institution designed to inflate artificially the own funds of the institution (negative amount)
36 (1) (g), 44, 472 (9)
18 Direct and indirect holdings by the institution of the CET1 instruments of financial sector entities where the institution does not have a significant investment in those entities (amount above the 10% threshold and net of eligible short positions) (negative amount)
36 (1) (h), 43, 45, 46, 49 (2)(3), 79, 472 (10)
19 Direct, indirect and synthetic holdings by the institution of the CET1 instruments of financial sector entities where the institution has a significant investment in those entities (amount above 10% threshold and net of eligible short positions) (negative amount)
36 (1) (i), 43, 45, 47, 48 (1) (b), 49 (1) to (3), 79, 470, 472 (11)
20 Empty Set in the EU
20a Exposure amount of the following items which qualify for a RW of 1250%, where the institution opts for the deduction alternative
(48) 36 (1) (k)
20b of which: qualifying holdings outside the financial sector (negative amount) 36 (1) (k) (i), 89 to 91
20c of which: securitisation positions (negative amount) (48) 36 (1) (k) (ii) 243 (1) (b) 244 (1) (b) 258
20d of which: free deliveries (negative amount) 36 (1) (k) (iii), 379 (3)
21 Deferred tax assets arising from temporary differences (amount above 10% threshold, net of related tax liability where the conditions in 38[lees: Article 38] (3) are met) (negative amount)
36 (1) (c), 38, 48 (1) (a), 470, 472 (5)
22 Amount exceeding the 15% threshold (negative amount) 48 (1)

Pillar 3 report 2017 85
Common Equity Tier 1 capital: instruments and reserves (A) (B) (C)
Amount at disclosure
date
Regulation (eu) no 575/2013 article reference
Amounts subject to pre- regulation (eu) no 575/2013
treatment or prescribed residual amount of regulation
(eu) no 575/ 2013
23 of which: direct and indirect holdings by the institution of the CET1 instruments of financial sector entities where the institution has a significant investment in those entities
36 (1) (i), 48 (1) (b), 470, 472 (11)
24 Empty Set in the EU
25 of which: deferred tax assets arising from temporary differences 36 (1) (c), 38, 48 (1) (a), 470, 472 (5)
25a Losses for the current financial year (negative amount) 36 (1) (a), 472 (3)
25b Foreseeable tax charges relating to CET1 items (negative amount) 36 (1) (l)
26 Regulatory adjustments applied to Common Equity Tier 1 in respect of amounts subject to pre-CRR treatment
(98)
26a Regulatory adjustments relating to unrealised gains and losses pursuant to Articles 467 and 468
(93)
Of which: 467
Of which: … filter for unrealised loss 2 467
Of which: filter for unrealised gain on available for sale Equity instruments (52) 468
Of which: filter for unrealised gain on available for sale Debt instruments (41) 468
26b Amount to be deducted from or added to Common Equity Tier 1 capital with regard to additional filters and deductions required pre CRR
(5) 481
Of which: Irrevocable Payment Commitment (59) 481
Of which: amendments to IAS 19 54 481
27 Qualifying AT1 deductions that exceed the AT1 capital of the institution (negative amount)
36 (1) (j)
28 Total regulatory adjustments to Common Equity Tier 1 (CET1) (1,602)
29 Common Equity Tier 1 (CET1) capital 31,263
Additional Tier 1 (AT1) capital: instruments
30 Capital instruments and the related share premium accounts 2,729 51, 52
31 of which: classified as equity under applicable accounting standards 2,729
32 of which: classified as liabilities under applicable accounting standards
33 Amount of qualifying items referred to in Article 484 (4) and the related share premium accounts subject to phase out from AT1
3,590 486 (3)
Public sector capital injections grandfathered until 1 January 2018 483 (3)
34 Qualifying Tier 1 capital included in consolidated AT1 capital (including minority interests not included in row 5) issued by subsidiaries and held by third parties
6 85, 86, 480
35 of which: instruments issued by subsidiaries subject to phase out 486 (3)
36 Additional Tier 1 (AT1) capital before regulatory adjustments 6,325
Additional Tier 1 (AT1) capital: regulatory adjustments
37 Direct and indirect holdings by an institution of own AT1 Instruments (negative amount)
(87) 52 (1) (b), 56 (a), 57, 475 (2)
38 Holdings of the AT1 instruments of financial sector entities where those entities have reciprocal cross holdings with the institution designed to inflate artificially the own funds of the institution (negative amount)
56 (b), 58, 475 (3)
39 Direct and indirect holdings of the AT1 instruments of financial sector entities where the institution does not have a significant investment in those entities (amount above the 10% threshold and net of eligible short positions) (negative amount)
56 (c), 59, 60, 79, 475 (4)
40 Direct and indirect holdings by the institution of the AT1 instruments of financial sector entities where the institution has a significant investment in those entities (amount above the 10% threshold net of eligible short positions) (negative amount)
(2) 56 (d), 59, 79, 475 (4)
41 Regulatory adjustments applied to additional Tier 1 in respect of amounts subject to pre-CRR treatment and transitional treatments subject to phase out as prescribed in Regulation (EU) No 575/2013 (i.e. CRR residual amounts)
41a Residual amounts deducted from Additional Tier 1 capital with regard to deduction from Common Equity Tier 1 capital during the transitional period pursuant to article 472 of Regulation (EU) No 575/2013
(295) 472, 472(3)(a), 472 (4), 472 (6), 472 (8) (a), 472 (9), 472 (10) (a), 472 (11) (a)
Of which: Intangible assets (200)
Of which: Negative amounts resulting from the calculation of expected losses amounts
(95)
41b Residual amounts deducted from Additional Tier 1 capital with regard to deduction from Tier 2 capital during the transitional period pursuant to article 475 of Regulation (EU) No 575/2013
477, 477 (3), 477 (4) (a)

Pillar 3 report 2017 86
Common Equity Tier 1 capital: instruments and reserves (A) (B) (C)
Amount at disclosure
date
Regulation (eu) no 575/2013 article reference
Amounts subject to pre- regulation (eu) no 575/2013
treatment or prescribed residual amount of regulation
(eu) no 575/ 2013
Of which items to be detailed line by line, e.g. Reciprocal cross holdings in Tier 2 instruments, direct holdings of non-significant investments in the capital of other financial sector entities, etc
41c Amount to be deducted from or added to Additional Tier 1 capital with regard to additional filters and deductions required pre-CRR
467, 468, 481
Of which: 481 deducted from or added to Additional 467
Of which: … possible filter for unrealised gains 468
Of which: … 481
42 Qualifying T2 deductions that exceed the T2 capital of the institution (negative amount)
56 (e)
43 Total regulatory adjustments to Additional Tier 1 (AT1) capital (384)
44 Additional Tier 1 (AT1) capital 5,941
45 Tier 1 capital (T1 = CET1 + AT1) 37,204
Tier 2 (T2) capital: instruments and provisions
46 Capital instruments and the related share premium accounts 14,896 62, 63
47 Amount of qualifying items referred to in Article 484 (5) and the related share premium accounts subject to phase out from T2
486 (4)
Public sector capital injections grandfathered until 1 January 2018 483 (4)
48 Qualifying own funds instruments included in consolidated T2 capital (including minority interests and AT1 instruments not included in rows 5 or 34) issued by subsidiaries and held by third parties
7 87, 88, 480
49 of which: instruments issued by subsidiaries subject to phase out 486 (4)
50 Credit risk adjustments 62 (c) & (d)
51 Tier 2 (T2) capital before regulatory adjustments 14,903
Tier 2 (T2) capital: regulatory adjustments
52 Direct and indirect holdings by an institution of own T2 instruments and subordinated loans (negative amount)
(89) 63 (b) (i), 66 (a), 67, 477 (2)
53 Holdings of the T2 instruments and subordinated loans of financial sector entities where those entities have reciprocal cross holdings with the institution designed to inflate artificially the own funds of the institution (negative amount)
66 (b), 68, 477 (3)
54 Direct and indirect holdings of the T2 instruments and subordinated loans of financial sector entities where the institution does not have a significant investment in those entities (amount above 10% threshold and net of eligible short positions) (negative amount)
66 (c), 69, 70, 79, 477 (4)
54a Of which new holdings not subject to transitional arrangements
54b Of which holdings existing before 1 January 2013 and subject to transitional arrangements
55 Direct and indirect holdings by the institution of the T2 instruments and subordinated loans of financial sector entities where the institution has a significant investment in those entities (net of eligible short positions) (negative amount)
66 (d), 69, 79, 477 (4)
56 Regulatory adjustments applied to Tier 2 in respect of amounts subject to pre-CRR treatment and transitional treatments subject to phase out as prescribed in Regulation (EU) No 575/2013 (i.e. CRR residual amounts)
56a Residual amounts deducted from Tier 2capital with regard to deduction from Common Equity Tier 1 capital during the transitional period pursuant to article 472 of Regulation (EU) No 575/2013
(95) 472, 472(3)(a), 472 (4), 472 (6), 472 (8) (a), 472 (9), 472 (10) (a), 472 (11) (a)
Of which: Negative amounts resulting from the calculation of expected losses amounts
(95)
56b Residual amounts deducted from Tier 2 capital with regard to deduction from Additional Tier 1 capital during the transitional period pursuant to article 475 of Regulation (EU) No 575/2013
475, 475 (2) (a), 475 (3), 475 (4) (a)
Of which items to be detailed line by line, e.g. reciprocal cross holdings in at1 instruments, direct holdings of non significant investments in the capital of other financial sector entities, etc
56c Amount to be deducted from or added to Tier 2 capital with regard to additional filters and deductions required pre CRR
467, 468, 481
Of which: … possible filter for unrealised losses 467
Of which: … possible filter for realised losses 468
Of which: 4 481
57 Total regulatory adjustments to Tier 2 (T2) capital (184)
58 Tier 2 (T2) capital 14,719
59 Total capital (TC = T1 + T2) 51,923

Pillar 3 report 2017 87
Common Equity Tier 1 capital: instruments and reserves (A) (B) (C)
Amount at disclosure
date
Regulation (eu) no 575/2013 article reference
Amounts subject to pre- regulation (eu) no 575/2013
treatment or prescribed residual amount of regulation
(eu) no 575/ 2013
59a Risk weighted assets in respect of amounts subject to pre-CRR treatment and transitional treatments subject to phase out as prescribed in Regulation (EU) No 575/ 2013 (i.e. CRR residual amounts)
191,177
Of which: ted assets in respect of amounts subject to pre-CRR treatment and transitional treatments subject to phase out as prescribed in Regulation (EU) rely on future profitability net of related tax liability, indirect holdings of own CET1, etc)
6,845 472, 472 (5), 472 (8) (b), 472 (10) (b), 472 (11) (b)
Of which: 5), 472 (8) (b), 472 (10) (b), 472 (11) (b) pre-CRR treatment andresidual amounts) (items to be detailed line by line, e.g. Reciprocal cross holdings in T2 instruments, direct holdings of non-significant investments in the capital of other financial sector entities, etc.)
475, 475 (2) (b), 475 (2) (c), 475 (4) (b)
Items not deducted from T2 items (Regulation (EU) No 575/2013 residual amounts) (items to be detailed line by line, e.g. Indirect holdings of own t2 instruments, indirect holdings of non-significant investments in the capital of other financial sector entities, indirect holdings of significant investments in the capital of other financial sector entities etc)
247 477, 477 (2) (b), 477 (2) (c), 477 (4) (b)
60 Total risk weighted assets 198,269
Capital ratios and buffers
61 Common Equity Tier 1 (as a percentage of risk exposure amount) 15.80% 92 (2) (a), 465
62 Tier 1 (as a percentage of risk exposure amount) 18.80% 92 (2) (b), 465
63 Total capital (as a percentage of risk exposure amount) 26.20% 92 (2) (c)
64 Institution specific buffer requirement (CET1 requirement in accordance with article 92 (1) (a) plus capital conservation and countercyclical buffer requirements, plus systemic risk buffer, plus the systemically important institution buffer (G-SII or O-SII buffer), expressed as a percentage of risk exposure amount)
2.76% CRD 128, 129, 130
65 of which: capital conservation buffer requirement 1.25%
66 of which: countercyclical buffer requirement 0.01%
67 of which: systemic risk buffer requirement 1.50%
67a of which: Global Systemically Important Institution (G-SII) or Other Systemically Important Institution (O-SII) buffer
CRD 131
68 Common Equity Tier 1 available to meet buffers (as a percentage of risk exposure amount)
11.27% CRD 128
69 [non relevant in EU regulation]
70 [non relevant in EU regulation]
71 [non relevant in EU regulation]
Capital ratios and buffers
72 Direct and indirect holdings of the capital of financial sector entities where the institution does not have a significant investment in those entities (amount below 10% threshold and net of eligible short positions)
476 36 (1) (h), 45, 46, 472 (10)56 (c), 59, 60, 475 (4)66 (c), 69, 70, 477 (4)
73 Direct and indirect holdings by the institution of the CET1 instruments of financial sector entities where the institution has a significant investment in those entities (amount below 10% threshold and net of eligible short positions)
2,167 36 (1) (i), 45, 48, 470, 472 (11)
74 Empty Set in the EU
75 Deferred tax assets arising from temporary differences (amount below 10% threshold, net of related tax liability where the conditions in Article 38 (3) are met)
1,418 36 (1) (c), 38, 48, 470, 472 (5)
Applicable caps on the inclusion of provisions in Tier 2
76 Credit risk adjustments included in T2 in respect of exposures subject to standardized approach (prior to the application of the cap)
62
77 Cap on inclusion of credit risk adjustments in T2 under standardised approach 235 62
78 Credit risk adjustments included in T2 in respect of exposures subject to internal ratings-based approach (prior to the application of the cap)
62
79 Cap for inclusion of credit risk adjustments in T2 under internal ratings-based approach
753 62
Capital instruments subject to phase-out arrangements (only applicable between 1 Jan 2013 and 1 Jan 2022)
80 Current cap on CET1 instruments subject to phase out arrangements 484 (3), 486 (2) & (5)
81 Amount excluded from CET1 due to cap (excess over cap after redemptions and maturities)
484 (3), 486 (2) & (5)
82 Current cap on AT1 instruments subject to phase out arrangements 4,552 484 (4), 486 (3) & (5)
83 Amount excluded from AT1 due to cap (excess over cap after redemptions and maturities)
484 (4), 486 (3) & (5)
84 Current cap on T2 instruments subject to phase out arrangements 484 (5), 486 (4) & (5)
85 Amount excluded from T2 due to cap (excess over cap after redemptions and maturities)
484 (5), 486 (4) & (5)
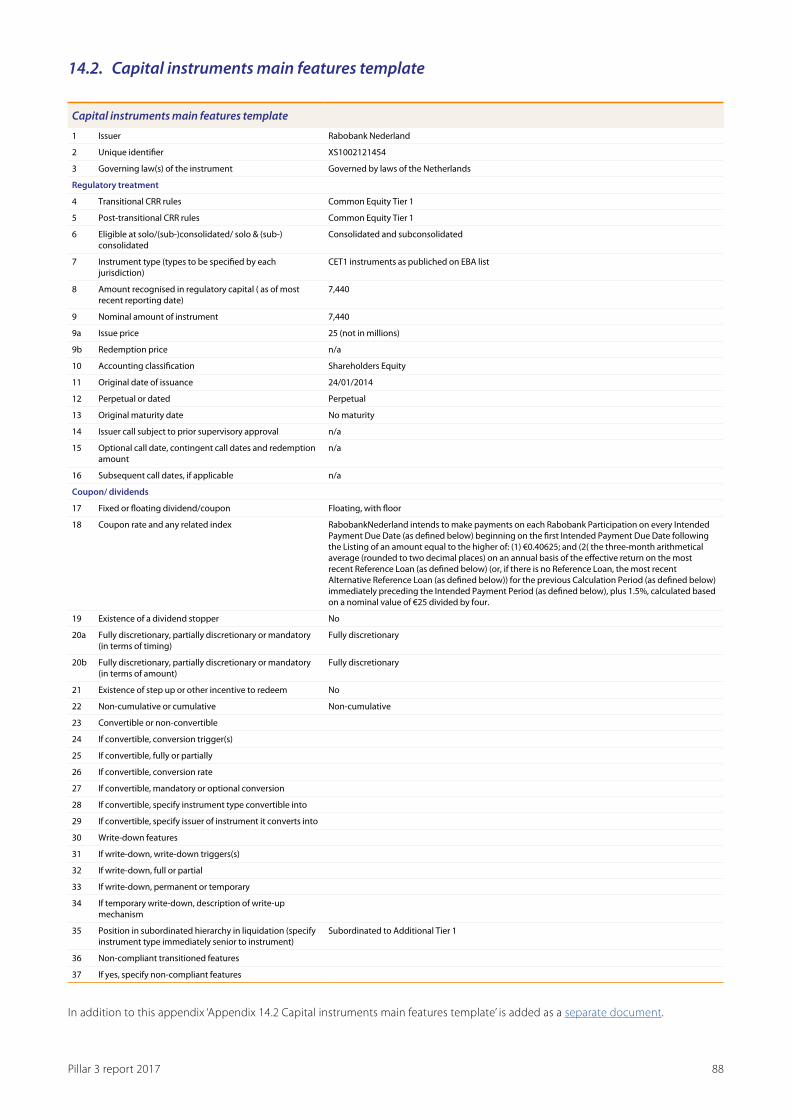
Pillar 3 report 2017 88
14.2. Capital instruments main features template
Capital instruments main features template
1 Issuer Rabobank Nederland
2 Unique identifier XS1002121454
3 Governing law(s) of the instrument Governed by laws of the Netherlands
Regulatory treatment
4 Transitional CRR rules Common Equity Tier 1
5 Post-transitional CRR rules Common Equity Tier 1
6 Eligible at solo/(sub-)consolidated/ solo & (sub-)consolidated
Consolidated and subconsolidated
7 Instrument type (types to be specified by each jurisdiction)
CET1 instruments as publiched on EBA list
8 Amount recognised in regulatory capital ( as of most recent reporting date)
7,440
9 Nominal amount of instrument 7,440
9a Issue price 25 (not in millions)
9b Redemption price n/a
10 Accounting classification Shareholders Equity
11 Original date of issuance 24/01/2014
12 Perpetual or dated Perpetual
13 Original maturity date No maturity
14 Issuer call subject to prior supervisory approval n/a
15 Optional call date, contingent call dates and redemption amount
n/a
16 Subsequent call dates, if applicable n/a
Coupon/ dividends
17 Fixed or floating dividend/coupon Floating, with floor
18 Coupon rate and any related index RabobankNederland intends to make payments on each Rabobank Participation on every Intended Payment Due Date (as defined below) beginning on the first Intended Payment Due Date following the Listing of an amount equal to the higher of: (1) €0.40625; and (2( the three-month arithmetical average (rounded to two decimal places) on an annual basis of the effective return on the most recent Reference Loan (as defined below) (or, if there is no Reference Loan, the most recent Alternative Reference Loan (as defined below)) for the previous Calculation Period (as defined below) immediately preceding the Intended Payment Period (as defined below), plus 1.5%, calculated based on a nominal value of €25 divided by four.
19 Existence of a dividend stopper No
20a Fully discretionary, partially discretionary or mandatory (in terms of timing)
Fully discretionary
20b Fully discretionary, partially discretionary or mandatory (in terms of amount)
Fully discretionary
21 Existence of step up or other incentive to redeem No
22 Non-cumulative or cumulative Non-cumulative
23 Convertible or non-convertible
24 If convertible, conversion trigger(s)
25 If convertible, fully or partially
26 If convertible, conversion rate
27 If convertible, mandatory or optional conversion
28 If convertible, specify instrument type convertible into
29 If convertible, specify issuer of instrument it converts into
30 Write-down features
31 If write-down, write-down triggers(s)
32 If write-down, full or partial
33 If write-down, permanent or temporary
34 If temporary write-down, description of write-up mechanism
35 Position in subordinated hierarchy in liquidation (specify instrument type immediately senior to instrument)
Subordinated to Additional Tier 1
36 Non-compliant transitioned features
37 If yes, specify non-compliant features
In addition to this appendix ‘Appendix 14.2 Capital instruments main features template’ is added as a separate document.

Pillar 3 report 2017 89
14.3. CRR Leverage Ratio
Summary reconciliation of accounting assets and leverage ratio exposures
Applicable Amounts
1 Total assets as per published financial statements 602,991
2 Adjustment for entities which are consolidated for accounting purposes but are outside the scope of regulatory consolidation
3(Adjustment for fiduciary assets recognised on the balance sheet pursuant to the applicable accounting framework but excluded from the leverage ratio exposure measure in accordance with Article 429(13) of Regulation (EU) No 575/2013 ‘CRR’)
4 Adjustments for derivative financial instruments (18,645)
5 Adjustments for securities financing transactions ‘SFTs’ 839
6 Adjustment for off-balance sheet items (ie conversion to credit equivalent amounts of off-balance sheet exposures) 26,581
EU-6a(Adjustment for intragroup exposures excluded from the leverage ratio exposure measure in accordance with Article 429 (7) of Regulation (EU) No 575/2013)
EU-6b(Adjustment for exposures excluded from the leverage ratio exposure measure in accordance with Article 429 (14) of Regulation (EU) No 575/2013)
7 Other adjustments 5,526
8 Total leverage ratio exposure 617,992
Leverage ratio common disclosure
CRR leverage ratio exposures
On-balance sheet exposures (excluding derivatives and SFTs)
1 On-balance sheet items (excluding derivatives, SFTs and fiduciary assets, but including collateral) 555,131
2 (Asset amounts deducted in determining Tier 1 capital) (2,252)
3 Total on-balance sheet exposures (excluding derivatives, SFTs and fiduciary assets) (sum of lines 1 and 2) 552,879
Derivative exposures
4 Replacement cost associated with all derivatives transactions (ie net of eligible cash variation margin) 3,740
5 Add-on amounts for PFE associated with all derivatives transactions (mark-to-market method) 11,340
EU-5a Exposure determined under Original Exposure Method
6Gross-up for derivatives collateral provided where deducted from the balance sheet assets pursuant to the applicable accounting framework
7 (Deductions of receivables assets for cash variation margin provided in derivatives transactions) (8,220)
8 (Exempted CCP leg of client-cleared trade exposures)
9 Adjusted effective notional amount of written credit derivatives
10 (Adjusted effective notional offsets and add-on deductions for written credit derivatives)
11 Total derivative exposures (sum of lines 4 to 10) 6,860
Securities financing transaction exposures
12 Gross SFT assets (with no recognition of netting), after adjusting for sales accounting transactions 30,254
13 (Netted amounts of cash payables and cash receivables of gross SFT assets)
14 Counterparty credit risk exposure for SFT assets 718
EU-14a Derogation for SFTs: Counterparty credit risk exposure in accordance with Article 429b (4) and 222 of Regulation (EU) No 575/2013
15 Agent transaction exposures
EU-15a (Exempted CCP leg of client-cleared SFT exposure)
16 Total securities financing transaction exposures (sum of lines 12 to 15a) 30,972
Other off-balance sheet exposures
17 Off-balance sheet exposures at gross notional amount 86,669
18 (Adjustments for conversion to credit equivalent amounts) (60,088)
19 Other off-balance sheet exposures (sum of lines 17 to 18) 26,581
Exempted exposures in accordance with CRR Article 429 (7) and (14) (on and off balance sheet)
EU-19a (Exemption of intragroup exposures (solo basis) in accordance with Article 429(7) of Regulation (EU) No 575/2013 (on and off balance sheet))
EU-19b (Exposures exempted in accordance with Article 429 (14) of Regulation (EU) No 575/2013 (on and off balance sheet))
Capital and total exposures
20 Tier 1 capital 37,204
21 Total leverage ratio exposures (sum of lines 3, 11, 16, 19, EU-19a and EU-19b) 617,292
Leverage ratio
22 Leverage ratio 6.0%
Choice on transitional arrangements and amount of derecognised fiduciary items
EU-23 Choice on transitional arrangements for the definition of the capital measure Transitional
EU-24 Amount of derecognised fiduciary items in accordance with Article 429(11) of Regulation (EU) NO 575/2013

Pillar 3 report 2017 90
Split-up of on balance sheet exposures (excluding derivatives, SFTs and exempted exposures)
CRR leverage ratio exposures
EU-1 Total on-balance sheet exposures (excluding derivatives, SFTs, and exempted exposures), of which: 555,131
EU-2 Trading book exposures 2,221
EU-3 Banking book exposures, of which: 552,910
EU-4 Covered bonds
EU-5 Exposures treated as sovereigns 95,564
EU-6 Exposures to regional governments, MDB, international organisations and PSE NOT treated as sovereigns
EU-7 Institutions 17,999
EU-8 Secured by mortgages of immovable properties 296,792
EU-9 Retail exposures 30,099
EU-10 Corporate 83,711
EU-11 Exposures in default 12,729
EU-12 Other exposures (eg equity, securitisations, and other non-credit obligation assets) 16,016
Disclosure on qualitative itemsDescription of the processes used to manage the risk of excessive leverageThe leverage ratio of Rabobank has never been below the
new Basel III minimum level of 3%. As the current level of
the leverage ratio is well above the regulatory minimum, no
explicit target has been defined. Our strategy is based on profit
improvement, selective asset growth and reduction of specific
portfolios. This will further improve the leverage ratio.
The leverage ratio is a less binding constraint for the Rabobank
Group in relation to the minimum requirements and our peers.
Changes and potential changes in regulation relating to the
leverage ratio are monitored and their potential impact is
assessed. The risk profile of the bank (such as the risk weighted
assets) is our primary driver in controlling the business.
Description of the factors that had an impact on the leverage Ratio during the period to which the disclosed leverage Ratio refersOur leverage ratio amounted to 6.0% as per December 2017
(5.5% as per December 2016). The change in leverage ratio was
mainly due to increased Tier 1 capital and a reduction of the
leverage exposure. We expect that the leverage ratio will further
increase in the coming years.

Pillar 3 report 2017 91
14.4. Countercyclical buffer by country and institution-specific countercyclical buffer rate
Countercyclical buffer by country (in million euros)
At 31December 2017
General credit exposures Trading book exposure Securitisation exposure Own funds requirements
Countries
Exposure value
under the Standardized
approach
Exposure value under
the IRB Approach
Sum of long and short
positions of trading book
exposures for SA
Value of trading
book exposure
under the IRB
approach
Exposure value
under the Standardized
approach
Exposure value under
the IRB Approach
Of which: general
credit exposures
Of which: trading
book exposure
Of which: securitisation
exposure Total
Own funds requirements
weights
Counter-cyclical capital
buffer rate set by the
Designated Authority
Argentina 29 796 - - - - 46 - - 46 0.4% 0.0%
Australia 294 18,840 - - - 315 374 - 5 380 3.0% 0.0%
Austria 9 333 - - - - 8 - - 8 0.1% 0.0%
Belgium 23 2,268 - - - - 80 - - 80 0.6% 0.0%
Brazil 2,909 5,599 - - - 346 489 - 6 495 3.9% 0.0%
Brit. Virgin Islands - 379 - - - - 22 - - 22 0.2% 0.0%
Canada 39 4,657 - - - - 114 - - 114 0.9% 0.0%
Chili 959 1,001 - - - - 95 - - 95 0.7% 0.0%
China 438 1,136 - - - 83 89 - 2 91 0.7% 0.0%
Curacao - 439 - - - - 8 - - 8 0.1% 0.0%
Czech Republic - 34 - - - - 1 - - 1 0.0% 0.5%
Denmark 49 506 - - - - 16 - - 16 0.1% 0.0%
France 374 3,746 - - - - 161 - - 161 1.3% 0.0%
Germany 1,061 4,426 - - - - 185 - - 185 1.5% 0.0%
Great Britain 223 6,493 - - - 85 201 - 1 202 1.6% 0.0%
Hong Kong 12 2,956 - - - - 80 - - 80 0.6% 1.3%
India 95 687 - - - - 52 - - 52 0.4% 0.0%
Indonesia 286 601 - - - 54 52 - - 53 0.4% 0.0%
Ireland 1,421 1,400 - - - 33 148 - - 148 1.2% 0.0%
Italy 182 1,609 - - - - 93 - - 93 0.7% 0.0%
Luxemburg - 1,862 - - - - 70 - - 70 0.5% 0.0%
Mexico 141 864 - - - 125 44 - 2 46 0.4% 0.0%
Netherlands 5,888 333,736 2 - - 3,693 7,665 - 21 7,686 60.3% 0.0%
New Zealand 336 8,731 - - - - 182 - - 182 1.4% 0.0%
Norway 59 630 - - - - 16 - - 16 0.1% 2.0%
Other countries 665 3,198 - - - 6,517 169 - 69 238 1.9% 0.0%
Poland 503 270 - - - - 57 - - 57 0.4% 0.0%
Singapore 97 3,910 - - - 1 74 - - 74 0.6% 0.0%
Spain 37 1,326 - - - - 62 - - 62 0.5% 0.0%
Sweden 60 735 - - - - 28 - - 28 0.2% 2.0%
Switzerland 95 3,211 - - - 209 82 - 3 85 0.7% 0.0%
Turkey 81 430 - - - - 25 - - 25 0.2% 0.0%
United States 2,172 47,399 - - - 1,911 1,498 - 39 1,537 12.0% 0.0%
Unassigned - - - - - - - 321 - 321 2.5% 0.0%
Total 18,538 464,210 2 - - 13,372 12,287 321 149 12,757 100% n/a
Amount of institution-specific countercyclical capital buffer
At 31December 2017
Risk-weighted exposure amount 198,269
Weighted counteryclical buffer rate 0.015%
Countercyclical buffer requirement 29

Pillar 3 report 2017 92
14.5. Reconciliation with EBA-guidelines, CRR articles and EDTF
Index templates of Guidelines on disclosure requirements under part eight of Regulation (EU) No 575/2013
Location in Pillar 3 2017
Template 1: EU LI1 Differences between accounting and regulatory scope of consolidation and mapping of financial statement categories with regulatory risk categories
3.3
Template 2: EU LI2 Main sources of differences between regulatory exposure amounts and carrying values in financial statements 3.3
Template 3: EU LI3 Outline of the differences in the scopes of consolidation (entity-by-entity) not applicable
Template 4: EU OV1 Overview of RWA’s 5.2
Template 5: EU CR10 IRB (specialised lending and equities) 6.2.1
Template 6: EU INS1 Non-deducted participations in insurance undertakings not applicable
Template 23: EU CR8 RWA flow statements of credit risk exposures under the IRB approach not applicable due to first time
adoption
Template 30: EU CCR7 RWA flow statements of CCR exosures under the IMM not applicable due to first time
adoption
Template 25: EU CCR1 Analysis of CCR exposure by approach 6.3.2
Template 26: EU CCR2 CVA capital charge 6.3.2
Template 27: EU CCR8 Exposures to CCPs 6.3.2
Template 31: EU CCR5-A Impact of netting and collateral held on exposure values 6.3.2
Template 32: EU CCR5-B Composition of collateral for exposures to CCR 6.3.2
Template 33: EU CCR6 Credit derivatives exposure 6.3.2
Template 7: EU CRB-B Total and average net amount of exposures 6.2.1
Template 8: EU CRB-C Geographical breakdown of exposures 6.2.1
Template 9: EU CRB-D Concentration of exposures by industry or counterparty types 6.2.1
Template 10: EU CRB-E Maturity of exposures 6.2.1
Template 11: EU CR1-A Credit quality of exposures by exposure class and instrument 6.2.2
Template 12: EU CR1-B Credit quality of exposures by industry 6.2.2
Template 13: EU CR1-C Credit quality of exposures by geography 6.2.2
Template 14: EU CR1-D Ageing of past-due exposures 6.2.2
Template 15: EU CR1-E Non-performing and forborne exposures 6.2.3
Template 16: EU CR2-A Changes in the stock of general and specific credit risk adjustments 6.2.2
Template 17: EU CR2-B Changes in the stock of defaulted and impaired loans and debt securities not applicable due to first time
adoption
Template 20: EU CR5 Standardised approach 6.2.1
Template 28: EU CCR3 Standardised approach - CCR exposures by regulatory portfolio and risk 6.3.2
Template 34: EU MR1 Market risk under the standardised approach 9.1.1
Template 21: EU CR6 IRB approach- Credit risk exposures by exposure class and PD range 6.2.1
Template 24: EU CR9 IRB approach - Backtesting of PD per exposure class not available
Template 29: EU CCR4 IRB approach - CCR exposures by portfolio and PD scale 6.3.2
Template 18: EU CR3 CRM techniques - Overview 6.2.1
Template 19: EU CR4 Standardised approach- Credit risk exposure and CRM effects 6.2.1
Template 22: EU CR7 IRB Approach - Effect on the RWAs of credit derivatives used as CRM techniques not applicable
Template 35: EU MR2-A Market risk under the IMA 9.1.1
Template 36: EU MR2-B RWA flow statements of market risk exposures under the IMA not applicable due to first time
adoption
Template 37: EU MR3 IMA values for trading portfolios 9.1.1
Template 38: EU MR4 Comparison of VaR estimates with gains/losses 9.1.1
Template EU LIQ1 10.2

Pillar 3 report 2017 93
Pillar 3 disclosure topic with reference to CRR-article
Location in Pillar 3 2017 Other locations
Risk management objectives and policies (Article 435) Paragraph 4.1 and Chapter 13Disclosed on our website:
Report on the Banking Code
Scope of application (Article 436) Chapter 3
Own funds (Article 437) Chapter 5, appendix 14.1 and 14.2
Capital requirements (Article 438) Chapter 5
Exposure to counterparty credit risk (Article 439) Paragraph 6.3
Capital buffers (Article 440) Appendix 14.4
Indicators of global systemic importance (Article 441 Chapter 12Disclosed on our website:
G-SIB assessment
Credit risk adjustments (Article 442) Paragraph 6.2
Unencumbered assets (Article 443) Paragraph 10.2
Use of ECAIs (Article 444) Paragraph 6.2
Exposure to market risk (Article 445) Paragraph 9.1
Operational risk (Article 446) Paragraph 8.1
Exposure in equities not included in the trading book (Article 447) Paragraph 6.6
Exposure to interest rate risk on positions not included in the trading book (Article 448) Paragraph 9.2
Exposure to securitization positions (Article 449) Chapter 7
Remuneration policy (Article 450) Chapter 11
Leverage (Article 451) Appendix 14.3
Use of the IRB approach to credit risk (Article 452) Paragraph 6.2
Use of credit risk mitigation techniques (Article 453) Paragraph 6.2
Use of the Advanced Measurement Approaches to operational risk (Article 454) Not applicable
Use of Internal Market Risk models (Article 455) Paragraph 9.1
Index Enhanced Disclosure Task Force (EDTF)
Nr Recommendation Pillar 3 Report 2017
Consolidated financial statements 2017
General recommendations
1 Present all related risk information together in any particular report. Where this is not practicable, provide an index or an aid to navigation to help users locate risk disclosures within the bank’s reports
Appendix 14.5 -
2 Define the bank’s risk terminology and risk measures and present key parameter values used. Chapter 4 -
3 Describe and discuss top and emerging risks, incorporating relevant information in the bank’s external reports on a timely basis. This should include quantitative disclosures, if possible, and a discussion of any changes in those risk exposures during the reporting period.
Paragraph 4.1 -
4 Once the applicable rules are finalised, outline plans to meet each new key regulatory ratio, e.g. the net stable funding ratio, liquidity coverage ratio and leverage ratio and, once the applicable rules are in force, provide such key ratios.
Paragraph 1 Risk Overview and 10.2
-
Risk governance and risk management strategies/business model
5 Summarise prominently the bank’s risk management organisation, processes and key functions. Paragraph 4.2 -
6 Provide a description of the bank’s risk culture, and how procedures and strategies are applied to support the culture. Paragraph 4.1 -
7 Describe the key risks that arise from the bank’s business models and activities, the bank’s risk appetite in the context of its business models and how the bank manages such risks. This is to enable users to understand how business activities are reflected in the bank’s risk measures and how those risk measures relate to line items in the balance sheet and income statement.
Paragraph 4.1 -
8 Describe the use of stress testing within the bank’s risk governance and capital frameworks. Stress testing disclosures should provide a narrative overview of the bank’s internal stress testing process and governance.
Paragraph 4.4.2 -
Capital adequacy and risk-weighted assets
9 Provide minimum Pillar 1 capital requirements, including capital surcharges for G-SIBs and the application of counter-cyclical and capital conservation buffers or the minimum internal ratio established by management.
Paragraph 5.4 -
10 Summarise information contained in the composition of capital templates adopted by the Basel Committee to provide an overview of the main components of capital, including capital instruments and regulatory adjustments. A reconciliation of the accounting balance sheet to the regulatory balance sheet should be disclosed.
Paragraph 5.1 and appendix 14.1
-
11 Present a flow statement of movements since the prior reporting date in regulatory capital, including changes in Common Equity Tier 1, Tier 1 and Tier 2 capital
Paragraph 5.1 -
12 Qualitatively and quantitatively discuss capital planning within a more general discussion of management’s strategic planning, including a description of management’s view of the required or targeted level of capital and how this will be established.
Paragraph 5.1 -
13 Provide granular information to explain how risk-weighted assets (RWAs) relate to business activities and related risks. Paragraph 5.2 -

Pillar 3 report 2017 94
Nr Recommendation Pillar 3 Report 2017
Consolidated financial statements 2017
14 Present a table showing the capital requirements for each method used for calculating RWAs for credit risk, including counterparty credit risk, for each Basel asset class as well as for major portfolios within those classes. For market risk and operational risk, present a table showing the capital requirements for each method used for calculating them. Disclosures should be accompanied by additional information about significant models used, e.g. data periods, downturn parameter thresholds and methodology for calculating loss given default (LGD).
Paragraph 5.2 -
15 Tabulate credit risk in the banking book showing average probability of default (PD) and LGD as well as exposure at default (EAD), total RWAs and RWA density for Basel asset classes and major portfolios within the Basel asset classes at a suitable level of granularity based on internal ratings grades. For non-retail banking book credit portfolios, internal ratings grades and PD bands should be mapped against external credit ratings and the number of PD bands presented should match the number of notch-specific ratings used by credit rating agencies
Paragraph 6.2 -
16 Present a flow statement that reconciles movements in RWAs for the period for each RWA risk type Not applicable
17 Provide a narrative putting Basel Pillar 3 back-testing requirements into context, including how the bank has assessed model performance and validated its models against default and loss.
Paragraph 6.2 -
Liquidity
18 Describe how the bank manages its potential liquidity needs and provide a quantitative analysis of the components of the liquidity reserve held to meet these needs, ideally by providing averages as well as period-end balances. The description should be complemented by an explanation of possible limitations on the use of the liquidity reserve maintained in any material subsidiary or currency
Paragraph 10.1 and paragraph 10.2
-
Funding
19 Summarise encumbered and unencumbered assets in a tabular format by balance sheet categories, including collateral received that can be rehypothecated or otherwise redeployed. This is to facilitate an understanding of available and unrestricted assets to support potential funding and collateral needs
Paragraph 10.2
20 Tabulate consolidated total assets, liabilities and off-balance sheet commitments by remaining contractual maturity at the balance sheet date. Present separately (i) senior unsecured borrowing (ii) senior secured borrowing (separately for covered bonds and repos) and (iii) subordinated borrowing. Banks should provide a narrative discussion of management’s approach to determining the behavioural characteristics of financial assets and liabilities
Paragraph 10.2 Paragraph 4.7
21 Discuss the bank’s funding strategy, including key sources and any funding concentrations, to enable effective insight into available funding sources, reliance on wholesale funding, any geographical or currency risks and changes in those sources over time.
Paragraph 10.2 -
Market Risk
22 Provide information that facilitates users’ understanding of the linkages between line items in the balance sheet and the income statement with positions included in the traded market risk disclosures (using the bank’s primary risk management measures such as Value at Risk (VaR)) and non-traded market risk disclosures such as risk factor sensitivities, economic value and earnings scenarios and/or sensitivities
Chapter 9 -
23 Provide further qualitative and quantitative breakdowns of significant trading and nontrading market risk factors that may be relevant to the bank’s portfolios beyond interest rates, foreign exchange, commodity and equity measures
Paragraph 9.1 -
24 Provide qualitative and quantitative disclosures that describe significant market risk measurement model limitations, assumptions, validation procedures, use of proxies, changes in risk measures and models through time and descriptions of the reasons for back-testing exceptions, and how these results are used to enhance the parameters of the model.
Paragraph 9.1.1 -
25 Provide a description of the primary risk management techniques employed by the bank to measure and assess the risk of loss beyond reported risk measures and parameters, such as VaR, earnings or economic value scenario results, through methods such as stress tests, expected shortfall, economic capital, scenario analysis, stressed VaR or other alternative approaches. The disclosure should discuss how market liquidity horizons are considered and applied within such measures.
Paragraph 9.1.1 and 9.1.2
-
Credit Risk
26 Provide information that facilitates users’ understanding of the bank’s credit risk profile, including any significant credit risk concentrations. This should include a quantitative summary of aggregate credit risk exposures that reconciles to the balance sheet, including detailed tables for both retail and corporate portfolios that segments them by relevant factors. The disclosure should also incorporate credit risk likely to arise from off-balance sheet commitments by type.
Paragraph 6.2.1 -
27 Describe the policies for identifying impaired or non-performing loans, including how the bank defines impaired or non-performing, restructured and returned-to-performing (cured) loans as well as explanations of loan forbearance policies.
Paragraph 6.2.2 -
28 Provide a reconciliation of the opening and closing balances of non-performing or impaired loans in the period and the allowance for loan losses. Disclosures should include an explanation of the effects of loan acquisitions on ratio trends, and qualitative and quantitative information about restructured loans
Paragraph 6.2.2 Chapter 11
29 Provide a quantitative and qualitative analysis of the bank’s counterparty credit risk that arises from its derivatives transactions. This should quantify notional derivatives exposure, including whether derivatives are over-the-counter (OTC) or traded on recognised exchanges. Where the derivatives are OTC, the disclosure should quantify how much is settled by central counterparties and how much is not, as well as provide a description of collateral agreements
Paragraph 6.3.2 -
30 Provide qualitative information on credit risk mitigation, including collateral held for all sources of credit risk and quantitative information where meaningful. Collateral disclosures should be sufficiently detailed to allow an assessment of the quality of collateral. Disclosures should also discuss the use of mitigants to manage credit risk arising from market risk exposures (i.e. the management of the impact of market risk on derivatives counterparty risk) and single name concentrations
Paragraph 6.2, paragraph 6.3.1 and paragraph 6.3.2
Paragraph 4.3.3
Other risks
31 Describe ‘other risk’ types based on management’s classifications and discuss how each one is identified, governed, measured and managed. In addition to risks such as operational risk, reputational risk, fraud risk and legal risk, it may be relevant to include topical risks such as business continuity, regulatory compliance, technology, and outsourcing.
Paragraph 8.1 -
32 Discuss publicly known risk events related to other risks, including operational, regulatory compliance and legal risks, where material or potentially material loss events have occurred. Such disclosures should concentrate on the effect on the business, the lessons learned and the resulting changes to risk processes already implemented or in progress
Paragraph 8.2 Paragraph 4.10

Pillar 3 report 2017 95
EBA European Banking Authority
EATE Exposure at Transfer Event
EatR Equity at Risk
ECAI External Credit Assessment Institution
ECB European Central Bank
EC Economic Capital
EDPM Execution, Delivery & Process Management
EDTF Enhanced Disclosure Task Force
EF External Fraud
EL Expected Loss
EPWS Employment Practices and Workplace Safety
ETP Exchange Traded Products
EU European Union
FED Federal Reserve Bank
FR&R Financial Restructuring & Recovery
FSB Financial Stability Board
GHOS Governors and Heads Of Supervision
HQLA High Quality Liquid Assets
IAA Internal Assessment Approach
IBNR Incurred But Not Reported
ICAAP Internal Capital Adequacy Assessment Process
IF Internal Fraud
IFRS International Financial Reporting Standards
IMA Internal Method Approach
IMM Internal Model Method
IRB Internal Ratings Based
IRC Incremental Risk Charge
ISDA International Swaps and Derivatives Association
KPIs Key Performance Indicators
LAD Loss At Default
LB Local Rabobanks
LCR Liquidity Coverage Ratio
LCS Limit & Control Structures
LGD Loss Given Default
LGTE Loss Given Transfer Event
LLPC Loan Loss Provision Committee
LTV Loan to Value
LQC Loan Quality Classification
MD Modified Duration
MGC Model Governance Committee
MREL Minimum Required Eligible Liabilities
MTM Mark to Market
NCM Non-Clearing Member
NHG Nationale Hypotheek Garantie
NSFR Net Stable Funding Ratio
OLEM Other Loans Exceptionally Mentioned
ORM Operational Risk Management
OTC Over The Counter
14.6. List of abbreviations
ABCP Asset Backed Commercial Paper
ABS Asset Backed Securitisation
AC Audit and Compliance Committee
AIRB Advanced Internal Ratings Based
ALM Asset Liability Management
ALCO Asset Liability Committee
AMA Advanced Measurement Approach
AML Anti-Money Laundering
AT1 Additional Tier 1
BCBS Basel Committee for Banking Supervision
BCM Business Continuity Management
BEICF Business Environment and Internal Control Factors
BIC Brexit Impact Committee
BGOC Brexit Group Oversight Committee
BPD Bouwfonds Property Development
BPV Basis Point Value
BRRD Bank Recovery and Resolution Directive
CA Credit Approvals
CC Credit Committee
CCB CounterCyclical Buffer
CCCRG Central Credit Committee Rabobank Group
CCFI Credit Committee Financial Institutions
CCP Central Counterparties
CCR Counterparty Credit Risk
CDD Customer Due Diligence
CDS Credit Default Swap
CET1 Common Equity Tier 1
CIOO Chief Information Operations Officer
CIU Collective Investement Units
CFO Chief Financial Officer
CLC Country Limits Committee
CLR Compliance Legal Risk
CPBP Cliënts, Products & Business Practices
CRD Capital Requirements Directive
CRO Chief Risk Officer
CRD IV Capital Requirements Directive IV
CRR Capital Requirements Regulation
CRUA Coöperatieve Rabobank U.A.
CSA Credit Support Annex
CTC Complex Transactions Committee
CVA Credit Value Adjustment
DBSF Business Disruption and System Failures
DLL De Lage Landen
DNB De Nederlandsche Bank
DPA Damage to Physical Assets
DRN Deferred Remuneration Note
EAD Exposure at Default
EaR Earnings at Risk

Pillar 3 report 2017 96
RWS Risk Weights for Securitisations
SA Standardised Approach
SDGs Sustainable Development Goals
SFT Securities Financing Transactions
S&P Standard and Poor’s
SREP Supervisory Review and Evaluation Process
SRT Significant Risk Transfer
SST Sustainably Successful Together
SSTC Scenario and Stress Testing Committee
STC Stress Test Committee
SPV Special Purpose Vehicle
SVaR Stressed Value at Risk
TCF Trade & Commodity Finance
TLAC Total Loss Absorbing Capacity
ToR Terms of Reference
TPS Trust Preferred Securities
TRS Total Return Swap
UL Unexpected Loss
VaR Value at Risk
WRR Wholesale, Rural & Retail
P&L Profit and Loss
PFE Potential Future Exposure
PD Probability of Default
PPM Policies and Procedures Management
PWCE Program Wide Credit Enhancement
RAROC Risk Adjusted Return On Capital
RAS Risk Appetite Statement
RC Regulatory Capital
RC Risk Committee
RCF Risk Control Framework
RMBS Residential Mortgage Backed Securities
RMC Risk Management Committee
RM Risk Management
RM FM Risk Management Financial Markets
RM FMA Risk Management Financial Markets Advisory
RMI Regulatory Market Infrastructure
RNIM Risks Not In Model
ROC Regulatory Oversight Committee
RRR Rabobank Risk Rating
RWA Risk Weighted Assets
RWEA Risk Weighted Exposure Amount