AWR Report - Oracle Scratchpad€¦ · Web viewStatistics including the word ... % of DB Time sql...
245
WORKLOAD REPOSITORY report for DB Name DB Id Instance Inst num Release RAC Host ORCL 1198388159 orcl1 1 10.2.0.3.0 YES node1 Snap Id Snap Time Sessions Cursors/Session Begin Snap: 4796 04-Jun-09 16:00:16 47 2.9 End Snap: 4798 04-Jun-09 18:00:55 106 20.4 Elapsed: 120.66 (mins) DB Time: 141.84 (mins) Report Summary Cache Sizes Begin End Buffer Cache: 5,392M 5,392M Std Block Size: 8K Shared Pool Size: 720M 720M Log Buffer: 4,224K Load Profile Per Second Per Transaction Redo size: 229,323.06 14,623.11 Logical reads: 39,954.43 2,547.75 Block changes: 1,350.15 86.09 Physical reads: 66.54 4.24 Physical writes: 37.49 2.39 User calls: 539.97 34.43 Parses: 297.59 18.98 Hard parses: 0.31 0.02 Sorts: 45.63 2.91 Logons: 0.58 0.04 Executes: 529.19 33.74 Transactions: 15.68 % Blocks changed per Read: 3.38 Recursive Call %: 67.37 Rollback per transaction %: 6.43 Rows per Sort: 131.81 Instance Efficiency Percentages (Target 100%) Buffer Nowait %: 99.99 Redo NoWait %: 100.00 Buffer Hit %: 99.96 In-memory Sort %: 100.00 Library Hit %: 99.89 Soft Parse %: 99.89
-
Upload
phungtuong -
Category
Documents
-
view
221 -
download
0
Transcript of AWR Report - Oracle Scratchpad€¦ · Web viewStatistics including the word ... % of DB Time sql...
WORKLOAD REPOSITORY report for DB Name DB Id Instance Inst num Release RAC Host
ORCL 1198388159 orcl1 1 10.2.0.3.0 YES node1
Snap Id Snap Time Sessions Cursors/Session
Begin Snap: 4796 04-Jun-09 16:00:16 47 2.9
End Snap: 4798 04-Jun-09 18:00:55 106 20.4
Elapsed: 120.66 (mins)
DB Time: 141.84 (mins)
Report Summary
Cache Sizes
Begin End
Buffer Cache: 5,392M 5,392M Std Block Size: 8K
Shared Pool Size: 720M 720M Log Buffer: 4,224K
Load Profile
Per Second Per Transaction
Redo size: 229,323.06 14,623.11
Logical reads: 39,954.43 2,547.75
Block changes: 1,350.15 86.09
Physical reads: 66.54 4.24
Physical writes: 37.49 2.39
User calls: 539.97 34.43
Parses: 297.59 18.98
Hard parses: 0.31 0.02
Sorts: 45.63 2.91
Logons: 0.58 0.04
Executes: 529.19 33.74
Transactions: 15.68
% Blocks changed per Read: 3.38 Recursive Call %: 67.37
Rollback per transaction %: 6.43 Rows per Sort: 131.81
Instance Efficiency Percentages (Target 100%)
Buffer Nowait %: 99.99 Redo NoWait %: 100.00
Buffer Hit %: 99.96 In-memory Sort %: 100.00
Library Hit %: 99.89 Soft Parse %: 99.89
Execute to Parse %: 43.77 Latch Hit %: 99.94
Parse CPU to Parse Elapsd %: 96.41 % Non-Parse CPU: 97.63
Shared Pool Statistics

Begin End
Memory Usage %: 69.30 75.94
% SQL with executions>1: 60.18 89.41
% Memory for SQL w/exec>1: 61.24 94.59
Top 5 Timed Events
Event Waits Time(s) Avg Wait(ms) % Total Call Time Wait Class
CPU time 3,201 37.6
gc buffer busy 31,850 1,184 37 13.9 Cluster
log file sync 173,559 877 5 10.3 Commit
flashback buf free by RVWR 24,319 619 25 7.3 Other
db file sequential read 161,855 559 3 6.6 User I/O
RAC StatisticsBegi
n End
Number of Instances:
2 2
Global Cache Load Profile
Per Second
Per Transaction
Global Cache blocks received:
112.55
7.18
Global Cache blocks served:
108.30
6.91
GCS/GES messages received:
388.86
24.80
GCS/GES messages sent:
369.39
23.55
DBW 5.52 0.35

R Fusion writes:
Estd Interconnect traffic (KB)
1,914.94
Global Cache Efficiency Percentages (Target local+remote 100%)
Buffer access - local cache %:
99.68
Buffer access - remote cache %:
0.28
Buffer access - disk %:
0.04
Global Cache and Enqueue Services - Workload Characteristics
Avg global enqueue get time (ms):
1.2
Avg global cache cr block receive time (ms):
0.8
Avg global cache current block receive time (ms):
1.7
Avg global cache
0.0

cr block build time (ms):
Avg global cache cr block send time (ms):
0.1
Global cache log flushes for cr blocks served %:
12.8
Avg global cache cr block flush time (ms):
2.5
Avg global cache current block pin time (ms):
0.6
Avg global cache current block send time (ms):
0.1
Global cache log flushes for current blocks served %:
2.4
Avg global cache curre
37.8

nt block flush time (ms):
Global Cache and Enqueue Services - Messaging Statistics
Avg message sent queue time (ms):
0.1
Avg message sent queue time on ksxp (ms):
0.3
Avg message received queue time (ms):
0.1
Avg GCS message process time (ms):
0.0
Avg GES message process time (ms):
0.0
% of direct sent messages:
61.53
% of indirect sent messages:
17.56
% of flow controlled
20.90
messages:
Main Report Report Summary Wait Events Statistics SQL Statistics Instance Activity Statistics IO Stats Buffer Pool Statistics Advisory Statistics Wait Statistics Undo Statistics Latch Statistics Segment Statistics Dictionary Cache Statistics Library Cache Statistics Memory Statistics Streams Statistics Resource Limit Statistics init.ora Parameters
More RAC Statistics RAC Report Summary Global Enqueue Statistics Global CR Served Stats Global CURRENT Served Stats Global Cache Transfer Stats
Back to Top
Wait Events Statistics Time Model Statistics Wait Class Wait Events Background Wait Events Operating System Statistics Service Statistics Service Wait Class Stats
Back to Top
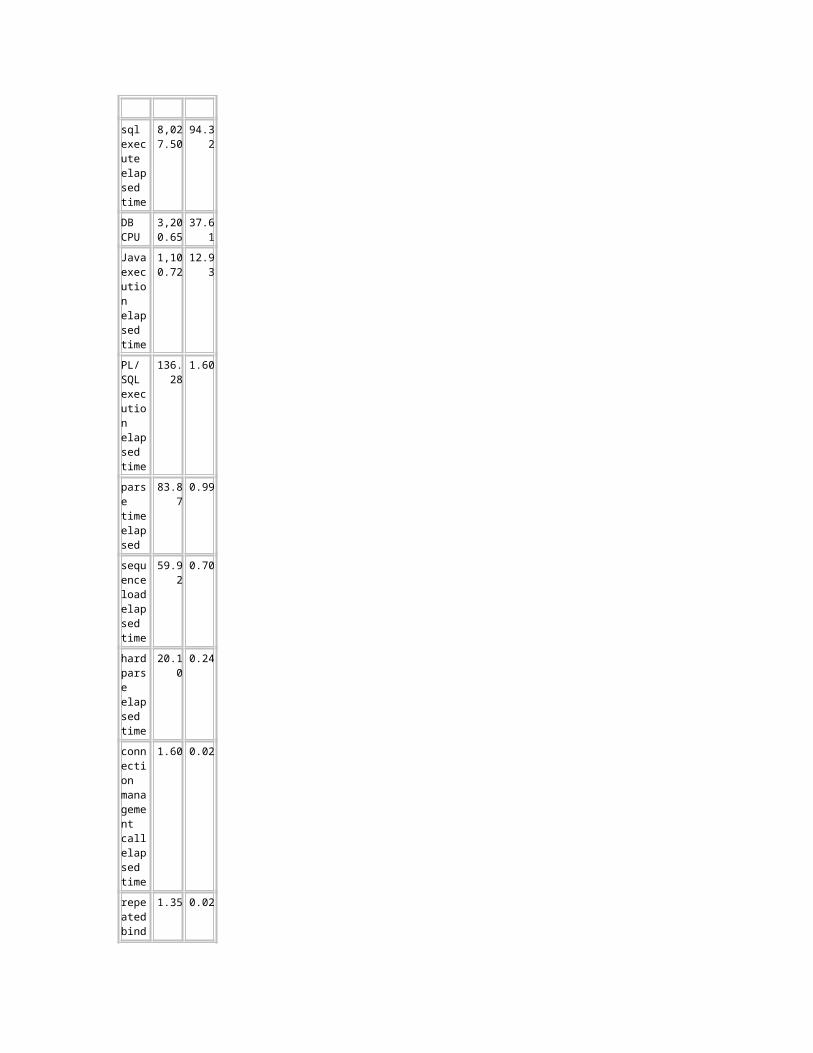
Time Model Statistics Total time in database user-calls (DB Time): 8510.6s Statistics including the word "background" measure background process time, and so do not
contribute to the DB time statistic Ordered by % or DB time desc, Statistic name
Statistic Nam
e
Time (s)
% of DB Tim
e
sql execute elapsed
8,027.50
94.32
time
DB CPU
3,200.65
37.61
Java execution elapsed time
1,100.72
12.93
PL/SQL execution elapsed time
136.28
1.60
parse time elapsed
83.87 0.99
sequence load elapsed time
59.92 0.70
hard parse elapsed time
20.10 0.24
connection management call elapsed time
1.60 0.02
repeated bind elapsed time
1.35 0.02
PL/SQL compilation elapsed time
1.09 0.01
inbound PL/SQL rpc elapsed time
0.90 0.01
hard parse (sharing
0.13 0.00

criteria) elapsed time
RMAN cpu time (backup/restore)
0.04 0.00
hard parse (bind mismatch) elapsed time
0.02 0.00
failed parse elapsed time
0.00 0.00
DB time
8,510.60
background elapsed time
1,546.03
background cpu time
528.56
Back to Wait Events Statistics Back to Top
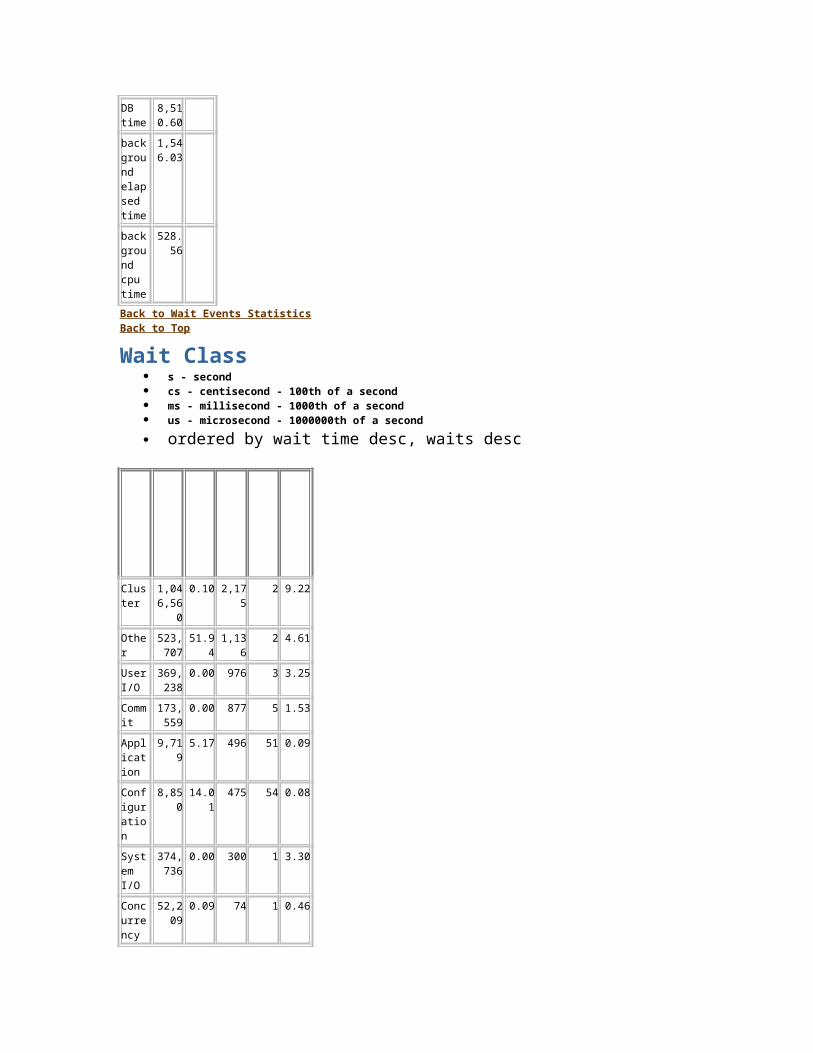
Wait Class s - second cs - centisecond - 100th of a second ms - millisecond - 1000th of a second us - microsecond - 1000000th of a second ordered by wait time desc, waits desc
Wait Clas
sWait
s%Time -outs
Total
Wait Time (s)
Avg wait (ms)
Waits
/txn
Cluster
1,046,560
0.10 2,175 2 9.22
Other 523,707
51.94 1,136 2 4.61
User I/O
369,238
0.00 976 3 3.25
Commit
173,559
0.00 877 5 1.53
Application
9,719 5.17 496 51 0.09
Confi 8,850 14.01 475 54 0.08
guration
System I/O
374,736
0.00 300 1 3.30
Concurrency
52,209
0.09 74 1 0.46
Network
2,833,834
0.00 11 0 24.96
Back to Wait Events Statistics Back to Top
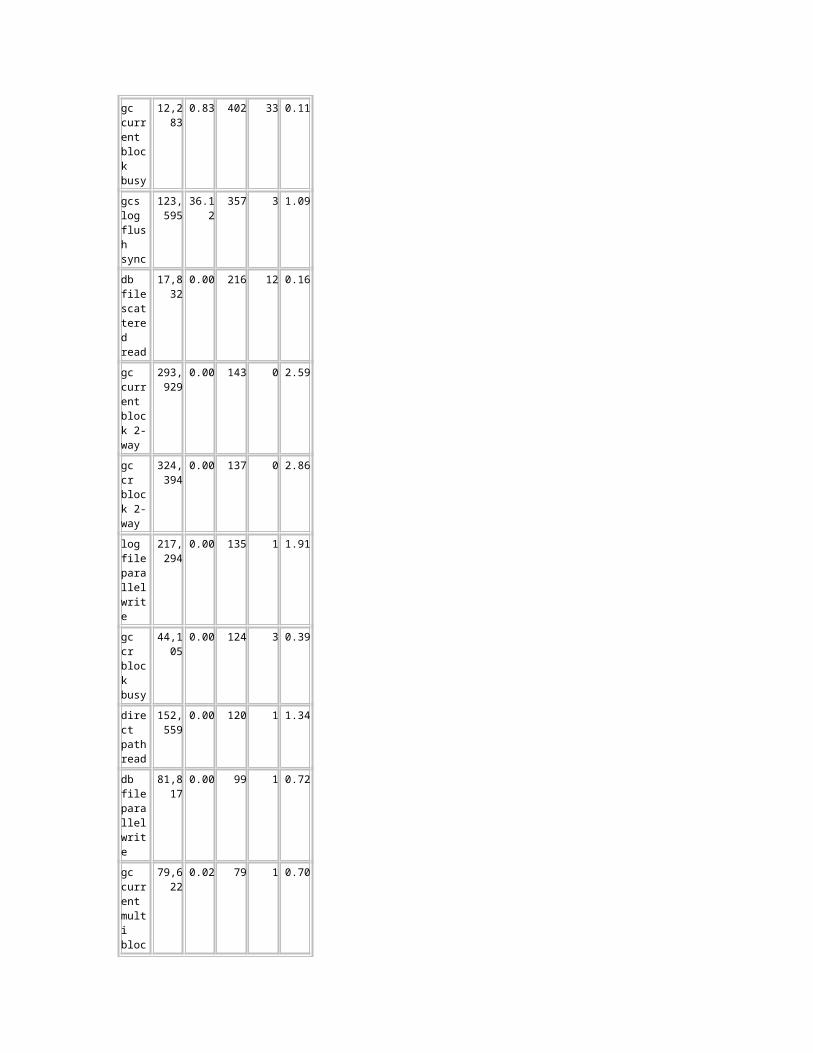
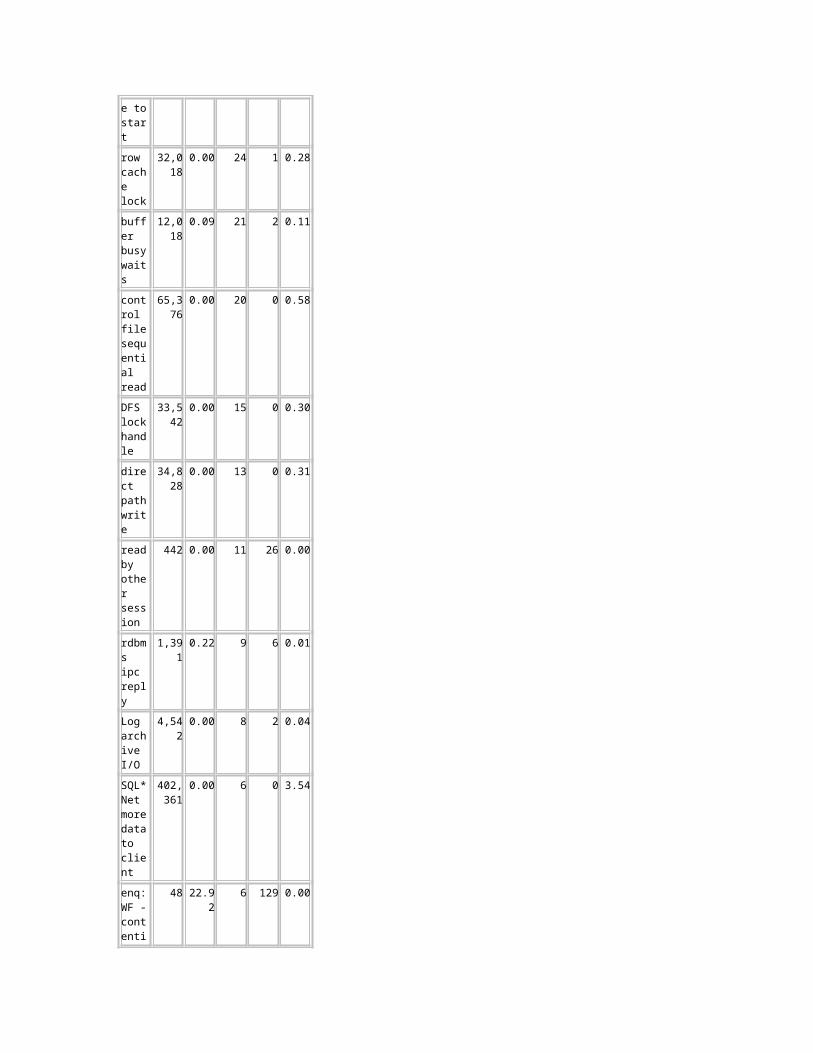
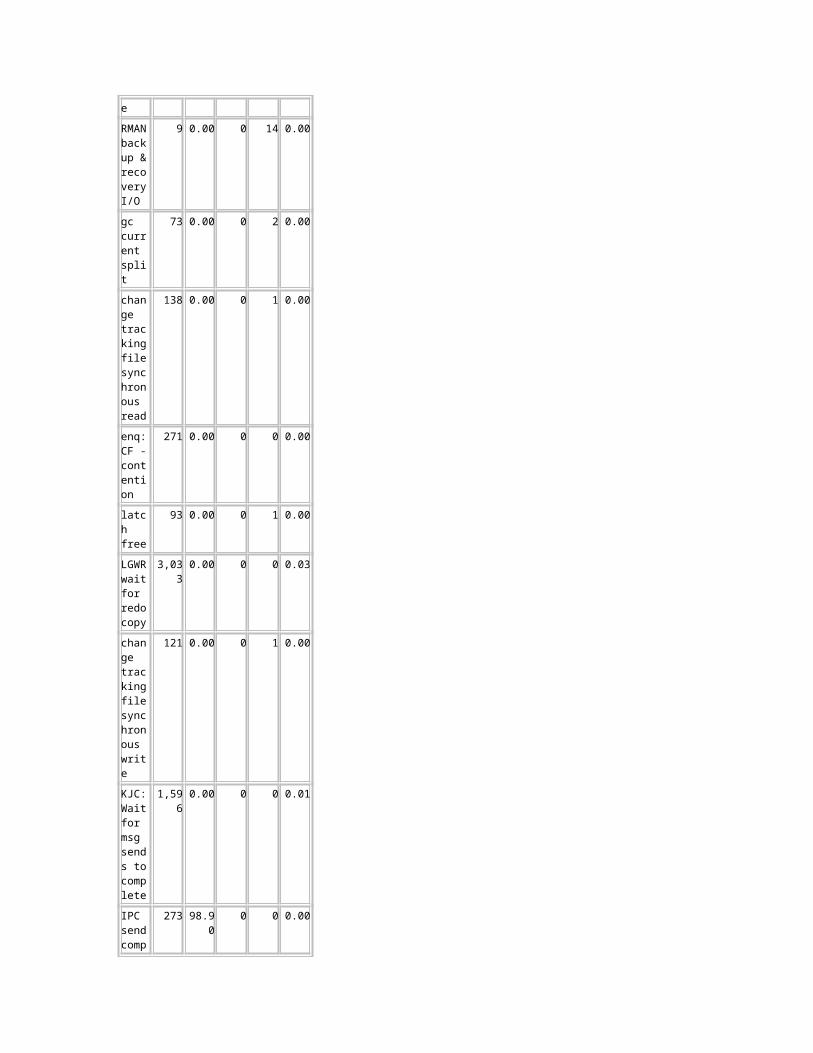
Wait Events s - second cs - centisecond - 100th of a second ms - millisecond - 1000th of a second us - microsecond - 1000000th of a second ordered by wait time desc, waits desc (idle events last)
Event
Waits
%Time -outs
Total
Wait Time (s)
Avg wait (ms)
Waits
/txn
gc buffer busy
31,850
2.75 1,184 37 0.28
log file sync
173,559
0.00 877 5 1.53
flashback buf free by RVWR
24,319
1.46 619 25 0.21
db file sequential read
161,855
0.00 559 3 1.43
enq: TX - row lock contention
6,166 8.14 495 80 0.05
enq: HW - contention
8,243 8.13 474 58 0.07
gc current block busy
12,283
0.83 402 33 0.11
gcs log flush sync
123,595
36.12 357 3 1.09
db file 17,83 0.00 216 12 0.16

scattered read
2
gc current block 2-way
293,929
0.00 143 0 2.59
gc cr block 2-way
324,394
0.00 137 0 2.86
log file parallel write
217,294
0.00 135 1 1.91
gc cr block busy
44,105
0.00 124 3 0.39
direct path read
152,559
0.00 120 1 1.34
db file parallel write
81,817
0.00 99 1 0.72
gc current multi block request
79,622
0.02 79 1 0.70
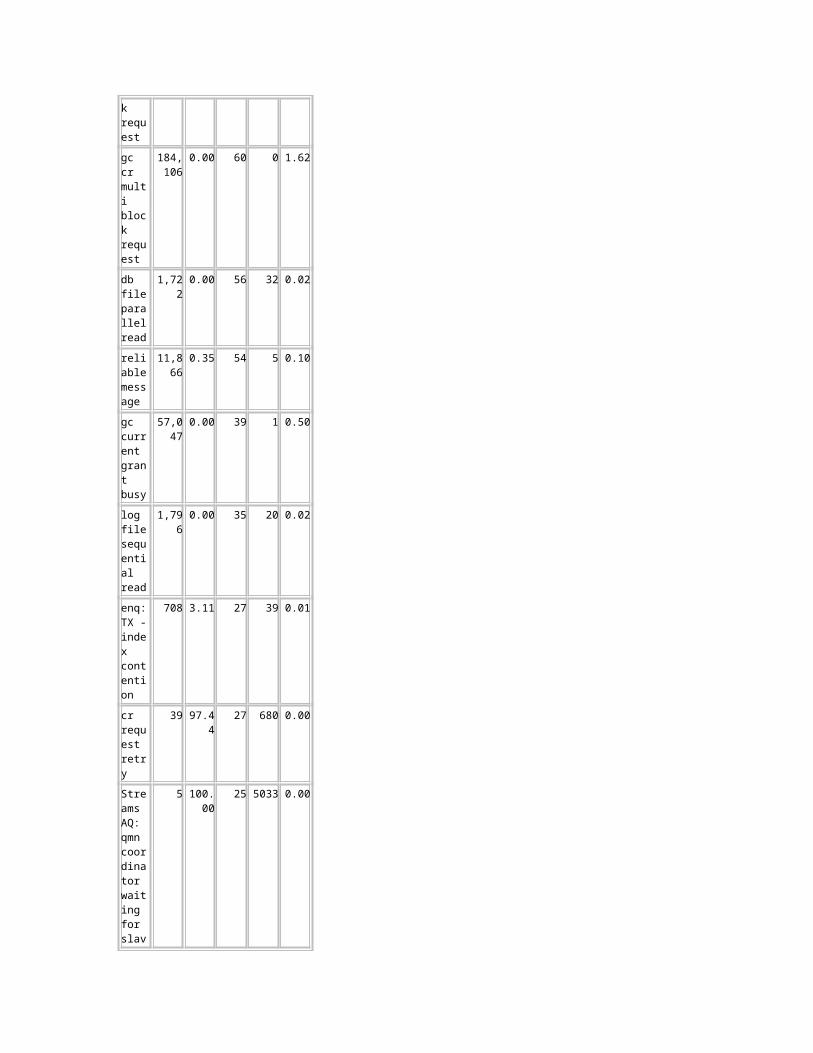
gc cr multi block request
184,106
0.00 60 0 1.62
db file parallel read
1,722 0.00 56 32 0.02
reliable message
11,866
0.35 54 5 0.10
gc current grant busy
57,047
0.00 39 1 0.50
log file sequential read
1,796 0.00 35 20 0.02
enq: TX - index contention
708 3.11 27 39 0.01
cr 39 97.44 27 680 0.00
request retry
Streams AQ: qmn coordinator waiting for slave to start
5 100.00
25 5033 0.00
row cache lock
32,018
0.00 24 1 0.28
buffer busy waits
12,018
0.09 21 2 0.11
control file sequential read
65,376
0.00 20 0 0.58
DFS lock handle
33,542
0.00 15 0 0.30
direct path write
34,828
0.00 13 0 0.31
read by other session
442 0.00 11 26 0.00
rdbms ipc reply
1,391 0.22 9 6 0.01
Log archive I/O
4,542 0.00 8 2 0.04
SQL*Net more data to client
402,361
0.00 6 0 3.54
enq: WF - contention
48 22.92 6 129 0.00
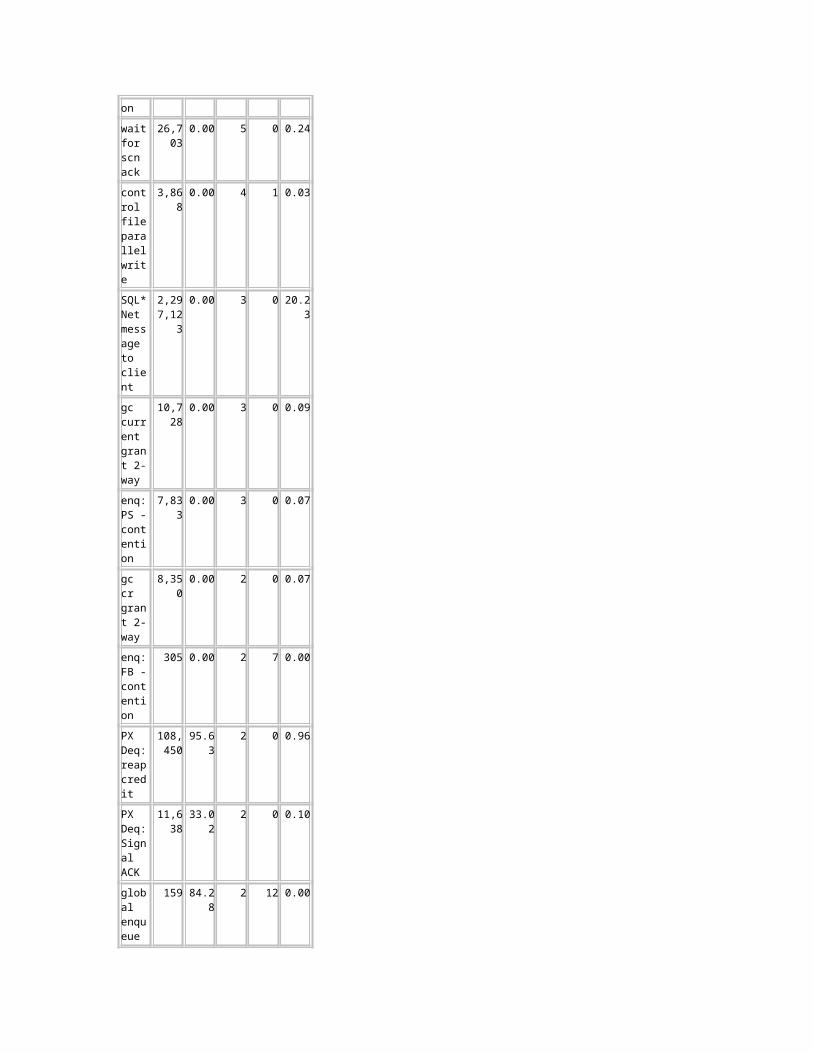
wait for scn ack
26,703
0.00 5 0 0.24
control file parallel write
3,868 0.00 4 1 0.03

SQL*Net message to client
2,297,123
0.00 3 0 20.23
gc current grant 2-way
10,728
0.00 3 0 0.09
enq: PS - contention
7,833 0.00 3 0 0.07
gc cr grant 2-way
8,350 0.00 2 0 0.07
enq: FB - contention
305 0.00 2 7 0.00
PX Deq: reap credit
108,450
95.63 2 0 0.96
PX Deq: Signal ACK
11,638
33.02 2 0 0.10
global enqueue expand wait
159 84.28 2 12 0.00
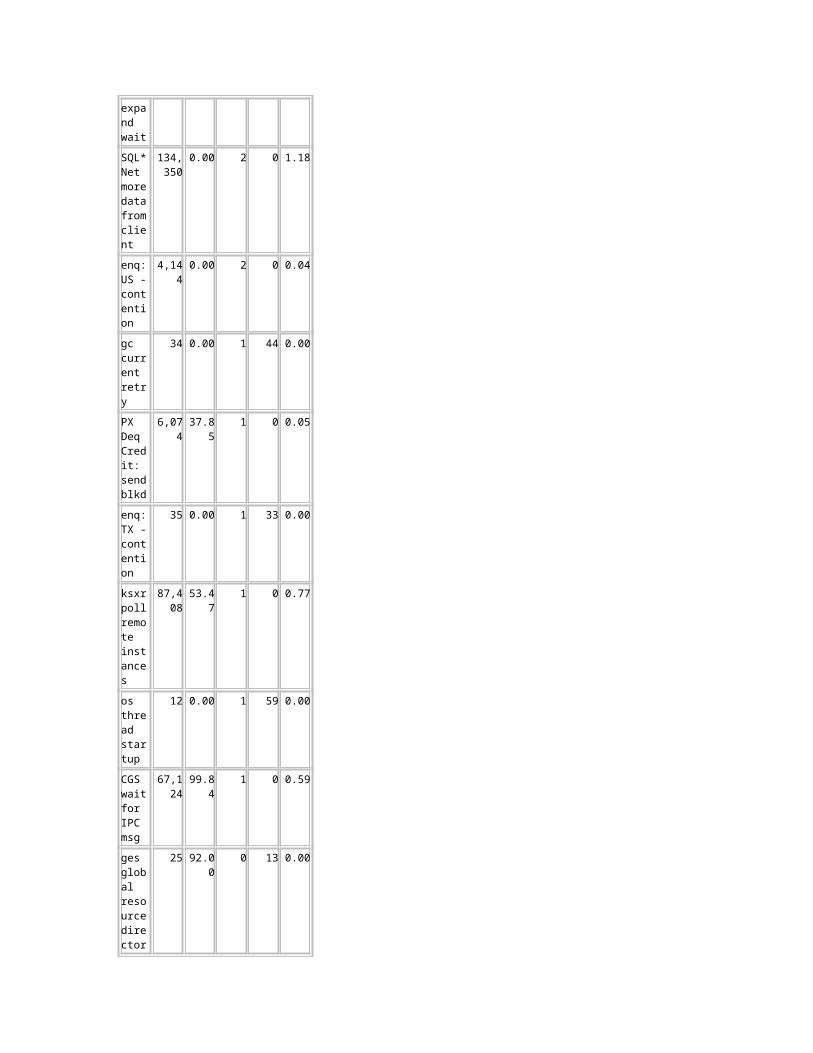
SQL*Net more data from client
134,350
0.00 2 0 1.18
enq: US - contention
4,144 0.00 2 0 0.04
gc current retry
34 0.00 1 44 0.00
PX Deq Credit: send blkd
6,074 37.85 1 0 0.05
enq: TX - contention
35 0.00 1 33 0.00
ksxr poll remote instances
87,408
53.47 1 0 0.77
os thread startup
12 0.00 1 59 0.00
CGS wait for IPC msg
67,124
99.84 1 0 0.59
ges global resource directory to be frozen
25 92.00 0 13 0.00
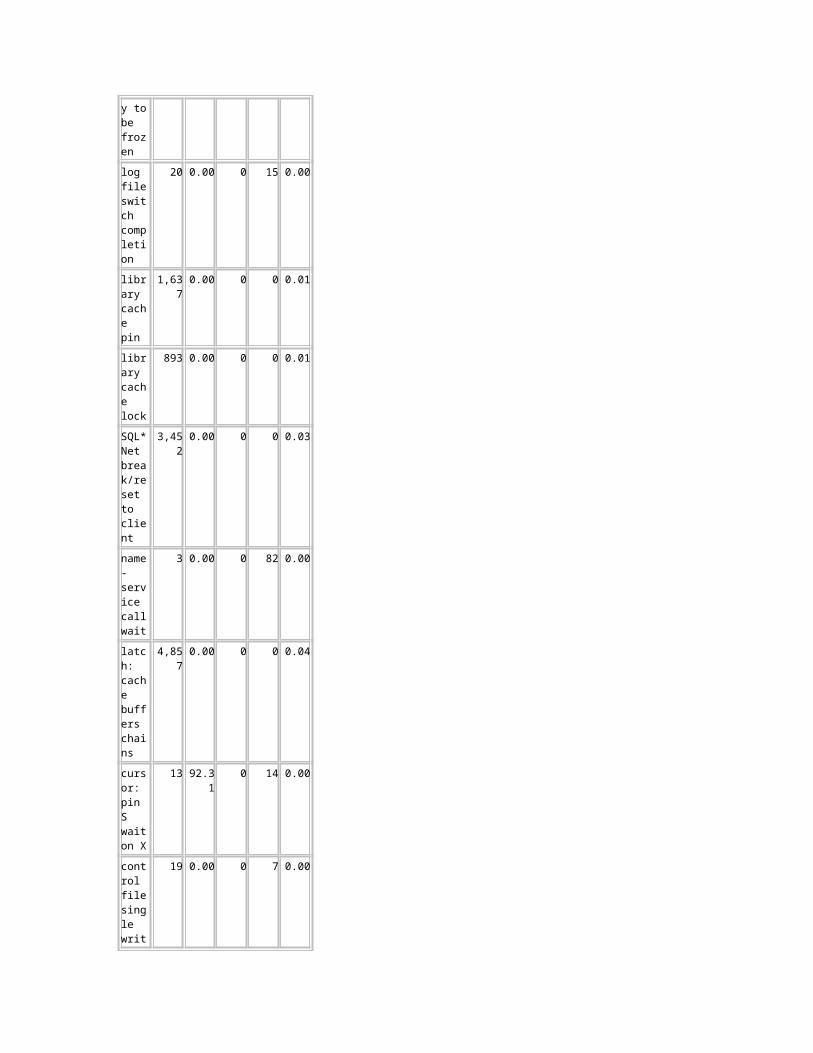
log file switch completion
20 0.00 0 15 0.00
library cache pin
1,637 0.00 0 0 0.01
library cache lock
893 0.00 0 0 0.01
SQL*Net break/reset to client
3,452 0.00 0 0 0.03
name-service call wait
3 0.00 0 82 0.00
latch: cache buffers chains
4,857 0.00 0 0 0.04
cursor: pin S wait on X
13 92.31 0 14 0.00
control file single write
19 0.00 0 7 0.00
RMAN backup & recovery I/O
9 0.00 0 14 0.00
gc curre
73 0.00 0 2 0.00
nt split
change tracking file synchronous read
138 0.00 0 1 0.00
enq: CF - contention
271 0.00 0 0 0.00
latch free
93 0.00 0 1 0.00
LGWR wait for redo copy
3,033 0.00 0 0 0.03
change tracking file synchronous write
121 0.00 0 1 0.00
KJC: Wait for msg sends to complete
1,596 0.00 0 0 0.01
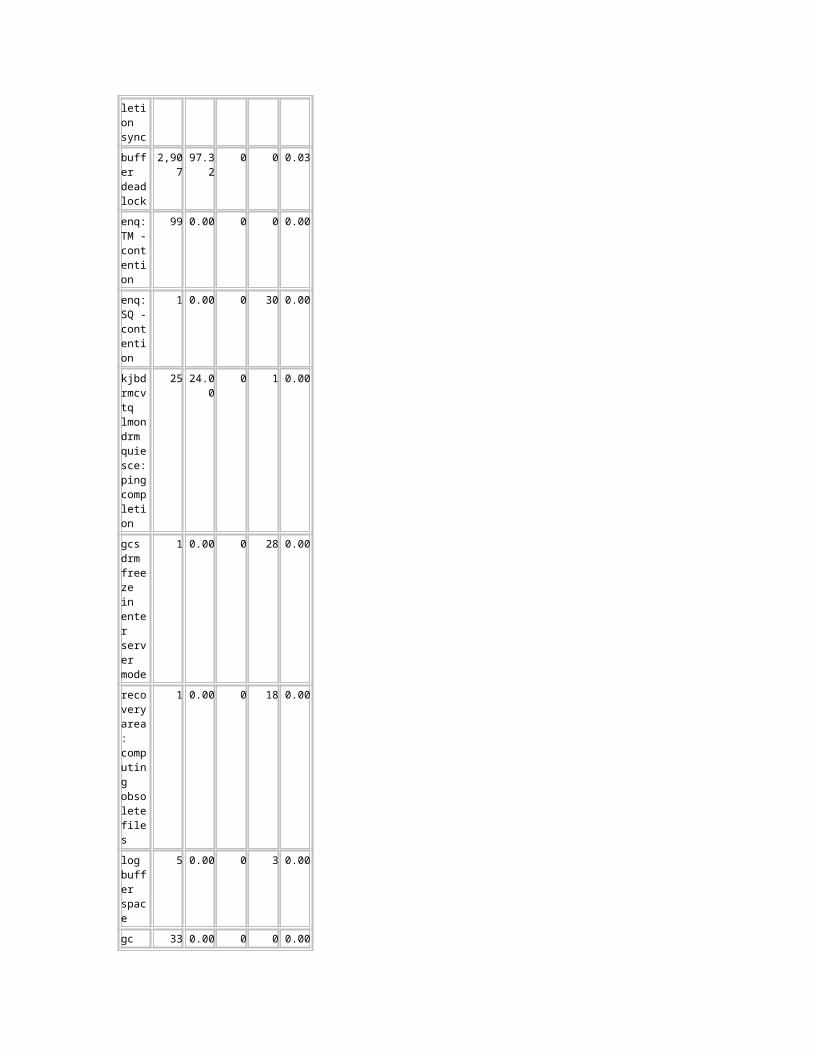
IPC send completion sync
273 98.90 0 0 0.00
buffer deadlock
2,907 97.32 0 0 0.03
enq: TM - contention
99 0.00 0 0 0.00
enq: SQ - contention
1 0.00 0 30 0.00
kjbdrmcvtq lmon drm quiesce: ping completion
25 24.00 0 1 0.00
gcs drm
1 0.00 0 28 0.00
freeze in enter server mode
recovery area: computing obsolete files
1 0.00 0 18 0.00
log buffer space
5 0.00 0 3 0.00
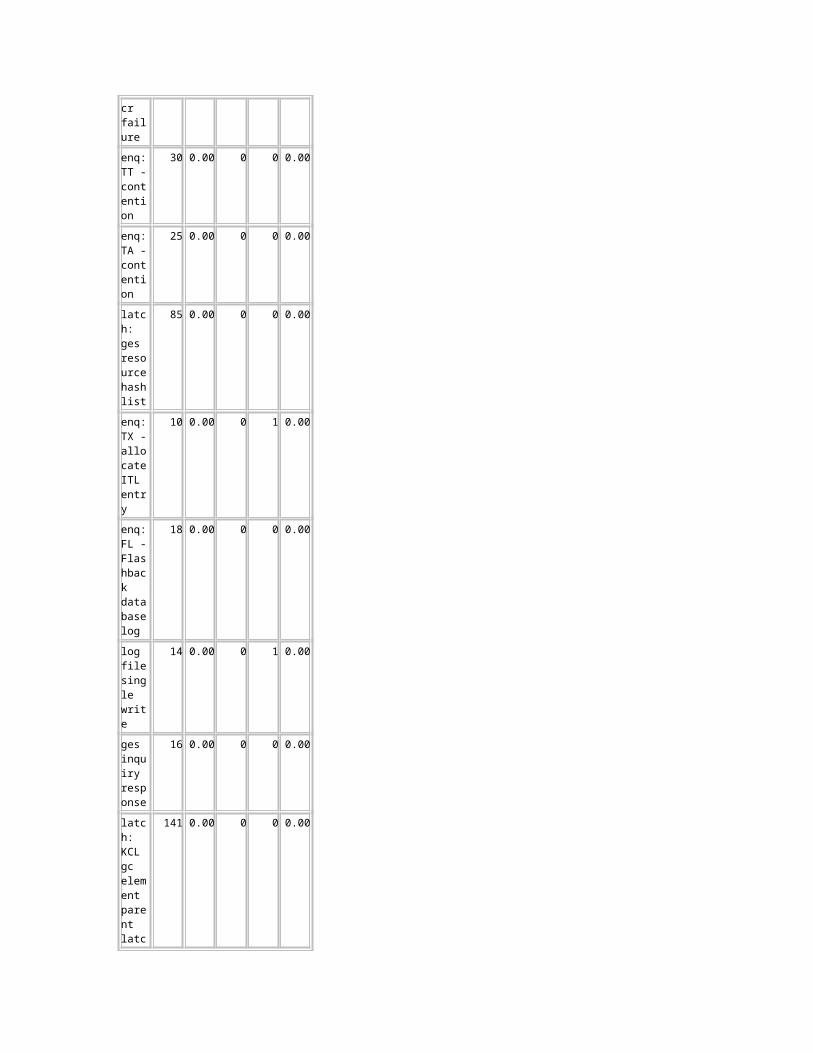
gc cr failure
33 0.00 0 0 0.00
enq: TT - contention
30 0.00 0 0 0.00
enq: TA - contention
25 0.00 0 0 0.00
latch: ges resource hash list
85 0.00 0 0 0.00
enq: TX - allocate ITL entry
10 0.00 0 1 0.00
enq: FL - Flashback database log
18 0.00 0 0 0.00
log file single write
14 0.00 0 1 0.00
ges inquiry response
16 0.00 0 0 0.00
latch: KCL gc element parent latch
141 0.00 0 0 0.00
enq: DR - conte
7 0.00 0 0 0.00
ntion
latch: row cache objects
14 0.00 0 0 0.00
latch: shared pool
15 0.00 0 0 0.00
latch: gcs resource hash
47 0.00 0 0 0.00
enq: CT - global space management
5 0.00 0 0 0.00
enq: WL - contention
4 0.00 0 0 0.00
enq: MW - contention
5 0.00 0 0 0.00
undo segment extension
571 99.82 0 0 0.01
gc cr disk read
4 0.00 0 0 0.00
latch: library cache
18 0.00 0 0 0.00
gc current block unknown
2 0.00 0 1 0.00
library cache load lock
3 0.00 0 0 0.00
enq: TQ - TM contention
3 0.00 0 0 0.00
enq: RS - prevent file delete
2 0.00 0 0 0.00
ksfd: async
1 0.00 0 1 0.00
disk IO
enq: JS - job run lock - synchronize
2 0.00 0 0 0.00
PX qref latch
23 91.30 0 0 0.00
enq: UL - contention
2 0.00 0 0 0.00
cursor: pin S
44 0.00 0 0 0.00
lock deadlock retry
32 100.00
0 0 0.00
latch: enqueue hash chains
8 0.00 0 0 0.00
recovery area: computing backed up files
1 0.00 0 0 0.00
enq: AF - task serialization
1 0.00 0 0 0.00
enq: RS - read alert level
1 0.00 0 0 0.00
latch: redo allocation
3 0.00 0 0 0.00
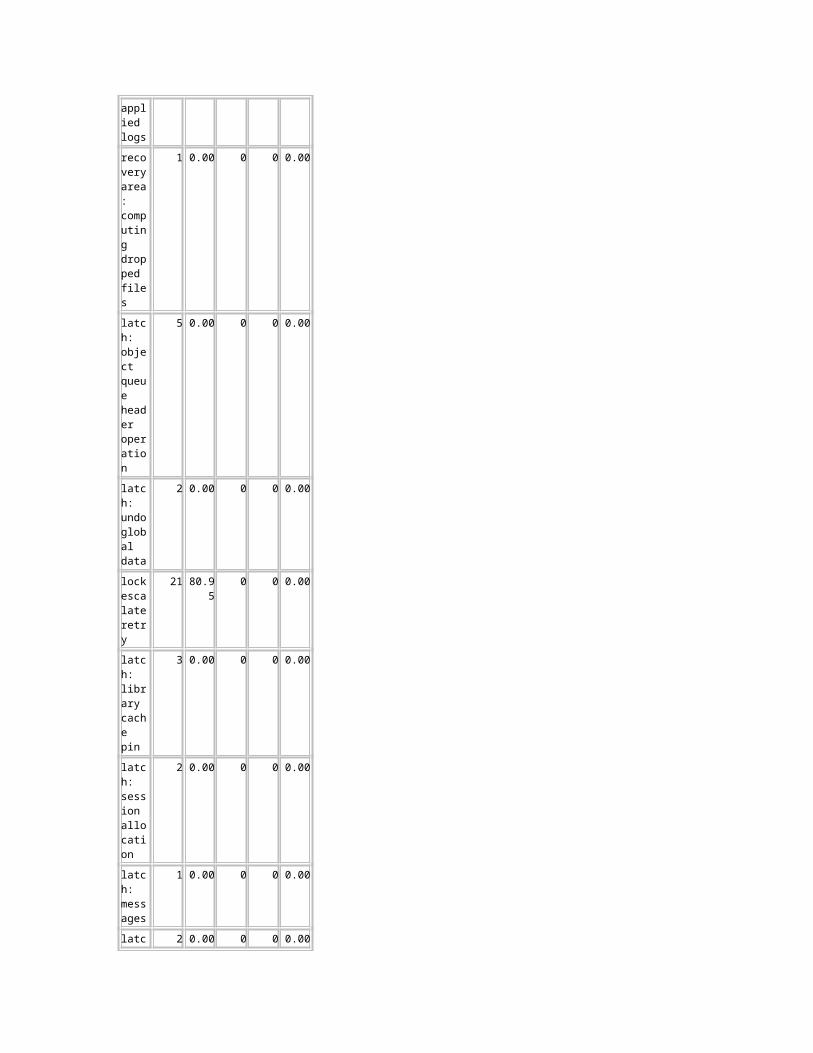
recovery area: computing applied logs
1 0.00 0 0 0.00
recovery area: computing
1 0.00 0 0 0.00
dropped files
latch: object queue header operation
5 0.00 0 0 0.00
latch: undo global data
2 0.00 0 0 0.00
lock escalate retry
21 80.95 0 0 0.00
latch: library cache pin
3 0.00 0 0 0.00
latch: session allocation
2 0.00 0 0 0.00
latch: messages
1 0.00 0 0 0.00
latch: cache buffers lru chain
2 0.00 0 0 0.00
latch: checkpoint queue latch
1 0.00 0 0 0.00
ges2 LMON to wake up LMD - mrcvr
3 0.00 0 0 0.00
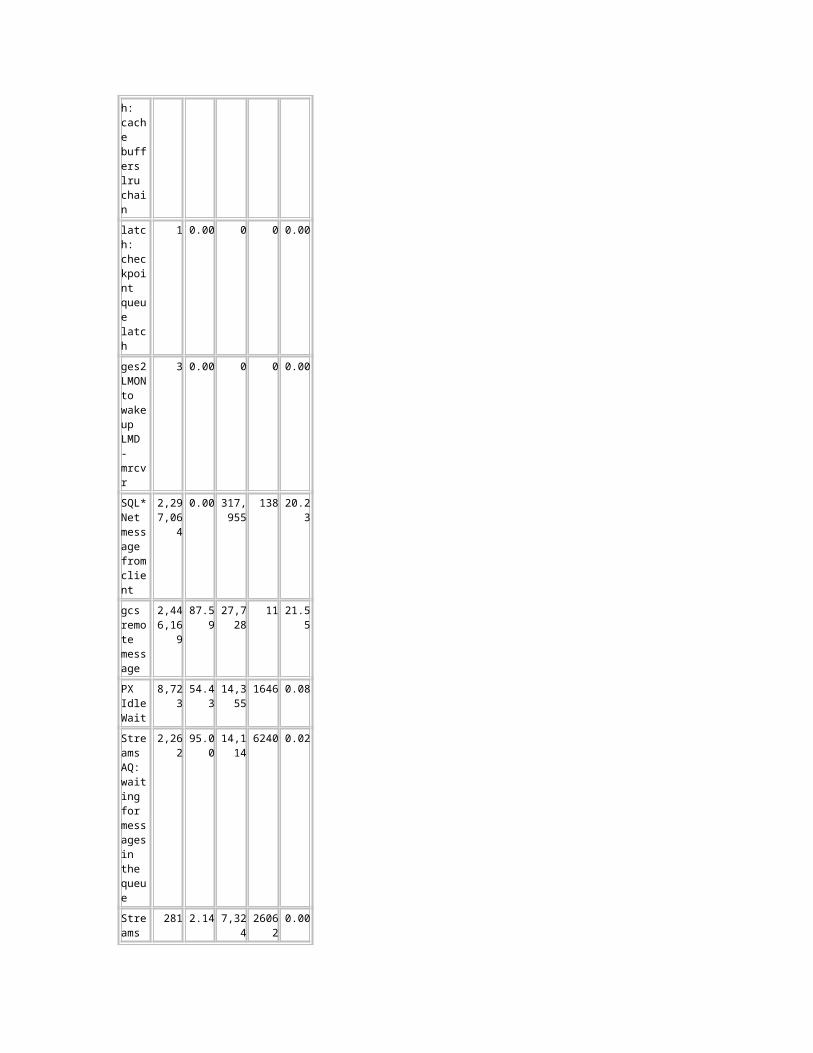
SQL*Net message from client
2,297,064
0.00 317,955
138 20.23
gcs remote message
2,446,169
87.59 27,728
11 21.55
PX Idle Wait
8,723 54.43 14,355
1646 0.08
Streams
2,262 95.00 14,114
6240 0.02
AQ: waiting for messages in the queue
Streams AQ: qmn slave idle wait
281 2.14 7,324 26062 0.00
DIAG idle wait
34,335
0.00 7,067 206 0.30
jobq slave wait
2,414 98.84 7,065 2927 0.02
ASM background timer
1,961 0.00 7,062 3601 0.02
Streams AQ: waiting for time management or cleanup tasks
269 44.61 7,059 26240 0.00
ges remote message
234,330
84.24 7,055 30 2.06
virtual circuit status
241 100.00
7,024 29146 0.00
Streams AQ: qmn coordinator idle wait
526 49.62 7,002 13312 0.00
class slave wait
400 7.00 6,903 17258 0.00
PX Deq: Execute Reply
10,114
34.71 36 4 0.09
PX Deq: Execution
17,612
0.49 24 1 0.16
Msg
PX Deq: Join ACK
11,111
31.28 6 1 0.10
PX Deq: Parse Reply
9,968 25.83 2 0 0.09
KSV master wait
364 0.00 2 5 0.00
PX Deq: Msg Fragment
1,081 3.24 0 0 0.01
Streams AQ: RAC qmn coordinator idle wait
526 100.00
0 0 0.00
Back to Wait Events Statistics Back to Top
Background Wait Events ordered by wait time desc, waits desc (idle events last)
Event
Waits
%Time -outs
Total
Wait Time (s)
Avg wait (ms)
Waits
/txn
events in waitclass Other
316,380
50.23 451 1 2.79
log file parallel write
217,295
0.00 135 1 1.91
db file parallel write
81,817
0.00 99 1 0.72
log file sequential read
1,796 0.00 35 20 0.02
control file sequential read
17,427
0.00 8 0 0.15
Log archive I/O
4,542 0.00 8 2 0.04
control file parallel write
3,819 0.00 3 1 0.03
os thread startup
10 0.00 1 56 0.00
db file sequential read
105 0.00 1 5 0.00
gc cr block 2-way
1,176 0.00 1 0 0.01
row cache lock
1,311 0.00 0 0 0.01
gc current block 2-way
388 0.00 0 0 0.00
direct path read
134 0.00 0 1 0.00
buffer busy waits
420 0.71 0 0 0.00
library cache lock
62 0.00 0 0 0.00
log file single write
14 0.00 0 1 0.00
direct path write
135 0.00 0 0 0.00
gc current grant 2-way
12 0.00 0 0 0.00
latch: cache buffers chains
90 0.00 0 0 0.00
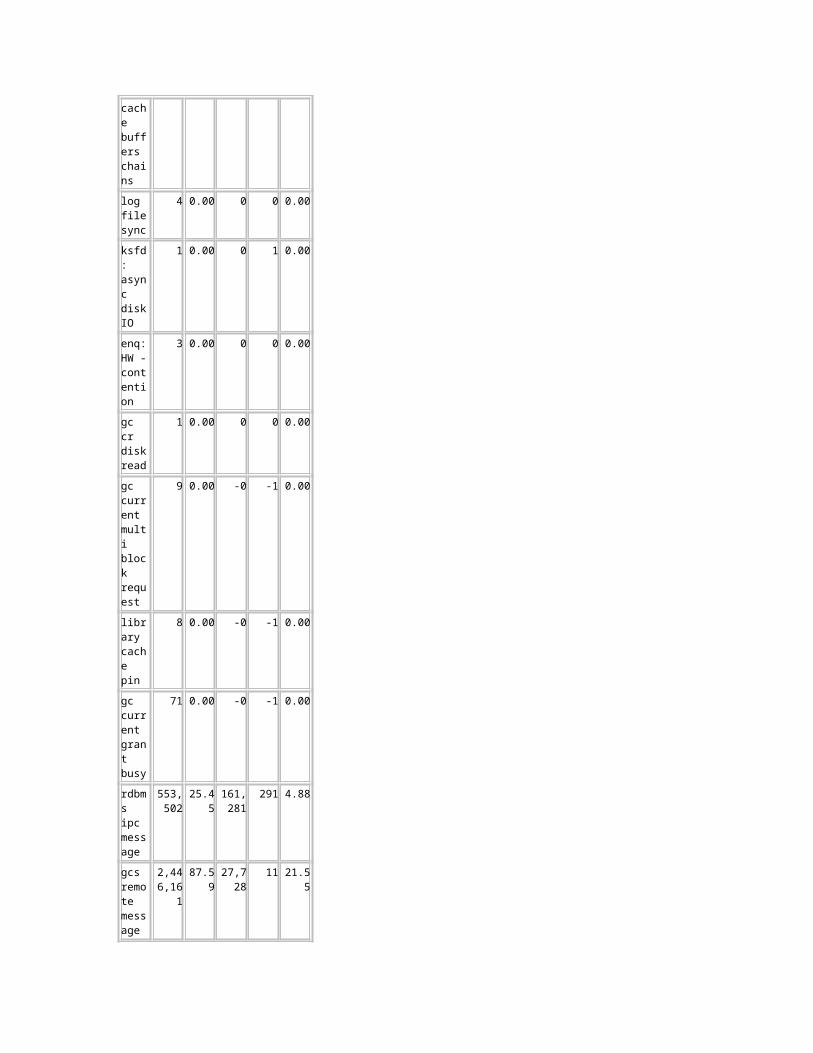
log file sync
4 0.00 0 0 0.00
ksfd: async disk IO
1 0.00 0 1 0.00

enq: HW - contention
3 0.00 0 0 0.00
gc cr disk read
1 0.00 0 0 0.00
gc current multi block request
9 0.00 -0 -1 0.00
library cache pin
8 0.00 -0 -1 0.00
gc current grant busy
71 0.00 -0 -1 0.00
rdbms ipc message
553,502
25.45 161,281
291 4.88
gcs remote message
2,446,161
87.59 27,728
11 21.55
smon timer
102 0.00 7,167 70269 0.00
DIAG idle wait
34,334
0.00 7,066 206 0.30
ASM background timer
1,961 0.00 7,062 3601 0.02
pmon timer
2,678 99.85 7,061 2637 0.02
Streams AQ: waiting for time management or cleanup tasks
269 44.61 7,059 26240 0.00
ges remote message
234,323
84.24 7,055 30 2.06
Streams AQ: qmn
526 49.62 7,002 13312 0.00

coordinator idle wait
class slave wait
390 7.18 6,903 17700 0.00
Streams AQ: qmn slave idle wait
17 0.00 471 27692 0.00
KSV master wait
252 0.00 1 6 0.00
PX Deq: Join ACK
60 40.00 0 1 0.00
PX Deq: Parse Reply
57 36.84 0 0 0.00
PX Deq: Execute Reply
55 34.55 0 0 0.00
Streams AQ: RAC qmn coordinator idle wait
526 100.00
0 0 0.00
Back to Wait Events Statistics Back to Top
Operating System StatisticsStatistic
Total
AVG_BUSY_TIME
38,317
AVG_IDLE_TIME
685,036
AVG_IOWAIT_TIME
0
AVG_SYS_TIME
13,990
AVG_USER_TIM
24,086

E
BUSY_TIME
616,603
IDLE_TIME
10,964,262
IOWAIT_TIME
0
SYS_TIME
227,595
USER_TIME
389,008
LOAD 0
OS_CPU_WAIT_TIME
5,300
RSRC_MGR_CPU_WAIT_TIME
0
VM_IN_BYTES
323,584
VM_OUT_BYTES
0
PHYSICAL_MEMORY_BYTES
33,813,995,
520
NUM_CPUS
16
Back to Wait Events Statistics Back to Top
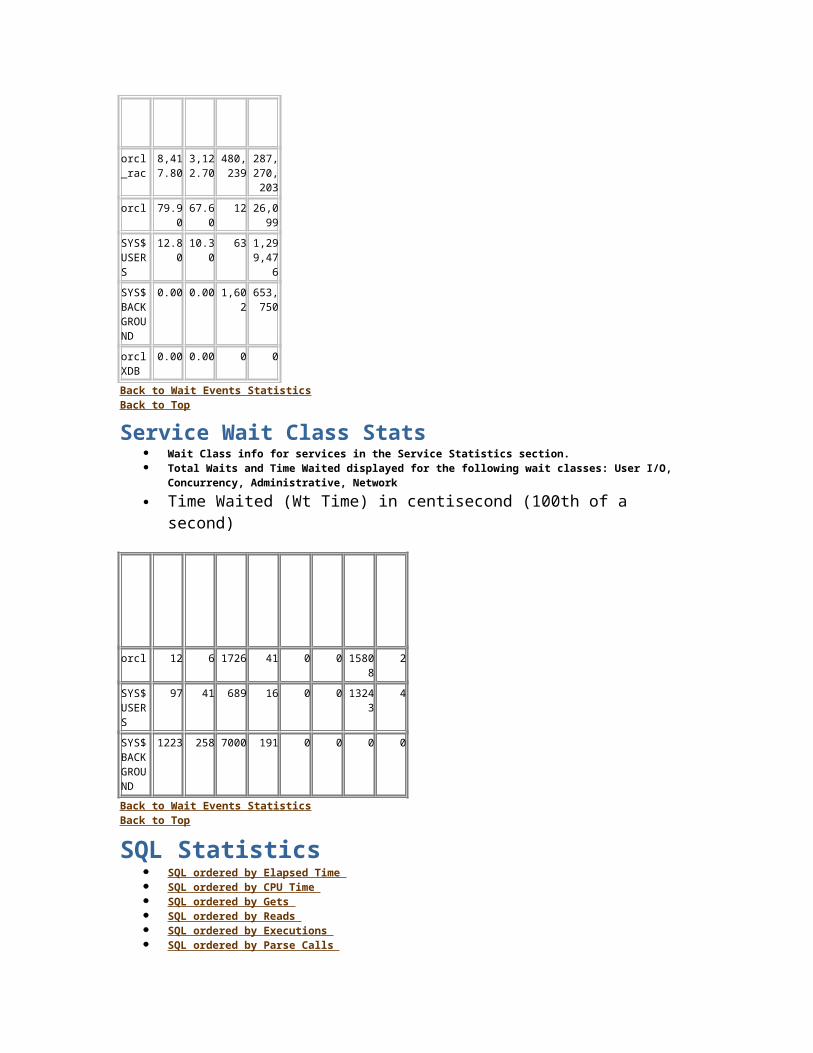
Service Statistics ordered by DB Time
Service
Name
DB Time (s)
DB CPU (s)
Physical Reads
Logical Reads
orcl_rac
8,417.80
3,122.70
480,239
287,270,20
3
orcl 79.90 67.60 12 26,099
SYS$ 12.80 10.30 63 1,299,
USERS
476
SYS$BACKGROUND
0.00 0.00 1,602 653,750
orclXDB
0.00 0.00 0 0
Back to Wait Events Statistics Back to Top
Service Wait Class Stats Wait Class info for services in the Service Statistics section. Total Waits and Time Waited displayed for the following wait classes: User I/O, Concurrency,
Administrative, Network Time Waited (Wt Time) in centisecond (100th of a second)
Service
Name
User I/O
Total
Wts
User I/O Wt Tim
e
Concurc
y Tota
l Wts
Concurcy Wt Tim
e
Admin
Total
Wts
Admin Wt Tim
e
Networ
k Tota
l Wts
Network Wt Tim
e
orcl 12 6 1726 41 0 0 15808 2
SYS$USERS
97 41 689 16 0 0 13243 4
SYS$BACKGROUND
1223 258 7000 191 0 0 0 0
Back to Wait Events Statistics Back to Top
SQL Statistics SQL ordered by Elapsed Time SQL ordered by CPU Time SQL ordered by Gets SQL ordered by Reads SQL ordered by Executions SQL ordered by Parse Calls SQL ordered by Sharable Memory SQL ordered by Version Count SQL ordered by Cluster Wait Time Complete List of SQL Text
Back to Top
SQL ordered by Elapsed Time Resources reported for PL/SQL code includes the resources used by all SQL statements called by the
code. % Total DB Time is the Elapsed Time of the SQL statement divided into the
Total Database Time multiplied by 100
Elapsed Time (s)
CPU Time (s)
Executions
Elap per Exec (s)
% Total DB Tim
e
SQL Id
SQL Module
SQL Text
1,918 92 9,921 0.19 22.53 6y4wha9gqjbkb
java@jbosscluster2-s (TNS V1-V3)
BEGIN :1 := p_outbox.createOut...
1,717 51 9,921 0.17 20.18 03hcmjsrzk2uj
java@jbosscluster2-s (TNS V1-V3)
INSERT INTO MESSAGECONTENTS (I...
807 123 76,013
0.01 9.48 4vngfzppsahts
java@jbosscluster2-s (TNS V1-V3)
begin :1 := JAVA_XA.xa_prepare...
683 439 11,881
0.06 8.02 apgdwp5n2wdug
java@jbosscluster2-s (TNS V1-V3)
SELECT T1.RN, T1.SUBMESSAGEID...
670 426 11,881
0.06 7.87 6ubadds0qp649
java@jbosscluster2-s (TNS V1-V3)
SELECT * FROM ( ...
485 43 9,393 0.05 5.70 cz0d2rv3hsxa2
java@jbosscluster2-s (TNS V1-V3)
INSERT INTO JMS_MESSAGES (MESS...
434 297 9,982 0.04 5.09 gvt7aq1y5uvp4
java@jbosscluster2-s (TNS V1-V3)
SELECT ALL_RESULTS.ID, ALL_RE...
396 81 11,130
0.04 4.66 1dtdmbwrskwxk
java@jbosscluster2-s (TNS V1-V3)
BEGIN p_outbox.sendOutboxMessa...
374 23 15,367
0.02 4.39 fqsda57xp
java@jbo
DELETE

qq15 sscluster2-s (TNS V1-V3)
FROM JMS_MESSAGES WHERE...
321 138 15,983
0.02 3.77 0bgsvc3fy531p
java@jbosscluster2-s (TNS V1-V3)
SELECT COUNT(*) FROM MAILBOXIT...
265 28 15,368
0.02 3.11 6yu9g4s41wmpp
java@jbosscluster2-s (TNS V1-V3)
DELETE FROM JMS_TRANSACTIONS W...
260 61 9,921 0.03 3.05 dgc3kfn6agh0z
java@jbosscluster2-s (TNS V1-V3)
BEGIN p_mailboxitem.manageMail...
247 53 4,102 0.06 2.90 6h0sav4txmn3a
java@jbosscluster2-s (TNS V1-V3)
SELECT ID, NAME, OWNERID, O...
221 170 11,881
0.02 2.60 gmc1a22nkcump
java@jbosscluster2-s (TNS V1-V3)
SELECT ID, NAME, OWNERID, O...
200 71 11,130
0.02 2.34 492ahypg2kn82
java@jbosscluster2-s (TNS V1-V3)
BEGIN p_recipient.updateRecipi...
192 190 217,243
0.00 2.26 b6qv8f7zwqz0d
java@jbosscluster2-s (TNS V1-V3)
begin :1 := JAVA_XA.xa_commit_...
189 164 9,921 0.02 2.22 9ztc2usu3f
java@jbo
SELECT

mj5 sscluster2-s (TNS V1-V3)
P.ID ID, P.SYSTEMID SY...
169 169 229,877
0.00 1.99 779s4601t4v6f
java@jbosscluster2-s (TNS V1-V3)
begin :1 := JAVA_XA.xa_end_new...
144 22 9,921 0.01 1.69 7kqrapr7256ud
java@jbosscluster2-s (TNS V1-V3)
INSERT INTO MAILBOXITEM (MAILB...
127 30 22,658
0.01 1.49 9pwyz2pm98vxx
java@jbosscluster2-s (TNS V1-V3)
BEGIN p_retention.updateMessag...
123 27 22,658
0.01 1.45 0fvy4tf0x9tm0
java@jbosscluster2-s (TNS V1-V3)
UPDATE SUBMESSAGERETENTION SET...
123 122 229,876
0.00 1.44 bnk1g42zxuk5u
java@jbosscluster2-s (TNS V1-V3)
begin :1 := JAVA_XA.xa_start_n...
113 98 11,881
0.01 1.33 4fmn6aaz2ds06
java@jbosscluster2-s (TNS V1-V3)
SELECT COUNT(*) FROM MAILBOXIT...
93 16 9,921 0.01 1.09 d0mzzx77304yz
java@jbosscluster2-s (TNS V1-V3)
INSERT INTO SUBMESSAGE (ID, S...
Back to SQL Statistics Back to Top
SQL ordered by CPU Time

Resources reported for PL/SQL code includes the resources used by all SQL statements called by the code.
% Total DB Time is the Elapsed Time of the SQL statement divided into the Total Database Time multiplied by 100
CPU Time (s)
Elapsed Time (s)
Executions
CPU per Exec (s)
% Total DB Tim
e
SQL Id
SQL Module
SQL Text
439 683 11,881
0.04 8.02 apgdwp5n2wdug
java@jbosscluster2-s (TNS V1-V3)
SELECT T1.RN, T1.SUBMESSAGEID...
426 670 11,881
0.04 7.87 6ubadds0qp649
java@jbosscluster2-s (TNS V1-V3)
SELECT * FROM ( ...
297 434 9,982 0.03 5.09 gvt7aq1y5uvp4
java@jbosscluster2-s (TNS V1-V3)
SELECT ALL_RESULTS.ID, ALL_RE...
190 192 217,243
0.00 2.26 b6qv8f7zwqz0d
java@jbosscluster2-s (TNS V1-V3)
begin :1 := JAVA_XA.xa_commit_...
170 221 11,881
0.01 2.60 gmc1a22nkcump
java@jbosscluster2-s (TNS V1-V3)
SELECT ID, NAME, OWNERID, O...
169 169 229,877
0.00 1.99 779s4601t4v6f
java@jbosscluster2-s (TNS V1-V3)
begin :1 := JAVA_XA.xa_end_new...
164 189 9,921 0.02 2.22 9ztc2usu3fmj5
java@jbosscluster2-s (TNS V1-V3)
SELECT P.ID ID, P.SYSTEMID SY...

138 321 15,983
0.01 3.77 0bgsvc3fy531p
java@jbosscluster2-s (TNS V1-V3)
SELECT COUNT(*) FROM MAILBOXIT...
123 807 76,013
0.00 9.48 4vngfzppsahts
java@jbosscluster2-s (TNS V1-V3)
begin :1 := JAVA_XA.xa_prepare...
122 123 229,876
0.00 1.44 bnk1g42zxuk5u
java@jbosscluster2-s (TNS V1-V3)
begin :1 := JAVA_XA.xa_start_n...
98 113 11,881
0.01 1.33 4fmn6aaz2ds06
java@jbosscluster2-s (TNS V1-V3)
SELECT COUNT(*) FROM MAILBOXIT...
92 1,918 9,921 0.01 22.53 6y4wha9gqjbkb
java@jbosscluster2-s (TNS V1-V3)
BEGIN :1 := p_outbox.createOut...
81 396 11,130
0.01 4.66 1dtdmbwrskwxk
java@jbosscluster2-s (TNS V1-V3)
BEGIN p_outbox.sendOutboxMessa...
71 200 11,130
0.01 2.34 492ahypg2kn82
java@jbosscluster2-s (TNS V1-V3)
BEGIN p_recipient.updateRecipi...
61 260 9,921 0.01 3.05 dgc3kfn6agh0z
java@jbosscluster2-s (TNS V1-V3)
BEGIN p_mailboxitem.manageMail...
53 247 4,102 0.01 2.90 6h0sav4txmn3a
java@jbosscluster2-s
SELECT ID, NAM
(TNS V1-V3)
E, OWNERID, O...
51 1,717 9,921 0.01 20.18 03hcmjsrzk2uj
java@jbosscluster2-s (TNS V1-V3)
INSERT INTO MESSAGECONTENTS (I...
43 485 9,393 0.00 5.70 cz0d2rv3hsxa2
java@jbosscluster2-s (TNS V1-V3)
INSERT INTO JMS_MESSAGES (MESS...
30 127 22,658
0.00 1.49 9pwyz2pm98vxx
java@jbosscluster2-s (TNS V1-V3)
BEGIN p_retention.updateMessag...
28 265 15,368
0.00 3.11 6yu9g4s41wmpp
java@jbosscluster2-s (TNS V1-V3)
DELETE FROM JMS_TRANSACTIONS W...
27 123 22,658
0.00 1.45 0fvy4tf0x9tm0
java@jbosscluster2-s (TNS V1-V3)
UPDATE SUBMESSAGERETENTION SET...
23 374 15,367
0.00 4.39 fqsda57xpqq15
java@jbosscluster2-s (TNS V1-V3)
DELETE FROM JMS_MESSAGES WHERE...
22 144 9,921 0.00 1.69 7kqrapr7256ud
java@jbosscluster2-s (TNS V1-V3)
INSERT INTO MAILBOXITEM (MAILB...
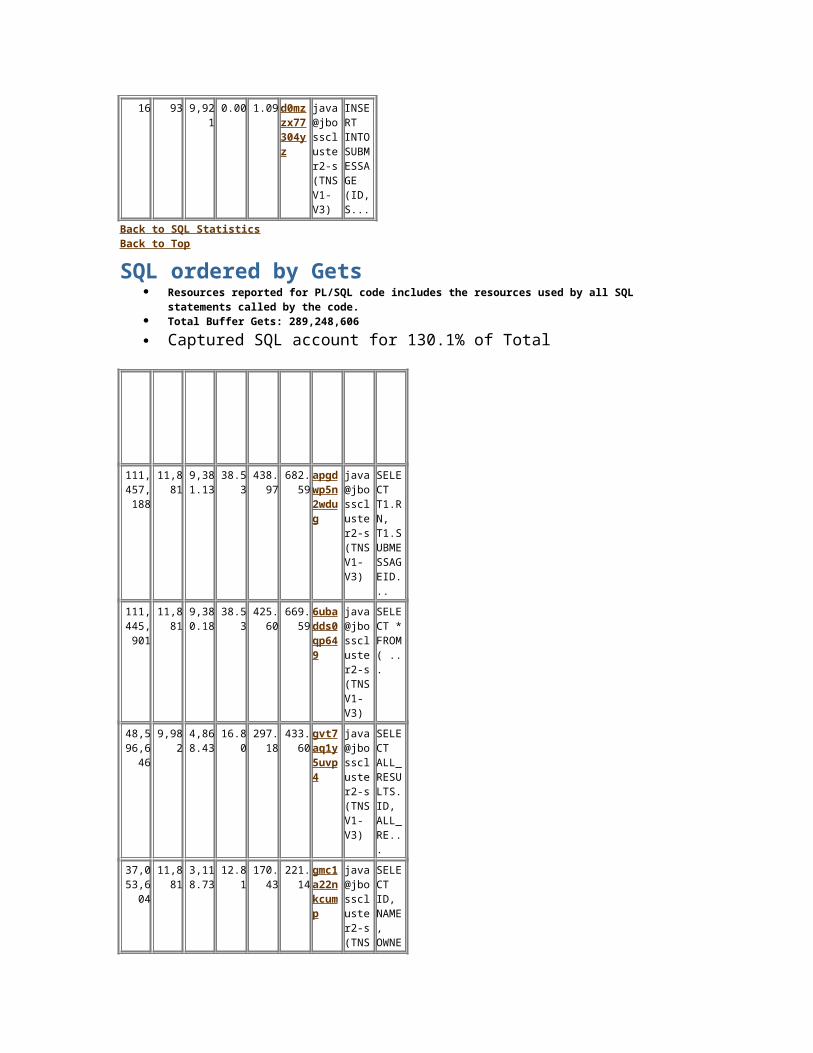
16 93 9,921 0.00 1.09 d0mz java INSE

zx77304yz
@jbosscluster2-s (TNS V1-V3)
RT INTO SUBMESSAGE (ID, S...
Back to SQL Statistics Back to Top
SQL ordered by Gets Resources reported for PL/SQL code includes the resources used by all SQL statements called by the
code. Total Buffer Gets: 289,248,606 Captured SQL account for 130.1% of Total
Buffer
Gets
Executions
Gets per Exe
c
%Total
CPU Time (s)
Elapsed Time (s)
SQL Id
SQL Module
SQL Text
111,457,18
8
11,881
9,381.13
38.53 438.97
682.59
apgdwp5n2wdug
java@jbosscluster2-s (TNS V1-V3)
SELECT T1.RN, T1.SUBMESSAGEID...
111,445,90
1
11,881
9,380.18
38.53 425.60
669.59
6ubadds0qp649
java@jbosscluster2-s (TNS V1-V3)
SELECT * FROM ( ...
48,596,646
9,982 4,868.43
16.80 297.18
433.60
gvt7aq1y5uvp4
java@jbosscluster2-s (TNS V1-V3)
SELECT ALL_RESULTS.ID, ALL_RE...
37,053,604
11,881
3,118.73
12.81 170.43
221.14
gmc1a22nkcump
java@jbosscluster2-s (TNS V1-V3)
SELECT ID, NAME, OWNERID, O...
24,821,725
15,983
1,553.01
8.58 138.35
320.72
0bgsvc3fy531p
java@jbosscluster2-s (TNS V1-V3)
SELECT COUNT(*) FROM MAILBOXIT...
18,473,665
11,881
1,554.89
6.39 97.63 113.43
4fmn6aaz2ds06
java@jbossclus
SELECT COU

ter2-s (TNS V1-V3)
NT(*) FROM MAILBOXIT...
16,696,227
3 5,565,409.0
0
5.77 56.16 56.16 9ddz2mw10nt8r
java@jbosscluster2-s (TNS V1-V3)
BEGIN :1 := p_group.insertExte...
6,676,811
4,102 1,627.70
2.31 52.66 247.03
6h0sav4txmn3a
java@jbosscluster2-s (TNS V1-V3)
SELECT ID, NAME, OWNERID, O...
5,265,270
9,393 560.55
1.82 43.46 484.69
cz0d2rv3hsxa2
java@jbosscluster2-s (TNS V1-V3)
INSERT INTO JMS_MESSAGES (MESS...
3,011,890
752,997
4.00 1.04 56.73 56.73 4z6jfdhm5uxr7
java@jbosscluster2-s (TNS V1-V3)
select longname from javasnm$ ...
Back to SQL Statistics Back to Top
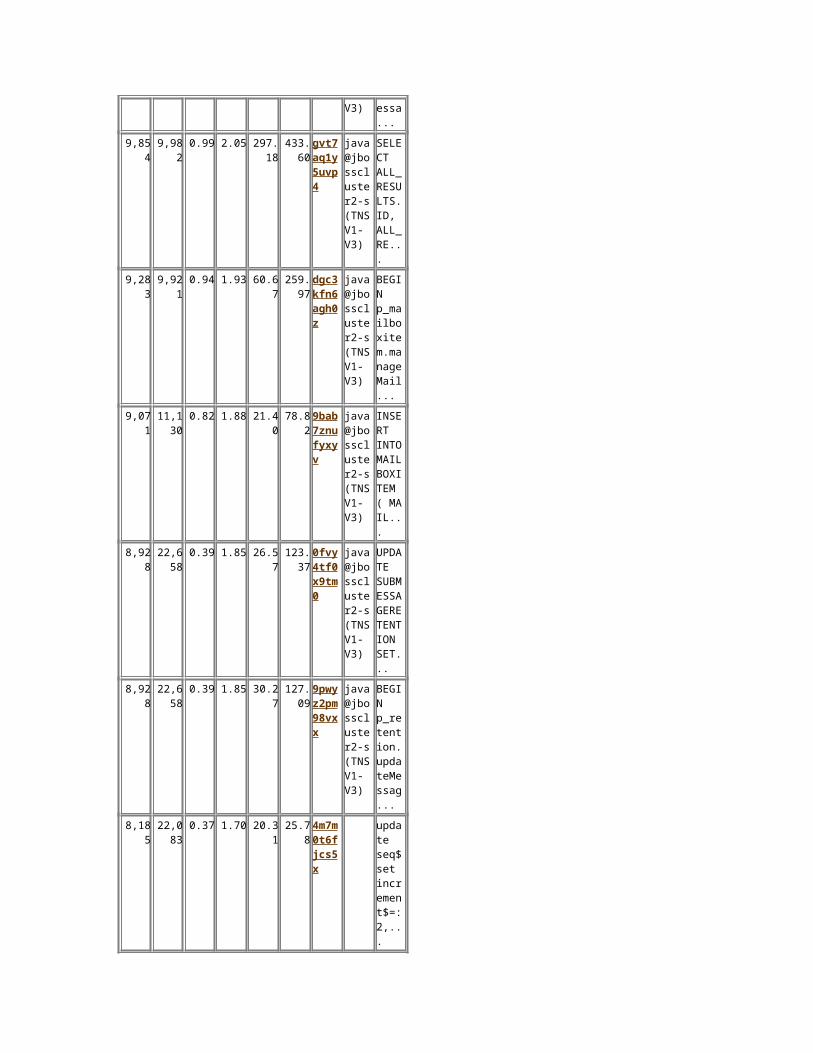
SQL ordered by Reads Total Disk Reads: 481,696 Captured SQL account for 76.2% of Total
Physical Reads
Executions
Reads per Exe
c
%Total
CPU Time (s)
Elapsed Time (s)
SQL Id
SQL Module
SQL Text
93,510
9,921 9.43 19.41 91.52 1917.69
6y4wha9gqjbkb
java@jbosscluster2-s (TNS V1-V3)
BEGIN :1 := p_outbox.createOut...
91,708
9,921 9.24 19.04 51.48 1717.37
03hcmjsrzk2uj
java@jbosscluster2-s (TNS V1-V3)
INSERT INTO MESSAGECONTENTS (I...

45,552
11,881
3.83 9.46 425.60
669.59
6ubadds0qp649
java@jbosscluster2-s (TNS V1-V3)
SELECT * FROM ( ...
45,552
11,881
3.83 9.46 438.97
682.59
apgdwp5n2wdug
java@jbosscluster2-s (TNS V1-V3)
SELECT T1.RN, T1.SUBMESSAGEID...
37,310
4,102 9.10 7.75 52.66 247.03
6h0sav4txmn3a
java@jbosscluster2-s (TNS V1-V3)
SELECT ID, NAME, OWNERID, O...
36,041
15,983
2.25 7.48 138.35
320.72
0bgsvc3fy531p
java@jbosscluster2-s (TNS V1-V3)
SELECT COUNT(*) FROM MAILBOXIT...
20,976
9,393 2.23 4.35 43.46 484.69
cz0d2rv3hsxa2
java@jbosscluster2-s (TNS V1-V3)
INSERT INTO JMS_MESSAGES (MESS...
16,067
11,130
1.44 3.34 70.75 199.52
492ahypg2kn82
java@jbosscluster2-s (TNS V1-V3)
BEGIN p_recipient.updateRecipi...
13,467
40,254
0.33 2.80 62.15 73.49 d6xwurybd1sc1
java@jbosscluster2-s (TNS V1-V3)
BEGIN :1 := p_audit.addAuditEn...
13,331
304 43.85 2.77 14.47 44.19 1cbrtxcgj2pty
java@jbosscluster2-s (TNS V1-V3)
BEGIN p_compliance_details.cre...
13,309
230,243
0.06 2.76 15.03 40.91 fmw713zq
java@jbo
INSERT
muzzz
sscluster2-s (TNS V1-V3)
INTO COMPLIANCE_DETAILS...
12,450
11,130
1.12 2.58 81.08 396.41
1dtdmbwrskwxk
java@jbosscluster2-s (TNS V1-V3)
BEGIN p_outbox.sendOutboxMessa...
9,854 9,982 0.99 2.05 297.18
433.60
gvt7aq1y5uvp4
java@jbosscluster2-s (TNS V1-V3)
SELECT ALL_RESULTS.ID, ALL_RE...
9,283 9,921 0.94 1.93 60.67 259.97
dgc3kfn6agh0z
java@jbosscluster2-s (TNS V1-V3)
BEGIN p_mailboxitem.manageMail...
9,071 11,130
0.82 1.88 21.40 78.82 9bab7znufyxyv
java@jbosscluster2-s (TNS V1-V3)
INSERT INTO MAILBOXITEM ( MAIL...
8,928 22,658
0.39 1.85 26.57 123.37
0fvy4tf0x9tm0
java@jbosscluster2-s (TNS V1-V3)
UPDATE SUBMESSAGERETENTION SET...
8,928 22,658
0.39 1.85 30.27 127.09
9pwyz2pm98vxx
java@jbosscluster2-s (TNS V1-V3)
BEGIN p_retention.updateMessag...
8,185 22,083
0.37 1.70 20.31 25.78 4m7m0t6fjcs5x
update seq$ set increment$=:2,...
7,946 21,051
0.38 1.65 42.87 58.53 fnpgu5z2728vu
java@jbosscluster2-s (TNS
SELECT TO_CHAR(SEQ_

V1-V3)
MAILBOXITEM...
5,572 9,921 0.56 1.16 21.76 143.64
7kqrapr7256ud
java@jbosscluster2-s (TNS V1-V3)
INSERT INTO MAILBOXITEM (MAILB...
5,388 10,771
0.50 1.12 12.16 15.75 dsuu77m1r3jbb
java@jbosscluster2-s (TNS V1-V3)
INSERT INTO AUDITENTRY ( ID, ...
5,214 11,130
0.47 1.08 34.29 54.70 253h456mgf3zr
java@jbosscluster2-s (TNS V1-V3)
UPDATE MAILBOXITEM SET MAILTYP...
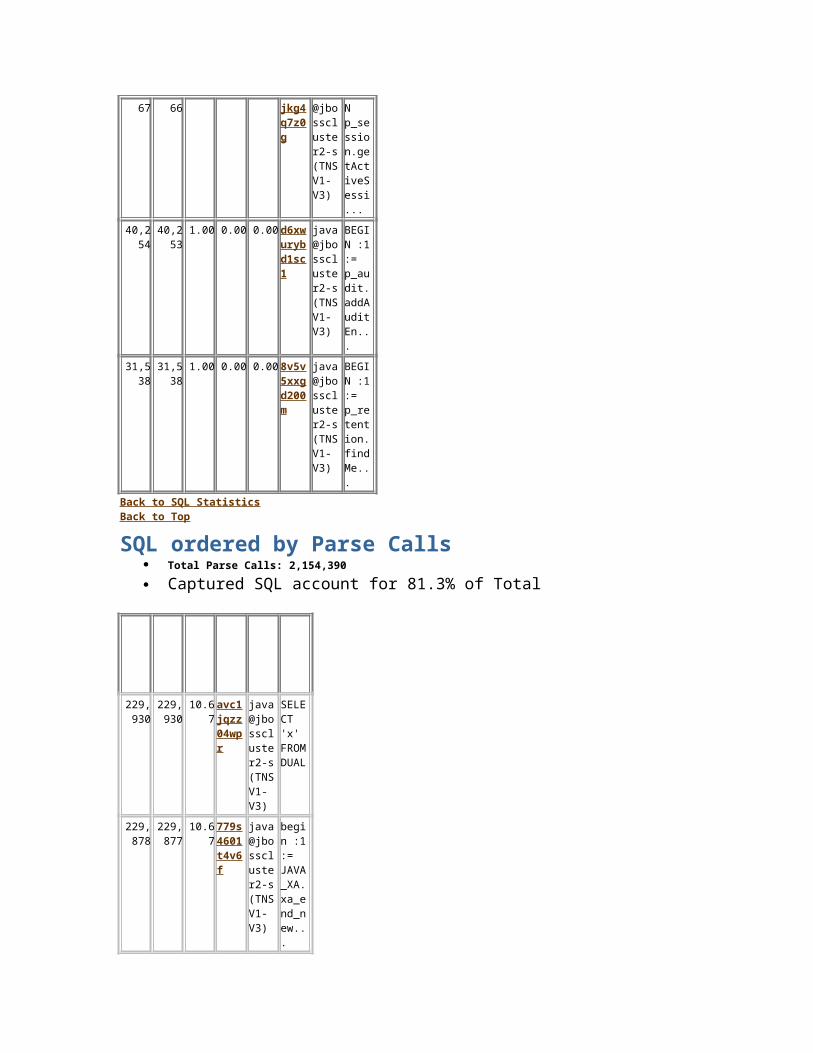
Back to SQL Statistics Back to Top
SQL ordered by Executions Total Executions: 3,831,071 Captured SQL account for 75.0% of Total
Executions
Rows
Processe
d
Rows
per Exe
c
CPU per Exec (s)
Elap per Exec (s)
SQL Id
SQL Module
SQL Text
752,997
752,977
1.00 0.00 0.00 4z6jfdhm5uxr7
java@jbosscluster2-s (TNS V1-V3)
select longname from javasnm$ ...
230,243
230,237
1.00 0.00 0.00 fmw713zqmuzzz
java@jbosscluster2-s (TNS V1-V3)
INSERT INTO COMPLIANCE_DETAILS...
229,930
229,925
1.00 0.00 0.00 avc1jqzz04wpr
java@jbosscluster2-s (TNS V1-V3)
SELECT 'x' FROM DUAL
229,8 229,8 1.00 0.00 0.00 779s4 java begin

77 75 601t4v6f
@jbosscluster2-s (TNS V1-V3)
:1 := JAVA_XA.xa_end_new...
229,876
229,875
1.00 0.00 0.00 bnk1g42zxuk5u
java@jbosscluster2-s (TNS V1-V3)
begin :1 := JAVA_XA.xa_start_n...
217,243
217,242
1.00 0.00 0.00 b6qv8f7zwqz0d
java@jbosscluster2-s (TNS V1-V3)
begin :1 := JAVA_XA.xa_commit_...
76,013
76,013
1.00 0.00 0.01 4vngfzppsahts
java@jbosscluster2-s (TNS V1-V3)
begin :1 := JAVA_XA.xa_prepare...
66,767
66,766
1.00 0.00 0.00 0hsyjkg4q7z0g
java@jbosscluster2-s (TNS V1-V3)
BEGIN p_session.getActiveSessi...
40,254
40,253
1.00 0.00 0.00 d6xwurybd1sc1
java@jbosscluster2-s (TNS V1-V3)
BEGIN :1 := p_audit.addAuditEn...
31,538
31,538
1.00 0.00 0.00 8v5v5xxgd200m
java@jbosscluster2-s (TNS V1-V3)
BEGIN :1 := p_retention.findMe...
Back to SQL Statistics Back to Top
SQL ordered by Parse Calls Total Parse Calls: 2,154,390 Captured SQL account for 81.3% of Total
Parse
Calls
Executions
% Tota
l Parses
SQL Id
SQL Module
SQL Text
229,930
229,930
10.67 avc1jqzz04wpr
java@jbossclus
SELECT 'x' FRO

ter2-s (TNS V1-V3)
M DUAL
229,878
229,877
10.67 779s4601t4v6f
java@jbosscluster2-s (TNS V1-V3)
begin :1 := JAVA_XA.xa_end_new...
229,877
229,876
10.67 bnk1g42zxuk5u
java@jbosscluster2-s (TNS V1-V3)
begin :1 := JAVA_XA.xa_start_n...
217,244
217,243
10.08 b6qv8f7zwqz0d
java@jbosscluster2-s (TNS V1-V3)
begin :1 := JAVA_XA.xa_commit_...
76,013
76,013
3.53 4vngfzppsahts
java@jbosscluster2-s (TNS V1-V3)
begin :1 := JAVA_XA.xa_prepare...
66,768
66,767
3.10 0hsyjkg4q7z0g
java@jbosscluster2-s (TNS V1-V3)
BEGIN p_session.getActiveSessi...
40,254
40,254
1.87 d6xwurybd1sc1
java@jbosscluster2-s (TNS V1-V3)
BEGIN :1 := p_audit.addAuditEn...
31,538
31,538
1.46 8v5v5xxgd200m
java@jbosscluster2-s (TNS V1-V3)
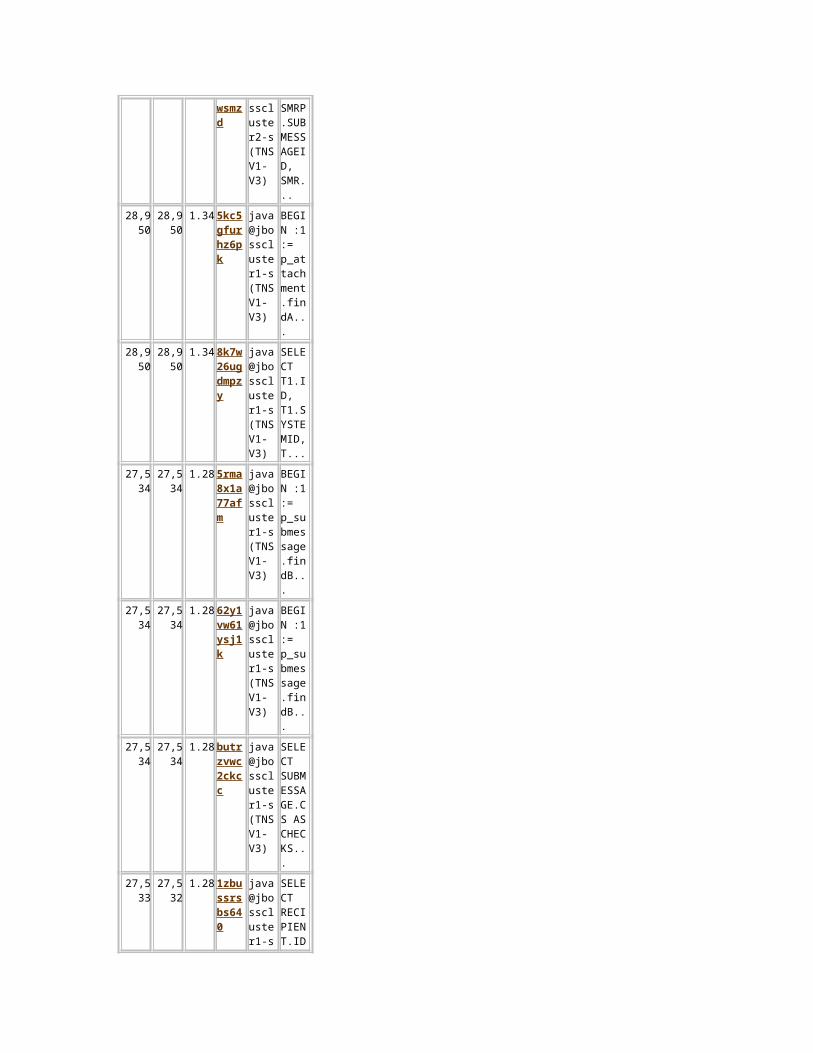
BEGIN :1 := p_retention.findMe...
31,538
31,538
1.46 9utsq4swwsmzd
java@jbosscluster2-s (TNS V1-V3)
SELECT SMRP.SUBMESSAGEID, SMR...
28,950
28,950
1.34 5kc5gfurhz6pk
java@jbossclus
BEGIN :1 :=

ter1-s (TNS V1-V3)
p_attachment.findA...
28,950
28,950
1.34 8k7w26ugdmpzy
java@jbosscluster1-s (TNS V1-V3)
SELECT T1.ID, T1.SYSTEMID, T...
27,534
27,534
1.28 5rma8x1a77afm
java@jbosscluster1-s (TNS V1-V3)
BEGIN :1 := p_submessage.findB...
27,534
27,534
1.28 62y1vw61ysj1k
java@jbosscluster1-s (TNS V1-V3)
BEGIN :1 := p_submessage.findB...
27,534
27,534
1.28 butrzvwc2ckcc
java@jbosscluster1-s (TNS V1-V3)
SELECT SUBMESSAGE.CS AS CHECKS...
27,533
27,532
1.28 1zbussrsbs640
java@jbosscluster1-s (TNS V1-V3)
SELECT RECIPIENT.ID, RECIPIEN...
27,533
27,533
1.28 6cjxa2k19akg5
java@jbosscluster1-s (TNS V1-V3)
SELECT SUBMESSAGE.ID, SUBMESS...
27,533
27,533
1.28 d8ghvzjd9r6v2
java@jbosscluster1-s (TNS V1-V3)
BEGIN :1 := p_submessage.findH...
27,533
27,532
1.28 fb9bdkw7ku1ws
java@jbosscluster1-s (TNS V1-
SELECT SUBMESSAGEHIST

V3) ORY.SUBME...
27,533
27,533
1.28 gb7fysp9b0pxh
java@jbosscluster1-s (TNS V1-V3)
BEGIN :1 := p_submessage.findS...
22,658
22,658
1.05 9pwyz2pm98vxx
java@jbosscluster2-s (TNS V1-V3)
BEGIN p_retention.updateMessag...
22,083
22,083
1.03 4m7m0t6fjcs5x
update seq$ set increment$=:2,...
Back to SQL Statistics Back to Top
SQL ordered by Sharable MemoryNo data exists for this section of the report.
Back to SQL Statistics Back to Top
SQL ordered by Version CountNo data exists for this section of the report.
Back to SQL Statistics Back to Top
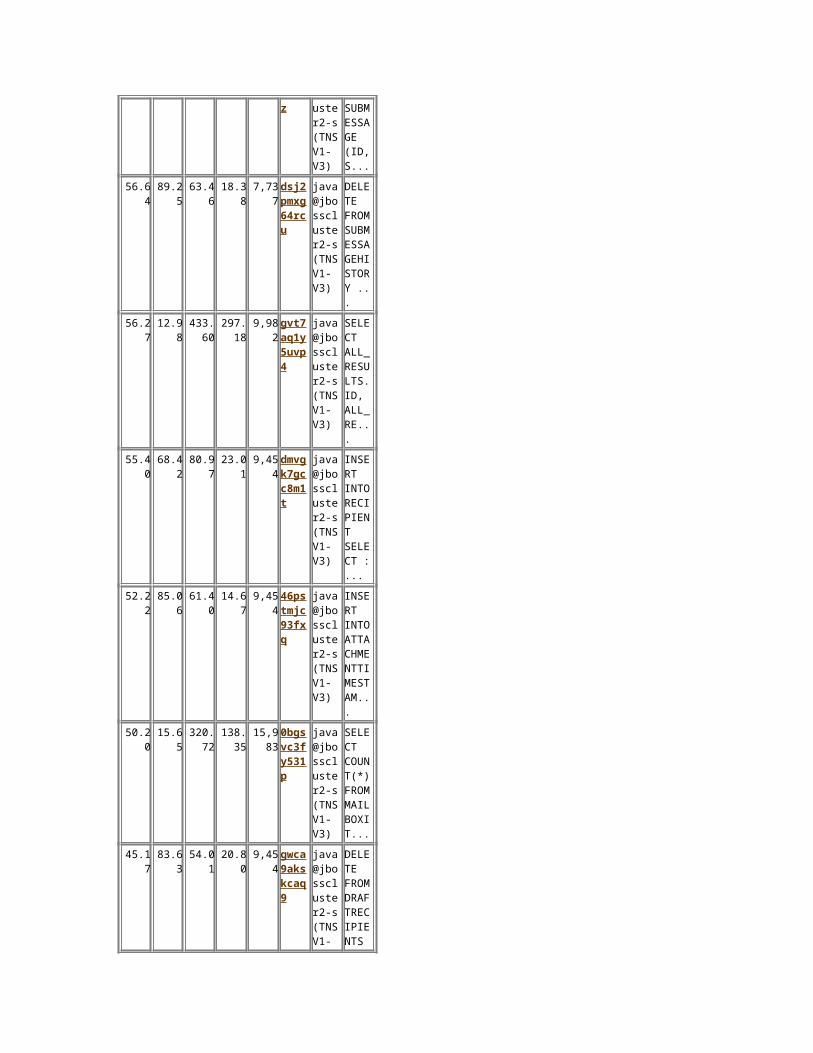
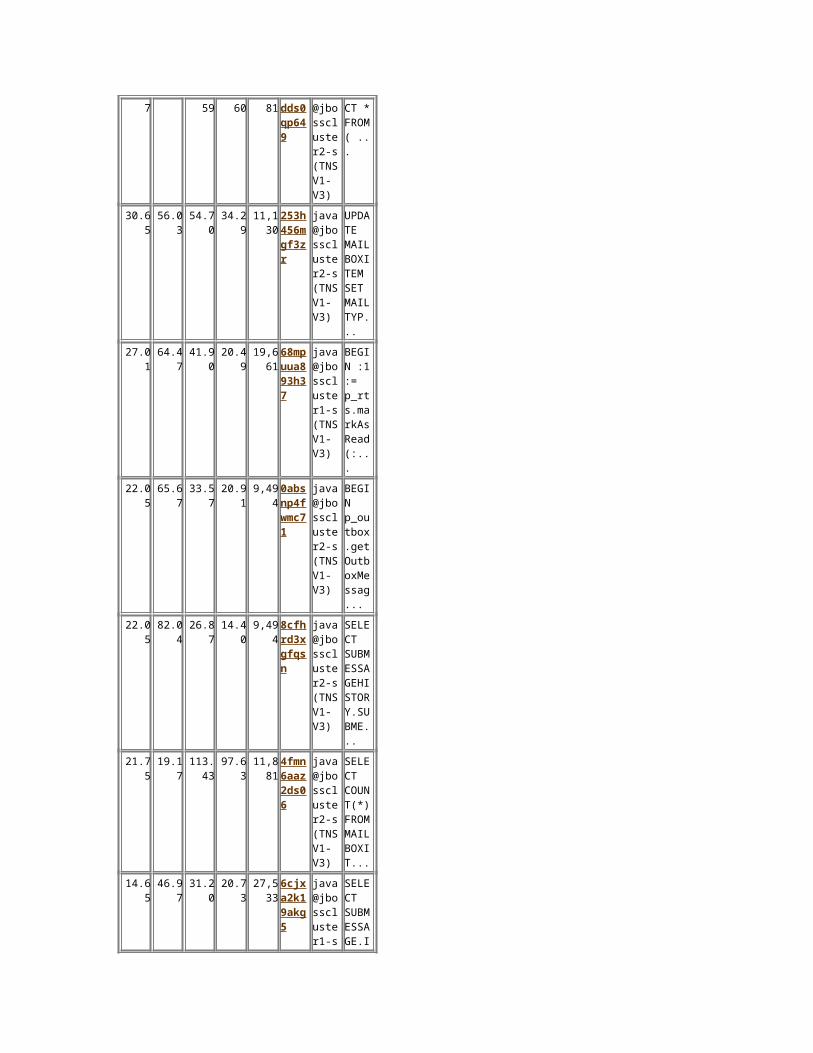
SQL ordered by Cluster Wait Time
Cluster
Wait Time (s)
CWT % of
Elapsd
Time
Elapsed Time(s)
CPU Time(s)
Executions
SQL Id
SQL Module
SQL Text
575.59
30.01 1,917.69
91.52 9,921 6y4wha9gqjbkb
java@jbosscluster2-s (TNS V1-V3)
BEGIN :1 := p_outbox.createOut...
428.75
24.97 1,717.37
51.48 9,921 03hcmjsrzk2uj
java@jbosscluster2-s (TNS V1-
INSERT INTO MESSAGECON

V3) TENTS (I...
294.75
74.35 396.41
81.08 11,130
1dtdmbwrskwxk
java@jbosscluster2-s (TNS V1-V3)
BEGIN p_outbox.sendOutboxMessa...
252.24
95.16 265.08
28.16 15,368
6yu9g4s41wmpp
java@jbosscluster2-s (TNS V1-V3)
DELETE FROM JMS_TRANSACTIONS W...
182.77
37.71 484.69
43.46 9,393 cz0d2rv3hsxa2
java@jbosscluster2-s (TNS V1-V3)
INSERT INTO JMS_MESSAGES (MESS...
180.13
69.29 259.97
60.67 9,921 dgc3kfn6agh0z
java@jbosscluster2-s (TNS V1-V3)
BEGIN p_mailboxitem.manageMail...
119.89
32.07 373.82
23.13 15,367
fqsda57xpqq15
java@jbosscluster2-s (TNS V1-V3)
DELETE FROM JMS_MESSAGES WHERE...
113.84
79.25 143.64
21.76 9,921 7kqrapr7256ud
java@jbosscluster2-s (TNS V1-V3)
INSERT INTO MAILBOXITEM (MAILB...
96.23 48.23 199.52
70.75 11,130
492ahypg2kn82
java@jbosscluster2-s (TNS V1-V3)
BEGIN p_recipient.updateRecipi...
70.96 76.68 92.54 15.83 9,921 d0mzzx77304yz
java@jbosscluster2-s (TNS
INSERT INTO SUBMES

V1-V3)
SAGE (ID, S...
56.64 89.25 63.46 18.38 7,737 dsj2pmxg64rcu
java@jbosscluster2-s (TNS V1-V3)
DELETE FROM SUBMESSAGEHISTORY ...
56.27 12.98 433.60
297.18
9,982 gvt7aq1y5uvp4
java@jbosscluster2-s (TNS V1-V3)
SELECT ALL_RESULTS.ID, ALL_RE...
55.40 68.42 80.97 23.01 9,454 dmvgk7gcc8m1t
java@jbosscluster2-s (TNS V1-V3)
INSERT INTO RECIPIENT SELECT :...
52.22 85.06 61.40 14.67 9,454 46pstmjc93fxq
java@jbosscluster2-s (TNS V1-V3)
INSERT INTO ATTACHMENTTIMESTAM...
50.20 15.65 320.72
138.35
15,983
0bgsvc3fy531p
java@jbosscluster2-s (TNS V1-V3)
SELECT COUNT(*) FROM MAILBOXIT...
45.17 83.63 54.01 20.80 9,454 gwca9akskcaq9
java@jbosscluster2-s (TNS V1-V3)
DELETE FROM DRAFTRECIPIENTS WH...
44.77 56.80 78.82 21.40 11,130
9bab7znufyxyv
java@jbosscluster2-s (TNS V1-V3)
INSERT INTO MAILBOXITEM ( MAIL...
44.72 18.10 247.0 52.66 4,102 6h0s java SELE

3 av4txmn3a
@jbosscluster2-s (TNS V1-V3)
CT ID, NAME, OWNERID, O...
40.11 32.51 123.37
26.57 22,658
0fvy4tf0x9tm0
java@jbosscluster2-s (TNS V1-V3)
UPDATE SUBMESSAGERETENTION SET...
40.11 31.56 127.09
30.27 22,658
9pwyz2pm98vxx
java@jbosscluster2-s (TNS V1-V3)
BEGIN p_retention.updateMessag...
38.99 17.63 221.14
170.43
11,881
gmc1a22nkcump
java@jbosscluster2-s (TNS V1-V3)
SELECT ID, NAME, OWNERID, O...
32.78 4.80 682.59
438.97
11,881
apgdwp5n2wdug
java@jbosscluster2-s (TNS V1-V3)
SELECT T1.RN, T1.SUBMESSAGEID...
32.77 4.89 669.59
425.60
11,881
6ubadds0qp649
java@jbosscluster2-s (TNS V1-V3)
SELECT * FROM ( ...
30.65 56.03 54.70 34.29 11,130
253h456mgf3zr
java@jbosscluster2-s (TNS V1-V3)
UPDATE MAILBOXITEM SET MAILTYP...
27.01 64.47 41.90 20.49 19,661
68mpuua893h37
java@jbosscluster1-s (TNS V1-V3)
BEGIN :1 := p_rts.markAsRead(:...
22.05 65.67 33.57 20.91 9,494 0absnp4fwmc7
java@jbossclus
BEGIN p_out
1 ter2-s (TNS V1-V3)
box.getOutboxMessag...
22.05 82.04 26.87 14.40 9,494 8cfhrd3xgfqsn
java@jbosscluster2-s (TNS V1-V3)
SELECT SUBMESSAGEHISTORY.SUBME...
21.75 19.17 113.43
97.63 11,881
4fmn6aaz2ds06
java@jbosscluster2-s (TNS V1-V3)
SELECT COUNT(*) FROM MAILBOXIT...
14.65 46.97 31.20 20.73 27,533
6cjxa2k19akg5
java@jbosscluster1-s (TNS V1-V3)
SELECT SUBMESSAGE.ID, SUBMESS...
12.55 60.73 20.67 16.62 27,534
butrzvwc2ckcc
java@jbosscluster1-s (TNS V1-V3)
SELECT SUBMESSAGE.CS AS CHECKS...
12.38 69.71 17.75 13.32 27,532
fb9bdkw7ku1ws
java@jbosscluster1-s (TNS V1-V3)
SELECT SUBMESSAGEHISTORY.SUBME...
12.25 27.73 44.19 14.47 304 1cbrtxcgj2pty
java@jbosscluster2-s (TNS V1-V3)
BEGIN p_compliance_details.cre...
12.25 29.95 40.91 15.03 230,243
fmw713zqmuzzz
java@jbosscluster2-s (TNS V1-V3)
INSERT INTO COMPLIANCE_DETAILS...

9.71 32.77 29.64 22.11 66,767
0hsyjkg4q7z0g
java@jbosscluster2-s (TNS V1-V3)
BEGIN p_session.getActiveSessi...
9.40 64.77 14.51 6.06 28,950
8k7w26ugdmpzy
java@jbosscluster1-s (TNS V1-V3)
SELECT T1.ID, T1.SYSTEMID, T...
7.31 12.49 58.53 42.87 21,051
fnpgu5z2728vu
java@jbosscluster2-s (TNS V1-V3)
SELECT TO_CHAR(SEQ_MAILBOXITEM...
6.47 42.02 15.40 15.13 31,538
9utsq4swwsmzd
java@jbosscluster2-s (TNS V1-V3)
SELECT SMRP.SUBMESSAGEID, SMR...
5.77 3.05 189.24
164.31
9,921 9ztc2usu3fmj5
java@jbosscluster2-s (TNS V1-V3)
SELECT P.ID ID, P.SYSTEMID SY...
3.78 14.65 25.78 20.31 22,083
4m7m0t6fjcs5x
update seq$ set increment$=:2,...
3.17 48.88 6.48 6.31 7,103 ch6ygprzxubjr
java@jbosscluster1-s (TNS V1-V3)
UPDATE MAILBOXITEM SET LASTMOD...
2.88 30.75 9.36 7.66 27,532
1zbussrsbs640
java@jbosscluster1-s (TNS V1-V3)
SELECT RECIPIENT.ID, RECIPIEN...
0.65 66.53 0.98 0.98 1,620 axmd select

f8vq7k1rh
increment$, minvalue, m...
0.61 0.83 73.49 62.15 40,254
d6xwurybd1sc1
java@jbosscluster2-s (TNS V1-V3)
BEGIN :1 := p_audit.addAuditEn...
0.22 0.18 122.71
122.14
229,876
bnk1g42zxuk5u
java@jbosscluster2-s (TNS V1-V3)
begin :1 := JAVA_XA.xa_start_n...
0.15 0.08 191.99
189.83
217,243
b6qv8f7zwqz0d
java@jbosscluster2-s (TNS V1-V3)
begin :1 := JAVA_XA.xa_commit_...
0.09 0.59 15.75 12.16 10,771
dsuu77m1r3jbb
java@jbosscluster2-s (TNS V1-V3)
INSERT INTO AUDITENTRY ( ID, ...
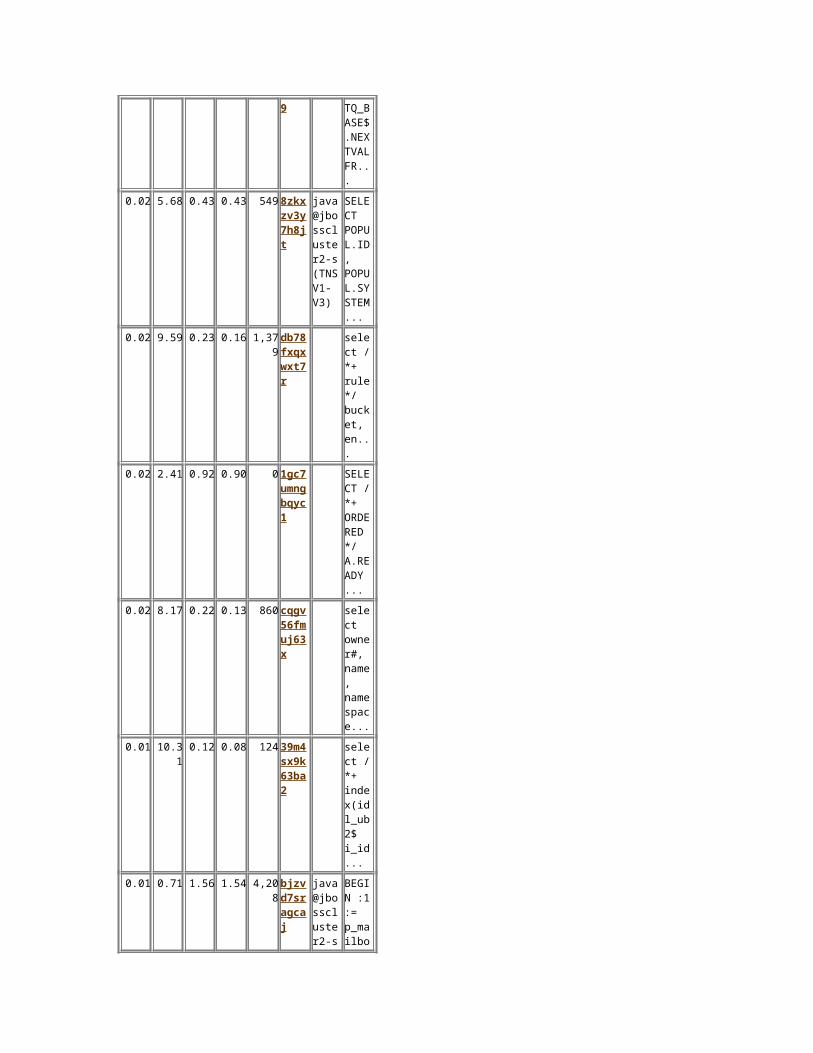
0.06 0.01 806.71
123.48
76,013
4vngfzppsahts
java@jbosscluster2-s (TNS V1-V3)
begin :1 := JAVA_XA.xa_prepare...
0.04 26.40 0.15 0.15 83 1dubbbfqnqvh9
SELECT ORA_TQ_BASE$.NEXTVAL FR...
0.02 5.68 0.43 0.43 549 8zkxzv3y7h8jt
java@jbosscluster2-s (TNS V1-V3)
SELECT POPUL.ID, POPUL.SYSTEM...
0.02 9.59 0.23 0.16 1,379 db78fxqxwxt7r
select /*+ rule */ bucket, en...
0.02 2.41 0.92 0.90 0 1gc7 SELE

umngbqyc1
CT /*+ ORDERED */ A.READY ...
0.02 8.17 0.22 0.13 860 cqgv56fmuj63x
select owner#, name, namespace...
0.01 10.31 0.12 0.08 124 39m4sx9k63ba2
select /*+ index(idl_ub2$ i_id...
0.01 0.71 1.56 1.54 4,208 bjzvd7sragcaj
java@jbosscluster2-s (TNS V1-V3)
BEGIN :1 := p_mailbox_contents...
0.01 10.16 0.07 0.07 124 ga9j9xk5cy9s0
select /*+ index(idl_sb4$ i_id...
0.01 0.10 6.67 6.66 28,950
5kc5gfurhz6pk
java@jbosscluster1-s (TNS V1-V3)
BEGIN :1 := p_attachment.findA...
0.01 6.69 0.08 0.08 657 8swypbbr0m372
select order#, columns, types ...
Back to SQL Statistics Back to Top
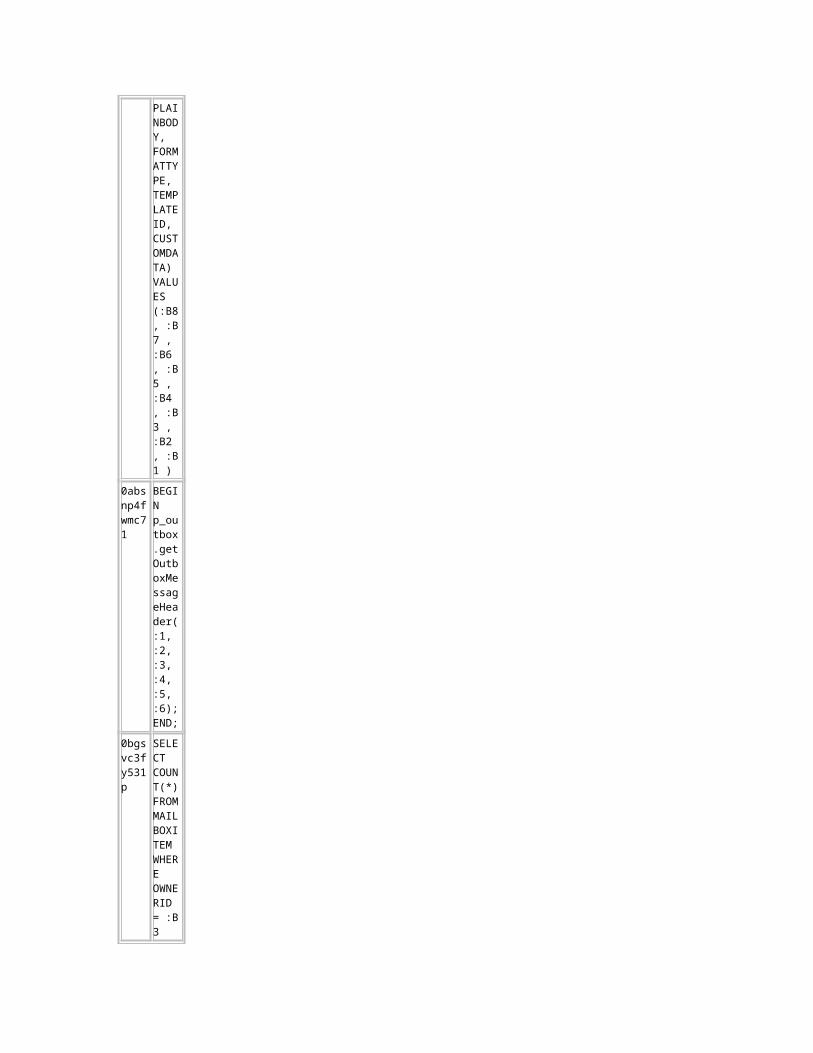
Complete List of SQL TextSQL
IdSQL Text
03hcmjsrzk2uj
INSERT INTO MESSAGECONTENTS (ID, SYSTEMID, CREA
TIONTIMESTAMP, BODY, PLAINBODY, FORMATTYPE, TEMPLATEID, CUSTOMDATA) VALUES (:B8 , :B7 , :B6 , :B5 , :B4 , :B3 , :B2 , :B1 )
0absnp4fwmc71
BEGIN p_outbox.getOutboxMessageHeader(:1, :2, :3, :4, :5, :6); END;
0bgsvc3fy531p
SELECT COUNT(*) FROM MAILBOXITEM WHERE OWNERID = :B3 AND OWNERSYSTEMID = :B2 AND MAILBOXID = :B1 AND MAIL

TYPE='RECVD' AND TRASHEDTIMESTAMP IS NULL AND READDATE IS NULL
0fvy4tf0x9tm0
UPDATE SUBMESSAGERETENTION SET LASTACCESSTIMESTAMP = :B5 , REPLYFORWARDTIMESTAMP = :B4 , EXPIRATIONTIMESTAMP = :B3 WHERE SUBMESSAGEID = :B2 AND SUBMESSAGESYSTEMID = :B1
0hsyjkg4q7z0g
BEGIN p_session.getActiveSessionId(:1, :2, :3, :4

, :5); END;
1cbrtxcgj2pty
BEGIN p_compliance_details.createAddressBook_array(:1, :2, :3, :4); END;
1dtdmbwrskwxk
BEGIN p_outbox.sendOutboxMessage(:1, :2, :3, :4, :5, :6, :7); END;
1dubbbfqnqvh9
SELECT ORA_TQ_BASE$.NEXTVAL FROM DUAL
1gc7umngbqyc1
SELECT /*+ ORDERED */ A.READY FROM USER_QUEUES B, GV$AQ A WHERE B.NAME = 'MGMT_NOTIFY_Q' AND A.QID = B.QID
1zbussrsbs640
SELECT RECIPIENT.ID, RECIPIENT.SYSTEMID, RECIPIENT.SEQUENCENR, RECIPIENT.TYPE, RECIPIENT.LISTTYPE, POPULATION.DISPLAYNAME1, POPULATION.SMTPADDRESS FROM RECIPIENT , POPULATION WHERE RECIPIENT.SUBMESSAGEID = :B2 AND RECIPIENT.SUBMESSAGESYSTEMID = :B1 AND RECIPIENT.ID = POP

ULATION.ID AND RECIPIENT.SYSTEMID = POPULATION.SYSTEMID
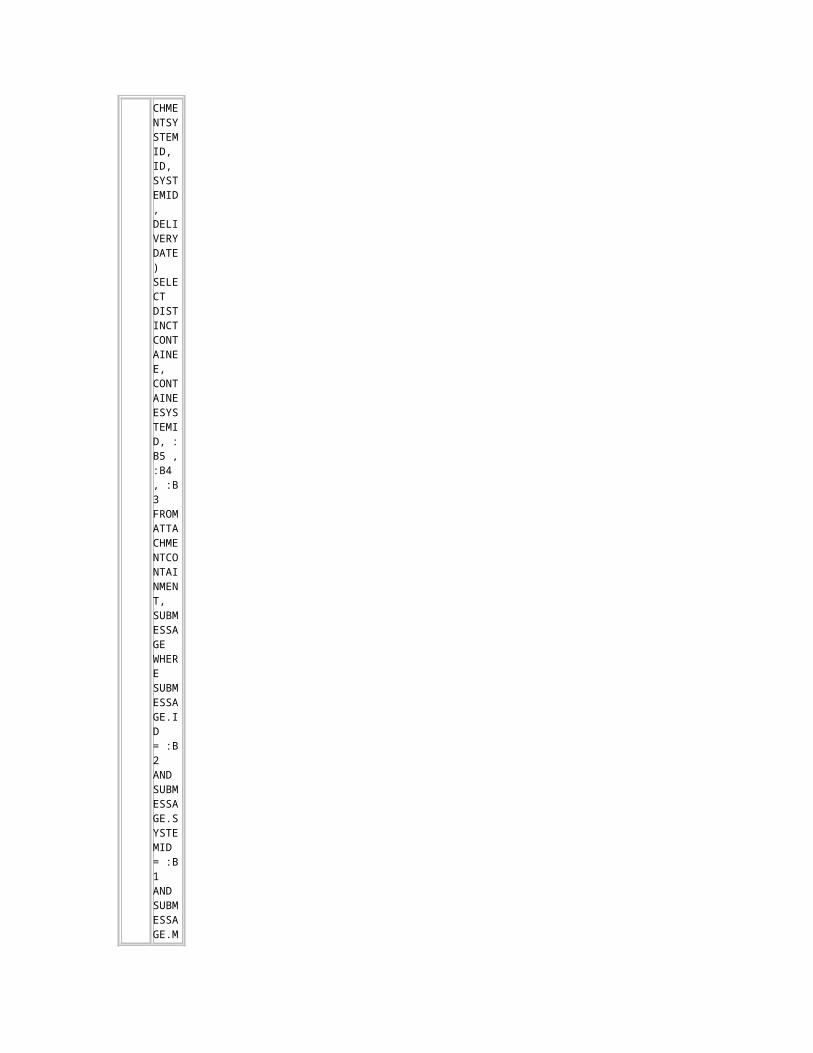
253h456mgf3zr
UPDATE MAILBOXITEM SET MAILTYPE = 'SENT', MAILBOXID = :B5 , LASTMODIFIEDTIMESTAMP = :B4 , READDATE = :B4 , LASTREADDATE = :B4 WHERE MAILBOXID = :B3 AND SUBMESSAGEID=:B2 AND SUBMESSAGESYSTEMID=:B1
39m4sx9k63ba2
select /*+ index(
idl_ub2$ i_idl_ub21) +*/ piece#, length, piece from idl_ub2$ where obj#=:1 and part=:2 and version=:3 order by piece#
46pstmjc93fxq
INSERT INTO ATTACHMENTTIMESTAMPS (ATTACHMENTID, ATTACHMENTSYSTEMID, ID, SYSTEMID, DELIVERYDATE) SELECT DISTINCT CONTAINEE, CONTAINEESYSTEMID, :B5 , :B4 , :B3 FROM ATTACHMENTC

ONTAINMENT, SUBMESSAGE WHERE SUBMESSAGE.ID = :B2 AND SUBMESSAGE.SYSTEMID = :B1 AND SUBMESSAGE.MESSAGEID = ATTACHMENTCONTAINMENT.CONTAINER AND SUBMESSAGE.MESSAGESYSTEMID = ATTACHMENTCONTAINMENT.CONTAINERSYSTEMID AND NOT EXISTS (SELECT 1 FROM ATTACHMENTTIMESTAMP

S WHERE ATTACHMENTTIMESTAMPS.ATTACHMENTID = ATTACHMENTCONTAINMENT.CONTAINEE AND ATTACHMENTTIMESTAMPS.ATTACHMENTSYSTEMID = ATTACHMENTCONTAINMENT.CONTAINEESYSTEMID AND ATTACHMENTTIMESTAMPS.ID = :B5 AND ATTACHMENTTIMESTAMPS.SYSTEMID = :B4 )
492ahypg2kn82
BEGIN p_recipient.updateRecipientsInbox

es(:1, :2, :3, :4, :5, :6, :7, :8, :9, :10, :11); END;
4fmn6aaz2ds06
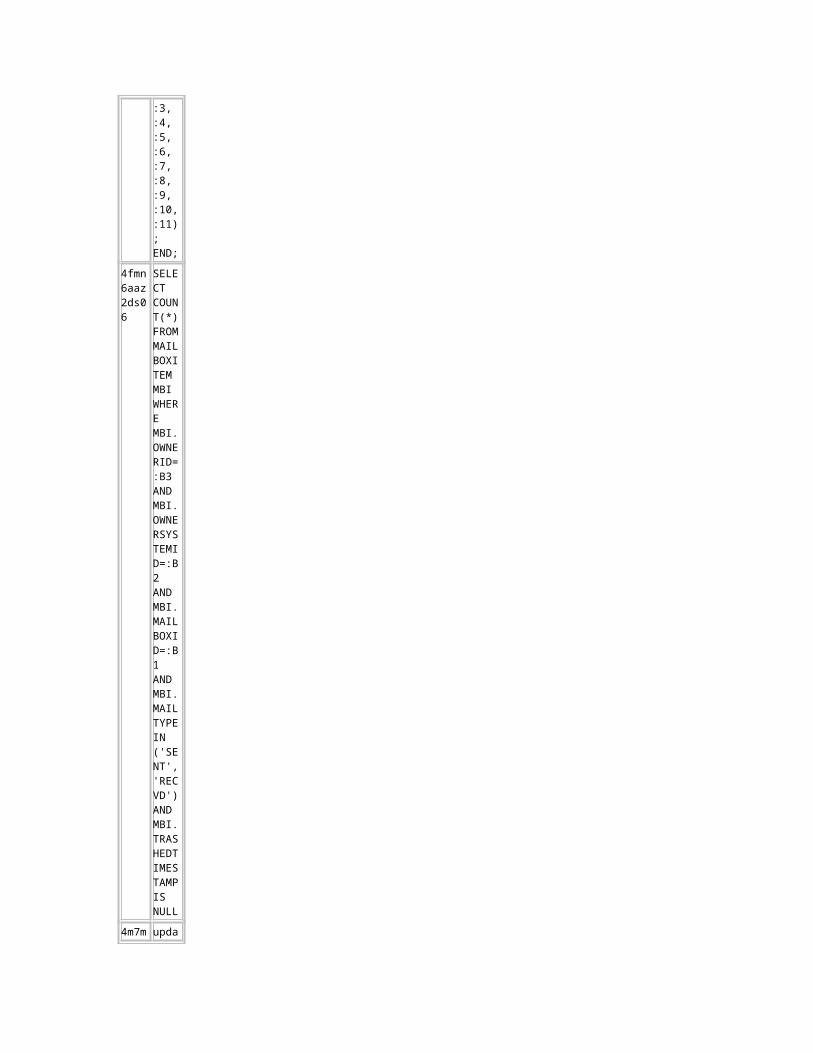
SELECT COUNT(*) FROM MAILBOXITEM MBI WHERE MBI.OWNERID=:B3 AND MBI.OWNERSYSTEMID=:B2 AND MBI.MAILBOXID=:B1 AND MBI.MAILTYPE IN ('SENT', 'RECVD') AND MBI.TRASHEDTIMESTAMP IS NULL
4m7m0t6fjcs5x
update seq$ set increment$=:2, minvalue=:3, maxvalue=:4, cycle#=:5,
order$=:6, cache=:7, highwater=:8, audit$=:9, flags=:10 where obj#=:1
4vngfzppsahts
begin :1 := JAVA_XA.xa_prepare_new (:2, :3, :4); end;
4z6jfdhm5uxr7
select longname from javasnm$ where short = :1
5kc5gfurhz6pk
BEGIN :1 := p_attachment.findAttachmentsBySubMessage(:2, :3) ; END;
5rma8x1a77afm
BEGIN :1 := p_submessage.findByPrimaryKeyAndOwner(:2, :3, :4, :5) ; END;
62y1vw61ysj1k
BEGIN :1 := p_submess

age.findByPrimaryKeyMailboxItem(:2, :3, :4) ; END;
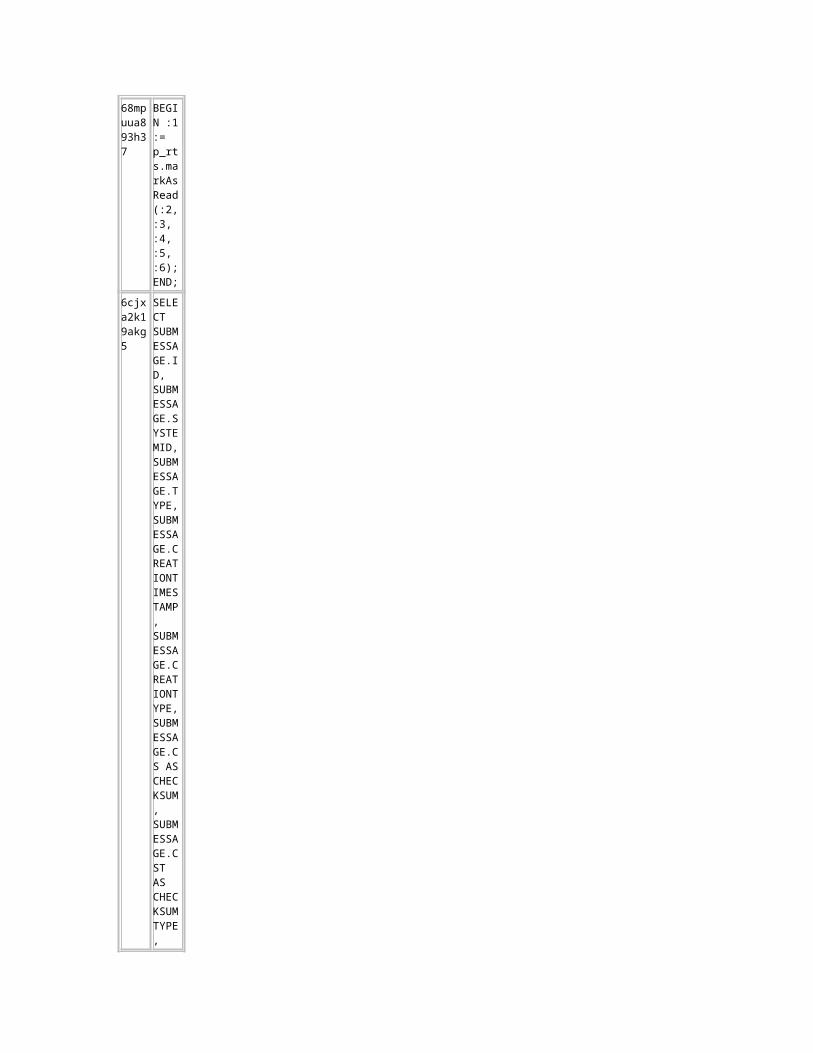
68mpuua893h37
BEGIN :1 := p_rts.markAsRead(:2, :3, :4, :5, :6); END;
6cjxa2k19akg5
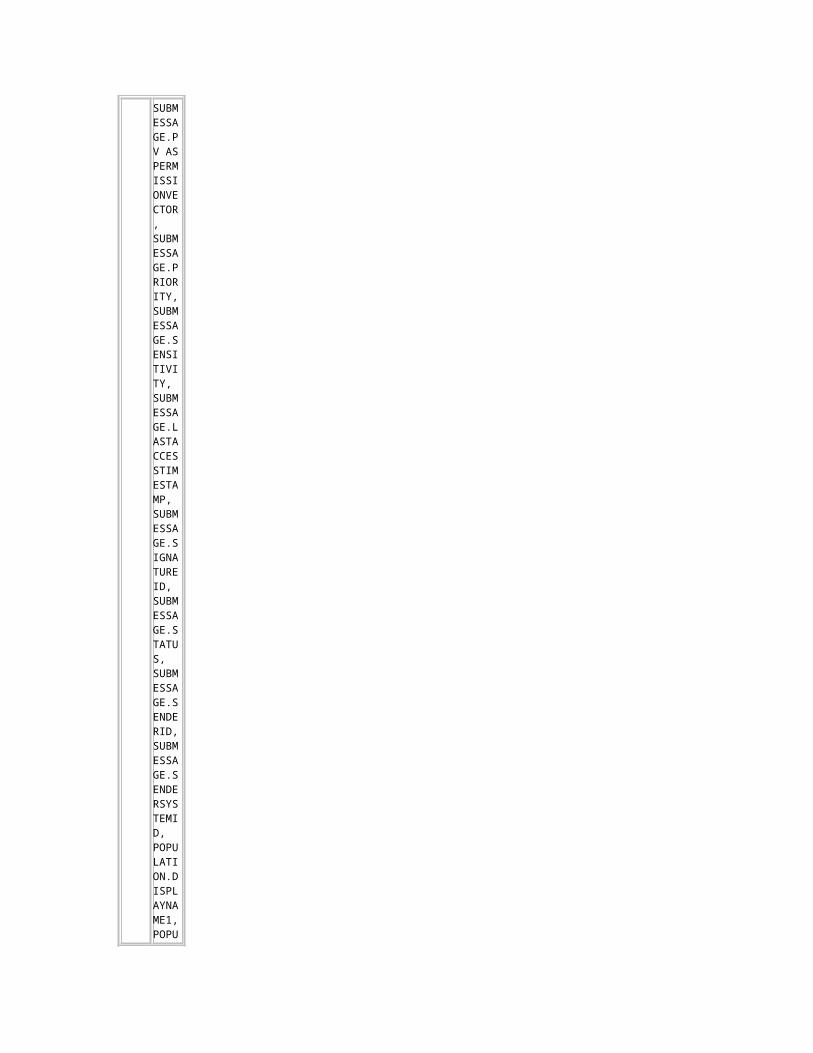
SELECT SUBMESSAGE.ID, SUBMESSAGE.SYSTEMID, SUBMESSAGE.TYPE, SUBMESSAGE.CREATIONTIMESTAMP, SUBMESSAGE.CREATIONTYPE, SUBMESSAGE.CS AS CHECKSUM, SUBMESSAGE.CST AS CHECKSU
MTYPE, SUBMESSAGE.PV AS PERMISSIONVECTOR, SUBMESSAGE.PRIORITY, SUBMESSAGE.SENSITIVITY, SUBMESSAGE.LASTACCESSTIMESTAMP, SUBMESSAGE.SIGNATUREID, SUBMESSAGE.STATUS, SUBMESSAGE.SENDERID, SUBMESSAGE.SENDERSYSTEMID, POPULATION.DISPLAYNAME1, POPULATION.SMTPADDRESS, POPULAT

ION.TYPE AS SENDERTYPE, SUBMESSAGE.SUBJECT, MESSAGECONTENTS.BODY, MESSAGECONTENTS.PLAINBODY, MESSAGECONTENTS.FORMATTYPE AS FORMATTYPE, MESSAGECONTENTS.TEMPLATEID, MESSAGECONTENTS.CUSTOMDATA FROM SUBMESSAGE , MESSAGECONTENTS, POPULATION, MAILBOXITEM WHERE

SUBMESSAGE.ID = :B4 AND SUBMESSAGE.SYSTEMID = :B3 AND SUBMESSAGE.MESSAGEID=MESSAGECONTENTS.ID AND SUBMESSAGE.MESSAGESYSTEMID=MESSAGECONTENTS.SYSTEMID AND POPULATION.ID = SUBMESSAGE.SENDERID AND POPULATION.SYSTEMID = SUBMESSAGE.SENDERSYSTEMID AND SUBMESSAGE.ID =

MAILBOXITEM.SUBMESSAGEID AND SUBMESSAGE.SYSTEMID = MAILBOXITEM.SUBMESSAGESYSTEMID AND MAILBOXITEM.OWNERID = :B2 AND MAILBOXITEM.OWNERSYSTEMID = :B1
6h0sav4txmn3a
SELECT ID, NAME, OWNERID, OWNERSYSTEMID, MBTYPE, ITEMSTYPE, MBPARENT, -1, P_MAILBOX.GETUNREADITEMSCOUNT(ID, :B2 , :B1 ), DESCRIPTI
ON FROM MAILBOX WHERE MAILBOX.OWNERID = :B2 AND MAILBOX.OWNERSYSTEMID = :B1
6ubadds0qp649
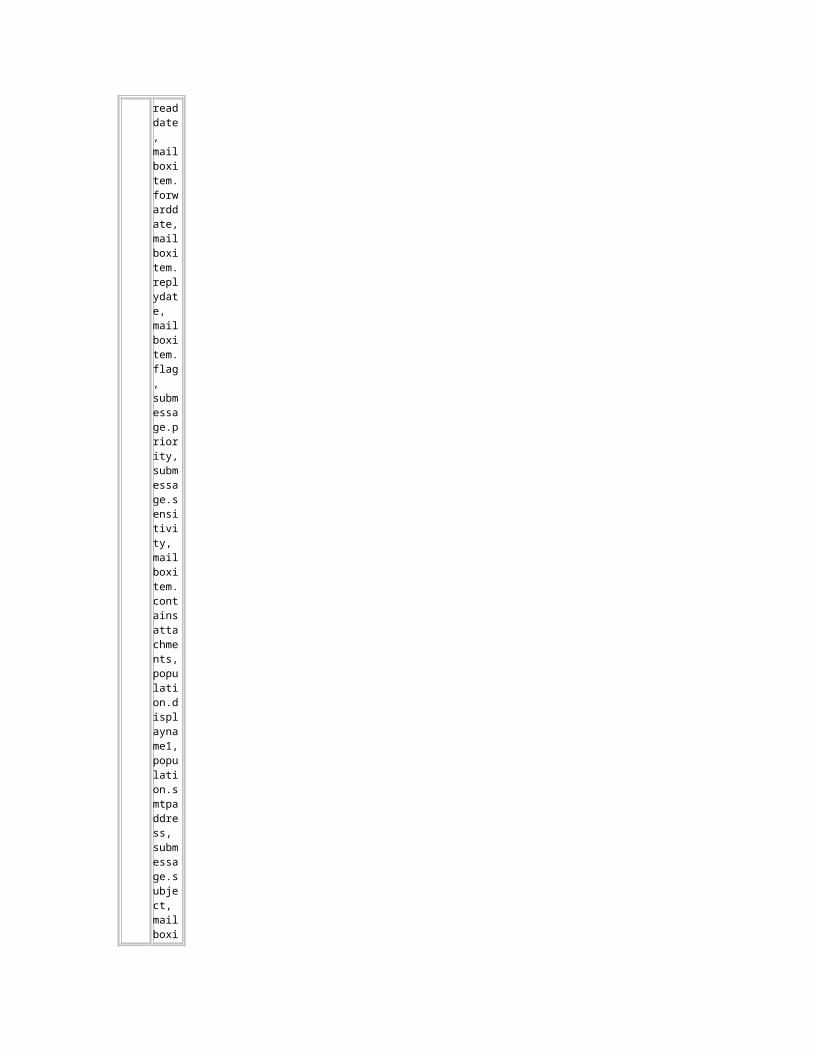
SELECT * FROM ( SELECT ROW_NUMBER() OVER (ORDER BY mailboxitem.deliverydate DESC, deliverydate DESC, mailboxitem.submessageid DESC) AS rn, mailboxitem.submessageid, mailboxitem.submessagesystemid, submessage.type

, mailboxitem.readdate, mailboxitem.forwarddate, mailboxitem.replydate, mailboxitem.flag, submessage.priority, submessage.sensitivity, mailboxitem.containsattachments, population.displayname1, population.smtpaddress, submessage.subject, mailboxitem.deliverydate, submessage.pv, submessage.hasCustomData as hasCustomData FROM mailboxite
m , submessage, population WHERE mailboxitem.ownerid = :v_population_id AND mailboxitem.ownersystemid = :v_population_system_id AND mailboxitem.mailboxid = :v_mailbox_id AND mailboxitem.mailtype='RECVD' AND mailboxitem.trashedtimestamp is null AND mailboxitem.deletedtimestamp is null AND submessage.id = mailboxitem.submessageid AND subm

essage.systemid = mailbox item.submessagesystemid AND submessage.senderid = population.id AND submessage.sendersystemid = population.systemid ) WHERE rn > :v_from AND rn <= :v_to
6y4wha9gqjbkb
BEGIN :1 := p_outbox.createOutboxMail(:2, :3, :4, :5, :6, :7, :8, :9, :10, :11, :12, :13, :14, :15, :16, :17, :18, :19, :20, :21, :22, :23, :24, :25, :26, :27, :28); END;
6yu9g4s41wmpp
DELETE FRO

M JMS_TRANSACTIONS WHERE TXID = :1
779s4601t4v6f
begin :1 := JAVA_XA.xa_end_new(:2, :3, :4, :5); end;
7kqrapr7256ud
INSERT INTO MAILBOXITEM (MAILBOXITEMID, MAILBOXID, SUBMESSAGEID, SUBMESSAGESYSTEMID, OWNERID, OWNERSYSTEMID, MAILTYPE, TRASHEDTIMESTAMP, HISTORYID, LASTMODIFIEDTIMESTAMP) VALUES (:B10 , :B9 , :B8 , :

B7 , :B6 , :B5 , :B4 , :B3 , :B2 , :B1 )
8cfhrd3xgfqsn
SELECT SUBMESSAGEHISTORY.SUBMESSAGEID, SUBMESSAGEHISTORY.SUBMESSAGESYSTEMID FROM SUBMESSAGEHISTORY, MAILBOXITEM WHERE MAILBOXITEM.MAILBOXID = :B5 AND MAILBOXITEM.SUBMESSAGEID = :B4 AND MAILBOXITEM.SUBMESSAGESYSTEMID = :B3 AND MAILBOXI

TEM.OWNERID = :B2 AND MAILBOXITEM.OWNERSYSTEMID = :B1 AND MAILBOXITEM.HISTORYID = SUBMESSAGEHISTORY.HISTORYID AND SUBMESSAGEHISTORY.CHECKED = 1
8k7w26ugdmpzy
SELECT T1.ID, T1.SYSTEMID, T1.ENCRYPTED, T1.FILESIZE, T1.INDEXSTATUS, T1.HASHDEPTH, T1.CS, T1.CST, T1.ORIGINALFILENAME, T1.FILEEX

TENSION FROM ATTACHMENT T1, ATTACHMENTCONTAINMENT T2, SUBMESSAGE T3 WHERE T1.ID = T2.CONTAINEE AND T1.SYSTEMID = T2.CONTAINEESYSTEMID AND T2.CONTAINER = T3.MESSAGEID AND T2.CONTAINERSYSTEMID = T3.MESSAGESYSTEMID AND T3.ID = :B2 AND T3.SYSTEMID = :B1
8swypbbr0m372
select order#, columns, types

from access$ where d_obj#=:1
8v5v5xxgd200m
BEGIN :1 := p_retention.findMessageRetention(:2, :3) ; END;
8zkxzv3y7h8jt
SELECT POPUL.ID, POPUL.SYSTEMID, POPUL.TYPE, POPUL.STATUS, POPUL.DISPLAYNAME1, POPUL.DISPLAYNAME2, POPUL.DOMAINID, POPUL.DOMAINSYSTEMID, '0' AS ADMINISTRABLE, POPUL.COMPLIANCESTATUS, POPUL.S
TARTDATE, POPUL.STARTTIME, POPUL.ENDDATE, POPUL.ENDTIME, PERS.LOGONNAME, PERS.FIRSTNAME, PERS.LASTNAME, PERS.PASSWORD, PERS.ROLEID, PERS.ROLESYSTEMID, PERS.ROLEBITS, ROLE.PERMISSIONBITS, ROLE.PERMISSIONSIZE, 0 AS DUMMYLOGGEDON, PERS.FAILEDLOGONS, PERS.TOKEN, PERS.TOK

ENEXPIREDATE, PERS.AUTOLOGONALLOWED, POPUL.SMTPADDRESS, PERS.EMAILADDRESS, PERS.SMSADDRESS, PERS.ADMINISTEREDDOMAINID, PERS.ADMINISTEREDDOMAINSYSTEMID, PERS.EUSID, EUS.TYPE, PERS.SYNCHRONIZE, CASE WHEN (PERS.ADMINISTEREDDOMAINID, PERS.ADMINISTEREDDOMAINSYSTEMID)=

(SELECT ID, SYSTEMID FROM V_POPULATION R WHERE R.DOMAINID IS NULL AND R.DOMAINSYSTEMID IS NULL) THEN 1 ELSE 0 END AS ISROOTADMINISTERED FROM V_POPULATION POPUL, V_PERSON PERS, ROLE ROLE, EUS EUS WHERE POPUL.ID = :B2 AND POPUL.SYSTEMID = :B1 AND (POPUL.TYPE = 'P' OR
POPUL.TYPE = 'A') AND PERS.ID = POPUL.ID AND PERS.SYSTEMID = POPUL.SYSTEMID AND PERS.ROLEID = ROLE.ID(+) AND PERS.ROLESYSTEMID = ROLE.SYSTEMID(+) AND PERS.EUSID = EUS.ID(+)
9bab7znufyxyv
INSERT INTO MAILBOXITEM ( MAILBOXITEMID, MAILBOXID, SUBMESSAGEID, SUBMESSAGESYSTEMID, OWNERID, OWNERSYSTEMID, MAIL

TYPE, LASTMODIFIEDTIMESTAMP, LISTTYPE, DELIVERYDATE, CONTAINSATTACHMENTS) VALUES ( :B10 , :B9 , :B8 , :B7 , :B1 , :B2 , :B6 , :B5 , :B3 , :B5 , :B4 )
9ddz2mw10nt8r
BEGIN :1 := p_group.insertExternalGroup(:2, :3, :4, :5, :6, :7, :8, :9, :10, :11, :12, :13, :14, :15, :16, :17, :18, :19, :20, :21); END;
9pwyz2pm98vxx
BEGIN p_retention.updateMessageRetention(:1, :2, :3, :4, :5); END;

9utsq4swwsmzd
SELECT SMRP.SUBMESSAGEID, SMRP.SUBMESSAGESYSTEMID, SMRP.RETENTIONPOLICYID, SMRP.RETENTIONPOLICYSYSTEMID, RP.CODE, RP.DESCRIPTION, SMRP.POLICYTYPE, SMRP.DAYS, SMRP.MONTHS, SMRP.YEARS, SMRP.SENTTIMESTAMP, SMRP.LASTACCESSTIMESTAMP, SMRP.REPLYFORWARDTIMESTAMP,
SMRP.EXPIRATIONTIMESTAMP, SMRP.HOLD RETENTIONHOLD FROM SUBMESSAGERETENTION SMRP, RETENTIONPOLICY RP WHERE SMRP.SUBMESSAGEID = :B2 AND SMRP.SUBMESSAGESYSTEMID = :B1 AND SMRP.RETENTIONPOLICYID = RP.ID AND SMRP.RETENTIONPOLICYSYSTEMID = RP.SYSTEMID
9ztc2usu3fmj5
SELECT P.ID
ID, P.SYSTEMID SYSTEMID, A.TYPED_NAME TYPEDNAME, P.TYPE POPULATIONTYPE, P.DISPLAYNAME1 DISPLAYNAME, P.SMTPADDRESS SMTPADDRESS FROM POPULATION P, COMPLIANCE_DETAILS C, TABLE(CAST(:B1 AS RECIPIENT_INFO_LIST)) A WHERE C.OWNERID = :B3 AND C.OWNERSYSTEMID = :B2 AND P.STATUS

<> 'R' AND C.TARGETID = P.ID AND C.TARGETSYSTEMID = P.SYSTEMID AND UPPER(P.DISPLAYNAME1) LIKE UPPER(NVL(A.DISPLAY_NAME, P.DISPLAYNAME1) || '%') AND UPPER(P.SMTPADDRESS) = NVL(UPPER(A.SMTPADDRESS), UPPER(P.SMTPADDRESS))
apgdwp5n2wdug
SELECT T1.RN, T1.SUBMESSAGEID AS SUBMESSAGEID, T1.SUBMESSAGESYSTEM

ID AS SUBMESSAGESYSTEMID, T1.TYPE, T1.REPLYDATE AS REPLYDATE, T1.FORWARDDATE AS FORWARDDATE, T1.READDATE AS READDATE, NVL(T1.FLAG, 0) AS FLAG, T1.PRIORITY AS PRIORITY, T1.SENSITIVITY AS SENSITIVITY, T1.CONTAINSATTACHMENTS AS CONTAINSATTACHMENTS, T1.DISPLAYNAME1 AS ADD

RESSDISPLAYNAME1, T1.SMTPADDRESS AS SMTPADDRESS, T1.SUBJECT AS SUBJECT, T1.DELIVERYDATE AS DELIVERYDATE, T1.PV AS PV, T1.HASCUSTOMDATA AS HASCUSTOMDATA FROM TABLE(P_MAILBOX_CONTENTS.GETRECEIVEDITEMSSET( :B1 , :B2 , :B3 , :B4 , :B5 , :B6 , :B7 )) T1 ORDER BY RN
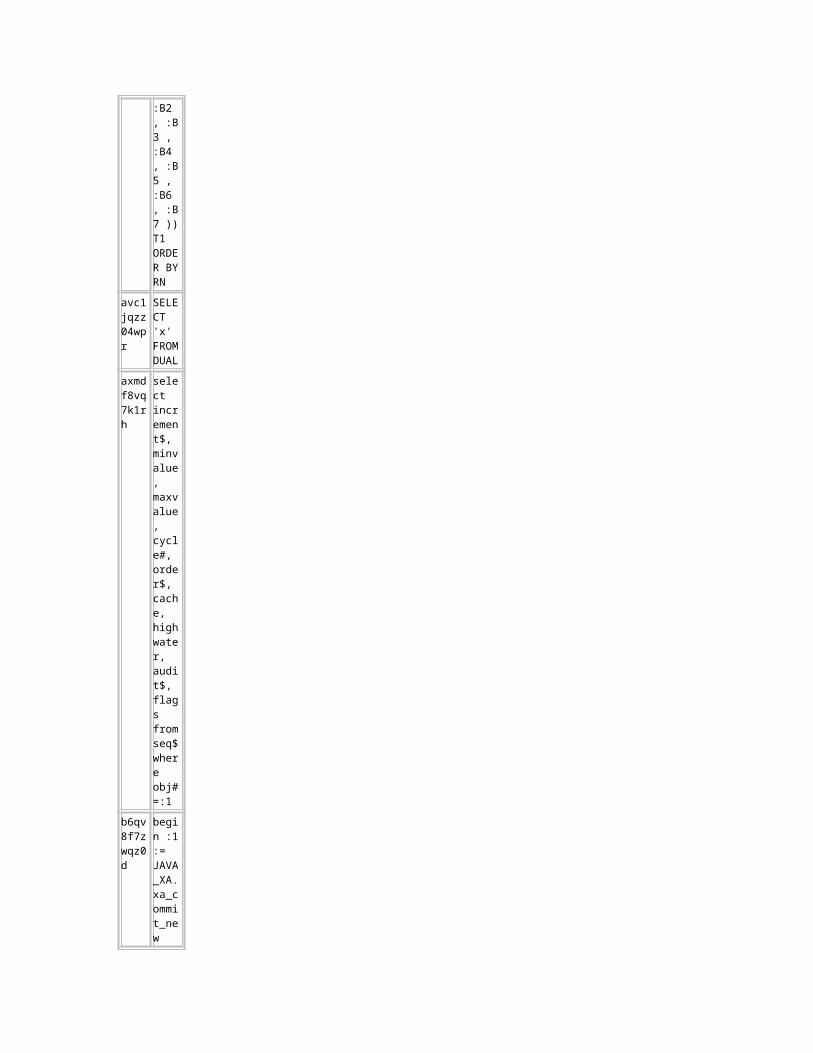
avc1j SELE

qzz04wpr
CT 'x' FROM DUAL
axmdf8vq7k1rh
select increment$, minvalue, maxvalue, cycle#, order$, cache, highwater, audit$, flags from seq$ where obj#=:1
b6qv8f7zwqz0d
begin :1 := JAVA_XA.xa_commit_new (:2, :3, :4, :5); end;
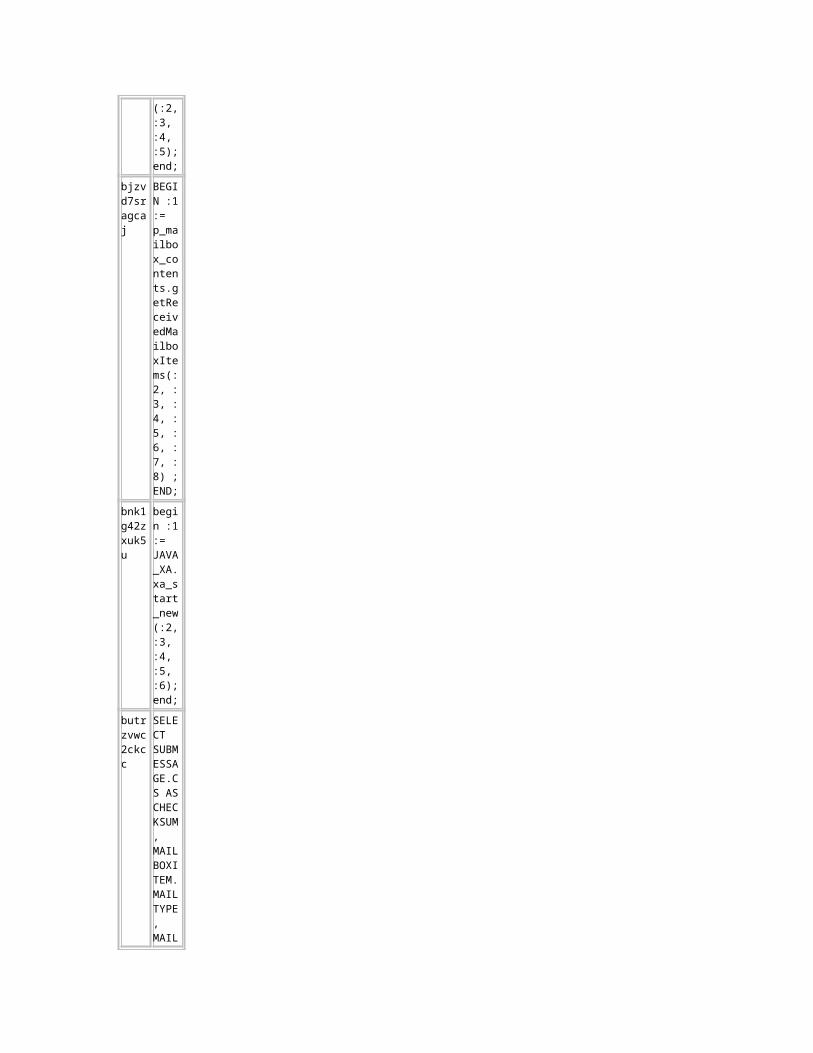
bjzvd7sragcaj
BEGIN :1 := p_mailbox_contents.getReceivedMailboxItems(:2, :3, :4, :5, :6, :7, :8) ; END;
bnk1g42zxuk5u
begin :1 := JAVA_XA.xa_start_new(:2, :3, :4, :5, :6); end;
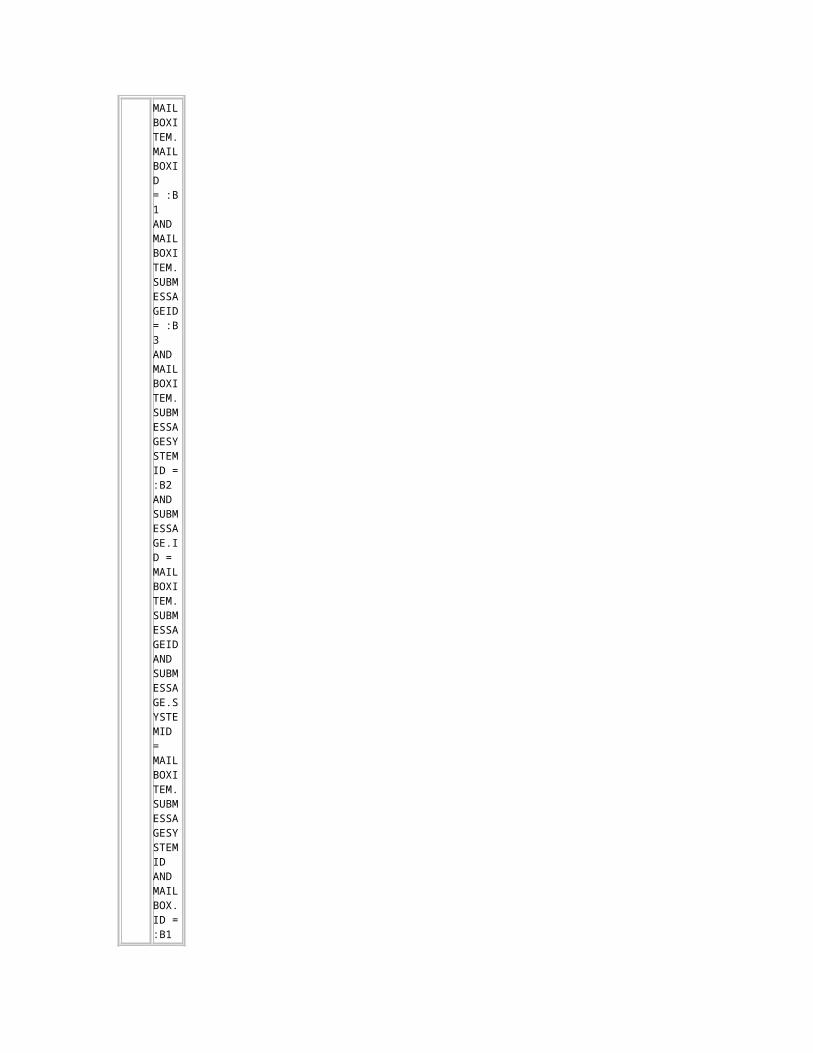
butrzvwc2ckcc
SELECT SUB

MESSAGE.CS AS CHECKSUM, MAILBOXITEM.MAILTYPE, MAILBOXITEM.TRASHEDTIMESTAMP, MAILBOXITEM.DELETEDTIMESTAMP, MAILBOXITEM.FLAG, MAILBOXITEM.CONTAINSATTACHMENTS AS CONTAINSATTACHMENTS, MAILBOXITEM.HISTORYID, MAILBOX.NAME AS MAILBOXNAME FROM MAILBOXITEM,
MAILBOX, SUBMESSAGE WHERE MAILBOXITEM.MAILBOXID = :B1 AND MAILBOXITEM.SUBMESSAGEID = :B3 AND MAILBOXITEM.SUBMESSAGESYSTEMID = :B2 AND SUBMESSAGE.ID = MAILBOXITEM.SUBMESSAGEID AND SUBMESSAGE.SYSTEMID = MAILBOXITEM.SUBMESSAGESYSTEMID AND MAILBOX.ID = :B1
ch6ygprzxubjr
UPDATE MAILBOXI

TEM SET LASTMODIFIEDTIMESTAMP = :B5 , READDATE = NVL(READDATE, :B5 ), LASTREADDATE = :B5 WHERE SUBMESSAGEID = :B4 AND SUBMESSAGESYSTEMID = :B3 AND OWNERID = :B2 AND OWNERSYSTEMID = :B1
cqgv56fmuj63x
select owner#, name, namespace, remoteowner, linkname, p_timestamp, p_obj#, nvl(property, 0), subname, d_attr

s from dependency$ d, obj$ o where d_obj#=:1 and p_obj#=obj#(+) order by order#
cz0d2rv3hsxa2
INSERT INTO JMS_MESSAGES (MESSAGEID, DESTINATION, MESSAGEBLOB, TXID, TXOP) VALUES(:1, :2, :3, :4, :5)
d0mzzx77304yz
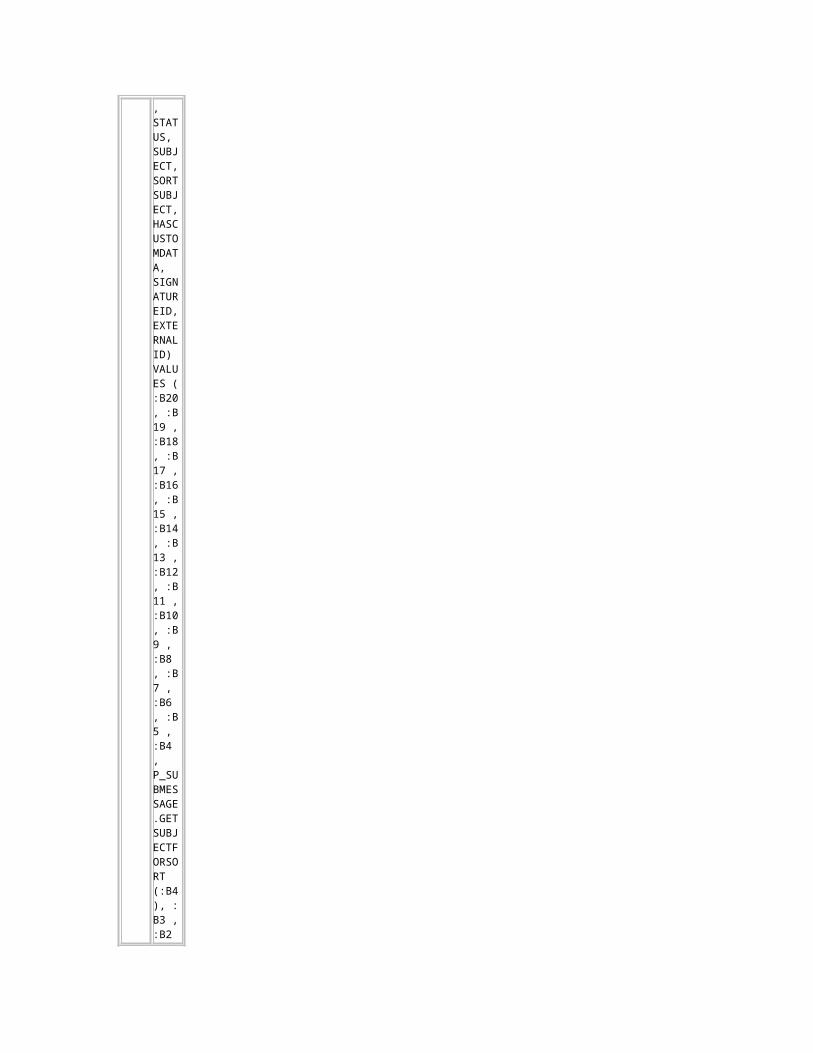
INSERT INTO SUBMESSAGE (ID, SYSTEMID, CREATIONTIMESTAMP, CREATIONTYPE, SENDERID, SENDERSYSTEMID, CS, CSWWS, CST,

MESSAGEID, MESSAGESYSTEMID, PV, PRIORITY, SENSITIVITY, TYPE, STATUS, SUBJECT, SORTSUBJECT, HASCUSTOMDATA, SIGNATUREID, EXTERNALID) VALUES ( :B20 , :B19 , :B18 , :B17 , :B16 , :B15 , :B14 , :B13 , :B12 , :B11 , :B10 , :B9 , :B8 , :B7 , :B6 , :B5 , :B4 , P_SUBMESSAGE.GETSUBJECTFORSORT (:B4 ), :B3 , :B2 , :B1 )
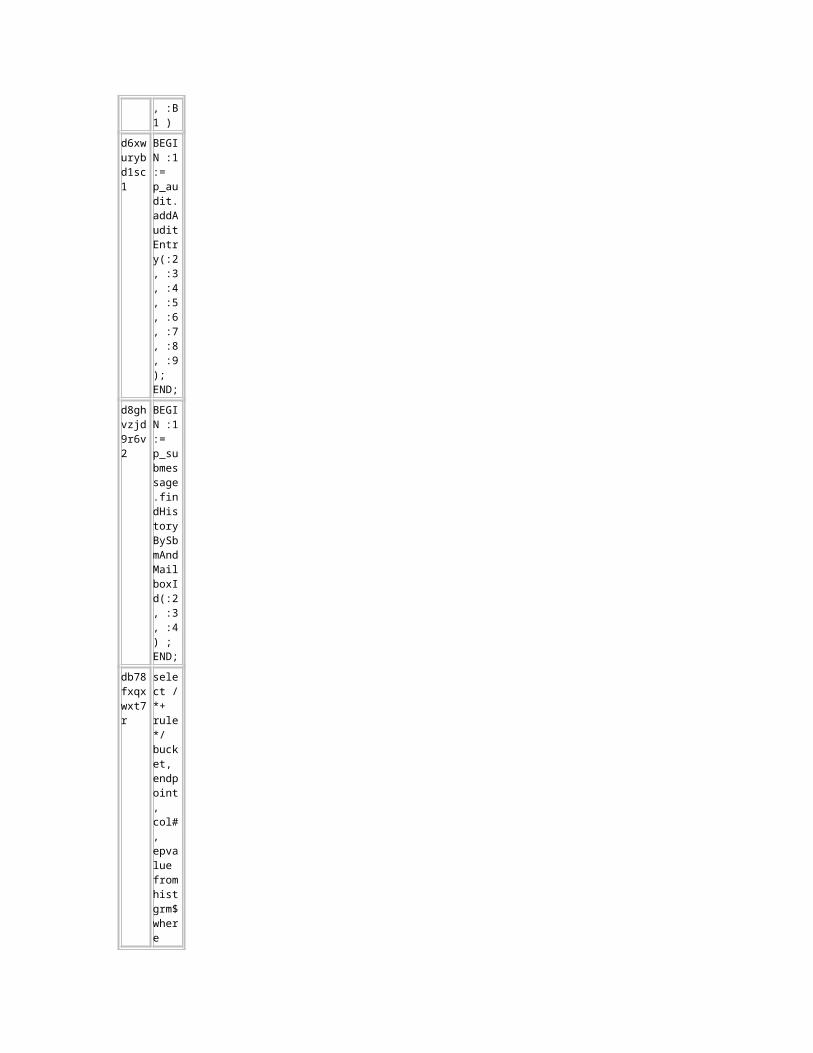
d6xwurybd1sc1
BEGIN :1 := p_audit.addAudit

Entry(:2, :3, :4, :5, :6, :7, :8, :9); END;
d8ghvzjd9r6v2
BEGIN :1 := p_submessage.findHistoryBySbmAndMailboxId(:2, :3, :4) ; END;
db78fxqxwxt7r
select /*+ rule */ bucket, endpoint, col#, epvalue from histgrm$ where obj#=:1 and intcol#=:2 and row#=:3 order by bucket
dgc3kfn6agh0z
BEGIN p_mailboxitem.manageMailboxItem(:1, :2, :3, :4, :5, :6, :7, :8, :9, :10, :11, :12, :13, :14); END;
dmvgk7gcc
INSERT

8m1t INTO RECIPIENT SELECT :B2 , :B1 , DRAFTRECIPIENTS.SEQUENCENR, POPULATION.TYPE, DRAFTRECIPIENTS.ID, DRAFTRECIPIENTS.SYSTEMID, DRAFTRECIPIENTS.LISTTYPE FROM DRAFTRECIPIENTS , POPULATION WHERE POPULATION.ID=DRAFTRECIPIENTS.ID AND POPULATION.SYSTEMID = DRAFTRECIPIENTS.SYSTEMID AND DRAF

TRECIPIENTS.SUBMESSAGEID = :B2 AND DRAFTRECIPIENTS.SUBMESSAGESYSTEMID = :B1
dsj2pmxg64rcu
DELETE FROM SUBMESSAGEHISTORY WHERE HISTORYID = :B1 AND CHECKED IS NULL
dsuu77m1r3jbb
INSERT INTO AUDITENTRY ( ID, APPTYPE, USERID, USERSYSTEMID, AUDIT_TIMESTAMP, CATEGORYID, OPERATIONID ) VALUES ( :B7 , :B6 , :B5 , :
B4 , :B3 , :B2 , :B1 )
fb9bdkw7ku1ws
SELECT SUBMESSAGEHISTORY.SUBMESSAGEID ID, SUBMESSAGEHISTORY.SUBMESSAGESYSTEMID SYSTEMID, SUBMESSAGE.SENDERID, SUBMESSAGE.SENDERSYSTEMID, POPULATION.DISPLAYNAME1, POPULATION.SMTPADDRESS, POPULATION.TYPE AS SENDERTYPE, SUBMESSAGE.CREATIONTIMESTAMP, SUB
MESSAGE.SUBJECT, SUBMESSAGEHISTORY.CHECKED, SUBMESSAGE.PV AS PERMISSIONVECTOR FROM MAILBOXITEM, SUBMESSAGEHISTORY, SUBMESSAGE, POPULATION WHERE MAILBOXITEM.MAILBOXID = :B3 AND MAILBOXITEM.SUBMESSAGEID = :B2 AND MAILBOXITEM.SUBMESSAGESYSTEMID = :B1 AND MAIL

BOXITEM.HISTORYID = SUBMESSAGEHISTORY.HISTORYID AND SUBMESSAGEHISTORY.SUBMESSAGEID = SUBMESSAGE.ID(+) AND SUBMESSAGEHISTORY.SUBMESSAGESYSTEMID = SUBMESSAGE.SYSTEMID(+) AND SUBMESSAGE.SENDERID = POPULATION.ID(+) AND SUBMESSAGE.SENDERSYSTEMID = POPULATION.SYSTEMID(+

) ORDER BY SUBMESSAGE.CREATIONTIMESTAMP DESC
fmw713zqmuzzz
INSERT INTO COMPLIANCE_DETAILS (OWNERID, OWNERSYSTEMID, TARGETID, TARGETSYSTEMID) VALUES (:B4 , :B3 , :B1 , :B2 )
fnpgu5z2728vu
SELECT TO_CHAR(SEQ_MAILBOXITEM.NEXTVAL) FROM DUAL
fqsda57xpqq15
DELETE FROM JMS_MESSAGES WHERE TXID=:1 AND TXOP=:2
ga9j9xk5cy9s0
select /*+ index(idl_sb4$ i_idl_sb41) +*/ piece#, length, piece from idl_sb4$ where obj#=:1 and part=:2 and version=:3 order by piece#
gb7fysp9b0pxh
BEGIN :1 := p_submessage.findSubmessageRecipients(:2, :3) ; END;
gmc1a22nkcump
SELECT ID, NAME, OWNERID, OWNERSYSTEMID, MBTYPE, ITEMSTYPE, MBPARENT, P_MAILBOX.GETITEMSCOUNT(ID, :B2 , :
B1 ), P_MAILBOX.GETUNREADITEMSCOUNT(ID, :B2 , :B1 ), DESCRIPTION FROM MAILBOX WHERE ID = :B3 AND OWNERID = :B2 AND OWNERSYSTEMID = :B1
gvt7aq1y5uvp4
SELECT ALL_RESULTS.ID, ALL_RESULTS.SYSTEMID, ALL_RESULTS.DISPLAYNAME1 DISPLAYNAME, ALL_RESULTS.TYPE, ALL_RESULTS.SMTPADDRESS, ROWNUM RN FROM (SELECT DISTI
NCT * FROM (SELECT RECIPIENT.ID ID, RECIPIENT.SYSTEMID SYSTEMID , POPULATION.DISPLAYNAME1 DISPLAYNAME1, POPULATION.TYPE TYPE, POPULATION.SMTPADDRESS SMTPADDRESS FROM SUBMESSAGE, RECIPIENT, POPULATION WHERE SUBMESSAGE.SENDERID = :B2 AND SUBMESSAGE.SENDERS

YSTEMID = :B1 AND SUBMESSAGE.ID = RECIPIENT.SUBMESSAGEID AND SUBMESSAGE.SYSTEMID = RECIPIENT.SUBMESSAGESYSTEMID AND RECIPIENT.ID = POPULATION.ID AND RECIPIENT.SYSTEMID = POPULATION.SYSTEMID AND POPULATION.STATUS != 'R' ORDER BY SUBMESSAGE.CREATIONTIMESTAMP DESC) ) ALL_

RESULTS WHERE ROWNUM <= :B3
gwca9akskcaq9
DELETE FROM DRAFTRECIPIENTS WHERE SUBMESSAGEID = :B2 AND SUBMESSAGESYSTEMID = :B1
Back to SQL Statistics Back to Top
Instance Activity Statistics Instance Activity Stats Instance Activity Stats - Absolute Values Instance Activity Stats - Thread Activity
Back to Top
Instance Activity StatsStatistic
Total
per Second
per Tran
s
CPU used by this session
302,232
41.75 2.66
CPU used when call started
307,467
42.47 2.71
CR blocks created
112,105
15.49 0.99
Cached Com
390 0.05 0.00

mit SCN referenced
Commit SCN cached
1 0.00 0.00
DB time
3,017,515
416.81
26.58
DBWR checkpoint buffers written
195,998
27.07 1.73
DBWR checkpoints
7 0.00 0.00
DBWR fusion writes
39,978
5.52 0.35
DBWR thread checkpoint buffers written
20,768
2.87 0.18
DBWR transaction table writes
1,089 0.15 0.01
DBWR undo block writes
117,523
16.23 1.04
DFO trees parallelized
3,890 0.54 0.03
PX local messages recv'd
20,354
2.81 0.18
PX local messages sent
20,354
2.81 0.18
PX 7,939 1.10 0.07

remote messages recv'd
PX remote messages sent
12,732
1.76 0.11
Parallel operations downgraded to serial
15 0.00 0.00
Parallel operations not downgraded
3,890 0.54 0.03
RowCR - row contention
4,506 0.62 0.04
RowCR attempts
239,104
33.03 2.11
RowCR hits
243,323
33.61 2.14
SMON posted for undo segment shrink
29 0.00 0.00
SQL*Net roundtrips to/from client
2,296,484
317.22
20.23
active txn count during cleanout
299,225
41.33 2.64
application wait time
49,553
6.84 0.44
backg 7 0.00 0.00

round checkpoints completed
background checkpoints started
7 0.00 0.00
background timeouts
53,557
7.40 0.47
branch node splits
10 0.00 0.00
buffer is not pinned count
178,425,76
8
24,646.27
1,571.60
buffer is pinned count
188,312,29
4
26,011.91
1,658.69
bytes received via SQL*Net from client
1,366,200,4
47
188,715.72
12,033.72
bytes sent via SQL*Net to client
1,805,368,8
67
249,378.84
15,901.99
calls to get snapshot scn: kcmgss
3,540,841
489.10
31.19
calls to kcmgas
1,264,468
174.66
11.14
calls to kcmgcs
21,097
2.91 0.19
change write time
4,667 0.64 0.04
cleanout -
208,930
28.86 1.84
number of ktugct calls
cleanouts and rollbacks - consistent read gets
105,981
14.64 0.93
cleanouts only - consistent read gets
23,625
3.26 0.21
cluster key scan block gets
18,127
2.50 0.16
cluster key scans
5,871 0.81 0.05
cluster wait time
217,479
30.04 1.92
commit batch performed
0 0.00 0.00
commit batch requested
0 0.00 0.00
commit batch/immediate performed
166 0.02 0.00
commit batch/immediate requested
166 0.02 0.00
commit cleanout failures: block lost
35,996
4.97 0.32
comm 2 0.00 0.00
it cleanout failures: buffer being written
commit cleanout failures: callback failure
1,696 0.23 0.01
commit cleanout failures: cannot pin
1,027 0.14 0.01
commit cleanouts
888,658
122.75
7.83
commit cleanouts successfully completed
849,937
117.40
7.49
commit immediate performed
166 0.02 0.00
commit immediate requested
166 0.02 0.00
commit txn count during cleanout
183,866
25.40 1.62
concurrency wait time
7,379 1.02 0.06
consistent changes
433,225
59.84 3.82

consistent gets
273,929,04
3
37,838.31
2,412.81
consistent gets - examination
116,575,33
7
16,102.76
1,026.82
consistent gets direct
167,217
23.10 1.47
consistent gets from cache
274,032,54
5
37,852.61
2,413.72
current blocks converted for CR
25 0.00 0.00
cursor authentications
1,147 0.16 0.01
data blocks consistent reads - undo records applied
257,472
35.57 2.27
db block changes
9,774,367
1,350.15
86.09
db block gets
15,319,563
2,116.12
134.94
db block gets direct
34,838
4.81 0.31
db block gets from cache
15,284,725
2,111.31
134.63
deferred (CURRENT) block clean
221,867
30.65 1.95
out applications
dirty buffers inspected
1,629 0.23 0.01
enqueue conversions
1,205,315
166.49
10.62
enqueue releases
4,082,414
563.91
35.96
enqueue requests
4,083,705
564.09
35.97
enqueue timeouts
1,291 0.18 0.01
enqueue waits
25,985
3.59 0.23
exchange deadlocks
3,225 0.45 0.03
execute count
3,831,071
529.19
33.74
flashback log writes
30,615
4.23 0.27
free buffer inspected
361,875
49.99 3.19
free buffer requested
2,762,311
381.56
24.33
gc CPU used by this session
43,299
5.98 0.38
gc cr block build time
1,248 0.17 0.01
gc cr block flush time
13,178
1.82 0.12
gc cr 33,32 4.60 0.29

block receive time
0
gc cr block send time
2,237 0.31 0.02
gc cr blocks received
416,762
57.57 3.67
gc cr blocks served
412,066
56.92 3.63
gc current block flush time
34,371
4.75 0.30
gc current block pin time
22,949
3.17 0.20
gc current block receive time
66,613
9.20 0.59
gc current block send time
1,914 0.26 0.02
gc current blocks received
398,067
54.99 3.51
gc current blocks served
371,976
51.38 3.28
gc local grants
156,867
21.67 1.38
gc remote grants
127,644
17.63 1.12
gcs 2,523, 348.5 22.23
messages sent
317 5
ges messages sent
150,875
20.84 1.33
global enqueue get time
105,773
14.61 0.93
global enqueue gets async
33,828
4.67 0.30
global enqueue gets sync
826,852
114.21
7.28
global enqueue releases
807,151
111.49
7.11
heap block compress
13,904
1.92 0.12
hot buffers moved to head of LRU
18,627
2.57 0.16
immediate (CR) block cleanout applications
129,615
17.90 1.14
immediate (CURRENT) block cleanout applications
138,584
19.14 1.22
index crx upgrade (positioned)
14,220
1.96 0.13
index fast
602 0.08 0.01
full scans (full)
index fetch by key
39,382,237
5,439.94
346.89
index scans kdiixs1
37,841,722
5,227.14
333.32
leaf node 90-10 splits
643 0.09 0.01
leaf node splits
2,578 0.36 0.02
lob reads
60,032
8.29 0.53
lob writes
61,486
8.49 0.54
lob writes unaligned
54,358
7.51 0.48
logons cumulative
4,188 0.58 0.04
messages received
471,489
65.13 4.15
messages sent
471,361
65.11 4.15
no buffer to keep pinned count
0 0.00 0.00
no work - consistent read gets
156,630,14
2
21,635.60
1,379.62
opened cursors cumulative
2,172,587
300.10
19.14
parse count (failures)
9 0.00 0.00
parse count
2,274 0.31 0.02

(hard)
parse count (total)
2,154,390
297.59
18.98
parse time cpu
7,591 1.05 0.07
parse time elapsed
7,874 1.09 0.07
physical read IO requests
360,312
49.77 3.17
physical read bytes
3,946,053,6
32
545,075.46
34,757.50
physical read total IO requests
427,888
59.10 3.77
physical read total bytes
7,049,507,8
40
973,761.15
62,093.24
physical read total multi block requests
20,410
2.82 0.18
physical reads
481,696
66.54 4.24
physical reads cache
283,057
39.10 2.49
physical reads cache prefetch
136,637
18.87 1.20
physical reads direct
198,639
27.44 1.75
physical reads direct (lob)
163,701
22.61 1.44
physical reads direct temporary tablespace
0 0.00 0.00
physical reads for flashback new
99,824
13.79 0.88
physical reads prefetch warmup
129,274
17.86 1.14
physical write IO requests
123,841
17.11 1.09
physical write bytes
2,223,235,0
72
307,099.45
19,582.63
physical write total IO requests
391,342
54.06 3.45
physical write total bytes
10,258,318,
848
1,416,999.9
7
90,356.98
physical write total multi block requests
217,043
29.98 1.91
physical writes
271,391
37.49 2.39
physical writes direct
34,970
4.83 0.31
physical writes direct (lob)
34,809
4.81 0.31

physical writes from cache
236,421
32.66 2.08
physical writes non checkpoint
207,770
28.70 1.83
pinned buffers inspected
1,264 0.17 0.01
prefetch warmup blocks aged out before use
3,910 0.54 0.03
prefetch warmup blocks flushed out before use
6 0.00 0.00
prefetched blocks aged out before use
28 0.00 0.00
process last non-idle time
7,522 1.04 0.07
queries parallelized
3,408 0.47 0.03
recursive calls
8,069,441
1,114.65
71.08
recursive cpu usage
150,665
20.81 1.33
redo block
3,476,307
480.19
30.62

s written
redo buffer allocation retries
29 0.00 0.00
redo entries
5,172,488
714.49
45.56
redo log space requests
24 0.00 0.00
redo log space wait time
31 0.00 0.00
redo ordering marks
98,899
13.66 0.87
redo size
1,660,175,8
04
229,323.06
14,623.11
redo subscn max counts
34,168
4.72 0.30
redo synch time
90,059
12.44 0.79
redo synch writes
174,240
24.07 1.53
redo wastage
61,856,144
8,544.30
544.84
redo write time
16,558
2.29 0.15
redo writer latching time
7 0.00 0.00
redo writes
217,288
30.01 1.91
rollback changes - undo records applied
659 0.09 0.01
rollba 7,484 1.03 0.07

cks only - consistent read gets
rows fetched via callback
39,071,587
5,397.03
344.15
session connect time
0 0.00 0.00
session cursor cache hits
1,395,843
192.81
12.29
session logical reads
289,248,60
6
39,954.43
2,547.75
session pga memory
7,103,153,7
76
981,171.36
62,565.76
session pga memory max
13,558,139,
152
1,872,810.0
6
119,422.35
session uga memory
17,403,258,
088
2,403,943.2
3
153,290.80
session uga memory max
1,139,810,7
44
157,444.10
10,039.64
shared hash latch upgrades - no wait
362,689
50.10 3.19
shared hash latch upgrades - wait
970 0.13 0.01
sorts 330,3 45.63 2.91
(memory)
50
sorts (rows)
43,542,950
6,014.67
383.53
sql area evicted
863 0.12 0.01
sql area purged
9 0.00 0.00
summed dirty queue length
7,613 1.05 0.07
switch current to new buffer
57,355
7.92 0.51
table fetch by rowid
118,416,52
5
16,357.09
1,043.03
table fetch continued row
20,016
2.76 0.18
table scan blocks gotten
6,710,255
926.90
59.11
table scan rows gotten
155,872,04
4
21,530.88
1,372.95
table scans (short tables)
60,855
8.41 0.54
total number of times SMON posted
102 0.01 0.00
transaction lock background gets
0 0.00 0.00
transaction lock foregr
0 0.00 0.00
ound requests
transaction lock foreground wait time
0 0.00 0.00
transaction rollbacks
166 0.02 0.00
undo change vector size
564,197,06
4
77,933.55
4,969.54
user I/O wait time
97,578
13.48 0.86
user calls
3,909,128
539.97
34.43
user commits
106,231
14.67 0.94
user rollbacks
7,300 1.01 0.06
workarea executions - optimal
261,962
36.19 2.31
write clones created in background
1 0.00 0.00
write clones created in foreground
20 0.00 0.00
Back to Instance Activity Statistics Back to Top
Instance Activity Stats - Absolute Values Statistics with absolute values (should not be diffed)
Statistic
Begin
Value
End Valu
e

session cursor cache count
543 7,081
opened cursors current
137 2,158
logons current
47 106
Back to Instance Activity Statistics Back to Top
Instance Activity Stats - Thread Activity Statistics identified by '(derived)' come from sources other than SYSSTAT
Statistic
Total
per Hou
r
log switches (derived)
7 3.48
Back to Instance Activity Statistics Back to Top
IO Stats Tablespace IO Stats File IO Stats
Back to Top
Tablespace IO Stats ordered by IOs (Reads + Writes) desc
Tablespace
Reads
Av Reads/s
Av Rd(ms)
Av Blks/Rd
Writes
Av Writes/s
Buffer
Waits
Av Buf Wt(ms)
BLUE_M064_CLOB
171,791
24 1.14 1.01 30,928
4 1,541 69.15
UNDOTBS1
92,877
13 0.95 1.00 8,949 1 1,318 0.09
BLUE_AUTO_INDX
18,284
3 6.47 2.02 49,643
7 18,360
24.54
BLUE_M008_NTAB
27,100
4 8.66 3.75 9,716 1 6,692 14.97

BLUE_M004_BLOB
17,754
2 0.53 1.00 7,331 1 347 5.88
BLUE_M001_NTAB
15,785
2 6.78 2.34 9,142 1 138 10.87
BLUE_K064_NTAB
12,697
2 0.09 1.01 99 0 3,413 48.86
USERS
2,281 0 4.40 2.16 5,058 1 492 9.53
BLUE_M256_NTAB
835 0 10.92 4.65 1,270 0 28 16.07
SYSAUX
610 0 2.87 1.96 900 0 0 0.00
SYSTEM
384 0 4.56 1.04 182 0 38 11.84
TEMP 0 0 0.00 330 0 0 0.00
BLUE_K128_NTAB
8 0 1.25 2.75 253 0 188 3.19
BLUE_K064_BLOB
ght' class='awrc'>0.0
0
1.00 6 0 0 0.00
BLUE_K512_CLOB
6 0 0.00 1.00 6 0 0 0.00
BLUE_M004_CLOB
6 0 0.00 1.00 6 0 0 0.00
BLUE_M064_BLOB
6 0 0.00 1.00 6 0 0 0.00
BLUE_M064_NTAB
6 0 0.00 1.00 6 0 0 0.00
UNDOTBS2
6 0 0.00 1.00 6 0 9,887 6.80
Back to IO Stats Back to Top
File IO Stats ordered by Tablespace, File
Tablespace
Filenam
e
Reads
Av Reads/s
Av Rd(ms)
Av Blks/Rd
Writes
Av Writes/s
Buffer
Wait
Av Buf Wt(

s ms)
BLUE_AUTO_INDX
+DG1/orcl/datafile/blue_auto_indx01.dbf
18,284
3 6.47 2.02 49,643
7 18,360
24.54
BLUE_K064_BLOB
+DG1/orcl/datafile/blue_k064_blob01.dbf
6 0 0.00 1.00 6 0 0 0.00
BLUE_K064_NTAB
+DG1/orcl/datafile/blue_k064_ntab01.dbf
12,697
2 0.09 1.01 99 0 3,413 48.86
BLUE_K128_NTAB
+DG1/orcl/datafile/blue_k128_ntab01.dbf
8 0 1.25 2.75 253 0 188 3.19
BLUE_K512_BLOB
+DG1/orcl/datafile/blue_k512_blob01.dbf
6 0 0.00 1.00 6 0 0 0.00
BLUE_K512_CLOB
+DG1/orcl/datafile/blue_k512_clob01.dbf
6 0 0.00 1.00 6 0 0 0.00
BLUE_M001_NTAB
+DG1/orcl/datafile/blue_m001_ntab01.dbf
15,785
2 6.78 2.34 9,142 1 138 10.87
BLUE_M004_BLOB
+DG1/orcl/datafile/blue_m004_blob01.dbf
17,754
2 0.53 1.00 7,331 1 347 5.88

BLUE_M004_CLOB
+DG1/orcl/datafile/blue_m004_clob01.dbf
6 0 0.00 1.00 6 0 0 0.00
BLUE_M008_NTAB
+DG1/orcl/datafile/blue_m008_ntab01.dbf
27,100
4 8.66 3.75 9,716 1 6,692 14.97
BLUE_M064_BLOB
+DG1/orcl/datafile/blue_m064_blob01.dbf
6 0 0.00 1.00 6 0 0 0.00
BLUE_M064_CLOB
+DG1/orcl/datafile/blue_m064_clob01.dbf
72,103
10 1.06 1.01 12,652
2 938 59.14
BLUE_M064_CLOB
+DG1/orcl/datafile/blue_m064_clob02.dbf
76,888
11 1.08 1.00 13,675
2 574 87.13
BLUE_M064_CLOB
+DG1/orcl/datafile/blue_m064_clob03.dbf
22,794
3 1.59 1.01 4,595 1 29 37.24
BLUE_M064_CLOB
+DG1/orcl/datafile/blue_m064_clob04.dbf
6 0 0.00 1.00 6 0 0 0.00
BLUE_M064_NTAB
+DG1/orcl/datafile/blue_m064_ntab01.dbf
6 0 0.00 1.00 6 0 0 0.00
BLUE +DG1 835 0 10.92 4.65 1,270 0 28 16.07
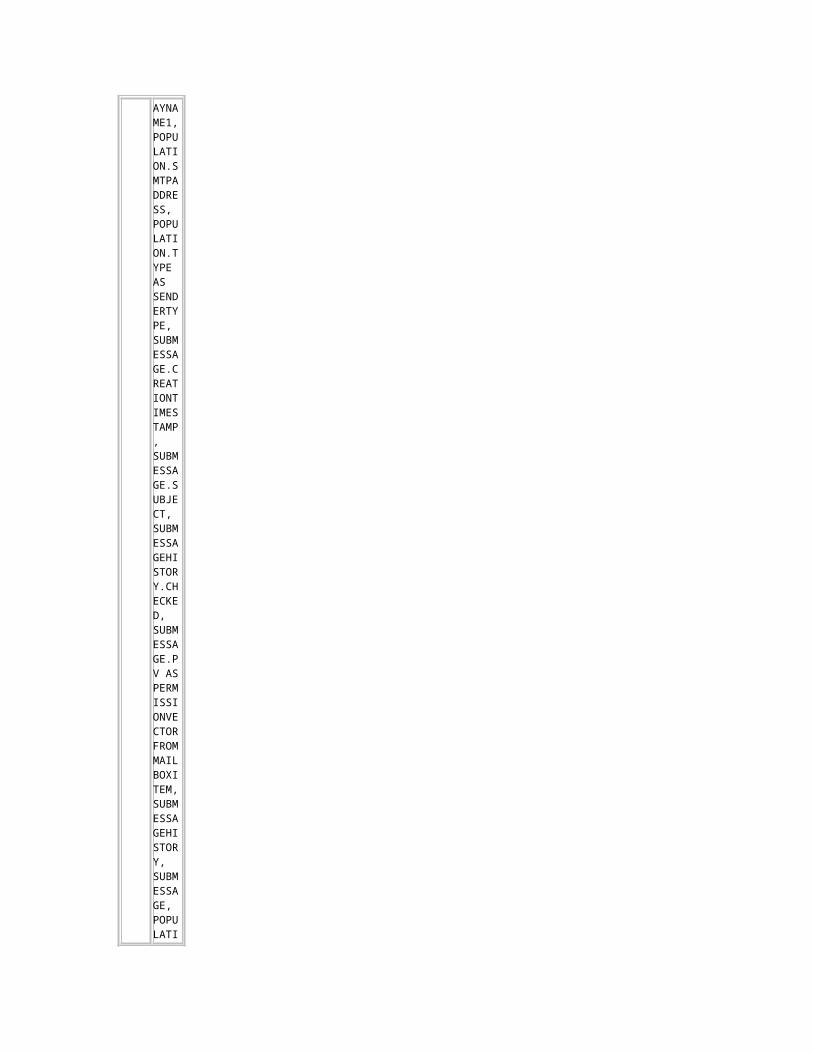
_M256_NTAB
/orcl/datafile/blue_m256_ntab01.dbf
SYSAUX
+DG1/orcl/datafile/sysaux.257.670607357
610 0 2.87 1.96 900 0 0 0.00
SYSTEM
+DG1/orcl/datafile/system.256.670607357
384 0 4.56 1.04 182 0 38 11.84
TEMP +DG1/orcl/tempfile/temp.263.670607431
0 0 330 0 0
UNDOTBS1
+DG1/orcl/datafile/undotbs1.258.670607357
92,877
13 0.95 1.00 8,949 1 1,318 0.09
UNDOTBS2
+DG1/orcl/datafile/undotbs2.264.670607447
6 0 0.00 1.00 6 0 9,887 6.80
USERS
+DG1/orcl/datafile/users.259.670607357
2,281 0 4.40 2.16 5,058 1 492 9.53
Back to IO Stats Back to Top
Buffer Pool Statistics Standard block size Pools D: default, K: keep, R: recycle Default Pools for other block sizes: 2k, 4k, 8k, 16k, 32k

P
Number of
Buffers
Pool Hit%
Buffer
Gets
Physical Reads
Physical Writes
Free Buff Wait
Writ Com
p Wait
Buffer
Busy
Waits
D 646,703
100 289,064,72
6
283,170
236,429
0 0 42,441
Back to Top
Advisory Statistics Instance Recovery Stats Buffer Pool Advisory PGA Aggr Summary PGA Aggr Target Stats PGA Aggr Target Histogram PGA Memory Advisory Shared Pool Advisory SGA Target Advisory Streams Pool Advisory Java Pool Advisory
Back to Top
Instance Recovery Stats B: Begin snapshot, E: End snapshot
Targt
MTTR (s)
Estd MTTR (s)
Recover
y Estd IOs
Actual
Redo
Blks
Target
Redo
Blks
Log File Size Red
o Blks
Log Ckpt Timeout Red
o Blks
Log Ckpt Interval Red
o Blks
B 0 23 253 1067 943650
943650
E 0 25 4552 62968 880133
943650
880133
Back to Advisory Statistics Back to Top
Buffer Pool Advisory Only rows with estimated physical reads >0 are displayed ordered by Block Size, Buffers For Estimate
PSize for Est (M)
Size Factor
Buffers for Estimat
e
Est Phy
s Rea
d Factor
Estimated
Physical Reads
D 528 0.10 63,327
57.78 16,758,319
D 1,056 0.20 126,654
16.87 4,891,536
D 1,584 0.29 189,981
5.14 1,490,978
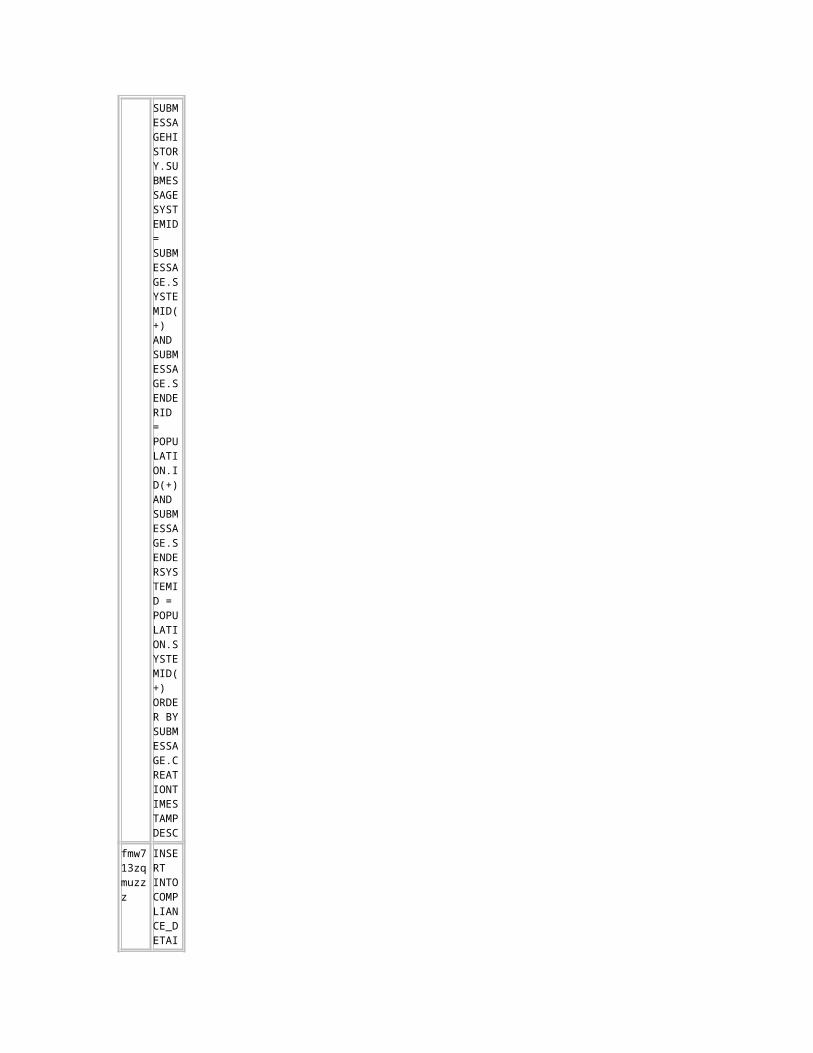
D 2,112 0.39 253,308
1.48 429,834
D 2,640 0.49 316,635
1.10 318,395
D 3,168 0.59 379,962
1.03 297,355
D 3,696 0.69 443,289
1.01 292,852
D 4,224 0.78 506,616
1.00 291,238
D 4,752 0.88 569,943
1.00 290,638
D 5,280 0.98 633,270
1.00 290,100
D 5,392 1.00 646,703
1.00 290,025
D 5,808 1.08 696,597
1.00 289,837
D 6,336 1.18 759,924
1.00 289,837
D 6,864 1.27 823,251
1.00 289,825
D 7,392 1.37 886,578
1.00 289,825
D 7,920 1.47 949,905
1.00 289,825
D 8,448 1.57 1,013,232
1.00 289,825
D 8,976 1.66 1,076,559
1.00 289,825
D 9,504 1.76 1,139,886
1.00 289,825
D 10,032
1.86 1,203,213
1.00 289,825
D 10,560
1.96 1,266,540
1.00 289,825
Back to Advisory Statistics Back to Top
PGA Aggr Summary PGA cache hit % - percentage of W/A (WorkArea) data processed only in-
memory
PGA Cache Hit %
W/A MB
Processe
d
Extra
W/A MB Read/Written
100.00
26,424
0
Back to Advisory Statistics Back to Top
PGA Aggr Target Stats

B: Begin snap E: End snap (rows dentified with B or E contain data which is absolute i.e. not diffed over the interval)
Auto PGA Target - actual workarea memory target W/A PGA Used - amount of memory used for all Workareas (manual + auto) %PGA W/A Mem - percentage of PGA memory allocated to workareas %Auto W/A Mem - percentage of workarea memory controlled by Auto Mem Mgmt %Man W/A Mem - percentage of workarea memory under manual control
PGA Agg
r Target(M
)
Auto
PGA Target(M
)
PGA Mem
Alloc(M)
W/A PGA Used(M)
%PGA W/A Mem
%Auto
W/A Mem
%Man
W/A Mem
Global Mem
Bound(K)
B 2,048 1,706 341.76
0.00 0.00 0.00 0.00 209,710
E 2,048 1,464 867.38
0.00 0.00 0.00 0.00 209,710
Back to Advisory Statistics Back to Top
PGA Aggr Target Histogram Optimal Executions are purely in-memory operations
Low Optimal
High Optimal
Total
Execs
Optimal Execs
1-Pas
s Execs
M-Pas
s Execs
2K 4K 231,103
231,103
0 0
64K 128K 1,366 1,366 0 0
128K 256K 8 8 0 0
256K 512K 2,708 2,708 0 0
512K 1024K
19,996
19,996
0 0
1M 2M 6,779 6,779 0 0
Back to Advisory Statistics Back to Top
PGA Memory Advisory When using Auto Memory Mgmt, minimally choose a pga_aggregate_target
value where Estd PGA Overalloc Count is 0
PGA Targ
et Est
(MB)
Size Fact
r
W/A MB
Processe
d
Estd Extr
a W/A MB Read/
Written to
Disk
Estd PGA Cache Hit %
Estd PGA Overallo
c Count
256 0.13 26,454.96
708.69
97.00 162
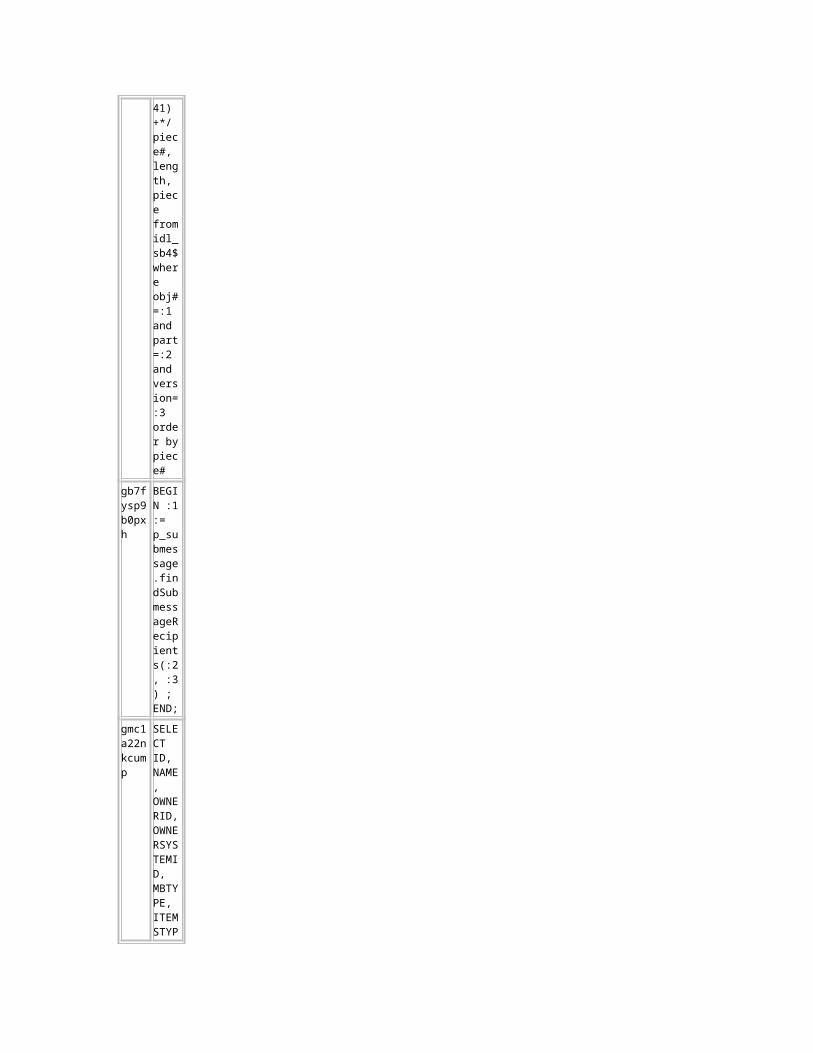
512 0.25 26,454.96
0.00 100.00
0
1,024 0.50 26,454.96
0.00 100.00
0
1,536 0.75 26,454.96
0.00 100.00
0
2,048 1.00 26,454.96
0.00 100.00
0
2,458 1.20 26,454.96
0.00 100.00
0
2,867 1.40 26,454.96
0.00 100.00
0
3,277 1.60 26,454.96
0.00 100.00
0
3,686 1.80 26,454.96
0.00 100.00
0
4,096 2.00 26,454.96
0.00 100.00
0
6,144 3.00 26,454.96
0.00 100.00
0
8,192 4.00 26,454.96
0.00 100.00
0
12,288
6.00 26,454.96
0.00 100.00
0
16,384
8.00 26,454.96
0.00 100.00
0
Back to Advisory Statistics Back to Top
Shared Pool Advisory SP: Shared Pool Est LC: Estimated Library Cache Factr: Factor Note there is often a 1:Many correlation between a single logical object in the
Library Cache, and the physical number of memory objects associated with it. Therefore comparing the number of Lib Cache objects (e.g. in v$librarycache), with the number of Lib Cache Memory Objects is invalid.
Shared
Pool Size(M)
SP Size Fact
r
Est LC
Size (M)
Est LC Mem
Obj
Est LC Tim
e Saved (s)
Est LC Tim
e Saved
Factr
Est LC Loa
d Time (s)
Est LC Loa
d Tim
e Fact
r
Est LC Mem
Obj Hits
560 0.78 90 2,805 37,162
0.83 7,946 91.33 5,821,444
640 0.89 157 5,284 37,166
0.83 7,942 91.29 5,822,331
720 1.00 171 5,828 45,021
1.00 87 1.00 5,822,380
800 1.11 171 5,828 45,021
1.00 87 1.00 5,822,380
880 1.22 171 5,828 45,021
1.00 87 1.00 5,822,380
960 1.33 171 5,828 45,021
1.00 87 1.00 5,822,380

1,040 1.44 171 5,828 45,021
1.00 87 1.00 5,822,380
1,120 1.56 171 5,828 45,021
1.00 87 1.00 5,822,380
1,200 1.67 171 5,828 45,021
1.00 87 1.00 5,822,380
1,280 1.78 171 5,828 45,021
1.00 87 1.00 5,822,380
1,360 1.89 171 5,828 45,021
1.00 87 1.00 5,822,380
1,440 2.00 171 5,828 45,021
1.00 87 1.00 5,822,380
Back to Advisory Statistics Back to Top
SGA Target AdvisorySGA Targ
et Size (M)
SGA Size Factor
Est DB Time (s)
Est Physical Reads
1,552 0.25 56,655
16,753,877
3,104 0.50 8,946 429,557
4,656 0.75 8,544 291,086
6,208 1.00 8,537 289,869
7,760 1.25 8,537 289,666
9,312 1.50 8,537 289,666
10,864
1.75 8,537 289,666
12,416
2.00 8,537 289,666
Back to Advisory Statistics Back to Top
Streams Pool AdvisoryNo data exists for this section of the report.
Back to Advisory Statistics Back to Top
Java Pool Advisory
Java Pool Size(M)
JP Size Fact
r
Est LC
Size (M)
Est LC Mem
Obj
Est LC Tim
e Saved (s)
Est LC Tim
e Saved
Factr
Est LC Loa
d Time (s)
Est LC Loa
d Tim
e Fact
r
Est LC Mem
Obj Hits
16 0.25 6 100 2 1.00 87 1.00 100
32 0.50 6 100 2 1.00 87 1.00 100

48 0.75 6 100 2 1.00 87 1.00 100
64 1.00 6 100 2 1.00 87 1.00 100
80 1.25 6 100 2 1.00 87 1.00 100
96 1.50 6 100 2 1.00 87 1.00 100
112 1.75 6 100 2 1.00 87 1.00 100
128 2.00 6 100 2 1.00 87 1.00 100
Back to Advisory Statistics Back to Top
Wait Statistics Buffer Wait Statistics Enqueue Activity
Back to Top
Buffer Wait Statistics ordered by wait time desc, waits desc
Class
Waits
Total
Wait Time (s)
Avg Tim
e (ms)
data block
29,682
747 25
1st level bmb
1,046 86 82
undo header
7,769 66 8
undo block
3,436 1 0
2nd level bmb
495 1 2
segment header
14 0 4
Back to Wait Statistics Back to Top
Enqueue Activity only enqueues with waits are shown Enqueue stats gathered prior to 10g should not be compared with 10g data ordered by Wait Time desc, Waits desc
Enqueu
e Typ
e (Request Reason)
Request
s
Succ
Gets
Failed
GetsWait
sWt Time (s)
Av Wt Time(ms)

TX-Transaction (row lock contention)
5,518 5,446 0 5,273 508 96.25
HW-Segment High Water Mark
26,196
25,881
315 7,381 486 65.86
TX-Transaction (index contention)
757 754 0 674 28 41.72
WF-AWR Flush
45 44 1 37 6 171.05
PS-PX Process Reservation
28,204
27,232
972 7,829 4 0.48
FB-Format Block
500 500 0 281 2 7.41
US-Undo Segment
4,432 4,432 0 4,048 2 0.45
TX-Transaction
164,253
164,253
0 31 1 37.65
CF-Controlfile Transaction
16,951
16,951
0 266 0 0.65
TM-DML
366,793
366,793
0 84 0 0.52
SQ-Sequence Cache
882 882 0 1 0 30.00
FL-Flashback database log (Flashback database log)
81 81 0 17 0 0.65
TT- 1,192 1,192 0 30 0 0.33

Tablespace
TX-Transaction (allocate ITL entry)
10 10 0 10 0 0.80
TA-Instance Undo
26 26 0 25 0 0.28
CT-Block Change Tracking (global space management)
6 6 0 5 0 0.60
DR-Distributed Recovery
7 7 0 6 0 0.33
MW-MWIN Schedule
4 4 0 4 0 0.50
WL-Being Written Redo Log
8 7 1 4 0 0.50
RS-Reclaimable Space (prevent file delete)
4 4 0 2 0 0.50
AF-Advisor Framework (task serialization)
7 7 0 1 0 1.00
TQ-Queue table enqueue
100 100 0 3 0 0.00
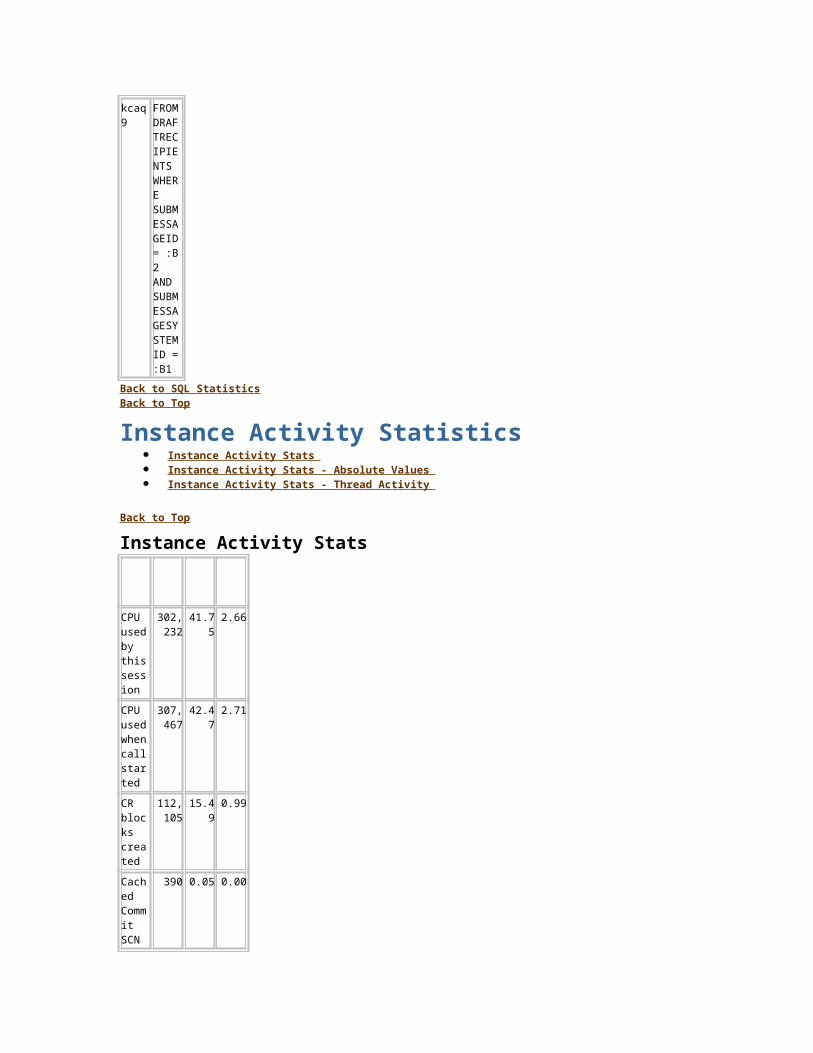
(TM contention)
JS-Job Scheduler (job run lock - synchronize)
4 4 0 2 0 0.00
UL-User-defined
4 4 0 2 0 0.00
RS-Reclaimable Space (read alert level)
26 26 0 1 0 0.00
Back to Wait Statistics Back to Top
Undo Statistics Undo Segment Summary Undo Segment Stats
Back to Top
Undo Segment Summary Min/Max TR (mins) - Min and Max Tuned Retention (minutes) STO - Snapshot Too Old count, OOS - Out of Space count Undo segment block stats: uS - unexpired Stolen, uR - unexpired Released, uU - unexpired reUsed eS - expired Stolen, eR - expired Released, eU - expired reUsed
Undo
TS#
Num Und
o Blocks (K)
Number of
Transactions
Max Qry Len (s)
Max Tx
Concurc
y
Min/Max TR
(mins)
STO/
OOS
uS/uR/uU/ eS/eR/eU
1 119.56
165,257
1,193 34 15/33.6333333333333333333333333333333333333
0/0 0/0/0/0/0/0
Back to Undo Statistics Back to Top
Undo Segment Stats Most recent 35 Undostat rows, ordered by Time desc

End Tim
e
Num Und
o Blocks
Number of
Transactions
Max Qry Len (s)
Max Tx
Concy
Tun Ret (min
s)
STO/
OOS
uS/uR/uU/ eS/eR/eU
04-Jun 18:06
824 1,972 418 13 20 0/0 0/0/0/0/0/0
04-Jun 17:56
26,391
54,565
93 34 15 0/0 0/0/0/0/0/0
04-Jun 17:46
12,639
21,944
1,193 16 33 0/0 0/0/0/0/0/0
04-Jun 17:36
5 141 654 3 30 0/0 0/0/0/0/0/0
04-Jun 17:26
4,531 21,399
139 11 20 0/0 0/0/0/0/0/0
04-Jun 17:16
5,278 21,259
634 29 25 0/0 0/0/0/0/0/0
04-Jun 17:06
6,708 16,331
855 33 33 0/0 0/0/0/0/0/0
04-Jun 16:56
5,522 7,418 628 10 25 0/0 0/0/0/0/0/0
04-Jun 16:46
6,231 9,683 1,176 9 34 0/0 0/0/0/0/0/0
04-Jun 16:36
6,598 9,828 571 14 27 0/0 0/0/0/0/0/0
04-Jun 16:26
31,545
246 312 21 22 0/0 0/0/0/0/0/0
04-Jun 16:16
13,225
373 0 2 15 0/0 0/0/0/0/0/0
04-Jun 16:06
59 98 0 3 15 0/0 0/0/0/0/0/0
Back to Undo Statistics Back to Top
Latch Statistics Latch Activity Latch Sleep Breakdown Latch Miss Sources Parent Latch Statistics Child Latch Statistics
Back to Top
Latch Activity "Get Requests", "Pct Get Miss" and "Avg Slps/Miss" are statistics for willing-to-wait latch get requests "NoWait Requests", "Pct NoWait Miss" are for no-wait latch get requests

"Pct Misses" for both should be very close to 0.0
Latch
Name
Get Request
s
Pct Get
Miss
Avg Slps /Mis
s
Wait Time (s)
NoWait Request
s
Pct No
Wait Miss
ASM allocation
1,966 0.00 0 0
ASM db client latch
7,053 0.00 0 0
ASM map headers
809 0.00 0 0
ASM map load waiting list
216 0.00 0 0
ASM map operation freelist
3,642 0.00 0 0
ASM map operation hash table
2,040,929
0.00 0.00 0 0
ASM network background latch
4,034 0.00 0 0
AWR Alerted Metric Element list
49,705
0.00 0 0
Consistent RBA
217,354
0.00 0.00 0 0
FAL request queue
159 0.00 0 0
FAL subheap alocation
159 0.00 0 0
FIB s.o
318 0.00 0 0
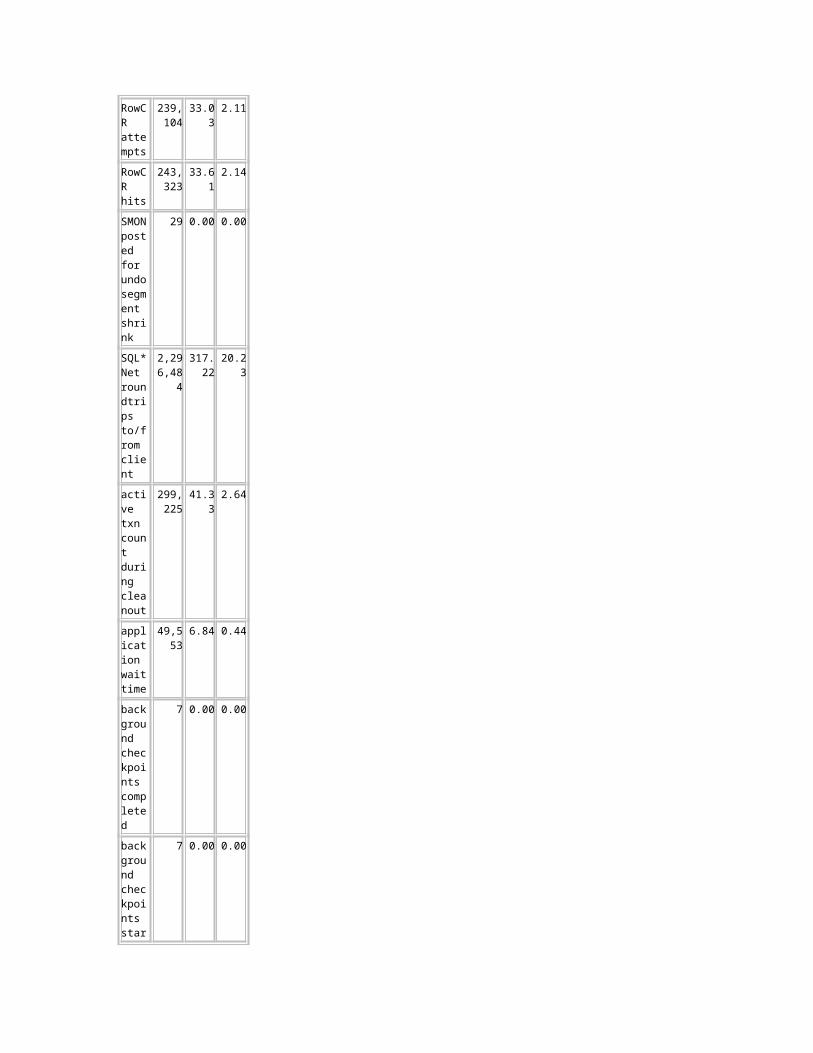
chain latch
FOB s.o list latch
3,077 0.00 0 0
JOX SGA heap latch
2,196 0.00 0 591 0.00
JS broadcast add buf latch
5,665 0.00 0 0
JS broadcast drop buf latch
5,667 0.00 0 0
JS broadcast load blnc latch
5,449 0.00 0 0
JS mem alloc latch
12 0.00 0 2 0.00
JS queue access latch
12 0.00 0 0
JS queue state obj latch
228,932
0.00 0 0
JS slv state obj latch
20 0.00 0 0
KCL gc element parent latch
9,229,849
0.03 0.05 0 15,273
0.10
KFK SGA context latch
5,061 0.00 0 0
KFMD SGA
713 0.14 0.00 0 0
KJC destination
0 0 2 0.00
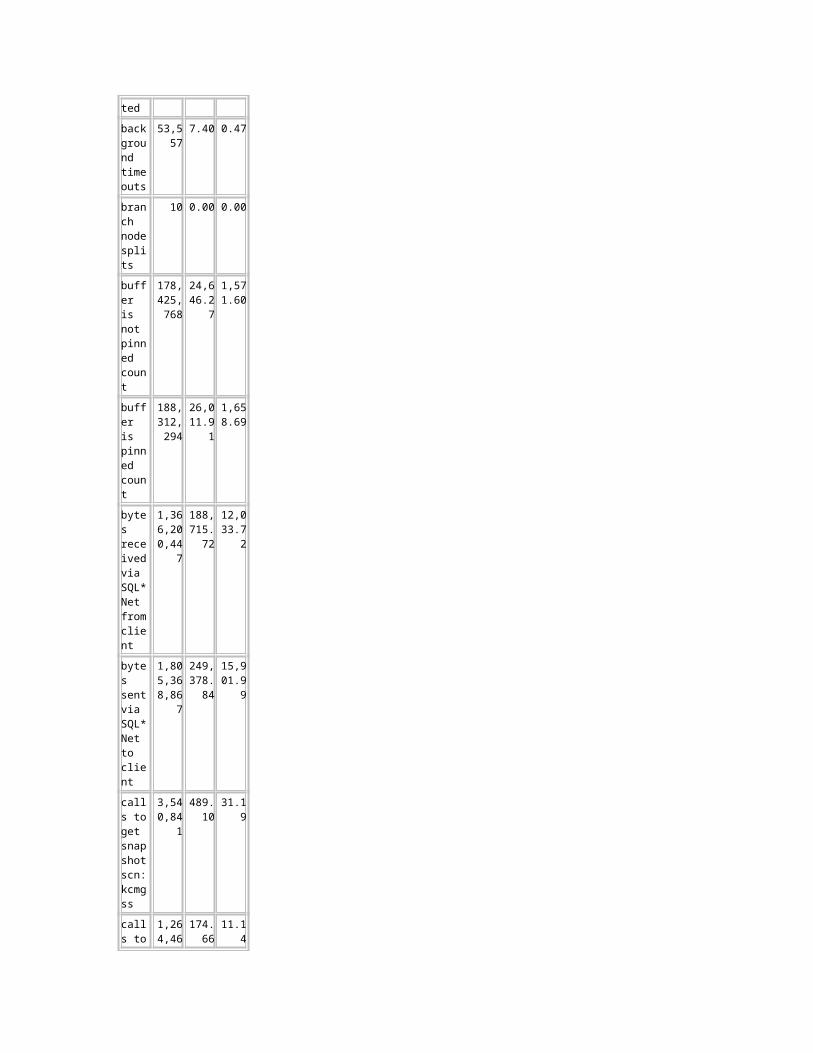
ctx free list
KJC message pool free list
523,173
0.05 0.00 0 148,799
0.06
KJC receiver ctx free list
0 0 2 0.00
KJCT flow control latch
2,906,799
0.03 0.00 0 0
KMG MMAN ready and startup request latch
2,405 0.00 0 0
KSXR large replies
482 0.00 0 0
KTF sga latch
34 0.00 0 2,323 0.00
KWQMN job cache list latch
1,139 0.09 0.00 0 0
MQL Tracking Latch
0 0 144 0.00
Memory Management Latch
0 0 2,405 0.00
Mutex Stats
1 0.00 0 0
OS process
663 0.00 0 0
OS process allocation
2,906 0.00 0 0
OS proce
457 0.00 0 0

ss: request allocation
PL/SQL warning settings
1,307,206
0.00 0 0
Reserved Space Latch
97 0.00 0 0
SGA IO buffer pool latch
591 0.00 0 592 0.00
SQL memory manager latch
2 0.00 0 2,403 0.00
SQL memory manager workarea list latch
299,433
0.00 0.00 0 0
Shared B-Tree
256 0.00 0 0
active checkpoint queue latch
121,530
0.42 0.00 0 2 0.00
active service list
85,135
0.00 0.00 0 2,678 0.00
alert log latch
0 0 2 0.00
archive control
237 0.00 0 0
archive process latch
2,562 0.00 0 0
begin backup scn array
34,697
0.00 0.00 0 0

business card
7,780 0.00 0 0
cache buffer handles
14,408
0.02 0.00 0 0
cache buffers chains
490,993,08
5
0.04 0.02 0 6,088,200
0.03
cache buffers lru chain
4,694,571
0.08 0.00 0 5,280,631
0.15
cache table scan latch
0 0 509 0.00
channel handle pool latch
569 0.00 0 0
channel operations parent latch
2,504,846
0.01 0.00 0 0
checkpoint queue latch
1,285,292
0.01 0.01 0 489,103
0.00
client/application info
23,141
0.00 0 0
commit callback allocation
318 0.00 0 0
compile environment latch
332,465
0.00 0 0
dml lock allocation
733,715
0.06 0.00 0 0
dummy allocation
8,319 0.00 0 0
enqueue hash chains
10,235,029
0.08 0.00 0 3,437 0.00

enqueues
7,429,947
0.44 0.00 0 0
error message lists
18,944
0.00 0 0
event group latch
258 0.00 0 0
event range base latch
48 0.00 0 0
file cache latch
1,583 0.00 0 0
flashback FBA barrier
4 0.00 0 0
flashback SCN barrier
8 0.00 0 0
flashback allocation
301,434
0.06 0.00 0 0
flashback copy
16 0.00 0 235,944
0.31
flashback hint SCN barrier
4 0.00 0 0
flashback mapping
30,502
0.00 0.00 0 0
flashback sync request
129,872
0.02 0.00 0 0
gcs drop object freelist
3,024 0.50 0.00 0 0
gcs opaque info freelist
832,384
0.04 0.00 0 0
gcs partitioned table
13,715,159
0.00 0 0

hash
gcs remastering latch
1,160,684
0.00 4.17 0 0
gcs resource freelist
347,971
0.18 0.00 0 288,396
0.00
gcs resource hash
6,203,587
0.20 0.00 0 2,285 0.04
gcs resource scan list
4,575 0.00 0 0
gcs shadows freelist
420,850
0.00 0 468,638
0.00
ges caches resource lists
283,906
0.02 0.00 0 109,458
0.05
ges deadlock list
1,696 0.00 0 1 0.00
ges domain table
1,437,212
0.00 0.00 0 0
ges enqueue table freelist
1,618,102
0.01 0.00 0 0
ges group table
2,135,557
0.01 0.00 0 0
ges process hash list
24,864
0.00 0 9 0.00
ges process parent latch
3,352,558
0.00 0 0
ges process table freelist
457 0.00 0 0

ges resource hash list
2,293,659
0.10 0.04 0 100,309
0.06
ges resource scan list
12,067
0.00 0 0
ges resource table freelist
40,773
0.00 0 36 0.00
ges synchronous data
128 2.34 0.00 0 8,571 0.06
ges timeout list
50,552
0.01 0.00 0 73,098
0.00
global KZLD latch for mem in SGA
225 0.00 0 0
global tx hash mapping
3,855,042
0.00 0.00 0 16 0.00
hash table column usage latch
1,272 0.00 0 210,974
0.00
hash table modification latch
175 0.00 0 2 0.00
hint flashback FBA barrier
4 0.00 0 0
job workq parent latch
0 0 8 0.00
job_queue_processes free list latch
1 0.00 0 2 0.00

job_queue_processes parameter latch
126 0.00 0 0
kks stats
11,522
0.00 0 0
krbmrosl
27 0.00 0 0
ksuosstats global area
486 0.00 0 0
ksv instance
7 0.00 0 0
ktm global data
160 0.00 0 0
kwqbsn:qsga
256 0.00 0 0
lgwr LWN SCN
233,353
0.00 0.00 0 0
library cache
13,723,984
0.26 0.00 0 11,716
0.15
library cache load lock
7,080 0.00 0 0
library cache lock
4,841,397
0.02 0.00 0 0
library cache lock allocation
17,618
0.00 0 0
library cache pin
6,389,051
0.06 0.00 0 0
library cache pin allocation
2,677 0.00 0 0
list of block allocation
8,164 0.00 0 0
loader state object freelist
257,274
0.01 0.00 0 0
message pool
24,972
0.00 0 0
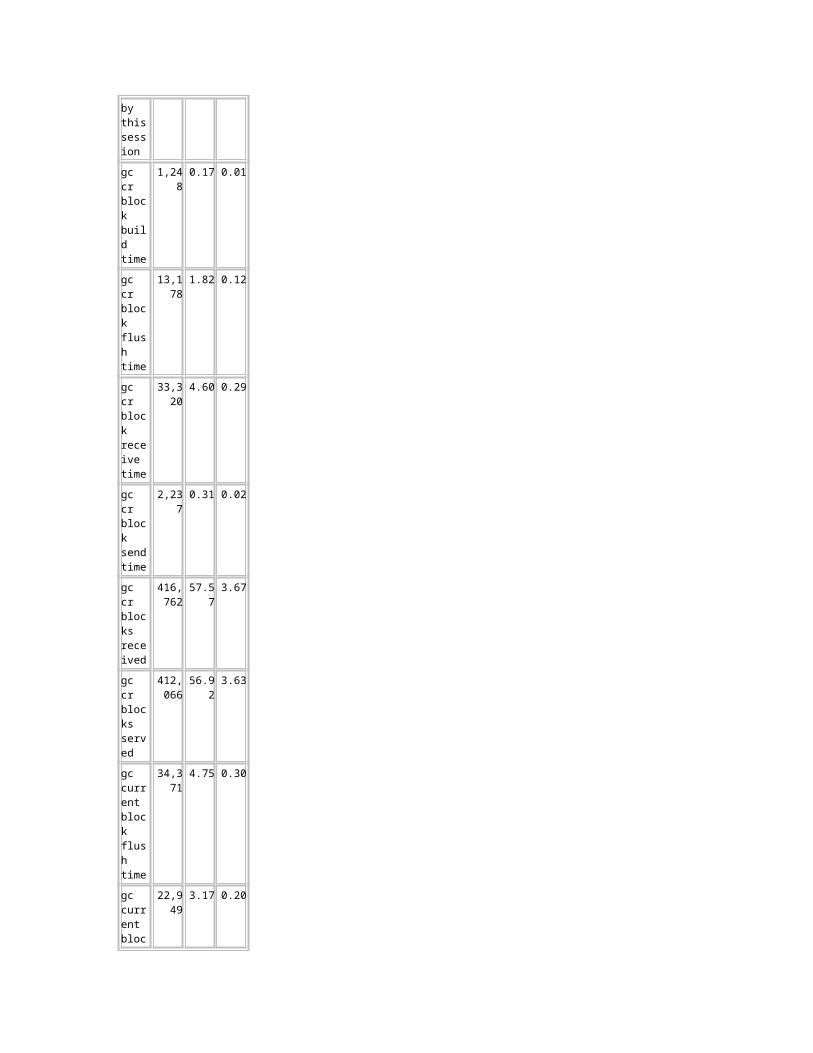
operations parent latch
messages
1,715,556
0.20 0.00 0 0
mostly latch-free SCN
239,261
0.57 0.00 0 0
msg queue
362 0.00 0 362 0.00
multiblock read objects
878,226
0.05 0.00 0 2 0.00
name-service memory objects
61,600
0.00 0 4 0.00
name-service namespace bucket
101,980
0.00 0 0
name-service namespace objects
0 0 2 0.00
name-service pending queue
29,904
0.00 0 0
name-service request
6 0.00 0 0
name-service request queue
103,248
0.00 0.00 0 0
ncodef
129 0.00 0 0
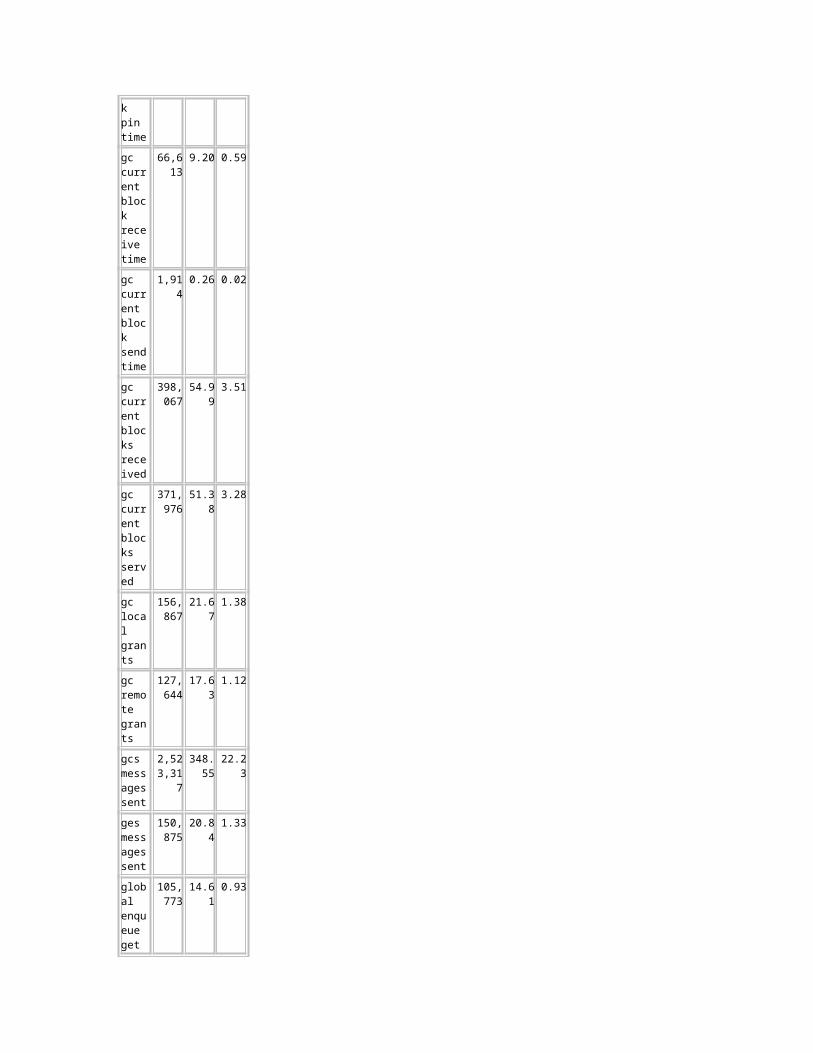
allocation latch
object queue header heap
124,948
0.00 0 2,632 0.00
object queue header operation
6,092,808
0.01 0.01 0 0
object stats modification
297 0.00 0 4 0.00
parallel query alloc buffer
78,966
0.00 0.00 0 0
parallel query stats
15,115
0.00 0 0
parallel txn reco latch
4,394 0.00 0 0
parameter list
2,970 0.00 0 0
parameter table allocation management
7,513 0.00 0 0
post/wait queue
592,883
0.12 0.00 0 284,059
0.02
process allocation
55,487
0.00 0 258 0.00
process group creation
457 0.00 0 0
process queue
42,849
0.00 0 0
process queue reference
680,353
0.00 0.00 0 65,245
0.04

qmn state object latch
10 0.00 0 0
qmn task queue latch
1,081 0.00 0 0
query server freelists
35,062
0.00 0 0
query server process
1 0.00 0 1 0.00
queued dump request
34,335
0.00 0 0
redo allocation
700,178
0.55 0.00 0 5,166,750
0.44
redo copy
128 0.00 0 5,172,699
0.08
redo writing
790,176
0.07 0.00 0 0
reservation so alloc latch
52 0.00 0 0
resmgr group change latch
10,103
0.00 0 0
resmgr:actses active list
9,775 0.00 0 0
resmgr:actses change group
7,126 0.00 0 0
resmgr:free threads list
8,299 0.00 0 0
resmgr:schema config
2 0.00 0 0
row cache object
9,532,391
0.11 0.00 0 4,345 0.07
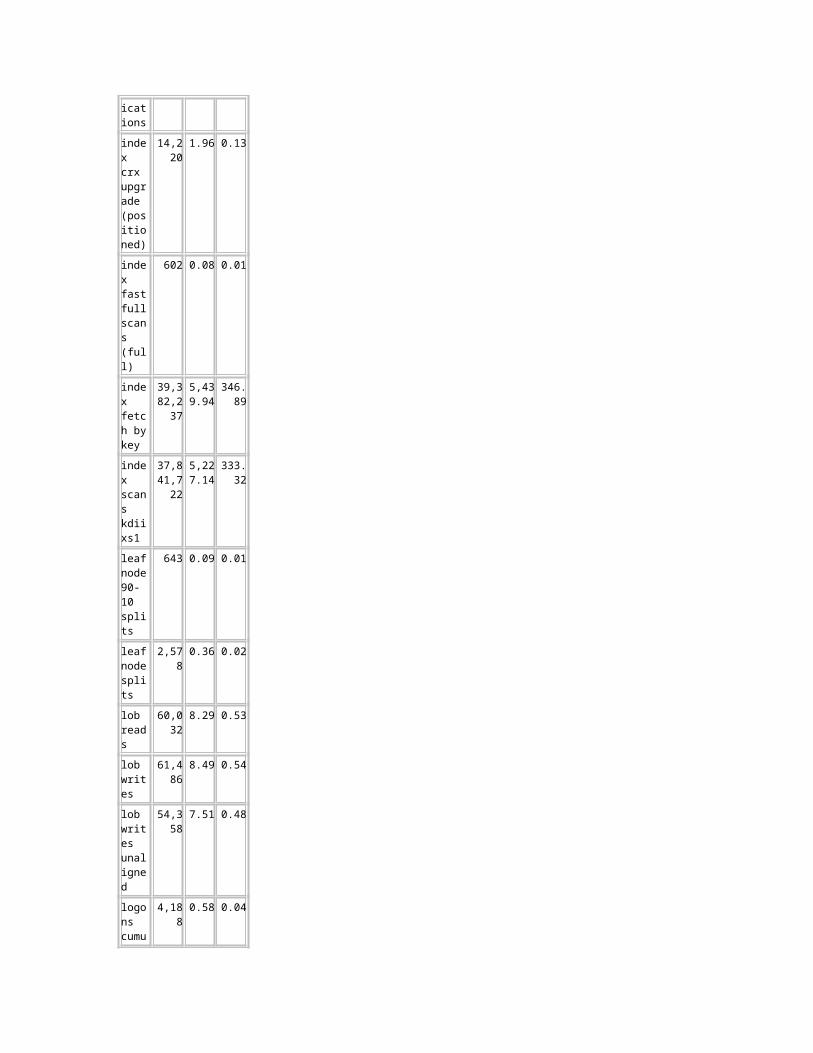
s
rules engine aggregate statistics
38 0.00 0 0
rules engine evaluation context statistics
0 0 2 0.00
rules engine rule set statistics
76 0.00 0 0
segmented array pool
226 0.00 0 0
sequence cache
364,089
0.12 0.00 0 0
session allocation
1,295,582
0.06 0.00 0 0
session idle bit
8,149,536
0.01 0.00 0 0
session state list latch
8,327 0.00 0 0
session switching
129 0.00 0 0
session timer
2,678 0.00 0 0
shared pool
2,191,171
0.05 0.01 0 0
shared pool sim alloc
153 0.00 0 0
shared pool simulator
838,774
0.00 0 0
simulator
16,494,092
0.00 0.01 0 0
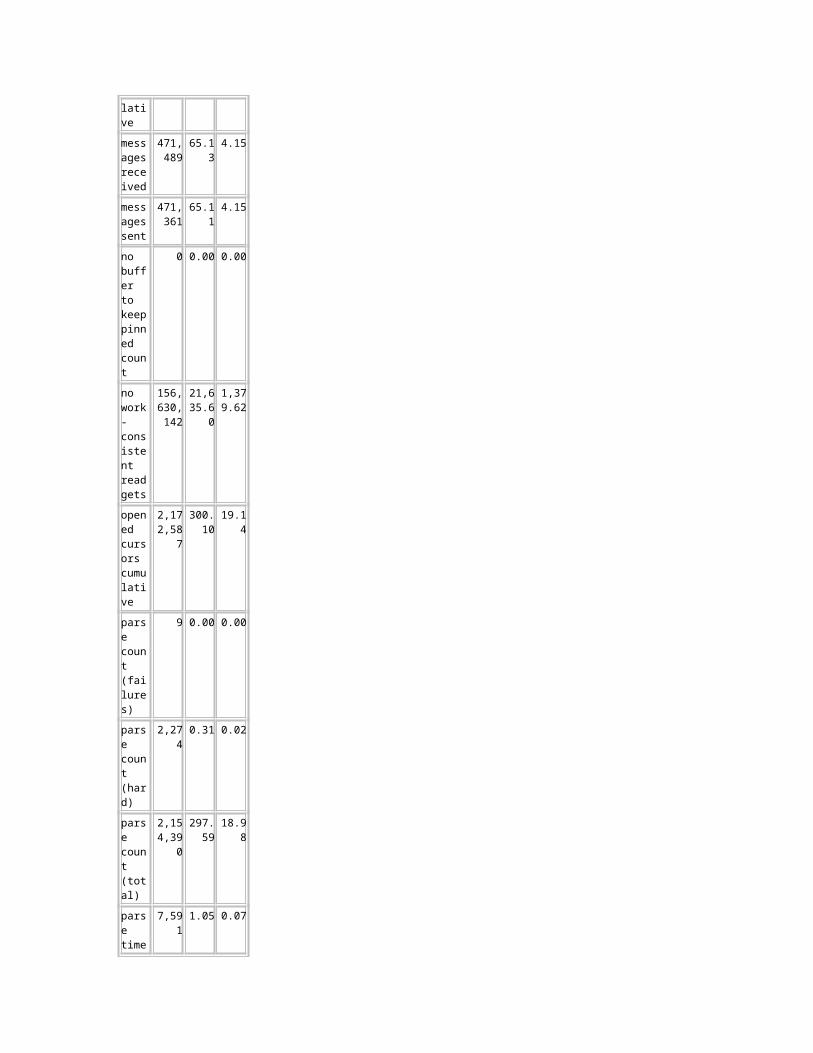
hash latch
simulator lru latch
16,293,080
0.23 0.00 0 156,404
0.01
slave class
1,098 0.00 0 2 0.00
slave class create
788 0.25 1.00 0 0
sort extent pool
990 0.20 0.00 0 0
state object free list
4 0.00 0 0
statistics aggregation
336 0.00 0 0
temp lob duration state obj allocation
121 0.00 0 0
threshold alerts latch
1,143 0.00 0 0
trace latch
71 0.00 0 0
transaction allocation
837 0.00 0 0
transaction branch allocation
3,688,639
0.19 0.00 0 0
undo global data
6,107,086
0.02 0.00 0 40 0.00
user lock
804 0.00 0 0
Back to Latch Statistics Back to Top
Latch Sleep Breakdown ordered by misses desc
Latch
Nam
Get Request
Misses
Sleeps
Spin Gets
Sleep1
Sleep2
Sleep3
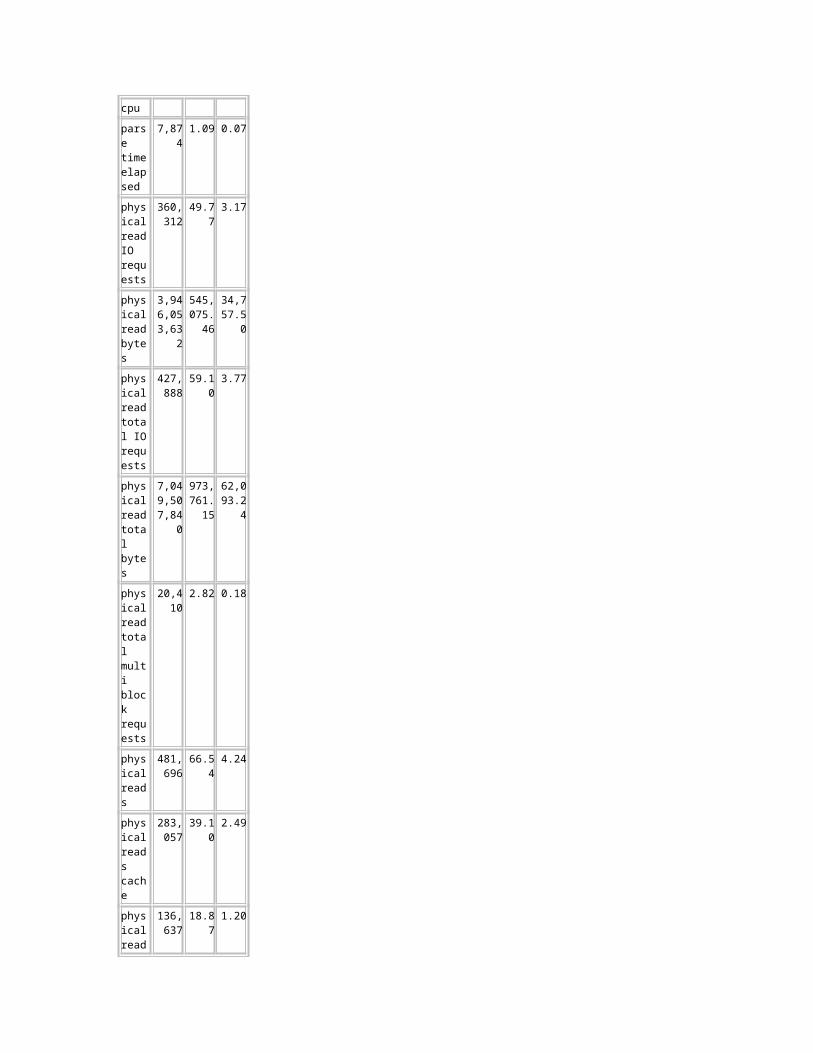
e s
cache buffers chains
490,993,08
5
200,803
4,857 196,192
0 0 0
simulator lru latch
16,293,080
38,116
31 38,085
0 0 0
library cache
13,723,984
36,326
18 36,308
0 0 0
enqueues
7,429,947
32,933
24 32,909
0 0 0
gcs resource hash
6,203,587
12,318
47 12,272
0 0 0
row cache objects
9,532,391
10,432
14 10,418
0 0 0
enqueue hash chains
10,235,029
7,897 8 7,889 0 0 0
transaction branch allocation
3,688,639
7,187 2 7,185 0 0 0
library cache pin
6,389,051
3,910 3 3,907 0 0 0
redo allocation
700,178
3,850 3 3,847 0 0 0
cache buffers lru chain
4,694,571
3,807 2 3,805 0 0 0
messages
1,715,556
3,361 1 3,360 0 0 0
KCL gc element parent latch
9,229,849
2,780 141 2,639 0 0 0
ges resource hash list
2,293,659
2,344 85 2,259 0 0 0
mostly latch-free SCN
239,261
1,359 2 1,357 0 0 0
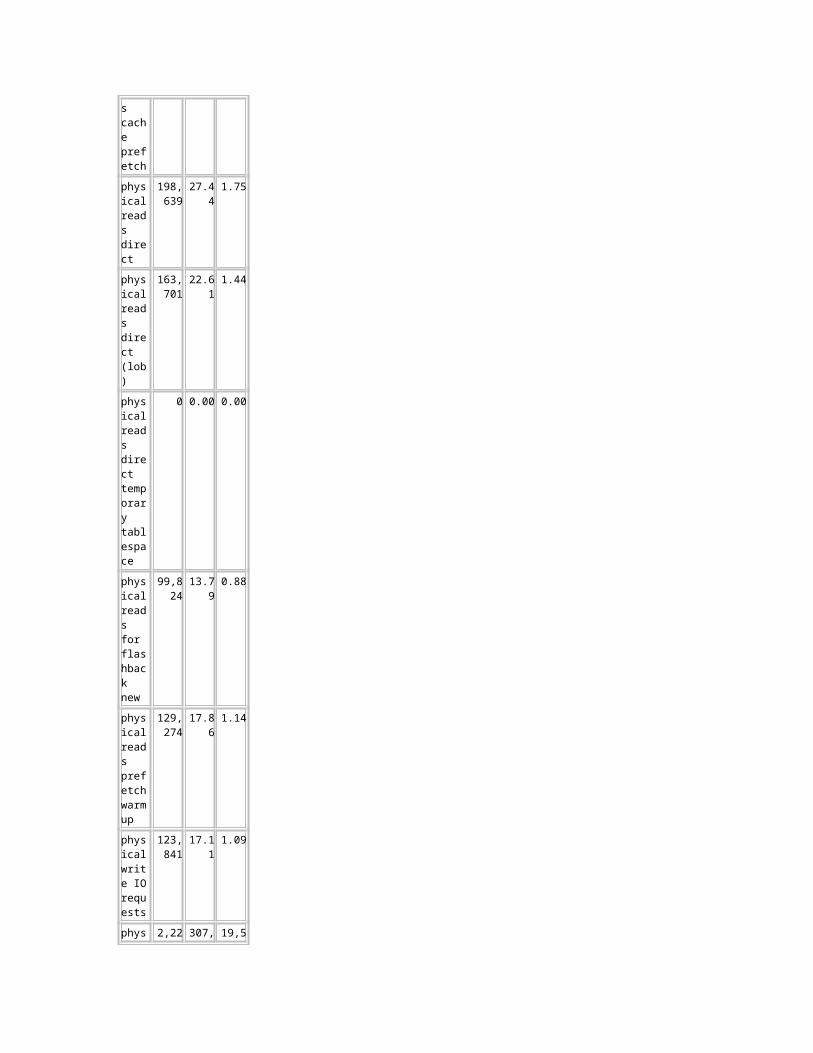
shared pool
2,191,171
1,107 15 1,092 0 0 0
undo global data
6,107,086
938 2 936 0 0 0
object queue header operation
6,092,808
897 5 893 0 0 0
session allocation
1,295,582
738 2 736 0 0 0
session idle bit
8,149,536
539 2 537 0 0 0
multiblock read objects
878,226
441 1 440 0 0 0
dml lock allocation
733,715
423 1 422 0 0 0
KJC message pool free list
523,173
287 1 286 0 0 0
simulator hash latch
16,494,092
230 2 228 0 0 0
checkpoint queue latch
1,285,292
137 1 136 0 0 0
gcs remastering latch
1,160,684
6 25 4 0 0 0
slave class create
788 2 2 0 0 0 0
Back to Latch Statistics Back to Top
Latch Miss Sources only latches with sleeps are shown ordered by name, sleeps desc
Latch
Name
Where
NoWait Miss
es
Sleeps
Waiter
Sleeps
KCL kclbla 0 258 5
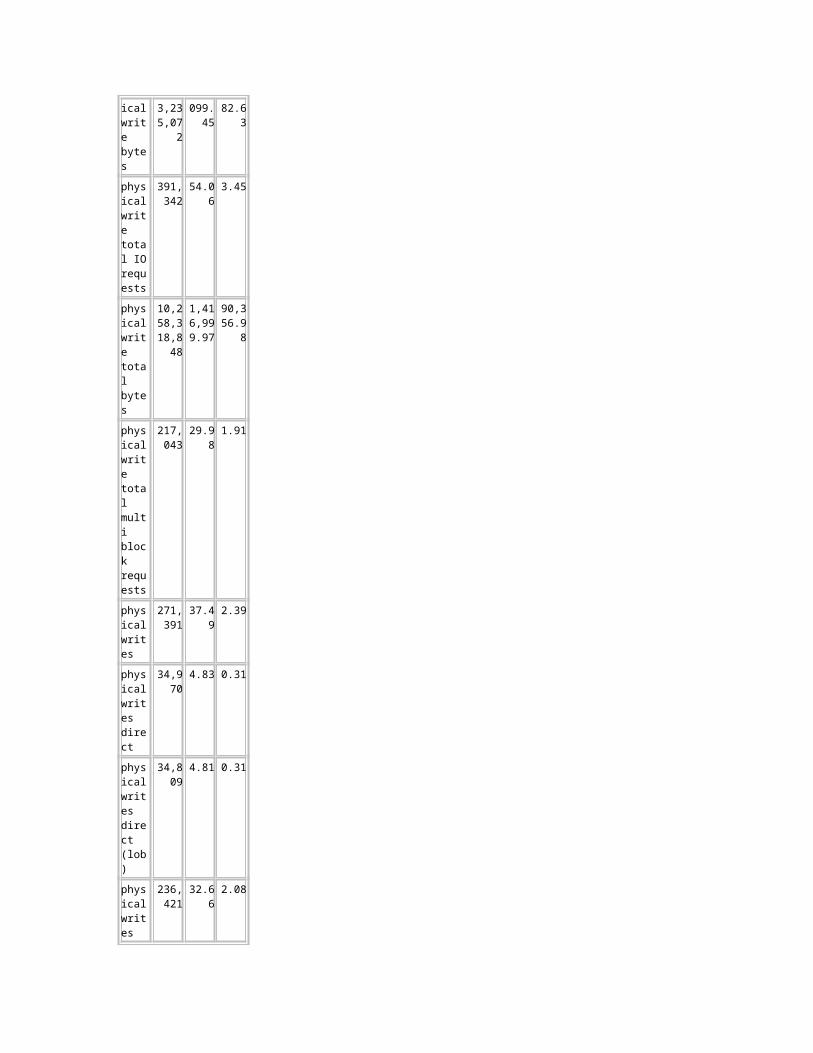
gc element parent latch
KCL gc element parent latch
kclliter
0 27 3
KCL gc element parent latch
kclpto 0 21 2
KCL gc element parent latch
kclnfndnewm
0 20 105
KCL gc element parent latch
kclgcr 0 19 2
KCL gc element parent latch
kclpto_3
0 14 0
KCL gc element parent latch
kclchkping
0 11 1
KCL gc element parent latch
kclfwrite1
0 7 5
KCL gc element parent latch
kcldrop
0 6 0
KCL gc element parent latch
KCLUNLNK
0 4 133
KCL gc element paren
kclrwrite
0 3 13

t latch
KCL gc element parent latch
kclfwrite2
0 1 0
KCL gc element parent latch
kclgrantlk
0 1 2
KCL gc element parent latch
kclnfnd
0 1 2
KCL gc element parent latch
kclpto_1
0 1 0
KCL gc element parent latch
kclulb 0 1 101
KCL gc element parent latch
kclwrt 0 1 1
KJC message pool free list
kjcspfmbq: free vector of msg buffers
0 1 0
cache buffers chains
kcbchg: kslbegin: bufs not pinned
0 3,633 2,844
cache buffers chains
kcbzwb
0 2,975 1,678
cache buffers chains
kcbgtcr: kslbegin excl
0 2,421 1,307
cache kcbgt 0 1,252 1,006

buffers chains
cr: fast path
cache buffers chains
kcbget: pin buffer
0 608 570
cache buffers chains
kcbgcur: kslbegin
0 524 352
cache buffers chains
kcbrls: kslbegin
0 119 1,974
cache buffers chains
kclbla 0 88 13
cache buffers chains
kcbget: exchange
0 67 58
cache buffers chains
kcbget: exchange rls
0 51 38
cache buffers chains
kcbgtcr: kslbegin shared
0 45 34
cache buffers chains
kcbsod1
0 26 48
cache buffers chains
kcbchg: kslbegin: call CR func
0 23 1,446
cache buffers chains
kclpto 0 21 0
cache buffers chains
kclwcrs
0 18 23
cache kcbgc 0 17 15

buffers chains
ur: buf pinned
cache buffers chains
kcbzib: multi-block read: nowait
0 13 0
cache buffers chains
kclfpdb
0 11 0
cache buffers chains
kcbgtcr
0 10 6
cache buffers chains
kclebs_1
0 8 3
cache buffers chains
kcbesc: escalate
0 5 2
cache buffers chains
kcbgkcbcr
0 5 163
cache buffers chains
kcbzgb: scan from tail. nowait
0 5 0
cache buffers chains
kclwlr 0 5 6
cache buffers chains
kcbzib: finish free bufs
0 4 64
cache buffers chains
kclpred
0 4 0
cache buffers chains
kcbbxsv
0 2 2

cache buffers chains
kcbcge
0 2 88
cache buffers chains
kcbso1: set no access
0 2 2
cache buffers chains
kclpto_1
0 2 29
cache buffers chains
kclwrt 0 2 0
cache buffers chains
kcbnlc
0 1 50
cache buffers chains
kcbzib: exchange rls
0 1 1
cache buffers chains
kclcsr 0 1 41
cache buffers chains
kclcsr_1
0 1 0
cache buffers chains
kclexpand
0 1 0
cache buffers chains
kclpdc_4
0 1 9
cache buffers lru chain
kcbzgb: posted for free bufs
0 1 1
cache buffers lru chain
kcbzib
0 1 1
checkpoint queue
kcbkubc
0 1 1

latch
dml lock allocation
ktaiam
0 1 1
enqueue hash chains
ksqrcl 0 4 3
enqueue hash chains
ksqcmi: if lk mode not requested
0 2 1
enqueue hash chains
ksqcmi: if lk mode requested
0 1 2
enqueue hash chains
ksqgtl3
0 1 2
enqueues
ksqgel: create enqueue
0 15 13
enqueues
ksqdel
0 9 9
gcs remastering latch
59 0 25 0
gcs remastering latch
42 0 1 0
gcs resource hash
kjbassume
0 21 2
gcs resource hash
kjbcrcomplete
0 17 1
gcs resource hash
kjbmdowncvt
0 3 0
gcs resource hash
kclzcl 0 1 1
gcs resource
kjbcrconvert
0 1 2

hash
gcs resource hash
kjbldrmrpst
0 1 0
gcs resource hash
kjbmpcreatepi
0 1 3
gcs resource hash
kjbmpopen
0 1 2
gcs resource hash
kjbopen:affinity
0 1 0
ges resource hash list
kjrmas1: lookup master node
0 55 9
ges resource hash list
kjlrlr: remove lock from resource queue
0 27 28
ges resource hash list
kjrref: find matched resource
0 2 47
ges resource hash list
kjucvl: lock convert request
0 1 1
lgwr LWN SCN
kcs023
0 1 0
library cache
kglpndl: child: after processing
0 8 5
library cache
kglobpn: child:
0 7 6
library cache
kglpnp: child
0 3 4
library cache pin
kglpnp: child
0 2 3
library kglpn 0 1 0
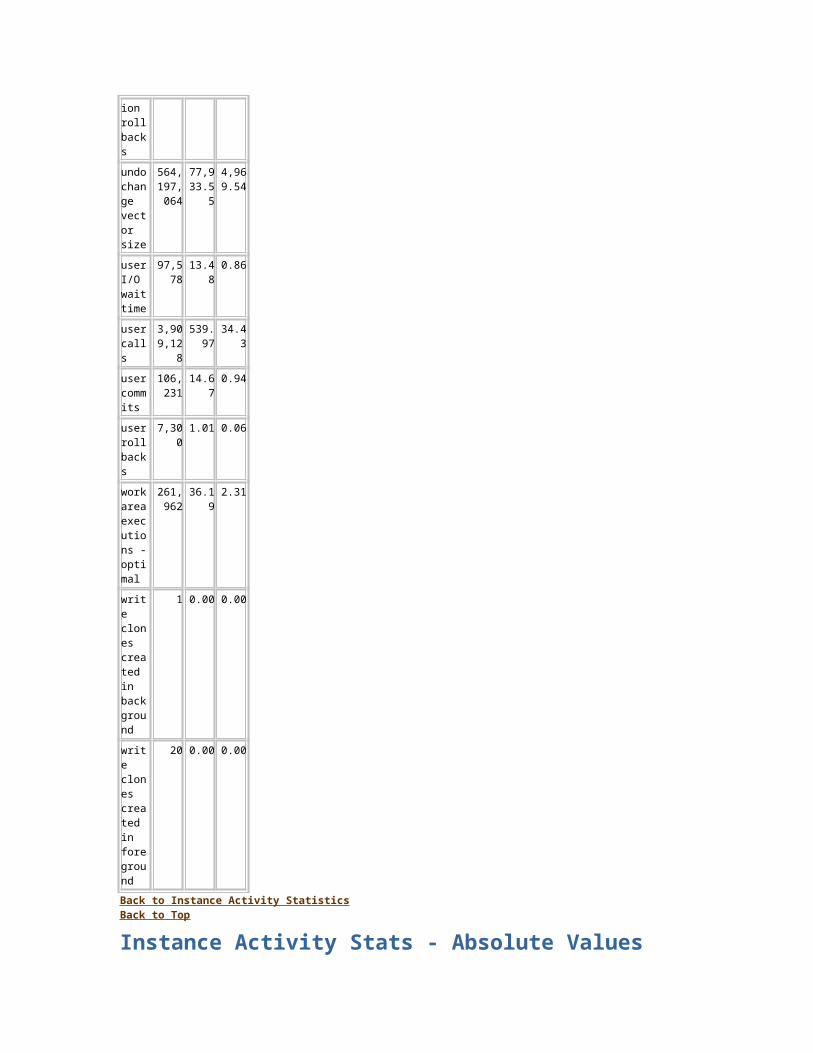
cache pin
dl
messages
ksaamb: after wakeup
0 1 0
mostly latch-free SCN
kcslcu3
0 1 2
multiblock read objects
kcbzib: normal mbr free
0 1 0
object queue header operation
kcbw_unlink_q
0 3 1
object queue header operation
kcbo_switch_cq
0 1 1
object queue header operation
kcbo_switch_q_bg
0 1 1
object queue header operation
kcbw_link_q
0 1 0
object queue header operation
kcbw_unlink_q_bg
0 1 2
redo allocation
kcrfw_redo_gen: redo allocation 2
0 2 0
redo allocation
kcrfw_redo_gen: redo allocation 1
0 1 0
row cache objects
kqreqd: reget
0 10 2

row cache objects
kqreqd
0 3 4
row cache objects
kqrpre: find obj
0 1 8
session allocation
ksuxds: KSUSFCLC not set
0 1 0
session allocation
ksuxds: not user session
0 1 0
session idle bit
ksupuc: clear busy
0 2 2
shared pool
kghalo
0 14 6
shared pool
kghfrunp: alloc: wait
0 1 0
simulator hash latch
kcbsacc: lookup dba
0 2 2
simulator lru latch
kcbs_simulate: simulate set
0 31 31
slave class create
ksvcreate
0 2 0
transaction branch allocation
ktcdbr 0 2 0
undo global data
kturimugur: child
0 2 0
Back to Latch Statistics Back to Top
Parent Latch StatisticsNo data exists for this section of the report.
Back to Latch Statistics Back to Top
Child Latch Statistics

No data exists for this section of the report.
Back to Latch Statistics Back to Top
Segment Statistics Segments by Logical Reads Segments by Physical Reads Segments by Row Lock Waits Segments by ITL Waits Segments by Buffer Busy Waits Segments by Global Cache Buffer Busy Segments by CR Blocks Received Segments by Current Blocks Received
Back to Top
Segments by Logical Reads Total Logical Reads: 289,248,606 Captured Segments account for 97.4% of Total
Owner
Tablespace Nam
e
Object
Name
Subobje
ct Nam
e
Obj. Typ
e
Logical Reads
%Total
HEAD BLUE_M001_NTAB
MAILBOXITEM
TABLE
61,492,768
21.26
HEAD BLUE_AUTO_INDX
TC_POPULATION_PK
INDEX
47,590,704
16.45
HEAD BLUE_AUTO_INDX
SUBMESSAGE_ID_SYSID_PK
INDEX
37,856,080
13.09
HEAD BLUE_M008_NTAB
SUBMESSAGE
TABLE
34,077,984
11.78
HEAD BLUE_AUTO_INDX
RECIPIENT_PK
INDEX
31,660,112
10.95
Back to Segment Statistics Back to Top
Segments by Physical Reads Total Physical Reads: 481,696 Captured Segments account for 72.4% of Total
Owner
Tablespace Nam
e
Object
Name
Subobje
ct Nam
e
Obj. Typ
e
Physical Reads
%Total

HEAD BLUE_M064_CLOB
MESSAGECONTENTS_PLAINBODY
LOB 72,847
15.12
HEAD BLUE_M064_CLOB
MESSAGECONTENTS_BODY
LOB 71,883
14.92
HEAD BLUE_M008_NTAB
SUBMESSAGE
TABLE
48,229
10.01
HEAD BLUE_M001_NTAB
MAILBOXITEM
TABLE
36,035
7.48
HEAD BLUE_M008_NTAB
MESSAGECONTENTS
TABLE
30,501
6.33
Back to Segment Statistics Back to Top
Segments by Row Lock Waits % of Capture shows % of row lock waits for each top segment compared with total row lock waits for all segments captured by the Snapshot
Owner
Tablespace Nam
e
Object
Name
Subobje
ct Nam
e
Obj. Typ
e
Row Loc
k Wait
s
% of Capture
HEAD BLUE_AUTO_INDX
JMS_MESSAGES_DESTINATION_IB
INDEX
5,018 78.71
HEAD BLUE_M001_NTAB
SUBMESSAGERETENTION
TABLE
474 7.44
HEAD BLUE_AUTO_INDX
MAILBOXITEM_SUBMESSAGE
INDEX
159 2.49
HEAD BLUE_M001_NTAB
MAILBOXITEM
TABLE
114 1.79
HEAD BLUE SUB INDE 71 1.11

_AUTO_INDX
MESSAGERETENTION_EXP_I
X
Back to Segment Statistics Back to Top
Segments by ITL Waits % of Capture shows % of ITL waits for each top segment compared with total ITL waits for all segments captured by the Snapshot
Owner
Tablespace Nam
e
Object
Name
Subobje
ct Nam
e
Obj. Typ
e
ITL Wait
s
% of Capture
HEAD BLUE_AUTO_INDX
MESSAGECONTENTS_PK
INDEX
3 30.00
HEAD BLUE_AUTO_INDX
SUBMESSAGERETENTION_SUBMSID_PK
INDEX
2 20.00
HEAD BLUE_AUTO_INDX
SUBMESSAGE_MESSAGEID_SYSID_I
INDEX
1 10.00
Back to Segment Statistics Back to Top
Segments by Buffer Busy Waits % of Capture shows % of Buffer Busy Waits for each top segment compared with total Buffer Busy Waits for all segments captured by the Snapshot
Owner
Tablespace Nam
e
Object
Name
Subobje
ct Nam
e
Obj. Typ
e
Buffer
Busy
Waits
% of Capture
HEAD BLUE_AUTO_INDX
JMS_MESSAGES_DESTINATION_IB
INDEX
3,927 36.72
HEAD BLUE_M008_NT
COMPLIANCE_
TABLE
3,899 36.46

AB DETAILS
HEAD BLUE_AUTO_INDX
JMS_MESSAGES_TXID_TXOP_I
INDEX
588 5.50
HEAD BLUE_AUTO_INDX
MAILBOXITEM_SUBMESSAGE
INDEX
366 3.42
HEAD BLUE_AUTO_INDX
DRAFTREC_SUBMESSAGE_LIST_I
INDEX
200 1.87
Back to Segment Statistics Back to Top
Segments by Global Cache Buffer Busy % of Capture shows % of GC Buffer Busy for each top segment compared with GC Buffer Busy for all segments captured by the Snapshot
Owner
Tablespace Nam
e
Object
Name
Subobje
ct Nam
e
Obj. Typ
e
GC Buffer
Busy
% of Capture
HEAD BLUE_K064_NTAB
JMS_TRANSACTIONS
TABLE
3,072 15.29
HEAD BLUE_AUTO_INDX
JMS_MESSAGES_DESTINATION_IB
INDEX
2,457 12.23
HEAD BLUE_M008_NTAB
ATTACHMTCONTAINMENT_CNT_CNE_PK
INDEX
2,305 11.48
HEAD BLUE_AUTO_INDX
JMS_MESSAGES_TXID_TXOP_I
INDEX
2,062 10.27
HEAD BLUE_AUTO_INDX
SUBMESSAGE_ID_S
INDEX
1,765 8.79
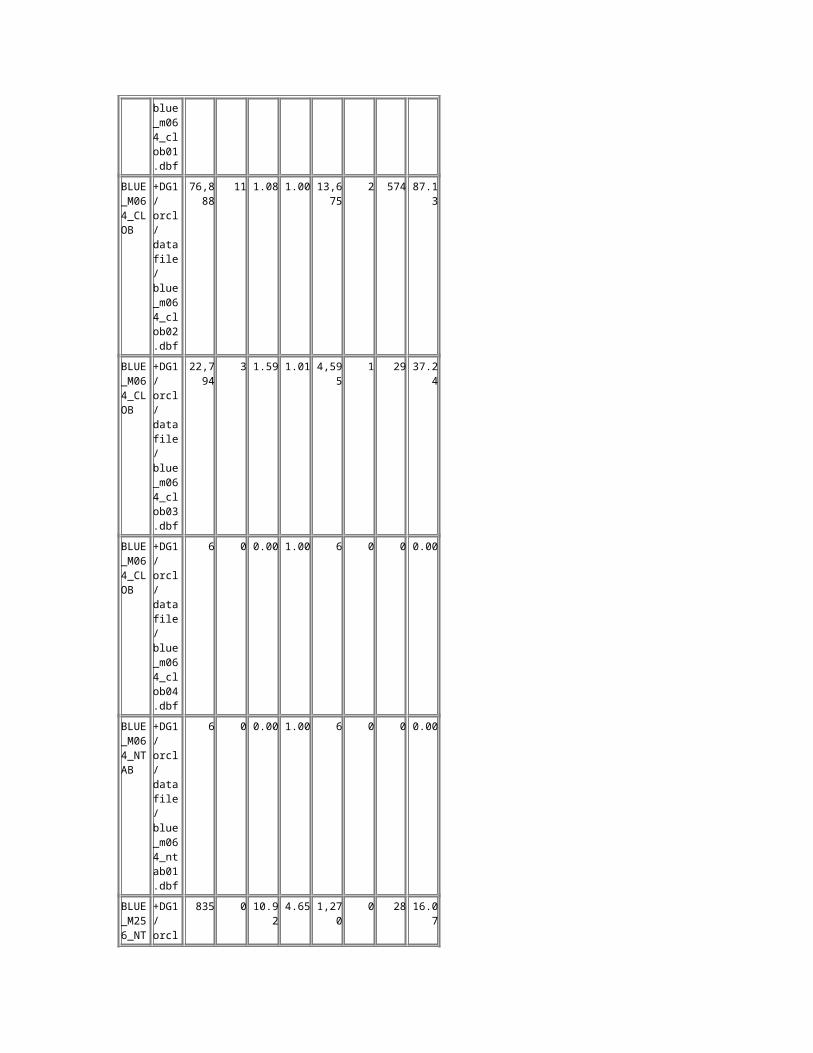
YSID_PK
Back to Segment Statistics Back to Top
Segments by CR Blocks Received Total CR Blocks Received: 416,762 Captured Segments account for 81.2% of Total
Owner
Tablespace Nam
e
Object
Name
Subobje
ct Nam
e
Obj. Typ
e
CR Blocks
Receive
d
%Total
HEAD BLUE_M001_NTAB
MAILBOXITEM
TABLE
68,827
16.51
HEAD BLUE_K064_NTAB
JMS_TRANSACTIONS
TABLE
31,658
7.60
HEAD BLUE_AUTO_INDX
MAILBOXITEM_MBID_OWN_DATES
INDEX
24,632
5.91
HEAD BLUE_AUTO_INDX
COMPLIANCE_DETAILS_PK
INDEX
23,853
5.72
HEAD BLUE_AUTO_INDX
MAILBOXITEM_MAILBOX_SUBMSG_PK
INDEX
23,786
5.71
Back to Segment Statistics Back to Top
Segments by Current Blocks Received Total Current Blocks Received: 398,067 Captured Segments account for 98.3% of Total
Owner
Tablespace Nam
e
Object
Name
Subobje
ct Nam
e
Obj. Typ
e
Current
Blocks
Receive
d
%Total
HEAD BLUE_M001_NT
MAILBOXITEM
TABLE
78,542
19.73

AB
HEAD BLUE_M008_NTAB
SUBMESSAGE
TABLE
43,571
10.95
HEAD BLUE_AUTO_INDX
MAILBOXITEM_MBID_OWN_DATES
INDEX
22,547
5.66
HEAD BLUE_AUTO_INDX
MAILBOXITEM_MAILBOX_SUBMSG_PK
INDEX
16,873
4.24
HEAD BLUE_AUTO_INDX
MAILBOXITEM_MBID_OWNER
INDEX
13,306
3.34
Back to Segment Statistics Back to Top
Dictionary Cache Statistics Dictionary Cache Stats Dictionary Cache Stats (RAC)
Back to Top
Dictionary Cache Stats "Pct Misses" should be very low (< 2% in most cases) "Final Usage" is the number of cache entries being used
Cache
Get Request
s
Pct Miss
Scan
Reqs
Pct Miss
Mod Req
s
Final
Usage
dc_awr_control
134 2.24 0 1 1
dc_global_oids
624,788
0.01 0 0 34
dc_histogram_data
53,443
4.49 0 0 844
dc_histogram_defs
88,078
5.53 0 0 1,388
dc_object_grants
415 19.28 0 0 18
dc_ob 1,120, 0.09 0 0 495

ject_ids
261
dc_objects
20,721
8.26 0 10 442
dc_profiles
233 0.00 0 0 1
dc_rollback_segments
246,934
0.00 0 0 171
dc_segments
102,128
1.19 0 15 383
dc_sequences
22,077
36.22 0 22,077
6
dc_tablespace_quotas
6 66.67 0 6 0
dc_tablespaces
87,219
0.00 0 0 20
dc_usernames
3,638 0.41 0 0 4
dc_users
734,624
0.00 0 0 45
outstanding_alerts
523 87.38 0 38 39
Back to Dictionary Cache Statistics Back to Top
Dictionary Cache Stats (RAC)
Cache
GES Request
s
GES Conflict
s
GES Releases
dc_awr_control
5 3 0
dc_global_oids
58 0 58
dc_histogram_defs
4,869 0 5,580
dc_object_ids
966 0 1,096
dc_objects
1,731 0 2,038
dc_rollback_segments
4 4 0
dc_se 1,239 3 1,374

gments
dc_sequences
41,283
7,989 5
dc_tablespace_quotas
12 0 4
dc_usernames
15 0 19
dc_users
9 0 5
outstanding_alerts
1,021 402 41
Back to Dictionary Cache Statistics Back to Top
Library Cache Statistics Library Cache Activity Library Cache Activity (RAC)
Back to Top
Library Cache Activity "Pct Misses" should be very low
Namespace
Get Request
s
Pct Miss
Pin Request
s
Pct Miss
Reloads
Invali-
dations
BODY
1,966 2.19 2,137,284
0.00 22 0
CLUSTER
60 1.67 125 4.00 4 0
INDEX
68 39.71 164 25.61 15 0
JAVA DATA
62 4.84 530 0.75 0 0
SQL AREA
2,837 76.07 4,521,556
0.14 585 30
TABLE/PROCEDURE
40,838
2.75 2,565,936
0.13 869 0
Back to Library Cache Statistics Back to Top
Library Cache Activity (RAC)
Namespace
GES Loc
k Request
s
GES Pin Request
s
GES Pin Releases
GES Inva
l Request
s
GES Inva
li- dations

CLUSTER
125 1 1 1 0
INDEX
164 27 58 27 0
TABLE/PROCEDURE
272,293
1,023 869 835 0
Back to Library Cache Statistics Back to Top
Memory Statistics Process Memory Summary SGA Memory Summary SGA breakdown difference
Back to Top
Process Memory Summary B: Begin snap E: End snap All rows below contain absolute values (i.e. not diffed over the interval) Max Alloc is Maximum PGA Allocation size at snapshot time Hist Max Alloc is the Historical Max Allocation for still-connected processes ordered by Begin/End snapshot, Alloc (MB) desc
Category
Alloc
(MB)
Used
(MB)
Avg Allo
c (MB)
Std Dev Allo
c (MB)
Max Allo
c (MB)
Hist Max Allo
c (MB)
Num Proc
Num Allo
c
B Other 328.41
6.44 7.69 26 26 51 51
Freeable
11.88 0.00 0.66 0.59 2 18 18
SQL 1.24 0.66 0.06 0.07 0 4 21 18
PL/SQL
0.39 0.21 0.01 0.01 0 0 49 47
E Other 758.77
6.90 5.83 26 41 110 110
JAVA 47.59 47.48 1.13 0.13 1 1 42 42
Freeable
47.25 0.00 0.76 0.49 3 62 62
SQL 8.56 4.83 0.11 0.39 4 6 80 66
PL/SQL
5.27 3.06 0.05 0.06 0 0 108 106
Back to Memory Statistics Back to Top
SGA Memory Summary
SGA regions
Begin
Size (Bytes)
End Size (Bytes) (if
different)
Database
5,653,921,7
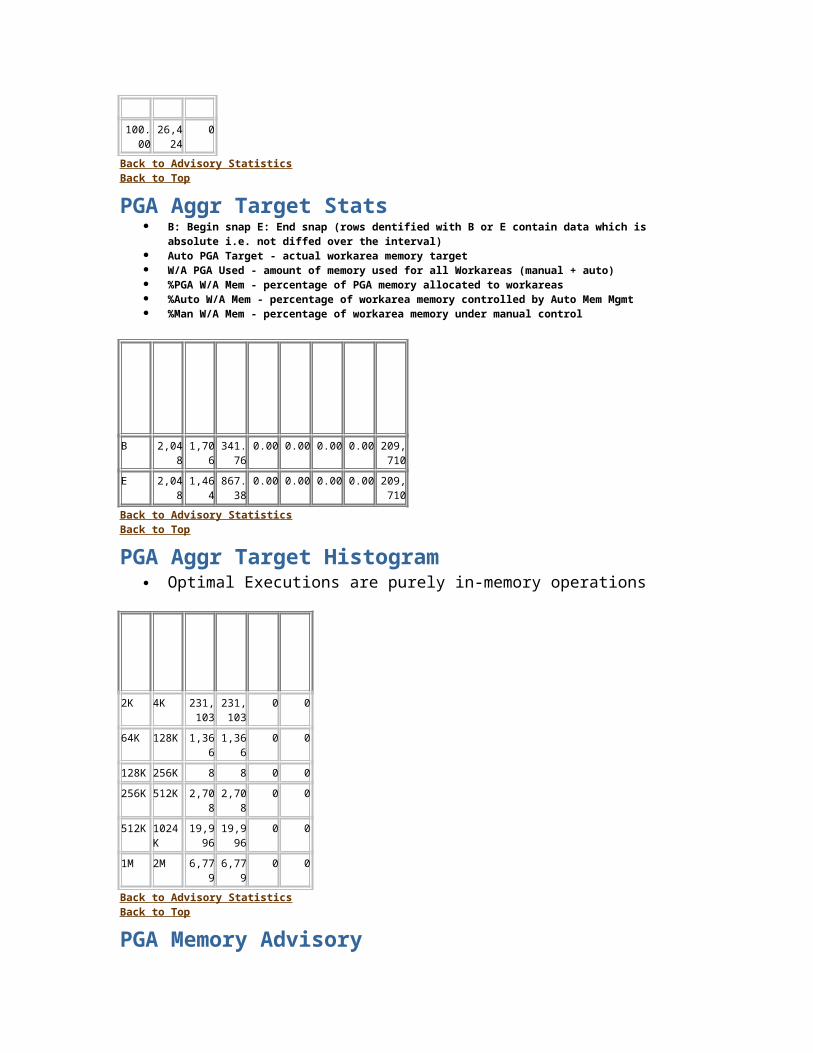
Buffers
92
Fixed Size
2,475,688
Redo Buffers
4,325,376
Variable Size
848,836,95
2
Back to Memory Statistics Back to Top
SGA breakdown difference ordered by Pool, Name N/A value for Begin MB or End MB indicates the size of that Pool/Name was
insignificant, or zero in that snapshot
Pool Name
Begin
MBEnd MB
% Diff
java free memory
64.00 58.56 -8.50
java joxlod exec hp
5.37
large ASM map operations hashta
0.38 0.38 0.00
large CTWR dba buffer
0.52 0.52 0.00
large PX msg pool
1.03 1.03 0.00
large free memory
12.08 12.08 0.00
large krcc extent chunk
2.00 2.00 0.00
shared
ASH buffers
29.00 29.00 0.00
shared
KCL name table
6.00 6.00 0.00
shared
dbwriter coalesce buffer
8.03 8.03 0.00
shared
event statistics
9.71 9.71 0.00
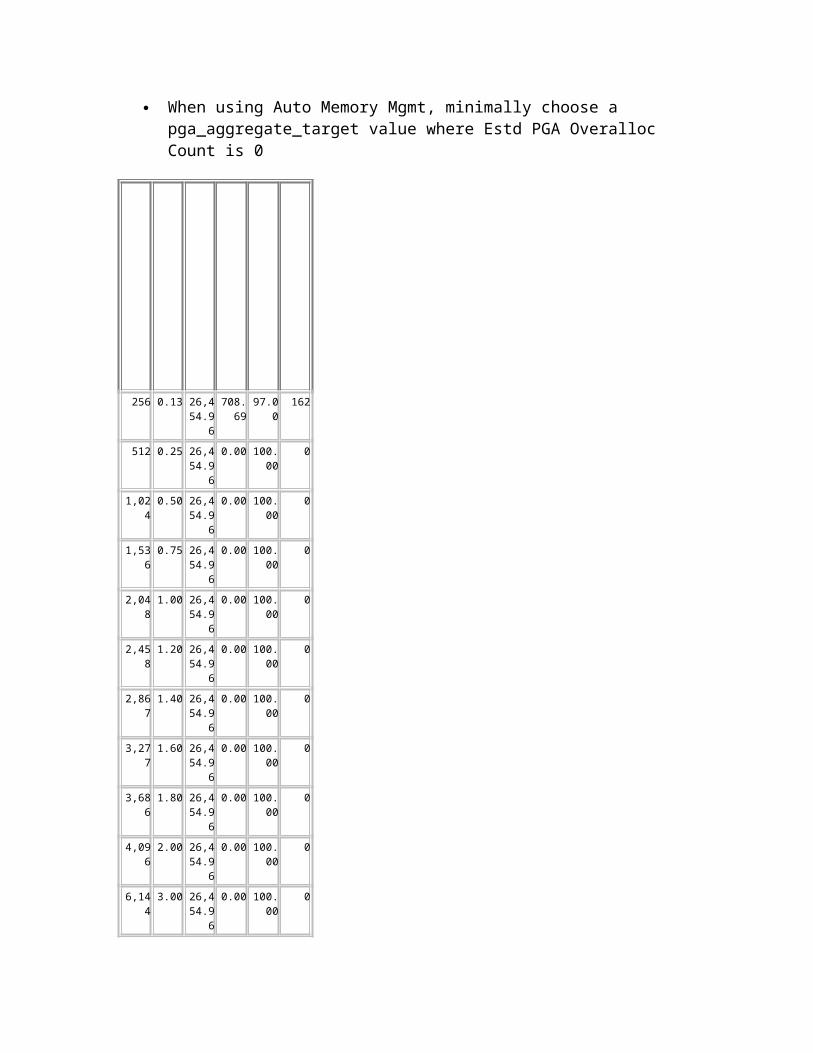
per sess
shared
flashback generation buff
15.04 15.04 0.00
shared
free memory
221.05
173.22
-21.64
shared
gcs resources
107.63
107.63
0.00
shared
gcs shadows
67.80 67.80 0.00
shared
ges big msg buffers
15.03 15.03 0.00
shared
ges reserved msg buffers
7.86 7.86 0.00
shared
library cache
8.12 13.88 70.85
shared
row cache
7.16 7.16 0.00
shared
sql area
13.04 50.64 288.28
buffer_cache
5,392.00
5,392.00
0.00
fixed_sga
2.36 2.36 0.00
log_buffer
4.13 4.13 0.00
Back to Memory Statistics Back to Top
Streams Statistics Streams CPU/IO Usage Streams Capture Streams Apply Buffered Queues Buffered Subscribers Rule Set
Back to Top
Streams CPU/IO UsageNo data exists for this section of the report.
Back to Streams Statistics Back to Top
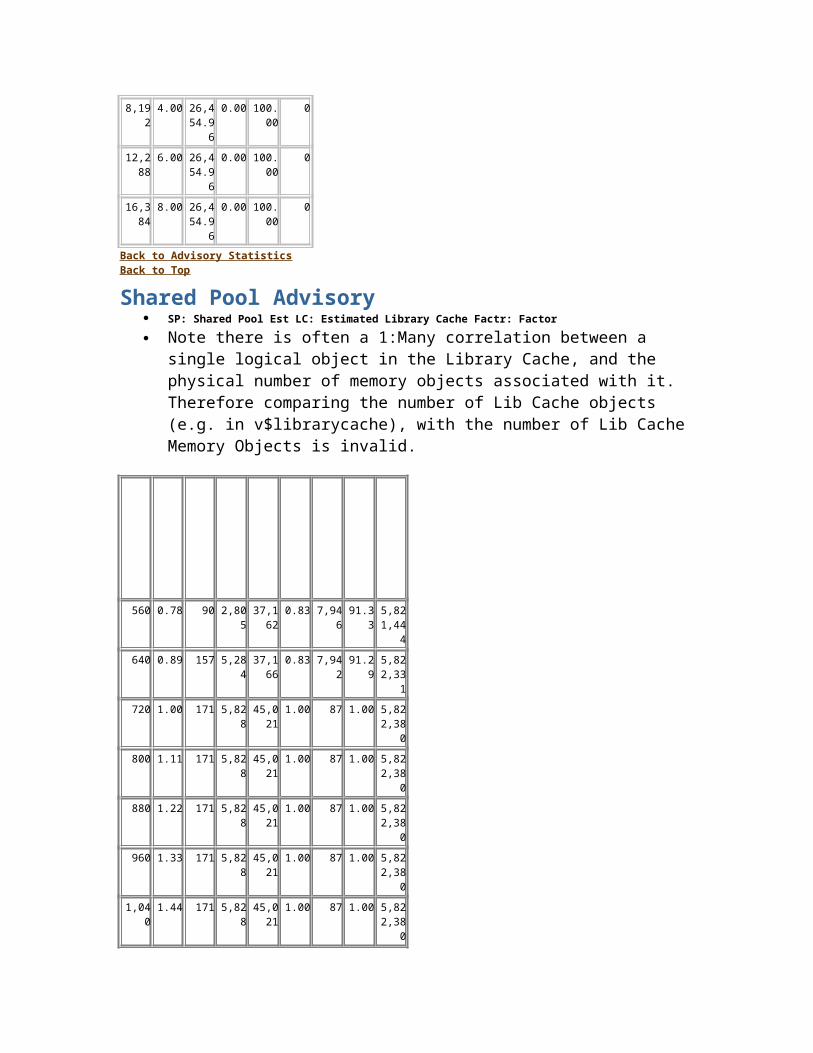
Streams CaptureNo data exists for this section of the report.
Back to Streams Statistics Back to Top
Streams ApplyNo data exists for this section of the report.
Back to Streams Statistics Back to Top
Buffered QueuesNo data exists for this section of the report.
Back to Streams Statistics Back to Top
Buffered SubscribersNo data exists for this section of the report.
Back to Streams Statistics Back to Top
Rule SetNo data exists for this section of the report.
Back to Streams Statistics Back to Top
Resource Limit Stats only rows with Current or Maximum Utilization > 80% of Limit are shown ordered by resource name
Resourc
e Nam
e
Current Utilization
Maximum
Utilization
Initial
Allocation
Limit
gcs_resources
532,428
715,626
732714
732714
gcs_shadows
573,405
718,880
732714
732714
Back to Top
init.ora ParametersPara Begi End

meter
Name
n valu
e
value (if different)
audit_file_dest
/u01/oracle/admin/orcl/adump
background_dump_dest
/u01/oracle/admin/orcl/bdump
cluster_database
TRUE
cluster_database_instances
2
compatible
10.2.0.3.0
control_files
+DG1/orcl/controlfile/current.260.670607423
core_dump_dest
/u01/oracle/admin/orcl/cdump
db_block_size
8192
db_create_file_dest
+DG1
db_domain
db_file_multiblock_read_count
16
db_flashback_retention_target
2880

db_name
orcl
db_recovery_file_dest
+DGFRA
db_recovery_file_dest_size
322122547200
dispatchers
(PROTOCOL=TCP) (SERVICE=orclXDB)
instance_number
1
job_queue_processes
10
log_archive_dest_1
log_archive_dest_10
location=use_db_recovery_file_dest
open_cursors
300
pga_aggregate_target
2147483648
processes
1000
remote_listener
LISTENERS_ORCL
remote_login_passwordfile
EXCLUSIVE
service_names
orcl, orcl_rac
sessions
1105
sga_target
6509559808
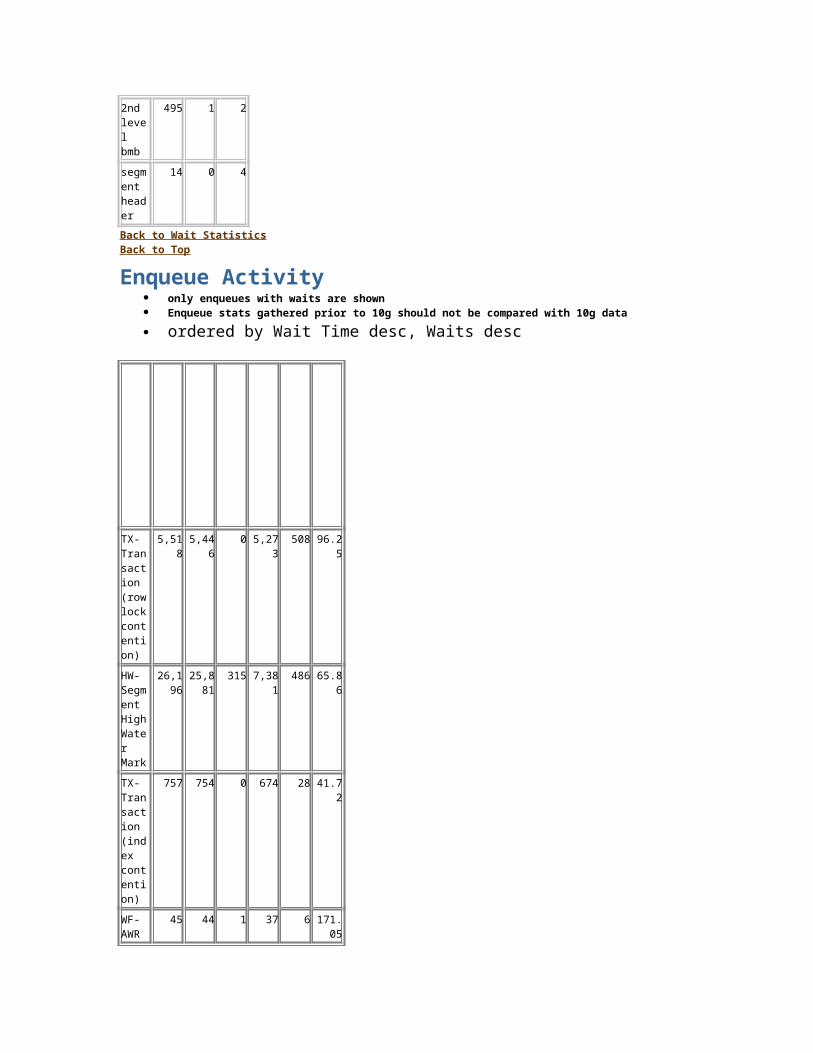
spfile +DG1/orcl/spfileorcl.ora
thread
1
undo_management
AUTO
undo_tablespace
UNDOTBS1
user_dump_dest
/u01/oracle/admin/orcl/udump
Back to Top
Global Enqueue StatisticsStatistic
Total
per Second
per Tran
s
acks for commit broadcast(actual)
313,739
43.34 2.76
acks for commit broadcast(logical)
358,547
49.53 3.16
broadcast msgs on commit(actual)
215,026
29.70 1.89
broadcast msgs on commit(logical)
217,288
30.01 1.91
broadcast msgs on commit(was
15,547
2.15 0.14

ted)
dynamically allocated gcs resources
0 0.00 0.00
dynamically allocated gcs shadows
0 0.00 0.00
false posts waiting for scn acks
0 0.00 0.00
flow control messages received
10 0.00 0.00
flow control messages sent
17 0.00 0.00
gcs assume cvt
0 0.00 0.00
gcs assume no cvt
186,465
25.76 1.64
gcs ast xid
82 0.01 0.00
gcs blocked converts
355,328
49.08 3.13
gcs blocked cr converts
420,882
58.14 3.71
gcs compatible basts
369 0.05 0.00
gcs comp
29,836
4.12 0.26
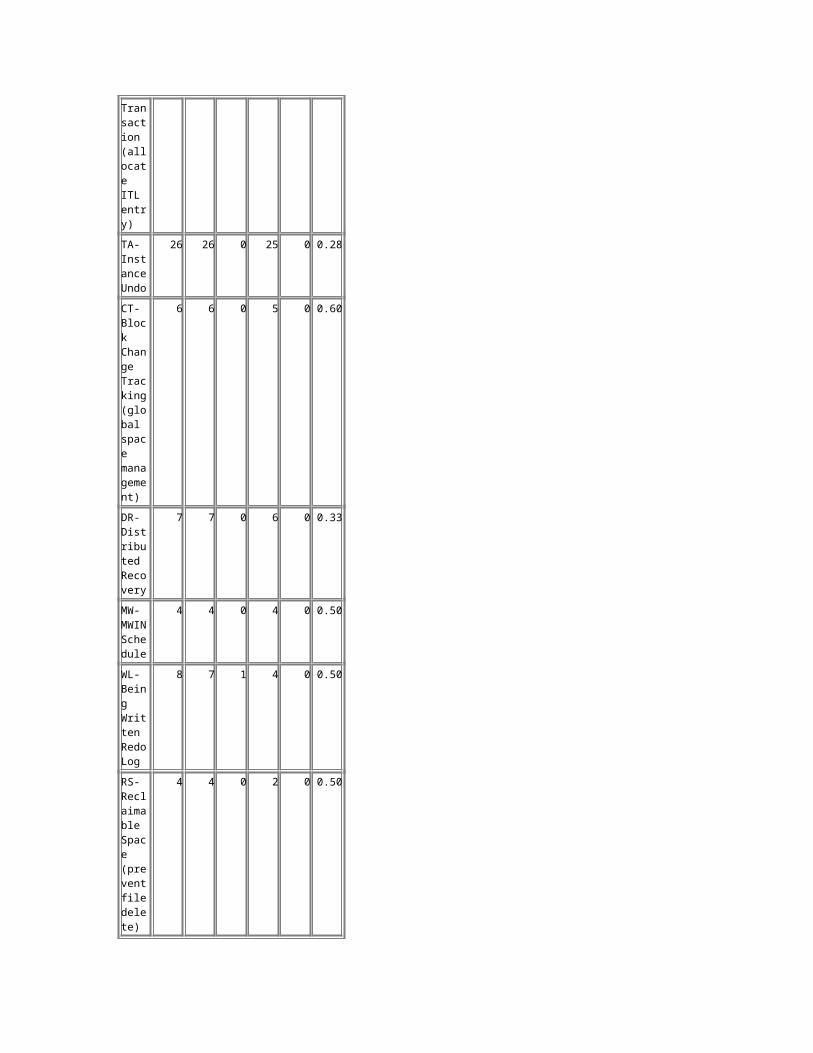
atible cr basts (global)
gcs compatible cr basts (local)
66,254
9.15 0.58
gcs cr basts to PIs
0 0.00 0.00
gcs cr serve without current lock
0 0.00 0.00
gcs dbwr flush pi msgs
35,877
4.96 0.32
gcs dbwr write request msgs
20,169
2.79 0.18
gcs error msgs
0 0.00 0.00
gcs forward cr to pinged instance
0 0.00 0.00
gcs immediate (compatible) converts
16,426
2.27 0.14
gcs immediate (null) converts
52,133
7.20 0.46
gcs immediate cr (compatible) converts
190 0.03 0.00
gcs 299,9 41.44 2.64

immediate cr (null) converts
98
gcs indirect ast
57,761
7.98 0.51
gcs lms flush pi msgs
0 0.00 0.00
gcs lms write request msgs
11,763
1.62 0.10
gcs msgs process time(ms)
98,046
13.54 0.86
gcs msgs received
2,669,347
368.72
23.51
gcs out-of-order msgs
0 0.00 0.00
gcs pings refused
410 0.06 0.00
gcs pkey conflicts retry
0 0.00 0.00
gcs queued converts
387 0.05 0.00
gcs recovery claim msgs
0 0.00 0.00
gcs refuse xid
54 0.01 0.00
gcs regular cr
0 0.00 0.00
gcs retry conve
125,067
17.28 1.10

rt request
gcs side channel msgs actual
6,298 0.87 0.06
gcs side channel msgs logical
853,633
117.91
7.52
gcs stale cr
3 0.00 0.00
gcs undo cr
13,263
1.83 0.12
gcs write notification msgs
2,973 0.41 0.03
gcs writes refused
203 0.03 0.00
ges msgs process time(ms)
3,685 0.51 0.03
ges msgs received
145,793
20.14 1.28
global posts dropped
0 0.00 0.00
global posts queue time
372 0.05 0.00
global posts queued
78 0.01 0.00
global posts requested
79 0.01 0.00
global posts sent
78 0.01 0.00
implicit
36,749
5.08 0.32
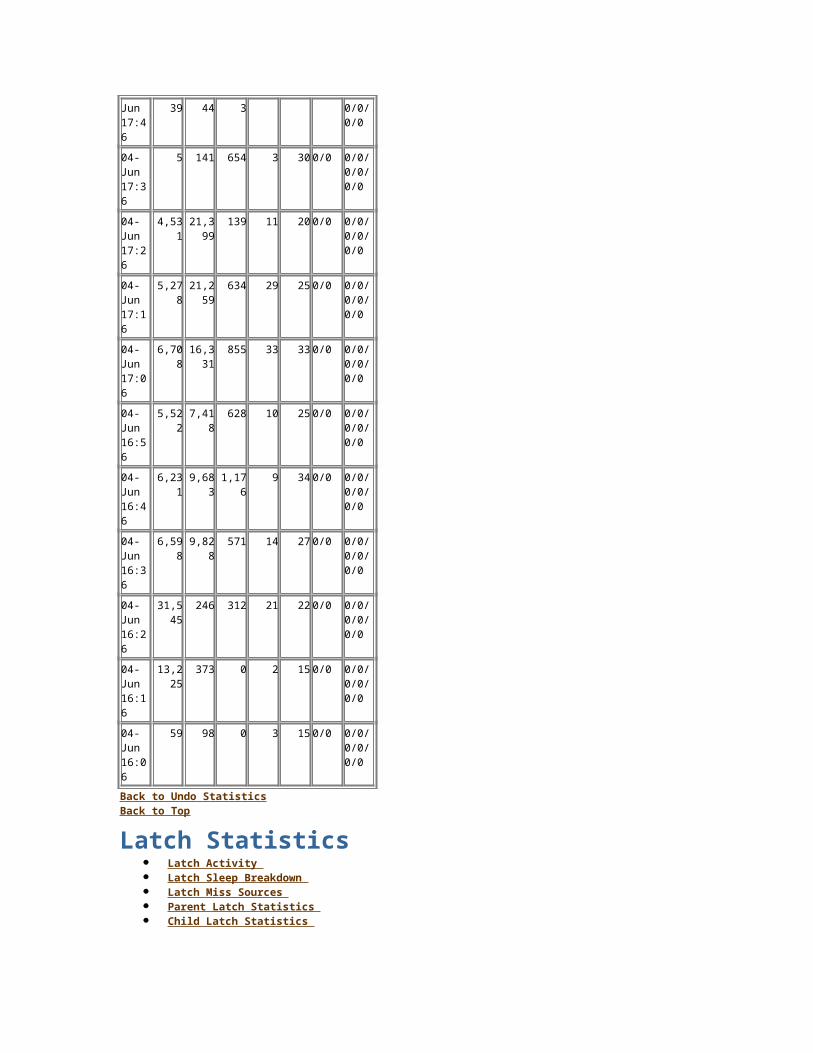
batch messages received
implicit batch messages sent
21,193
2.93 0.19
lmd msg send time(ms)
0 0.00 0.00
lms(s) msg send time(ms)
0 0.00 0.00
messages flow controlled
242,598
33.51 2.14
messages queue sent actual
443,057
61.20 3.90
messages queue sent logical
513,550
70.94 4.52
messages received actual
1,843,000
254.58
16.23
messages received logical
2,815,180
388.87
24.80
messages sent directly
714,134
98.64 6.29
messages sent indirectly
203,831
28.16 1.80
messages sent not implicit
421,864
58.27 3.72

batched
messages sent pbatched
1,636,197
226.01
14.41
msgs causing lmd to send msgs
60,705
8.39 0.53
msgs causing lms(s) to send msgs
457,624
63.21 4.03
msgs received queue time (ms)
339,892
46.95 2.99
msgs received queued
2,815,199
388.87
24.80
msgs sent queue time (ms)
31,464
4.35 0.28
msgs sent queue time on ksxp (ms)
550,849
76.09 4.85
msgs sent queued
509,802
70.42 4.49
msgs sent queued on ksxp
1,785,880
246.69
15.73
process batch messages received
605,629
83.66 5.33
process batch messages
814,791
112.55
7.18

sent
Back to Top
Global CR Served StatsStatistic
Total
CR Block Requests
332,603
CURRENT Block Requests
79,520
Data Block Requests
332,603
Undo Block Requests
13,263
TX Block Requests
59,375
Current Results
377,805
Private results
14,360
Zero Results
19,916
Disk Read Results
0
Fail Results
25
Fairness Down Converts
45,657
Fairness Clears
0
Free GC Elements
0
Flushes
52,563
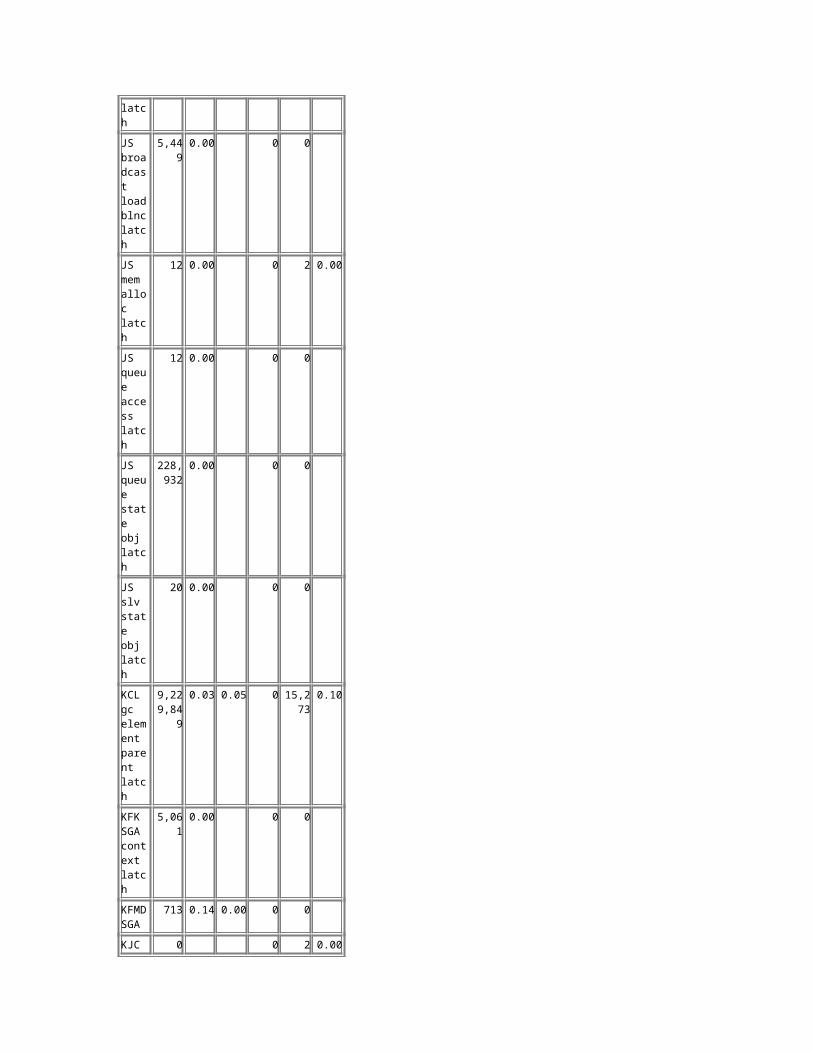
Flushes Queued
0
Flush Queue Full
0
Flush Max Time (us)
98,507
Light Works
21,734
Errors 0
Back to Top
Global CURRENT Served Stats Pins = CURRENT Block Pin Operations Flushes = Redo Flush before CURRENT Block Served Operations Writes = CURRENT Block Fusion Write Operations
Statistic
Total
% <1m
s
% <10ms
% <100ms
% <1s
% <10
s
Pins 371,965
98.39 0.03 1.58 0.00 0.00
Flushes
9,090 56.37 33.84 8.29 1.29 0.21
Writes
39,978
28.60 66.20 1.18 2.28 1.75
Back to Top
Global Cache Transfer Stats Immediate (Immed) - Block Transfer NOT impacted by Remote Processing Delays Busy (Busy) - Block Transfer impacted by Remote Contention Congested (Congst) - Block Transfer impacted by Remote System Load ordered by CR + Current Blocks Received desc
CR Current
Inst No
Block
Class
Blocks
Receive
d
% Immed
% Bus
y
% Congst
2 data block
333,013
85.55
14.45
0.00
363,242
96.69 3.31 0.00
2 undo header
62,5
94.5
5.45
0.00
1,843 92.24 7.76 0.00

24
5
2 Others
8,272
95.82
4.18
0.00
32,931
95.44 4.56 0.00
2 undo block
12,965
85.88
14.12
0.00
0
Back to Top
End of Report