
AW item reliability Adolescent - University of California...
45
Active Where? Individual Item Reliability Statistics Adolescent Survey (N = 120) Suggested citation: Joe L, Carlson JA, Sallis JF. Active Where? Individual item reliability statistics adolescent survey. http://www.drjamessallis.sdsu.edu/Documents/AW_item_reliability_Adolescent.pdf
Transcript of AW item reliability Adolescent - University of California...

Active Where?
Individual Item Reliability Statistics Adolescent Survey (N = 120)
Suggested citation: Joe L, Carlson JA, Sallis JF. Active Where? Individual item reliability statistics adolescent survey. http://www.drjamessallis.sdsu.edu/Documents/AW_item_reliability_Adolescent.pdf

Active Where Individual Item Test-Retest Reliability – Adolescent Survey (N=120) 2
Section A: Equipment Checklist
Coding: all missing values recoded as 0 a) # of working, non-portable electronic devices in home b) # of working, non-portable electronic devices in my bedroom
Item Number Item Content Response
Option ICC (95% CI) Kappa Percent Agreement
A1a TVs in home Fill-in .795 (.719, .853) 73.5% A1b TVs in my bedroom “ .465 (.313, .594) 94.2%
A2a VCR or DVD player in home “ .815 (.745, .854) 87.5%
A2b VCR or DVD player in my bedroom “ .869 (.818, .907) 80.0% A3a Digital TV recorders in home “ .358 (.192, .504) 80.0% A3b Digital TV recorders in my bedroom “ .187 (.010, .354) 91.6%
A4a Music players in home “ .573 (.440, .682) -*
A4b Music players in my bedroom “ .465 (.278, .569) 62.5%
A5a Desktop computer with internet access in home “ .588 (.458, .694) 75.0%
A5b Desktop computer with internet access in my bedroom
“ .716 (.617, .793) 90.0%
A6a Desktop computer without internet access in home “ .514 (.670, .634) 83.3%
A6b Desktop computer without internet access in my bedroom
“ .775 (.693, .838) 92.5%
A7a Video game player that hooks up to a TV in home “ .799 (.724, .856) 78.4%
A7b Video game player that hooks up to a TV in my bedroom
“ .792 (.714, .850) 87.4%
A8a Telephone (non-cell phone) in home “ .636 (.517, .732) - * Indicates that there were greater than 10 different types of responses to this question, and a percent agreement was not calculated.
Active Where Individual Item Test-Retest Reliability – Adolescent Survey (N=120) 3
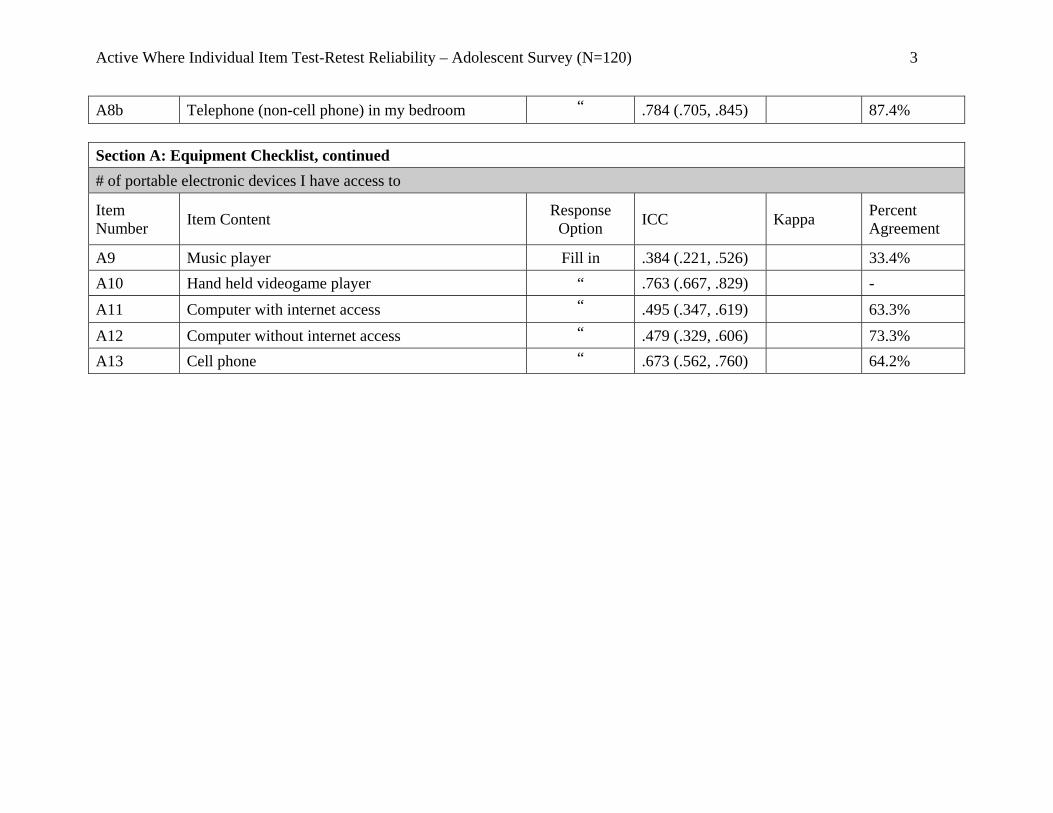
A8b Telephone (non-cell phone) in my bedroom “ .784 (.705, .845) 87.4% Section A: Equipment Checklist, continued # of portable electronic devices I have access to
Item Number Item Content Response
Option ICC Kappa Percent Agreement
A9 Music player Fill in .384 (.221, .526) 33.4% A10 Hand held videogame player “ .763 (.667, .829) -
A11 Computer with internet access “ .495 (.347, .619) 63.3%
A12 Computer without internet access “ .479 (.329, .606) 73.3% A13 Cell phone “ .673 (.562, .760) 64.2%

Active Where Individual Item Test-Retest Reliability – Adolescent Survey (N=120) 4
Section B: Stores and other public places in the neighborhood where you live Coding: “don’t know” and all other missing values recoded as 5 (31+ min) Length of time it would take you to walk from your home to the nearest places listed below
Item Number Item Content Response Option ICC (95% CI) Kappa Percent
Agreement
B1_dk5 Convenience/corner store/small grocery store/bodega
1 = 1-5 min 2 = 6-10 min 3 = 11-20 min 4 = 21-30 min 5 = 31+ min
.743 (.651, .813) 45.7%
B2_dk5 Supermarket “ .772 (.689, .836) 53.4%
B3_dk5 Hardware store “ .740 (.647, .811) 60.1%
B4_dk5 Fruit/vegetable market “ .578 (.446, .686) 48.3% B5_dk5 Laundry or dry cleaners “ .709 (.607, .788) 50.0% B6_dk5 Clothing store “ .617 (.493, .716) 57.9%
B7_dk5 Post office “ .777 (.695, .839) 54.1%
B8_dk5 Library “ .774 (.691, .837) 54.2%
B9_dk5 Elementary school “ .699 (.595, .780) 60.7%
B10_dk5 Middle or high school “ .637 (.518, .732) 52.5%
B11_dk5 Book store “ .745 (.654, .815) 66.7%
B12_dk5 Fast food restaurant “ .629 (.508, .726) 44.1%
B13_dk5 Coffee place “ .681 (.572, .766) 55.0%
B14_dk5 Bank/credit union “ .732 (.637, .805) 59.3%
B15_dk5 Non-fast food restaurant “ .679 (.570, .765) 46.8%

Active Where Individual Item Test-Retest Reliability – Adolescent Survey (N=120) 5
B16_dk5 Video store “ .754 (.665, .822) 57.5%
B17_dk5 Pharmacy/drug store “ .747 (.656, .816) 59.2%
B18_dk5 Hairdressers/barber shop “ .614 (.657, .833) 50.0%
B19_dk5 Any offices/worksites “ .634 (.514, .730) 55.0%
B20_dk5 Bus, subway or train stop “ .760 (.673, .826) 65.0%

Active Where Individual Item Test-Retest Reliability – Adolescent Survey (N=120) 6
Section C: Recreation places in your neighborhood Coding: “don’t know” and all other missing values recoded as 5 (31+ min) Length of time it would take you to walk from your home to the nearest places listed below
Item Number Item Content Response Option ICC (95% CI) Kappa Percent
Agreement
C1_dk5 Indoor recreation or exercise facility (public or private)
1 = 1-5 min 2 = 6-10 min 3 = 11-20 min 4 = 21-30 min 5 = 31+ min
.547 (.409, .661) 49.7%
C2_dk5 Beach, lake, river or creek “ .721 (.622, .797) 67.5%
C3_dk5 Bike/hiking/walking trails, paths “ .703 (.600, .783) 55.9%
C4_dk5 Basketball court “ .574 (.441, .682) 49.9% C5_dk5 Other playing fields/ courts “ .525 (.383, .643) 40.7% C6_dk5 YMCA “ .693 (.588, .776) 72.5%
C7_dk5 Boys and girls club “ .554 (.417, .667) 69.3%
C8_dk5 Swimming pool “ .666 (.553, .754) 51.7%
C9_dk5 Walking/ running track “ .476 (.325, .603) 51.7%
C10_dk5 School with recreation facilities open to the public
“ .600 (.472, .703) 59.3%
C11_dk5 Small public park “ .610 (.484, .711) 55.8%
C12_dk5 Large public park “ .693 (.588, .776) 51.7%
C13_dk5 Public playground with equipment “ .572 (.439, .681) 52.6%
C14_dk5 Public open space (grass or sand/dirt) that is not a park
“ .375 (.211, .518) 51.7%

Active Where Individual Item Test-Retest Reliability – Adolescent Survey (N=120) 7
Section D: Recreation places and sports facilities where you live Coding: D1a-D17a: missing values recoded as 0 (never) D1b-D17b: missing values recoded as 0 (no) a) How often you are active in these places? b) Do you usually walk or bike to/from there?
Item Number Item Content Response Option ICC (95% CI) Kappa Percent
Agreement
D1a How often active at indoor recreation or exercise facility (public or private)
0 = Never 1 = Once a month or less 2 = Once every other week 3 = Once a week or more
.551 (.414, .664) 59.2%
D1b Usually walk or bike to/from indoor recreation or exercise facility (public or private)
0 = No 1 = Yes 0.458
D2a How often active at beach, lake, river or creek
0 = Never 1 = Once a month or less 2 = Once every other week 3 = Once a week or more
.546 (.408, .660) 57.5%
D2b Usually walk or bike to/from beach, lake, river or creek
0 = No 1 = Yes 0.565
D3a How often active at bike/hiking/walking trails, paths
0 = Never 1 = Once a month or less 2 = Once every other week 3 = Once a week or more
.521 (.378, .640) 60.0%
D3b Usually walk or bike to/from bike/hiking/walking trails, paths
0 = No 1 = Yes 0.414
D4a How often active at basketball court 0 = Never .583 (.452, .689) 60.0%
Active Where Individual Item Test-Retest Reliability – Adolescent Survey (N=120) 8
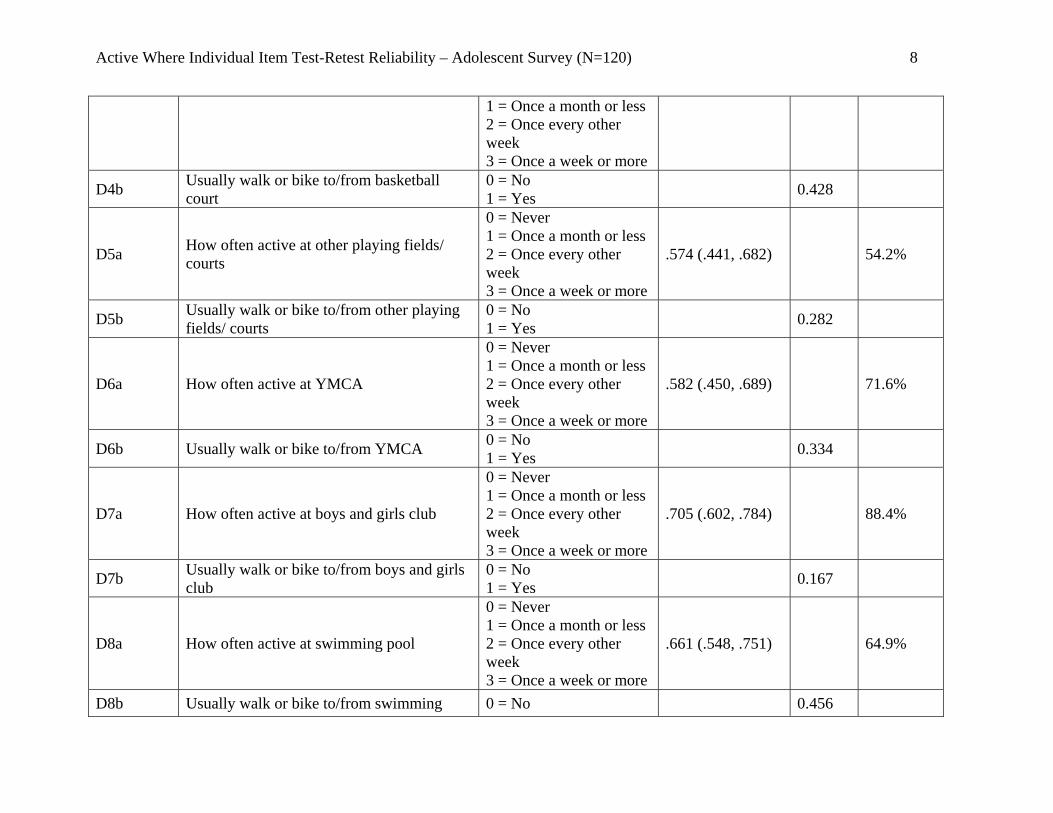
1 = Once a month or less 2 = Once every other week 3 = Once a week or more
D4b Usually walk or bike to/from basketball court
0 = No 1 = Yes 0.428
D5a How often active at other playing fields/ courts
0 = Never 1 = Once a month or less 2 = Once every other week 3 = Once a week or more
.574 (.441, .682) 54.2%
D5b Usually walk or bike to/from other playing fields/ courts
0 = No 1 = Yes 0.282
D6a How often active at YMCA
0 = Never 1 = Once a month or less 2 = Once every other week 3 = Once a week or more
.582 (.450, .689) 71.6%
D6b Usually walk or bike to/from YMCA 0 = No 1 = Yes 0.334
D7a How often active at boys and girls club
0 = Never 1 = Once a month or less 2 = Once every other week 3 = Once a week or more
.705 (.602, .784) 88.4%
D7b Usually walk or bike to/from boys and girls club
0 = No 1 = Yes 0.167
D8a How often active at swimming pool
0 = Never 1 = Once a month or less 2 = Once every other week 3 = Once a week or more
.661 (.548, .751) 64.9%
D8b Usually walk or bike to/from swimming 0 = No 0.456

Active Where Individual Item Test-Retest Reliability – Adolescent Survey (N=120) 9
pool 1 = Yes
D9a How often active at walking/ running track
0 = Never 1 = Once a month or less 2 = Once every other week 3 = Once a week or more
.566 (.432, .676) 56.7%
D9b Usually walk or bike to/from walking/ running track
0 = No 1 = Yes .550
D10a How often active at school with recreation facilities open to the public
0 = Never 1 = Once a month or less 2 = Once every other week 3 = Once a week or more
.504 (.358, .626) 53.4%
D10b Usually walk or bike to/from school with recreation facilities open to the public
0 = No 1 = Yes .493
D11a How often active at small public park
0 = Never 1 = Once a month or less 2 = Once every other week 3 = Once a week or more
.416 (.257, .553) 47.5%
D11b Usually walk or bike to/from small public park
0 = No 1 = Yes .502
D12a How often active at large public park
0 = Never 1 = Once a month or less 2 = Once every other week 3 = Once a week or more
.486 (.337, .611) 49.2%
D12b Usually walk or bike to/from large public park
0 = No 1 = Yes .525
D13a How often active at public playground with equipment
0 = Never 1 = Once a month or less 2 = Once every other week
.452 (.298, .583) 55.0%
Active Where Individual Item Test-Retest Reliability – Adolescent Survey (N=120) 10
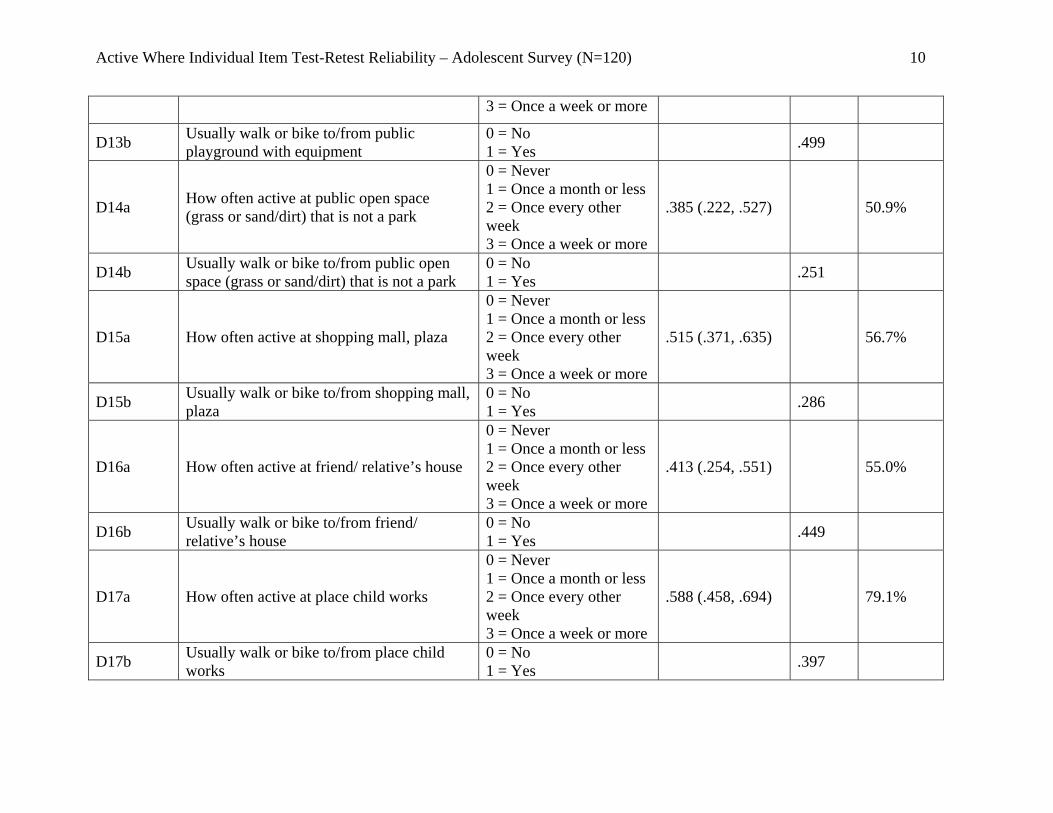
3 = Once a week or more
D13b Usually walk or bike to/from public playground with equipment
0 = No 1 = Yes .499
D14a How often active at public open space (grass or sand/dirt) that is not a park
0 = Never 1 = Once a month or less 2 = Once every other week 3 = Once a week or more
.385 (.222, .527) 50.9%
D14b Usually walk or bike to/from public open space (grass or sand/dirt) that is not a park
0 = No 1 = Yes .251
D15a How often active at shopping mall, plaza
0 = Never 1 = Once a month or less 2 = Once every other week 3 = Once a week or more
.515 (.371, .635) 56.7%
D15b Usually walk or bike to/from shopping mall, plaza
0 = No 1 = Yes .286
D16a How often active at friend/ relative’s house
0 = Never 1 = Once a month or less 2 = Once every other week 3 = Once a week or more
.413 (.254, .551) 55.0%
D16b Usually walk or bike to/from friend/ relative’s house
0 = No 1 = Yes .449
D17a How often active at place child works
0 = Never 1 = Once a month or less 2 = Once every other week 3 = Once a week or more
.588 (.458, .694) 79.1%
D17b Usually walk or bike to/from place child works
0 = No 1 = Yes .397

Active Where Individual Item Test-Retest Reliability – Adolescent Survey (N=120) 11
Section E: Barriers to walking and biking to the local park Coding: E1a: missing recoded as 0 (No) E1b: missing recoded as 0 (No), only if 1a=yes E2-18: missing left as missing
Item Number Item Content Response Option ICC (95% CI) Kappa Percent
Agreement
E1a Is there a park within a 15-minute walk or bike from your home?
0 = No 1 = Yes .452
E1b If yes, do you walk or bike there (alone or with someone)?
0 = No 1 = Yes .468
Do you agree or disagree with the following statements: It is difficult for me to walk or bike to the local park (alone or with someone) because…
E2 There are too many hills along the way
1 = strongly disagree 2 = somewhat disagree 3 = somewhat agree 4 = strongly agree
.531 (.389, .649) 61.3%
E3 There are no sidewalks or bike lanes “ .490 (.341, .615) 58.8%
E4 The route is boring “ .320 (.149, .472) 49.9% E5 The route does not have good lighting “ .515 (.370, .636) 51.8% E6 There is too much traffic along the route “ .490 (.340, .616) 45.3%
E7 There is one or more dangerous crossings “ .491 (.342, .615) 47.0%
E8 I get too hot and sweaty “ .499 (.351, .623) 53.4%
E9 No other children walk or bike to this park “ .403 (.241, .543) 49.9%
E10 It’s not considered cool to walk or bike “ .456 (.301, .588) 60.0%
Active Where Individual Item Test-Retest Reliability – Adolescent Survey (N=120) 12
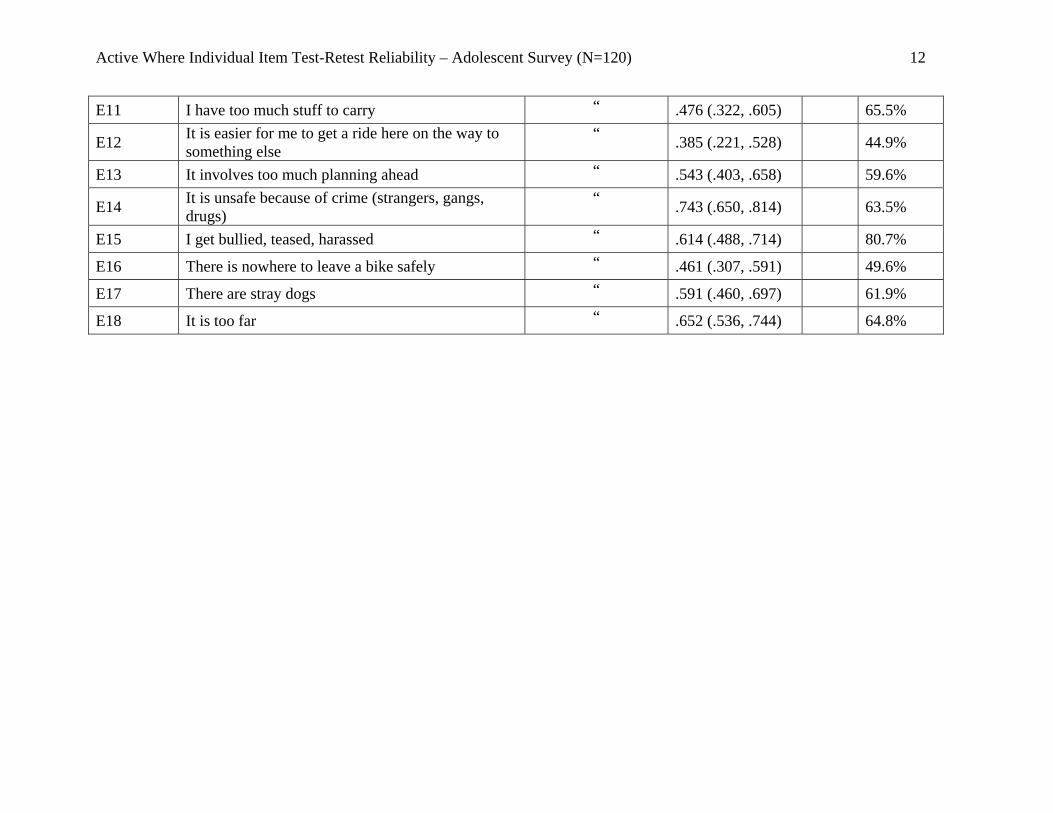
E11 I have too much stuff to carry “ .476 (.322, .605) 65.5%
E12 It is easier for me to get a ride here on the way to something else
“ .385 (.221, .528) 44.9%
E13 It involves too much planning ahead “ .543 (.403, .658) 59.6%
E14 It is unsafe because of crime (strangers, gangs, drugs)
“ .743 (.650, .814) 63.5%
E15 I get bullied, teased, harassed “ .614 (.488, .714) 80.7%
E16 There is nowhere to leave a bike safely “ .461 (.307, .591) 49.6%
E17 There are stray dogs “ .591 (.460, .697) 61.9%
E18 It is too far “ .652 (.536, .744) 64.8%

Active Where Individual Item Test-Retest Reliability – Adolescent Survey (N=120) 13
Section F: Barriers to walking and biking to shops and restaurants for you Coding: F1a: missing recoded as 0 (No) F1b: missing recoded as 0 (No), only if 1a=yes F2-F18: missing left as missing
Item Number Item Content Response Option ICC (95% CI) Kappa Percent
Agreement
F1a Are there shops, restaurants, or food stores within a 15-minute walk or bike from your home?
0 = No 1 = Yes .355
F1b If yes, do you walk or bike there (alone or with someone)
0 = No 1 = Yes .502
Do you agree or disagree with the following statements: It is difficult for me to walk or bike to the local stores or restaurants (alone or with someone) because…
F2 There are too many hills along the way
1 = strongly disagree 2 = somewhat disagree 3 = somewhat agree 4 = strongly agree
.470 (.318, .599) 66.4%
F3 There are no sidewalks or bike lanes “ .670 (.558, .758) 65.5%
F4 The route is boring “ .391 (.229, .533) 60.4% F5 The route does not have good lighting “ .569 (.434, .679) 62.7% F6 There is too much traffic along the route “ .485 (.334, .612) 46.2%
F7 There is one or more dangerous crossings “ .516 (.371, .638) 45.3%
F8 I get too hot and sweaty “ .466 (.313, .596) 55.9%
F9 No other children walk or bike to this park “ .445 (.289, .579) 54.2%
F10 It’s not considered cool to walk or bike “ .376 (.210, .521) 61.5%

Active Where Individual Item Test-Retest Reliability – Adolescent Survey (N=120) 14
F11 I have way too much stuff to carry “ .438 (.281, .572) 63.8%
F12 It is easier for me to get a ride here on the way to something else
“ .540 (.398, .656) 49.6%
F13 It involves too much planning ahead “ .568 (.432, .678) 61.0%
F14 It is unsafe because of crime (strangers, gangs, drugs)
“ .677 (.566, .763) 64.6%
F15 I get bullied, teased, harassed “ .626 (.504, .724) 79.8%
F16 There is nowhere to leave a bike safely “ .541 (.401, .657) 54.6%
F17 There are stray dogs “ .601 (.472, .705) 66.1%
F18 It is too far “ .539 (.399, .655) 55.6%

Active Where Individual Item Test-Retest Reliability – Adolescent Survey (N=120) 15
Section G: Barriers to activity in the local neighborhood Coding: missing left as missing Do you agree or disagree with the following statements: It is difficult for me to be active in the local park near our home because…
Item Number Item Content Response Option ICC (95% CI) Kappa Percent
Agreement
G1 There is not enough space to be active in
1 = strongly disagree 2 = somewhat disagree 3 = somewhat agree 4 = strongly agree
.403 (.242, .543) 66.4%
G2 There is no choice of activities “ .476 (.324, .603) 50.4%
G3 There is no equipment “ .440 (.282, .574) 44.1%
G4 There is no adult supervision “ .466 (.314, .596) 52.9% G5 There are no other children there “ .426 (.264, .564) 53.9%
G6 It is not safe because of crime (strangers, gangs, drugs)
“ .633 (.512, .729) 62.2%
G7 I get bullied, teased, harassed “ .712 (.611, .790) 80.6%
G8 It is not safe because it is close to a road “ .441 (.284, .574) 62.2%
G9 There are too many people there “ .391 (.229, .534) 49.9%
G10 It does not have good lighting “ .353 (.185, .500) 56.3%
G11 It is difficult to get to “ .307 (.135, .460) 60.5% Do you agree or disagree with the following statements: It is difficult for me to be active in the local streets, alley ways, cul de sacs because…
G12 There is not enough space to be active in 1 = strongly disagree .493 (.342, .619) 44.1%
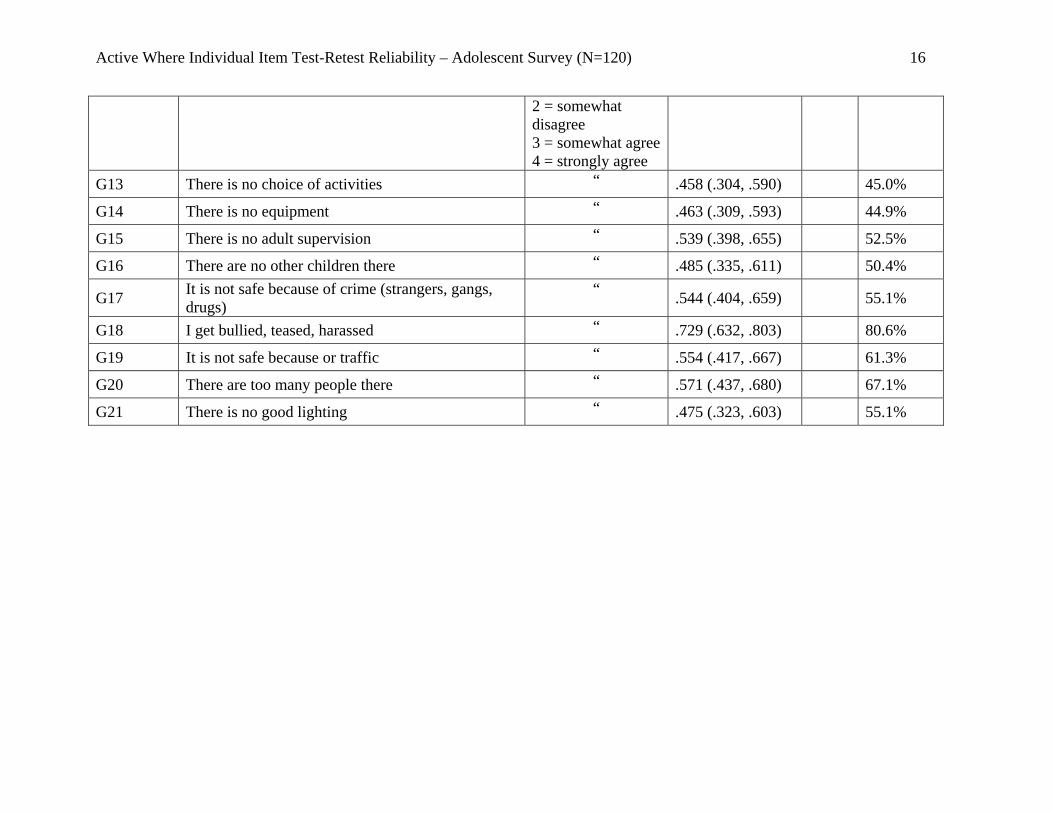
Active Where Individual Item Test-Retest Reliability – Adolescent Survey (N=120) 16
2 = somewhat disagree 3 = somewhat agree 4 = strongly agree
G13 There is no choice of activities “ .458 (.304, .590) 45.0%
G14 There is no equipment “ .463 (.309, .593) 44.9%
G15 There is no adult supervision “ .539 (.398, .655) 52.5%
G16 There are no other children there “ .485 (.335, .611) 50.4%
G17 It is not safe because of crime (strangers, gangs, drugs)
“ .544 (.404, .659) 55.1%
G18 I get bullied, teased, harassed “ .729 (.632, .803) 80.6%
G19 It is not safe because or traffic “ .554 (.417, .667) 61.3%
G20 There are too many people there “ .571 (.437, .680) 67.1%
G21 There is no good lighting “ .475 (.323, .603) 55.1%

Active Where Individual Item Test-Retest Reliability – Adolescent Survey (N=120) 17
Section H: Types of homes in your neighborhood Coding: missing left as missing Thinking about the places where people live in your neighborhood (within a 10-15 minute walk in any direction), how common are the following in your neighborhood:
Item Number Item Content Response Option ICC (95% CI) Kappa Percent
Agreement
H1 Separate or stand alone one family homes
1 = none 2 = a few 3 = some 4 = a lot 5 = all residences are separate one family homes
.438 (.280, .573) 54.2%
H2 Connected townhouses or rows of houses
1 = none 2 = a few 3 = some 4 = a lot 5 = all residences are townhouses or row houses
.486 (.335, .613) 48.7%
H3 Multiple family or duplex homes
1 = none 2 = a few 3 = some 4 = a lot 5 = all residences are multiple family/duplex homes
.662 (.547, .753) 51.3%
H4 Apartment or condo buildings
1 = none 2 = a few 3 = some 4 = a lot 5 = all residences are in apartment or condo buildings
.515 (.369, .636) 50.5%

Active Where Individual Item Test-Retest Reliability – Adolescent Survey (N=120) 18
Section I: Access to services Coding: missing left as missing Circle the answer that best applies to the neighborhood where you live. Local and within walking distance mean within a 10-15 minute walk from your home
Item Number Item Content Response Option ICC Kappa Percent
Agreement
I1 Stores are within easy walking distance of our home.
1 = strongly disagree 2 = somewhat disagree 3 = somewhat agree 4 = strongly agree
.580 (.446, .688) 56.8%
I2 Parking is difficult in local shopping areas. “ .238 (.061, .401) 40.6%
I3 There are many places for me to go (alone or with someone) within easy walking distance of our home.
“ .452 (.297, .584) 42.4%
I4 From my home, it is easy for me to walk (alone or with someone) to a transit stop (bus, subway, train).
“ .649 (.531, .742) 66.1%
I5 The streets in my neighborhood are hilly, making our neighborhood difficult for me to walk in.
“ .519 (.374, .640) 60.8%
I6 There are major barriers to walking in our local area that make it hard for me to get from place to place.
“ .350 (.181, .499) 62.4%
Active Where Individual Item Test-Retest Reliability – Adolescent Survey (N=120) 19
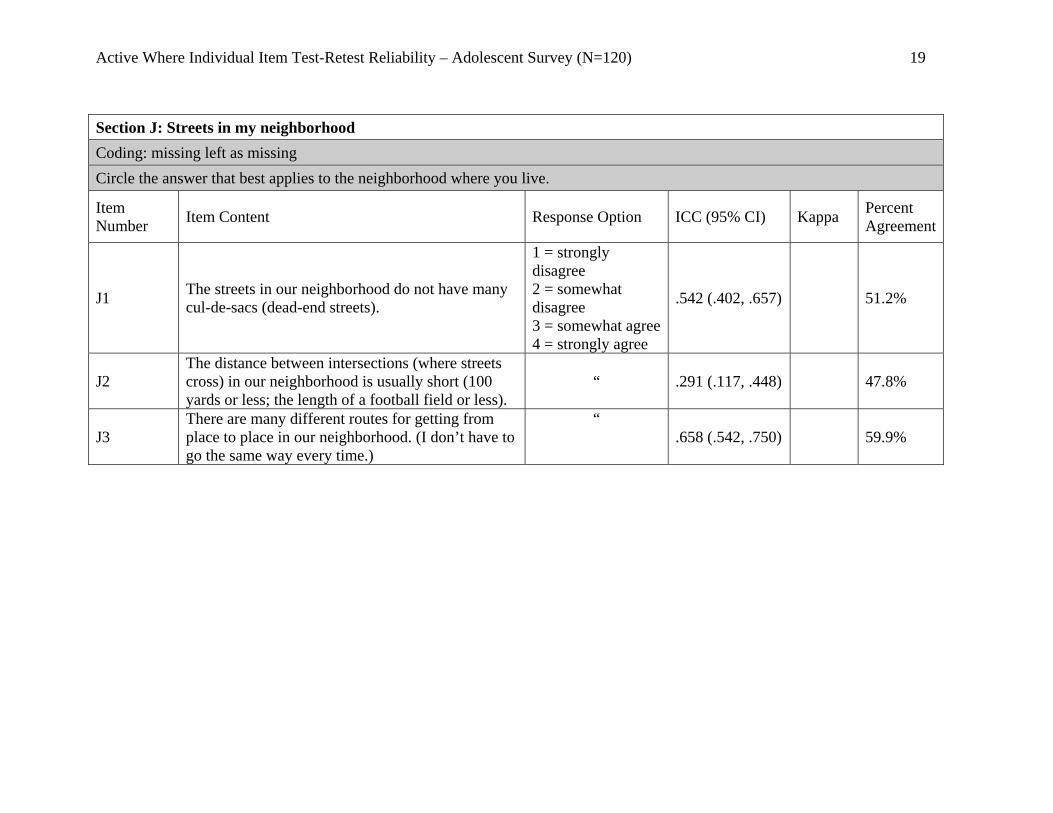
Section J: Streets in my neighborhood Coding: missing left as missing Circle the answer that best applies to the neighborhood where you live.
Item Number Item Content Response Option ICC (95% CI) Kappa Percent
Agreement
J1 The streets in our neighborhood do not have many cul-de-sacs (dead-end streets).
1 = strongly disagree 2 = somewhat disagree 3 = somewhat agree 4 = strongly agree
.542 (.402, .657) 51.2%
J2 The distance between intersections (where streets cross) in our neighborhood is usually short (100 yards or less; the length of a football field or less).
“ .291 (.117, .448) 47.8%
J3 There are many different routes for getting from place to place in our neighborhood. (I don’t have to go the same way every time.)
“ .658 (.542, .750) 59.9%

Active Where Individual Item Test-Retest Reliability – Adolescent Survey (N=120) 20
Section K: Places for walking Coding: missing left as missing Circle the answer that best applies to the neighborhood where you live.
Item Number Item Content Response Option ICC (95% CI) Kappa Percent
Agreement
K1 There are sidewalks on most of the streets in our neighborhood.
1 = strongly disagree 2 = somewhat disagree 3 = somewhat agree 4 = strongly agree
.739 (.645, .811) 72.0%
K2 Sidewalks are separated from the road/traffic in our neighborhood by parked cars. “ .514 (.369, .635) 51.7%
K3 There is grass/dirt between the streets and the sidewalks in our neighborhood
“ .454 (.299, .586) 43.2%

Active Where Individual Item Test-Retest Reliability – Adolescent Survey (N=120) 21
Section L: Neighborhood surroundings Coding: missing left as missing Circle the answer that best applies to the neighborhood where you live.
Item Number Item Content Response Option ICC (95% CI) Kappa Percent
Agreement
L1 There are trees along the streets in my neighborhood.
1 = strongly disagree 2 = somewhat disagree 3 = somewhat agree 4 = strongly agree
.444 (.288, .577) 47.9%
L2 There are many interesting things for me to look at while walking in my neighborhood. “ .433 (.275, .568) 52.1%
L3 There are many beautiful natural things for me to look at in my neighborhood (e.g. gardens, views).
“ .611 (.486, .712) 52.0%
L4 There are many buildings/homes in my neighborhood that are nice to look at for me.
.504 (.357, .627) 53.7%

Active Where Individual Item Test-Retest Reliability – Adolescent Survey (N=120) 22
Section M. Neighborhood safety Coding: missing left as missing Circle the answer that best applies to the neighborhood where you live.
Item Number Item Content Response Option ICC (95% CI) Kappa Percent
Agreement
M1 There is so much traffic along nearby streets that it makes it difficult or unpleasant for me to walk (alone or with someone) in our neighborhood.
1 = strongly disagree 2 = somewhat disagree 3 = somewhat agree 4 = strongly agree
.407 (.245, .548) 46.1%
M2 The speed of traffic on most nearby streets is usually slow (30 mph or less).
“ .566 (.430, .677) 55.9%
M3 Most drivers go faster than the posted speed limits in our neighborhood.
“ .537 (.395, .654) 49.6%
M4 Our neighborhood streets have good lighting at night.
“ .483 (.332, .609) 49.2%
M5 Walkers and bikers on the streets in our neighborhoods can be easily seen by people in their homes.
“ .335 (.164, .486) 47.0%
M6 There are crosswalks and signals to help walkers cross busy streets in our neighborhood.
“ .449 (.293, .582) 42.3%
M7 When walking in our neighborhood there are a lot of exhaust fumes.
“ .534 (.390, .652) 56.1%
M8 There is a high crime rate in our neighborhood. “ .735 (.639, .808) 71.0%
M9 The crime rate in our neighborhood makes it unsafe for me to go on walks (alone or with someone) at night.
“ .683 (.574, .769) 61.9%
M10 I am worried about playing outside around my home alone (e.g. yard, driveway, apartment
“ .584 (.451, .691) 59.3%

Active Where Individual Item Test-Retest Reliability – Adolescent Survey (N=120) 23
common area) because I am afraid of being taken or hurt by a stranger.
M11 I am worried about being outside with a friend around my home because I am afraid of being taken or hurt by a stranger.
“ .630 (.507, .727) 72.8%
M12
I am worried about playing or walking alone with friends in my neighborhood and local streets because I am afraid of being taken or hurt by a stranger.
“
.575 (.441, .684) 61.9%
M13 I am worried about being alone with friends in a local or nearby park because I am afraid of being taken or hurt by a stranger.
“ .481 (.330, .608) 52.6%
Section N: Weather Coding: missing left as missing Circle the answer that best applies to the neighborhood where you live.
Item Number Item Content Response Option ICC (95% CI) Kappa Percent
Agreement
N1 Bad weather (like rain, snow or cold) often keeps me from being physically active outside.
1 = strongly disagree 2 = somewhat disagree 3 = somewhat agree 4 = strongly agree
.473 (.321, .602) 46.6%
N2 Bad weather often keeps me from biking or walking places. “ .394 (.231, .536) 45.8%

Active Where Individual Item Test-Retest Reliability – Adolescent Survey (N=120) 24
Section O. Local environment Coding: missing values recoded as 0 (never) How often are you in the following places?
Item Number Item Content Response Option ICC (95% CI) Kappa Percent
Agreement
O1 Inside my home
0 = never 1 = once a month or less 2 = once every other week 3 = once a week or more
.312 (.142, .465) 66.6%
O2 In my yard “ .649 (.532, .741) 53.3%
O3 In my driveway “ .614 (.490, .714) 49.1%
O4 At a neighbor’s house, yard or driveway “ .432 (.276, .567) 55.0%
O4 In a local street, cul de sac (dead end street) or vacant lot
“ .367 (.202, .512) 45.8%
Active Where Individual Item Test-Retest Reliability – Adolescent Survey (N=120) 25
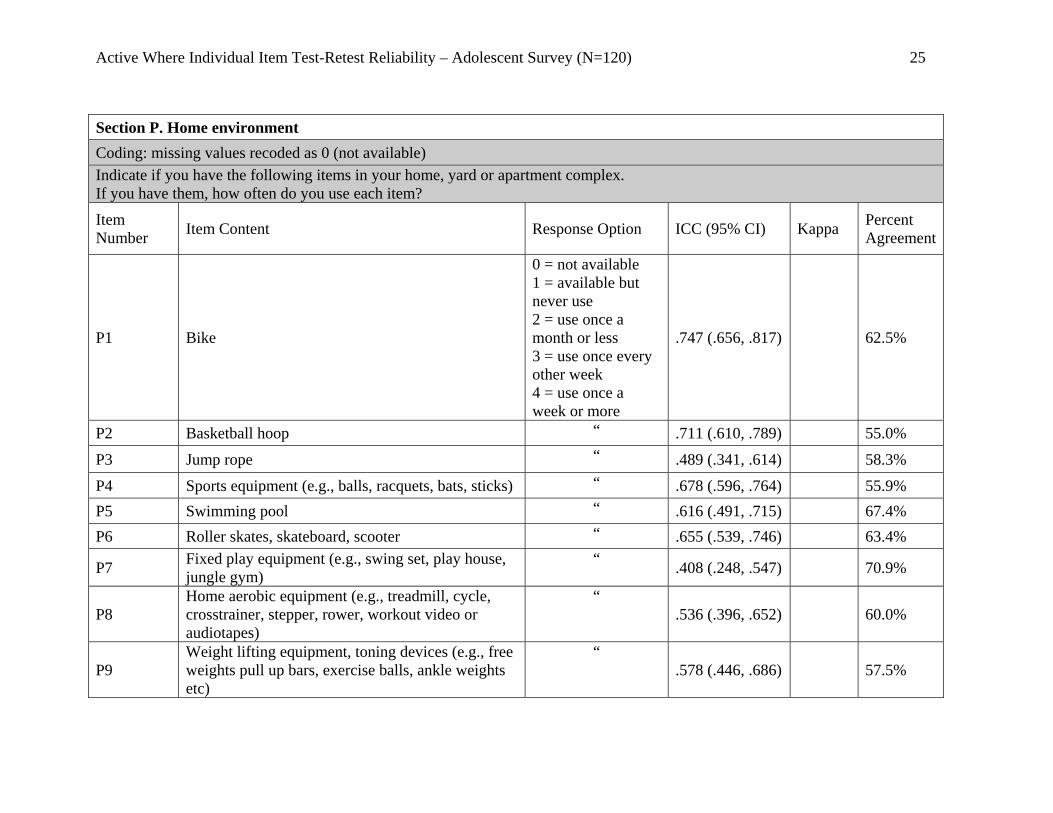
Section P. Home environment Coding: missing values recoded as 0 (not available) Indicate if you have the following items in your home, yard or apartment complex. If you have them, how often do you use each item?
Item Number Item Content Response Option ICC (95% CI) Kappa Percent
Agreement
P1 Bike
0 = not available 1 = available but never use 2 = use once a month or less 3 = use once every other week 4 = use once a week or more
.747 (.656, .817) 62.5%
P2 Basketball hoop “ .711 (.610, .789) 55.0%
P3 Jump rope “ .489 (.341, .614) 58.3%
P4 Sports equipment (e.g., balls, racquets, bats, sticks) “ .678 (.596, .764) 55.9% P5 Swimming pool “ .616 (.491, .715) 67.4% P6 Roller skates, skateboard, scooter “ .655 (.539, .746) 63.4%
P7 Fixed play equipment (e.g., swing set, play house, jungle gym)
“ .408 (.248, .547) 70.9%
P8 Home aerobic equipment (e.g., treadmill, cycle, crosstrainer, stepper, rower, workout video or audiotapes)
“ .536 (.396, .652) 60.0%
P9 Weight lifting equipment, toning devices (e.g., free weights pull up bars, exercise balls, ankle weights etc)
“ .578 (.446, .686) 57.5%
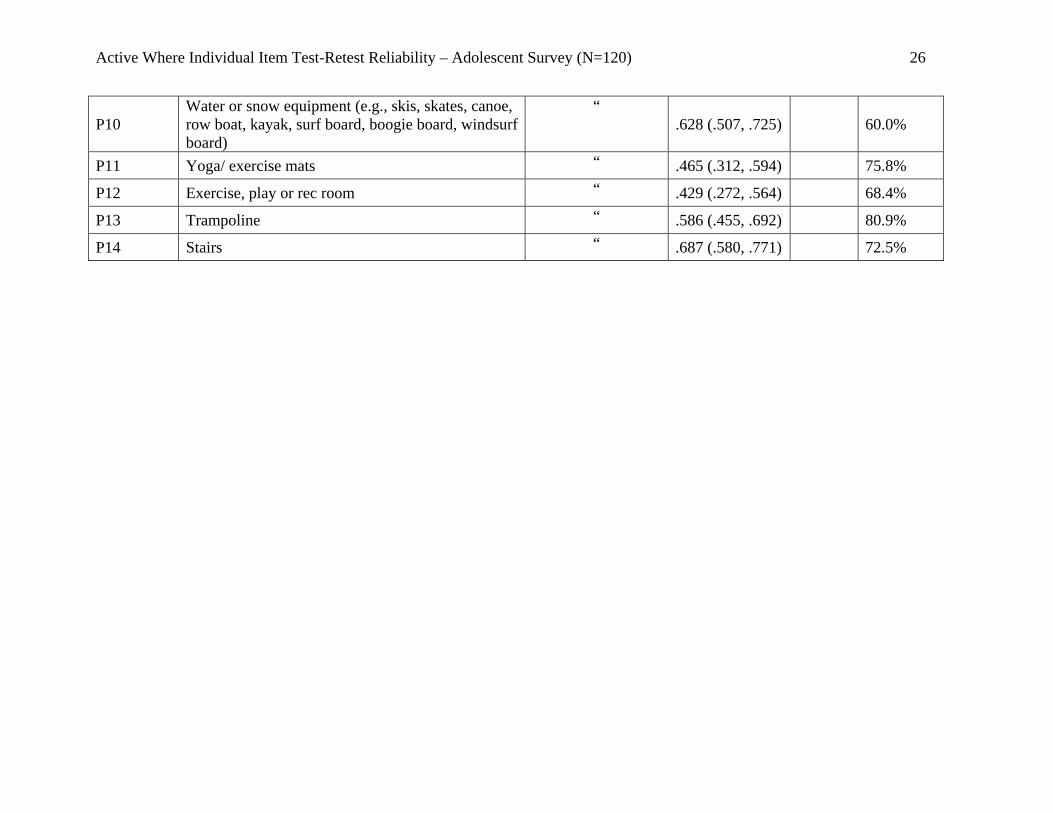
Active Where Individual Item Test-Retest Reliability – Adolescent Survey (N=120) 26
P10 Water or snow equipment (e.g., skis, skates, canoe, row boat, kayak, surf board, boogie board, windsurf board)
“ .628 (.507, .725) 60.0%
P11 Yoga/ exercise mats “ .465 (.312, .594) 75.8%
P12 Exercise, play or rec room “ .429 (.272, .564) 68.4%
P13 Trampoline “ .586 (.455, .692) 80.9%
P14 Stairs “ .687 (.580, .771) 72.5%

Active Where Individual Item Test-Retest Reliability – Adolescent Survey (N=120) 27
Section Q. Physical Activity Coding: missing left as missing Add up the time you spend in physical activity each day (do not include school physical education or gym class). Circle the answer that best applies to you.
Item Number Item Content Response Option ICC (95% CI) Kappa Percent
Agreement
Q1 For the past seven days, how many days are you physically active for a total of at least 60 minutes per day?
0 = 0 days 1 = 1 day 2 = 2 days 3 = 3 days 4 = 4 days 5 = 5 days 6 = 6 days 7 = 7 days
.571 (.437, .681) 34.5%
Q2 Over a typical or usual week on how many days are you physically active for a total of at least 60 minutes per day?
“ .588 (.457, .694) 41.9%
Q3 Outside of school, how many days per week do you play or practice team sports?
“ .645 (.526, .739) 55.0%
Q4 Outside of school, how many days per week do you have activity training or instruction not in a team sport (e.g., martial arts, dance, tennis)?
“ .374 (.209, .518) 61.4%
Q5 How many days per week do you have gym or Phys Ed class at school?
“ .764 (.677, .829) 71.2%
Q6 On average how long is each PE period? Minutes per class Don’t know .864 (.790, .913) -†
Q7 Do you have a dog at home? 0 = No 1 = Yes 0.932
† Indicates that there were greater than 10 different types of responses to this question, and a percent agreement was not calculated.

Active Where Individual Item Test-Retest Reliability – Adolescent Survey (N=120) 28
Q7a If you answered yes how much time did you child spend walking your dog last week?
Fill in --‡ --
Q8 Do you have a family membership to a health club or gym?
0 = No 1 = Yes 0.562
Q9 Do you have a family membership to a public, private, or community pool?
0 = No 1 = Yes 0.639
‡ Indicates that the majority of responses to this question were missing.

Active Where Individual Item Test-Retest Reliability – Adolescent Survey (N=120) 29
Section R. Sedentary Behavior Coding: missing left as missing Weekdays: How much time on a typical week day do you do the following activities when you are mostly sitting and not moving around. Do not include time when you are in school during regular hours.
Item Number Item Content Response Option ICC (95% CI) Kappa Percent
Agreement
R1 Watching television/videos/DVDs
0 = None 1 = 15 min 2 = 30 min 3 = 1 hour 4 = 2 hours 5 = 3 hours 6 = 4 hours or more
.654 (.537, .746) 43.1%
R2 Playing computer or video games (like Nintendo or xbox)
“ .552 (.413, .666) 43.1%
R3 Using the internet, emailing or other electronic media for leisure
“ .649 (.531, .742) 40.7%
R4 Doing homework (including reading, writing, or using the computer)
“ .511 (.364, .633) 35.1%
R5 Sitting listening to music (on radio, CD, tape, MP3, iPod, etc.)
“ .590 (.457, .697) 31.2%
R6 Sitting talking on the telephone or texting “ .694 (.588, .777) 44.9%
R7 Sitting/hanging out/talking with friends or family “ .327 (.156, .480) 29.1%
R8 Reading a book or magazine NOT for school (including comic books)
“ .492 (.343, .618) 43.2%
R9 Doing inactive hobbies (music, art, crafts, clubs, going to movies, etc.)
“ .319 (.147, .472) 34.2%
R10 Sitting at work “ .345 (-.097, .687) 47.5%
Active Where Individual Item Test-Retest Reliability – Adolescent Survey (N=120) 30
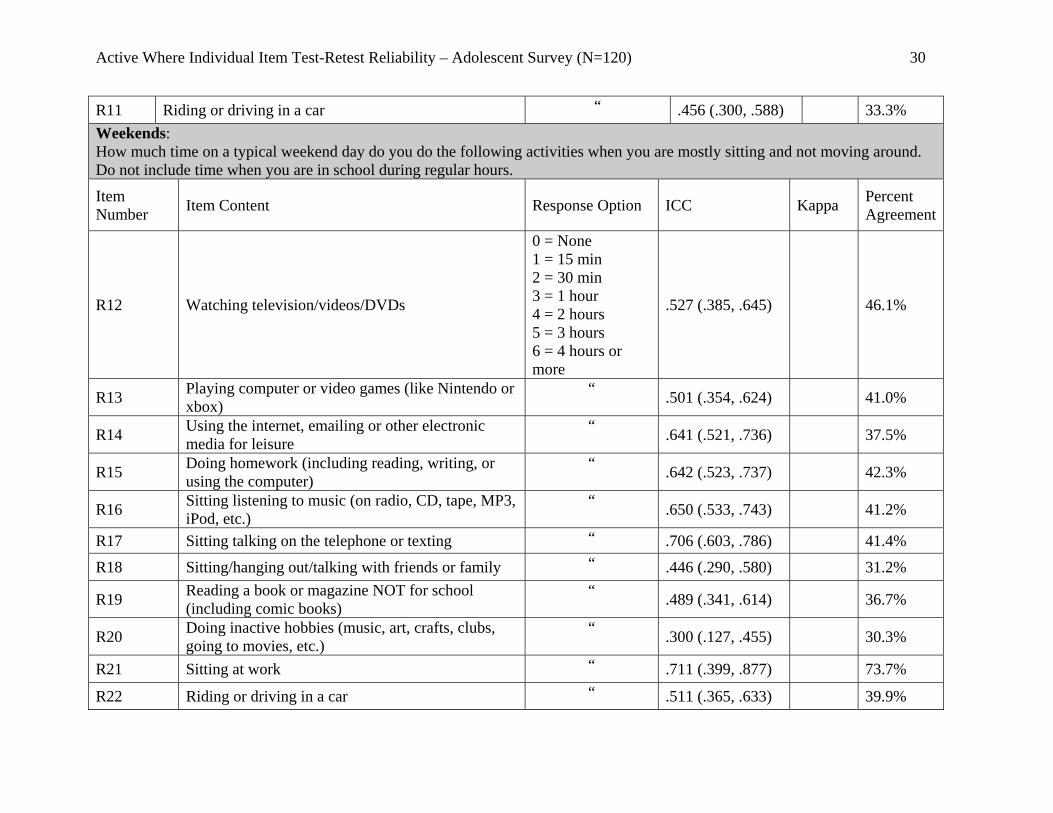
R11 Riding or driving in a car “ .456 (.300, .588) 33.3% Weekends: How much time on a typical weekend day do you do the following activities when you are mostly sitting and not moving around. Do not include time when you are in school during regular hours.
Item Number Item Content Response Option ICC Kappa Percent
Agreement
R12 Watching television/videos/DVDs
0 = None 1 = 15 min 2 = 30 min 3 = 1 hour 4 = 2 hours 5 = 3 hours 6 = 4 hours or more
.527 (.385, .645) 46.1%
R13 Playing computer or video games (like Nintendo or xbox)
“ .501 (.354, .624) 41.0%
R14 Using the internet, emailing or other electronic media for leisure
“ .641 (.521, .736) 37.5%
R15 Doing homework (including reading, writing, or using the computer)
“ .642 (.523, .737) 42.3%
R16 Sitting listening to music (on radio, CD, tape, MP3, iPod, etc.)
“ .650 (.533, .743) 41.2%
R17 Sitting talking on the telephone or texting “ .706 (.603, .786) 41.4%
R18 Sitting/hanging out/talking with friends or family “ .446 (.290, .580) 31.2%
R19 Reading a book or magazine NOT for school (including comic books)
“ .489 (.341, .614) 36.7%
R20 Doing inactive hobbies (music, art, crafts, clubs, going to movies, etc.)
“ .300 (.127, .455) 30.3%
R21 Sitting at work “ .711 (.399, .877) 73.7%
R22 Riding or driving in a car “ .511 (.365, .633) 39.9%

Active Where Individual Item Test-Retest Reliability – Adolescent Survey (N=120) 31
R23 Do you do regular paid or volunteer work? 0 = No 1 = Yes 0.483
R23a If yes, how many days per week do you work? Continuous response --§ --
R23b If yes, how many hours per day do you usually work?
Continuous response -- --
§ Indicates that the majority of responses to this question were missing.

Active Where Individual Item Test-Retest Reliability – Adolescent Survey (N=120) 32
Section S. Rules Coding: missing values recoded as 0 (no) Rules for playing outside: Does you parent or another parent/guardian have the following rules for you, regardless of how often you are told the rule?
Item Number Item Content Response Option ICC (95% CI) Kappa Percent
Agreement
S1r Stay close to or within sight of the house/parent 0 = No 0.5 = Sometimes 1 = Yes
.581 (.449, .688) 64.1%
S2r Do not go into the street “ .543 (.405, .658) 69.9%
S3r Come in before dark “ .562 (.427, .673) 63.3%
S4r Do not fight or play rough games “ .238 (.062, .399) 50.0% S5r Do not climb walls, trees or fences “ .461 (.308, .591) 65.9% S6r Do not go places alone “ .316 (.146, .468) 54.1%
S7r Stay within the neighborhood “ .707 (.605, .786) 70.0%
S8r Do not ride bike on the street “ .342 (.174, .490) 65.9%
S9r Wear a bike helmet “ .617 (.493, .716) 75.9%
S10r Wear protective clothing (e.g. knee pads) “ .273 (.100, .431) 66.7%
S11r Do not cross busy streets “ .447 (.293, .579) 60.9%
S12r Carry a cell phone “ .609 (.483, .710) 72.5%
S13r Avoid strangers “ .461 (.308, .591) 76.6%
S14r Do homework before going out “ .534 (.393, .650) 66.7%
S15r Watch out for cars “ .394 (.232, .534) 78.3%
S16r Check in frequently “ .098 (-.081, .272) 61.7%
Active Where Individual Item Test-Retest Reliability – Adolescent Survey (N=120) 33
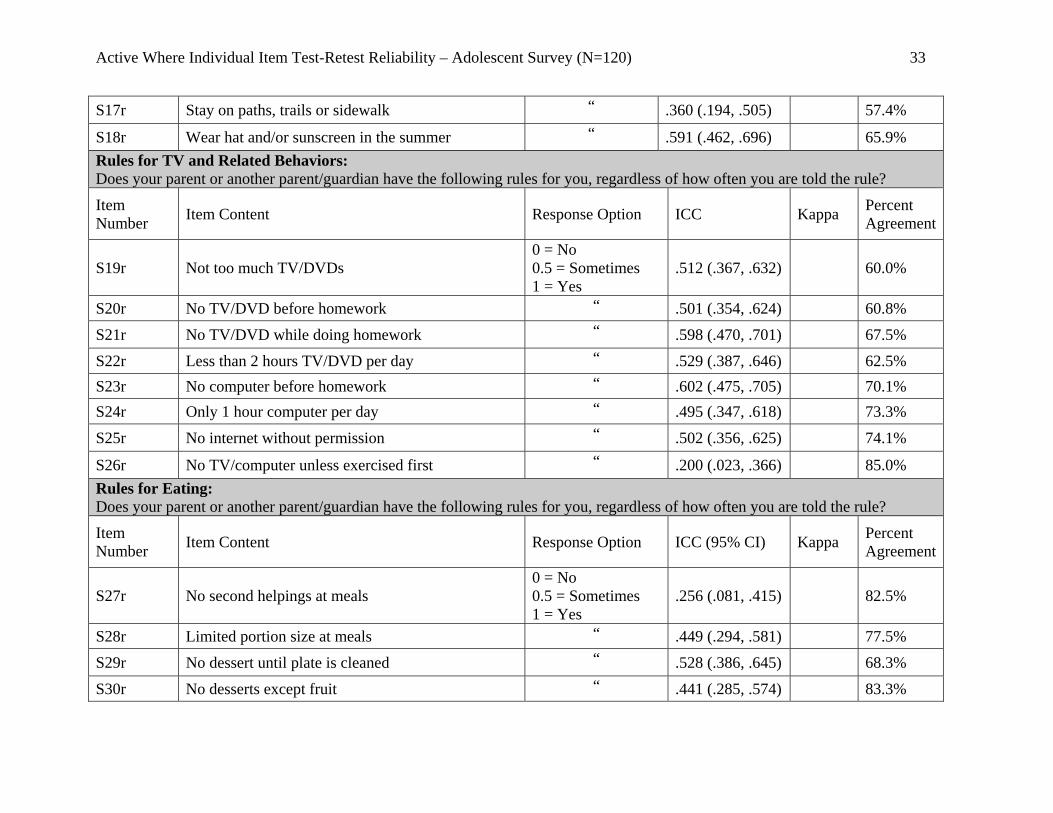
S17r Stay on paths, trails or sidewalk “ .360 (.194, .505) 57.4%
S18r Wear hat and/or sunscreen in the summer “ .591 (.462, .696) 65.9% Rules for TV and Related Behaviors: Does your parent or another parent/guardian have the following rules for you, regardless of how often you are told the rule?
Item Number Item Content Response Option ICC Kappa Percent
Agreement
S19r Not too much TV/DVDs 0 = No 0.5 = Sometimes 1 = Yes
.512 (.367, .632) 60.0%
S20r No TV/DVD before homework “ .501 (.354, .624) 60.8%
S21r No TV/DVD while doing homework “ .598 (.470, .701) 67.5%
S22r Less than 2 hours TV/DVD per day “ .529 (.387, .646) 62.5% S23r No computer before homework “ .602 (.475, .705) 70.1% S24r Only 1 hour computer per day “ .495 (.347, .618) 73.3%
S25r No internet without permission “ .502 (.356, .625) 74.1%
S26r No TV/computer unless exercised first “ .200 (.023, .366) 85.0% Rules for Eating: Does your parent or another parent/guardian have the following rules for you, regardless of how often you are told the rule?
Item Number Item Content Response Option ICC (95% CI) Kappa Percent
Agreement
S27r No second helpings at meals 0 = No 0.5 = Sometimes 1 = Yes
.256 (.081, .415) 82.5%
S28r Limited portion size at meals “ .449 (.294, .581) 77.5%
S29r No dessert until plate is cleaned “ .528 (.386, .645) 68.3%
S30r No desserts except fruit “ .441 (.285, .574) 83.3%

Active Where Individual Item Test-Retest Reliability – Adolescent Survey (N=120) 34
S31r No meals while watching TV/DVDs “ .591 (.461, .696) 74.1% S32r No snacking while watching TV/DVDs “ .653 (.537, .745) 83.3%
S33r No sweet snacks “ .468 (.316, .596) 80.0%
S34r No fired snacks at home (such as potato chips) “ .448 (.293, .580) 76.6%
S35r Must help with meal preparation at home “ .572 (.438, .681) 65.8%
S36r Must help with clean-up after meals at home “ .359 (.193, .505) 60.0%
S37r Must eat dinner with family “ .684 (.577, .769) 73.3%
S38r Limited fast food “ .627 (.506, .725) 65.8%

Active Where Individual Item Test-Retest Reliability – Adolescent Survey (N=120) 35
Section T. Food Coding: T1-2: missing values recoded as 0 (none) T3-19: missing left as missing In a typical day, how many servings of the following do you eat?
Item Number Item Content Response Option ICC (95% CI) Kappa Percent
Agreement
T1 Fruit (not including fruit punch, lemonade, Gatorade, Sunny Delight or fruit drink)
0 = none 1 = 1 serving 2 = 2 servings 3 = 3 servings 4 = 4 + servings
.513 (.369, .634) 38.3%
T2 Vegetables (not including French fries, onion rings, potato chips, or fried okra)
“ .510 (.365, .631) 49.1%
How often are the following food items available in your home?
Item Number Item Content Response Option ICC (95% CI) Kappa Percent
Agreement
T3 Chocolate candy
0 = never 1 = rarely 2 = sometimes 3 = frequently 4 = always
.627 (.504, .724) 49.5%
T4 Other candy “ .596 (.465, .701) 47.0% T5 Raw fruit (e.g. apples, oranges) “ .346 (.176, .495) 46.1% T6 Cakes, brownies, muffins or cookies “ .320 (.148, .473) 41.0%
T7 Regular chips “ .531 (.389, .649) 43.8%

Active Where Individual Item Test-Retest Reliability – Adolescent Survey (N=120) 36
T8 Baked chips “ .454 (.299, .585) 44.5%
T9 Raw vegetables (e.g. carrots) “ .500 (.354, .623) 45.1%
T10 100% fruit juice “ .618 (.493, .717) 46.9%
T11 Juice drinks (e.g. Snapple, Sunny delight) “ .596 (.467, .701) 44.5%
T12 Regular sodas with sugar “ .655 (.539, .746) 44.6%
T13 Diet or sugar free sodas “ .661 (.547, .752) 49.2%
T14 Sports drinks (e.g. Gatorade) “ .624 (.502, .723) 44.6%
T15 Regular or 2% milk “ .607 (.477, .710) 51.3%
T16 1% or fat-free milk “ .653 (.537, .744) 54.0%
T17 Sweetened breakfast cereal “ .590 (.461, .696) 44.1%
T18 Unsweetened breakfast cereal “ .361 (.195, .507) 38.4%

Active Where Individual Item Test-Retest Reliability – Adolescent Survey (N=120) 37
Section U. Physical activity and your school Coding: U1: missing values recoded to 1 (yes) U2a-c; U3a-c: missing values recoded to 0 U4-10: missing left as missing U11_final-13_final: see “Response option” for recoded values U14r-21r: missing values and don’t know recoded as 0 (no) U22-23: missing values recoded as 0 (no)
Item Number Item Content Response Option ICC Kappa Percent
Agreement
U1 Do you go to school outside your home? 0 = No 1 = Yes .792
U1a What is the name of the school? NA U1b What is the address of the school? NA How many days do you use the following modes of transportation to get to and from school?
Item Number Item Content Response Option ICC (95% CI) Kappa Percent
Agreement
U2a Walk to school 0 – 5 days .510 (.365, .631) 74.2%
U2b Bicycle to school “ .818 (.749, .870) 95.0%
U2c Go by car or bus to school “ .718 (.619, .795) 85.8%
U3a Walk from school “ .599 (.472, .703) 73.2%
U3b Bicycle from school “ .842 (.781, .887) 94.1% U3c Go by car or bus from school “ .676 (.565, .762) 71.7% How much do you agree/ disagree with each of the following statements?

Active Where Individual Item Test-Retest Reliability – Adolescent Survey (N=120) 38
Item Number Item Content Response Option ICC (95% CI) Kappa Percent
Agreement
U4 Other kids my age walk or bike to school by themselves.
1= strongly disagree 2 = somewhat
disagree 3 = somewhat agree 4 = strongly agree
.443 (.284, .579) 51.7%
U5 Other kids my age talk or bike to school with a parent or other adult
“ .236 (.056, .401) 61.4%
U6 Other kids my age think walking or biking to school is “cool”
“ .496 (.344, .623) 46.9%
U7 At my school, the older kids think walking or biking to school is “cool”
“ .304 (.126, .463) 45.9%
U8 I enjoy walking or biking to school “ .686 (.574, .772) 55.8%
U9 I enjoy walking or biking to school with friends “ .490 (.336, .618) 48.7%
U10 I enjoy enjoys walking or biking to school with a parent or other adult
“ .674 (.560, .763) 69.3%
Answer the following questions about your school
Item Number Item Content Response Option ICC (95% CI) Kappa Percent
Agreement
U11_final How often does your school have supervised physical activities after school?
1 = never, don’t know or missing 2 = rarely 3 = sometimes 4 = frequently 5 = always
.266 (.092, .424) 45.8%
U12_final How often does your school allow students to use play areas or fields after school?
“ .571 (.437, .680) 50.0%
U13_final How often does your school allow students to use play areas or fields after lunch?
“ .544 (.405, .658) 60.8%
Active Where Individual Item Test-Retest Reliability – Adolescent Survey (N=120) 39
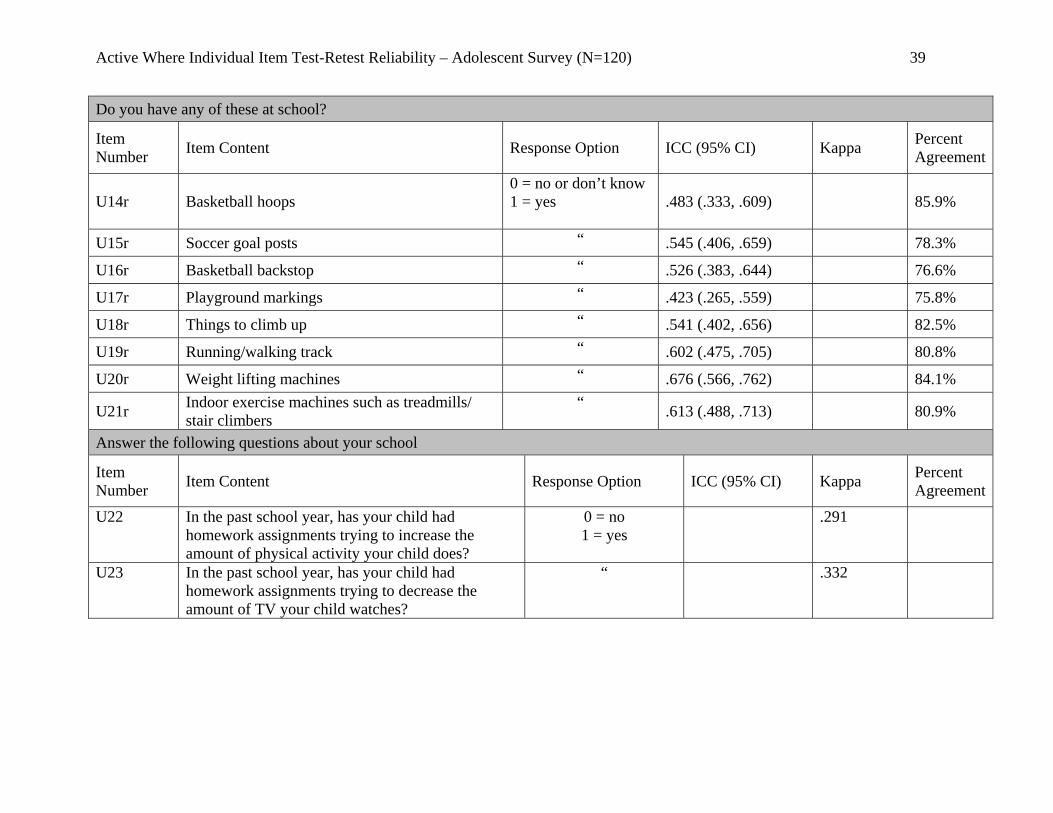
Do you have any of these at school?
Item Number Item Content Response Option ICC (95% CI) Kappa Percent
Agreement
U14r Basketball hoops 0 = no or don’t know 1 = yes
.483 (.333, .609) 85.9%
U15r Soccer goal posts “ .545 (.406, .659) 78.3%
U16r Basketball backstop “ .526 (.383, .644) 76.6%
U17r Playground markings “ .423 (.265, .559) 75.8%
U18r Things to climb up “ .541 (.402, .656) 82.5%
U19r Running/walking track “ .602 (.475, .705) 80.8%
U20r Weight lifting machines “ .676 (.566, .762) 84.1%
U21r Indoor exercise machines such as treadmills/ stair climbers
“ .613 (.488, .713) 80.9%
Answer the following questions about your school
Item Number Item Content Response Option ICC (95% CI) Kappa Percent
Agreement
U22 In the past school year, has your child had homework assignments trying to increase the amount of physical activity your child does?
0 = no 1 = yes
.291
U23 In the past school year, has your child had homework assignments trying to decrease the amount of TV your child watches?
“ .332

Active Where Individual Item Test-Retest Reliability – Adolescent Survey (N=120) 40
Section V. Barriers to walking and biking to school for you Coding: V1a-1b: missing values recoded as 0 (No) V2-18: missing left as missing
Item Number Item Content Response Option ICC (95% CI) Kappa Percent
Agreement
V1a Is your child’s school within a 30 minute walk or bike from your home?
0 = No 1 = Yes .612
V1b Does your child walk or bike to school, either alone or with someone (at least once a week)?
“ .674
Do you agree/disagree with the following statements: It is difficult for me to walk or bike to school (alone or with someone) because …
Item Number Item Content Response Option ICC (95% CI) Kappa Percent
Agreement
V2 There are too many hills along the way
1 = strongly disagree 2 = somewhat disagree 3 = somewhat agree 4 = strongly agree
.494 (.340, .623) 55.8%
V3 There are no sidewalks or bike lanes “ .584 (.447, .694) 62.1%
V4 The route is boring “ .375 (.204, .524) 48.6% V5 The route does not have good lighting “ .488 (.333, .618) 55.4% V6 There is too much traffic along the route “ .601 (.468, .708) 55.8%
V7 There is one or more dangerous crossings “ .606 (.474, .711) 56.7%
V8 I get too hot and sweaty “ .451 (.289, .588) 50.9%

Active Where Individual Item Test-Retest Reliability – Adolescent Survey (N=120) 41
V9 No other children walk or bike to school “ .499 (.345, .627) 46.4%
V10 It’s not considered cool to walk or bike “ .518 (.369, .642) 61.2%
V11 I have too much stuff to carry “ .585 (.449, .695) 51.3%
V12 It is easier for someone to drive me here on the way to something else
“ .434 (.270, .574) 57.3%
V13 It involves too much planning ahead “ .456 (.295, .591) 57.6%
V14 It is unsafe because of crime (strangers, gangs, drugs)
“ .478 (.321, .609) 60.3%
V15 I get bullied, teased, harassed “ .547 (.403, .665) 74.8%
V16 There is nowhere to leave a bike safely “ .492 (.335, .622) 64.7%
V17 There are stray dogs “ .638 (.514, .736) 68.5%
V18 It is too far “ .772 (.685, .838) 72.0%

Active Where Individual Item Test-Retest Reliability – Adolescent Survey (N=120) 42
Section W: Food and your school Coding: W1: missing values recoded as 0 (no) W2: missing values recoded as 0 (never) W3-10; W3a-10a: missing left as missing W11-15; W11a-15a; W19-20; W19a-20a: missing left as missing W16r-18r: “don’t know” and missing values recoded to 0 (no) Circle the answer that best applies to you and your school
Item Number Item Content Response
Option ICC (95% CI) Kappa Percent Agreement
W1
In the past school year, have you had homework and assignments trying to improve your eating habits, such as eating more fruits and vegetables or drinking fewer sugary drinks?
0 = no 1 = yes .283
W2 How often does your school send home information about the nutritional content of the foods offered at school?
0 = never 1 = rarely 2 = sometimes 3 = frequently 4 = always
.337 (.169, .486) 55.9%
W3 Are there food vending machines at your school? 0 = no 1 = yes .767
W3a If yes, how many days per week do you use them?
0 = 0 days 1 = 1day 2 = 2 days 3 = 3 days 4 = 4 days 5 = 5 days
.474 (.275, .633) 43.7%
W4 Are there food vending machines at your school that offer only “healthy” foods, including fruit?
0 = no 1 = yes .434
W4a If yes, how many days per week do you use them? 0 = 0 days 1 = 1day .390 (-.186, .773) 41.7%
Active Where Individual Item Test-Retest Reliability – Adolescent Survey (N=120) 43
2 = 2 days 3 = 3 days 4 = 4 days 5 = 5 days
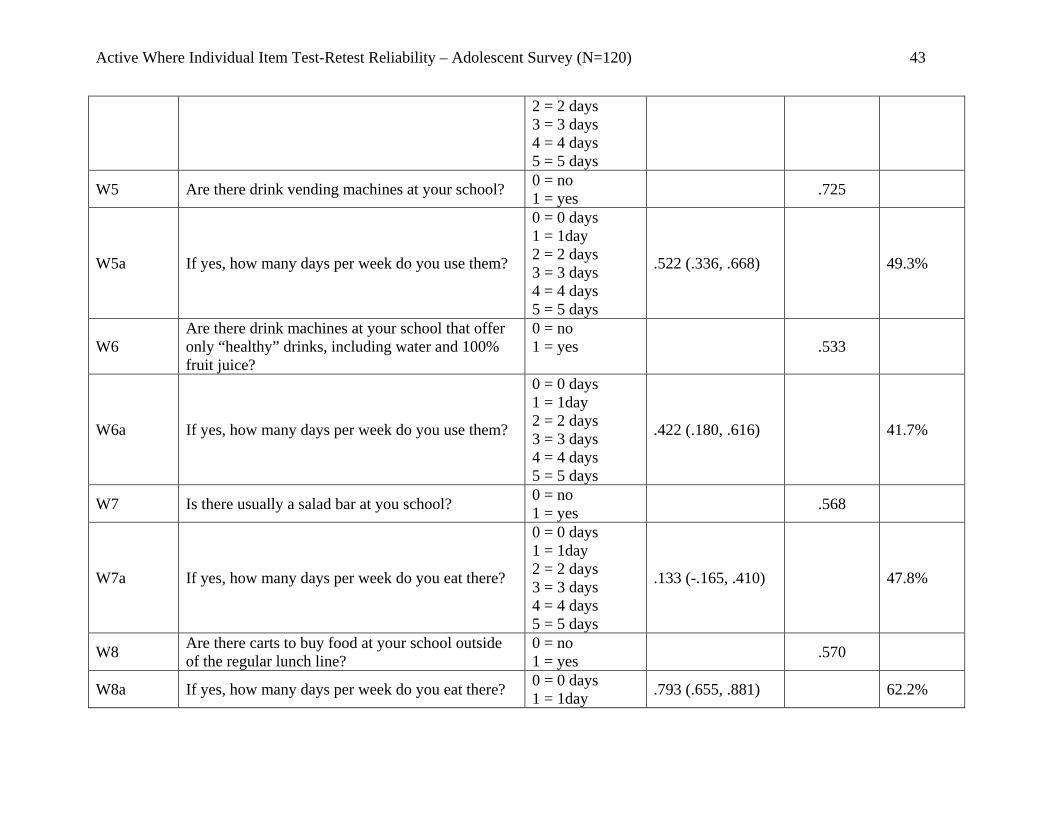
W5 Are there drink vending machines at your school? 0 = no 1 = yes .725
W5a If yes, how many days per week do you use them?
0 = 0 days 1 = 1day 2 = 2 days 3 = 3 days 4 = 4 days 5 = 5 days
.522 (.336, .668) 49.3%
W6 Are there drink machines at your school that offer only “healthy” drinks, including water and 100% fruit juice?
0 = no 1 = yes .533
W6a If yes, how many days per week do you use them?
0 = 0 days 1 = 1day 2 = 2 days 3 = 3 days 4 = 4 days 5 = 5 days
.422 (.180, .616) 41.7%
W7 Is there usually a salad bar at you school? 0 = no 1 = yes .568
W7a If yes, how many days per week do you eat there?
0 = 0 days 1 = 1day 2 = 2 days 3 = 3 days 4 = 4 days 5 = 5 days
.133 (-.165, .410) 47.8%
W8 Are there carts to buy food at your school outside of the regular lunch line?
0 = no 1 = yes .570
W8a If yes, how many days per week do you eat there? 0 = 0 days 1 = 1day .793 (.655, .881) 62.2%

Active Where Individual Item Test-Retest Reliability – Adolescent Survey (N=120) 44
2 = 2 days 3 = 3 days 4 = 4 days 5 = 5 days
W9 Are name-brand fast foods served at your school (like Pizza Hut or Taco Bell)?
0 = no 1 = yes .694
W9a If yes, how many days per week do you eat there?
0 = 0 days 1 = 1day 2 = 2 days 3 = 3 days 4 = 4 days 5 = 5 days
.688 (.477, .824) 65.7%
W10 Is there a student store at your school that sells food?
0 = no 1 = yes .699
W10a If yes, how many days per week do you eat there?
0 = 0 days 1 = 1day 2 = 2 days 3 = 3 days 4 = 4 days 5 = 5 days
.688 (.477, .824) 42.2%
W11 Is it permitted for you to go off-campus during lunch time?
0 = no 1 = yes .742
W11a How many days per week do you eat off-campus?
0 = 0 days 1 = 1day 2 = 2 days 3 = 3 days 4 = 4 days 5 = 5 days
.732 (.485, .872) 68.0%
W12 How often do clubs or other groups sell candy at your school?
“ .619 (.491, .721) 48.6%
W13 How many days do you typically eat breakfast at school?
“ .649 (.527, .744) 89.5%
W14 How many days do you typically get lunch in the “ .831 (.764, .881) 68.8%

Active Where Individual Item Test-Retest Reliability – Adolescent Survey (N=120) 45
cafeteria line?
W15 How many days do you typically bring lunch from home?
“ .736 (.639, .809) 67.8%
W16r Is there a fruit and vegetable market within a 5- minute walk from your school?
0 = no 1 = yes .415
W17r Is there a convenience store/ corner shop/ bodega within a 5-minute walk from your school?
“ .515
W18r Is there a fast food restaurant within a 5-minute walk from your school?
“ .550
W19 During a normal school week, how m any days per week do you get lunch off campus at a fast food restaurant?
0 = 0 days 1 = 1day 2 = 2 days 3 = 3 days 4 = 4 days 5 = 5 days
.503 (.354, .628) 71.3%
W20 During a normal school week, how many days per week do you get lunch off campus at a convenience store?
“ .550 (.409, 665) 76.4%


