Avon Products av95855a1 Proof 1 The Avon Opportunity · Avon Products av95855a1 Proof 1 The Avon...
92
The Avon Opportunity Annual Report 2008 Dawn Parrino, Avon Independent Sales Representative
Transcript of Avon Products av95855a1 Proof 1 The Avon Opportunity · Avon Products av95855a1 Proof 1 The Avon...

Avon Products av95855a1 Proof 1
The Avon OpportunityAnnual Repor t 2008
Dawn Parrino, Avon Independent Sales Representative
av95855a.indd 1av95855a.indd 1 3/12/09 9:45:54 AM3/12/09 9:45:54 AM

Avon Products av95855a2 Proof 1
“ I was amazed. I was astonished. I just thought
I would make a little bit of extra pocket money
and here I was making a signifcant
amount of money.”
– Dawn Parrino, Avon Independent Sales Representative
av95855a.indd 2av95855a.indd 2 3/6/09 10:33:08 AM3/6/09 10:33:08 AM
Annua l Repor t 2008
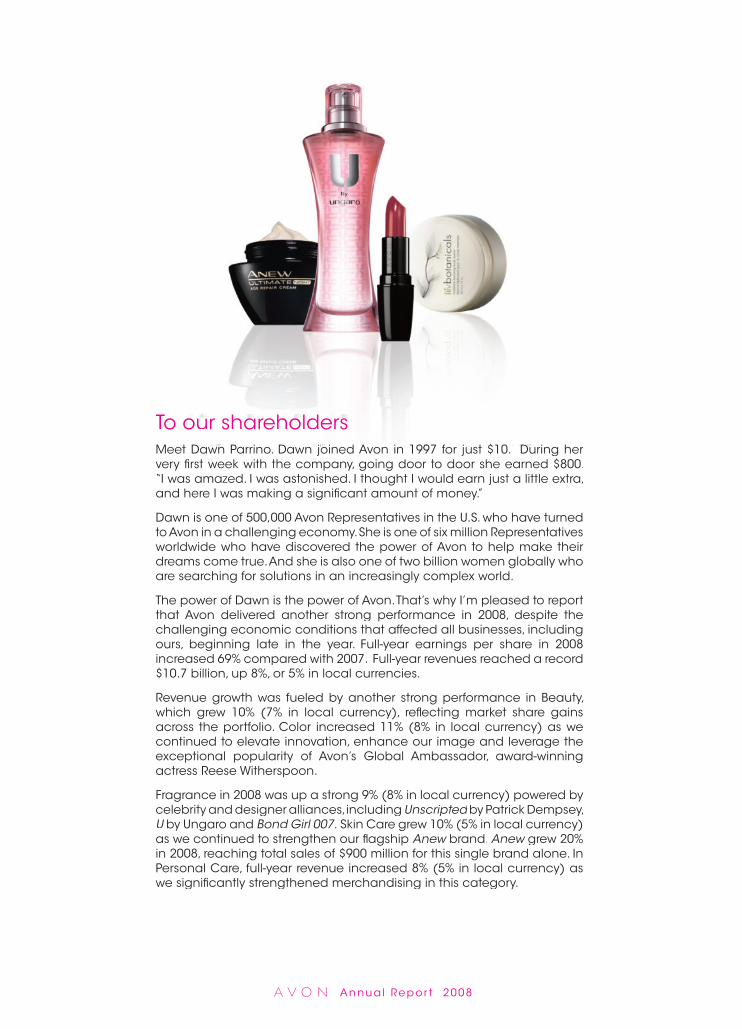
TTo our shareholdersMeet Dawn Parrino. Dawn joined Avon in 1997 for just $10. During her Meet Dawn Parrino. Dawn joined Avon in 1997 for just $10. During hevery fi rst week with the company, going door to door she earned $800. very fi rst week with the company, going door to door she earned $80“I was amazed. I was astonished. I thought I would earn just a little extra, I was amazed. I was astonished. I thought I would earn just a little extraand here I was making a signifi cant amount of money.” and here I was making a significant amount of money”
Dawn is one of 500,000 Avon Representatives in the U.S. who have turned to Avon in a challenging economy. She is one of six million Representatives worldwide who have discovered the power of Avon to help make their dreams come true. And she is also one of two billion women globally who are searching for solutions in an increasingly complex world.
The power of Dawn is the power of Avon. That’s why I’m pleased to report that Avon delivered another strong performance in 2008, despite the challenging economic conditions that affected all businesses, including ours, beginning late in the year. Full-year earnings per share in 2008 increased 69% compared with 2007. Full-year revenues reached a record $10.7 billion, up 8%, or 5% in local currencies.
Revenue growth was fueled by another strong performance in Beauty, which grew 10% (7% in local currency), refl ecting market share gains across the portfolio. Color increased 11% (8% in local currency) as we continued to elevate innovation, enhance our image and leverage the exceptional popularity of Avon’s Global Ambassador, award-winning actress Reese Witherspoon.
Fragrance in 2008 was up a strong 9% (8% in local currency) powered by celebrity and designer alliances, including Unscripted by Patrick Dempsey, dU by Ungaro andU Bond Girl 007. Skin Care grew 10% (5% in local currency) as we continued to strengthen our fl agship Anew brand. w Anew grew 20% win 2008, reaching total sales of $900 million for this single brand alone. In Personal Care, full-year revenue increased 8% (5% in local currency) as we signifi cantly strengthened merchandising in this category.
Avon Products av96244a1 Proof 1
Cyan Magenta Yellow Blackav96244a 1av96244a 1 3/7/09 7:57:59 AM3/7/09 7:57:59 AM
In addition to these positive performances across all of our Beauty categories, in 2008 Active Representatives increased a strong 7%. Representative growth was broad-based across geographies as we continued to aggressively invest in initiatives to improve the Avon earning opportunity and make it easier for our Representatives to sell and run their businesses.
A Year in Two Chapters We feel very good about our revenue growth in 2008, but for Avon, as for most companies, the story of the year was a tale in two chapters. Following three quarters of strong performance, our revenue results in the fourth quarter were impacted by the worsening global economic environment as well as by very signifi cant negative movements in foreign exchange rates.
These volatile external headwinds also impacted our operating margin results. For the fi rst three quarters of the year, we tracked ahead of our full-year operating margin goal to approach 2005’s level of 14%. However, the negative impact of foreign currency exchange and slowing local currency revenue growth signifi cantly affected fourth-quarter profi ts. As a result, we achieved a full-year 2008 operating margin of 12.5%, below our original expectation but still a full 370-basis point improvement over 2007’s operating margin of 8.8%.
In terms of 2009, it would be safe to say that none of us have a crystal ball for how the year will play out. The unprecedented scale of the global economic downturn and the magnitude of the foreign currency exchange impact will certainly continue to pressure businesses around the globe. It is prudent to assume that these pressures will continue for the foreseeable future, so we are fully prepared to manage through a very challenging year.
Having said that, I believe that we enter this period of unprecedented headwinds with three exceptional competitive assets that position us to emerge as an even stronger and healthier business when the economy improves. These assets include:
• progress with our turnaround plan which has given us a stronger foundation for success;
• our fundamentally advantaged business model which offers both an income-generating opportunity and “smart value” products;
• and third, our decades of experience managing through economic downturns.
Progress with Our Four-Point Turnaround Plan At the end of 2005, Avon embarked on a bold journey to transform the business and position the company for sustainable growth over the long term. As a result, Avon is a far stronger business today than we were just three short years ago.
We have signifi cantly enhanced the competi-tiveness of our iconic beauty brand through an elevated focus on product innovation. We have also achieved breakthrough levels of awareness with the launch of our new “Hello Tomorrow” advertising campaign. Our overall advertising expenditure of nearly $400 million in 2008 was almost three times the amount we invested in 2005. These investments have helped strengthen our brand image and have enabled us to command higher price points for many of our most innovative products, par-ticularly in Skin Care and Fragrance.
As part of our turnaround, we have also invested an incremental $200 million to improve the value proposition for our Representatives. This has included improving commission structures in key growth markets around the world. We have also accelerated the roll out of our Sales Leadership program, which allows our Representatives to earn two ways: by selling to customers and by recruiting other Representatives. In 2005, only fi ve markets had implemented Sales Leadership; today more than 30 markets are providing this increased earning opportunity to their Representatives.
While improving earnings, we have also ag-gressively expanded the web-based tools available to help our Representatives man-age their businesses. In fact today, 25 of our markets boast online ordering rates of 50% or more, with these numbers rising every day.
To help fund these investments, over the past three years we have dramatically transformed our cost structure through a set of bold initiatives including a multi-year restructuring, the simplifi cation of our product line, and a strategic sourcing program that leverages our global scale and buying power. Previously estimated to deliver $830 million in savings and benefi ts, these programs are overachieving their targets and are now expected to yield nearly $900 million in savings and benefi ts when fully implemented in 2011-2012.
Avon Products av96244a2 Proof 1
Cyan Magenta Yellow Blackav96244a 2av96244a 2 3/7/09 7:58:00 AM3/7/09 7:58:00 AM
Annual Report 2008
With many aspects of those programs successfully completed, we now have the management capacity to undertake new cost opportunities. In February 2009, we announced a new restructuring program that is targeted to deliver annualized savings of approximately $200 million by 2012–2013.
Even beyond these programs, we have embedded a “constant turnaround mentality” throughout the organization, refl ecting our commitment to continually drive costs out of the business. Over the past three years, we have focused on achieving zero overhead growth. In 2009, we are accelerating our aggressive focus on cost reduction to deliver negative overhead growth in response to the challenging macro environment.
Avon’s Advantaged Business Model The second competitive asset we will leverage in 2009 is Avon’s advantaged business model, which is uniquely suited to adjust to times like these. With unemployment increasing in many countries, and with recessionary fears spreading, promoting Avon’s income-generating opportunity will be one of our most critical areas of focus in 2009.
Avon is the largest engine of economic opportunity for women on earth. We sell to our Representatives on credit, so that for the most part, our Representatives don’t pay us until they get paid by their customers. This makes us the largest microlender to women. Additionally, unlike other entrepreneurial opportunities, there is minimal cost to start an Avon business. Our brand name has 90% recognition worldwide and is consistently listed as one of the world’s top global brands. So Representatives are selling products that consumers know and want.
With these strengths, in 2009 we are shifting a greater portion of our total advertising budget against our Representative recruiting effort, doubling both the amount we spend and the number of markets where we advertise Avon’s earning opportunity. We are also strengthening this advertising to address people’s concerns in the current economy, with messages like: “I can’t get fi red. I can’t lose my job. This is my business.” We are also seeking high-profi le venues to share this message, such as the 30-second advertising spot we recently ran during the pre-game show of the U.S. Super Bowl.
We are supporting this advertising with equally high-profi le public relations opportunities, including a recent appearance by several Avon U.S. Representatives on Good Morning America, and similar appearances in key markets around the world. We are also capital-izing on many other different venues to get our messages to the public. These include show-casing the Avon earning opportunity at career fairs and on internet job sites, as well as more prominent focus on Avon’s own internet home page and in our brochure, which is one of the highest circulation publications in the world.
In addition to Representative recruiting, in 2009 we will ensure that our sales brochure offers consumers a far greater amount of products in the under $5 or equivalent range to meet the needs of increasingly value-conscious consumers. Avon offers a broad product assortment at every price point and we also have full control over our store—the Avon brochure. This gives us the fl exibility to quickly rebalance our product mix as consumer needs shift.
We have also sharpened our “smart value” messaging. This includes creating special value sections in sales brochures around the world as well as separate fl yers and mini-brochures. For example, a sales fl yer in the U.K. features the cover line: “Want to Be Beautiful on a Budget?” The message here is not about discounting. The goal is to remind consumers of our everyday low prices. Or as we say in one of the mini-brochures: “Forget one-day discounts. Avon prices will always be appealing because we believe that women should look and feel fabulous for less.” In addition, we are combining this “smart value” focus with clear messages about the ease of the Avon shopping experience compared with retail, emphasizing personal home delivery by Avon Representatives with no delivery fee.
A History of Experience By accelerating our focus in 2009 on these recruiting and “smart value” strategies, our goal is to outrun the contraction in consumer spending and protect our market share. This is the strategy we have relied on during fi nancial crises in the past, and each time we have emerged stronger and better.
Avon Products av96244a3 Proof 1
Cyan Magenta Yellow Blackav96244a 3av96244a 3 3/7/09 7:58:00 AM3/7/09 7:58:00 AM
Avon Products av96244a4 Proof 1
Cyan Magenta Yellow Black
A company doesn’t get to be 123 years old as Avon is without learning to navigate economic downturns. During challenging times like these, we are fortunate to have a leadership team on the ground that is steeped in experience. Our general manager in Brazil, Luis Felipe Miranda, for example, is a 30-year veteran who spent many years in Venezuela, leading that market through nearly constant crisis. Our general manager in Mexico, Jorge Martinez Quiroga, is another 30-plus year Avon leader who led Argentina through that market’s fi nancial crisis in 2001. In both European business units, as we confront volatile currency movements, we are fortunate to have two regional operating leaders with nearly 60 years of combined experience between them.
Even during the Great Depression, Avon’s model thrived on aggressively reaching for new customers and Representatives. So history says we have met each challenge with success. And each time, we’ve emerged stronger and healthier as a company.
There is no doubt that 2009 will be one of the most challenging periods in business history. With the world on edge, fear can trump fundamentals, but Avon has proven time and time again that fundamentals can trump fear. We have a proven track record and the right playbook for challenging times. Our world-famous direct selling channel and iconic beauty brand continue to provide unparalleled advantage.
And beyond this, Avon remains a fi nancially stable company. We ended 2008 with $1.1 billion in cash, and we continue to have an investment grade debt rating and full access to credit markets. As a sign of our fi nancial stability, our Board of Directors in early February approved a 5% increase in our dividend for 2009, the 19th consecutive year of an increase in our regular dividend to shareholders.
So we begin 2009 on a strong foundation. Our commitment to Avon shareholders is that we’re going to keep on doing all the right things for the business, just as we have always done -- opening new doors and bringing new Representatives and customers into our store. We will build on our progress with our turnaround, our advantaged business model and our 123 years of experience as one of the most admired and successful companies in the world. We will do what we know how to do, but also what we need to do to ensure that we emerge a much stronger company, as we always have.
In closing, I want to thank our almost six million Avon Representatives and approximately 42,000 associates around the globe for their dedication and commitment to the company. I also want to recognize our outstanding Board of Directors for their invaluable guidance and counsel. And fi nally, I would like to acknowledge you, the Avon shareholder, for supporting and believing in our management team.
You have our commitment that Avon will stay the course on our continuing journey to sustainable profi table growth. Our destination remains unchanged: being the solution for Dawn Parrino and for the six million other Dawns who touch hundreds of millions of women across the globe. During these unprecedented times when the world is full of questions, we fi rmly believe that now more than ever, Avon can be the answer.
Andrea Jung
March, 2009
av96244a 4av96244a 4 3/7/09 7:58:00 AM3/7/09 7:58:00 AM
UNITED STATESSECURITIES AND EXCHANGE COMMISSION
Washington, D.C. 20549---------------------------------------------------------------
FORM 10-K
[x] Annual Report Pursuant to Section 13 or 15(d)of the Securities Exchange Act of 1934
For the fiscal year ended December 31, 2008
OR
[ ] Transition Report Pursuant to Section 13 or 15(d)of the Securities Exchange Act of 1934
For the transition period from to
Commission file number 1-4881
AVON PRODUCTS, INC.---------------------------------------------------------------(Exact name of registrant as specified in its charter)
New York 13-0544597--------------------------------------------------------------
(State or other jurisdiction ofincorporation or organization)
(I.R.S. EmployerIdentification No.)
1345 Avenue of the Americas, New York, N.Y. 10105-0196(Address of principal executive offices)
(212) 282-5000(Registrant’s telephone number, including area code)
Securities registered pursuant to Section 12(b) of the Act:
Title of each className of each exchange on
which registered------------------------------------------------------------------
Common stock (par value $.25) New York Stock Exchange
Securities registered pursuant to Section 12(g) of the Act: None
Indicate by check mark if the registrant is a well-known seasoned issuer, as defined in Rule 405 of the Securities Act.Yes È No ‘
Indicate by check mark if the registrant is not required to file reports pursuant to Section 13 or Section 15(d) of the Act.Yes ‘ No È
Indicate by check mark whether the registrant (1) has filed all reports required to be filed by Section 13 or 15(d) of theSecurities Exchange Act of 1934 during the preceding 12 months (or for such shorter period that the registrant was requiredto file such reports), and (2) has been subject to such filing requirements for the past 90 days. Yes È No ‘
Indicate by check mark if disclosure of delinquent filers pursuant to Item 405 of Regulation S-K is not contained herein, andwill not be contained, to the best of registrant’s knowledge, in definitive proxy or information statements incorporated byreference in Part III of this Form 10-K or any amendment to this Form 10-K. ‘
Indicate by check mark whether the registrant is a large accelerated filer, an accelerated filer, a non-accelerated filer, or asmaller reporting company. See the definitions of “large accelerated filer,” “accelerated filer” and “smaller reporting com-pany” in Rule 12b-2 of the Exchange Act.
Large accelerated filer È Accelerated filer ‘
Non-accelerated filer ‘ (Do not check if a smaller reporting company) Smaller reporting company ‘
Indicate by check mark whether the registrant is a shell company (as defined in Rule 12b-2 of the Act).Yes ‘ No È
The aggregate market value of voting and non-voting Common Stock (par value $.25) held by non-affiliates at June 30, 2008(the last business day of our most recently completed second quarter) was $15.3 billion.
The number of shares of Common Stock (par value $.25) outstanding at January 31, 2009, was 426,348,493.
Documents Incorporated by Reference
Parts II and III – Portions of the registrant’s Proxy Statement relating to the 2009 Annual Meeting of Shareholders.
A V O N 2008 1

Table of ContentsPart I
6Item 1 Business
10Item 1A Risk Factors
16Item 1B Unresolved StaffComments
16Item 2 Properties
16Item 3 Legal Proceedings
16Item 4 Submission of Mattersto a Vote of Security Holders
Part II
17Item 5 Market for Registrant’sCommon Equity, RelatedStockholder Matters andIssuer Purchases of EquitySecurities
19Item 6 Selected FinancialData
20Item 7 Management’s Dis-cussion and Analysis ofFinancial Condition andResults of Operations
36Item 7A Quantitative andQualitative DisclosuresAbout Market Risk
37Item 8 Financial Statementsand Supplementary Data
37Item 9 Changes in andDisagreements withAccountants on Accountingand Financial Disclosure
37Item 9A Controls andProcedures
38Item 9B Other Information
Part III
39Item 10 Directors, ExecutiveOfficers and CorporateGovernance
39Item 11 ExecutiveCompensation
39Item 12 Security Ownershipof Certain Beneficial Ownersand Management andRelated Stockholder Matters
39Item 13 Certain Relationshipsand Related Transactions, andDirector Independence
39Item 14 Principal AccountantFees and Services
Part IV
40Item 15 Exhibits and FinancialStatement Schedule
4015 (a) 1 Consolidated Finan-cial Statements
4015 (a) 2 Financial StatementSchedule
4015 (a) 3 Index to Exhibits
44Signatures
A V O N 2008 3

CAUTIONARY STATEMENT FOR PURPOSES OF THE “SAFE HARBOR”
STATEMENT UNDER THE PRIVATE SECURITIES LITIGATION REFORM
ACT OF 1995
Statements in this report that are not historical facts or infor-mation are forward-looking statements within the meaning of thePrivate Securities Litigation Reform Act of 1995. Words such as“estimate,” “project,” “forecast,” “plan,” “believe,” “may,”“expect,” “anticipate,” “intend,” “planned,” “potential,” “can,”“expectation” and similar expressions, or the negative of thoseexpressions, may identify forward-looking statements. Suchforward-looking statements are based on management’s reason-able current assumptions and expectations. Such forward-lookingstatements involve risks, uncertainties and other factors, whichmay cause the actual results, levels of activity, performance orachievement of Avon to be materially different from any futureresults expressed or implied by such forward-looking statements,and there can be no assurance that actual results will not differmaterially from management’s expectations. Such factors include,among others, the following:
• our ability to implement the key initiatives of and realize theoperating margins and projected benefits (in the amounts andtime schedules we expect) from our global business strategy,including our multi-year restructuring initiatives, product mixand pricing strategies, enterprise resource planning, customerservice initiatives, product line simplification program, salesand operation planning process, strategic sourcing initiative,outsourcing strategies, zero-overhead-growth philosophy,cash flow from operations and cash management, tax, foreigncurrency hedging and risk management strategies;
• our ability to realize the anticipated benefits (including anyprojections concerning future revenue and operating marginincreases) from our multi-year restructuring initiatives or otherstrategic initiatives on the time schedules or in the amountsthat we expect, and our plans to invest these anticipatedbenefits ahead of future growth;
• the possibility of business disruption in connection with ourmulti-year restructuring initiatives or other strategic initiatives;
• our ability to realize sustainable growth from our investmentsin our brand and the direct-selling channel;
• a general economic downturn, a recession globally or in oneor more of our geographic regions, such as North America, orsudden disruption in business conditions, and the ability of ourbroad-based geographic portfolio to withstand such economicdownturn, recession or conditions;
• the inventory obsolescence and other costs associated withour product line simplification program;
• our ability to effectively implement initiatives to reduceinventory levels in the time period and in the amounts weexpect;
• our ability to achieve growth objectives or maintain rates ofgrowth, particularly in our largest markets and developing andemerging markets;
• our ability to successfully identify new business opportunitiesand identify and analyze acquisition candidates, and our abilityto negotiate and consummate acquisitions as well as to suc-cessfully integrate or manage any acquired business;
• the effect of political, legal and regulatory risks, as well asforeign exchange or other restrictions, imposed on us, ouroperations or our Representatives by governmental entities;
• our ability to successfully transition our business in China inconnection with the resumption of direct selling in that marketin 2006, our ability to operate using the direct-selling modelpermitted in that market and our ability to retain and increasethe number of Active Representatives there over a sustainedperiod of time;
• the effect of economic factors, including inflation and fluctua-tions in interest rates and currency exchange rates, and thepotential effect of such fluctuations on our business, results ofoperations and financial condition;
• general economic and business conditions in our markets,including social, economic and political uncertainties in theinternational markets in our portfolio;
• any consequences of the internal investigation of our Chinaoperations;
• information technology systems outages, disruption in oursupply chain or manufacturing and distribution operations, orother sudden disruption in business operations beyond ourcontrol as a result of events such as acts of terrorism or war,natural disasters, pandemic situations and large scale poweroutages;
• the risk of product or ingredient shortages resulting from ourconcentration of sourcing in fewer suppliers;
• the quality, safety and efficacy of our products;• the success of our research and development activities;• our ability to attract and retain key personnel and executives;• competitive uncertainties in our markets, including competi-
tion from companies in the cosmetics, fragrances, skin careand toiletries industry, some of which are larger than we areand have greater resources;
• our ability to implement our Sales Leadership program glob-ally, to generate Representative activity, to enhance the Repre-sentative experience and increase Representative productivitythrough investments in the direct-selling channel, and to com-pete with other direct-selling organizations to recruit, retainand service Representatives;
• the impact of the seasonal nature of our business, adverseeffect of rising energy, commodity and raw material prices,changes in market trends, purchasing habits of our consumersand changes in consumer preferences, particularly given theglobal nature of our business and the conduct of our businessin primarily one channel;
• our ability to protect our intellectual property rights;• the risk of an adverse outcome in our material pending and
future litigations;• our ratings and our access to financing and ability to secure
financing at attractive rates; and• the impact of possible pension funding obligations, increased
pension expense and any changes in pension regulations orinterpretations thereof on our cash flow and results ofoperations.
We undertake no obligation to update any such forward-looking
statements.
A V O N 2008 5
PART I
Dollars in Millions
ITEM 1. BUSINESS
GeneralWe commenced operations in 1886 and were incorporated in
the State of New York on January 27, 1916. We are a global
manufacturer and marketer of beauty and related products. We
conduct our business in the highly competitive beauty industry
and compete against other consumer packaged goods (“CPG”)
and direct-selling companies to create, manufacture and market
beauty and beauty-related products. Beginning in the fourth
quarter of 2008, we changed our product categories from Beau-
ty, Beauty Plus and Beyond Beauty to Beauty, Fashion and Home.
Beauty consists of cosmetics, fragrances, skin care and toiletries
(“CFT”). Fashion consists of fashion jewelry, watches, apparel,
footwear and accessories. Home consists of gift and decorative
products, housewares, entertainment and leisure, children’s and
nutritional products. Sales from Health and Wellness products
and mark., a global cosmetics brand that focuses on the market
for young women, are included among these three categories
based on product type.
Unlike most of our CPG competitors, which sell their products
through third-party retail establishments (e.g., drug stores,
department stores), our business is conducted worldwide primar-
ily in one channel, direct selling. Our reportable segments are
based on geographic operations in six regions: Latin America;
North America; Central & Eastern Europe; Western Europe,
Middle East & Africa; Asia Pacific; and China. We also centrally
manage Brand Marketing, Supply Chain and Sales organizations.
Financial information relating to our reportable segments is
included in the “Segment Review” section within Management’s
Discussion and Analysis of Financial Condition and Results of
Operations (“MD&A”) on pages 20 through 36 of this 2008
Annual Report on Form 10-K, and in Note 12, Segment Infor-
mation, on pages F-26 through F-27 of this 2008 Annual Report
on Form 10-K. Information about geographic areas is included in
Note 12, Segment Information, on pages F-26 through F-27 of
this 2008 Annual Report on Form 10-K.
Strategic InitiativesIn November 2005, we launched a comprehensive, multi-year
turnaround plan to restore sustainable growth. Our four-point
turnaround plan includes:
• Committing to brand competitiveness by focusing research
and development resources on product innovation and by
increasing our advertising;
• Winning with commercial edge by more effectively utilizing
pricing and promotion, expanding our Sales Leadership
program and improving the attractiveness of our Representa-
tive earnings opportunity as needed;
• Elevating organizational effectiveness by redesigning our
structure to eliminate layers of management in order to take
full advantage of our global scale and size; and
• Transforming the cost structure so that our costs are aligned
to our revenue growth and remain so.
Over the past three years we have been implementing our turn-
around plan through various strategic initiatives, including our
multi-year restructuring plan, product line simplification program
(“PLS”), strategic sourcing initiative (“SSI”) and investments in
advertising and our Representatives. Additional information regard-
ing our strategic initiatives is included in the “Overview” and
“Strategic Initiatives” sections within MD&A on pages 20 through
23 and additional information regarding our inventory is included in
the “Provisions for Inventory Obsolescence” and “Liquidity and
Capital Resources” sections within MD&A on pages 24 and 33
through 36 of this 2008 Annual Report on Form 10-K.
DistributionWe presently have sales operations in 66 countries and terri-
tories, including the U.S., and distribute our products in 44
more. Unlike most of our competitors, which sell their products
through third party retail establishments (i.e. drug stores, depart-
ment stores), Avon primarily sells its products to the ultimate
consumer through the direct-selling channel. In Avon’s case,
sales of our products are made to the ultimate consumer princi-
pally through the direct selling by 5.8 million active independent
Avon Representatives, approximately 457,000 of whom are in
the U.S. Representatives are independent contractors, not em-
ployees of Avon. Representatives earn a profit by purchasing
products directly from us at a discount from a published bro-
chure price and selling them to their customers, the ultimate
consumer of Avon’s products. We generally have no arrange-
ments with end users of our products beyond the Represen-
tative, except as described below. No single Representative
accounts for more than 10% of our net sales.
A Representative contacts customers directly, selling primarily
through the Avon brochure, which highlights new products and
special promotions for each sales campaign. In this sense, the
Representative, together with the brochure, are the “store”
through which Avon products are sold. A brochure introducing a
new sales campaign is usually generated every two weeks in the
U.S. and every two to four weeks for most markets outside the
U.S. Generally, the Representative forwards an order for a cam-
paign to us using the mail, the Internet, telephone, or fax. This
order is processed and the products are assembled at a dis-
tribution center and delivered to the Representative usually
through a combination of local and national delivery companies.
Generally, the Representative then delivers the merchandise and
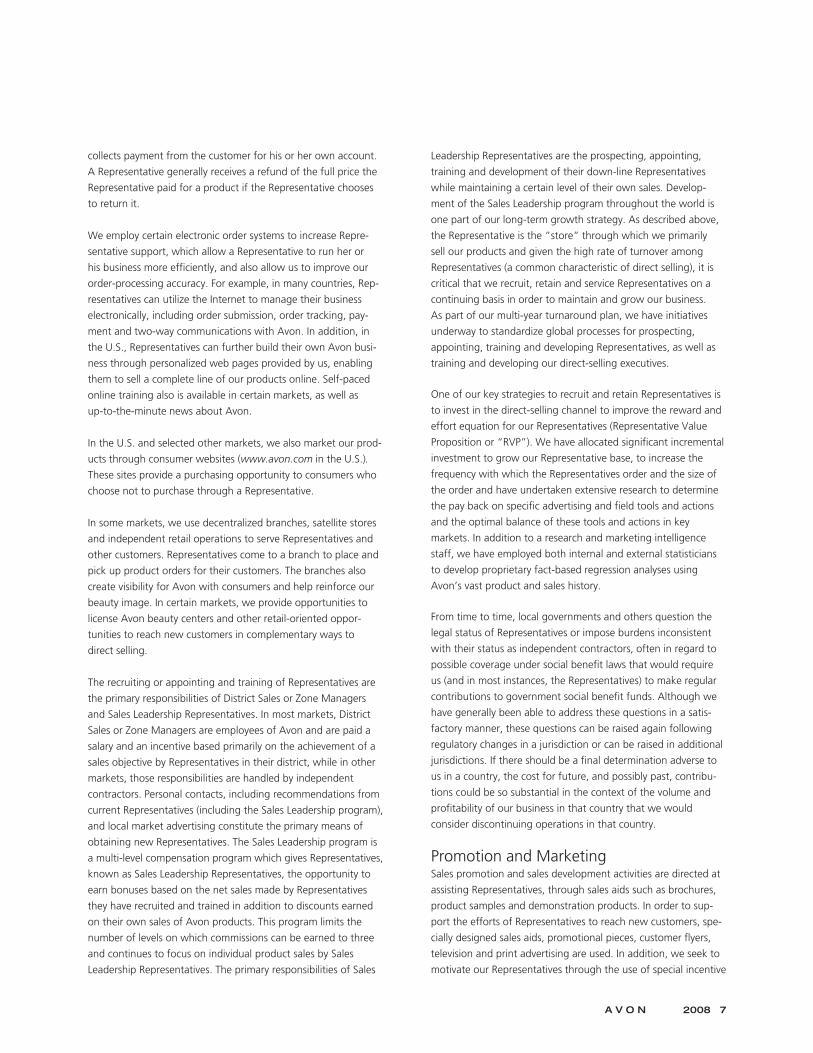
collects payment from the customer for his or her own account.
A Representative generally receives a refund of the full price the
Representative paid for a product if the Representative chooses
to return it.
We employ certain electronic order systems to increase Repre-
sentative support, which allow a Representative to run her or
his business more efficiently, and also allow us to improve our
order-processing accuracy. For example, in many countries, Rep-
resentatives can utilize the Internet to manage their business
electronically, including order submission, order tracking, pay-
ment and two-way communications with Avon. In addition, in
the U.S., Representatives can further build their own Avon busi-
ness through personalized web pages provided by us, enabling
them to sell a complete line of our products online. Self-paced
online training also is available in certain markets, as well as
up-to-the-minute news about Avon.
In the U.S. and selected other markets, we also market our prod-
ucts through consumer websites (www.avon.com in the U.S.).
These sites provide a purchasing opportunity to consumers who
choose not to purchase through a Representative.
In some markets, we use decentralized branches, satellite stores
and independent retail operations to serve Representatives and
other customers. Representatives come to a branch to place and
pick up product orders for their customers. The branches also
create visibility for Avon with consumers and help reinforce our
beauty image. In certain markets, we provide opportunities to
license Avon beauty centers and other retail-oriented oppor-
tunities to reach new customers in complementary ways to
direct selling.
The recruiting or appointing and training of Representatives are
the primary responsibilities of District Sales or Zone Managers
and Sales Leadership Representatives. In most markets, District
Sales or Zone Managers are employees of Avon and are paid a
salary and an incentive based primarily on the achievement of a
sales objective by Representatives in their district, while in other
markets, those responsibilities are handled by independent
contractors. Personal contacts, including recommendations from
current Representatives (including the Sales Leadership program),
and local market advertising constitute the primary means of
obtaining new Representatives. The Sales Leadership program is
a multi-level compensation program which gives Representatives,
known as Sales Leadership Representatives, the opportunity to
earn bonuses based on the net sales made by Representatives
they have recruited and trained in addition to discounts earned
on their own sales of Avon products. This program limits the
number of levels on which commissions can be earned to three
and continues to focus on individual product sales by Sales
Leadership Representatives. The primary responsibilities of Sales
Leadership Representatives are the prospecting, appointing,
training and development of their down-line Representatives
while maintaining a certain level of their own sales. Develop-
ment of the Sales Leadership program throughout the world is
one part of our long-term growth strategy. As described above,
the Representative is the “store” through which we primarily
sell our products and given the high rate of turnover among
Representatives (a common characteristic of direct selling), it is
critical that we recruit, retain and service Representatives on a
continuing basis in order to maintain and grow our business.
As part of our multi-year turnaround plan, we have initiatives
underway to standardize global processes for prospecting,
appointing, training and developing Representatives, as well as
training and developing our direct-selling executives.
One of our key strategies to recruit and retain Representatives is
to invest in the direct-selling channel to improve the reward and
effort equation for our Representatives (Representative Value
Proposition or “RVP”). We have allocated significant incremental
investment to grow our Representative base, to increase the
frequency with which the Representatives order and the size of
the order and have undertaken extensive research to determine
the pay back on specific advertising and field tools and actions
and the optimal balance of these tools and actions in key
markets. In addition to a research and marketing intelligence
staff, we have employed both internal and external statisticians
to develop proprietary fact-based regression analyses using
Avon’s vast product and sales history.
From time to time, local governments and others question the
legal status of Representatives or impose burdens inconsistent
with their status as independent contractors, often in regard to
possible coverage under social benefit laws that would require
us (and in most instances, the Representatives) to make regular
contributions to government social benefit funds. Although we
have generally been able to address these questions in a satis-
factory manner, these questions can be raised again following
regulatory changes in a jurisdiction or can be raised in additional
jurisdictions. If there should be a final determination adverse to
us in a country, the cost for future, and possibly past, contribu-
tions could be so substantial in the context of the volume and
profitability of our business in that country that we would
consider discontinuing operations in that country.
Promotion and MarketingSales promotion and sales development activities are directed at
assisting Representatives, through sales aids such as brochures,
product samples and demonstration products. In order to sup-
port the efforts of Representatives to reach new customers, spe-
cially designed sales aids, promotional pieces, customer flyers,
television and print advertising are used. In addition, we seek to
motivate our Representatives through the use of special incentive
A V O N 2008 7
PART I
programs that reward superior sales performance. Avon has
made significant investments to understand the financial return
of such field incentives. Periodic sales meetings with Represen-
tatives are conducted by the District Sales Managers or Zone
Managers. The meetings are designed to keep Representatives
abreast of product line changes, explain sales techniques and
provide recognition for sales performance.
A number of merchandising techniques are used, including the
introduction of new products, the use of combination offers, the
use of trial sizes and samples, and the promotion of products
packaged as gift items. In general, for each sales campaign, a
distinctive brochure is published, in which new products are
introduced and selected items are offered as special promotions
or are given particular prominence in the brochure. A key current
priority for our merchandising is to expand the use of pricing and
promotional models to enable a deeper, fact-based understand-
ing of the role and impact of pricing within our product portfolio.
Investment in advertising is another key strategy. We significantly
increased spending on advertising over the past three years,
including advertising to recruit Representatives. We expect this
to be an ongoing investment to strengthen our beauty image
worldwide and drive sales positively.
From time to time, various regulations or laws have been pro-
posed or adopted that would, in general, restrict the frequency,
duration or volume of sales resulting from new product intro-
ductions, special promotions or other special price offers. We
expect our pricing flexibility and broad product lines to mitigate
the effect of these regulations.
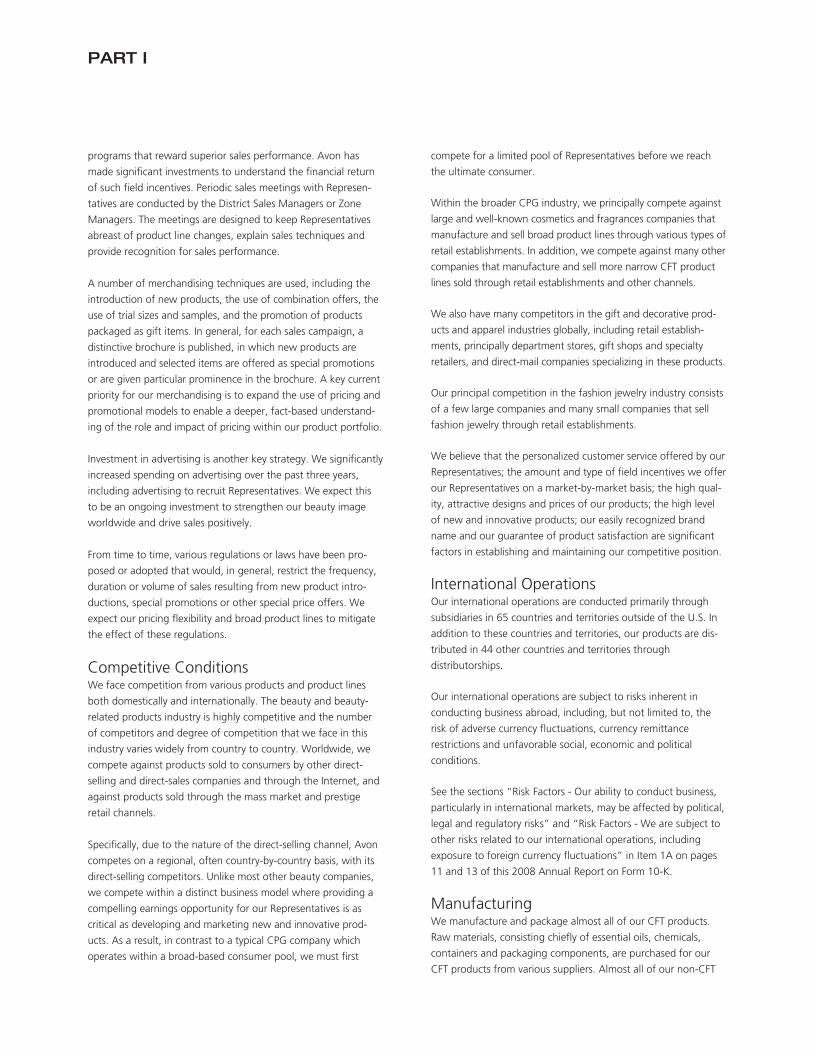
Competitive ConditionsWe face competition from various products and product lines
both domestically and internationally. The beauty and beauty-
related products industry is highly competitive and the number
of competitors and degree of competition that we face in this
industry varies widely from country to country. Worldwide, we
compete against products sold to consumers by other direct-
selling and direct-sales companies and through the Internet, and
against products sold through the mass market and prestige
retail channels.
Specifically, due to the nature of the direct-selling channel, Avon
competes on a regional, often country-by-country basis, with its
direct-selling competitors. Unlike most other beauty companies,
we compete within a distinct business model where providing a
compelling earnings opportunity for our Representatives is as
critical as developing and marketing new and innovative prod-
ucts. As a result, in contrast to a typical CPG company which
operates within a broad-based consumer pool, we must first
compete for a limited pool of Representatives before we reach
the ultimate consumer.
Within the broader CPG industry, we principally compete against
large and well-known cosmetics and fragrances companies that
manufacture and sell broad product lines through various types of
retail establishments. In addition, we compete against many other
companies that manufacture and sell more narrow CFT product
lines sold through retail establishments and other channels.
We also have many competitors in the gift and decorative prod-
ucts and apparel industries globally, including retail establish-
ments, principally department stores, gift shops and specialty
retailers, and direct-mail companies specializing in these products.
Our principal competition in the fashion jewelry industry consists
of a few large companies and many small companies that sell
fashion jewelry through retail establishments.
We believe that the personalized customer service offered by our
Representatives; the amount and type of field incentives we offer
our Representatives on a market-by-market basis; the high qual-
ity, attractive designs and prices of our products; the high level
of new and innovative products; our easily recognized brand
name and our guarantee of product satisfaction are significant
factors in establishing and maintaining our competitive position.
International OperationsOur international operations are conducted primarily through
subsidiaries in 65 countries and territories outside of the U.S. In
addition to these countries and territories, our products are dis-
tributed in 44 other countries and territories through
distributorships.
Our international operations are subject to risks inherent in
conducting business abroad, including, but not limited to, the
risk of adverse currency fluctuations, currency remittance
restrictions and unfavorable social, economic and political
conditions.
See the sections “Risk Factors - Our ability to conduct business,
particularly in international markets, may be affected by political,
legal and regulatory risks” and “Risk Factors - We are subject to
other risks related to our international operations, including
exposure to foreign currency fluctuations” in Item 1A on pages
11 and 13 of this 2008 Annual Report on Form 10-K.
ManufacturingWe manufacture and package almost all of our CFT products.
Raw materials, consisting chiefly of essential oils, chemicals,
containers and packaging components, are purchased for our
CFT products from various suppliers. Almost all of our non-CFT
products are purchased from various suppliers. Additionally, we
design the brochures that are used by the Representatives to sell
our products. The loss of any one supplier would not have a
material impact on our ability to source raw materials for our
CFT products or paper for the brochures or our non-CFT prod-
ucts. Packages, consisting of containers and packaging com-
ponents, are designed by our staff of artists and designers.
The design and development of new CFT products are affected
by the cost and availability of materials such as glass, plastics and
chemicals. We believe that we can continue to obtain sufficient
raw materials and supplies to manufacture and produce our CFT
products.
As further described in the “Overview” and “Strategic Initia-
tives” sections within MD&A on pages 20 through 23, we have
begun implementing SSI to reduce direct and indirect costs of
materials, goods and services. Under this initiative, we are shift-
ing our purchasing strategy from a local, commodity-oriented
approach towards a globally-coordinated effort.
We are also implementing an enterprise resource planning
(“ERP”) system on a worldwide basis, which is expected to
improve the efficiency of our supply chain and financial trans-
action processes. The implementation is expected to occur in
phases over the next several years. We completed implemen-
tation in certain significant markets, and will continue to roll-out
the ERP system over the next several years.
See Item 2, Properties, for additional information regarding the
location of our principal manufacturing facilities.
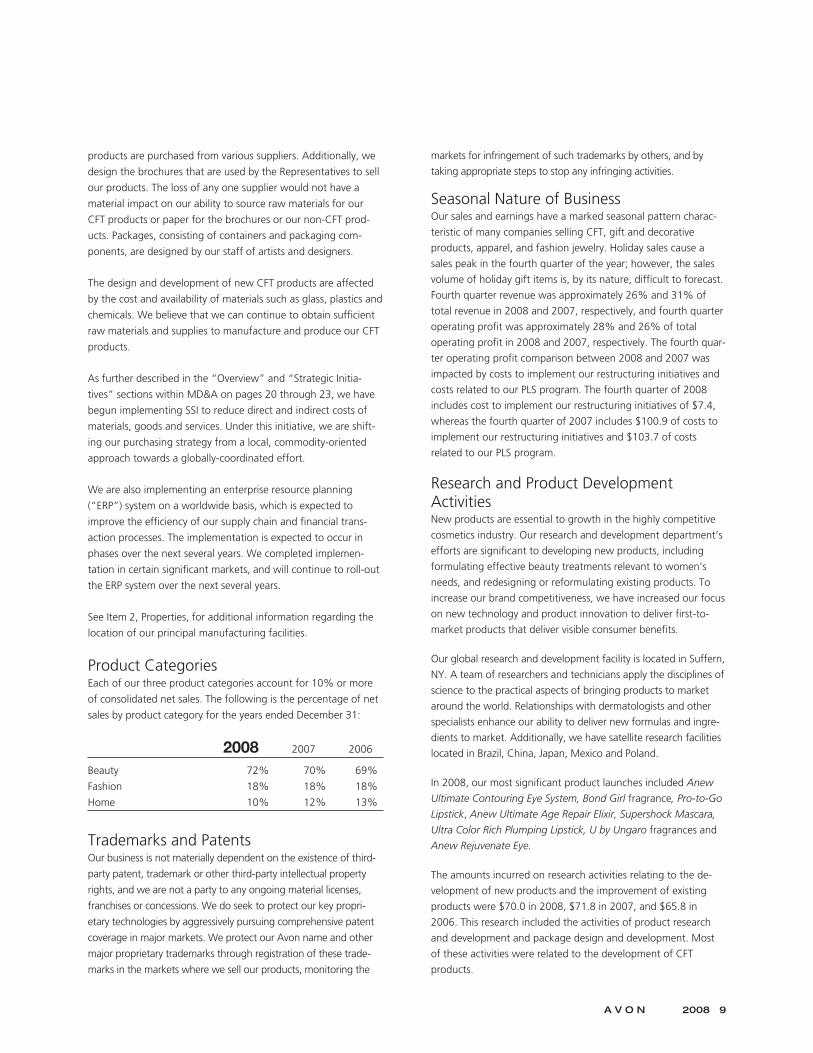
Product CategoriesEach of our three product categories account for 10% or more
of consolidated net sales. The following is the percentage of net
sales by product category for the years ended December 31:
2008 2007 2006
Beauty 72% 70% 69%
Fashion 18% 18% 18%
Home 10% 12% 13%
Trademarks and PatentsOur business is not materially dependent on the existence of third-
party patent, trademark or other third-party intellectual property
rights, and we are not a party to any ongoing material licenses,
franchises or concessions. We do seek to protect our key propri-
etary technologies by aggressively pursuing comprehensive patent
coverage in major markets. We protect our Avon name and other
major proprietary trademarks through registration of these trade-
marks in the markets where we sell our products, monitoring the
markets for infringement of such trademarks by others, and by
taking appropriate steps to stop any infringing activities.
Seasonal Nature of BusinessOur sales and earnings have a marked seasonal pattern charac-
teristic of many companies selling CFT, gift and decorative
products, apparel, and fashion jewelry. Holiday sales cause a
sales peak in the fourth quarter of the year; however, the sales
volume of holiday gift items is, by its nature, difficult to forecast.
Fourth quarter revenue was approximately 26% and 31% of
total revenue in 2008 and 2007, respectively, and fourth quarter
operating profit was approximately 28% and 26% of total
operating profit in 2008 and 2007, respectively. The fourth quar-
ter operating profit comparison between 2008 and 2007 was
impacted by costs to implement our restructuring initiatives and
costs related to our PLS program. The fourth quarter of 2008
includes cost to implement our restructuring initiatives of $7.4,
whereas the fourth quarter of 2007 includes $100.9 of costs to
implement our restructuring initiatives and $103.7 of costs
related to our PLS program.
Research and Product DevelopmentActivitiesNew products are essential to growth in the highly competitive
cosmetics industry. Our research and development department’s
efforts are significant to developing new products, including
formulating effective beauty treatments relevant to women’s
needs, and redesigning or reformulating existing products. To
increase our brand competitiveness, we have increased our focus
on new technology and product innovation to deliver first-to-
market products that deliver visible consumer benefits.
Our global research and development facility is located in Suffern,
NY. A team of researchers and technicians apply the disciplines of
science to the practical aspects of bringing products to market
around the world. Relationships with dermatologists and other
specialists enhance our ability to deliver new formulas and ingre-
dients to market. Additionally, we have satellite research facilities
located in Brazil, China, Japan, Mexico and Poland.
In 2008, our most significant product launches included Anew
Ultimate Contouring Eye System, Bond Girl fragrance, Pro-to-Go
Lipstick, Anew Ultimate Age Repair Elixir, Supershock Mascara,
Ultra Color Rich Plumping Lipstick, U by Ungaro fragrances and
Anew Rejuvenate Eye.
The amounts incurred on research activities relating to the de-
velopment of new products and the improvement of existing
products were $70.0 in 2008, $71.8 in 2007, and $65.8 in
2006. This research included the activities of product research
and development and package design and development. Most
of these activities were related to the development of CFT
products.
A V O N 2008 9
PART I
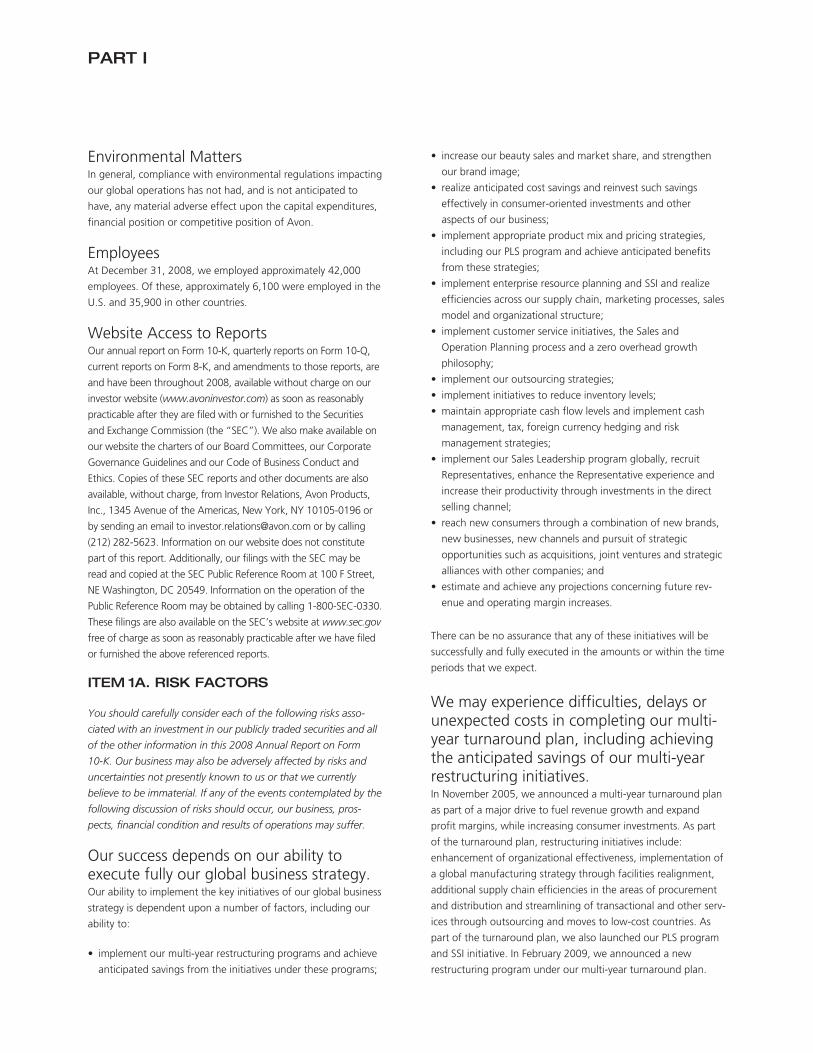
Environmental MattersIn general, compliance with environmental regulations impacting
our global operations has not had, and is not anticipated to
have, any material adverse effect upon the capital expenditures,
financial position or competitive position of Avon.
EmployeesAt December 31, 2008, we employed approximately 42,000
employees. Of these, approximately 6,100 were employed in the
U.S. and 35,900 in other countries.
Website Access to ReportsOur annual report on Form 10-K, quarterly reports on Form 10-Q,
current reports on Form 8-K, and amendments to those reports, are
and have been throughout 2008, available without charge on our
investor website (www.avoninvestor.com) as soon as reasonably
practicable after they are filed with or furnished to the Securities
and Exchange Commission (the “SEC”). We also make available on
our website the charters of our Board Committees, our Corporate
Governance Guidelines and our Code of Business Conduct and
Ethics. Copies of these SEC reports and other documents are also
available, without charge, from Investor Relations, Avon Products,
Inc., 1345 Avenue of the Americas, New York, NY 10105-0196 or
by sending an email to [email protected] or by calling
(212) 282-5623. Information on our website does not constitute
part of this report. Additionally, our filings with the SEC may be
read and copied at the SEC Public Reference Room at 100 F Street,
NE Washington, DC 20549. Information on the operation of the
Public Reference Room may be obtained by calling 1-800-SEC-0330.
These filings are also available on the SEC’s website at www.sec.gov
free of charge as soon as reasonably practicable after we have filed
or furnished the above referenced reports.
ITEM 1A. RISK FACTORS
You should carefully consider each of the following risks asso-
ciated with an investment in our publicly traded securities and all
of the other information in this 2008 Annual Report on Form
10-K. Our business may also be adversely affected by risks and
uncertainties not presently known to us or that we currently
believe to be immaterial. If any of the events contemplated by the
following discussion of risks should occur, our business, pros-
pects, financial condition and results of operations may suffer.
Our success depends on our ability toexecute fully our global business strategy.Our ability to implement the key initiatives of our global business
strategy is dependent upon a number of factors, including our
ability to:
• implement our multi-year restructuring programs and achieve
anticipated savings from the initiatives under these programs;
• increase our beauty sales and market share, and strengthen
our brand image;
• realize anticipated cost savings and reinvest such savings
effectively in consumer-oriented investments and other
aspects of our business;
• implement appropriate product mix and pricing strategies,
including our PLS program and achieve anticipated benefits
from these strategies;
• implement enterprise resource planning and SSI and realize
efficiencies across our supply chain, marketing processes, sales
model and organizational structure;
• implement customer service initiatives, the Sales and
Operation Planning process and a zero overhead growth
philosophy;
• implement our outsourcing strategies;
• implement initiatives to reduce inventory levels;
• maintain appropriate cash flow levels and implement cash
management, tax, foreign currency hedging and risk
management strategies;
• implement our Sales Leadership program globally, recruit
Representatives, enhance the Representative experience and
increase their productivity through investments in the direct
selling channel;
• reach new consumers through a combination of new brands,
new businesses, new channels and pursuit of strategic
opportunities such as acquisitions, joint ventures and strategic
alliances with other companies; and
• estimate and achieve any projections concerning future rev-
enue and operating margin increases.
There can be no assurance that any of these initiatives will be
successfully and fully executed in the amounts or within the time
periods that we expect.
We may experience difficulties, delays orunexpected costs in completing our multi-year turnaround plan, including achievingthe anticipated savings of our multi-yearrestructuring initiatives.In November 2005, we announced a multi-year turnaround plan
as part of a major drive to fuel revenue growth and expand
profit margins, while increasing consumer investments. As part
of the turnaround plan, restructuring initiatives include:
enhancement of organizational effectiveness, implementation of
a global manufacturing strategy through facilities realignment,
additional supply chain efficiencies in the areas of procurement
and distribution and streamlining of transactional and other serv-
ices through outsourcing and moves to low-cost countries. As
part of the turnaround plan, we also launched our PLS program
and SSI initiative. In February 2009, we announced a new
restructuring program under our multi-year turnaround plan.
We may not realize, in full or in part, the anticipated savings or
benefits from one or more of these initiatives, and other events
and circumstances, such as difficulties, delays or unexpected
costs, may occur which could result in our not realizing all or any
of the anticipated savings or benefits. If we are unable to realize
these savings or benefits, our ability to continue to fund planned
advertising, market intelligence, consumer research and product
innovation initiatives may be adversely affected. In addition, our
plans to invest these savings and benefits ahead of future
growth means that such costs will be incurred whether or not
we realize these savings and benefits.
We are also subject to the risk of business disruption in connec-
tion with our multi-year restructuring programs or other strategic
initiatives, which could have a material adverse effect on our
business, financial condition and operating results.
There can be no assurance that we will beable to achieve our growth objectives ormaintain rates of growth.There can be no assurance that we will be able to achieve profit-
able growth in the future or maintain rates of growth. In devel-
oped markets, such as the U.S., we seek to achieve growth in
line with that of the overall beauty market, while in developing
and emerging markets we have higher growth targets. Our
growth overall is also subject to the strengths and weakness of
our individual markets, including our international markets,
which are or may be impacted by global economic conditions.
We cannot assure you that our broad-based geographic portfolio
will be able to withstand an economic downturn or recession in
one or more particular regions. Our ability to increase or main-
tain revenue and earnings depends on numerous factors, and
there can be no assurance that our current or future business
strategies will lead us to achieve our growth objectives or main-
tain our rates of growth.
Our business is conducted worldwideprimarily in one channel, direct selling.Our business is conducted worldwide, primarily in the direct-
selling channel. Sales are made to the ultimate consumer
principally through 5.8 million independent Representatives
worldwide. There is a high rate of turnover among Representa-
tives, which is a common characteristic of the direct-selling
business. As a result, in order to maintain our business and grow
our business in the future, we need to recruit, retain and service
Representatives on a continuing basis. If consumers change their
purchasing habits, such as by reducing purchases of beauty and
related products generally, or reducing purchases from Repre-
sentatives or buying beauty and related products in channels
other than in direct selling, this could reduce our sales and have
a material adverse effect on our business, financial condition and
results of operations. If our competitors establish greater market
share in the direct-selling channel, our business, financial
condition and operating results may be adversely affected.
Furthermore, if any government bans or severely restricts our
business method of direct selling, our business, financial
condition and operating results may be adversely affected.
Our ability to conduct business, particularlyin international markets, may be affectedby political, legal and regulatory risks.Our ability to capitalize on growth in new international markets
and to maintain the current level of operations in our existing
international markets is exposed to risks associated with our
international operations, including:
• the possibility that a foreign government might ban or severely
restrict our business method of direct selling, or that local civil
unrest, political instability or changes in diplomatic or trade
relationships might disrupt our operations in an international
market;
• the possibility that a government authority might impose legal,
tax or other financial burdens on our Representatives, as direct
sellers, or on Avon, due, for example, to the structure of our
operations in various markets; and
• the possibility that a government authority might challenge
the status of our Representatives as independent contractors
or impose employment or social taxes on our Representatives.
For example, in 1998, the Chinese government banned direct
selling but, subsequently in April 2005, the Chinese government
granted approval for us to proceed with a limited test of direct
selling in certain areas. The Chinese government later issued
direct-selling regulations in late 2005, and we were granted a
direct-selling license by China’s Ministry of Commerce in late
February 2006, which has allowed us to commence direct selling
under such regulations. However, there can be no assurance that
these and other regulations and approvals will not be rescinded,
restricted or otherwise altered, which may have a material
adverse effect on our direct selling business in China. There can
be no assurance that we will be able to successfully transition
our business in China in connection with the resumption of
direct selling in that market and successfully operate using the
direct-selling model currently in place or that may be subse-
quently permitted in that market, or that we will experience
growth in that or other emerging markets. The introduction of
new channels in our business, such as the direct selling channel
in China, may also negatively impact existing sales. We may
encounter similar political, legal and regulatory risks in other
international markets in our portfolio.
We are also subject to changes in other foreign laws, rules, regu-
lations or policies, such as restrictions on trade, import and
A V O N 2008 11
PART I
export license requirements, privacy and data protection laws,
and tariffs and taxes. In addition, we face legal and regulatory
risks in the United States and, in particular, cannot predict with
certainty the outcome of various contingencies or the impact
that pending or future legislative and regulatory changes may
have on our business in the future. The U.S. Federal Trade
Commission has proposed business opportunity regulations
which may have an effect upon the Company’s method of oper-
ating in the U.S. It is not possible to gauge what any final regu-
lation may provide, its effective date or its impact at this time.
A general economic downturn, a recessionglobally or in one or more of ourgeographic regions or sudden disruption inbusiness conditions may adversely affectour business, including consumerpurchases of discretionary items, such asbeauty and related products.A downturn in the economies in which we sell our products,
including any recession in one or more of our geographic regions,
or the current global macro-economic pressures, could adversely
affect our business. Recent global economic events, especially in
North America, including job losses, the tightening of credit
markets and failures of financial institutions and other entities,
have resulted in challenges to our business and a heightened
concern regarding further deterioration globally. If conditions
continue or worsen, we could experience potential declines in
revenues, profitability and cash flow due to reduced orders,
payment delays, supply chain disruptions or other factors caused
by economic challenges faced by customers, prospective custom-
ers and suppliers. Additionally, if these conditions continue or
worsen, any one or all of them could potentially have a material
adverse effect on our liquidity and capital resources, including our
ability to issue commercial paper or raise additional capital, the
ability of lenders to maintain our credit lines, and our ability to
maintain offshore cash balances, or otherwise negatively impact
our business, results of operations and financial condition.
Consumer spending is generally affected by a number of factors,
including general economic conditions, inflation, interest rates,
energy costs, gasoline prices and consumer confidence generally,
all of which are beyond our control. Consumer purchases of
discretionary items tend to decline during recessionary periods,
when disposable income is lower, and may impact sales of our
products. We face a challenging fiscal 2009 because customers
may have less money for discretionary purchases as a result of
job losses, foreclosures, bankruptcies, reduced access to credit
and sharply falling home prices, among other things.
In addition, sudden disruptions in business conditions as a result
of a terrorist attack similar to the events of September 11, 2001,
including further attacks, retaliation and the threat of further
attacks or retaliation, war, adverse weather conditions and
climate changes or other natural disasters, such as Hurricane
Katrina, pandemic situations or large scale power outages can
have a short or, sometimes, long-term impact on consumer
spending.
We face significant competition.We face competition from competing products in each of our
lines of business, in both the domestic and international markets.
Worldwide, we compete against products sold to consumers by
other direct-selling and direct-sales companies and through the
Internet, and against products sold through the mass market and
prestige retail channels.
Within the direct selling channel, we compete on a regional, and
often country-by-country basis, with our direct-selling competi-
tors. There are also a number of direct-selling companies that
sell product lines similar to ours, some of which also have world-
wide operations and compete with us globally. Unlike most
other beauty companies, we compete within a distinct business
model where providing a compelling earnings opportunity for
our Representatives is as critical as developing and marketing
new and innovative products. Therefore, in contrast to a typical
consumer packaged goods (“CPG”) company which operates
within a broad-based consumer pool, we must first compete for
a limited pool of Representatives before we reach the ultimate
consumer.
Direct sellers compete for representative or entrepreneurial talent
by providing a more competitive earnings opportunity or “better
deal” than that offered by the competition. Representatives are
attracted to a direct seller by competitive earnings opportunities,
often through what are commonly known as “field incentives”
in the direct selling industry. Competitors devote substantial
effort to finding out the effectiveness of such incentives so that
they can invest in incentives that are the most cost effective or
produce the better payback. As the largest and oldest beauty
direct seller, Avon’s business model and strategies are often
highly sought after, particularly by smaller local and more nimble
competitors who seek to capitalize on our investment and ex-
perience. As a result, we are subject to significant competition
for the recruitment of Representatives from other direct selling
or network marketing organizations. It is therefore continually
necessary to recruit and retain new Representatives and if we are
unable to do so our business will be adversely affected.
Within the broader CPG industry, we compete against large and
well-known cosmetics and fragrances companies that manu-
facture and sell broad product lines through various types of
retail establishments. In addition, we compete against many
other companies that manufacture and sell in more narrow CFT
product lines sold through retail establishments. This industry is
highly competitive, and some of our principal competitors in the
CPG industry are larger than we are and have greater resources
than we do. Competitive activities on their part could cause our
sales to suffer. We have many competitors in the highly com-
petitive gift and decorative products and apparel industries
globally, including retail establishments, principally department
stores, gift shops and specialty retailers, and direct-mail compa-
nies specializing in these products. Our principal competition in
the highly competitive fashion jewelry industry consists of a few
large companies and many small companies that sell fashion
jewelry through retail establishments.
The number of competitors and degree of competition that we
face in this beauty and related products industry varies widely
from country to country. If our advertising, promotional, mer-
chandising or other marketing strategies are not successful, if we
are unable to deliver new products that represent technological
breakthroughs, if we do not successfully manage the timing of
new product introductions or the profitability of these efforts, or
if for other reasons our Representatives or end customers per-
ceive competitors’ products as having greater appeal, then our
sales and financial results may suffer.
We are subject to other risks related to ourinternational operations, includingexposure to foreign currency fluctuations.We operate globally, through operations in various locations
around the world, and derive approximately 80% of our con-
solidated revenue from our operations outside of the U.S.
One risk associated with our international operations is that the
functional currency for most of our international operations is
the applicable local currency. Because of this, movements in
exchange rates may have a significant impact on our earnings,
cash flow and financial position. For example, currencies for
which we have significant exposures include the Argentine peso,
Brazilian real, British pound, Canadian dollar, Chinese renminbi,
Colombian peso, the Euro, Japanese yen, Mexican peso, Philip-
pine peso, Polish zloty, Russian ruble, Turkish lira, Ukrainian
hryvna and Venezuelan bolivar. Although we implement foreign
currency hedging and risk management strategies to reduce our
exposure to fluctuations in earnings and cash flows associated
with changes in foreign exchange rates, there can be no assur-
ance that foreign currency fluctuations will not have a material
adverse effect on our business, results of operations and
financial condition.
Another risk associated with our international operations is the
possibility that a foreign government may impose currency
remittance restrictions. Due to the possibility of government
restrictions on transfers of cash out of the country and control of
exchange rates, we may not be able to immediately repatriate
cash at the official exchange rate or if the official exchange rate
devalues, it may have a material adverse effect on our business,
results of operations and financial condition. For example, cur-
rency restrictions enacted by the Venezuelan government in
2003 have become more restrictive and have impacted the abil-
ity of our subsidiary in Venezuela (“Avon Venezuela”) to obtain
foreign currency at the official rate to pay for imported products.
Unless official foreign exchange is made more readily available,
Avon Venezuela’s operations will continue to be negatively
impacted as it will need to obtain more of its foreign currency
needs from non-government sources where the exchange rate is
less favorable than the official rate.
Inflation is another risk associated with our international oper-
ations. For example, inflation in Venezuela has continued to
increase over the past few years and it is possible that Venezuela
will be designated as a highly inflationary economy during 2009.
Gains and losses resulting from the translation of the financial
statements of subsidiaries operating in highly inflationary
economies are recorded in earnings. If Venezuela is designated
as a highly inflationary economy and there is a devaluation of
the official rate, revenue and operating profit will be negatively
impacted.
Third-party suppliers provide, among otherthings, the raw materials used tomanufacture our CFT products, and theloss of these suppliers or a disruption orinterruption in the supply chain mayadversely affect our business.We manufacture and package almost all of our CFT products.
Raw materials, consisting chiefly of essential oils, chemicals,
containers and packaging components, are purchased from vari-
ous third-party suppliers for our CFT products. Almost all of our
non-CFT products are purchased from various suppliers. Addi-
tionally, we produce the brochures that are used by Representa-
tives to sell Avon products. The loss of multiple suppliers or a
significant disruption or interruption in the supply chain could
have a material adverse effect on the manufacturing and pack-
aging of our CFT products, the purchasing of our non-CFT
products or the production of our brochures. This risk may be
exacerbated by SSI, which will shift our purchasing strategy
toward a globally- coordinated effort. Furthermore, increases in
the costs of raw materials or other commodities may adversely
affect our profit margins if we are unable to pass along any
higher costs in the form of price increases or otherwise achieve
cost efficiencies in manufacturing and distribution.
A V O N 2008 13

PART I
The loss of or a disruption in ourmanufacturing and distribution operationscould adversely affect our business.Our principal properties consist of worldwide manufacturing
facilities for the production of CFT products, distribution centers
where offices are located and where finished merchandise is
packed and shipped to Representatives in fulfillment of their
orders, and one principal research and development facility.
Therefore, as a company engaged in manufacturing, distribution
and research and development on a global scale, we are subject
to the risks inherent in such activities, including industrial acci-
dents, environmental events, strikes and other labor disputes,
disruptions in logistics or information systems, loss or impairment
of key manufacturing sites, product quality control, safety, licens-
ing requirements and other regulatory issues, as well as natural
disasters, acts of terrorism and other external factors over which
we have no control. The loss of, or damage to, any of our facili-
ties or centers could have a material adverse effect on our busi-
ness, results of operations and financial condition.
Our success depends, in part, on thequality and safety of our products.Our success depends, in part, on the quality and safety of our
products. If our products are found to be defective or unsafe, or
if they otherwise fail to meet our Representatives’ or end cus-
tomers’ standards, our relationship with our Representatives or
end customers could suffer, we could need to recall some of our
products, our reputation or the appeal of our brand could be
diminished, and we could lose market share and/or become
subject to liability claims, any of which could result in a material
adverse effect on our business, results of operations and finan-
cial condition.
Any future acquisitions may expose us toadditional risks.We continuously review acquisition prospects that would comple-
ment our current product offerings, increase the size and geo-
graphic scope of our operations or otherwise offer growth and
operating efficiency opportunities. The financing for any of these
acquisitions could dilute the interests of our stockholders, result
in an increase in our indebtedness or both. Acquisitions may
entail numerous risks, including:
• difficulties in assimilating acquired operations or products,
including the loss of key employees from acquired businesses
and disruption to our direct selling channel;
• diversion of management’s attention from our core business;
• adverse effects on existing business relationships with suppli-
ers and customers; and
• risks of entering markets in which we have limited or no prior
experience.
Our failure to successfully complete the integration of any
acquired business could have a material adverse effect on our
business, financial condition and operating results. In addition,
there can be no assurance that we will be able to identify suit-
able acquisition candidates or consummate acquisitions on
favorable terms.
Our information technology systems maybe susceptible to disruptions.We employ information technology systems to support our busi-
ness, including systems to support financial reporting, an enter-
prise resource planning system which we are implementing on a
worldwide basis, and an internal communication and data trans-
fer network. We also employ information technology systems to
support Representatives in many of our markets, including elec-
tronic order collection and invoicing systems and on-line train-
ing. We have Internet sites in many of our markets, including
business-to-business sites to support Representatives. We have
undertaken initiatives to increase our reliance on employing
information technology systems to support our Representatives,
as well as initiatives, as part of our multi-year restructuring pro-
gram, to outsource certain services, including the provision of
global human resources information technology systems to our
employees and other information technology processes. Any of
these systems may be susceptible to outages due to fire, floods,
power loss, telecommunications failures, terrorist attacks,
break-ins and similar events. Despite the implementation of
network security measures, our systems may also be vulnerable
to computer viruses, break-ins and similar disruptions from
unauthorized tampering with these systems. The occurrence of
these or other events could disrupt our information technology
systems and adversely affect our operation.
Our success depends, in part, on our keypersonnel.Our success depends, in part, on our ability to retain our key
personnel, including our executive officers and senior manage-
ment team. The unexpected loss of one or more of our key
employees could adversely affect our business. Our success also
depends, in part, on our continuing ability to identify, hire, train
and retain other highly qualified personnel. Competition for
these employees can be intense. We may not be able to attract,
assimilate or retain qualified personnel in the future, and our
failure to do so could adversely affect our business. This risk may
be exacerbated by the uncertainties associated with the imple-
mentation of our multi-year restructuring plan.
Our ability to anticipate and respond tomarket trends and changes in consumerpreferences could affect our financialresults.Our continued success depends on our ability to anticipate,
gauge and react in a timely and effective manner to changes in
consumer spending patterns and preferences for beauty and
related products. We must continually work to develop, produce
and market new products, maintain and enhance the recog-
nition of our brands, achieve a favorable mix of products, and
refine our approach as to how and where we market and sell
our products. While we devote considerable effort and resources
to shape, analyze and respond to consumer preferences, con-
sumer spending patterns and preferences cannot be predicted
with certainty and can change rapidly. If we are unable to antici-
pate and respond to trends in the market for beauty and related
products and changing consumer demands, our financial results
will suffer. This risk may be exacerbated by our product line
simplification (“PLS”) program, which will lead to significant
changes to our product offerings.
Furthermore, material shifts or decreases in market demand for
our products, including as a result of changes in consumer
spending patterns and preferences, could result in us carrying
inventory that cannot be sold at anticipated prices or increased
product returns by our Representatives. Failure to maintain
proper inventory levels or increased product returns by our
Representatives could result in a material adverse effect on our
business, results of operations and financial condition.
If we are unable to protect our intellectualproperty rights, specifically patents andtrademarks, our ability to compete couldbe negatively impacted.The market for our products depends to a significant extent
upon the value associated with our patents and trademarks. We
own the material patents and trademarks used in connection
with the marketing and distribution of our major products both
in the U.S. and in other countries where such products are
principally sold. Although most of our material intellectual prop-
erty is registered in the U.S. and in certain foreign countries in
which we operate, there can be no assurance with respect to
the rights associated with such intellectual property in those
countries. In addition, the laws of certain foreign countries, in-
cluding many emerging markets, such as China, may not protect
our intellectual property rights to the same extent as the laws of
the U.S. The costs required to protect our patents and trade-
marks may be substantial.
We are involved, and may become involvedin the future, in legal proceedings that, ifadversely adjudicated or settled, couldadversely affect our financial results.We are and may, in the future, become party to litigation, in-
cluding, for example, claims relating to our customer service or
advertisings, or alleging violation of the federal securities or
ERISA laws and/or state law. In general, litigation claims can be
expensive and time consuming to bring or defend against and
could result in settlements or damages that could significantly
affect financial results. We are currently vigorously contesting
certain of these litigation claims. However, it is not possible to
predict the final resolution of the litigation to which we currently
are or may in the future become party to, and the impact of
certain of these matters on our business, results of operations
and financial condition could be material.
Significant changes in pension fundinvestment performance, assumptionsrelating to pension costs or required legalchanges in pension funding rules may havea material effect on the valuation ofpension obligations, the funded status ofpension plans and our pension cost.Our funding policy for pension plans is to accumulate plan assets
that, over the long run, will approximate the present value of
projected benefit obligations. Our pension cost is materially
affected by the discount rate used to measure pension obliga-
tions, the level of plan assets available to fund those obligations
at the measurement date and the expected long-term rate of
return on plan assets. Significant changes in investment per-
formance or a change in the portfolio mix of invested assets can
result in corresponding increases and decreases in the valuation
of plan assets, particularly equity securities, or in a change of the
expected rate of return on plan assets. A change in the discount
rate would result in a significant increase or decrease in the
valuation of pension obligations, affecting the reported funded
status of our pension plans as well as the net periodic pension
cost in the following fiscal years. Similarly, changes in the ex-
pected return on plan assets can result in significant changes
in the net periodic pension cost of the following fiscal years.
Finally, recent pension funding requirements under the Pension
Protection Act of 2006 may result in a significant increase or
decrease in the valuation of pension obligations affecting the
reported funded status of our pension plans.
A V O N 2008 15

PART I
The market price of our common stockcould be subject to fluctuations as a resultof many factors.Factors that could affect the trading price of our common stock
include the following:
• variations in operating results;
• economic conditions and volatility in the financial markets;
• announcements or significant developments in connection
with our business and with respect to beauty and related
products or the beauty industry in general;
• actual or anticipated variations in our quarterly or annual
financial results;
• governmental policies and regulations;
• estimates of our future performance or that of our com-
petitors or our industries;
• general economic, political, and market conditions; and
• factors relating to competitors.
The trading price of our common stock has been, and could in
the future continue to be, subject to significant fluctuations.
An internal investigation of our Chinaoperations is being conducted.We are voluntarily conducting an internal investigation of our
China operations, focusing on compliance with the Foreign
Corrupt Practices Act. The internal investigation, which is being
conducted under the oversight of the Audit Committee, com-
menced in June 2008 after we received an allegation that certain
travel, entertainment and other expenses may have been improp-
erly incurred in connection with our China operations. We have
voluntarily contacted the Securities and Exchange Commission
and the United States Department of Justice to advise both
agencies that an internal investigation is underway. Because the
internal investigation is in its early stage, we cannot predict how
the resulting consequences, if any, may impact our internal con-
trols, business, results of operations or financial position.
ITEM 1B. UNRESOLVED STAFFCOMMENTS
Not applicable.
ITEM 2. PROPERTIES
Our principal properties worldwide consist of manufacturing
facilities for the production of CFT products, distribution centers
where offices are located and where finished merchandise is
packed and shipped to Representatives in fulfillment of their
orders, and one principal research and development facility. The
domestic manufacturing facilities are located in Morton Grove, IL
and Springdale, OH. The domestic distribution centers are locat-
ed in Atlanta, GA; Glenview, IL; Newark, DE; and Pasadena, CA.
The research and development facility is located in Suffern, NY.
We also lease office space in two locations in New York City and
own property in Rye, NY, for our executive and administrative
offices.
Other principal properties outside the U.S. measuring 50,000
square feet or more include the following:
• two distribution centers for primary use in North America
operations (other than in the U.S.);
• four manufacturing facilities, eleven distribution centers and
two administrative offices in Latin America;
• four manufacturing facilities in Europe, primarily servicing
Western Europe, Middle East & Africa and Central & Eastern
Europe;
• six distribution centers and four administrative offices in West-
ern Europe, Middle East & Africa;
• three distribution centers and two administrative offices in
Central & Eastern Europe;
• three manufacturing facilities, four distribution centers, and
two administrative offices in Asia Pacific; and
• two manufacturing facilities and six distribution centers in
China.
Of all the properties listed above, 32 are owned and the remain-
ing 33 are leased. Many of our properties are used for a com-
bination of manufacturing, distribution and administration.
These properties are included in the above listing based on pri-
mary usage.
We consider all of these properties to be in good repair, to
adequately meet our needs and to operate at reasonable levels
of productive capacity.
In January 2007, we announced plans to realign certain North
America distribution operations. This initiative includes the
building of a new distribution center in Zanesville, OH, that is
expected to open in the first quarter of 2009. We will phase-
out our current distribution branches in Newark, DE, and
Glenview, IL, with the closures expected to be completed by
mid-2009 and mid-2010, respectively.
In January 2008, we announced plans to realign certain Latin
America distribution and manufacturing operations. We are
building a new distribution center in Brazil that is expected to
open in 2010. We will phase-out our current distribution center
in Sao Paulo, Brazil during 2011. During 2008, we transferred
production from our manufacturing facility in Guatemala to our
facility in Mexico.
ITEM 3. LEGAL PROCEEDINGS
Reference is made to Note 15, Contingencies, on pages F-31
through F-33 of this 2008 Annual Report on Form 10-K.
ITEM 4. SUBMISSION OF MATTERS TOA VOTE OF SECURITY HOLDERS
No matters were submitted to a vote of security holders during
the quarter ended December 31, 2008.
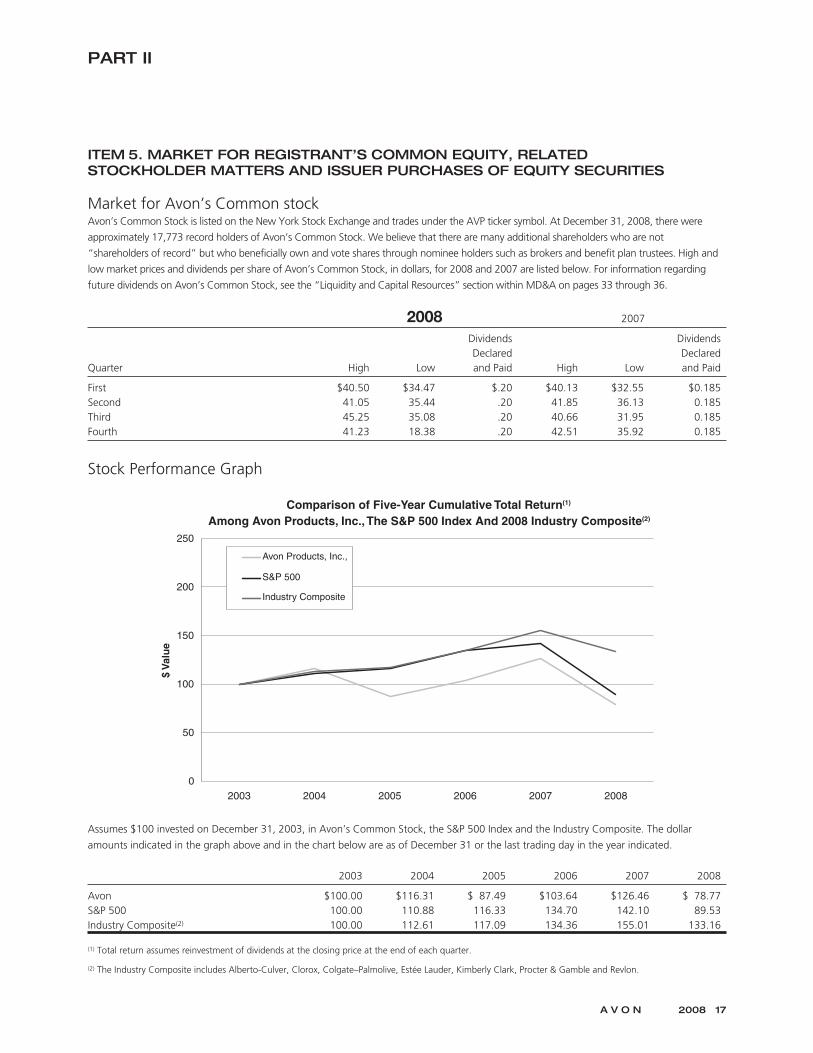
PART II
ITEM 5. MARKET FOR REGISTRANT’S COMMON EQUITY, RELATEDSTOCKHOLDER MATTERS AND ISSUER PURCHASES OF EQUITY SECURITIES
Market for Avon’s Common stockAvon’s Common Stock is listed on the New York Stock Exchange and trades under the AVP ticker symbol. At December 31, 2008, there were
approximately 17,773 record holders of Avon’s Common Stock. We believe that there are many additional shareholders who are not
“shareholders of record” but who beneficially own and vote shares through nominee holders such as brokers and benefit plan trustees. High and
low market prices and dividends per share of Avon’s Common Stock, in dollars, for 2008 and 2007 are listed below. For information regarding
future dividends on Avon’s Common Stock, see the “Liquidity and Capital Resources” section within MD&A on pages 33 through 36.
2008 2007
Quarter High Low
DividendsDeclaredand Paid High Low
DividendsDeclaredand Paid
First $40.50 $34.47 $.20 $40.13 $32.55 $0.185Second 41.05 35.44 .20 41.85 36.13 0.185Third 45.25 35.08 .20 40.66 31.95 0.185Fourth 41.23 18.38 .20 42.51 35.92 0.185
Stock Performance Graph
Comparison of Five-Year Cumulative Total Return(1)
Among Avon Products, Inc., The S&P 500 Index And 2008 Industry Composite(2)
0
50
100
150
250
200
2003 2004 2005 2006 2007 2008
$ V
alu
e
Avon Products, Inc.,
S&P 500
Industry Composite
Assumes $100 invested on December 31, 2003, in Avon’s Common Stock, the S&P 500 Index and the Industry Composite. The dollar
amounts indicated in the graph above and in the chart below are as of December 31 or the last trading day in the year indicated.
2003 2004 2005 2006 2007 2008
Avon $100.00 $116.31 $ 87.49 $103.64 $126.46 $ 78.77S&P 500 100.00 110.88 116.33 134.70 142.10 89.53Industry Composite(2) 100.00 112.61 117.09 134.36 155.01 133.16
(1) Total return assumes reinvestment of dividends at the closing price at the end of each quarter.
(2) The Industry Composite includes Alberto-Culver, Clorox, Colgate–Palmolive, Estée Lauder, Kimberly Clark, Procter & Gamble and Revlon.
A V O N 2008 17
PART II
The Stock Performance Graph shall not be deemed to be
“soliciting material” or to be “filed” with the Securities and
Exchange Commission or subject to the liabilities of Section 18
under the Securities Exchange Act of 1934. In addition, it shall
not be deemed incorporated by reference by any statement that
incorporates this annual report on Form 10-K by reference into
any filing under the Securities Act of 1933 or the Securities
Exchange Act of 1934, except to the extent that we specifically
incorporate this information by reference.
Securities Authorized for Issuance UnderEquity Compensation PlansInformation regarding securities authorized for issuance under
equity compensation plans is incorporated by reference to the
“Equity Compensation Plan Information” section of Avon’s Proxy
Statement for the 2009 Annual Meeting of Shareholders.
Issuer Purchases of Equity SecuritiesThe following table provides information with respect to our purchases of Avon Common Stock during the fourth quarter of 2008:
Total Numberof Shares
Purchased (1)
Average PricePaid per Share
Total Number ofShares Purchased as
Part of PubliclyAnnounced Programs (2)
Approximate DollarValue of Shares that
May Yet Be PurchasedUnder the Program
10/1/08 – 10/31/08 8,603 $43.26 – $1,821,526,000
11/1/08 – 11/30/08 12,487 24.59 – 1,821,526,000
12/1/08 – 12/31/08 7,976 18.20 – 1,821,526,000
Total 29,066 –
(1) Consists of shares that were repurchased by us in connection with employee elections to use shares to pay withholding taxes upon the vesting of theirrestricted stock units.
(2) There were no shares purchased during the fourth quarter of 2008 as part of our $2.0 billion share repurchase program, publicly announced on October 11,2007. The program commenced on December 17, 2007, and is scheduled to expire on December 17, 2012.
ITEM 6. SELECTED FINANCIAL DATA
We derived the following selected financial data from our audited consolidated financial statements. The following data should be read in
conjunction with “Management’s Discussion and Analysis of Financial Condition and Results of Operations” and our Consolidated Financial
Statements and related Notes.
2008 2007 (2) 2006 (3) 2005 2004
Income Data
Total revenue $10,690.1 $9,938.7 $8,763.9 $8,149.6 $7,747.8
Operating profit (1) 1,339.3 872.7 761.4 1,149.0 1,229.0
Net income 875.3 530.7 477.6 847.6 846.1
Diluted earnings per share $ 2.04 $ 1.21 $ 1.06 $ 1.81 $ 1.77
Cash dividends per share $ 0.80 $ 0.74 $ 0.70 $ 0.66 $ 0.56
Balance Sheet Data
Total assets $ 6,074.0 $5,716.2 $5,238.2 $4,761.4 $4,148.1
Debt maturing within one year 1,031.4 929.5 615.6 882.5 51.7
Long-term debt 1,456.2 1,167.9 1,170.7 766.5 866.3
Total debt 2,487.6 2,097.4 1,786.3 1,649.0 918.0
Shareholders’ equity 674.9 711.6 790.4 794.2 950.2
(1) In 2008, 2007, 2006 and 2005, operating profit includes costs to implement restructuring initiatives related to our multi-year restructuring programannounced during 2005 of $60.6, $158.3, $228.8, and $56.5, respectively.
In 2007 and 2006, operating profit includes charges totaling $187.8 and $81.4, including inventory obsolescence expense of $167.3 and $72.6, respectively,related to our product line simplification program (“PLS”). In 2008, operating profit includes benefits to obsolescence expense of approximately $13 fromchanges in our disposition plan under our PLS program.
Effective January 1, 2006, we adopted SFAS No. 123 (revised 2004) Share-Based Payment. Operating profit includes charges related to share-based compensa-tion of $54.8, $61.6, $62.9, $10.1 and $8.8 for the years ended December 31, 2008, 2007, 2006, 2005 and 2004, respectively.
(2) In 2007, we recorded a decrease of $18.3 to shareholders’ equity from the initial adoption of Financial Accounting Standards Board (“FASB”) InterpretationNo. 48, Accounting for Uncertainty in Income Taxes – an interpretation of FASB Statement No. 109.
(3) In 2006, we recorded a decreases of $232.8 and $254.7 to total assets and shareholders’ equity, respectively, from the initial adoption of Statement ofFinancial Accounting Standards (“SFAS”) No. 158, Employers’ Accounting for Defined Benefit Pension and Other Postretirement Plans—an amendment ofFASB Statements No. 87, 88, 106 and 132R.
A V O N 2008 19

PART II
ITEM 7. MANAGEMENT’S DISCUSSIONAND ANALYSIS OF FINANCIALCONDITION AND RESULTS OFOPERATIONS
The following discussion of the results of operations and finan-
cial condition of Avon Products, Inc. and its majority and wholly
owned subsidiaries (“Avon” or the “Company”) should be read
in conjunction with the information contained in the Consoli-
dated Financial Statements and related Notes. When used in
this discussion, the terms “Avon,” “Company,” “we,” “our”
or “us” mean, unless the context otherwise indicates, Avon
Products, Inc. and its majority and wholly owned subsidiaries.
OVERVIEW
We are a global manufacturer and marketer of beauty and
related products. Our business is conducted worldwide, primarily
in the direct selling channel. We presently have sales operations
in 66 countries and territories, including the United States, and
distribute products in 44 more. Our reportable segments are
based on geographic operations in six regions: Latin America;
North America; Central & Eastern Europe; Western Europe,
Middle East & Africa; Asia Pacific; and China. We centrally man-
age global Brand Marketing, Supply Chain and Sales organiza-
tions. Beginning in the fourth quarter of 2008, we changed our
product categories from Beauty, Beauty Plus and Beyond Beauty
to Beauty, Fashion and Home. Beauty consists of cosmetics,
fragrances, skin care and toiletries (“CFT”). Fashion consists of
fashion jewelry, watches, apparel, footwear and accessories.
Home consists of gift and decorative products, housewares,
entertainment and leisure, children’s and nutritional products.
Sales from Health and Wellness products and mark., a global
cosmetics brand that focuses on the market for young women,
are included among these three categories based on product
type. Sales are made to the ultimate consumer principally
through the direct selling by 5.8 million active independent Rep-
resentatives, who are independent contractors and not employ-
ees of Avon. The success of our business is highly dependent on
recruiting, retaining and servicing our Representatives.
We view the geographic diversity of our businesses as a strategic
advantage in part because it allows us to participate in higher
growth Beauty markets internationally. In developed markets,
such as the United States, we seek to achieve growth in line with
that of the overall beauty market, while in developing and
emerging markets we seek to achieve higher growth targets.
During 2008, approximately 80% of our consolidated revenue
was derived from operations outside the U.S. When we first
penetrate a market, we typically experience high growth rates
and, as we reach scale in these markets, growth rates gen-
erally decline.
At the end of 2005, we launched a comprehensive, multi-year
turnaround plan to restore sustainable growth. In January 2008,
we announced the final initiatives of our restructuring program
that was launched in 2005 under our turnaround plan. In 2007,
we completed the analysis of our optimal product portfolio and
made decisions on exit strategies for non-optimal products under
our Product Line Simplification program (“PLS”). In 2007, we also
launched our Strategic Sourcing Initiative (“SSI”). We expect our
restructuring initiatives to deliver annualized savings of approx-
imately $430 once all initiatives are fully implemented by 2011-
2012. We also expect to achieve annualized benefits in excess of
$200 and $250 from PLS and SSI, respectively, in 2010. As dis-
cussed further below, in February 2009 we announced a new
restructuring program under our multi-year turnaround plan.
During 2008, revenue increased 8%, and Active Representatives
increased 7% (with increases in all segments), fueled by invest-
ments in advertising and the Representative Value Proposition
(“RVP”). Sales from each of our product categories increased,
with products in the Beauty category increasing 10%. During
2008, revenue grew in all segments except North America,
which was adversely affected by the slowing macro-economic
environment, deteriorating consumer confidence and higher
year-over-year fuel prices. We benefited from strength in devel-
oping and emerging markets around the globe that more than
offset the unfavorable impact of economic softness in North
America. See the “Segment Review” section of Management’s
Discussion and Analysis of Financial Condition and Results of
Operations for additional information related to changes in
revenue by segment.
During the fourth quarter of 2008, revenue declined as com-
pared to 2007, due to the significant negative impact of foreign
exchange and the depressed economy. We expect the global
economic pressures and negative impact of foreign currency will
continue or could worsen in the foreseeable future and 2009
will be a challenging year. Given the current macro-economic
environment, we expect that revenue growth in 2009 will be
somewhat lower than our long-term revenue growth, which is
expected to average mid-single digits, excluding the impact of
foreign exchange. We also expect that operating margin in 2009
will continue to be pressured by the unfavorable impacts of for-
eign exchange. Operating margin will also be negatively impact-
ed by additional restructuring charges during 2009. We believe
benefits from our SSI program, focusing on manufacturing
productivity, changing sourcing of raw materials and finished
goods to use exchange rates to our advantage, and some soften-
ing in commodity costs will help to partially offset the negative
impact of foreign exchange. We will continue to look for ways to
transform our cost structure and intend to reduce non-strategic
spending during 2009. We will also continue our strategies of
investing in advertising and our Representatives.
We believe that our strong operating cash flow and global cash
balances of over $1 billion, coupled with the continuing execu-
tion of our turnaround strategies and the competitive advan-
tages of our direct selling business model, will allow us to look
beyond our anticipated challenges in 2009 and continue our
focus on long-term sustainable, profitable growth.
STRATEGIC INITIATIVES
Advertising and Representative ValueProposition (“RVP”)Investing in advertising is a key strategy. We significantly
increased spending on advertising over the past three years.
During 2008, we increased our investment in advertising by
$22.1 or 6%. Approximately 70% of the incremental spending
was spent in Russia, China and the United Kingdom. The incre-
mental spending on advertising was at a rate somewhat less
than revenue growth. The advertising investments supported
new product launches, such as, Anew Ultimate Contouring Eye
System, Bond Girl fragrance, Pro-to-Go Lipstick, Anew Ultimate
Age Repair Elixir, Supershock Mascara, Avon Solutions Hydra-
Radiance, U by Ungaro fragrances and Anew Rejuvenate Eye.
Advertising investments also included advertising to recruit
Representatives. We have also continued to forge alliances
with celebrities, including alliances with Patrick Dempsey and
Ferragamo Parfums S.P.A. for the “U by Ungaro” line of
fragrances.
We continued to invest in our direct-selling channel to improve
the reward and effort equation for our Representatives. We have
committed significant investments for extensive research to de-
termine the payback on advertising and field tools and actions,
and the optimal balance of these tools and actions in our mar-
kets. We have allocated these significant investments in propri-
etary direct selling analytics to better understand the drivers of
value for our Representatives. We measure our investment in
RVP as the incremental cost to provide these value-enhancing
initiatives. During 2008, we invested approximately $83 incre-
mentally in our Representatives through RVP by continued
implementation of our Sales Leadership program, enhanced
incentives, increased sales campaign frequency, improved com-
missions and new e-business tools. This incremental investment
was ahead of revenue growth. Investing in RVP will continue to
be a key strategy. We will continue to look for ways to improve
the earnings opportunity for Representatives through various
means, including the following:
• Evaluating optimum discount structures in select markets;
• Continuing the roll-out of our Sales Leadership Program,
which offers Representatives an enhanced career opportunity;
• Strategically examining the fee structure and brochure costs to
enhance Representative economics;
• Recalibrating the frequency of campaigns to maximize
Representative selling opportunities; and
• Applying the optimal balance of advertising and field
investment in our key markets.
While the reward and effort will be different within our global
portfolio of businesses, we believe that web enablement is a key
element to reduce Representative effort worldwide. We will
continue to focus on improving Internet-based tools for our
Representatives.
Product Line SimplificationDuring 2006, we began to analyze our product line, under our
PLS program, to develop a smaller range of better performing,
more profitable products. The overall goal of PLS is to identify an
improved product assortment to drive higher sales of more
profitable products. During 2007, we completed the analysis of
our product portfolio, concluded on the appropriate product
assortment going forward and made decisions regarding the
ultimate disposition of products that will no longer be part of our
improved product assortment (such as selling at a discount, dona-
tion, or destruction). During 2007 and 2006, we recorded PLS
charges of $187.8 and $81.4, respectively, primarily incremental
inventory obsolescence expense of $167.3 and $72.6, respec-
tively. We recorded final PLS charges in the fourth quarter of
2007. During the first half of 2008, we began to implement PLS
in the U.K and early results appear favorable; however, the tran-
sition is a long process and will continue into 2009. In the second
half of 2008, we began implementing PLS in all other markets,
with full implementation expected by the end of 2009.
We expect that sales and marketing benefits will account for
approximately 85% of our projected benefits. Improving our
product assortment will allow us to increase exposure and
improve presentation of the remaining products within our
brochure, which is expected to yield more pleasurable consumer
shopping experiences, easier Representative selling experiences,
and greater sales per brochure page. A second source of benefits
from PLS results from “transferable demand.” Transferable
demand refers to the concept that when products with redun-
dant characteristics are removed from our product assortment,
some demand from the eliminated products will transfer to the
remaining products that offer similar or comparable product
characteristics. As part of PLS, when we identify products that
have sufficient overlap of characteristics, we will eliminate the
products with the lowest profitability and we expect the prod-
ucts that we retain will generate more profit. A third source of
benefits from PLS is less price discounting. As we implement
operating procedures under PLS, we anticipate introducing fewer
new products and lengthening the lifecycle of products in our
offering, which we expect will lead to less aggressive price dis-
counting over a product’s life cycle.
A V O N 2008 21
PART II
In addition to the benefits above, we also expect supply chain
benefits to account for approximately 15% of our projected
benefits. We expect improvements to cost of sales once PLS is
fully implemented, primarily from a reduction in inventory
obsolescence expense as a result of better managed inventory
levels, lower variable spending on warehousing, more efficient
manufacturing utilization and lower purchasing costs. We also
expect operating expenses to benefit from a reduction in dis-
tribution costs and benefits to inventory productivity.
We estimate that we realized total benefits of approximately $40
during 2008 and we expect to realize benefits of approximately
$120 in 2009 and in excess of $200 in 2010.
Strategic Sourcing InitiativeWe launched SSI in 2007. This initiative is expected to reduce
direct and indirect costs of materials, goods and services. Under
this initiative, we are shifting our purchasing strategy from a
local, commodity-oriented approach towards a globally-
coordinated effort which leverages our volumes, allows our
suppliers to benefit from economies of scale, utilizes sourcing
best practices and processes, and better matches our suppliers’
capabilities with our needs. Beyond lower costs, our goals from
SSI include improving asset management, service for Representa-
tives and vendor relationships. During 2008, we realized benefits
of approximately $114 from SSI. In addition, we were able to
offset commodity cost increases of approximately $21 for full-
year 2008 due to SSI actions already in place. We expect to
realize annualized benefits from this initiative in excess of $250
by the end of 2009, with a full year of benefit in 2010. As a
result, we expect to realize benefits of approximately $200 in
2009 and benefits in excess of $250 in 2010.
We continue to implement a Sales and Operations Planning
process that is intended to better align demand plans with our
supply capabilities and provide us with earlier visibility to any
potential supply issues.
Enterprise Resource Planning SystemWe are in the midst of a multi-year global roll-out of an enter-
prise resource planning (“ERP”) system, which is expected to
improve the efficiency of our supply chain and financial trans-
action processes. We began our global roll-out in Europe in
2005 and have since implemented ERP in our European manu-
facturing facilities, our larger European direct selling operations
and in the U.S. As part of this continuing global roll-out, we
expect to implement ERP in several countries over the next
several years leveraging the knowledge gained from our pre-
vious implementations.
During 2008, we worked to improve the effectiveness of ERP in
the U.S. and began to implement in the other markets within
North America, as well as in certain smaller European direct
selling operations. During 2008, we also began the multi-year
implementation process in Latin America in one market. In Latin
America, we plan to implement modules of ERP in a gradual
manner across key markets over the next several years.
Zero-Overhead-GrowthWe have institutionalized a zero-overhead-growth philosophy
that aims to offset inflation through productivity improvements.
These improvements in productivity will come primarily from SSI
and our restructuring initiatives. We have defined overhead as
fixed expenses such as costs associated with our sales and
marketing infrastructure, and management and administrative
activities. Overhead excludes variable expenses within selling,
general and administrative expenses, such as shipping and
handling costs and bonuses to our employees in the sales
organization, and also excludes consumer and strategic invest-
ments that are included in selling, general and administrative
expenses, such as advertising, RVP, research and development
and brochure costs.
Restructuring Programs
2005 ProgramWe launched our original restructuring program under our multi-
year turnaround plan in late 2005 (the “2005 Program”). In
January 2008, we announced the final initiatives that are part of
the 2005 Program. We expect to record total restructuring
charges and other costs to implement restructuring initiatives
under this program of approximately $530 before taxes. We
have recorded $504.2 through December 31, 2008, ($60.6 in
2008, $158.3 in 2007, $228.8 in 2006 and $56.5 in 2005) for
actions associated with our restructuring initiatives under the
2005 Program, primarily for employee-related costs, including
severance, pension and other termination benefits, and pro-
fessional service fees related to these initiatives. We expect to
record a majority of the remaining costs by the end of 2009.
The costs to implement restructuring initiatives during 2005
through 2008 are associated with specific actions, including:
• organization realignment and downsizing in each region and
global through a process called “delayering,” taking out layers
to bring senior management closer to operations;
• the phased outsourcing of certain services, including certain
finance, information technology, human resource and
customer service processes, and the move of certain services
from markets to lower cost shared service centers;
• the restructure of certain international direct-selling
operations;
• the realignment of certain distribution and manufacturing
operations, including the realignment of certain of our North
America and Latin America distribution operations;

• the automation of certain distribution processes;
• the exit of certain unprofitable operations, including the clo-
sure of the Avon Salon & Spa, the closure of our operations in
Indonesia, the exit of a product line in China and the exit of
the beComing product line in the U.S.; and
• the reorganization of certain functions, primarily sales-related
organizations.
Actions implemented under these restructuring initiatives
resulted in savings of approximately $270 in 2008, as compared
to savings of approximately $230 in 2007. We expect to achieve
annualized savings of approximately $430 once all initiatives are
fully implemented by 2011-2012. We expect the savings to
reach approximately $300 in 2009.
2009 Restructuring ProgramIn February 2009, we announced a new restructuring program
under our multi-year turnaround plan (the “2009 Program”).
The restructuring initiatives under the 2009 Program are
expected to focus on restructuring our global supply chain
operations, realigning certain local business support functions to
a more regional basis to drive increased efficiencies, and stream-
lining transaction-related services, including selective outsourc-
ing. We expect to incur restructuring charges and other costs to
implement these initiatives in the range of $300 to $400 before
taxes over the next several years. We are targeting annualized
savings under the 2009 Program of approximately $200 upon
full implementation by 2012-2013.
See Note 14, Restructuring Initiatives, on pages F-28 through
F-31 of this 2008 Annual Report on Form 10-K.
NEW ACCOUNTING STANDARDS
Information relating to new accounting standards is included
Note 2, New Accounting Standards, on pages F-10 through F-11
of this 2008 Annual Report on Form 10-K.
Key Performance IndicatorsWithin the following discussion and analysis, we utilize the key performance indicators (“KPIs”) defined below to assist in the evaluation of
our business.
KPI DefinitionGrowth in Active Representatives This indicator is based on the number of Representatives submitting an order in a campaign,
totaled for all campaigns in the related period. This amount is divided by the number of bill-
ing days in the related period, to exclude the impact of year-to-year changes in billing days
(for example, holiday schedules). To determine the growth in Active Representatives, this
calculation is compared to the same calculation in the corresponding period of the prior
year.
Change in Units This indicator is based on the gross number of pieces of merchandise sold during a period,
as compared to the same number in the same period of the prior year. Units sold include
samples sold and product contingent upon the purchase of another product (for example,
gift with purchase or purchase with purchase), but exclude free samples.
Inventory Days This indicator is equal to the number of days of historical cost of sales covered by the
inventory balance at the end of the period.
CRITICAL ACCOUNTING ESTIMATES
We believe the accounting policies described below represent
our critical accounting policies due to the estimation processes
involved in each. See Note 1, Description of the Business and
Summary of Significant Accounting Policies, for a detailed dis-
cussion of the application of these and other accounting policies.
Restructuring ReservesWe record severance-related expenses once they are both prob-
able and estimable in accordance with the provisions of FAS
No. 112, Employer’s Accounting for Post-Employment Benefits,
for severance provided under an ongoing benefit arrangement.
One-time, involuntary benefit arrangements and disposal costs,
primarily contract termination costs, are accounted for under the
provisions of FAS No. 146, Accounting for Costs Associated with
Exit or Disposal Activities. One-time, voluntary benefit arrange-
ments are accounted for under the provisions of FAS No. 88,
Employers’ Accounting for Settlements and Curtailments of
Defined Benefit Pension Plans and for Termination Benefits. We
evaluate impairment issues under the provisions of FAS No. 144,
Accounting for the Impairment or Disposal of Long-Lived Assets.
We estimate the expense for these initiatives, when approved by
A V O N 2008 23
PART II
the appropriate corporate authority, by accumulating detailed
estimates of costs for such plans. These expenses include the
estimated costs of employee severance and related benefits,
impairment of property, plant and equipment, contract termi-
nation payments for leases, and any other qualifying exit costs.
These estimated costs are grouped by specific projects within the
overall plan and are then monitored on a quarterly basis by
finance personnel. Such costs represent management’s best
estimate, but require assumptions about the programs that may
change over time, including attrition rates. Estimates are evalu-
ated periodically to determine if an adjustment is required.
Allowances for Doubtful AccountsReceivableRepresentatives contact their customers, selling primarily through
the use of brochures for each sales campaign. Sales campaigns
are generally for a two-week duration in the U.S. and a two- to
four-week duration outside the U.S. The Representative pur-
chases products directly from Avon and may or may not sell
them to an end user. In general, the Representative, an
independent contractor, remits a payment to Avon each sales
campaign, which relates to the prior campaign cycle. The Repre-
sentative is generally precluded from submitting an order for the
current sales campaign until the accounts receivable balance for
the prior campaign is paid; however, there are circumstances
where the Representative fails to make the required payment.
We record an estimate of an allowance for doubtful accounts on
receivable balances based on an analysis of historical data and
current circumstances. Over the past three years, annual bad
debt expense has been in the range of $145 to $195, or approx-
imately 1.7% of total revenue. We generally have no detailed
information concerning, or any communication with, any end
user of our products beyond the Representative. We have no
legal recourse against the end user for the collectability of any
accounts receivable balances due from the Representative to us.
If the financial condition of our Representatives were to deterio-
rate, resulting in an impairment of their ability to make pay-
ments, additional allowances may be required.
Allowances for Sales ReturnsWe record a provision for estimated sales returns based on histor-
ical experience with product returns. Over the past three years,
sales returns have been in the range of $295 to $370, or approx-
imately 3.4% of total revenue. If the historical data we use to
calculate these estimates does not approximate future returns,
due to changes in marketing or promotional strategies, or for
other reasons, additional allowances may be required.
Provisions for Inventory ObsolescenceWe record an allowance for estimated obsolescence equal to the
difference between the cost of inventory and the estimated
market value. In determining the allowance for estimated obso-
lescence, we classify inventory into various categories based
upon its stage in the product life cycle, future marketing sales
plans and the disposition process. We assign a degree of
obsolescence risk to products based on this classification to
determine the level of obsolescence provision. If actual sales are
less favorable than those projected by management, additional
inventory allowances may need to be recorded for such addi-
tional obsolescence. Annual obsolescence expense was $80.8,
$280.6 and $179.7 for the years ended December 31, 2008,
2007 and 2006, respectively. 2007 and 2006 included incre-
mental inventory obsolescence charges of $167.3 and $72.6,
respectively, related to our PLS program and 2006 also includes
$20.5 related to our decision to discontinue the sale of heavily
discounted excess products. Obsolescence expense for 2008
benefited by approximately $13 from changes in estimates to
our disposition plan under our PLS program.
Pension, Postretirement andPostemployment Benefit ExpenseWe maintain defined benefit pension plans, which cover sub-
stantially all employees in the U.S. and in certain international
locations. Additionally, we have unfunded supplemental pension
benefit plans for certain current and retired executives (see Note
11, Employee Benefit Plans).
For 2008, the weighted average assumed rate of return on all
pension plan assets, including the U.S. and non-U.S. plans was
7.66%. In determining the long-term rates of return, we con-
sider the nature of the plans’ investments, an expectation for the
plans’ investment strategies, historical rates of return and current
economic forecasts. We evaluate the expected long-term rate of
return annually and adjust as necessary.
The majority of our pension plan assets relate to the U.S. pension
plan. The assumed rate of return for 2008 for the U.S. plan was
8%, which was based on an asset allocation of approximately
35% in corporate and government bonds and mortgage-backed
securities (which are expected to earn approximately 4% to 6%
in the long term) and 65% in equity securities (which are ex-
pected to earn approximately 8% to 10% in the long term).
Historical rates of return on the assets of the U.S. plan for the
most recent 10-year and 20-year periods were 2.0% and 7.6%,
respectively. In the U.S. plan, our asset allocation policy has
favored U.S. equity securities, which have lost .7% and returned
8.4%, respectively, over the 10-year and 20-year periods. The
plan assets in the U.S. lost 26.2% and returned 9.3% in 2008
and 2007, respectively.
The discount rate used for determining future pension obliga-
tions for each individual plan is based on a review of long-term
bonds that receive a high-quality rating from a recognized rating
agency. The discount rates for our more significant plans, includ-
ing our U.S. plan, were based on the internal rates of return for
a portfolio of high quality bonds with maturities that are con-
sistent with the projected future benefit payment obligations of
each plan. The weighted-average discount rate for U.S. and
non-U.S. plans determined on this basis was 6.11% at Decem-
ber 31, 2008, and 5.88% at December 31, 2007.
Our funding requirements may be impacted by regulations or
interpretations thereof. Our calculations of pension, postretire-
ment and postemployment costs are dependent upon the use of
assumptions, including discount rates, expected return on plan
assets, interest cost, health care cost trend rates, benefits
earned, mortality rates, the number of associate retirements, the
number of associates electing to take lump-sum payments and
other factors. Actual results that differ from assumptions are
accumulated and amortized to expense over future periods and,
therefore, generally affect recognized expense in future periods.
At December 31, 2008, we had pretax actuarial losses and prior
service credits totaling $538.4 and $260.6 for the U.S. and
non-U.S. plans, respectively, that have not yet been charged to
expense. These actuarial losses have been charged to accumu-
lated other comprehensive loss within shareholders’ equity.
While we believe that the assumptions used are reasonable,
differences in actual experience or changes in assumptions may
materially affect our pension, postretirement and postemploy-
ment obligations and future expense. During 2008, the plan
assets experienced significant losses, which were mostly due to
unfavorable returns on equity securities. These unfavorable
returns will increase pension cost in future periods. For 2009, our
assumption for the expected rate of return on assets is 8.0% and
7.2% for our U.S. and non-U.S. plans, respectively. Our assump-
tions are reviewed and determined on an annual basis.
A 50 basis point change (in either direction) in the expected rate
of return on plan assets, the discount rate or the rate of com-
pensation increases, would have had the following effect on
2008 pension expense:Increase/(Decrease) in
Pension Expense
50 basis pointIncrease
50 basis pointDecrease
Rate of return on
assets (6.0) 6.0
Discount rate (8.6) 8.4
Rate of compensation
increase 1.2 (1.5)
TaxesWe record a valuation allowance to reduce our deferred tax
assets to an amount that is more likely than not to be realized.
While we have considered projected future taxable income and
ongoing tax planning strategies in assessing the need for the
valuation allowance, in the event we were to determine that we
would be able to realize a net deferred tax asset in the future, in
excess of the net recorded amount, an adjustment to the
deferred tax asset would increase earnings in the period such
determination was made. Likewise, should we determine that
we would not be able to realize all or part of our net deferred
tax asset in the future, an adjustment to the deferred tax asset
would decrease earnings in the period such determination was
made. Deferred taxes are not provided on the portion of
unremitted earnings of subsidiaries outside of the U.S. when
management concludes that these earnings are indefinitely
reinvested. Deferred taxes are provided on earnings not
considered indefinitely reinvested.
We establish additional provisions for income taxes when,
despite the belief that our tax positions are fully supportable,
there remain certain positions that are likely to be challenged
and may or may not be sustained on review by tax authorities.
We adjust these additional accruals in light of changing facts
and circumstances. We file income tax returns in many juris-
dictions. In 2009, a number of income tax returns are scheduled
to close by statute and it is possible that a number of tax
examinations may be completed. If Avon’s filing positions are
ultimately upheld, it is possible that the 2009 provision for
income taxes may reflect adjustments.
In accordance with FIN 48, we recognize the benefit of a tax
position, if that position is more likely than not of being sus-
tained on audit, based on the technical merits of the position.
We believe that our assessment of more likely than not is
reasonable, but because of the subjectivity involved and the
unpredictable nature of the subject matter at issue, our
assessment may prove ultimately to be incorrect, which could
materially impact the Consolidated Financial Statements.
Share-based CompensationAll share-based payments to employees are recognized in the
financial statements based on their fair values using an option-
pricing model at the date of grant. We use a Black-Scholes-
Merton option-pricing model to calculate the fair value of
options. This model requires various judgmental assumptions
including volatility, forfeiture rates and expected option life. If
any of the assumptions used in the model change significantly,
share-based compensation may differ materially in the future
from that recorded in the current period.
Loss ContingenciesIn accordance with FAS No. 5, Accounting for Contingencies, we
determine whether to disclose and accrue for loss contingencies
based on an assessment of whether the risk of loss is remote,
reasonably possible or probable. Our assessment is developed in
A V O N 2008 25
PART II
consultation with our outside counsel and other advisors and is
based on an analysis of possible outcomes under various strat-
egies. Loss contingency assumptions involve judgments that are
inherently subjective and can involve matters that are in litigation,
which, by its nature is unpredictable. We believe that our assess-
ment of the probability of loss contingencies is reasonable, but
because of the subjectivity involved and the unpredictable nature
of the subject matter at issue, our assessment may prove ulti-
mately to be incorrect, which could materially impact the Con-
solidated Financial Statements.
RESULTS OF OPERATIONS – CONSOLIDATED
Favorable (Unfavorable)%/Point Change
2008 2007 20062008 vs.
20072007 vs.
2006
Total revenue $10,690.1 $9,938.7 $8,763.9 8% 13%Cost of sales 3,949.1 3,941.2 3,416.5 –% (15)%Selling, general and administrative expenses 5,401.7 5,124.8 4,586.0 (5)% (12)%Operating profit 1,339.3 872.7 761.4 53% 15%Interest expense 100.4 112.2 99.6 11% (13)%Interest income (37.1) (42.2) (55.3) (12)% (24)%Other expense, net 37.7 6.6 13.6 * 51%Net income $ 875.3 $ 530.7 $ 477.6 65% 11%Diluted earnings per share $ 2.04 $ 1.21 $ 1.06 69% 14%
Advertising expenses(1) $ 390.5 $ 368.4 $ 248.9 (6)% (48)%
Gross margin 63.1% 60.3% 61.0% 2.8 (.7)Selling, general and administrative expenses as a % of
total revenue 50.5% 51.6% 52.3% 1.1 .7Operating margin 12.5% 8.8% 8.7% 3.7 .1Effective tax rate 29.3% 33.0% 31.8% 3.7 (1.2)
Units sold 1% 7%Active Representatives 7% 9%
* Calculation not meaningful
(1) Advertising expenses are included within selling, general and administrative expenses.
Total RevenueTotal revenue increased 8% in 2008, with foreign exchange
contributing 3 percentage points to the revenue growth. Rev-
enue grew in all segments, except North America. Revenue
growth was driven by an increase of 7% in Active
Representatives.
On a category basis, the 2008 increase in revenue was primarily
driven by an increase of 10% in Beauty sales, with increases in
all sub-categories of Beauty. Within the Beauty category, fra-
grance grew 9%, color grew 11%, skin care grew 10%, and
personal care grew 8%. Fashion sales increased 6%, while Home
sales decreased 3%.
Total revenue increased 13% in 2007 with growth in all seg-
ments. Revenue growth was driven by an increase of 9% in
Active Representatives, while foreign exchange contributed 5
percentage points to the revenue growth. Additional selling
opportunities in Central & Eastern Europe had a minimal impact
on Active Representative growth.
On a category basis, the 2007 increase in revenue was primarily
driven by an increase of 15% in Beauty sales. Within the Beauty
category, fragrance increased 20%, color increased 16%, skin
care increased 6% and personal care increased 21%. Fashion
sales increased 12% and Home sales increased 6%.
For additional discussion of the changes in revenue by segment,
see the “Segment Review” section of this Management’s Dis-
cussion and Analysis of Financial Condition and Results of
Operations.
Gross MarginGross margin increased 2.8 points in 2008, primarily due to a
decrease in inventory obsolescence provisions in 2008, which
benefited gross margin by 2.0 points, and from increased pricing
and favorable product mix, which benefited gross margin by 1.3
points. These benefits to gross margin were partially offset by
higher commodity costs and the unfavorable impact of foreign
exchange on product cost in Europe. 2007 included incremental
inventory obsolescence charges of $167.3 related to our PLS
program. Obsolescence expense for 2008 also benefited by
approximately $13 from changes in estimates to our disposition
plan under our PLS program.
Gross margin decreased .7 point in 2007, primarily due to an
increase in inventory obsolescence provisions of approximately
$100 in 2007, which negatively impacted gross margin by 1.1
points, and an unfavorable mix of products sold, partially offset
by supply chain efficiencies. As discussed in the Overview sec-
tion, 2007 and 2006 included incremental inventory obso-
lescence charges of $167.3 and $72.6, respectively, related to
our decision to discontinue the sale of certain products as part of
our PLS program. Additionally, 2006 included incremental
inventory obsolescence charges of $20.5 related to our decisions
to discontinue the sale of certain heavily discounted products.
Selling, General and AdministrativeExpensesSelling, general and administrative expenses increased $276.9
during 2008, primarily due to the following:
• higher investments in RVP and advertising of approximately
$105;
• higher variable expenses such as freight from increased sales
volume and brochure costs;
• higher overhead primarily due to higher marketing costs; and
• the impact of foreign exchange.
These higher costs were partially offset by lower costs incurred
to implement our restructuring initiatives of $99.8, due to costs
associated with previously approved initiatives.
Selling, general and administrative expenses increased $538.8
during 2007, primarily due to the following:
• higher investments in advertising and RVP of approximately
$240;
• higher variable expenses such as freight and commissions from
increased sales volume; and
• increased distribution costs as a percentage of revenue.
These higher costs were partially offset by $71.8 of lower costs
incurred to implement our restructuring initiatives and savings
associated with position eliminations resulting from restructur-
ing initiatives. Additionally, 2007 benefited from a favorable
comparison to 2006 which included a one-time charge of $21.0
related to the resolution of a long-standing dispute regarding
value-added taxes in the U.K., the recognition of unclaimed
sales-related tax credits and a reduction of a reserve for statutory
liabilities.
See the “Segment Review” section of Management’s Discussion
and Analysis of Financial Condition and Results of Operations for
additional information related to changes in operating margin by
segment.
Other ExpensesInterest expense decreased in 2008, primarily due to lower
domestic interest rates. Interest expense increased in 2007 as
compared to 2006, mainly due to higher borrowings to support
our share repurchase programs, as well as increases in domestic
interest rates. At December 31, 2008 and 2007, we held interest
rate swap agreements that effectively converted approximately
50% and 30% of our outstanding long-term, fixed-rate borrow-
ings to a variable interest rate based on LIBOR, respectively. The
total exposure of our debt to floating interest rates at Decem-
ber 31, 2008, and December 31, 2007, was approximately 65%
and 60%, respectively.
Interest income decreased in 2008, primarily due to lower
interest rates. Interest income decreased in 2007 as compared to
2006, primarily due to lower cash and cash equivalent balances.
Other expense, net increased in 2008, primarily due to net
foreign exchange losses in 2008, as compared to foreign
exchange gains in 2007. Other expense, net decreased in 2007
as compared to 2006, primarily due to higher net foreign
exchange gains in 2007.
Effective Tax RateThe effective tax rate for 2008 was 29.3%, compared to 33.0%
for 2007 and 31.8% for 2006.
During 2008, the tax rate was favorably impacted by 3.8 points
due to an audit settlement, partially offset by 1.2 points from the
establishment of a valuation allowance against deferred tax
assets. The rate was also favorably impacted by changes in the
earnings mix of international subsidiaries, which is not expected
to recur. During 2007, the tax rate was favorably impacted by
approximately 2.0 points due to the net release of valuation
allowances, partially offset by the unfavorable impact of restruc-
turing and PLS initiatives. During 2006, the effective tax rate was
favorably impacted by approximately 4.0 points due to the clo-
sure of tax years by expiration of the statute of limitations and
audit settlements as well as 1.7 points due to tax refunds. These
benefits were partially offset by the repatriation of international
earnings, which increased the rate by approximately 3.1 points,
and the tax impact associated with our restructuring charges due
to the lower weighted-average effective tax rate of subsidiaries
incurring the charges.
A V O N 2008 27
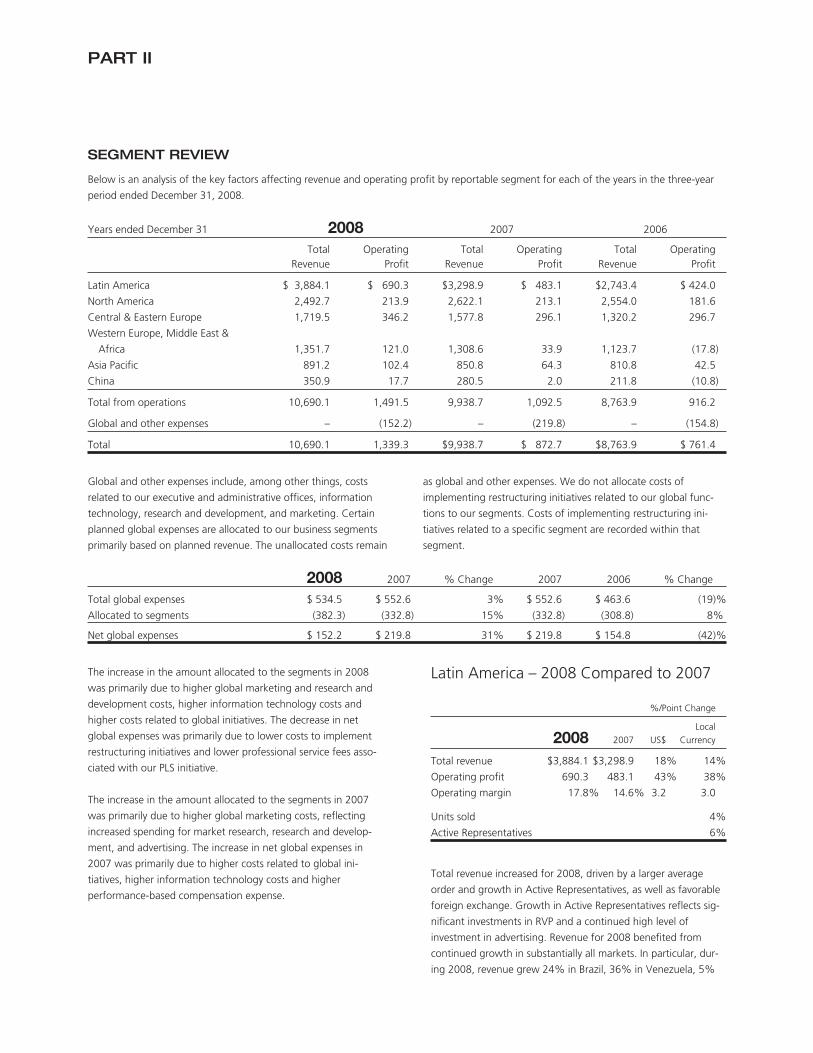
PART II
SEGMENT REVIEW
Below is an analysis of the key factors affecting revenue and operating profit by reportable segment for each of the years in the three-year
period ended December 31, 2008.
Years ended December 31 2008 2007 2006
TotalRevenue
OperatingProfit
TotalRevenue
OperatingProfit
TotalRevenue
OperatingProfit
Latin America $ 3,884.1 $ 690.3 $3,298.9 $ 483.1 $2,743.4 $ 424.0
North America 2,492.7 213.9 2,622.1 213.1 2,554.0 181.6
Central & Eastern Europe 1,719.5 346.2 1,577.8 296.1 1,320.2 296.7
Western Europe, Middle East &
Africa 1,351.7 121.0 1,308.6 33.9 1,123.7 (17.8)
Asia Pacific 891.2 102.4 850.8 64.3 810.8 42.5
China 350.9 17.7 280.5 2.0 211.8 (10.8)
Total from operations 10,690.1 1,491.5 9,938.7 1,092.5 8,763.9 916.2
Global and other expenses – (152.2) – (219.8) – (154.8)
Total 10,690.1 1,339.3 $9,938.7 $ 872.7 $8,763.9 $ 761.4
Global and other expenses include, among other things, costs
related to our executive and administrative offices, information
technology, research and development, and marketing. Certain
planned global expenses are allocated to our business segments
primarily based on planned revenue. The unallocated costs remain
as global and other expenses. We do not allocate costs of
implementing restructuring initiatives related to our global func-
tions to our segments. Costs of implementing restructuring ini-
tiatives related to a specific segment are recorded within that
segment.
2008 2007 % Change 2007 2006 % Change
Total global expenses $ 534.5 $ 552.6 3% $ 552.6 $ 463.6 (19)%
Allocated to segments (382.3) (332.8) 15% (332.8) (308.8) 8%
Net global expenses $ 152.2 $ 219.8 31% $ 219.8 $ 154.8 (42)%
The increase in the amount allocated to the segments in 2008
was primarily due to higher global marketing and research and
development costs, higher information technology costs and
higher costs related to global initiatives. The decrease in net
global expenses was primarily due to lower costs to implement
restructuring initiatives and lower professional service fees asso-
ciated with our PLS initiative.
The increase in the amount allocated to the segments in 2007
was primarily due to higher global marketing costs, reflecting
increased spending for market research, research and develop-
ment, and advertising. The increase in net global expenses in
2007 was primarily due to higher costs related to global ini-
tiatives, higher information technology costs and higher
performance-based compensation expense.
Latin America – 2008 Compared to 2007
%/Point Change
2008 2007 US$Local
Currency
Total revenue $3,884.1 $3,298.9 18% 14%
Operating profit 690.3 483.1 43% 38%
Operating margin 17.8% 14.6% 3.2 3.0
Units sold 4%
Active Representatives 6%
Total revenue increased for 2008, driven by a larger average
order and growth in Active Representatives, as well as favorable
foreign exchange. Growth in Active Representatives reflects sig-
nificant investments in RVP and a continued high level of
investment in advertising. Revenue for 2008 benefited from
continued growth in substantially all markets. In particular, dur-
ing 2008, revenue grew 24% in Brazil, 36% in Venezuela, 5%
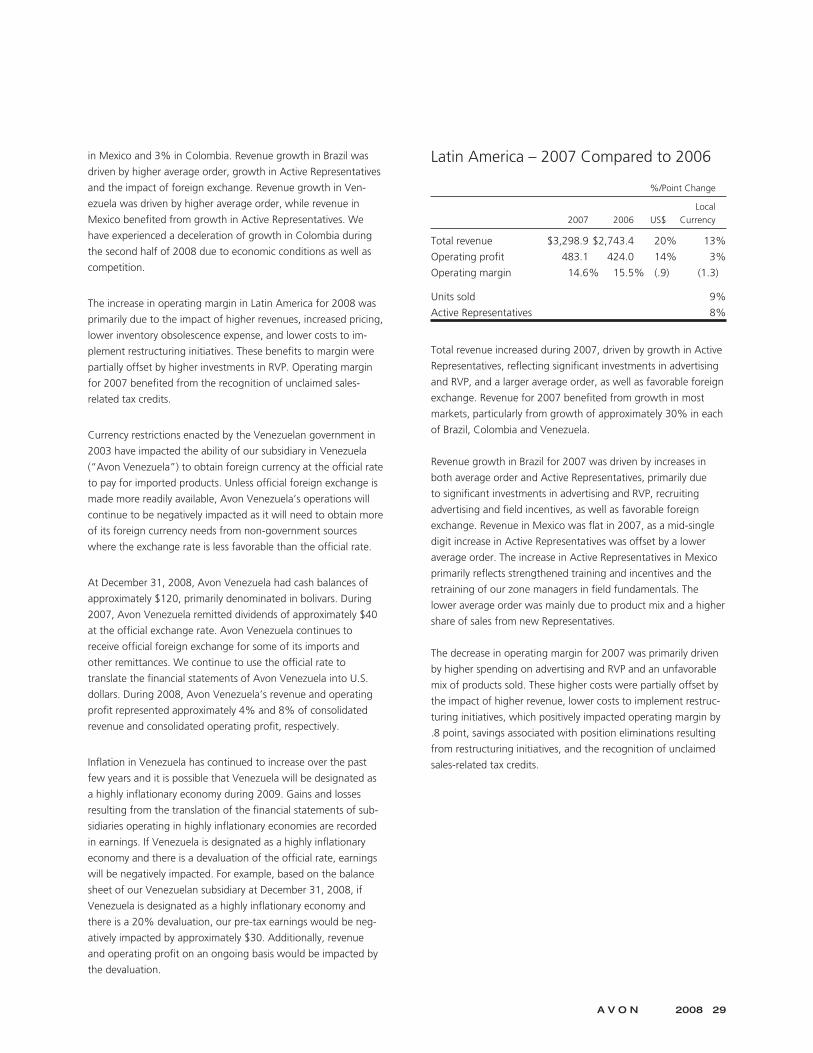
in Mexico and 3% in Colombia. Revenue growth in Brazil was
driven by higher average order, growth in Active Representatives
and the impact of foreign exchange. Revenue growth in Ven-
ezuela was driven by higher average order, while revenue in
Mexico benefited from growth in Active Representatives. We
have experienced a deceleration of growth in Colombia during
the second half of 2008 due to economic conditions as well as
competition.
The increase in operating margin in Latin America for 2008 was
primarily due to the impact of higher revenues, increased pricing,
lower inventory obsolescence expense, and lower costs to im-
plement restructuring initiatives. These benefits to margin were
partially offset by higher investments in RVP. Operating margin
for 2007 benefited from the recognition of unclaimed sales-
related tax credits.
Currency restrictions enacted by the Venezuelan government in
2003 have impacted the ability of our subsidiary in Venezuela
(“Avon Venezuela”) to obtain foreign currency at the official rate
to pay for imported products. Unless official foreign exchange is
made more readily available, Avon Venezuela’s operations will
continue to be negatively impacted as it will need to obtain more
of its foreign currency needs from non-government sources
where the exchange rate is less favorable than the official rate.
At December 31, 2008, Avon Venezuela had cash balances of
approximately $120, primarily denominated in bolivars. During
2007, Avon Venezuela remitted dividends of approximately $40
at the official exchange rate. Avon Venezuela continues to
receive official foreign exchange for some of its imports and
other remittances. We continue to use the official rate to
translate the financial statements of Avon Venezuela into U.S.
dollars. During 2008, Avon Venezuela’s revenue and operating
profit represented approximately 4% and 8% of consolidated
revenue and consolidated operating profit, respectively.
Inflation in Venezuela has continued to increase over the past
few years and it is possible that Venezuela will be designated as
a highly inflationary economy during 2009. Gains and losses
resulting from the translation of the financial statements of sub-
sidiaries operating in highly inflationary economies are recorded
in earnings. If Venezuela is designated as a highly inflationary
economy and there is a devaluation of the official rate, earnings
will be negatively impacted. For example, based on the balance
sheet of our Venezuelan subsidiary at December 31, 2008, if
Venezuela is designated as a highly inflationary economy and
there is a 20% devaluation, our pre-tax earnings would be neg-
atively impacted by approximately $30. Additionally, revenue
and operating profit on an ongoing basis would be impacted by
the devaluation.
Latin America – 2007 Compared to 2006
%/Point Change
2007 2006 US$Local
Currency
Total revenue $3,298.9 $2,743.4 20% 13%
Operating profit 483.1 424.0 14% 3%
Operating margin 14.6% 15.5% (.9) (1.3)
Units sold 9%
Active Representatives 8%
Total revenue increased during 2007, driven by growth in Active
Representatives, reflecting significant investments in advertising
and RVP, and a larger average order, as well as favorable foreign
exchange. Revenue for 2007 benefited from growth in most
markets, particularly from growth of approximately 30% in each
of Brazil, Colombia and Venezuela.
Revenue growth in Brazil for 2007 was driven by increases in
both average order and Active Representatives, primarily due
to significant investments in advertising and RVP, recruiting
advertising and field incentives, as well as favorable foreign
exchange. Revenue in Mexico was flat in 2007, as a mid-single
digit increase in Active Representatives was offset by a lower
average order. The increase in Active Representatives in Mexico
primarily reflects strengthened training and incentives and the
retraining of our zone managers in field fundamentals. The
lower average order was mainly due to product mix and a higher
share of sales from new Representatives.
The decrease in operating margin for 2007 was primarily driven
by higher spending on advertising and RVP and an unfavorable
mix of products sold. These higher costs were partially offset by
the impact of higher revenue, lower costs to implement restruc-
turing initiatives, which positively impacted operating margin by
.8 point, savings associated with position eliminations resulting
from restructuring initiatives, and the recognition of unclaimed
sales-related tax credits.
A V O N 2008 29
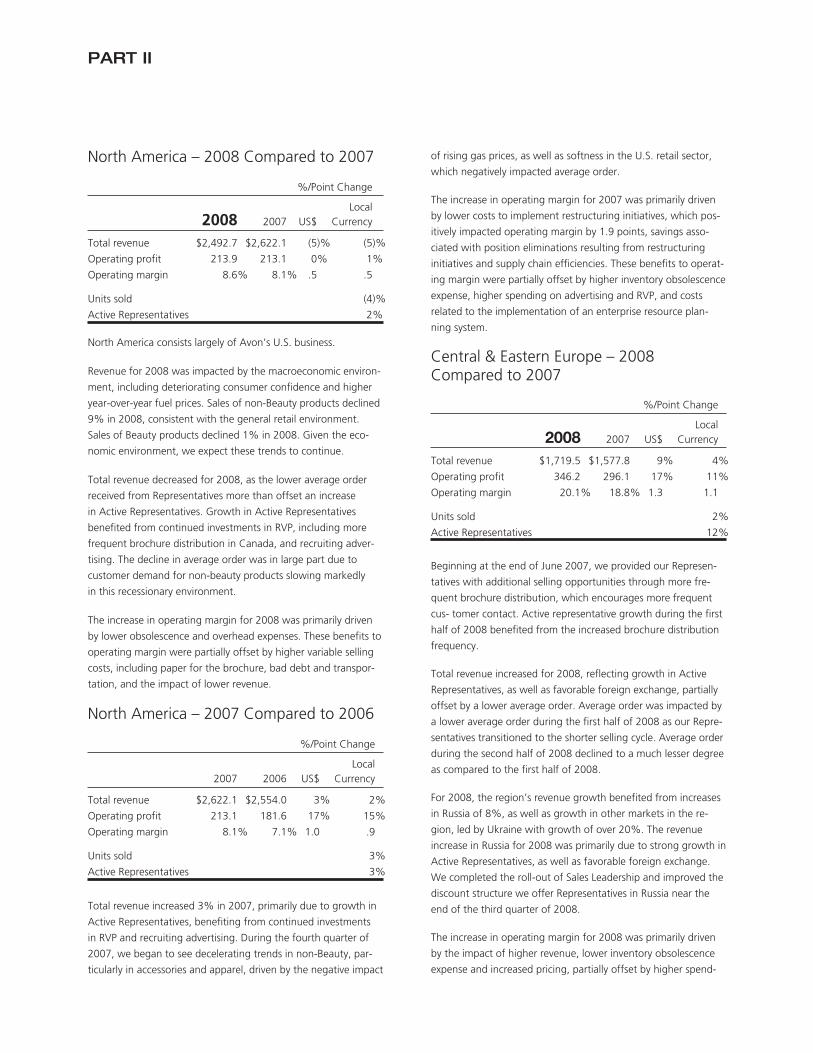
PART II
North America – 2008 Compared to 2007
%/Point Change
2008 2007 US$Local
Currency
Total revenue $2,492.7 $2,622.1 (5)% (5)%
Operating profit 213.9 213.1 0% 1%
Operating margin 8.6% 8.1% .5 .5
Units sold (4)%
Active Representatives 2%
North America consists largely of Avon’s U.S. business.
Revenue for 2008 was impacted by the macroeconomic environ-
ment, including deteriorating consumer confidence and higher
year-over-year fuel prices. Sales of non-Beauty products declined
9% in 2008, consistent with the general retail environment.
Sales of Beauty products declined 1% in 2008. Given the eco-
nomic environment, we expect these trends to continue.
Total revenue decreased for 2008, as the lower average order
received from Representatives more than offset an increase
in Active Representatives. Growth in Active Representatives
benefited from continued investments in RVP, including more
frequent brochure distribution in Canada, and recruiting adver-
tising. The decline in average order was in large part due to
customer demand for non-beauty products slowing markedly
in this recessionary environment.
The increase in operating margin for 2008 was primarily driven
by lower obsolescence and overhead expenses. These benefits to
operating margin were partially offset by higher variable selling
costs, including paper for the brochure, bad debt and transpor-
tation, and the impact of lower revenue.
North America – 2007 Compared to 2006
%/Point Change
2007 2006 US$Local
Currency
Total revenue $2,622.1 $2,554.0 3% 2%
Operating profit 213.1 181.6 17% 15%
Operating margin 8.1% 7.1% 1.0 .9
Units sold 3%
Active Representatives 3%
Total revenue increased 3% in 2007, primarily due to growth in
Active Representatives, benefiting from continued investments
in RVP and recruiting advertising. During the fourth quarter of
2007, we began to see decelerating trends in non-Beauty, par-
ticularly in accessories and apparel, driven by the negative impact
of rising gas prices, as well as softness in the U.S. retail sector,
which negatively impacted average order.
The increase in operating margin for 2007 was primarily driven
by lower costs to implement restructuring initiatives, which pos-
itively impacted operating margin by 1.9 points, savings asso-
ciated with position eliminations resulting from restructuring
initiatives and supply chain efficiencies. These benefits to operat-
ing margin were partially offset by higher inventory obsolescence
expense, higher spending on advertising and RVP, and costs
related to the implementation of an enterprise resource plan-
ning system.
Central & Eastern Europe – 2008Compared to 2007
%/Point Change
2008 2007 US$Local
Currency
Total revenue $1,719.5 $1,577.8 9% 4%
Operating profit 346.2 296.1 17% 11%
Operating margin 20.1% 18.8% 1.3 1.1
Units sold 2%
Active Representatives 12%
Beginning at the end of June 2007, we provided our Represen-
tatives with additional selling opportunities through more fre-
quent brochure distribution, which encourages more frequent
cus- tomer contact. Active representative growth during the first
half of 2008 benefited from the increased brochure distribution
frequency.
Total revenue increased for 2008, reflecting growth in Active
Representatives, as well as favorable foreign exchange, partially
offset by a lower average order. Average order was impacted by
a lower average order during the first half of 2008 as our Repre-
sentatives transitioned to the shorter selling cycle. Average order
during the second half of 2008 declined to a much lesser degree
as compared to the first half of 2008.
For 2008, the region’s revenue growth benefited from increases
in Russia of 8%, as well as growth in other markets in the re-
gion, led by Ukraine with growth of over 20%. The revenue
increase in Russia for 2008 was primarily due to strong growth in
Active Representatives, as well as favorable foreign exchange.
We completed the roll-out of Sales Leadership and improved the
discount structure we offer Representatives in Russia near the
end of the third quarter of 2008.
The increase in operating margin for 2008 was primarily driven
by the impact of higher revenue, lower inventory obsolescence
expense and increased pricing, partially offset by higher spend-
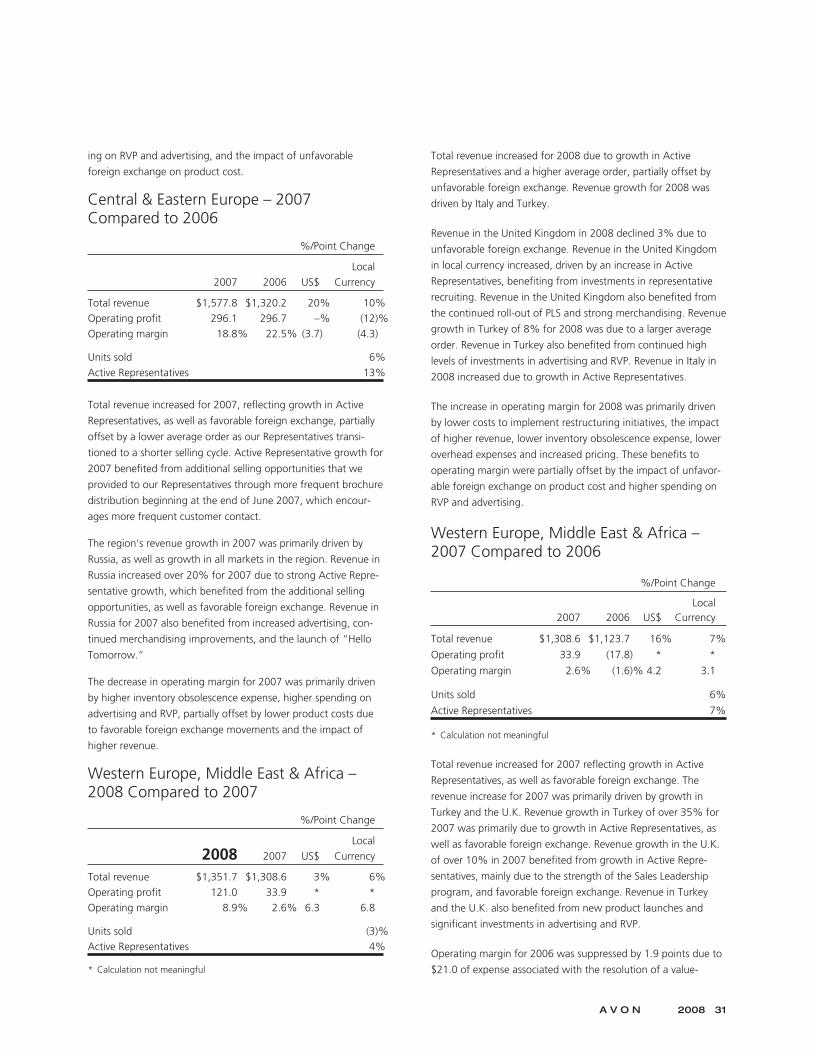
ing on RVP and advertising, and the impact of unfavorable
foreign exchange on product cost.
Central & Eastern Europe – 2007Compared to 2006
%/Point Change
2007 2006 US$Local
Currency
Total revenue $1,577.8 $1,320.2 20% 10%Operating profit 296.1 296.7 –% (12)%Operating margin 18.8% 22.5% (3.7) (4.3)
Units sold 6%Active Representatives 13%
Total revenue increased for 2007, reflecting growth in Active
Representatives, as well as favorable foreign exchange, partially
offset by a lower average order as our Representatives transi-
tioned to a shorter selling cycle. Active Representative growth for
2007 benefited from additional selling opportunities that we
provided to our Representatives through more frequent brochure
distribution beginning at the end of June 2007, which encour-
ages more frequent customer contact.
The region’s revenue growth in 2007 was primarily driven by
Russia, as well as growth in all markets in the region. Revenue in
Russia increased over 20% for 2007 due to strong Active Repre-
sentative growth, which benefited from the additional selling
opportunities, as well as favorable foreign exchange. Revenue in
Russia for 2007 also benefited from increased advertising, con-
tinued merchandising improvements, and the launch of “Hello
Tomorrow.”
The decrease in operating margin for 2007 was primarily driven
by higher inventory obsolescence expense, higher spending on
advertising and RVP, partially offset by lower product costs due
to favorable foreign exchange movements and the impact of
higher revenue.
Western Europe, Middle East & Africa –2008 Compared to 2007
%/Point Change
2008 2007 US$Local
Currency
Total revenue $1,351.7 $1,308.6 3% 6%Operating profit 121.0 33.9 * *Operating margin 8.9% 2.6% 6.3 6.8
Units sold (3)%Active Representatives 4%
* Calculation not meaningful
Total revenue increased for 2008 due to growth in Active
Representatives and a higher average order, partially offset by
unfavorable foreign exchange. Revenue growth for 2008 was
driven by Italy and Turkey.
Revenue in the United Kingdom in 2008 declined 3% due to
unfavorable foreign exchange. Revenue in the United Kingdom
in local currency increased, driven by an increase in Active
Representatives, benefiting from investments in representative
recruiting. Revenue in the United Kingdom also benefited from
the continued roll-out of PLS and strong merchandising. Revenue
growth in Turkey of 8% for 2008 was due to a larger average
order. Revenue in Turkey also benefited from continued high
levels of investments in advertising and RVP. Revenue in Italy in
2008 increased due to growth in Active Representatives.
The increase in operating margin for 2008 was primarily driven
by lower costs to implement restructuring initiatives, the impact
of higher revenue, lower inventory obsolescence expense, lower
overhead expenses and increased pricing. These benefits to
operating margin were partially offset by the impact of unfavor-
able foreign exchange on product cost and higher spending on
RVP and advertising.
Western Europe, Middle East & Africa –2007 Compared to 2006
%/Point Change
2007 2006 US$Local
Currency
Total revenue $1,308.6 $1,123.7 16% 7%
Operating profit 33.9 (17.8) * *
Operating margin 2.6% (1.6)% 4.2 3.1
Units sold 6%
Active Representatives 7%
* Calculation not meaningful
Total revenue increased for 2007 reflecting growth in Active
Representatives, as well as favorable foreign exchange. The
revenue increase for 2007 was primarily driven by growth in
Turkey and the U.K. Revenue growth in Turkey of over 35% for
2007 was primarily due to growth in Active Representatives, as
well as favorable foreign exchange. Revenue growth in the U.K.
of over 10% in 2007 benefited from growth in Active Repre-
sentatives, mainly due to the strength of the Sales Leadership
program, and favorable foreign exchange. Revenue in Turkey
and the U.K. also benefited from new product launches and
significant investments in advertising and RVP.
Operating margin for 2006 was suppressed by 1.9 points due to
$21.0 of expense associated with the resolution of a value-
A V O N 2008 31
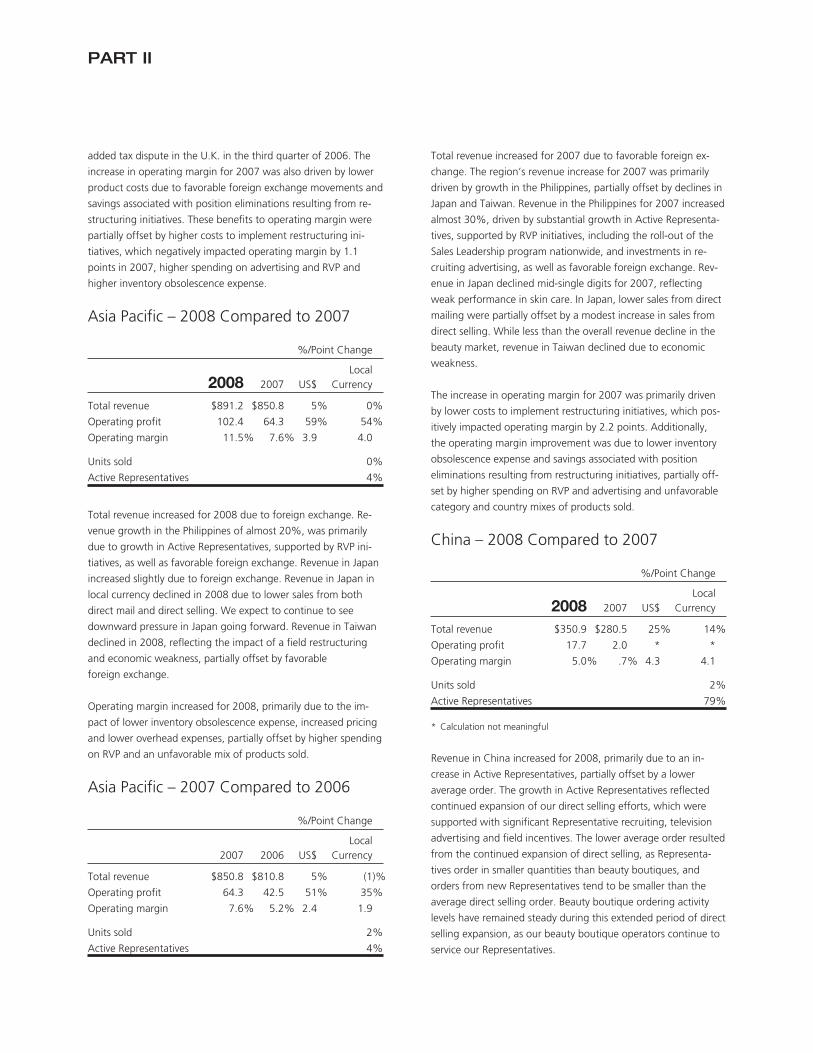
PART II
added tax dispute in the U.K. in the third quarter of 2006. The
increase in operating margin for 2007 was also driven by lower
product costs due to favorable foreign exchange movements and
savings associated with position eliminations resulting from re-
structuring initiatives. These benefits to operating margin were
partially offset by higher costs to implement restructuring ini-
tiatives, which negatively impacted operating margin by 1.1
points in 2007, higher spending on advertising and RVP and
higher inventory obsolescence expense.
Asia Pacific – 2008 Compared to 2007
%/Point Change
2008 2007 US$Local
Currency
Total revenue $891.2 $850.8 5% 0%
Operating profit 102.4 64.3 59% 54%
Operating margin 11.5% 7.6% 3.9 4.0
Units sold 0%
Active Representatives 4%
Total revenue increased for 2008 due to foreign exchange. Re-
venue growth in the Philippines of almost 20%, was primarily
due to growth in Active Representatives, supported by RVP ini-
tiatives, as well as favorable foreign exchange. Revenue in Japan
increased slightly due to foreign exchange. Revenue in Japan in
local currency declined in 2008 due to lower sales from both
direct mail and direct selling. We expect to continue to see
downward pressure in Japan going forward. Revenue in Taiwan
declined in 2008, reflecting the impact of a field restructuring
and economic weakness, partially offset by favorable
foreign exchange.
Operating margin increased for 2008, primarily due to the im-
pact of lower inventory obsolescence expense, increased pricing
and lower overhead expenses, partially offset by higher spending
on RVP and an unfavorable mix of products sold.
Asia Pacific – 2007 Compared to 2006
%/Point Change
2007 2006 US$Local
Currency
Total revenue $850.8 $810.8 5% (1)%
Operating profit 64.3 42.5 51% 35%
Operating margin 7.6% 5.2% 2.4 1.9
Units sold 2%
Active Representatives 4%
Total revenue increased for 2007 due to favorable foreign ex-
change. The region’s revenue increase for 2007 was primarily
driven by growth in the Philippines, partially offset by declines in
Japan and Taiwan. Revenue in the Philippines for 2007 increased
almost 30%, driven by substantial growth in Active Representa-
tives, supported by RVP initiatives, including the roll-out of the
Sales Leadership program nationwide, and investments in re-
cruiting advertising, as well as favorable foreign exchange. Rev-
enue in Japan declined mid-single digits for 2007, reflecting
weak performance in skin care. In Japan, lower sales from direct
mailing were partially offset by a modest increase in sales from
direct selling. While less than the overall revenue decline in the
beauty market, revenue in Taiwan declined due to economic
weakness.
The increase in operating margin for 2007 was primarily driven
by lower costs to implement restructuring initiatives, which pos-
itively impacted operating margin by 2.2 points. Additionally,
the operating margin improvement was due to lower inventory
obsolescence expense and savings associated with position
eliminations resulting from restructuring initiatives, partially off-
set by higher spending on RVP and advertising and unfavorable
category and country mixes of products sold.
China – 2008 Compared to 2007
%/Point Change
2008 2007 US$Local
Currency
Total revenue $350.9 $280.5 25% 14%
Operating profit 17.7 2.0 * *
Operating margin 5.0% .7% 4.3 4.1
Units sold 2%
Active Representatives 79%
* Calculation not meaningful
Revenue in China increased for 2008, primarily due to an in-
crease in Active Representatives, partially offset by a lower
average order. The growth in Active Representatives reflected
continued expansion of our direct selling efforts, which were
supported with significant Representative recruiting, television
advertising and field incentives. The lower average order resulted
from the continued expansion of direct selling, as Representa-
tives order in smaller quantities than beauty boutiques, and
orders from new Representatives tend to be smaller than the
average direct selling order. Beauty boutique ordering activity
levels have remained steady during this extended period of direct
selling expansion, as our beauty boutique operators continue to
service our Representatives.

The results in China for 2008 were negatively impacted by the
earthquake and subsequent flooding that occurred during the
second quarter of 2008.
The increase in operating margin for 2008 was primarily driven
by the impact of higher revenue and lower product costs, parti-
ally offset by ongoing higher spending on RVP and advertising
and costs associated with the 2008 earthquake and floods.
Operating margin for 2007 benefited from higher reductions in
reserves for statutory liabilities.
For information concerning an internal investigation into our
China operations, see Risk Factors and Note 15, Contingencies.
China – 2007 Compared to 2006
%/Point Change
2007 2006 US$Local
Currency
Total revenue $280.5 $211.8 32% 26%
Operating profit 2.0 (10.8) * *
Operating margin .7% (5.1)% 5.8 5.5
Units sold 19%
Active Representatives 145%
* Calculation not meaningful
Total revenue in China increased significantly in 2007, primarily
due to an increase in Active Representatives reflecting further
expansion of the direct-selling business, which contributed over
one half of the region’s revenue in 2007. Active Representatives
increased significantly in 2007 due to Representative recruiting,
as well as the absence of a meaningful base comparison for the
first half of 2006. The lower average order was mainly due to a
higher share of sales from new Representatives. At the same
time that we have been building on direct selling, we have seen
ordering activity levels maintained by our beauty boutiques as
they continue to engage in direct selling by servicing our Repre-
sentatives. Additionally, the number of beauty boutiques has
remained stable over the last year. Revenue in 2007 benefited
from representative recruiting and continued significant invest-
ments in advertising.
The increase in operating margin for 2007 was primarily driven
by the impact of higher revenue and a reduction of a reserve for
statutory liabilities. These positive impacts were partially offset by
ongoing higher spending on RVP and fees paid to registered
service centers for providing services to our Active
Representatives.
LIQUIDITY AND CAPITAL RESOURCES
Our principal sources of funds historically have been cash flows
from operations, commercial paper and borrowings under lines
of credit. We currently believe that existing cash, cash from
operations (including the impacts of cash required for restructur-
ing initiatives) and available sources of public and private financ-
ing are adequate to meet anticipated requirements for working
capital, dividends, capital expenditures, the share repurchase
program, possible acquisitions and other cash needs in the short
and long term.
We may, from time to time, seek to repurchase our equity in
open market purchases, privately negotiated transactions, pur-
suant to derivative instruments or otherwise. During 2008, we
repurchased approximately 4.6 million shares of our common
stock for an aggregate purchase price of approximately $172.
Retirements of debt will depend on prevailing market conditions,
our liquidity requirements, contractual restrictions and other
factors, and the amounts involved may be material. We may also
elect to incur additional debt or issue equity or convertible secu-
rities to finance ongoing operations, acquisitions or to meet our
other liquidity needs.
Any issuances of equity securities or convertible securities could
have a dilutive effect on the ownership interest of our current
shareholders and may adversely impact earnings per share in
future periods.
Our liquidity could also be impacted by dividends, capital expen-
ditures and acquisitions. At any given time, we may be in the
process of discussing and negotiating an acquisition. An acquisi-
tion may be accretive or dilutive and by its nature, involve num-
erous risks and uncertainties. See our Cautionary Statement for
purposes of the “Safe Harbor” Statement under the Private
Securities Litigation Reform Act of 1995.
While recent turmoil in global financial markets has limited
access to capital for many companies, in 2008 we did not
experience any limitations in issuing commercial paper, reflecting
our investment-grade credit rating (Standard and Poor’s rating of
single A and Moody’s rating of A2). In addition, our commercial
paper program is fully supported by a revolving line of credit,
which is described below under “Capital Resources”. Manage-
ment is not aware of any issues currently impacting our lenders’
ability to honor their commitment to extend credit under the
revolving line of credit. It is unclear the extent to which this
credit crisis will persist and what overall impact it may have
on Avon.
A V O N 2008 33
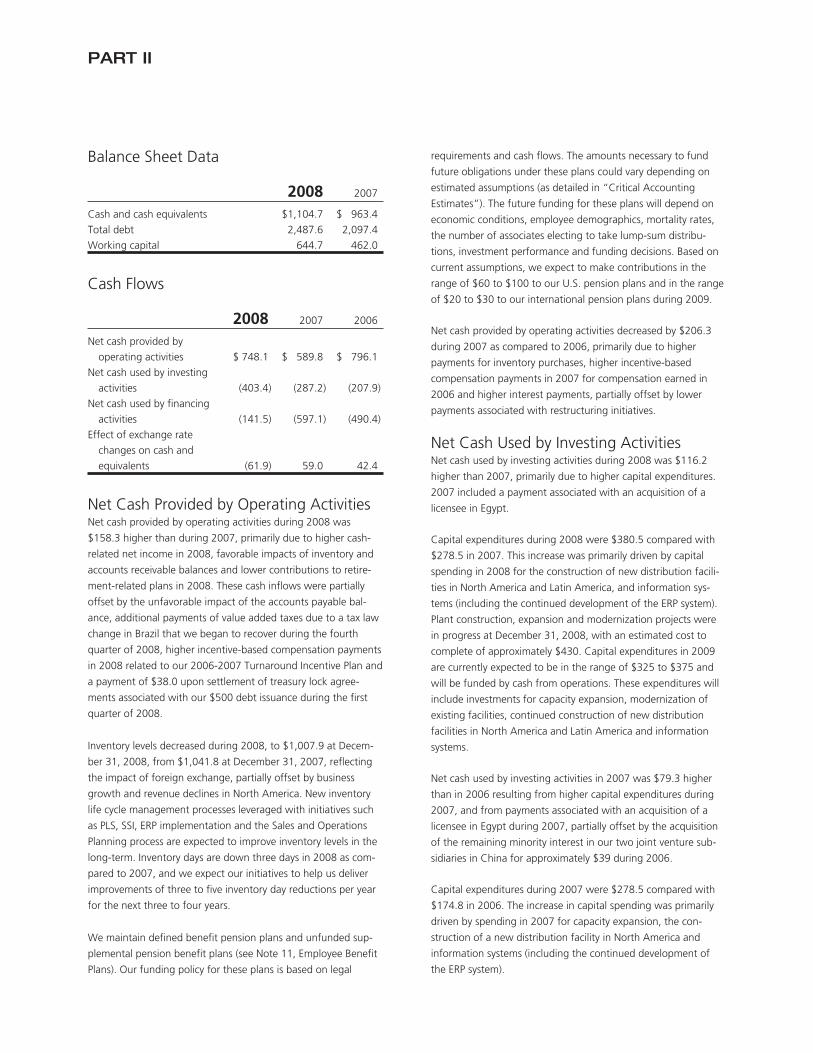
PART II
Balance Sheet Data
2008 2007
Cash and cash equivalents $1,104.7 $ 963.4
Total debt 2,487.6 2,097.4
Working capital 644.7 462.0
Cash Flows
2008 2007 2006
Net cash provided by
operating activities $ 748.1 $ 589.8 $ 796.1
Net cash used by investing
activities (403.4) (287.2) (207.9)
Net cash used by financing
activities (141.5) (597.1) (490.4)
Effect of exchange rate
changes on cash and
equivalents (61.9) 59.0 42.4
Net Cash Provided by Operating ActivitiesNet cash provided by operating activities during 2008 was
$158.3 higher than during 2007, primarily due to higher cash-
related net income in 2008, favorable impacts of inventory and
accounts receivable balances and lower contributions to retire-
ment-related plans in 2008. These cash inflows were partially
offset by the unfavorable impact of the accounts payable bal-
ance, additional payments of value added taxes due to a tax law
change in Brazil that we began to recover during the fourth
quarter of 2008, higher incentive-based compensation payments
in 2008 related to our 2006-2007 Turnaround Incentive Plan and
a payment of $38.0 upon settlement of treasury lock agree-
ments associated with our $500 debt issuance during the first
quarter of 2008.
Inventory levels decreased during 2008, to $1,007.9 at Decem-
ber 31, 2008, from $1,041.8 at December 31, 2007, reflecting
the impact of foreign exchange, partially offset by business
growth and revenue declines in North America. New inventory
life cycle management processes leveraged with initiatives such
as PLS, SSI, ERP implementation and the Sales and Operations
Planning process are expected to improve inventory levels in the
long-term. Inventory days are down three days in 2008 as com-
pared to 2007, and we expect our initiatives to help us deliver
improvements of three to five inventory day reductions per year
for the next three to four years.
We maintain defined benefit pension plans and unfunded sup-
plemental pension benefit plans (see Note 11, Employee Benefit
Plans). Our funding policy for these plans is based on legal
requirements and cash flows. The amounts necessary to fund
future obligations under these plans could vary depending on
estimated assumptions (as detailed in “Critical Accounting
Estimates”). The future funding for these plans will depend on
economic conditions, employee demographics, mortality rates,
the number of associates electing to take lump-sum distribu-
tions, investment performance and funding decisions. Based on
current assumptions, we expect to make contributions in the
range of $60 to $100 to our U.S. pension plans and in the range
of $20 to $30 to our international pension plans during 2009.
Net cash provided by operating activities decreased by $206.3
during 2007 as compared to 2006, primarily due to higher
payments for inventory purchases, higher incentive-based
compensation payments in 2007 for compensation earned in
2006 and higher interest payments, partially offset by lower
payments associated with restructuring initiatives.
Net Cash Used by Investing ActivitiesNet cash used by investing activities during 2008 was $116.2
higher than 2007, primarily due to higher capital expenditures.
2007 included a payment associated with an acquisition of a
licensee in Egypt.
Capital expenditures during 2008 were $380.5 compared with
$278.5 in 2007. This increase was primarily driven by capital
spending in 2008 for the construction of new distribution facili-
ties in North America and Latin America, and information sys-
tems (including the continued development of the ERP system).
Plant construction, expansion and modernization projects were
in progress at December 31, 2008, with an estimated cost to
complete of approximately $430. Capital expenditures in 2009
are currently expected to be in the range of $325 to $375 and
will be funded by cash from operations. These expenditures will
include investments for capacity expansion, modernization of
existing facilities, continued construction of new distribution
facilities in North America and Latin America and information
systems.
Net cash used by investing activities in 2007 was $79.3 higher
than in 2006 resulting from higher capital expenditures during
2007, and from payments associated with an acquisition of a
licensee in Egypt during 2007, partially offset by the acquisition
of the remaining minority interest in our two joint venture sub-
sidiaries in China for approximately $39 during 2006.
Capital expenditures during 2007 were $278.5 compared with
$174.8 in 2006. The increase in capital spending was primarily
driven by spending in 2007 for capacity expansion, the con-
struction of a new distribution facility in North America and
information systems (including the continued development of
the ERP system).
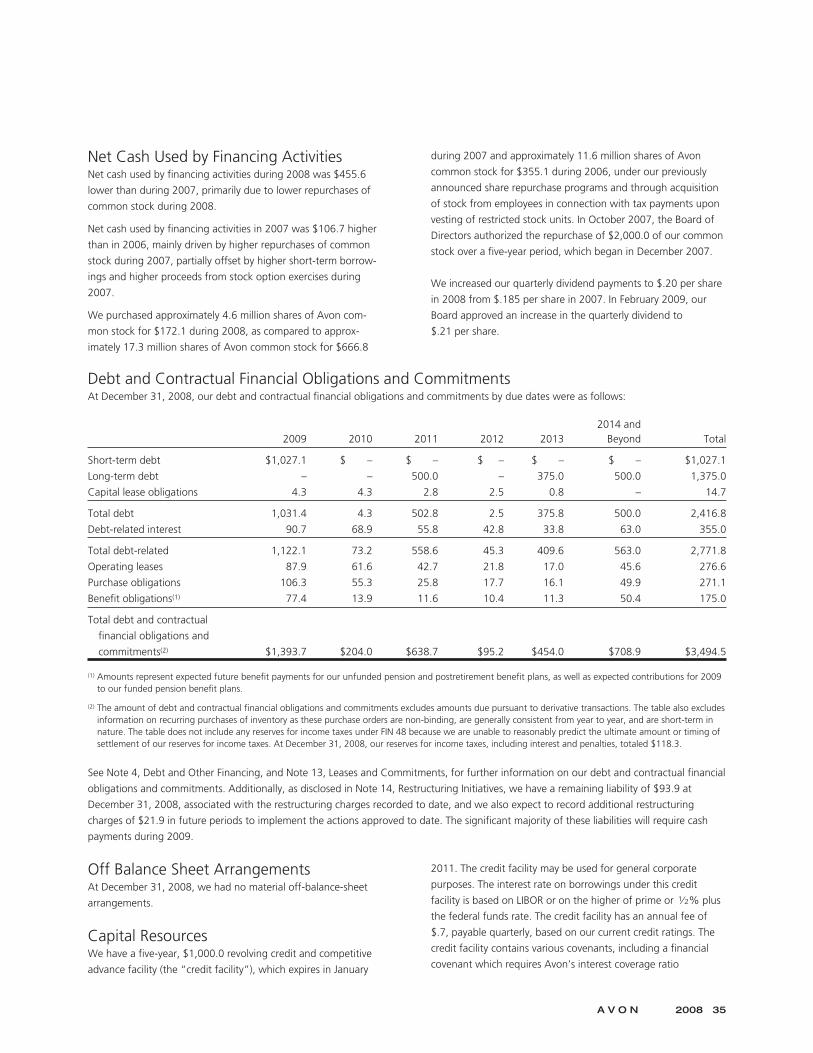
Net Cash Used by Financing ActivitiesNet cash used by financing activities during 2008 was $455.6
lower than during 2007, primarily due to lower repurchases of
common stock during 2008.
Net cash used by financing activities in 2007 was $106.7 higher
than in 2006, mainly driven by higher repurchases of common
stock during 2007, partially offset by higher short-term borrow-
ings and higher proceeds from stock option exercises during
2007.
We purchased approximately 4.6 million shares of Avon com-
mon stock for $172.1 during 2008, as compared to approx-
imately 17.3 million shares of Avon common stock for $666.8
during 2007 and approximately 11.6 million shares of Avon
common stock for $355.1 during 2006, under our previously
announced share repurchase programs and through acquisition
of stock from employees in connection with tax payments upon
vesting of restricted stock units. In October 2007, the Board of
Directors authorized the repurchase of $2,000.0 of our common
stock over a five-year period, which began in December 2007.
We increased our quarterly dividend payments to $.20 per share
in 2008 from $.185 per share in 2007. In February 2009, our
Board approved an increase in the quarterly dividend to
$.21 per share.
Debt and Contractual Financial Obligations and CommitmentsAt December 31, 2008, our debt and contractual financial obligations and commitments by due dates were as follows:
2009 2010 2011 2012 20132014 and
Beyond Total
Short-term debt $1,027.1 $ – $ – $ – $ – $ – $1,027.1
Long-term debt – – 500.0 – 375.0 500.0 1,375.0
Capital lease obligations 4.3 4.3 2.8 2.5 0.8 – 14.7
Total debt 1,031.4 4.3 502.8 2.5 375.8 500.0 2,416.8
Debt-related interest 90.7 68.9 55.8 42.8 33.8 63.0 355.0
Total debt-related 1,122.1 73.2 558.6 45.3 409.6 563.0 2,771.8
Operating leases 87.9 61.6 42.7 21.8 17.0 45.6 276.6
Purchase obligations 106.3 55.3 25.8 17.7 16.1 49.9 271.1
Benefit obligations(1) 77.4 13.9 11.6 10.4 11.3 50.4 175.0
Total debt and contractual
financial obligations and
commitments(2) $1,393.7 $204.0 $638.7 $95.2 $454.0 $708.9 $3,494.5
(1) Amounts represent expected future benefit payments for our unfunded pension and postretirement benefit plans, as well as expected contributions for 2009to our funded pension benefit plans.
(2) The amount of debt and contractual financial obligations and commitments excludes amounts due pursuant to derivative transactions. The table also excludesinformation on recurring purchases of inventory as these purchase orders are non-binding, are generally consistent from year to year, and are short-term innature. The table does not include any reserves for income taxes under FIN 48 because we are unable to reasonably predict the ultimate amount or timing ofsettlement of our reserves for income taxes. At December 31, 2008, our reserves for income taxes, including interest and penalties, totaled $118.3.
See Note 4, Debt and Other Financing, and Note 13, Leases and Commitments, for further information on our debt and contractual financial
obligations and commitments. Additionally, as disclosed in Note 14, Restructuring Initiatives, we have a remaining liability of $93.9 at
December 31, 2008, associated with the restructuring charges recorded to date, and we also expect to record additional restructuring
charges of $21.9 in future periods to implement the actions approved to date. The significant majority of these liabilities will require cash
payments during 2009.
Off Balance Sheet ArrangementsAt December 31, 2008, we had no material off-balance-sheet
arrangements.
Capital ResourcesWe have a five-year, $1,000.0 revolving credit and competitive
advance facility (the “credit facility”), which expires in January
2011. The credit facility may be used for general corporate
purposes. The interest rate on borrowings under this credit
facility is based on LIBOR or on the higher of prime or 1⁄2% plus
the federal funds rate. The credit facility has an annual fee of
$.7, payable quarterly, based on our current credit ratings. The
credit facility contains various covenants, including a financial
covenant which requires Avon’s interest coverage ratio
A V O N 2008 35
PART II
(determined in relation to our consolidated pretax income and
interest expense) to equal or exceed 4:1. The credit facility also
provides for possible increases by up to an aggregate incre-
mental principal amount of $250.0, subject to the consent of the
affected lenders under the credit facility. At December 31, 2008,
there were no amounts outstanding under the credit facility.
We have a $1,000.0 commercial paper program. Under this pro-
gram, we may issue from time to time unsecured promissory
notes in the commercial paper market in private placements
exempt from registration under federal and state securities laws,
for a cumulative face amount not to exceed $1,000.0 outstand-
ing at any one time and with maturities not exceeding 270 days
from the date of issue. The commercial paper short-term notes
issued under the program are not redeemable prior to maturity
and are not subject to voluntary prepayment. The commercial
paper program is supported by our credit facility. Outstanding
commercial paper effectively reduces the amount available for
borrowing under the credit facility. At December 31, 2008, we
had commercial paper outstanding of $499.7.
We have a Japanese yen 11 billion ($122.0 at the exchange rate
on December 31, 2008) uncommitted credit facility (“yen credit
facility”), which expires in August 2009. Borrowings under the
yen credit facility bear interest at the yen LIBOR rate plus an
applicable margin. The yen credit facility is available for general
corporate purposes, including working capital and the repay-
ment of outstanding indebtedness. At December 31, 2008,
$102.0 (Japanese yen 9.2 billion) was outstanding under the yen
credit facility.
In March 2008, we issued $500.0 principal amount of notes
payable in a public offering. $250.0 of the notes bear interest at
a per annum coupon rate equal to 4.8%, payable semi-annually,
and mature on March 1, 2013, unless redeemed prior to ma-
turity (the “2013 Notes”). $250.0 of the notes bear interest at a
per annum coupon rate of 5.75%, payable semi-annually, and
mature on March 1, 2018, unless redeemed prior to maturity
(the “2018 Notes”). The net proceeds from the offering of
$496.3 were used to repay outstanding indebtedness under our
commercial paper program and for general corporate purposes.
In August 2007, we entered into treasury lock agreements (the
“locks”) with notional amounts totaling $500.0 designated as
cash flow hedges of the anticipated interest payments on $250.0
principal amount of the 2013 Notes and $250.0 principal
amount of the 2018 Notes. The losses on the locks of $38.0
were recorded in accumulated other comprehensive loss. $19.2
and $18.8 of the losses are being amortized to interest expense
over five years and ten years, respectively.
At December 31, 2008, we were in compliance with all cove-
nants in our indentures (see Note 4, Debt and Other Financing).
Such indentures do not contain any rating downgrade triggers
that would accelerate the maturity of our debt. However, we
would be required to make an offer to repurchase the 2013
Notes and 2018 Notes at a price equal to 101% of their
aggregate principal amount plus accrued and unpaid interest in
the event of a change in control involving Avon and a
corresponding ratings downgrade to below investment grade.
ITEM 7A. QUANTITATIVE ANDQUALITATIVE DISCLOSURES ABOUTMARKET RISK
The overall objective of our financial risk management program
is to reduce the potential negative effects from changes in
foreign exchange and interest rates arising from our business
activities. We may reduce our exposure to fluctuations in cash
flows associated with changes in interest rates and foreign
exchange rates by creating offsetting positions through the use
of derivative financial instruments and through operational
means. Since we use foreign currency rate-sensitive and interest
rate-sensitive instruments to hedge a certain portion of our exist-
ing and forecasted transactions, we expect that any loss in value
for the hedge instruments generally would be offset by increases
in the value of the underlying transactions.
We do not enter into derivative financial instruments for trading
or speculative purposes, nor are we a party to leveraged
derivatives. The master agreements governing our derivative
contracts generally contain standard provisions that could trigger
early termination of the contracts in certain circumstances,
including if we were to merge with another entity and the
creditworthiness of the surviving entity were to be “materially
weaker” than that of Avon prior to the merger.
Interest Rate RiskOur long-term, fixed-rate borrowings are subject to interest rate
risk. We use interest rate swaps, which effectively convert the
fixed rate on the debt to a floating interest rate, to manage our
interest rate exposure. At December 31, 2008 and 2007, we
held interest rate swap agreements that effectively converted
approximately 50% and 30% of our outstanding long-term,
fixed-rate borrowings to a variable interest rate based on LIBOR,
respectively. Avon’s total exposure to floating interest rates at
December 31, 2008, and December 31, 2007, was approx-
imately 65% and 60%, respectively.
Our long-term borrowings and interest rate swaps were analyzed
at year-end to determine their sensitivity to interest rate changes.
Based on the outstanding balance of all these financial instru-
ments at December 31, 2008, a hypothetical 50-basis-point
change (either an increase or a decrease) in interest rates prevail-
ing at that date, sustained for one year, would not represent a
material potential change in fair value, earnings or cash flows.
This potential change was calculated based on discounted cash
flow analyses using interest rates comparable to our current cost
of debt.
Foreign Currency RiskWe operate globally, with operations in various locations around
the world. Over the past three years, approximately 75% to
80% of our consolidated revenue was derived from operations
of subsidiaries outside of the U.S. The functional currency for
most of our foreign operations is the local currency. We are
exposed to changes in financial market conditions in the normal
course of our operations, primarily due to international busi-
nesses and transactions denominated in foreign currencies and
the use of various financial instruments to fund ongoing activ-
ities. At December 31, 2008, the primary currencies for which
we had net underlying foreign currency exchange rate exposures
were the Argentine peso, Brazilian real, British pound, Canadian
dollar, Chinese renminbi, Colombian peso, the Euro, Japanese
yen, Mexican peso, Philippine peso, Polish zloty, Russian ruble,
Turkish lira, Ukrainian hryvna and Venezuelan bolivar.
We may reduce our exposure to fluctuations in cash flows asso-
ciated with changes in foreign exchange rates by creating
offsetting positions through the use of derivative financial
instruments.
Our hedges of our foreign currency exposure are not designed
to, and, therefore, cannot entirely eliminate the effect of
changes in foreign exchange rates on our consolidated financial
position, results of operations and cash flows.
Our foreign-currency financial instruments were analyzed at
year-end to determine their sensitivity to foreign exchange
rate changes. Based on our foreign exchange contracts at
December 31, 2008, the impact of a hypothetical 10% apprecia-
tion or 10% depreciation of the U.S. dollar against our foreign
exchange contracts would not represent a material potential
change in fair value, earnings or cash flows. This potential
change does not consider our underlying foreign currency ex-
posures. The hypothetical impact was calculated on the open
positions using forward rates at December 31, 2008, adjusted
for an assumed 10% appreciation or 10% depreciation of the
U.S. dollar against these hedging contracts.
Credit Risk of Financial InstrumentsWe attempt to minimize our credit exposure to counterparties by
entering into derivative transactions and similar agreements only
with major international financial institutions with “A” or higher
credit ratings as issued by Standard & Poor’s Corporation. Our
foreign currency and interest rate derivatives are comprised of
over-the-counter forward contracts, swaps or options with major
international financial institutions. Although our theoretical
credit risk is the replacement cost at the then estimated fair
value of these instruments, we believe that the risk of incurring
credit risk losses is remote and that such losses, if any, would not
be material.
Non-performance of the counterparties on the balance of all the
foreign exchange and interest rate agreements would result in a
write-off of $111.8 at December 31, 2008. In addition, in the
event of non-performance by such counterparties, we would be
exposed to market risk on the underlying items being hedged as
a result of changes in foreign exchange and interest rates.
ITEM 8. FINANCIAL STATEMENTS ANDSUPPLEMENTARY DATA
Reference is made to the Index on page F-1 of our Consolidated
Financial Statements and Notes thereto contained herein.
ITEM 9. CHANGES IN ANDDISAGREEMENTS WITHACCOUNTANTS ON ACCOUNTINGAND FINANCIAL DISCLOSURE
Not applicable.
ITEM 9A. CONTROLS ANDPROCEDURES
Evaluation of Disclosure Controls andProceduresAs of the end of the period covered by this report, our principal
executive and principal financial officers carried out an evalua-
tion of the effectiveness of the design and operation of our dis-
closure controls and procedures pursuant to Rule 13a-15 of the
Securities Exchange Act of 1934 (the “Exchange Act”). In
designing and evaluating our disclosure controls and procedures,
management recognizes that any controls and procedures, no
matter how well designed and operated, can provide only
reasonable assurance of achieving the desired control objectives,
and management was required to apply its judgment in evaluat-
ing and implementing possible controls and procedures. Based
upon their evaluation, the principal executive and principal
financial officers concluded that our disclosure controls and
procedures were effective as of December 31, 2008, at the rea-
sonable assurance level. Disclosure controls and procedures are
designed to ensure that information relating to Avon (including
our consolidated subsidiaries) required to be disclosed by us in
the reports we file under the Exchange Act is recorded, proc-
essed, summarized and reported within the time periods speci-
fied in the Securities and Exchange Commission’s rules and
forms and to ensure that information required to be disclosed is
A V O N 2008 37
PART II
accumulated and communicated to management to allow timely
decisions regarding disclosure.
Management’s Report on Internal Controlover Financial ReportingAvon’s management is responsible for establishing and maintain-
ing adequate internal control over financial reporting, as such
term is defined in Rule 13a-15(f) under the Exchange Act.
Internal control over financial reporting is defined as a process
designed by, or under the supervision of, Avon’s principal execu-
tive and principal financial officers and effected by Avon’s board
of directors, management and other personnel, to provide
reasonable assurance regarding the reliability of financial report-
ing and the preparation of financial statements for external
purposes in accordance with generally accepted accounting
principles, and includes those policies and procedures that:
• pertain to the maintenance of records that, in reasonable
detail accurately and fairly reflect the transactions and
dispositions of the assets of Avon;
• provide reasonable assurance that transactions are recorded as
necessary to permit preparation of financial statements in
accordance with generally accepted accounting principles, and
that receipts and expenditures of Avon are being made only in
accordance with authorizations of management and directors
of Avon; and
• provide reasonable assurance regarding prevention or timely
detection of unauthorized acquisition, use or disposition of
Avon’s assets that could have a material effect on the financial
statements.
Internal control over financial reporting cannot provide absolute
assurance of achieving financial reporting objectives because of
its inherent limitations. Internal control over financial reporting is
a process that involves human diligence and compliance and is
subject to lapses in judgment and breakdowns resulting from
human failures. Internal control over financial reporting also can
be circumvented by collusion or improper override. Because of
such limitations, there is a risk that material misstatements may
not be prevented or detected on a timely basis by internal
control over financial reporting. However, these inherent limi-
tations are known features of the financial reporting process,
and it is possible to design into the process safeguards to reduce,
though not eliminate, this risk.
Under the supervision and with the participation of our manage-
ment, including its principal executive and principal financial
officers, we assessed as of December 31, 2008, the effectiveness
of our internal control over financial reporting. This assessment
was based on criteria established in the framework in Internal
Control-Integrated Framework issued by the Committee of
Sponsoring Organizations of the Treadway Commission. Based
on our assessment using those criteria, our management con-
cluded that our internal control over financial reporting as of
December 31, 2008, was effective.
PricewaterhouseCoopers LLP, the independent registered public
accounting firm that audited the financial statements included in
this 2008 Annual Report on Form 10-K, has audited the effec-
tiveness of Avon’s internal control over financial reporting as of
December 31, 2008. Their report is included on page F-2 of this
2008 Annual Report on Form 10-K.
Changes in Internal Control over FinancialReportingManagement has evaluated, with the participation of our
principal executive and principal financial officers, whether any
changes in our internal control over financial reporting that
occurred during our last fiscal quarter (the registrant’s fourth
fiscal quarter in the case of an annual report) have materially
affected, or are reasonably likely to materially affect, our internal
control over financial reporting. Based on the evaluation we
conducted, management has concluded that no such changes
have occurred.
We are implementing an enterprise resource planning (“ERP”)
system on a worldwide basis, which is expected to improve the
efficiency of our supply chain and financial transaction processes.
The implementation is expected to occur in phases over the next
several years. The implementation of a worldwide ERP system
will likely affect the processes that constitute our internal control
over financial reporting and will require testing for effectiveness.
We completed implementation in certain significant markets and
will continue to roll-out the ERP system over the next several
years. As with any new information technology application we
implement, this application, along with the internal controls over
financial reporting included in this process, were appropriately
tested for effectiveness prior to the implementation in these
countries. We concluded, as part of our evaluation described in
the above paragraph, that the implementation of ERP in these
countries has not materially affected our internal control over
financial reporting.
ITEM 9B. OTHER INFORMATION
Not applicable.
PART III
ITEM 10. DIRECTORS, EXECUTIVEOFFICERS AND CORPORATEGOVERNANCE
DirectorsInformation regarding directors is incorporated by reference to
the “Proposal 1 – Election of Directors” and “Information
Concerning the Board of Directors” sections of Avon’s Proxy
Statement for the 2009 Annual Meeting of Shareholders.
Executive OfficersInformation regarding executive officers is incorporated by refer-
ence to the “Executive Officers” section of Avon’s Proxy
Statement for the 2009 Annual Meeting of Shareholders.
Section 16(a) Beneficial OwnershipReporting ComplianceThis information is incorporated by reference to the “Section
16(a) Beneficial Ownership Reporting Compliance” section of
Avon’s Proxy Statement for the 2009 Annual Meeting of
Shareholders.
Code of Business Conduct and EthicsAvon’s Board of Directors has adopted a Code of Business
Conduct and Ethics, amended in February 2008, that applies to
all members of the Board of Directors and to all of the Compa-
ny’s employees, including its principal executive officer, principal
financial officer and principal accounting officer or controller.
Avon’s Code of Business Conduct and Ethics is available, free of
charge, on Avon’s investor website, www.avoninvestor.com.
Avon’s Code of Business Conduct and Ethics is also available,
without charge, from Investor Relations, Avon Products, Inc.,
1345 Avenue of the Americas, New York, NY 10105-0196 or by
sending an email to [email protected] or by calling
(212) 282-5623. Any amendment to, or waiver from, the provi-
sions of this Code of Business Conduct and Ethics that applies to
any of those officers will be posted to the same location on
Avon’s website.
Audit Committee; Audit CommitteeFinancial ExpertThis information is incorporated by reference to the “Information
Concerning the Board of Directors” section of Avon’s Proxy
Statement for the 2009 Annual Meeting of Shareholders.
Material Changes in NominatingProceduresThis information is incorporated by reference to the “Information
Concerning the Board of Directors” section of Avon’s Proxy
Statement for the 2009 Annual Meeting of Shareholders.
ITEM 11. EXECUTIVE COMPENSATION
This information is incorporated by reference to the “Information
Concerning the Board of Directors,” “Executive Compensation”
and “Director Compensation” sections of Avon’s Proxy State-
ment for the 2009 Annual Meeting of Shareholders.
ITEM 12. SECURITY OWNERSHIP OFCERTAIN BENEFICIAL OWNERS ANDMANAGEMENT AND RELATEDSTOCKHOLDER MATTERS
This information is incorporated by reference to the “Equity
Compensation Plan Information” and “Ownership of Shares”
sections of Avon’s Proxy Statement for the 2009 Annual Meeting
of Shareholders.
ITEM 13. CERTAIN RELATIONSHIPSAND RELATED TRANSACTIONS, ANDDIRECTOR INDEPENDENCE
This information is incorporated by reference to the “Information
Concerning the Board of Directors” and “Transactions with
Related Persons” sections of Avon’s Proxy Statement for the
2009 Annual Meeting of Shareholders.
ITEM 14. PRINCIPAL ACCOUNTANTFEES AND SERVICES
This information is incorporated by reference to the “Proposal 2
– Ratification of Appointment of Independent Registered Public
Accounting Firm” section of Avon’s Proxy Statement for the
2009 Annual Meeting of Shareholders.
A V O N 2008 39
PART IV
ITEM 15. EXHIBITS AND FINANCIAL STATEMENT SCHEDULE
(a) 1. Consolidated Financial Statements and Report of Independent Registered PublicAccounting FirmSee Index on page F-1.
(a) 2. Financial Statement ScheduleSee Index on page F-1.
All other schedules are omitted because they are not applicable or because the required information is shown in the consolidated financial
statements and notes.
(a) 3. Index to Exhibits
Exhibit
Number Description
3.1 Restated Certificate of Incorporation, filed with the Secretary of State of the State of New York on May 3, 2007 (incorporated
by reference to Exhibit 3.1 to Avon’s Quarterly Report on Form 10-Q for the quarter ended June 30, 2007).
3.2 By-laws of Avon, as amended, effective May 3, 2007 (incorporated by reference to Exhibit 3.1 to Avon’s Quarterly Report on
Form 10-Q for the quarter ended June 30, 2007).
4.1 Indenture, dated as of November 9, 1999, between Avon, as Issuer, and The Chase Manhattan Bank, as Trustee, relating to
the 6.90% Notes due 2004, and the 7.15% Notes due 2009 (incorporated by reference to Exhibit 4.2 to Avon’s Registration
Statement on Form S-4, Registration Statement No. 333-92333 filed December 8, 1999).
4.2 First Supplemental Indenture, dated as of January 5, 2000, between Avon, as Issuer and The Chase Manhattan Bank, as Trust-
ee, pursuant to which the 6.90% Notes due 2004, and the 7.15% Notes due 2009 are issued (incorporated by reference to
Exhibit 4.3 to Avon’s Registration Statement on Form S-4/A, Registration Statement No. 333-92333 filed January 6, 2000).
4.3 Indenture, dated as of May 13, 2003, between Avon, as Issuer, and JPMorgan Chase Bank, as Trustee, relating to Avon’s
$125.0 aggregate principal amount of 4.625% Notes due 2013, $250.0 aggregate principal amount of 4.20% Notes due
2018 and $500.0 aggregate principal amount of Avon’s 5.125% Notes due 2011 (incorporated by reference to Exhibit 4.1 to
Avon’s Quarterly Report on Form 10-Q for the quarter ended June 30, 2003).
4.4 First Supplemental Indenture, dated as of March 3, 2008, between Avon Products, Inc. and Deutsche Bank Trust Company
Americas, as Trustee, pursuant to which the 4.800% Notes due 2013 are issued (incorporated by reference to Exhibit 4.1 to
Avon’s Current Report on Form 8-K filed on March 4, 2008).
4.5 Second Supplemental Indenture, dated as of March 3, 2008, between Avon Products, Inc. and Deutsche Bank Trust Company
Americas, as Trustee, pursuant to which the 5.750% Notes due 2018 are issued (incorporated by reference to Exhibit 4.2 to
Avon’s Current Report on Form 8-K filed on March 4, 2008).
4.6 Indenture, dated as of February 27, 2008, between Avon Products, Inc. and Deutsche Bank Trust Company Americas, as
Trustee (incorporated by reference to Exhibit 4.5 to Avon’s Current Report on Form 8-K filed on March 4, 2008).
10.1* Avon Products, Inc. 1993 Stock Incentive Plan, approved by stockholders on May 6, 1993 (incorporated by reference to Exhibit
10.2 to Avon’s Quarterly Report on Form 10-Q for the quarter ended June 30, 1993).
10.2* Form of Stock Option Agreement to the Avon Products, Inc. 1993 Stock Incentive Plan (incorporated by reference to Exhibit
10.2 to Avon’s Annual Report on Form 10-K for the year ended December 31, 1993).
10.3* First Amendment of the Avon Products, Inc. 1993 Stock Incentive Plan, effective January 1, 1997, approved by stockholders on
May 1, 1997 (incorporated by reference to Exhibit 10.1 to Avon’s Quarterly Report on Form 10-Q for the quarter ended
September 30, 1997).
Exhibit
Number Description
10.4* Avon Products, Inc. Year 2000 Stock Incentive Plan (incorporated by reference to Appendix A to the Company’s Proxy State-
ment as filed with the Commission on March 27, 2000 in connection with Avon’s 2000 Annual Meeting of Shareholders).
10.5* Amendment of the Avon Products, Inc. Year 2000 Stock Incentive Plan, effective January 1, 2002 (incorporated by reference
to Exhibit 10.17 to Avon’s Annual Report on Form 10-K for the year ended December 31, 2002).
10.6* Second Amendment to the Avon Products, Inc. Year 2000 Stock Incentive Plan, effective January 1, 2009.
10.7* Form of U.S. Stock Option Agreement under the Avon Products, Inc. Year 2000 Stock Incentive Plan (incorporated by refer-
ence to Exhibit 10.1 to Avon’s Quarterly Report on Form 10-Q for the quarter ended September 30, 2004).
10.8* Form of U.S. Restricted Stock Unit Award Agreement under the Avon Products, Inc. Year 2000 Stock Incentive Plan
(incorporated by reference to Exhibit 10.39 to Avon’s Annual Report on Form 10-K for the year ended December 31, 2005).
10.9* Form of Revised U.S. Stock Option Agreement under the Avon Products, Inc. Year 2000 Stock Incentive Plan (incorporated by
reference to Exhibit 99.1 to Avon’s Current Report on Form 8-K filed on March 8, 2005).
10.10* Form of Revised U.S. Restricted Stock Unit Award Agreement under the Avon Products, Inc. Year 2000 Stock Incentive Plan
(incorporated by reference to Exhibit 99.2 to Avon’s Current Report on Form 8-K filed on March 8, 2005).
10.11* Avon Products, Inc. 2005 Stock Incentive Plan approved by stockholders on May 5, 2005 (incorporated by reference to Appen-
dix G to Avon’s Definitive Proxy Statement filed on May 5, 2005 in connection with Avon’s 2005 Annual Meeting of
Shareholders).
10.12* First Amendment of the Avon Products, Inc. 2005 Stock Incentive Plan, effective January 1, 2006 (incorporated by reference to
Exhibit 10.12 to Avon’s Annual Report on Form 10-K for the year ended December 31, 2006).
10.13* Second Amendment of the Avon Products, Inc. 2005 Stock Incentive Plan, effective January 1, 2007 (incorporated by refer-
ence to Exhibit 10.13 to Avon’s Annual Report on Form 10-K for the year ended December 31, 2006).
10.14* Third Amendment to the Avon Products, Inc. 2005 Stock Incentive Plan, dated October 2, 2008.
10.15* Form of U.S. Stock Option Agreement under the Avon Products, Inc. Year 2005 Stock Incentive Plan (incorporated by refer-
ence to Exhibit 99.1 to Avon’s Current Report on Form 8-K filed on September 6, 2005).
10.16* Form of U.S. Restricted Stock Unit Award Agreement under the Avon Products, Inc. Year 2005 Stock Incentive Plan
(incorporated by reference to Exhibit 99.2 to Avon’s Current Report on Form 8-K filed on September 6, 2005).
10.17* Form of Performance Contingent Restricted Stock Unit Award Agreement for Senior Officers under the Avon Products, Inc.
2005 Stock Incentive Plan (incorporated by reference to Exhibit 10 to Avon’s Current Report on Form 8-K filed on March 13,
2007).
10.18* Form of Restricted Stock Unit Award Agreement under the Avon Products, Inc. 2005 Stock Incentive Plan (incorporated by
reference to Exhibit 10.1 to Avon’s Current Report on Form 8-K filed on February 7, 2008).
10.19* Form of Retention Restricted Stock Unit Award Agreement under the Avon Products, Inc. 2005 Stock Incentive Plan
(incorporated by reference to Exhibit 10.2 to Avon’s Current Report on Form 8-K filed on February 7, 2008).
10.20* Supplemental Executive Retirement Plan of Avon Products, Inc., as amended and restated as of January 1, 2009.
10.21* Avon Products, Inc. Deferred Compensation Plan, as amended and restated as of January 1, 2008 (incorporated by reference
to Exhibit 10.20 to Avon’s Annual Report on Form 10-K for the year ended December 31, 2007).
10.22* Avon Products, Inc. Compensation Plan for Non-Employee Directors, as amended and restated as of January 1, 2008
(incorporated by reference to Exhibit 10.21 to Avon’s Annual Report on Form 10-K for the year ended December 31, 2007).
10.23* Board of Directors of Avon Products, Inc. Deferred Compensation Plan, as amended and restated as of January 1, 2008
(incorporated by reference to Exhibit 10.22 to Avon’s Annual Report on Form 10-K for the year ended December 31, 2007).
A V O N 2008 41
PART IV
Exhibit
Number Description
10.24* Avon Products, Inc. Executive Incentive Plan, approved by shareholders on May 1, 2003 (incorporated by reference to Appen-
dix E to Avon’s Proxy Statement as filed with the Commission on March 27, 2003 in connection with Avon’s 2003 Annual
Meeting of Shareholders).
10.25* Avon Products, Inc. 2008-2012 Executive Incentive Plan (incorporated by reference to Exhibit 10.1 to Avon’s Current Report
on Form 8-K filed on March 11, 2008).
10.26* Benefit Restoration Pension Plan of Avon Products, Inc., as amended and restated as of January 1, 2009.
10.27* Trust Agreement, dated as of October 29, 1998, between Avon and The Chase Manhattan Bank, N.A., as Trustee, relating to
the grantor trust (incorporated by reference to Exhibit 10.12 to Avon’s Annual Report on Form 10-K for the year ended
December 31, 2004).
10.28* Amendment to Trust Agreement, effective as of January 1, 2009.
10.29* Avon Products, Inc. 2006-2007 Turnaround Incentive Plan, effective as of January 1, 2006 (incorporated by reference to
Exhibit 10.1 to Avon’s Current Report on Form 8-K filed on March 31, 2006.)
10.30* Amended and Restated Employment Agreement with Andrea Jung, dated December 5, 2008 (incorporated by reference to
Exhibit 10.1 to Avon’s Current Report on Form 8-K filed on December 8, 2008).
10.31* Offer letter from Avon Products, Inc. to Elizabeth A. Smith, dated November 1, 2004 (incorporated by reference to Exhibit
10.1 to Avon’s Current Report on Form 8-K filed on January 6, 2005).
10.32* Amendment to Employment Letter Agreement, effective as of November 12, 2008 between Avon and Elizabeth A. Smith.
10.33* Employment Letter Agreement, dated as of November 13, 2005, between Avon and Charles W. Cramb (incorporated by refer-
ence to Exhibit 10.1 to Avon’s Current Report on Form 8-K/A filed on November 16, 2005).
10.34* Amendment to Employment Letter Agreement, effective as of December 3, 2008 between Avon and Charles W. Cramb.
10.35* Form of Performance Contingent Restricted Stock Unit Award Agreement under the Avon Products, Inc. 2005 Stock Incentive
Plan for the Chief Executive Officer (incorporated by reference to Exhibit 10.2 to Avon’s Current Report on Form 8-K filed on
March 31, 2006).
10.36* Restricted Stock Unit Award Agreement, dated as of July 26, 2006, by and between Avon Products, Inc. and Elizabeth Smith,
Executive Vice President, President North America and Global Marketing, under the Avon Products, Inc. 2005 Stock Incentive
Plan (incorporated by reference to Exhibit 10.1 to Avon’s Current Report on Form 8-K filed on August 1, 2006).
10.37* Employment Letter Agreement, dated as of November 18, 2005, between Avon and Charles Herington.
10.38* Amendment to Employment Letter Agreement, effective as of November 24, 2008 between Avon and Charles Herington.
10.39* Expatriate Assignment Agreement, dated as of April 6, 2006, by and between Avon Products, Inc. and Ben Gallina.
10.40* Amendment to Expatriate Assignment Agreement, effective as of December 1, 2008 between Avon and Ben Gallina.
10.41 Credit Agreement, dated as of August 23, 2005, among Avon Products, Inc., Avon Capital Corporation and Bank of America,
N.A (incorporated by reference to Exhibit 10.1 to Avon’s Current Report on Form 8-K filed on August 26, 2005).
10.42 Credit Agreement, dated as of August 23, 2005, among Avon Products, Inc., Avon Capital Corporation and Citibank, N.A.
(incorporated by reference to Exhibit 10.2 to Avon’s Current Report on Form 8-K filed on August 26, 2005).
10.43 Guarantee of Avon Products, Inc. dated as of August 31, 2005 (incorporated by reference to Exhibit 10.1 to Avon’s Current
Report on Form 8-K filed on September 6, 2005).
10.44 Revolving Credit and Competitive Advance Facility Agreement, dated as of January 13, 2006, among Avon Products, Inc.,
Avon Capital Corporation, Citibank, N.A., as Administrative Agent, Citigroup Global Markets Inc., Banc of America Securities
LLC and J.P. Morgan Securities Inc., as Joint Lead Arrangers and Joint Bookrunners, and the other lenders party thereto
(incorporated by reference to Exhibit 10.1 to Avon’s Current Report on Form 8-K filed on January 13, 2006).
Exhibit
Number Description
10.45 Loan Agreement, dated as of August 28, 2006, by and between Avon Products, Inc. and The Bank of Tokyo-Mitsubishi UFJ,
Ltd. (incorporated by reference to Exhibit 10.1 to Avon’s Current Report on Form 8-K filed on August 31, 2006).
10.46 Amendment No. 1 to Loan Agreement, dated as of August 6, 2007, by and between Avon Products, Inc. and the Bank of
Tokyo-Mitsubishi UFJ, Ltd. (incorporated by reference to Exhibit 10.1 to Avon’s Current Report on Form 8-K filed on August 7,
2007).
10.47 Amendment No. 2 to Loan Agreement, dated August 21, 2008, by and between Avon Products, Inc. and The Bank of Tokyo-
Mitsubishi UFJ, Ltd. (incorporated by reference to Exhibit 10.1 to Avon’s Current Report on Form 8-K filed on August 26,
2008).
10.48* Supplemental Life Plan of Avon Products, Inc., amended and restated as of January 1, 2009.
10.49* Pre-1990 Supplemental Life Plan of Avon Products, Inc., amended and restated as of January 1, 2009.
10.50* Avon Products, Inc. Management Incentive Plan, effective as of January 1, 2009.
21 Subsidiaries of the registrant.
23 Consent of PricewaterhouseCoopers LLP.
24 Power of Attorney.
31.1 Certification of Chief Executive Officer pursuant to Section 302 of the Sarbanes-Oxley Act of 2002.
31.2 Certification of Vice Chairman, Chief Finance and Strategy Officer pursuant to Section 302 of the Sarbanes-Oxley Act of 2002.
32.1 Certification of Chief Executive Officer Pursuant to 18 U.S.C. Section 1350, As Adopted Pursuant to Section 906 of the
Sarbanes-Oxley Act of 2002.
32.2 Certification of Vice Chairman, Chief Finance and Strategy Officer Pursuant to 18 U.S.C. Section 1350, As Adopted Pursuant
to Section 906 of the Sarbanes-Oxley Act of 2002.
* The Exhibits identified above with an asterisk (*) are management contracts or compensatory plans or arrangements.
Avon’s Annual Report on Form 10-K for the year ended December 31, 2008, at the time of filing with the Securities and Exchange Commis-
sion, shall modify and supersede all prior documents filed pursuant to Section 13, 14 or 15(d) of the Securities Exchange Act of 1934 for
purposes of any offers or sales of any securities after the date of such filing pursuant to any Registration Statement or Prospectus filed pur-
suant to the Securities Act of 1933, which incorporates by reference such Annual Report on Form 10-K.
A V O N 2008 43
SIGNATURES
Pursuant to the requirements of Section 13 or 15(d) of the Securities Exchange Act of 1934, the registrant has duly caused this report to be
signed on its behalf by the undersigned, thereunto duly authorized, on the 20th day of February 2009.
Avon Products, Inc.
/s/ Simon N. R. Harford
Simon N. R. Harford
Group Vice President and
Corporate Controller — Principal Accounting Officer
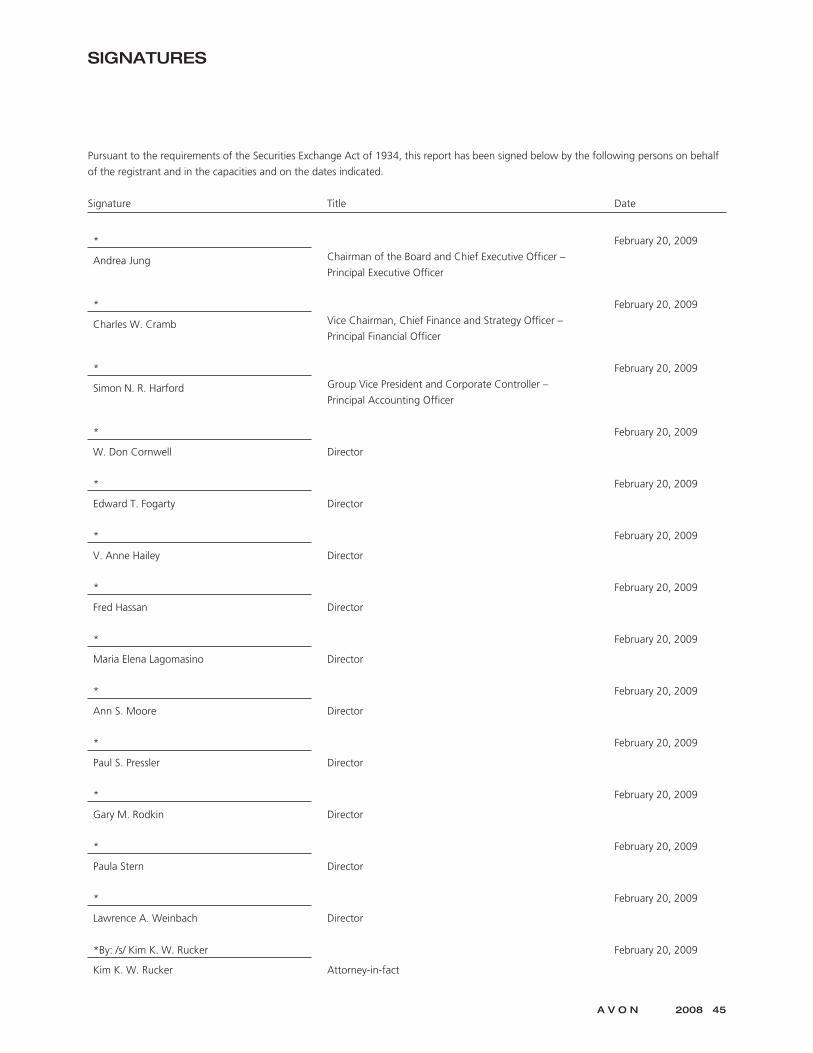
SIGNATURES
Pursuant to the requirements of the Securities Exchange Act of 1934, this report has been signed below by the following persons on behalf
of the registrant and in the capacities and on the dates indicated.
Signature Title Date
*
Andrea Jung Chairman of the Board and Chief Executive Officer –
Principal Executive Officer
February 20, 2009
*
Charles W. Cramb Vice Chairman, Chief Finance and Strategy Officer –
Principal Financial Officer
February 20, 2009
*
Simon N. R. Harford Group Vice President and Corporate Controller –
Principal Accounting Officer
February 20, 2009
*
W. Don Cornwell Director
February 20, 2009
*
Edward T. Fogarty Director
February 20, 2009
*
V. Anne Hailey Director
February 20, 2009
*
Fred Hassan Director
February 20, 2009
*
Maria Elena Lagomasino Director
February 20, 2009
*
Ann S. Moore Director
February 20, 2009
*
Paul S. Pressler Director
February 20, 2009
*
Gary M. Rodkin Director
February 20, 2009
*
Paula Stern Director
February 20, 2009
*
Lawrence A. Weinbach Director
February 20, 2009
*By: /s/ Kim K. W. Rucker
Kim K. W. Rucker Attorney-in-fact
February 20, 2009
A V O N 2008 45

[THIS PAGE INTENTIONALLY LEFT BLANK]
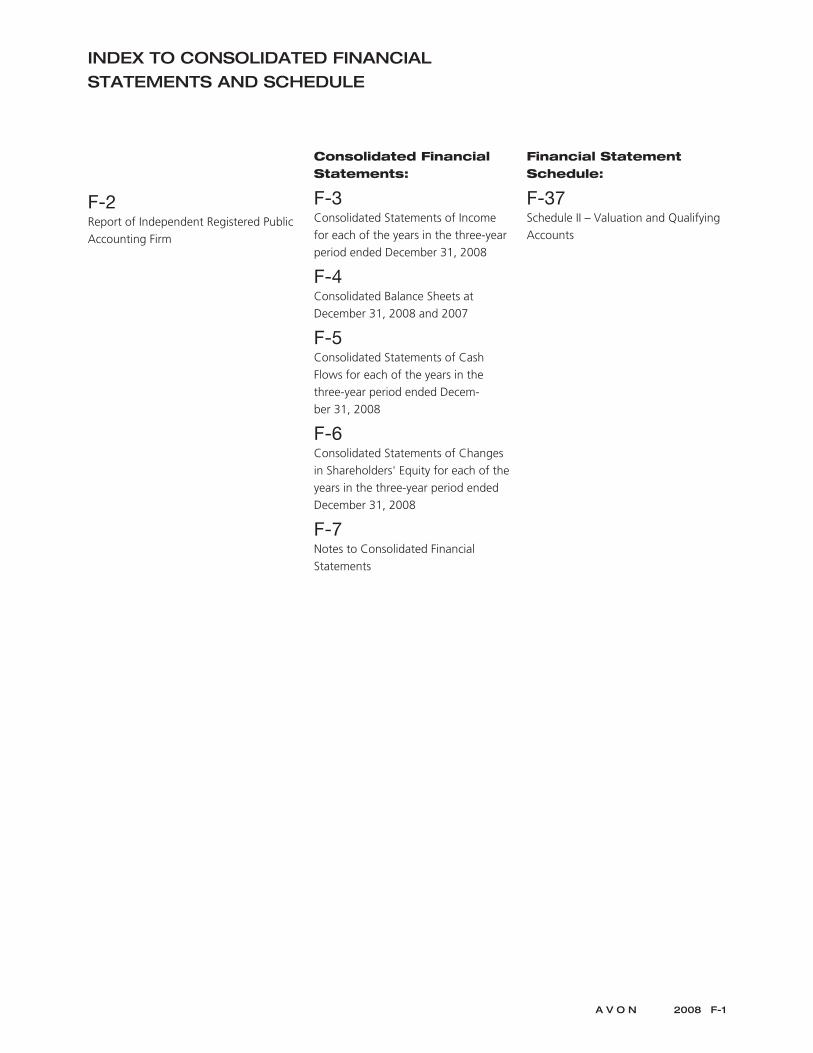
INDEX TO CONSOLIDATED FINANCIAL
STATEMENTS AND SCHEDULE
F-2Report of Independent Registered PublicAccounting Firm
Consolidated FinancialStatements:
F-3Consolidated Statements of Incomefor each of the years in the three-yearperiod ended December 31, 2008
F-4Consolidated Balance Sheets atDecember 31, 2008 and 2007
F-5Consolidated Statements of CashFlows for each of the years in thethree-year period ended Decem-ber 31, 2008
F-6Consolidated Statements of Changesin Shareholders' Equity for each of theyears in the three-year period endedDecember 31, 2008
F-7Notes to Consolidated FinancialStatements
Financial StatementSchedule:
F-37Schedule II – Valuation and QualifyingAccounts
A V O N 2008 F-1
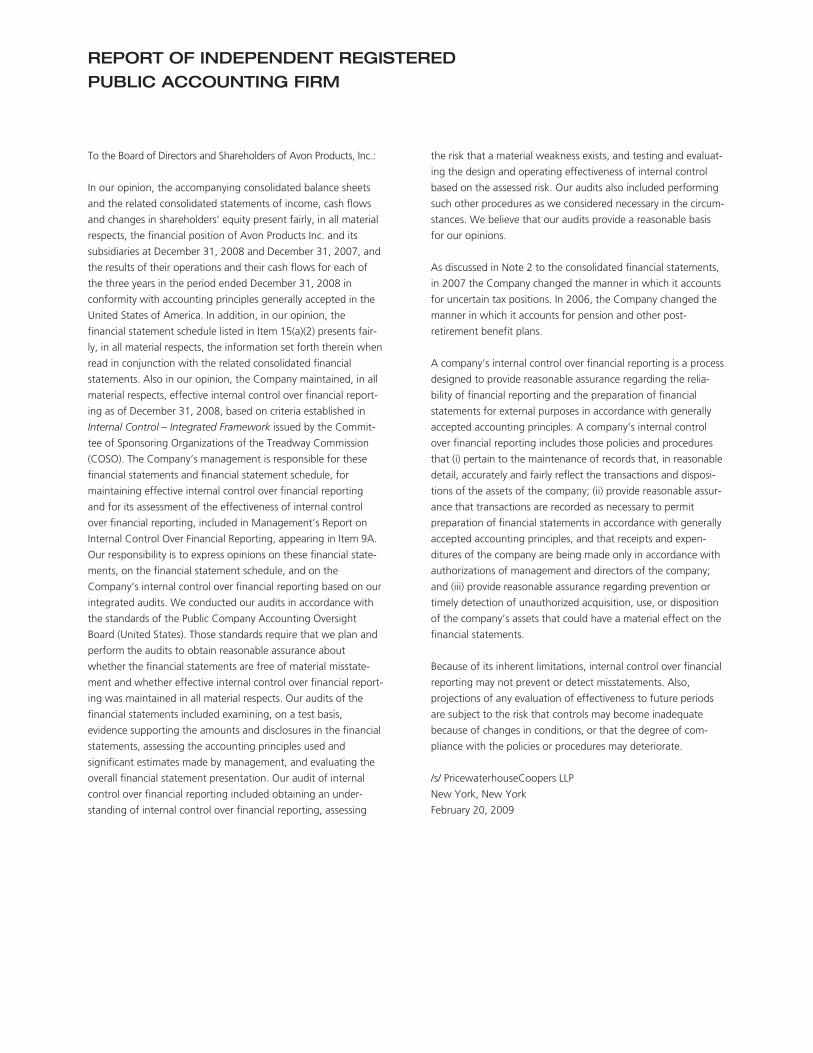
REPORT OF INDEPENDENT REGISTERED
PUBLIC ACCOUNTING FIRM
To the Board of Directors and Shareholders of Avon Products, Inc.:
In our opinion, the accompanying consolidated balance sheets
and the related consolidated statements of income, cash flows
and changes in shareholders’ equity present fairly, in all material
respects, the financial position of Avon Products Inc. and its
subsidiaries at December 31, 2008 and December 31, 2007, and
the results of their operations and their cash flows for each of
the three years in the period ended December 31, 2008 in
conformity with accounting principles generally accepted in the
United States of America. In addition, in our opinion, the
financial statement schedule listed in Item 15(a)(2) presents fair-
ly, in all material respects, the information set forth therein when
read in conjunction with the related consolidated financial
statements. Also in our opinion, the Company maintained, in all
material respects, effective internal control over financial report-
ing as of December 31, 2008, based on criteria established in
Internal Control – Integrated Framework issued by the Commit-
tee of Sponsoring Organizations of the Treadway Commission
(COSO). The Company’s management is responsible for these
financial statements and financial statement schedule, for
maintaining effective internal control over financial reporting
and for its assessment of the effectiveness of internal control
over financial reporting, included in Management’s Report on
Internal Control Over Financial Reporting, appearing in Item 9A.
Our responsibility is to express opinions on these financial state-
ments, on the financial statement schedule, and on the
Company’s internal control over financial reporting based on our
integrated audits. We conducted our audits in accordance with
the standards of the Public Company Accounting Oversight
Board (United States). Those standards require that we plan and
perform the audits to obtain reasonable assurance about
whether the financial statements are free of material misstate-
ment and whether effective internal control over financial report-
ing was maintained in all material respects. Our audits of the
financial statements included examining, on a test basis,
evidence supporting the amounts and disclosures in the financial
statements, assessing the accounting principles used and
significant estimates made by management, and evaluating the
overall financial statement presentation. Our audit of internal
control over financial reporting included obtaining an under-
standing of internal control over financial reporting, assessing
the risk that a material weakness exists, and testing and evaluat-
ing the design and operating effectiveness of internal control
based on the assessed risk. Our audits also included performing
such other procedures as we considered necessary in the circum-
stances. We believe that our audits provide a reasonable basis
for our opinions.
As discussed in Note 2 to the consolidated financial statements,
in 2007 the Company changed the manner in which it accounts
for uncertain tax positions. In 2006, the Company changed the
manner in which it accounts for pension and other post-
retirement benefit plans.
A company’s internal control over financial reporting is a process
designed to provide reasonable assurance regarding the relia-
bility of financial reporting and the preparation of financial
statements for external purposes in accordance with generally
accepted accounting principles. A company’s internal control
over financial reporting includes those policies and procedures
that (i) pertain to the maintenance of records that, in reasonable
detail, accurately and fairly reflect the transactions and disposi-
tions of the assets of the company; (ii) provide reasonable assur-
ance that transactions are recorded as necessary to permit
preparation of financial statements in accordance with generally
accepted accounting principles, and that receipts and expen-
ditures of the company are being made only in accordance with
authorizations of management and directors of the company;
and (iii) provide reasonable assurance regarding prevention or
timely detection of unauthorized acquisition, use, or disposition
of the company’s assets that could have a material effect on the
financial statements.
Because of its inherent limitations, internal control over financial
reporting may not prevent or detect misstatements. Also,
projections of any evaluation of effectiveness to future periods
are subject to the risk that controls may become inadequate
because of changes in conditions, or that the degree of com-
pliance with the policies or procedures may deteriorate.
/s/ PricewaterhouseCoopers LLP
New York, New York
February 20, 2009
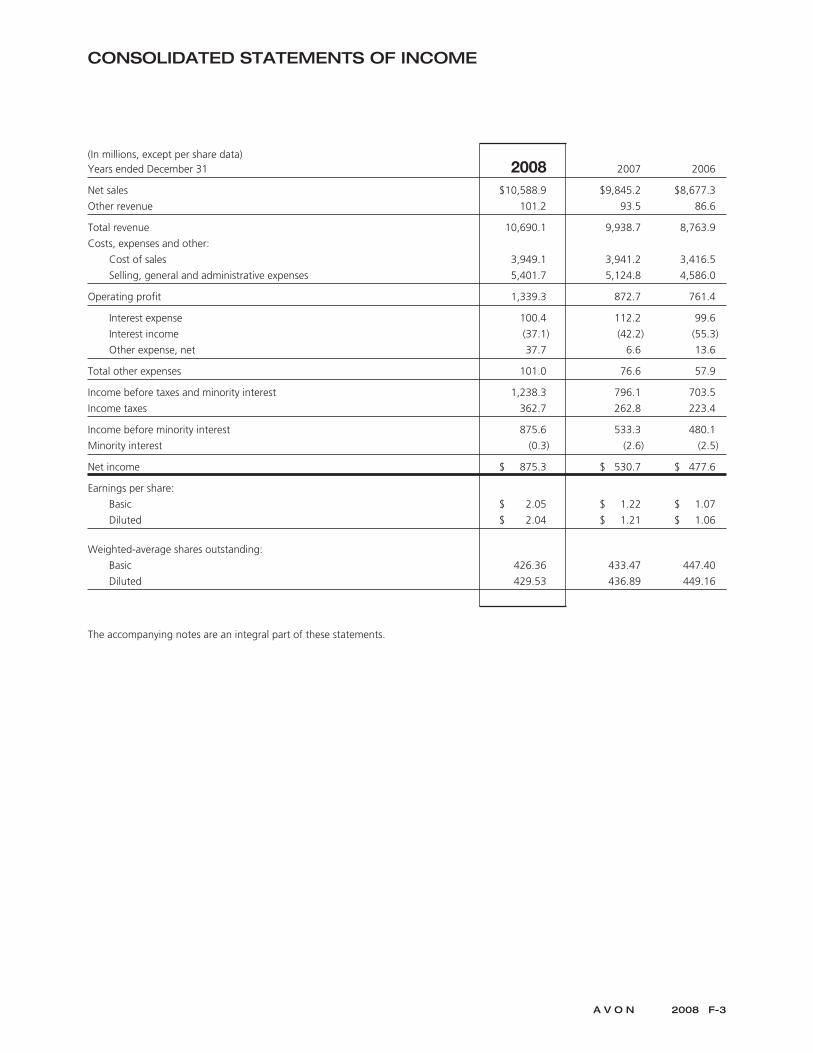
CONSOLIDATED STATEMENTS OF INCOME
(In millions, except per share data)Years ended December 31 2008 2007 2006
Net sales $10,588.9 $9,845.2 $8,677.3
Other revenue 101.2 93.5 86.6
Total revenue 10,690.1 9,938.7 8,763.9
Costs, expenses and other:
Cost of sales 3,949.1 3,941.2 3,416.5
Selling, general and administrative expenses 5,401.7 5,124.8 4,586.0
Operating profit 1,339.3 872.7 761.4
Interest expense 100.4 112.2 99.6
Interest income (37.1) (42.2) (55.3)
Other expense, net 37.7 6.6 13.6
Total other expenses 101.0 76.6 57.9
Income before taxes and minority interest 1,238.3 796.1 703.5
Income taxes 362.7 262.8 223.4
Income before minority interest 875.6 533.3 480.1
Minority interest (0.3) (2.6) (2.5)
Net income $ 875.3 $ 530.7 $ 477.6
Earnings per share:
Basic $ 2.05 $ 1.22 $ 1.07
Diluted $ 2.04 $ 1.21 $ 1.06
Weighted-average shares outstanding:
Basic 426.36 433.47 447.40
Diluted 429.53 436.89 449.16
The accompanying notes are an integral part of these statements.
A V O N 2008 F-3
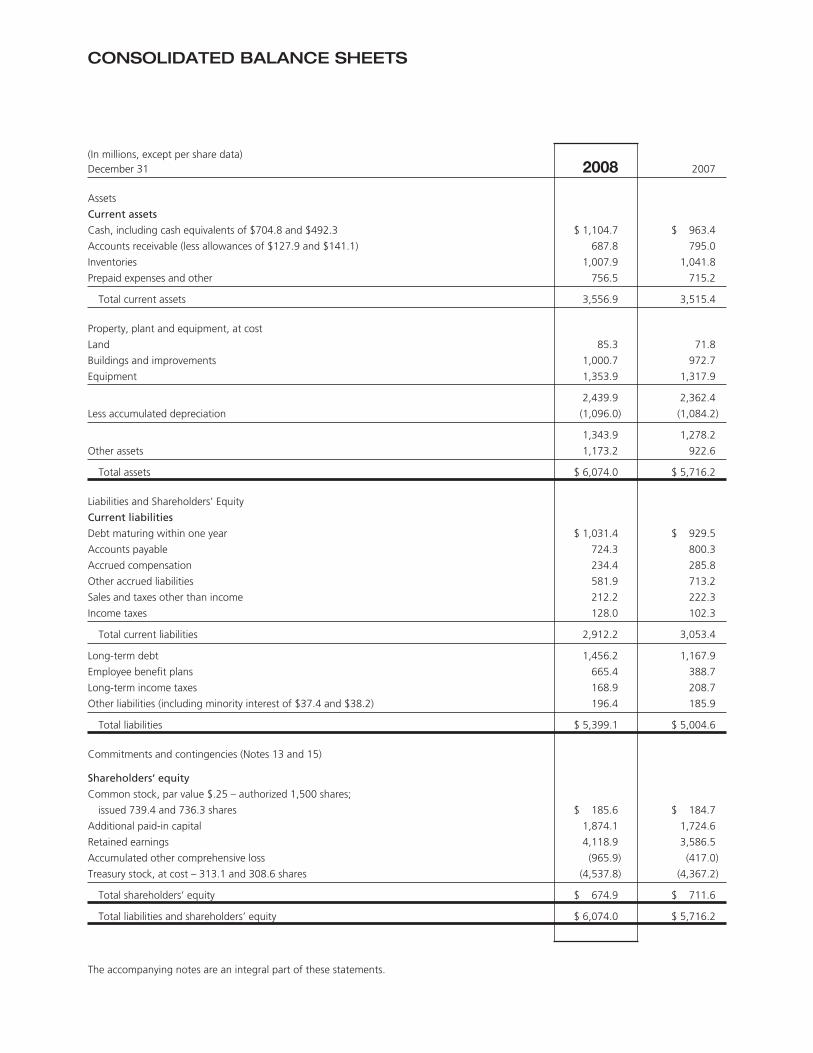
CONSOLIDATED BALANCE SHEETS
(In millions, except per share data)December 31 2008 2007
Assets
Current assets
Cash, including cash equivalents of $704.8 and $492.3 $ 1,104.7 $ 963.4
Accounts receivable (less allowances of $127.9 and $141.1) 687.8 795.0
Inventories 1,007.9 1,041.8
Prepaid expenses and other 756.5 715.2
Total current assets 3,556.9 3,515.4
Property, plant and equipment, at cost
Land 85.3 71.8
Buildings and improvements 1,000.7 972.7
Equipment 1,353.9 1,317.9
2,439.9 2,362.4
Less accumulated depreciation (1,096.0) (1,084.2)
1,343.9 1,278.2
Other assets 1,173.2 922.6
Total assets $ 6,074.0 $ 5,716.2
Liabilities and Shareholders’ Equity
Current liabilities
Debt maturing within one year $ 1,031.4 $ 929.5
Accounts payable 724.3 800.3
Accrued compensation 234.4 285.8
Other accrued liabilities 581.9 713.2
Sales and taxes other than income 212.2 222.3
Income taxes 128.0 102.3
Total current liabilities 2,912.2 3,053.4
Long-term debt 1,456.2 1,167.9
Employee benefit plans 665.4 388.7
Long-term income taxes 168.9 208.7
Other liabilities (including minority interest of $37.4 and $38.2) 196.4 185.9
Total liabilities $ 5,399.1 $ 5,004.6
Commitments and contingencies (Notes 13 and 15)
Shareholders’ equity
Common stock, par value $.25 – authorized 1,500 shares;
issued 739.4 and 736.3 shares $ 185.6 $ 184.7
Additional paid-in capital 1,874.1 1,724.6
Retained earnings 4,118.9 3,586.5
Accumulated other comprehensive loss (965.9) (417.0)
Treasury stock, at cost – 313.1 and 308.6 shares (4,537.8) (4,367.2)
Total shareholders’ equity $ 674.9 $ 711.6
Total liabilities and shareholders’ equity $ 6,074.0 $ 5,716.2
The accompanying notes are an integral part of these statements.
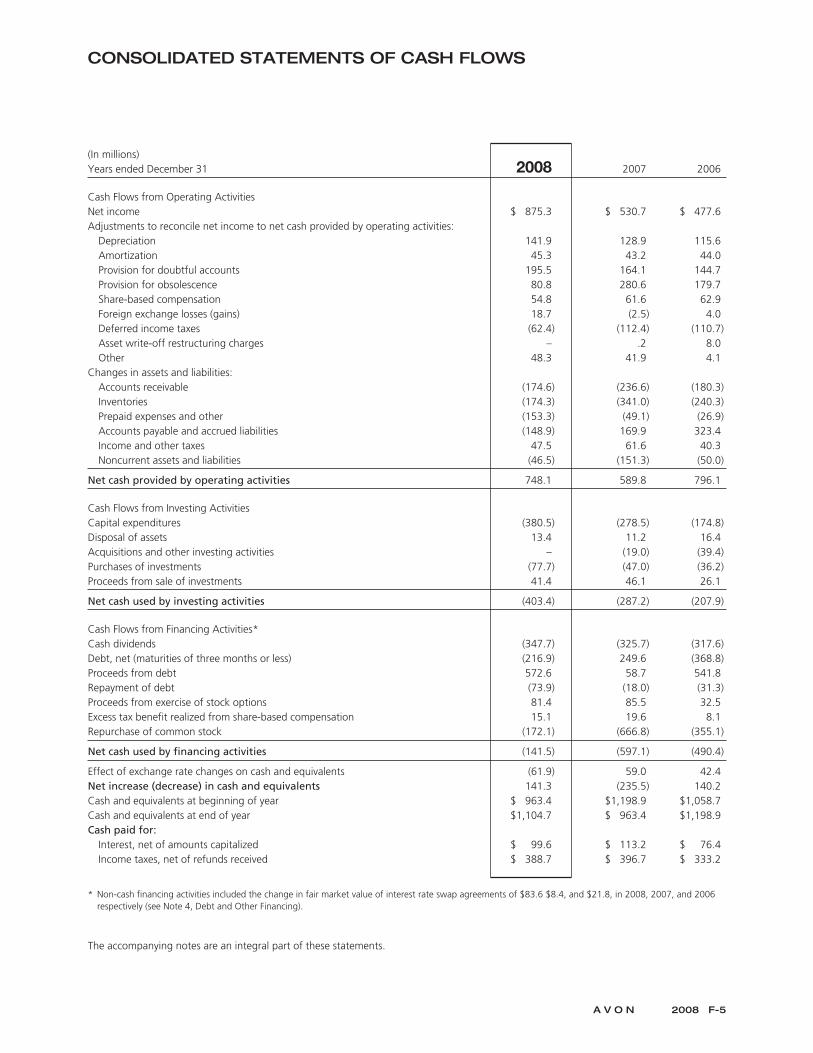
CONSOLIDATED STATEMENTS OF CASH FLOWS
(In millions)Years ended December 31 2008 2007 2006
Cash Flows from Operating ActivitiesNet income $ 875.3 $ 530.7 $ 477.6Adjustments to reconcile net income to net cash provided by operating activities:
Depreciation 141.9 128.9 115.6Amortization 45.3 43.2 44.0Provision for doubtful accounts 195.5 164.1 144.7Provision for obsolescence 80.8 280.6 179.7Share-based compensation 54.8 61.6 62.9Foreign exchange losses (gains) 18.7 (2.5) 4.0Deferred income taxes (62.4) (112.4) (110.7)Asset write-off restructuring charges – .2 8.0Other 48.3 41.9 4.1
Changes in assets and liabilities:Accounts receivable (174.6) (236.6) (180.3)Inventories (174.3) (341.0) (240.3)Prepaid expenses and other (153.3) (49.1) (26.9)Accounts payable and accrued liabilities (148.9) 169.9 323.4Income and other taxes 47.5 61.6 40.3Noncurrent assets and liabilities (46.5) (151.3) (50.0)
Net cash provided by operating activities 748.1 589.8 796.1
Cash Flows from Investing ActivitiesCapital expenditures (380.5) (278.5) (174.8)Disposal of assets 13.4 11.2 16.4Acquisitions and other investing activities – (19.0) (39.4)Purchases of investments (77.7) (47.0) (36.2)Proceeds from sale of investments 41.4 46.1 26.1
Net cash used by investing activities (403.4) (287.2) (207.9)
Cash Flows from Financing Activities*Cash dividends (347.7) (325.7) (317.6)Debt, net (maturities of three months or less) (216.9) 249.6 (368.8)Proceeds from debt 572.6 58.7 541.8Repayment of debt (73.9) (18.0) (31.3)Proceeds from exercise of stock options 81.4 85.5 32.5Excess tax benefit realized from share-based compensation 15.1 19.6 8.1Repurchase of common stock (172.1) (666.8) (355.1)
Net cash used by financing activities (141.5) (597.1) (490.4)
Effect of exchange rate changes on cash and equivalents (61.9) 59.0 42.4Net increase (decrease) in cash and equivalents 141.3 (235.5) 140.2Cash and equivalents at beginning of year $ 963.4 $1,198.9 $1,058.7Cash and equivalents at end of year $1,104.7 $ 963.4 $1,198.9Cash paid for:
Interest, net of amounts capitalized $ 99.6 $ 113.2 $ 76.4Income taxes, net of refunds received $ 388.7 $ 396.7 $ 333.2
* Non-cash financing activities included the change in fair market value of interest rate swap agreements of $83.6 $8.4, and $21.8, in 2008, 2007, and 2006respectively (see Note 4, Debt and Other Financing).
The accompanying notes are an integral part of these statements.
A V O N 2008 F-5
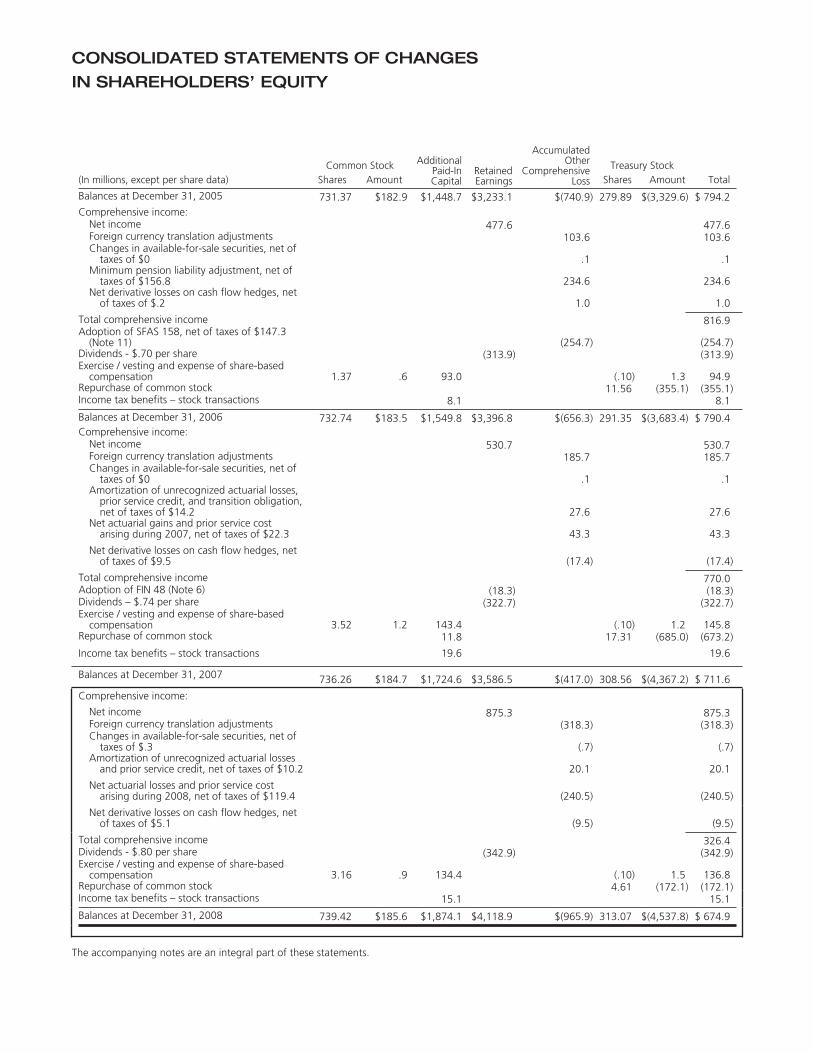
CONSOLIDATED STATEMENTS OF CHANGES
IN SHAREHOLDERS’ EQUITY
Common Stock AdditionalPaid-InCapital
RetainedEarnings
AccumulatedOther
ComprehensiveLoss
Treasury Stock(In millions, except per share data) Shares Amount Shares Amount Total
Balances at December 31, 2005 731.37 $182.9 $1,448.7 $3,233.1 $(740.9) 279.89 $(3,329.6) $ 794.2Comprehensive income:
Net income 477.6 477.6Foreign currency translation adjustments 103.6 103.6Changes in available-for-sale securities, net of
taxes of $0 .1 .1Minimum pension liability adjustment, net of
taxes of $156.8 234.6 234.6Net derivative losses on cash flow hedges, net
of taxes of $.2 1.0 1.0
Total comprehensive income 816.9Adoption of SFAS 158, net of taxes of $147.3
(Note 11) (254.7) (254.7)Dividends - $.70 per share (313.9) (313.9)Exercise / vesting and expense of share-based
compensation 1.37 .6 93.0 (.10) 1.3 94.9Repurchase of common stock 11.56 (355.1) (355.1)Income tax benefits – stock transactions 8.1 8.1
Balances at December 31, 2006 732.74 $183.5 $1,549.8 $3,396.8 $(656.3) 291.35 $(3,683.4) $ 790.4Comprehensive income:
Net income 530.7 530.7Foreign currency translation adjustments 185.7 185.7Changes in available-for-sale securities, net of
taxes of $0 .1 .1Amortization of unrecognized actuarial losses,
prior service credit, and transition obligation,net of taxes of $14.2 27.6 27.6
Net actuarial gains and prior service costarising during 2007, net of taxes of $22.3 43.3 43.3
Net derivative losses on cash flow hedges, netof taxes of $9.5 (17.4) (17.4)
Total comprehensive income 770.0Adoption of FIN 48 (Note 6) (18.3) (18.3)Dividends – $.74 per share (322.7) (322.7)Exercise / vesting and expense of share-based
compensation 3.52 1.2 143.4 (.10) 1.2 145.8Repurchase of common stock 11.8 17.31 (685.0) (673.2)
Income tax benefits – stock transactions 19.6 19.6
Balances at December 31, 2007 736.26 $184.7 $1,724.6 $3,586.5 $(417.0) 308.56 $(4,367.2) $ 711.6
Comprehensive income:
Net income 875.3 875.3Foreign currency translation adjustments (318.3) (318.3)Changes in available-for-sale securities, net of
taxes of $.3 (.7) (.7)Amortization of unrecognized actuarial losses
and prior service credit, net of taxes of $10.2 20.1 20.1
Net actuarial losses and prior service costarising during 2008, net of taxes of $119.4 (240.5) (240.5)
Net derivative losses on cash flow hedges, netof taxes of $5.1 (9.5) (9.5)
Total comprehensive income 326.4Dividends - $.80 per share (342.9) (342.9)Exercise / vesting and expense of share-based
compensation 3.16 .9 134.4 (.10) 1.5 136.8Repurchase of common stock 4.61 (172.1) (172.1)Income tax benefits – stock transactions 15.1 15.1
Balances at December 31, 2008 739.42 $185.6 $1,874.1 $4,118.9 $(965.9) 313.07 $(4,537.8) $ 674.9
The accompanying notes are an integral part of these statements.
NOTES TO CONSOLIDATED FINANCIAL STATEMENTS
(In millions, except per share and share data)
NOTE 1. Description of the Businessand Summary of Significant AccountingPolicies
BusinessWhen used in these notes, the terms “Avon,” “Company,”
“we,” “our” or “us” mean Avon Products, Inc.
We are a global manufacturer and marketer of beauty and
related products. Our business is conducted worldwide primarily
in one channel, direct selling. We manage our operations based
on geographic operations and our reportable segments are Latin
America; North America; Central & Eastern Europe; Western
Europe, Middle East & Africa; Asia Pacific; and China. We also
centrally manage Global Brand Marketing, Supply Chain and
Sales organizations. Beginning in the fourth quarter of 2008, we
changed our product categories from Beauty, Beauty Plus and
Beyond Beauty to Beauty, Fashion and Home. Beauty consists of
cosmetics, fragrances, skin care and toiletries (“CFT”). Fashion
consists of fashion jewelry, watches, apparel, footwear and
accessories. Home consists of gift and decorative products,
housewares, entertainment and leisure, children’s and nutritional
products. Sales from Health and Wellness products and mark., a
global cosmetics brand that focuses on the market for young
women, are included among these three categories based on
product type. Sales are made to the ultimate consumer
principally by independent Avon Representatives.
Principles of ConsolidationThe consolidated financial statements include the accounts of
Avon and our majority and wholly-owned subsidiaries.
Intercompany balances and transactions are eliminated.
Use of EstimatesThe preparation of financial statements in conformity with gen-
erally accepted accounting principles in the United States of
America requires us to make estimates and assumptions that
affect the reported amounts of assets and liabilities, the
disclosure of contingent assets and liabilities at the date of the
financial statements and the reported amounts of revenues and
expenses during the reporting period. Actual results could differ
materially from those estimates and assumptions. On an ongoing
basis, we review our estimates, including those related to
restructuring reserves, allowances for doubtful accounts receiv-
able, allowances for sales returns, provisions for inventory obso-
lescence, income taxes and tax valuation reserves, share-based
compensation, loss contingencies, and the determination of
discount rate and other actuarial assumptions for pension,
postretirement and postemployment benefit expenses.
Foreign CurrencyFinancial statements of foreign subsidiaries operating in other
than highly inflationary economies are translated at year-end
exchange rates for assets and liabilities and average exchange
rates during the year for income and expense accounts. The
resulting translation adjustments are recorded within accumu-
lated other comprehensive loss. Financial statements of
subsidiaries operating in highly inflationary economies are trans-
lated using a combination of current and historical exchange
rates and any translation adjustments are included in current
earnings. Gains or losses resulting from foreign currency trans-
actions are recorded in other expense, net.
Revenue RecognitionNet sales primarily include sales generated as a result of
Representative orders less any discounts, taxes and other
deductions. We recognize revenue upon delivery, when both
title and the risks and rewards of ownership pass to the
independent Representatives, who are our customers. Our
internal financial systems accumulate revenues as orders are
shipped to the Representative. Since we report revenue upon
delivery, revenues recorded in the financial system must be
reduced for an estimate of the financial impact of those orders
shipped but not delivered at the end of each reporting period.
We use estimates in determining the adjustments to revenue and
operating profit for orders that have been shipped but not deliv-
ered as of the end of the period. These estimates are based on
daily sales levels, delivery lead times, gross margin and variable
expenses. We also estimate an allowance for sales returns based
on historical experience with product returns. In addition, we
estimate an allowance for doubtful accounts receivable based on
an analysis of historical data and current circumstances.
Other RevenueOther revenue primarily includes shipping and handling fees
billed to Representatives.
Cash and Cash EquivalentsCash equivalents are stated at cost plus accrued interest, which
approximates fair value. Cash equivalents are high-quality,
short-term money market instruments with an original maturity
of three months or less and consist of time deposits with a
number of U.S. and non-U.S. commercial banks and money
market fund investments.
InventoriesInventories are stated at the lower of cost or market. Cost is
determined using the first-in, first-out (“FIFO”) method. We clas-
sify inventory into various categories based upon their stage in
the product life cycle, future marketing sales plans and
disposition process. We assign a degree of obsolescence risk to
A V O N 2008 F-7
NOTES TO CONSOLIDATED FINANCIAL STATEMENTS
products based on this classification to determine the level of
obsolescence provision.
Prepaid Brochure CostsCosts to prepare brochures are deferred and amortized over the
period during which the benefits are expected, which is typically
the sales campaign length of two to four weeks. At Decem-
ber 31, 2008 and 2007, prepaid expenses and other included
deferred brochure costs of $44.0 and $40.8, respectively. Addi-
tionally, paper stock is purchased in advance of creating the
brochures. At December 31, 2008 and 2007, prepaid expenses
and other included paper supply of $31.6 and $14.7,
respectively.
Property, Plant and EquipmentProperty, plant and equipment are stated at cost and are depreci-
ated using a straight-line method over the estimated useful lives
of the assets. The estimated useful lives generally are as follows:
buildings, 45 years; land improvements, 20 years; machinery and
equipment, 15 years; and office equipment, five to ten years.
Leasehold improvements are depreciated over the shorter of the
lease term or the estimated useful life of the asset. Upon dis-
posal of property, plant and equipment, the cost of the assets
and the related accumulated depreciation are removed from the
accounts and the resulting gain or loss is reflected in earnings.
Costs associated with repair and maintenance activities are
expensed as incurred.
We capitalize interest on borrowings during the active
construction period of major capital projects. Capitalized interest
is added to the cost of the related asset and depreciated over the
useful lives of the assets. For 2008, 2007 and 2006, Avon
capitalized $4.9, $0 and $1.0 of interest, respectively.
Deferred SoftwareCertain systems development costs related to the purchase,
development and installation of computer software are
capitalized and amortized over the estimated useful life of the
related project, not to exceed five years. Costs incurred prior to
the development stage, as well as maintenance, training costs,
and general and administrative expenses are expensed as
incurred. At December 31, 2008 and 2007, other assets included
unamortized deferred software costs of $98.3 and $95.9,
respectively.
Investments in Debt and Equity SecuritiesDebt and equity securities that have a readily determinable fair
value and that we do not intend to hold to maturity are classified
as available-for-sale and carried at fair value. Unrealized holding
gains and losses, net of applicable taxes, are recorded as a sepa-
rate component of shareholders’ equity, net of deferred taxes.
Realized gains and losses from the sale of available-for-sale secu-
rities are calculated on a specific identification basis. Declines in
the fair values of investments below their cost basis that are
judged to be other-than-temporary are recorded in other
expense, net. In determining whether an other-than-temporary
decline in market value has occurred, we consider various
factors, including the duration and the extent to which market
value is below cost.
Goodwill and Intangible AssetsGoodwill is not amortized, but rather is assessed for impairment
annually and upon the occurrence of an event that indicates
impairment may have occurred. Intangible assets with estimable
useful lives are amortized using a straight-line method over the
estimated useful lives of the assets. We completed annual
goodwill impairment assessments and no adjustments to
goodwill were necessary for the years ended December 31,
2008, 2007 or 2006.
Financial InstrumentsWe use derivative financial instruments, including interest rate
swaps, treasury lock agreements, forward foreign currency
contracts and options, to manage interest rate and foreign cur-
rency exposures. We record all derivative instruments at their fair
values on the Consolidated Balance Sheets as either assets or
liabilities. See Note 7, Financial Instruments and Risk
Management.
Deferred Income TaxesDeferred income taxes have been provided on items recognized
for financial reporting purposes in different periods than for
income tax purposes using tax rates in effect for the year in
which the differences are expected to reverse. A valuation
allowance is provided for deferred tax assets if it is more likely
than not these items will not be realized. The ultimate realization
of our deferred tax assets depends upon generating sufficient
future taxable income during the periods in which our temporary
differences become deductible or before our net operating loss
and tax credit carryforwards expire. Deferred taxes are not pro-
vided on the portion of unremitted earnings of subsidiaries out-
side of the U.S. when management concludes that these
earnings are indefinitely reinvested. Deferred taxes are provided
on earnings not considered indefinitely reinvested. U.S. income
taxes have not been provided on approximately $2,463.1 of
undistributed income of subsidiaries that has been or is intended
to be indefinitely reinvested outside the U.S.
Uncertain Tax PositionsEffective January 1, 2007, we adopted Financial Accounting
Standards Board (“FASB”) Interpretation No. 48, Accounting for
Uncertainty in Income Taxes – an interpretation of FASB
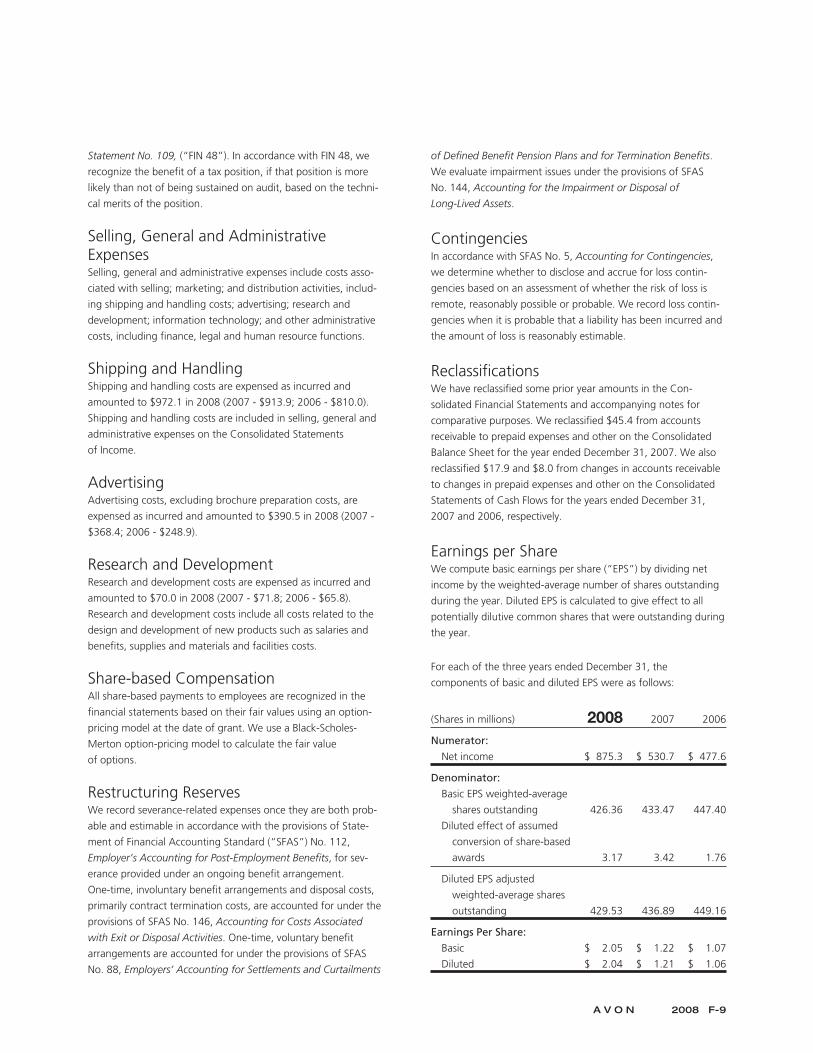
Statement No. 109, (“FIN 48”). In accordance with FIN 48, we
recognize the benefit of a tax position, if that position is more
likely than not of being sustained on audit, based on the techni-
cal merits of the position.
Selling, General and AdministrativeExpensesSelling, general and administrative expenses include costs asso-
ciated with selling; marketing; and distribution activities, includ-
ing shipping and handling costs; advertising; research and
development; information technology; and other administrative
costs, including finance, legal and human resource functions.
Shipping and HandlingShipping and handling costs are expensed as incurred and
amounted to $972.1 in 2008 (2007 - $913.9; 2006 - $810.0).
Shipping and handling costs are included in selling, general and
administrative expenses on the Consolidated Statements
of Income.
AdvertisingAdvertising costs, excluding brochure preparation costs, are
expensed as incurred and amounted to $390.5 in 2008 (2007 -
$368.4; 2006 - $248.9).
Research and DevelopmentResearch and development costs are expensed as incurred and
amounted to $70.0 in 2008 (2007 - $71.8; 2006 - $65.8).
Research and development costs include all costs related to the
design and development of new products such as salaries and
benefits, supplies and materials and facilities costs.
Share-based CompensationAll share-based payments to employees are recognized in the
financial statements based on their fair values using an option-
pricing model at the date of grant. We use a Black-Scholes-
Merton option-pricing model to calculate the fair value
of options.
Restructuring ReservesWe record severance-related expenses once they are both prob-
able and estimable in accordance with the provisions of State-
ment of Financial Accounting Standard (“SFAS”) No. 112,
Employer’s Accounting for Post-Employment Benefits, for sev-
erance provided under an ongoing benefit arrangement.
One-time, involuntary benefit arrangements and disposal costs,
primarily contract termination costs, are accounted for under the
provisions of SFAS No. 146, Accounting for Costs Associated
with Exit or Disposal Activities. One-time, voluntary benefit
arrangements are accounted for under the provisions of SFAS
No. 88, Employers’ Accounting for Settlements and Curtailments
of Defined Benefit Pension Plans and for Termination Benefits.
We evaluate impairment issues under the provisions of SFAS
No. 144, Accounting for the Impairment or Disposal of
Long-Lived Assets.
ContingenciesIn accordance with SFAS No. 5, Accounting for Contingencies,
we determine whether to disclose and accrue for loss contin-
gencies based on an assessment of whether the risk of loss is
remote, reasonably possible or probable. We record loss contin-
gencies when it is probable that a liability has been incurred and
the amount of loss is reasonably estimable.
ReclassificationsWe have reclassified some prior year amounts in the Con-
solidated Financial Statements and accompanying notes for
comparative purposes. We reclassified $45.4 from accounts
receivable to prepaid expenses and other on the Consolidated
Balance Sheet for the year ended December 31, 2007. We also
reclassified $17.9 and $8.0 from changes in accounts receivable
to changes in prepaid expenses and other on the Consolidated
Statements of Cash Flows for the years ended December 31,
2007 and 2006, respectively.
Earnings per ShareWe compute basic earnings per share (“EPS”) by dividing net
income by the weighted-average number of shares outstanding
during the year. Diluted EPS is calculated to give effect to all
potentially dilutive common shares that were outstanding during
the year.
For each of the three years ended December 31, the
components of basic and diluted EPS were as follows:
(Shares in millions) 2008 2007 2006
Numerator:
Net income $ 875.3 $ 530.7 $ 477.6
Denominator:
Basic EPS weighted-average
shares outstanding 426.36 433.47 447.40
Diluted effect of assumed
conversion of share-based
awards 3.17 3.42 1.76
Diluted EPS adjusted
weighted-average shares
outstanding 429.53 436.89 449.16
Earnings Per Share:
Basic $ 2.05 $ 1.22 $ 1.07
Diluted $ 2.04 $ 1.21 $ 1.06
A V O N 2008 F-9
NOTES TO CONSOLIDATED FINANCIAL STATEMENTS
For the years ended December 31, 2008, 2007 and 2006, we did
not include stock options to purchase 21.3 million shares,
7.4 million and 12.9 million shares of Avon common stock,
respectively, in the calculations of diluted EPS because the
exercise prices of those options were greater than the average
market price and their inclusion would be anti-dilutive.
NOTE 2. New Accounting Standards
Standards ImplementedEffective January 1, 2008, we adopted Financial Accounting
Standards Board (“FASB”) SFAS 157, Fair Value Measurements
(“SFAS 157”), with the exception of the application of the
statement to non-recurring, nonfinancial assets and liabilities.
SFAS 157 defines fair value, establishes a framework for measur-
ing fair value in accordance with generally accepted accounting
principles, and expands disclosures about fair value measure-
ments. In February 2008, the FASB issued Staff Position 157-2,
Effective Date of FASB Statement No. 157, which delays the
effective date of SFAS No. 157 for nonfinancial assets and
liabilities, except for those that are recognized or disclosed at fair
value in the financial statements on a recurring basis, until
January 1, 2009. The adoption of SFAS 157 did not have a mate-
rial impact on our Consolidated Financial Statements. See Note
8, Fair Value, for additional information.
Effective January 1, 2008, we adopted SFAS No. 159, The Fair
Value Option for Financial Assets and Financial Liabilities –
including an amendment to FASB Statement No. 115, (“SFAS
159”), which permits entities to choose to measure many finan-
cial instruments and certain other items at fair value that are not
currently required to be measured at fair value. The adoption of
SFAS 159 had no impact on our Consolidated Financial State-
ments, as we did not choose to measure the items at fair value.
Effective January 1, 2007, we adopted Financial Accounting
Standards Board (“FASB”) Interpretation No. 48, Accounting for
Uncertainty in Income Taxes – an interpretation of FASB State-
ment No. 109, (“FIN 48”). See Note 6, Income Taxes, for
additional information.
Effective December 31, 2006, we adopted SFAS No. 158,
Employers’ Accounting for Defined Benefit Pension and Other
Postretirement Plans – an amendment of FASB Statements
No. 87, 88, 106 and 132R (“SFAS 158”). See Note 11, Employee
Benefit Plans, for additional information.
Effective December 31, 2006, we adopted Staff Accounting
Bulletin (“SAB”) No. 108, Considering the Effects of Prior Year
Misstatements when Quantifying Misstatements in Current Year
Financial Statements (“SAB 108”), which provides interpretive
guidance on the consideration of the effects of prior year
misstatements in quantifying current year misstatements for the
purpose of a materiality assessment. SAB 108 allows for a
one-time transitional cumulative effect adjustment to beginning
retained earnings as of January 1, 2007, for errors that were not
previously deemed material, but are material under the guidance
in SAB 108. The adoption of SAB 108 had no impact on our
Consolidated Financial Statements.
Standards to be ImplementedIn December 2008, the FASB issued Staff Position No. (“FSP”)
FAS 132(R)-1, Employers’ Disclosures about Postretirement Bene-
fit Plan Assets. The FSP will require additional disclosures about
the major categories of plan assets and concentrations of risk, as
well as disclosure of fair value levels, similar to the disclosure
requirements of SFAS 157. The enhanced disclosures about plan
assets required by this FSP must be provided in our 2009 Annual
Report on Form 10-K.
In February 2008, the FASB issued SFAS No. 161, Disclosures
about Derivative Instruments and Hedging Activities – an
amendment of FASB Statement No. 133, (“SFAS 161”) which
changes, among other things, the disclosure requirements for
derivative instruments and hedging activities. We will be re-
quired to provide enhanced disclosures about how and why we
use derivative instruments, how they are accounted for, and how
they affect our financial performance. SFAS 161 is effective
January 1, 2009, for Avon.
In June 2008, the FASB issued FSP Emerging Issues Task Force
(“EITF”) 03-6-1, Determining Whether Instruments Granted in
Share-Based Payment Transactions Are Participating Securities,
(“FSP EITF 03-6-1”), which addresses whether instruments grant-
ed in share-based payment awards are participating securities
prior to vesting and, therefore, need to be included in the earn-
ings allocation in computing earnings per share (“EPS”) under
the two-class method. FSP EITF 03-6-1 is effective January 1,
2009, for Avon and requires prior period EPS presented to be
adjusted retrospectively. Our grants of restricted stock and re-
stricted stock units contain non-forfeitable rights to dividend
equivalents and are considered participating securities as defined
in FSP EITF 03-6-1 and will be included in computing earnings
per share using the two-class method beginning with our first
quarter 2009 Form 10-Q. The adoption of FSP EITF 03-6-1 will
not have a material impact on the calculation of basic or diluted
earnings per share.
In December 2007, the FASB issued SFAS No. 141 (revised 2007),
Business Combinations, (“SFAS 141R”), which changes how
business combinations are accounted for and will impact financial
statements both on the acquisition date and in subsequent peri-
ods. SFAS 141R is effective January 1, 2009, for Avon and will be
applied prospectively. The impact of adopting SFAS 141R will
depend on the nature and terms of future acquisitions.

In December 2007, the FASB issued SFAS No. 160, Noncontrol-
ling Interests in Consolidated Financial Statements, (“SFAS
160”), which changes the accounting and reporting standards
for the noncontrolling interests in a subsidiary in consolidated
financial statements. SFAS 160 recharacterizes minority interests
as noncontrolling interests and requires noncontrolling interests
to be classified as a component of shareholders’ equity. SFAS
160 is effective January 1, 2009, for Avon and requires retro-
active adoption of the presentation and disclosure requirements
for existing minority interests. We do not believe the adoption of
SFAS 160 will have a material impact on our consolidated finan-
cial statements. At December 31, 2008 and 2007, other liabilities
included minority interest liabilities of $37.4 and $38.2,
respectively.
NOTE 3. Inventories
Inventories at December 31 consisted of the following:
2008 2007
Raw materials $ 292.7 $ 337.8Finished goods 715.2 704.0
Total $1,007.9 $1,041.8
NOTE 4. Debt and Other Financing
DebtDebt at December 31 consisted of the following:
2008 2007
Debt maturing within one year:Notes payable $ 125.4 $ 76.0Commercial paper 499.7 701.6Yen credit facility 102.0 96.3Euro credit facility – 32.87.15% Notes, due November 2009 300.0 –Current portion of long-term debt 4.3 22.8
Total $1,031.4 $ 929.5
Long-term debt:7.15% Notes, due November 2009 $ – $ 300.05.125% Notes, due January 2011 499.7 499.64.80% Notes, due March 2013 249.2 –4.625% Notes, due May 2013 114.1 112.05.75% Notes, due March 2018 249.2 –4.20% Notes, due July 2018 249.7 249.1
Other, payable through 2013 withinterest from 1.4% to 25.3% 14.7 31.0
Total long-term debt 1,376.6 1,191.7Adjustments for debt with fair value
hedges 83.9 (1.0)Less current portion (4.3) (22.8)
Total $1,456.2 $1,167.9
At December 31, 2008 and 2007, notes payable included
short-term borrowings of international subsidiaries at average
annual interest rates of approximately 7.6% and 4.6%,
respectively.
At December 31, 2008 and 2007, other long-term debt, payable
through 2013, included obligations under capital leases of $11.4
and $13.6, respectively, which primarily relate to leases of auto-
mobiles and equipment.
Adjustments for debt with fair value hedges includes adjust-
ments to reflect net unrealized gains of $80.0 and losses of $9.4
on debt with fair value hedges at December 31, 2008 and 2007,
respectively, and unamortized gains on terminated swap
agreements and swap agreements no longer designated as fair
value hedges of $3.9 and $8.4 at December 31, 2008 and 2007,
respectively (see Note 7, Financial Instruments and Risk
Management).
At December 31, 2008 and 2007, we held interest rate swap
contracts that swap approximately 50% and 30%, respectively,
of our long-term debt to variable rates (see Note 7, Financial
Instruments and Risk Management).
In March 2008, we issued $500.0 principal amount of notes
payable in a public offering. $250.0 of the notes bear interest at
a per annum coupon rate equal to 4.80%, payable semi-
annually, and mature on March 1, 2013, unless previously
redeemed (the “2013 Notes”). $250.0 of the notes bear interest
at a per annum coupon rate of 5.75%, payable semi-annually,
and mature on March 1, 2018, unless previously redeemed (the
“2018 Notes”). The net proceeds from the offering of $496.3
were used to repay outstanding indebtedness under our
commercial paper program and for general corporate purposes.
The carrying value of the 2013 Notes represents the $250.0
principal amount, net of the unamortized discount to face value
of $.8 at December 31, 2008. The carrying value of the 2018
Notes represents the $250.0 principal amount, net of the unam-
ortized discount to face value of $.8 at December 31, 2008.
In January 2006, we issued in a public offering $500.0 principal
amount of notes payable (“5.125% Notes”) that mature on
January 15, 2011, and bear interest, payable semi-annually, at a
per annum rate equal to 5.125%. The net proceeds from the
offering were used for general corporate purposes, including the
repayment of short-term domestic debt. The carrying value of
the 5.125% Notes represents the $500.0 principal amount, net
of the unamortized discount to face value of $.3 and $.4 at
December 31, 2008 and 2007, respectively.
In June 2003, we issued to the public $250.0 principal amount
of registered senior notes (the “4.20% Notes”) under our
A V O N 2008 F-11
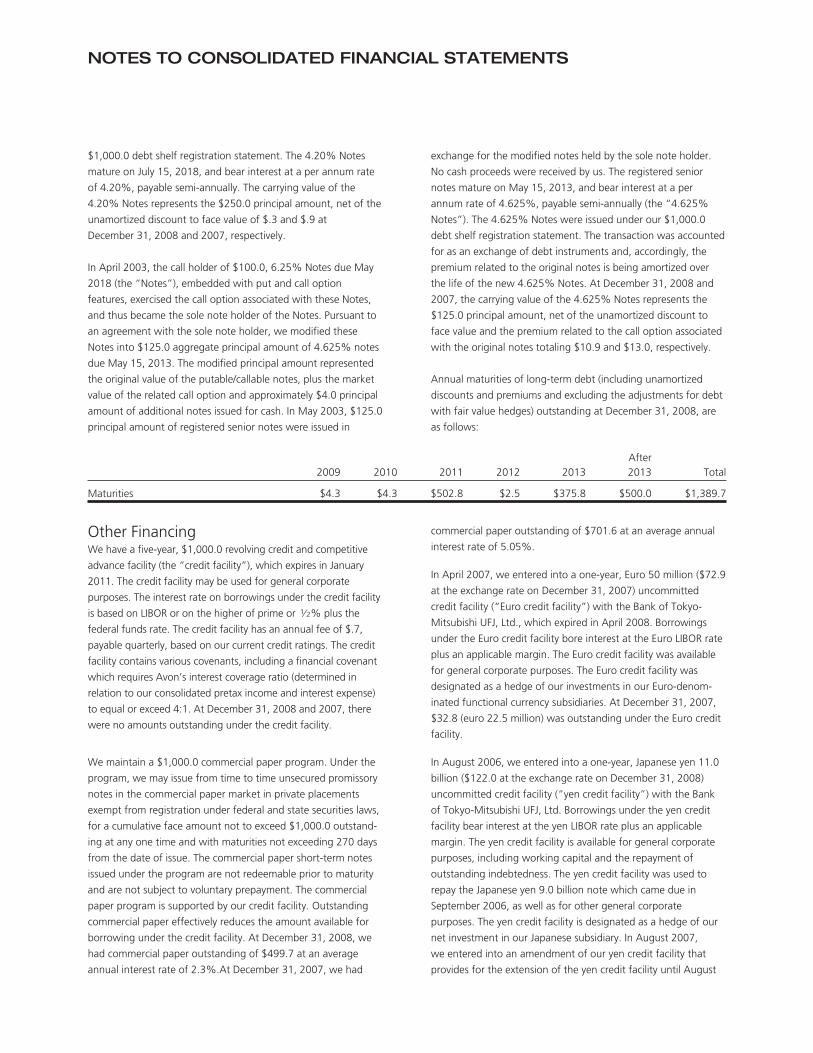
NOTES TO CONSOLIDATED FINANCIAL STATEMENTS
$1,000.0 debt shelf registration statement. The 4.20% Notes
mature on July 15, 2018, and bear interest at a per annum rate
of 4.20%, payable semi-annually. The carrying value of the
4.20% Notes represents the $250.0 principal amount, net of the
unamortized discount to face value of $.3 and $.9 at
December 31, 2008 and 2007, respectively.
In April 2003, the call holder of $100.0, 6.25% Notes due May
2018 (the “Notes”), embedded with put and call option
features, exercised the call option associated with these Notes,
and thus became the sole note holder of the Notes. Pursuant to
an agreement with the sole note holder, we modified these
Notes into $125.0 aggregate principal amount of 4.625% notes
due May 15, 2013. The modified principal amount represented
the original value of the putable/callable notes, plus the market
value of the related call option and approximately $4.0 principal
amount of additional notes issued for cash. In May 2003, $125.0
principal amount of registered senior notes were issued in
exchange for the modified notes held by the sole note holder.
No cash proceeds were received by us. The registered senior
notes mature on May 15, 2013, and bear interest at a per
annum rate of 4.625%, payable semi-annually (the “4.625%
Notes”). The 4.625% Notes were issued under our $1,000.0
debt shelf registration statement. The transaction was accounted
for as an exchange of debt instruments and, accordingly, the
premium related to the original notes is being amortized over
the life of the new 4.625% Notes. At December 31, 2008 and
2007, the carrying value of the 4.625% Notes represents the
$125.0 principal amount, net of the unamortized discount to
face value and the premium related to the call option associated
with the original notes totaling $10.9 and $13.0, respectively.
Annual maturities of long-term debt (including unamortized
discounts and premiums and excluding the adjustments for debt
with fair value hedges) outstanding at December 31, 2008, are
as follows:
2009 2010 2011 2012 2013After2013 Total
Maturities $4.3 $4.3 $502.8 $2.5 $375.8 $500.0 $1,389.7
Other FinancingWe have a five-year, $1,000.0 revolving credit and competitive
advance facility (the “credit facility”), which expires in January
2011. The credit facility may be used for general corporate
purposes. The interest rate on borrowings under the credit facility
is based on LIBOR or on the higher of prime or 1⁄2% plus the
federal funds rate. The credit facility has an annual fee of $.7,
payable quarterly, based on our current credit ratings. The credit
facility contains various covenants, including a financial covenant
which requires Avon’s interest coverage ratio (determined in
relation to our consolidated pretax income and interest expense)
to equal or exceed 4:1. At December 31, 2008 and 2007, there
were no amounts outstanding under the credit facility.
We maintain a $1,000.0 commercial paper program. Under the
program, we may issue from time to time unsecured promissory
notes in the commercial paper market in private placements
exempt from registration under federal and state securities laws,
for a cumulative face amount not to exceed $1,000.0 outstand-
ing at any one time and with maturities not exceeding 270 days
from the date of issue. The commercial paper short-term notes
issued under the program are not redeemable prior to maturity
and are not subject to voluntary prepayment. The commercial
paper program is supported by our credit facility. Outstanding
commercial paper effectively reduces the amount available for
borrowing under the credit facility. At December 31, 2008, we
had commercial paper outstanding of $499.7 at an average
annual interest rate of 2.3%.At December 31, 2007, we had
commercial paper outstanding of $701.6 at an average annual
interest rate of 5.05%.
In April 2007, we entered into a one-year, Euro 50 million ($72.9
at the exchange rate on December 31, 2007) uncommitted
credit facility (“Euro credit facility”) with the Bank of Tokyo-
Mitsubishi UFJ, Ltd., which expired in April 2008. Borrowings
under the Euro credit facility bore interest at the Euro LIBOR rate
plus an applicable margin. The Euro credit facility was available
for general corporate purposes. The Euro credit facility was
designated as a hedge of our investments in our Euro-denom-
inated functional currency subsidiaries. At December 31, 2007,
$32.8 (euro 22.5 million) was outstanding under the Euro credit
facility.
In August 2006, we entered into a one-year, Japanese yen 11.0
billion ($122.0 at the exchange rate on December 31, 2008)
uncommitted credit facility (“yen credit facility”) with the Bank
of Tokyo-Mitsubishi UFJ, Ltd. Borrowings under the yen credit
facility bear interest at the yen LIBOR rate plus an applicable
margin. The yen credit facility is available for general corporate
purposes, including working capital and the repayment of
outstanding indebtedness. The yen credit facility was used to
repay the Japanese yen 9.0 billion note which came due in
September 2006, as well as for other general corporate
purposes. The yen credit facility is designated as a hedge of our
net investment in our Japanese subsidiary. In August 2007,
we entered into an amendment of our yen credit facility that
provides for the extension of the yen credit facility until August
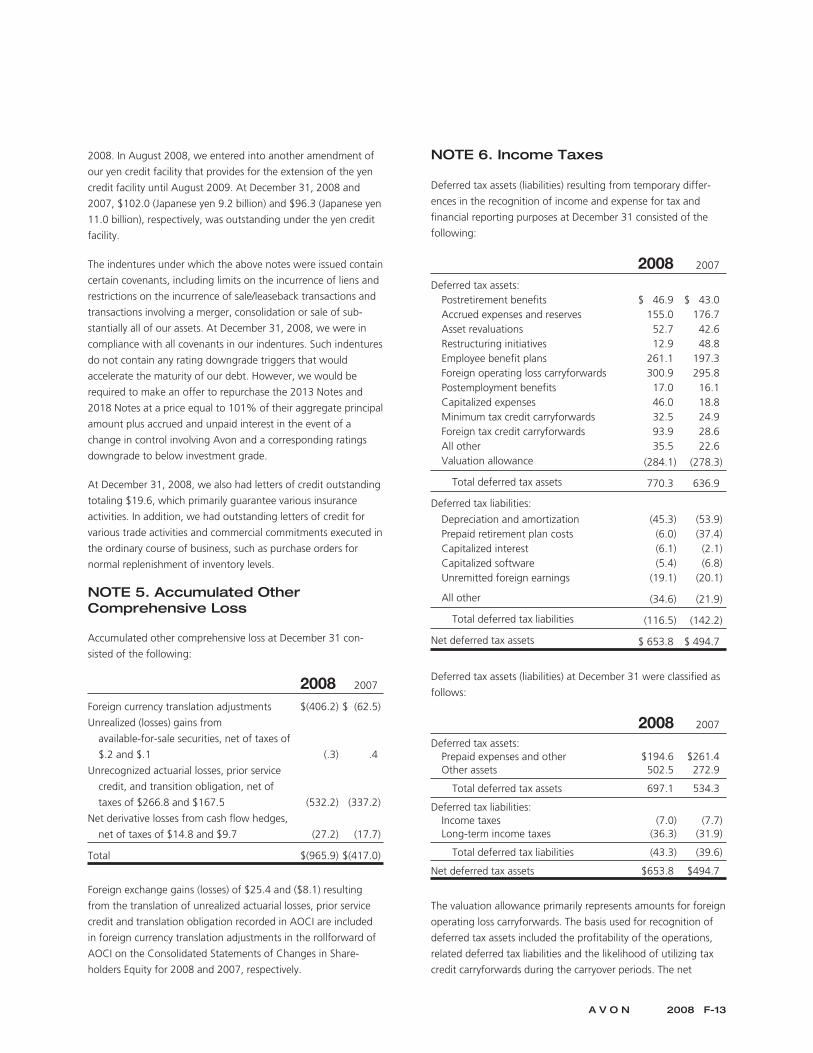
2008. In August 2008, we entered into another amendment of
our yen credit facility that provides for the extension of the yen
credit facility until August 2009. At December 31, 2008 and
2007, $102.0 (Japanese yen 9.2 billion) and $96.3 (Japanese yen
11.0 billion), respectively, was outstanding under the yen credit
facility.
The indentures under which the above notes were issued contain
certain covenants, including limits on the incurrence of liens and
restrictions on the incurrence of sale/leaseback transactions and
transactions involving a merger, consolidation or sale of sub-
stantially all of our assets. At December 31, 2008, we were in
compliance with all covenants in our indentures. Such indentures
do not contain any rating downgrade triggers that would
accelerate the maturity of our debt. However, we would be
required to make an offer to repurchase the 2013 Notes and
2018 Notes at a price equal to 101% of their aggregate principal
amount plus accrued and unpaid interest in the event of a
change in control involving Avon and a corresponding ratings
downgrade to below investment grade.
At December 31, 2008, we also had letters of credit outstanding
totaling $19.6, which primarily guarantee various insurance
activities. In addition, we had outstanding letters of credit for
various trade activities and commercial commitments executed in
the ordinary course of business, such as purchase orders for
normal replenishment of inventory levels.
NOTE 5. Accumulated OtherComprehensive Loss
Accumulated other comprehensive loss at December 31 con-
sisted of the following:
2008 2007
Foreign currency translation adjustments $(406.2) $ (62.5)
Unrealized (losses) gains from
available-for-sale securities, net of taxes of
$.2 and $.1 (.3) .4
Unrecognized actuarial losses, prior service
credit, and transition obligation, net of
taxes of $266.8 and $167.5 (532.2) (337.2)
Net derivative losses from cash flow hedges,
net of taxes of $14.8 and $9.7 (27.2) (17.7)
Total $(965.9) $(417.0)
Foreign exchange gains (losses) of $25.4 and ($8.1) resulting
from the translation of unrealized actuarial losses, prior service
credit and translation obligation recorded in AOCI are included
in foreign currency translation adjustments in the rollforward of
AOCI on the Consolidated Statements of Changes in Share-
holders Equity for 2008 and 2007, respectively.
NOTE 6. Income Taxes
Deferred tax assets (liabilities) resulting from temporary differ-
ences in the recognition of income and expense for tax and
financial reporting purposes at December 31 consisted of the
following:
2008 2007
Deferred tax assets:Postretirement benefits $ 46.9 $ 43.0Accrued expenses and reserves 155.0 176.7Asset revaluations 52.7 42.6Restructuring initiatives 12.9 48.8Employee benefit plans 261.1 197.3Foreign operating loss carryforwards 300.9 295.8Postemployment benefits 17.0 16.1Capitalized expenses 46.0 18.8Minimum tax credit carryforwards 32.5 24.9Foreign tax credit carryforwards 93.9 28.6All other 35.5 22.6Valuation allowance (284.1) (278.3)
Total deferred tax assets 770.3 636.9
Deferred tax liabilities:
Depreciation and amortization (45.3) (53.9)Prepaid retirement plan costs (6.0) (37.4)Capitalized interest (6.1) (2.1)Capitalized software (5.4) (6.8)Unremitted foreign earnings (19.1) (20.1)
All other (34.6) (21.9)
Total deferred tax liabilities (116.5) (142.2)
Net deferred tax assets $ 653.8 $ 494.7
Deferred tax assets (liabilities) at December 31 were classified as
follows:
2008 2007
Deferred tax assets:Prepaid expenses and other $194.6 $261.4Other assets 502.5 272.9
Total deferred tax assets 697.1 534.3
Deferred tax liabilities:Income taxes (7.0) (7.7)Long-term income taxes (36.3) (31.9)
Total deferred tax liabilities (43.3) (39.6)
Net deferred tax assets $653.8 $494.7
The valuation allowance primarily represents amounts for foreign
operating loss carryforwards. The basis used for recognition of
deferred tax assets included the profitability of the operations,
related deferred tax liabilities and the likelihood of utilizing tax
credit carryforwards during the carryover periods. The net
A V O N 2008 F-13
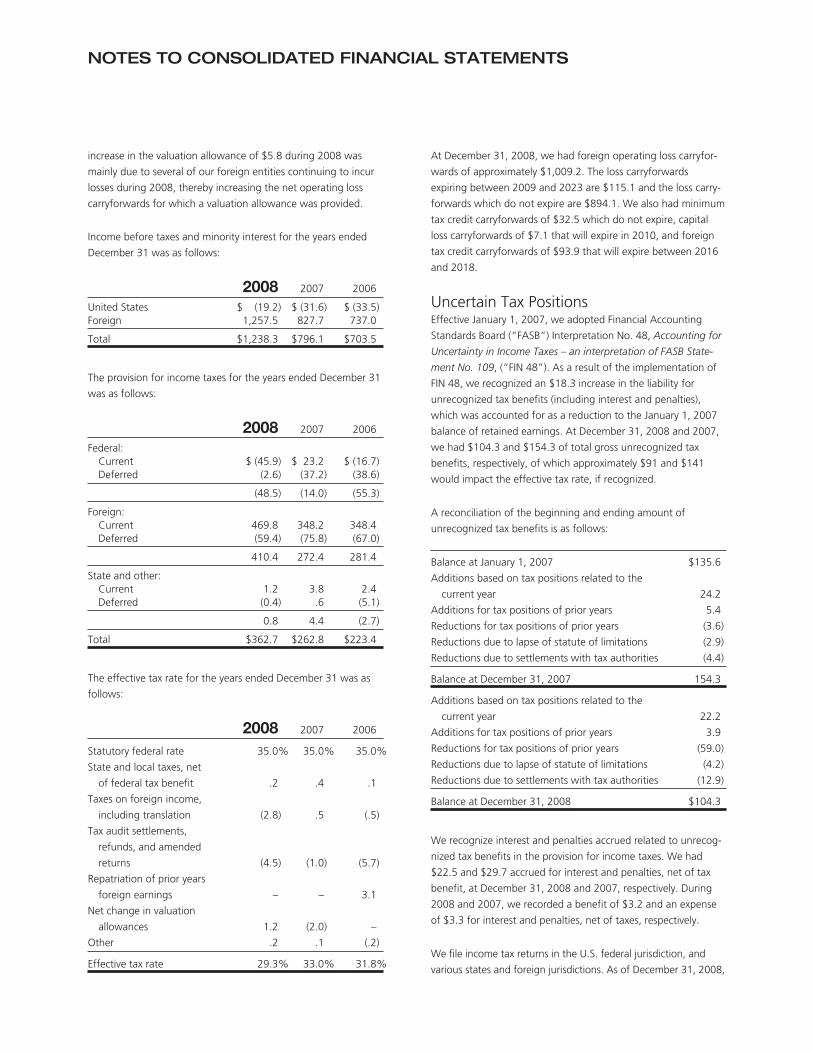
NOTES TO CONSOLIDATED FINANCIAL STATEMENTS
increase in the valuation allowance of $5.8 during 2008 was
mainly due to several of our foreign entities continuing to incur
losses during 2008, thereby increasing the net operating loss
carryforwards for which a valuation allowance was provided.
Income before taxes and minority interest for the years ended
December 31 was as follows:
2008 2007 2006
United States $ (19.2) $ (31.6) $ (33.5)Foreign 1,257.5 827.7 737.0
Total $1,238.3 $796.1 $703.5
The provision for income taxes for the years ended December 31
was as follows:
2008 2007 2006
Federal:Current $ (45.9) $ 23.2 $ (16.7)Deferred (2.6) (37.2) (38.6)
(48.5) (14.0) (55.3)
Foreign:Current 469.8 348.2 348.4Deferred (59.4) (75.8) (67.0)
410.4 272.4 281.4
State and other:Current 1.2 3.8 2.4Deferred (0.4) .6 (5.1)
0.8 4.4 (2.7)
Total $362.7 $262.8 $223.4
The effective tax rate for the years ended December 31 was as
follows:
2008 2007 2006
Statutory federal rate 35.0% 35.0% 35.0%
State and local taxes, net
of federal tax benefit .2 .4 .1
Taxes on foreign income,
including translation (2.8) .5 (.5)
Tax audit settlements,
refunds, and amended
returns (4.5) (1.0) (5.7)
Repatriation of prior years
foreign earnings – – 3.1
Net change in valuation
allowances 1.2 (2.0) –
Other .2 .1 (.2)
Effective tax rate 29.3% 33.0% 31.8%
At December 31, 2008, we had foreign operating loss carryfor-
wards of approximately $1,009.2. The loss carryforwards
expiring between 2009 and 2023 are $115.1 and the loss carry-
forwards which do not expire are $894.1. We also had minimum
tax credit carryforwards of $32.5 which do not expire, capital
loss carryforwards of $7.1 that will expire in 2010, and foreign
tax credit carryforwards of $93.9 that will expire between 2016
and 2018.
Uncertain Tax PositionsEffective January 1, 2007, we adopted Financial Accounting
Standards Board (“FASB”) Interpretation No. 48, Accounting for
Uncertainty in Income Taxes – an interpretation of FASB State-
ment No. 109, (“FIN 48”). As a result of the implementation of
FIN 48, we recognized an $18.3 increase in the liability for
unrecognized tax benefits (including interest and penalties),
which was accounted for as a reduction to the January 1, 2007
balance of retained earnings. At December 31, 2008 and 2007,
we had $104.3 and $154.3 of total gross unrecognized tax
benefits, respectively, of which approximately $91 and $141
would impact the effective tax rate, if recognized.
A reconciliation of the beginning and ending amount of
unrecognized tax benefits is as follows:
Balance at January 1, 2007 $135.6
Additions based on tax positions related to the
current year 24.2
Additions for tax positions of prior years 5.4
Reductions for tax positions of prior years (3.6)
Reductions due to lapse of statute of limitations (2.9)
Reductions due to settlements with tax authorities (4.4)
Balance at December 31, 2007 154.3
Additions based on tax positions related to the
current year 22.2
Additions for tax positions of prior years 3.9
Reductions for tax positions of prior years (59.0)
Reductions due to lapse of statute of limitations (4.2)
Reductions due to settlements with tax authorities (12.9)
Balance at December 31, 2008 $104.3
We recognize interest and penalties accrued related to unrecog-
nized tax benefits in the provision for income taxes. We had
$22.5 and $29.7 accrued for interest and penalties, net of tax
benefit, at December 31, 2008 and 2007, respectively. During
2008 and 2007, we recorded a benefit of $3.2 and an expense
of $3.3 for interest and penalties, net of taxes, respectively.
We file income tax returns in the U.S. federal jurisdiction, and
various states and foreign jurisdictions. As of December 31, 2008,
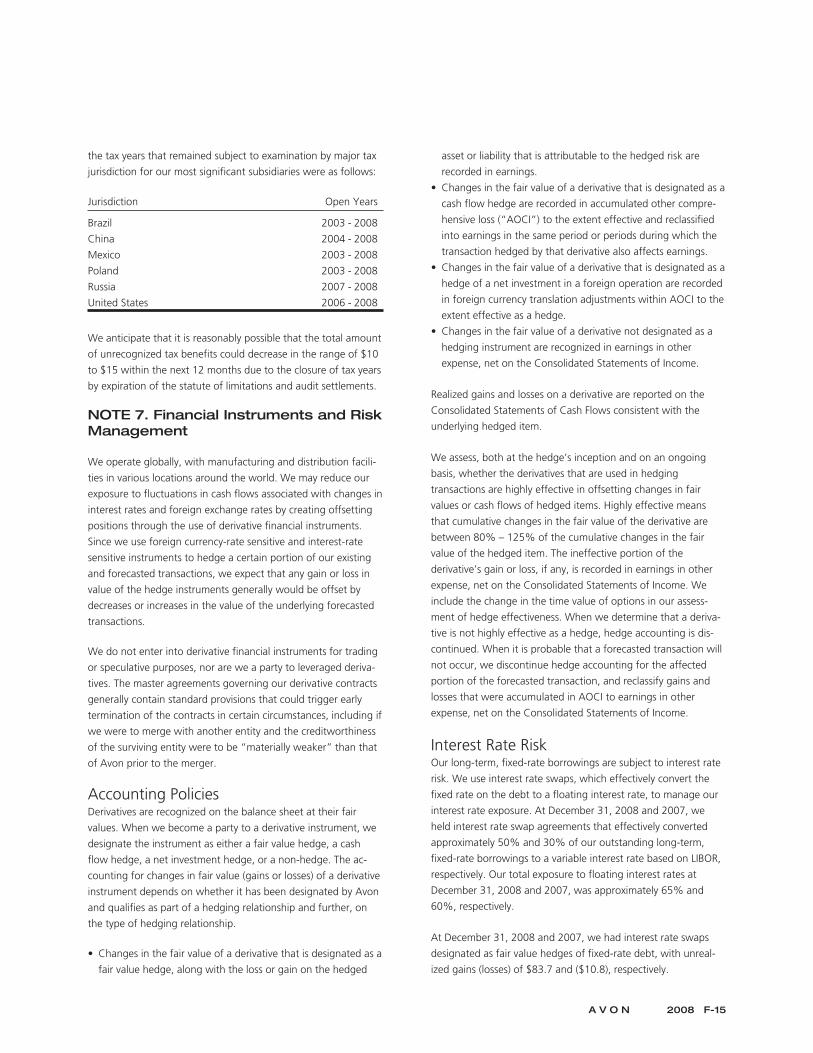
the tax years that remained subject to examination by major tax
jurisdiction for our most significant subsidiaries were as follows:
Jurisdiction Open Years
Brazil 2003 - 2008
China 2004 - 2008
Mexico 2003 - 2008
Poland 2003 - 2008
Russia 2007 - 2008
United States 2006 - 2008
We anticipate that it is reasonably possible that the total amount
of unrecognized tax benefits could decrease in the range of $10
to $15 within the next 12 months due to the closure of tax years
by expiration of the statute of limitations and audit settlements.
NOTE 7. Financial Instruments and RiskManagement
We operate globally, with manufacturing and distribution facili-
ties in various locations around the world. We may reduce our
exposure to fluctuations in cash flows associated with changes in
interest rates and foreign exchange rates by creating offsetting
positions through the use of derivative financial instruments.
Since we use foreign currency-rate sensitive and interest-rate
sensitive instruments to hedge a certain portion of our existing
and forecasted transactions, we expect that any gain or loss in
value of the hedge instruments generally would be offset by
decreases or increases in the value of the underlying forecasted
transactions.
We do not enter into derivative financial instruments for trading
or speculative purposes, nor are we a party to leveraged deriva-
tives. The master agreements governing our derivative contracts
generally contain standard provisions that could trigger early
termination of the contracts in certain circumstances, including if
we were to merge with another entity and the creditworthiness
of the surviving entity were to be “materially weaker” than that
of Avon prior to the merger.
Accounting PoliciesDerivatives are recognized on the balance sheet at their fair
values. When we become a party to a derivative instrument, we
designate the instrument as either a fair value hedge, a cash
flow hedge, a net investment hedge, or a non-hedge. The ac-
counting for changes in fair value (gains or losses) of a derivative
instrument depends on whether it has been designated by Avon
and qualifies as part of a hedging relationship and further, on
the type of hedging relationship.
• Changes in the fair value of a derivative that is designated as a
fair value hedge, along with the loss or gain on the hedged
asset or liability that is attributable to the hedged risk are
recorded in earnings.
• Changes in the fair value of a derivative that is designated as a
cash flow hedge are recorded in accumulated other compre-
hensive loss (“AOCI”) to the extent effective and reclassified
into earnings in the same period or periods during which the
transaction hedged by that derivative also affects earnings.
• Changes in the fair value of a derivative that is designated as a
hedge of a net investment in a foreign operation are recorded
in foreign currency translation adjustments within AOCI to the
extent effective as a hedge.
• Changes in the fair value of a derivative not designated as a
hedging instrument are recognized in earnings in other
expense, net on the Consolidated Statements of Income.
Realized gains and losses on a derivative are reported on the
Consolidated Statements of Cash Flows consistent with the
underlying hedged item.
We assess, both at the hedge’s inception and on an ongoing
basis, whether the derivatives that are used in hedging
transactions are highly effective in offsetting changes in fair
values or cash flows of hedged items. Highly effective means
that cumulative changes in the fair value of the derivative are
between 80% – 125% of the cumulative changes in the fair
value of the hedged item. The ineffective portion of the
derivative’s gain or loss, if any, is recorded in earnings in other
expense, net on the Consolidated Statements of Income. We
include the change in the time value of options in our assess-
ment of hedge effectiveness. When we determine that a deriva-
tive is not highly effective as a hedge, hedge accounting is dis-
continued. When it is probable that a forecasted transaction will
not occur, we discontinue hedge accounting for the affected
portion of the forecasted transaction, and reclassify gains and
losses that were accumulated in AOCI to earnings in other
expense, net on the Consolidated Statements of Income.
Interest Rate RiskOur long-term, fixed-rate borrowings are subject to interest rate
risk. We use interest rate swaps, which effectively convert the
fixed rate on the debt to a floating interest rate, to manage our
interest rate exposure. At December 31, 2008 and 2007, we
held interest rate swap agreements that effectively converted
approximately 50% and 30% of our outstanding long-term,
fixed-rate borrowings to a variable interest rate based on LIBOR,
respectively. Our total exposure to floating interest rates at
December 31, 2008 and 2007, was approximately 65% and
60%, respectively.
At December 31, 2008 and 2007, we had interest rate swaps
designated as fair value hedges of fixed-rate debt, with unreal-
ized gains (losses) of $83.7 and ($10.8), respectively.
A V O N 2008 F-15

NOTES TO CONSOLIDATED FINANCIAL STATEMENTS
Additionally, at December 31, 2008 and 2007, we had interest
rate swaps that were not designated as fair value hedges with
unrealized gains of $3.9 and $9.7, respectively. Long-term debt
at December 31, 2008 and 2007, respectively, included net
unrealized gains (losses) of $80.0 and ($9.4), respectively, on
interest rate swaps designated as fair value hedges. Long-term
debt at December 31, 2008 and 2007, also included remaining
un- amortized gains of $3.9 and $8.4, respectively, resulting
from terminated swap agreements and swap agreements no
longer designated as fair value hedges, which are being amor-
tized to interest expense over the remaining terms of the under-
lying debt. There was no hedge ineffectiveness for the years
ended December 31, 2008, 2007 and 2006, related to these
interest rate swaps.
During 2007, we entered into treasury lock agreements (the
“locks”) with notional amounts totaling $500.0 that expired on
January 31, 2008. On January 31, 2008, we extended the
maturity date of the locks to July 31, 2008 and the locks were
designated as cash flow hedges of the anticipated interest
payments on $250.0 principal amount of the 2013 Notes and
$250.0 principal amount of the 2018 Notes. The losses on the
locks of $38.0 were recorded in accumulated other compre-
hensive loss. $19.2 and $18.8 of the losses are being amortized
to interest expense over five years and ten years, respectively.
During 2005, we entered into treasury lock agreements that we
designated as cash flow hedges and used to hedge exposure to
a possible rise in interest rates prior to the anticipated issuance
of ten- and 30-year bonds. In December 2005, we decided that
a more appropriate strategy was to issue five-year bonds given
our strong cash flow and high level of cash and cash equivalents.
As a result of the change in strategy, in December 2005, we de-
designated the locks as hedges and reclassified the gain of $2.5
on the locks from AOCI to other expense, net. Upon the change
in strategy in December 2005, we entered into a treasury lock
agreement with a notional amount of $250.0 designated as a
cash flow hedge of the $500.0 principal amount of five-year
notes payable issued in January 2006. The loss on the 2005 lock
agreement of $1.9 was recorded in AOCI and is being amortized
to interest expense over five years.
During 2003, we entered into treasury lock agreements that we
designated as cash flow hedges and used to hedge the exposure
to the possible rise in interest rates prior to the issuance of the
4.625% Notes. The loss of $2.6 was recorded in AOCI and is
being amortized to interest expense over ten years.
At December 31, 2008 and 2007, AOCI includes remaining
unamortized losses of $35.2 and $27.9 ($22.9 and $18.1 net of
taxes), respectively, resulting from treasury lock agreements.
Foreign Currency RiskThe primary currencies for which we have net underlying foreign
currency exchange rate exposures are the Argentine peso,
Brazilian real, British pound, Canadian dollar, Chinese renminbi,
Colombian peso, the Euro, Japanese yen, Mexican peso,
Philippine peso, Polish zloty, Russian ruble, Turkish lira, Ukrainian
hryvna and Venezuelan bolivar. We use foreign currency forward
contracts and options to hedge portions of our forecasted
foreign currency cash flows resulting from intercompany
royalties, and other third-party and intercompany foreign cur-
rency transactions where there is a high probability that antici-
pated exposures will materialize. These contracts have been
designated as cash flow hedges.
For the years ended December 31, 2008, 2007 and 2006, the
ineffective portion of our cash flow foreign currency derivative
instruments and the net gains or losses reclassified from AOCI to
earnings for cash flow hedges that had been discontinued be-
cause the forecasted transactions were not probable of occurring
were not material.
At December 31, 2008, the maximum remaining term over
which we were hedging foreign exchange exposures to the
variability of cash flows for all forecasted transactions was 12
months. As of December 31, 2008, we expect to reclassify
$27.2, net of taxes, of net losses on derivative instruments
designated as cash flow hedges from AOCI to earnings during
the next 12 months due to (a) foreign currency denominated
intercompany royalties, (b) intercompany loan settlements and
(c) foreign currency denominated purchases or receipts.
For the years ended December 31, 2008 and 2007, cash flow
hedges impacted AOCI as follows:
2008 2007
Net derivative losses at beginning of year $(17.7) $ (.3)
Net gains on derivative instruments,
net of taxes of $8.4 and $12.2 20.3 16.8
Reclassification of net gains to earnings,
net of taxes of $3.3 and $2.7 (29.8) (34.2)
Net derivative losses at end of year, net of
taxes of $14.8 and $9.7 $(27.2) $(17.7)
Certain forward contracts used to manage foreign currency
exposure of intercompany loans are not designated as hedges. In
these cases, the change in value of the contracts is designed to
offset the foreign currency impact of the underlying exposure.
The change in fair value of these instruments is immediately
recognized in earnings.
We use foreign currency forward contracts and foreign currency-
denominated debt to hedge the foreign currency exposure
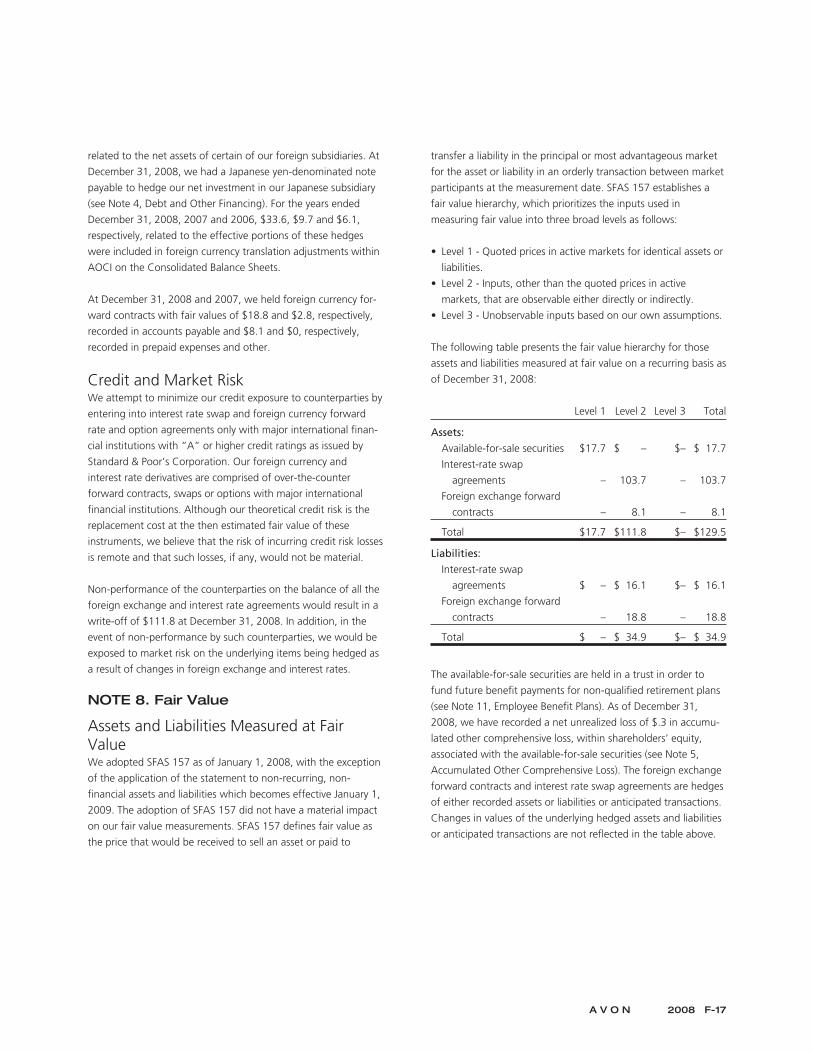
related to the net assets of certain of our foreign subsidiaries. At
December 31, 2008, we had a Japanese yen-denominated note
payable to hedge our net investment in our Japanese subsidiary
(see Note 4, Debt and Other Financing). For the years ended
December 31, 2008, 2007 and 2006, $33.6, $9.7 and $6.1,
respectively, related to the effective portions of these hedges
were included in foreign currency translation adjustments within
AOCI on the Consolidated Balance Sheets.
At December 31, 2008 and 2007, we held foreign currency for-
ward contracts with fair values of $18.8 and $2.8, respectively,
recorded in accounts payable and $8.1 and $0, respectively,
recorded in prepaid expenses and other.
Credit and Market RiskWe attempt to minimize our credit exposure to counterparties by
entering into interest rate swap and foreign currency forward
rate and option agreements only with major international finan-
cial institutions with “A” or higher credit ratings as issued by
Standard & Poor’s Corporation. Our foreign currency and
interest rate derivatives are comprised of over-the-counter
forward contracts, swaps or options with major international
financial institutions. Although our theoretical credit risk is the
replacement cost at the then estimated fair value of these
instruments, we believe that the risk of incurring credit risk losses
is remote and that such losses, if any, would not be material.
Non-performance of the counterparties on the balance of all the
foreign exchange and interest rate agreements would result in a
write-off of $111.8 at December 31, 2008. In addition, in the
event of non-performance by such counterparties, we would be
exposed to market risk on the underlying items being hedged as
a result of changes in foreign exchange and interest rates.
NOTE 8. Fair Value
Assets and Liabilities Measured at FairValueWe adopted SFAS 157 as of January 1, 2008, with the exception
of the application of the statement to non-recurring, non-
financial assets and liabilities which becomes effective January 1,
2009. The adoption of SFAS 157 did not have a material impact
on our fair value measurements. SFAS 157 defines fair value as
the price that would be received to sell an asset or paid to
transfer a liability in the principal or most advantageous market
for the asset or liability in an orderly transaction between market
participants at the measurement date. SFAS 157 establishes a
fair value hierarchy, which prioritizes the inputs used in
measuring fair value into three broad levels as follows:
• Level 1 - Quoted prices in active markets for identical assets or
liabilities.
• Level 2 - Inputs, other than the quoted prices in active
markets, that are observable either directly or indirectly.
• Level 3 - Unobservable inputs based on our own assumptions.
The following table presents the fair value hierarchy for those
assets and liabilities measured at fair value on a recurring basis as
of December 31, 2008:
Level 1 Level 2 Level 3 Total
Assets:
Available-for-sale securities $17.7 $ – $– $ 17.7
Interest-rate swap
agreements – 103.7 – 103.7
Foreign exchange forward
contracts – 8.1 – 8.1
Total $17.7 $111.8 $– $129.5
Liabilities:
Interest-rate swap
agreements $ – $ 16.1 $– $ 16.1
Foreign exchange forward
contracts – 18.8 – 18.8
Total $ – $ 34.9 $– $ 34.9
The available-for-sale securities are held in a trust in order to
fund future benefit payments for non-qualified retirement plans
(see Note 11, Employee Benefit Plans). As of December 31,
2008, we have recorded a net unrealized loss of $.3 in accumu-
lated other comprehensive loss, within shareholders’ equity,
associated with the available-for-sale securities (see Note 5,
Accumulated Other Comprehensive Loss). The foreign exchange
forward contracts and interest rate swap agreements are hedges
of either recorded assets or liabilities or anticipated transactions.
Changes in values of the underlying hedged assets and liabilities
or anticipated transactions are not reflected in the table above.
A V O N 2008 F-17
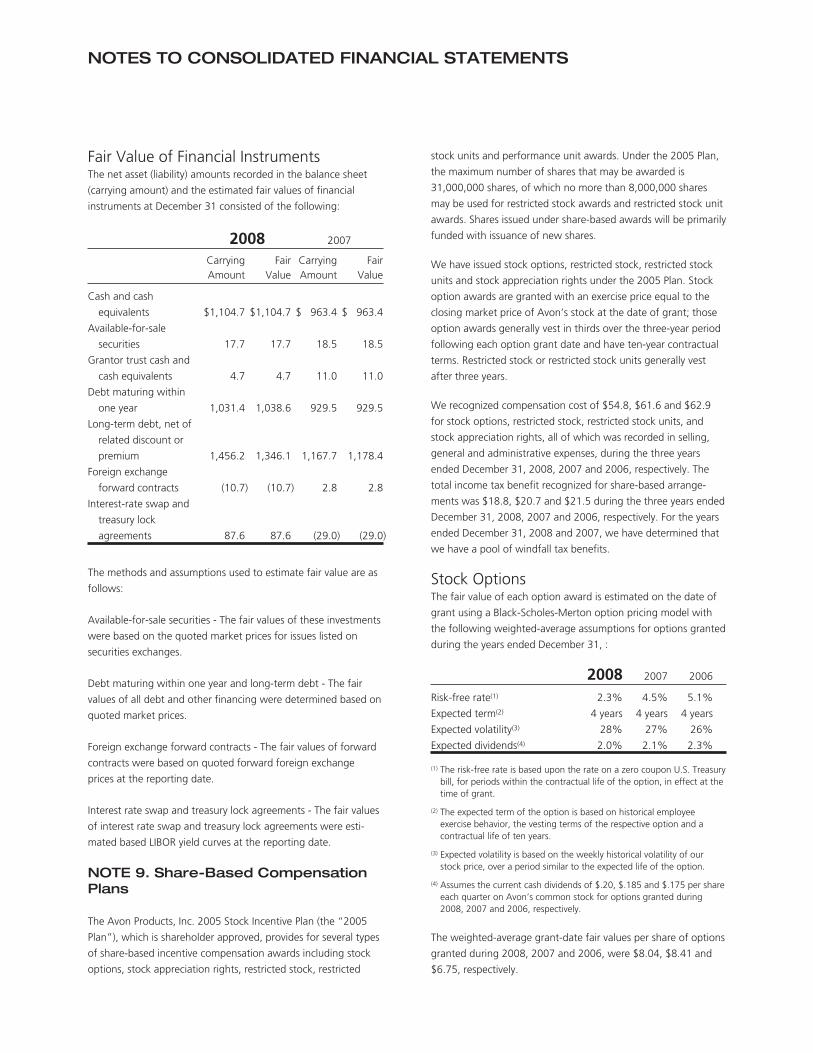
NOTES TO CONSOLIDATED FINANCIAL STATEMENTS
Fair Value of Financial InstrumentsThe net asset (liability) amounts recorded in the balance sheet
(carrying amount) and the estimated fair values of financial
instruments at December 31 consisted of the following:
2008 2007
CarryingAmount
FairValue
CarryingAmount
FairValue
Cash and cash
equivalents $1,104.7 $1,104.7 $ 963.4 $ 963.4
Available-for-sale
securities 17.7 17.7 18.5 18.5
Grantor trust cash and
cash equivalents 4.7 4.7 11.0 11.0
Debt maturing within
one year 1,031.4 1,038.6 929.5 929.5
Long-term debt, net of
related discount or
premium 1,456.2 1,346.1 1,167.7 1,178.4
Foreign exchange
forward contracts (10.7) (10.7) 2.8 2.8
Interest-rate swap and
treasury lock
agreements 87.6 87.6 (29.0) (29.0)
The methods and assumptions used to estimate fair value are as
follows:
Available-for-sale securities - The fair values of these investments
were based on the quoted market prices for issues listed on
securities exchanges.
Debt maturing within one year and long-term debt - The fair
values of all debt and other financing were determined based on
quoted market prices.
Foreign exchange forward contracts - The fair values of forward
contracts were based on quoted forward foreign exchange
prices at the reporting date.
Interest rate swap and treasury lock agreements - The fair values
of interest rate swap and treasury lock agreements were esti-
mated based LIBOR yield curves at the reporting date.
NOTE 9. Share-Based CompensationPlans
The Avon Products, Inc. 2005 Stock Incentive Plan (the “2005
Plan”), which is shareholder approved, provides for several types
of share-based incentive compensation awards including stock
options, stock appreciation rights, restricted stock, restricted
stock units and performance unit awards. Under the 2005 Plan,
the maximum number of shares that may be awarded is
31,000,000 shares, of which no more than 8,000,000 shares
may be used for restricted stock awards and restricted stock unit
awards. Shares issued under share-based awards will be primarily
funded with issuance of new shares.
We have issued stock options, restricted stock, restricted stock
units and stock appreciation rights under the 2005 Plan. Stock
option awards are granted with an exercise price equal to the
closing market price of Avon’s stock at the date of grant; those
option awards generally vest in thirds over the three-year period
following each option grant date and have ten-year contractual
terms. Restricted stock or restricted stock units generally vest
after three years.
We recognized compensation cost of $54.8, $61.6 and $62.9
for stock options, restricted stock, restricted stock units, and
stock appreciation rights, all of which was recorded in selling,
general and administrative expenses, during the three years
ended December 31, 2008, 2007 and 2006, respectively. The
total income tax benefit recognized for share-based arrange-
ments was $18.8, $20.7 and $21.5 during the three years ended
December 31, 2008, 2007 and 2006, respectively. For the years
ended December 31, 2008 and 2007, we have determined that
we have a pool of windfall tax benefits.
Stock OptionsThe fair value of each option award is estimated on the date of
grant using a Black-Scholes-Merton option pricing model with
the following weighted-average assumptions for options granted
during the years ended December 31, :
2008 2007 2006
Risk-free rate(1) 2.3% 4.5% 5.1%
Expected term(2) 4 years 4 years 4 years
Expected volatility(3) 28% 27% 26%
Expected dividends(4) 2.0% 2.1% 2.3%
(1) The risk-free rate is based upon the rate on a zero coupon U.S. Treasurybill, for periods within the contractual life of the option, in effect at thetime of grant.
(2) The expected term of the option is based on historical employeeexercise behavior, the vesting terms of the respective option and acontractual life of ten years.
(3) Expected volatility is based on the weekly historical volatility of ourstock price, over a period similar to the expected life of the option.
(4) Assumes the current cash dividends of $.20, $.185 and $.175 per shareeach quarter on Avon’s common stock for options granted during2008, 2007 and 2006, respectively.
The weighted-average grant-date fair values per share of options
granted during 2008, 2007 and 2006, were $8.04, $8.41 and
$6.75, respectively.
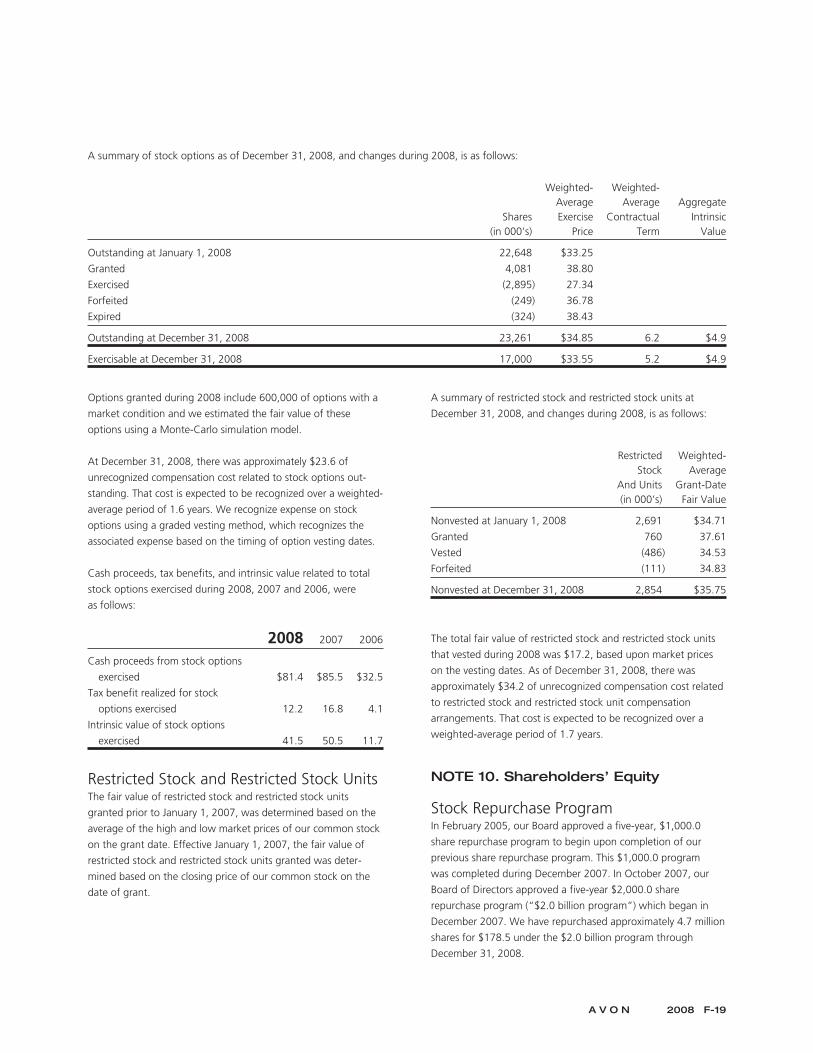
A summary of stock options as of December 31, 2008, and changes during 2008, is as follows:
Shares(in 000’s)
Weighted-AverageExercise
Price
Weighted-Average
ContractualTerm
AggregateIntrinsic
Value
Outstanding at January 1, 2008 22,648 $33.25
Granted 4,081 38.80
Exercised (2,895) 27.34
Forfeited (249) 36.78
Expired (324) 38.43
Outstanding at December 31, 2008 23,261 $34.85 6.2 $4.9
Exercisable at December 31, 2008 17,000 $33.55 5.2 $4.9
Options granted during 2008 include 600,000 of options with a
market condition and we estimated the fair value of these
options using a Monte-Carlo simulation model.
At December 31, 2008, there was approximately $23.6 of
unrecognized compensation cost related to stock options out-
standing. That cost is expected to be recognized over a weighted-
average period of 1.6 years. We recognize expense on stock
options using a graded vesting method, which recognizes the
associated expense based on the timing of option vesting dates.
Cash proceeds, tax benefits, and intrinsic value related to total
stock options exercised during 2008, 2007 and 2006, were
as follows:
2008 2007 2006
Cash proceeds from stock options
exercised $81.4 $85.5 $32.5
Tax benefit realized for stock
options exercised 12.2 16.8 4.1
Intrinsic value of stock options
exercised 41.5 50.5 11.7
Restricted Stock and Restricted Stock UnitsThe fair value of restricted stock and restricted stock units
granted prior to January 1, 2007, was determined based on the
average of the high and low market prices of our common stock
on the grant date. Effective January 1, 2007, the fair value of
restricted stock and restricted stock units granted was deter-
mined based on the closing price of our common stock on the
date of grant.
A summary of restricted stock and restricted stock units at
December 31, 2008, and changes during 2008, is as follows:
RestrictedStock
And Units(in 000’s)
Weighted-Average
Grant-DateFair Value
Nonvested at January 1, 2008 2,691 $34.71
Granted 760 37.61
Vested (486) 34.53
Forfeited (111) 34.83
Nonvested at December 31, 2008 2,854 $35.75
The total fair value of restricted stock and restricted stock units
that vested during 2008 was $17.2, based upon market prices
on the vesting dates. As of December 31, 2008, there was
approximately $34.2 of unrecognized compensation cost related
to restricted stock and restricted stock unit compensation
arrangements. That cost is expected to be recognized over a
weighted-average period of 1.7 years.
NOTE 10. Shareholders’ Equity
Stock Repurchase ProgramIn February 2005, our Board approved a five-year, $1,000.0
share repurchase program to begin upon completion of our
previous share repurchase program. This $1,000.0 program
was completed during December 2007. In October 2007, our
Board of Directors approved a five-year $2,000.0 share
repurchase program (“$2.0 billion program”) which began in
December 2007. We have repurchased approximately 4.7 million
shares for $178.5 under the $2.0 billion program through
December 31, 2008.
A V O N 2008 F-19
NOTES TO CONSOLIDATED FINANCIAL STATEMENTS
NOTE 11. Employee Benefit Plans
Savings PlanWe offer a qualified defined contribution plan for U.S.-based
employees, the Avon Personal Savings Account Plan (the “PSA”),
which allows eligible participants to contribute up to 25% of
eligible compensation through payroll deductions. We match
employee contributions dollar for dollar up to the first 3% of
eligible compensation and fifty cents for each dollar contributed
from 4% to 6% of eligible compensation. In 2008, 2007, and
2006, matching contributions approximating $13.0, $12.8 and
$12.7, respectively, were made to the PSA in cash, which were
then used by the PSA to purchase Avon shares in the open
market.
Defined Benefit Pension andPostretirement PlansAvon and certain subsidiaries have contributory and non-
contributory retirement plans for substantially all employees of
those subsidiaries. Benefits under these plans are generally based
on an employee’s years of service and average compensation
near retirement. Plans are funded based on legal requirements
and cash flow.
We provide health care and life insurance benefits for the
majority of employees who retire under our retirement plans in
the U.S. and certain foreign countries. In the U.S., the cost of
such health care benefits is shared by us and our retirees for
employees hired on or before January 1, 2005. Employees hired
after January 1, 2005, will pay the full cost of the health care
benefits upon retirement.
In September 2006, the FASB issued SFAS No. 158, Employers’
Accounting for Defined Benefit Pension and Other Postretire-
ment Plans - an amendment of FASB Statements No. 87, 88, 106
and 132R (“SFAS 158”). SFAS 158 requires, among other things,
the recognition of the funded status of pension and other post-
retirement benefit plans on the balance sheet. Each overfunded
plan is recognized as an asset and each underfunded plan is
recognized as a liability. The initial impact of the standard, due
to unrecognized prior service costs or credits and net actuarial
gains or losses, as well as subsequent changes in the funded
status, were recognized as components of accumulated compre-
hensive loss in shareholders’ equity. Additional minimum pen-
sion liabilities and related intangible assets were also derecog-
nized upon adoption of the new standard. The adoption of SFAS
158 resulted in a decrease to accumulated other comprehensive
loss of $254.7 after taxes at December 31, 2006. The adoption
of SFAS 158 had no impact on our Consolidated Statement of
Income for the year ended December 31, 2006. SFAS 158’s
provisions regarding the change in the measurement date of
defined benefit and other postretirement plans had no impact as
we were already using a measurement date of December 31 for
our pension plans.
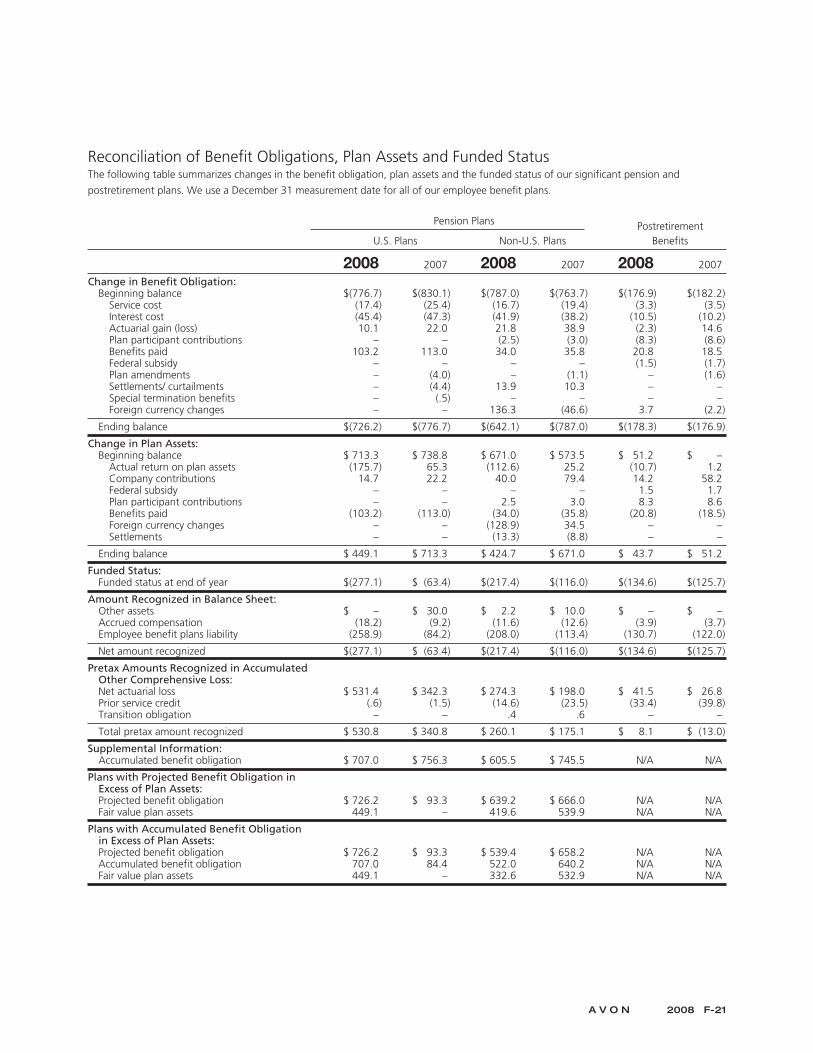
Reconciliation of Benefit Obligations, Plan Assets and Funded StatusThe following table summarizes changes in the benefit obligation, plan assets and the funded status of our significant pension and
postretirement plans. We use a December 31 measurement date for all of our employee benefit plans.
Pension Plans PostretirementBenefitsU.S. Plans Non-U.S. Plans
2008 2007 2008 2007 2008 2007
Change in Benefit Obligation:Beginning balance $(776.7) $(830.1) $(787.0) $(763.7) $(176.9) $(182.2)
Service cost (17.4) (25.4) (16.7) (19.4) (3.3) (3.5)Interest cost (45.4) (47.3) (41.9) (38.2) (10.5) (10.2)Actuarial gain (loss) 10.1 22.0 21.8 38.9 (2.3) 14.6Plan participant contributions – – (2.5) (3.0) (8.3) (8.6)Benefits paid 103.2 113.0 34.0 35.8 20.8 18.5Federal subsidy – – – – (1.5) (1.7)Plan amendments – (4.0) – (1.1) – (1.6)Settlements/ curtailments – (4.4) 13.9 10.3 – –Special termination benefits – (.5) – – – –Foreign currency changes – – 136.3 (46.6) 3.7 (2.2)
Ending balance $(726.2) $(776.7) $(642.1) $(787.0) $(178.3) $(176.9)
Change in Plan Assets:Beginning balance $ 713.3 $ 738.8 $ 671.0 $ 573.5 $ 51.2 $ –
Actual return on plan assets (175.7) 65.3 (112.6) 25.2 (10.7) 1.2Company contributions 14.7 22.2 40.0 79.4 14.2 58.2Federal subsidy – – – – 1.5 1.7Plan participant contributions – – 2.5 3.0 8.3 8.6Benefits paid (103.2) (113.0) (34.0) (35.8) (20.8) (18.5)Foreign currency changes – – (128.9) 34.5 – –Settlements – – (13.3) (8.8) – –
Ending balance $ 449.1 $ 713.3 $ 424.7 $ 671.0 $ 43.7 $ 51.2
Funded Status:Funded status at end of year $(277.1) $ (63.4) $(217.4) $(116.0) $(134.6) $(125.7)
Amount Recognized in Balance Sheet:Other assets $ – $ 30.0 $ 2.2 $ 10.0 $ – $ –Accrued compensation (18.2) (9.2) (11.6) (12.6) (3.9) (3.7)Employee benefit plans liability (258.9) (84.2) (208.0) (113.4) (130.7) (122.0)
Net amount recognized $(277.1) $ (63.4) $(217.4) $(116.0) $(134.6) $(125.7)
Pretax Amounts Recognized in AccumulatedOther Comprehensive Loss:Net actuarial loss $ 531.4 $ 342.3 $ 274.3 $ 198.0 $ 41.5 $ 26.8Prior service credit (.6) (1.5) (14.6) (23.5) (33.4) (39.8)Transition obligation – – .4 .6 – –
Total pretax amount recognized $ 530.8 $ 340.8 $ 260.1 $ 175.1 $ 8.1 $ (13.0)
Supplemental Information:Accumulated benefit obligation $ 707.0 $ 756.3 $ 605.5 $ 745.5 N/A N/A
Plans with Projected Benefit Obligation inExcess of Plan Assets:Projected benefit obligation $ 726.2 $ 93.3 $ 639.2 $ 666.0 N/A N/AFair value plan assets 449.1 – 419.6 539.9 N/A N/A
Plans with Accumulated Benefit Obligationin Excess of Plan Assets:Projected benefit obligation $ 726.2 $ 93.3 $ 539.4 $ 658.2 N/A N/AAccumulated benefit obligation 707.0 84.4 522.0 640.2 N/A N/AFair value plan assets 449.1 – 332.6 532.9 N/A N/A
A V O N 2008 F-21
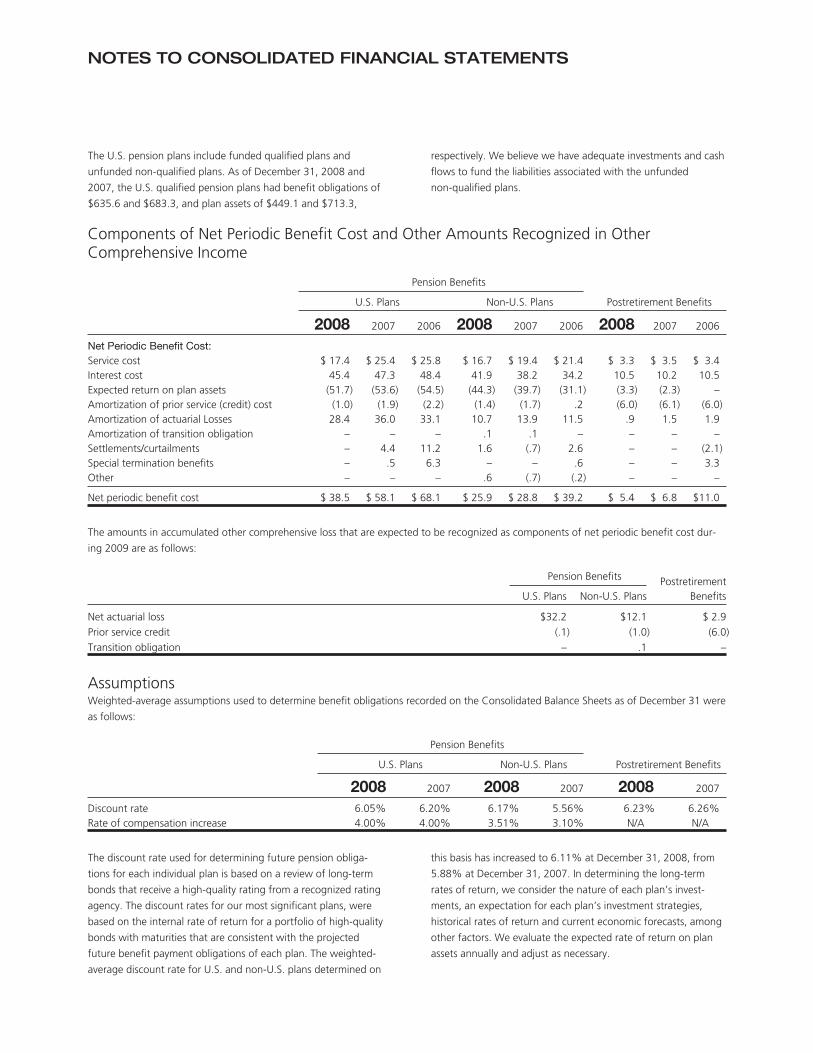
NOTES TO CONSOLIDATED FINANCIAL STATEMENTS
The U.S. pension plans include funded qualified plans and
unfunded non-qualified plans. As of December 31, 2008 and
2007, the U.S. qualified pension plans had benefit obligations of
$635.6 and $683.3, and plan assets of $449.1 and $713.3,
respectively. We believe we have adequate investments and cash
flows to fund the liabilities associated with the unfunded
non-qualified plans.
Components of Net Periodic Benefit Cost and Other Amounts Recognized in OtherComprehensive Income
Pension Benefits
Postretirement BenefitsU.S. Plans Non-U.S. Plans
2008 2007 2006 2008 2007 2006 2008 2007 2006
Net Periodic Benefit Cost:
Service cost $ 17.4 $ 25.4 $ 25.8 $ 16.7 $ 19.4 $ 21.4 $ 3.3 $ 3.5 $ 3.4Interest cost 45.4 47.3 48.4 41.9 38.2 34.2 10.5 10.2 10.5Expected return on plan assets (51.7) (53.6) (54.5) (44.3) (39.7) (31.1) (3.3) (2.3) –Amortization of prior service (credit) cost (1.0) (1.9) (2.2) (1.4) (1.7) .2 (6.0) (6.1) (6.0)Amortization of actuarial Losses 28.4 36.0 33.1 10.7 13.9 11.5 .9 1.5 1.9Amortization of transition obligation – – – .1 .1 – – – –Settlements/curtailments – 4.4 11.2 1.6 (.7) 2.6 – – (2.1)Special termination benefits – .5 6.3 – – .6 – – 3.3Other – – – .6 (.7) (.2) – – –
Net periodic benefit cost $ 38.5 $ 58.1 $ 68.1 $ 25.9 $ 28.8 $ 39.2 $ 5.4 $ 6.8 $11.0
The amounts in accumulated other comprehensive loss that are expected to be recognized as components of net periodic benefit cost dur-
ing 2009 are as follows:
Pension Benefits PostretirementBenefitsU.S. Plans Non-U.S. Plans
Net actuarial loss $32.2 $12.1 $ 2.9Prior service credit (.1) (1.0) (6.0)Transition obligation – .1 –
AssumptionsWeighted-average assumptions used to determine benefit obligations recorded on the Consolidated Balance Sheets as of December 31 were
as follows:
Pension Benefits
U.S. Plans Non-U.S. Plans Postretirement Benefits
2008 2007 2008 2007 2008 2007
Discount rate 6.05% 6.20% 6.17% 5.56% 6.23% 6.26%Rate of compensation increase 4.00% 4.00% 3.51% 3.10% N/A N/A
The discount rate used for determining future pension obliga-
tions for each individual plan is based on a review of long-term
bonds that receive a high-quality rating from a recognized rating
agency. The discount rates for our most significant plans, were
based on the internal rate of return for a portfolio of high-quality
bonds with maturities that are consistent with the projected
future benefit payment obligations of each plan. The weighted-
average discount rate for U.S. and non-U.S. plans determined on
this basis has increased to 6.11% at December 31, 2008, from
5.88% at December 31, 2007. In determining the long-term
rates of return, we consider the nature of each plan’s invest-
ments, an expectation for each plan’s investment strategies,
historical rates of return and current economic forecasts, among
other factors. We evaluate the expected rate of return on plan
assets annually and adjust as necessary.
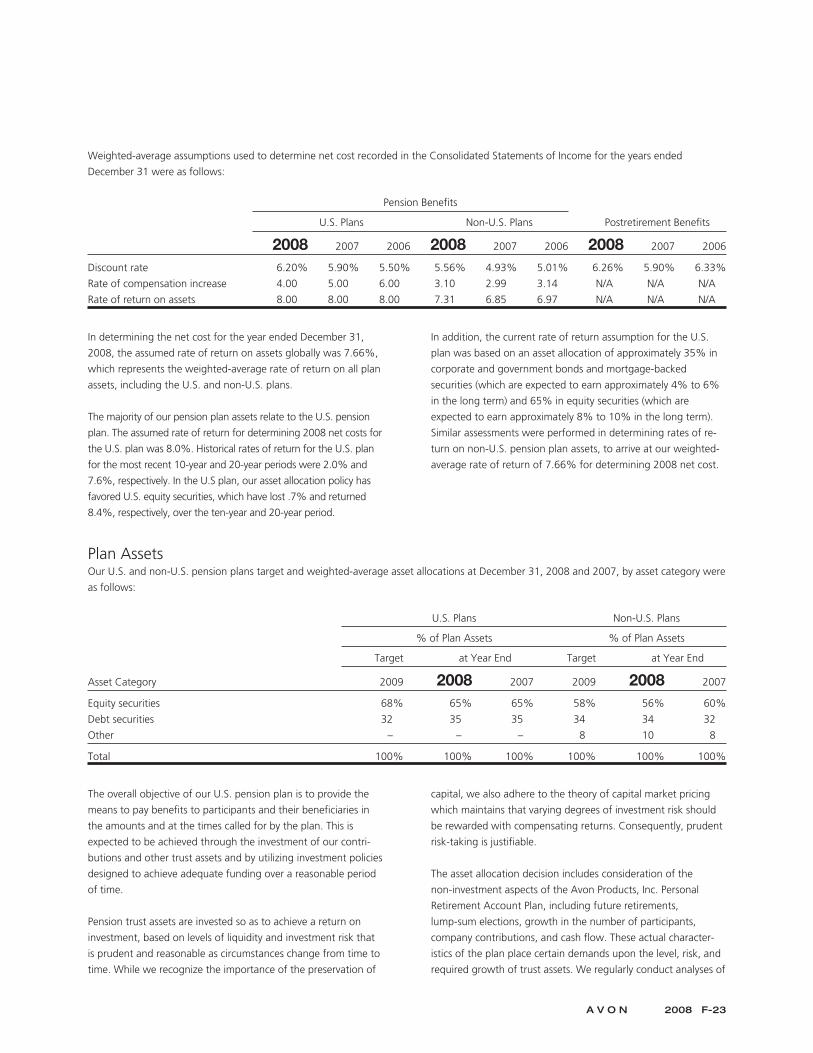
Weighted-average assumptions used to determine net cost recorded in the Consolidated Statements of Income for the years ended
December 31 were as follows:
Pension Benefits
U.S. Plans Non-U.S. Plans Postretirement Benefits
2008 2007 2006 2008 2007 2006 2008 2007 2006
Discount rate 6.20% 5.90% 5.50% 5.56% 4.93% 5.01% 6.26% 5.90% 6.33%
Rate of compensation increase 4.00 5.00 6.00 3.10 2.99 3.14 N/A N/A N/A
Rate of return on assets 8.00 8.00 8.00 7.31 6.85 6.97 N/A N/A N/A
In determining the net cost for the year ended December 31,
2008, the assumed rate of return on assets globally was 7.66%,
which represents the weighted-average rate of return on all plan
assets, including the U.S. and non-U.S. plans.
The majority of our pension plan assets relate to the U.S. pension
plan. The assumed rate of return for determining 2008 net costs for
the U.S. plan was 8.0%. Historical rates of return for the U.S. plan
for the most recent 10-year and 20-year periods were 2.0% and
7.6%, respectively. In the U.S plan, our asset allocation policy has
favored U.S. equity securities, which have lost .7% and returned
8.4%, respectively, over the ten-year and 20-year period.
In addition, the current rate of return assumption for the U.S.
plan was based on an asset allocation of approximately 35% in
corporate and government bonds and mortgage-backed
securities (which are expected to earn approximately 4% to 6%
in the long term) and 65% in equity securities (which are
expected to earn approximately 8% to 10% in the long term).
Similar assessments were performed in determining rates of re-
turn on non-U.S. pension plan assets, to arrive at our weighted-
average rate of return of 7.66% for determining 2008 net cost.
Plan AssetsOur U.S. and non-U.S. pension plans target and weighted-average asset allocations at December 31, 2008 and 2007, by asset category were
as follows:
U.S. Plans Non-U.S. Plans
% of Plan Assets % of Plan Assets
Target at Year End Target at Year End
Asset Category 2009 2008 2007 2009 2008 2007
Equity securities 68% 65% 65% 58% 56% 60%
Debt securities 32 35 35 34 34 32
Other – – – 8 10 8
Total 100% 100% 100% 100% 100% 100%
The overall objective of our U.S. pension plan is to provide the
means to pay benefits to participants and their beneficiaries in
the amounts and at the times called for by the plan. This is
expected to be achieved through the investment of our contri-
butions and other trust assets and by utilizing investment policies
designed to achieve adequate funding over a reasonable period
of time.
Pension trust assets are invested so as to achieve a return on
investment, based on levels of liquidity and investment risk that
is prudent and reasonable as circumstances change from time to
time. While we recognize the importance of the preservation of
capital, we also adhere to the theory of capital market pricing
which maintains that varying degrees of investment risk should
be rewarded with compensating returns. Consequently, prudent
risk-taking is justifiable.
The asset allocation decision includes consideration of the
non-investment aspects of the Avon Products, Inc. Personal
Retirement Account Plan, including future retirements,
lump-sum elections, growth in the number of participants,
company contributions, and cash flow. These actual character-
istics of the plan place certain demands upon the level, risk, and
required growth of trust assets. We regularly conduct analyses of
A V O N 2008 F-23
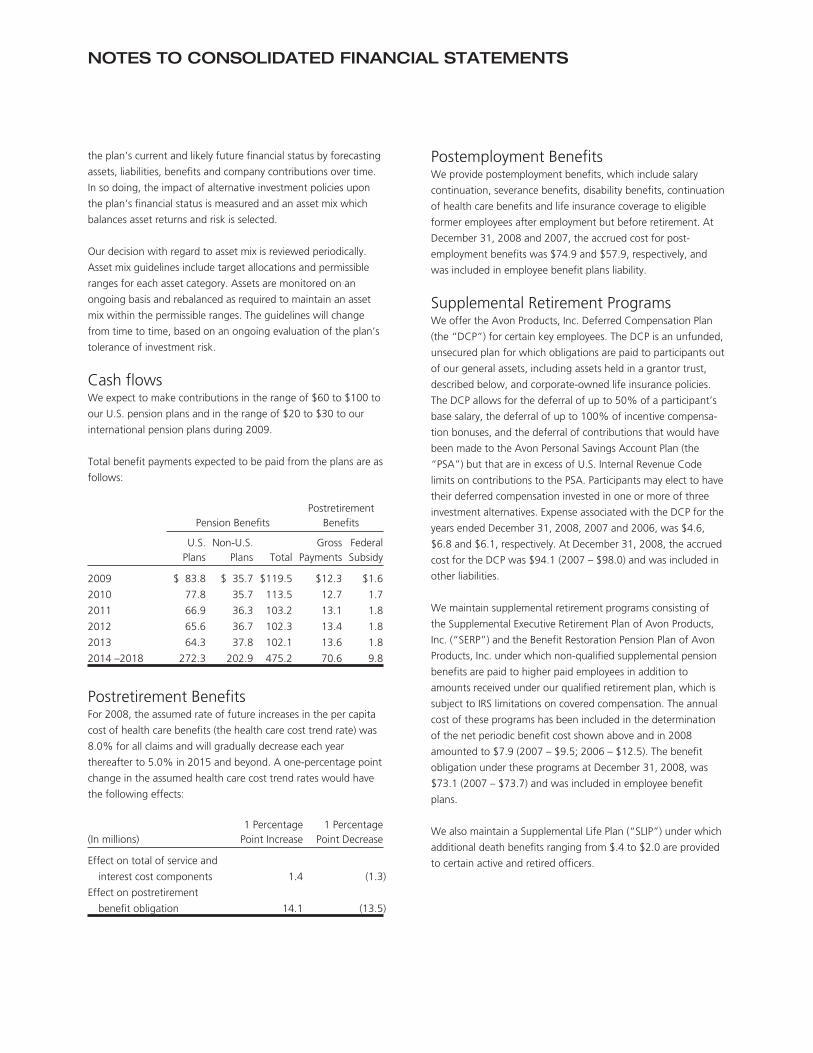
NOTES TO CONSOLIDATED FINANCIAL STATEMENTS
the plan’s current and likely future financial status by forecasting
assets, liabilities, benefits and company contributions over time.
In so doing, the impact of alternative investment policies upon
the plan’s financial status is measured and an asset mix which
balances asset returns and risk is selected.
Our decision with regard to asset mix is reviewed periodically.
Asset mix guidelines include target allocations and permissible
ranges for each asset category. Assets are monitored on an
ongoing basis and rebalanced as required to maintain an asset
mix within the permissible ranges. The guidelines will change
from time to time, based on an ongoing evaluation of the plan’s
tolerance of investment risk.
Cash flowsWe expect to make contributions in the range of $60 to $100 to
our U.S. pension plans and in the range of $20 to $30 to our
international pension plans during 2009.
Total benefit payments expected to be paid from the plans are as
follows:
Pension BenefitsPostretirement
Benefits
U.S.Plans
Non-U.S.Plans Total
GrossPayments
FederalSubsidy
2009 $ 83.8 $ 35.7 $119.5 $12.3 $1.6
2010 77.8 35.7 113.5 12.7 1.7
2011 66.9 36.3 103.2 13.1 1.8
2012 65.6 36.7 102.3 13.4 1.8
2013 64.3 37.8 102.1 13.6 1.8
2014 –2018 272.3 202.9 475.2 70.6 9.8
Postretirement BenefitsFor 2008, the assumed rate of future increases in the per capita
cost of health care benefits (the health care cost trend rate) was
8.0% for all claims and will gradually decrease each year
thereafter to 5.0% in 2015 and beyond. A one-percentage point
change in the assumed health care cost trend rates would have
the following effects:
(In millions)1 Percentage
Point Increase1 Percentage
Point Decrease
Effect on total of service and
interest cost components 1.4 (1.3)
Effect on postretirement
benefit obligation 14.1 (13.5)
Postemployment BenefitsWe provide postemployment benefits, which include salary
continuation, severance benefits, disability benefits, continuation
of health care benefits and life insurance coverage to eligible
former employees after employment but before retirement. At
December 31, 2008 and 2007, the accrued cost for post-
employment benefits was $74.9 and $57.9, respectively, and
was included in employee benefit plans liability.
Supplemental Retirement ProgramsWe offer the Avon Products, Inc. Deferred Compensation Plan
(the “DCP”) for certain key employees. The DCP is an unfunded,
unsecured plan for which obligations are paid to participants out
of our general assets, including assets held in a grantor trust,
described below, and corporate-owned life insurance policies.
The DCP allows for the deferral of up to 50% of a participant’s
base salary, the deferral of up to 100% of incentive compensa-
tion bonuses, and the deferral of contributions that would have
been made to the Avon Personal Savings Account Plan (the
“PSA”) but that are in excess of U.S. Internal Revenue Code
limits on contributions to the PSA. Participants may elect to have
their deferred compensation invested in one or more of three
investment alternatives. Expense associated with the DCP for the
years ended December 31, 2008, 2007 and 2006, was $4.6,
$6.8 and $6.1, respectively. At December 31, 2008, the accrued
cost for the DCP was $94.1 (2007 – $98.0) and was included in
other liabilities.
We maintain supplemental retirement programs consisting of
the Supplemental Executive Retirement Plan of Avon Products,
Inc. (“SERP”) and the Benefit Restoration Pension Plan of Avon
Products, Inc. under which non-qualified supplemental pension
benefits are paid to higher paid employees in addition to
amounts received under our qualified retirement plan, which is
subject to IRS limitations on covered compensation. The annual
cost of these programs has been included in the determination
of the net periodic benefit cost shown above and in 2008
amounted to $7.9 (2007 – $9.5; 2006 – $12.5). The benefit
obligation under these programs at December 31, 2008, was
$73.1 (2007 – $73.7) and was included in employee benefit
plans.
We also maintain a Supplemental Life Plan (“SLIP”) under which
additional death benefits ranging from $.4 to $2.0 are provided
to certain active and retired officers.
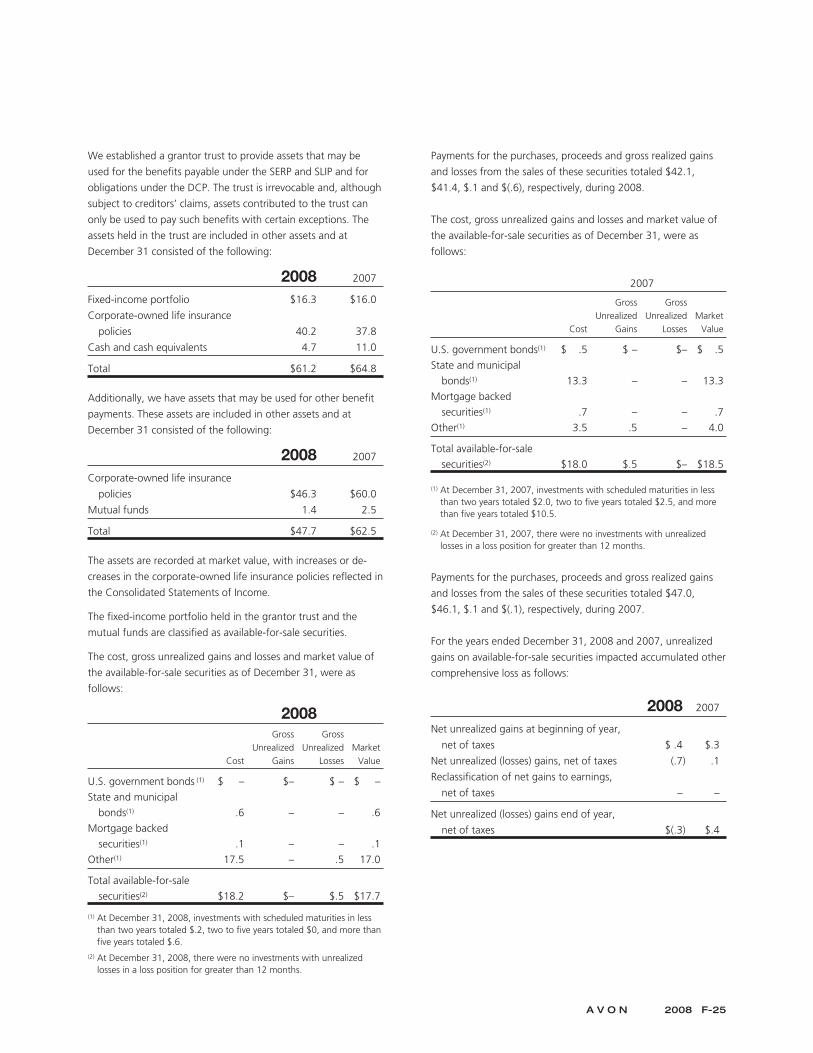
We established a grantor trust to provide assets that may be
used for the benefits payable under the SERP and SLIP and for
obligations under the DCP. The trust is irrevocable and, although
subject to creditors’ claims, assets contributed to the trust can
only be used to pay such benefits with certain exceptions. The
assets held in the trust are included in other assets and at
December 31 consisted of the following:
2008 2007
Fixed-income portfolio $16.3 $16.0
Corporate-owned life insurance
policies 40.2 37.8
Cash and cash equivalents 4.7 11.0
Total $61.2 $64.8
Additionally, we have assets that may be used for other benefit
payments. These assets are included in other assets and at
December 31 consisted of the following:
2008 2007
Corporate-owned life insurance
policies $46.3 $60.0
Mutual funds 1.4 2.5
Total $47.7 $62.5
The assets are recorded at market value, with increases or de-
creases in the corporate-owned life insurance policies reflected in
the Consolidated Statements of Income.
The fixed-income portfolio held in the grantor trust and the
mutual funds are classified as available-for-sale securities.
The cost, gross unrealized gains and losses and market value of
the available-for-sale securities as of December 31, were as
follows:
2008
Cost
GrossUnrealized
Gains
GrossUnrealized
LossesMarket
Value
U.S. government bonds (1) $ – $– $ – $ –
State and municipal
bonds(1) .6 – – .6
Mortgage backed
securities(1) .1 – – .1
Other(1) 17.5 – .5 17.0
Total available-for-sale
securities(2) $18.2 $– $.5 $17.7
(1) At December 31, 2008, investments with scheduled maturities in lessthan two years totaled $.2, two to five years totaled $0, and more thanfive years totaled $.6.
(2) At December 31, 2008, there were no investments with unrealizedlosses in a loss position for greater than 12 months.
Payments for the purchases, proceeds and gross realized gains
and losses from the sales of these securities totaled $42.1,
$41.4, $.1 and $(.6), respectively, during 2008.
The cost, gross unrealized gains and losses and market value of
the available-for-sale securities as of December 31, were as
follows:
2007
Cost
GrossUnrealized
Gains
GrossUnrealized
LossesMarket
Value
U.S. government bonds(1) $ .5 $ – $– $ .5
State and municipal
bonds(1) 13.3 – – 13.3
Mortgage backed
securities(1) .7 – – .7
Other(1) 3.5 .5 – 4.0
Total available-for-sale
securities(2) $18.0 $.5 $– $18.5
(1) At December 31, 2007, investments with scheduled maturities in lessthan two years totaled $2.0, two to five years totaled $2.5, and morethan five years totaled $10.5.
(2) At December 31, 2007, there were no investments with unrealizedlosses in a loss position for greater than 12 months.
Payments for the purchases, proceeds and gross realized gains
and losses from the sales of these securities totaled $47.0,
$46.1, $.1 and $(.1), respectively, during 2007.
For the years ended December 31, 2008 and 2007, unrealized
gains on available-for-sale securities impacted accumulated other
comprehensive loss as follows:
2008 2007
Net unrealized gains at beginning of year,
net of taxes $ .4 $.3
Net unrealized (losses) gains, net of taxes (.7) .1
Reclassification of net gains to earnings,
net of taxes – –
Net unrealized (losses) gains end of year,
net of taxes $(.3) $.4
A V O N 2008 F-25
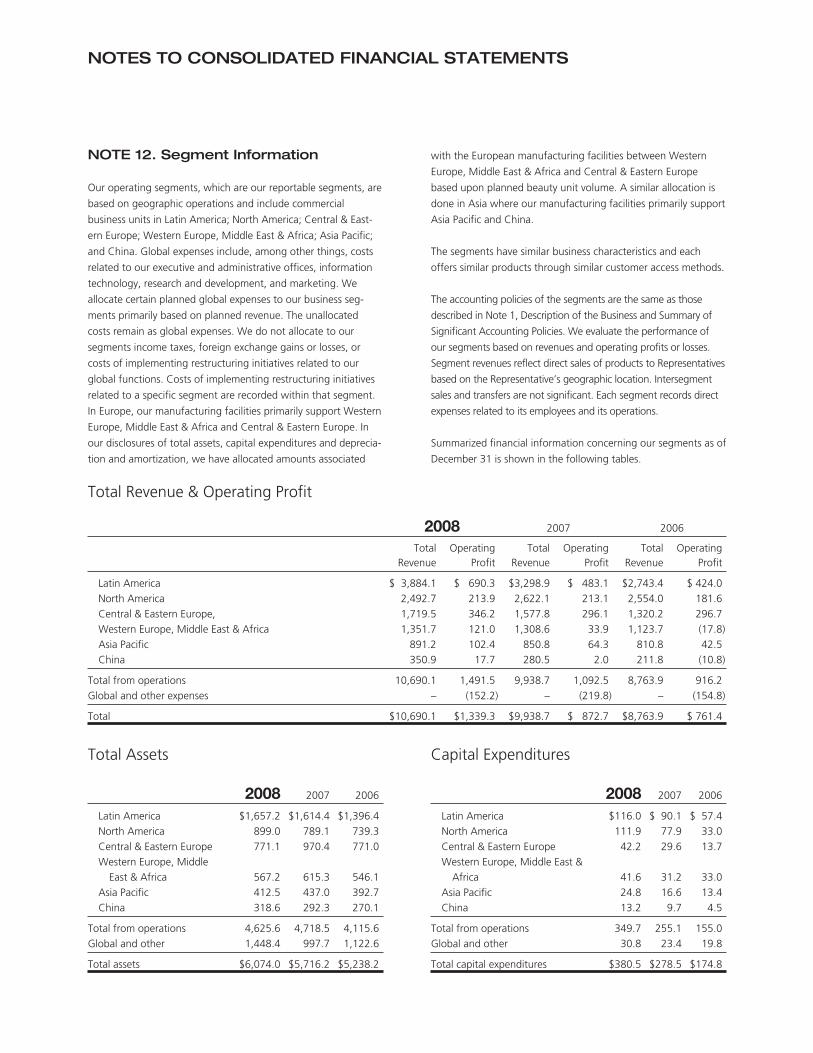
NOTES TO CONSOLIDATED FINANCIAL STATEMENTS
NOTE 12. Segment Information
Our operating segments, which are our reportable segments, are
based on geographic operations and include commercial
business units in Latin America; North America; Central & East-
ern Europe; Western Europe, Middle East & Africa; Asia Pacific;
and China. Global expenses include, among other things, costs
related to our executive and administrative offices, information
technology, research and development, and marketing. We
allocate certain planned global expenses to our business seg-
ments primarily based on planned revenue. The unallocated
costs remain as global expenses. We do not allocate to our
segments income taxes, foreign exchange gains or losses, or
costs of implementing restructuring initiatives related to our
global functions. Costs of implementing restructuring initiatives
related to a specific segment are recorded within that segment.
In Europe, our manufacturing facilities primarily support Western
Europe, Middle East & Africa and Central & Eastern Europe. In
our disclosures of total assets, capital expenditures and deprecia-
tion and amortization, we have allocated amounts associated
with the European manufacturing facilities between Western
Europe, Middle East & Africa and Central & Eastern Europe
based upon planned beauty unit volume. A similar allocation is
done in Asia where our manufacturing facilities primarily support
Asia Pacific and China.
The segments have similar business characteristics and each
offers similar products through similar customer access methods.
The accounting policies of the segments are the same as those
described in Note 1, Description of the Business and Summary of
Significant Accounting Policies. We evaluate the performance of
our segments based on revenues and operating profits or losses.
Segment revenues reflect direct sales of products to Representatives
based on the Representative’s geographic location. Intersegment
sales and transfers are not significant. Each segment records direct
expenses related to its employees and its operations.
Summarized financial information concerning our segments as of
December 31 is shown in the following tables.
Total Revenue & Operating Profit
2008 2007 2006
TotalRevenue
OperatingProfit
TotalRevenue
OperatingProfit
TotalRevenue
OperatingProfit
Latin America $ 3,884.1 $ 690.3 $3,298.9 $ 483.1 $2,743.4 $ 424.0North America 2,492.7 213.9 2,622.1 213.1 2,554.0 181.6Central & Eastern Europe, 1,719.5 346.2 1,577.8 296.1 1,320.2 296.7Western Europe, Middle East & Africa 1,351.7 121.0 1,308.6 33.9 1,123.7 (17.8)Asia Pacific 891.2 102.4 850.8 64.3 810.8 42.5China 350.9 17.7 280.5 2.0 211.8 (10.8)
Total from operations 10,690.1 1,491.5 9,938.7 1,092.5 8,763.9 916.2Global and other expenses – (152.2) – (219.8) – (154.8)
Total $10,690.1 $1,339.3 $9,938.7 $ 872.7 $8,763.9 $ 761.4
Total Assets
2008 2007 2006
Latin America $1,657.2 $1,614.4 $1,396.4North America 899.0 789.1 739.3Central & Eastern Europe 771.1 970.4 771.0Western Europe, Middle
East & Africa 567.2 615.3 546.1Asia Pacific 412.5 437.0 392.7China 318.6 292.3 270.1
Total from operations 4,625.6 4,718.5 4,115.6Global and other 1,448.4 997.7 1,122.6
Total assets $6,074.0 $5,716.2 $5,238.2
Capital Expenditures
2008 2007 2006
Latin America $116.0 $ 90.1 $ 57.4North America 111.9 77.9 33.0Central & Eastern Europe 42.2 29.6 13.7Western Europe, Middle East &
Africa 41.6 31.2 33.0Asia Pacific 24.8 16.6 13.4China 13.2 9.7 4.5
Total from operations 349.7 255.1 155.0Global and other 30.8 23.4 19.8
Total capital expenditures $380.5 $278.5 $174.8

Depreciation and Amortization
2008 2007 2006
Latin America $ 55.5 $ 49.6 $ 48.7
North America 37.6 35.0 30.0
Central & Eastern Europe 25.8 19.7 19.8
Western Europe, Middle
East & Africa 31.8 26.4 23.1
Asia Pacific 13.3 16.0 10.6
China 5.9 5.8 5.2
Total from operations 169.9 152.5 137.4
Global and other 17.3 19.6 22.2
Total depreciation and
amortization $187.2 $172.1 $159.6
Total Revenue by Major Country
2008 2007 2006
U.S. $ 2,061.8 $2,194.9 $2,157.1
Brazil 1,674.3 1,352.0 1,039.2
All other 6,954.0 6,391.8 5,567.6
Total $10,690.1 $9,938.7 $8,763.9
A major country is defined as one with total revenues greater
than 10% of consolidated total revenues.
Long-Lived Assets by Major Country
2008 2007 2006
U.S. $ 649.3 $ 465.5 $ 418.2Brazil 187.1 197.7 115.5Colombia 122.5 131.6 145.1All other 910.2 935.3 800.4
Total $1,869.1 $1,730.1 $1,479.2
A major country is defined as one with long-lived assets greater
than 10% of consolidated long-lived assets. Long-lived assets
primarily include property, plant and equipment and intangible
assets. The U.S. and Brazil’s long-lived assets consist primarily of
property, plant and equipment related to manufacturing and
distribution facilities. Colombia’s long-lived assets consist
primarily of goodwill and intangible assets associated with the
2005 acquisition of this business.
Revenue by Product Category
2008 2007 2006
Beauty(1) $ 7,603.7 $6,932.5 $6,019.6Fashion(2) 1,863.3 1,753.2 1,562.7Home(3) 1,121.9 1,159.5 1,095.0
Net sales 10,588.9 9,845.2 8,677.3Other revenue(4) 101.2 93.5 86.6
Total revenue $10,690.1 $9,938.7 $8,763.9
(1) Beauty includes cosmetics, fragrances, skin care and toiletries.
(2) Fashion includes fashion jewelry, watches, apparel, footwear andaccessories.
(3) Home includes gift and decorative products, housewares,entertainment and leisure, children’s and nutritional products.
(4) Other revenue primarily includes shipping and handling fees billed toRepresentatives.
Sales from Health and Wellness products and mark. are included
among these categories based on product type.
Beginning in the fourth quarter of 2008, we changed our
product categories from Beauty, Beauty Plus and Beyond Beauty
to Beauty, Fashion and Home.
NOTE 13. Leases and Commitments
Minimum rental commitments under noncancellable operating
leases, primarily for equipment and office facilities at Decem-
ber 31, 2008, are included in the following table under leases.
Purchase obligations include commitments to purchase paper,
inventory and other services.
Year LeasesPurchase
Obligations
2009 $ 92.3 $106.32010 65.9 55.32011 47.0 25.82012 26.3 17.72013 21.5 16.1Later years 54.8 49.9Sublease rental income (31.2) –
Total $276.6 $271.1
Rent expense in 2008 was $120.4 (2007 – $118.5; 2006 –
$114.7). Plant construction, expansion and modernization proj-
ects with an estimated cost to complete of $430.2 were in
progress at December 31, 2008.
A V O N 2008 F-27
NOTES TO CONSOLIDATED FINANCIAL STATEMENTS
NOTE 14. Restructuring Initiatives
2005 ProgramIn November 2005, we announced a multi-year turnaround plan to
restore sustainable growth. As part of our turnaround plan, we
launched a restructuring program in late 2005 (the “2005
Program”) and restructuring initiatives under this program include:
• enhancement of organizational effectiveness, including efforts
to flatten the organization and bring senior management
closer to consumers through a substantial organization
downsizing;
• implementation of a global manufacturing strategy through
facilities realignment;
• additional supply chain efficiencies in distribution; and
• streamlining of transactional and other services through
outsourcing and moves to low-cost countries.
In January 2008, we announced the final initiatives that are part
of the 2005 Program. We expect to record restructuring charges
and other costs to implement restructuring initiatives of approx-
imately $530 before taxes. Through December 31, 2008, we
have recorded total costs to implement, net of adjustments, of
$504.2 ($60.6 in 2008, $158.3 in 2007, $228.8 in 2006, and
$56.5 in 2005) for actions associated with our restructuring
initiatives. We expect to record a majority of the remaining costs
by the end of 2009.
2009 ProgramIn February 2009, we announced a new restructuring program
under our multi-year turnaround plan (the “2009 Program”).
The restructuring initiatives under the 2009 Program are ex-
pected to focus on restructuring our global supply chain opera-
tions, realigning certain local business support functions to a
more regional basis to drive increased efficiencies, and stream-
lining transaction-related services, including selective outsourc-
ing. We expect to incur restructuring charges and other costs to
implement these initiatives in the range of $300 to $400 before
taxes over the next several years.
Restructuring Charges –2005In December 2005 and January 2006, exit and disposal activities
that are a part of this multi-year restructuring plan were
approved. Specific actions for this initial phase of our multi-year
restructuring plan included:
• organization realignment and downsizing in each region and
global through a process called “delayering,” taking out layers
to bring senior management closer to operations;
• the exit of unprofitable lines of business or markets, including
the closure of unprofitable operations in Asia, primarily
Indonesia and the exit of a product line in China, and the exit
of the beComing product line in the U.S.; and
• the move of certain services from markets within Europe to
lower cost shared service centers.
The actions described above were completed during 2006,
except for the move of certain services from markets within
Europe to lower cost shared service centers, which was com-
pleted during 2008.
In connection with initiatives that had been approved to date,
we recorded total costs to implement in 2005 of $56.5, and the
costs consisted of the following:
• charges of $43.2 for employee-related costs, including
severance, pension and other termination benefits, asset
impairment charges and cumulative foreign currency trans-
lation charges previously recorded directly to shareholders’
equity;
• charges of $8.4 for inventory write-off; and
• other costs to implement of $4.9 for professional service fees
related to the implementation of these initiatives.
Of the total costs to implement, $48.1 was recorded in selling,
general and administrative expenses in 2005, and $8.4 was
recorded in cost of sales in 2005.
Approximately 58% of these charges resulted in cash
expenditures, with a majority of the cash payments made
during 2006.
Restructuring Charges –2006During 2006 and January 2007, additional exit and disposal
activities that are a part of our restructuring initiatives were
approved. Specific actions for this phase of our restructuring
initiatives included:
• organization realignment and downsizing in each region and
global through a process called “delayering,” taking out layers
to bring senior management closer to operations;
• the phased outsourcing of certain services, including certain
key human resource and customer service processes;
• the realignment of certain North America distribution
operations;
• the exit of certain unprofitable operations, including the
closure of the Avon Salon & Spa; and
• the reorganization of certain functions, primarily sales-related
organizations.
Many of the actions were completed in 2006, including the
delayering program. A majority of the remaining actions were
completed in 2007. The outsourcing of certain services is expect-
ed to be completed in phases through 2009. The realignment of
certain North America distribution operations is expected to be
completed in phases through 2012. The reorganization of one of
our functions is expected to be completed in phases through
2010.
In connection with initiatives that had been approved to date,
we recorded total costs to implement in 2006 of $228.8, and
the costs consisted of the following:
• charges of $218.3 for employee-related costs, including
severance, pension and other termination benefits;
• favorable adjustments of $16.1, primarily relating to a higher
than expected number of employees successfully pursuing
reassignments to other positions and higher than expected
turnover (employees leaving prior to termination); and
• other costs to implement of $24.9 and $1.7 for professional
service fees related to the implementation of these initiatives
and accelerated depreciation, respectively.
Of the total costs to implement, $229.1 was recorded in selling,
general and administrative expenses in 2006, and a favorable
adjustment of $.3 was recorded in cost of sales in 2006.
Approximately 85% of these charges resulted in cash
expenditures, with a majority of the cash payments made
during 2007.
Restructuring Charges –2007During 2007 and January 2008, exit and disposal activities that
are a part of our multi-year restructuring plan were approved.
Specific actions for this phase of our multi-year restructuring
plan included:
• the reorganization of certain functions, primarily sales-related
organizations;
• the restructure of certain international direct selling
operations;
• the realignment of certain of our distribution and manu-
facturing operations, including the realignment of certain of
our Latin America distribution operations;
• automation of certain distribution processes; and
• outsourcing of certain finance, customer service, and
information technology processes.
The actions described above are expected to be completed by
the end of 2009. The outsourcing of certain information
technology processes and the realignment of certain Latin
America distribution operations are expected to be completed
by the end of 2011.
In connection with initiatives that have been approved to date,
we recorded total costs to implement in 2007 of $158.3, and
the costs consisted of the following:
• charges of $118.0 for employee-related costs, including
severance, pension and other termination benefits;
• favorable adjustments of $8.0, primarily relating to certain
employees pursuing reassignments to other positions and
higher than expected turnover (employees leaving prior to
termination); and
• other costs to implement of $48.3 for professional service fees
associated with our initiatives to outsource certain human
resource, finance, customer service, and information tech-
nology processes and accelerated depreciation associated with
our initiatives to realign certain distribution operations and
close certain manufacturing operations.
Of the total costs to implement, $157.3 was recorded in selling,
general and administrative expenses and $1.0 was recorded in
cost of sales in 2007.
Approximately 95% of these charges are expected to result in
future cash expenditures, with a majority of the cash payments
made during 2008.
Restructuring Charges – 2008During 2008, we recorded total costs to implement associated
with previously approved initiatives that are part of our multi-
year restructuring plan of $60.6, and the costs consisted of
the following:
• net charges of $19.1 primarily for severance and pension
benefits;
• implementation costs of $30.5 for professional service fees,
primarily associated with our initiatives to outsource certain
finance and human resource processes; and
• accelerated depreciation of $11.0 associated with our
initiatives to realign certain distribution operations and close
certain manufacturing operations.
Of the total costs to implement, $57.5 was recorded in selling,
general and administrative expenses and $3.1 was recorded in
cost of sales for 2008.
A V O N 2008 F-29
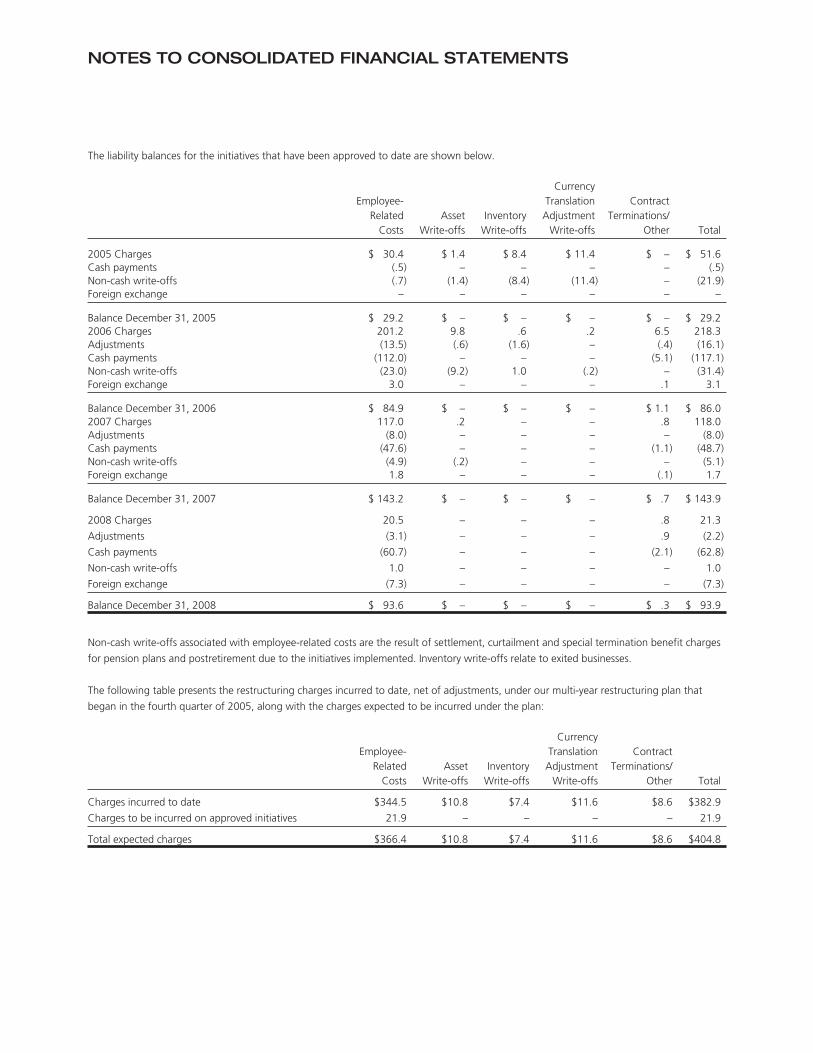
NOTES TO CONSOLIDATED FINANCIAL STATEMENTS
The liability balances for the initiatives that have been approved to date are shown below.
Employee-Related
CostsAsset
Write-offsInventory
Write-offs
CurrencyTranslationAdjustment
Write-offs
ContractTerminations/
Other Total
2005 Charges $ 30.4 $ 1.4 $ 8.4 $ 11.4 $ – $ 51.6Cash payments (.5) – – – – (.5)Non-cash write-offs (.7) (1.4) (8.4) (11.4) – (21.9)Foreign exchange – – – – – –
Balance December 31, 2005 $ 29.2 $ – $ – $ – $ – $ 29.22006 Charges 201.2 9.8 .6 .2 6.5 218.3Adjustments (13.5) (.6) (1.6) – (.4) (16.1)Cash payments (112.0) – – – (5.1) (117.1)Non-cash write-offs (23.0) (9.2) 1.0 (.2) – (31.4)Foreign exchange 3.0 – – – .1 3.1
Balance December 31, 2006 $ 84.9 $ – $ – $ – $ 1.1 $ 86.02007 Charges 117.0 .2 – – .8 118.0Adjustments (8.0) – – – – (8.0)Cash payments (47.6) – – – (1.1) (48.7)Non-cash write-offs (4.9) (.2) – – – (5.1)Foreign exchange 1.8 – – – (.1) 1.7
Balance December 31, 2007 $ 143.2 $ – $ – $ – $ .7 $ 143.9
2008 Charges 20.5 – – – .8 21.3
Adjustments (3.1) – – – .9 (2.2)
Cash payments (60.7) – – – (2.1) (62.8)
Non-cash write-offs 1.0 – – – – 1.0
Foreign exchange (7.3) – – – – (7.3)
Balance December 31, 2008 $ 93.6 $ – $ – $ – $ .3 $ 93.9
Non-cash write-offs associated with employee-related costs are the result of settlement, curtailment and special termination benefit charges
for pension plans and postretirement due to the initiatives implemented. Inventory write-offs relate to exited businesses.
The following table presents the restructuring charges incurred to date, net of adjustments, under our multi-year restructuring plan that
began in the fourth quarter of 2005, along with the charges expected to be incurred under the plan:
Employee-Related
CostsAsset
Write-offsInventory
Write-offs
CurrencyTranslationAdjustment
Write-offs
ContractTerminations/
Other Total
Charges incurred to date $344.5 $10.8 $7.4 $11.6 $8.6 $382.9
Charges to be incurred on approved initiatives 21.9 – – – – 21.9
Total expected charges $366.4 $10.8 $7.4 $11.6 $8.6 $404.8
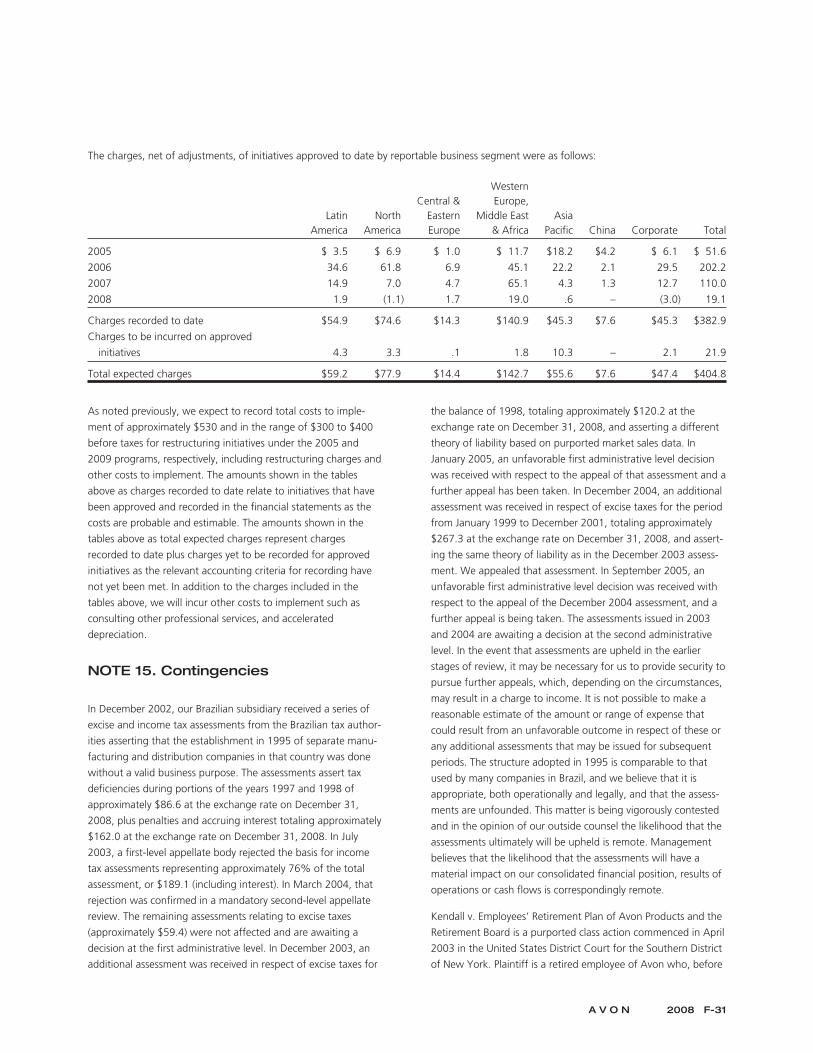
The charges, net of adjustments, of initiatives approved to date by reportable business segment were as follows:
LatinAmerica
NorthAmerica
Central &EasternEurope
WesternEurope,
Middle East& Africa
AsiaPacific China Corporate Total
2005 $ 3.5 $ 6.9 $ 1.0 $ 11.7 $18.2 $4.2 $ 6.1 $ 51.6
2006 34.6 61.8 6.9 45.1 22.2 2.1 29.5 202.2
2007 14.9 7.0 4.7 65.1 4.3 1.3 12.7 110.0
2008 1.9 (1.1) 1.7 19.0 .6 – (3.0) 19.1
Charges recorded to date $54.9 $74.6 $14.3 $140.9 $45.3 $7.6 $45.3 $382.9
Charges to be incurred on approved
initiatives 4.3 3.3 .1 1.8 10.3 – 2.1 21.9
Total expected charges $59.2 $77.9 $14.4 $142.7 $55.6 $7.6 $47.4 $404.8
As noted previously, we expect to record total costs to imple-
ment of approximately $530 and in the range of $300 to $400
before taxes for restructuring initiatives under the 2005 and
2009 programs, respectively, including restructuring charges and
other costs to implement. The amounts shown in the tables
above as charges recorded to date relate to initiatives that have
been approved and recorded in the financial statements as the
costs are probable and estimable. The amounts shown in the
tables above as total expected charges represent charges
recorded to date plus charges yet to be recorded for approved
initiatives as the relevant accounting criteria for recording have
not yet been met. In addition to the charges included in the
tables above, we will incur other costs to implement such as
consulting other professional services, and accelerated
depreciation.
NOTE 15. Contingencies
In December 2002, our Brazilian subsidiary received a series of
excise and income tax assessments from the Brazilian tax author-
ities asserting that the establishment in 1995 of separate manu-
facturing and distribution companies in that country was done
without a valid business purpose. The assessments assert tax
deficiencies during portions of the years 1997 and 1998 of
approximately $86.6 at the exchange rate on December 31,
2008, plus penalties and accruing interest totaling approximately
$162.0 at the exchange rate on December 31, 2008. In July
2003, a first-level appellate body rejected the basis for income
tax assessments representing approximately 76% of the total
assessment, or $189.1 (including interest). In March 2004, that
rejection was confirmed in a mandatory second-level appellate
review. The remaining assessments relating to excise taxes
(approximately $59.4) were not affected and are awaiting a
decision at the first administrative level. In December 2003, an
additional assessment was received in respect of excise taxes for
the balance of 1998, totaling approximately $120.2 at the
exchange rate on December 31, 2008, and asserting a different
theory of liability based on purported market sales data. In
January 2005, an unfavorable first administrative level decision
was received with respect to the appeal of that assessment and a
further appeal has been taken. In December 2004, an additional
assessment was received in respect of excise taxes for the period
from January 1999 to December 2001, totaling approximately
$267.3 at the exchange rate on December 31, 2008, and assert-
ing the same theory of liability as in the December 2003 assess-
ment. We appealed that assessment. In September 2005, an
unfavorable first administrative level decision was received with
respect to the appeal of the December 2004 assessment, and a
further appeal is being taken. The assessments issued in 2003
and 2004 are awaiting a decision at the second administrative
level. In the event that assessments are upheld in the earlier
stages of review, it may be necessary for us to provide security to
pursue further appeals, which, depending on the circumstances,
may result in a charge to income. It is not possible to make a
reasonable estimate of the amount or range of expense that
could result from an unfavorable outcome in respect of these or
any additional assessments that may be issued for subsequent
periods. The structure adopted in 1995 is comparable to that
used by many companies in Brazil, and we believe that it is
appropriate, both operationally and legally, and that the assess-
ments are unfounded. This matter is being vigorously contested
and in the opinion of our outside counsel the likelihood that the
assessments ultimately will be upheld is remote. Management
believes that the likelihood that the assessments will have a
material impact on our consolidated financial position, results of
operations or cash flows is correspondingly remote.
Kendall v. Employees’ Retirement Plan of Avon Products and the
Retirement Board is a purported class action commenced in April
2003 in the United States District Court for the Southern District
of New York. Plaintiff is a retired employee of Avon who, before
A V O N 2008 F-31
NOTES TO CONSOLIDATED FINANCIAL STATEMENTS
retirement, had been on paid disability leave for approximately
19 years. The initial complaint alleged that the Employees’
Retirement Plan of Avon Products (the “Retirement Plan”)
violated the Employee Retirement Income Security Act (“ERISA”)
and, as a consequence, unlawfully reduced the amount of plain-
tiff’s pension. Plaintiff sought a reformation of the Retirement
Plan and recalculation of benefits under the terms of the Retire-
ment Plan, as reformed for plaintiff and for the purported class.
In November 2003, plaintiff filed an amended complaint alleging
additional Retirement Plan violations of ERISA and seeking,
among other things, elimination of a social security offset in the
Retirement Plan. The purported class includes “all Plan partic-
ipants, whether active, inactive or retired, and their beneficiaries
and/or Estates, with one hour of service on or after January 1,
1976, whose accrued benefits, pensions or survivor’s benefits
have been or will be calculated and paid based on the Plan’s
unlawful provisions.” In February 2004, we filed a motion to
dismiss the amended complaint. In September 2007, the trial
court granted our motion to dismiss and plaintiff thereafter
appealed that decision to the United States Court of Appeals for
the Second Circuit. While it is not possible to predict the out-
come of litigation, management believes that there are merito-
rious defenses to the claims asserted and that this action should
not have a material adverse effect on our consolidated financial
position, results of operations or cash flows. This action is being
vigorously contested.
In August 2005, we reported the filing of class action complaints
for alleged violations of the federal securities laws in actions
entitled Nilesh Patel v. Avon Products, Inc. et al. and Michael
Cascio v. Avon Products, Inc. et al., respectively, which
subsequently have been consolidated. A consolidated amended
class action complaint for alleged violations of the federal secu-
rities laws was filed in the consolidated action in December 2005
in the United States District Court for the Southern District of
New York (Master File Number 05-CV-06803) under the caption
In re Avon Products, Inc. Securities Litigation naming Avon, an
officer and two officer/directors. The consolidated action,
brought on behalf of purchasers of our common stock between
February 3, 2004 and September 20, 2005, seeks damages for
alleged false and misleading statements “concerning Avon’s
operations and performance in China, the United States . . . and
Mexico.” The consolidated amended complaint also asserts that
during the class period certain officers and directors sold shares
of our common stock. In February 2006, we filed a motion to
dismiss the consolidated amended class action complaint, assert-
ing, among other things, that it failed to state a claim upon
which relief may be granted, and the plaintiffs have opposed
that motion.
In August 2005, we reported the filing of a complaint in a share-
holder derivative action purportedly brought on behalf of Avon
entitled Robert L. Garber, derivatively on behalf of Avon Prod-
ucts, Inc. v. Andrea Jung et al. as defendants, and Avon Prod-
ucts, Inc. as nominal defendant. An amended complaint was
filed in this action in December 2005 in the United States District
Court for the Southern District of New York (Master File Number
05-CV-06803) under the caption In re Avon Products, Inc. Secu-
rities Litigation naming certain of our officers and directors. The
amended complaint alleges that defendants’ violations of state
law, including breaches of fiduciary duties, abuse of control,
gross mismanagement, waste of corporate assets and unjust
enrichment, between February 2004 and the present, have
caused losses to Avon. In February 2006, we filed a motion to
dismiss the amended complaint, asserting, among other things,
that it failed to state a claim upon which relief may be granted,
and the plaintiff opposed that motion. In February 2009, plaintiff
Garber filed an unopposed motion for voluntary dismissal of the
action, which the court granted by order dated
February 13, 2009.
In October 2005, we reported the filing of class action com-
plaints for alleged violations of the Employee Retirement Income
Security Act (“ERISA”) in actions entitled John Rogati v. Andrea
Jung, et al. and Carolyn Jane Perry v. Andrea Jung, et al.,
respectively, which subsequently have been consolidated. A
consolidated class action complaint for alleged violations of
ERISA was filed in the consolidated action in December 2005 in
the United States District Court for the Southern District of New
York (Master File Number 05-CV-06803) under the caption In re
Avon Products, Inc. ERISA Litigation naming Avon, certain
officers, Avon’s Retirement Board and others. The consolidated
action purports to be brought on behalf of the Avon Products,
Inc. Personal Savings Account Plan and the Avon Products, Inc.
Personal Retirement Account Plan (collectively the “Plan”) and
on behalf of participants and beneficiaries of the Plan “for
whose individual accounts the Plan purchased or held an interest
in Avon Products, Inc. . . . common stock from February 20,
2004 to the present.” The consolidated complaint asserts
breaches of fiduciary duties and prohibited transactions in
violation of ERISA arising out of, inter alia, alleged false and
misleading public statements regarding Avon’s business made
during the class period and investments in Avon stock by the
Plan and Plan participants. In February 2006, we filed a motion
to dismiss the consolidated complaint, asserting that it failed to
state a claim upon which relief may be granted, and the plain-
tiffs have opposed that motion.
It is not possible to predict the outcome of litigation and it is
reasonably possible that there could be unfavorable outcomes in
the In re Avon Products, Inc. Securities Litigation, In re Avon
Products, Inc. Securities Litigation (derivative action) and In re
Avon Products, Inc. ERISA Litigation matters. Management is
unable to make a meaningful estimate of the amount or range
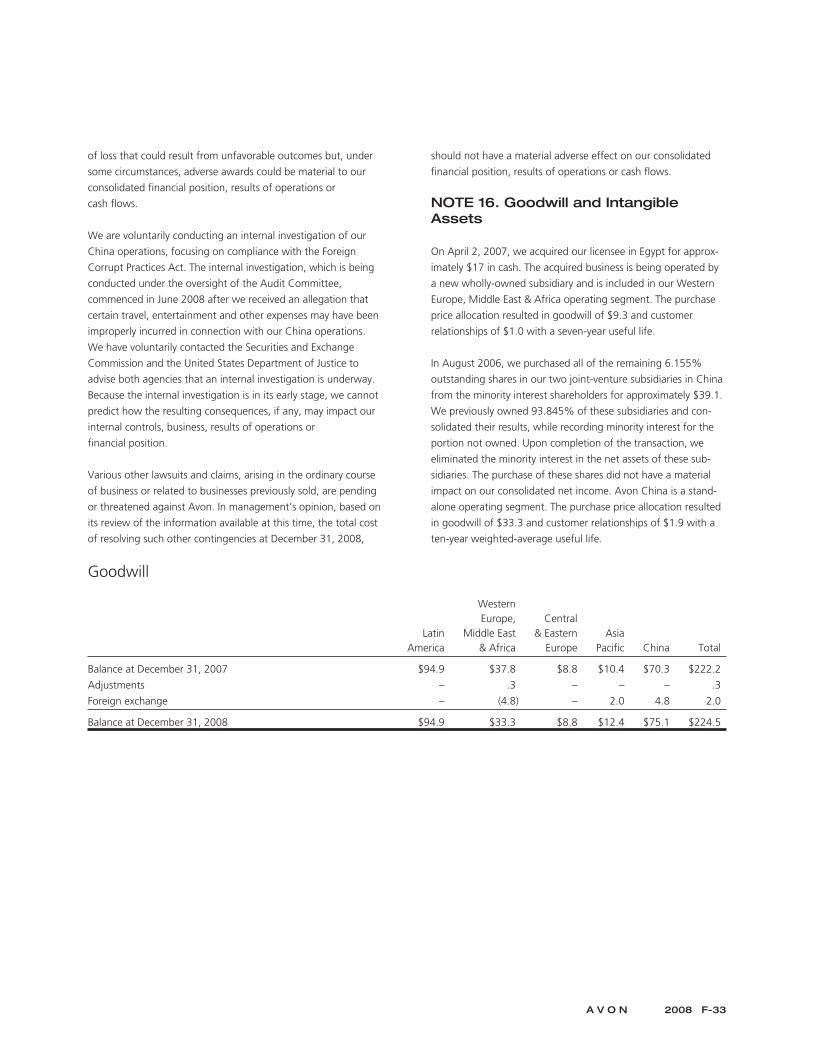
of loss that could result from unfavorable outcomes but, under
some circumstances, adverse awards could be material to our
consolidated financial position, results of operations or
cash flows.
We are voluntarily conducting an internal investigation of our
China operations, focusing on compliance with the Foreign
Corrupt Practices Act. The internal investigation, which is being
conducted under the oversight of the Audit Committee,
commenced in June 2008 after we received an allegation that
certain travel, entertainment and other expenses may have been
improperly incurred in connection with our China operations.
We have voluntarily contacted the Securities and Exchange
Commission and the United States Department of Justice to
advise both agencies that an internal investigation is underway.
Because the internal investigation is in its early stage, we cannot
predict how the resulting consequences, if any, may impact our
internal controls, business, results of operations or
financial position.
Various other lawsuits and claims, arising in the ordinary course
of business or related to businesses previously sold, are pending
or threatened against Avon. In management’s opinion, based on
its review of the information available at this time, the total cost
of resolving such other contingencies at December 31, 2008,
should not have a material adverse effect on our consolidated
financial position, results of operations or cash flows.
NOTE 16. Goodwill and IntangibleAssets
On April 2, 2007, we acquired our licensee in Egypt for approx-
imately $17 in cash. The acquired business is being operated by
a new wholly-owned subsidiary and is included in our Western
Europe, Middle East & Africa operating segment. The purchase
price allocation resulted in goodwill of $9.3 and customer
relationships of $1.0 with a seven-year useful life.
In August 2006, we purchased all of the remaining 6.155%
outstanding shares in our two joint-venture subsidiaries in China
from the minority interest shareholders for approximately $39.1.
We previously owned 93.845% of these subsidiaries and con-
solidated their results, while recording minority interest for the
portion not owned. Upon completion of the transaction, we
eliminated the minority interest in the net assets of these sub-
sidiaries. The purchase of these shares did not have a material
impact on our consolidated net income. Avon China is a stand-
alone operating segment. The purchase price allocation resulted
in goodwill of $33.3 and customer relationships of $1.9 with a
ten-year weighted-average useful life.
Goodwill
LatinAmerica
WesternEurope,
Middle East& Africa
Central& Eastern
EuropeAsia
Pacific China Total
Balance at December 31, 2007 $94.9 $37.8 $8.8 $10.4 $70.3 $222.2
Adjustments – .3 – – – .3
Foreign exchange – (4.8) – 2.0 4.8 2.0
Balance at December 31, 2008 $94.9 $33.3 $8.8 $12.4 $75.1 $224.5
A V O N 2008 F-33
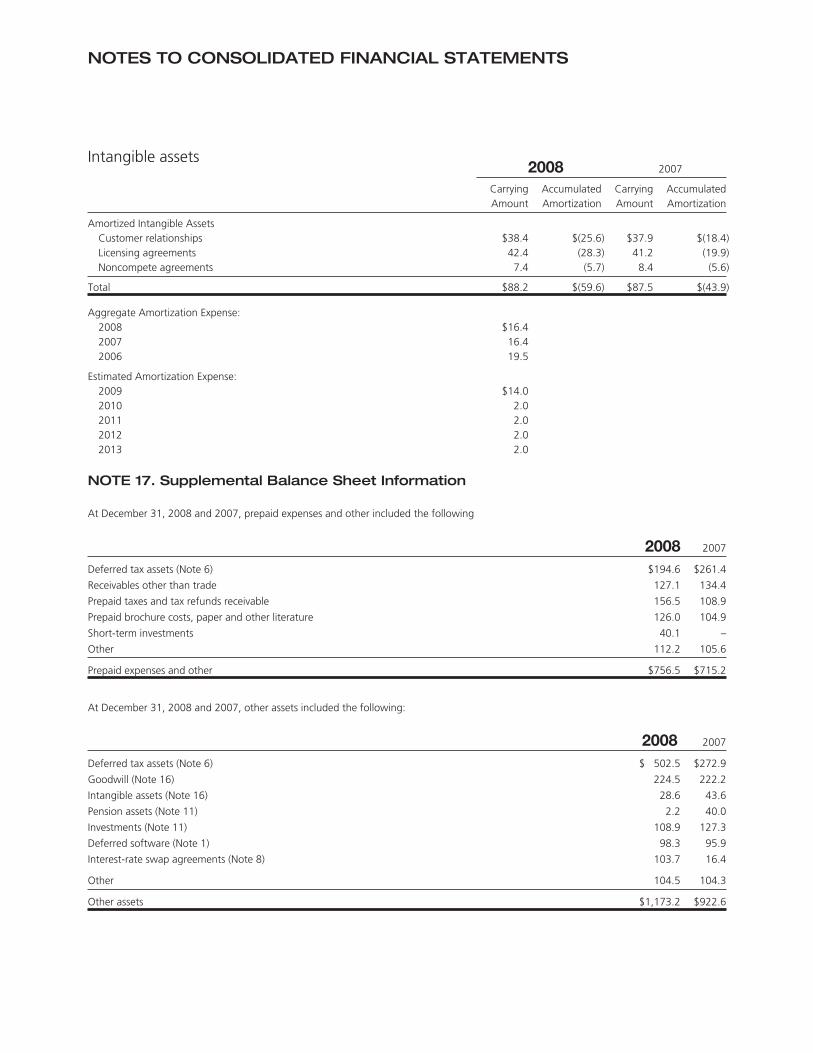
NOTES TO CONSOLIDATED FINANCIAL STATEMENTS
Intangible assets2008 2007
CarryingAmount
AccumulatedAmortization
CarryingAmount
AccumulatedAmortization
Amortized Intangible AssetsCustomer relationships $38.4 $(25.6) $37.9 $(18.4)Licensing agreements 42.4 (28.3) 41.2 (19.9)Noncompete agreements 7.4 (5.7) 8.4 (5.6)
Total $88.2 $(59.6) $87.5 $(43.9)
Aggregate Amortization Expense:2008 $16.42007 16.42006 19.5
Estimated Amortization Expense:2009 $14.02010 2.02011 2.02012 2.02013 2.0
NOTE 17. Supplemental Balance Sheet Information
At December 31, 2008 and 2007, prepaid expenses and other included the following
2008 2007
Deferred tax assets (Note 6) $194.6 $261.4
Receivables other than trade 127.1 134.4
Prepaid taxes and tax refunds receivable 156.5 108.9
Prepaid brochure costs, paper and other literature 126.0 104.9
Short-term investments 40.1 –
Other 112.2 105.6
Prepaid expenses and other $756.5 $715.2
At December 31, 2008 and 2007, other assets included the following:
2008 2007
Deferred tax assets (Note 6) $ 502.5 $272.9
Goodwill (Note 16) 224.5 222.2
Intangible assets (Note 16) 28.6 43.6
Pension assets (Note 11) 2.2 40.0
Investments (Note 11) 108.9 127.3
Deferred software (Note 1) 98.3 95.9
Interest-rate swap agreements (Note 8) 103.7 16.4
Other 104.5 104.3
Other assets $1,173.2 $922.6
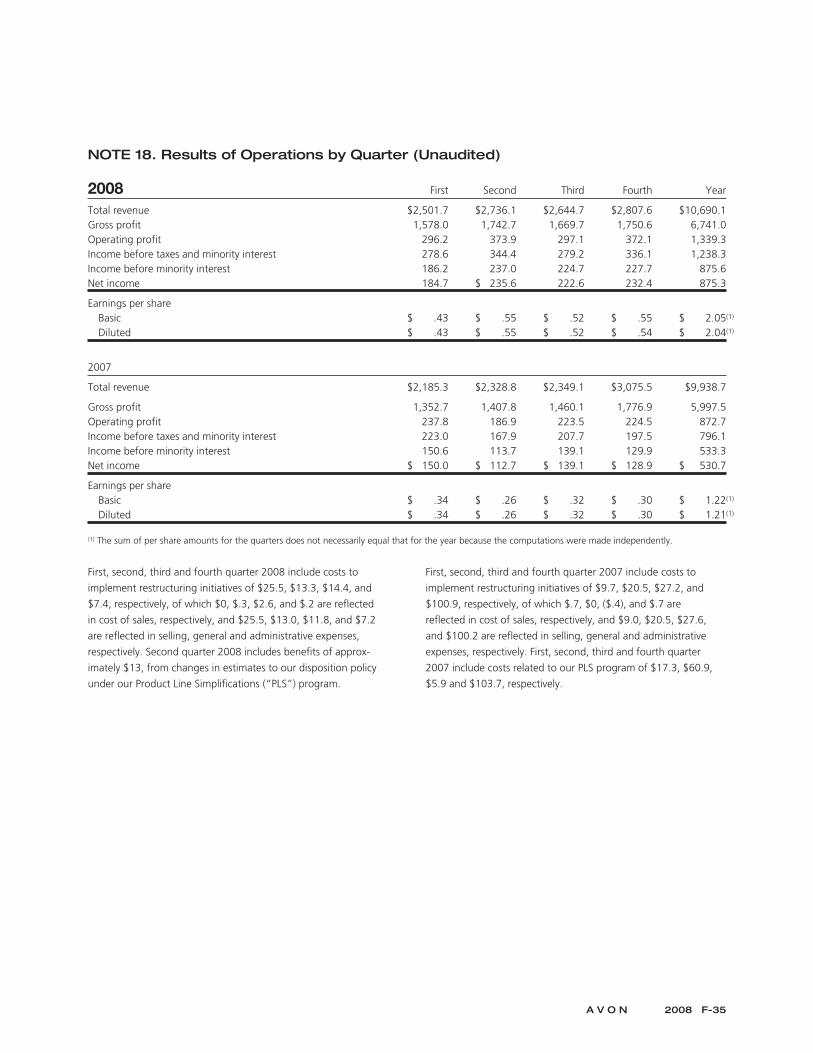
NOTE 18. Results of Operations by Quarter (Unaudited)
2008 First Second Third Fourth Year
Total revenue $2,501.7 $2,736.1 $2,644.7 $2,807.6 $10,690.1Gross profit 1,578.0 1,742.7 1,669.7 1,750.6 6,741.0Operating profit 296.2 373.9 297.1 372.1 1,339.3Income before taxes and minority interest 278.6 344.4 279.2 336.1 1,238.3Income before minority interest 186.2 237.0 224.7 227.7 875.6Net income 184.7 $ 235.6 222.6 232.4 875.3
Earnings per shareBasic $ .43 $ .55 $ .52 $ .55 $ 2.05(1)
Diluted $ .43 $ .55 $ .52 $ .54 $ 2.04(1)
2007
Total revenue $2,185.3 $2,328.8 $2,349.1 $3,075.5 $9,938.7
Gross profit 1,352.7 1,407.8 1,460.1 1,776.9 5,997.5Operating profit 237.8 186.9 223.5 224.5 872.7Income before taxes and minority interest 223.0 167.9 207.7 197.5 796.1Income before minority interest 150.6 113.7 139.1 129.9 533.3Net income $ 150.0 $ 112.7 $ 139.1 $ 128.9 $ 530.7
Earnings per shareBasic $ .34 $ .26 $ .32 $ .30 $ 1.22(1)
Diluted $ .34 $ .26 $ .32 $ .30 $ 1.21(1)
(1) The sum of per share amounts for the quarters does not necessarily equal that for the year because the computations were made independently.
First, second, third and fourth quarter 2008 include costs to
implement restructuring initiatives of $25.5, $13.3, $14.4, and
$7.4, respectively, of which $0, $.3, $2.6, and $.2 are reflected
in cost of sales, respectively, and $25.5, $13.0, $11.8, and $7.2
are reflected in selling, general and administrative expenses,
respectively. Second quarter 2008 includes benefits of approx-
imately $13, from changes in estimates to our disposition policy
under our Product Line Simplifications (“PLS”) program.
First, second, third and fourth quarter 2007 include costs to
implement restructuring initiatives of $9.7, $20.5, $27.2, and
$100.9, respectively, of which $.7, $0, ($.4), and $.7 are
reflected in cost of sales, respectively, and $9.0, $20.5, $27.6,
and $100.2 are reflected in selling, general and administrative
expenses, respectively. First, second, third and fourth quarter
2007 include costs related to our PLS program of $17.3, $60.9,
$5.9 and $103.7, respectively.
A V O N 2008 F-35
NOTE 19. Subsequent Events
On February 3, 2009, we announced an increase in our quarterly
cash dividend to $.21 per share from $.20 per share. The first
dividend at the new rate will be paid on March 2, 2009, to
shareholders of record on February 17, 2009. With this increase,
the indicated annual dividend rate is $.84 per share.
In February 2009, we announced a new restructuring program
under our multi-year turnaround plan. The restructuring
initiatives under the new program are expected to focus on
restructuring our global supply chain operations, realigning cer-
tain local business support functions to a more regional basis to
drive increased efficiencies, and streamlining transaction-related
services, including selective outsourcing. We expect to incur
restructuring charges and other costs to implement these
initiatives in the range of $300 to $400 before taxes over the
next several years.
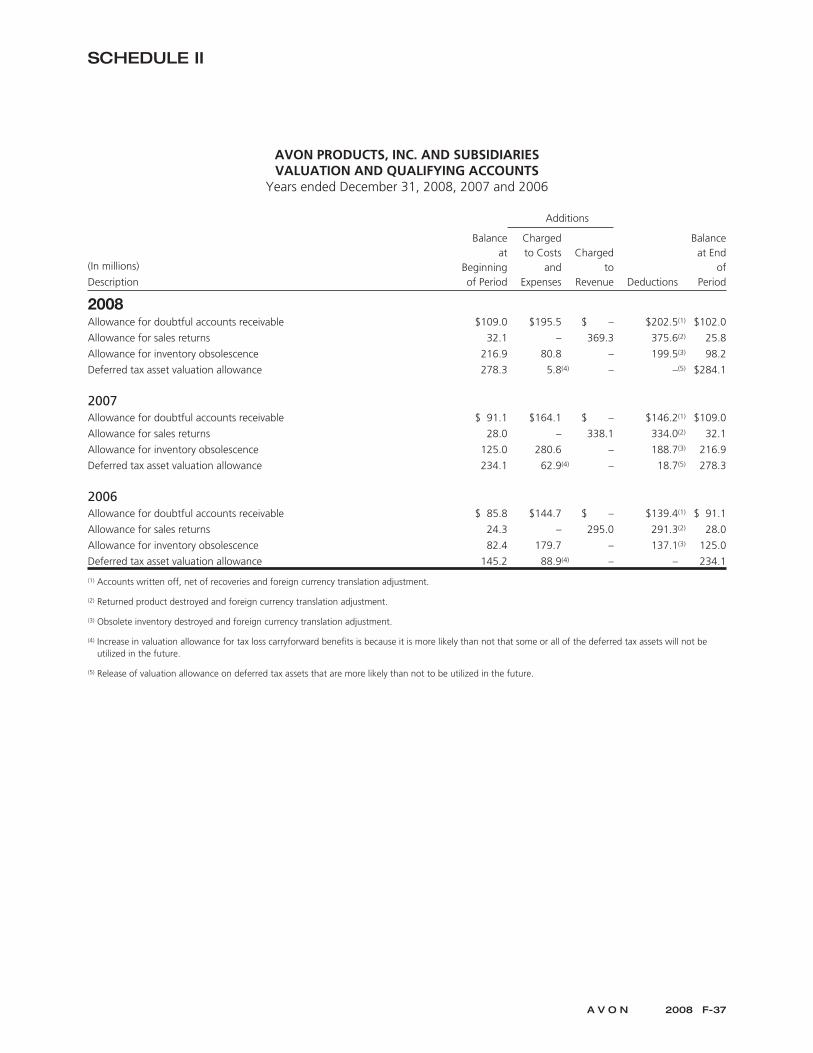
SCHEDULE II
AVON PRODUCTS, INC. AND SUBSIDIARIESVALUATION AND QUALIFYING ACCOUNTS
Years ended December 31, 2008, 2007 and 2006
Additions
(In millions)
Description
Balanceat
Beginningof Period
Chargedto Costs
andExpenses
Chargedto
Revenue Deductions
Balanceat End
ofPeriod
2008Allowance for doubtful accounts receivable $109.0 $195.5 $ – $202.5(1) $102.0
Allowance for sales returns 32.1 – 369.3 375.6(2) 25.8
Allowance for inventory obsolescence 216.9 80.8 – 199.5(3) 98.2
Deferred tax asset valuation allowance 278.3 5.8(4) – –(5) $284.1
2007Allowance for doubtful accounts receivable $ 91.1 $164.1 $ – $146.2(1) $109.0
Allowance for sales returns 28.0 – 338.1 334.0(2) 32.1
Allowance for inventory obsolescence 125.0 280.6 – 188.7(3) 216.9
Deferred tax asset valuation allowance 234.1 62.9(4) – 18.7(5) 278.3
2006Allowance for doubtful accounts receivable $ 85.8 $144.7 $ – $139.4(1) $ 91.1
Allowance for sales returns 24.3 – 295.0 291.3(2) 28.0
Allowance for inventory obsolescence 82.4 179.7 – 137.1(3) 125.0
Deferred tax asset valuation allowance 145.2 88.9(4) – – 234.1
(1) Accounts written off, net of recoveries and foreign currency translation adjustment.
(2) Returned product destroyed and foreign currency translation adjustment.
(3) Obsolete inventory destroyed and foreign currency translation adjustment.
(4) Increase in valuation allowance for tax loss carryforward benefits is because it is more likely than not that some or all of the deferred tax assets will not beutilized in the future.
(5) Release of valuation allowance on deferred tax assets that are more likely than not to be utilized in the future.
A V O N 2008 F-37
Executive CommitteeAndrea JungChairman and Chief Executive Officer
Elizabeth A. SmithPresident, Avon Products, Inc.
Charles W. CrambVice Chairman,Chief Finance and Strategy Officer
Charles M. HeringtonExecutive Vice President,Latin America
Lucien AlziariSenior Vice President,Human Resources
Geralyn R. BreigSenior Vice President,and President, North America
Jeri FinardSenior Vice President Global Brand President
Bennett R. GallinaSenior Vice President,Western Europe, Middle East and Africa; Asia Pacific; and China
Nancy GlaserSenior Vice President,Global Communications
Donagh HerlihySenior Vice President, Chief Information Officer
John P. HigsonSenior Vice President,Central and Eastern Europe
Srdjan MijuskovicSenior Vice President,Global Sales
John F. OwenSenior Vice President,Global Supply Chain
Kim K. W. RuckerSenior Vice President,General Counsel and Corporate Secretary
Corporate InformationAvon Products, Inc.1345 Avenue of the AmericasNew York, NY 10105212-282-5000www.avoncompany.com
Independent Registered Public Accounting FirmPricewaterhouseCoopers LLP300 Madison AvenueNew York, NY 10017
Institutional Investor InquiriesPlease call Renee W. Johansenat (212) 282-5320or e-mail [email protected]
Individual Investor InquiriesFor questions regarding stock certificates or accounts; dividend checks; or Avon’s dividendreinvestment program, contact our Stock Transfer Agent and Registrar at Computershare Trust Company, N.A.P.O. Box 43078Providence, RI 02940-3078(781) 575-2879www.computershare.com
For other investor questions or document requests, please visit our website at www.avoncompany.com; email [email protected]; or call (212) 282-5623
Form 10-KThe company’s 2008 Annual Report(Form 10-K) can be viewed on the Internetat www.avoninvestor.com
For information about becoming an Avon Representative or purchasing Avon products, please call 1-800-FOR-AVON or visit www.avon.com
Avon’s 2008 Annual Report on Form 10-Kincludes as exhibits the certifications of the Chief Executive Officer and Chief Financial Officer, which are required to be filed with the SEC by Section 302 of the Sarbanes-Oxley Act. A copy ofAvon’s Form 10-K may be obtained by referring to theinstructions listed above. Avon has also filed withthe New York Stock Exchange (NYSE) the certification of its Chief Executive Officer confirming that Avon has complied with the NYSE’scorporate governance listing standards.
Annual Report design byAvon Corporate Identity DepartmentNew York, NY

Board of Directors 1. Andrea Jung Chairman and Chief Executive Offi cer2. W. Don Cornwell Chairman and Chief Executive Offi cer, Granite Broadcasting Corporation3. Edward T. Fogarty Former Chairman, President and Chief Executive Offi cer, Tambrands, Inc.4. V. Ann Hailey Chief Financial Offi cer Gilt Groupe, Inc.5. Fred Hassan Chairman and Chief Executive Offi cer, Schering-Plough Corporation6. Maria Elena Lagomasino Chief Executive Offi cer, GenSpring Family Offi ces7. Ann S. Moore Chairman and Chief Executive Offi cer, Time Inc.8. Paul S. Pressler Former President and Chief Executive Offi cer, Gap, Inc. 9. Gary M. Rodkin Chief Executive Offi cer, ConAgra Foods, Inc.10. Paula Stern, Ph.D. Chairwoman, The Stern Group, Inc.11. Lawrence A. Weinbach Partner, Yankee Hill Capital Management LLC
Board CommitteesLead DirectorFred HassanAudit CommitteeLawrence A. Weinbach, ChairW. Don CornwellEdward T. FogartyV. Ann HaileyPaul S. PresslerCompensation CommitteeMaria Elena Lagomasino, ChairFred HassanAnn S. MooreGary M. RodkinFinance CommitteePaul S. Pressler, ChairW. Don CornwellEdward T. FogartyGary M. RodkinPaula Stern, Ph.D.Nominating and Corporate Governance CommitteeFred Hassan, ChairMaria Elena Lagomasino Ann S. MoorePaula Stern, Ph.D.
1 2
3 4
5 6
7 8
9 10
11
Avon Products av95855a3 Proof 2
av95855a.indd 3av95855a.indd 3 3/10/09 5:05:34 AM3/10/09 5:05:34 AM

www.avoncompany.com
Avon Products av95855a4 Proof 1
av95855a.indd 4av95855a.indd 4 3/6/09 10:33:08 AM3/6/09 10:33:08 AM