Avian Community Response to Mechanical Fuel …data.prbo.org/apps/snamin/uploads/images/fuels/PRBO...
35
Page 1 Avian Community Response to Mechanical Fuel Treatment in the Sierra Nevada, USA. Ryan D. Burnett, Nathaniel E. Seavy, Leo Salas, and Diana L. Humple PRBO Conservation Science 3820 Cypress Drive #11 Petaluma, CA 94954 PRBO Contribution # 1912
Transcript of Avian Community Response to Mechanical Fuel …data.prbo.org/apps/snamin/uploads/images/fuels/PRBO...
Page 1
Avian Community Response to Mechanical Fuel Treatment in the Sierra Nevada, USA.
Ryan D. Burnett, Nathaniel E. Seavy, Leo Salas, and Diana L. Humple
PRBO Conservation Science
3820 Cypress Drive #11
Petaluma, CA 94954
PRBO Contribution # 1912

Page 2
Abstract
We investigated the short term response (2 – 6 years post treatment) of the avian
community to three fuels reduction treatments in the Northern Sierra Nevada, USA. We
evaluated the effects of shaded fuel breaks, group selections, and pre-commercial understory
thinning on the abundance of a suite of focal bird species that serve as surrogate species for three
habitat guilds (mature closed canopy forest, shrubs, and edge/open forest). We also measured
five vegetation characteristics that we predicted may impact bird habitat in these forest. We
found that treatments significantly reduced snag density, overstory and understory tree cover,
shrub cover, and herbaceous cover. The effect of treatments on bird abundance was less obvious.
The overall abundance of members of each habitat guild was not significantly different between
pre and post-treatment conditions for any of the treatments. Species richness modestly increased
following shaded fuel break and group selection treatments and significantly decreased after pre-
commercial thinning. Species within the habitat guilds often did not respond congruently to
treatments and overall effects for most species were modest. However, as predicted mature forest
canopy associated species showed the strongest negative responses while edge and open forest
species showed the most positive responses to treatment. Our results suggest that these fuel
reduction treatments have relatively modest impacts on bird community composition and
abundance. The potential of these treatments to benefit the full spectrum of disturbance-
dependent species, especially those associated with moderate and high severity fire, appears
limited.
Keywords: shaded fuel break, group selection, pre-commercial thin, mastication, songbird, focal
species, forest heterogeneity, fire surrogate

Page 3
1. Introduction
In conifer forests of the Sierra Nevada, fire suppression and silvicultural practices have
increased forest stand densities and fuel loads and reduced local and landscape heterogeneity
(Taylor, 2004; Beaty and Taylor, 2008; Collins et al., 2011). Because the current structure of
many Sierra Nevada forests is believed to increase their vulnerability to stand-replacing fire,
managers are increasingly concerned with reducing vulnerability through the mechanical
removal of fuels (North et al., 2007; Collins et al., 2010; Safford et al., 2012). These fuels
treatments generally involve reducing understory vegetation and thinning medium-sized trees in
order to slow the rate at which fires spread, reduce the intensity with which they burn, and
increase human safety (Stephens, 1998; Collins et al., 2007).
Because fuels reduction treatments have become one of the primary forest management
tools in western North American forests, the degree to which these treatments impact ecological
conditions and wildlife habitat is important (Schoennagel and Nelson, 2011; Safford et al., 2012;
Stephens et al., 2012). Understanding the ecological consequences of fuels reduction treatments
is complicated because they can vary dramatically depending on the intensity and spatial extent
of the treatments and because they need to be understood in the context of the natural disturbance
regime of the ecosystem in which they are implemented (Fontaine and Kennedy, 2012; Stephens
et al. 2012). Monitoring that evaluates effects of these treatments on wildlife habitat and other
ecosystem functions is an important element of ensuring treatments can be implemented without
risking other ecological values (Lee and Irwin, 2005; Hutto and Belote, 2013).
One approach to ecological monitoring is to focus on groups of organisms that can
provide cost-effective information about ecological conditions of interest (Vos et al. 2000; Gram
et al. 2001). In this context, birds are an effective tool for monitoring because: (1) many species
are easily and inexpensively detected using standardized sampling protocols; (2) these species
are sensitive to a wide variety of habitat conditions and their abundance can be used as proxy of
habitat quality (Bock and Jones 2004); and (3) accounting for and maintaining many species with
different ecological requirements can be used to implement landscape conservation strategies
(Hutto 1998). For these reasons, the abundance of bird species previously identified as ecological
indicators (i.e., focal species or surrogate species) in habitat conservation plans and other
management documents can provide a metric for evaluating the ecological effects of fuels
treatments. For example, information about the habitat requirements of Partners in Flight focal
Page 4
species has provided a straightforward way to interpret the ecological effects of fuels treatments
in the context of regional conservation priorities (Alexander et al., 2007; Seavy et al., 2008).
Because there are a suite of different fuels reduction prescriptions available to forest
managers, information about the relative effects of these treatments on wildlife habitat is relevant
to decision-making. Two common fuels treatments prescriptions used in the Sierra Nevada are
shaded fuel breaks (also called defensible fuel profile zones) and pre-commercial understory
thinning. An additional treatment, group selections, is not employed primarily as a fuels
reduction treatment, but was frequently used in our study area in concert with the two other fuel
treatments. Because group selections are a common and sometimes controversial silvicultural
prescription, we included them in this analysis and refer to all three treatments as fuels
reductions.
To evaluate the relative effects of these treatments on wildlife habitat, we selected a suite
of passerine birds to use as indicators of ecological change. We propose that the degree to which
these treatments altered the forest structure in ecologically meaningful ways could be ascertained
from the changes in abundance of these indicator species after treatment (Hutto and Belote,
2013). Because these treatments were generally designed to reduce tree and shrub cover, and
increase the amount of forest edge, we predicted that if the treatments were ecologically
meaningful, then birds associated with understory shrubs and canopy trees would decline in the
initial years post-treatment, whereas those associated with more open canopy and edge would
increase. Thus the objectives of this project were to (1) describe the effects of these three fuels
treatments on bird abundance and vegetation structure, (2) use these changes to make inferences
about the degree to which fuels treatments produce changes in forest structure that are
ecologically meaningful for Sierra Nevada wildlife, and (3) provide forest managers with
information about the ecological consequences of fuels treatments primarily designed to modify
fire behavior.
2. Methods
2.1. Study sites
We studied mechanical fuels reduction treatments in the Lassen and Plumas National
Forests within the boundaries of the Herger-Feinstein Quincy Library Group Forest Recovery
Act Pilot Project (HFQLG 1999). The study sites encompassed portions of Butte, Lassen, and
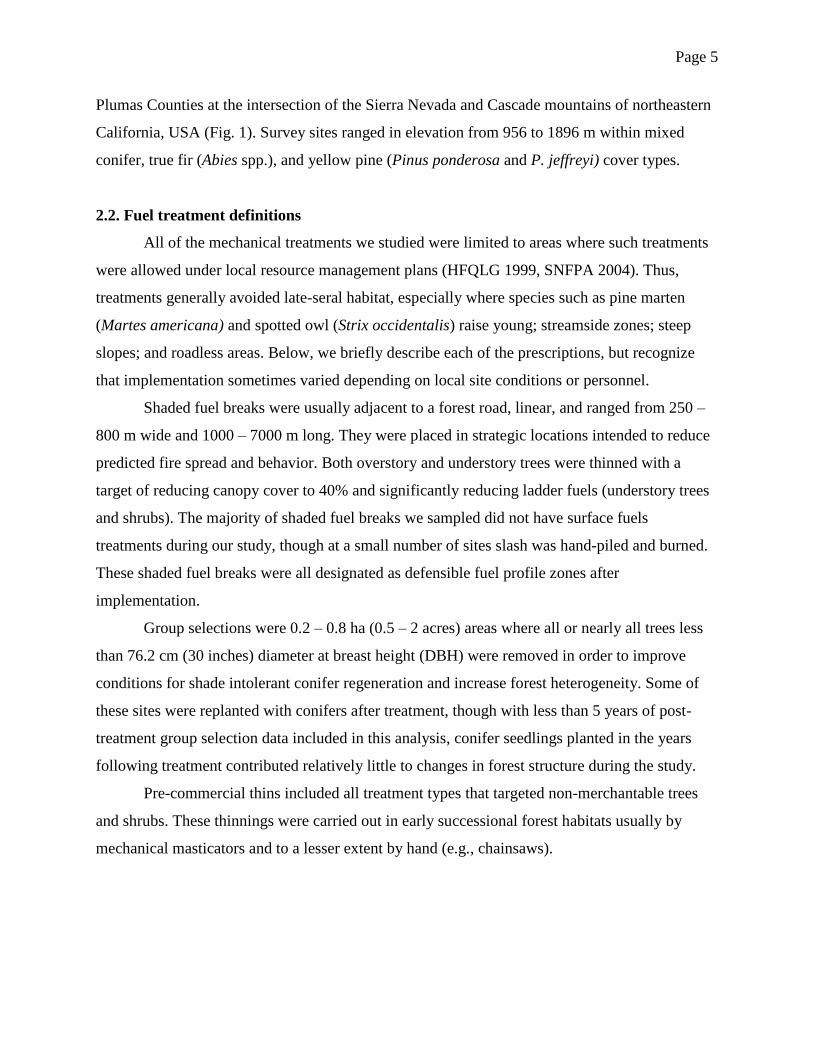
Page 5
Plumas Counties at the intersection of the Sierra Nevada and Cascade mountains of northeastern
California, USA (Fig. 1). Survey sites ranged in elevation from 956 to 1896 m within mixed
conifer, true fir (Abies spp.), and yellow pine (Pinus ponderosa and P. jeffreyi) cover types.
2.2. Fuel treatment definitions
All of the mechanical treatments we studied were limited to areas where such treatments
were allowed under local resource management plans (HFQLG 1999, SNFPA 2004). Thus,
treatments generally avoided late-seral habitat, especially where species such as pine marten
(Martes americana) and spotted owl (Strix occidentalis) raise young; streamside zones; steep
slopes; and roadless areas. Below, we briefly describe each of the prescriptions, but recognize
that implementation sometimes varied depending on local site conditions or personnel.
Shaded fuel breaks were usually adjacent to a forest road, linear, and ranged from 250 –
800 m wide and 1000 – 7000 m long. They were placed in strategic locations intended to reduce
predicted fire spread and behavior. Both overstory and understory trees were thinned with a
target of reducing canopy cover to 40% and significantly reducing ladder fuels (understory trees
and shrubs). The majority of shaded fuel breaks we sampled did not have surface fuels
treatments during our study, though at a small number of sites slash was hand-piled and burned.
These shaded fuel breaks were all designated as defensible fuel profile zones after
implementation.
Group selections were 0.2 – 0.8 ha (0.5 – 2 acres) areas where all or nearly all trees less
than 76.2 cm (30 inches) diameter at breast height (DBH) were removed in order to improve
conditions for shade intolerant conifer regeneration and increase forest heterogeneity. Some of
these sites were replanted with conifers after treatment, though with less than 5 years of post-
treatment group selection data included in this analysis, conifer seedlings planted in the years
following treatment contributed relatively little to changes in forest structure during the study.
Pre-commercial thins included all treatment types that targeted non-merchantable trees
and shrubs. These thinnings were carried out in early successional forest habitats usually by
mechanical masticators and to a lesser extent by hand (e.g., chainsaws).

Page 6
2.3. Sampling design
To evaluate the response of the avian community to the three fuels reduction treatments,
we compared bird abundance following treatment to pre-treatment and untreated reference sites.
To identify sampling locations that would be treated, we worked with USFS personnel in the
initial years of the study to identify 10 projects where fuels treatments were planned. Within
these projects, we placed avian point count stations in units that were prioritized for treatment
and in units not slated for treatment in the same sub-watersheds.
Following 10 years of point count surveys at these sites, we used the USFS Forest
Service Activity Tracking System geo-database and USFS personnel to determine the treatment
status of each of our point count stations in each of these projects for each year. We then
identified all point count stations for which we had at least one year of pre-treatment bird data
and one year of post-treatment data from at least two breeding seasons following treatment. We
excluded data from the first breeding season following treatment to reduce the influence of
lagged responses to vegetation change (Seavy and Alexander, 2011).
For shaded fuel breaks and pre-commercial thins, we considered a station to be treated if
the point count station center was within the footprint of the treatment, no matter how far from
the edge of the treatment it was located. Because individual group selections had relatively small
footprints (13 – 50 m radius circles), but a potentially large effect (removal of all trees) we
considered point count stations that were not within the treatment footprint but fell within 25m of
the edge of a group selection as treated. Any sites that received more than one treatment during
the study period or were affected by wildfire were excluded from analysis once the second
treatment or fire occurred.
Our study was conducted between 2002 and 2011 (10 years). By the end of the study, we
had 122 point count stations in shaded fuel breaks (in 18 treatment units and 7 different USFS
projects), 49 point count stations in pre-commercial thins (7 treatment units and 4 USFS
projects), and 17 point count stations in group selections (8 treatment units and 2 USFS projects;
Fig. 1). Treatment of these units was completed between 2002 and 2009, and monitoring data
included in this analysis spanned up to eight years for shaded fuel breaks (2004 – 2011) and up
to 10 years (2002 – 2011) for group selections and pre-commercial thins. Treatments were not all
initiated in the same year, thus not all point count stations were monitored during the same years,
Page 7
such that for any point count station the number of pre-treatment years of data varied from one to
five, and the number of post-treatment years varied from two to six.
In addition to using pre- and post-treatment surveys to evaluate changes associated with
fuels treatments, we also wanted to compare these points to the natural variability in bird
abundance at reference sites that remained untreated during the entire study period. Reference
sites were selected from a pool of point count stations that were either identified to be treated but
never treated, or were identified as reference sites in stands within the same sub-watersheds as
the treated stands. The reference site pool consisted of over 500 points all of which occurred
within at least 5km of at least one treated stand. From this pool, we eliminated any point count
stations that were <100 m from any fuels treatment implemented between 1999 (the first year for
which reliable treatment data was available) and 2011. We also removed points that were <250
m from wildfires that had burned since 1992 (10 years prior to our study). We then used the
abundance of 15 avian study species (see below) in a cluster analysis of reference and pre-
treatment point count locations. Using the dendrogram generated from the cluster analysis, we
identified reference points that had bird communities most similar to those at the pre-treatment
points, and then selected a number of reference points that was equal to the number of treatment
points for each of the three treatment types.
2.4. Measuring vegetation structure
We collected vegetation data across a 50-m radius plot centered on the point count
station. On these plots we made ocular estimates of the percent cover of overstory trees (>5 m),
understory trees (<5 m), shrubs, and herbaceous vegetation, and counted all snags in two DBH
size categories (10-30 cm and > 30 cm). We collected vegetation data at all 122 shaded fuel
break point count stations both pre- and post-treatment; 38 of 49 pre-commercial thin stations
pre-treatment and 29 post-treatment; 17 of 17 group selection stations pre-treatment and 9 post-
treatment; and all reference stations for each treatment. Vegetation data were collected at treated
sites 1 to 4 years prior to treatment and 1 to 4 years following treatment, and at reference sites
once at the beginning of the study from 2003-2005.
Page 8
2.5. Measuring bird abundance
The avian community was sampled using five-minute point count surveys (Reynolds et
al., 1980; Ralph et al., 1995). In this method points are clustered in transects, but data are only
collected at the individual point. All birds detected at each point during the five-minute survey
were recorded according to their initial distance from the observer. All observers underwent an
intensive, three-week training period focused on bird identification and distance estimation prior
to conducting surveys, and laser rangefinders were used to assist in distance estimation at every
survey point. Surveys began around local sunrise, were completed within four hours, and did not
occur in inclement weather (rain, snow, or wind > 20kph). All sites were surveyed two times in
each year and observers were rotated between visits within years. All point count stations were at
least 230 m apart.
2.6. Ecological inference
We evaluated changes in vegetation structure that occurred as a result of the treatment to
verify that these changes were generally consistent with the desired effects of the fuels reduction
prescriptions, and to compare the variability of treated sites to the variability in forest structure at
reference sites.
We identified a suite of 15 bird species to use to evaluate the ecological effects of fuels
treatments. The species were chosen because they (1) were detected in sufficient numbers to
allow for meaningful statistical analysis (Nur et al. 1999), (2) were appropriately sampled using
the standardized point count survey method (Ralph et al. 1993), and (3) represented a range of
ecological conditions found throughout our study area (Chase and Guepel 2005). To select these
species, we began with the California Partners in Flight Coniferous Forest Bird Conservation
Plan (CalPIF 2002), and then supplemented this list with seven additional species that
complemented the CalPIF focal species. The list included permanent residents, short-distance
migrants, and Neotropical migrants; and ranged in habitat associations from mature dense
canopy forest species to early successional chaparral species.
Based on our local knowledge and published information about the habitat associations of
these 15 species, we grouped them into three guilds representing shared associations with forest
structure and composition. The forest canopy guild species were associated with relatively
mature forest stands with considerable canopy closure: Golden-crowned Kinglet (Regulus

Page 9
satrapa), Hermit Warbler (Setophaga occidentalis), Red-breasted Nuthatch (Sitta canadensis),
Hammond’s Flycatcher (Empidonax hammondii), and Brown Creeper (Certhia americana). The
understory guild species were associated with low-growing foliage (broadleaf shrubs and
herbaceous species) and often more open stand conditions: Dark-eyed Junco (Junco hyemalis),
Dusky Flycatcher (Empidonax oberholseri), Fox Sparrow (Passerella iliaca), Nashville Warbler
(Oreothlypis ruficapilla), and MacGillivray's Warbler (Geothlypis tolmiei). Finally, the forest
edge guild species were those that occur primarily along forest edges or in areas with breaks in
the canopy: Olive-sided Flycatcher (Contopus cooperi), Western Tanager (Piranga ludoviciana),
Chipping Sparrow (Spizella passerina), Mountain Chickadee (Poecile gambeli), and Yellow-
rumped Warbler (Setophaga coronata).
We hypothesized that if the treatments had ecologically meaningful effects for birds, then
species in the canopy guild would respond negatively to all three fuels reduction treatments,
species in the edge guild would respond positively to all three treatments, and species in the
understory guild would respond negatively to shaded fuel breaks and especially pre-commercial
thinning, and have a neutral or positive response to the group selection treatment.
Finally, we used the number of species detected at each point as a measure of species
richness to evaluate the effects of fuels treatments on the avian community. Because managers
are often encouraged to manage for diversity, we wanted to be able to ask if on average there
were more or fewer bird species detected at a point after fuels treatments were implemented. We
hypothesized that if treatments provided greater structural heterogeneity in vegetation, that the
number of bird species per point would increase, whereas if they created greater homogeneity in
vegetation structure, the number of species per point would decrease (Verner and Larson 1989).
2.7. Data analysis
To analyze changes in vegetation structure, we evaluated the difference between pre and
post-treatment vegetation using a two-tailed student t-test with unequal variance for each of the
five vegetation metrics. Although multiple tests inflate the table-wide error rate (Rice 1989), we
chose not to use Bonferroni corrections in our interpretation of p-values, following instead the
recommendations of Moran (2003): we report exact p-values, used an uncorrected α of 0.05, and
interpret the change in vegetation in the context of ecological significance to the bird species of
interest.

Page 10
For our analysis of changes in bird abundance, we were initially concerned that
detectability may have varied among treatments. To evaluate detectability, we began by fitting
an imperfect-detection mixture model that considered a single Poisson mean of abundance and a
single probability of detection per treatment level (Zuur et al., 2009) using package “pscl”
(Zeileis et al., 2008) in program R (R Core Development Team, 2011). With this model, we
assumed repeated visits to a point generated independent estimates of density for the treatment
level. This assumption had little bearing on our analyses, since its main consequence would be
that of underestimating the variance around the parameters in the model (Oksanen, 2001; Millar
and Anderson, 2004), in particular variance around the probability of detection. These models
showed substantial congruence in estimates of probability of detection between treatment levels
for all species in our study (none showed statistically significant differences, see Appendix A).
Thus, even with underestimated variances, the model failed to detect any differences in
probability of detection among treatment conditions. Because we found little evidence for
substantial variation in detection probabilities among treatments, for our final analysis we fitted a
simpler random-effects generalized linear model to the data using the R package “lme4” (Bates
et al., 2011), instead of opting for the more complex hierarchical imperfect detection models
(Royle, 2004). These random-effects generalized linear models were more appropriate for our
study design than the initial imperfect-detection mixture models because they allowed us to use
random-effects to accommodate the spatially-nested structure of our data.
We initially were interested in evaluating the effect of time since treatment on the avian
community but preliminary analysis revealed few patterns and analyzing each year separately
significantly reduced our power to detect effects. Thus, we considered the overall treatment
effects by pooling data across all post-treatment years and controlling for annual variation.
In our final models we considered counts (the response parameter) to be the maximum
number of detections within 50 m of the point across the two surveys at a point in a year. We
recognized that this metric reflects both true densities at a point and the probability of detecting
all individuals given that a species is present (Royle and Nichols, 2003), but given the lack of
evidence that detectability varied among treatments, it provides a useful index of true density of
these species (Johnson 2008).
Because the maximum counts were discrete, we used a Poisson link function for
generalized linear model with random and fixed effects using “lme4” package (Bates et al.,

Page 11
2011) in R. Random-effect models are well suited to capture nested designs such as ours, where
survey points are clustered in space (ie transects; Pinheiro and Bates, 2000). Random effects on
the intercept parameter included year and the factor transect:point, or year, transect and point
(i.e., two competing models). The random effect of year on the intercept captures the variation
across years in density, the random effect due to transect captures regional differences in density,
and the point effect captures differences among points. The factor transect:point captures the
differences among points but within the nested relationship of points within transects (Pinheiro
and Bates, 2000). We included a single fixed effect that categorized the condition of point as
reference, pre-treatment, or post-treatment. We chose the model that best fit the data by value of
AIC coefficient.
In addition to analyzing the abundance of the 15 species individually, we also evaluated
the overall effect of these treatments on each guild by considering species as a random effect.
Finally, to evaluate the effects of treatments on bird richness (i.e., number of species) at a point,
we used a random-effect models as described above, but with response parameter being the
maximum number of species recorded at a point in a year across both visits.
Although the mixed-effects models produce estimates and standard errors for the effects
of treatment levels, we did not consider analysis of differences between these estimates.
Nevertheless, some patterns are evident and we illustrate these through plots of mean values and
confidence limits contrasting treatment effects.
We evaluated the evidence for an effect of treatment based on three factors: 95%
statistical significance between treated and pre-treatment (confidence intervals did not overlap
means), the magnitude of change from pre to post-treatment, and by comparing post-treatment
and reference site means and confidence intervals.
3. Results
3.1. Vegetation structure
All five vegetation characteristics we measured were lower in post-treatment than pre-
treatment or untreated sites. Across all treatments the most consistent change in vegetation
structure following treatment was a reduction in snags. In shaded fuel breaks the number of large
snags (>30 cm DBH) was reduced by 50% following treatment (P = 0.009; Fig. 2). Similarly,
group selections (P = 0.03) saw a significant reduction in large snags. Snags were rarest pre-

Page 12
treatment in pre-commercial thins and were reduced modestly following treatment (P = 0.61).
After treatments were implemented, large snag density was highest in shaded fuel breaks (4.2/ha)
and lowest in group selections (2.2/ha). Small snags showed similar patterns. Shaded fuel breaks
had significantly less overstory (P < 0.001) and understory tree cover (P < 0.001) following
treatment, shrub cover showed a modest decrease (P = 0.05), and herbaceous cover showed little
change (Fig. 2). In group selections, we observed some of the largest changes in vegetation
structure, with most being significantly different from pre-treatment conditions. These treatments
showed the largest percent change in overstory (P < 0.001) and understory tree cover (P = 0.002)
and herbaceous cover (P = 0.05) of any treatment (Fig. 2). There was little evidence of a
difference in shrub cover following treatment (Fig. 2). Understory tree (P = 0.002), shrub (P <
0.001), and herbaceous cover (P = 0.03) all decreased significantly following pre-commercial
thinning, while overstory tree cover showed only a small decrease (Fig. 2).
To summarize, we observed substantial changes in vegetative structure with the majority
of metrics showing over 30% reduction following treatment. Post-fuel reduction conditions
across each of these treatments were characterized by low snag densities, low (group selection)
to moderate canopy cover, little understory tree cover, moderate shrub cover, and little
herbaceous cover. In terms of changes from pre-treatment conditions we found the effects of
treatment on vegetation structure strongest in group selections, followed by pre-commercial
thins, and weakest in shaded fuel breaks.
3.2. Bird response to treatments
The fifteen species we selected to evaluate the effects of fuels treatments on the avian
community accounted for 82% of all bird detections within our 50 m radius sample across
treatment types and years, and included the ten most detected species. Among our focal species,
Dusky Flycatcher represented the largest proportion with 11% of all detections while Chipping
Sparrow was the smallest proportion accounting for 0.45% of all detections.
When we combined species into habitat guilds, in shaded fuel breaks the abundance of
each guild showed little change as a result of treatment; in group selections there was weak
evidence of a decrease for canopy species and an increase for understory species, and no change
for edge species as a result of the treatment; in pre-commercial thins there was weak evidence for
a decrease in the abundance of canopy and understory species and no change for edge species as

Page 13
a result of the treatment (Fig. 3). Across all guilds and treatments there was substantial overlap of
the 95% confidence intervals (Fig. 3).
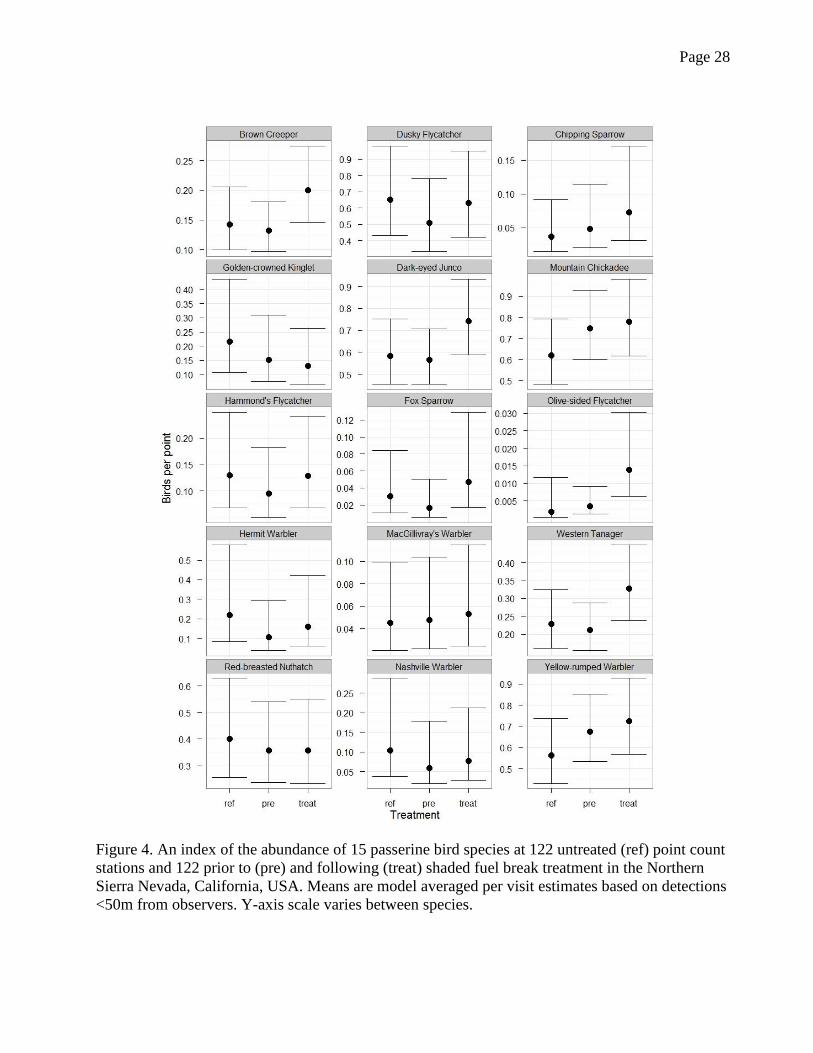
In post-treatment shaded fuel breaks the abundance of 14 of the 15 focal species was
equal to or greater than prior to treatment, with five species showing a significant increase from
pre to post treatment condition (Fig. 4): one mature forest (Brown Creeper), two understory (Fox
Sparrow and Dark-eyed Junco), and two edge species (Olive-sided Flycatcher and Western
Tanager). Golden-crowned Kinglet was the only species less abundant at treated sites, and this
difference was small and not statistically significant. At treated sites, the abundance of species in
the edge and understory guilds were equal to or greater than at reference points, while the canopy
guild species were equal to or lower than at reference points; the exception was Brown Creeper,
which was far more abundant at post-treatment points.
In group selections, the abundance of 8 out of 14 species was equal or greater following
treatment (Fig. 5). We were unable to produce a meaningful comparative model for the 15th
species, Olive-sided Flycatcher, due to a near absence of records at reference and pre-treatment
group selection points, although their results are included (Fig. 5). We interpreted our results as
showing five species responding positively and four negatively to group selections. Of these,
three positive responses (Dark-eyed Junco, Fox Sparrow, and Chipping Sparrow) and one
negative response (Brown Creeper) were statistically significant. One edge and four understory
associates were among those with a positive response while all four species with a negative
response were mature forest-closed canopy associates. The abundance of mature forest species
was generally lower at post-treatment points than reference, understory species were generally
more abundant at post-treatment points than reference, and edge species showed no consistent
pattern.
For the pre-commercial thins we interpreted the response of three species to be positive
and five to be negative, of which all but one (MacGillivray’s Warbler) was statistically
significant (Fig. 6). All three of the positive responses were species associated with open forest
and edges, while those having a negative response included three mature forest-closed canopy
species (Brown Creeper, Hammond’s Flycatcher, and Hermit Warbler) and two understory
species (MacGillivray’s Warbler and Nashville Warbler). Despite the apparent decrease in
abundance following treatment, the mature forest species were all more abundant at post-
treatment points than reference points, as were all of the edge species, while two understory

Page 14
species were more abundant in post-treatment points and three were less abundant than reference
points.
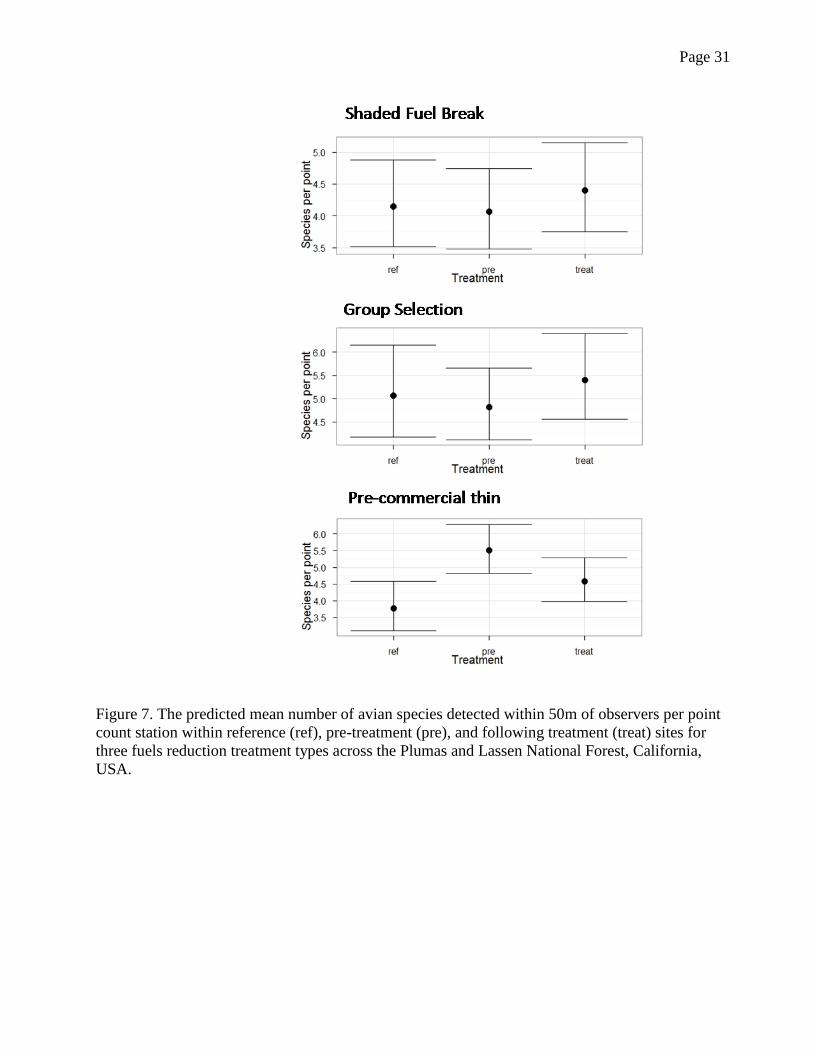
In post-treatment sites overall avian species richness was highest in group selections and
lowest in shaded fuel breaks. Richness showed a modest non-significant increase in shaded fuel
breaks and group selections following treatment and a significant decrease at pre-commercial
thins (Fig. 7).
4. Discussion
4.1. Overview
Mechanical fuels reduction treatments, as employed in our study area, appear capable of
altering the suitability of habitat for conifer-forest-breeding passerine bird species, in both
negative and positive directions depending on the species, species guild, or treatment type.
Though there are several limitations to this study, due to its relatively large sample size and
geographic scope it fills an important gap in information about the effects of fuel treatments on a
group of wildlife species that occupy a broad range of habitat conditions in the Sierra Nevada
ecosystem and contributes to the growing body of literature on the effects of fuels treatments on
forested ecosystems across North America.
4.2 Ecological effects of fuels treatments
The changes in avian community metrics we evaluated were less extreme than we
expected based on changes observed in the forest structure we observed, both in terms of
statistical significance and overall effect size.
In our analysis of avian guilds, we generally found little support for an ecological effect
of the treatments given the modest and uncertain response of the species combined. This is
consistent with a recent meta-analysis of the effects of fuel treatments on birds and supports their
conclusion to be cautious in assuming consistent responses to these treatments among species of
with similar habitat associations (Fontaine and Kennedy, 2012). The closed canopy-mature forest
guild showed the most consistent responses of any guild. They responded negatively to group
selection and pre-commercial thins as we predicted, but had a neutral to slightly positive
response to shaded fuel break treatments, the latter contrary to our prediction. In fact, one
Page 15
species, the Brown Creeper, showed the strongest positive response to shaded fuel break
treatment of any species, nearly doubling in abundance following treatments.
However, when individual species were considered, in general decreases in the
abundance of mature-forest closed-canopy associates, and increases in the abundance of species
associated with edge and open forest conditions, provide evidence of an ecological effect on the
bird community that is consistent with the observed changes in forest structure.
Of the treatments we investigated, group selections, though small in size, appear to have
the most substantial effects on the avian community. Consistent with our predictions, the closed
canopy guild responded negatively and edge species had a neutral to positive response. But,
contrary to our predictions, the understory guild responded positively even though we did not
detect a change in shrub cover after treatment. It is possible that the species composition of
shrubs changed – away from ground-cover species to the more erect plant species that supply the
preferred nesting structure for many of these species.
4.2. Caveats and limitations
This study investigated the short-term effects (2 – 6 years post-treatment) of fuel
reduction activities, and thus provides an incomplete picture of treatment effects on breeding
landbirds. Post-treatment successional processes may result in considerable change at these sites
over longer time periods, though recent evidence suggests that at least shaded fuel breaks in the
Northern Sierra exhibit little vegetative change in at least the first 10 - 15 years following
treatment (L. Chiono pers. comm.).
The results of this study should also be considered in the context of the conditions that
existed in the study area prior to implementation of these treatments as the entire study area had
been subjected to a century of timber harvest and fire suppression.
Our analysis was focused primarily on species that are fairly common to abundant. We
lacked sufficient data for rarer species to conduct meaningful analysis of the effects of these
treatments on their abundance. For the two rarer species we did include (Olive-sided Flycatcher
and Chipping Sparrow) error around estimates is large and in one case we were unable to fit a
model, thus justifying our exclusion of even less common species. It is possible the species that
are most sensitive to silvicultural treatments may be the less common ones in these forests that
have been actively managed with mechanical treatments for over a century. However, the

Page 16
avifauna of the Sierra Nevada is still rather intact with no upland species in our study area listed
as threatened or endangered. We hypothesize that the upland avifauna of the Sierra Nevada are
adapted to regular disturbance. Other studies in western North American forests have shown that
few if any landbird species appear to be negatively affected by fragmentation or habitat edges
(McGarigal and McCombs, 1995; Scheick et al., 1995; Tewskbury et al., 1998, 2006; George
and Dobkin, 2002). The consistent large reduction in snags we observed as a result of these
treatments has the potential to affect woodpecker species, though other studies have shown
primarily positive fuels treatment effects for most woodpecker species (Fontaine and Kennedy,
2012).
Our group selection sample size was small (17 points) and limited to a relatively small
portion of our overall study area. Our power to detect effects was small and caution is advised in
extrapolating the effects we did find to other portions of the Sierra Nevada. Further study of the
effects of these treatments on the avian community in the Sierra Nevada is needed.
Finally, it is important to consider that this study only investigated the abundance patterns
of species and not demographic parameters (productivity or survival). In some systems, the
abundance (or density) of birds may (Bock and Jones, 2004) or may not (Van Horne, 1983) be a
good estimate of the viability of habitat for a species, in particular when it may take longer than
the span of our study to detect changes in abundance driven by changes in productivity, survival,
and the immigration of birds from surrounding source areas (Sallabanks et al., 2000; Griesser et
al. 2007).
4.3. Management implications
If an objective of these treatments is to minimize negative impacts to wildlife, they
appear to have been fairly successful, as the magnitude of difference for most species between
pre and post-treatment were relatively modest and all species present prior to treatment were
present following treatment. However, a number of disturbance-dependent species were rare in
pre-treatment sites and, though some may have increased, they were still quite rare following
treatment (e.g. Fox Sparrow & Olive-sided Flycatcher). A frequently-stated objective for
mechanical fuels reductions is to mimic the effects of natural disturbance in forested ecosystems
(Fontaine and Kennedy 2012, Stephens et al. 2012). As such, an approach that considers the
strategic placement of fuel treatments outside of late successional closed-canopy habitats (e.g.

Page 17
spotted owl home range core areas) and designs fuel reductions to benefit disturbance dependent
species in western forest may be a more prudent approach to manage for biological diversity
(Hurteau et al. 2007, Fontaine et al. 2009). A number of the open forest and understory species
we investigated, as well as a number of other species too rare in our study area to evaluate (e.g.
Lazuli Bunting and Mountain Bluebird), reach their greatest abundance in post-fire habitat.
These treatments, at least in the short term, appear ineffective in creating habitat that supports
equivalent densities of these species as in areas burned in wildfires in the region based on results
of an ongoing study in the region (PRBO data), and reinforces the results of a recent meta-
analysis of the effects of fire and fire surrogate treatments on birds (Fontaine and Kennedy
2012).
Most of the shrub-nesting species we evaluated were uncommon in shaded fuel break
treatments prior to and following treatment. In order to more effectively mimic the mosaic
patterns created through natural disturbance and benefit a greater number of species dependent
upon those disturbances we suggest - where appropriate – shaded fuel break treatments that
consider a greater variation in canopy cover (Chambers et al., 1999; Hagar et al., 2004; Siegel
and DeSante, 2003). Mechanical treatments that significantly reduce canopy cover or create
canopy gaps can result in increased abundance of middle- and understory-associated landbirds in
western forests and overall avian diversity (Hansen et al., 1995; Siegel and DeSante, 2003;
Hagar et al., 2004). Additionally, many forest-interior associated birds may benefit from small
gaps in mature forest as they utilize the unique resources those gaps provide such as nectar, fruit,
seeds and deciduous associated insects (Vitz and Rodewald, 2006; Greenberg et al., 2007;
Altman and Hagar, 2007). We found a modest negative effect of group selection treatments on
mature forest birds thus the benefits of forest openings to these species may manifest over longer
time periods after understory vegetation has been re-established; further study is needed to
determine the long-term value or detriment of small forest openings to closed canopy associated
species in the Sierra Nevada.
The importance of forest structural diversity for landbirds in western forests is well
established (Beedy, 1981; Verner and Larson, 1989; Wilson and Comet 1996). Fuel treatments
that remove structure can have negative impacts on a number of avian species while benefiting
relatively few (Rodewald and Smith 1998), as we found with pre-commercial thinning.
Interestingly, the mature forest species had the strongest negative response to these treatments
Page 18
along with the ground nesting and hardwood associated Nashville Warbler. Variable canopy
cover and understory retention in both pre-commercial thins and shaded fuel breaks should allow
for greater structural diversity by invigorating or maintaining shade intolerant understory plant
assemblages utilized by a large number of avian species in these forests (Hagar et al., 2004).
Since treating surface fuels through prescribed fire following mechanical treatments has
been shown to be more effective fuel treatment than mechanical treatments alone (Stephens and
Moghaddas, 2005; Stephens et al., 2009), it is unfortunate we were not able to evaluate the
effects of fuels treatments and prescribed fire on the avian community in our study. The fact that
we had a very small sample of sites that had been burned suggests the limited application of
prescribed fire in these forests. Fontaine and Kennedy (2012) recently summarized effects of
these combined treatments across fire prone forests of North America but they did not present
results showing effects of these combined treatments for any of our study species. They found
that responses to mechanical-plus-fire treatments had greater effects than either treatment alone,
but they found no interactions where a species response switched (e.g. from positive to negative)
following the addition of fire to mechanically treated stands. Studies should be conducted
evaluating the combined effect of these treatments as prescribed burning following mechanical
treatments becomes more commonplace in the Sierra Nevada (Safford et al. 2012).
5.1 Conclusions
Management decisions should be made in the context of current trends in forest structure
and disturbance patterns in order to strike a balance that ensures the full complement of habitat
types and structural characteristics to support the range of biological diversity dependent on fire-
adapted western forests systems. The goal of land management may not always be to maximize
the number of species that benefit from a treatment while minimizing those that do not. Such a
species-richness oriented approach may lead to more homogenization of the landscape and
declines in species with particular ecological needs. We suggest that a landscape-based
ecological approach is prudent, promoting an increase in late successional habitat in some
locations while prescribing greater reductions in canopy cover that mimic natural disturbance
patterns in areas where biological diversity is relatively low (e.g. closed canopy mid successional
stands). Under current management strategies being implemented on National Forest lands in the
Sierra Nevada, the loss of late-seral forest, landscape heterogeneity, and fire-dependent habitats

Page 19
appear to be the greatest threat to biodiversity. A balanced approach using a full range of
management tools and prescriptions is advisable to ensure biodiversity is sustained.
Acknowledgements
Funding for this project was provided by the Lassen and Plumas National Forests and a
grant from the Resources Legacy Fund’s Western Conservation Program. Specifically we thank
Colin Dillingham of the Plumas National Forest, Coye Burnett of the Lassen National Forest,
Peter Stine the USFS National Coordinator for Experimental Forests and Ranges, and Rick
Bottoms of the USFS Pacific Southwest Research Station for their support and logistical
assistance with this project over many years. We are also grateful to the dozens of field
biologists who collected all of the data used in this manuscript. This is PRBO contribution
number 1912.
References
Alexander, J.D., Seavy, N.E., Hosten, P., 2007. Using bird conservation plans to evaluate
ecological effects of fuels reduction in southwest Oregon oak woodland and chaparral.
Forest Ecology and Management 238, 375–383.
Altman, B. Hagar, J., 2007. Rainforest birds: a land managers guide to breeding bird habitat in
young conifer forests in the Pacific Northwest. U.S. Geological Survey, Scientific
Investigations Report 2006 – 5304.
Beaty, R.M., Taylor, A.H., 2008. Fire history and the structure and dynamics of a mixed conifer
forest landscape in the northern Sierra Nevada, Lake Tahoe Basin, California, USA.
Forest Ecology and Management 255, 707-719.
Bates, D., Maechler, M., Bolker, B. 2011. lme4: Linear mixed-effects models using S4
classes. R package version 0.999375-42.
Beedy, E.C. 1981. Bird communities and forest structure in the Sierra Nevada of California. The
Condor 83, 97-105.
Bock C.E., Jones, Z.F., 2004. Avian habitat evaluation: should counting birds count? Front. Ecol.
Environ. 2, 403–410
CALPIF (California Partners in Flight). 2002. Version 1.0. The coniferous forest bird
conservation plan: a strategy for protecting and managing coniferous forest habitats and

Page 20
associated birds in California (J. Robinson and J. Alexander, lead authors). Point Reyes
Bird Observatory, Stinson Beach, CA. http://www.prbo.org/calpif/plans.html.
Chambers, C.L., McComb, W.C., Tappeiner, J.C., II., 1999. Breeding bird responses to three
silvicultural treatments in the Oregon Coast Range. Ecological Applications 9, 171-185.
Chase, M.K., Geupel, G.R., 2005. The use of avian focal species for conservation planning in
California. In C.J. Ralph and T.D. Rich (eds.), Bird Conservation Implementation and
Integration in the Americas: Proceedings of the Third International Partners in Flight
Conference. USDA Forest Service Publication, Gen. Tech. Rep. PSW-GTR-191, Albany,
CA.
Collins, B.M., Moghaddas, J.J., Stephens, S.L., 2007. Initial changes in forest structure and
understory plant communities following fuel reduction activities in a Sierra Nevada
mixed conifer forest. Forest Ecology and Management 239, 102-111.
Collins, B.M., Stephens, S.L., Moghaddas, J.J., Battles, J., 2010. Challenges and approaches in
planning fuel treatments across fire-excluded forested landscapes. Journal of Forestry
108, 24-31.
Collins, B.M., Everett, R.G., Stephens, S.L., 2011. Impacts of fire exclusion and recent managed
fire on forest structure in old growth Sierra Nevada mixed-conifer forests. Ecosphere 2,
1-14.
Fontaine, J.B., Kennedy, P.L., 2012. Meta-analysis of avian and small-mammal response to fire
severity and fire surrogate treatments in US fire-prone forests. Ecological Applications
22, 1547-1561.
Hagar, J., Howlin, S., Ganio, L., 2004. Short-term response of songbirds to experimental
thinning of young Douglas-fir forests in the Oregon Cascades. Forest Ecology and
Management 199, 333-347.
Hansen, A.J., McComb, W.C., Vega, R., Raphael, M.G., Hunter, M., 1995. Bird habitat
relationships in natural and managed forests in the west cascades of Oregon. Ecological
Applications 5, 555-569.
HFQLG (Herger-Feinstein Quincy Library Group Forest Recovery Act) 1999. Final
Environmental Impact Statement, U.S. Department of Agriculture, Forest Service,
Pacific Southwest Region, Vallejo, CA.
http://www.fs.fed.us/r5/hfqlg/publications/1999_feis/TOC.htm

Page 21
Hurteau, S.R., Sisk, T.D., Block, W.M., Dickson, B.G., 2008. Fuel-reduction treatment effects
on avian community structure and diversity. Journal of Wildlife Management 72, 1168-
1174.
Hutto, R.L., 1998. Using landbirds as an indicator species group. In: Marzluff, J.M., Sallabanks,
R. (Eds.), Avian Conservation: Research and Management. Island Press, Covelo,
California, pp. 75–92.
Hutto R.L. and R.T. Belote. 2013. Distinguishing four types of monitoring based on the
questions they address. Forest Ecology and Management 289:183-189.
George, T.L, Dobkin, D.S., (eds.). 2002. Effects of habitat fragmentation on birds in western
landscapes: Contrasts with paradigms from the eastern U.S. Studies in Avian Biology 25,
270 p.
Gram, W.K., Sork, V.L., Marquis, R.J., Renken, R.B., Clawson, R.L., Faaborg, J., Fantz, D.K.,
Le Corff, J., Lill, J., Porneluzi, P.A., 2001. Evaluating the effects of ecosystem
management: a case study in Missouri Ozark forest. Ecol. Appl. 11, 1667–1679.
Greenberg, C.H., Tomcho, A.L., Lanham, J.D., Waldrop, T.A., Tomcho, J., Phillips, R.J., Simon,
D., 2007. Short-term effects of fire and other fuel reduction treatments on breeding birds
in a Southern Appalachian upland hardwood forest. Journal of Wildlife Management 71,
1906-1916.
Griesser, M., Nystrand, M., Eggers, S., Ekman, J., 2007. Impact of forestry practices on fitness
correlates and population productivity in an open-nesting bird species. Conservation
Biology, 21, 767-774.
Johnson, D.H. 2008. In defense of indices: the case of bird surveys. Journal of Wildlife
Management 72, 857-868.
Lee, D.C., Irwin, L.L., 2005. Assessing risks to spotted owls from forest thinning in fire-adapted
forests of the western United States. Forest Ecology and Management 211, 191-209.
Millar, R.B., Anderson, M.J., Remedies for pseudoreplication. 2004. Fisheries Research 70, 397-
407.
McGarigal, K., McComb, W.C., 1995. Relationships between landscape structure and breeding
birds in the Oregon Coast Range. Ecological Monographs 65, 235-260.
Nur, N., Jones, S.L., Geupel, G.R., 1999. Statistical guide to data analysis of avian monitoring
programs. U.S. Fish & Wildlife Service, Biological Technical Publication R6001-1999.
Page 22
Oksanen, L. 2001. Logic of experiments in ecology: is pseudoreplication a pseudoissue? Oikos
94, 27–38.
Pinheiro, J.C., Bates, D.M., 2000. Mixed-effects models in S and S-PLUS. Springer Verlag.
R Development Core Team. 2009. R: a language and environment for statistical computing. R
Foundation for Statistical Computing, Vienna, Austria.
Ralph, C.J., Geupel, G.R., Pyle, P., Martin, T.E., and DeSante, D.F., 1993. Field Methods for
Monitoring Landbirds. U.S. Department of Agriculture, Forest Service, General
Technical Report PSW-144.
Ralph, C.J., Droege, S., Sauer, J.R., 1995. Managing and monitoring birds using point counts:
standards and applications. In C. J. Ralph, J. R. Sauer and S. Droege (eds.), Monitoring
Bird Populations by Point Counts. USDA Forest Service Publication, Gen. Tech. Rep.
PSW-GTR-149, Albany, CA .
Reynolds, R.T., Scott, J.M., Nussbaum, R.A., 1980. A variable circular plot method for
estimating bird numbers. Condor 82, 309:313.
Rodewald, P.G., Smith, K.G., 1998. Short-term effects of understory and overstory management
on breeding birds in Arkansas oak-hickory forests. The Journal of Wildlife Management
62, 1411-1417.
Royle, J.A. 2004. N-mixture models for estimating population size from spatially replicated
counts. Biometrics 60: 108-115.
Royle, J.A., Nichols, J.D., 2003. Estimating abundance from repeated presence-absence data or
point counts. Ecology 84, 777-790.
Safford, H.D., Stevens, J.T., Merriam, K., Meyer, M.D., Latimer, A.M., 2012. Fuel treatment
effectiveness in California yellow pine and mixed conifer forests. Forest Ecology and
Management 274, 17-28.
Sallabanks, R., Arnett, E.B. Marzluff, J.M., 2000. An evaluation of research on the effects of
timber harvest on bird populations. Wildlife Society Bulletin 28, 1144-1155.
Schieck, J.K., Lertzman, B., Nyberg, B., Page, R., 1995. Effects of patch size on birds in old-
growth montane forests. Conservation Biology 9, 1072-1084.
Schoennagel, T., Nelson, C.R. 2011. Restoration relevance of recent National Fire Plan
treatments in forests of the western United States. Front. Ecol. Environ 9, 271-277.
Page 23
Seavy, N. E., Alexander, J. D., 2011. Interactive effects of vegetation structure and composition
describe bird habitat associations in mixed broadleaf–conifer forest. Journal of Wildlife
Management, 75, 344-352.
Seavy, N. E., Alexander, J.D., Hosten, P.E., 2008. Bird community composition after mechanical
mastication fuel treatments in southwest Oregon oak woodland and chaparral. Forest
Ecology and Management 256, 774-778.
Siegel, R.B., DeSante, D.F., 2003. Bird communities in thinned versus unthinned sierran mixed
conifer stands. Wilson Bulletin 115, 155-165.
Stephens, S.L, Moghaddas, J.J., 2005. Experimental fuel treatment impacts on forest structure,
potential fire behavior, and predicted tree mortality in a California mixed conifer forest.
Forest Ecology and Management 215, 21-36.
Stephens, S.L., Moghaddas, J.J., Edminster, C., Fiedler, C.E., Haase, S., Harrington, M., Keeley,
J.E., Knapp, E.E., McIver, J.D., Metlen, K., Skinner, C.N., Youngblood, A., 2009. Fire
treatment effects on vegetation structure, fuels, and potential fire severity in western U.S.
forests. Ecological Applications 19, 305-320.
Stephens, S.L., McIver, J.D., Boerner, R.E.J., Fettig, C.J., Fontaine, J.B., Hartsough, B.R.,
Kennedy, P.L., Schwilk, D.W., 2012. The effects of forest fuel-reduction treatments in
the United States. Bioscience 62, 549-560.
Stine, P., Landram, M., Keane, J., Lee, D., Laudenslayer, B., Weatherspoon, P., and Baldwin, J.
2002. Fire and fuels management, landscape dynamics, and fish and wildlife resources:
An integrated research plan for the Herger-Feinstein Quincy Library Group Pilot Study
Area. http://www.fs.fed.us/psw/programs/snrc/forest_health/plas_studyplan.pdf
Tewksbury, J.J., Hejl, S.J., Martin, T.E., 1998. Fragmentation in a western landscape: forest
fragmentation does not reduce nesting success. Ecology 79, 2890-2903.
Tiedemann, A.R., Klemmedson, J.O., Bull, E.L., 2000. Solution of forest health problems with
prescribed fire: are forest productivity and wildlife at risk? Forest Ecology and
Management 127, 1–18.
Vanderwel, M.C., Malcom, J.R., Mills, S.C., 2007. A meta‐analysis of bird responses to uniform
partial harvesting across North America. Conservation Biology 21, 1230-1240.
Van Horne, B. 1983. Density as a misleading estimate of habitat quality. The Journal of Wildlife
Management 47, 893-901.

Page 24
Verner, J., Larson, T.A., 1989. Richness of breeding bird species in mixed-conifer forests of the
Sierra Nevada, California. Auk 106, 447-463.
Vitz, A.C. Rodewald, A.D., 2006. Can regenerating clearcuts benefit mature-forest songbirds?
An examination of post-breeding ecology. Biological Conservation 127, 477-486.
Vos, P., Meelis, E., Ter Keurs, W.J.A., 2000. A framework for the design of ecological
monitoring programs as a tool for environmental and nature management. Environ.
Monit. Assess. 61, 317–344.
Wayman R.B. North, M., 2007. Initial response of a mixed-conifer understory plant community
to burning and thinning restoration treatments. Forest Ecology and Management 239, 32-
44.
Wilson, M..F., Comet, T.A., 1996. Bird communities of northern forests: ecological correlates of
diversity and abundance in the understory. Condor 98, 350-362.
Zeileis, A., Kleiber, C., and Jackman, S. 2008. Regression Models for Count Data in R. Journal
of Statistical Software 27, 1-25.
Zuur, A.F., Ieno, E.N., Walker, N., Saveliev, A.A., Smith, G.M., 2009. Mixed effects models and
extensions in ecology with R, first ed. New York, New York.
Page 25
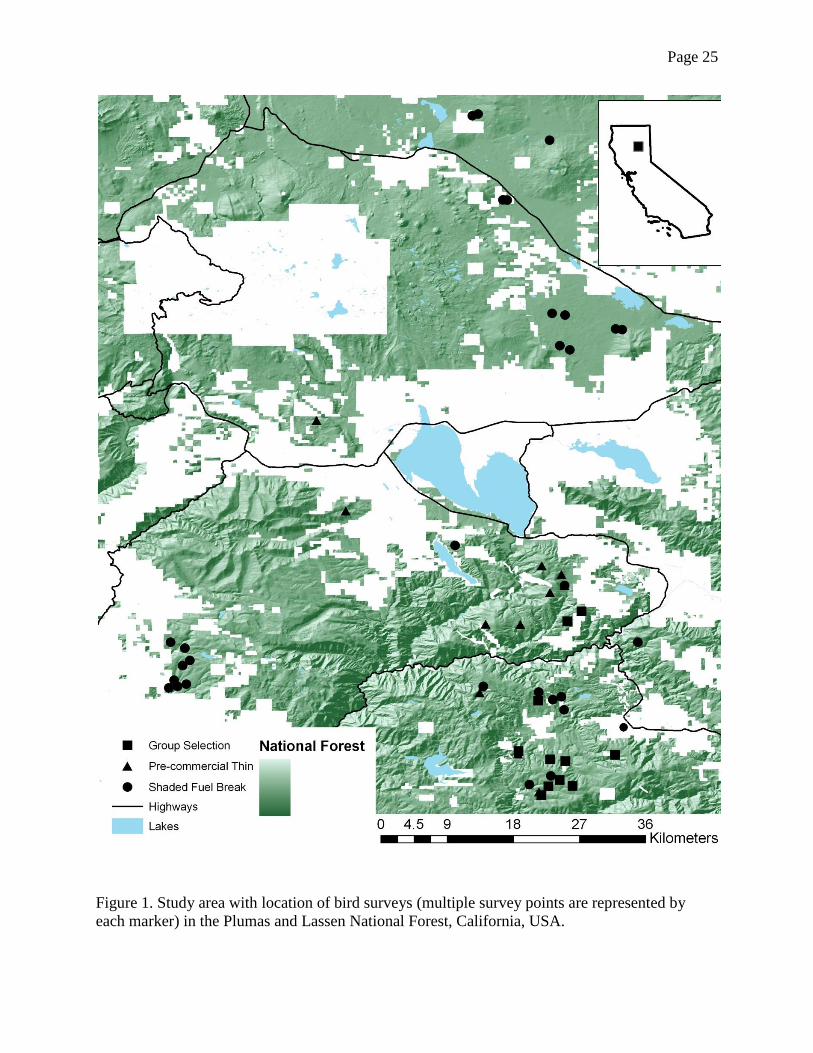
Figure 1. Study area with location of bird surveys (multiple survey points are represented by
each marker) in the Plumas and Lassen National Forest, California, USA.

Page 26
Figure 2. Vegetation characteristics at reference (ref), pre-treatment (pre), and post (treat) fuel treatment avian point count stations in
the Plumas and Lassen National Forests, California, USA.
0
10
20
30
40
# p
er
he
ctar
eShaded Fuel Break
Reference
Pre-treatment
Post-treatment
0
10
20
30
40
50
Pe
rce
nt
Co
ver
Shaded Fuel Breaks
ReferencePre-treatmentPost-treatment
0
5
10
15
20
# P
er
he
ctar
e
Group Selection
0
10
20
30
40
50
60
70
Pe
rce
nt
Co
ver
Group Selection
0
2
4
6
8
10
10 - 30 cm DBH Snags >30 cm DBH Snags
# P
er
he
ctar
e
Pre-commercial Thin
0
10
20
30
40
50
60
Overstory Tree Undestory Tree Shrub Herbaceous
Pe
rce
nt
Co
ver
Pre-commercial Thin

Page 27
Figure 3. Model averaged per visit abundance (detections <50m from observers) of species in each
of three general habitat guilds at reference (ref), pre-treatment (pre), and post-treatment (treat) fuel
treatment sites in the Northern Sierra Nevada, California, USA.
Page 28
Figure 4. An index of the abundance of 15 passerine bird species at 122 untreated (ref) point count
stations and 122 prior to (pre) and following (treat) shaded fuel break treatment in the Northern
Sierra Nevada, California, USA. Means are model averaged per visit estimates based on detections
<50m from observers. Y-axis scale varies between species.

Page 29
Figure 5. An index of the abundance of 15 passerine bird species at 17 untreated (ref) point count
stations and 17 prior to (pre) and following (treat) group selection treatments in the Northern
Sierra Nevada, California, USA. Means are model averaged per-visit estimates based on detections
<50m from observers. Due to small sample size we were unable to produce meaningful estimates
for Olive-sided Flycatcher. Y-axis scale varies between species.

Page 30
Figure 6. An index of the abundance of 15 passerine bird species at 49 untreated (ref) point count
stations and 49 stations prior to (pre) and following (treat) pre-commercial understory thinning
treatments in the Northern Sierra Nevada, California, USA. Means are model averaged per visit
estimates based on detections <50m from observers. Y-axis scale varies between species.
Page 31
Figure 7. The predicted mean number of avian species detected within 50m of observers per point
count station within reference (ref), pre-treatment (pre), and following treatment (treat) sites for
three fuels reduction treatment types across the Plumas and Lassen National Forest, California,
USA.

Page 32
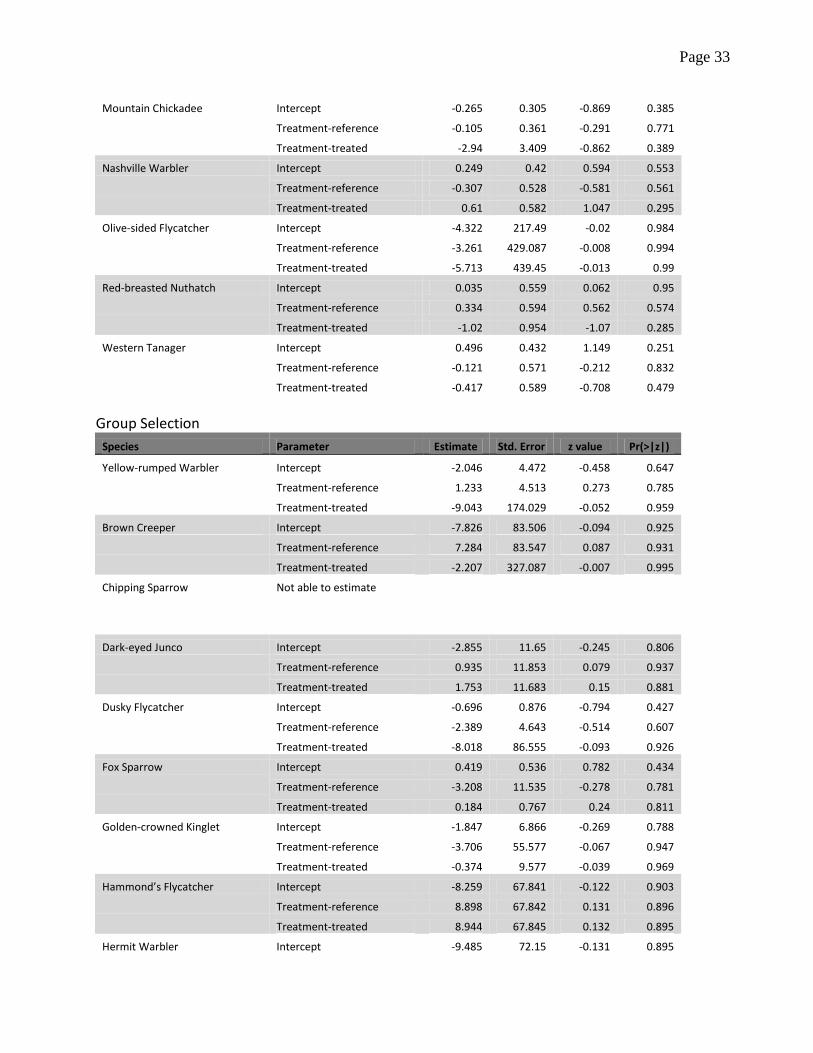
Table A.1 Estimates of probability of detection, standard errors and tests of significance obtained
separately for each type of fuel reduction treatment (shaded fuel breaks, group selection, and pre-
commercial understory thinning) and bird species. Estimates are from a zero-inflation model with
detection function that included treatment categories (reference, pre-treatment and treated) as a
factor, plus an intercept parameter. The reference category is pre-treatment, therefore estimates
with sufficiently low p-value would evidence lack of support for the hypothesis of no difference in
detection between treated and untreated samples.
Shaded Fuel Break
Species Parameter Estimate Std. Error z value Pr(>|z|)
Yellow-rumped Warbler Intercept -1.564 1.196 -1.307 0.191
Treatment-reference -0.208 1.355 -0.153 0.878
Treatment-treated -8.416 45.209 -0.186 0.852
Brown Creeper Intercept 1.253 0.586 2.137 0.033
Treatment-reference -2.385 1.856 -1.285 0.199
Treatment-treated -1.627 1.101 -1.478 0.139
Chipping Sparrow Intercept 0.649 1.458 0.445 0.656
Treatment-reference 1.216 1.495 0.813 0.416
Treatment-treated 0.163 1.654 0.099 0.921
Dark-eyed Junco Intercept -0.094 0.346 -0.273 0.785
Treatment-reference 0.015 0.41 0.037 0.97
Treatment-treated 0.103 0.414 0.249 0.804
Dusky Flycatcher Intercept -0.565 0.304 -1.858 0.063
Treatment-reference -0.378 0.408 -0.927 0.354
Treatment-treated -0.258 0.481 -0.535 0.593
Fox Sparrow Intercept 0.932 0.64 1.457 0.145
Treatment-reference 0.33 0.669 0.492 0.623
Treatment-treated 0.678 0.696 0.973 0.331
Golden-crowned Kinglet Intercept 0.579 0.44 1.315 0.189
Treatment-reference -0.708 0.53 -1.336 0.181
Treatment-treated -10.669 83.672 -0.128 0.899
Hammond’s Flycatcher Intercept 0.598 0.493 1.212 0.225
Treatment-reference 0.427 0.56 0.762 0.446
Treatment-treated -0.058 0.708 -0.082 0.935
Hermit Warbler Intercept 0.208 0.288 0.722 0.47
Treatment-reference -0.049 0.383 -0.129 0.897
Treatment-treated 0.356 0.366 0.972 0.331
MacGillivray’s Warbler Intercept 1.713 0.621 2.757 0.006
Treatment-reference -0.798 0.732 -1.089 0.276
Treatment-treated 0.405 0.856 0.473 0.636
Page 33
Mountain Chickadee Intercept -0.265 0.305 -0.869 0.385
Treatment-reference -0.105 0.361 -0.291 0.771
Treatment-treated -2.94 3.409 -0.862 0.389
Nashville Warbler Intercept 0.249 0.42 0.594 0.553
Treatment-reference -0.307 0.528 -0.581 0.561
Treatment-treated 0.61 0.582 1.047 0.295
Olive-sided Flycatcher Intercept -4.322 217.49 -0.02 0.984
Treatment-reference -3.261 429.087 -0.008 0.994
Treatment-treated -5.713 439.45 -0.013 0.99
Red-breasted Nuthatch Intercept 0.035 0.559 0.062 0.95
Treatment-reference 0.334 0.594 0.562 0.574
Treatment-treated -1.02 0.954 -1.07 0.285
Western Tanager Intercept 0.496 0.432 1.149 0.251
Treatment-reference -0.121 0.571 -0.212 0.832
Treatment-treated -0.417 0.589 -0.708 0.479
Group Selection
Species Parameter Estimate Std. Error z value Pr(>|z|)
Yellow-rumped Warbler Intercept -2.046 4.472 -0.458 0.647
Treatment-reference 1.233 4.513 0.273 0.785
Treatment-treated -9.043 174.029 -0.052 0.959
Brown Creeper Intercept -7.826 83.506 -0.094 0.925
Treatment-reference 7.284 83.547 0.087 0.931
Treatment-treated -2.207 327.087 -0.007 0.995
Chipping Sparrow Not able to estimate
Dark-eyed Junco Intercept -2.855 11.65 -0.245 0.806
Treatment-reference 0.935 11.853 0.079 0.937
Treatment-treated 1.753 11.683 0.15 0.881
Dusky Flycatcher Intercept -0.696 0.876 -0.794 0.427
Treatment-reference -2.389 4.643 -0.514 0.607
Treatment-treated -8.018 86.555 -0.093 0.926
Fox Sparrow Intercept 0.419 0.536 0.782 0.434
Treatment-reference -3.208 11.535 -0.278 0.781
Treatment-treated 0.184 0.767 0.24 0.811
Golden-crowned Kinglet Intercept -1.847 6.866 -0.269 0.788
Treatment-reference -3.706 55.577 -0.067 0.947
Treatment-treated -0.374 9.577 -0.039 0.969
Hammond’s Flycatcher Intercept -8.259 67.841 -0.122 0.903
Treatment-reference 8.898 67.842 0.131 0.896
Treatment-treated 8.944 67.845 0.132 0.895
Hermit Warbler Intercept -9.485 72.15 -0.131 0.895

Page 34
Treatment-reference -2.556 456.744 -0.006 0.996
Treatment-treated 7.798 72.16 0.108 0.914
MacGillivray’s Warbler Intercept 0.04 1.237 0.032 0.974
Treatment-reference 0.556 1.328 0.419 0.676
Treatment-treated -8.904 86.044 -0.103 0.918
Mountain Chickadee Intercept -0.453 0.98 -0.462 0.644
Treatment-reference -0.093 1.094 -0.085 0.932
Treatment-treated -0.93 1.893 -0.491 0.623
Nashville Warbler Intercept -0.161 0.569 -0.283 0.777
Treatment-reference -1.808 2.483 -0.728 0.467
Treatment-treated -10.025 122.93 -0.082 0.935
Olive-sided Flycatcher Not able to estimate
Red-breasted Nuthatch Intercept -2.874 11.974 -0.24 0.81
Treatment-reference 2.699 11.984 0.225 0.822
Treatment-treated 1.231 12.286 0.1 0.92
Western Tanager Intercept -0.79 1.629 -0.485 0.628
Treatment-reference 0.79 1.762 0.448 0.654
Treatment-treated -0.59 3.068 -0.192 0.848
Pre-commercial Thin
Species Parameter Estimate Std. Error z value Pr(>|z|)
Yellow-rumped Warbler Intercept 0.25 0.898 0.279 0.781
Treatment-reference -3.299 2.59 -1.274 0.203
Treatment-treated -1.882 1.406 -1.339 0.181
Brown Creeper Intercept -8.414 231.077 -0.036 0.971
Treatment-reference -2.879 537.826 -0.005 0.996
Treatment-treated -3.922 570.489 -0.007 0.995
Chipping Sparrow Intercept -6.114 219.533 -0.028 0.978
Treatment-reference -1.92 485.796 -0.004 0.997
Treatment-treated -2.715 490.258 -0.006 0.996
Dark-eyed Junco Intercept 0.764 0.57 1.341 0.18
Treatment-reference -1.321 0.656 -2.013 0.044
Treatment-treated -1.967 0.913 -2.155 0.031
Dusky Flycatcher Intercept -7.958 33.549 -0.237 0.813
Treatment-reference -3.751 112.609 -0.033 0.973
Treatment-treated 7.31 33.551 0.218 0.828
Fox Sparrow Intercept -0.034 0.602 -0.056 0.956
Treatment-reference 0.301 0.692 0.436 0.663
Treatment-treated 1.101 0.667 1.651 0.099
Golden-crowned Kinglet Intercept -8.938 95.37 -0.094 0.925
Treatment-reference -3.965 189.071 -0.021 0.983

Page 35
Treatment-treated -2.304 151.911 -0.015 0.988
Hammond’s Flycatcher Intercept -6.398 125.76 -0.051 0.959
Treatment-reference 6.859 125.76 0.055 0.957
Treatment-treated 7.383 125.761 0.059 0.953
Hermit Warbler Intercept -0.389 1.249 -0.311 0.756
Treatment-reference -10.925 47.901 -0.228 0.82
Treatment-treated -0.608 1.351 -0.45 0.652
MacGillivray’s Warbler Intercept -7.845 71.82 -0.109 0.913
Treatment-reference 7.479 71.826 0.104 0.917
Treatment-treated -0.833 438.969 -0.002 0.998
Mountain Chickadee Intercept 0.309 0.749 0.412 0.68
Treatment-reference -0.663 0.791 -0.838 0.402
Treatment-treated -0.413 0.801 -0.515 0.606
Nashville Warbler Intercept 0.41 1.045 0.392 0.695
Treatment-reference -0.701 1.139 -0.615 0.538
Treatment-treated 1.217 1.531 0.795 0.427
Olive-sided Flycatcher Intercept -5.672 176.055 -0.032 0.974
Treatment-reference -3.666 309.356 -0.012 0.991
Treatment-treated -3.751 314.285 -0.012 0.99
Red-breasted Nuthatch Intercept 1.128 0.828 1.363 0.173
Treatment-reference -1.827 0.938 -1.948 0.051
Treatment-treated -9.371 64.136 -0.146 0.884
Western Tanager Intercept 0.869 1.288 0.674 0.5
Treatment-reference -10.447 65.612 -0.159 0.873
Treatment-treated -1.699 1.561 -1.088 0.276