AUTOMOTIVE AFTERMARKET SECTOR UPDATE │ MAY 2016
12
www.harriswilliams.com Investment banking services are provided by Harris Williams LLC, a registered broker-dealer and member of FINRA and SIPC, and Harris Williams & Co. Ltd, which is authorised and regulated by the Financial Conduct Authority. Harris Williams & Co. is a trade name under which Harris Williams LLC and Harris Williams & Co. Ltd conduct business. TRANSPORTATION & LOGISTICS AUTOMOTIVE AFTERMARKET SECTOR UPDATE │ MAY 2016
Transcript of AUTOMOTIVE AFTERMARKET SECTOR UPDATE │ MAY 2016

www.harriswilliams.com
Investment banking services are provided by Harris Williams LLC, a registered broker-dealer and member of FINRA and SIPC, and Harris Williams & Co. Ltd, which is authorised andregulated by the Financial Conduct Authority. Harris Williams & Co. is a trade name under which Harris Williams LLC and Harris Williams & Co. Ltd conduct business.
TRANSPORTATION & LOGISTICS
AUTOMOTIVE AFTERMARKET SECTOR UPDATE │ MAY 2016

PAGE |
www.harriswilliams.com
TRANSPORTATION & LOGISTICS
AUTOMOTIVE AFTERMARKET SECTOR UPDATE │ MAY 2016
AAA TO MEET WITH CRITICS OF DATA PLAN
With the heat intensifying on AAA Inc. over its plan to cull data from memberautomotive service shops, the organization has agreed to meet with some of itscritics. Representatives of certain AAA Approved Auto Repair (AAR) shop owners,will gather sometime in May to discuss issues arising from AAA’s requirements forcustomer information sharing as part of the AAR agreement the group hasplanned for next year. The list of attendees is still being finalized, according toCathy Rossi, vice president of public and government affairs at AAA Mid-Atlantic.
Tire Business
WHAT WE’RE READING
CAR SALES, MILES DRIVEN, AND RECORD-BREAKING TEMPERATURES
The automotive aftermarket industry grew to $14.6 billion in 2015, with dollar salesincreasing by 3.9% and units/quarts by 1.7%, according to global informationcompany The NPD Group. While dollar sales have been accelerating since 2013,unit/quart sales have been down, and 2015 marked the first year in which bothended positively. New and used car sales, an increase in miles driven, andatypical weather were factors that influenced the aftermarket’s strongperformance during the year.
NPD
1
CONTENTS
M&A TRANSACTIONS
PUBLIC MARKETS OVERVIEW
STOCK PRICE PERFORMANCE
OUR GROUP
CONTACTS
UNITED STATES
Frank MountcastleManaging [email protected]+1 (804) 915-0124
Jason BassManaging [email protected]+1 (804) 915-0132
Joe ConnerManaging Director [email protected]+1 (804) 915-0151
Jershon JonesDirector [email protected]+1 (804) 932-1356
Jeff BurkettDirector [email protected] +1 (804) 932-1334
Jeff KiddVice President [email protected] +1 (804) 915-0178
James O’MalleyVice President [email protected]+1 (804) 915-0165
EUROPE
Jeffery PerkinsManaging Director [email protected]+49 (0) 69 3650638 00
Sales figures announced from GM, Ford, Toyota and Fiat Chrysler suggested thatabout 1.5 million light vehicles were sold during the month of April. That wouldproduce a seasonally adjusted annual rate of sales of 17.5 million, up 6% from April2015. Lackluster sales in March had stirred concerns that the long sales recoverymight finally be ending and that the market might be on the brink of a downturn.However, the new figures suggest that the industry could be on track to match oreven beat the all-time annual sales record of 17.5 million vehicles set in 2015.
Financial Times
STRONG U.S. CAR SALES IN APRIL REVIVE HOPES FOR FRESH RECORD
Johnson Controls Inc. had a logistics mystery on its hands: thousands of reusableshipping boxes and storage racks were disappearing every year. The auto-partsmaker, which was spending a small fortune to replace the equipment, launchedan investigation using RFID tags, attached to the containers. It showed some weresquirreled away at factories by Johnson Controls’ own plant managers, otherswere kept by customers. Auto-parts makers have mostly stuck with cheaperalternatives to RFID tags, like bar code stickers. Johnson Controls’ decision to startusing RFID could change that.
Wall Street Journal
JOHNSON CONTROLS UNRAVELS RIDDLE OF MISSING CRATES
LATIN AMERICA – OPPORTUNITIES FOR U.S. AUTOMOTIVE AFTERMARKET
The U.S. auto parts sector continues to be one of the largest contributors to totalU.S. exports. In 2015, the U.S. exported nearly $81 billion in auto parts worldwide.One of the promising, but overlooked regions for U.S. automotive aftermarket partsexports is Latin America, particularly Peru, Guatemala and El Salvador. Demandfor aftermarket auto parts and repair services in these three markets is increaseddue to aging vehicles (averaging 15.5 years for private and 22.5 years forcommercial vehicles). In addition, there is a high level of used-car sales anddeteriorating road conditions. US market share for auto parts in Guatemala is 31%,in El Salvador it is 26%, and US companies have a 19% share of the Peruvianmarket. Also worth noting: U.S. auto parts exports over the last five years grew 87%in Peru; 19% in Guatemala, and 50% in El Salvador.
Tradeology

PAGE |
M&A TRANSACTIONS
2
RECENT M&A TRANSACTIONS1,2
TRANSPORTATION & LOGISTICS
AUTOMOTIVE AFTERMARKET SECTOR UPDATE │ MAY 2016
*Denotes pending transactions
Date Target Business Description Acquirer
5/9/2016* Johann Hay GmbH und Co. KG
Automobiltechnik
Manufactures and supplies machined and forged components for
automotive, commercial vehicles, and bearing industries in Germany
and internationally.
Musashi Seimitsu Industry
Co., Ltd.
4/19/2016 Laydon Composites Ltd. Designs and manufactures aerodynamic devices for heavy-duty trucks
and trailers in North America and internationally.
WABCO Holdings Inc.
4/18/2016 Sperry & Rice Manufacturing
Company, LLC
Manufactures and markets rubber and sponge extrusions for appliance,
automotive, construction, and truck and bus industries.
Salt Creek Capital I I , LLC
4/15/2016 Zitco, Inc. Distributes automotive paints and coatings. Finishmaster Inc.
4/11/2016* Kovatch Mobile Equipment
Corporation
Designs, manufactures, and distributes customized specialty trucks,
chassis, and vehicles.
REV Group, Inc.
4/1/2016 DYK Automotive, LLC & AAHC,
Inc.
Distributes products to the automotive aftermarket throughout the
United States.
The Sterling Group
3/30/2016 Take 5 Oil Change LLC Provides oil change serv ices for vehicles in the United States. Driven Brands, Inc.
3/24/2016* ASIMCO NVH Technologies Co.,
Ltd.
Manufactures automotive components such as bushings, body mounts,
and engine mounts.
Zhengzhou Coal Mining
Machinery Group Co., Ltd.
3/11/2016* Cruise Automation, Inc. Develops and manufactures autonomous vehicle technologies. General Motors Company
3/1/2016 Jiffy-tite Company Inc. Manufactures fluid hose couplers for the automotive industry. Oetiker Limited
2/29/2016 Pittsburgh Glass Works LLC Manufactures and distributes automotive glass in the United States and
internationally.
LKQ Corp.
2/17/2016 Texas Hydraulics, Inc. Operates as a custom manufacturer of fluid power components for
original equipment manufacturers.
Wynnchurch Capital, LLC
2/9/2016 Trans-Safety LOCKS GmbH Manufactures and markets anti-theft protection products for the
transport industry.
WABCO Holdings Inc.
2/3/2016* PurePOWER Technologies, LLC Offers research and development, engineering, and manufacturing of
engine control and emissions management solutions.
Smithfield Group LLP;
Kensington Capital Partners,
LLC
2/2/2016 UGN, Inc. Manufactures acoustic, interior trim, and thermal management
products for the automotive industry.
Angeles Equity Partners
2/2/2016* Key Safety Systems, Inc. Designs, develops, and manufactures automotive safety-critical
components and systems for automotive and non-automotive markets
worldwide.
Ningbo Joyson Electronic
Corp.
2/2/2016 MICO, Incorporated Manufactures and sells hydraulic components, controls, and brake
systems primarily for off-road vehicles worldwide.
WABCO Holdings Inc.
1/28/2016 Save-A-Load, Inc. Manufactures cargo load bars for tractor trailers, light duty/commercial
vehicles, sprinter vans, SUVs, and pick-up trucks.
Fleet Engineers, Inc.

PAGE |
PUBLIC MARKETS OVERVIEW
3
TRANSPORTATION & LOGISTICS
TEV / LTM EBITDA TEV / 2016P EBITDA
AVERAGE REVENUE GROWTH (2012 – 2015) AVERAGE REVENUE GROWTH (2015 – 2017P)
AVERAGE EBITDA GROWTH (2012 – 2015) AVERAGE EBITDA GROWTH (2015 – 2017P)
AUTOMOTIVE AFTERMARKET SECTOR UPDATE │ MAY 2016
7.1x
9.4x
12.0x
12.4x
Suppliers
Vehicle Manufacturers
Dealerships and Services
Providers
Distributors and Retailers
6.2x
9.0x
11.1x
11.4x
Suppliers
Vehicle Manufacturers
Dealerships and Services
Providers
Distributors and Retailers
0.7%
4.4%
6.6%
15.1%
Suppliers
Vehicle Manufacturers
Distributors and Retailers
Dealerships and Services
Providers
2.2%
4.5%
5.4%
7.5%
Vehicle Manufacturers
Suppliers
Distributors and Retailers
Dealerships and Services
Providers
2.4%
7.8%
12.1%
16.6%
Suppliers
Distributors and Retailers
Vehicle Manufacturers
Dealerships and Services
Providers
5.4%
7.2%
12.9%
17.8%
Vehicle Manufacturers
Dealerships and Services
Providers
Suppliers
Distributors and Retailers

PAGE |
STOCK PRICE PERFORMANCE
4
TRANSPORTATION & LOGISTICS
(Indexed to May 11, 2015)
TRAILING TWELVE MONTHS
MEDIAN % CHANGE (1 MONTH) MEDIAN % CHANGE (12 MONTH)
AUTOMOTIVE AFTERMARKET SECTOR UPDATE │ MAY 2016
(40%)
(30%)
(20%)
(10%)
0%
10%
20%
30%
40%
May-15 Aug-15 Nov-15 Feb-16 May-16
Suppliers Distributors and Retailers
Dealerships and Service Providers Vehicle Manufacturers
S&P 500 Index
(2.0%)
(0.6%)
1.1%
3.2%
5.2%
Suppliers
Distributors and
Retailers
S&P 500
Dealerships and
Service Providers
Vehicle
Manufacturers
(24.5%)
(22.1%)
(12.1%)
(1.6%)
16.9%
Dealerships and
Service Providers
Vehicle
Manufacturers
Suppliers
S&P 500
Distributors and
Retailers

PAGE |
OUR GROUP
Harris Williams & Co. is a leading advisor to the transportation and logistics M&A market. Our Transportation & LogisticsGroup serves companies in a broad range of attractive niches, including third-party logistics (3PL), truck, rail, marineand air transportation, transportation equipment, and the automotive and heavy duty vehicle market.
TRANSPORTATION & LOGISTICS
RECENTLY CLOSED T&L TRANSACTIONS
DEEP EXPERIENCE ACROSS T&L SECTORS
MARINE TRANSPORTATION
NICHE TRANSPORTATION
TRANSPORTATION EQUIPMENT
RAIL & RAIL SERVICES
AUTOMOTIVE & HEAVY DUTY
VEHICLE
THIRD-PARTY LOGISTICS
AIR TRANSPORTATION
5
AUTOMOTIVE AFTERMARKET SECTOR UPDATE │ MAY 2016
has been acquired by
a portfolio company of
has been acquired by
a portfolio company of
and
in partnership with
and
RCL Services Group
has sold
tohas been acquired by
a portfolio company of
has been acquired by
a portfolio company of
has been acquired by
a portfolio company of
has been acquired by
a portfolio company of
a portfolio company of
has been acquired by
a portfolio company of
has acquired
a portfolio company of
has been acquired by
a portfolio company of
has been acquired by
has merged with
a division of
in a recapitalization by
and

Energy, Power& Infrastructure
IndustrialsHealthcare & Life Sciences
Transportation & Logistics
Aerospace, Defense & Government
Services
Business Services
Building Products & Materials
Technology, Media & Telecom
Specialty Distribution
Consumer
PAGE |
HARRIS WILLIAMS & CO. OFFICE LOCATIONS
UNITED STATES EUROPE
BostonTwo International Place24th FloorBoston, Massachusetts 02110Phone: +1 (617) 482-7501
Cleveland1900 East 9th Street20th FloorCleveland, Ohio 44114Phone: +1 (216) 689-2400
Minneapolis222 South 9th StreetSuite 3350Minneapolis, Minnesota 55402Phone: +1 (612) 359-2700
Richmond (Headquarters)1001 Haxall Point9th FloorRichmond, Virginia 23219Phone: +1 (804) 648-0072
San Francisco575 Market Street31st FloorSan Francisco, California 94105Phone: +1 (415) 288-4260
FrankfurtBockenheimer Landstrasse 33-3560325 FrankfurtGermanyPhone: +49 069 3650638 00
London63 Brook StreetLondon W1K 4HS, EnglandPhone: +44 (0) 20 7518 8900
NETWORK OFFICES
Beijing
Hong Kong
Mumbai
New Delhi
Shanghai
Transportation & Logistics
Harris Williams & Co. has a broad range of industry expertise, which creates powerful opportunities.Our clients benefit from our deep-sector experience, integrated industry intelligence andcollaboration across the firm, and our commitment to learning what makes them unique. For moreinformation, visit our website at www.harriswilliams.com/industries.
6
OUR FIRM
TRANSPORTATION & LOGISTICS
AUTOMOTIVE AFTERMARKET SECTOR UPDATE │ MAY 2016

PAGE |
PUBLIC COMPARABLES
7
TRANSPORTATION & LOGISTICS
AUTOMOTIVE AFTERMARKET SECTOR UPDATE │ MAY 2016
Stock Performance
Stock Price Change from 52-Week TEV / EBITDA EBITDA
($ in millions except per share data) TEV Current Prior Month Prior Year High % of High May-15 Nov-15 Current 2016P 2017P
Automotive Aftermarket
TEV / LTM EBITDA as of
Suppliers
BorgWarner Inc. $9,673 $34.00 (2.3%) (44.5%) $62.32 54.6% 10.6x 7.6x 6.9x 6.5x 6.1x
Cooper Tire & Rubber Co. 1,695 32.39 (9.1%) (10.7%) 43.40 74.6% 4.0x 4.5x 2.9x 3.4x 3.7x
Dorman Products, Inc. 1,767 53.58 2.9% 14.6% 55.00 97.4% 10.7x 10.6x 10.5x 9.9x 9.2x
Federal-Mogul Holdings Corporation 4,505 8.91 1.1% (30.0%) 13.17 67.7% 8.9x 7.4x 7.3x 6.0x 5.6x
The Goodyear Tire & Rubber Company 12,657 27.95 (10.2%) (8.0%) 35.30 79.2% 5.9x 5.8x 5.4x 4.8x 4.8x
Modine Manufacturing Company 569 10.28 (1.6%) (14.3%) 12.53 82.0% 6.0x 5.3x 5.6x 5.1x 4.7x
Motorcar Parts of America, Inc. 575 30.52 (13.9%) 9.0% 41.03 74.4% 14.1x NM 16.8x 7.2x 6.4x
Standard Motor Products Inc. 886 37.42 12.4% 5.9% 45.72 81.8% 7.3x 8.5x 7.6x 7.9x 7.1x
Tenneco Inc. 4,114 52.01 12.7% (13.5%) 61.73 84.3% 6.5x 5.9x 5.2x 4.9x 4.6x
Visteon Corporation 2,246 74.06 (3.6%) (30.4%) 121.65 60.9% NM 14.6x 8.3x 6.9x 6.2x
Median (2.0%) (12.1%) 76.9% 7.3x 7.4x 7.1x 6.2x 5.9x
Distributors and Retailers
Advance Auto Parts Inc. $12,035 $148.13 (4.3%) (0.8%) $201.24 73.6% 10.0x 12.4x 9.8x 9.0x 8.3x
AutoZone, Inc. 27,605 769.29 (0.6%) 13.1% 810.00 95.0% 11.9x 12.8x 12.1x 11.6x 10.9x
Genuine Parts Company 14,889 96.12 (0.7%) 3.7% 100.00 96.1% 11.6x 10.9x 11.8x 11.4x 10.8x
LKQ Corp. 12,580 32.57 3.9% 16.9% 34.26 95.1% 12.4x 12.7x 14.6x 11.7x 10.3x
O'Reilly Automotive Inc. 26,515 262.76 (1.6%) 19.7% 277.96 94.5% 15.0x 16.5x 14.7x 13.8x 12.6x
U.S. Auto Parts Network, Inc. 120 3.16 10.9% 53.4% 3.45 91.6% 18.7x 17.3x 17.1x 9.0x 7.7x
Uni-Select Inc. 1,172 25.85 18.7% 59.4% 27.90 92.6% 10.9x 11.7x 12.4x 11.3x 10.2x
Median (0.6%) 16.9% 94.5% 11.9x 12.7x 12.4x 11.4x 10.3x
Dealerships and Service Providers
Asbury Automotive Group, Inc. $2,988 $55.19 2.1% (34.7%) $96.58 57.1% 12.3x 10.7x 9.1x 9.2x 8.9x
AutoNation, Inc. 11,527 47.09 7.1% (24.5%) 66.63 70.7% 12.8x 12.3x 11.5x 11.0x 10.4x
Boyd Group Income Fund 1,101 56.85 0.0% 31.5% 62.28 91.3% 13.8x 13.6x 14.1x 11.8x 10.3x
CarMax Inc. 20,499 50.97 0.2% (28.3%) 73.76 69.1% NM 18.0x 17.1x 17.3x 16.5x
Copart, Inc. 5,373 43.36 6.0% 23.8% 43.82 99.0% 11.6x 11.7x 13.4x 12.6x 11.7x
Group 1 Automotive Inc. 4,204 60.95 11.8% (24.8%) 97.34 62.6% 10.9x 11.1x 10.0x 10.5x 9.9x
KAR Auction Services, Inc. 8,354 39.44 3.2% 5.6% 40.06 98.5% 12.9x 12.4x 12.4x 11.1x 10.2x
Lithia Motors Inc. 4,018 80.39 (1.1%) (22.0%) 126.56 63.5% 15.4x 14.3x 10.3x 9.9x 9.3x
Monro Muffler Brake Inc. 2,527 69.30 2.5% 12.8% 77.00 90.0% 15.2x 16.7x 16.0x 15.6x 13.4x
Penske Automotive Group, Inc. 7,889 35.84 4.8% (28.7%) 54.39 65.9% 14.7x 13.5x 12.0x 11.8x 11.1x
Sonic Automotive Inc. 3,053 16.95 3.9% (29.3%) 25.77 65.8% 10.6x 11.2x 10.0x 10.0x 9.6x
Median 3.2% (24.5%) 69.1% 12.8x 12.4x 12.0x 11.1x 10.3x

PAGE |
PUBLIC COMPARABLES
8
TRANSPORTATION & LOGISTICS
AUTOMOTIVE AFTERMARKET SECTOR UPDATE │ MAY 2016
Stock Performance
Stock Price Change from 52-Week TEV / EBITDA EBITDA
($ in millions except per share data) TEV Current Prior Month Prior Year High % of High May-15 Nov-15 Current 2016P 2017P
Automotive Aftermarket
TEV / LTM EBITDA as of
Vehicle Manufacturers
Bayerische Motoren Werke Aktiengesellschaft $146,978 $88.50 3.2% (26.0%) $123.12 71.9% 11.9x 11.3x 10.1x 9.0x 8.7x
Daimler AG 171,072 67.94 (1.9%) (29.6%) 104.11 65.3% 8.9x 7.9x 6.8x 8.0x 7.7x
Ford Motor Co. 169,773 13.32 5.2% (13.6%) 15.84 84.1% 18.9x 15.3x 9.6x 12.4x 12.0x
General Motors Company 100,861 31.08 5.2% (10.7%) 36.88 84.3% 7.9x 6.8x 6.5x 6.0x 6.0x
Harley-Davidson, Inc. 15,097 45.67 1.0% (18.2%) 60.67 75.3% 11.4x 11.4x 11.2x 11.1x 10.6x
Navistar International Corporation 5,417 12.04 0.2% (59.2%) 29.84 40.3% 18.8x 13.0x 14.5x 9.0x 8.0x
Oshkosh Corporation 4,320 45.75 15.9% (14.6%) 55.42 82.6% 8.7x 8.1x 9.3x 9.6x 8.0x
PACCAR Inc. 25,356 56.94 8.0% (14.5%) 67.17 84.8% 11.2x 8.2x 9.3x 12.4x 12.1x
Toyota Motor Corporation 299,695 51.36 5.7% (32.0%) 80.11 64.1% 10.0x 8.5x 7.2x 8.4x 8.8x
Volkswagen AG 177,975 149.13 22.5% (40.2%) 268.63 55.5% 8.7x 7.7x 9.4x 5.8x 5.2x
Median 5.2% (22.1%) 73.6% 10.6x 8.4x 9.4x 9.0x 8.4x

PAGE |
PUBLIC COMPARABLES
9
TRANSPORTATION & LOGISTICS
AUTOMOTIVE AFTERMARKET SECTOR UPDATE │ MAY 2016
Revenue Revenue Growth EBITDA EBITDA Growth
($ in millions) 2012 2013 2014 2015 2016P 2017P '12-15 '15-17P 2012 2013 2014 2015 2016P 2017P '12-15 '15-17P
Automotive Aftermarket
Suppliers
BorgWarner Inc. $7,183 $7,437 $8,305 $8,023 $9,125 $9,592 3.8% 9.3% $1,126 $1,224 $1,398 $1,362 $1,488 $1,578 6.6% 7.6%
Cooper Tire & Rubber Co. 4,201 3,439 3,425 2,973 2,973 3,032 (10.9%) 1.0% 629 483 516 555 502 470 (4.1%) (7.9%)
Dorman Products, Inc. 570 664 751 803 861 930 12.1% 7.6% 112 138 152 162 178 191 13.0% 8.5%
Federal-Mogul Holdings Corporation 6,444 6,786 7,317 7,419 7,560 7,820 4.8% 2.7% 439 555 578 575 745 795 9.4% 17.6%
The Goodyear Tire & Rubber Company 20,992 19,540 18,138 16,443 15,893 16,197 (7.8%) (0.7%) 1,819 2,132 2,251 2,336 2,641 2,662 8.7% 6.7%
Modine Manufacturing Company 1,577 1,376 1,478 1,496 1,360 1,344 (1.7%) (5.2%) 128 96 116 109 112 122 (5.3%) 6.1%
Motorcar Parts of America, Inc. 179 213 259 302 380 428 19.1% 19.1% 31 37 35 36 80 90 5.5% 57.9%
Standard Motor Products Inc. 949 984 980 972 1,010 1,052 0.8% 4.1% 102 120 126 110 113 125 2.4% 7.0%
Tenneco Inc. 7,363 7,964 8,420 8,209 8,611 9,086 3.7% 5.2% 638 695 736 772 842 903 6.6% 8.1%
Visteon Corporation 5,715 1,724 2,586 3,245 3,229 3,405 (17.2%) 2.4% 479 55 125 259 324 356 (18.5%) 17.2%
Total $55,173 $50,127 $51,659 $49,885 $51,002 $52,886 0.7% 4.5% $5,503 $5,535 $6,033 $6,276 $7,026 $7,293 2.4% 12.9%
Distributors and Retailers
Advance Auto Parts Inc. $6,205 $6,494 $9,844 $9,737 $9,758 $9,927 16.2% 1.0% $847 $969 $1,381 $1,233 $1,346 $1,456 13.4% 8.7%
AutoZone, Inc. 8,604 9,148 9,475 10,187 10,748 11,294 5.8% 5.3% 1,841 2,000 2,081 2,223 2,385 2,530 6.5% 6.7%
Genuine Parts Company 13,014 14,078 15,342 15,280 15,537 16,022 5.5% 2.4% 1,114 1,209 1,273 1,266 1,304 1,389 4.4% 4.8%
LKQ Corp. 4,123 5,063 6,740 7,193 9,143 10,283 20.4% 19.6% 493 627 790 852 1,078 1,227 20.0% 20.0%
O'Reilly Automotive Inc. 6,182 6,649 7,216 7,967 8,606 9,203 8.8% 7.5% 1,159 1,291 1,468 1,743 1,920 2,104 14.6% 9.9%
U.S. Auto Parts Network, Inc. 304 255 284 291 306 320 (1.4%) 4.8% 8 5 5 6 13 16 (8.5%) 62.5%
Uni-Select Inc. 1,798 1,788 1,784 1,355 1,238 1,277 (9.0%) (2.9%) 79 82 92 90 105 113 4.4% 12.4%
Total $40,229 $43,474 $50,685 $52,010 $55,335 $58,325 6.6% 5.4% $5,540 $6,182 $7,091 $7,414 $8,150 $8,836 7.8% 17.8%
Dealerships and Service Providers
Asbury Automotive Group, Inc. $4,475 $5,128 $5,639 $6,325 $6,676 $6,867 12.2% 4.2% $210 $259 $297 $332 $330 $344 16.5% 1.7%
AutoNation, Inc. 15,020 16,674 18,180 19,847 21,979 22,835 9.7% 7.3% 737 826 911 998 1,051 1,105 10.6% 5.2%
Boyd Group Income Fund 335 446 651 914 1,053 1,155 39.7% 12.4% 21 32 52 78 94 107 54.4% 17.2%
CarMax Inc. 10,004 10,963 12,574 14,269 15,150 16,258 12.6% 6.7% 783 828 932 1,091 1,196 1,244 11.7% 6.8%
Copart, Inc. 924 1,046 1,163 1,146 1,210 1,276 7.4% 5.5% 338 351 362 389 426 458 4.7% 8.5%
Group 1 Automotive Inc. 7,216 8,607 9,571 10,224 11,313 11,681 12.3% 6.9% 271 322 390 416 402 438 15.4% 2.6%
KAR Auction Services, Inc. 1,963 2,173 2,365 2,640 3,006 3,237 10.4% 10.7% 471 495 574 644 749 815 11.0% 12.4%
Lithia Motors Inc. 3,204 3,867 5,200 7,581 8,555 9,071 33.3% 9.4% 166 210 266 383 400 430 32.2% 5.9%
Monro Muffler Brake Inc. 687 732 831 894 951 1,043 9.2% 8.0% 115 101 127 147 162 187 8.4% 12.8%
Penske Automotive Group, Inc. 12,584 14,112 16,796 18,807 20,397 21,263 14.3% 6.3% 417 489 571 645 674 705 15.6% 4.6%
Sonic Automotive Inc. 8,115 8,571 8,897 9,298 9,847 10,203 4.6% 4.8% 288 300 304 309 302 315 2.3% 1.0%
Total $64,528 $72,320 $81,868 $91,944 $100,137 $104,888 15.1% 7.5% $3,818 $4,213 $4,784 $5,432 $5,787 $6,147 16.6% 7.2%
PAGE |
PUBLIC COMPARABLES
10
TRANSPORTATION & LOGISTICS
AUTOMOTIVE AFTERMARKET SECTOR UPDATE │ MAY 2016
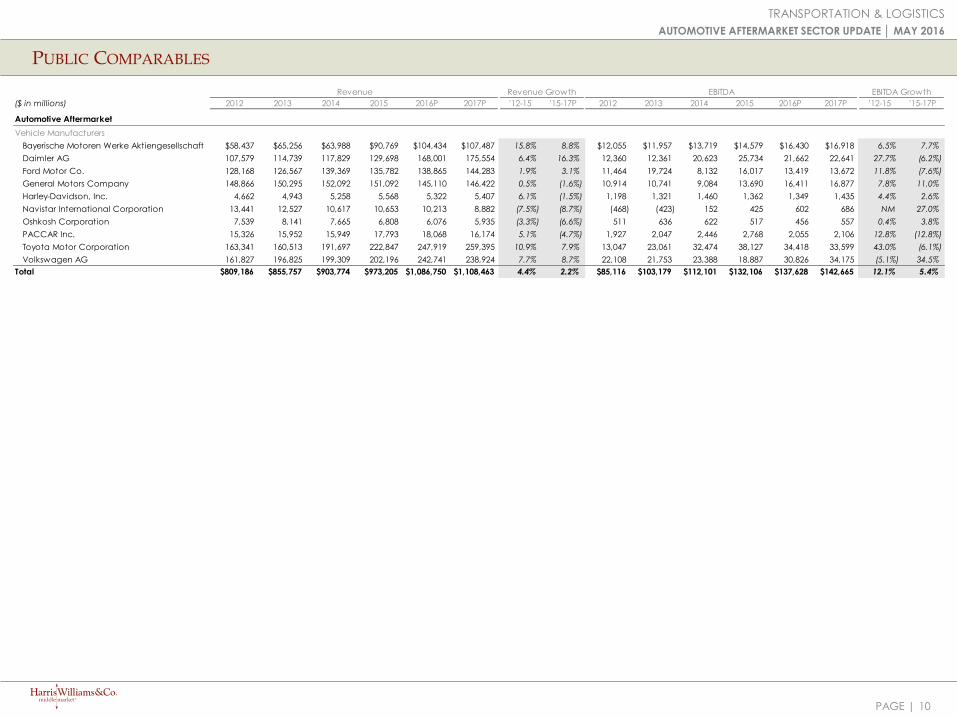
Vehicle Manufacturers
Bayerische Motoren Werke Aktiengesellschaft $58,437 $65,256 $63,988 $90,769 $104,434 $107,487 15.8% 8.8% $12,055 $11,957 $13,719 $14,579 $16,430 $16,918 6.5% 7.7%
Daimler AG 107,579 114,739 117,829 129,698 168,001 175,554 6.4% 16.3% 12,360 12,361 20,623 25,734 21,662 22,641 27.7% (6.2%)
Ford Motor Co. 128,168 126,567 139,369 135,782 138,865 144,283 1.9% 3.1% 11,464 19,724 8,132 16,017 13,419 13,672 11.8% (7.6%)
General Motors Company 148,866 150,295 152,092 151,092 145,110 146,422 0.5% (1.6%) 10,914 10,741 9,084 13,690 16,411 16,877 7.8% 11.0%
Harley-Davidson, Inc. 4,662 4,943 5,258 5,568 5,322 5,407 6.1% (1.5%) 1,198 1,321 1,460 1,362 1,349 1,435 4.4% 2.6%
Navistar International Corporation 13,441 12,527 10,617 10,653 10,213 8,882 (7.5%) (8.7%) (468) (423) 152 425 602 686 NM 27.0%
Oshkosh Corporation 7,539 8,141 7,665 6,808 6,076 5,935 (3.3%) (6.6%) 511 636 622 517 456 557 0.4% 3.8%
PACCAR Inc. 15,326 15,952 15,949 17,793 18,068 16,174 5.1% (4.7%) 1,927 2,047 2,446 2,768 2,055 2,106 12.8% (12.8%)
Toyota Motor Corporation 163,341 160,513 191,697 222,847 247,919 259,395 10.9% 7.9% 13,047 23,061 32,474 38,127 34,418 33,599 43.0% (6.1%)
Volkswagen AG 161,827 196,825 199,309 202,196 242,741 238,924 7.7% 8.7% 22,108 21,753 23,388 18,887 30,826 34,175 (5.1%) 34.5%
Total $809,186 $855,757 $903,774 $973,205 $1,086,750 $1,108,463 4.4% 2.2% $85,116 $103,179 $112,101 $132,106 $137,628 $142,665 12.1% 5.4%
Revenue Revenue Growth EBITDA EBITDA Growth
($ in millions) 2012 2013 2014 2015 2016P 2017P '12-15 '15-17P 2012 2013 2014 2015 2016P 2017P '12-15 '15-17P
Automotive Aftermarket

PAGE |
TRANSPORTATION & LOGISTICS
SOURCES
TRANSPORTATION & LOGISTICS
1. Capital IQ.
2. MergerMarket.
Harris Williams & Co. (www.harriswilliams.com) is a preeminent middle market investment bank focused on the advisory needs of clients worldwide. The firm has deep industry knowledge, global transaction expertise, and an unwavering commitment to excellence. Harris Williams & Co. provides sell-side and acquisition advisory, restructuring advisory, board advisory, private placements, and capital markets advisory services.
Investment banking services are provided by Harris Williams LLC, a registered broker-dealer and member of FINRA and SIPC, and Harris Williams & Co. Ltd, which is authorised and regulated by the Financial Conduct Authority. Harris Williams & Co. is a trade name under which Harris Williams LLC and Harris Williams & Co. Ltd conduct business.
THIS REPORT MAY CONTAIN REFERENCES TO REGISTERED TRADEMARKS, SERVICE MARKS AND COPYRIGHTS OWNED BY THIRD-PARTY INFORMATION PROVIDERS. NONE OF THE THIRD-PARTY INFORMATION PROVIDERS IS ENDORSING THE OFFERING OF, AND SHALL NOT IN ANY WAY BE DEEMED AN ISSUER OR UNDERWRITER OF, THE SECURITIES, FINANCIAL INSTRUMENTS OR OTHER INVESTMENTS DISCUSSED IN THIS REPORT, AND SHALL NOT HAVE ANY LIABILITY OR RESPONSIBILITY FOR ANY STATEMENTS MADE IN THE REPORT OR FOR ANY FINANCIAL STATEMENTS, FINANCIAL PROJECTIONS OR OTHER FINANCIAL INFORMATION CONTAINED OR ATTACHED AS AN EXHIBIT TO THE REPORT. FOR MORE INFORMATION ABOUT THE MATERIALS PROVIDED BY SUCH THIRD PARTIES, PLEASE CONTACT US AT THE ABOVE ADDRESSES OR NUMBERS.
The information and views contained in this report were prepared by Harris Williams & Co. (“Harris Williams”). It is not a research report, as such term is defined by applicable law and regulations, and is provided for informational purposes only. It is not to be construed as an offer to buy or sell or a solicitation of an offer to buy or sell any financial instruments or to participate in any particular trading strategy. The information contained herein is believed by Harris Williams to be reliable, but Harris Williams makes no representation as to the accuracy or completeness of such information. Harris Williams and/or its affiliates may be market makers or specialists in, act as advisers or lenders to, have positions in and effect transactions in securities of companies mentioned herein and also may provide, may have provided, or may seek to provide investment banking services for those companies. In addition, Harris Williams and/or its affiliates or their respective officers, directors and employees may hold long or short positions in the securities, options thereon or other related financial products of companies discussed herein. Opinions, estimates and projections in this report constitute Harris Williams’ judgment and are subject to change without notice. The financial instruments discussed in this report may not be suitable for all investors, and investors must make their own investment decisions using their own independent advisors as they believe necessary and based upon their specific financial situations and investment objectives. Also, past performance is not necessarily indicative of future results. No part of this material may be copied or duplicated in any form or by any means, or redistributed, without Harris Williams’ prior written consent.
Copyright© 2016 Harris Williams & Co., all rights reserved.
DISCLOSURES
11
AUTOMOTIVE AFTERMARKET SECTOR UPDATE │ MAY 2016