Jefferies 2019 Global Automotive Aftermarket Investor...
46
Jefferies 2019 Global Automotive Aftermarket Investor Conference May 23, 2019
Transcript of Jefferies 2019 Global Automotive Aftermarket Investor...

Jefferies 2019 Global Automotive Aftermarket Investor Conference
May 23, 2019
1
Forward Looking Statements and Non-GAAP FinancialMeasures
Statements and information in this presentation that are not historical are forward-looking statements within themeaning of the Private Securities Litigation Reform Act of 1995 and are made pursuant to the “safe harbor”provisions of such Act.Forward-looking statements include, but are not limited to, statements regarding our outlook, guidance,expectations, beliefs, hopes, intentions and strategies. These statements are subject to a number of risks,uncertainties, assumptions and other factors including those identified below. All forward-looking statements arebased on information available to us at the time the statements are made. We undertake no obligation to updateany forward-looking statements, whether as a result of new information, future events or otherwise, except asrequired by law.You should not place undue reliance on our forward-looking statements. Actual events or results may differmaterially from those expressed or implied in the forward-looking statements. The risks, uncertainties,assumptions and other factors that could cause actual results to differ from the results predicted or implied by ourforward-looking statements include the factors disclosed under the captions “Risk Factors” and “Management’sDiscussion and Analysis of Financial Condition and Results of Operations” in our Annual Report on Form 10-K for theyear ended December 31, 2018 and in our subsequent Quarterly Reports on Form 10-Q. These reports are availableon our investor relations website at lkqcorp.com and on the SEC website at sec.gov.This presentation contains non-GAAP financial measures. Included with this presentation is a reconciliation of eachnon-GAAP financial measure with the most directly comparable financial measure calculated in accordance withGAAP.

2
Mission Statement
To be the leading global value-added distributor ofvehicle parts and accessories by offering our
customers the most comprehensive, available andcost effective selection of part solutions while
building strong partnerships with our employeesand the communities in which we operate
(1) TTM as of 3/31/2019
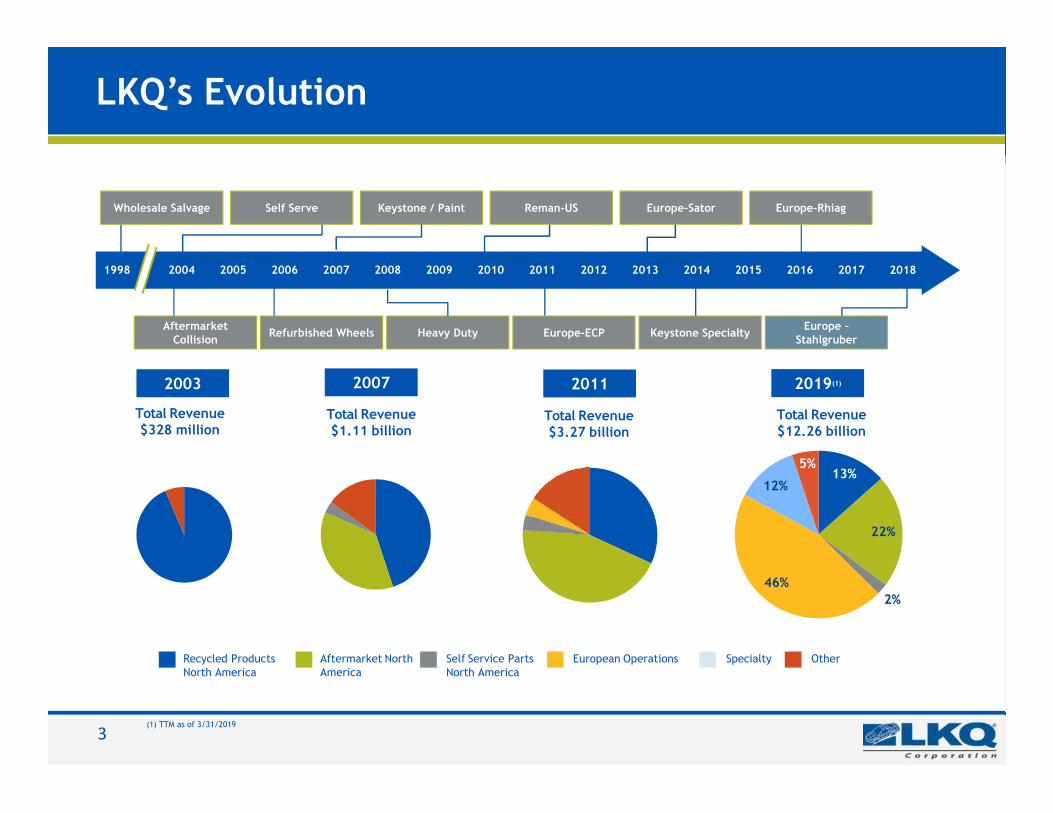
LKQ’s Evolution
Total Revenue$328 million
Total Revenue$1.11 billion
Total Revenue$3.27 billion
2003 2007 2011
AftermarketCollision Refurbished Wheels Heavy Duty Europe-ECP Keystone Specialty
Wholesale Salvage Self Serve Keystone / Paint Reman-US Europe-Sator Europe-Rhiag
1998 2004 2005 2006 2007 2008 2009 2010 2011 2012 2013 2014 2015 2016 2017
Total Revenue$12.26 billion
2019(1)
Aftermarket NorthAmerica
Self Service PartsNorth America
European Operations SpecialtyRecycled ProductsNorth America
Other
Europe –Stahlgruber
2018
13%
22%
2%46%
12%
5%
3

Specialty
• Performance products• Appearance & accessories• RV, trailer & other• Specialty wheels & tires
Operating Unit Overview
4
North America
• Collision– Aftermarket automotive products– Automotive glass distribution– Recycled & Refurbished
• Mechanical– Recycled engines & transmissions– Remanufactured engines & transmissions
Europe
• Mechanical– 175,000+ small part SKUs– Brakes, filters, hoses, belts, etc.
• Collision (limited)– Aftermarket (UK) & Recycled (Sweden)

5
Historical Financial Performance
(*) Net leverage is calculated as total debt, excluding the impact of capitalized debt issuance costs, less cash, and divided by Segment EBITDA(**) Accounts reflect continuing operations only
($ in millions)
$446$389
$544 $571$523
$711
$90$141 $170 $183 $175
$250
2013 2014 2015 2016 2017 2018
Cash Flow/ Capex**Operating Cash Flow Capital Spending
$5,063
$6,740 $7,193
$8,584$9,737
$11,877
$-
$2,000
$4,000
$6,000
$8,000
$10,000
$12,000
$14,000
2013 2014 2015 2016 2017 2018
Revenue**
$629
$791$855
$1,005$1,117
$1,251
$-
$200
$400
$600
$800
$1,000
$1,200
$1,400
2013 2014 2015 2016 2017 2018
Segment EBITDA**
1.8x
2.2x
1.8x
3.1x2.8x 2.9x
0.0x
0.5x
1.0x
1.5x
2.0x
2.5x
3.0x
3.5x
2013 2014 2015 2016 2017 2018
Net Leverage*
6
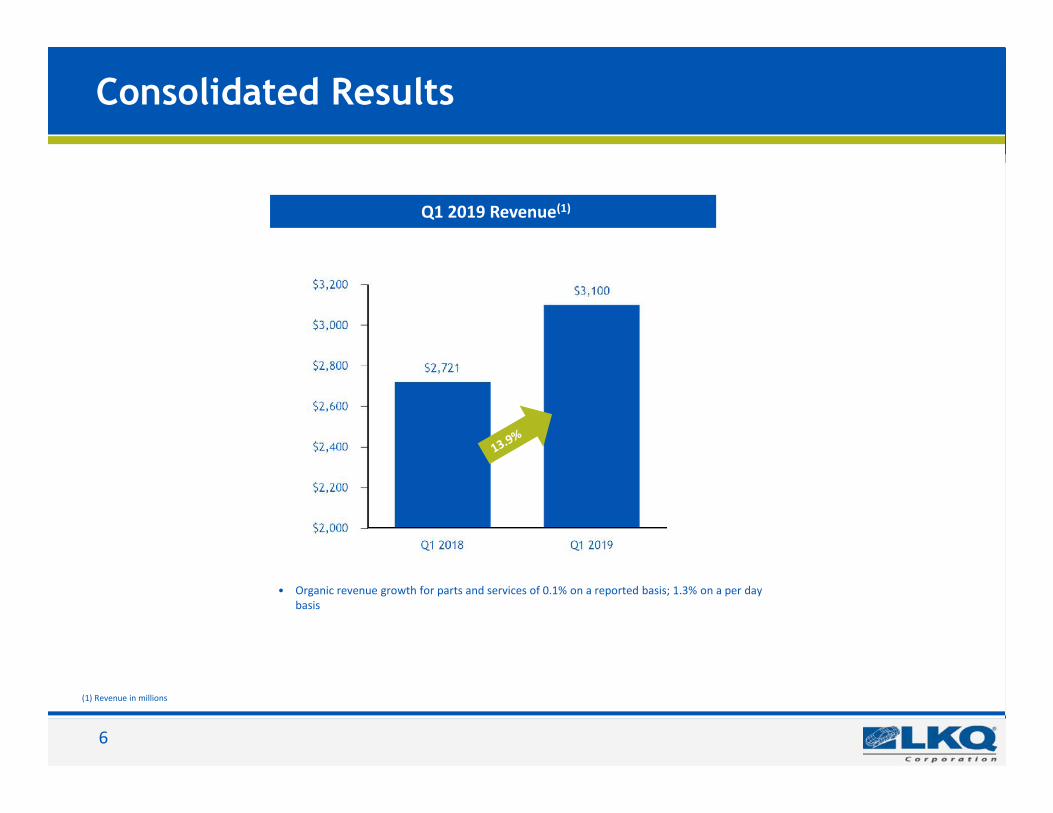
Consolidated Results
Q1 2019 Revenue(1)
(1) Revenue in millions
• Organic revenue growth for parts and services of 0.1% on a reported basis; 1.3% on a per daybasis

7
Consolidated Results
Q1 2019 EPS(1)
(1) Earnings per share figures refer to net income attributable to LKQ stockholders(2) Adjusted Diluted EPS is a non-GAAP measure. Refer to Appendix 4 for Adjusted Diluted EPS reconciliation(3) Segment EBITDA is a non-GAAP financial measure. Refer to Segment EBITDA reconciliation on Appendix 3
Diluted EPS Adjusted Diluted EPS(2)
• Net income attributable to LKQ stockholders of $98 million (3.2% of revenue) Q1 2019 vs.$153 million (5.6% of revenue) Q1 2018 (Q1 2019 includes impairment charges totaling $52million after tax)
• Segment EBITDA(3) of $320 million; up 8.4% YOY• Segment EBITDA Margin(3) of 10.3% Q1 2019 vs. 10.9% Q1 2018; decrease reflects the larger
European mix

8
Q1 2019 Revenue Growth
• Organic revenue growth for parts and services on a per day basis was 1.3% as there was one fewer selling day, on average, in Q1 2019 compared to Q1 2018
• Parts and services organic revenue declined in North America primarily attributable to one fewer selling day in 2019; decline in accident frequency accompanied with mildwinter weather had a negative effect compared to Q1 2018; 0.8% negative impact from lower revenue in our aviation business; and a further 0.7% negative impact due tolower glass revenue on a per day basis
• Organic revenue growth for parts and services in Europe was 1.3% (2.1% on a per day basis) impacted by macro economic softness and mild winter weather conditions insome markets
• Unfavorable F/X impact on European parts and services revenue of $75 million; European constant currency parts and services revenue growth of 46.2%(2)
• European acquisition growth for parts and services was $465 million, primarily related to the acquisition of Stahlgruber GmbH ("Stahlgruber") (acquired May 30, 2018)
• Decrease in other revenue was primarily attributable to lower prices of scrap steel, partially offset by increased volumes of scrap and steel and higher prices from othermetals and catalytic converters YOY. Scrap steel prices were down 24% versus Q1 2018
(1) The sum of the individual revenue change components may not equal the total percentage due to rounding(2) Constant currency is a non-GAAP financial measure. Refer to constant currency reconciliation on Appendix 1
Revenue Changes by Source:Organic Acquisition Foreign Exchange Total(1)
North America (1.4)% 0.3% (0.4)% (1.4)%Europe 1.3% 44.9% (7.3)% 38.9%Specialty 1.0% —% (0.4)% 0.5%
Parts and Services 0.1% 18.3% (3.2)% 15.2%Other Revenue (6.4)% 1.0% (0.3)% (5.8)%
Total (0.3)% 17.3% (3.0)% 13.9%

Revised Executive Compensation
9
2018 2019Annual Cash Incentive Annual Cash Incentive
• Adjusted Diluted EPS • EBITDA
• EBITDA as a % of Revenue
• Free Cash Flow
Long Term Incentive Plan Long Term Incentive Plan
• Organic Revenue Growth • Organic Revenue Growth
• Adjusted Diluted EPS • Adjusted Diluted EPS
• ROE • ROIC• Executive’s 3-year long-term
incentive plan is now 50% RSUs & 50%Cash

Key Strategic Underpinnings
GEAR Forward!
GROW
Diversified Offerings
EXPAND
Global Footprint
RATIONALIZE
Asset Base
ADAPT
To EvolvingTechnology
Path to Success: ● DEPENDABLE ● EXCELLENCE ● LEADERSHIP ● INTEGRITY● VALUE ● EFFICIENT ● RESPONSIVE
10

Operating Segments

Large & Fragmented US Market
Automotive Repair Market$243 bn
Do It For Me (DIFM)$194 bn
Collision$46 bn
Collision Parts$25 bn
Collision(Wholesale)
$17 bn
Markup$8 bn
Labor$21 bn
Mechanical$148 bn
Mechanical Parts$81 bn
Mechanical(Wholesale)
$54 bn
Markup$27 bn
Labor$67 bn
DIY$49 bn
RetailPrice
Parts &Labor
Market Opportunity – $71 billion
Source: AAIA Factbook, 27th Edition 2018; 2016 data is estimated, excludes tires.
12

Wholesale North America Footprint
13

Collision Products, a $17 Billion Industry
Repair ShopNew OEM
Manufacturers62%
Aftermarket21%
Recycled OEM11%
Refurbished &Optional OE
Products6%
Insurance Companies(Indirect Customers)
Alternative parts = 38% of parts costs
Source: CCC Information Services –Crash Course 2018
14

Shift Toward Alternative Parts Usage
Source: CCC Information Services Inc.
Over 20 million vehicle claims
6.5
2.7
9.2
6.8
3.2
10
0.0
2.0
4.0
6.0
8.0
10.0
12.0
OEM Alternative Parts Total
2014 2015 2016 2017 2018
Average Parts Used Per Claim
15
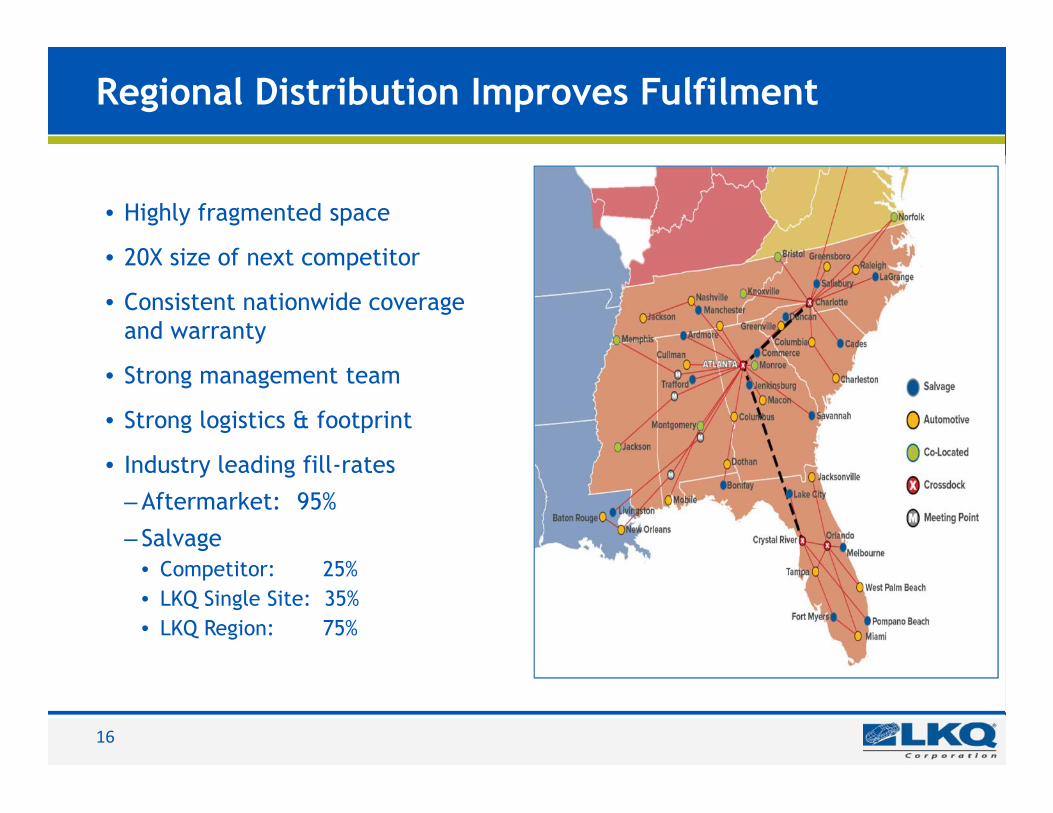
Regional Distribution Improves Fulfilment
• Highly fragmented space
• 20X size of next competitor
• Consistent nationwide coverageand warranty
• Strong management team
• Strong logistics & footprint
• Industry leading fill-rates– Aftermarket: 95%– Salvage
• Competitor: 25%• LKQ Single Site: 35%• LKQ Region: 75%
16

5 year time horizon
Number of Vehicles in LKQ’s “Sweet Spot”
17
2009 2010 2011 2012 2013 2014 2015 2016 2017 2018 2019 2020 2021 2022SAAR 10.4 11.6 12.7 14.4 15.5 16.5 17.4 17.5 17.2 17.2 16.3 15.1 14.3 13.6VIO 3-10 121 118 114 108 103 101 101 101 103 108 115 119 122 122
10.4 11.6 12.7 14.4 15.5 16.5 17.4 17.5 17.2 17.2 16.3 15.1 14.3 13.6
121 118114
108103 101 101 101 103
108115 119 122 122
-
20.0
40.0
60.0
0
20
40
60
80
100
120
140
160
180
Num
ber o
f Veh
icle
s (M
illio
ns)
Source: Experian vehicles in operation as of 9/30/18; SAAR Bank of America Merrill Lynch 1/7/19
United States Vehicles in Operation

18
Battery electric vehicles have no material impact in North Americaor Europe operations until well after 2025
• BEV expected to reachless than 3% of the VIOin Europe and lessthan 2% in the USA
• The mechanical sweetspot is 6 to 14 years;BEV sold this year willbe 6 years in 2025
• BEV often uselightweight materialsand ADAS sensorsincreasing the averagecost of collision repair
Impacts
0%
1%
2%
3%
2017 2018 2019 2020 2021 2022 2023 2024 2025
Base Aggessive
% USA VIO
0%
1%
2%
3%
2017 2018 2019 2020 2021 2022 2023 2024 2025
Base Aggressive
% Europe VIO
Data based on LKQ Projected Forecasts

Crash Avoidance Systems Growing
(0.1%)
(0.1%)
(0.2%)
(0.2%)
(0.4%)
(0.7%)
(3.3%)
(6.8%)
(10.3%)
(13.8%)
(17.3%)
(20.8%)
(24.3%)
(30.0%)(25.0%)(20.0%)(15.0%)(10.0%) (5.0%) 0.0%
CY 2010
CY 2011
CY 2012
CY 2013
CY 2014
CY 2015
CY 2020
CY 2025
CY 2030
CY 2035
CY 2040
CY 2045
CY 2050
78%
22%
CY 2040
All Other
Conventional Gasoline Vehicles
U.S. EIA Energy Outlook 2014Light Duty Vehicle Sales by Energy Use
CCC estimatesa 10.3% impactto losses innext 11 years
Source: CCC Information Services Inc.
19

Large European Market
Automotive Repair Market€198B
Do It For Me (DIFM)€188B
Collision€30B
Collision Parts€22B
Collision(Wholesale)
€14B
Markup€8B
Labor€8B
Mechanical€158B
Mechanical Parts€120B
Mechanical(Wholesale)
€78B
Markup€42B
Labor€38B
DIY (1)
€10B
Market Opportunity – €102 billion
RetailPrice
Parts &Labor
Source: 2014 Datamonitor; Management estimates.Note: All € in millions; Excludes VAT and sales taxes.(1) Do It Yourself e-commerce only.
20

[Text]
[Text]
Large Car Parc
FragmentedIndustry
“CountryChampion” inKey Markets
DIFMFocused
SupplierSegmentation
Low CollisionAPU
Europe - Market Observations
21

IT
HU IE
NO
SE
DK
UK
NL
BE
CH DE
AT
SI
HR
BA
PL
CZ
SK
UA
RO
BG
FR
LKQ European Footprint
22
* LKQ Corporation acquired a 26.5% interest in Mekonomen Group in December 2016; we increased our ownershipinterest to 26.6% in October 2018.

LKQ’s European Platform Acquisitions
Opportunities for Procurement & Back Office Synergies
October 2011 April 2013 March 2016 May 2018
• Leading distributorof automotiveaftermarketmechanical parts inthe UK
• Nearly 55,000commercialcustomers
• 1 NationalDistribution Centertotaling 500K squarefeet
• 8 regional hubs, 89branches
• Leading distributorof automotiveaftermarketmechanical parts inthe Benelux
• Proprietary, best-in-class online orderingtechnology for localdistributors & repairshops
• 11 distributioncenters
• Leading automotiveaftermarketmechanical partsdistributor in Italy,The Czech Republic& Slovakia; #2 or #3position in 6 othercountries in Central& Eastern Europe
• Rhiag utilizes anetwork of 10 DC’sand 247 localbranches,distributing productto over 57,000professionalcustomers
• Leading Europeanwholesale distributorof aftermarket spareparts for passengercars, tools, capitalequipment &accessories withoperations inGermany, EasternEurope, Italy, &Switzerland
• 188 sales centers & a128,000 squaremeter advancedlogistics center inGermany
23

Benefits of Scale
Longer-Term Margin Drivers
• Lower procurement costs– OES brands (volume)– Private label brands (margin)
• Reduced logistics and warehousing– e.g. Asian sourcing– e.g. long tail products
• Improved overhead costs– Back-office activities– Cataloguing– Rationalize ERP systems
• Brand economies of scale
24

25
+1.0/1.5%+0.3/0.5% +0.7/1.0%
+1.0/2.0%+0.3/0.5%+0.5/0.8%
0.5%
1.0%
1.5%
2.0%
2.5%
T2(incl. recovery
exceptional costs)
AP rationalization European procurement Catalogue/BAAS Logistics BackOffice
• This slide represents ranges of potential effects on Segment EBITDA margins of proposed initiatives in Europe. There can be no assurance that the indicated potential effects will be realized. In addition, therealization of one or more effects may be dependent on the realization of one or more other effects and should not be viewed as guidance by the Company.
• The slide is solely for hypothetical illustration of the possible outcomes of proposed initiatives.• The slide does not include the effects of new acquisitions completed in the period nor the costs to implement the ERP.• The slide does not include the dilution effect of the Stahlgruber acquisition.
Potential Effects on Margins of Proposed Initiatives
Potential effects on Segment EBITDA Margin

Specialty
• Leading distributor and marketer of specialty aftermarketequipment, accessories, and products in North America
• Critical link between 800+ suppliers and approximately20,000 customers selling over 300,000 total SKUssupported by a highly technical sales force
• Diverse product segments: truck and off-road; speed andperformance; recreational vehicle; towing; wheels, tiresand performance handling; and miscellaneous accessories
• Best-in-class logistics and distribution network withapproximately 1,100,000 annual deliveries and ability toserve over 97% of dealer / jobber customers next-day
Specialty Directly Addressable Market (1)
($ in billions)
Specialty Overview
(1) Management estimates based on AAIA Factbook, SEMA and other industry research
Accessory andAppearance
$5.03B37%
Performance Products$4.37B
32%
RV and Towing$1.37B
10%
Wheels, Tires &Suspension
$2.78B21%
Towing
5th Wheels
Receiver Hitches
Wheels andTires
Tires
Wheels
Accessories
Floor Liners
Fender Flares
Truck &Off-Road
Toolboxes
Winches
Speed &Performance
Superchargers
Air Intakes
Satellites
RV
Awnings
26

27
Consistent Business Model and Strategy
Niche andFragmented Markets
Industry LeadingManagement
HighFulfillment
Rates
Synergy and LeverageOpportunities
Sustainable Growthand Margin Expansion
AttractiveAdjacentMarkets
Financial Overview

29
North America Segment EBITDA Margin Bridge Segment EBITDA Margin
Gross Margin% of Revenue
($ in millions) 2019 2018 Change 2019 2018
Total Revenue $1,302 $1,330 (2.1)%
Gross Margin $576 $576 0.0% 44.2% 43.3%
Operating Expenses $407 $403 1.2% 31.3% 30.3%
Other Income, net $7 $3 n/m 0.6% 0.3%
Segment EBITDA(1) $177 $178 (0.6)% 13.6% 13.4%
North America – Q1 2019 Results
Note: In the table above, the sum of the individual percentages may not equal the total due to rounding
(1) Segment EBITDA is a non-GAAP measure. Refer to total Segment EBITDA reconciliation on Appendix 3 and the breakoutof Segment EBITDA by each respective segment on Appendix 2
30
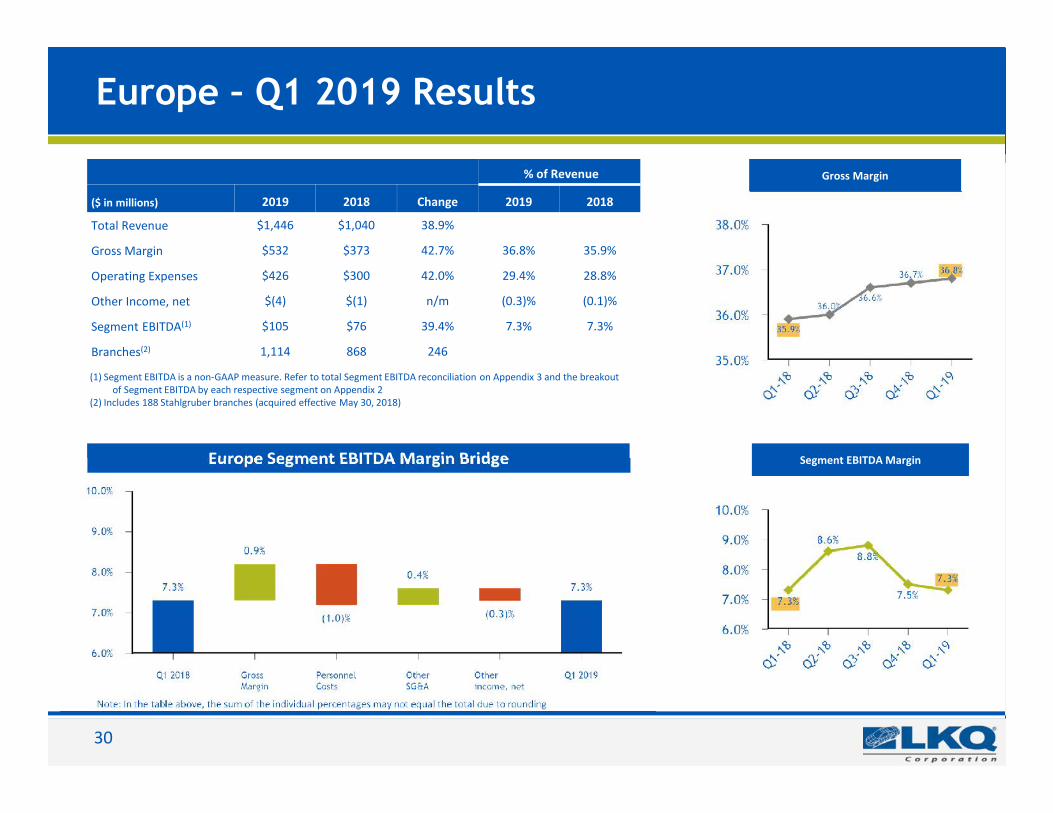
(1) Segment EBITDA is a non-GAAP measure. Refer to total Segment EBITDA reconciliation on Appendix 3 and the breakoutof Segment EBITDA by each respective segment on Appendix 2
(2) Includes 188 Stahlgruber branches (acquired effective May 30, 2018)
Europe – Q1 2019 Results
Europe Segment EBITDA Margin Bridge
Gross Margin
Segment EBITDA Margin
% of Revenue
($ in millions) 2019 2018 Change 2019 2018
Total Revenue $1,446 $1,040 38.9%
Gross Margin $532 $373 42.7% 36.8% 35.9%
Operating Expenses $426 $300 42.0% 29.4% 28.8%
Other Income, net $(4) $(1) n/m (0.3)% (0.1)%
Segment EBITDA(1) $105 $76 39.4% 7.3% 7.3%
Branches(2) 1,114 868 246
Note: In the table above, the sum of the individual percentages may not equal the total due to rounding

31
Note: In the table above, the sum of the individual percentages may not equal the total due to rounding
Segment EBITDA Margin
Gross Margin
Specialty – Q1 2019 Results
Specialty Segment EBITDA Margin Bridge
% of Revenue
($ in millions) 2019 2018 Change 2019 2018
Total Revenue $354 $352 0.6%
Gross Margin $100 $105 (4.8)% 28.4% 30.0%
Operating Expenses $63 $65 (1.8)% 17.9% 18.4%
Other Income, net $0 $0 n/m 0.1% 0.0%
Segment EBITDA(1) $38 $42 (9.6)% 10.7% 11.9%(1) Segment EBITDA is a non-GAAP measure. Refer to total Segment EBITDA reconciliation on Appendix 3 and the
breakout of Segment EBITDA by each respective segment on Appendix 2

32
2019 Capital Allocation
• Operating cash flows:
◦ The $32 million year over year increase is primarily driven by a $26 million increase in operating income excluding $30 million of non-cash depreciation and amortization expense andimpairment of net assets held for sale increases compared to prior year
• Investing cash flows:
◦ Capex of $53 million mainly due to our North America and Europe segments
• Financing cash flows
◦ Includes $60 million of net repayments on our credit facilities
◦ Includes $70 million in share repurchases
$ in millions

33
Leverage & Liquidity
Effective borrowing rate for Q1 2019 was 3.4%(3)
TotalCapacity(1)
($ in millions )
2.9x
(1) Total capacity includes our term loans and revolving credit facilities(2) Net leverage per bank covenants is defined as Net Debt/EBITDA. See the definitions of Net Debt and EBITDA in the credit agreement filed with the SEC for further details(3) Including our interest rate swaps, approximately 80% of our outstanding debt at March 31, 2019 is effectively at a fixed interest rate
($ in millions )
2.9x

34
Return on Invested Capital
(1) Amortization of acquired intangibles and lease obligations have been excluded from the calculation of Return on Invested Capital(2) TTM 2019 excludes all income, transaction costs, capital and equity related to Stahlgruber GmbH(3) TTM 2019 excludes the effect of the Mekonomen and other impairment charges on income
Return on Invested Capital(1)

35
Guidance 2019(effective only on the date issued: April 25, 2019)
(1) Guidance for 2019 is based on current conditions and excludes the impact of restructuring and acquisition related expenses, impairment charges, excess tax benefits and deficiencies from stock basedpayments, and amortization expense related to acquired intangibles. In addition, it excludes gains or losses (including changes in fair value of contingent consideration liabilities) and capital spendingrelated to acquisitions or divestitures, and assumes no material disruptions associated with the United Kingdom's potential exit from the European Union. Our forecasted results for our internationaloperations were calculated using current foreign exchange rates for the remainder of the year. Guidance for 2019 includes a global effective tax rate of 27.0%. Full year 2018 actual figures for AdjustedNet Income and Adjusted Diluted EPS were calculated using the same methodology as the 2019 guidance. Organic revenue guidance refers only to parts and services revenue. LKQ updated its guidanceon April 25, 2019, and it is only effective on the date of issuance. It is LKQ’s policy to comment on its annual guidance only when the company issues its quarterly press releases with financial results.LKQ has no obligation to update this guidance.
(2) Adjusted net income and Adjusted Diluted EPS are non-GAAP measures. See Appendix 5 for reconciliation of forecasted adjusted net income and forecasted adjusted diluted earnings per shareattributable to LKQ stockholders
($ in millions excluding EPS)
Full Year 2018Actual Full Year 2019 Guidance(1)
Organic Growth, Parts and Services 4.4% 2.0% - 4.0%Net Income attributable to LKQ stockholders $485 $586 - $625
Adjusted Net Income attributable to LKQ stockholders(2) $691 $732 - $771
Diluted EPS attributable to LKQ stockholders $1.53 $1.87 - $2.00
Adjusted Diluted EPS attributable to LKQ stockholders(2) $2.19 $2.34 - $2.46
Cash Flow from Operations $711 $775 - $850Capital Expenditures $250 $250 - $300
36
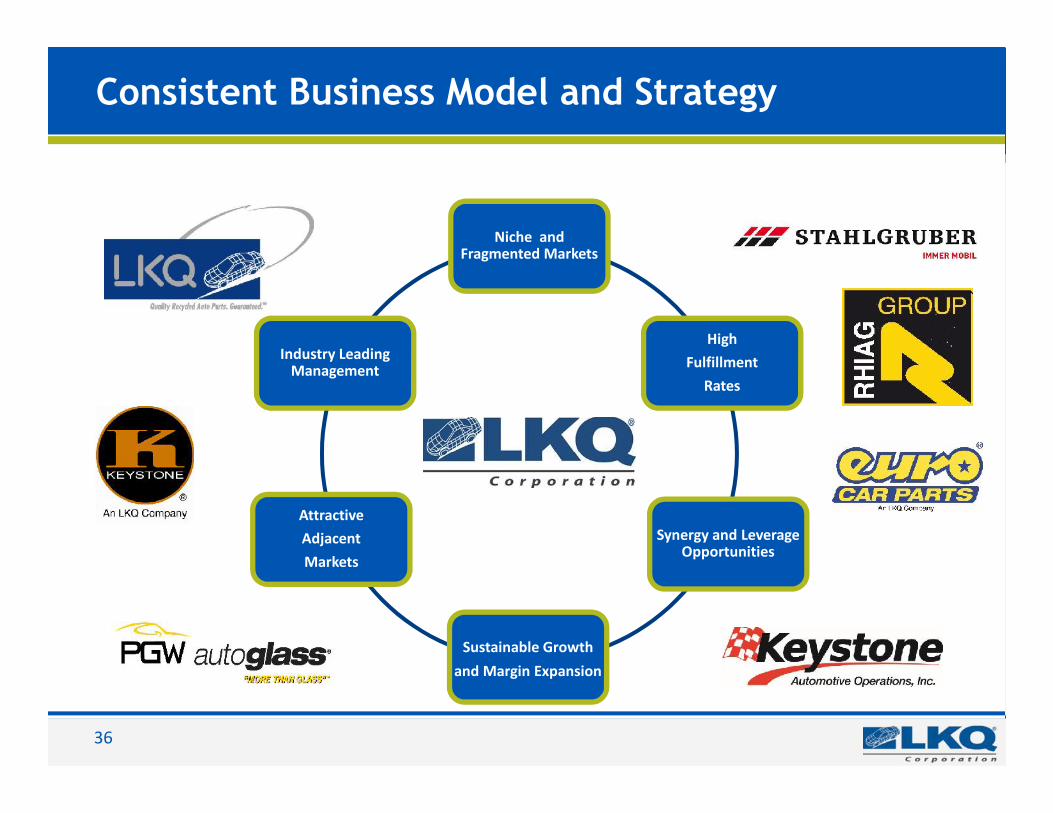
Consistent Business Model and Strategy
Niche andFragmented Markets
Industry LeadingManagement
HighFulfillment
Rates
Synergy and LeverageOpportunities
Sustainable Growthand Margin Expansion
AttractiveAdjacentMarkets

37
Appendix - Non-GAAP Financial Measures
This presentation contains non-GAAP financial measures. Following are reconciliations of each non-GAAP financial measure with the mostdirectly comparable financial measure calculated in accordance with GAAP.

38
Appendix 1 - Constant Currency Reconciliation
• The following unaudited table reconciles consolidated revenue growth for Parts & Services to constant currency revenuegrowth for the same measure:
We have presented the growth of our revenue on both an as reported and a constant currency basis. The constant currency presentation, which isa non-GAAP financial measure, excludes the impact of fluctuations in foreign currency exchange rates. We believe providing constant currencyrevenue information provides valuable supplemental information regarding our growth, consistent with how we evaluate our performance, as thisstatistic removes the translation impact of exchange rate fluctuations, which are outside of our control and do not reflect our operationalperformance. Constant currency revenue results are calculated by translating prior year revenue in local currency using the current year'scurrency conversion rate. This non-GAAP financial measure has limitations as an analytical tool and should not be considered in isolation or as asubstitute for an analysis of our results as reported under GAAP. Our use of this term may vary from the use of similarly-titled measures by otherissuers due to the potential inconsistencies in the method of calculation and differences due to items subject to interpretation. In addition, not allcompanies that report revenue growth on a constant currency basis calculate such measure in the same manner as we do and, accordingly, ourcalculations are not necessarily comparable to similarly-named measures of other companies and may not be appropriate measures forperformance relative to other companies.
Three Months EndedMarch 31, 2019
Consolidated Europe
Parts & Services
Revenue growth as reported 15.2% 38.9%
Less: Currency impact (3.2%) (7.3%)
Revenue growth at constantcurrency 18.4% 46.2%

39
Appendix 2 - Revenue and Segment EBITDA by segment
Three Months EndedMarch 31(1)
(in millions) 2019% of
revenue 2018% of
revenueRevenueNorth America $1,302 $1,330Europe 1,446 1,040
Specialty 354 352
Eliminations (1) (1)
Total Revenue $3,100 $2,721
Segment EBITDA
North America $177 13.6% $178 13.4%
Europe 105 7.3% 76 7.3%
Specialty 38 10.7% 42 11.9%
Total Segment EBITDA $320 10.3% $295 10.9%
We have presented Segment EBITDA solely as a supplemental disclosure that offers investors, securities analysts and other interested partiesuseful information to evaluate our segment profit and loss. We calculate Segment EBITDA as EBITDA excluding restructuring and acquisitionrelated expenses, change in fair value of contingent consideration liabilities, other gains and losses related to acquisitions, equity methodinvestments, or divestitures, equity in losses and earnings of unconsolidated subsidiaries and impairment charges. EBITDA, which is the basis forSegment EBITDA, is calculated as net income, less net income (loss) attributable to noncontrolling interest, excluding depreciation, amortization,interest and income tax expense. Our chief operating decision maker, who is our Chief Executive Officer, uses Segment EBITDA as the keymeasure of our segment profit or loss. We use Segment EBITDA to compare profitability among our segments and evaluate business strategies.This financial measure is included in the metrics used to determine incentive compensation for our senior management. We also considerSegment EBITDA to be a useful financial measure in evaluating our operating performance, as it provides investors, securities analysts and otherinterested parties with supplemental information regarding the underlying trends in our ongoing operations. Segment EBITDA includes revenueand expenses that are controllable by the segment. Corporate and administrative expenses are allocated to the segments based on usage, withshared expenses apportioned based on the segment's percentage of consolidated revenue. Refer to the table on the following page for areconciliation of net income to EBITDA and Segment EBITDA.
(1) The sum of the individual components may not equal the total due to rounding

40
Appendix 3 - Reconciliation of Net Income to EBITDA andSegment EBITDA
(1) The sum of the individual components may not equal the total due to rounding
Three Months Ended March 31(1)
(in millions) 2019 2018Net income $99 $153Subtract:Net income (loss) attributable to noncontrolling interest 1 (0)Net income attributable to LKQ stockholders $98 $153Add:Depreciation and Amortization 71 56Depreciation and Amortization - cost of goods sold 5 5Interest expense, net of interest income 36 29Provision for income taxes 52 50EBITDA $262 $292Subtract:Equity in (losses) earnings of unconsolidated subsidiaries (40) 1Add:Restructuring and acquisition related expenses 3 4Inventory step-up adjustment - acquisition related — 0Impairment of net assets held for sale 15 —Change in fair value of contingent consideration liabilities 0 0Segment EBITDA $320 $295Net income attributable to LKQ stockholders as a percentage of revenue 3.2% 5.6%EBITDA as a percentage of revenue 8.4% 10.7%Segment EBITDA as a percentage of revenue 10.3% 10.9%

41
Appendix 3 - EBITDA and Segment EBITDA Reconciliation
We have presented EBITDA solely as a supplemental disclosure that offers investors, securities analysts and other interested parties usefulinformation to evaluate our operating performance and the value of our business. We calculate EBITDA as net income, less net income (loss)attributable to noncontrolling interest, excluding depreciation, amortization, interest and income tax expense. EBITDA provides insight intoour profitability trends and allows management and investors to analyze our operating results with the impact of noncontrolling interest andwithout the impact of depreciation, amortization, interest and income tax expense. We believe EBITDA is used by investors, securitiesanalysts and other interested parties in evaluating the operating performance and the value of other companies, many of which presentEBITDA when reporting their results.
We have presented Segment EBITDA solely as a supplemental disclosure that offers investors, securities analysts and other interestedparties useful information to evaluate our segment profit and loss and underlying trends in our ongoing operations. We calculate SegmentEBITDA as EBITDA excluding restructuring and acquisition related expenses, change in fair value of contingent consideration liabilities, othergains and losses related to acquisitions, equity method investments, or divestitures, equity in losses and earnings of unconsolidatedsubsidiaries and impairment charges. Our chief operating decision maker, who is our Chief Executive Officer, uses Segment EBITDA as thekey measure of our segment profit or loss. We use Segment EBITDA to compare profitability among our segments and evaluate businessstrategies. This financial measure is included in the metrics used to determine incentive compensation for our senior management. SegmentEBITDA includes revenue and expenses that are controllable by the segment. Corporate and administrative expenses are allocated to thesegments based on usage, with shared expenses apportioned based on the segment's percentage of consolidated revenue.
EBITDA and Segment EBITDA should not be construed as alternatives to operating income, net income or net cash provided by operatingactivities, as determined in accordance with accounting principles generally accepted in the United States. In addition, not all companies thatreport EBITDA or Segment EBITDA information calculate EBITDA or Segment EBITDA in the same manner as we do and, accordingly, ourcalculations are not necessarily comparable to similarly named measures of other companies and may not be appropriate measures forperformance relative to other companies.
42
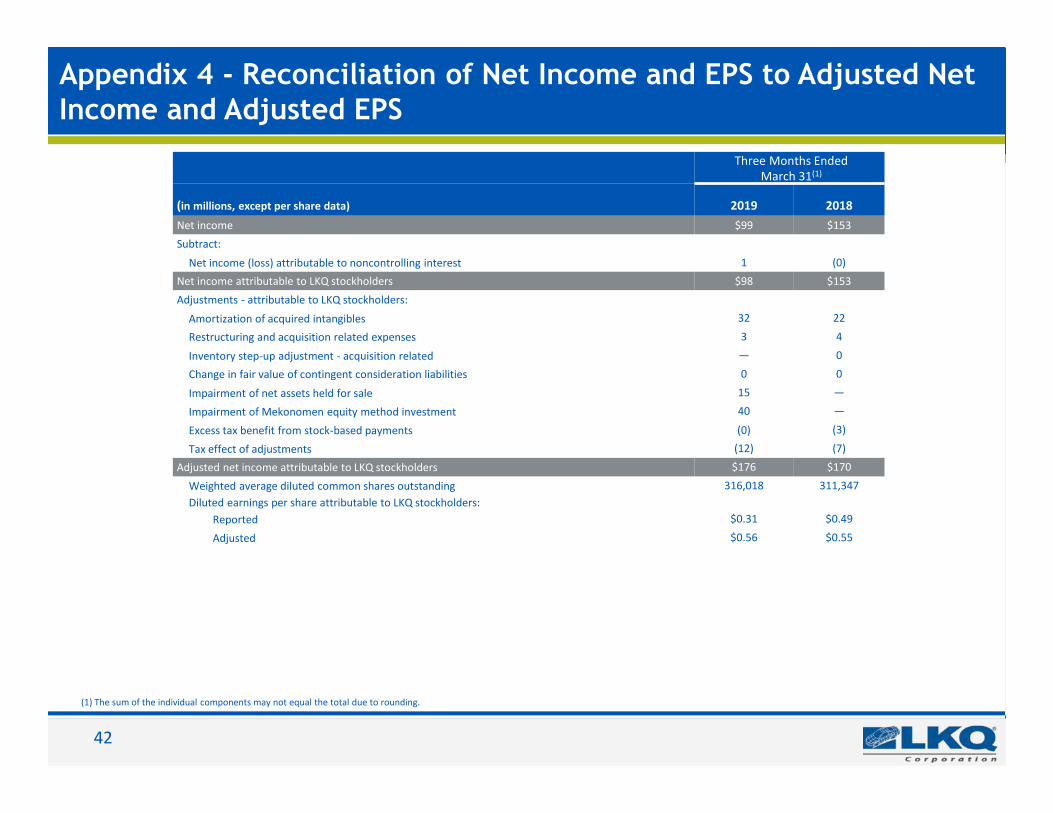
Appendix 4 - Reconciliation of Net Income and EPS to Adjusted NetIncome and Adjusted EPS
Three Months EndedMarch 31(1)
(in millions, except per share data) 2019 2018Net income $99 $153Subtract:
Net income (loss) attributable to noncontrolling interest 1 (0)Net income attributable to LKQ stockholders $98 $153Adjustments - attributable to LKQ stockholders:
Amortization of acquired intangibles 32 22Restructuring and acquisition related expenses 3 4Inventory step-up adjustment - acquisition related — 0Change in fair value of contingent consideration liabilities 0 0Impairment of net assets held for sale 15 —Impairment of Mekonomen equity method investment 40 —Excess tax benefit from stock-based payments (0) (3)Tax effect of adjustments (12) (7)
Adjusted net income attributable to LKQ stockholders $176 $170Weighted average diluted common shares outstanding 316,018 311,347Diluted earnings per share attributable to LKQ stockholders:
Reported $0.31 $0.49Adjusted $0.56 $0.55
(1) The sum of the individual components may not equal the total due to rounding.
43
Appendix 4 - Reconciliation of Net Income and EPS to AdjustedNet Income and Adjusted EPS
We have presented Adjusted Net Income and Adjusted Diluted Earnings per Share Attributable to LKQ Stockholders as we believe thesemeasures are useful for evaluating the core operating performance of our continuing business across reporting periods and in analyzing ourhistorical operating results. We define Adjusted Net Income and Adjusted Diluted Earnings per Share Attributable to LKQ Stockholders as NetIncome and Diluted Earnings per Share adjusted to eliminate the impact of noncontrolling interest, restructuring and acquisition relatedexpenses, amortization expense related to acquired intangibles, the change in fair value of contingent consideration liabilities, other gains andlosses related to acquisitions, equity method investments, or divestitures, impairment charges, excess tax benefits and deficiencies from stock-based payments and any tax effect of these adjustments. The tax effect of these adjustments is calculated using the effective tax rate for theapplicable period or for certain discrete items the specific tax expense or benefit for the adjustment. Given the variability and volatility of theamount and frequency of costs related to acquisitions, management believes that these costs are not normal operating expenses and should beadjusted in our calculation of Adjusted Net Income Attributable to LKQ Stockholders. These financial measures are used by management in itsdecision making and overall evaluation of our operating performance and are included in the metrics used to determine incentive compensationfor our senior management. Adjusted Net Income and Adjusted Diluted Earnings per Share Attributable to LKQ Stockholders should not beconstrued as alternatives to Net Income or Diluted Earnings per Share as determined in accordance with accounting principles generallyaccepted in the United States. In addition, not all companies that report measures similar to Adjusted Net Income and Adjusted Diluted Earningsper Share Attributable to LKQ Stockholders calculate such measures in the same manner as we do and, accordingly, our calculations are notnecessarily comparable to similarly-named measures of other companies and may not be appropriate measures for performance relative toother companies.

44
Appendix 5 - Forecasted EPS Reconciliation(1)
For the year ending December 31, 2019(in millions, except per share data) Minimum Guidance Maximum GuidanceNet income attributable to LKQ stockholders $586 $625Adjustments:
Amortization of acquired intangibles 125 125Restructuring and acquisition related expenses 3 3Impairment of net assets held for sale 15 15Impairment of Mekonomen equity method investment 40 40Other 0 0Tax effect of adjustments (37) (37)
Adjusted net income attributable to LKQ stockholders $732 $771Weighted average diluted common shares outstanding 313 313Diluted EPS attributable to LKQ stockholders:
U.S. GAAP $1.87 $2.00Non-GAAP (Adjusted) $2.34 $2.46
(1) The sum of the individual components may not equal the total due to rounding
We have presented forecasted Adjusted Net Income and forecasted Adjusted Diluted Earnings per Share Attributable to LKQ Stockholders inour financial guidance. Refer to the discussion of Adjusted Net Income and Adjusted Diluted Earnings per Share Attributable to LKQStockholders for details on the calculation of these non-GAAP financial measures. In the calculation of forecasted Adjusted Net Income andforecasted Adjusted Diluted Earnings per Share Attributable to LKQ Stockholders, we included estimates of income attributable to LKQstockholders, amortization of acquired intangibles for the full fiscal year 2019 and the related tax effect; we included for all othercomponents the amounts incurred through March 31, 2019.

45
Appendix 6 - Reconciliation of Net Cash Provided by OperatingActivities to Free Cash Flow
Three Months EndedMarch 31(1)
(in millions) 2019 2018Net cash provided by operating activities $177 $145
Less: purchases of property, plant and equipment 53 62Free cash flow $124 $83
(1) The sum of the individual components may not equal the total due to rounding.
We have presented free cash flow solely as a supplemental disclosure that offers investors, securities analysts and other interested partiesuseful information to evaluate our liquidity. We calculate free cash flow as net cash provided by operating activities, less purchases ofproperty, plant and equipment. Free cash flow provides insight into our liquidity and provides useful information to management andinvestors concerning our cash flow available to meet future debt service obligations and working capital requirements, make strategicacquisitions and repurchase stock. We believe free cash flow is used by investors, securities analysts and other interested parties inevaluating the liquidity of other companies, many of which present free cash flow when reporting their results. This financial measure isincluded in the metrics used to determine incentive compensation for our senior management. Free cash flow should not be construed as analternative to net cash provided by operating activities, as determined in accordance with accounting principles generally accepted in theUnited States. In addition, not all companies that report free cash flow information calculate free cash flow in the same manner as we doand, accordingly, our calculation is not necessarily comparable to similarly named measures of other companies and may not be anappropriate measure for liquidity relative to other companies.