Towards Automatic Modeling of Volleyball Players Behavior ...

1
Business Unit or Product Name
© 2003 IBM Corporation
IBM Research
© 2005 IBM Corporation
Automatic Modeling of Human
Behavior and Social Network
December 28, 2005
Ching-Yung Lin
IBM T. J. Watson Research CenterUniv. of Washington / Columbia Univ.
© 2005 IBM Corporation2
IBM T. J. Watson Research Center
12/28/05 | Automatic Modeling of Human Behavior and Social Network | Ching-Yung Lin
Outline
� Motivation
� Social Network Analysis and Modeling
� Expertise Modeling
� Personal / Community Interest Modeling
� Sleep Quality Inference
� Smart Wearable Audio-Visual-Location Sensors
� Conclusion
-- Who do you know?
-- What do you know?
-- How do you like it?
-- What did you do?
-- Where, When, What and Who did you see?

2
3
IBM T. J. Watson Research Center
12/28/05 | Automatic Modeling of Human Behavior and Social Network | Ching-Yung Lin © 2005 IBM Corporation
From multimedia understanding to multimodality understanding
A picture is worth 1000 words – which one thousand?
NIST TREC Video Concept Retrieval Benchmarking
Autonomous Learning
Cross-Modality Training
Imperfect Learning
4
IBM T. J. Watson Research Center
12/28/05 | Automatic Modeling of Human Behavior and Social Network | Ching-Yung Lin © 2005 IBM Corporation
Human – a complex multimodality subject/object
� “Human and Social Dynamics (HSD)” is identified as one of the five NSF key priorities among:
� Nanoscale Science and Engineering
� Biocomplexity in the Environment
� Human and Social Dynamics
� Mathematical Sciences
� Cyberinfrastructure
� (http://www.nsf.gov/news/priority_areas/)

3
5
IBM T. J. Watson Research Center
12/28/05 | Automatic Modeling of Human Behavior and Social Network | Ching-Yung Lin © 2005 IBM Corporation
Person, Community, Society
Photo Source: New York Times, 3/2/2005
6
IBM T. J. Watson Research Center
12/28/05 | Automatic Modeling of Human Behavior and Social Network | Ching-Yung Lin © 2005 IBM Corporation
Social Computing – when computer science meets sociology

4
7
IBM T. J. Watson Research Center
12/28/05 | Automatic Modeling of Human Behavior and Social Network | Ching-Yung Lin © 2005 IBM Corporation
Social Computing – when computer science meets sociology
�Computing-based Human Modeling (person)
�Computing-based Society Modeling (person <-> person)
�Computing-based Trust Management (person -> society,
person -> person, person -> information)
�Computing-based Information Organization and Management
(information -. person, information -> society)
8
IBM T. J. Watson Research Center
12/28/05 | Automatic Modeling of Human Behavior and Social Network | Ching-Yung Lin © 2005 IBM Corporation
Social Computing – when computer science meets sociology
� Computing-based Human Modeling (person)� Biometric-based modeling
� Behavior modeling
� Knowledge and Interest modeling
� Computing-based Society Modeling (person <-> person)� Community modeling
� Social network modeling
� Computing-based Trust Management (person -> society, person -> person, person -> information)
� Information trustworthiness
� Human trustworthiness
� System trustworthiness
� Computing-based Information Organization and Management (information -. person, information -> society)
� Personalized information
� Community-oriented information

5
9
IBM T. J. Watson Research Center
12/28/05 | Automatic Modeling of Human Behavior and Social Network | Ching-Yung Lin © 2005 IBM Corporation
Social Computing (I) -- Computing-based Human Modeling
� Biometric-based modeling:� Face Recognition
� Speaker Recognition
� Fingerprint Recognition
� Iris Recognition
� Hand, Dental Recognition
� DNA Recognition
� Behavior modeling:� Painting and Speaking Style Authentication
� Walking and Typing Features Authentication
� Emailing Behavior Modeling
� Personal Information Propagation Behavior Modeling
� Knowledge and Interest modeling:� Expertise Modeling
� Interest Modeling
� Personal Social Network Modeling
10
IBM T. J. Watson Research Center
12/28/05 | Automatic Modeling of Human Behavior and Social Network | Ching-Yung Lin © 2005 IBM Corporation
Social Computing (II) -- Computing-based Society Modeling
� Community modeling:
� Communication-based Community Identification
� Link-based Community Identification (e.g., blogs, personal webpages, citations)
� Access-based Community Identification (e.g., e-commerce sites, digital archive, organization database)
� Opinion-based Community Identification (e.g., collaborative filtering)
�Social Network modeling:
� Informal Network in Organization
� Information Propagation Network
� Epidemic Network
� Friendship Network

6
11
IBM T. J. Watson Research Center
12/28/05 | Automatic Modeling of Human Behavior and Social Network | Ching-Yung Lin © 2005 IBM Corporation
Social Computing (III) -- Computing-based Trust Management
� Information Trustworthiness:
� Multimedia Authentication
� Data Security in Communication
�Human Trustworthiness:
� Collaborator Identification
� Opinion Acceptance
�System Trustworthiness:
� System Reliability
� Fault-Tolerance System
12
IBM T. J. Watson Research Center
12/28/05 | Automatic Modeling of Human Behavior and Social Network | Ching-Yung Lin © 2005 IBM Corporation
Social Computing (IV) -- Computing-based Information Organization and Management
� Personalized Information:
� Personalized Multimedia Summarization
� Personalized Data Abstraction
� Personalized Data Representation and Visualization
�Community-Oriented Information:
� Community-Profiling for Multimedia Summarization
� Community-Profiling for Data Abstraction
� Community-Profiling for Data Representation and Visualization

7
13
IBM T. J. Watson Research Center
12/28/05 | Automatic Modeling of Human Behavior and Social Network | Ching-Yung Lin © 2005 IBM Corporation
Outline
�Motivation
�Social Network Analysis and Modeling
�Expertise Modeling
�Personal / Community Interest Modeling
�Sleep Quality Inference
�Conclusion
14
IBM T. J. Watson Research Center
12/28/05 | Automatic Modeling of Human Behavior and Social Network | Ching-Yung Lin © 2005 IBM Corporation
What is Social Network Analysis?
It’s all about who you know and how you find them…
�Social Network Analysis (SNA) is a set of methods and tools for revealing relations between entities – communities, people (if they are strong influential stakeholders), teams, departments, organizations and even countries.
�Social networks assumes interdependence between people.
�Behaviors and outcomes are understood through our relationship with others
� Academic roots in sociology, anthropology, organizational behavior and medicine
� Recent application to problems in Knowledge Management and Collaboration
� Also called Organizational Network Analysis
Provided by Drs. Tony Mobbs and Kate Ehrlich, IBM

8
15
IBM T. J. Watson Research Center
12/28/05 | Automatic Modeling of Human Behavior and Social Network | Ching-Yung Lin © 2005 IBM Corporation
Beyond the organizational chart
Source: Cross, R., Parker, A., Prusak, L. & Borgatti, S.P. 2001. Knowing What We Know: Supporting Knowledge Creation and Sharing in Social Networks. Organizational Dynamics 30(2): 100-120. [pdf]
� Organization charts are not the best indicator of how work gets done
� Senior people are not always central; peripheral people can represent untapped knowledge
� Making the network visible makes it actionable and becomes the basis for a collaboration action plan
Provided by Drs. Tony Mobbs and Kate Ehrlich, IBM
16
IBM T. J. Watson Research Center
12/28/05 | Automatic Modeling of Human Behavior and Social Network | Ching-Yung Lin © 2005 IBM Corporation
Relationships are multi-dimensional and uncovered through network questions
Communication
How often do you
communicate with this
person?
Innovation
How often do you turn
to this person for new
ideas
Advice
How often do you seek advice
from this person before making
an important decision?
Awareness
I am aware of this
person’s knowledge and
skills
Learning
How likely are you to
rely on this person for
advice on new methods
and processes
Valued Expertise
How likely are you to
turn to this person for
specialized expertise
Trust
I believe there is a high
personal cost in seeking
advice or support from
this person
Access
I believe this person will respond to my request in a reasonable and timely manner
Energy
I generally feel energized when I interact with this person
Actions Awareness Emotional
Provided by Drs. Tony Mobbs and Kate Ehrlich, IBM

9
17
IBM T. J. Watson Research Center
12/28/05 | Automatic Modeling of Human Behavior and Social Network | Ching-Yung Lin © 2005 IBM Corporation
What can computer scientists do?
� Informal social network within formal organizations is a major factor affecting a company/society’s performance.
�Krackhardt (2005) showed that companies with strong informal networks perform five or six times better than those with weak networks.
� Since Weber (1920s), decades of related social scientific researches have been mainly relying on questionnaires and interviews to understand individual’s thoughts and behaviors.
� Is it possible to ‘acquire’ social networks automatically?
� How about automatically building/updating ‘personal profiles’, ‘social capitals’?
Sample questionnaire (Prof. Krackhardt, CMU)
18
IBM T. J. Watson Research Center
12/28/05 | Automatic Modeling of Human Behavior and Social Network | Ching-Yung Lin © 2005 IBM Corporation
Case Study -- Enron Corpus
10
19
IBM T. J. Watson Research Center
12/28/05 | Automatic Modeling of Human Behavior and Social Network | Ching-Yung Lin © 2005 IBM Corporation
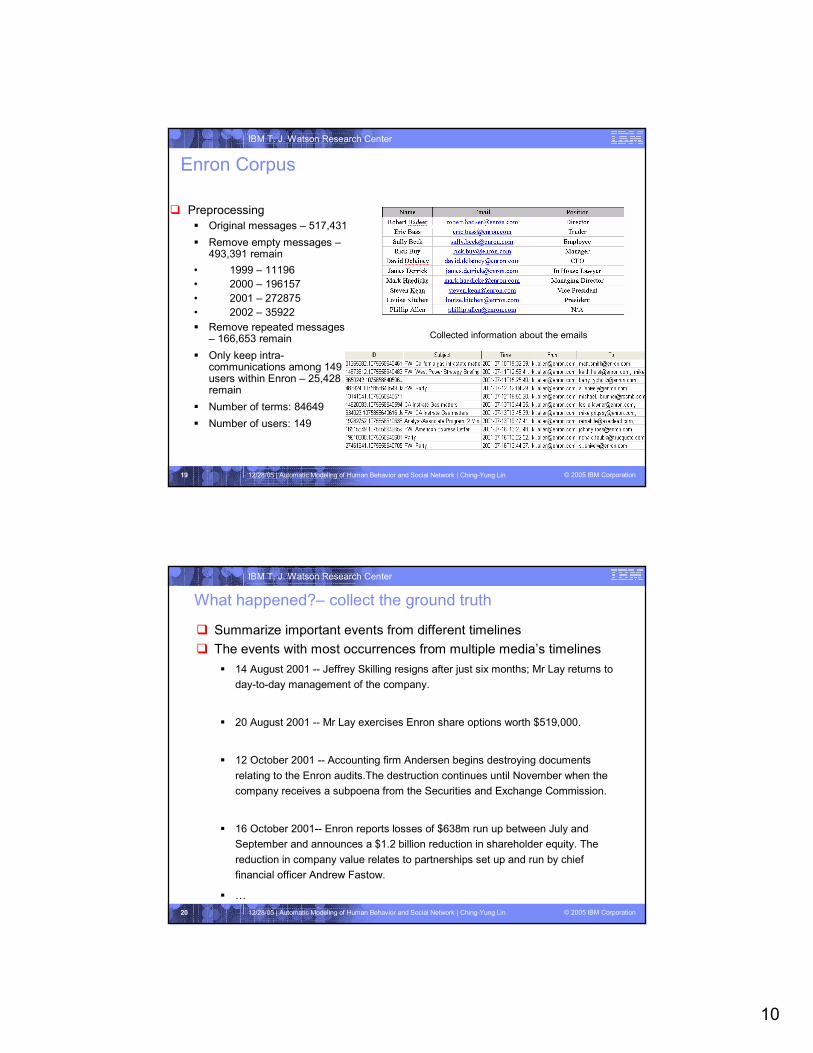
Enron Corpus
� Preprocessing
� Original messages – 517,431
� Remove empty messages –493,391 remain
• 1999 – 11196
• 2000 – 196157
• 2001 – 272875
• 2002 – 35922
� Remove repeated messages – 166,653 remain
� Only keep intra-communications among 149 users within Enron – 25,428 remain
� Number of terms: 84649
� Number of users: 149
Collected information for each person
Collected information about the emails
20
IBM T. J. Watson Research Center
12/28/05 | Automatic Modeling of Human Behavior and Social Network | Ching-Yung Lin © 2005 IBM Corporation
What happened?– collect the ground truth
� Summarize important events from different timelines
� The events with most occurrences from multiple media’s timelines
� 14 August 2001 -- Jeffrey Skilling resigns after just six months; Mr Lay returns to
day-to-day management of the company.
� 20 August 2001 -- Mr Lay exercises Enron share options worth $519,000.
� 12 October 2001 -- Accounting firm Andersen begins destroying documents
relating to the Enron audits.The destruction continues until November when the
company receives a subpoena from the Securities and Exchange Commission.
� 16 October 2001-- Enron reports losses of $638m run up between July and
September and announces a $1.2 billion reduction in shareholder equity. The
reduction in company value relates to partnerships set up and run by chief
financial officer Andrew Fastow.
� …

11
21
IBM T. J. Watson Research Center
12/28/05 | Automatic Modeling of Human Behavior and Social Network | Ching-Yung Lin © 2005 IBM Corporation
Social Network Analysis:� Potential of social network analysis
� every person in the world is only six edges away from every other, if an edge between i and j means "i knows j" [Milgram 1967]
� Static social network analysis � In social network analysis: Exponential Random Graph Models [Wasserman and Pattison, 1996]
� In information mining area:
• Mine social relationships from email logs by using a set of heuristic graph algorithms [Schwartz and Wood 1993]
• Mine a social network from a wide variety of publicly-available online information to help individuals find experts who could answer their questions [Kautz et al. 1997]
• Mine communities from the Web (defined as sets of sites that have more links to each other than to non-members) [Flake et al. 2002]
• Use a betweeness centrality algorithm for the automatic identification of communities of practice from email logs within an organization [Joshua T. et al. 2003]
• The Google search engine and HITS algorithm [Page et al. et al. 1998] [Kleinberg 1998]� Dynamical social networks
� In social network analysis: Dynamic actor-oriented social network [Snijder 2002]
• Changes in the network are modeled as the stochastic result of network effects (density, reciprocity, etc.)
• Network evolution is modeled by continuous time Markov chain models� In information mining area:
• link prediction problem - Infer which new interactions among its members are likely to occur in the near future [Liben-Nowell 2003]
• Track changes in large-scale data by periodically creating an agglomerative clustering and examining the evolution of clusters over time [Kubica et al. 2002]
� However, all of them are only based on pure network properties, without knowing what people are
talking about and why they have close relationship
22
IBM T. J. Watson Research Center
12/28/05 | Automatic Modeling of Human Behavior and Social Network | Ching-Yung Lin © 2005 IBM Corporation
Dynamic social networks

12
23
IBM T. J. Watson Research Center
12/28/05 | Automatic Modeling of Human Behavior and Social Network | Ching-Yung Lin © 2005 IBM Corporation
Using Traditional SNA -- People with top 10 centralities in Enron
Managing_Direc
torMark_Haedicke
In_house_la
wyerMary_Hain
Vice_Preside
ntJohn_ArnoldIn_house_lawyerCarol_Clair10
N/ADana_DavisN/APhillip_AllenN/AJeffrey_A_Shank
manEmployeeDan_Hyvl9
N/ADoug_Gilbert-
Smith
Managing_
Director
Mark_Haedick
eEmployeeSally_BeckVice_PresidentSteven_Kean8
Vice_PresidentFletcher_SturmPresidentGreg_WhalleyPresidentGreg_WhalleyManaging_Direct
orJohn_Hodge7
PresidentGreg_WhalleyCEODavid_Delain
eyN/AMike_McConnell
Managing_Direct
orMark_Haedicke6
Vice_PresidentJames_SteffesPresidentLouise_Kitche
nCEOJeff_SkillingEmployeeElizabeth_Sager5
Vice_PresidentHunter_ShivelyManagerVince_Kamins
kiManagerVince_KaminskiVice_PresidentRichard_Sanders4
CEOJohn_LavoratoEmployeeJeff_DasovichCEOJohn_LavoratoN/ASara_Shackleton3
PresidentLouise_KitchenCEOJohn_LavoratoVice_Preside
ntSteven_KeanN/ATana_Jones2
Vice_PresidentKevin_PrestoVice_Presid
entSteven_KeanCEODavid_DelaineyEmployeeMark_Taylor1
PositionNamePositionNamePositionNamePositionName
2002200120001999Centralit
y
Centrality: Actor has high involvement in many relations, regardless of send/receive directionality (volume of activity)
24
IBM T. J. Watson Research Center
12/28/05 | Automatic Modeling of Human Behavior and Social Network | Ching-Yung Lin © 2005 IBM Corporation
Using Traditional SNA -- People with top-10 prestige in Enron
NANAVice_Presiden
tHunter_ShivelyCEOJeff_SkillingEmployeeStacy_Dickson10
NANACEODavid_DelaineyN/APhillip_AllenN/AMichelle_Cash9
NANAN/AMike_GrigsbyN/AJeffrey_A_Shankm
anEmployeeMark_Taylor8
NANAVice_Presiden
tSteven_KeanVice_PresidentKevin_PrestoVice_PresidentKevin_Presto7
Vice_PresidentFletcher_SturmVice_Presiden
tBarry_TycholizManagerRick_BuyVice_PresidentRichard_Sanders6
N/AStacey_WhiteVice_Presiden
tKevin_PrestoManagerVince_KaminskiEmployeeElizabeth_Sager5
N/AErrol_McLaughlinPresidentGreg_WhalleyVice_PresidentSteven_KeanManaging_Directo
rMark_Haedicke4
EmployeeKam_KeiserN/APhillip_AllenCEODavid_DelaineyManagerVince_Kaminski3
N/APhillip_LovePresidentLouise_KitchenPresidentGreg_WhalleyVice_PresidentSteven_Kean2
N/ADarron_GironCEOJohn_LavoratoCEOJohn_LavoratoManaging_Directo
rJohn_Hodge1
PositionNamePositionNamePositionNamePositionName
2002200120001999
Prestige
Most of them have relatively high position in Enron, which reveal the roles in the social network actually are almost corresponding to the roles in the real life
Prestige: Actor is the recipient of many directed ties

13
25
IBM T. J. Watson Research Center
12/28/05 | Automatic Modeling of Human Behavior and Social Network | Ching-Yung Lin © 2005 IBM Corporation
Our Contributions
� A novel way to automatically model and predict human behavior ofreceiving and disseminating information.
� Generate an application model (CommunityNet) which describes personal dynamic community network.
� Develop a new algorithm incorporating content, time and social networks simultaneously.
� Experiments results show that personal behavior and intention are somewhat predictable – e.g., to whom a person is going to send a specific mail.
� The performance of the proposed adaptive algorithm is 58% better than the model only based on social network, and is 75% better than an aggregated model based on the state-of-the-art content analysis model with social network enhancement.
� Developed prototypes showing how this model can be applied to organization management and social capital management
26
IBM T. J. Watson Research Center
12/28/05 | Automatic Modeling of Human Behavior and Social Network | Ching-Yung Lin © 2005 IBM Corporation
An Overview of CommunityNet
Input: Emails
From: [email protected]: [email protected]
Subject: Re: timing of submitting information to Risk Controls
Good memo - let me know if you see results.……
Topic Detection,Content Analysis
Topics
Meeting schedule
Agreement
California Energy
Game
Holiday celebration
CommunityNet
CommunityNetModeling
ApplicationsRecommendation system
Prediction,Filtering
14
27
IBM T. J. Watson Research Center
12/28/05 | Automatic Modeling of Human Behavior and Social Network | Ching-Yung Lin © 2005 IBM Corporation
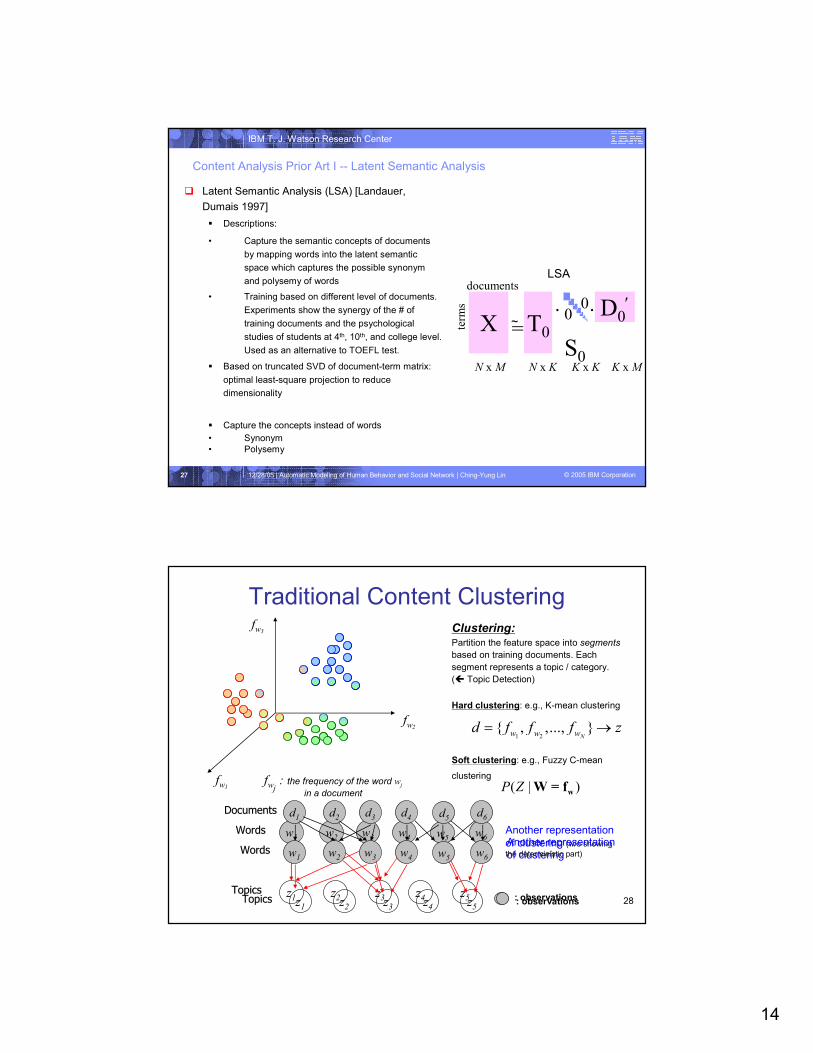
Content Analysis Prior Art I -- Latent Semantic Analysis
� Latent Semantic Analysis (LSA) [Landauer,
Dumais 1997]
� Descriptions:
• Capture the semantic concepts of documents
by mapping words into the latent semantic
space which captures the possible synonym
and polysemy of words
• Training based on different level of documents.
Experiments show the synergy of the # of
training documents and the psychological
studies of students at 4th, 10th, and college level.
Used as an alternative to TOEFL test.
� Based on truncated SVD of document-term matrix:
optimal least-square projection to reduce
dimensionality
� Capture the concepts instead of words
• Synonym• Polysemy
X T0
S0
D0′
N xM N x K K x K K xM
· ·=te
rms
documents
00
~
LSA
28
Traditional Content Clustering
fw2
fwj: the frequency of the word wj
in a document
fw1
fw3 Clustering:Partition the feature space into segments
based on training documents. Each
segment represents a topic / category.
( Topic Detection)
Hard clustering: e.g., K-mean clustering
1 2{ , ,..., }
Nw w wd f f f z= →
w1
: observationsz1
TopicsTopics
WordsWords
z2 z3 z4 z5
w5w2 w3 w4 w6
Another representation of clustering (w/o showing the deterministic part)
( | )P Z wW = f
Soft clustering: e.g., Fuzzy C-mean
clustering
w1
: observationsz1TopicsTopics
WordsWords
z2 z3 z4 z5
w5w2 w3 w4 w6
Another representation of clustering
d1DocumentsDocuments d5
d2 d3 d4 d6
15
29
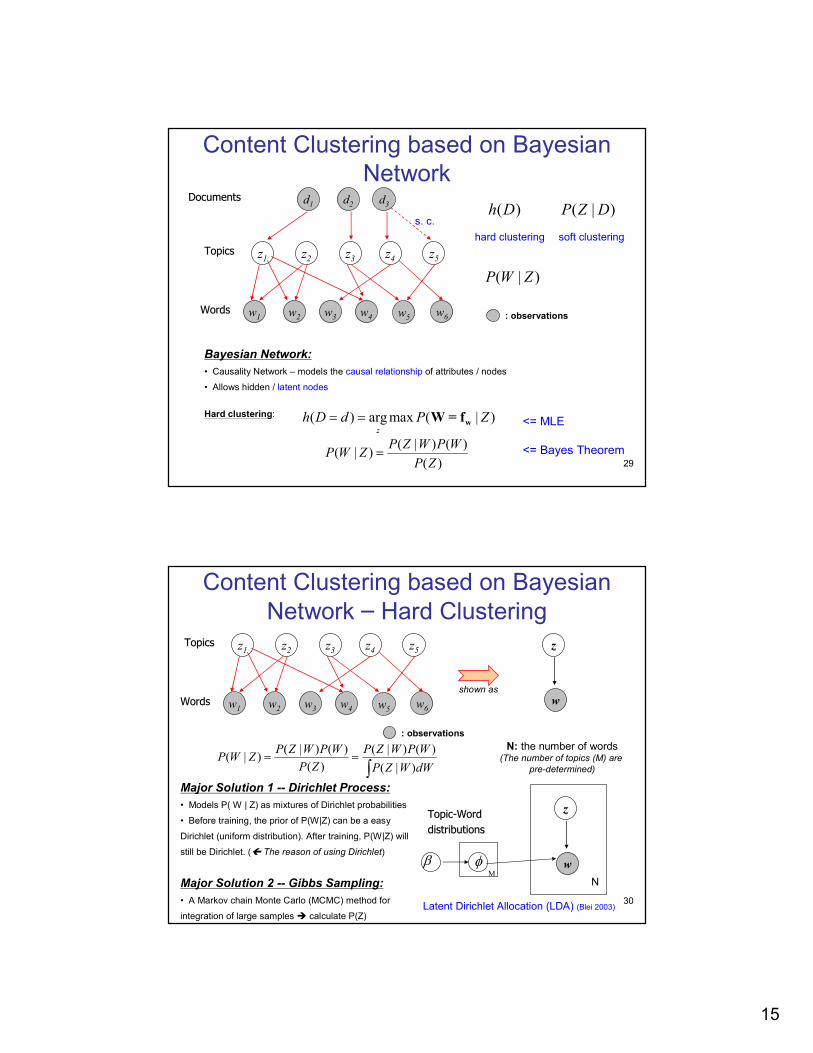
Content Clustering based on Bayesian Network
( | )P W Z
Bayesian Network:
• Causality Network – models the causal relationship of attributes / nodes
• Allows hidden / latent nodes
Hard clustering:
w1 : observations
z1TopicsTopics
WordsWords
z2 z3 z4 z5
w5w2 w3 w4 w6
soft clustering
d1DocumentsDocuments d2 d3
( | ) ( )( | )
( )
P Z W P WP W Z
P Z=
( | )P Z D
( ) argmax ( | )z
h D d P Z= = wW = f
( )h D
hard clustering
s. c.
<= MLE
<= Bayes Theorem
30
Content Clustering based on Bayesian Network – Hard Clustering
w1
: observations
z1TopicsTopics
WordsWords
z2 z3 z4 z5
w5w2 w3 w4 w6
( | ) ( ) ( | ) ( )( | )
( ) ( | )
P Z W P W P Z W P WP W Z
P Z P Z W dW= =
∫
z
w
N: the number of words(The number of topics (M) are
pre-determined)
Major Solution 1 -- Dirichlet Process:
• Models P( W | Z) as mixtures of Dirichlet probabilities
• Before training, the prior of P(W|Z) can be a easy
Dirichlet (uniform distribution). After training, P(W|Z) will
still be Dirichlet. ( The reason of using Dirichlet)
Major Solution 2 -- Gibbs Sampling:
• A Markov chain Monte Carlo (MCMC) method for
integration of large samples � calculate P(Z)
z
w
N
βM
φ
TopicTopic--WordWord
distributionsdistributions
Latent Dirichlet Allocation (LDA) (Blei 2003)
shown as

16
31
Content Clustering based on Bayesian Network – Soft Clustering
w1
: observations
z1TopicsTopics
WordsWords
z2 z3 z4 z5
w5w2 w3 w4 w6
N: the number of wordsA: the number of docs
shown as
d1DocumentsDocuments d2 d3
w
d
z
LDA (Blei 2003)β
M
φTopicTopic--WordWord
distributionsdistributions
α θ
wN
d
A
zA
DocumentDocument--TopicTopic
distributionsdistributions
32
Some Insight on BN-based Content Clustering
Content Clustering:
• Because documents and words are
dependent,
� only close documents in the feature
space can be clustered together as
one topic.
fw2
fwj: the frequency of the word wj
in a document
fw1
fw3
⇒Incorporating human factors can possibly *link* multiple
clusters together.
Bayesian Network:
• Models the *practical* causal
relationships..

17
33
Why We Need Simultaneous Multimodality Clustering?
Multiple-Step Clustering:
• e.g., Naïve way to combine content filtering and collaborative filtering
� Independently cluster first. Combine later.
fw2
fw1
fw3
OK
fw2
fw1
fw3
Not-OK
�Simultaneous Multimodality Clustering is important.
34
How to Incorporate Human Factors?
2-Stage Bayesian Network Modeling for Emails [Song et. al. KDD 2005]
CTR Modeling :
• Objective: Build 2-stage Bayesian
Networks to represent the causal
relations of user, receiver, topic, and
words of emails.
• Technical Achievement: Show that
multiple Gibbs Sampling can be applied
to multistage BNs, if nodes are only 1-
stage dependent.
• Applications: Email Topic/Thread
Classification and Information Flow
Predication
w
: observations
zα θ
U, V
NA
βM
φ
User/ReceiverUser/Receiver--TopicTopic
distributionsdistributions
TopicTopic--WordWord
distributionsdistributions
TopicTopic
WordWord
u, vUser/ReceiverUser/Receiver
PairPair
z : latent topicsθθθθ : User/Receiver-Topic distributionsφφφφ : Topic-Word distributionsαααα, β: Dirichlet parameters
A: the number of emailsM: the number of latent topicsN: the number of words in a documentU, V: the number of sender / receiver

18
35
IBM T. J. Watson Research Center
12/28/05 | Automatic Modeling of Human Behavior and Social Network | Ching-Yung Lin © 2005 IBM Corporation
Novel Content-Time-Relation Algorithm -- II
: observations
α θA
ND
βT
φ
ad
z
w
Given the sender and the
time of an email:
1. Get the probability of a topic given the sender
2. Get the probability of the receiver given the sender and the topic
3. Get the probability of a word given the topic
r
CTR model
Boxes represents iteration.
S
Given the sender and the set of receivers of an email:
1. Pick a receiver
2. Get the probability of a topic given the sender and receiver
3. Get the probability a word given the topic
[McCallum et. al, 2005]
� Content-Time-Relation (CTR) [Song, Lin, Tseng, Sun, KDD-submission Feb. 2005]:
� Incremental Latent Dirichlet Allocations
� Capture evolutionary information
� Integrate social network model
�Combine content, time and social relation information with Dirichlet allocations, a causal Bayesian
network and an Exponential Random Graph Social Network Model.
� Besides, for the time windowing, one can use Poisson distribution to replace the Dirichlet allocation, where ϕ = γ^ | t – t0|.
γ ϕTm
t
36
IBM T. J. Watson Research Center
12/28/05 | Automatic Modeling of Human Behavior and Social Network | Ching-Yung Lin © 2005 IBM Corporation
Demo – The Email Receiver Recommendation System
url: http://nansen.ee.washington.edu/communitynet

19
37
IBM T. J. Watson Research Center
12/28/05 | Automatic Modeling of Human Behavior and Social Network | Ching-Yung Lin © 2005 IBM Corporation
Topic Analysis Results - Hot and cold topics in Enron Email Corpus
Table 1. Hot Topics
letter
draft
attach
comment
review
mark
Houston
Texas
Enron
north
America
street
Petroleum
research
dear
photo
Enron
station
deal
desk
book
bill
group
explore
meeting
plan
conference
balance
presentation
discussion
DocumentTexasPetroleumDealMeeting
Table 2. Cold Topics
call
market
week
trade
description
respond
Court
state
India
server
project
govern
network
world
user
save
secure
system
Stock
earn
company
share
price
new
trade
London
bank
name
Mexico
conserve
MarketProjectNetworkStockTrade
38
IBM T. J. Watson Research Center
12/28/05 | Automatic Modeling of Human Behavior and Social Network | Ching-Yung Lin © 2005 IBM Corporation
Corporate Topic Trend Analysis Example: Yearly repeating events
Topic Trend Comparison
0
0.005
0.01
0.015
0.02
0.025
0.03
Jan Mar May Jul Sep Nov
Popularity
Topic45(y2000)
Topic45(y2001)
Topic19(y2000)
Topic19(y2001)
Topic 45, which is talking about a schedule issue, reaches a peak during June to September. For topic 19, it is talking about a meeting issue. The trend repeats year to year.

20
39
IBM T. J. Watson Research Center
12/28/05 | Automatic Modeling of Human Behavior and Social Network | Ching-Yung Lin © 2005 IBM Corporation
Topic Detection and Key People Detection of “California Power” Match Their Real-Life Roles
(a)
Topic Analysis for Topic 61
0
0.002
0.004
0.006
0.008
0.01
0.012
0.014
0.016
0.018
Jan-00 Apr-00 Jul-00 Oct-00 Jan-01 Apr-01 Jul-01 Oct-01
Popularity
Jeff_Dasovich 0.249863 James_Steffes 0.139212
Richard_Shapiro 0.096179 Mary_Hain 0.078131
Richard_Sanders 0.052866 Steven_Kean 0.044745
Vince_Kaminski 0.035953
Key People
power 0.089361 California 0.088160 electrical 0.087345 price 0.055940
energy 0.048817 generator 0.035345 market 0.033314 until 0.030681
Key Words
Event “California Energy Crisis” occurred at exactly this time period. Key people are active in this event except Vince_Kaminski …
40
IBM T. J. Watson Research Center
12/28/05 | Automatic Modeling of Human Behavior and Social Network | Ching-Yung Lin © 2005 IBM Corporation
Topic Trends of Key Person’s Communication Records Match the Trends in the Topic-Community
0
0.1
0.2
0.3
0.4
0.5
Jan-00 May-00 Sep-00 Jan-01 May-01 Sep-01
Popularity
Overall trend
Jeff_Dasovich
Vince_Kaminski
All of the key people were sort of politicians except Vince Kaminski is a researcher.

21
41
IBM T. J. Watson Research Center
12/28/05 | Automatic Modeling of Human Behavior and Social Network | Ching-Yung Lin © 2005 IBM Corporation
Receivers are Predictable Given the Content and the Composer of an Email
0
0.2
0.4
0.6
0.8
1
Jan-01 Apr-01 Jul-01 Oct-01 Jan-02
Accura
cy
by PSN
by CTR
by LDA-PSN
(a) Accuracy based on the top 5 most likely people
0
0.2
0.4
0.6
0.8
1
Jan-01 Apr-01 Jul-01 Oct-01 Jan-02
Accuracy
by PSN
by CTR
by LDA-PSN
(b) Accuracy based on the top 10 most likely people
. Accuracy is measured by testing whether the “real” receiver is among the prediction list of the top 5 or 10 most likely people
0
0.2
0.4
0.6
0.8
1
Jan-01 Mar-01 May-01 Jul-01 Sep-01 Nov-01
Accuracy
Adaptive CTR(Top 5)
Adaptive CTR(Top 10)
CTR(Top5)
CTR(Top10)
0
5
10
15
20
25
30
35
40
45
Jan-01 Mar-01 May-01 Jul-01 Sep-01 Nov-01
Adaptive CTR(aggregative)
Adaptive CTR(6 months)
CTR
LDA-PSN
PSN
(c). Comparison between Adaptive CTR and CTR models
(d) Comparison using Breese evaluation metrics
42
IBM T. J. Watson Research Center
12/28/05 | Automatic Modeling of Human Behavior and Social Network | Ching-Yung Lin © 2005 IBM Corporation
Personal Social Network - who a user contacts with during a time period
(b1) Jan-‘99 to Dec-‘99 (b2) Jan-‘00 to Jun-‘00 (b3) Jul-‘00 to Dec-‘00(b) Evolutionary Personal Social Network
(c) Personal Social Network Information Flow
with two-level personal social network of John Arnold
(a) Personal Social Network of John Arnold

22
43
IBM T. J. Watson Research Center
12/28/05 | Automatic Modeling of Human Behavior and Social Network | Ching-Yung Lin © 2005 IBM Corporation
Personal Topic-Community Networks- who a user will contact with under different topics
(a) Personal Topic-Community Networks when we type in “Christmas” and “Stock”
(b) Personal Topic-Community Information flow for keyword “energy” with two-level personal Topic-Community network
44
IBM T. J. Watson Research Center
12/28/05 | Automatic Modeling of Human Behavior and Social Network | Ching-Yung Lin © 2005 IBM Corporation
Personal Social Capital Management -Receiver Recommendation Demo
(c) Receiver recommendation for “Can you tell me the current stock price?”
(b) Receiver recommendation for “Government”
(a) Receiver recommendation based on Personal Social Network

23
45
IBM T. J. Watson Research Center
12/28/05 | Automatic Modeling of Human Behavior and Social Network | Ching-Yung Lin © 2005 IBM Corporation
Outline
�Motivation
�Social Network Analysis and Modeling
�Expertise Modeling
�Personal / Community Interest Modeling
�Sleep Quality Inference
�Conclusion
46
ExpertiseNet
Build graphical representations of a researcher’s expertise based on her/his publications and citation networks
ERGM
Text
Analysis
Link
Analysis
Data
ExpertiseNet Expertise
Mining
Expertise
Matching
Pattern
Discovery
ExpertiseExtraction
RelationshipRepresentation
EvolutionaryRepresentation

24
47
expertise category set { }
Expertise Extraction
� Adaboost based algorithm
� Weighted combination of weak learners
� Not prone to overfitting
� Features� Bag of words with tf as weight
� Title
� Abstract
� Title of the reference
� Expertise categories from references and the associated ratio (ref. prob.)
P5P8
P7
P2 P4
P9P6
P3P1
P10
Citation network
48
Building Relational ExpertiseNet
�Capture one’s research expertise + how one expertise
influences and is influenced by others
ExpertiseNet
(NLP)
(IR) (NLP)
#3
(IR)
Paper
#1
(ML)
Person A
Publications in the wholecommunity
(IR) (NLP)
(ML)
(ML)
(ML)
#2
(NLP)
Person A
MLNLP
IR
Summarize

25
49
Relational ExpertiseNet
� Graph G=(V,E)
� V = set of nodes
� E = set of edges
� Node: Expertise
� The strength of the expertise
� Edge: Relationship between two expertise
� The strength of the correlation between two expertise
An example of Relational ExpertiseNet
50
Model the ExpertiseNet
� Capture expertise as well as the structure influences� The dependency relationship� The hierarchical structure
� ERGM
� Y : a random graph on a set of n nodes� y : an observation� : graph statistics on y
Density, reciprocity, transitivity, strengths of edges
� : parameters to model the importance of the statistics on the graph
� The structure distance of two Relational ExpertiseNets
� M: the total number of the parameters
θ
( )( )( )
( )exp T s y
P Y yc
θ
θ
θ= =
( )s y
, , ,
1
( )M
i j i k j k
k
D E E θ θ=
= −∑

26
51
Building Evolutionary ExpertiseNet
�Capture one’s research expertise + how they evolved
ExpertiseNet
Publications
ExpertiseNet
Publications
(NLP)
1992
(IR)
1993(NLP)
1993
#3(IR)
1997
Paper #1(ML)1994
Person A
(IR)
1996
(NLP)
1995
(ML)1993
(ML)1993
(ML)
1992
#2(NLP)
1994
Person A
1994 - 1996 After 1997
ML
NLP
IR
Summarize
52
Expertise Extraction
� Incorporation of ref. prob. as a feature boosts classification accuracy
Dataset:Cora Research Publication Corpus • Over 50,000 papers• About 715,000 citation links• Labeled into a topic hierarchy with 69 leaves• Provide bibliographic information for each paper

27
53
ExpertiseNet for Expertise Mining
(a) Relational mining
Machine Learning – PlanningSearch can be based on keywords and
Influence relationships
� Rich graphical user profiling provides a more
discriminative system on mining and matching experts.
Machine Learning � PlanningSearch can be based
on keywords and evolutions
(b) Evolutionary mining
54
Examples: enhanced discriminative capability of ExpertiseNets
Two researchers with the same expertise vector:
Another two researchers with similar expertise vectors:

28
55
Expertise MatchingSearch for similar people based on ExpertiseNet
56
IBM T. J. Watson Research Center
12/28/05 | Automatic Modeling of Human Behavior and Social Network | Ching-Yung Lin © 2005 IBM Corporation
Outline
�Motivation
�Social Network Analysis and Modeling
�Expertise Modeling
�Personal / Community Interest Modeling
�Sleep Quality Inference
�Conclusion

29
57
Modeling Interests for RecommendationTraditionally, how to make recommendations?
• Administrator looks at the new content –decide whether the content is interesting
• If we want to use automatic recommendation – Content Filtering
categorize the new content, then decide whether this content is similar to the ones that users accessed before.
– Collaborative FilteringWait a few days – if a content becomes popular (access by many people similar to the user), then it must be interesting
RFID WiFi Security
marketing R&D executives
58
Finding Communities and Topics Modeling for Document Recommendations [Song et. al. SDM 2006]
CTC Modeling:
• Build 3-stage BNs.
• Showing that models converge
even for 2 latent layers
• Time determines a decaying factor
of documents for measuring the
similarity of users for community
clustering.
� Obtains communities and content
topics based on the observed time,
users and the words in the accessed
documents.
w
: observations
zα θ
K
N
βM
φ
CommunityCommunity--TopicTopic
distributionsdistributions
TopicTopic--WordWord
distributionsdistributions
TopicTopic
WordWord
γ ϕU
UserUser--CommunityCommunity
distributionsdistributions
CommunityCommunityg
A
u UserUser
tTimeTime
g, z : latent variablesθθθθ : Community-Topic distributionsφφφφ : Topic-Word distributionsφ: Community distributionsαααα, β, γ: Dirichlet parameters
A: the number of access recordsK: the number of latent communitiesM: the number of latent topicsN: the number of words in a documentU: the number of users
30
59
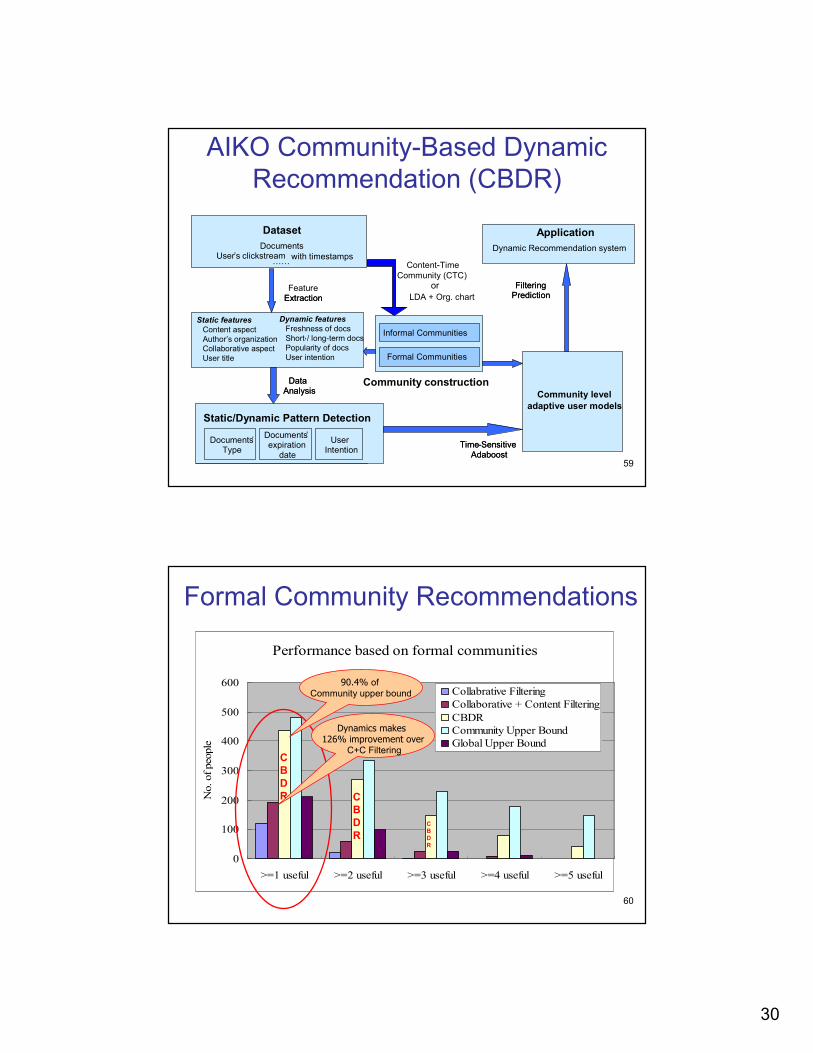
AIKO Community-Based Dynamic Recommendation (CBDR)
Data Analysis Community level
adaptive user models
Dataset
DocumentsUser’s clickstreamwith timestamps
Time-Sensitive Adaboost
Application
FilteringPrediction
Document’s title, abstract
FeatureExtraction
Dynamic Pattern Detection
Documents’Type
Documents’expiration
date
User Intention
Data Analysis Community level
adaptive user models
Dataset
DocumentsUser’s clickstream with timestamps
…… Content-TimeCommunity (CTC)
Time-Sensitive Adaboost
Application
Dynamic Recommendation system
FilteringPrediction
Static features
Content aspectAuthor’s organizationCollaborative aspectUser title
’
Extraction
Static/Dynamic Pattern Detection
Documents’Type
Documents’expiration
date
User Intention
Community construction
Formal Communities
LDA + Org. chart
Informal Communities
Dynamic features
Freshness of docsShort / long-term docsPopularity of docsUser intention
or
60
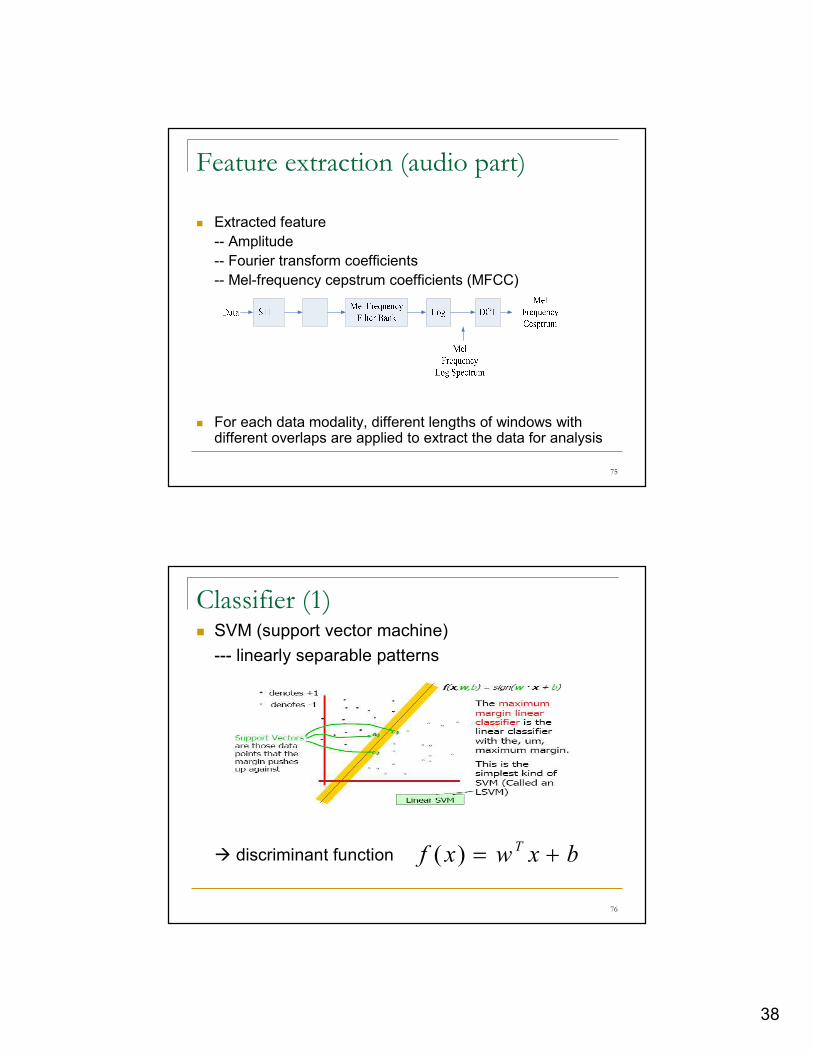
Performance based on formal communities
0
100
200
300
400
500
600
>=1 useful >=2 useful >=3 useful >=4 useful >=5 useful
No. of people
Collabrative Filtering
Collaborative + Content Filtering
CBDR
Community Upper Bound
Global Upper Bound
C
B
D
R C
B
D
R
CB
D
R
Formal Community Recommendations
90.4% of Community upper bound
Dynamics makes 126% improvement over
C+C Filtering

31
61
Performance based on informal communities
0
100
200
300
400
500
600
>=1 useful >=2 useful >=3 useful >=4 useful >=5 useful
No. of people
Collabrative Filtering
Collaborative + Content Filtering
CBDR
Community Upper Bound
Global Upper Bound
C
B
D
R C
B
D
R
CB
D
R
Informal Community Recommendations
13% improvement over Formal Community
95.5% of Community upper bound
62
Summary of Personal Interest Modeling and Personalized Recommendation Work
• People’s dynamic interests and documents’ dynamic factors are analyzed to find out similar people and similar documents – CTC Model
• People’s dynamic interests and documents’ dynamic factors are considered for deciding whether a document is interesting to a person –Time-sensitive Adaboost.
AIKO Community Recommendation(1) Incorporate dynamic interests, document properties and user modeling (made

32
63
IBM T. J. Watson Research Center
12/28/05 | Automatic Modeling of Human Behavior and Social Network | Ching-Yung Lin © 2005 IBM Corporation
Outline
�Motivation
�Social Network Analysis and Modeling
�Expertise Modeling
�Personal / Community Interest Modeling
�Sleep Quality Inference
�Conclusion
64
Sleep Monitoring� Knowing a person’s long-term sleep pattern is important.
� Current sleep quality monitoring is usually conducted at:� Clinics with specific complicated devices such as PSG.
� Home using accelerometers (Actigraph) to record limb movements.
� Major drawbacks:� Because the sleeping environment is different, a subject’s clinical
sleep quality measurements may be affected by other factors thatdecrease the reliability.
� Long term measurement of sleep quality is difficult through clinical measurement.
� Actigraph only provide a single modality measurement. Wearing a specific device may be considered intrusive.
� Subjective reports (e.g., sleep diary or PSQI) may not be reliable.

33
65
Our Goals
� Objective measurements:
� Develop simple (wireless) multimodality sensors at home for long-term sleep logging.
� Early diagnoses based on machine cognition:
� Instead of simply recording the signals, we are interested at developing inference techniques for:
� Sleep pattern detection
� Sleep quality detection
� Sleep disorder detection
� Sleep-related diseases detection
66
Many questionnaire items can be answered by
automatic multimodality sensing� Pittsburgh Sleep Quality Index
(PSQI): a self-rated questionnaire (1 week/ 1 month)
� 19 individual items generate 7 component scores; their sum yields one global score.
� Example items:-- How many hours of actual sleep did you get at night?-- How often have you had trouble sleeping because you…
Have to get up to use the bathroom?
Cough or snore loudly?
Had bad dreams? …
…
First Page of PSQI Questionnaire

34
67
Some Sleep Activity Measure Metrics May
Be Inferred by Multimodality Sensors
� Many of the 7 component scores in PSQI can be automatically filled up via audio-visual monitoring:� Subject Sleep Quality� Sleep Latency� Sleep Duration� Habitual Sleep Efficiency� Sleep Disturbances� Use of Sleep Medication -- may be inferred by observing abnormal
patterns� Daytime Dysfunction – need additional wearable sensors
� Sleep-related diseases--- sleep apnea, restless legs syndrome…; they often show several syndromes during sleep. These syndromes may be observable through audio-visual signals.
68
Our Current Status � What we have done:
� Developed visual, audio, heartbeat and infrared sensors for sleep monitoring
� Inference a person’s sleep pattern by sleep/awake detection
� Preliminary inference of sleep quality
� Logging of sleep situation
� What we may do next:� Early detection and long term
monitoring of sleep related diseases
� Validation of the effectiveness of simple multimodality sensors with rigorous field study
� Daytime wearable sensors to monitor dysfunctions caused by sleep disorder
� Others…

35
69
Outline
� Introduction
� Using simple-multimodality sensors to infer sleep condition (sleep vs. awake) and preliminary sleep quality measurement
� Experiments and results
� Conclusion and future works
70
Using simple-multimodality sensors for
sleep monitoring
� Overall outline
Brightness
Temperature
Humidity
Window curtain
Music volume
Heartbeat
audio
…
input
Inference engine
Video?
�Focus on sleep/awake detection and extend the result to preliminary sleepquality inference first

36
71
Using simple-multimodality sensors for
sleep condition inference
� Data modalities:
-- physiological (heart-rate), motion, sound
� System for asleep-awake detection
72
Data modalities and corresponding
sensors
� Heart-rate
-- sensor: Garmin Forerunner 301
http://www.garmin.com
� Motion
-- sensor: infrared webcam
http://shop.store.yahoo.com/insidecomputer/6inniusb35we.html
� Sound
-- sensor: laptop+ audio-recording software

37
73
Feature extraction (heart-rate part)
� Extracted feature
-- power spectrum
-- wavelet coefficients
74
Feature extraction (motion part)
� Normalized motion amplitude histogram (ME of consecutive I frames)
-- Block size=8x8, SR=5 in both x, y directions
-- define 6 bins as
max( abs(Δx) ,abs(Δy))<1
max( abs(Δx) ,abs(Δy))<2
� Non-motion ratio: 1st bin in the normalized motion amplitude histogram
� Extracted feature-- Fourier transform coefficients of non-motion ratio
0
0.1
0.2
0.3
0.4
1 2 3 4 5 6…
38
75
Feature extraction (audio part)
� Extracted feature
-- Amplitude
-- Fourier transform coefficients
-- Mel-frequency cepstrum coefficients (MFCC)
� For each data modality, different lengths of windows with different overlaps are applied to extract the data for analysis
76
Classifier (1)� SVM (support vector machine)
--- linearly separable patterns
� discriminant function bxwxf T +=)(

39
77
Classifier (2)
� SVM
--- nonlinearly separable patterns
� Kernel vs. nonlinear transform
� Discriminant function
)()(),( xxxxK T
i φφ=
∑=
+=S
i
ii bxxKaxf1
),()(
78
Multimodalities fusion
� Ensemble fusion
� Gaussian normalization:
� Combiner function:
--- maxima
--- average
x
xxxf
σµ )(
)(−
=
,....),max()( 21 xxxf =
∑=
=N
i
ii xwxf1
)(

40
79
Outline
� Introduction
� Using simple-multimodality sensors for sleep condition (sleep vs. awake) inference and preliminary sleep quality measurement
� Experiments and results
� Conclusion and future works
80
Data Collection
� 28 days of HR, motion, sound data along with filled-up PSQI questionnaire
� Example data

41
81
Inference results of sleep-awake detection
(1)
� 6 days for validation set and 20 days left for randomly partitioned training and testing sets
� Exclude audio data here…
� Motion data is a strong and dominant indicator for the sleep/awake detection…
0.61730.97640.91690.9359Accuracy
0.36440.06940.01740.0357Miss rate
0.54840.03120.59050.2283FA rate
Heart-rate only
Motion onlyEnsemble fusion (maxima)
Ensemble fusion (average)
ClassifierAverage performance
82
Inference results of sleep-awake detection
(2)
� Modified experiments that the subject is inactive during the awake time
� Multi-modality fusion actually can improve the classification results under some situations
0.70.92940.93090.8410Accuracy
0.30760.00530.03600.1317Miss rate
00.97220.4750.4143FA rate
Heart-rate onlyMotion onlyEnsemble fusion (maxima)
Ensemble fusion (average)
ClassifierAverage performance

42
83
Comparison of video and Actigraph for
sleep-awake detection
� Example
� Performance with the same method applied
0 20 40 60 80 100 120 140 160 180 200 2200
0.2
0.4
0.6
0.8
1
Non-M
otion R
atio
0 20 40 60 80 100 120 140 160 180 200 2200
200
400
600
minute
Motion C
ounts
0.06220.0331Miss rate
0.92440.9383Accuracy
0.19560.2928FA rate
ActigraphVideo sensor
DeviceAverage performance (5 days)
84
Preliminary results of automatic sleep
quality indexing (1)
� 3 objective component scores in PSQI
--- sleep latency: the time you spend before falling asleep
--- sleep duration: total time you spend on the bed
--- habitual sleep efficiency: asleep time/total bed time
� Using our sleep-awake inference results, only count detected awake time before detected sleep situation

43
85
Preliminary results of automatic sleep
quality indexing (2)
� Example results
� Provide a preliminary, automatic score range for subjective sleep quality measurement
>=4 (5)>=3 (3)Estimated PSQI (vs. subjective PSQI)
90.8% (89.9%)94.4% (93.4%)Habitual sleep efficiency (vs. subjective sleep efficiency)
217 minutes (217 minutes)304 minutes (304 minutes)Sleep duration (vs. self-recorded sleep duration)
20 minutes (22 minutes)17 minutes (20 minutes)Awake time before sleep (vs. subjective sleep latency)
Sep. 10Aug. 24
Example Testing DayInference Items (vs. subjective ground truth)
86
Extended work (1)
� For privacy concern, people may be unwilling to use video
� Using economic PIR (passive infrared sensor) to detect the motion

44
87
Extended Work (2)
� PIR sensor, wireless TX and RX (zigbee
communication)
88
Extended Work (3)
� Visualization of example
data
0 2000 4000 6000 8000 10000 120000
5
10
15
20
seconds
ON-OFF
PIR DATA 2005-11-25
0 2000 4000 6000 8000 10000 120000
200
400
600
seconds
Motion Counts
Actigraph DATA 2005-11-25

45
89
Conclusion and future work (1)
� A novel, economical system (multimodality sensors with machine learning methods) for sleep-awake detection
� About 0.8~0.9 detection accuracy using HR and video sensors
� Explore the possibility of using simple video sensor rather than the costly Actigraph (>=$1000 USD)
� Apply the sleep-awake inference result to an automatic, preliminary indexing for subjective sleep quality assessment
� Replace video sensor with PIR sensor for motion information acquisition (data collection is going on…)
90
Conclusion and future work (2)� Bottleneck
-- hardware limitation (ex. noisy HR data)
-- data collection (different subjects, better procedure…)
-- ground truth for more meaningful evaluation
-- better approach for sleep quality measurement (postsleepinventory?)
-- meaningful & valuable issues (ex. sleep log)?
� Near-Term Future work
-- distributed system (going on now…)
-- use of audio data for snoring detection, disturbance detection, etc.
-- behavior of HRV (heart-rate variation)
-- thorough measuring sleep quality via simple sensors

46
91
Collaborations with UW Sleep Lab
� Joint proposals to NIH or related interested companies.
� Set up a system including non-intrusive sensors in the Sleep Lab:
� Compare signal quality with existing devices.
� Test whether the captured signals can be used by experts for diagnostic purpose.
� Compare the inference accuracy with expert opinions.
� Develop more prototype systems for home-based long term tests on sleep disordered subjects.
� Develop efficient visualization and mining/retrieval tools for long-term sleep logging and pattern analyses.
92
IBM T. J. Watson Research Center
12/28/05 | Automatic Modeling of Human Behavior and Social Network | Ching-Yung Lin © 2005 IBM Corporation
My Social Network – Current Collaborators
Victor SutanJason Cardillo
Columbia Univ.
Dr. Lisa AminiDr. Oliver VerscheureDr. Anshul Sehgal
Dr. Upendra ChaudhariDr. Xiaohui Gu
Navneet Panda (UCSB)
Xiaodan Song
Ya-Ti Peng
Prof. Ming-Ting Sun
Dr. Belle Tseng
Coach
Table Light
Sensors
Univ. of Washington
ego

47
93
IBM T. J. Watson Research Center
12/28/05 | Automatic Modeling of Human Behavior and Social Network | Ching-Yung Lin © 2005 IBM Corporation
References
1. Xiaodan Song, Ching-Yung Lin, Belle L. Tseng and Ming-Ting Sun, “Modeling and Predicting
Personal Information Dissemination Behavior,” ACM SIGKDD Intl. Conf. on Knowledge
Discovery and Data Mining, Chicago, August 2005. (KDD 2005 Student Travel Award)
2. Xiaodan Song, Belle L. Tseng, Ching-Yung Lin and Ming-Ting Sun, “ExpertiseNet: Relational
and Evolutionary Expert Modeling,” Intl. Conf. on User Modeling, Edinburgh, UK, July 2005.
(US National Science Foundation UM05 Student Travel Award)
3. Xiaodan Song, Ching-Yung Lin, Belle L. Tseng and Ming-Ting Sun, “Modeling Evolutionary
and Relational Behaviors for Community-based Dynamic Recommendation,” SIAM Data
Mining Conference, Bethesda, MD, April 2006.
4. Ya-Ti Peng, Ching-Yung Lin, Ming-Ting Sun and Ming-Whei Feng, “Sleep Condition
Inferencing Using Simple Multimodality Sensors,” IEEE Intl. Symposium on Circuits and
Systems, Kos Island, Greece, May 2006.
5. Ya-Ti Peng, Ching-Yung Lin and Ming-Ting Sun, “A Distributed Multimodality Sensor System
for Home-Used Sleep Condition Inference and Monitoring,” IEEE/AMA/BMES
Transdisciplinary Conference on Distributed Diagnose and Home Healthcare, Arlington, VA, April
2006.