Automatic Cattle Identification based on Muzzle … Cattle Identification based on Muzzle Photo...
5
Automatic Cattle Identification based on Muzzle Photo Using Speed-Up Robust Features Approach ARY NOVIYANTO Universitas Indonesia Faculty of Computer Science Kampus UI Depok, West Java INDONESIA [email protected] ANIATI MURNI ARYMURTHY Universitas Indonesia Faculty of Computer Science Kampus UI Depok, West Java INDONESIA [email protected] Abstract: Cattle identification has been a serious problem for breeding association. The need of a robust identi- fication method is a must. The previous identification means have not been satisfactory. The biometric marking has been investigated to be a permanent marking of the individual. Muzzle pattern or nose print has the same characteristic with the human fingerprint which is the most popular biometric marker. SURF approach which is an object recognition based method has been evaluated for the automatic cattle identification purpose. Based on the experiment result SURF approach outperforms the previous research that is used eigenface algorithm. The original SURF approach relatively can handle non-normalized data set (scale and orientation invariant) with high accuracy and precision. With a sufficient training data, the performance of the original SURF can be more than 0.9 in accuracy and kappa statistic. The U-SURF as another version of the original SURF has shown an outstanding performance more than the original SURF and eigenface algorithm, but only in the orientation normalized data. Key–Words: Animal biometric, Cattle identification, Cattle’s Muzzle photo, SURF, U-SURF. 1 Introduction The important of animal identification has been con- sidered since a long time ago. Valuable animals have been identified by marking of the animal’s body to make sure the owner [1]. A robust cattle identification method for now is an important part for the breeding associations [2, 3]. The usages of robust cattle iden- tification are related to traceability [1, 4] and registra- tion for breeding and marketing [3]. The previous cattle identification means includ- ing ear tag, were not really satisfactory [2, 5, 6]. In Indonesia which this work was conducted, the ear tag- ging became the most feasible method for the cattle identification. In big countries such as Great Britain, Australia, USA and Europe, Radio-frequency identifi- cation (RFID) embedded in ear tag are used [1]. This ear tag based method works well in some ways but the limitations also arise. The ear tag will disintegrate the cattle’s ear in long term usage and the ear tag makes defect in the cattle’s ear which makes the cattle cannot be slaughtered for religious ceremonies in some reli- gions. Beside that all of artificial marking basically can be duplicated. Because of the limitation of the artificial marking, marks which naturally stick with the individual is ex- plored as the alternative mean of identification. The muzzle pattern or nose print that is correlated with human fingerprint [7, 8] has been considered as a bio- metric marker for cattle [2]. Related with digital for- mat of the muzzle pattern, it contains of beads and ridges as shown in Fig. 1. The bead is an irregular re- gion looked like an island and the ridge is an elongated region looked like a river with an irregular width. The muzzle pattern can be captured into digital format in two ways. The first is lifted on paper data and the second is the muzzle photo [3]. In this re- search, the muzzle photos will be used as input data for an automatic cattle identification. A previous re- search by Barry et al. (2007) used eigenface algo- rithm for automatic cattle classification based on the muzzle photo. Fig. 1 Beads and Ridges in a muzzle photo. Recent Advances in Information Science ISBN: 978-1-61804-140-1 110
Transcript of Automatic Cattle Identification based on Muzzle … Cattle Identification based on Muzzle Photo...
Automatic Cattle Identification based on Muzzle Photo UsingSpeed-Up Robust Features Approach
ARY NOVIYANTOUniversitas Indonesia
Faculty of Computer ScienceKampus UI Depok, West Java
ANIATI MURNI ARYMURTHYUniversitas Indonesia
Faculty of Computer ScienceKampus UI Depok, West Java
Abstract: Cattle identification has been a serious problem for breeding association. The need of a robust identi-fication method is a must. The previous identification means have not been satisfactory. The biometric markinghas been investigated to be a permanent marking of the individual. Muzzle pattern or nose print has the samecharacteristic with the human fingerprint which is the most popular biometric marker. SURF approach which isan object recognition based method has been evaluated for the automatic cattle identification purpose. Based onthe experiment result SURF approach outperforms the previous research that is used eigenface algorithm. Theoriginal SURF approach relatively can handle non-normalized data set (scale and orientation invariant) with highaccuracy and precision. With a sufficient training data, the performance of the original SURF can be more than 0.9in accuracy and kappa statistic. The U-SURF as another version of the original SURF has shown an outstandingperformance more than the original SURF and eigenface algorithm, but only in the orientation normalized data.
Key–Words: Animal biometric, Cattle identification, Cattle’s Muzzle photo, SURF, U-SURF.
1 IntroductionThe important of animal identification has been con-sidered since a long time ago. Valuable animals havebeen identified by marking of the animal’s body tomake sure the owner [1]. A robust cattle identificationmethod for now is an important part for the breedingassociations [2, 3]. The usages of robust cattle iden-tification are related to traceability [1, 4] and registra-tion for breeding and marketing [3].
The previous cattle identification means includ-ing ear tag, were not really satisfactory [2, 5, 6]. InIndonesia which this work was conducted, the ear tag-ging became the most feasible method for the cattleidentification. In big countries such as Great Britain,Australia, USA and Europe, Radio-frequency identifi-cation (RFID) embedded in ear tag are used [1]. Thisear tag based method works well in some ways but thelimitations also arise. The ear tag will disintegrate thecattle’s ear in long term usage and the ear tag makesdefect in the cattle’s ear which makes the cattle cannotbe slaughtered for religious ceremonies in some reli-gions. Beside that all of artificial marking basicallycan be duplicated.
Because of the limitation of the artificial marking,marks which naturally stick with the individual is ex-plored as the alternative mean of identification. Themuzzle pattern or nose print that is correlated with
human fingerprint [7, 8] has been considered as a bio-metric marker for cattle [2]. Related with digital for-mat of the muzzle pattern, it contains of beads andridges as shown in Fig. 1. The bead is an irregular re-gion looked like an island and the ridge is an elongatedregion looked like a river with an irregular width.
The muzzle pattern can be captured into digitalformat in two ways. The first is lifted on paper dataand the second is the muzzle photo [3]. In this re-search, the muzzle photos will be used as input datafor an automatic cattle identification. A previous re-search by Barry et al. (2007) used eigenface algo-rithm for automatic cattle classification based on themuzzle photo.
Fig. 1 Beads and Ridges in a muzzle photo.
Recent Advances in Information Science
ISBN: 978-1-61804-140-1 110
2 Materials and MethodsThis section explains about the data, previous method,the proposed method for cattle identification based ondigital muzzle photo data, the experimental scenarioand the performance evaluation.
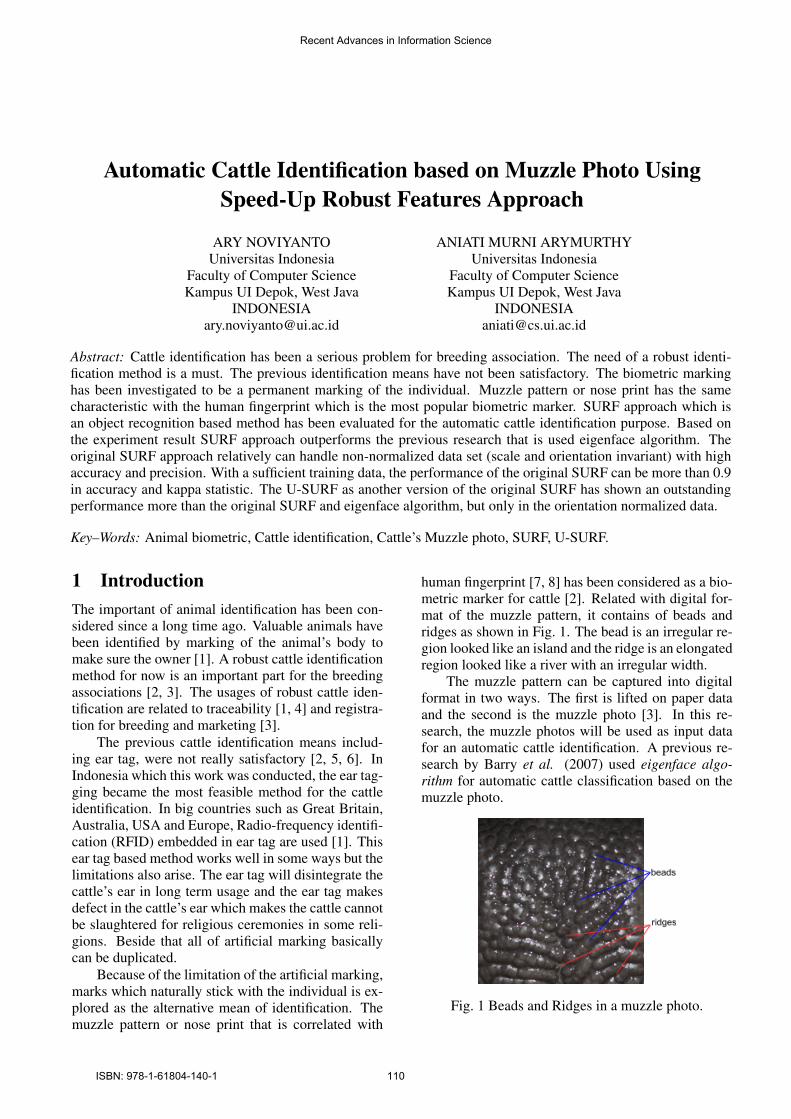
2.1 DataThe muzzle photos have been taken from two kindsof beef cattle race (i.e. Bali cow and Hybrid Ongolecow). The set of the muzzle photo has been standard-ized in orientation and scale manually based on [9].In every muzzle photo, a rectangle region centered onthe minimum line between the nostrils is taken as theregion of interest (ROI). The illustration of the ROI isshown in Fig. 2. Each ROI may be in different sizeso that it is re-sized into 200 × 200 pixels. The imagecontrast has been enhanced using intensity transfor-mation function [10].
Fig. 2 The blue rectangle region is the ROI of the muz-zle photo. The red line is a minimum distance betweenthe nostrils.
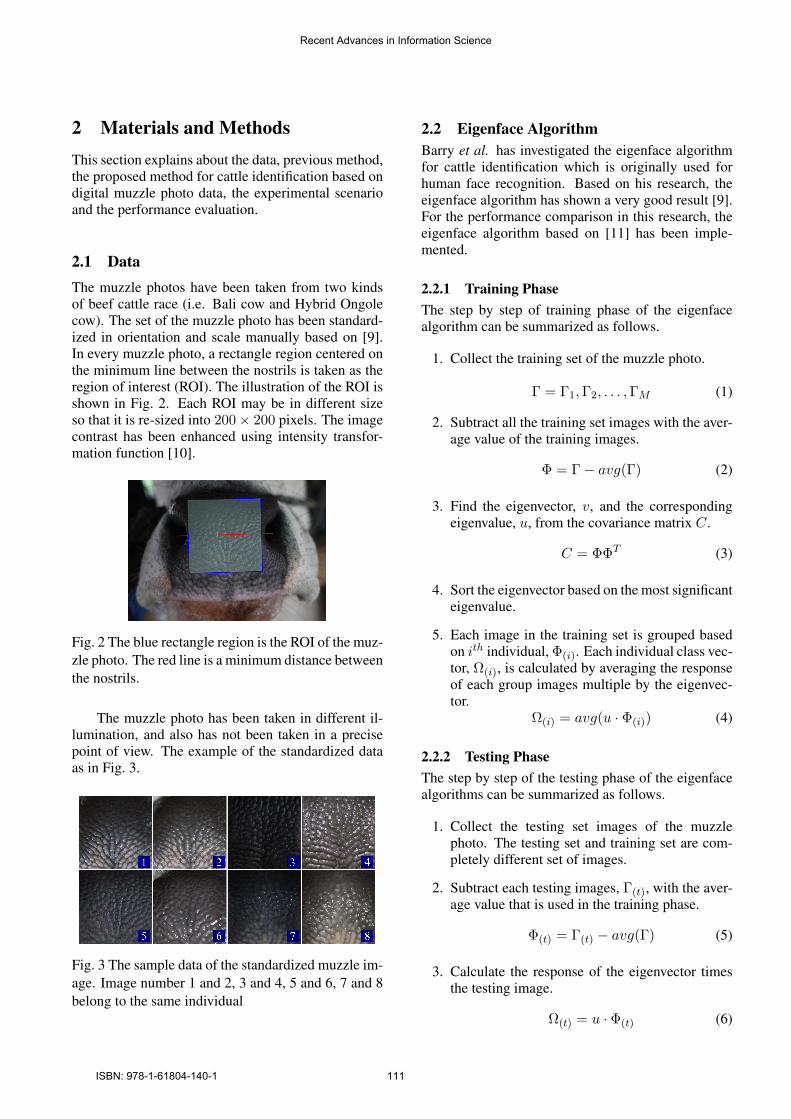
The muzzle photo has been taken in different il-lumination, and also has not been taken in a precisepoint of view. The example of the standardized dataas in Fig. 3.
Fig. 3 The sample data of the standardized muzzle im-age. Image number 1 and 2, 3 and 4, 5 and 6, 7 and 8belong to the same individual
2.2 Eigenface AlgorithmBarry et al. has investigated the eigenface algorithmfor cattle identification which is originally used forhuman face recognition. Based on his research, theeigenface algorithm has shown a very good result [9].For the performance comparison in this research, theeigenface algorithm based on [11] has been imple-mented.
2.2.1 Training PhaseThe step by step of training phase of the eigenfacealgorithm can be summarized as follows.
1. Collect the training set of the muzzle photo.
Γ = Γ1,Γ2, . . . ,ΓM (1)
2. Subtract all the training set images with the aver-age value of the training images.
Φ = Γ − avg(Γ) (2)
3. Find the eigenvector, v, and the correspondingeigenvalue, u, from the covariance matrix C.
C = ΦΦT (3)
4. Sort the eigenvector based on the most significanteigenvalue.
5. Each image in the training set is grouped basedon ith individual, Φ(i). Each individual class vec-tor, Ω(i), is calculated by averaging the responseof each group images multiple by the eigenvec-tor.
Ω(i) = avg(u · Φ(i)) (4)
2.2.2 Testing PhaseThe step by step of the testing phase of the eigenfacealgorithms can be summarized as follows.
1. Collect the testing set images of the muzzlephoto. The testing set and training set are com-pletely different set of images.
2. Subtract each testing images, Γ(t), with the aver-age value that is used in the training phase.
Φ(t) = Γ(t) − avg(Γ) (5)
3. Calculate the response of the eigenvector timesthe testing image.
Ω(t) = u · Φ(t) (6)
Recent Advances in Information Science
ISBN: 978-1-61804-140-1 111
4. Using Euclidean distance, find i so that it has theshortest distance from a class vector. The mostsimilar class vector will be the decision of thetesting images.
argmini
Eucdist(Ω(t), Ω(i)) (7)
2.3 Speed-Up Robust FeaturesSpeed-Up Robust Features (SURF) [12] has beenclaimed as a method for the object recognition whichis better than its competitor, Scale Invariant FeaturesTransform (SIFT) by Lowe [14]. In this research orig-inal SURF and Upright version SURF (U-SURF) areinvestigated. U-SURF is a version of SURF that is notdesigned for rotation invariant [12, 13] but U-SURFhas been reported that can be more distinctive thanthe original SURF. SURF approach is originally usedfor object recognition purposes so that in this researcha similarity measure mechanishm is added in order tohandle the identification problem.
2.3.1 Training PhaseThe step by step training phase of SURF algorithmcan be summarized as follows.
1. Collect the training data set. Extract the inter-est points and the corresponding descriptors us-ing SURF algorithm.
2. Save the interest points and the correspondingdescriptors grouped by individual in a database.
2.3.2 Testing PhaseThe step by step of the testing phase of SURF algo-rithm can be summarized as follows.
1. Collect the testing data set of muzzle photo.
2. Extract the interest points and the descriptors us-ing SURF algorithm for each testing data.
3. Find the best corresponding interest points forevery pair of testing image and training image inthe database. The similarity measure of two in-terest points is the Euclidean distance of two cor-responding interest points descriptor (it can becalled inter-interest point distance).
4. Calculate inter-image distances for every pair ofthe testing image and the training image in thedatabase. The inter-image distance can be cal-culated by a summation all of inter-interest pointdistance of two images.
5. Calculate class distances for every pair of test-ing image and classes. In this case, classes arethe individuals. The class distance can be calcu-lated by a summation all of inter-image distanceswhich belong to the same class and then it is di-vided by the number of training images in thecorresponding class. In the other word, the classdistance is average of a summation all of inter-image distance in a particular class.
6. Define the identification result by finding theminimum class distance.
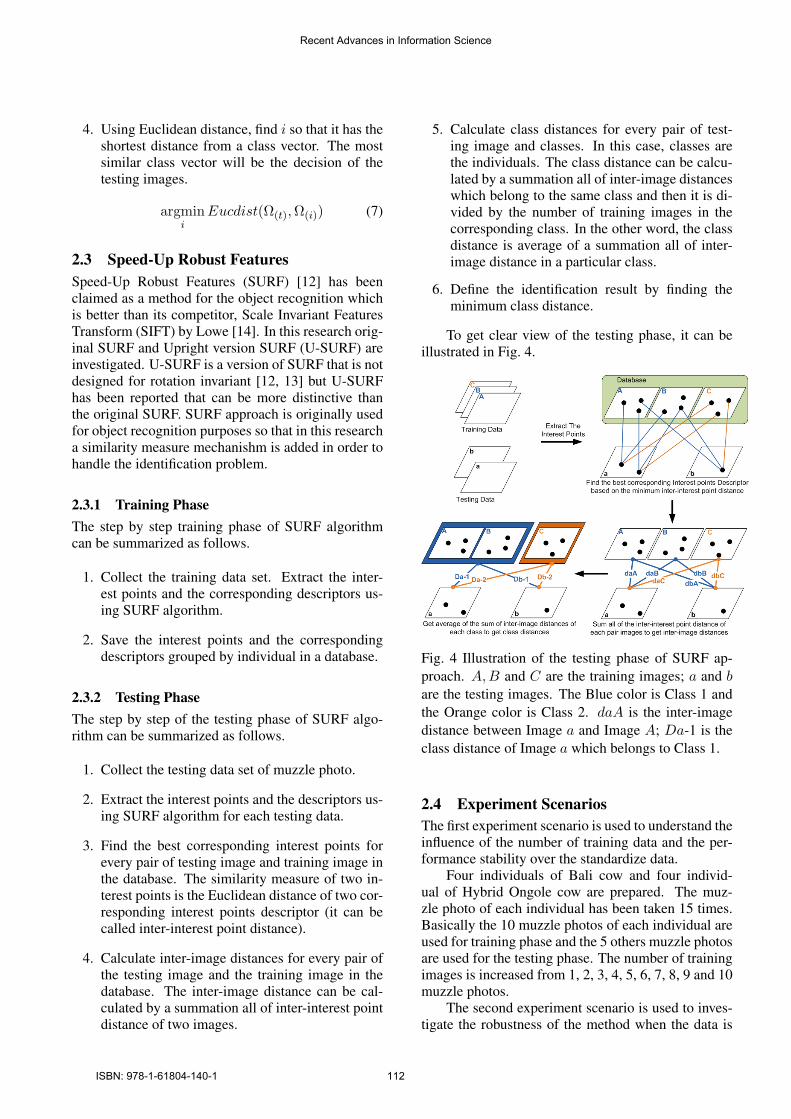
To get clear view of the testing phase, it can beillustrated in Fig. 4.
Fig. 4 Illustration of the testing phase of SURF ap-proach. A,B and C are the training images; a and bare the testing images. The Blue color is Class 1 andthe Orange color is Class 2. daA is the inter-imagedistance between Image a and Image A; Da-1 is theclass distance of Image a which belongs to Class 1.
2.4 Experiment ScenariosThe first experiment scenario is used to understand theinfluence of the number of training data and the per-formance stability over the standardize data.
Four individuals of Bali cow and four individ-ual of Hybrid Ongole cow are prepared. The muz-zle photo of each individual has been taken 15 times.Basically the 10 muzzle photos of each individual areused for training phase and the 5 others muzzle photosare used for the testing phase. The number of trainingimages is increased from 1, 2, 3, 4, 5, 6, 7, 8, 9 and 10muzzle photos.
The second experiment scenario is used to inves-tigate the robustness of the method when the data is
Recent Advances in Information Science
ISBN: 978-1-61804-140-1 112
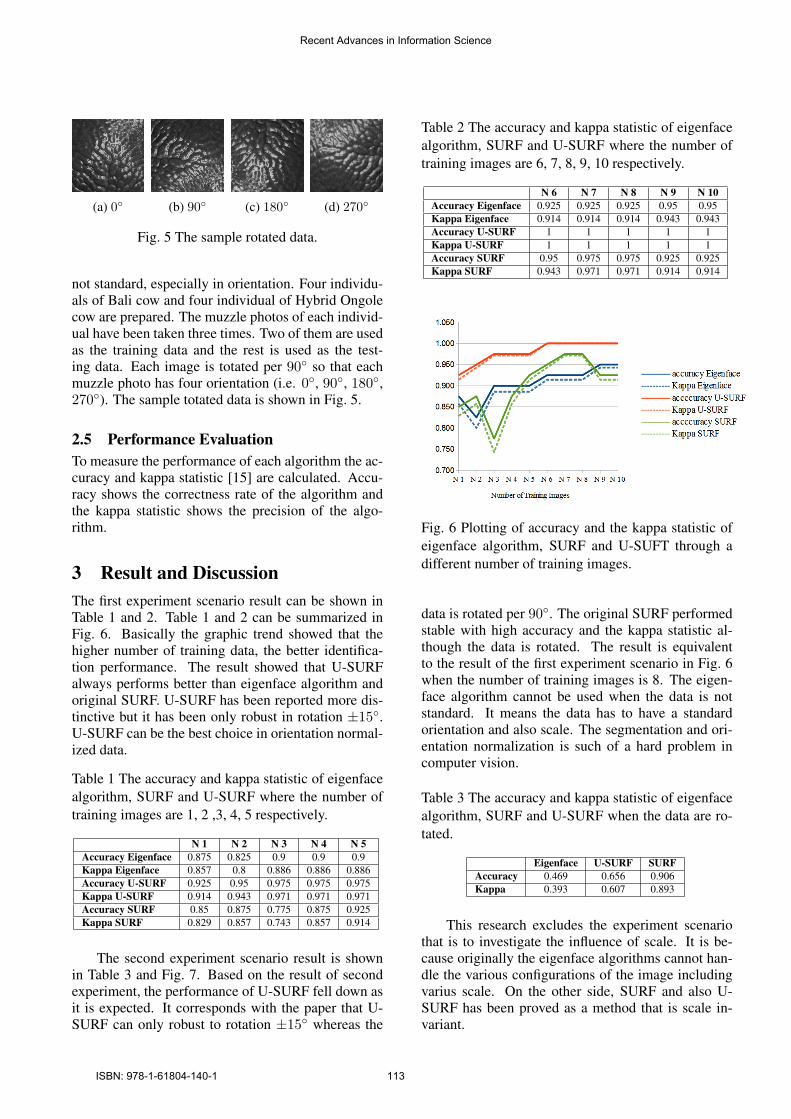
(a) 0 (b) 90 (c) 180 (d) 270
Fig. 5 The sample rotated data.
not standard, especially in orientation. Four individu-als of Bali cow and four individual of Hybrid Ongolecow are prepared. The muzzle photos of each individ-ual have been taken three times. Two of them are usedas the training data and the rest is used as the test-ing data. Each image is totated per 90 so that eachmuzzle photo has four orientation (i.e. 0, 90, 180,270). The sample totated data is shown in Fig. 5.
2.5 Performance EvaluationTo measure the performance of each algorithm the ac-curacy and kappa statistic [15] are calculated. Accu-racy shows the correctness rate of the algorithm andthe kappa statistic shows the precision of the algo-rithm.
3 Result and DiscussionThe first experiment scenario result can be shown inTable 1 and 2. Table 1 and 2 can be summarized inFig. 6. Basically the graphic trend showed that thehigher number of training data, the better identifica-tion performance. The result showed that U-SURFalways performs better than eigenface algorithm andoriginal SURF. U-SURF has been reported more dis-tinctive but it has been only robust in rotation ±15.U-SURF can be the best choice in orientation normal-ized data.
Table 1 The accuracy and kappa statistic of eigenfacealgorithm, SURF and U-SURF where the number oftraining images are 1, 2 ,3, 4, 5 respectively.
N 1 N 2 N 3 N 4 N 5Accuracy Eigenface 0.875 0.825 0.9 0.9 0.9Kappa Eigenface 0.857 0.8 0.886 0.886 0.886Accuracy U-SURF 0.925 0.95 0.975 0.975 0.975Kappa U-SURF 0.914 0.943 0.971 0.971 0.971Accuracy SURF 0.85 0.875 0.775 0.875 0.925Kappa SURF 0.829 0.857 0.743 0.857 0.914
The second experiment scenario result is shownin Table 3 and Fig. 7. Based on the result of secondexperiment, the performance of U-SURF fell down asit is expected. It corresponds with the paper that U-SURF can only robust to rotation ±15 whereas the
Table 2 The accuracy and kappa statistic of eigenfacealgorithm, SURF and U-SURF where the number oftraining images are 6, 7, 8, 9, 10 respectively.
N 6 N 7 N 8 N 9 N 10Accuracy Eigenface 0.925 0.925 0.925 0.95 0.95Kappa Eigenface 0.914 0.914 0.914 0.943 0.943Accuracy U-SURF 1 1 1 1 1Kappa U-SURF 1 1 1 1 1Accuracy SURF 0.95 0.975 0.975 0.925 0.925Kappa SURF 0.943 0.971 0.971 0.914 0.914
Fig. 6 Plotting of accuracy and the kappa statistic ofeigenface algorithm, SURF and U-SUFT through adifferent number of training images.
data is rotated per 90. The original SURF performedstable with high accuracy and the kappa statistic al-though the data is rotated. The result is equivalentto the result of the first experiment scenario in Fig. 6when the number of training images is 8. The eigen-face algorithm cannot be used when the data is notstandard. It means the data has to have a standardorientation and also scale. The segmentation and ori-entation normalization is such of a hard problem incomputer vision.
Table 3 The accuracy and kappa statistic of eigenfacealgorithm, SURF and U-SURF when the data are ro-tated.
Eigenface U-SURF SURFAccuracy 0.469 0.656 0.906Kappa 0.393 0.607 0.893
This research excludes the experiment scenariothat is to investigate the influence of scale. It is be-cause originally the eigenface algorithms cannot han-dle the various configurations of the image includingvarius scale. On the other side, SURF and also U-SURF has been proved as a method that is scale in-variant.
Recent Advances in Information Science
ISBN: 978-1-61804-140-1 113
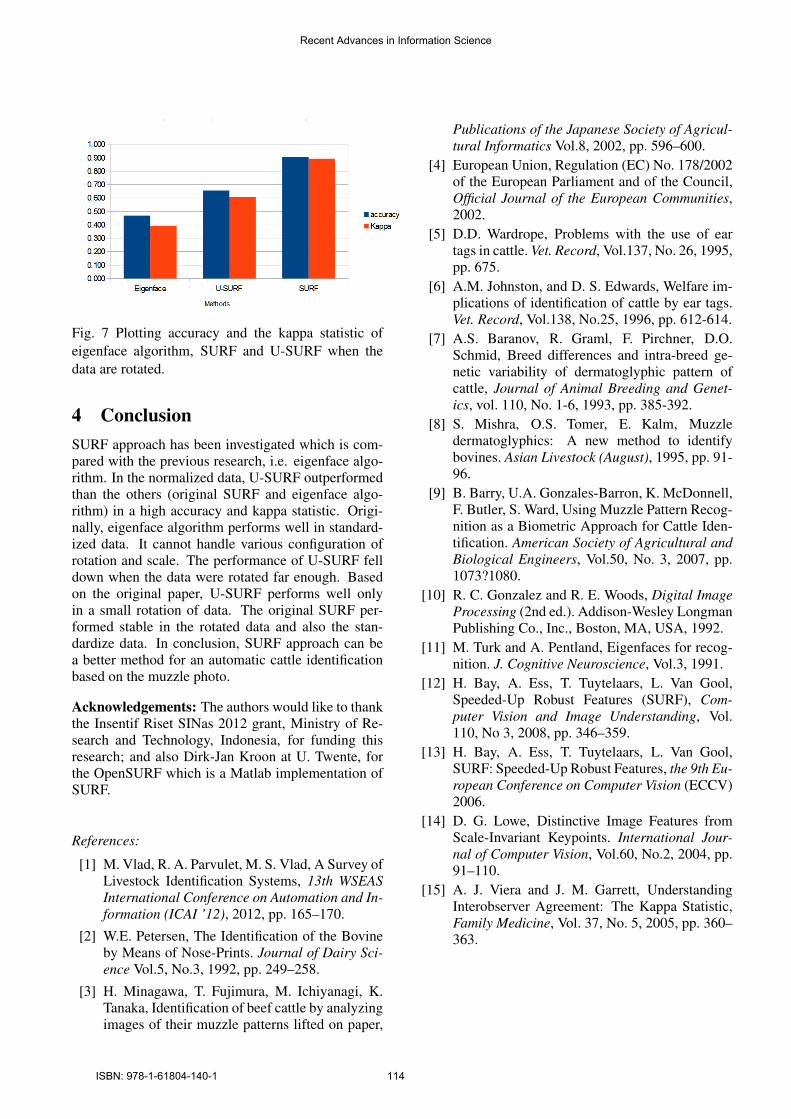
Fig. 7 Plotting accuracy and the kappa statistic ofeigenface algorithm, SURF and U-SURF when thedata are rotated.
4 ConclusionSURF approach has been investigated which is com-pared with the previous research, i.e. eigenface algo-rithm. In the normalized data, U-SURF outperformedthan the others (original SURF and eigenface algo-rithm) in a high accuracy and kappa statistic. Origi-nally, eigenface algorithm performs well in standard-ized data. It cannot handle various configuration ofrotation and scale. The performance of U-SURF felldown when the data were rotated far enough. Basedon the original paper, U-SURF performs well onlyin a small rotation of data. The original SURF per-formed stable in the rotated data and also the stan-dardize data. In conclusion, SURF approach can bea better method for an automatic cattle identificationbased on the muzzle photo.
Acknowledgements: The authors would like to thankthe Insentif Riset SINas 2012 grant, Ministry of Re-search and Technology, Indonesia, for funding thisresearch; and also Dirk-Jan Kroon at U. Twente, forthe OpenSURF which is a Matlab implementation ofSURF.
References:
[1] M. Vlad, R. A. Parvulet, M. S. Vlad, A Survey ofLivestock Identification Systems, 13th WSEASInternational Conference on Automation and In-formation (ICAI ’12), 2012, pp. 165–170.
[2] W.E. Petersen, The Identification of the Bovineby Means of Nose-Prints. Journal of Dairy Sci-ence Vol.5, No.3, 1992, pp. 249–258.
[3] H. Minagawa, T. Fujimura, M. Ichiyanagi, K.Tanaka, Identification of beef cattle by analyzingimages of their muzzle patterns lifted on paper,
Publications of the Japanese Society of Agricul-tural Informatics Vol.8, 2002, pp. 596–600.
[4] European Union, Regulation (EC) No. 178/2002of the European Parliament and of the Council,Official Journal of the European Communities,2002.
[5] D.D. Wardrope, Problems with the use of eartags in cattle. Vet. Record, Vol.137, No. 26, 1995,pp. 675.
[6] A.M. Johnston, and D. S. Edwards, Welfare im-plications of identification of cattle by ear tags.Vet. Record, Vol.138, No.25, 1996, pp. 612-614.
[7] A.S. Baranov, R. Graml, F. Pirchner, D.O.Schmid, Breed differences and intra-breed ge-netic variability of dermatoglyphic pattern ofcattle, Journal of Animal Breeding and Genet-ics, vol. 110, No. 1-6, 1993, pp. 385-392.
[8] S. Mishra, O.S. Tomer, E. Kalm, Muzzledermatoglyphics: A new method to identifybovines. Asian Livestock (August), 1995, pp. 91-96.
[9] B. Barry, U.A. Gonzales-Barron, K. McDonnell,F. Butler, S. Ward, Using Muzzle Pattern Recog-nition as a Biometric Approach for Cattle Iden-tification. American Society of Agricultural andBiological Engineers, Vol.50, No. 3, 2007, pp.1073?1080.
[10] R. C. Gonzalez and R. E. Woods, Digital ImageProcessing (2nd ed.). Addison-Wesley LongmanPublishing Co., Inc., Boston, MA, USA, 1992.
[11] M. Turk and A. Pentland, Eigenfaces for recog-nition. J. Cognitive Neuroscience, Vol.3, 1991.
[12] H. Bay, A. Ess, T. Tuytelaars, L. Van Gool,Speeded-Up Robust Features (SURF), Com-puter Vision and Image Understanding, Vol.110, No 3, 2008, pp. 346–359.
[13] H. Bay, A. Ess, T. Tuytelaars, L. Van Gool,SURF: Speeded-Up Robust Features, the 9th Eu-ropean Conference on Computer Vision (ECCV)2006.
[14] D. G. Lowe, Distinctive Image Features fromScale-Invariant Keypoints. International Jour-nal of Computer Vision, Vol.60, No.2, 2004, pp.91–110.
[15] A. J. Viera and J. M. Garrett, UnderstandingInterobserver Agreement: The Kappa Statistic,Family Medicine, Vol. 37, No. 5, 2005, pp. 360–363.
Recent Advances in Information Science
ISBN: 978-1-61804-140-1 114