
Automated Fingerprint Identification and Imaging Systems · Automated Fingerprint Identification...
65
Automated Fingerprint Identification and Imaging Systems Anil Jain Sharath Pankanti Dept. of Comp. Science & Eng. TJW Research Center Michigan State University IBM Research East Lansing, MI Hawthorne, NY [email protected] [email protected] 1 Introduction More than a century has passed since Alphonse Bertillon first conceived and then industriously practiced the idea of using body measurements for solving crimes [1]. Just as his idea was gaining popularity, it faded into relative obscurity by a far more significant and practical discovery of the uniqueness of the human fingerprints 1 . Soon after this discovery, many major law enforcement departments embraced the idea of first “booking” the fingerprints of criminals, so that their records are readily available and later using leftover fingerprint smudges (latents), the identity of criminals can be determined. These agencies sponsored a rigorous study of fingerprints, developed scientific 1 In 1893, the Home Ministry Office, UK, accepted that no two individuals have the same fingerprints. 1
-
Upload
phungkhuong -
Category
Documents
-
view
235 -
download
0
Transcript of Automated Fingerprint Identification and Imaging Systems · Automated Fingerprint Identification...
Automated Fingerprint Identification and Imaging
Systems
Anil Jain Sharath Pankanti
Dept. of Comp. Science & Eng. TJW Research Center
Michigan State University IBM Research
East Lansing, MI Hawthorne, NY
[email protected] [email protected]
1 Introduction
More than a century has passed since Alphonse Bertillon first conceived and then industriously
practiced the idea of using body measurements for solving crimes [1]. Just as his idea was gaining
popularity, it faded into relative obscurity by a far more significant and practical discovery of the
uniqueness of the human fingerprints1. Soon after this discovery, many major law enforcement
departments embraced the idea of first “booking” the fingerprints of criminals, so that their records
are readily available and later using leftover fingerprint smudges (latents), the identity of criminals
can be determined. These agencies sponsored a rigorous study of fingerprints, developed scientific
1In 1893, the Home Ministry Office, UK, accepted that no two individuals have the same fingerprints.
1

methods for visual matching of fingerprints and strong programs/cultures for training fingerprint
experts, and applied the art of fingerprint identification for nailing down the perpetrators.
Despite the ingenious methods improvised to increase the efficiency of the manual method of
fingerprint indexing and search, the ever growing demands on manual fingerprint identification
quickly became overwhelming. The manual method of fingerprint indexing resulted in a highly
skewed distribution of fingerprints into bins (types): most fingerprints fell into a few bins and this
resulted in search inefficiencies. Fingerprint training procedures were time-intensive and slow.
Further, demands imposed by painstaking attention needed to visually match the fingerprints of
varied qualities, tedium of monotonic nature of the work, and increasing workloads due to a higher
demand on fingerprint identification services, all prompted the law enforcement agencies to initiate
research into acquiring fingerprints through electronic medium and automatic fingerprint identifi-
cation based on the digital representation of the fingerprints. These efforts have led to development
of automatic/semi-automatic fingerprint identification systems over the past few decades. We at-
tempt to present current state-of-the-art in fingerprint sensing and identification technology.
The objective of this chapter is to present a high level overview of fingerprint sensing and
matching technology so as to provide the reader with some insights into the strengths and limita-
tions of the automation in matching fingerprints. Because of space limitation, we have focussed
only on the core technology rather than the details of the commercial systems. We will not describe
the existing elaborate manual protocols (e.g., What is a core? How are fingerprints indexed/filed
in a manual system?) for similar reasons. Readers are referred to [2] for an excellent exposition on
these subject matters.
The rest of this chapter is organized as follows. Section 2 introduces emerging applications of
automatic fingerprint matching and its implications. In Section 3, we describe functional compo-
2

nents of a typical fingerprint identification system. We summarize some of the challenges involved
in automatic fingerprint-based identification in Section 4. Section 5 deals with topics related to
fingerprint sensing technology. Section 6 presents issues related to representing the useful infor-
mation contained in a fingerprint image. The next section (Section 7) presents automatic extraction
of the most commonly used fingerprint representation, i.e., minutiae. Sections 8 and 9 describe an
overview of fingerprint classification and matching algorithms. In Section 10, we summarize a
fingerprint image enhancement algorithm. Some of the issues peculiar to large scale identification
systems are dealt in Section 11. Fingerprint identification system performance evaluation issues
are presented in Section 12. Finally, conclusions are presented in Section 13.
2 Emerging Applications
As mentioned earlier, law enforcement agencies were the earliest adopters of the fingerprint iden-
tification technology. More recently, increasing identity fraud has created a growing need for
biometric technology2 for positive person identification in a number of non-forensic applications.
Is this person authorized to enter this facility? Is this individual entitled to access the privileged
information? Is the given service being administered exclusively to the enrolled users? Answers
to questions such as these are valuable to business and government organizations. Since biomet-
ric identifiers cannot be easily misplaced, forged, or shared, they are considered more reliable for
personal identification than traditional token or knowledge based methods. Table 1 summarizes
typical applications of biometrics for positive person identification. The objectives of these appli-
cations are user convenience (e.g., money withdrawal without ATM card and PIN), better security
2Biometrics refers to use of distinctive physiological (e.g., fingerprints, face, retina, iris) and behavioral (e.g., gait,signature) characteristics for automatically identifying individuals [3].
3

Equal Error Rate
ApplicationsCivilian
Applications
High Security Access
Forensic Applications
Fals
e R
ejec
t Rat
e (F
RR
)
False Accept Rate (FAR)
Figure 1: Receiver operating characteristics (ROC) curve of a system illustrates false reject rate(FRR) and false acceptance rate (FAR) of a matcher at all operating points (threshold, T). Eachpoint on an ROC defines FRR and FAR for a given matcher operating at a particular threshold.High security access applications are concerned about break-ins and hence operate the matcherat a point on ROC with a small FAR. Forensic applications desire to catch a criminal even at theexpense of examining a large number of false accepts and hence operate their matcher at a highFAR. Civilian applications attempt to operate their matchers at the operating points with both, lowFRR and low FAR [3].
(e.g., difficult to forge access), and more efficiency (e.g., lower overhead for computer password
maintenance).
A significant limitation of the existing biometrics based personal identification systems is that
their accuracy performance is not perfect. These systems sometimes falsely accept an impostor
(false accept error) and falsely reject a genuine user (false reject error). Typically, the two error
rates depend on the system operating point (called decision threshold) and their relationship is
characterized by a Receiver Operating Curve (ROC). Fig. 1 illustrates a hypothetical ROC and
typical operating points for different biometric applications.
Tremendous success of the fingerprint based identification technology in law enforcement ap-
plications, decreasing cost of the fingerprint sensing devices, increasing availability of inexpensive
4

computing power, and growing identity fraud/theft have all ushered in an era of fingerprint-based
person identification applications in commercial, civilian, and financial domains.
A typical law enforcement identification system serves a different purpose than those of the
emerging biometric applications. Most of the financial and commercial applications require iden-
tity verification (also known as authentication) which involves confirming/denying a claimed iden-
tity based on fingerprint information, given a claim to a specific identity (e.g., Joe Smith). That
is, given a fingerprint known to have originated from, say, Joe Smith’s left index finger and an-
other print from a left index finger, the system will determine whether the second print, indeed,
belongs to Joe Smith. The law enforcement systems, on the other hand, mostly deal with recogni-
tion (also popularly referred to as identification, as in automatic fingerprint identification system)
which involves establishing the identity of the person based on the fingerprint information. Given
a fingerprint(s), possibly without any knowledge of the finger position (i.e., left index), the system,
by searching through the database of available fingerprints associated with the known identities,
will determine whether the print is associated with an identity3. The task of identity verification is
much easier than that of identity recognition: the former involving just one comparison while the
latter involving multiple comparisons with fingerprints in the database. Even though some civilian
applications involve identity recognition, the underlying design considerations are different (see
Fig. 2). Despite these differences in the functionalities among different fingerprint identification
application domains, all the underlying systems rely on the distinctive individual information in
fingerprints; the fingerprint expertise which has primarily resided within law enforcement agencies
3The term identification is used in this chapter either to refer to the general problem of identifying individuals(identification/recognition and authentication/verification) or to refer to the specific problem of identifying (recogniz-ing) an individual from a database which involves one to many search. We rely on the context to disambiguate thereference.
5

for more than a century. Further, we believe, eventually, the law enforcement agencies will also
be closely involved in studying the civilian/commercial/financial fingerprint (and more generally
biometric) applications as well.
For any biometric measurement to be incorporated into a positive person identification sys-
tem, it is necessary that such measurements are acceptable to a society. Despite the criminal
stigma associated with fingerprints, a recent CNN poll found that fingerprints rate high in social
acceptabilty [4]. While acceptability is a complex (and mutable) phenomenon depending on con-
founding factors including individual/institutional trust, religious and personal beliefs/values, and
culture, two system issues influence acceptability: system security [5] and individual privacy [6, 7].
The security issues ensure that the intruders will neither be able to access the individual informa-
tion/measurements (e.g., obtain fingerprint information) nor be able to pose as other individuals by
electronically interjecting stale and fradulently obtained biometrics measurements (e.g., surrepti-
tiously lifted fingerprints from surfaces touched by the individuals) into the system. It is desirable
that a personal identification system uses the biometric measurements exclusively for the purposes
for which they were acquired. For instance, it may be possible to glean information about the med-
ical conditions of individuals from their biometric measurements. Secondly, people are concerned
about linkages: unauthorized usage of biometric measurements across different identification sys-
tems (e.g., criminal and civilian fingerprint identification systems) to link the identities of person
to gather/track individual information that may otherwise be unavailable. It is necessary to enforce
systemwide mechanisms to ensure the usage of the biometric measurement for its proscribed in-
tent. As the novel applications of fingerprints (and other biometric identifiers) will become more
widespread, we believe, law enforcement agencies will be increasingly involved in resolving the
frauds involving repudiation (e.g., users denying having accessed the system), coercion (e.g., users
6

Forensic Civilian CommercialCorpse identification National ID ATMCriminal Investigation Driver’s license Access controlParenthood determination Welfare disbursement Cellular phone
Border crossing Credit card
Table 1: Biometric Applications [8].
claiming to have been forced into the system), contamination (e.g., erroneous acquisition of bio-
metrics identifier not associated with the intended user) and circumvention (e.g., unauthorized user
illegitimately gaining access to the system). Consequently, agencies may not only be required to
pass judgments about the identities related to biometric identifiers but also about the integrity of
the systems and the validity of the biometric measurements.
3 System Architecture
A fingerprint identification system is an automatic pattern recognition system which consists of
three fundamental stages: (i) data acquisition: the fingerprint to be recognized is sensed; (ii) fea-
ture extraction: a machine representation (pattern) is extracted from the sensed image; and (iii)
decision-making: the representations derived from the sensed image are compared with a repre-
sentation stored in the system. The comparison typically yields a matching score quantifying the
similarity between the two representations. If the score is higher than a threshold (determined by
the system operating point (see Fig. 1)), the representations are determined to have originated from
the same finger(s). In an identification system, multiple comparisons may be needed. Often, the
stored representations in the database are partitioned into bins either based on information extrinsic
to the sensed input measurements (e.g., sex and age of the individual) or information intrinsic to
7

FingerprintAcquisition
FingerprintEnhancementEstimation
Quality
IndexingFingerprint
FeatureExtraction
FingerprintMatching
Editing
MatchVerification
Feature
Figure 2: Functional block diagram of an “automatic” fingerprint identification system. The dottedlines illustrate alternative path. Some of the functional blocks, e.g., indexing, may be performedeither by an expert or a computer. The feature editing and match verification tasks are performedby an expert. Typically, a fingerprint matcher passes a ranked list of 10-100 fingerprints for matchverification stage; a fingerprint expert browses the original fingerprint images to confirm/reject acandidate match.
the sensed image (e.g., fingerprint class or type (see Section 8)). As a result, the input fingerprint
need not be searched in the entire database but only in the particular bin of interest.
Different systems may use different numbers of available fingerprints (multiple impressions
of a single finger or single impressions of multiple fingers) for person identification. The feature
extraction stage may involve manual over-ride and editing by experts. Image enhancement may be
used for poor quality images (see Section 10).
8

4 Challenges
While significant progress has been made in automatic fingerprint identification, there are still a
number of research issues that need to be addressed to improve system accuracy. Most of the
shortcomings in the accuracy of an automatic fingerprint identification system can be attributed to
the acquisition process (see Section 5) [9]:
(i) Inconsistent contact: The act of sensing distorts the fingerprint. Determined by the pressure
and contact of the finger on the glass platen, the three-dimensional shape of the finger gets mapped
onto the two-dimensional surface of the glass platen. As the finger is not a rigid object and since
the process of projecting the finger surface onto the image acquisition surface is not precisely con-
trolled, different impressions of a finger are related to each other by various transformations. The
most problematic of these projections appears to be elastic distortions of the friction skin of finger
which displaces different portions of the finger (ever so slightly) by different magnitudes and in
different directions (see Figure 14).
(ii) Non-uniform contact: The ridge structure of a finger would be completely captured if
ridges belonging to the part of the finger being imaged are in complete physical/optical contact
with the image acquisition surface and the valleys do not make any contact with the image ac-
quisition surface (see Fig. 6). However, the dryness of the skin, shallow/worn-out ridges (due to
aging/genetics), skin disease, sweat, dirt, humidity in the air all confound the situation resulting in
a non-ideal contact situation. In the case of inked fingerprints, an additional factor may include in-
appropriate inking of the finger: This results in “noisy” low contrast images, which leads to either
spurious or missing minutiae.
9

(iii) Irreproducible contact: Manual work, accidents, etc. inflict injuries to the finger, thereby,
changing the ridge structure of the finger either permanently or semi-permanently. Further, each
impression of a finger may possibly depict a different portion of its surface. This may introduce
additional spurious fingerprint features.
(iv) Feature extraction artifacts: The feature extraction algorithm (see, for instance, Section 7)
is imperfect and introduces measurement errors. Various image processing operations might intro-
duce inconsistent biases to perturb the location and orientation estimates of the reported fingerprint
structures from their grayscale counterparts.
(v) The act of sensing itself adds noise to the image. For example, in the livescan fingerprint
acquisition method, residues from the previous fingerprint capture may be left behind. A typi-
cal imaging system geometrically distorts the image of the object being sensed due to imperfect
imaging conditions. In the Frustrated Total Internal Reflection sensing scheme (see Section 5), for
example, there is a geometric distortion because the image plane is not parallel to the glass platen.
Apart from the fingerprint acquisition and feature extraction issues, there are three major ad-
ditional challenges [10]. Although a number of automatic fingerprint classification methods (Sec-
tion 8) have been proposed and some of them are used in operational systems, fingerprint classifi-
cation still remains one of the most difficult problems for both humans and machines. Currently,
the fingerprint classification framework is mainly intended for human experts; this may not be
optimal for an automatic system.
In designing any automatic pattern recognition system, an important issue is the performance
10

assessment of the system: how to evaluate the performance of a given system or how to verify that
a deployed system satisfies certain performance specifications? Unfortunately, the performance
evaluation problem is far from well established.
In the absence of a good fingerprint compression scheme, storing hundreds of millions of fin-
gerprints is too expensive. The wavelet-based method, Wavelet/Scalar Quantization (WSQ), which
has been proposed as the standard for fingerprint compression can compress a fingerprint image
by a factor of 10 to 25 [11, 12] (see Fig 3). An algorithm that can reach even higher compression
ratio is an important research topic.
(a) (b) (c)
Figure 3: Fingerprint Compression: (a) an uncompressed fingerprint image; (b) portion of image in(a) compressed using a generic image compression algorithm, JPEG [13]; and (c) portion of imagein (a) compressed using Wavelet/Scalar Quantization (WSQ), a compression algorithm specificallydeveloped for compressing images. Both, JPEG and WSQ use compression ratio of 12.9; JPEGtypically introduces blocky artifacts and obliterates detailed information. See [14] for a moredetailed imagery.
5 Fingerprint Sensing
Depending on whether the acquisition process is offline or online, a fingerprint may be either (i) an
inked fingerprint, (ii) a latent fingerprint or (iii) a live-scan fingerprint.
Inked fingerprint is used to indicate that the fingerprint image is obtained from an impression
11

(a) (b) (c)
(d) (e)
Figure 4: Comparison of different fingerprint impressions: (a) an inked rolled fingerprint (fromNIST 4 database); (b) an inked dab fingerprint (from NIST 4 database); (c) live-scan (dab) fin-gerprint (captured with a scanner manufactured by Digital Biometrics); (d) a latent fingerprint; (e)fingerprint captured using a solid state sensor [15]. c
�Academic Press.
12

of the finger on an intermediate medium such as paper. An example of a rolled inked fingerprint
is shown in Figure 4 (a). Typically, the first step in capturing a rolled impression of a fingerprint
is to place a few dabs of ink on a slab and rolling it out smoothly with a roller until the slab is
covered with a thin, even layer of ink. The finger is then rolled from one side of the nail to the
other side over the inked slab which inks the ridge patterns on top of the finger completely. After
that, the finger is rolled on a piece of white paper so that the inked impression of the ridge pattern
of the finger appears on the white paper. Rolled inked fingerprints impressed on paper can be
electronically scanned into digital rolled fingerprints using optical scanners or video cameras. The
rolled acquisition method has remained a standard technique for fingerprint acquisition for more
than a hundred years [2, 16]. Rolled inked fingerprints tend to have a large area of valid ridges and
furrows, but have large deformations due to the inherent nature of the rolled acquisition process.
Acquisition of rolled fingerprints is cumbersome, slow, and requires practice and skill. In the con-
text of an automatic personal identification system, it is both infeasible and socially unacceptable
to use the rolled inked method to acquire fingerprints in the operational phase although it may be
feasible to use the rolled inked method in the enrollment phase4. Another method of acquiring
an inked impression is called a dab (see Figure 4 (b)). In this method, the inked finger is simply
impressed on the paper without rolling it from nail to nail. Obviously, the fingerprint dab images
cover a smaller fingerprint pattern area, but there is a smaller distortion in the print.
In forensics, a special kind of inked fingerprints, called latent fingerprints, is of great interest.
Constant perspiration exudation of sweat pores on fingerprint ridges and intermittent contact of
fingers with other parts of human body and various objects leave a film of moisture and/or grease on
the surface of fingers. In touching an object (e.g., a glass), the film of moisture and/or grease may
4For example, Master Card relies on inked impressions for enrollment.
13
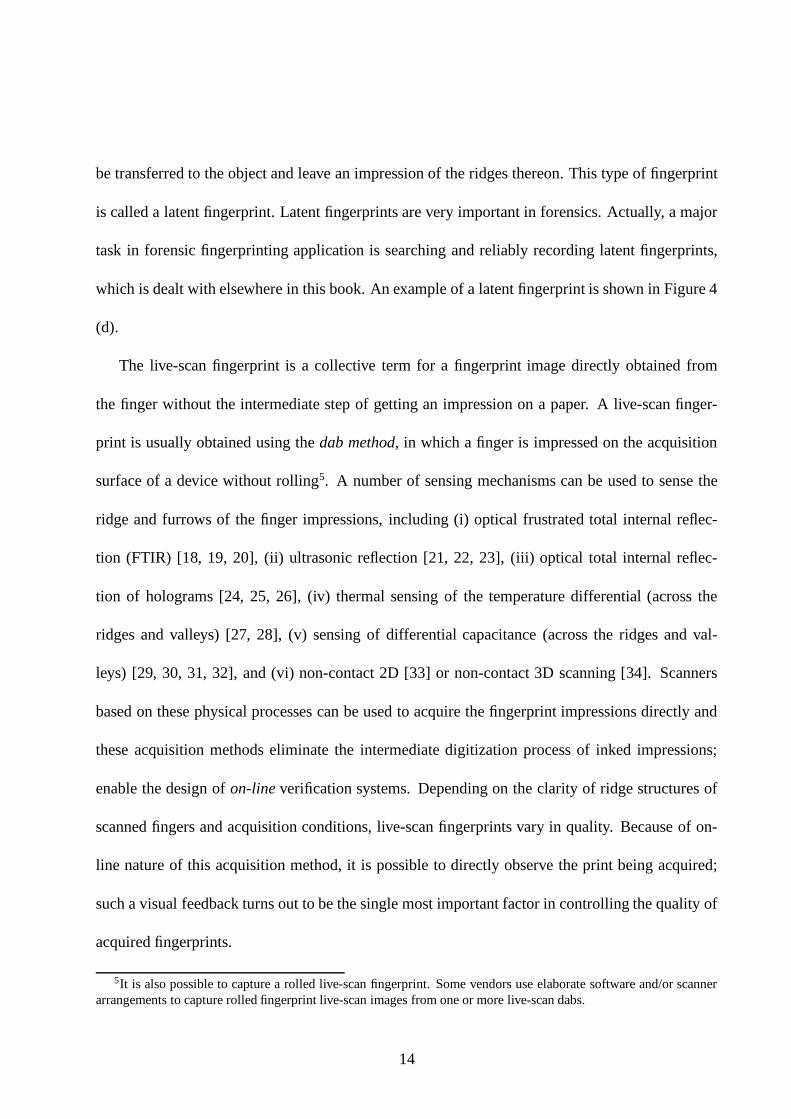
be transferred to the object and leave an impression of the ridges thereon. This type of fingerprint
is called a latent fingerprint. Latent fingerprints are very important in forensics. Actually, a major
task in forensic fingerprinting application is searching and reliably recording latent fingerprints,
which is dealt with elsewhere in this book. An example of a latent fingerprint is shown in Figure 4
(d).
The live-scan fingerprint is a collective term for a fingerprint image directly obtained from
the finger without the intermediate step of getting an impression on a paper. A live-scan finger-
print is usually obtained using the dab method, in which a finger is impressed on the acquisition
surface of a device without rolling5. A number of sensing mechanisms can be used to sense the
ridge and furrows of the finger impressions, including (i) optical frustrated total internal reflec-
tion (FTIR) [18, 19, 20], (ii) ultrasonic reflection [21, 22, 23], (iii) optical total internal reflec-
tion of holograms [24, 25, 26], (iv) thermal sensing of the temperature differential (across the
ridges and valleys) [27, 28], (v) sensing of differential capacitance (across the ridges and val-
leys) [29, 30, 31, 32], and (vi) non-contact 2D [33] or non-contact 3D scanning [34]. Scanners
based on these physical processes can be used to acquire the fingerprint impressions directly and
these acquisition methods eliminate the intermediate digitization process of inked impressions;
enable the design of on-line verification systems. Depending on the clarity of ridge structures of
scanned fingers and acquisition conditions, live-scan fingerprints vary in quality. Because of on-
line nature of this acquisition method, it is possible to directly observe the print being acquired;
such a visual feedback turns out to be the single most important factor in controlling the quality of
acquired fingerprints.
5It is also possible to capture a rolled live-scan fingerprint. Some vendors use elaborate software and/or scannerarrangements to capture rolled fingerprint live-scan images from one or more live-scan dabs.
14

Figure 5: FTIR fingerprint scanner manufactured by Digital Biometrics [35].
The most popular technology to obtain a live-scan fingerprint image is based on the optical
frustrated total internal reflection (FTIR) concept [18]. When a finger is placed on one side of a
glass platen (prism), ridges of the finger are in contact with the platen, while the valleys of the
finger are not in contact with the platen. The rest of the imaging system essentially consists of an
assembly of an LED light source and a CCD camera placed on the other side of the glass platen.
The laser light source illuminates the glass at a certain angle and the camera is placed such that
it can capture the laser light reflected from the glass. The light which is incident on the plate
at the glass surface touched by the ridges is randomly scattered while the light incident at the
glass surface corresponding to valleys suffers total internal reflection, resulting in a corresponding
fingerprint image on the imaging plane of the CCD. An example of live-scan fingerprint is shown in
Figure 4 (b). Figure 5 shows a FTIR fingerprint scanner. Typically, an optical live-scan fingerprint
scanner images span an area which is approximately��� � ��� �� �
. There are vendors who supply
optical scanners which are also capable of imaging very large areas of friction skin and facilitate
ten-print or palmprint/soleprint scanning (see, for instance, [36, 33]).
15

L
P
C
(a)
Finger Friction Surface
PV
A B
R
C
(b)
Figure 6: Optical fingerprint sensing: (a) imaging geometry consists of a laser source (L) illumi-nating a finger resting on a glass platen/prism, P, and an imaging surface (C); (b) Frustrated totalinternal reflection; the ray A incident at the ridge/glass interface scatters while the ray B falling atthe valley/glass interface suffers total internal reflection and the reflected rays are collected at theimaging surface.
16

The other live-scan modalities of fingerprint acquisition strive for (i) reducing the size/price
of the optical scanning system, (ii) improving the quality/resolution of the prints, and/or (iii) im-
proving geometric/photometric/elastic distortion characteristics involved in the image capture. For
instance, by scanning the internal layers of friction skin (as opposed to scanning the superficial
surface layers of the friction skin) an ultrasound method of fingerprint imaging is believed to be
capable of acquiring a very clear fingerprint image even if the impressed finger does not apparently
have clear ridge structures. Imaging in a typical FTIR optical scanners suffers from geometric dis-
tortion since the fingerprint surface (platen) is not parallel to the imaging surface. Hologram based
live scans avoid this problem and hence the resulting fingerprint images are believed to have better
spatial fidelity. Further, the edge-lit holograms [24] avoid bulky illumination optics and, hence, are
compact. Some hologram based scanners have demonstrated 1000 dpi resolution [37] in labaratory
settings. Thomson CSF manufactures a “sweep” based fingerprint scanner based on thermal sens-
ing; this scheme claims to have significantly better reliability in harsh environmental conditions
and a large imaging area. The contact-less scanners permit imaging without contact and hence
eliminate the problems related to elastic distortion in the fingerprints caused by contact with the
presentation surface. Optical scanners are too large to be readily integrated in a number of appli-
cations such as laptop security, cellular phone security, and notebook security. Recently, a number
of different types of compact solid state fingerprint chips have become available. These solid state
chips can be manufactured with very low cost if manufactured in large quantity. Figure 7 shows
two solid state fingerprint chips which are commercially available.
Livescan fingerprinting is an emerging technology and it is too early to assess its strengths
based on the existing commercial products. At this moment, with respect to imaging area, grayscale
resolution, and quality of fingerprints, (rolled) inked fingerprints appear to be superior to the opti-
17

(a) (b)
Figure 7: Solid state fingerprint chips: (a) Differential capacitance fingerprint chip manufacturedby Veridicom [32]. (b) A capacitance-based fingerprint imaging mouse made by Siemens [38].
cal livescans; optical FTIR livescans are superior to solid state fingerprints sensors. The forensic
community has extensively evaluated the quality of livescan fingerprints and expressed concerns
about quality of fingerprints acquired using livescan fingerprint sensors. In its quest to establish
minimum requirements for fingerprint acquisition for criminal applications, various US Govern-
ment agencies have compiled compliance specifications for the optical live-scan fingerprints (see
for instance, image quality specifications (IQS) [17, 39]).
6 Fingerprint Representation
A fingerprint is a smoothly flowing pattern of alternating valleys and ridges, the ridges and valleys
being parallel in most regions. Several permanent and semi-permanent features such as scars, cuts,
bruises, cracks, and calluses, are also present in a fingerprint.
What information is available in fingerprints to enable sound judgement about whether two
prints have originated from the same finger or from two distinct fingers? In order to reliably
18

establish whether two prints came from the same finger or different fingers, it is necessary to
capture some invariant representation (features) of the fingerprints: the features which over a life-
time will continue to remain relatively unaltered irrespective of the cuts and bruises, the orientation
of the finger placement with respect to the medium of the capture, occlusion of a small part of
the finger, the imaging technology used to acquire the fingerprint from the finger, or the elastic
distortion of the finger during the acquisition of the print.
Several representations have been used to assess fingerprint similarity. Fingerprint represen-
tations can be broadly categorized into two types: global and local. Global representation is an
overall attribute of the finger and a single representation is valid for the entire fingerprint and is
typically determined by an examination of the entire finger. A local representation consists of
several components, each component typically derived from a spatially restricted region of the
fingerprint. Typically, generic representations are used for fingerprint indexing and local represen-
tations are used for fingerprint matching.
One of the significant global features used for fingerprints is its class or type. The overall
fingerprint pattern is typically categorized into a small number of classes. Several fingerprint
classification schema exist and as mentioned earlier, we will avoid delving into the details of the
classifications schema adopted by different automatic identification schemes. A simple fingerprint
classification scheme categorizes the prints into following six major classes: whorl, right loop,
left loop, arch, twin loop, and tented arch (see Figure 8)6. Sometimes, a synthetic category called
scars is included to classify fingerprints mutilated with scars obscuring the possibility of accurately
determining its true class.
6A typical AFIS may use the following 8 classes: (i) whorl, (ii) radial loop (iii) ulnar loop, (iv) double loop, (v)arch, (vi) tented arch, (vii) accidental, and (viii) central pocket loop.
19

(a) (b) (c)
(d) (e) (f)
Figure 8: A fingerprint classification schema involving six categories: (a) arch, (b) tented arch, (c)right loop, (d) left loop, (e) whorl, and (f) twin loop. Critical points in a fingerprint, called core anddelta, are marked as squares and triangles, respectively. An arch does not have a delta or a core.One of the two deltas in (e) and both the deltas in (f) are not imaged. A sample minutiae ridgeending ( � ) and ridge bifurcation ( � ) are illustrated in (e). Each image is 512 � 512 with 256 greylevels and is scanned at 512
� � �resolution [9]. c
�IEEE.
20

E
Y
xb
yb
θb
xe
ye
θe
X
B
Figure 9: Schematic representation of a ridge ending (E) and a ridge bifurcation/branching (B). Aminutiae is typically quantified by its
� ��� ���coordinates and the orientiation of the abutting ridge.
Different representation conventions are used by different automatic fingerprint identification sys-tems.
Fingers can also be distinguished based on features such as ridge thickness, ridge separation,
or ridge depths. Some examples of global representation include information about locations of
critical points (e.g., core and delta) in a fingerprint. Core-delta ridge count feature, sometimes
simply referred to as the ridge count, measures the number of ridges between core and delta points
(see Figure 8) on a finger7. All these features measure an overall property of a finger and we will
refer to these similarities as global or generic features.
Major representations of the local information in fingerprints are based on finger ridges, pores
on the ridges, or salient features derived from the ridges. Sometimes, the entire fingerprint itself
(or some condensed form of it) is used as the fingerprint representation [40, 41]. The most widely
7Some categories of fingerprints do not intrinsically have any core or delta. In such cases, an automatic system mayin some consistent way define other landmark features of fingerprints in lieu of core-delta ridge count, core, and/ordelta.
21
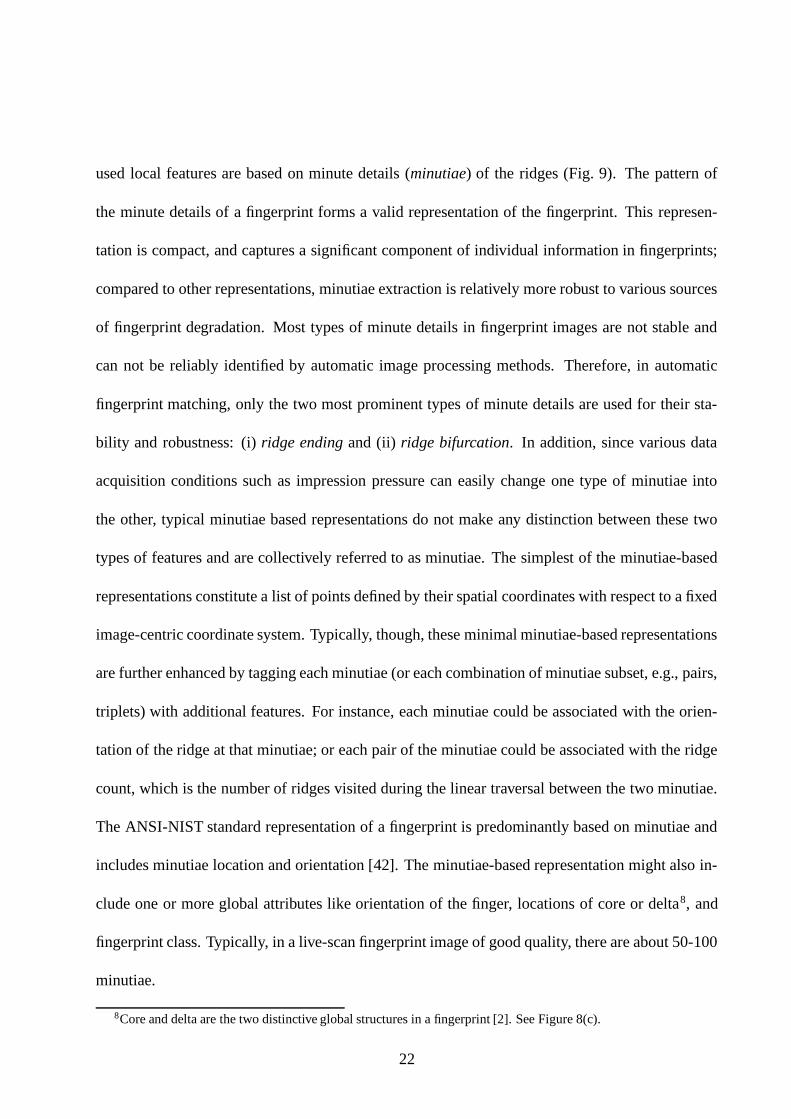
used local features are based on minute details (minutiae) of the ridges (Fig. 9). The pattern of
the minute details of a fingerprint forms a valid representation of the fingerprint. This represen-
tation is compact, and captures a significant component of individual information in fingerprints;
compared to other representations, minutiae extraction is relatively more robust to various sources
of fingerprint degradation. Most types of minute details in fingerprint images are not stable and
can not be reliably identified by automatic image processing methods. Therefore, in automatic
fingerprint matching, only the two most prominent types of minute details are used for their sta-
bility and robustness: (i) ridge ending and (ii) ridge bifurcation. In addition, since various data
acquisition conditions such as impression pressure can easily change one type of minutiae into
the other, typical minutiae based representations do not make any distinction between these two
types of features and are collectively referred to as minutiae. The simplest of the minutiae-based
representations constitute a list of points defined by their spatial coordinates with respect to a fixed
image-centric coordinate system. Typically, though, these minimal minutiae-based representations
are further enhanced by tagging each minutiae (or each combination of minutiae subset, e.g., pairs,
triplets) with additional features. For instance, each minutiae could be associated with the orien-
tation of the ridge at that minutiae; or each pair of the minutiae could be associated with the ridge
count, which is the number of ridges visited during the linear traversal between the two minutiae.
The ANSI-NIST standard representation of a fingerprint is predominantly based on minutiae and
includes minutiae location and orientation [42]. The minutiae-based representation might also in-
clude one or more global attributes like orientation of the finger, locations of core or delta8, and
fingerprint class. Typically, in a live-scan fingerprint image of good quality, there are about 50-100
minutiae.
8Core and delta are the two distinctive global structures in a fingerprint [2]. See Figure 8(c).
22

Another local fingerprint feature is sweat pore information. The location and densities of the
minute sweat pores have been found to contain information helpful for distinguishing individu-
als [37].
The guidelines for (visual) matching of fingerprints are quite elaborate. A fingerprint expert
often relies on subtle and complex reasoning to argue whether two prints originated from a single
finger or two distinct fingers. For instance, an expert can visually localize several rich features
of a fingerprint with remarkable accuracy. These features include the locations of core, delta,
islands, dots, short ridges, ridge endings, ridge bifurcations, and numerical values of orientation
of the ridges, and number of ridges between two features (ridge counts). An expert can reliably
use judgements about scars, complex visual textures, sweat pores, and ridge thickness to rule out
false matches. It is not an exaggeration to state that research in automatic fingerprint identification
has been mostly an exercise in imitating the performance of a human fingerprint expert without
access to the many underlying information-rich features an expert is able to glean by her visual
examination. The lack of such a rich set of informative features in automatic systems is mostly due
to the unavailability of complex modeling techniques and image processing techniques which can
reliably and consistently extract detailed features in the presence of noise.
It should be noted that, at least in the context of law enforcement/forensic applications of
fingerprint based identification, the machine representations alone are not considered a sufficient
basis for assessing the matching outcome and other visual features of the original fingerprint can
sway the final decision. Although there are FBI recommendations about the minimum number of
corresponding minutiae for declaring a “fingerprint match”, a fingerprint expert can overrule such
recommendations based on her visual judgment. For an illustration of the danger of exclusively
relying on parsimonious representations such as minutiae, see [43].
23

Figure 10: Relative configuration of ridge endings and branchings between two impressions of thesame finger. The minutiae were extracted using the algorithm in [9] and the correspondences weremanually determined for illustration.
Considering the relative simplicity of the automatically extracted fingerprint representations,
and the brittleness of the processing algorithms, especially in the context of poor quality fin-
gerprints, an expert is actively involved in processing/classification/matching stages of a typical
fingerprint identification system, especially in forensic applications.
7 Minutiae Feature Extraction
In this section, we will present a summary of a typical automatic feature extraction algorithm for
minutiae representation. An outline of feature extraction related to fingerprint classification is pre-
sented in Section 8. A detailed exposition of these algorithms is presented in [10, 9]. Computation
of fingerprint quality estimation and fingerprint ridge count is not presented here due to space lim-
itation and readers are referred to typical algorithms presented elsewhere in the literature [44, 45].
24
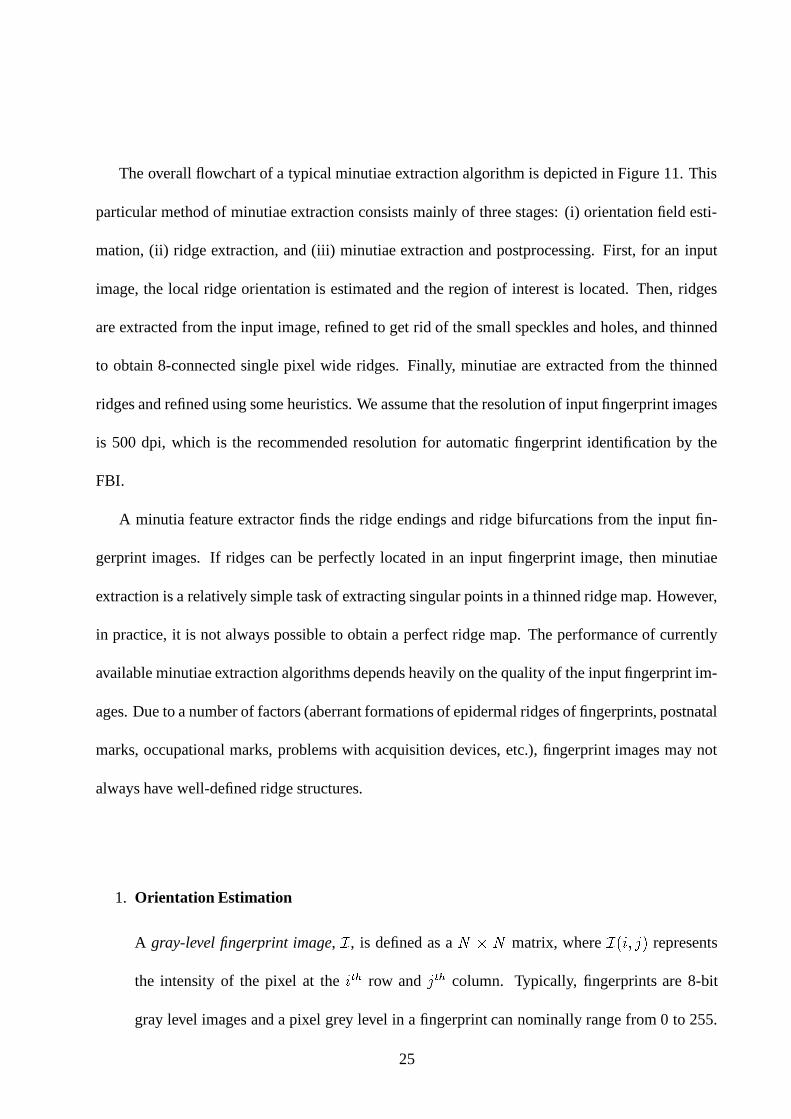
The overall flowchart of a typical minutiae extraction algorithm is depicted in Figure 11. This
particular method of minutiae extraction consists mainly of three stages: (i) orientation field esti-
mation, (ii) ridge extraction, and (iii) minutiae extraction and postprocessing. First, for an input
image, the local ridge orientation is estimated and the region of interest is located. Then, ridges
are extracted from the input image, refined to get rid of the small speckles and holes, and thinned
to obtain 8-connected single pixel wide ridges. Finally, minutiae are extracted from the thinned
ridges and refined using some heuristics. We assume that the resolution of input fingerprint images
is 500 dpi, which is the recommended resolution for automatic fingerprint identification by the
FBI.
A minutia feature extractor finds the ridge endings and ridge bifurcations from the input fin-
gerprint images. If ridges can be perfectly located in an input fingerprint image, then minutiae
extraction is a relatively simple task of extracting singular points in a thinned ridge map. However,
in practice, it is not always possible to obtain a perfect ridge map. The performance of currently
available minutiae extraction algorithms depends heavily on the quality of the input fingerprint im-
ages. Due to a number of factors (aberrant formations of epidermal ridges of fingerprints, postnatal
marks, occupational marks, problems with acquisition devices, etc.), fingerprint images may not
always have well-defined ridge structures.
1. Orientation Estimation
A gray-level fingerprint image,�
, is defined as a � ��� matrix, where� � � � � �
represents
the intensity of the pixel at the� � �
row and� � �
column. Typically, fingerprints are 8-bit
gray level images and a pixel grey level in a fingerprint can nominally range from 0 to 255.
25

Input Image Orientation Field
Thinned Ridges
Extracted Ridges
Minutiae Points
Figure 11: Flowchart of the minutiae extraction algorithm [9].
26

The actual gray levels in a fingerprint may span significantly smaller range either due to (i)
poor finger contact with the sensor, (ii) poor imaging, or (iii) shallow ridges/valleys. Many
systems first preprocess the fingerprint images before subjecting them to the processing steps
described below. The preprocessing may typically consist of either gray level smoothing,
contrast stretching, and/or spatial/frequency domain filtering. In extreme cases, a very poor
fingerprint may be automatically enhanced (see Section 10).
An orientation field/image is defined as an � � � image, where� � � � � �
represents the
local ridge orientation at pixel� � � � �
. The local ridge orientation can not be meaningfully
determined from the gray value at pixel� � � � �
alone; it is typically computed from pixels of
the surrounding (rectangular block) region. An image is divided into a set of � ��� non-
overlapping blocks and a single local ridge orientation is defined for each block. Typically,
� is determined by the image resolution and its dimension is comparable to one to two
inter-ridge distances (e.g., 32 � 32 pixels in a 512 dpi fingerprint image).
One approach to ridge orientation estimation relies on local image gradient. A gray scale
gradient is a vector whose orientation indicates the direction of the steepest change in the
gray values and whose magnitude depends upon the amount of change of the gray values in
the direction of the gradient. The local orientation in a block can be determined from the
constituent pixel gradient orientations of the block in several ways. For instance, one could
determine the block gradient orientation by averaging the pixel gradient orientations [46]. An
alternative method of determining block gradient orientation may rely on a voting scheme
involving pixel gradient orientations [47]. Another method [48] uses a least square optimiza-
tion scheme involving the pixel gradient orientations.
27

The rationale for determining a single orientation for each block of � � � pixels (rather than
for each pixel) is computational efficiency. Consequently, in regions of a fingerprint with
smoothly flowing parallel ridges, representing a single ridge orientation for an entire block
is not unreasonable but in the regions where the ridges are sharply changing their directions
(e.g., regions surrounding core or delta) or the regions with cuts/scars, the choice of local
ridge direction per block is ambiguous. Note that in a fingerprint image, the ridges oriented
at� �
and the ridges oriented at� � � �
in a local neighborhood can not be differentiated from
each other.
2. Segmentation
The objective of this stage is to locate the actual region in the fingerprint image depicting the
finger (region of interest) and discard the regions of the image containing irrelevant informa-
tion, e.g., dirt, smudges leftover from previous acquisitions, and spurious (pencil) markings
in inked impressions. This stage is also sometimes referred to as foreground/background de-
tection. Note that this stage is not responsible for discriminating the ridges against valleys.
A typical approach to segmentation might involve smearing (spatial gray scale smoothing)
the fingerprint image and using a fixed/adaptive thresholding to discard background region.
This approach may produce reasonable results for a good quality print but may not easily re-
move the extraneous artifacts in a poor quality fingerprint image. Here we describe a method
of segmentation based on the concept of certainty level of orientation field estimation.
After the orientation field of an input fingerprint image is estimated, a region of interest
localization algorithm which is based on the local certainty level of the orientation field
is used to locate the region of interest within the input image. The certainty level of the
28

orientation field in a block quantifies the extent to which the pixel gradient orientations agree
with the block gradient orientation. For each block, if its certainty level of the orientation
field is below a threshold, then all the pixels in this block are marked as background pixels.
As the computation of certainty level is a by-product of the local ridge orientation estimation,
it is a computationally efficient approach. We have found that this method of segmentation
performs reasonably well in detecting the region of interest.
3. Ridge Detection As alluded earlier, the objective of the ridge detection algorithm is to sep-
arate ridges from the valleys in a given fingerprint image. Previous approaches to ridge
detection have used either global or adaptive thresholding, i.e., pixels darker/brighter than a
constant/variable threshold are determined to be pixels depicting a ridge in the fingerprint.
These straightforward approaches generally do not work well for noisy and low contrast
portions of the image.
A more reliable property of the ridges in a fingerprint image is that the gray level values on
ridges attain their local minima9 along a direction normal to the local ridge orientation [48,
9]. Pixels can be identified to be ridge pixels based on this property. Given the local ridge
orientation at a pixel� � � � �
in the foreground portion of the image, a simple test can be
devised to determine whether the gray level values in the fingerprint image attain a local
minima at� � � � �
along a direction normal to the ridge orientation. The resultant image is a
binary image, e.g., the loci of the minima are marked 1 and all other pixels are marked 0.
The ridges thus detected are typically thick (e.g., three pixels wide) and standard thinning
algorithms [49] can be used to obtain one pixel thin ridges. Thinned ridges facilitate the
9In a fingerprint image where ridges are darker than valleys.
29

detection of minutiae. Before applying a thinning algorithm, spurious structures (e.g., dirt)
detected as ridges must be discarded based on their (small) area.
4. Minutiae Detection Once the thinned ridge map is available, the ridge pixels with three ridge
pixel neighbors are identified as ridge bifurcations and those with one ridge pixel neighbor
are identified as ridge endings. However, all the minutia thus detected are not genuine due
to image processing artifacts and the noise present in the fingerprint image.
5. Postprocessing In this stage, typically, genuine minutiae are gleaned from the extracted
minutiae using a number of heuristics. For instance, too many minutiae in a small neigh-
borhood may indicate the presence of noise and they could be discarded. Very close ridge
endings that are oriented anti-parallel to each other may indicate spurious minutia generated
by a break in the ridge due either to poor contrast or a cut in the finger. Two very closely lo-
cated bifurcations sharing a common short ridge often suggest extraneous minutia generated
by bridging of adjacent ridges as a result of dirt or image processing artifacts.
8 Fingerprint Classification
Fingerprints have been traditionally classified into categories based on the information contained
in the global patterns of ridges. In large scale fingerprint identification systems, elaborate methods
of manual fingerprint classification systems were developed to index individuals into bins based on
classification of their fingerprints; these methods of binning eliminate the need to match an input
fingerprint to the entire fingerprint database in identification applications, thereby significantly
reducing the computing requirements [50, 51, 52].
30

Efforts in automatic fingerprint classification have been exclusively directed at replicating the
manual fingerprint classification system. Figure 8 shows one prevalent manual fingerprint classi-
fication scheme that has been the focus of many automatic fingerprint classification efforts. It is
important to note that the distribution of fingers into the six classes (shown in Figure 8) is highly
skewed (32.5% left loop, 32.5% right loop, 30% whorl, 5% other). A fingerprint classification
system should be invariant to rotation, translation, and elastic distortion of the frictional skin. In
addition, often a significant part of the finger may not be imaged (e.g., dabs frequently miss deltas)
and the classification methods requiring information from the entire fingerprint may be too restric-
tive for many applications.
A number of approaches to fingerprint classification have been developed. Some of the ear-
liest approaches did not make use of the rich information in the ridge structures and exclusively
depended on the orientation field information. Although fingerprint landmarks provide very effec-
tive fingerprint class clues, methods relying on the fingerprint landmarks alone may not be very
successful due to lack of availability of such information in many fingerprint images and due to the
difficulty in extracting the landmark information from the noisy fingerprint images. As a result,
a successful approach needs to (i) supplement the orientation field information with ridge infor-
mation; (ii) use fingerprint landmark information when available but devise alternative schemes
when such information cannot be extracted from the input fingerprint images; and (iii) use struc-
tural/syntactic pattern recognition methods in addition to statistical methods. We summarize a
method of classification [10] which takes into consideration the above mentioned design criteria
that has been tested on a large database of realistic fingerprints to classify fingers into five major
categories: right loop, left loop, arch, tented arch, and whorl10.
10Other types of prints, e.g., twin-loop, are not considered here but, in principle, could be lumped into “other” or
31

cN = 1?
cN = 2?Start
yes
no
no
and
no
yes
yesyes
yes
no
no
yes
R = 1?
d
N = 0
N = 0? c
whorl tented arch left loop
right loopwhorl
arch
yes
dN = 1? or 1N > 0
or β < 15 &α < 10γ = 0?
N > T?2
type 0 type 1 type 2
Ridge Classification
(N1) (N2)
axis of symmetry
axis of symmetry
no
no
re-compute
re-compute
Figure 12: Flowchart of fingerprint classification algorithm. Inset also illustrates ridge classifica-tion [10]. The “re-compute” option involves starting the classification algorithm with a differentpreprocessing (e.g., smoothing) of the image [10, 15]. c
�Academic Press.
The orientation field determined from the input image may not be very accurate and the ex-
tracted ridges may contain many artifacts and, therefore, cannot be directly used for fingerprint
classification. A ridge verification stage assesses the reliability of the extracted ridges based upon
the length of each connected ridge segment and its alignment with other adjacent ridges. Paral-
lel adjacent subsegments typically indicate a good quality fingerprint region; the ridge/orientation
estimates in these regions are used to refine the estimates in the orientation field/ridge map.
“reject” category.
32

1. Singular Points: The Poincare index [46] computed from the orientation field is used to
determine the number of delta ( � � ) and core ( ��� ) points in the fingerprint. A digital closed
curve,�
, about 25 pixels long, around each pixel is used to compute the Poincare index as
defined below:
Given a fingerprint orientation field, Poincare index at a pixel� � � � �
is the integration (sum-
mation) of all differences in orientations of successive pixels along a square shaped curve
centered around pixel� � � � �
. The Poincare index at most of the pixels in a fingerprint im-
age is equal to zero and these points are called non-singular points. The pixels with non-zero
Poincare index always take a value of 1/2 or -1/2 and are called singular points. The Poincare
index of a core-shaped singular point has a value of 1/2 and the Poincare index of a delta-
shaped singular point has a value of -1/2.
The size of the square used for computing Poincare index is crucial for the performance of a
singular point detection algorithm. If it is too small, then a small perturbation of orientations
may result in spurious singular points being detected. On the other hand, if it is too large,
then a true pair of core and delta which are close to one another may be ignored because the
Poincare index of a digital curve that includes an equal number of cores and deltas is 0. For a
512 dpi fingerprint image, for instance, square curve with a length of 25 pixels may be used
for computation of Poincare index. The results of Poincare index cannot be directly used to
obtain core/delta point locations and may need some postprocessing [10].
2. Symmetry: The feature extraction stage also estimates an axis which is locally symmetric
to the ridge structures at the core and computes (i) � , angle between the symmetry axis and
the line segment joining core and delta, (i) � , average angle difference between the ridge
33

orientation and the orientation of the line segment joining the core and delta, and (iii) � , the
number of ridges crossing the line segment joining core and delta. The relative position, R,
of delta with respect to the symmetry axis is determined as follows: R = 1 if the delta is on
the right side of symmetry axis, R = 0, otherwise.
3. Ridge Structure: The classifier not only uses the orientation information but also utilizes the
structural information in the extracted ridges. This feature summarizes the overall nature of
the ridge flow in the fingerprint. In particular, it classifies each ridge of the fingerprint into
three categories:
� Non-recurving ridges: the ridges which do not curve very much.
� Type-1 recurving ridges: ridges which curve approximately � .
� Type-2 fully recurving ridges: ridges which curve by more than � .
The classification algorithm summarized here (see Figure 12) essentially devises a sequence
of tests for determining the class of a fingerprint and conducts simpler tests near the root of the
decision tree. For instance, two core points are typically detected for a whorl (see Figure 12) which
is an easier condition to verify than detecting the number of Type-2 recurring ridges. Another
highlight of the algorithm is that if it can not detect the salient characteristics of any category from
the features extracted in a fingerprint, it recomputes the features with a different pre-processing
method. For instance, in the current implementation, the differential pre-processing consists of
a different method/scale of smoothing the image. As can be observed from the flowchart, the
algorithm detects (i) whorls based upon detection of either two core points or a sufficient number
of Type-2 recurring ridges; (ii) arch based upon the inability to detect either delta or core points;
34

Assigned ClassTrue ClassA T L R W
A 885 13 10 11 0T 179 384 54 14 5L 31 27 755 3 20R 30 47 3 717 16W 6 1 15 15 759
Table 2: Five-class classification results on the NIST-4 database; A-Arch, T-Tented Arch, L-LeftLoop, R-Right Loop, W-Whorl.
(iii) left (right) loops based on the characteristic tilt of the symmetric axis, detection of a core
point, and detection of either a delta point or a sufficient number of Type-1 recurring curves; and
(iv) tented arch based on the presence of a relatively upright symmetric axis, detection of a core
point, and detection of either a delta point or a sufficient number of Type-1 recurring curves.
Table 2 shows the results of the fingerprint classification algorithm on the NIST-4 database
which contains 4,000 images (image size is� � �
���� �
) taken from 2,000 different fingers, 2 images
per finger. Five fingerprint classes are defined: (i) Arch, (ii) Tented arch, (iii) Left Loop, (iv) Right
Loop, and (v) Whorl. Fingerprints in this database are uniformly distributed among these five
classes (800 per class). The five-class error rate in classifying these 4,000 fingerprints is 12.5%.
The confusion matrix is given in Table 2; numbers shown in bold font are correct classifications.
Since a number of fingerprints in the NIST-4 database are labeled as belonging to possibly more
than one classes, each row of the confusion matrix in Table 2 does not sum up to 800. For the
five-class problem, most of the classification errors are due to misclassifying a tented arch as an
arch. By combining these two arch categories into a single class, the four-class error rate drops
from 12.5% to 7.7%. Besides the tented arch-arch errors, the other errors mainly come from
misclassifications between arch/tented arch and loops and due to poor image quality.
35
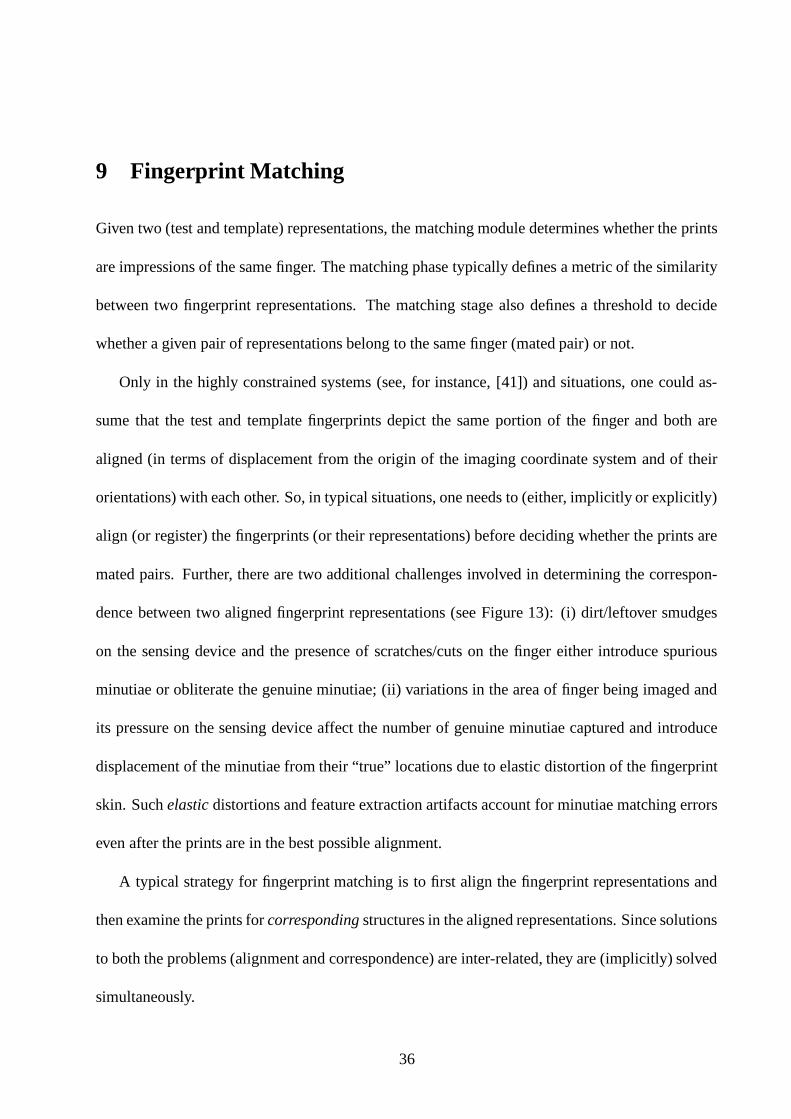
9 Fingerprint Matching
Given two (test and template) representations, the matching module determines whether the prints
are impressions of the same finger. The matching phase typically defines a metric of the similarity
between two fingerprint representations. The matching stage also defines a threshold to decide
whether a given pair of representations belong to the same finger (mated pair) or not.
Only in the highly constrained systems (see, for instance, [41]) and situations, one could as-
sume that the test and template fingerprints depict the same portion of the finger and both are
aligned (in terms of displacement from the origin of the imaging coordinate system and of their
orientations) with each other. So, in typical situations, one needs to (either, implicitly or explicitly)
align (or register) the fingerprints (or their representations) before deciding whether the prints are
mated pairs. Further, there are two additional challenges involved in determining the correspon-
dence between two aligned fingerprint representations (see Figure 13): (i) dirt/leftover smudges
on the sensing device and the presence of scratches/cuts on the finger either introduce spurious
minutiae or obliterate the genuine minutiae; (ii) variations in the area of finger being imaged and
its pressure on the sensing device affect the number of genuine minutiae captured and introduce
displacement of the minutiae from their “true” locations due to elastic distortion of the fingerprint
skin. Such elastic distortions and feature extraction artifacts account for minutiae matching errors
even after the prints are in the best possible alignment.
A typical strategy for fingerprint matching is to first align the fingerprint representations and
then examine the prints for corresponding structures in the aligned representations. Since solutions
to both the problems (alignment and correspondence) are inter-related, they are (implicitly) solved
simultaneously.
36

Figure 13: Two different impressions of the same finger. In order to know the correspondencebetween the minutiae of these two fingerprint images, all the minutiae must be precisely localizedand the deformations must be recovered.
A number of strategies have been employed in the literature to solve the alignment problem.
Typically, it is assumed that the alignment of the test and template fingerprints involve an overall
displacement (translation) and rotation. The scale variations, shear transformations, local elastic
deformations are often overlooked in the alignment stage. In image based representations, the
alignment of the prints may be obtained by optimizing their image correlation. In ridge represen-
tations of the fingerprints, portions of ridges may be used to align the prints [9]. In minutiae based
representations, typically, the alignment process uses predominantly minutia positions; minutia
angles are not significantly involved because they are vulnerable to image noise/distortion. Other
supplementary information, e.g., connectivity, nearest neighboring minutia, ridge count, may often
participate in the alignment process. In minutia based alignment, a single minutia, pairs of minu-
tia, or triplets of minutia have been used to hypothesize an alignment. In [48], for instance, all
possible test and template minutia pair correspondence possibilities are exhaustively considered;
37

each hypothesized pairing votes for all feasible translations and rotations. In [51], a triplet of test
minutia votes for a congruent template triplet. The transformation receiving the maximum number
of votes is deemed to be the best transformation.
Once the prints are aligned, the corresponding structures in the aligned representations provide
a basis for computing the matching score. In image based representation, the correlation coeffi-
cient generated during the alignment can serve as a matching score. The elastic deformation, shear
transformation, and scale variations may impose severe limitations on the utility of image corre-
lation and image based representations. In an elastic minutia based matching, the test minutia are
searched in a square region centered (bounding box) around each template minutia in the aligned
representation. The elastic matchers account for small local elastic deformations.
Figure 14 illustrates a typical situation of aligned ridge structures of mated pairs. Note that
the best alignment in one part (center) of the image may result in a large amount of displacement
between the corresponding minutiae in the other regions (bottom right). In addition, observe that
the distortion is non-linear: given distortions at two arbitrary locations on the finger, it is not
possible to predict the distortion at all the intervening points on the line joining the two points.
Accomodating such large non-linear distortions was the motivation underlying the design of the
adaptive elastic string matching algorithm [9].
The operation of adaptive elastic string matching algorithm (string matcher, for short) is similar
to an elastic matcher. As in an elastic matcher, the test minutia are searched in the bounding box
neighborhood of each template minutia. In the string matcher, however, the size of the bounding
box around each template minutia, unlike in elastic minutia, is not constant. The bounding box size
38

Figure 14: Aligned ridge structures of mated pairs. Note that the best alignment in one part (mid-left) of the image results in large displacements between the corresponding minutiae in the otherregions (bottom right) [9]. c
�IEEE.
39

is adjusted based on the estimate of the local deformation; the estimate of the local deformation
is derived from the bounding boxes of the already matched minutia in the neighborhood of the
current template minutiae.
The string matcher first selects a pair of corresponding minutia in test and template represen-
tations based on information associated with an adjoining portion of ridge; the minutiae sets in
this pair of minutia are called reference test and reference template minutiae. The string matcher
uses three attributes of the aligned minutiae for matching: its distance from the reference minutiae
(radius), angle subtended to the reference minutiae (radial angle), and local direction of the as-
sociated ridge (minutiae direction). The algorithm initiates the matching by first representing the
aligned input (template) minutiae as an input (template) minutiae string. The string representation
is obtained by imposing a linear ordering on the minutiae based on radial angles and radii. The re-
sulting input and template minutiae strings are matched using an inexact string matching algorithm
to establish the correspondence.
The inexact string matching algorithm essentially transforms (edits) the input string to template
string and the number of edit operations is used to define the (dis)similarity between the strings.
While permitted edit operators model the fingerprint impression variations (deletion of the genuine
minutiae, insertion of spurious minutiae, and perturbation of the minutiae), the penalty associated
with each edit operator reflects the likelihood of that edit operation. The sum of penalties of all the
edits (edit distance) defines the similarity between the input and template minutiae strings. Among
several possible sets of edits that permit the transformation of the input minutiae string into the
reference minutiae string, the string matching algorithm chooses the transform associated with the
minimum cost using dynamic programming.
40

ε
δl
l(m,n)
(m,n)
(m,n)
(m,n)h
h
e
Reference minutia
∆
ε
δ
∆r
Template minutia
Input minutia
Figure 15: Bounding box and its adjustment [9]. c�
IEEE.
The algorithm tentatively considers a candidate (aligned) input and a candidate template minu-
tiae to be a mismatch if their attributes are not within a tolerance window (see Figure 15) and
penalizes them for deletion/insertion edit operation. If the attributes are within the tolerance win-
dow, the amount of penalty associated with the tentative match is proportional to the disparity in
the values of the attributes in the minutiae. The algorithm accommodates for the elastic distortion
by adaptively adjusting the parameters of the tolerance window based on the most recent success-
ful tentative match. The tentative matches (and correspondences) are accepted if the edit distance
for those correspondences is smaller than any other correspondences.
There are several approaches to converting minutia correspondence information to a matching
41

(a)
(b)
Figure 16: Fingerprint matching. (a) Matching two impressions of the same finger, matching score= 49; (b) matching fingerprints from two different fingers, matching score = 4.
42
score. One straightforward approach for computing the score�
is:
���� � ������������������
�(1)
where�����
is the number of corresponding minutiae and���
,���
are the total number of minutia
in template and test fingerprints. In some matchers, the total number of minutiae (���
and���
in
Eq. (1)) is not used. After the correspondence is determined, an overall bounding box only for
corresponding test and template minutia is computed. The matching score� �
is then computed as:
������ � ������������������ �����
�(2)
where�����
is the number of corresponding minutiae and�����
,�����
are the number of minutia
in the overall bounding boxes computed for template and test fingerprints, respectively. Often,
different normalizations are used for different counts of the total number of minutia. The matching
score when matching two impressions of the same finger as expected is higher than the matching
score when matching two fingerprints from different fingers (Figure 16).
Due to limitations of space, we have not described many other important classes of finger-
print matchers which are based on topological (ridge connectivity) information and the readers are
referred to literature [53, 54] for related information.
10 Fingerprint Enhancement
The performance of a fingerprint feature extraction and image matching algorithm relies critically
on the quality of the input fingerprint images. The ridge structures in poor quality fingerprint
43

images are not always well-defined and hence they can not be correctly detected. This leads to
the following problems: (i) a significant number of spurious minutiae may be created, (ii) a large
percentage of genuine minutiae may be ignored, and (iii) large errors in minutiae localization (po-
sition and orientation) may be introduced. In order to ensure that the performance of the minutiae
extraction algorithm will be robust with respect to the quality of fingerprint images, an enhance-
ment algorithm which can improve the clarity of the ridge structures is necessary. Traditionally, the
forensic applications have been the biggest end-users of fingerprint enhancement algorithms, since
the important ridge details are frequently obliterated in the latent fingerprints lifted from a scene
of crime. Over-inking, under-inking, imperfect friction skin contact, fingerprint smudges leftover
from previous livescan acquisitions, adverse imaging conditions, and improper imaging geom-
etry/optics are some of the systematic reasons for poor quality fingerprint images. It is widely
acknowledged that at least 2-5% of target population have poor-quality fingerprints: fingerprints
that cannot be reliably processed using automatic image processing methods. We suspect this frac-
tion is even higher in reality when the target population consists of (i) older people; (ii) people
who suffer routine finger injuries in their occupation; (iii) people living in dry weather conditions
or having skin problems, and (iv) people who have poor fingerprints due to their genetic and racial
attributes. With the increasing demand for cheaper and compact fingerprint scanners, the finger-
print verification software cannot afford the luxury of assuming good quality fingerprints obtained
from the optical scanner. The cheaper and more compact semiconductor sensors not only offer
smaller scan area but also typically poor quality fingerprints.
44

−200−100
0100
200
−200
−100
0
100
200
−1
−0.5
0
0.5
1
(a)−200
−1000
100200
−200
−100
0
100
200
0
0.2
0.4
0.6
0.8
1
(b)
Figure 17: An even-symmetric Gabor filter: (a) Gabor filter tuned to 60 cycles/width and� �
orien-tation; (b) corresponding modulation transfer function (MTF) [10].
Fingerprint enhancement approaches [55, 56, 57, 58] often employ frequency domain tech-
niques [56, 59, 55] and are computationally demanding. In a small local neighborhood, the ridges
and furrows approximately form a two-dimensional sinusoidal wave along the direction orthog-
onal to local ridge orientation. Thus, the ridges and furrows in a small local neighborhood have
well-defined local frequency and orientation properties. The common approaches employ band-
pass filters which model the frequency domain characteristics of a good quality fingerprint image.
The poor quality fingerprint image is processed using the filter to block the extraneous noise and
pass the fingerprint signal. Some methods may estimate the orientation and/or frequency of ridges
in each block in the fingerprint image and adaptively tune the filter characteristics to match the
ridge characteristics.
One typical variation of this theme segments the image into non-overlapping square blocks of
width larger than the average inter-ridge distance. Using a bank of directional bandpass filters,
each filter is matched to a predetermined model of generic fingerprint ridges flowing in a certain
direction; the filter generating a strong response indicates the dominant direction of the ridge flow
in the finger in the given block. The resulting orientation information is more accurate, leading
45

Ridge MapCoarse-level
Region Mask
−200−100
0100
200
−200
−100
0
100
200
−1
−0.5
0
0.5
1
Bank of Gabor Filters
Ridge Extraction
Voting Algorithm
Estimate Local Orientation
Composition
Enhanced Image
Input Image
Filtered Images
Orientation Field
Ridge Maps
Unrecoverable
Figure 18: Fingerprint Enhancement Algorithm [10, 15]. c�
Academic Press.
46

(a) (b)
(c) (d)
Figure 19: Examples of enhancement results; (a) and (c) are the input images; (b) and (d) showenhanced recoverable regions superimposed on the corresponding input images.
47

(a) (b) (c)
Figure 20: Fingerprint Enhancement Results: (a) a poor quality fingerprint; (b) minutia extractedwithout image enhancement; and (c) minutiae extracted after image enhancement [10].
to more reliable features. A single block direction can never truly represent the directions of all
the ridges in the block and may consequently introduce filter artifacts. One common directional
filter used for fingerprint enhancement is a Gabor filter [60]. Gabor filters (see Fig. 17) have both
frequency-selective and orientation-selective properties. For instance, a properly tuned Gabor filter
will pass only fingerprint ridges of certain spatial frequency flowing in certain specific direction.
Typically, in a 500 dpi, 512 � 512 fingerprint image, a Gabor filter with ��� = 60 cycles per image
width (height), the radial bandwidth of 2.5 octaves, and orientation�
models the fingerprint ridges
flowing in the direction���
��� � .
We summarize a novel approach to fingerprint enhancement proposed by Hong et al. [10] (see
Figure 18). It decomposes the given fingerprint image into several component images using a
bank of directional Gabor bandpass filters and extracts ridges from each of the filtered bandpass
images [9]. By integrating information from the sets of ridges extracted from filtered images,
the enhancement algorithm infers the region of fingerprint where there is sufficient information
available for enhancement (recoverable region) and estimates a coarse-level ridge map for the
48

recoverable region. The information integration is based on the observation that genuine ridges
in a region evoke a strong response in the feature images extracted from the filters oriented in
the direction parallel to the ridge direction in that region and at most a weak response from the
filters oriented in the direction orthogonal to the ridge direction in that region. The resulting coarse
ridge map consists of the ridges extracted from each filtered image which are mutually consistent;
portions of the image where the ridge information is consistent across the filtered images constitute
recoverable regions. The orientation field estimated from the coarse ridge map is more reliable than
the orientation estimation from the input fingerprint image. After the orientation field is obtained,
the fingerprint image can then be adaptively enhanced by using the local orientation information.
Typically, given the local orientation�
at a pixel� ��� ���
, the enhanced image pixel is chosen to be
the pixel� ��� ���
of the Gabor filter which has orientation�. When Gabor filter with orientation
�
is not available, the enhanced pixel� ��� ���
can be linearly interpolated from the two Gabor filters
with orientations closest to�. The interpolation is computationally efficient as the filtered images
are already available during the previous stages of enhancement and it produces good results.
Examples of fingerprint image enhancement are shown in Figure 19. An example illustrating
the results of minutiae extraction algorithm on a noisy input image and its enhanced counterpart is
shown in Figure 20. The improvement in matching performance by encorporating image enhance-
ment module was evaluated using the fingerprint matcher described in Section 9. Figure 21 shows
the ROC curves for the matcher that were obtained with and without image enhancement module
on a database consisting of 700 fingerprint images of 70 individuals (10 fingerprints per finger per
individual). It is clear that the image enhancement has improved the performance on this database.
49

10−3
10−2
10−1
100
101
102
0
10
20
30
40
50
60
70
80
90
100
False Acceptance Rate (%)
Aut
hent
ic A
ccep
tanc
e R
ate
(%)
with enhancement
without enhancement
Figure 21: Performance Improvement due to Fingerprint Enhancement Algorithm [10].
11 Large Scale Systems Issues
Typically, in a large scale identification problem, given a fingerprint and a large database of fin-
gerprints (e.g., millions), one would like to find out whether any one of the prints in the database
matches the given fingerprint. A straightforward solution to this problem involves matching the
given fingerprint with each fingerprint in the database. However, in this approach, the expected
number of matches required to solve the identification problem increases linearly with the database
size. It is therefore desirable to find more efficient solutions to the identification problem.
There have been two primary approaches to make the identification searches efficient. In the
first approach, the database is organized so that certain matches can be ruled out either based on
the information extrinsic/intrinsic to the fingerprints. When the number of necessary matches is
reduced based on the information extrinsic to the fingerprints, the solution is commonly referred to
as filtering. For instance database may be presegmented based on the information about sex, race,
age, and other bio-/geo-graphical information related to the individual. In binning, a fingerprint’s
intrinsic information, e.g., fingerprint class, is used to reduce the number of matches [61].
The percentage of the total database to be scanned, on an average, for each search is called the
50

“penetration coefficient”, P, which can be defined as the ratio of the expected number of compar-
isons required for a single input image to the total number of prints in the entire database. Based on
the published results, we believe that binning can achieve a penetration coefficient of about 50%.
The second approach for making the search more efficient is by reducing the effective time
taken for each match. Given a matching algorithm, the effective time per match can be reduced
by directly implementing the entire algorithm or components of it in special hardware. The other
method of reducing the effective time per match is by parallelizing the matches, i.e., using multiple
processors and assigning a fraction of the matches to each processor. Some vendors have resorted
to optical computing [41] to achieve a very high matching throughput.
Scalability of accuracy performance of a large scale identification system is a more formidable
challenge than its speed performance. If the accuracy performance associated with matching each
pair of fingerprints (e.g., verification accuracy) is characterized by false accept (�������
) and false
reject (�������
) rates, the identification accuracy performance of the system with�
records in the
database (one per identity), can then be expressed as:
������� � �������������(3)
������� � � � � �� ������� � � � � �(4)
under the simplifying assumptions that (i) outcome of each match is an independent event; (ii) all
the records in the database are correctly classified; (iii) FCR is the probability of falsely classifying
(binning) the given fingerprint into a wrong bin; (iv) the misclassification and mismatching events
are independent.
A significant implication of the above mentioned accuracy equation is that the false accept rates
51

0
0.1
0.2
0.3
0.4
0.5
0.6
0.7
0.8
0.9
1
1 10 100 1000 10000 100000 1e+006
Iden
tific
atio
n F
AR
Database Size
P=0.5,Verification FAR=0.001P=0.5,Verification FAR=0.0001P=0.3,Verification FAR=0.0001
Figure 22: False acceptance error rates of verification (matcher) and identification systems. Forinstance, a matcher which can match with a false acceptance error rate (FAR) of
� � ��
and a clas-sifier with a penetration ratio (P) of
��� �could typically result in an identification system (database
population of 14,000 distinct fingers, 1 finger per individual) with a false acceptance error rate ofapproximately
��� �. That is, the likelihood of the system determining a match from an arbitrary
input fingerprint matching one of the 14,000 (actually, only half of them because of the classifierpenetration ratio) fingerprints is 0.5.
of the identification deteriorate as a function of the size of the database (see Fig. 22). Consequently,
an effective identification system requires a very accurate matcher.
12 System Evaluation
Given a fingerprint matcher, one would like to assess its accuracy and speed performance in a
realistic setting. In this section, we will mainly deal with accuracy performance evaluation issues.
Given two fingerprints, a decision made by a fingerprint identification system is either a “match”
or a “no-match”. For each type of decision, there are two possibilities: either the decision reflects
the true state of the nature or otherwise. Therefore, there are a total of four possible outcomes: (i)
a genuine (mated) fingerprint pair is accepted as a “match”, (ii) a genuine fingerprint mated pair
52

� � � � � � � � � � � � � � �� � � � � � � � � � � � � � �� � � � � � � � � � � � � � �� � � � � � � � � � � � � � �� � � � � � � � � � � � � � �� � � � � � � � � � � � � � �
� � � � � � � � � � � � � � �� � � � � � � � � � � � � � �� � � � � � � � � � � � � � �� � � � � � � � � � � � � � �� � � � � � � � � � � � � � �� � � � � � � � � � � � � � �
� � � � � � � � � � � � � � �� � � � � � � � � � � � � � �� � � � � � � � � � � � � � �
� � � � � � � � � � � � � � �� � � � � � � � � � � � � � �� � � � � � � � � � � � � � �
� �� �� �
� �� �� �
FAR
Score
Impostor Distribution
Genuine Distribution
Pro
bab
ilit
y
Threshold Score, T
FRR
Figure 23: Probability distributions of matcher scores from genuine mated and impostor fingerprintpairs. FRR and FAR denote the false reject and false accept error rates.
is rejected as “no-match”, (iii) a non-mated fingerprint pair (also called impostor) is rejected as
“no-match”, and (iv) an impostor is accepted as a “match” by the system. Outcomes (i) and (iii)
are correct whereas (ii) and (iv) are incorrect. Thus, probabilities of a matcher committing false
accept (or false match) and false reject (false non-match) errors are two necessary components to
characterize the accuracy performance of a system. Note that false accept and false reject error
rates are related to each other through the score threshold parameter determined by the system op-
erating point. Further, it is widely acknowledged [62] that false accept/reject error rates at a single
operating point do not provide sufficient information for system accuracy performance character-
ization; it is recommended that a curve, called ROC, describing the false accept/reject error rates
at all possible score thresholds be plotted for a comprehensive perspective at the system accuracy
and this information provides a useful basis for system evaluation and comparison.
How is an ROC generated? In order to generate an ROC, a set of mated fingerprint pairs
(e.g., a sample of genuine distribution) and a set of non-matching fingerprint pairs (e.g., a sample
53

of impostor distribution) is necessary. The matcher scores resulting from mated fingerprint pairs
are used to generate the genuine score probability distribution and the scores from non-mated
fingerprint pairs are used to generate the impostor score probability distribution. Given a score
threshold, T, impostor scores larger than T contribute to the false accept error and the corresponding
area under the impostor distribution quantifies the false accept error at that threshold (see Fig. 23).
Similarly, genuine scores smaller than T contribute to the false reject error and the corresponding
area under the genuine distribution quantifies the false reject error at that threshold.
For any performance metric to be able to precisely generalize to the entire population of inter-
est, the test data should (i) be representative of the population and (ii) contain enough samples from
each category of the population. The samples are collected so that the method of sensing and the
method of presentation of the finger closely correspond to those in the real situations. Fingerprint
images collected in a very controlled and non-realistic environment provide over-optimistic results
which do not generalize well in practice. Typically, the collected database has a lot of non-mated
pairs but lacks a sufficient number of mated paired samples. Further, the collection of two finger-
print impressions comprising a sample mated pair should be separated by a sufficient time period.
Different applications, depending on whether the subjects are cooperative, and habituated, whether
the target population is benevolent or subversive, may require a completely different sample set.
Finally, the system may have to be tuned to peculiarities of the sample data without overtuning
it to arrive at optimistic error rate estimates. Techniques such as data sequestering [63] may be
necessary to avoid overtuning the system.
In principle, we can use the false (impostor) acceptance rate (FAR), the false (genuine indi-
vidual) reject rate (FRR) and the equal error rate (EER)11 to indicate the identification accuracy of
11Equal error rate is defined as the value where FAR and FRR are equal.
54

a biometric system [64, 65]. In practice, these performance metrics can only be estimated from
empirical data and the estimates of the performance are dependent on the fingerprint database used
in the experiments. Therefore, they are meaningful only for a specific database in a specific test
environment. For example, the performance of a biometric system as claimed by its manufacturer
had a FRR of 0.3% and a FAR of 0.1%. An independent test by the Sandia National Lab. found
that the same system had a FRR of 25% with an unknown FAR [66]! In order to provide a more
reliable assessment of a biometric system, some more descriptive performance measures are neces-
sary. Receiver operating curve (ROC) is one such descriptive measure of performance (see Figure
21).
13 Conclusions and Future Prospects
Fingerprint-based personal identification is an important biometric technique with many current
and emerging applications. In this chapter, we provide an overview of the fingerprint-based per-
sonal identification. We outline some of the important issues involved in the design of fingerprint-
based identification systems and present algorithms for fingerprint feature extraction, enhance-
ment, matching, and classification. A brief summary of the performance of these algorithms is
also provided. We have also included a discussion on issues related to fingerprint representation,
fingerprint identification system architecture, and performance evaluation.
Fingerprint-based identification has come a long way since its inception more than 100 years
back. The first primitive scanners designed by Cornell Aeronautical Lab/North American Aviation
Inc. were unwieldy beasts with many problems as compared to sleek, inexpensive and relatively,
miniscule semiconductor sensors. Over the past few decades, research and active use of fingerprint
55

matching and indexing have also advanced our understanding of individuality information in fin-
gerprints and efficient ways of processing this information. Increasingly inexpensive computing
power, cheap fingerprint sensors, demand for security/efficiency/convenience have lead to viabil-
ity of fingerprint matching information for every day positive person identification in the last few
years.
There is a popular misconception that automatic fingerprint matching is a fully solved problem
since it was one of the first applications of automatic pattern recognition. Despite notions to the
contrary, there are a number of challenges that remain to be overcome in designing a completely
automatic and reliable fingerprint matcher, especially when images are of poor quality and in the
case of latent prints. Although automatic systems are successful, the level of sophistication of
automatic systems in matching fingerprints today cannot rival that of a dedicated, well-trained, fin-
gerprint expert. Still, automatic fingerprint matching systems offer a reliable, rapid, consistent and
cost effective solution in a number of traditional and newly emerging applications. Performance of
various stages of an identification system, including feature extraction, classification, and minutiae
matching, do not degrade gracefully with a deterioration in the quality of the fingerprints. Most
of these deficiencies in the existing automatic identification systems are overcome by having an
expert interact with the system to compensate for the intermediate errors. As mentioned earlier,
significant research appears to be necessary to enable us to develop feature extraction systems
which can reliably and consistently extract a diverse set of features that provide rich information
comparable to those commonly used by the fingerprint experts.
In most pattern recognition applications (e.g., OCR), the best-performing commercial systems
use a combination of matchers, matching strategies, and representations. There is limited work
in combining multiple fingerprint matchers [67, 68]; more research/evaluation of such techniques
56
is needed. The proprietary set of features used by the system vendors and lack of a meaning-
ful information exchange standard makes it difficult, if not impossible, for the law enforcement
agencies to leverage the complementary strengths of different commercial systems. Multi-modal
(e.g., multiple biometrics) systems provably deliver better performance than any single constituent
biometrics [69]. Lack of standardization also poses challenges in integrating different biometrics
(e.g., face and finger [70], finger and speech [71]) in the context of forensic identification systems.
On a more speculative note, perhaps, using human intuition-based manual fingerprint iden-
tification system may not be the most appropriate basis for the design of automatic fingerprint
identification systems; there may be a need for exploring radically different features [40, 52] rich
in discriminatory information, methods of fingerprint matching [51], and more ingenious methods
for combining fingerprint matching and classification that are amenable to automation.
Only a few years back, it seemed as though, the interest in fingerprint matching research was
waning. As mentioned earlier, due to increasing identity fraud in our society, there is a grow-
ing need for positive person identification. Cheap fingerprint sensor prices, easy availability of
inexpensive computing power, and our (relatively better) understanding of individuality informa-
tion in fingerprints (compared to other biometrics) have attracted a lot of commercial interest in
fingerprint-based personal identification. Consequently, dozens of fingerprint identification ven-
dors have mushroomed in the last few years. Pervasive embedded applications of fingerprint-based
identification (e.g., in a smart card or in a cell phone) may not be far behind. We strongly believe
that higher visibility of (and liability from) performance limitations of commercial fingerprint iden-
tification applications would fuel a much stronger research interest in some of the most difficult
research problems in fingerprint based identification. Some of these difficult problems will entail
solving not only the hard core pattern recognition challenges but also confronting very challenging
57
system engineering issues related to security and privacy.
Acknowledgments
We are grateful to Prof. Jay Siegel, Dept. of Criminal Justice, Michigan State University for his
detailed comments and editorial suggestions. Thanks also to Chris Brislawn, Los Alamos National
Lab., for sharing WSQ related illustrations (Fig. 3). We appreciate the help of Lin Hong, Salil
Prabhakar, Arun Ross, and Dan Gutchess in preparing this manuscript.
References
[1] H. T. F. Rhodes. Alphonse Bertillon: Father of Scientific Detection. Abelard-Schuman, New
York, 1956.
[2] Federal Bureau of Investigation. The Science of Fingerprints: Classification and Uses. U.S.
Government Printing Office, Washington, D. C., 1984.
[3] A. Jain, R. Bolle, and S. Pankanti. Biometrics: Personal Identification in Networked Society.
Kluwer, New York, December 1999.
[4] Sharon Collins. CNN Quick Poll, Trading PINS for body parts, August. 18.
http://www.cnn.com/2000/TECH/computing/08/18/biometrics/index.html, 2000.
[5] B. Schneier. Inside risks: the uses and abuses of biometrics. Comm. ACM, 42(8):136, Aug
1999.
58

[6] J. D. Woodward. Biometrics: Privacy’s foe or privacy’s friend? Proceedings of the IEEE
(Special Issue on Automated Biometrics), 85(9):1480–1492, September 1997.
[7] J. L. Wayman. Federal biometric technology legislation. Special issue on Biometrics, IEEE
Computer Magazine, 33(2):76–80, Feb 2000.
[8] A. K. Jain, L. Hong, and S. Pankanti. Biometric identification. Comm. ACM, pages 91–98,
Feb 2000.
[9] A. Jain, L. Hong, S. Pankanti, and R. Bolle. On-line identity-authentication system using
fingerprints. Proceedings of IEEE (Special Issue on Automated Biometrics), 85(9):1365–
1388, September 1997.
[10] Lin Hong. Automatic Personal Identification Using Fingerprints. PhD thesis, 1998.
[11] C. M. Brislawn. WSQ FAQ homepage. ftp://wwwc3.lanl.gov/pub/misc/WSQ/FBI WSQ FAQ.
[12] Michael M. S. Chong, Robert K. L. Gay, H. N. Tan, and J. Liu. Automatic representation of
fingerprints for data compression by B- Spline functions. Pattern Recognition, 25(10):1199–
1210, October 1992.
[13] JPEG Committee. JPEG Homepage. http://www.jpeg.org/public/jpeghomepage.htm.
[14] C. M. Brislawn. The FBI Fingerprint Image Compression Standard.
http://www.c3.lanl.gov/ brislawn/FBI/FBI.html.
[15] A. K. Jain and S. Pankanti. Fingerprint classification and matching. In A. Bovik, editor,
Handbook for Image and Video Processing. Academic Press, April 2000.
59

[16] A. Moenssens. Fingerprint Techniques. Chilton Book Company, London, 1971.
[17] American National Standard for Information Systems. Data Format for the Interchange of
Fingerprint Information, Doc#ANSI/NIST-CSL 1-1993, Appendices F and G. American Na-
tional Standards Institute, New York, 1993.
[18] Melissa Hartman. Compact fingerprint scanner techniques. In Proceedings of Biometric
Consortium Ninth Meeting, June 11-12, San Jose, California, 1996.
[19] M. Hase and A. Shimisu. Entry method of fingerprint image using a prism. Trans. Inst.
Electron. Commun. Eng. Japan, J67-D:627–628, 1984.
[20] F. Karen. Encryption, smart cards, and fingerprint readers. IEEE Spectrum, 26(8):22, 1989.
[21] John Schneider. Improved image quality of live scan fingerprint scanners using acoustic
backscatter measurements. In Proceedings of Biometric Consortium Ninth Meeting, June
11-12, San Jose, California, 1996.
[22] Ultra-Scan. Ultra-Scan Homepage. http://www.ultra-scan.com/, 2000.
[23] W. Bicz, D. Banasiak, P. Bruciak, Z. Gumienny, S. Gumulinski, D. Kosz, A. Krysiak,
W. Kuczynski, M. Pluta, and G. Rabiej. Fingerprint structure imaging based on an ultra-
sound camera. http://www.optel.com.pl/article/english/article.htm, 2000.
[24] Edge Lit Hologram for Live-scan Fingerprinting. http://www.ImEdge.com/, 1997.
[25] Y. Fumio, I. Seigo, and E. Shin. Real-time fingerprint sensor using a hologram. Applied
Optics, 31(11):1794, 1992.
60

[26] I. Seigo, E. Shin, and S. Takashi. Holographic fingerprint sensor. Fujitsu Scientific & Tech-
nical Journal, 25(4):287, 1989.
[27] James Klett. Thermal imaging fingerprint technology. In Proceedings of Biometric Consor-
tium Ninth Meeting, April 8–9, Crystal City, Virginia, 1997.
[28] Thomson CSF. Thomson CSF Homepage. http://www.tcs.thomson-
csf.com/Us/standard/finger.htm, 1998.
[29] N. D. Young, G. Harkin, R. M. Bunn, D. J. McCulloch, R. W. Wilks, and A. G. Knapp.
Novel fingerprint scanning arrays using polysilicon tft’s on glass and polymer substrates.
IEEE Electron Device Letters, 18(1):19–20, Jan 1997.
[30] Karl McCalley, Dale Setlak, Steve Wilson, and John Schmitt. A direct fingerprint reader.
In Proceedings of CardTech SecurTech, Volume I: Technology, May 13–16, pages 271–279,
Atlanta, Georgia, 1996.
[31] Harris Semiconductor. Harris Semiconductor Homepage.
http://www.semi.harris.com/fngrloc/index.htm, 1998.
[32] Veridicom. Veridicom Homepage. http://www.veridicom.com/.
[33] Biometric Partners. Biometric Partners Homepage. http://www.biometricpartners.com/,
2000.
[34] F. R. Livingstone, L. King, J.-A. Beraldin, and M. Rioux. Development of a real-time laser
scanning system for object recognition, inspection, and robot control. In Proceedings of SPIE
61

on Telemanipulator Technology and Space Telerobotics, Volume 2057, 7–9 September, pages
454–461, Boston, Massachusetts, 1993.
[35] Digital Biometrics. Digital Biometrics Homepage. http://www.digitalbiometrics.com/.
[36] Sagem Morpho. Sagem Morpho Homepage. http://www.morpho.com.
[37] A. Roddy and J. Stosz. Fingerprint features – statistical analysis and system performance
estimates. Proceedings of IEEE, 85(9):1390–1421, 1997.
[38] Siemens. The ID Mouse from Siemens. http://www.fingertip.de/.
[39] Criminal Justice Information Services. Interim IAFIS image quality specifications for scan-
ners. www.engr.sjsu.edu/biometrics/publications appendixg.html.
[40] A. K. Jain, S. Prabhakar, L. Hong, and S. Pankanti. Filterbank-based fingerprint matching.
IEEE Trans. Image Processing, 9(5):846–859, May 2000.
[41] Access Control Applications using Optical Computing. http://www.mytec.com/, 1997.
[42] American National Standard for Information Systems. Data format for the interchange of
fingerprint information, doc#ansi/nist-csl 1-1993. 1993.
[43] Edward German. Problem Idents. http://onin.com/fp/problemidents.html.
[44] R. M. Bolle, S. Pankanti, and Y-S. Yao. System and method for determining the quality of
fingerprint images. U. S. Patent No. 5,963,656, 1999.
[45] R. M. Bolle, S. E. Colville, and S. Pankanti. System and method for determining ridge counts
in fingerprint image processing. U.S. Patent No. 6,111,978, 2000.
62

[46] M. Kawagoe and A. Tojo. Fingerprint pattern classification. Pattern Recognition, 17(3):295–
303, 1984.
[47] B. M. Mehtre and B. Chatterjee. Segmentation of fingerprint images – a composite method.
Pattern Recognition, 22(4):381–385, 1989.
[48] S. Chen N. Ratha, K. Karu and A. K. Jain. A real-time matching system for large fingerprint
database. IEEE Trans. Pattern Anal. and Machine Intell., 18(8):799–813, 1996.
[49] T. Pavlidis. Algorithms for Graphics and Image Processing. Computer Science Press, 1982.
[50] G. T. Candela, P. J. Grother, C. I. Watson, R. A. Wilkinson, and C. L. Wilson. PCASYS: A
Pattern-Level Classification Automation System for Fingerprints. NIST Tech. Report NISTIR
5647, August 1995.
[51] R. Germain, A Califano, , and S. Colville. Fingerprint matching using transformation param-
eter clustering. IEEE Computational Science and Engineering, 4(4):42–49, 1997.
[52] A. K. Jain, S. Prabhakar, and L. Hong. A multichannel approach to fingerprint classification.
IEEE Trans. Pattern Anal. and Machine Intell., 21(4):348–359, April 1999.
[53] M. Sparrow and P. Sparrow. A Topological Approach to The Matching of Single Fingerprints:
Development of Algorithms for Use on Latent Fingermarks. U.S.A. Government Publication.
Gaithersburg, MD: U.S. Dept. of Commerce, National Bureau of Standards, Washington,
D.C., 1985.
[54] J. H. Wegstein. An automated fingerprint identification system. Technical Report 500-89,
National Bureau of Standards, 1982.
63

[55] L. O’Gorman and J. V. Nickerson. An approach to fingerprint filter design. Pattern Recogni-
tion, 22(1):29–38, 1989.
[56] T. Kamei and M. Mizoguchi. Image filter design for fingerprint enhancement. In Proc. ISCV’
95, pages 109–114, Coral Gables, FL, 1995.
[57] D. C. Huang. Enhancement and feature purification of fingerprint images. Pattern Recogni-
tion, 26(11):1661–1671, 1993.
[58] Louis Coetzee and Elizabeth Botha. Fingerprint recognition in low quality images. Pattern
Recognition, 26(10):1441–1460, 1993.
[59] L. Hong, A. K. Jain, S. Pankanti, and R. Bolle. Fingerprint enhancement. In Proc. 1st IEEE
WACV, pages 202–207, Sarasota, FL, 1996.
[60] A. K. Jain and F. Farrokhnia. Unsupervised texture segmentation using Gabor filters. Pattern
Recognition, 24:1167–1186, 1991.
[61] J. L. Wayman. Fundamentals of Biometric Technology.
www.engr.sjsu.edu/biometrics/publications.html.
[62] UK Govt. Biometrics Working Group. Best Practices in Testing and Reporting Biometric
Device Performance, version 1.0. http://www.afb.org.uk/bwg/bestprac10.pdf, March 2000.
[63] P. J. Phillips, H. Moon, S. A. Rizvi, and P. J. Rauss. The FERET evaluation methodology for
face recognition algorithms. IEEE Trans. on Pattern Anal. Mach. Intell., 22(10):1090–1104,
2000.
64

[64] J. G. Daugman. High confidence visual recognition of persons by a test of statistical indepen-
dence. IEEE Transactions on Pattern Analysis and Machine Intelligence, 15(11):1148–1161,
1993.
[65] J. G. Daugman and G. O. Williams. A proposed standard for biometric decidability. In Proc.
CardTech/SecureTech Conference, pages 223–234, Atlanta, GA, 1996.
[66] J. Campbell Jr., L. Alyea, and J. Dunn. Biometric security: Government applications and
operations. http://www.biometrics.org/REPORTS/CTSTG96/index.html, 1996.
[67] A. K. Jain, S. Prabhakar, and S. Chen. Combining multiple matchers for a high security
fingerprint verification system. Pattern Recognition Letters, 20(11-13):1371–1379, 1999.
[68] S. Prabhakar and Anil K. Jain. Decision-level fusion in biometric verification. submitted to
IEEE Trans. Patt. Anal. and Machine Intell., 2000.
[69] Lin Hong, Anil Jain, and Sharath Pankanti. Can multibiometrics improve performance? In
Proceedings AutoID’99, pages 59–64, Summit, NJ, October 1999.
[70] L. Hong and A. Jain. Integrating faces and fingerprints. IEEE Trans. Pattern Anal. and
Machine Intell., 20(12):1295–1307, December 1998.
[71] A.K. Jain, L.Hong, and Y. Kulkarni. A multimodal biometric system using fingerprints, face
and speech. In Proc. of 2nd Int’l Conference on Audio- and Video-based Biometric Person
Authentication, pages 182–187, Washington D.C., March 22-24, 1999.
65


![Resource-Efficient Hardware Implementation of a Neural ...isyou.info/jowua/papers/jowua-v8n4-2.pdf · ware Automated Fingerprint Identification Systems (AFISes) [15][16][17]. Essentially,](https://static.fdocuments.in/doc/165x107/6023a7bed9ad9f2f86778a39/resource-eficient-hardware-implementation-of-a-neural-isyouinfojowuapapersjowua-v8n4-2pdf.jpg)