
Fingerprint Entropy and Identification Capacity …...Fingerprint Entropy and Identification...
11
General rights Copyright and moral rights for the publications made accessible in the public portal are retained by the authors and/or other copyright owners and it is a condition of accessing publications that users recognise and abide by the legal requirements associated with these rights. Users may download and print one copy of any publication from the public portal for the purpose of private study or research. You may not further distribute the material or use it for any profit-making activity or commercial gain You may freely distribute the URL identifying the publication in the public portal If you believe that this document breaches copyright please contact us providing details, and we will remove access to the work immediately and investigate your claim. Downloaded from orbit.dtu.dk on: May 09, 2020 Fingerprint Entropy and Identification Capacity Estimation Based on Pixel-level Generative Modelling Yankov, Metodi Plamenov; Olsen, Martin A.; Stegmann, Mikkel Bille; Christensen, Søren Sk; Forchhammer, Søren Published in: IEEE Transactions on Information Forensics and Security Link to article, DOI: 10.1109/TIFS.2019.2916406 Publication date: 2020 Document Version Peer reviewed version Link back to DTU Orbit Citation (APA): Yankov, M. P., Olsen, M. A., Stegmann, M. B., Christensen, S. S., & Forchhammer, S. (2020). Fingerprint Entropy and Identification Capacity Estimation Based on Pixel-level Generative Modelling. IEEE Transactions on Information Forensics and Security, 15, 56-65. https://doi.org/10.1109/TIFS.2019.2916406
Transcript of Fingerprint Entropy and Identification Capacity …...Fingerprint Entropy and Identification...

General rights Copyright and moral rights for the publications made accessible in the public portal are retained by the authors and/or other copyright owners and it is a condition of accessing publications that users recognise and abide by the legal requirements associated with these rights.
Users may download and print one copy of any publication from the public portal for the purpose of private study or research.
You may not further distribute the material or use it for any profit-making activity or commercial gain
You may freely distribute the URL identifying the publication in the public portal If you believe that this document breaches copyright please contact us providing details, and we will remove access to the work immediately and investigate your claim.
Downloaded from orbit.dtu.dk on: May 09, 2020
Fingerprint Entropy and Identification Capacity Estimation Based on Pixel-levelGenerative Modelling
Yankov, Metodi Plamenov; Olsen, Martin A.; Stegmann, Mikkel Bille; Christensen, Søren Sk;Forchhammer, SørenPublished in:IEEE Transactions on Information Forensics and Security
Link to article, DOI:10.1109/TIFS.2019.2916406
Publication date:2020
Document VersionPeer reviewed version
Link back to DTU Orbit
Citation (APA):Yankov, M. P., Olsen, M. A., Stegmann, M. B., Christensen, S. S., & Forchhammer, S. (2020). FingerprintEntropy and Identification Capacity Estimation Based on Pixel-level Generative Modelling. IEEE Transactions onInformation Forensics and Security, 15, 56-65. https://doi.org/10.1109/TIFS.2019.2916406

1556-6013 (c) 2019 IEEE. Personal use is permitted, but republication/redistribution requires IEEE permission. See http://www.ieee.org/publications_standards/publications/rights/index.html for more information.
This article has been accepted for publication in a future issue of this journal, but has not been fully edited. Content may change prior to final publication. Citation information: DOI 10.1109/TIFS.2019.2916406, IEEETransactions on Information Forensics and Security
JOURNAL OF LATEX CLASS FILES, VOL. 14, NO. 8, AUGUST 2015 1
Fingerprint Entropy and Identification CapacityEstimation Based on Pixel-level Generative
ModellingMetodi P. Yankov, Member, IEEE, Martin A. Olsen, Mikkel B. Stegmann, Søren Sk. Christensen,
and Søren Forchhammer, Member, IEEE
Abstract—A family of texture-based generative models forfingerprint images is proposed. The generative models are usedto estimate upper bounds on the image entropy for systemswith small sensor acquisition. The identification capacity of suchsystems is then estimated using the mutual information betweendifferent samples from the same finger. Similar to the generativemodel for entropy estimation, pixel-level model families areproposed for estimating similarity between fingerprint imageswith a given global affine transformation. These models areused for mutual information estimation, and are also adopted tocompensate for local deformations between samples. Finally, it isshown that sensor sizes as small as 52x52 pixels are potentiallysufficient to discriminate populations as large as the entire worldpopulation that ever lived, given that a complexity-unconstrainedrecognition algorithm is available which operates on the lowestpossible pixel level.
Index Terms—Fingerprint recognition, biometric identification,biometric capacity, biometric entropy, generative modelling
I. INTRODUCTION
F INGERPRINT recognition is one of the more popularmethods for biometric recognition due to its excellent
performance combined with high security levels. The low costof fingerprint sensors allows them to be integrated in evergreater portion of devices that require and/or can be used forrecognition, such as mobile phones, personal computers andsmart cards. In order to keep the cost down and allow higherintegration, small sensors are attractive to vendors. However,such sensors pose a challenge for standard fingerprint recog-nition systems [1].
Fingerprints are historically and typically described byridge endings and bifurcations, also known as minutiae. Forfull-print size sensors, minutiae-based fingerprint recognitionis now well-established. In such cases, the individuality offingerprints can be estimated from e.g. the probability ofoccurrence (PoO) of a minutiae configuration in the world[2], [3], extracted by statistical modelling. The number ofpossible configurations on the other hand can be related tothe pattern rate in the pattern recognition field [4]. Since the
Metodi P. Yankov is with Fingerprint Cards A/S, 2730 Herlev,Denmark, and with the Department of Photonics Engineering, Tech-nical University of Denmark, 2800 Kgs. Lyngby, Denmark, e-mail:([email protected], [email protected]).
Martin A. Olsen, Søren Sk. Christensen and Mikkel B. Stegmann are withFingerprint Cards A/S, 2730 Herlev, Denmark.
Søren Forchhammer is with the Department of Photonics Engineering,Technical University of Denmark, 2800 Kgs. Lyngby, Denmark.
Manuscript received XXX; revised XXX.
pattern rate does not capture intra-class variability (such asnoise and skin warping and distortion during acquisition), theprobability of random correspondence (PRC) was introducedto measure individuality [2], [5]. The PRC measures howlikely it is to classify two random samples to the samefinger, rather than the likelihood that a sample appears inthe world. A good overview of the attempts at estimatingfingerprint individuality is provided in [6], [5], most of whichrely on said minutiae configurations. However, most of thesemethods cannot be tailored to small fingerprint samples due toinsufficient number of minutiae present in the sample [6]. Theindividuality estimates with such methods is in small-sensorcases grossly underestimated and does not reflect the identi-fication capabilities of algorithms, which are not constrainedto minutiae matching. In some recent works, the security ofsmall-sensor minutiae-based fingerprint recognition systems iseven challenged based on similar arguments [7].
It is already known that a large amount of discriminatoryinformation is present in the level 3 features, such as pores andridge contours [6, Ch. 4]. Pore distributions can be exploitedfor improved PRC estimates [8] and also improved small-sensor performance [9]. To the best of our knowledge, theindividuality of fingerprint samples when estimated on thelowest level of detail (the pixel level) is presently unknown.Such estimates are of great interest to fingerprint sensor designsince they pose an ultimate limit on the sensor size for a givenbiometric performance.
In this paper, mutual information (MI) and entropy esti-mation for binarized fingerprint images is considered witha focus on small sensor acquisition systems. The entropyprovides a lower bound on the length of a code, which canbe used to uniquely describe the space of fingerprint images,acquired with that system. The entropy is thus one estimateof fingerprint individuality. Entropy can also be used as aquality metric for fingerprints [10]. Pixel-level entropy is thusof general interest also to practical fingerprint systems. Onthe other hand, MI is a more suited metric for identificationcapacity estimation since it takes into account the intra-fingerimage variation due to non-ideal acquisition conditions. Thenotion of biometric information has been used in a similarmanner for face recognition when feature representation isapplied [11]. To our knowledge, there are no published studieson the pixel-level MI for fingerprints.
This paper is organized as follows. In Section II, thebasic foundations of entropy and MI estimation is given,

1556-6013 (c) 2019 IEEE. Personal use is permitted, but republication/redistribution requires IEEE permission. See http://www.ieee.org/publications_standards/publications/rights/index.html for more information.
This article has been accepted for publication in a future issue of this journal, but has not been fully edited. Content may change prior to final publication. Citation information: DOI 10.1109/TIFS.2019.2916406, IEEETransactions on Information Forensics and Security
JOURNAL OF LATEX CLASS FILES, VOL. 14, NO. 8, AUGUST 2015 2
together with the system model under consideration. Theentropy bounds rely on texture-based generative modelling,which is introduced in Section III. Models are then proposedin Section IV for MI and thereby fingerprint identificationsystem capacity estimation. In Section V, some bounds andestimates of the entropy and MI are provided for differentfingerprint sensor configurations and databases. In Section VI,the implications of the estimates are discussed, and Section VIIconcludes the work.
II. SYSTEM MODEL AND INFORMATION THEORY
The system under investigation is depicted in Fig. 1. Duringenrolment, the biometric source S (in this paper a fingerprint)is captured by an acquisition system, digitized and further pro-cessed (e.g. filtered, enhanced, binarized, etc.) into the imageX . The acquisition system can be represented by a probabilitydistribution pX|S , which includes noise, imperfections, and allthe above processing. Usually, feature extraction is performedin order to reduce the dimensionality of the recognition task,storage requirements and processing complexity of the system,as well as to increase the robustness to noise and intra-fingervariations due to skin deformation. The features of interestmay be further processed and stored in memory. The storeddata related to one identity is that identity’s template. Duringrecognition, the biometric source is acquired by a potentiallydifferent system (although for simplicity, in this paper theacquisition system is assumed the same during enrolment andverification) into the image Y , its features are extracted andcompared to the feature set in the memory. When runningin identification mode, the recognition system classifies theprobe to one of the templates in the memory, while inverification mode, the system produces a binary decision oftype accept/reject.
Feature extraction is not a strict requirement. In fact, featureextraction can be viewed as processing, which inevitablyreduces the information content [12, Ch. 2.8] of the template,and thus degrades the theoretical recognition performancebounds. In this paper, information content of fingerprint imagedata is extracted.
A. Notation
Variables are denoted with capital letters, e.g. X . Realiza-tions of variable with small letters, e.g. x for scalars and x forvectors (matrices), xk being the k−th element in a sequence ofoutcomes, and x(i, j) being the element on the i−th row andj−th column of the matrix. The probability of the outcome xis p(x). A set of elements (pixels) around the (i, j)-th pixel isdenoted as C, is also referred to as context, and the elementsof the matrix on those pixels with x(C). Other notations aredefined on occurrence. Acronyms are defined on occurrenceand are also given in the Appendinx, together with the mainvariables.
B. Entropy Estimation
The entropy H(X) of a random variable X is defined asthe expectation of − log of its probability density function, or
Source 𝑆Acquisition
system𝑝𝑋|𝑆 𝑋 𝑆
Storage 𝐹𝑋
Acquisition system
𝑝𝑌|𝑆 𝑌 𝑆
Feature extraction𝑝𝐹|𝑋 𝐹𝑌 𝑌
Recognition score 𝑓 𝐹𝑋, 𝐹𝑌
Feature extraction𝑝𝐹|𝑋 𝐹𝑋 𝑋
Enrolment𝑋
𝑌
Fig. 1. Biometric recognition system model.
probability mass function (PMF) PX for discrete variables. Inthe latter case
H(X) = −∑
x∈supp(X)
p(x) log2 p(x), (1)
where p(x) = PX(X = x) for shorter notation and the entropyis measured in bits when the base of the logarithm is two.When X is the digitized biometric signal (as in Fig. 1), itsentropy describes the pattern rate [4] for that biometric modal-ity. In identification mode, the achievable rate R with whichindividuals can be discriminated with vanishing probability oferror [13] (or equivalently, the maximum supported number ofindividuals 2R) will be upper-bounded by the entropy as
R ≤ C ≤ H(X), (2)
where C is the system capacity (defined below in (6)). Thesecond inequality stems from the fact that the acquisitionand processing systems are generally noisy. This differenceis qualitatively similar to the difference between individualityestimated based on PRC and based on PoO of a fingerprintconfiguration, as described in the introduction. The first in-equality stems from the fact that operating at capacity entailsideal recognition system. More details are given in the rest ofthis section. In this paper, X is an mxn dimensional digitizedsample of the fingerprint S with a given resolution takingvalues in a discrete alphabet Xm·n (X is the finite alphabet ofeach pixel, which can be e.g. binary or 8-bit depending on thequantization). When (1) cannot be solved in closed form, theentropy can be estimated from a long sequence of samples as
H(X) = limK→∞
− 1
K
K∑k=1
log2 p(xk), (3)
where xk is the k−th image in the set of K images, andthe convergence to the true entropy is with probability 1 (cf.[14, Example 3] for application of (3) to telecommunicationsand references therein for applications to entropy in general).Furthermore, when the PMF is not available in closed form,the entropy can be upper-bounded by calculating (3) fromthe true samples xK
1 , but replacing PX(X) with an auxiliarydistribution QX(X) [14]
H(X) ≤ H(X) = limK→∞
− 1
K
K∑k=1
log2 q(xk), (4)
where the closer QX is to PX , the tighter the bound, withequality iff QX(X = x) = q(x) = p(x) for all x ∈supp(X). The auxiliary distribution QX can also be referredto as a generative model.

1556-6013 (c) 2019 IEEE. Personal use is permitted, but republication/redistribution requires IEEE permission. See http://www.ieee.org/publications_standards/publications/rights/index.html for more information.
This article has been accepted for publication in a future issue of this journal, but has not been fully edited. Content may change prior to final publication. Citation information: DOI 10.1109/TIFS.2019.2916406, IEEETransactions on Information Forensics and Security
JOURNAL OF LATEX CLASS FILES, VOL. 14, NO. 8, AUGUST 2015 3
Examples of closed-form generative models for e.g. minu-tiae and pores are the above-mentioned [2] and [8], respec-tively, or the minutia model obtained with histograms [3]. Agenerative model for the ridge-flow can also be found in [15].In this paper, the focus is on pixel-level modelling, which asargued below, improves the system capacity. Another exampleof generative models for biometrics can be found in [16] forthe IrisCode, where a 1-st order Markov chain is used as anauxiliary generative model and for estimation of the IrisCodeentropy. When the auxiliary model is simple, its entropy canbe estimated in closed form from (1) (as also done in [16]and [3]). When the model is more sophisticated (as in the restof the paper), sequence based entropy estimation should beperformed (e.g. from (3)).
When the limit in (3) is approached with samples from thesame finger, the entropy describes the entropy of that fingerand is estimated based on the average PoO of its samples. Suchrepresentation is useful in terms of estimating uniqueness of agiven finger. On the other hand, when the limit is approachedwith samples from infinitely many fingers S, the entropyrepresents the average entropy for that biometric modality.The entropy can also be estimated based on a single image,in which case it is just equivalent to the PoO of that sample.
C. Entropy of images
A particularly popular generative model for images is thecausal pixel predictive model (PPM) [17], which attemptssimplifying the joint distribution q(x) into
q(x) =∏
(i,j)∈{1:m,1:n}
q(x(i, j)|x(C))
=∆∏
(i,j)∈{1:m,1:n}
q(x(i, j)|x(C(i, j))), (5)
where x(i, j) is the pixel at the i−th row and j−th column,C is the set of previously traversed pixels (also referred toas past), C(i, j) is a small subset around the pixel of interest(PoI) (i, j), also known as context, and x(C(i, j)) is the setof pixel values in the context. The first equality is simplythe product rule for probabilities, followed by dimensionalitytruncation. In the case of C ≡ C, q(x) = p(x). The PPMwe apply in this paper is exemplified in Fig. 2 for a 4Dcontext and a 12D context, for which (i, j) are traversed ina row-wise fashion, with the context only containing pixelsin the past. Notice that other configurations of the contextare possible, and this particular is chosen for consistency andeasier implementation of context with variable radius. Sinceq(x) is a valid distribution, the inequality in (4) still holds.
The entropy of images also describes their lossless com-pressability in that it lower-bounds the length of the code,which can be used to compress an image (or source in general)[12, Ch. 5.4].
D. Mutual Information Estimation
In [13], the system identification capacity from (2) is shownto be
C = I(X;Y ) = H(X)−H(X|Y ), (6)
12D
10 9 8 7 6
11 3 2 1 5
12 4
Future
Past
4D
3 2 1
4
Future
Past
Fig. 2. PPM and image traversing illustration.
where H(X|Y ) is the conditional entropy of X once Y isobserved, and I(X;Y ) is the MI between X and Y . In thiscontext, the MI describes how much of the information in Xis also present in Y . The conditional entropy H(X|Y ) can beviewed as a measure of similarity between images, whereasH(X) represents the total amount of information (includingnoise), present in X . As mentioned, when estimated for asingle image,H(X) is directly related to the image uniquenessthrough its PoO. Typically, recognition algorithms rely solelyon similarity, thus implicitly estimating H(X|Y ) and neglect-ing H(X). As seen from (6), theoretically both measuresare required for approaching the system capacity, and theirdifference should be maximized for maximizing that capacity.As H(X|Y ) is non-negative, the capacity (6) is ultimatelybounded by H(X). The MI representation of capacity can beunderstood with the following simple examples:f
1) Ideal acquisition system and fixed acquisition condi-tions. In this case, the variability between samples of thesame finger is zero, the images X , Y and S are identical,H(X|Y ) = 0 and the entire information content of Scan be used for biometric recognition, resulting in a highcapacity.
2) Completely noisy system. In this case, X and Y areindependent, H(X|Y ) = H(X) and R = C = 0.
3) Extremely robust system. In this case, zero (or small)variability can be achieved at the expense of sacrificing(e.g. by quantizing) most of the details of S. The result isidentical X and Y and thereby smallH(X|Y ). However,in such cases the entropy H(X), and thus capacity, isalso small.
Minutiae based recognition systems can be classified to amoderate example 3), since details in the image are sacri-ficed (not utilized), in order to exploit the robustness andrepeatability of the minutia configuration. Another exampleof a robust feature is the orientation map (OMAP). The MIbetween OMAPs of two images can be used for relativetransformation estimation [18], but a system, relying solelyon OMAP for recognition would be penalized by the lowentropy. Feature-based biometric information was estimatedfor face samples [11], where it is also used to estimate systemcapacity. As mentioned, feature-based MIs do not fully exploitthe information content available at the pixel-level, but can beutilized to improve the pixel-level modelling, as will be seenbelow.
Similar to H(X), H(X|Y ) can be estimated and bounded

1556-6013 (c) 2019 IEEE. Personal use is permitted, but republication/redistribution requires IEEE permission. See http://www.ieee.org/publications_standards/publications/rights/index.html for more information.
This article has been accepted for publication in a future issue of this journal, but has not been fully edited. Content may change prior to final publication. Citation information: DOI 10.1109/TIFS.2019.2916406, IEEETransactions on Information Forensics and Security
JOURNAL OF LATEX CLASS FILES, VOL. 14, NO. 8, AUGUST 2015 4
as
H(X|Y ) = limK→∞
− 1
K
K∑k=1
log2 p(xk|yk) (7)
≤ limK→∞
− 1
K
K∑k=1
log2 q(xk|yk), (8)
where p(x|y) = p(x,y)p(y) =
∑s∈S p(s)p(x|s)p(y|s)∑
s∈S p(s)p(y|s) [13] andQX|Y (X = xk|Y = yk) = q(xk|yk) is any valid distribution.In this paper, auxiliary distributions of the form
q(x|y) =∏
(i,j)∈{1:m,1:n}
q(x(i, j)|x(C),y)
=∆∏
(i,j)∈{1:m,1:n}
q(x(i, j)|x(C(i, j)),y(C(i, j))), (9)
are adopted, where the context C(i, j) is not necessarilyidentical to C(i, j) and can include any subset of y, includingfuture pixels.
The auxiliary distribution QX|Y will be referred to as achannel model, highlighting the similarities between biometricrecognition and communications technology. In the latter case,a source X is communicated through a channel pY |X , and themaximum error-free transmission rate is given by I(X;Y ).However, pX and pX|Y are typically available, and I(X;Y )for standard channels and sources is thus straight forwardto calculate. In biometrics, both distributions are typicallyunknown, and must be thus replaced by their auxiliary ver-sions. In this paper, the term channel is abstract (as no actualcommunication channel exists) and serves the purpose ofrepresenting the relation between the images X and Y .
An example is given in Fig. 3 for a 4D generative model(5) and a 13D channel model (9) contexts. For simplicity, theradii of both models in both images are assumed identical,which is also not a requirement.
In telecommunications, achieving the capacity entails usingan optimal and infinitely long error-correcting code. Similarly,as mentioned above, the entropy only provides a bound on thelength of the source code, which can be used to compress thesignal. The design of such error-correcting and source codes isby far a non-trivial task. In the case of biometrics in general,and fingerprints in particular, error-correcting and source codedesign can be related to the design of optimal feature vectors.Such feature vectors allow to extract the useful informationfrom the image in an efficient manner (source code), and atthe same time are encoded for maximum separability of theclasses (error-correcting code). Such design falls outside thescope of the present paper.
III. GENERATIVE MODELS
The first class of models we apply are the look-up table(LUT) models, for which the PMF q(x(i, j)|X(C) = x(C))is defined for each possible realization of the context. Thismodel is trained by traversing training images and buildinghistograms for each realization. The complexity of this modelgrows exponentially with the size of the context (since thenumber of realizations is |supp(X(C))| = |X ||C|). Such
Fig. 3. PPM with probe and reference for MI estimation with a 4D generativemodel and the respective (3 · 4 + 1)D channel model.
models are therefore typically limited to binary alphabets andsmall contexts (e.g. 10 pixels in the binary image compressionstandard JBIG [19] or up to 16 pixels in JBIG2 [20]).
A. Closed-form expression models
In order to extend the context and the pixel alphabet, closed-form expression models are required. In this work, two suchmodels are studied: a logistic regression (LR) linear model,and a neural network (NN), which operate in classificationmode and are able to produce log-likelihoods of each class[21]. The output classes in this case represent X . Both modelsare trained by traversing training images similar to the LUTmodel. The training data consist of input/output pairs of points,where the input points are the |C|−dimensional context of eachPoI in each training image, and the output is each said PoI.The LR model is trained using the LIBLINEAR optimizationlibraries [22]. Single layer NN configuration is studied in thiswork with a hidden layer size optimized to 50 units. Thestochastic gradient-based algorithm [21, Ch. 5] is used for NNtraining.
B. Including orientation map
The generative models can be improved by including thelocal ridge-flow OMAP in the context. This is equivalentto estimating the MI I(X;Y |O) instead, where O describesthe OMAP. It is noted that as mentioned above, the OMAPis a feature itself and carries discriminatory information,which can be used to improve the matching performance.Conditioning on the OMAP essentially provides estimates onthe performance of algorithms, which assume the OMAP isknown prior to matching, e.g. from estimation, and do notexploit it explicitly for decision making. In this paper, theOMAP is estimated with standard gradient-based methods [6,Ch. 3], and is assumed available when estimating the entropy(with alphabet spanning the integer range 1-180 degrees). It isnoted that generative models including the OMAP have doubledimensionality. We also note that the OMAP of all pixels in thecontext is not as necessary as texture information, and can bereplaced by e.g. the average OMAP of the context. However,for consistency, the local OMAP of all context pixels is usedin this work.

1556-6013 (c) 2019 IEEE. Personal use is permitted, but republication/redistribution requires IEEE permission. See http://www.ieee.org/publications_standards/publications/rights/index.html for more information.
This article has been accepted for publication in a future issue of this journal, but has not been fully edited. Content may change prior to final publication. Citation information: DOI 10.1109/TIFS.2019.2916406, IEEETransactions on Information Forensics and Security
JOURNAL OF LATEX CLASS FILES, VOL. 14, NO. 8, AUGUST 2015 5
IV. CHANNEL MODELS
The channel models as described in Section II exhibittexture dimensionality of three times the dimensionality of thegenerative model plus one pixel (see Fig. 3). Even for smallradii, LUT models are thus infeasible. For channel models,only the NN is applied in this paper, which also includes theorientation map of image X . It is assumed that the orientationof image Y is identical, or at least sufficiently similar to thatof image X to not bring additional information for genuinematches, and is thus not included in the model in order toreduce complexity.
Training and testing images X and Y are generated by run-ning a commercial recognition algorithm for genuine matchesas described below. The MI estimation process is summa-rized in Algorithm 1. The recognition algorithm determinesthe global transformation T between images and transforms(translates and rotates) the image Y = T (Y ) to match theimage X . A mask image M is then constructed for theoverlapping area (m(i, j) = 1 if the images overlap at thatpixel), and the pixels in those areas are used for training ofthe NN and for conditional entropy and MI estimation.
Examples of this process are given in Section V. Anexample of such an NN used as channel model is givenin Fig. 4. The generative model is identical, but of lowerdimensionality as it does not include the inputs y(C(i, j)).
V. RESULTS
A. Dataset description
An overview of the datasets used to study the identificationcapacity is given in Table I. The FVC databases are com-prised of 100 fingers, eight impressions each [6]. The MCYTdatabases [23], [24] contain 1000 fingers, 12 impressions each,but for consistency, only the first 100 fingers are used. Asargued below, they are sufficient to see convergence in theentropy and MI estimates. Each image from the datasets iscropped at a random location to a desired sensor size, ensuringthat the captured area does not contain empty spaces (conditionwas 99% active area). Crop sizes of 80x80, 120x120 and160x160 pixels are studied in this work. The training datasetis comprised of the first 50 fingers, and entropy estimation isperformed on the rest. Smaller crops are not studied since thisleads to insufficient training and testing dataset size.
A synthetic database generated with the SFinGe model isalso used [6, Ch. 6], [25]. Two types of images are generated:1) ridge-line pattern; 2) noisy and distorted realistic images. Itis noted that this database assumes that the only discriminatoryinformation in fingerprints is minutiae (pores are not gener-ated), and disregards texture information which as mentionedis in fact highly discriminatory. The noisy realistic imagesare generated with an average image quality distribution asdefined by SFinGe. Similar to the public data base, small-sensor images are produced by cropping full-size prints. Thetraining set in this case similarly comprises 400 images, with400 testing images.
For MI estimation, one image per finger is used as template(image X) and the rest (images Y ) are matched against itwith a commercial algorithm. Training and testing images are
Soft
-max
𝑞𝐱𝑖,𝑗|𝐱
መ 𝒞𝑖,𝑗
,𝐲ሶ
𝒞𝑖,𝑗
…
… 𝐱 𝑖, 𝑗……
𝒞in
pu
ts
𝐱መ 𝒞𝑖,𝑗
Pix
el
ori
enta
tio
n
𝒞in
pu
ts
𝐲ሶ
𝒞𝑖,𝑗
ሶ𝒞
inp
uts
∈ 1,2,… 180∈ 𝒳∈ 𝒳
Fig. 4. An example of an NN channel model for the auxiliary distributionq(x|y).
TABLE ISUMMARY OF THE DATABASES USED IN THIS WORK.
Acquisitiontechnology
Array size,pixels
Resolution,dpi
FVC-2002-DB1-A Optical 388x374 500FVC-2002-DB2-A Optical 296x560 569FVC-2002-DB3-A Capacitive 300x300 500FVC-2004-DB1-A Optical 640x480 500FVC-2004-DB2-A Optical 328x364 500FVC-2004-DB3-A Thermal 300x480 512
MCYT optical Optical 256x400 500MCYT capacitive Capacitive 300x300 500
SFinGe Synthetic 416x560 500
then generated as described in Section IV. It is noted that therandom cropping sometimes results in insufficient overlap forour algorithm to correctly match the probe to the reference. Inorder to mitigate this, only images of size 160x160 are used forconditional entropy and MI estimation. However, the trainingand testing datasets in this case are still somewhat smaller thanfor the entropy estimation, since the entire images are not used,but only the areas, where the image X overlaps with imageY .
In all cases, the training size is more than 2.5 · 106 pixels,and testing size is more than 1.5 · 106 pixels.
B. Entropy estimates for small sensors
In Fig. 5, the entropy estimates for the FVC-2002-DB3-Adatabase are shown as a function of the context size for the80x80 cropped samples. The studied sizes of 4, 12, 24, 40, 84and 112 correspond to context radii of 1, 2, 3, 4, 5 and 6 pixels(see Fig. 2). The LUT model is limited by its complexity to12 pixels, whereas the closed-form expression models (fromSection III-A) were possible to simulate on a standard PCfor up to 112 pixels, including the double dimensionalityOMAP case. In order to reduce the number of possible contextconfigurations for the LUT case, the rather small images ofsize 80x80 are first rotated s.t. the average OMAP of theentire image is zero. We found that this significantly tightensthe entropy bounds for the LUT model. For the small-contextsize, the LUT is slightly better than the closed form models,

1556-6013 (c) 2019 IEEE. Personal use is permitted, but republication/redistribution requires IEEE permission. See http://www.ieee.org/publications_standards/publications/rights/index.html for more information.
This article has been accepted for publication in a future issue of this journal, but has not been fully edited. Content may change prior to final publication. Citation information: DOI 10.1109/TIFS.2019.2916406, IEEETransactions on Information Forensics and Security
JOURNAL OF LATEX CLASS FILES, VOL. 14, NO. 8, AUGUST 2015 6
Algorithm 1 Algorithm for estimation of MI between two fingerprint images.Require: Images X , Y
1: Find transform and mask [T,m] = match(X,Y ) . ’match’ is the recognition algorithm of choice2: Transform Y = T (Y )3: Extract OMAP o . Orientation of image X4: H(X) = 0,H(X|Y ) = 0, I(X;Y ) = 0, Npixels = 05: for i = 1 : Nrows do . Traverse rows6: for j = 1 : Ncols do . Traverse columns7: if m(i, j) then8: Extract contexts (NN inputs) x(C(i, j)), o(C(i, j)) and y(C(i, j))9: if Training mode then
10: Store NN inputs and NN output x(i, j) for NN training11: else if Estimation mode then12: Estimate PoO q(x(i, j)|x(C(i, j)),o(C(i, j))) . Generative model13: Estimate PoO q(x(i, j)|x(C(i, j)),y(C(i, j)),o(C(i, j))) . Channel model, Fig. 414: H(X) = H(X)− log2 q(x(i, j)|x(C(i, j)))15: H(X|Y ) = H(X|Y )− log2 q(x(i, j)|x(C(i, j)),y(C(i, j)))16: Npixels = Npixels + 117: end if18: end if19: end for20: end for21: H(X) = H(X)/Npixels, H(X|Y ) = H(X|Y )/Npixels . Normalize22: I(X;Y ) = H(X)−H(X|Y )
which can be expected as the histogram can be made veryaccurate with the amount of training data available (makingQX a better approximation of PX ). When the dimensionalityis increased, both the NN and LR models improve the tightnessof their bounds, reaching a saturation at around 60 pixelcontexts. When the OMAP is included in the model, the LR-based bound does not improve, while the NN is able to tapinto this fingerprint domain property and model the imagesbetter. An optimal value of 40 pixels is found, leading tomodel dimensionality of 80. The corresponding diameter ofthe context is 9 pixels, which at 500 dpi is sufficient tocapture a ridge-valley period [6, Sec. 6.4.3]. The NN thuscan conceivably model the ridge-valley frequency as a macro-feature. When the context size is increased, the NN-basedentropy bound becomes unstable. This can be attributed toestimation errors and overfitting of the very complex model tothe limited amount of training data. The lowest upper boundwe could find for this dataset is ≈ 0.3552 bits/pixel. For asensor size of 80x80 this means an average entropy of 2273bits/sample.
For the rest of the paper, the context size in the generativemodel is set to 40 pixels (radius of four pixels), the orientationmap is included and the NN model is used.
In Fig. 6, the histogram of the finger entropy estimateswith bin size of 0.05 bits is studied (the set of K imagesin (3) includes only the eight images of the same finger).As mentioned, the inter-finger variation can be interpreted asvariable degree of uniqueness for each finger, i.e., some fingerswill experience higher false acceptance rate when matching(the “lambs” in the Doddington zoo context [26]) due to theirsmaller entropy (related to their higher PoO). In the samefigure, the effect of sensor size is also studied. As seen, the
0 20 40 60 80 100 120context size, pixels
0.34
0.36
0.38
0.4
0.42
0.44
0.46
0.48
Info
rmat
ion
entr
opy
per
pixe
l, bi
ts
LUT+histogram, texture onlyLR, texture onlyNN, texture onlyLR, texture+local orientation (x2 D)NN, texture+local orientation (x2 D)
Fig. 5. Entropy estimates vs. context size for the studied generative models.
estimates (on average) are very similar regardless of the sensorsize. This suggests that individuality, and thus recognitionperformance will be a function largely of the reference imagecoverage area, and is independent of the sensor size at leastdown to the smallest studied crop size of 80x80. Thus, if aprobe image has an overlap of sufficient size with a referenceimage (governed by the entropy per pixel), the biometricperformance does not suffer from the small sensor.
Finally in this section, the border effect is discussed. Inthe above, in order to initialize the traversal, the top and leftborders, with width defined by the radius of the context, areassumed known. In practice, the entropy and MI per pixelreported in this paper will have to be adjusted, e.g. by rescalingthe per-pixel results or by assuming a slightly larger sensor.

1556-6013 (c) 2019 IEEE. Personal use is permitted, but republication/redistribution requires IEEE permission. See http://www.ieee.org/publications_standards/publications/rights/index.html for more information.
This article has been accepted for publication in a future issue of this journal, but has not been fully edited. Content may change prior to final publication. Citation information: DOI 10.1109/TIFS.2019.2916406, IEEETransactions on Information Forensics and Security
JOURNAL OF LATEX CLASS FILES, VOL. 14, NO. 8, AUGUST 2015 7
0.2 0.25 0.3 0.35 0.4 0.45 0.5Information entropy per pixel, bits
0
5
10
15
20
25nu
mbe
r of
fing
ers
80x80, past context (80D)120x120, past context (80D)160x160, past context (80D)
Fig. 6. Histogram of the entropy estimates per finger for sensors of differentsize.
For consistency, in this paper only the inner parts of the imagesare used for entropy and MI estimation and the border effectdescribed is neglected.
C. Mutual Information Estimates
In Fig. 7, an example is given for the MI estimation betweentwo images. Once the global transformation is found, theimages are traversed as in Fig. 2, and the conditional entropyis estimated for the overlapping areas following the contextillustration in Fig. 3. The probability map p(X|Y ) is generallybrighter than the map p(X), which is a result of the similaritybetween the image areas. Observe that the mutual informationis contained in pixels, which carry a lot of self-information(low PoO p(X)) and at the same time are similar in bothimages (high PoO p(X|Y )). On the other hand, extremelynoisy areas (having low PoO p(X)), will be very different inimage Y (resulting in low PoO p(X|Y ) as well), and will thusnot contribute to the MI, since the terms cancel in Eq. (6).
In Table II, the average entropy and MI per pixel andper area are given for all studied databases. The entropyestimates reported for FVC-2002-DB3-A are slightly lowerthan the ones reported in Fig. 5, since the entropy in the formercase is estimated only for the matched areas. The recognitionalgorithm that was used favours less-noisy areas, and suffersperformance penalty in areas, which are more noisy, and thushigher in entropy content. Such areas are thus used less oftenfor the estimate in this section, since they appear less often inthe dataset with matched images.
The ridge-line synthetic SFinGe images exhibit significantlysmaller entropy than that of captured and realistic images.There are several reasons for this discrepancy:
1) There are noise and distortions in real images, whichdo not carry discriminatory information, however, theirentropy is added to the estimates.
2) As mentioned, ridge-lines and minutiae do not carry thecomplete biometric information of a fingerprint. Somediscriminatory information is thus not present in theridgeline dataset.
3) In a less noisy environment, the generative models canbe trained much more accurately, leading to tighterentropy bound.
TABLE IICOMPARISON OF ENTROPY UPPER BOUNDS AND MI ESTIMATES FOR THE
STUDIED DATABASES (DESCRIBED IN THE TEXT).
Entropyper pixel
Entropyper mm2
MIper pixel
MIper mm2
FVC-2002-DB1-A 0.299 119.6 0.0188 7.52FVC-2002-DB2-A 0.258 124.9 0.0158 7.64FVC-2002-DB3-A 0.318 127.2 0.0196 7.84FVC-2004-DB1-A 0.250 100.0 0.0233 9.32FVC-2004-DB2-A 0.269 107.6 0.0156 6.24FVC-2004-DB3-A 0.252 102.3 0.0135 5.48
MCYT optical 0.341 136.6 0.0374 4.96MCYT capacitive 0.345 138.2 0.035 14.01
SFinGe, ridge-lines 0.193 77.2 0.057 22.80SFinGe, realistic 0.315 126.0 0.057 22.80
This being said, there exist variations across databases,which are attributed mostly to different quality, acquisitiontechnology and dataset collection environment and purpose.Optical sensors generally exhibit lower entropy bounds, asexpected from the higher-quality, less-noisy acquisition. Inthe case of FVC-2002-DB2-A, the lower entropy per pixelis also attributed to the higher resolution. The difference inthe entropy per area estimates for FVC-2002-DB1-A andFVC-2002-DB2-A is ≈ 4%. The MCYT databases exhibitsignificantly higher MI, which is attributed to the higher imagequality. Even-though the sensor used to collect the MCYToptical database is the same model as that of FVC-2004-DB2-A, the latter database was designed to be as realistic aspossible, while the former contains both random and highly-controlled captures [23], resulting in high MI. Furthermore,the sensor was not cleaned during the FVC collections, whichis also clearly visible upon visual inspection of the images,resulting in poorer overall quality. Similar arguments can bemade for the difference in MI between the MCYT capacitivedatabase and FVC-2002-DB3-A, which employ the samesensor model for acquisition. 1
The MIs of the SFinGe ridgeline and noisy samples areremarkably close, regardless of their significantly differententropies. This highlights the validity of the NN as a channelmodel, as it is able to successfully extract the interestingportion of information from the noisy samples and disregardsthe information content of the noise part. The higher MI forsynthetic images has two possible explanations:
1) The particular noise configuration generated by SFinGefor this paper is in fact more optimistic than what truesensors provide.
2) The underlying fingerprint distribution defined bySFinGe is significantly different than that of truedatasets, and results in unrealistically high capacityexpressed by MI.
Finally in this subsection, the convergence of the estimatesis studied. In Fig. 8, the estimates are given as a function ofthe number of pixels, used in the estimation for the FVC-2002-DB1 database. The vertical lines indicate bulks of ten images(unevenly distributed due to different size of the overlap area
1Typical images from FVC can be foundon http://bias.csr.unibo.it/fvc2004/databases.asp andhttp://bias.csr.unibo.it/fvc2002/databases.asp, and typical MCYT imagesin [23], and are omitted here for space.
1556-6013 (c) 2019 IEEE. Personal use is permitted, but republication/redistribution requires IEEE permission. See http://www.ieee.org/publications_standards/publications/rights/index.html for more information.
This article has been accepted for publication in a future issue of this journal, but has not been fully edited. Content may change prior to final publication. Citation information: DOI 10.1109/TIFS.2019.2916406, IEEETransactions on Information Forensics and Security
JOURNAL OF LATEX CLASS FILES, VOL. 14, NO. 8, AUGUST 2015 8
Image X Image Y p(X), H(X)=0.360
0.0
0.1
0.2
0.3
0.4
0.5
0.6
0.7
0.8
0.9
p(X|Y), H(X|Y)=0.291
0.0
0.1
0.2
0.3
0.4
0.5
0.6
0.7
0.8
0.9
0.98 0.985 0.99 0.995 1probability of occurrence
0
0.05
0.1
0.15
0.2
0.25
0.3
norm
aliz
ed h
isto
gram
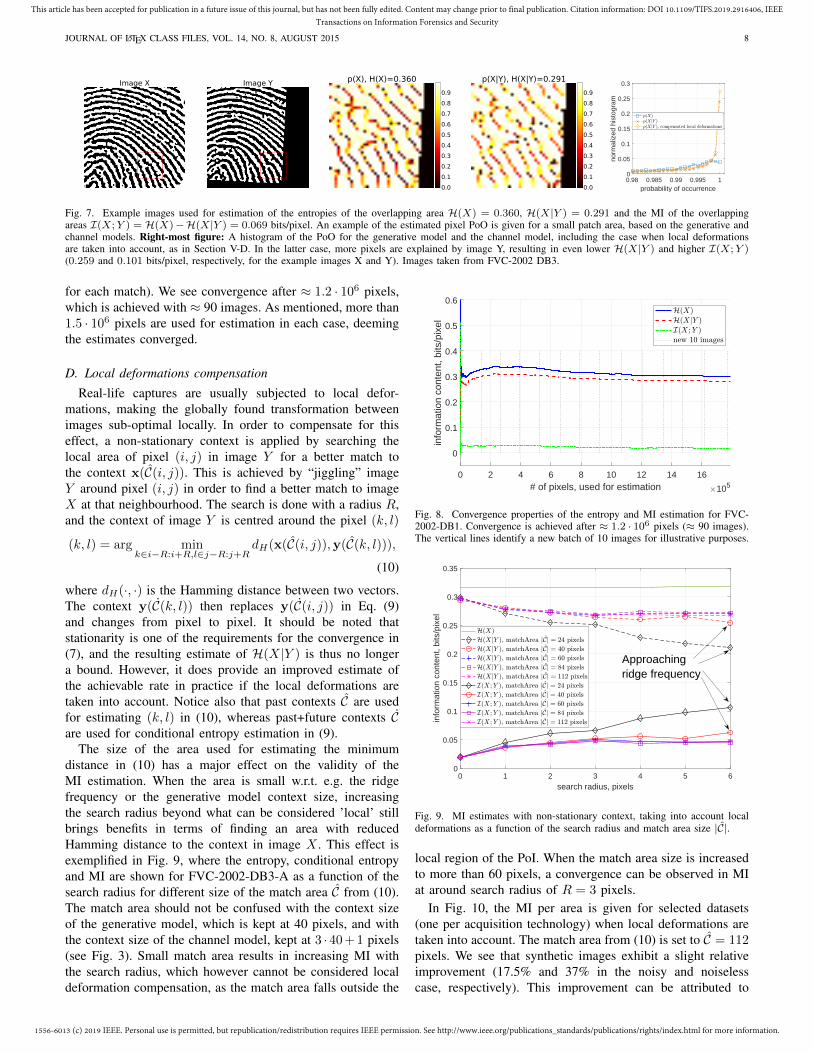
Fig. 7. Example images used for estimation of the entropies of the overlapping area H(X) = 0.360, H(X|Y ) = 0.291 and the MI of the overlappingareas I(X;Y ) = H(X)−H(X|Y ) = 0.069 bits/pixel. An example of the estimated pixel PoO is given for a small patch area, based on the generative andchannel models. Right-most figure: A histogram of the PoO for the generative model and the channel model, including the case when local deformationsare taken into account, as in Section V-D. In the latter case, more pixels are explained by image Y, resulting in even lower H(X|Y ) and higher I(X;Y )(0.259 and 0.101 bits/pixel, respectively, for the example images X and Y). Images taken from FVC-2002 DB3.
for each match). We see convergence after ≈ 1.2 · 106 pixels,which is achieved with ≈ 90 images. As mentioned, more than1.5 · 106 pixels are used for estimation in each case, deemingthe estimates converged.
D. Local deformations compensation
Real-life captures are usually subjected to local defor-mations, making the globally found transformation betweenimages sub-optimal locally. In order to compensate for thiseffect, a non-stationary context is applied by searching thelocal area of pixel (i, j) in image Y for a better match tothe context x(C(i, j)). This is achieved by “jiggling” imageY around pixel (i, j) in order to find a better match to imageX at that neighbourhood. The search is done with a radius R,and the context of image Y is centred around the pixel (k, l)
(k, l) = arg mink∈i−R:i+R,l∈j−R:j+R
dH(x(C(i, j)),y(C(k, l))),
(10)
where dH(·, ·) is the Hamming distance between two vectors.The context y(C(k, l)) then replaces y(C(i, j)) in Eq. (9)and changes from pixel to pixel. It should be noted thatstationarity is one of the requirements for the convergence in(7), and the resulting estimate of H(X|Y ) is thus no longera bound. However, it does provide an improved estimate ofthe achievable rate in practice if the local deformations aretaken into account. Notice also that past contexts C are usedfor estimating (k, l) in (10), whereas past+future contexts Care used for conditional entropy estimation in (9).
The size of the area used for estimating the minimumdistance in (10) has a major effect on the validity of theMI estimation. When the area is small w.r.t. e.g. the ridgefrequency or the generative model context size, increasingthe search radius beyond what can be considered ’local’ stillbrings benefits in terms of finding an area with reducedHamming distance to the context in image X . This effect isexemplified in Fig. 9, where the entropy, conditional entropyand MI are shown for FVC-2002-DB3-A as a function of thesearch radius for different size of the match area C from (10).The match area should not be confused with the context sizeof the generative model, which is kept at 40 pixels, and withthe context size of the channel model, kept at 3 · 40 + 1 pixels(see Fig. 3). Small match area results in increasing MI withthe search radius, which however cannot be considered localdeformation compensation, as the match area falls outside the
0 2 4 6 8 10 12 14 16# of pixels, used for estimation 105
0
0.1
0.2
0.3
0.4
0.5
0.6
info
rmat
ion
cont
ent,
bits
/pix
el
Fig. 8. Convergence properties of the entropy and MI estimation for FVC-2002-DB1. Convergence is achieved after ≈ 1.2 · 106 pixels (≈ 90 images).The vertical lines identify a new batch of 10 images for illustrative purposes.
0 1 2 3 4 5 6search radius, pixels
0
0.05
0.1
0.15
0.2
0.25
0.3
0.35
info
rmat
ion
cont
ent,
bits
/pix
el
Approachingridge frequency
Fig. 9. MI estimates with non-stationary context, taking into account localdeformations as a function of the search radius and match area size |C|.
local region of the PoI. When the match area size is increasedto more than 60 pixels, a convergence can be observed in MIat around search radius of R = 3 pixels.
In Fig. 10, the MI per area is given for selected datasets(one per acquisition technology) when local deformations aretaken into account. The match area from (10) is set to C = 112pixels. We see that synthetic images exhibit a slight relativeimprovement (17.5% and 37% in the noisy and noiselesscase, respectively). This improvement can be attributed to

1556-6013 (c) 2019 IEEE. Personal use is permitted, but republication/redistribution requires IEEE permission. See http://www.ieee.org/publications_standards/publications/rights/index.html for more information.
This article has been accepted for publication in a future issue of this journal, but has not been fully edited. Content may change prior to final publication. Citation information: DOI 10.1109/TIFS.2019.2916406, IEEETransactions on Information Forensics and Security
JOURNAL OF LATEX CLASS FILES, VOL. 14, NO. 8, AUGUST 2015 9
0 1 2 3 4 5 6search radius, pixels
5
10
15
20
25
30
35
40M
I, bi
ts p
er m
m2
MCYT (optical)FVC_2004_DB3 (thermal)FVC_2002_DB3 (capacitive)SFinGe, realisticSFinGe, ridge-lines
Fig. 10. MI convergence with search radius for the local deformationcompensation for selected datasets. Synthetic images converge faster andexhibit smaller relative improvement, which can be attributed to the finiteprecision of the affine transformation. High-quality optical images take fulladvantage of the information content of ridge contours and exhibit higher MI.
TABLE IIIMI ESTIMATES WITH LOCAL DEFORMATION COMPENSATION.
MIper pixel
MIper mm2
FVC-2002-DB1-A 0.044 17.6FVC-2002-DB2-A 0.034 16.5FVC-2002-DB3-A 0.047 18.8FVC-2004-DB1-A 0.038 15.3FVC-2004-DB2-A 0.051 20.5FVC-2004-DB3-A 0.045 18.3
MCYT optical 0.091 37.1MCYT capacitive 0.069 27.9
SFinGe, ridge-lines 0.065 26.0SFinGe, realistic 0.077 30.8
the imperfections in the affine transformation that is appliedin order to estimate the transformed image Y at Step 2 inAlgorithm 1. On the other hand, the improvement is morethan double for the real datasets. Additionally to the affinetransformation imperfections, this improvement is attributed totrue local deformations in the images. The MI saturates to thevalues given in Table III, showing that the MI on true datasetscan even exceed that of synthetic images when the localdeformations are compensated for due to the high informationcontent of level-3 features (pores and ridge contours), notpresent in the synthetic images.
An example of the improvement of the conditional entropyis given in the histogram in Fig. 7, where it is shown thatmore pixels have high (≈ 1) conditional probabilities and theirinformation content thus contributes to the MI.
VI. DISCUSSION AND IMPLICATION OF RESULTS
In this paper, binarized images only were treated due tothe complexity, related to higher-order representation. Theclosed form expression models from Section III-A can also beapplied to multi-level images. In such cases, the entropy andMI estimates will clearly be higher, however, the sensitivityto noise is also increased.
The methods for estimating entropy and MI from sequencesof data are general to any signal. The presented methodology
of training generative and channel models, then using them forestimation of entropy, MI and thereby identification capacityis thus applicable to other biometric modalities, where closed-form generative and channel models are unavailable.
Single-layer NN was treated in this work in order to show-case the methodology. More sophisticated, deeper networkpixel-level models (e.g. as in [27]) can potentially improvethe entropy bounds and MI estimates and are interesting areafor future research.
As mentioned in Section II, feature extraction is usuallyperformed in order to reduce the dimensionality of the recog-nition problem. In this paper, raw (binarized) images aretreated in order to estimate a capacity with unconstrainedrecognition algorithms. The identification capacity of systemsrunning practical algorithms with feature extraction can alsobe estimated with the presented methods. For that purpose,feature generative and channel models can be trained. Further-more, layered models can be devised that first model explicitfingerprint features, such as minutiae, and then tap into theridge contour information content in a pixel-level fashion.It can be expected that pixel-level MI vastly dominates theinformation content of such macro features, but this is left forfuture research to confirm.
It is noted that while all presented results on H(X) arevalid upper bounds, the results on MI can only be consideredestimates, since the results on H(X|Y ) are upper boundsthemselves. The results on MI are valid as far as either or bothupper bounds on H(X) and H(X|Y ) are tight. We speculatethat since the generative and channel models are from thesame family and estimated based on the same images X , thetightness and uncertainty of both bounds is similar and the MIestimates are thus reasonable. This is yet to be confirmed byfuture research.
Biometric entropy and MI are fundamental requirements forestimating bounds on template storage, as well as templatesecurity, privacy and invertibility and performance/securitytrade-offs [28]. The methodology presented in this paper canbe applied also to such problems.
Finally, the most conservative MI estimate presented (5.48bits/mm2 corresponding to 0.0135 bits/pixel at 512 dpi, FVC-2004-DB3 in Table II) is applied in order to estimate thenumber of individuals which can be represented with a fin-gerprint sample. For a sensor of size 80x80 pixels, the resultis 280·80·0.0135 ≈ 1028, which is well-above the entire worldpopulation that ever lived of ≈ 1.07 · 1011 [29]. Followingthe presented analysis, recognition of a population of thissize would be possible with a sensor of size ≈ 2.7 · 103
pixels, or ≈ 52x52 (at 512 dpi), as long as the pixel-levelgenerative and channel models hold below the minimumpresented size of 80x80 and said population adhere to thegenerative model. The problem of operating a system at arate, close to this identification capacity in an efficient manneris still open, and entails as mentioned design of good error-correcting and source codes (or feature vectors). However,from the estimates given in this paper, it can be suggestedthat when a complexity unconstrained matching algorithm isallowed, small fingerprint sensors will be well-sufficient foridentification of large populations. The only requirement is

1556-6013 (c) 2019 IEEE. Personal use is permitted, but republication/redistribution requires IEEE permission. See http://www.ieee.org/publications_standards/publications/rights/index.html for more information.
This article has been accepted for publication in a future issue of this journal, but has not been fully edited. Content may change prior to final publication. Citation information: DOI 10.1109/TIFS.2019.2916406, IEEETransactions on Information Forensics and Security
JOURNAL OF LATEX CLASS FILES, VOL. 14, NO. 8, AUGUST 2015 10
that the reference image covers sufficient area, such that theoverlap between the active probe area and the reference imagesis sufficiently large.
VII. CONCLUSION
In this paper, the entropy and mutual information (MI)of fingerprint images were estimated. It was demonstratedthat texture-based generative models allow for entropy-per-pixel estimation which is independent of the sensor size. Theentropy was therefore shown to only depend on the amountof active area, present in the fingerprint sample. By exten-sion, the biometric performance of complexity-unconstrainedfingerprint recognition algorithms will only be a function ofthe overlapping area between the probe and reference samples.The achievable rates of fingerprint identification systems werethen estimated via the MI between a probe and reference forseveral public databases. The most conservative texture-basedMI estimates given in this paper suggest capacity, which issufficient for identification of extremely large populations withsensors as small as a few thousand pixels.
APPENDIX: LIST OF ABBREVIATIONS AND MAINDEFINITIONS
FVC fingerprint verification competition.LR logistic regression.LUT look-up table.MCYT Ministerio de Ciencia y Tecnologıa.MI mutual information.NN neural network.OMAP orientation map.PMF probability mass function.PoI pixel of interest.PoO probability of occurrence.PPM pixel predictive model.PRC probability of random correspondence.S biometric source.X biometric source template image after
acquisition and processing.Y biometric source verification image after
acquisition and processing.H(X) information entropy of X .H(X|Y ) conditional entropy of X after observing Y .I(X;Y ) mutual information of X and Y .
ACKNOWLEDGEMENTS
Innovation Fund Denmark (ref. 7039-00019B) is acknowl-edged for the partial financial support of this work.
REFERENCES
[1] R. Cappelli, M. Ferrara, and D. Maltoni, “On the operational quality offingerprint scanners,” IEEE Transacstions on Information Forensics andSecurity, vol. 3, no. 2, pp. 192–202, 2008.
[2] Y. Zhu, S. C. Dass, and A. K. Jain, “Statistical models for assessingthe individuality of fingerprints,” IEEE Transacstions on InformationForensics and Security, vol. 2, no. 3, pp. 391–401, 2007.
[3] M. R. Young, S. J. Elliott, C. J. Tilton, and J. E. Goldman, “Entropy offingerprints,” IJCSET, vol. 3, no. 2, pp. 43–47, 2013.
[4] M. B. Westover and J. A. O’Sullivan, “Achievable rates for patternrecognition,” IEEE Transacstions on Information Theory, vol. 54, no. 1,pp. 299–320, 2008.
[5] S. Pankanti, S. Prabhakar, and A. K. Jain, “On the individuality offingerprints,” IEEE Transacstions on Pattern Analysis and MachineIntelligence, vol. 24, no. 8, pp. 1010–1025, 2002.
[6] D. Maltoni, D. Maio, A. K. Jain, and S. Prabhakar, Handbook ofFingerprint Recognition, 2nd edition. Springer, 2009.
[7] A. Roy, N. Memon, and A. Ross, “Masterprint: Exploring the vul-nerability of partial fingerprint-based authentication systems,” IEEETransacstions on Information Forensics and Security, vol. 12, no. 9,pp. 2013–2025, 2017.
[8] Y. Chen and A. K. Jain, “Beyond minutiae: A fingerprint individualitymodel with pattern, ridge and pore features,” in Tistarelli M., Nixon M.S.(eds) Advances in Biometrics. ICB 2009. Lecture Notes in ComputerScience, vol. 5558, Springer.
[9] Q. Zhao, D. Zhang, L. Zhang, and N. Luo, “Adaptive fingerprint poremodeling and extraction,” Pattern Recognition, vol. 43, no. 8, pp. 2833–2844, 2010.
[10] F. Alonso-Fernandez, J. Fierrez, J. Ortega-Garcia, J. Gonzalez-Rodriguez, H. Fronthaler, K. Kollreider, and J. Bigun, “A comparativestudy of fingerprint image-quality estimation methods,” IEEE Transac-tions on Information Forensics and Security, vol. 2, no. 4, pp. 734–743,2007.
[11] R. Youmaran and A. Adler, “Measuring biometric sample quality interms of biometric information,” in Biometrics Symposium, Sep. 2006.
[12] T. M. Cover and J. A. Thomas, Elements of Information Theory, 2ndedition. John Wiley and Sons, Inc, 2006.
[13] F. Willems, T. Kalker, J. Goseling, and J.-P. Linnartz, “On the capacityof a biometrical identification system,” in International Symposium onInformation Theory, ISIT, July 2003.
[14] D. M. Arnold, H.-A. Loeliger, P. O. Vontobel, A. Kavcic, and W. Zeng,“Simulation-based computation of information rates for channels withmemory,” IEEE Transacstions on Information Theory, vol. 52, no. 8,pp. 3498–3508, 2006.
[15] C. Su and S. N. Srihari, “Generative models for fingerprint individualityusing ridge models,” in International Conference on Pattern Recognition,ICPR, Dec. 2008.
[16] J. Daugman, “Information theory and the IrisCode,” IEEE Transacstionson Information Forensics and Security, vol. 11, no. 2, pp. 400–409, 2016.
[17] J. Justensen and S. Forchhammer, Two-Dimensional Information Theoryand Coding. Cambridge University Press, 2010.
[18] L. Liu, T. Jiang, J. Yang, and C. Zhu, “Fingerprint registration bymaximization of mutual information,” IEEE Transactions on ImageProcessing, vol. 15, no. 5, pp. 1100–1110, 2006.
[19] “Information technology - coded representation of picture and audioinformation - progressive bi-level image compression,” ITU Recommen-dation T.82 (03/93), 1993.
[20] P. G. Howard, F. Kossentini, B. Martins, S. Forchhammer, and W. J.Rucklidge, “The emerging JBIG2 standard,” IEEE Transacstions onCircuits and Systems for Video Tech., vol. 8, no. 7, pp. 838–848, 1998.
[21] C. M. Bishop, Pattern recognition and machine learning. Springer, 2006.[22] R. Fan, K. Chang, C. Hsieh, X. Wang, and C. Lin, “LIBLINEAR:
A library for large linear classification,” Journal of Machine LearningResearch, vol. 9, no. 8, pp. 1871–1874, 2008.
[23] J. Ortega-Garcia, J. Fierrez-Aguilar, D. Simon, J. Gonzalez, M. Faundez-Zanuy, V. Espinosa, A. Satue, I. Hernaez, J. J. Igarza, C. Vivaracho,D. Escudero, and Q. I. Moro, “Mcyt baseline corpus: a bimodal bio-metric database,” IEE Proceedings on Visual Image Signal Processing,vol. 150, no. 6, pp. 395–401, 2003.
[24] “Biometric recognition group - ATVS.”http://atvs.ii.uam.es/atvs/mcyt100f.html.
[25] “Biometric system laboratory - SFinGe.”http://biolab.csr.unibo.it/Research.asp.
[26] G. Doddington, W. Liggett, A. Martin, M. Przybocki, and D. Reynolds,“Sheep, goats, lambs and wolves: A statistical analysis of speakerperformance in the NIST 1998 speaker recognition evaluation,” inInternational Conference on Spoken Language Processing, ICSLP, Dec.1998.
[27] K. Bousmalis, N. Silberman, Dohan, D. Erhan, and D. Krishnan,“Unsupervised pixel level domain adaptation with generative adversarialnetworks,” in Conference on Computer Vision and Pattern Recognition,CVPR, July 2017.
[28] K. Nandakumar and A. K. Jain, “Biometric template protection: Bridg-ing the performance gap between theory and practice,” IEEE SignalProcessing Magazine, vol. 32, no. 5, pp. 88–100, 2015.
[29] C. Haub, “How many people have ever lived on earth?,” A Publicationof the Population Reference Bureau, vol. 30, no. 8, pp. 3–4, 2002.