Author's personal copy - Teaching for Robust Understanding ...
28
1 23 Journal for STEM Education Research ISSN 2520-8705 Volume 1 Combined 1-2 Journal for STEM Educ Res (2018) 1:34-59 DOI 10.1007/s41979-018-0001-7 On Classroom Observations Alan H. Schoenfeld, Robert Floden, Fady El Chidiac, Dennis Gillingham, Heather Fink, Sihua Hu, Alyssa Sayavedra, Anna Weltman, et al.
Transcript of Author's personal copy - Teaching for Robust Understanding ...

1 23
Journal for STEM Education Research ISSN 2520-8705Volume 1Combined 1-2 Journal for STEM Educ Res (2018)1:34-59DOI 10.1007/s41979-018-0001-7
On Classroom Observations
Alan H. Schoenfeld, Robert Floden, FadyEl Chidiac, Dennis Gillingham, HeatherFink, Sihua Hu, Alyssa Sayavedra, AnnaWeltman, et al.
1 23
Your article is protected by copyright and
all rights are held exclusively by Springer
Nature Switzerland AG. This e-offprint is
for personal use only and shall not be self-
archived in electronic repositories. If you wish
to self-archive your article, please use the
accepted manuscript version for posting on
your own website. You may further deposit
the accepted manuscript version in any
repository, provided it is only made publicly
available 12 months after official publication
or later and provided acknowledgement is
given to the original source of publication
and a link is inserted to the published article
on Springer's website. The link must be
accompanied by the following text: "The final
publication is available at link.springer.com”.

On Classroom Observations
Alan H. Schoenfeld1& Robert Floden2
& Fady El Chidiac1 &
Dennis Gillingham1& Heather Fink1 & Sihua Hu3
& Alyssa Sayavedra1 &
Anna Weltman1& Anna Zarkh1
Published online: 5 September 2018# Springer Nature Switzerland AG 2018
AbstractAs STEM education matures, the field will profit from tools that support teacher growthand that support rich instruction. A central design issue concerns domain specificity.Can generic classroom observation tools suffice, or will the field need tools tailored toSTEM content and processes? If the latter, how much will specifics matter? This articlebegins by proposing desiderata for frameworks and rubrics used for observations ofclassroom practice. It then addresses questions of domain specificity by focusing on thesimilarities, differences, and affordances of three observational frameworks widelyused in mathematics classrooms: Framework for Teaching, Mathematical Quality ofInstruction, and Teaching for Robust Understanding. It describes the ways that eachframework assesses selected instances of mathematics instruction, documenting theways in which the three frameworks agree and differ. Specifically, these widely usedframeworks disagree on what counts as high quality instruction: questions of whether aframework valorizes orderly classrooms or the messiness that often accompaniesinquiry, and which aspects of disciplinary thinking are credited, are consequential.This observation has significant implications for tool choice, given that these and otherobservation tools are widely used for professional development and for teacherevaluations.
Keywords Classroom observations . Theory of proficiency . Observational frameworks .
Observational rubrics
Journal for STEM Education Research (2018) 1:34–59https://doi.org/10.1007/s41979-018-0001-7
* Alan H. [email protected]
1 Education, EMST, M.C. 1670, University of California, Berkeley, 2121 Berkeley Way, Berkeley,CA 94720-1670, USA
2 College of Education, Erickson Hall, Michigan State University, East Lansing,MI 48824-1034, USA
3 Northwestern University School of Education & Social Policy, Walter Annenberg Hall,Northwestern University, 2120 Campus Drive, Evanston, IL 60208, USA
Author's personal copy

Prolog: Definitions, Constraints, and Theoretical Perspective
The evolution and improvement of STEM education requires tools that support teachergrowth and enhance instruction. Will extant, across-the-boards tools for observinginstruction suffice, or will such tools need to be STEM-specific? If the latter, howimportant will it be to focus on the details of STEM content, practices, and pedagogy?Will any validated “standards based” approach to STEM in general or a particularSTEM discipline suffice, or might there be consequential differences between frame-works in a particular discipline in what is valued – and thus, what is rewarded inprofessional development and teacher evaluations?
We begin by proposing desiderata for frameworks and rubrics used for observations ofclassroom practice. This is a form of theoretical ground-clearing, the goal being to elaboratea set of criteria that can be used, a priori, to judge the possible usefulness of any particularobservation framework. (For example, a framework may be useful for assigning evaluationscores, but may not be helpful in supporting professional development.) The remainder ofthe paper is devoted to the characterization of the similarities, differences, and affordancesof three observational frameworks applied to mathematics classrooms: Framework forTeaching (FfT), Mathematical Quality of Instruction (MQI), and Teaching for RobustUnderstanding of Mathematics (TRU). We describe the ways each framework assessesselected instances of mathematics instruction, documenting the ways in which the frame-works agree and differ. A key finding is that the frameworks do not agree on what counts ashigh quality instruction. First, there is the role of orderliness/disorderliness in instruction. Asshown below, FfT assigns relatively high overall scores to a well managed lesson, whileMQI and TRU assign the same lesson low scores because of the shallowness of itsmathematical content. Conversely, FfTassigns relatively low scores to a somewhat “messy”inquiry-oriented classroom, whileMQI and TRU give that classroom higher scores becausethe students engage somewhat successfully with rich content. Thus, the relative emphasesthat frameworks place on aspects of classroom management and on disciplinary contentmake a significant difference in the ways classrooms are judged. But, as documented below,having a standards-based emphasis on content does not mean that two frameworks have thesame content emphases: MQI and TRU assign different mathematics scores to the samelesson because they emphasize different aspects of the mathematics. In a sense, this shouldnot be surprising: decades ago “problem solving” in mathematics was interpreted asmeaning everything from “working two-step word problems of a type that students haveexperienced in instruction” to “working open-ended exploratory problems the students havenot had experience with.”As a result of such often tacit disparities, there were differences inclassroom focus, teacher and student assessments, and learning. Hence, values matter: amajor question is what content-related values are noted and rewarded in any observationalframework. And, details matter: to understand some differences in frameworks, one mustsee how they play out in practice. The need for detailed examination of classroom episodesis the reason this paper focuses on mathematics (there simply isn’t space to exploreadditional frameworks, although it is reasonable to believe that the findings here applyacross STEMdisciplines), and the reasonwe compare the lessons we discuss in this paper infine-grained detail. Other papers at different levels of grain size (e.g., Boston et al. 2015)make valuable contributions, but not at this level of detail.
In brief, an observational framework and its associated scoring rubrics providecharacterizations of what takes place inside a classroom for one or more lessons. Such
On Classroom Observations 35
Author's personal copy

characterizations should be valid, in the sense that they provide meaningful and robustinformation about the phenomena being observed. As a characterization of validity weadopt the argument-based approach advocated by Kane (1992, 2013, see also Messick1989), which holds that validity is best thought of as a property of the argument thatconnects an assessment or observation to an interpretation or a course of action. For aclassroom observation framework in any content area, we hold that there should be aplausible and coherent line of reasoning that links scores from observation frameworkrubrics to a characterization of the classroom (e.g., for “equitable access,” that moststudents are or are not are getting opportunities to engage with meaningful content).
Desiderata for Classroom Observations
Here we propose and justify four major desiderata for observational frameworks andrubrics. The central issue is, “What counts during instruction, and how can and shouldit be measured?”
Among the understandings that have been developed over the past half century withregard to teaching and learning are the following:
A. Observational Frameworks – And more Generally, all Assessments ofPerformance – Should Be Grounded in Robust Theories of Domain Proficiency.
Observations should focus on “what counts” in ways that correspond to the field’s besttheoretical understanding of domain performance. For such theories to be robust theyshould have been derived in concert with substantial empirical investigations.
Researchers’ and practitioners’ understandings of what it means to be good at STEMdisciplines, other academic disciplines such as language arts or social studies, andprofessions such as medicine, computer programming, and electronic trouble shooting,has grown substantially in recent decades. Whereas the primary concern of assessmentsonce focused primarily if not exclusively on mastery of important facts and concepts, it isnow understood that being a powerful disciplinary thinker includes significantly morethan having a solid knowledge base. It includes being strategic, having disciplinary habitsof mind, and being able to use and participate effectively in central disciplinary practices.
In mathematics for example, the National Research Council’s (2001) Adding it Updescribes mathematical proficiency as having five intertwined strands: conceptualunderstanding, procedural fluency, strategic competence, adaptive reasoning, and pro-ductive disposition (National Research Council 2001, p. 5). The Common Core StateStandards in Mathematics (CCSSM 2010) emphasize mathematical content and prac-tices (problem solving, reasoning, modeling, etc.) as do the two national assessmentconsortia, the Partnership for Assessment of Readiness for College and Careers(PARCC, 2014) and the Smarter Balanced Assessment Consortium (SBAC, 2014).Moreover, one can argue that, whether labeled as such or not, recent sets of standardsfor various fields – the Common Core State Standards in English language arts, the NextGeneration Science Standards, emerging State STEM standards (California departmentof Education 2018), etc. – represent characterizations of desired student proficiency.
Ideally, a theory of proficiency should describe “necessary and sufficient” conditions forproficiency – necessary in the sense that each focus of attention in the theory is essential for
36 Schoenfeld et al.
Author's personal copy
proficient performance, and sufficient in that if someone does well on all of them, then thatperson is clearly proficient. Whether a classroom observation system is used for research,professional development, or evaluation, it should have these properties. It should begrounded in a robust theory that characterizes the classroom practices that are most likelyto support students in developing rich understandings of the discipline being studied.
Although there is a massive literature on teaching – see, e.g., Gitomer and Bell 2016 –there has been little systematic work on theories of proficiency. To our knowledge, thefirst such attempt in that direction, a theory of proficiency for teaching, was produced bySchoenfeld and Kilpatrick (2008). The framework they advanced was acknowledged asprovisional, with a focus on the act of teaching rather than on the learning environment.1
B. To Be Useful, Observational Frameworks – And the Theories of Proficiency thatUnderpin them – Should Be Parsimonious.
Long lists of skills and understandings are likely to be too unwieldy to serve research,professional development, or evaluation effectively. Researchers seek to develop andtest models that explain variability in student learning in terms of a handful ofmeaningful variables, and professional learning communities can only focus on a smallnumber of “big ideas” in any given year. If administrators are to use observationalsystems for systemic improvement as well as for accountability purposes, they needsystems that have a relatively small number of dimensions.
Whatever purposes one has in mind, it is desirable for a research-based frameworkto identify a manageable number of issues that really matter – in the sense that they areindividually important and collectively comprehensive. Those issues can then becomethe focus of study, improvement, or evaluation. By way of analogy, consider a set ofcontent standards for any particular discipline at a specific grade level. A list of 40topics to master for the year becomes a series of things to race through, one per week.In contrast, a list of five big ideas can provide a set of thematic leitmotifs that can beused to structure a year’s curriculum. In practice people can only remember a smallnumber of things that can serve as conscious foci of improvement. The same is the casefor attributes of productive learning environments.
Associated with parsimony is the question of comprehensibility. Ideally, one wants asystem that “makes sense,” is easy to keep in mind, and easy to use. For researchers,such a system provides greater likelihood of ecological validity. For teachers, coaches,and professional learning communities, it can become a “tool to think with” in planningand reflecting. For administrators, it provides information regarding systemic needs, aswell as for giving meaning to accountability structures.
C. Observation Tools should Provide Information Appropriate to their Purpose, in aTimely Manner.
Consider the analogy to student learning. When the main goal of assessing studentperformance is to help teacher and student know what to do in order to improve, getting
1 To be sure, teacher educators and professional developers hold tacit theories of proficiency, which shape theiremphases in teacher preparation and professional development. The question is the degree to which such ideasare explicit, grounded in the literature, and empirically assessed.
On Classroom Observations 37
Author's personal copy

results back quickly is essential. “Actionable” and timely findings for purposes ofprofessional development are equally desirable. Research studies allow for longerturn-around time, although it is worth noting that design-based research calls forrelatively quick cycles of evaluation and refinement. Teacher evaluation systems wouldbe enhanced if they could provide the kinds of information that support the teacher –with, one hopes, the collaboration of coaches and professional learning communities –in becoming better at helping students learn.
D. Observation Tools should Be Reliable, but Statistical Reliability Is Not Enough.
Classroom observation frameworks and rubrics should be reliable in the ways thatpsychometricians discuss (see, e.g., Hill et al. 2012). And, they have to focus on whatcounts, in the ways that have been discussed above (e.g., Kane 1992, 2013).
Psychometric reliability is only one consideration if one is seeking meaningfulinformation, especially for purposes of improvement. Again, consider student assess-ments. Short answer and multiple choice questions are easier to score than essays oropen-ended problems, and can be very reliable in statistical terms. However, the degreeto which short-answer or multiple choice tests reflect domain proficiency is a seriousissue, given current goals for student proficiency: a major question is the degree towhich they provide useful information about habits of mind or the ability to tacklechallenges that demand sustained attention. The same is the case for classroomobservation tools. Such tools must provide the kind of quantitatively robust informationthat is defensible in measurement terms, and they must focus on what counts in waysthat can support inferences for research, professional development, or evaluation.
Finally, a theory of proficiency, while derived from and situated in the literature, is ahypothesis. Its accuracy should be assessed and it should be refined in the light ofongoing empirical studies.
Table 1 summarizes the desiderata discussed in this section.
The Space of Observation Frameworks, and the Focal Choices for Discussion
The world does not lack for classroom observational frameworks. Widely availableframeworks applied to mathematics classrooms include the following:
& Classroom Assessment Scoring System (CLAS: Pianta et al. 2008)& Framework for Teaching (FfT: Danielson 2011)& Instructional Quality Assessment, (IQA: Junker et al. 2004)
Table 1 Desirable properties of classroom observation frameworks
A classroom observation framework should be:A. grounded in a theory of domain proficiency, which characterizes “necessary and sufficient” conditions
for proficient domain performanceB. parsimonious, in that the framework helps focus on what truly counts – preferably in ways that are easy
to understand and rememberC. fruitful and timely for the intended purposesD. quantitatively robust, both in measurement terms and in empirical studies of how it correlates to powerful
student performance
38 Schoenfeld et al.
Author's personal copy
& Mathematical Quality of Instruction (MQI: University of Michigan 2006)& Performance Assessment for California Teachers (PACT: PACT Consortium 2012)& Systematic Classroom Analysis Notation (SCAN: Beeby et al. 1980)& Teaching for Robust Understanding (TRU: Schoenfeld 2013)& UTeach Teacher Observation Protocol (Marder and Walkington 2012)
Three frameworks were chosen for comparison in this study. The Framework forTeaching (FfT: Danielson 2011) is perhaps the most widely used framework for teacherevaluation and professional development. It was one of the frameworks used in theMET study (Measures of Effective Teaching Project 2012), which showed it tocorrelate reasonably well with student performance. FfT is content-discipline-independent; it does not have a specific focus on particular content domains such asmathematics, science, or ELA.
The Mathematical Quality of Instruction framework (MQI: University ofMichigan 2006) may be the most widely used mathematics-specific classroomobservation framework. Developed within the educational research community,MQI has extensive psychometric validation. Like FfT, it claims to cover “whatcounts,” and was part of the MET study (also correlating reasonably well withstudent performance). It has been used both for professional development and forteacher evaluations.
The Teaching for Robust Understanding framework (TRU: Schoenfeld 2013, 2014,2017, 2018) applies to all STEM disciplines. Here we use the mathematics-specificversion. TRU was derived as a theory of proficiency, its explicit claim being that thefive dimensions of analysis in the framework are necessary and sufficient for class-rooms to produce students who are mathematically proficient. TRU and the set of toolsit offers have been focused largely on research and professional development, with lessattention to teacher evaluation than FfT and MQI.
Taken together, the three frameworks allow us to address at least two major issuesrelated to domain specifics: (1) whether there are meaningful difference betweendomain-general and domain-specific frameworks in terms of judgments of the qualityof teaching, and (2) whether the values represented in two domain-specific frameworks(MQI and TRU) are similar, or how the underlying theory of proficiency for one ofthem might or might not result in consequential differences from the other. The findingsclearly apply to all STEM disciplines.
Details on the three frameworks follow.
The Framework for Teaching
The Framework for Teaching (FfT) is described by the Danielson Group (2015) asfollows:
“The Framework for Teaching is a research-based set of components of instruction,aligned to the INTASC standards, and grounded in a constructivist view of learning andteaching. The complex activity of teaching is divided into 22 components (and 76smaller elements) clustered into four domains of teaching responsibility: Domain 1:Planning and Preparation; Domain 2: Classroom Environment; Domain 3: Instruction;Domain 4: Professional Responsibilities.” (https://danielsongroup.org/framework/,July 6, 2015)
On Classroom Observations 39
Author's personal copy
According to its authors, “The Framework may be used for many purposes, but itsfull value is realized as the foundation for professional conversations among practi-tioners as they seek to enhance their skill in the complex task of teaching”(https://danielsongroup.org/framework/, July 6, 2015).
Regarding the desiderata in Table 1, we note that (cf. criterion A) FfT is grounded inresearch, but not a theory of proficiency; it has, on the other hand been extensivelyrefined in practice. According to Danielson, “On learning, the underlying assumption isgrounded in cognitive science (for example, “How People Learn” monograph), andstates, simply, that “learning is done by the learner, through an active intellectualprocess.” That is, students learn, not so much on account of what we, as teachers, do,but primarily on account of what THEY do.” (Danielson, personal communication,August 14, 2015).
With regard to necessary and sufficient conditions, FfT appears to be comprehensivewith regard to professional activities. It is not content-specific, however – a major pointof comparison with both TRU and MQI. Also, FfT devotes significant attention toclassroom management, foregrounding rather than backgrounding the issue. Withregard to criterion B, its lack of parsimony makes it far from transparent or easy tolearn, but (cf. criterion C) it is very widely used for teacher evaluation and professionaldevelopment, indicating that the field has found it useful. FfT was used in the METstudy (Measures of Effective Teaching Project 2012). Hence it has been used reliablyfor large-scale scoring of classroom videos (cf. Criterion D). Validity in Kane’s (1992)terms is suggested by the rationales cited above and the large scale use and adoption ofthe framework.
The Mathematical Quality of Instruction Framework
Extensive information about MQI can be found at the project training web site,<http://isites.harvard.edu/icb/icb.do?keyword=mqi_training>. The MET project (2010)describes the MQI protocol for classroom observations as follows:
The Mathematical Quality of Instruction (MQI) observational instrument was de-veloped by Heather Hill in collaboration with research colleagues at the University ofMichigan and Harvard University. The instrument is designed to reliably measure themathematical work that occurs in classrooms, on the theory that that work is distinctfrom classroom climate, pedagogical style, or the deployment of generic instructionalstrategies. The MQI instrument is based on a theory of instruction that focuses onresources and their use (Cohen et al. 2003), existing literature on effective instruction inmathematics (e.g., Borko et al. 1992; Ma 1999; Stigler and Hiebert 1999; Thompsonand Thompson 1994) and on an analysis of nearly 250 videos of diverse teachers andteaching.
The theoretical and empirical underpinnings of MQI are described by the LearningMathematics for Teaching Project (2011). In brief, developers constructed and revised acoding system grounded in the literature and on their iterated viewings of segments oftape, with codings revised as their understandings deepened. “We consider this study tobe a variant of grounded theory-building (Glaser and Strauss 1967), one that usedprimary source material, which was cognizant of our own histories and lenses forlooking at instruction, but which also used key insights from the existing literature onmathematics classrooms” (p. 32).
40 Schoenfeld et al.
Author's personal copy
Thus (cf. criterion A) MQI is theory-based, but it was not derived within thecontext of a theory of proficiency. Re criterion B, it may be that parsimony is in theeye of the beholder, but the authors of this paper find that MQI is not easy tosummarize in brief. Thus (cf. criterion C), MQI has varied affordances for differentpurposes. MQI has been shown in the MET study to correlate with student out-comes; hence it serves some research purposes well. The lack of parsimony maymake it somewhat challenging to use MQI for purposes of professional develop-ment. MQI has been adopted by a number of school districts for accountabilitypurposes; it is, as far as we know, an open question as to how well it serves forsystemic improvement. Re criterion D, MQI has been carefully studied in psycho-metric terms (Hill et al. 2012) – much more so than either TRU or FfT. Validity inKane’s (1992) terms is suggested by the theoretical rationales cited above and thelarge scale use and adoption of the framework.
The Teaching for Robust Understanding of Mathematics (TRU) Framework
The TRU framework is described in Schoenfeld (2013, 2014, 2017, 2018). Theframework was derived by identifying contributions to powerful learning from anextensive literature review, and then distilling them into five “equivalence classes” ordimensions of teaching (Schoenfeld 2013). The dimensions, which are claimed to beboth necessary and sufficient for powerful mathematical instruction, are (1) the richnessof the mathematical content, (2) opportunities for cognitive demand or “productivestruggle,” (3) equitable access to content for all students, (4) students’ opportunities todevelop agency, ownership of content, and positive mathematical identities; and (5)formative assessment. This is an explicit theory of proficiency for learning environ-ments. Details regarding the framework and supporting tools may be found at theMathematics Assessment Project and TRU Framework web sites, at <http://map.mathshell.org/trumath.php> and https://truframework.org/.
TRUwas designed explicitly as a theory of proficiency. Hence it doeswell on criterionAof Table 1. Similarly (criterionB), TRUwas designedwith parsimony and “actionability” inmind: TRU is organized with a focus on just five dimensions of classroom activity.
Re criterion C, TRU offers differential affordances for the research, professionaldevelopment, and assessment. Designed by researchers, it offers a parsimonious theoryof proficiency and a set of related tools that can be used for classroom studies. SkilledTRU scorers can score instruction in approximately twice real time. With regard toprofessional development, it is important to note that the issue of classroom managementis “backgrounded” rather than foregrounded in TRU; classrooms will not do well on TRUif they are not well run, but the focus is on activity structures beyondmanagement. TRU isnot aimed at administrative decision making, but its use by administrators has focused onenhancing teacher capacity along the five dimensions. (See St. John 2007, who argues thatthe tools of “improvement infrastructures” should be aimed at enhancing capacity.)
TRU’s psychometric properties (criterion D) have not been documented. Theresearch community that developed it has achieved some uniformity of scoring (seebelow), but that uniformity has not been tested with a wider community. Preliminaryinvestigations suggest that TRU scores are likely to correlate with student outcomesin ways similar to the measures used in the MET project (Measures of EffectiveTeaching Project 2012). (Schoenfeld, personal communication, July 9, 2016).
On Classroom Observations 41
Author's personal copy

Validity in Kane’s (1992) terms is suggested by the explicit linkages between theoryand observation, and the process of framework development, in which iterations ofthe theoretical framing were tested against observations of classroom practice andstudent performance (Schoenfeld 2013). The use of a theory of proficiency in thedevelopment of the TRU framework addresses the core ideas underlying Kane’sapproach in fundamental ways.
Framing the Comparison
There are clear differences between the three frameworks along the dimensions elaboratedin Table 1. The key question, however, is whether the differences in emphasis areconsequential. All three frameworks can be used to assign scores to instances of instruc-tion. If all three frameworks were to produce roughly the same scores – that is, instances ofinstruction that score high, medium, or low on one framework score similarly on the otherframeworks – then potential users could choose between them on the basis of conve-nience, ease of use, or intended purposes. As will be seen below, that is not the case.
Any framework for assessing instruction embodies a set of values regarding “whatcounts.” If episodes of instruction that score high on one framework score low onanother, the choice of framework could drive a district’s professional development indifferent directions; and if scores are used as part of an evaluation/retention system,such differences could have very serious consequences both for individual teachers andfor the system. Hence the authoring team set out to see if there are consequentialdifferences in the ways that the three frameworks assess instruction, and if there are, tounderstand some of the reasons why.2
In planning to score and examine videos, we had two families of questions in mind:
1. Does the content-specific character of a rubric matter for the improvement ofteaching, and if so, in what ways? MQI and TRU are mathematics-specific whileFfT is used to assess teaching in all content areas. On the one hand, there might bean argument that “a good classroom is a good classroom,” in which case a generalrubric might consistently yield scores similar to discipline-specific rubrics. On theother hand, disciplinary norms could make a difference. For example, a STEMclassroom that appears well organized and in which the students seem activelyengaged, might provide little by way of interdisciplinary opportunities or applica-tions. Or, in a classroom in which activities appeared to be somewhat “messy” orunstructured, the students might be engaged deeply with in making connectionsand applying them.3
2. Might there be consequential differences between discipline-specific rubrics, aboveand beyond matters of ease of use for different purposes? To give an extreme case
2 The authoring team consists of members of the TRU team. We have done our best to provide enoughevidence to allow readers to come to their own judgments about possible issues of bias.3 Matters of pedagogy and content are intertwined. For example, a “demonstrate and practice” form ofpedagogy may inhibit certain kinds of inquiry that are highly valued in STEM. Thus a rubric that assignshigh value to such pedagogy may downgrade classrooms in which there are somewhat unstructured explor-atory investigations. The question is how much disciplinary scores matter in assigning the overall score to anepisode of instruction, and whether a more fine-grained examination of disciplinary practices reveals thingsnot reflected in a general rubric.
42 Schoenfeld et al.
Author's personal copy

not represented in this paper, the “math wars” and “reading wars” representedconflicts between competing disciplinary perspectives regarding what “counts” inlearning a discipline. Any scoring rubric reflects underlying perspectives aboutwhat matters in teaching and learning. Thus scores might differ based on theunderlying perspectives – a fact that would be consequential when such rubricsare used for professional development or for teacher evaluations.
Methods
To find classroom videos that could be (or better, had been) scored independently usingthe three rubrics, we secured access to the Measures of Effective Teaching (MET)longitudinal database (2016). The original MET study (see, e.g., MET, 2010, 2012)gathered and analyzed a large number of fourth through ninth-grade classroom videos,employing a wide range of analytic frameworks including FfT and MQI. The METdatabase includes classroom videos, the scores assigned by trained coders using variousanalytic frameworks including FfT and MQI, and other data. TRU had not beendeveloped when the MET study was undertaken. Thus this study could rely on theMET scoring of tapes for the FfT and MQI measures, but any tapes identified forscoring using MET data would have to be scored independently using TRU.
We ran a simple search on the MET database, looking for videos of mathematicsclassrooms that scored uniformly high or low on either FfTorMQI.We identified a dozensuch videos and we scored them using TRU. If the scores had lined up, we would havestopped; but, they did not. Even among the small number of videos with very high scoresfrom either FfT or MQI, there was not necessarily agreement between the two; and, TRUscores of those videos often differed from one or both of the other frameworks.
Although database scores were used to identify videos for examination and we usenumerical scores as overall indications of lesson quality, our primary intentions arequalitative rather than quantitative. In what follows we use the scores assigned by thethree frameworks to provide a sense of the values to which each framework gives priority.
The following summary descriptions of FfT and MQI scoring are taken from theMET web site.
FfT Scoring Overview
The FfT instrument… [addresses] four domains of teaching responsibility: Planning andPreparation (Domain 1), Classroom Environment (Domain 2), Instruction (Domain 3),and Professional Responsibilities (Domain 4). However … the MET Study scoredvideos on only two of these domains (“Classroom Environment” and “Instruction”).Each of these domains, in turn, is measured by a number of dimensions. The domain“Classroom Environment,” for example, is measured along five dimensions: creating anenvironment of respect and rapport; establishing a culture for learning; managingclassroom procedures; managing student behavior; and organizing physical space. Thedomain “Instruction” also is measured along five dimensions: communicating withstudents; using questioning and discussion techniques; engaging students in learning;using assessment in instruction; and demonstrating flexibility and responsiveness.(MET longitudinal Database 2016, “instruments”).
On Classroom Observations 43
Author's personal copy

MQI Scoring Overview
The MQI instrument measures the mathematical quality of instruction by assessingclassroom instruction along six dimensions: Richness of the Mathematics; Errors andImprecision; Working with Students and Mathematics; Student Participation inMeaning-Making and Reasoning; Explicitness and Thoroughness; and Connectionsbetween Classroom Work and Mathematics. The dimension Richness of Mathematicscaptures student meaning making and classroom mathematical practices. The dimen-sion Errors and Imprecision captures major errors made by the teacher, imprecision inlanguage and notation used by the teacher, and lack of clarity. … Raters score eachsegment on these 5 dimensions as well as giving an overall video score for eachdimension. In addition to the main dimensions of the MQI, scorers rate a teacher on hisor her apparent mathematical knowledge for teaching and provide a holistic score forthe quality of the entire video. (MET longitudinal Database 2016, “instruments”).
TRU Scoring Overview
TRU assigns scores for each of its five dimensions: (1) the richness of the mathematicalcontent, (2) opportunities for cognitive demand or “productive struggle,” (3) equitableaccess to content for all students, (4) students’ opportunities to develop agency,ownership of content, and positive mathematical identities; and (5) formative assess-ment. TRU employs a 5-point rubric, generating scores of 1, 1.5, 2, 2.5, and 3. Thesummary rubric (Schoenfeld, A. H., Floden, & the Algebra Teaching Study andMathematics Assessment Project 2014) provides capsule descriptions of mechanismsfor assigning scores of 1, 2, and 3 on each of the five dimensions, for four differentactivity structures: whole class activities, small group work, student presentations, andindividual work. For example, a score of 3 on “agency, ownership, and identity”(dimension 4) is given when “students explain their ideas and reasoning. The teachermay ascribe ownership for students’ ideas in exposition, and/or students respond to andbuild on each other’s ideas.” A score of 3 on “formative assessment” (dimension 5) isassigned when “the teacher solicits student thinking and subsequent instruction re-sponds to those ideas, by building on productive beginnings or addressing emergingmisunderstandings.” A detailed scoring guide (Schoenfeld, Floden, & the AlgebraTeaching Study and Mathematics Assessment Project 2015) is available from theproject. For purposes of comparability with FfT and MQI codings, the authoring teamsegmented the first 30 min of classroom videos into episodes of length 7.5 min.
The videos discussed in this paper were scored by a training and consensusmechanism as follows. Seven group members, three of whom were new to TRUscoring, watched the videos individually and scored independently. Typically, theindependent scores were within a range of 1 – e.g., from 1.5 to 2.5. At the nextresearch group meeting people explained their scores, justifying their decisions withrespect to what they saw in the video and their understanding of the rubric. Betweenmeetings individuals re-watched and re-scored the videos. Typically, the second scoresfor each dimension differed by no more than .5: there was at most one pair of scoresthat differed by 1, and none that differed by 1.5.
44 Schoenfeld et al.
Author's personal copy
Results: Videos and Scores
In what follows we discuss two videos and, for reasons of space, briefly summarize ouranalyses of a third.4 For each video we describe the reason the video was selected. Wethen provide a characterization of the video as a whole, and selected excerpts, with theintention of justifying the scores assigned by the rubrics and explaining differencesbetween them.
Video A5
To explore the issue of domain specificity (Question 1 above), we searched theMET database for videos that scored very high on FfT. There were very few videosthat scored uniformly high on FfT (or MQI for that matter). We found two suchvideos. Here we focus on one of them. The issues with regard to the other weresimilar.
The lesson was scored 4 (“distinguished”) on FfT’s four-point scale on all of theFfT’s coded dimensions. In contrast, the MQI scores were not as generous. Thescores assigned were mostly 1 s (on a 3-point scale) across all dimensions andepisodes, with the exception of some 2 s on Mathematical Richness. The lessonscored mostly 2 s (on a 3-point scale) in each episode on mathematical richness, butwas assigned an overall score of 1 on holistic richness; it received scores of 1 onexplicitness and thoroughness, student participation in meaning making and rea-soning, (teacher’s) errors and imprecisions, and working with students and mathe-matics. Hence the video appeared to be a rich candidate for exploration anddiscussion, which follow.6
Lesson Overview
This lesson occurs in a calm, well-managed sixth grade classroom in which the teacherand students have well-established classroom routines. The teacher is very clear andvery well organized, and the lesson proceeds like clockwork, with the students consis-tently engaged. The lesson begins with a warm-up activity reviewing conversionsbetween fractions, decimals and percents – the prerequisites for the main activity ofthe day. The class rehearses the procedures, with the students working exercises bythemselves, after which the teacher comments on their methods – e.g., 4/5 can bewritten as 8/10 = 0.8, or 80/100 = 0.80, which can then be written as 80%.
In the second example, students work in pairs to convert 20% to a fraction byreducing the fraction 20/100 to 1/5. They convert 20% to a decimal by “rememberingthe trick” that one can place a decimal point at the end of the whole number, and then
4 The authors will gladly send interested readers our analysis of Video B, which is written up in detailcomparable to the write-ups for Videos A and C.5 In accord with our permission to examine the videos from the MET database, we have done everything wecan to honor the confidentiality of the research process and to remove possible identifiers of the individuals,cities and schools involved.6 The other video with comparably high FfT scores fared similarly less well on the MQI scale, so our choicefor exposition does not represent an anomalous example.
On Classroom Observations 45
Author's personal copy

move the decimal two places to the left. That is: 20% can be written as “20.” ; movingthe decimal point two places to the left yields “.20”, which is the decimal equivalent.
With these preliminaries out of the way, the class embarks on the main part of thelesson – using two different methods to find a certain percentage of a number, e.g.,25% of 260.
The teacher begins with Method 1. Using a document camera that projects her notesonto the blackboard so that students can take notes well, she explains that 25% ¼ 1
4 , so
that the task is to calculate 14 of 260. To do so, she replaces “of” by the “times” sign, so
that the board now shows “14 ×260.” She then reminds the students that 260 can be
written as 2601 , so the expression on the board becomes “14 � 1
4 ¼ 14”. She then divides 4
into 260, obtaining 65. She concludes by writing “25% of 260 is 65” under Method 1.The method is codified as: “Write the percent as a fraction. Then multiply”.
The teacher then turns to Method 2, which is codified as: “Write the percent as adecimal. Then multiply.” She works the same problem, so that the students can see thatthe same answer emerges. 25% is converted to .25, which she then multiplies by 260,taking care to note the way in which the decimal point in the final answer (6500) shouldbe moved two digits to the left, because the decimal point in .25 was two digits to the left.Since both methods give the same (correct) answer, the students can use either one.
The balance of the class is devoted to practice. Students work in groups of 4. Withineach group of four, two students work together on method 1 and two on method 2; ineach pair, one student does the work and the second student is a coach. Work is done onwhiteboards, so students can display their answers to the teacher and each other.
The first collective task is to find 48% of 50. Most of the students appear to get theright answer; the teacher tells the students to check with their groupmates if theiranswers differ. She confirms that the answer is 24, and asks if the answer is reasonable;she goes on to say that 48% is about one-half, so 48% of 50 would be about half of 50,or 25, which is close to their calculated answer of 24.
For the rest of the class the students work a series of examples: 40% of 95, 8% of 85, 15%of 342, 350% of 60, and 40% of 340. The teacher uses a variety of activities to mix up theaction. At various times students work in groups of four, with two students using method 1and two using method 2; at times they engage in a form of musical chairs, walking aroundthe classroom until the music stops, at which point the nearest person is one’s partner. Whenthemusic stops, all the students shout “what’s the problem?”, indicating that this procedure isa familiar routine. At the end of the lesson the teacher summarizes as follows: “No matterwhat you do, you start by converting the% to a decimal or a fraction. Step 2 is youmultiply”.
Those are the basics. The mathematics is clear; the class runs smoothly; thestudents work on whiteboards and hold up their answers, so the teacher is able tocheck on student progress.
How the Different Frameworks Scored the Lesson
How one scores this lesson depends on what one values – or more precisely, on thevalues embedded in the scoring rubric. As we have noted, this lesson received topscores on all of the following FfT dimensions: Establishing a Culture for Learning(ECL), Managing Classroom Procedures (MCP), Communicating with Students(CS), Engaging Students in Learning (ESL), Using Questioning and Discussion
46 Schoenfeld et al.
Author's personal copy
Techniques (UQDT), and Using Assessment in Instruction (UAI). Here, in brief, iswhy. The rationales below draw from phrasing in the FfT rubric.
ECL: The teacher is supportive and enthusiastic, engaging students in workingwith each other.
MCP: Classroom routines operate smoothly with students supported in makinggood use of instructional time, and helping to accomplish classroom routinessmoothly.
CS: The teacher explains content clearly, points out possible areas of misunder-standing, and invites students to explain work to their classmates.
ESL: Virtually all students are intellectually engaged in the lesson, in a variety ofinteractive formats.
UQDT: Virtually all students are engaged in the discussions, and are invited toengage with their colleagues in discussion.
UAI: The teacher is constantly taking the pulse of the class, both at the wholeclass level and (thanks to white boards) the individual student level.
We note that some of these scoring attributions seem a bit generous, but thedifferences would result in scores of 3 rather than 4. In qualitative terms, this is a“distinguished” lesson according to FfT.
MQI scores were generally low. The lesson was assigned scores of 2 (on a 3-pointscale) for each video episode onMathematical Richness and scores of 1 on Explicitnessand Thoroughness, Student Participation in Meaning Making and Reasoning,(teacher’s) Errors and Imprecisions, and Working with Students and Mathematics.Here too we wonder about some of the scores: although the lesson was given a scoreof 1, for example, on “(teacher’s) errors and imprecisions,” we did not catch any sucherrors. However, most of the scores assigned seem entirely in line with the MQI rubric,given its focus. On mathematical richness, for example, a score of 1 is assigned ifelements of rich mathematics are not present or only minimally present” and a score of2 is assigned if “elements of rich mathematics are used ‘locally’ without connection tolarger mathematical concepts.” Individual episodes in the lesson were scored 2.Likewise, there was little student initiative in meaning making and reasoning, giventhat this was a “demonstrate and practice” lesson in which the students were workingon procedures presented to them by the teacher. Finally, MQI’s version of “workingwith students and mathematics” specifically attends to the quality of the mathematics: ifthe content is largely procedural, then a low score is given, even if the teacher iseffective at catching and remediating (procedural) errors.
Thus, the (quite different) scores in MQI and FfT do provide reasonably accuraterepresentations of the differences between the two frameworks. We now work throughthe five dimensions of TRU.
TRU Dimension 1, the Mathematics, addresses the richness of the mathematicalcontent of the lesson. If the lesson is at grade level, the minimum possible mathematics
On Classroom Observations 47
Author's personal copy
score is 1.5 (on a scale from 1 to 3). This lesson was at grade level. However, themathematics of the lesson consisted of either employing previously covered algorithms orlearning new ones. Those procedures were not developed with the students, nor were theyexplained using mathematical reasoning; rather, the methods were simply provided by theteacher for the students to practice, unlinked to conceptual underpinnings and untied tostrategic thinking. Although students were instructed to use the methods they “preferred”or found “easier,” those decisions were not driven by mathematical rationales.
For more than 25 years, national standards documents within mathematics have calledfor linking procedures with their underlying conceptual grounding. They have also calledfor strategic flexibility in solving problems – that is, for mathematical sense making. Therigid adherence to procedures in this lesson completely undermined this kind of sensemaking. The language of the class – e.g., “method 1,” “method 2,” and “remember thetrick” – was completely procedural. Beyond that, focusing on the implementation of twomethods to the exclusion of all else deprived students of the opportunity to engage inmathematical sense making. Consider the task find “48% of 50,” for example. Thestudents were channeled into either multiplying 48
100 � 48100 or multiplying (.48) × 50.
Both procedures produce the correct answer, with some work. However these sameproblems, approached with some strategic flexibility, are more easily solved and openthe way to a much richer mathematical discussion. For example, products can be taken inany order (that is, 3×2 = 2×3), so 48% of 50 is the same as 50% of 48 – or half of 48,which is 24. Thus with the understanding of why it is OK to reverse the order ofmultiplication and some flexibility, the task becomes simple. Similarly, the best way tocompute 20% of a number might be to find 10% of it by shifting a decimal place, and thendoubling the result. (That is, 20% of 150 is [2 × (10% of 150)], which is twice 15, or 30.).All of the mathematics standards documents call for this kind of flexibility, which isabsent when students simply practice predetermined methods. The authoring team scoredthis lesson a 1.5, the minimum possible score for a lesson at grade level.
TRU Dimension 2, Cognitive Demand, addresses the question of whether studentshave meaningful opportunities to grapple with the content. A score of 1 is given when“classroom activities are structured so that students mostly apply memorized proce-dures and/or work routine exercises.” We scored this lesson a 1.
TRU Dimension 3, Equitable Access to Mathematical Content, is concerned withthe extent to which classroom activity structures invite and support the active engage-ment of all of the students in the classroom with the core mathematics being addressedby the class. Here the mix of procedures used by the teacher – calling on a fair range ofstudents, and having them work with each other in a number of different ways – scoresreasonably high, toward the 2.5 range.
TRU Dimension 4, Agency, Ownership, and Identity, addresses the opportunities thatstudents have to come to see themselves asmathematical thinkers. A score of 1 is assignedwhen “the teacher initiates conversations. Students’ speech turns are short (one sentenceor less), and constrained by what the teacher says or does.” That was the case here.
TRU dimension 5, Formative Assessment, is concerned with whether the lessonaddresses student thinking productively. A score of 1 is given when “Student reasoningis not actively surfaced or pursued. Teacher actions are limited to corrective feedback orencouragement.”While it is true that students were provided opportunities to determine
48 Schoenfeld et al.
Author's personal copy
whether their answers were correct and to fix mistakes, their reasoning was notaddressed. The authoring team assigned a score of 1.
Discussion of the Different Codings of Video A
It should be clear from the preceding discussion that disciplinary content matters when oneis assessing the learning opportunities available to students in a classroom. A class canseem to run beautifully – indeed, this classroom does run beautifully – but if the studentsdo not have opportunities to grapple with important disciplinary content in ways that callfor sense making, then they do not have meaningful opportunities to learn. FfT, whichdoes not attend to the mathematical specifics, assigned uniformly high scores. MQI andTRU, which have a specific mathematical focus, assigned low scores. Hence, whether ornot a classroom observation framework addresses disciplinary specifics in enough detail tomake content-related distinctions about the quality of the lesson is deeply consequential.
A Note Regarding Video B
As noted above, space limitations preclude a full presentation of Video B; the authorswill send interested readers our analysis on request. Video B provided the opportunity toexamine the “flip side” of the issues discussed regarding Video A. In contrast to VideoA, the classroom environment in Video B could be considered “messier” – it is certainlynoisier, and it does not seem to run nearly as smoothly as the classroom in Video A.However, part of the messiness is due to the fact that the students are engaged in arguingabout issues of mathematical substance. Thus, this lesson scored comparatively low onFfT, while it scored reasonably well on MQI and slightly better than that on TRU.
The scores assigned to Videos A and B indicate the importance attending todisciplinary content and practices, and the interplay between content-related concernsand pedagogical concerns. But, in both videos, the MQI and TRU scores, while notperfectly aligned, were reasonably close to each other. This raises the question ofwhether they represent the same mathematical and pedagogical values, or whether thereare points at which they diverge in consequential ways.
Video C
To compare MQI and TRU, we proceeded in the same way that we did for thecomparisons with FfT. We searched the MET database for videos that scores uniformlyhigh on MQI, with the intention of seeing if TRU would score the videos similarly. Thesample space was again small: we identified two videos with consistently high scores(almost all 3 s on the MQI 3 point scale). Both videos received consistent scores of 3 onFfT’s 4-point scale, so in both cases the pedagogy was deemed “proficient” or better;and the mathematics was deemed “high” by MQI. In both cases, the TRU rubricassigned mathematics scores of 1.5 – the content being at grade level (which warrantsthe 1.5 score) but of minimal richness, as described below. For purposes of expositionwe chose Video C, because the mathematics in it is somewhat more accessible andeasier to explain than the mathematics in the other video.
On Classroom Observations 49
Author's personal copy
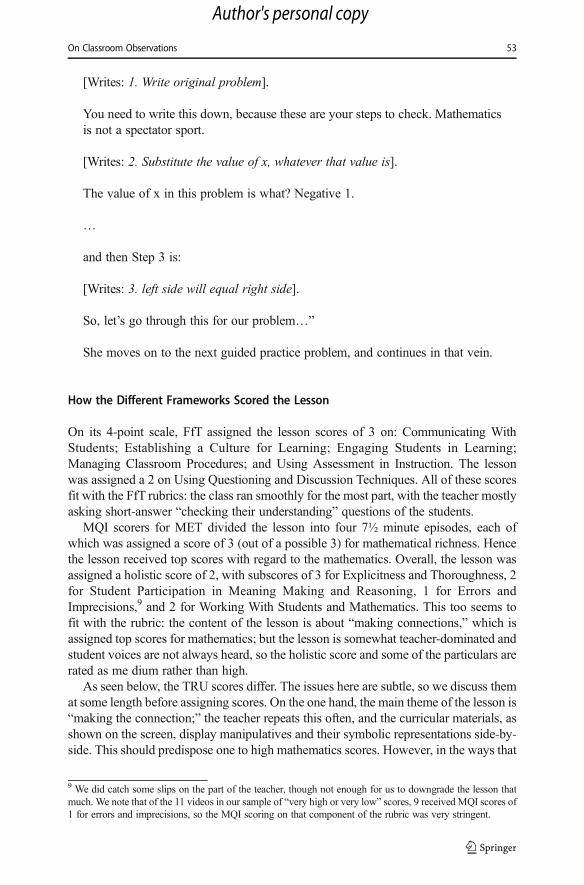
The Lesson
Video C shows an 8th grade lesson on equation solving, in which students work with“manipulatives” (concrete objects representing symbolic entities) and drawings of themto develop understandings of algebraic operations, and then link those objects andoperations on them to symbolic operations using algebraic terms. The idea behind theuse of manipulatives in general is that working with concrete objects can give meaningto mathematical operations; then, when students operate on the symbols, they will do sowith deeper understanding. The lesson content is projected from a computer onto ascreen in front of the class. The teacher steps through the lesson by pressing on aclicker, or by making changes on the computer.
The teacher opens the lesson by saying “[This] lesson is about making connec-tions between the abstract and the concrete.” On the board one sees pictures of“algebra tiles,” which will represent ones and x’s. There is a vertical line betweenthem, as reflected in Figs. 1 and 2.7
The goal is to “play the game” by moving or adjusting the objects according tocertain rules, so that you can “win the game” by having just one rectangle on oneside of the vertical bar, and a number of (white or dark) squares on the other side ofthe bar. The rules of the game are as follows:
7 These represent “2x + 3 = − 5” (Fig. 1) and “- 5 = 3x - 2” (Fig. 2) respectively, although the equations are notyet written. They will appear later in the lesson.
Fig. 1 The first algebra tiles game
Fig. 2 The second algebra tiles game
50 Schoenfeld et al.
Author's personal copy

1. You can add the same number of identical items to the collections on either side ofthe bar;
2. A dark square and a light square cancel each other out8 (i.e., (−1) + (1) = 0); and3. You can divide both sets of objects on either side of the vertical line by the same
number.
In pictures, the way you win the game in Fig. 1 is to begin by adding three dark squaresto both sides of the bar. This produces Fig. 3.
Then, because the three light-and-dark pairs on the left hand side cancel each otherout, they can be removed. What remains is shown in Fig. 4.
Because both sides of the bar in Fig. 4 can be divided by 2, you can obtain Fig. 5, towin the game.
In symbols, “playing the game” corresponds to the following algebraic moves:
2x + 3 = − 5 (The problem)− 3 = − 3 (These are equal, so you can add them to both sides)2x = − 8 (The result of the cancelation on the left, the addition on the right)x = − 4 (Division by 2 yields x by itself, thus solving for x).
8 There are also dark rectangles representing (− x). They cancel out the light rectangles.
Fig. 4 What remains after the “zero pairs” are removed
Fig. 3 Adding 3 dark squares to both sides
On Classroom Observations 51
Author's personal copy

Similarly, Fig. 2 represents the equation – 5 = 3x – 2; adding 2 to both sides yields theequation – 3 = 3x, and dividing by 3 yields −1 = x. That is, operating on the manipulativesis intended to give meaning to the symbolic operations one performs on the equations.
In the first part of the lesson the teacher walks the students through several iterationsof the game. Students work with tiles on their desks as she projects images like thefigures above on a screen in front of the classroom. In the next part the teacher leads theclass through the portion of the lesson called “Making the Connection,” in which shesolves for the unknown in an equation by simultaneously using the game and symbolicmanipulation. The students then work at their desks on similar problems in “GuidedPractice,” coming together as a whole class to review their solutions.
The teacher follows the script provided in an instructional manual closely, calling onstudents frequently for contributions, and checking for meaning. She begins by havingthe students model problem 1 on their desks. Then she asks what the first step is to winthe game. One student identifies the right step, and the teacher has another studentrepeat what the first student said, as a check. She then asks the class what they hadformed by adding the three dark tiles. A student says “zero pairs,” which in turn meansthat those “zero pairs” could be removed from the table.
In working the problem in Fig. 2, the teacher asks students if it matters that therectangles are on the right rather than the left. Students say no, and she reinforces theidea that the goal of the game is to get rectangles on one side of the line, boxes on theother. She then takes the students through the solution, asking about next steps or askingabout why they are taking that step, for example, “Who can raise their hand and tell me,why are we adding the opposites?” There are various responses, from which she picksout “zero pairs,” and she says they cancel and can be taken away. She demonstrates how.
The class then transitions to “Making the Connections,” with a split screen thatshows pictures on the left-hand side of the board the corresponding equations on theright-hand side of the board. As the teacher clicks through the sequence, solution stepsappear simultaneously on the left and right, so the students see the tiles and equationsunfolding at the same time. The teacher then checks the solution.
About half-way through the lesson, before the students are to do guided practice, theteacher lays out the method for checking solutions as follows.
First step…
Fig. 5 The configuration that wins the game
52 Schoenfeld et al.
Author's personal copy
[Writes: 1. Write original problem].
You need to write this down, because these are your steps to check. Mathematicsis not a spectator sport.
[Writes: 2. Substitute the value of x, whatever that value is].
The value of x in this problem is what? Negative 1.
…
and then Step 3 is:
[Writes: 3. left side will equal right side].
So, let’s go through this for our problem…”
She moves on to the next guided practice problem, and continues in that vein.
How the Different Frameworks Scored the Lesson
On its 4-point scale, FfT assigned the lesson scores of 3 on: Communicating WithStudents; Establishing a Culture for Learning; Engaging Students in Learning;Managing Classroom Procedures; and Using Assessment in Instruction. The lessonwas assigned a 2 on Using Questioning and Discussion Techniques. All of these scoresfit with the FfT rubrics: the class ran smoothly for the most part, with the teacher mostlyasking short-answer “checking their understanding” questions of the students.
MQI scorers for MET divided the lesson into four 7½ minute episodes, each ofwhich was assigned a score of 3 (out of a possible 3) for mathematical richness. Hencethe lesson received top scores with regard to the mathematics. Overall, the lesson wasassigned a holistic score of 2, with subscores of 3 for Explicitness and Thoroughness, 2for Student Participation in Meaning Making and Reasoning, 1 for Errors andImprecisions,9 and 2 for Working With Students and Mathematics. This too seems tofit with the rubric: the content of the lesson is about “making connections,” which isassigned top scores for mathematics; but the lesson is somewhat teacher-dominated andstudent voices are not always heard, so the holistic score and some of the particulars arerated as me dium rather than high.
As seen below, the TRU scores differ. The issues here are subtle, so we discuss themat some length before assigning scores. On the one hand, the main theme of the lesson is“making the connection;” the teacher repeats this often, and the curricular materials, asshown on the screen, display manipulatives and their symbolic representations side-by-side. This should predispose one to high mathematics scores. However, in the ways that
9 We did catch some slips on the part of the teacher, though not enough for us to downgrade the lesson thatmuch. We note that of the 11 videos in our sample of “very high or very low” scores, 9 received MQI scores of1 for errors and imprecisions, so the MQI scoring on that component of the rubric was very stringent.
On Classroom Observations 53
Author's personal copy
the lesson played out, few connections were supported or made. The presentation wasvery scripted and mechanical, with a focus on detail rather than the big picture, whichwould have allowed students to see the ways in which the steps they used to “play thegame” with manipulatives and to solve equations made sense in and of themselves, andthat they were linked. Our strong sense is that those connections were not supported ormade – that the focus on following “steps” was so rote as to obscure the connections.
The key idea in equation solving, whether with manipulatives or symbols, is thisgoal: to determine the value of “x” (or a single rectangle) by getting it “alone,” on oneside of the equation. To do so one uses certain “legal” moves – adding the samequantities to both sides of the equation, dividing both sides of the equation by the samequantity (if you have 3×, you divide by 3 to get x), etc. Understanding that you aretrying to get x by itself, and what the rules are, shapes why you make the “moves” youdo and gives meaning to the mathematical procedures. The game isn’t about “steps,”it’s about moving sensibly toward the desired mathematical goal.
A key component of TRU mathematics scoring relates to the mathematical coher-ence of a lesson, as experienced by the students. The most compelling evidence that thestudents did not experience the mathematics as coherent came about 2/3 of the waythrough the lesson segment, when the class was “Making the Connection” (the title ofthe slide projected on the board) as they worked through the equation
3x−3 ¼ 3:
The teacher said, “go ahead and solve it. Let’s see what you get when you solve it.” Shethen asked the students, “show me on your fingers the value of x.” Student after studentput 6 fingers in the air. The reason: they had done the work with “zero pairs,” andgotten the equation
3x ¼ 6:
With the 6 by itself on the right hand side of the equation, the students indicated that the“answer” was 6.
Simply put, the students would not have done that if they understood that the goal ofthe “game” was to get x by itself. We believe that the students were so immersed instep-by-step procedures that they lost sight of the goal of the mathematics; they did astep that resulted in a number by itself on the right hand side of the equation, andreported the result of that step as “the answer.” Indeed, the teacher’s response, “Itwasn’t 6, people. Look at this step right here,” reinforced the notion of step-by-stepprocedures rather than the big picture that should frame the choice of steps.
TRU Dimension 1, the Mathematics. The content was presented in a rote andlargely if not wholly step-by-step manner, failing to address understandings thatmake for mathematical coherence. The lesson was at grade level, making for aminimum score of 1.5, and there were some connections, so it might scoresomewhere between a 1.5 and a 2.Dimension 2, Cognitive Demand. In this lesson, the cognitive demand of doingeach step (the primary activity during class time) was negligible. The students did
54 Schoenfeld et al.
Author's personal copy

not have a sense of the larger goals of the enterprise. As such, there was noopportunity for “productive struggle.” This is a clear 1 on the TRU rubric.Dimension 3, Equitable Access to Mathematical Content. Determining access isalways difficult, because even one lesson is not enough to sample for participation.The teacher seems to call repeatedly on a small number of students, but manystudents do get called on and many do raise their hands when the teacher asks fortheir answers to a question. Participation might thus be in the 1.5 to 2 range.Dimension 4, Agency, Ownership, and Identity. This lesson is teacher driven: theteacher is the arbiter of right/wrong, and she lets the students know in no uncertainterms when they’re wrong. Student ideas are not built on, and the teacher seems attimes to “hear” from a chorus of answers only the answers that enable her to moveforward with the lesson. This is a clear 1 on the TRU rubric.Dimension 5, Formative Assessment. To be considered formative assessment, thelesson must elicit student thinking and then react to incomplete or incorrect ideasby building on what is correct and providing opportunities to understand what isincorrect, and repair it. That did not happen. When students gave incorrectanswers, she told them the answers were wrong and demonstrated how to dothings right. This too is a clear 1.
Discussion of the Different Codings of Video C
As noted above, the lesson was clearly organized and teacher controlled; it was wellrun, which explains the overall “proficient” score from FfT. What is interesting inthis video is the significant differences between MQI and TRU. MQI assigned topscores for the mathematics, and a holistic score of 2. TRU found the mathematicsdeeply lacking, and assigned low scores related to dimensions 2, 4, and 5, whichhave to do with the ways students interact with the mathematics. An overall holisticscore for the lesson (or its rough equivalent, the average of the dimension scores)would be quite low.
We have already seen that attention to domain knowledge is consequential, in thatMQI and TRU, which attend to domain knowledge seriously, gave substantiallydifferent ratings to Videos A and B than did FfT. But, the ratings of Video C showthat there are consequential differences in the ways that the two mathematics frame-works view the lesson. The high math scores from MQI may have come from the factthat the connections between representations were shown on the board and werefrequently mentioned by the teacher. The low TRU scores come from the fact that asthe students experienced the lesson, such connections clearly were not made – more-over, the rote presentation of the lesson obscured those connections. The framing ofTRU is primarily focused on student opportunities to connect to the mathematics, andto develop a sense of themselves as people who can do mathematics; TRU assignedscores of 1 to each of the dimensions 2, 4, and 5. The analogue in MQI, “studentparticipation in meaning making and reasoning,” was scored a 2. One can see a warrantfor this, in that students did participate in “local reasoning” – e.g., stating that putting adark square atop a light square “made a zero pair,” which could be removed. But theTRU framework deems such actions, in a larger context where the actions seem to havelittle or no meaning, not to be sense making.
On Classroom Observations 55
Author's personal copy
In short, the two mathematics frameworks, while often agreeing on the overallquality of a lesson, have somewhat different focal emphases and represent somewhatdifferent mathematical and pedagogical values. MQI assigned credit for local reasoning(zero pairs), while the TRU threshold for mathematical sense making – specifically formaking connections between representations – was much higher.
Discussion
The improvement of STEM instruction will call for well designed and appropriateclassroom observation tools and frameworks. The first part of this paper set forth fourdesiderata for classroom observation frameworks, summarized in Table 1. We suggestthat individuals or districts considering the use of observation frameworks should takesuch desiderata into account when deciding which framework to use. First, is theframework theoretically justified in a powerful and meaningful way? Second, does ithighlight a small number of things that can be worked on productively, and is itmanageable in and of itself? Third, is the framework appropriate for one’s intendedpurposes? A particular framework may be useful for research but too convoluted forprofessional development, or it may be good at assigning scores for purposes ofevaluation but not helpful for professional development or research into powerfulteaching. Finally, is it reliable and valid? Especially given some high stakes uses ofevaluations, scoring rubrics must have the appropriate psychometric properties. Butmore important, they must capture what counts. If a rubric does not embody the valuesthat one hopes to support, its psychometric properties are of minor import.
The second part of this paper addressed questions of content specificity. The focus wason mathematics instruction, but the issues apply to all of STEM education. We docu-mented the ways in which three observation frameworks – the Framework for Teaching(FfT), Mathematical Quality of Instruction (MQI), and Teaching for RobustUnderstanding (TRU) – characterize three different classroom lessons. The numbersinvolved are not important; all three frameworks can be used reliably, and, in Kane’s(1992, 2013) terms, the frameworks have some validity, given the underlying values theyrepresent. The crucial issue is the substance represented by the numbers – just what doeseach observation rubric deem important with regard to teaching and learning?
The discussion of Videos A and B shows that whether a rubric is discipline-specific orgeneral makes a difference. While there are certainly aspects of “good or bad pedagogy”that are discipline-independent, it is also the case that one needs to have a deep under-standing of the content to know whether the instruction is providing students with accessto the content and practices that truly comprise disciplinary proficiency. The videos alsosuggest that there is some tension between observation frameworks that privilege certainkinds of “demonstrate and practice” pedagogy and frameworks that privilege activitystructures that have students grapple, sometimes in messy ways, with complex ideas.These are value judgments – and opting for one observation system or another meansmaking a value choice about what matters in classrooms. Specifically, a well-managedSTEM classroom in which students are only superficially engaged with interdisciplinarycontent and applications might score well on a rubric that focuses largely on managementand is indifferent to content; conversely, a somewhat “messy” classroom in whichstudents are engaged in sense making might score poorly on that rubric. Content matters.
56 Schoenfeld et al.
Author's personal copy
But it’s not only content, it’s what’s taken to be important in that content. Thediscussion of Video C indicates that, even when observation frameworks do attend todisciplinary content and practices, the same instruction can be seen very differently.What counts as a rich instructional environment in science, technology, engineering,and mathematics, is in the eye of the beholder – and those values will be deeplyembedded in the coding rubric for any observation framework.10
Consider the three purposes for which observation rubrics are typically used. Thefirst is research. Here values matter both for the observation rubric and outcomemeasures. Ultimately, one wants to identify which observation frameworks best get atwhat counts in classrooms. But, “what counts” is a matter of values, not only forobservation rubrics but for outcome measures: how well do those outcome measuresrepresent the student proficiencies one would like to see? This is an ongoing researchissue, given that standards and assessments evolve.
The second is professional development (PD). Here too there are two sets of issues.The first has to do with the values inherent in the observation framework. Everyframework privileges certain things – whether they be a form of pedagogy or a viewof what matters in disciplinary terms. Thus, using a particular observational frameworkas a component of a PD system implies having chosen certain aspects of learning andinstruction as being more important than others. Those are consequential decisions. Thesecond set of issues has to do with potential utility for PD. Does the framework focuson things that are not only important and consistent with intended learning goals andvalues, but actually implementable as part of a PD program?
The third is evaluation. To put things simply, major decisions about the future ofteachers and schools should be grounded in what really, really matters.
In sum, the choice of observation framework, for any of the purposes above, isconsequential; such frameworks must be carefully examined to see how they are insynch with one’s goals for using them. Our hope is that the discussions in this paper haveillustrated some of the issues involved in the use of observation frameworks, and willsupport both their careful use and their improvement over time. The ways we concep-tualize and assess STEM learning environments will shape the growth of the field.
Acknowledgments The authors gratefully acknowledge support for this work from The Algebra TeachingStudy (NSF Grant DRL-0909815 to PI Alan Schoenfeld, U.C. Berkeley, and NSF Grant DRL-0909851 to PIRobert Floden, Michigan State University), and of The Mathematics Assessment Project (Bill and MelindaGates Foundation Grants OPP53342 PIs Alan Schoenfeld, U. C Berkeley, and Hugh Burkhardt and MalcolmSwan, The University of Nottingham). They are grateful for the ongoing collaborations and support frommembers of the Algebra Teaching Study and Mathematics Assessment Project teams.
Compliance with Ethical Standards
Conflict of Interest As noted above, the authors are the developers of the TRU framework. To address theissue of positionality, we have drawn liberally from source materials for the FfT and MQI, and had extensiveexchanges with Charlotte Danielson (FfT) and Jennifer Lewis (MQI) regarding the accuracy of ourcharacterizations.
10 This is parallel to the issue of assessing student understanding. A test of STEM content can focus on thingsthat are superficial, or on real sense-making. The same is the case for the assessment of classroomenvironments.
On Classroom Observations 57
Author's personal copy
References
Beeby, T., Burkhardt, H., & Caddy, R. (1980). SCAN: Systematic classroom analysis notation for mathematicslessons. Nottingham: Shell Centre for Mathematics Education.
Borko, H., Eisenhart, M., Brown, C., Underhill, R., Jones, D., & Agard, P. (1992). Learning to teach hardmathematics: Do novice teachers and their instructors give up too easily? Journal for Research inMathematics Education, 23(3), 194–222.
Boston, M., Bostic, J., Lesseig, K., & Sherman, M. (2015). A comparison of mathematics classroomprotocols. Mathematics Teacher Educator, 3(2), 154–175.
California Department of Education (2018). Science, Technology, Engineering, & Mathematics (STEM)information. Accessed April 2, 2018 from https://www.cde.ca.gov/pd/ca/sc/stemintrod.asp.
Cohen, D., Raudenbush, S., & Ball, D. (2003). Resources, instruction, and research. Educational Evaluationand Policy Analysis, 25(2), 1–24.
Common Core State Standards Initiative (2010). Common Core State Standards for Mathematics.Downloaded June 4, 2010 from http://www.corestandards.org/the-standards.
Danielson, C. (2011). The Framework for Teaching evaluation instrument, 2011 Edition.Downloaded April 1,2012, from http://www.danielsongroup.org/article.aspx?page=FfTEvaluationInstrument.
Danielson, C. (August 14, 2015). Personal communication.Danielson Group. (2015). The Framework. Downloaded July 6, 2015, from https://danielsongroup.
org/framework/.Gitomer, D., & Bell, C. (Eds.). (2016). Handbook of research on teaching (5th ed.). Washington, DC:
American Educational Research Association.Glaser, B., & Strauss, A. (1967). The discovery of grounded theory: Strategies for qualitative research.
Chicago: Aldine.Hill, H., Charalambous, C., & Kraft, M. (2012). When rater reliability is not enough: Teacher observation
systems and a case for their generalizability. Educational Researcher, 41(2), 56–64. https://doi.org/10.3102/0013189X12437203.
Junker, B., Matsumura, L. C., Crosson, A., Wolf, M. K., Levison, A., Weisberg, Y., & Resnick, L. (2004).Overview of the instructional quality assessment. San Diego: Paper presented at the annual meeting of theAmerican Educational Research Association.
Kane, M. T. (1992). An argument-based approach to validity. Psychological Bulletin, 112(3), 527–535.Kane, M. T. (2013). Validating the interpretations and uses of test scores. Journal of Educational
Measurement, 50(1), 1–73.Learning Mathematics for Teaching Project. (2011). Measuring the mathematical quality of instruction.
Journal of Mathematics Teacher Education, 14, 25–47. https://doi.org/10.1007/s10857-010-9140-1.Ma, L. (1999). Knowing and teaching elementary mathematics. Mahwah: Erlbaum.Marder, M., &Walkington, C. (2012) UTeach Teacher Observation Protocol. Downloaded April 1, 2012, from
https://wikis.utexas.edu/pages/viewpageattachments.action?pageId=6884866&sortBy=date&highlight=UTOP_Physics_2009.doc.&.
Measures of Effective Teaching Longitudinal Database. (2016). http://www.icpsr.umich.edu/icpsrweb/METLDB/.“Instruments,” http://www.icpsr.umich.edu/icpsrweb/content/METLDB/grants/instruments.html. AccessedJanuary 1, 2016.
Measures of Effective Teaching Project (2010). The MQI protocol for classroom observations. Retrieved onJuly 4, 2012, from http://metproject.org/resources/MQI_10_29_10.pdf
Measures of Effective Teaching Project (2012). Gathering feedback for teaching. Retrieved on July 4, 2012,from the Bill and Melinda Gates Foundation website: http://metproject.org/downloads/MET_Gathering_Feedback_Research_Paper.pdf
Messick, S. (1989). Validity. In R. L. Linn (Ed.), Educational measurement (3rd ed., pp. 13–103). New York:American Council on Education and Macmillan.
National Research Council. (2001). Adding it up: Helping children learn mathematics. Washington DC:National Academy Press.
PACT Consortium (2012) Performance Assessment for California Teachers. (2012) A brief overview of thePACT assessment system. Downloaded April 1, 2012, from http://www.pacttpa.org/_main/hub.php?pageName=Home.
Partnership for Assessment of Readiness for College and Careers. About PARCC. (2014) Downloaded April1, 2014 from http://www.parcconline.org/about.
Pianta, R., La Paro, K., & Hamre, B. K. (2008). Classroom assessment scoring system. Baltimore: Paul H.Brookes.
58 Schoenfeld et al.
Author's personal copy

Schoenfeld, A. H. (2013). Classroom observations in theory and practice. ZDM, the International Journal ofMathematics Education, 45, 607–621. https://doi.org/10.1007/s11858-012-0483-1.
Schoenfeld, A. H. (2014). What makes for powerful classrooms, and how can we support teachers in creatingthem? Educational Researcher, 43(8), 404–412. https://doi.org/10.3102/0013189X1455.
Schoenfeld, A. H. (July 9, 2016). Personal communication.Schoenfeld, A. H. (2017). Uses of video in understanding and improving mathematical thinking and teaching.
Journal of Mathematics Teacher Education, 20(5), 415–432. https://doi.org/10.1007/s10857-017-9381-3.Schoenfeld, A. H. (2018). Video analyses for research and professional development: The teaching for robust
understanding (TRU) framework. In C. Y. Charalambous & A.-K. Praetorius (Eds.), Studying instruc-tional quality in mathematics through different lenses: In search of common ground. An issue of ZDM:Mathematics Education. Manuscript available at https://doi.org/10.1007/s11858-017-0908-y.
Schoenfeld, A. H., & Kilpatrick, J. (2008). Toward a theory of proficiency in teaching mathematics. In D.Tirosh & T. Wood (Eds.), International handbook of mathematics teacher education, volume 2: Tools andprocesses in mathematics teacher education (pp. 321–354). Rotterdam: Sense Publishers.
Schoenfeld, A. H., Floden, R. E., & The Algebra Teaching Study and Mathematics Assessment Project.(2014). The TRU Math Scoring Rubric. Berkeley, CA & E. Lansing, MI: Graduate School of Education,University of California, Berkeley & College of Education, Michigan State University. Retrieved fromhttp://ats.berkeley.edu/tools.html and http://map.mathshell.org/trumath.php.
Schoenfeld, A. H., Floden, R. E., & The algebra teaching study and mathematics assessment project. (2015).TRUMath Scoring Guide Version Alpha. Berkeley, CA& E. Lansing, MI: Graduate School of Education,University of California, Berkeley & College of Education, Michigan State University. Retrieved fromhttp://ats.berkeley.edu/tools.html and http://map.mathshell.org/trumath.php.
Smarter Balanced Assessment Consortium. (2014) Home. Downloaded April 1, 2014, from http://www.smarterbalanced.org/.
Smarter Balanced Assessment Consortium. (2015) Content specifications for the summative assessment of thecommon core state standards for mathematics (revised draft, July 2015). Downloaded August 1, 2015,from http://www.smarterbalanced.org/wordpress/wp-content/uploads/2011/12/Mathematics-Content-Specifications_July-2015.pdf
St. John, M. (2007). Investing in an improvement infrastructure. Downloaded April 1, 2011, fromhttp://nmpmse.pbworks.com/f/building+an+infrastructure.pdf
Stigler, J, & Hiebert, J. (1999). The teaching gap. New York: Free Press.Thompson, P., & Thompson, A. (1994). Talking about rates conceptually, part I: A teacher's struggle. Journal
for Research in Mathematics Education, 25(3), 279–303.University of Michigan. (2006). Learning mathematics for teaching. A coding rubric for measuring the
mathematical quality of instruction (Technical Report LMT1.06). Ann Arbor: University of Michigan,School of Education.
On Classroom Observations 59
Author's personal copy