AUTHOR MacFarland, Thomas W. INSTITUTION PUB DATE PUB … · Notes for SPSS-X. 3. ULTRIX 2.3....
44
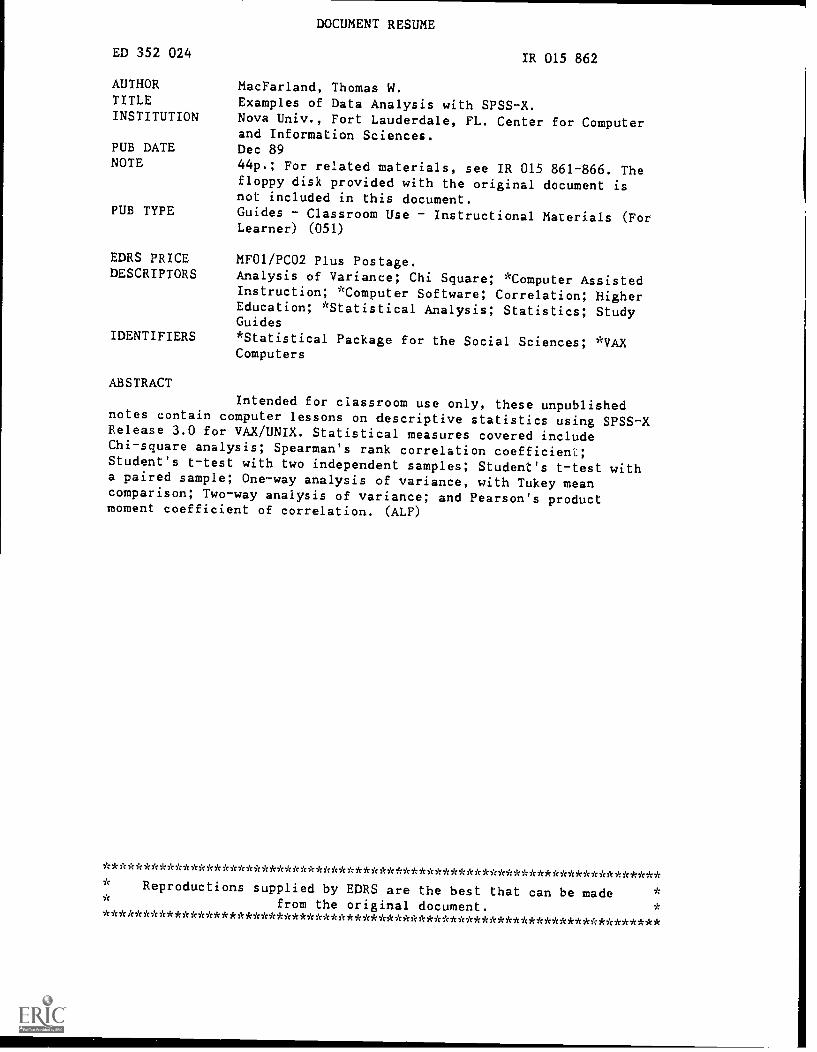
DOCUMENT RESUME ED 352 024 IR 015 862 AUTHOR MacFarland, Thomas W. TITLE Examples of Data Analysis with SPSS-X. INSTITUTION Nova Univ., Fort Lauderdale, FL. Center for Computer and Information Sciences. PUB DATE Dec 89 NOTE 44p.; For related materials, see IR 015 861-866. The floppy disk provided with the original document is not included in this document. PUB TYPE Guides Classroom Use Instructional Materials (For Learner) (051) EDRS PRICE MF01/PCO2 Plus Postage. DESCRIPTORS Analysis of Variance; Chi Square; *Computer Assisted Instruction; *Computer Software; Correlation; Higher Education; *Statistical Analysis; Statistics; Study Guides IDENTIFIERS *Statistical Package for the Social Sciences; *VAX Computers ABSTRACT Intended for classroom use only, these unpublished notes contain computer lessons on descriptive statistics using SPSS-X Release 3.0 for VAX/UNIX. Statistical measures covered include Chi-square analysis; Spearman's rank correlation coefficient; Student's t-test with two independent samples; Student's t-test with a paired sample; One-way analysis of variance, with Tukey mean comparison; Two-way analysis of variance; and Pearson's product moment coefficient of correlation. (ALF) *********************************************************************** Reproductions supplied by EDRS are the best that can be made from the original document. ***;c*******************************************************************
Transcript of AUTHOR MacFarland, Thomas W. INSTITUTION PUB DATE PUB … · Notes for SPSS-X. 3. ULTRIX 2.3....
DOCUMENT RESUME
ED 352 024 IR 015 862
AUTHOR MacFarland, Thomas W.TITLE Examples of Data Analysis with SPSS-X.INSTITUTION Nova Univ., Fort Lauderdale, FL. Center for Computer
and Information Sciences.PUB DATE Dec 89NOTE 44p.; For related materials, see IR 015 861-866. The
floppy disk provided with the original document isnot included in this document.
PUB TYPE Guides Classroom Use Instructional Materials (ForLearner) (051)
EDRS PRICE MF01/PCO2 Plus Postage.DESCRIPTORS Analysis of Variance; Chi Square; *Computer Assisted
Instruction; *Computer Software; Correlation; HigherEducation; *Statistical Analysis; Statistics; StudyGuides
IDENTIFIERS *Statistical Package for the Social Sciences; *VAXComputers
ABSTRACT
Intended for classroom use only, these unpublishednotes contain computer lessons on descriptive statistics using SPSS-XRelease 3.0 for VAX/UNIX. Statistical measures covered includeChi-square analysis; Spearman's rank correlation coefficient;Student's t-test with two independent samples; Student's t-test witha paired sample; One-way analysis of variance, with Tukey meancomparison; Two-way analysis of variance; and Pearson's productmoment coefficient of correlation. (ALF)
***********************************************************************Reproductions supplied by EDRS are the best that can be made
from the original document.***;c*******************************************************************
vottAltili 11%01
42,
125
Center for Computer and Information Sciences
EXAMPLES OF DATA ANALYSIS
WITH SPSSX
THOMAS W. MACFARLAND, Ed.D.
U 5 DEPARTMENT OF EDUCATIONOffer of Educational Research and improvemem
EDUCATIONAL RESOUROES INFGRMATIeNCENTER (ERIC)
T',.1 document haS been reproduced asrecerr.ed from the Person or orgam:at,oorrornetrng .1
0 Moor changes have been made U nprovereproduction quahry
Penis of view or oprmons Slated ,n thIS (Jet umeat do not necessarrry represent oPrcrarDEFIr DOseron or botch
FOR CLASSROOM USE ONLY
1 ANNIVERSARY 2Setting the Pace in Education
UST COPY AVAILABLE
"PERMISSION TO nEPRODUCE THISMATERIAL HAS BEEN GRANTED BY
Thomas 11acFar 1 and
TO THE EDUCATIONAL RESOURCESINFORMATION CENTER (ERIC)
Notes for SPSS-X
1
EXAMPLES OF DATA ANALYSIS WITH SPSS-X
Thomas W. MacFarland, Ed.D.
Unpublished notes of the author
December, 1989
Notes for SPSS-X
2
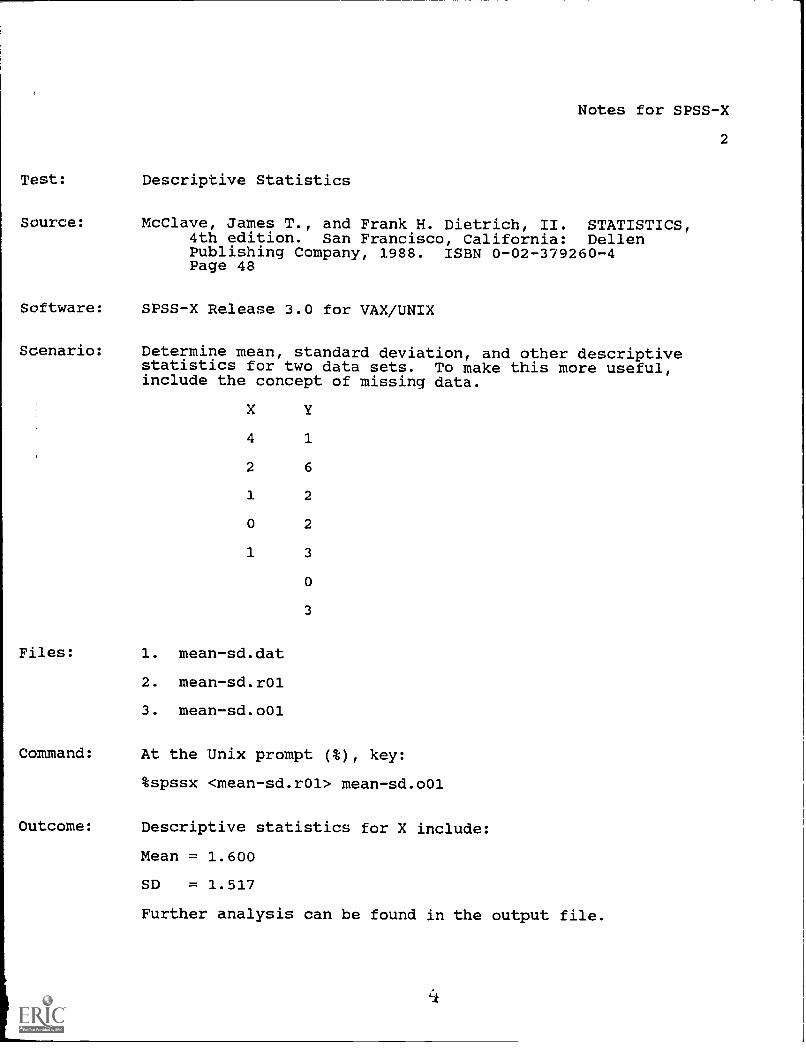
Test: Descriptive Statistics
Source: McClave, James T., and Frank H. Dietrich, II. STATISTICS,4th edition. San Francisco, California: DellenPublishing Company, 1988. ISBN 0-02-379260-4Page 48
Software: SPSS-X Release 3.0 for VAX/UNIX
Scenario:
Files:
Determine mean, standard deviation, and other descriptivestatistics for two data sets. To make this more useful,include the concept of missing data.
X
4 1
2 6
1 2
0 2
1 3
0
3
1. mean-sd.dat
2. mean-sd.r01
3. mean-sd.o01
Command: At the Unix prompt (%), key:
%spssx <mean-sd.r01> mean-sd.o01
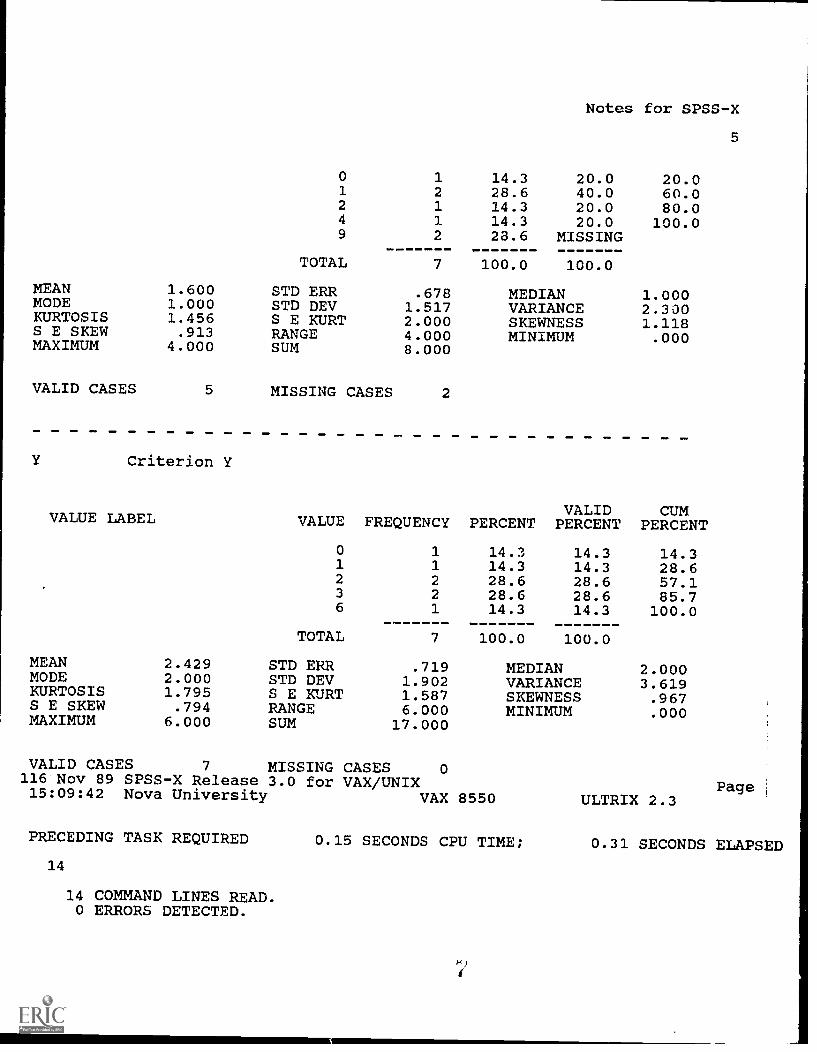
Outcome: Descriptive statistics for X include:
Mean = 1.600
SD = 1.517
Further analysis can be found in the output file.
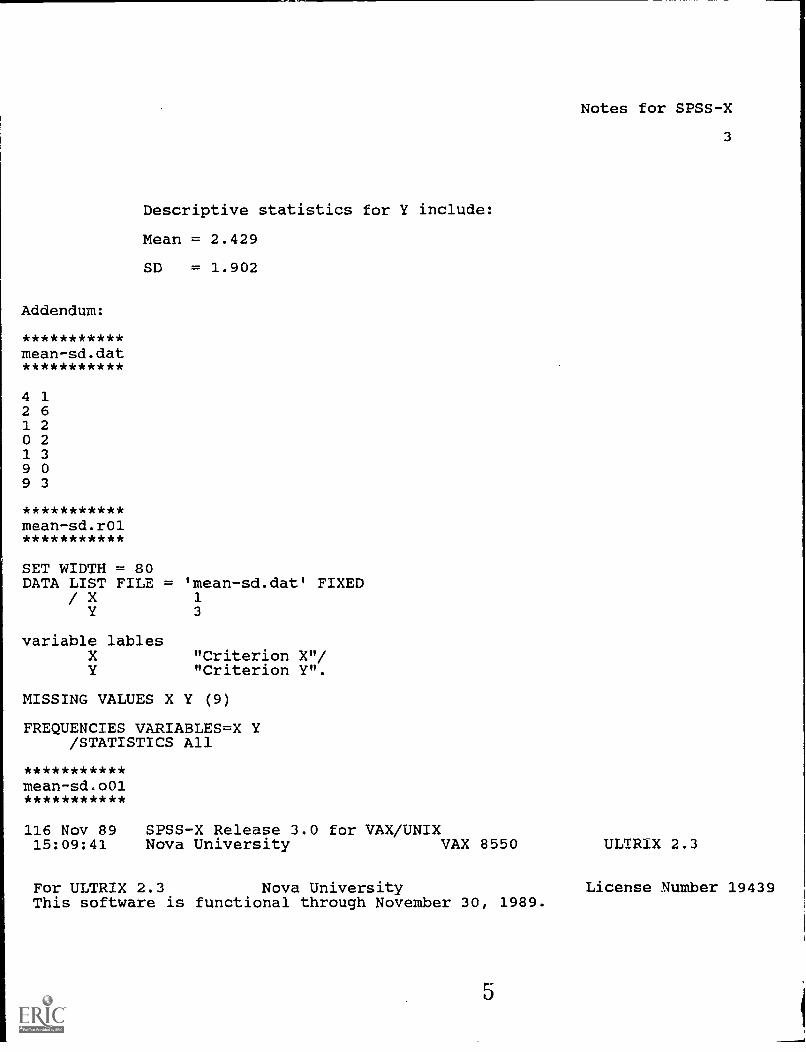
Descriptive statistics for Y include:
Mean = 2.429
SD = 1.902
Addendum:
***********mean-sd.dat***********
4 12 61 20 21 3
9 09 3
***********mean-sd.r01***********
SET WIDTH = 80DATA LIST FILE = 'mean-sd.dat' FIXED
/ X 1Y 3
variable lablesXY
"Criterion X"/"Criterion Y".
MISSING VALUES X Y (9)
FREQUENCIES VARIABLES=X Y/STATISTICS All
***********mean-sd.o01***********
116 Nov 89 SPSS-X Release 3.0 for VAX/UNIX15:09:41 Nova University VAX 8550
For ULTRIX 2.3 Nova UniversityThis software is functional through November 30, 1989.
5
Notes for SPSS-X
3
ULTRIX 2.3
License Number 19439
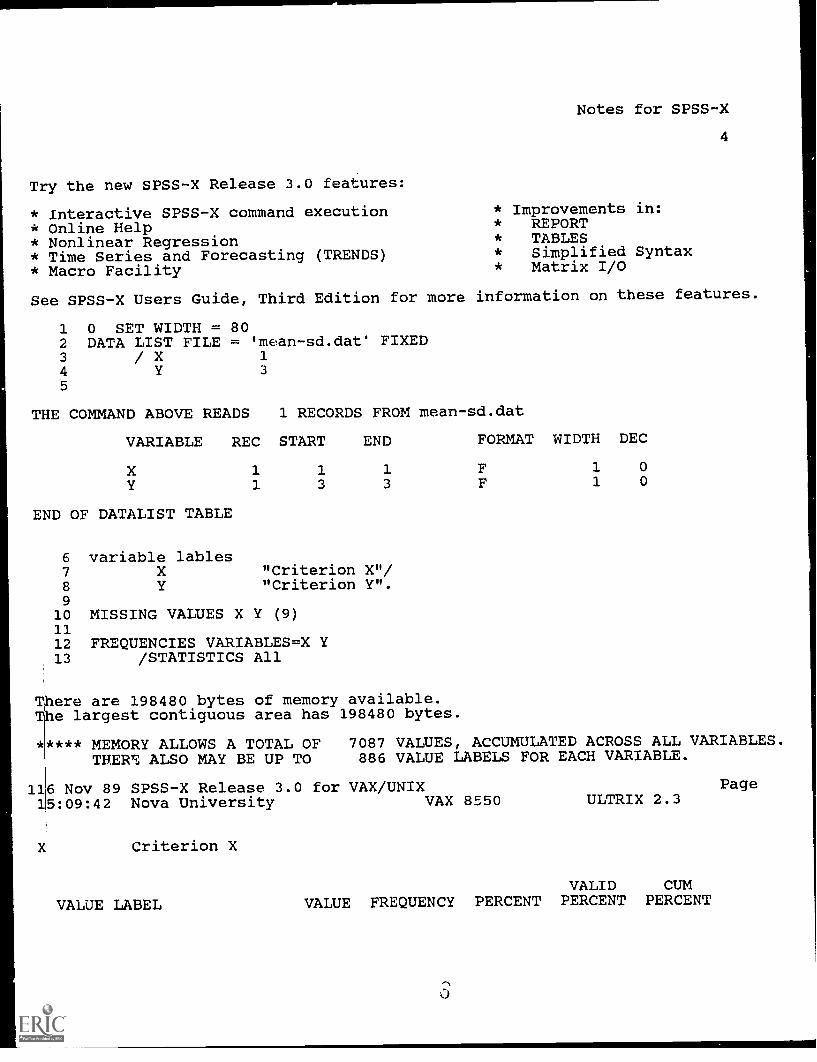
Try the new SPSS-X Release 3.0 features:
* Interactive SPSS-X command execution* Online Help* Nonlinear Regression* Time Series and Forecasting (TRENDS)* Macro Facility
Notes for SPSS-X
* Improvements in:* REPORT* TABLES* Simplified Syntax* Matrix I/O
4
See SPSS-X Users Guide, Third Edition for more information on these features.
1 0 SET WIDTH = 802 DATA LIST FILE = 'mean-sd.datm FIXED3 / X 1
4 Y 3
5
THE COMMAND ABOVE READS 1 RECORDS FROM mean-sd.dat
VARIABLE REC START END FORMAT WIDTH DEC
X 1 1 1 F 1 0
1 3 3 F 1 0
END OF DATALIST TABLE
6 variable lables7 X "Criterion X"/8 Y "Criterion Y".910 MISSING VALUES X Y (9)1112 FREQUENCIES VARIABLES=X Y13 /STATISTICS All
There are 198480 bytes of memory available.The largest contiguous area has 198480 bytes.
111
**** MEMORY ALLOWS A TOTAL OF 7087 VALUES, ACCUMULATED ACROSS ALL VARIABLES.THERE ALSO MAY BE UP TO 886 VALUE LABELS FOR EACH VARIABLE.
6 Nov 89 SPSS-X Release 3.0 for VAX/UNIX Page5:09:42 Nova University VAX 8550 ULTRIX 2.3
X Criterion X
VALID CUMVALUE LABEL VALUE FREQUENCY PERCENT PERCENT PERCENT
Notes for SPSS-X
5
0 1 14.3 20.0 20.01 2 28.6 40.0 60.02 1 14.3 20.0 80.04 1 14.3 20.0 100.09 2 23.6 MISSING
TOTAL 7 100.0 100.0
MEAN 1.600 STD ERR .678 MEDIAN 1.000MODE 1.000 STD DEV 1.517 VARIANCE 2.300KURTOSIS 1.456 S E KURT 2.000 SKEWNESS 1.118S E SKEW .913 RANGE 4.000 MINIMUM .000MAXIMUM 4.000 SUM 8.000
VALID CASES 5 MISSING CASES 2
Y Criterion Y
VALUE LABEL VALUE FREQUENCY PERCENTVALIDPERCENT
CUMPERCENT
0 1 14.3 14.3 14.31 1 14.3 14.3 28.62 2 28.6 28.6 57.13 2 28.6 28.6 85.76 1 14.3 14.3 100.0
TOTAL 7 100.0 100.0
MEAN 2.429 STD ERR .719 MEDIAN 2.000MODE 2.000 STD DEV 1.902 VARIANCE 3.619KURTOSIS 1.795 S E KURT 1.587 SKEWNESS .967S E SKEW .794 RANGE 6.000 MINIMUM .000MAXIMUM 6.000 SUM 17.000
VALID CASES 7 MISSING CASES 0116 Nov 89 SPSS-X Release 3.0 for VAX/UNIX15:09:42 Nova University VAX 8550
PRECEDING TASK REQUIRED
14
14 COMMAND LINES READ.0 ERRORS DETECTED.
PageULTRIX 2.3
0.15 SECONDS CPU TIME; 0.31 SECONDS ELAPSED
Notes for SPSS-X
6
0 WARNINGS ISSUED.0 SECONDS CPU TIME.1 SECONDS ELAPSED TIME.
END OF JOB.
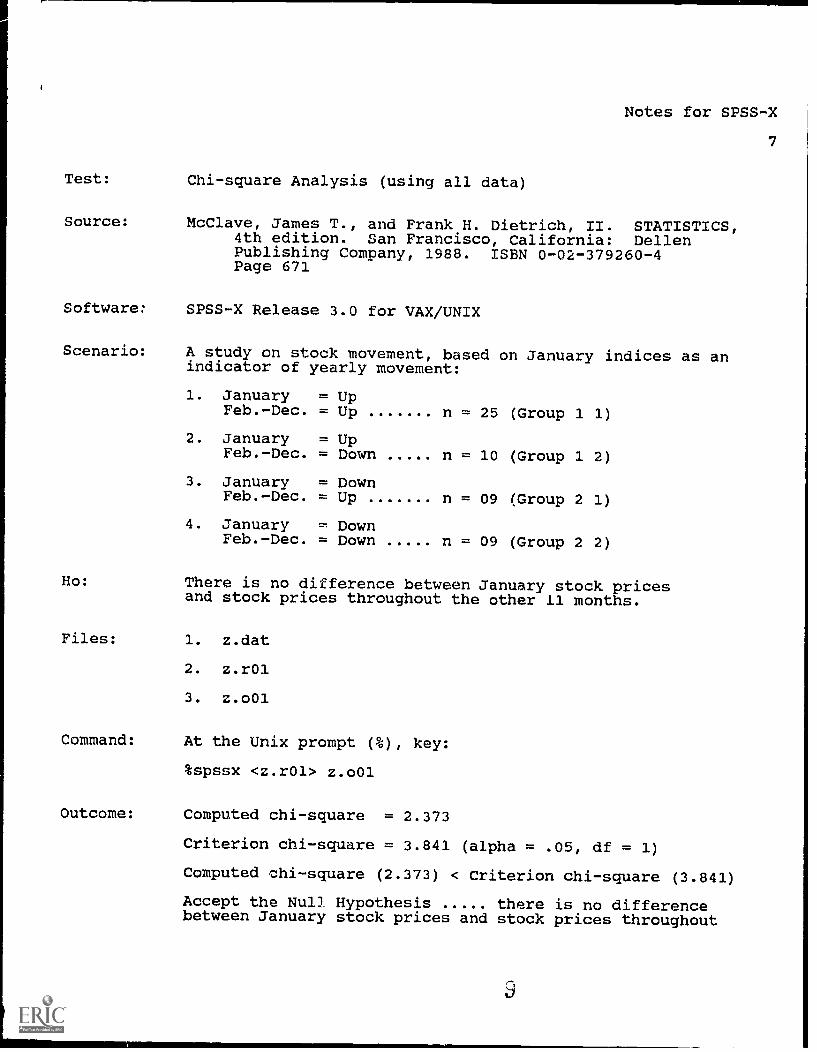
Test: Chi-square Analysis (using all data)
Source:
Notes for SPSS-X
7
McClave, James T., and Frank H. Dietrich, II. STATISTICS,4th edition. San Francisco, California: DellenPublishing Company, 1988. ISBN 0-02-379260-4Page 671
Software; SPSS-X Release 3.0 for VAX/UNIX
Scenario: A study on stock movement, based on January indices as anindicator of yearly movement:
1. January = UpFeb.-Dec. = Up n = 25 (Group 1 1)
2. January = UpFeb.-Dec. = Down n = 10 (Group 1 2)
3. January = DownFeb.-Dec. = Up n = 09 (Group 2 1)
4. January -,-- DownFeb.-Dec. = Down n = 09 (Group 2 2)
Ho: There is no difference between January stock pricesand stock prices throughout the other 11 months.
Files: 1. z.dat
2. z.r01
3. z.o01
Command: At the Unix prompt (%), key:
%spssx <z.r01> z.o01
Outcome: Computed chi-square = 2.373
Criterion chi-square = 3.841 (alpha = .05, df = 1)
Computed chi-square (2.373) < Criterion chi-square (3.841)
Accept the Null Hypothesis there is no differencebetween January stock prices and stock prices throughout

the other 11 months.
Addendum:
*****z.dat*****
01 1 102 1 103 1 104 1 105 1 106 1 107 1 108 1 109 1 110 1 111 1 112 1 113 1 1
14 1 115 1 116 1 1f7 1 118 1 119 1 120 1 121 1 122 1 123 1 124 1 125 1 126 1 227 1 228 1 229 1 230 1 231 1 232 1 233 1 234 1 235 1 236 2 137 2 138 2 139 2 140 2 141 2 142 2 142 2 1
10
Notes for SPSS-X
8
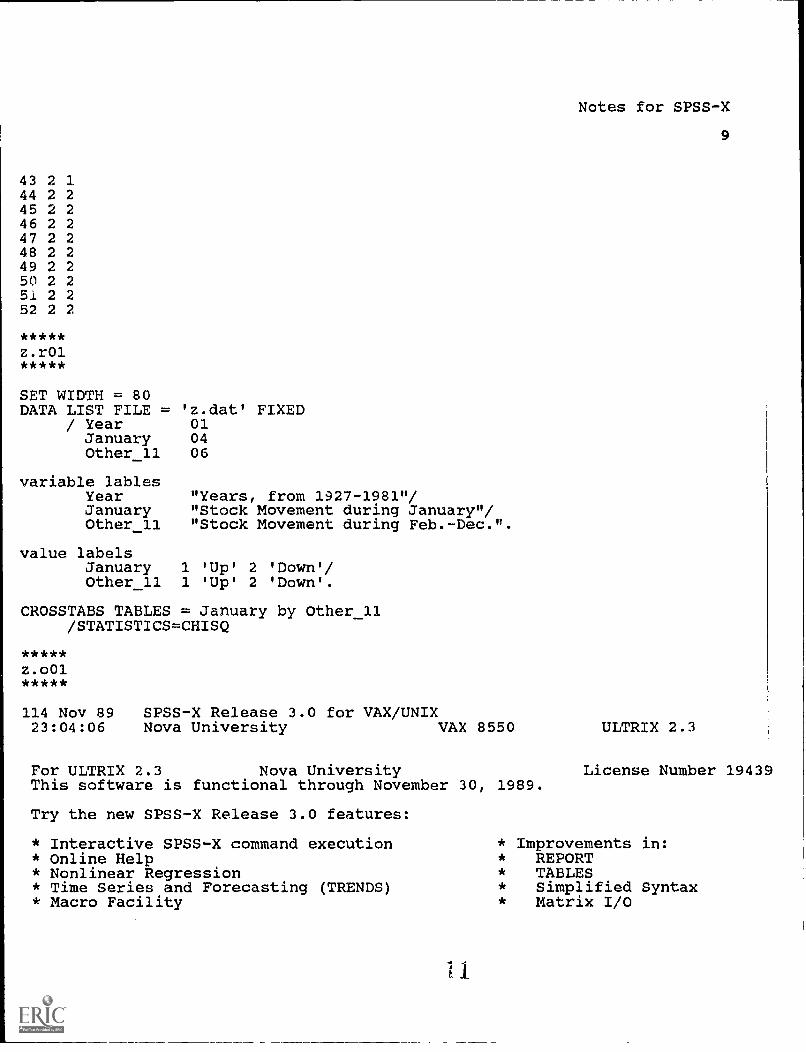
43 2 1
44 2 2
45 2 2
46 2 2
47 2 2
48 2 2
49 2 2
50 2 2
5i 2 2
52 2 2
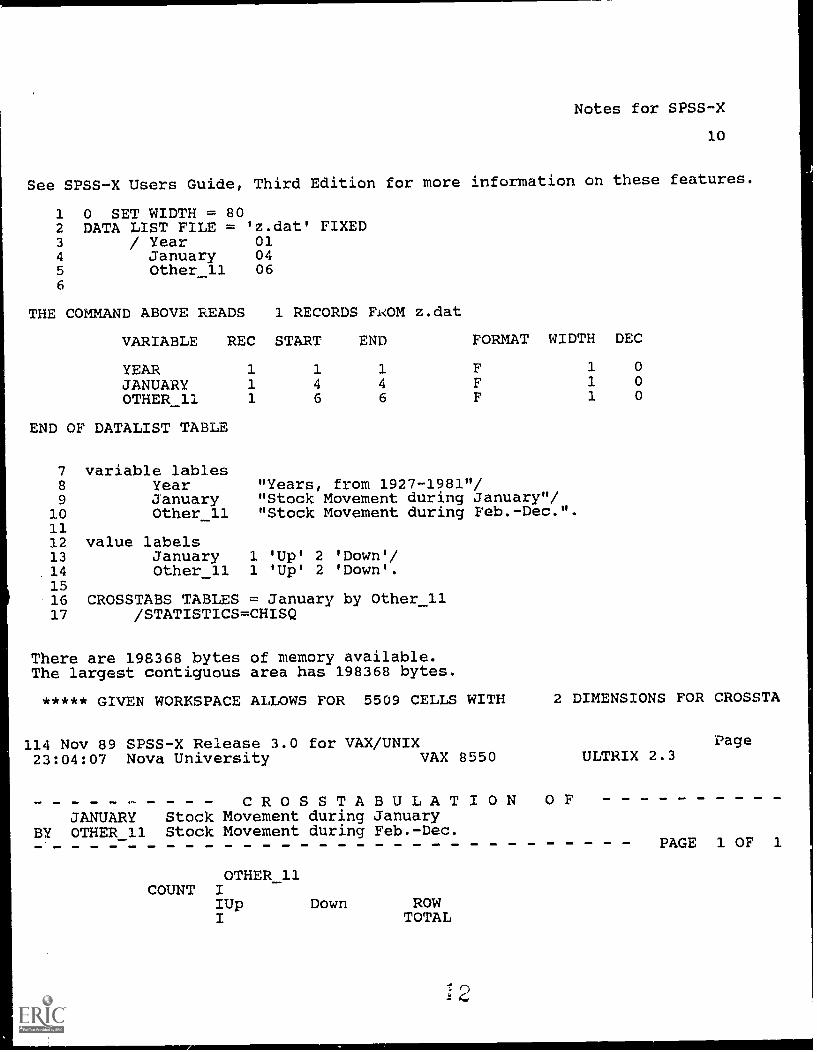
SET WIDTH = 80DATA LIST FILE = 'z.dat' FIXED
/ Year 01January 04Other 11 06
variable lablesYearJanuaryOther 11
"Years, from 1927-1981"/"Stock Movement during January"/"Stock Movement during Feb.-Dec.".
value labelsJanuary 1 'Up' 2 'Down'/Other_11 1 'Up' 2 'Down'.
CROSSTABS TABLES = January by Other_11/STATISTICS=CHISQ
114 Nov 89 SPSS-X Release 3.0 for VAX/UNIX23:04:06 Nova University VAX 8550
For ULTRIX 2.3 Nova UniversityThis software is functional through November 30, 1989.
Try the new SPSS-X Release 3.0 features:
* Interactive SPSS-X command execution* Online Help* Nonlinear Regression* Time Series and Forecasting (TRENDS)* Macro Facility
Notes for SPSS-X
9
ULTRIX 2.3
License Number 19439
* Improvements in:* REPORT* TABLES* Simplified Syntax* Matrix I/O
Notes for SPSS-X
10
See SPSS-X Users Guide, Third Edition for more information on these features.
1 0 SET WIDTH = 802 DATA LIST FILE = 'z.dat' FIXED3 / Year 014 January 045 Other 11 066
THE COMMAND ABOVE READS 1 RECORDS FiOM z.dat
VARIABLE REC START END FORMAT WIDTH DEC
YEAR 1 1 1 F 1 0
JANUARY 1 4 4 F 1 0
OTHER_11 1 6 6 F 1 0
END OF DATALIST TABLE
7 variable lables8 Year "Years, from 1927-1981"/9 January "Stock Movement during January"/10 Other_11 "Stock Movement during Feb.-Dec.".1112 value labels13 January 1 'Up' 2 'Down'/14 Other 11 1 'Up' 2 'Down'.1516 CROSSTABS TABLES = January by Other 1117 /STATISTICS=CHISQ
There are 198368 bytes of memory available.The largest contiguous area has 198368 bytes.
***** GIVEN WORKSPACE ALLOWS FOR 5509 CELLS WITH 2 DIMENSIONS FOR CROSSTA
114 Nov 89 SPSS-X Release 3.0 for VAX/UNIX Page23:04:07 Nova University VAX 8550 ULTRIX 2.3
- -- - - - - -- CROSSTABULATION OFJANUARY Stock Movement during January
BY OTHER 11 Stock Movement during Feb.-Dec.
OTHER_11COUNT I
IUp Down ROWI TOTAL
PAGE 1 OF 1
Notes for SPSS-X
11
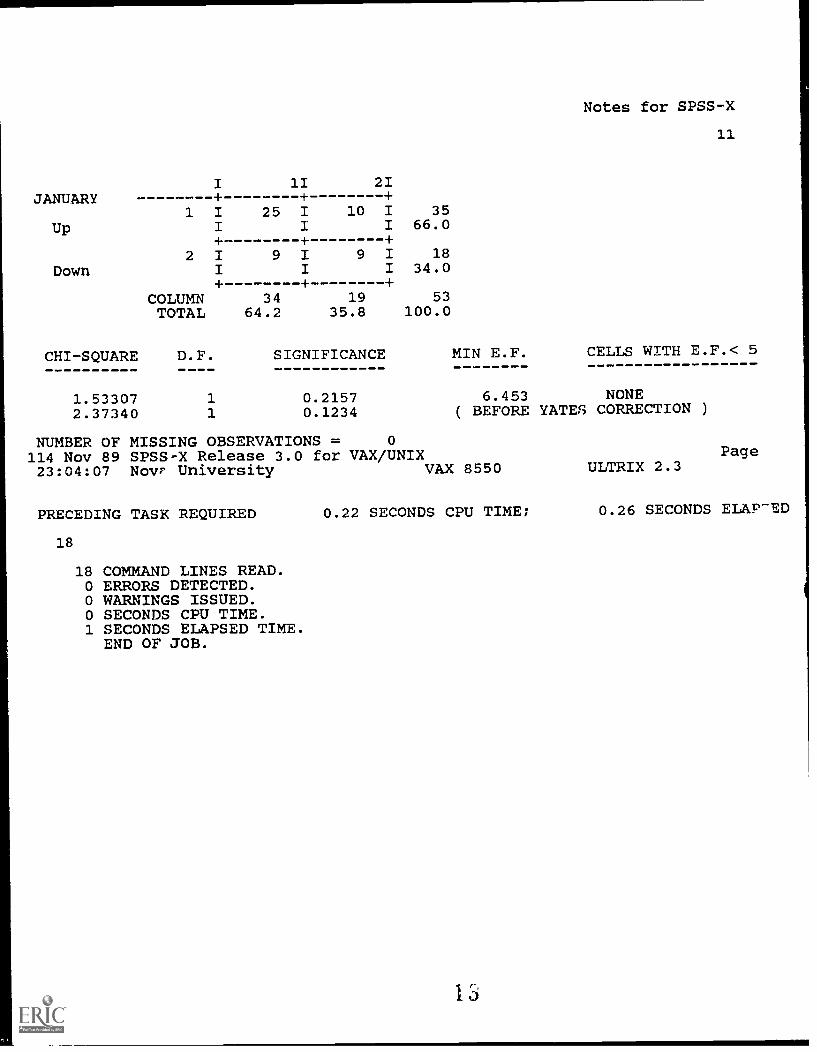
I 1I 21JANUARY + + +
1 I 25 I 10 I 35Up I I I 66.0
+ + +2 I 9 I 9 I 18
Down I I I 34.0+ + +
COLUMN 34 19 53TOTAL 64.2 35.8 100.0
CHI-SQUARE D.F. SIGNIFICANCE MIN E.F. CELLS WITH E.F.< 5
1.53307 1 0.2157 6.453 NONE2.37340 1 0.1234 ( BEFORE YATES CORRECTION )
NUMBER OF MISSING OBSERVATIONS = 0
114 Nov 89 SPSS-X Release 3.0 for VAX/UNIX23:04:07 Now University VAX 8550
PRECEDING TASK REQUIRED
18
18 COMMAND LINES READ.O ERRORS DETECTED.O WARNINGS ISSUED.O SECONDS CPU TIME.1 SECONDS ELAPSED TIME.END OF JOB.
PageULTRIX 2.3
0.22 SECONDS CPU TIME; 0.26 SECONDS ELAP-ED

Notes for SPSS-X
12
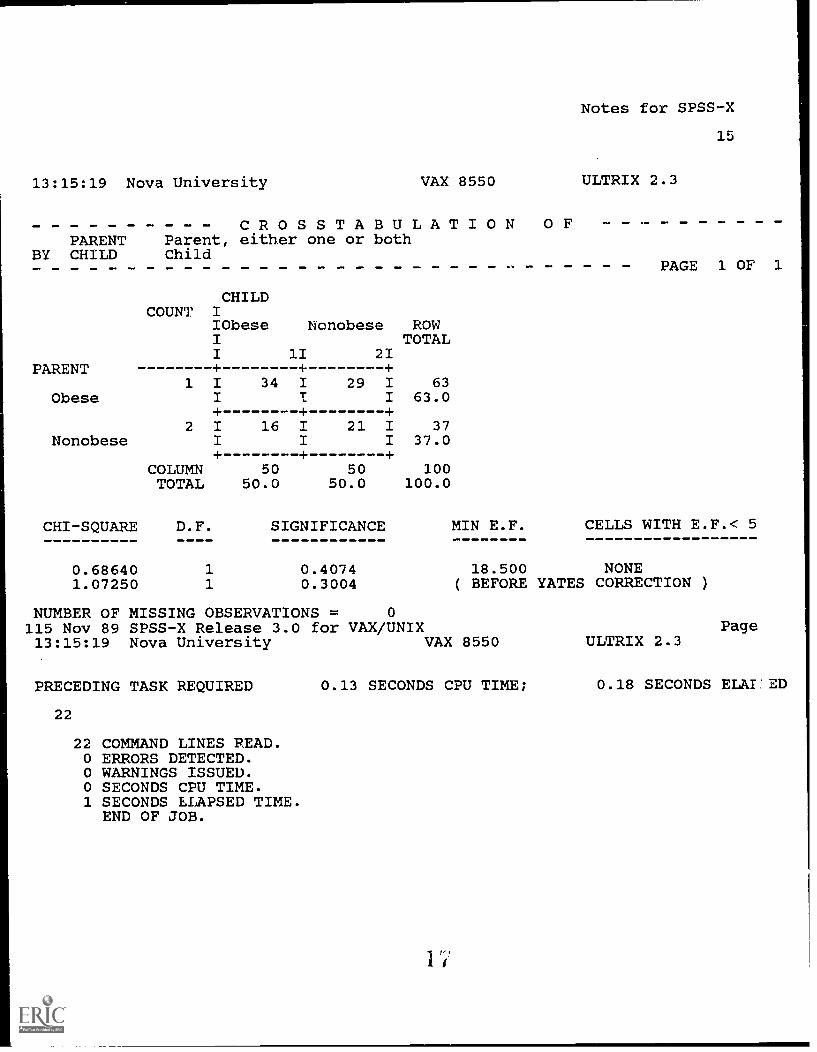
Test: Chi-square Analysis (using WEIGHT, to avoid excessive keying)
Source: McClave, James T., and Frank H. Dietrich, II. STATISTICS,4i-h edition. San Francisco, California: DellenPublishing Company, 1988. ISBN 0-02-379260-4Page 667
Software: SPSS-X Release 3.0 for VAX/UNIX
Scenario: A study on the incidence of obesity in children andobesity of parents (either one or both parents):
Ho:
Files:
1. Parent = ObeseChild = Obese n = 34 (Group 1 1)
2. Parent = ObeseChild = Nonobese n = 29 (Group 1 2)
3. Parent = NonobeseChild = Obese n = 16 (Group 2 1)
4. Parent = NonobeseChild = Nonobese n = 21 (Group 2 2)
There is no difference in the incidence of obesityamong children and the incidence of obesity withtheir respective parents.
1. zz.dat
2. zz.r01
3. zz.o01
Command: At the Unix prompt (%), key:
%spssx <zz.r01> z.o01
Outcome: Computed chi-square = 1.072
Criterion chi-square = 3.841 (alpha = .05, df = 1)
Computed chi-square (1.072) < Criterion chi-square (3.841)
Accept the Null Hypothesis there is no difference
a LI
Notes for SPSS-X
13
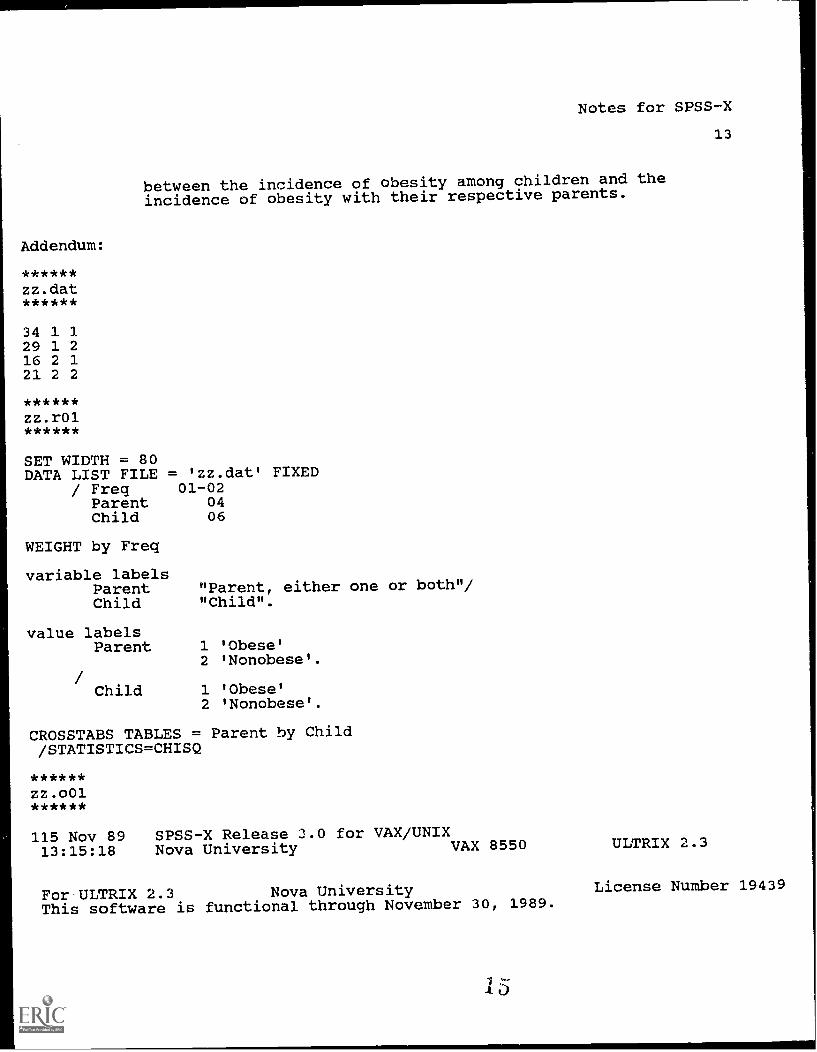
between the incidence of obesity among children and the
incidence of obesity with their respective parents.
Addendum:
******zz.dat******
34 1 129 1 216 2 1
21 2 2
******zz.r01******
SET WIDTH = 80DATA LIST FILE = 'zz.dat' FIXED
/ Freq 01-02Parent 04Child 06
WEIGHT by Freq
variable labelsParentChild
value labelsParent
Child
"Parent, either one or both"/"Child".
1 'Obese'2 'Nonobese'.
1 'Obese'2 'Nonobese'.
CROSSTABS TABLES = Parent by Child/STATISTICS=CHISQ
******zz.o01******
115 Nov 8913:15:18
SPSS-X Release 3.0 for VAX/UNIXNova University VAX 8550
For ULTRIX 2.3 Nova UniversityThis software is functional through November 30, 1989.
ULTRIX 2.3
License Number 19439
Try the new SPSS-X Release 3.0 features:
* Interactive SPSS-X command execution* Online Help* Nonlinear Regression* Time Series and Forecasting (TRENDS)* Macro Facility
Notes for SPSS-X
* Improvements in:* REPORT* TABLES* Simplified Syntax* Matrix I/O
14
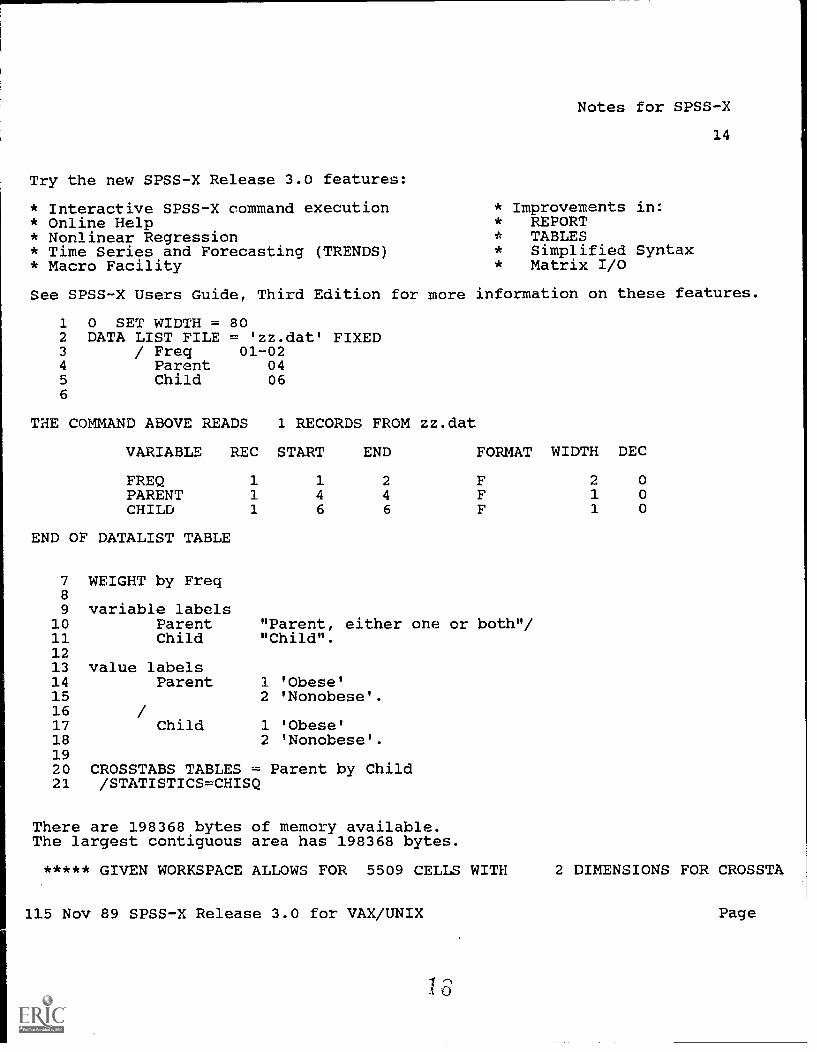
See SPSS-X Users Guide, Third Edition for more information on these features.
1 0 SET WIDTH = 802 DATA LIST FILE = 'zz.dat' FIXED3 / Freq 01-024 Parent 045 Child 066
THE COMMAND ABOVE READS 1 RECORDS FROM zz.dat
VARIABLE REC START END FORMAT WIDTH DEC
FREQ 1 1 2 F 2 0PARENT 1 4 4 F 1 0CHILD 1 6 6 F 1 0
END OF DATALIST TABLE
7 WEIGHT by Freq89 variable labels
10 Parent11 Child1213 value labels14 Parent151617 Child1819
"Parent, either one or both"/"Child".
1 'Obese'2 'Nonobese'.
1 'Obese'2 ' Nonobese'.
20 CROSSTABS TABLES = Parent by Child21 /STATISTICS=CHISQ
There are 198368 bytes of memory available.The largest contiguous area has 198368 bytes.
***** GIVEN WORKSPACE ALLOWS FOR 5509 CELLS WITH
115 Nov 89 SPSS-X Release 3.0 for VAX/UNIX
2 DIMENSIONS FOR CROSSTA
Page
13:15:19 Nova University
Notes for SPSS-X
VAX 8550 ULTRIX 2.3
CROSSTABULATION OFPARENT Parent, either one or both
BY CHILD Child
CHILDCOUNT I
I0beseI
Nonobese ROWTOTAL
I 1I 21PARENT
1 I 34 I 29 I 63Obese I I I 63.0
+ + +2 I 16 I 21 I 37
Nonobese I I I 37.0+ + +
COLUMN 50 50 100TOTAL 50.0 50.0 100.0
15
PAGE 1 OF 1
CHI-SQUARE D.F. SIGNIFICANCE MIN E.F. CELLS WITH E.F.< 5
0.68640 1 0.4074 18.500 NONE1.07250 1 0.3004 ( BEFORE YATES CORRECTION )
NUMBER OF MISSING OBSERVATIONS = 0115 Nov 89 SPSS-X Release 3.0 for VAX/UNIX13:15:19 Nova University VAX 8550
PRECEDING TASK REQUIRED
22
22 COMMAND LINES READ.O ERRORS DETECTED.O WARNINGS ISSUED.O SECONDS CPU TIME.1 SECONDS ELAPSED TIME.
END OF JOB.
PageULTRIX 2.3
0.13 SECONDS CPU TIME; 0.18 SECONDS ELAI ED
1'1
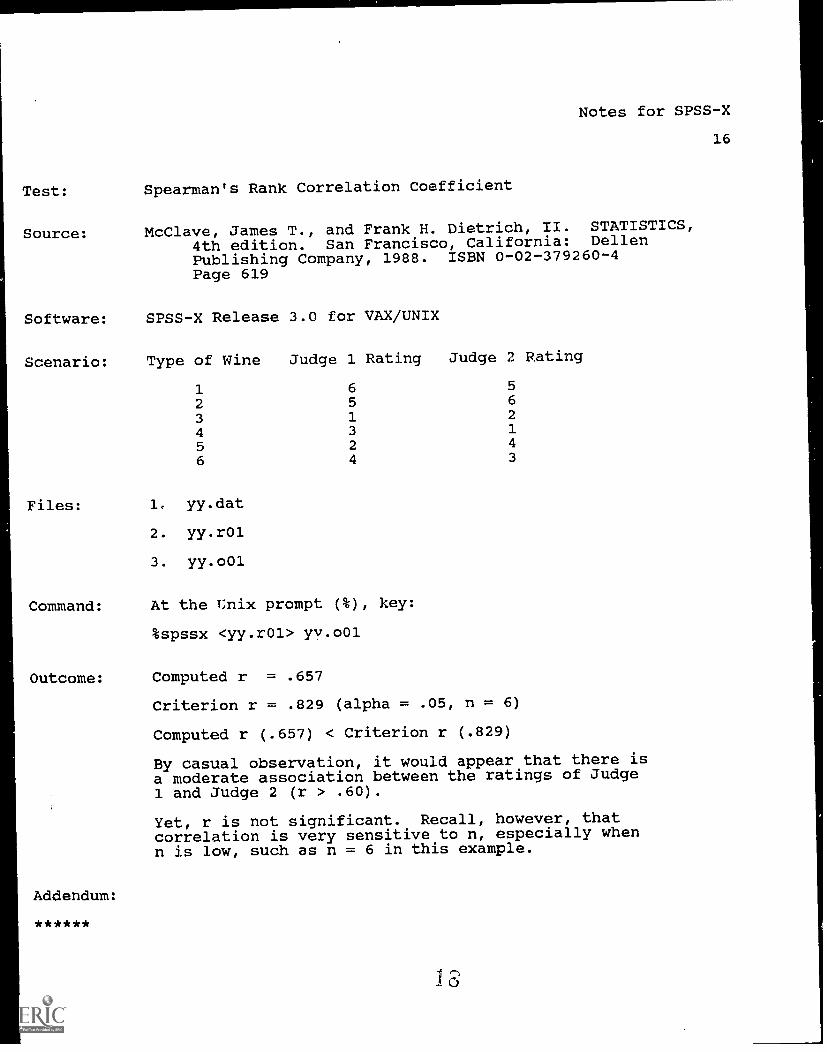
Test: Spearman's Rank Correlation Coefficient
Source:
Notes for SPSS-X
McClave, James T., and Frank H. Dietrich, II. STATISTICS,4th edition. San Francisco, California: Dellen
Software:
Publishing Company, 1988.Page 619
SPSS-X Release 3.0 for VAX/UNIX
ISBN 0-02-379260-4
Scenario: Type of Wine Judge 1 Rating Judge 2 Rating
1 6 5
2 5 6
3 1 2
4 3 1
5 2 4
6 4 3
Files: 1, yy.dat
2. yy.r01
3. yy.o01
Command: At the I:nix prompt (%), key:
%spssx <yy.r01> yv.o01
Outcome: Computed r = .657
Criterion r = .829 (alpha = .05, n = 6)
Computed r (.657) < Criterion r (.829)
By casual observation, it would appear that there isa moderate association between the ratings of Judge1 and Judge 2 (r > .60).
Yet, r is not significant. Recall, however, thatcorrelation is very sensitive to n, especially whenn is low, such as n = 6 in this example.
Addendum:
u
16
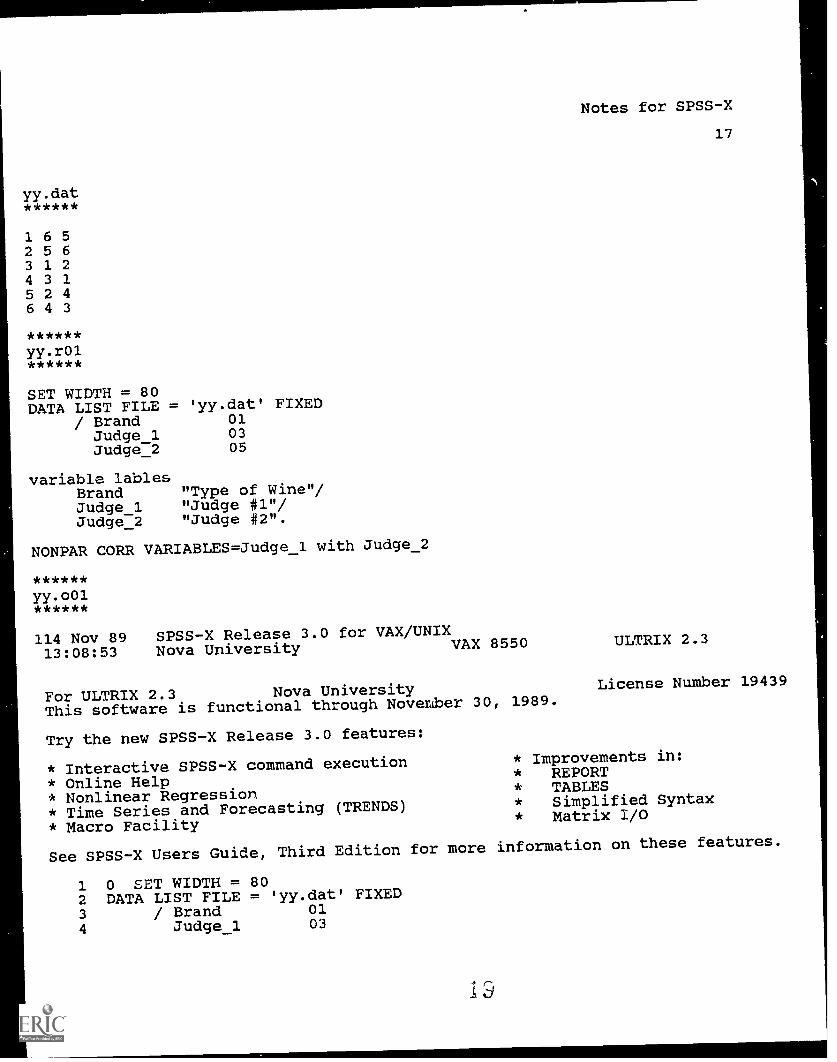
yy.dat******
1 6 52 5 63 1 24 3 15 2 46 4 3
******yy.r01******
SET WIDTH = 80DATA LIST FILE = 'yy.dat' FIXED
/ Brand 01Judge_1 03Judge_2 05
variable lablesBrand "Type of Wine"/Judge_1 "Judge #1"/Judge_2 "Judge #2".
NONPAR CORR VARIABLES=Judge_1 with Judge_2
******yy.o01******
114 Nov 89 SPSS-X Release 3.0 for VAX/UNIX
13:08:53 Nova University VAX 8550
For ULTRIX 2.3 Nova UniversityThis software is functional through November 30, 1989.
Try the new SPSS-X Release 3.0 features:
* Interactive SPSS-X command execution* Online Help* Nonlinear Regression* Time Series and Forecasting (TRENDS)* Macro Facility
Notes for SPSS-X
17
ULTRIX 2.3
License Number 19439
* Improvements in:
* REPORT* TABLES* Simplified Syntax* Matrix I/O
See SPSS-X Users Guide, Third Edition for more information on these features.
1 0 SET WIDTH = 802 DATA LIST FILE = ' yy.dat' FIXED
3 / Brand 01
4 Judge_1 03
1 SI
Notes for SPSS-X
18
5 Judge_2 056
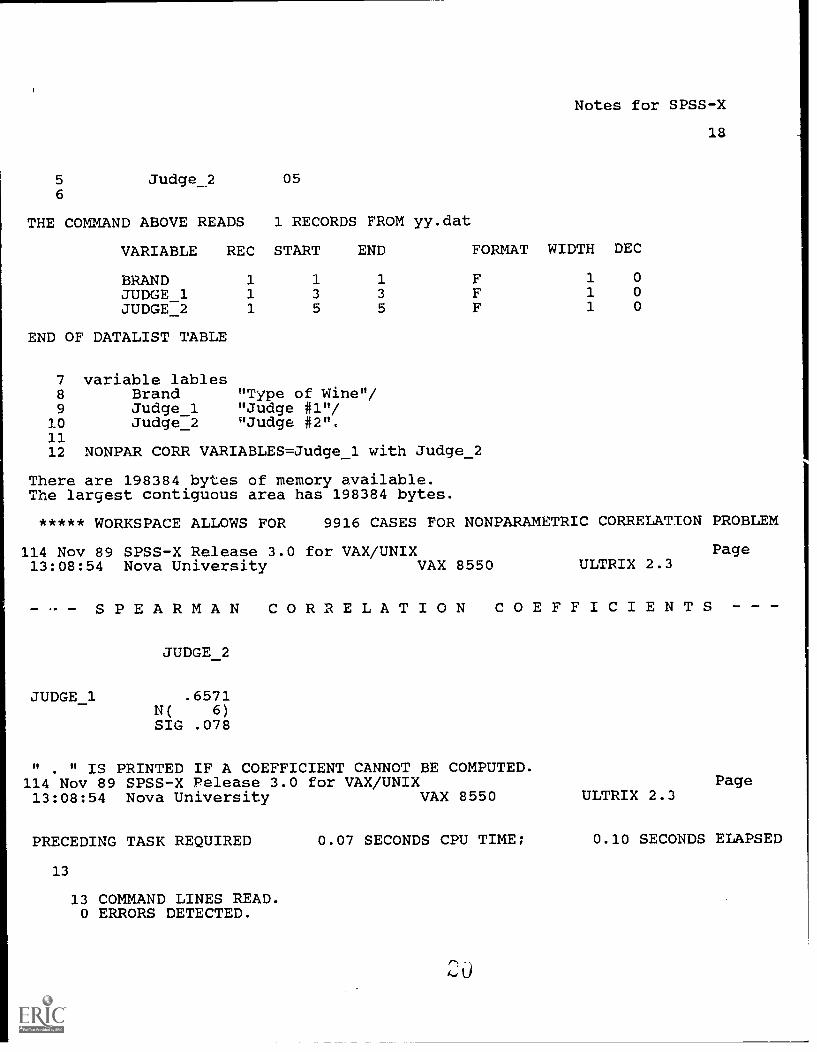
THE COMMAND ABOVE READS 1 RECORDS FROM yy.dat
VARIABLE REC START END FORMAT WIDTH DEC
BRAND 1 1 1 F 1 0
JUDGE 1 1 3 3 F 1 0
JUDGE 2 1 5 5 F 1 0
END OF DATALIST TABLE
7 variable lables8 Brand "Type of Wine"/9 Judge_1 "Judge #1"/
10 Judge_2 "Judge #2".1112 NONPAR CORR VARIABLES=Judge_1 with Judge_2
There are 198384 bytes of memory available.The largest contiguous area has 198384 bytes.
***** WORKSPACE ALLOWS FOR 9916 CASES FOR NONPARAMETRIC CORRELATION PROBLEM
114 Nov 89 SPSS-X Release 3.0 for VAX/UNIX Page13:08:54 Nova University VAX 8550 ULTRIX 2.3
VP - SPEARMAN CORRELATION COEFFICIENTS
JUDGE 2
JUDGE _1 .6571N( 6)SIG .078
" . " IS PRINTED IF A COEFFICIENT CANNOT BE COMPUTED.114 Nov 89 SPSS-X Pelease 3.0 for VAX/UNIX13:08:54 Nova University VAX 8550
PRECEDING TASK REQUIRED
13
13 COMMAND LINES READ.0 ERRORS DETECTED.
ULTRIX 2.3
- -
Page
0.07 SECONDS CPU TIME; 0.10 SECONDS ELAPSED
Notes for SPSS-X
19
0 WARNINGS ISSUED.0 SECONDS CPU TIME.1 SECONDS ELAPSED TIME.END OF JOB.
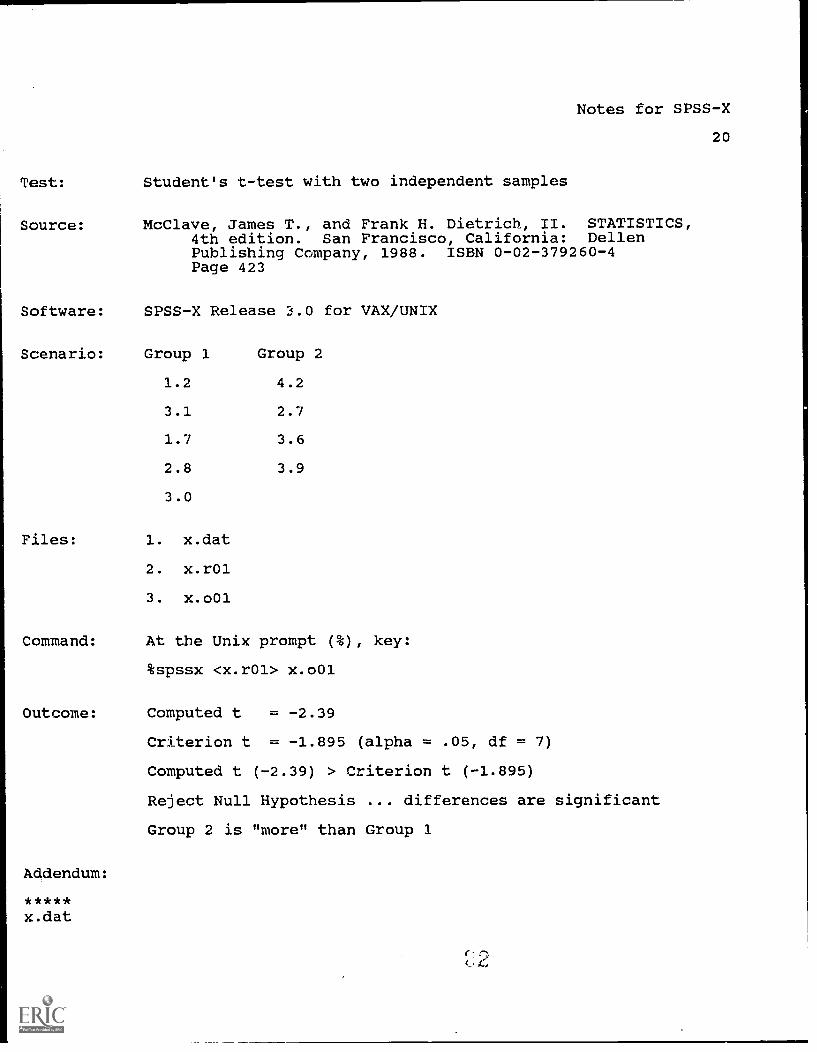
Test: Student's t-test with two independent samples
Source:
Notes for SPSS-X
McClave, James T., and Frank H. Dietrich, II. STATISTICS,4th edition. San Francisco, California: DellenPublishing Company, 1988. ISBN 0-02-379260-4Page 423
Software: SPSS-X Release 3.0 for VAX/UNIX
Scenario: Group 1 Group 2
1.2 4.2
3.1 2.7
1.7 3.6
2.8 3.9
3.0
Files: 1. x.dat
2. x.r01
3. x.o01
Command: At the Unix prompt (%), key:
%spssx <x.r01> x.o01
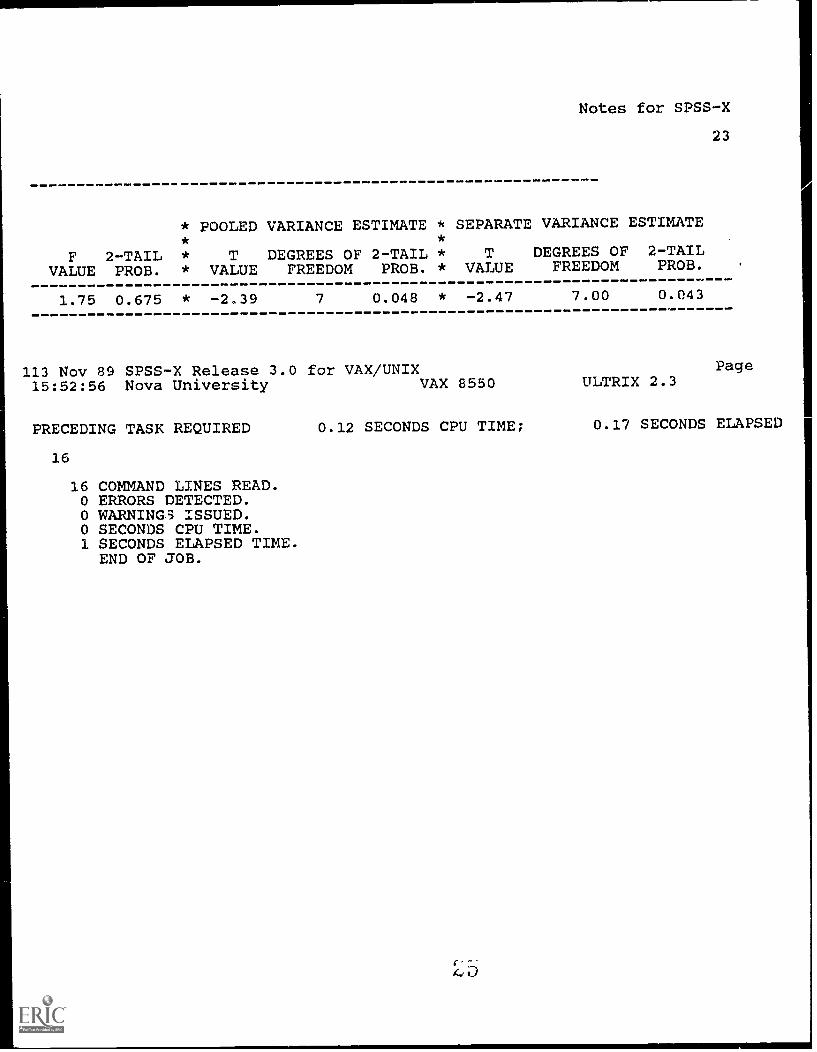
Outcome: Computed t = -2.39
Criterion t = -1.895 (alpha = .05, df = 7)
Computed t (-2.39) > Criterion t (-1.895)
Reject Null Hypothesis ... differences are significant
Group 2 is "more" than Group 1
Addendum:
*****x.dat
20
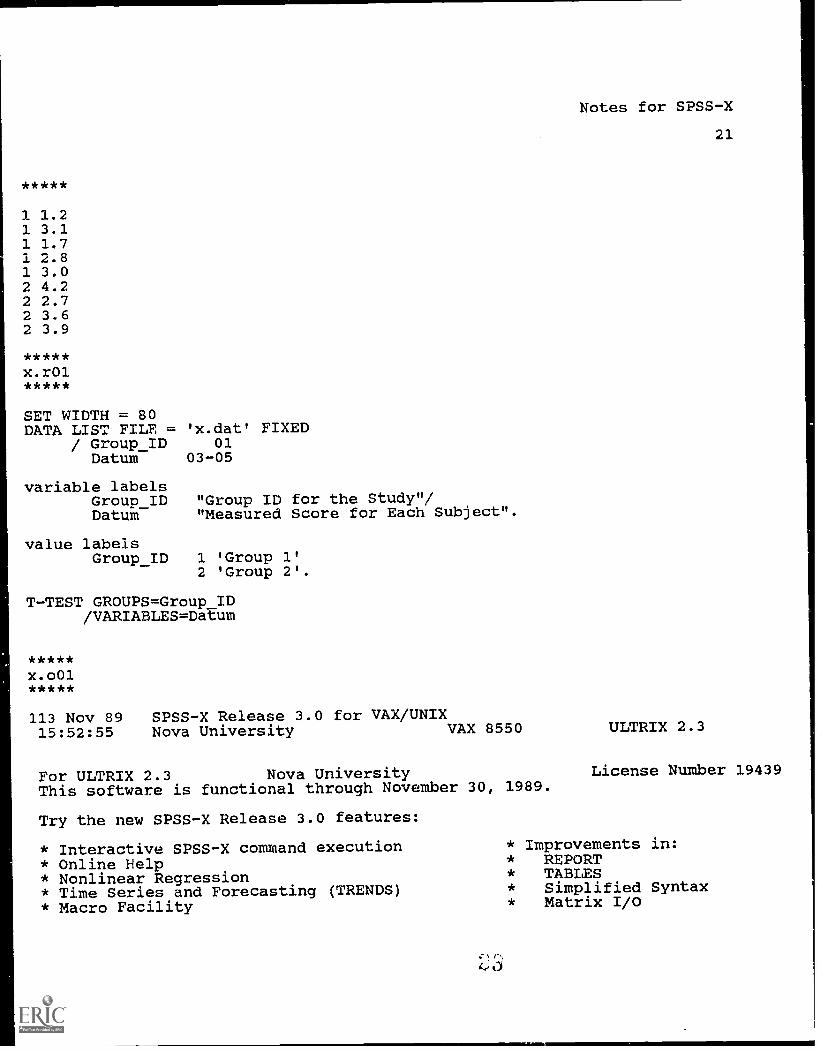
1 1.21 3.11 1.71 2.81 3.02 4.22 2.72 3.62 3.9
SET WIDTH = 80DATA LIST FILE = 'x.dat' FIXED
/ Group_ID 01Datum 03-05
variable labelsGroup_ID "Group ID for the Study"/Datum "Measured Score for Each Subject".
value labelsGroup_ID 1 'Group 1'
2 'Group 2'.
T-TEST GROUPS=Group_ID/VARIABLES=Datum
113 Nov 89 SPSS-X Release 3.0 for VAX/UNIX15:52:55 Nova University VAX 8550
For ULTRIX 2.3 Nova UniversityThis software is functional through November 30, 1989.
Try the new SPSS-X Release 3.0 features:
* Interactive SPSS-X command execution* Online Help* Nonlinear Regression* Time Series and Forecasting (TRENDS)* Macro Facility
Notes for SPSS-X
21
ULTRIX 2.3
License Number 19439
* Improvements in:* REPORT* TABLES* Simplified Syntax* Matrix I/O
Notes for SPSS-X
22
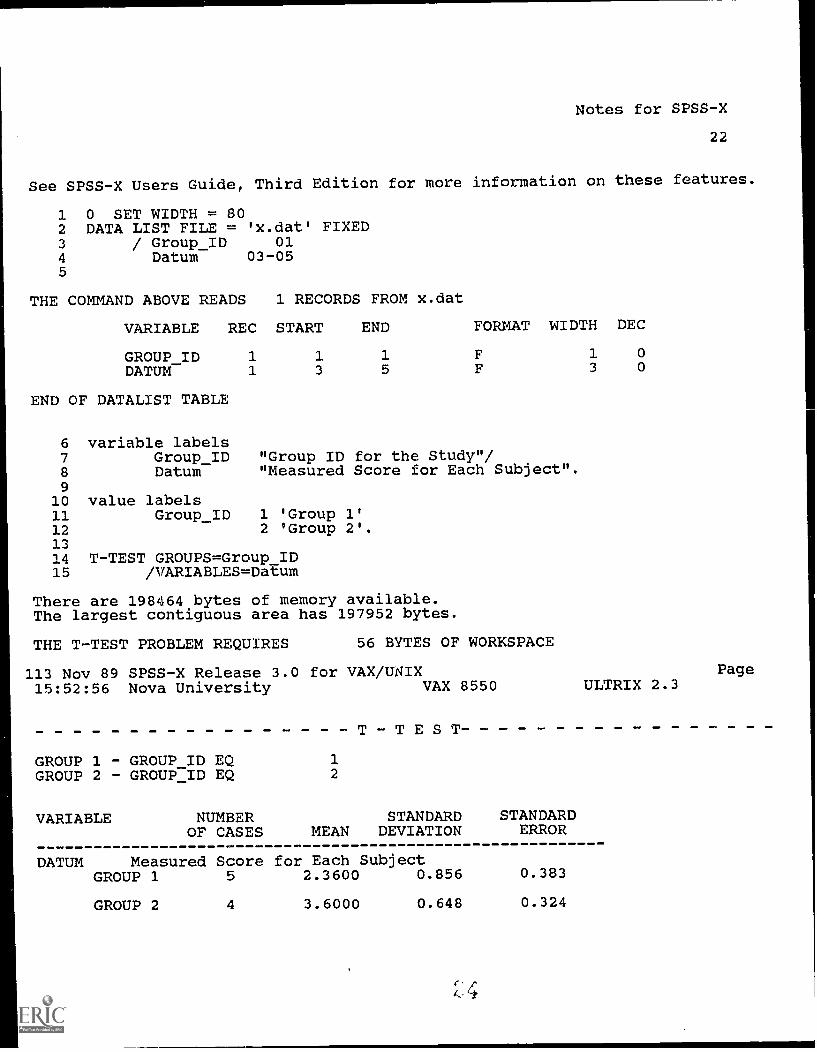
See SPSS-X Users Guide, Third Edition for more information on these features.
1 0 SET WIDTH = 802 DATA LIST FILE = 'x.dat' FIXED1 / Group_ID 013
4 Datum 03-055
THE COMMAND ABOVE READS 1 RECORDS FROM x.dat
VARIABLE REC START END FORMAT WIDTH DEC
GROUP ID 1 1 1 F 1 0
DATUM- 1 3 5 F 3 0
END OF DATALIST TABLE
6 variable labels7 Group_ID "Group ID for the Study"/8 Datum "Measured Score for Each Subject".910 value labels11 Group_ID 1 'Group 1'
12 2 'Group 2'.1314 T-TEST GROUPS=Group_ID15 /VARIABLES=Datum
There are 198464 bytes of memory available.The largest contiguous area has 197952 bytes.
THE T-TEST PROBLEM REQUIRES 56 BYTES OF WORKSPACE
113 Nov 89 SPSS-X Release 3.0 for VAX/UNIX Page15:52:56 Nova University VAX 8550 ULTRIX 2.3
GROUP 1 - GROUP ID EQGROUP 2 - GROUP ID EQ 2
VARIABLE
T TEST
NUMBER STANDARD STANDARDOF CASES MEAN DEVIATION ERROR
DATUM Measured Score for Each SubjectGROUP 1 5 2.3600 0.856 0.383
GROUP 2 4 3.6000 0.648 0.324
Notes for SPSS-X
* POOLED VARIANCE ESTIMATE * SEPARATE VARIANCE ESTIMATE* *
F 2-TAIL * T DEGREES OF 2-TAIL *VALUE PROB. * VALUE FREEDOM PROB. *
23
T DEGREES OF 2-TAILVALUE FREEDOM PROB.
1.75 0.675 * -2.39 7 0.048 * -2.47 7.00 0.043
113 Nov 89 SPSS-X Release 3.0 for VAX/UNIX15:52:56 Nova University VAX 8550
PRECEDING TASK REQUIRED
16
16 COMMAND LINES READ.O ERRORS DETECTED.O WARNING3 ISSUED.0 SECONDS CPU TIME.1 SECONDS ELAPSED TIME.
END OF JOB.
0.12 SECONDS CPU TIME;
ULTRIX 2.3Page
0.17 SECONDS ELAPSED
Notes for SPSS-X
24
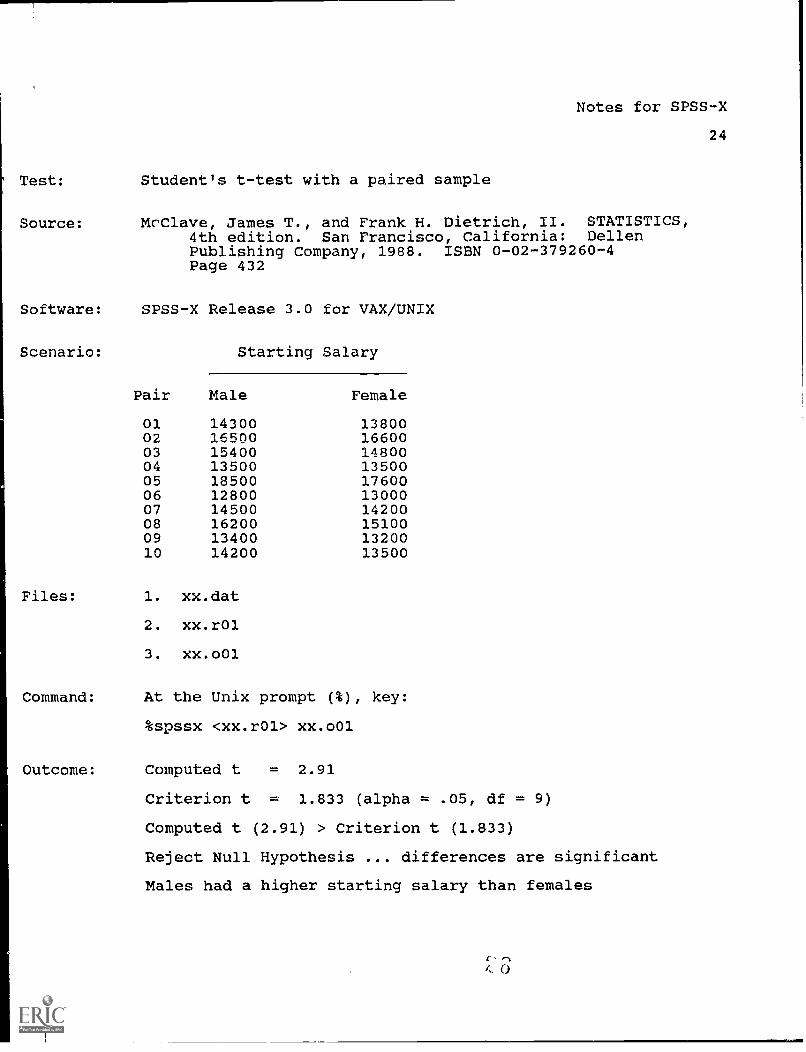
Test: Student's t-test with a paired sample
Source: McClave, James T., and Frank H. Dietrich, II. STATISTICS,4th edition. San Francisco, California: DellenPublishing Company, 1988. ISBN 0-02-379260-4Page 432
Software: SPSS-X Release 3.0 for VAX/UNIX
Scenario: Starting Salary
Files:
Pair Male Female
01 14300 1380002 16500 1660003 15400 1480004 13500 1350005 18500 1760006 12800 1300007 14500 1420008 16200 1510009 13400 1320010 14200 13500
1. xx.dat
2. xx.r01
3. xx.o01
Command: At the Unix prompt (%), key:
%spssx <xx.r01> xx.o01
Outcome: Computed t = 2.91
Criterion t = 1.833 (alpha = .05, df = 9)
Computed t (2.91) > Criterion t (1.833)
Reject Null Hypothesis ... differences are significant
Males had a higher starting salary than females
A. C)
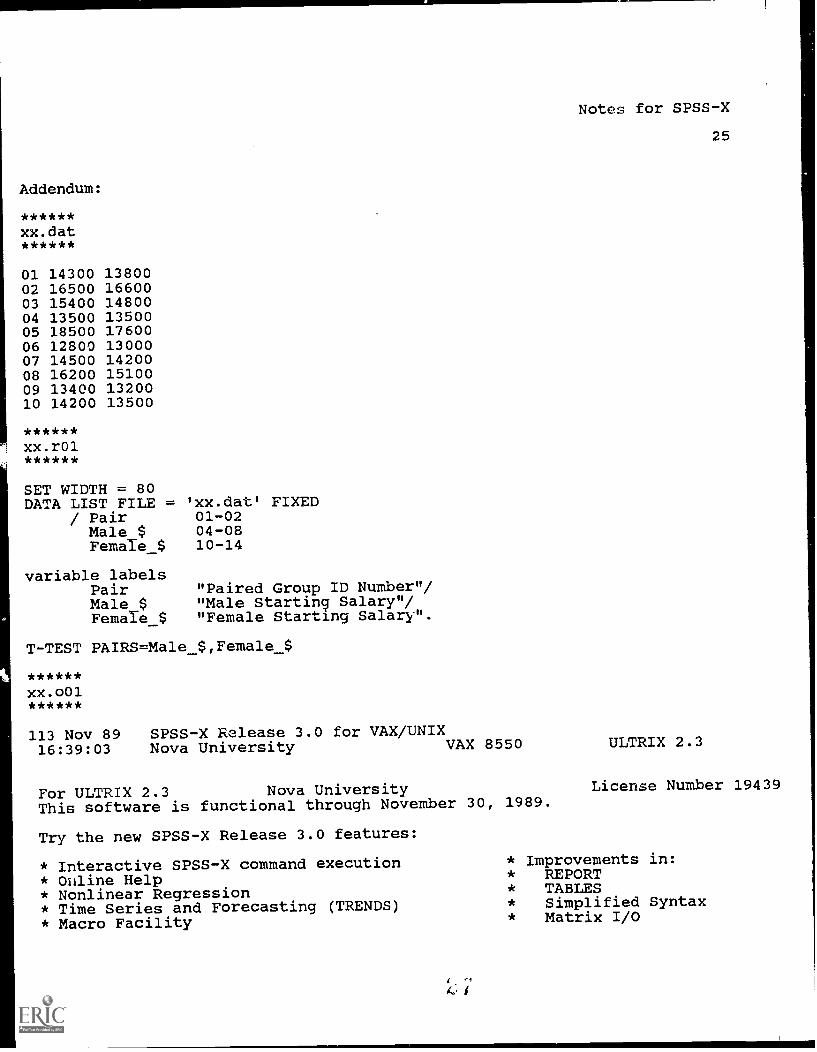
Addendum:
******xx.dat******
01 14300 1380002 16500 1660003 15400 1480004 13500 1350005 18500 1760006 12800 1300007 14500 1420008 16200 1510009 13400 1320010 14200 13500
******xx.r01******
SET WIDTH = 80DATA LIST FILE =
/ PairMale $Female $
variable labelsPairMale $FemaIe_$
T-TEST PAIRS=Male
******xx.o01******
'xx.dat' FIXED01-0204-0810-14
"Paired Group ID Number"/"Male Starting Salary"/"Female Starting Salary".
$,Female $
113 Nov 89 SPSS-X Release 3.0 for VAX/UNIX16:39:03 Nova University VAX 8550
For ULTRIX 2.3 Nova UniversityThis software is functional through November 30, 1989.
Try the new SPSS-X Release 3.0 features:
* Interactive SPSS-X command execution* Online Help* Nonlinear Regression* Time Series and Forecasting (TRENDS)* Macro Facility
'1
Notes for SPSS-X
25
ULTRIX 2.3
License Number 19439
* Improvements in:* REPORT* TABLES* Simplified Syntax* Matrix I/O
Notes for SPSS-X
26
See SPSS-X Users Guide, Third Edition for more information on these features.
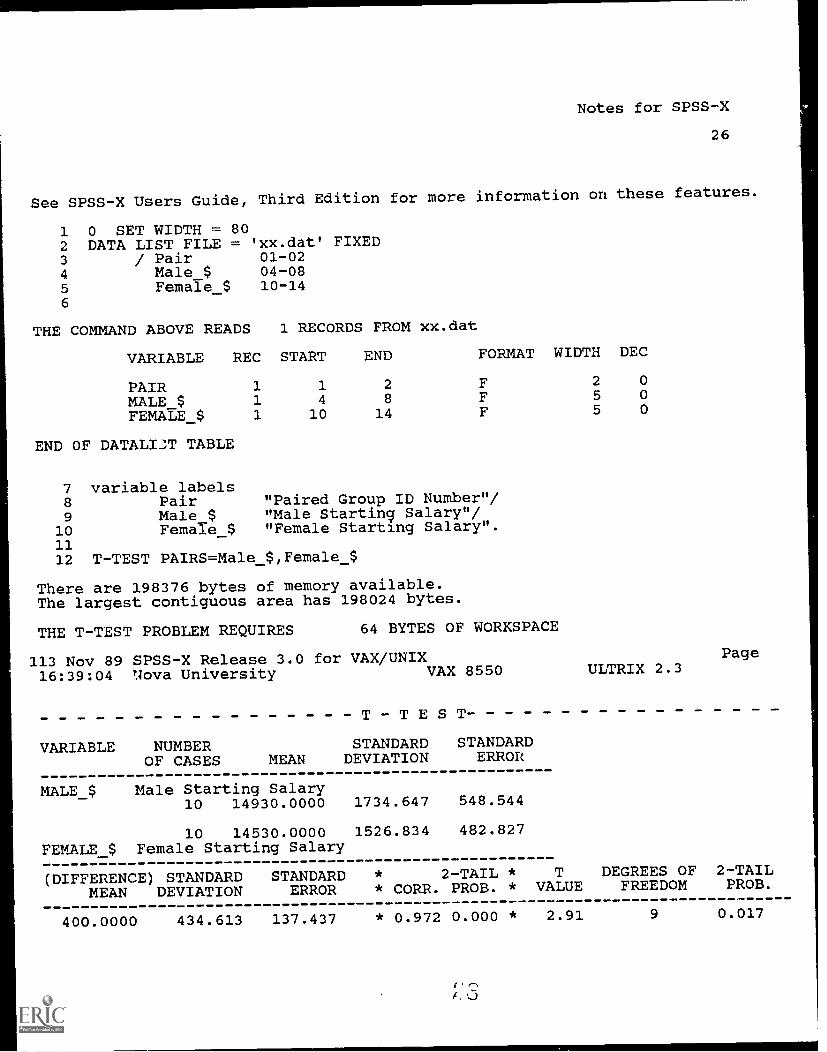
1 0 SET WIDTH = 802 DATA LIST FILE = 'xx.dat' FIXED3 / Pair 01-024 Male _$ 04-085 FemaTe_$ 10-146
THE COMMAND ABOVE READS 1 RECORDS FROM xx.dat
VARIABLE REC START END FORMAT WIDTH DEC
PAIR 1 1 2 F 2 0
MALE $ 1 4 8 F 5 0
FEMALE $ 1 10 14 F 5 0
END OF DATALI2,T TABLE
7 variable labels8 Pair "Paired Group ID Number"/9 Male $ "Male Starting Salary"/
10 FemaTe_$ "Female Starting Salary".1112 T-TEST PAIRS=Male_$,Female_$
There are 198376 bytes of memory available.The largest contiguous area has 198024 bytes.
THE T-TEST PROBLEM REQUIRES 64 BYTES OF WORKSPACE
113 Nov 89 SPSS-X Release 3.0 for VAX/UNIX16:39:04 Nova University VAX 8550
VARIABLE
T TEST
PageULTRIX 2.3
NUMBER STANDARD STANDARDOF CASES MEAN DEVIATION ERROR
MALE $
FEMALE $
Male Starting Salary10 14930.0000 1734.647 548.544
10 14530.0000 1526.834 482.827Female Starting Salary
(DIFFERENCE) STANDARD STANDARD 2-TAIL * T DEGREES OF 2-TAIL
MEAN DEVIATION ERROR * CORR. PROB. * VALUE FREEDOM PROB.
400.0000 434.613 137.437 * 0.972 0.000 * 2.91 9 0.017
Notes for SPSS-X
27
113 Nov 89 SPSS-X Release 3.0 for VAX/UNIX Page
16:39:04 Nova University VAX 8550 ULTRIX 2.3
PRECEDING TASK REQUIRED
13
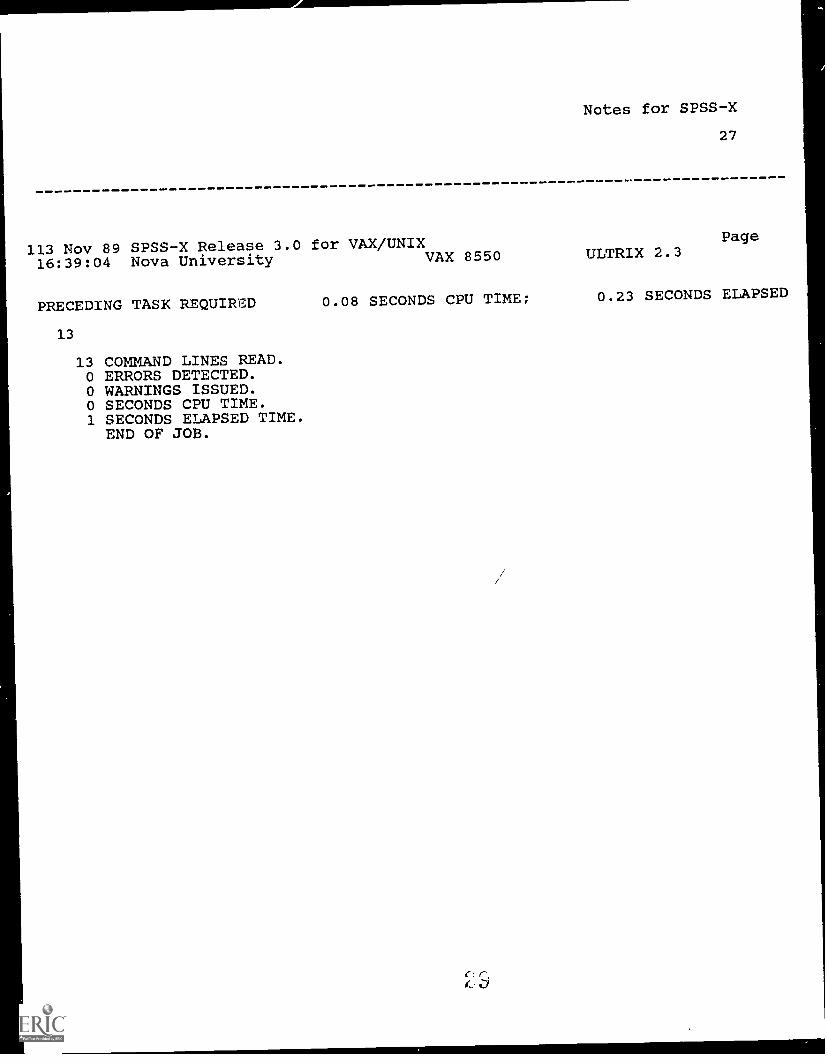
13 COMMAND LINES READ.0 ERRORS DETECTED.0 WARNINGS ISSUED.0 SECONDS CPU TIME.1 SECONDS ELAPSED TIME.
END OF JOB.
0.08 SECONDS CPU TIME; 0.23 SECONDS ELAPSED
Notes for SPSS-X
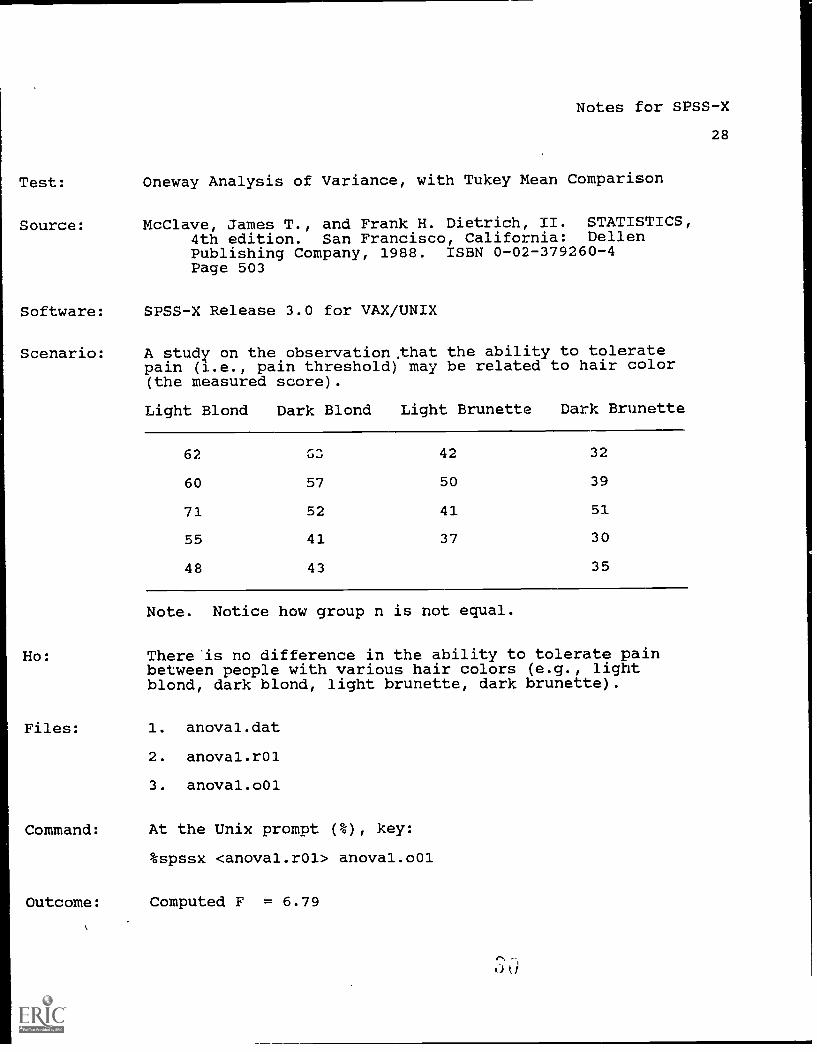
Test: Oneway Analysis of Variance, with Tukey Mean Comparison
Source: McClave, James T., and Frank H. Dietrich, II. STATISTICS,4th edition. San Francisco, California: DellenPublishing Company, 1988. ISBN 0-02-379260-4Page 503
Software: SPSS-X Release 3.0 for VAX/UNIX
Scenario:
Ho:
Files:
A study on the observation .that the ability to toleratepain (i.e., pain threshold) may be related to hair color(the measured score).
Light Blond Dark Blond Light Brunette Dark Brunette
62 .,0, 42 32
60 57 50 39
71 52 41 51
55 41 37 30
48 43 35
Note. Notice how group n is not equal.
There'is no difference in the ability to tolerate painbetween people with various hair colors (e.g., lightblond, dark blond, light brunette, dark brunette).
1. anoval.dat
2. anoval.r01
3. anoval.o01
Command: At the Unix prompt (%), key:
%spssx <anoval.r01> anoval.o01
Outcome: Computed F = 6.79
ti tl
28
Notes for SPSS-X
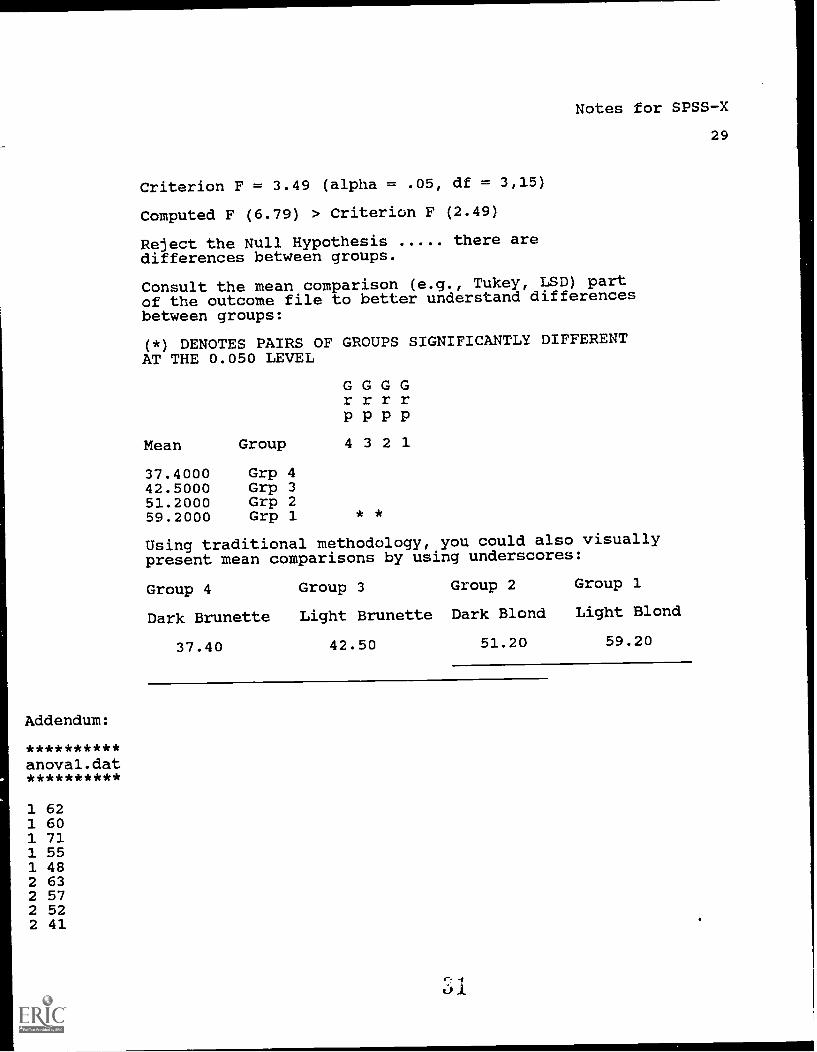
Criterion F = 3.49 (alpha = .05, df = 3,15)
Computed F (6.79) > Criterion F (2.49)
Reject the Null Hypothesis there aredifferences between groups.
Consult the mean comparison (e.g., Tukey, LSD) partof the outcome file to better understand differencesbetween groups:
(*) DENOTES PAIRS OF GROUPS SIGNIFICANTLY DIFFERENTAT THE 0.050 LEVEL
G GGGrrr
P PPPMean Group 4 3 2 1
37.4000 Grp 442.5000 Grp 351.2000 Grp 259.2000 Grp 1 * *
Using traditional methodology, you could also visuallypresent mean comparisons by using underscores:
Group 4 Group 3 Group 2 Group 1
Dark Brunette Light Brunette Dark Blond Light Blond
37.40 42.50 51.20 59.20
Addendum:
**********anova1.dat**********
1 621 601 711 551 482 632 572 522 41
29
2 A33 A
2
3.503 A
1
3 1374 1
324 ;
394 5
14 .304 3
5
**********
anoval.r01
**********
SET
WIDTH
= 80
DATA
LIST
FILE
= 'anoval.dat'
FIXED/ G
roup
01
Score
03-04
variable
lables
Group
"Group,
Based
on
Hair
Color"/
Score
"Pain
Threshold
Score".
value
labels
Group
1 'Light
Blond'2 '
Dark
Blond'3 '
Light
Brunette'4 '
Dark
Brunette'.
ONEWAY
Score
by
Group
(1,4)
/RANGES=TUKEY
**********
anoval.o01
**********
115
Nov
89
SPSS-X
Release
3.0
for
VAX/UNIX
22:25:44
Nova
University
VAX
8550
For
ULTRIX
2.3
Nova
UniversityThis
software
is
functional
through
November
30,
Try
the
new
SPSS-X
Release
3.0
features:
* Interactive
SPSS-X
command
execution* O
nline
Help* N
onlinear
Regression* Time
Series
and
Forecasting
(TRENDS)* M
acro
Facility
r.
ti it
1989.
Notes
for
SPSS-X
30
ULTRIX
2.3
License
Number
19439
* Improvements
in:
* REPORT* T
ABLES* S
implified
Syntax* Matrix
I/O
Notes for SPSS-X
31
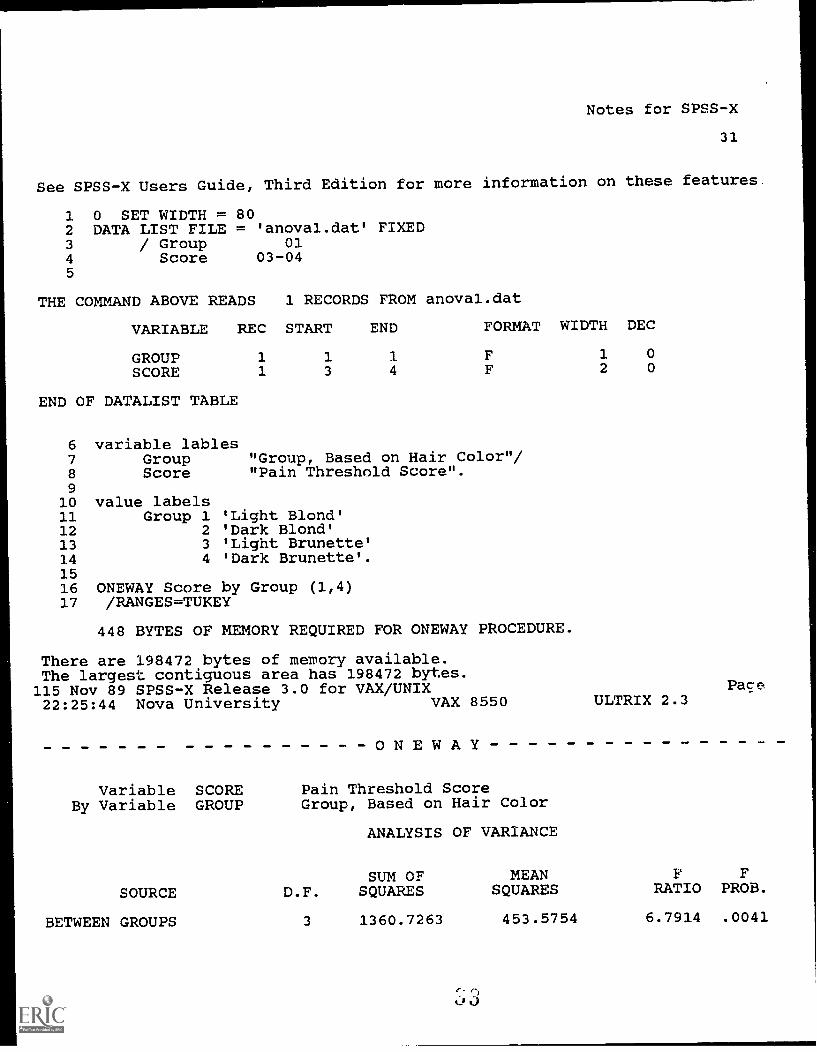
See SPSS-X Users Guide, Third Edition for more information on these features.
1 0 SET WIDTH = 802 DATA LIST FILE = 'anoval.dat' FIXED3 / Group 014 Score 03-045
THE COMMAND ABOVE READS 1 RECORDS FROM anoval.dat
VARIABLE REC START END FORMAT WIDTH DEC
GROUP 1 1 1 F 1 0
SCORE 1 3 4 F 2 0
END OF DATALIST TABLE
6 variable lables7 Group "Group, Based on Hair Color"/8 Score "Pain Threshold Score".910 value labels11 Group 1 'Light Blond'12 2 'Dark Blond'13 3 'Light Brunette'14 4 'Dark Brunette'.1516 ONEWAY Score by Group (1,4)17 /RANGES=TUKEY
448 BYTES OF MEMORY REQUIRED FOR ONEWAY PROCEDURE.
There are 198472 bytes of memory available.The largest contiguous area has 198472 bytes.115 Nov 89 SPSS-X Release 3.0 for VAX/UNIX22:25:44 Nova University VAX 8550
ONEWAY
Pace.ULTRIX 2.3
Variable SCORE Pain Threshold ScoreBy Variable GROUP Group, Based on Hair Color
ANALYSIS OF VARIANCE
SUM OF MEAN F F
SOURCE D.F. SQUARES SQUARES RATIO PROB.
BETWEEN GROUPS 3 1360.7263 453.5754 6.7914 .0041
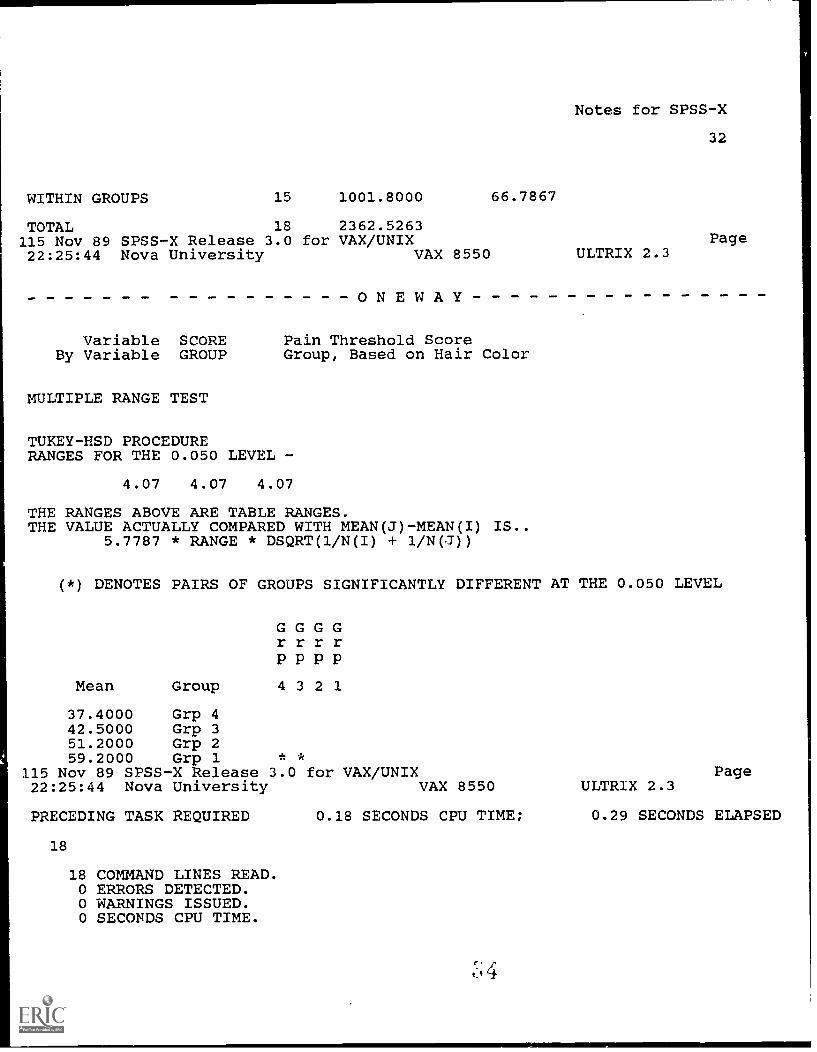
WITHIN GROUPS 15 1001.8000
TOTAL 18 2362.5263115 Nov 89 SPSS-X Release 3.0 for VAX/UNIX22:25:44 Nova University VAX 8550
ONEWAY
66.7867
Notes for SPSS-X
ULTRIX 2.3
32
Page
Variable SCORE Pain Threshold ScoreBy Variable GROUP Group, Based on Hair Color
MULTIPLE RANGE TEST
TUKEY-HSD PROCEDURERANGES FOR THE 0.050 LEVEL -
4.07 4.07 4.07
THE RANGES ABOVE ARE TABLE RANGES.THE VALUE ACTUALLY COMPARED WITH MEAN(J)-MEAN(I) IS..
5.7787 * RANGE * DSQRT(1/N(I) + 1/N(.3))
(*) DENOTES PAIRS OF GROUPS SIGNIFICANTLY DIFFERENT AT THE 0.050 LEVEL
G GGGrrr
P PPPMean Group 4 3 2 1
37.4000 Grp 442.5000 Grp 351.2000 Grp 259.2000 Grp 1 *
115 Nov 89 SPSS-X Release 3.0 for VAX/UNIX22:25:44 Nova University VAX 8550
PRECEDING TASK REQUIRED
18
18 COMMAND LINES READ.O ERRORS DETECTED.O WARNINGS ISSUED.O SECONDS CPU TIME.
PageULTRIX 2.3
0.18 SECONDS CPU TIME; 0.29 SECONDS ELAPSED
Notes for SPSS-X33
1 SECONDS ELAPSED TIME.END OF JOB.
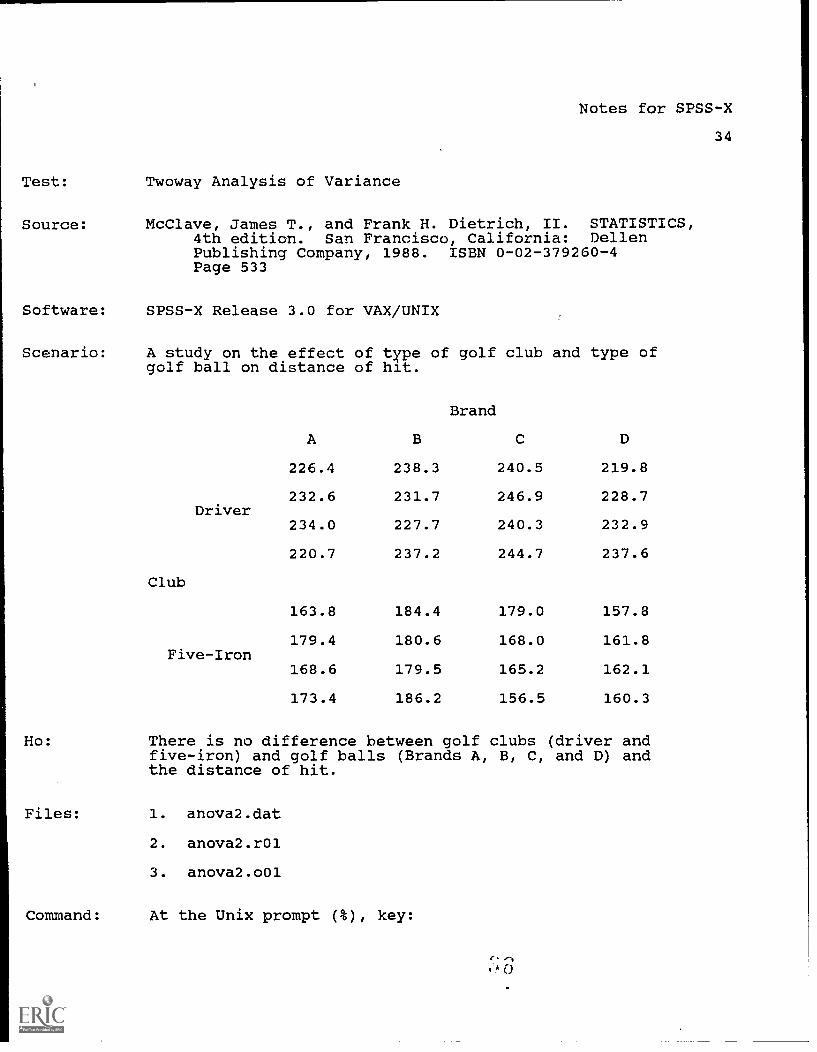
Test: Twoway Analysis of Variance
Source:
Notes for SPSS-X
McClave, James T., and Frank H. Dietrich, II. STATISTICS,4th edition. San Francisco, California: DellenPublishing Company, 1988. ISBN 0-02-379260-4Page 533
Software: SPSS-X Release 3.0 for VAX/UNIX
Scenario: A study on the effect of type of golf club and type ofgolf ball on distance of hit.
Ho:
Files:
Driver
Club
Five-Iron
Brand
A B C D
226.4 238.3 240.5 219.8
232.6 231.7 246.9 228.7
234.0 227.7 240.3 232.9
220.7 237.2 244.7 237.6
163.8 184.4 179.0 157.8
179.4 180.6 168.0 161.8
168.6 179.5 165.2 162.1
173.4 186.2 156.5 160.3
There is no difference between golf clubs (driver andfive-iron) and golf balls (Brands A, B, C, and D) andthe distance of hit.
1. anova2.dat
2. anova2.r01
3. anova2.o01
Command: At the Unix prompt (%), key:
f0 0
34
Outcome:
Addendum:
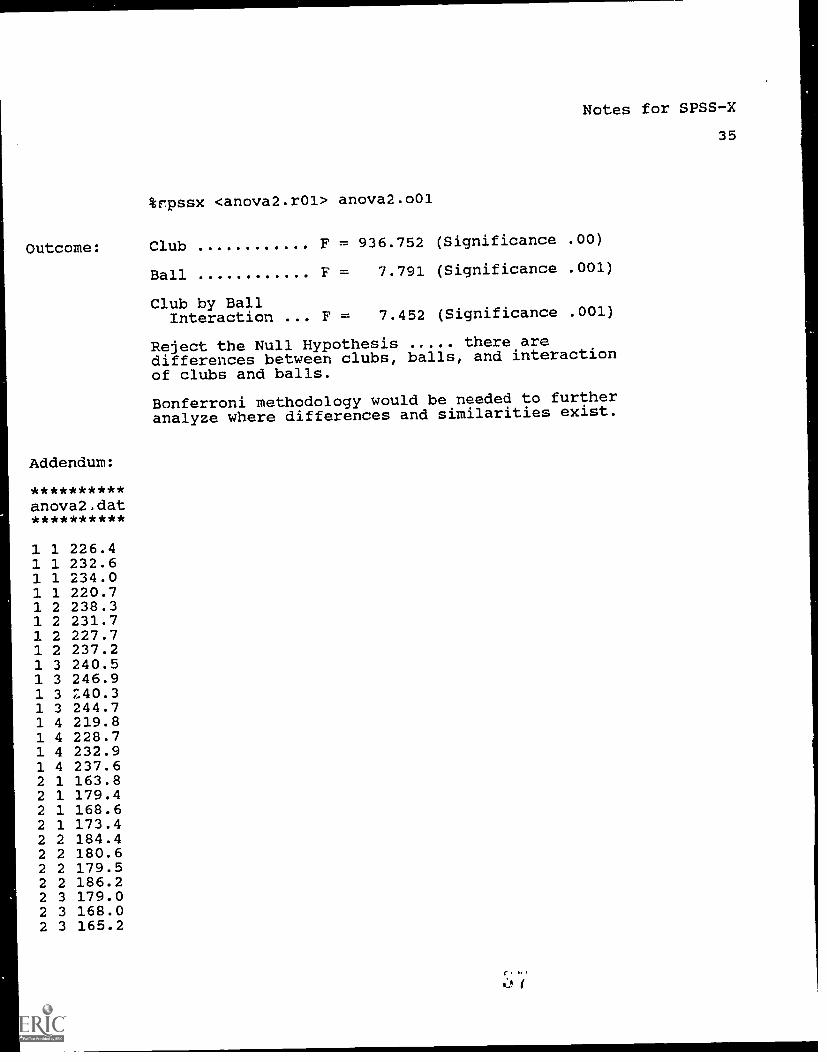
**********anova2.dat**********
1 1 226.41 1 232.61 1 234.01 1 220.71 2 238.31 2 231.71 2 227.71 2 237.21 3 240.51 3 246.91 3 7.40.31 3 244.71 4 219.81 4 228.71 4 232.91 4 237.62 1 163.82 1 179.42 1 168.62 1 173.42 2 184.42 2 180.62 2 179.52 2 186.22 3 179.02 3 168.02 3 165.2
Notes for SPSS-X
%rpssx <anova2.r01> anova2.o01
Club F = 936.752 (Significance .00)
Ball F = 7.791 (Significance .001)
Club by BallInteraction F = 7.452 (Significance .001)
Reject the Null Hypothesis there aredifferences between clubs, balls, and interactionof clubs and balls.
Bonferroni methodology would be needed to furtheranalyze where differences and similarities exist.
35
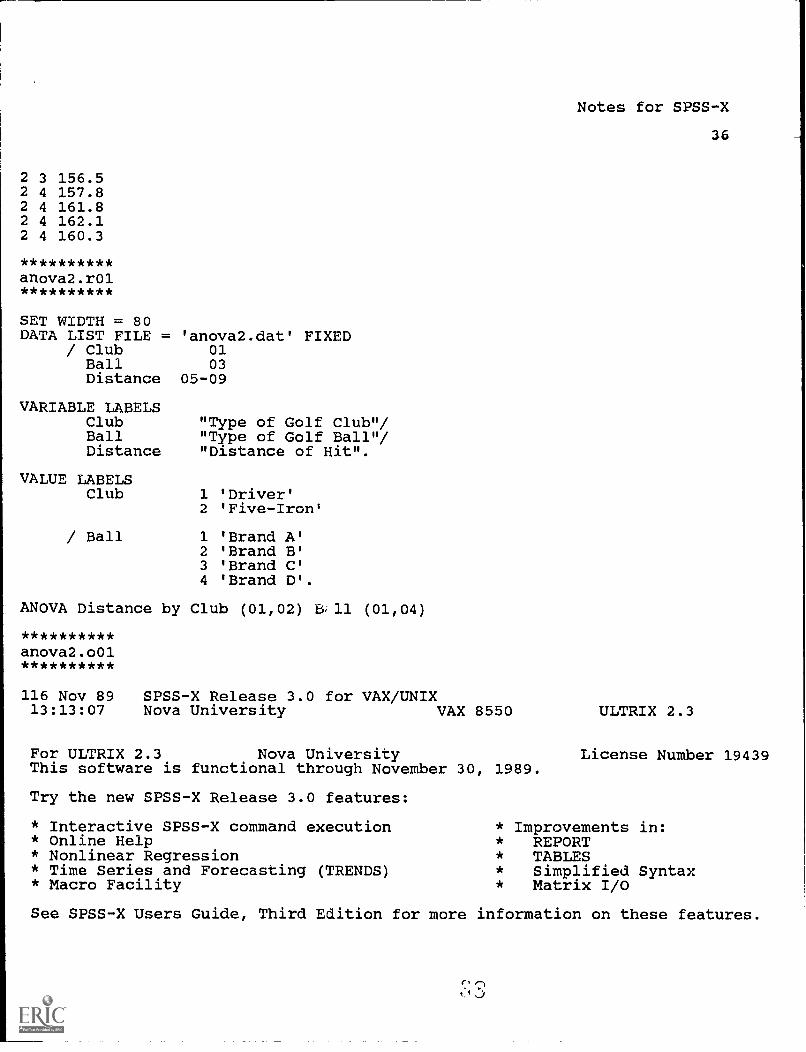
2 3 156.52 4 157.82 4 161.82 4 162.12 4 160.3
**********anova2.r01**********
SET WIDTH = 80DATA LIST FILE = 'anova2.dat' FIXED
/ Club 01Ball 03Distance 05-09
VARIABLE LABELSClubBallDistance
"Type of Golf Club"/"Type of Golf Ball"!"Distance of Hit".
VALUE LABELSClub 1 'Driver'
2 'Five-Iron'
/ Ball 1 'Brand A'2 'Brand B'3 'Brand C'4 'Brand D'.
ANOVA Distance by Club (01,02) B;11 (01,04)
**********anova2.o01**********
116 Nov 89 SPSS-X Release 3.0 for VAX/UNIX13:13:07 Nova University VAX 8550
For ULTRIX 2.3 Nova UniversityThis software is functional through November 30, 1989.
Try the new SPSS-X Release 3.0 features:
* Interactive SPSS-X command execution* Online Help* Nonlinear Regression* Time Series and Forecasting (TRENDS)* Macro Facility
Notes for SPSS-X
36
ULTRIX 2.3
License Number 19439
* Improvements in:* REPORT* TABLES* Simplified Syntax* Matrix I/O
See SPSS-X Users Guide, Third Edition for more information on these features.

1 0 SET WIDTH = 802 DATA LIST FILE = 'anova2.dat' FIXED3 / Club 014 Ball 035 Distance 05-096
THE COMMAND ABOVE READS 1 RECORDS FROM anova2.dat
VARIABLE REC START END
CLUB 1BALL 1DISTANCE 1
END OF DATALIST TABLE
7 VARIABLE LABELS8 Club9 Ball10 Distance1112 VALUE LABELS13 Club141516 / Ball1718192021 ANOVA Distance by Club
13
5
13
9
"Type of Golf Club"/"Type of Golf Ball"/"Distance of Hit".
1 'Driver'2 'Five-Iron'
1 'Brand A'2 'Brand B'3 'Brand C'4 'Brand D'.
'ANOVA' PROBLEM REQUIRES116 Nov 89 SPSS-X Release 3.013:13:08 Nova University
Notes for SPSS-X
FORMAT WIDTH DEC
FFF
(01,02) Ball (01,04)
992 BYTES OF MEMORY.for VAX/UNIX
VAX 8550
1 01 05 0
ULTRIX 2.3
* * * ANALYSIS OF VARIANCE * * *
byDISTANCE Distance of HitCLUB Type of Golf ClubBALL Type of Golf Ball
Source of Variation
Main EffectsCLUB
Sum ofSquares
32893.84732093.111
41
MeanSquare
37
Page
SigF of F
8223.462 240.031 .00032093.111 936.752 .00
Notes for SPSS-X
38
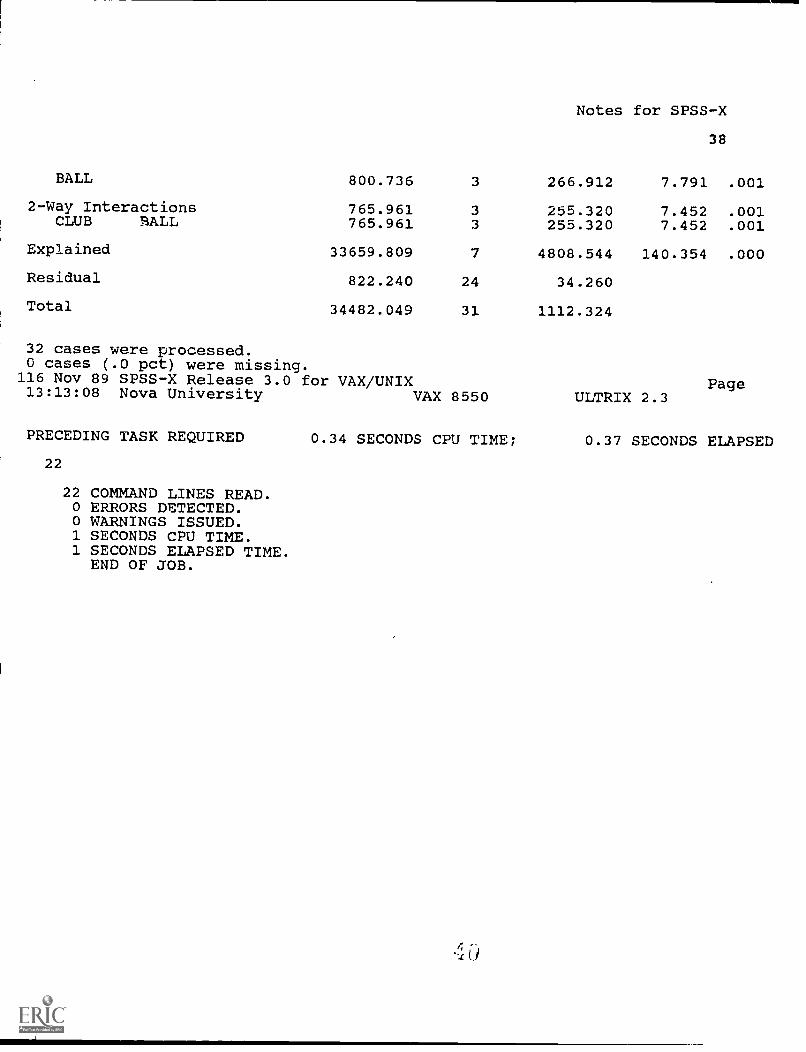
BALL 800.736 3 266.912 7.791 .001
2-Way Interactions 765.961 3 255.320 7.452 .001CLUB BALL 765.961 3 255.320 7.452 .001
Explained 33659.809 7 4808.544 140.354 .000
Residual 822.240 24 34.260
Total 34482.049 31 1112.324
32 cases were processed.0 cases (.0 pct) were missing.116 Nov 89 SPSS-X Release 3.0 for VAX/UNIX Page13:13:08 Nova University VAX 8550 ULTRIX 2.3
PRECEDING TASK REQUIRED 0.34 SECONDS CPU TIME; 0.37 SECONDS ELAPSED
22
22 COMMAND LINES READ.0 ERRORS DETECTED.0 WARNINGS ISSUED.1 SECONDS CPU TIME.1 SECONDS ELAPSED TIME.END OF JOB.
Notes for SPSS-X
39
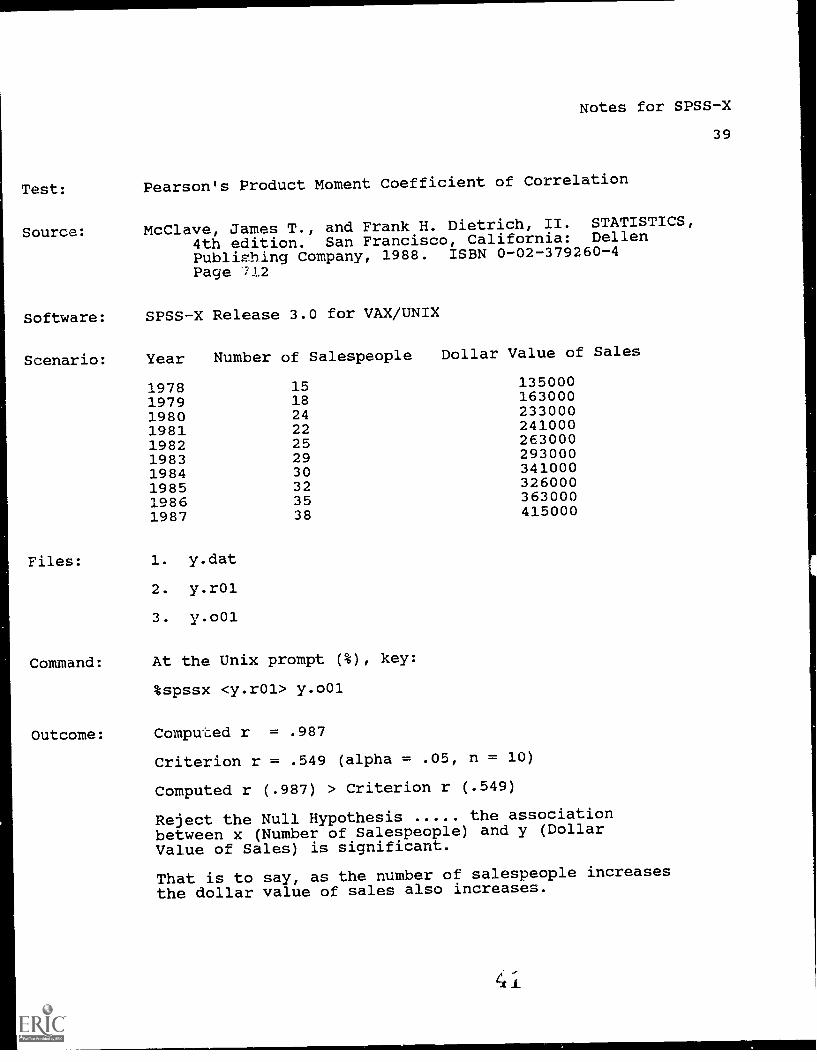
Test: Pearson's Product Moment Coefficient of Correlation
Source: McClave, James T., and Frank H. Dietrich, II. STATISTICS,
4th edition. San Francisco, California: DellenPubliPhing Company, 1988. ISBN 0-02-379260-4Page '12
Software: SPSS-X Release 3.0 for VAX/UNIX
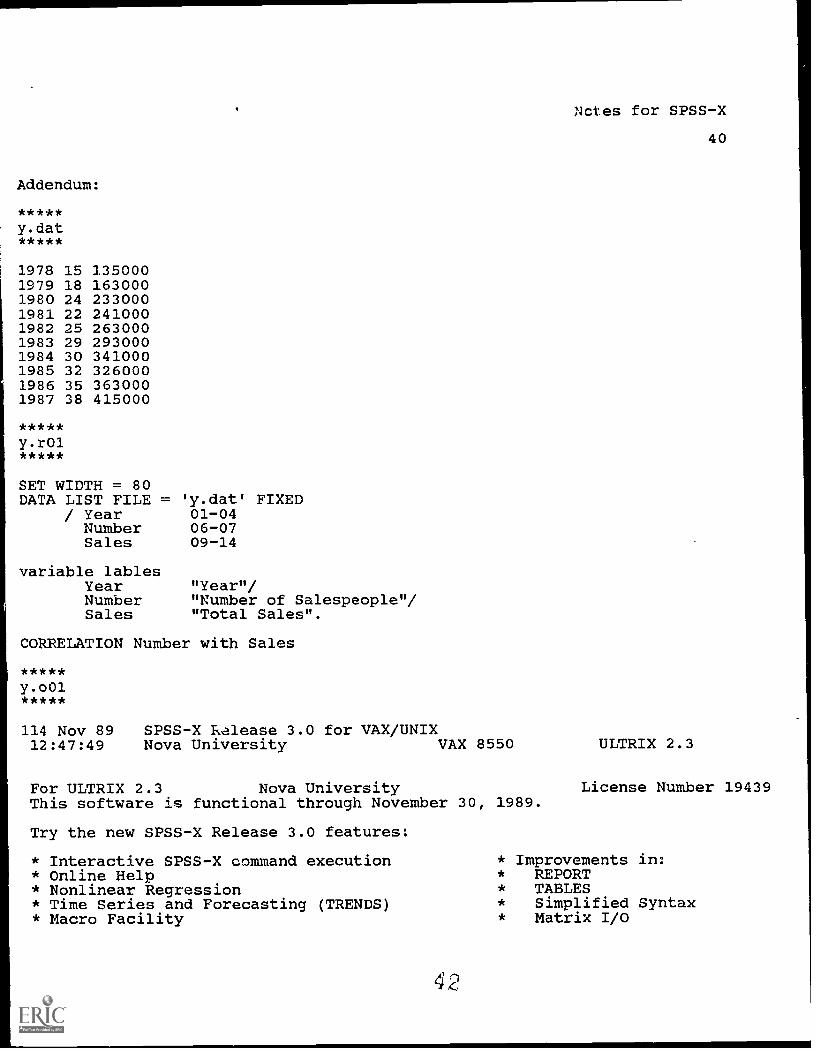
Scenario: Year Number of Salespeople Dollar Value of Sales
Files:
1978 15 135000
1979 18 163000
1980 24 2330001981 22 2410001982 25 263000
1983 29 2930001984 30 3410001985 32 3260001986 35 363000
1987 38 415000
1. y.dat
2. y.r01
3. y.o01
Command: At the Unix prompt (%), key:
%spssx <y.r01> y.o01
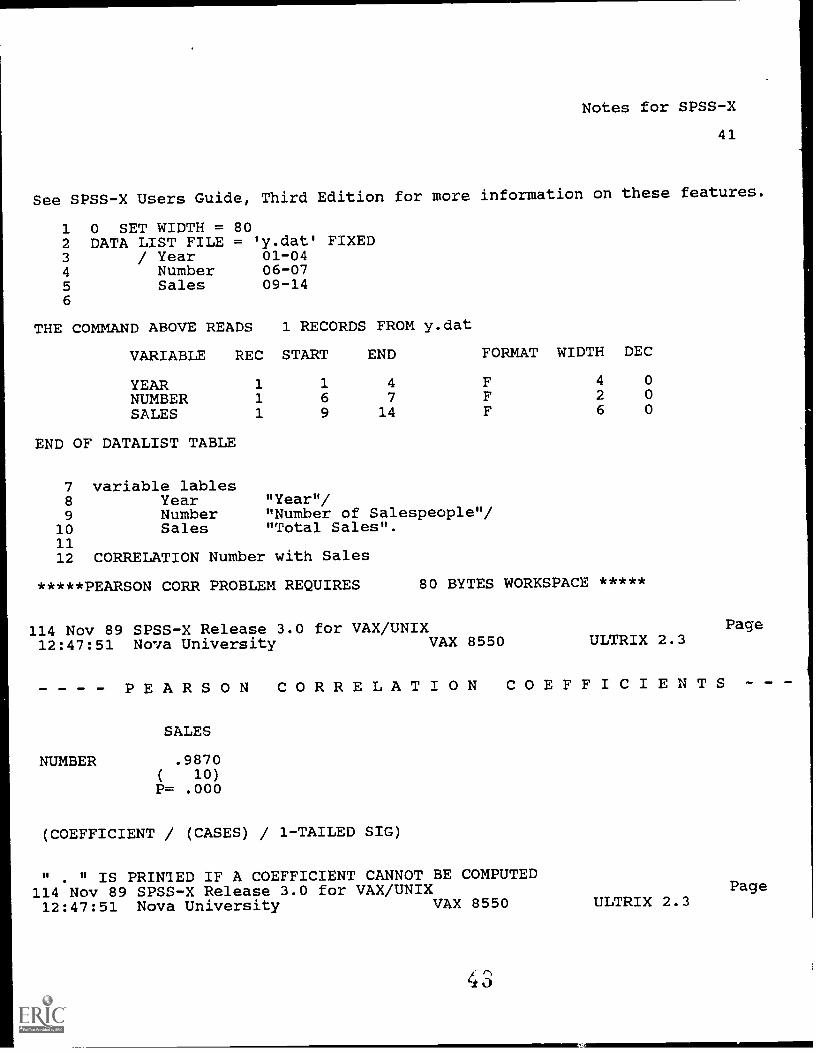
Outcome: Computed r = .987
Criterion r = .549 (alpha = .05, n = 10)
Computed r (.987) > Criterion r (.549)
Reject the Null Hypothesis the associationbetween x (Number of Salespeople) and y (DollarValue of Sales) is significant.
That is to say, as the number of salespeople increasesthe dollar value of sales also increases.
Addendum:
*****y.dat*****
1978 15 1350001979 18 1630001980 24 2330001981 22 2410001982 25 2630001983 29 2930001984 30 3410001985 32 3260001986 35 3630001987 38 415000
SET WIDTH = 80DATA LIST FILE = 'y.dat' FIXED
/ Year 01-04Number 06-07Sales 09-14
variable lablesYear "Year"!Number "Number of Salespeople"/Sales "Total Sales".
CORRELATION Number with Sales
114 Nov 89 SPSS-X Release 3.0 for VAX/UNIX12:47:49 Nova University VAX 8550
For ULTRIX 2.3 Nova UniversityThis software is functional through November 30, 1989.
Try the new SPSS-X Release 3.0 features:
* Interactive SPSS-X command execution* Online Help* Nonlinear Regression* Time Series and Forecasting (TRENDS)* Macro Facility
42
Notes for SPSS-X
40
ULTRIX 2.3
License Number 19439
* Improvements in:* REPORT* TABLES* Simplified Syntax* Matrix I/O
Notes for SPSS-X
41
See SPSS-X Users Guide, Third Edition for more information on these features.
1 0 SET WIDTH = 802 DATA LIST FILE = 'y.dat' FIXED3 / Year 01-044 Number 06-075 Sales 09-146
THE COMMAND ABOVE READS 1 RECORDS FROM y.dat
VARIABLE REC START END FORMAT WIDTH DEC
YEAR 1 1 4 F 4 0
NUMBER 1 6 7 F 2 0
SALES 1 9 14 F 6 0
END OF DATALIST TABLE
7 variable lables8 Year "Year"/9 Number "Number of Salespeople"!
10 Sales "Total Sales".1112 CORRELATION Number with Sales
*****PEARSON CORR PROBLEM REQUIRES 80 BYTES WORKSPACE *****
114 Nov 89 SPSS-X Release 3.0 for VAX/UNIX Page
12:47:51 Nova University VAX 8550 ULTRIX 2.3
---- PEARSON CORRELATION COEFFICIENTS -
NUMBER
SALES
.9870( 10)P= .000
(COEFFICIENT / (CASES) / 1-TAILED SIG)
" . " IS PRINTED IF A COEFFICIENT CANNOT BE COMPUTED114 Nov 89 SPSS-X Release 3.0 for VAX/UNIX12:47:51 Nova University VAX 8550
3
ULTRIX 2.3Page
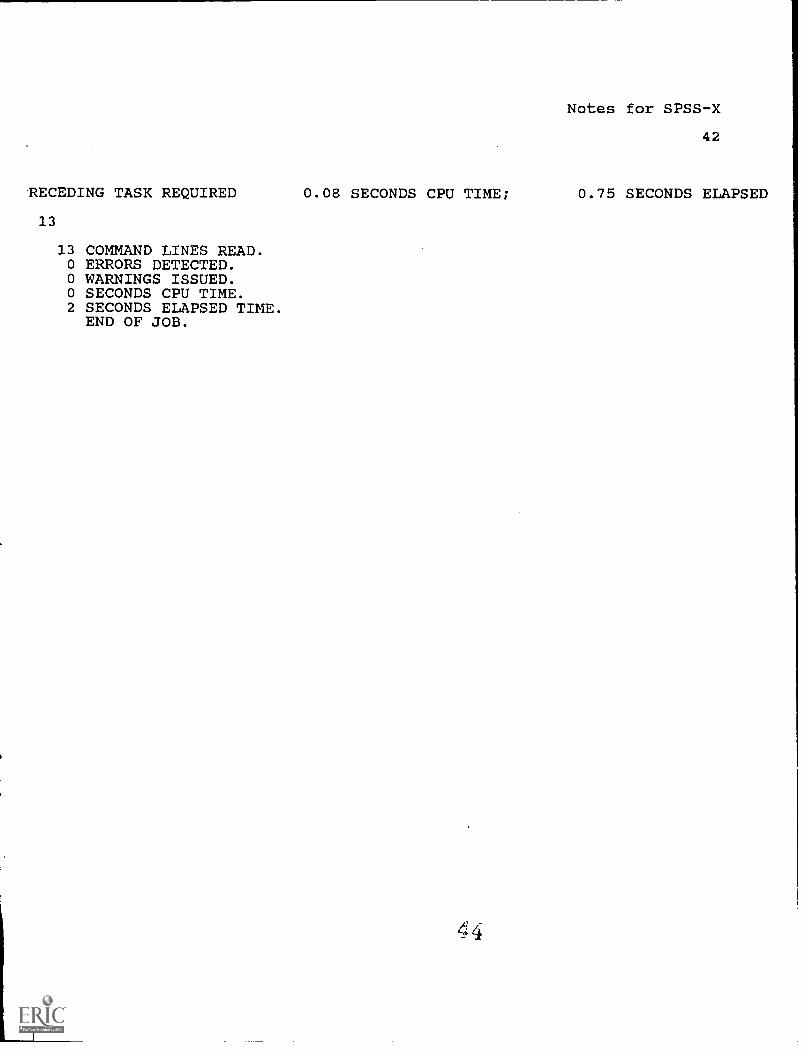
RECEDING TASK REQUIRED
13
13 COMMAND LINES READ.O ERRORS DETECTED.O WARNINGS ISSUED.O SECONDS CPU TIME.2 SECONDS ELAPSED TIME.
END OF JOB.
Notes for SPSS-X
42
0.08 SECONDS CPU TIME; 0.75 SECONDS ELAPSED


![A Bibliography of Publications about the SPSS (Statistical ...ftp.math.utah.edu/pub/tex/bib/spss.pdf · Nie:1971:SSP [4] Norman H. Nie and C. Hadlai Hull. SPSS: Statistical Package](https://static.fdocuments.in/doc/165x107/607b11dbe2e470510b5abb82/a-bibliography-of-publications-about-the-spss-statistical-ftpmathutahedupubtexbibspsspdf.jpg)