Australia’s Life Sciences Sector - AusBiotech
16
Australia’s Life Sciences Sector Snapshot 2019 | 1 Australia’s Life Sciences Sector Snapshot 2019 Conducted by
Transcript of Australia’s Life Sciences Sector - AusBiotech
Australia’s Life Sciences Sector Snapshot 2019 | 1
Australia’s Life Sciences Sector Snapshot 2019
Conducted by

2 | Australia’s Life Sciences Sector Snapshot 2019
About AusBiotech
Acknowledgements
AusBiotech is Australia’s biotechnology industry organisation representing over 3,000 members, covering human health, medical devices and diagnostics, and agricultural biotechnology sectors.
Dedicated to the development, growth and prosperity of the Australian biotechnology industry, AusBiotech provides initiatives to drive sustainability and growth, outreach and access to markets, and representation and support for members nationally and around the world.
AusBiotech is a not-for-profit organisation, with representation in each Australian state and in various special interest sectors. Active state committees and advisory groups provide a national network to support members and promote the commercialisation of Australian bioscience in the global marketplace. AusBiotech has been working on behalf of members for more than 30 years, since it was established as the Australian Biotechnology Association and 15 years later changed its name to AusBiotech.
The membership base includes biotechnology companies, ranging from start-ups to mature multinationals, research institutes and universities, specialist service professionals, corporate, institutional and individual members from Australia and overseas.
For further information or to submit any comments in relation to the Snapshot, contact:
AusBiotechLevel 3, 15 Queen Street, Melbourne, VIC 3000
+61 3 9828 [email protected]
This report was commissioned by AusBiotech, and data collection and analysis were carried out by Master of Biotechnology students at the University of Melbourne. Sincere appreciation is extended to all group members of the project.
Lorraine ChiroiuCEO, AusBiotech
Dr Claretta DSouzaNational Projects Manager, AusBiotech
Turlough CroweMBiotech Student, University of Melbourne
Caitlin PhillipsMBiotech Student, University of Melbourne
Drishti Kaur SarnaMBiotech Student, University of Melbourne
Jacqueline SaykaoMBiotech Student, University of Melbourne
Dr Matthew DigbyDirector, Master of Biotechnology, University of Melbourne

Australia’s Life Sciences Sector Snapshot 2019 | 3
Executive Summary 5
Sector Map 6
Key Findings 8
Appendix A – Definitions 14
Appendix B – Methodology and Statistics 15
Contents
Disclaimer
This report provides a statistically quantified snapshot of the employment numbers as well as the sector, state and gender distribution within the Australian life sciences sector. The information presented within this report has been derived from data that was collected over a three-month period from July to September 2019. It should be noted that the numbers presented are approximations based on statistical calculations and should not be taken as definitive.
The material in this publication is intended to provide a general summary only and should not be relied on as a substitute for legal or other professional advice. You should obtain your own legal or other professional advice. Whilst every care has been taken in producing this information, no warranty is given or implied as to the accuracy. To the extent permitted by the law, no responsibility for any loss (whether in negligence or otherwise) occasioned by anyone acting or refraining from acting as a result of this information is accepted by AusBiotech. © October 2019

More than 161 life sciences companies are listed on the ASX(up 15% from 140 in 2017) and represents a market capitalisation of approximately $170 Billion
Women represent 51% of the life sciences workforce and in industry this is only 32%
The life sciences industry has grown by 16% since 2017
55%
Victoria and New South Wales are critical hubs of the life sciences sector
There are
1,852 organisationsin the life sciences sector up 12% from 1,654 in 2017
Industry represents 55% of the life sciences sector
up from 53% in 2017
Industry employs 36% of the workforce
87,397 people, up 26% from 69,108 in 2017
There are approximately
243,406 people employed in the life sciences sector up 5% since 2017
4 | Australia’s Life Sciences Sector Snapshot 2017
Australia’s Life Sciences Sector Snapshot 2019 | 5
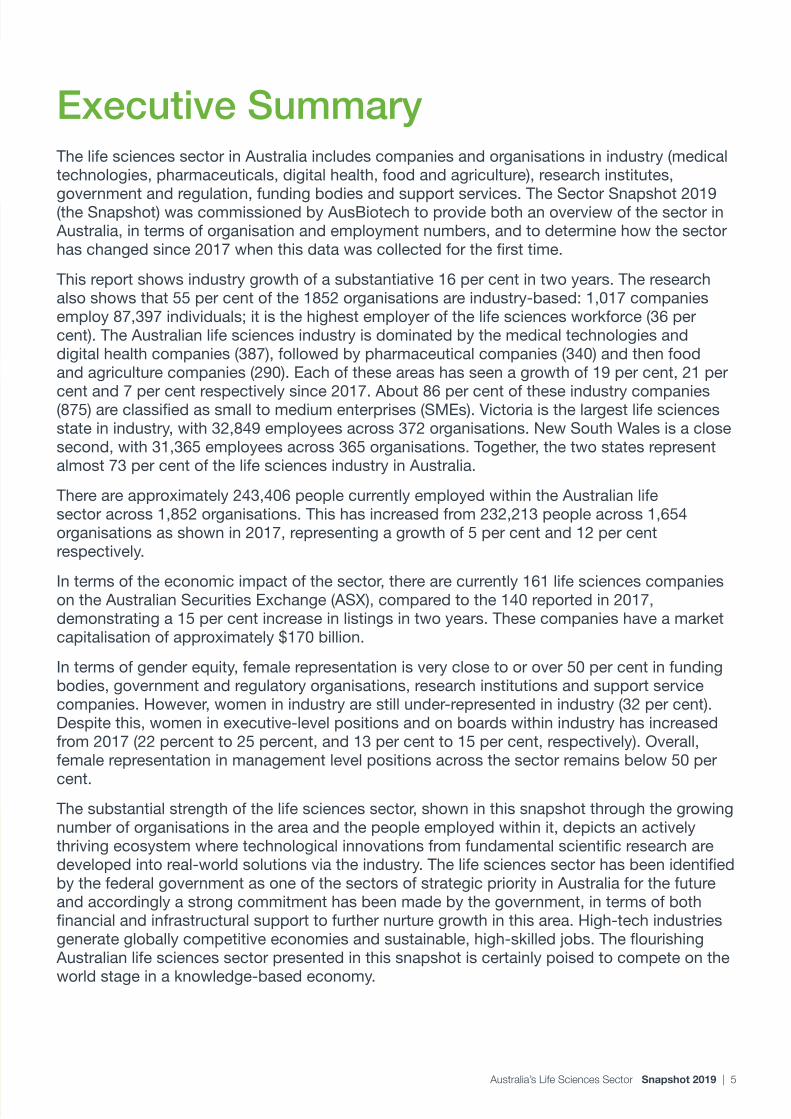
The life sciences sector in Australia includes companies and organisations in industry (medical technologies, pharmaceuticals, digital health, food and agriculture), research institutes, government and regulation, funding bodies and support services. The Sector Snapshot 2019 (the Snapshot) was commissioned by AusBiotech to provide both an overview of the sector in Australia, in terms of organisation and employment numbers, and to determine how the sector has changed since 2017 when this data was collected for the first time.
This report shows industry growth of a substantiative 16 per cent in two years. The research also shows that 55 per cent of the 1852 organisations are industry-based: 1,017 companies employ 87,397 individuals; it is the highest employer of the life sciences workforce (36 per cent). The Australian life sciences industry is dominated by the medical technologies and digital health companies (387), followed by pharmaceutical companies (340) and then food and agriculture companies (290). Each of these areas has seen a growth of 19 per cent, 21 per cent and 7 per cent respectively since 2017. About 86 per cent of these industry companies (875) are classified as small to medium enterprises (SMEs). Victoria is the largest life sciences state in industry, with 32,849 employees across 372 organisations. New South Wales is a close second, with 31,365 employees across 365 organisations. Together, the two states represent almost 73 per cent of the life sciences industry in Australia.
There are approximately 243,406 people currently employed within the Australian life sector across 1,852 organisations. This has increased from 232,213 people across 1,654 organisations as shown in 2017, representing a growth of 5 per cent and 12 per cent respectively.
In terms of the economic impact of the sector, there are currently 161 life sciences companies on the Australian Securities Exchange (ASX), compared to the 140 reported in 2017, demonstrating a 15 per cent increase in listings in two years. These companies have a market capitalisation of approximately $170 billion.
In terms of gender equity, female representation is very close to or over 50 per cent in funding bodies, government and regulatory organisations, research institutions and support service companies. However, women in industry are still under-represented in industry (32 per cent). Despite this, women in executive-level positions and on boards within industry has increased from 2017 (22 percent to 25 percent, and 13 per cent to 15 per cent, respectively). Overall, female representation in management level positions across the sector remains below 50 per cent.
The substantial strength of the life sciences sector, shown in this snapshot through the growing number of organisations in the area and the people employed within it, depicts an actively thriving ecosystem where technological innovations from fundamental scientific research are developed into real-world solutions via the industry. The life sciences sector has been identified by the federal government as one of the sectors of strategic priority in Australia for the future and accordingly a strong commitment has been made by the government, in terms of both financial and infrastructural support to further nurture growth in this area. High-tech industries generate globally competitive economies and sustainable, high-skilled jobs. The flourishing Australian life sciences sector presented in this snapshot is certainly poised to compete on the world stage in a knowledge-based economy.
Executive Summary

6 | Australia’s Life Sciences Sector Snapshot 2019
Consulting•Commercialisation
• Intellectual property (IP)
•Mergers & acquisition (M&A)
Industry body & professional organisations
Distributors
Patient support & science
communication
Contract research organisations
(CROs), including for clinical trials
Incubators & accelerators Supply &
manufacturing
Accounting & financial services
Legal
Private research institutes
Universities
Philanthropic organisations
189Research Institutes
485Support Services
The Australian Life Sciences Sector: 1852 organisations

Australia’s Life Sciences Sector Snapshot 2019 | 7
Regulatory
Federal
State
Local
Medical technology & digital health•Medical product
& devices
•Diagnostic device, including genetic testing
•eHealth, mHealth
•Wearables
•Telemedicine
Australia’s Life Sciences
Sector
Venture capitalists & angel investors
Pharmaceuticals•Drugs
•Vaccines
•Therapies, including cell therapies
Food & agriculture•Industrial
•Plants
Accelerators & incubators
State & federal grants & programs
32Government & RegulatoryOrganisations
129Funding Bodies
1,017 Industry
Companies
The Australian Life Sciences Sector: 1852 organisations

8 | Australia’s Life Sciences Sector Snapshot 2019
Key FindingsThe Australian life sciences industry has grown by 16 per cent since 2017There are 1,852 organisations identified as being part of the life sciences sector as defined by this report. These include companies and organisations within the industry, funding bodies, government and regulatory, research, and support services sub-sectors (Sector map, page 6 - 7). Growing from 1,654 organisations in 2017 to 1,852 organisations in 2019, the life sciences sector has seen a 12 per cent growth over two years.
With 1,017 companies within medical technology and digital health (387), pharmaceutical (340), and food and agriculture (290), industry makes up 55 per cent of the life sciences sector in Australia (Figure 1b). Support services make up the second largest portion of the sector (26 per cent) with 485 organisations; this category encompasses organisations ranging from legal firms, to consultancies, to manufacturers and distributors. In comparison to 2017, these sub-sectors have grown by 16 per cent and 22 per cent respectively.
Figure 1 – a) Graph shows the number of companies in the industry and support services sub-sectors in 2017 (chequered bars) to 2019 (solid bars). b) Graph showing the breakdown of companies within the industry sub-sector in 2017 (chequered bars) and 2019 (solid bars).
The life sciences workforce has increased by 5 per cent since 2017 There are approximately 243,406 people employed in the life sciences sector across the 1,852 organisations. Figure 2a shows the distribution of the workforce. The majority of the workforce is found in industry (36 per cent, 87,397 people, Figure 2b). When compared to the employee numbers reported in 2017, there has been a 5 per cent overall increase in the number of people employed by the sector (from 232,213 in 2017). Similarly, since 2017 there has been a 6 per cent increase in the number of people employed by industry and a 2 percent increase in the research workforce.
Figure 2 – a) Graph showing the distribution of life sciences employees across industry and support services in 2017(chequered bars) and 2019 (solid bars). b) Chart showing the distribution of life sciences employees within industry in 2019.
1Standard error = 20,195; 95% Confidence Interval = 203,016 – 283,795. The large CI is due to large companies having a range of employee numbers (~ 120 to 5000)

Australia’s Life Sciences Sector Snapshot 2019 | 9
Victoria and New South Wales are critical Australian life science sector hubsAlmost three-fourths of the entire life sciences sector (Figure 3a) is based in Victoria (707 organisations; 38 per cent) and New South Wales (652 organisations; 35 per cent). Queensland has the third largest number of life sciences organisations (203; 11 per cent), remaining steady from 2017. Western Australia has shown the greatest increase (50 per cent) in the number of organisations, going from 119 in 2017 to 179 in 2019. South Australia and Tasmania have shown no marked change in the size of their life sciences sectors since 2017.
The highest proportion of all people employed in the life sciences sector (Figure 3b) are based in Victoria (87,870 people) and New South Wales (88,338 people), together making up 72 per cent of the workforce. Accordingly, Queensland has the third-largest proportion of the life sciences workforce in Australia (27,707).
Figure 3 - a) The graph shows the number of life sciences organisations in each Australian state in 2017 (chequered pyramids) and 2019 (solid columns). Two organisations based in the Northern Territory are not shown. b) The graph shows the number of life sciences employees in each Australian state in 2017 (chequered pyramids) and 2019 (solid bars). Employee numbers were obtained via statistical calculations and should not be taken as definitive. Discrepancies in numbers could also be due to organisations operating in multiple states and/or across multiple categories.
The number of life sciences organisations is further broken down by state in Figure 4a, along with the respective number of employees in each state (Figure 4b). The different organisation types (industry, funding bodies, government and regulatory bodies, research institutions, support services) are distributed amongst the states in proportion to the size of the sector in each state, although, the greatest proportion (56 per cent) of support services organisations are based in Victoria. The distribution of the life sciences workforce is also similarly proportionately distributed amongst the various types of organisations in each state.

10 | Australia’s Life Sciences Sector Snapshot 2019
Figure 4 – a) The graph shows the number of life sciences organisations across each sub-sector (industry, funding bodies, government and regulatory, research institutions, support services organisations) in each Australian state in 2017 (chequered bars) and 2019 (solid bars).
b) The graph shows the number of people employed in the various life sciences sub-sectors across each Australian state in 2017 (chequered bars) and 2019 (solid bars). Employee numbers were obtained via statistical calculations and should not be taken as definitive. Discrepancies in numbers could also be due to organisations operating in multiple states and/or across multiple categories.

Australia’s Life Sciences Sector Snapshot 2019 | 11
Figure 5 – a) The graph shows the number of companies in the medical technology & digital health, pharmaceutical and food & agriculture categories of the life sciences industry in 2017 (chequered bars) and 2019 (solid bars).
b) The graph shows the number of people employed in the various types of companies in industry in 2017 (chequered bars) and 2019 (solid bars). Employee numbers were obtained via statistical calculations and should not be taken as definitive. Discrepancies in numbers could also be due to companies operating in multiple states and/or across multiple categories.
The distribution of companies amongst the categories of medical technology & digital health, pharmaceuticals and food & agriculture for each state is shown in Figure 5a. New South Wales is home to the highest number of medical technology & digital health and food & agriculture companies, whereas Victoria is where the highest number of pharmaceutical companies are based. The overall distribution of the different industry company types was generally even, however, the number of companies in all three areas of industry has notably increased in Western Australia since 2017. The number of people employed in each state shows a similar trend (Figure 5b).

12 | Australia’s Life Sciences Sector Snapshot 2019
The life sciences industry in Australia is largely composed of SMEsSmall and medium enterprises (SMEs) make up 86 per cent of the life sciences industry with approximately 875 companies with less than 100 employees across Australia. Of these, there are approximately 314 medical technology and digital health, 300 pharmaceutical and 261 food and agriculture SMEs. Since 2017, the number of medium sized industry organisations has increased, the number of small companies has decreased, and there has been little change to the number of large organisations (Figure 6). This suggests that industry has also seen growth within individual companies in additional to an overall increase in the number of companies.
Figure 6 – The graphs show the number of small, medium and large companies across the medical technology & digital health, pharmaceutical and food & agriculture industry categories in 2017 (chequered pyramid) and 2019 (solid columns).
Health and bio-medical research is an important area of investment in AustraliaThere are 161 life sciences companies listed on the ASX with a market capitalisation of approximately $170 billion. There was a 15 per cent increase in the number of ASX listed companies over two years. The majority of listed companies can be categorised (Figure 7) as medical technology & digital health companies (67), followed by pharmaceutical companies (62) and food and agriculture (16).
Figure 7 – The chart shows the number of ASX listed companies across the medical technology & digital health, pharmaceutical and food & agriculture categories.
2As of September 2019, Australian Biotechnology Journal

Australia’s Life Sciences Sector Snapshot 2019 | 13
Increased female representation in positions of leadership across the life sciences sector Women form 51 per cent of the workforce across the life sciences sector and this is has not varied markedly since 2017 (50 per cent). Female representation in senior positions (executive, board, CEO/founder) was mostly under 50 per cent across the sector, except in research institutes (50 per cent) and support services organisations (62 per cent). However, there was an increase in the percentage of women in leadership positions overall when compared to 2017 (Figure 8).
Figure 8 –The image shows the percentage female representation across the various sub-sectors in 2017 (chequered bars) and 2019 (solid bars) and the average female representation across seniority levels within an organisation.
The representation of women in industry alone was the lowest at only 32 per cent female and has not changed a lot since 2017 (33 per cent). Female representation at senior levels in industry was also the lowest when compared to the other sub-sectors. However, compared to 2017 there was a marginal increase in the percentage of executive-level women (21 per cent to 25 per cent) and female board members (13 per cent to 15 percent) as seen in Figure 9.
Figure 9 – The image shows the average percentage female distribution across industry and various seniority levels in 2017 (chequered bars) and 2019 (solid bars).

14 | Australia’s Life Sciences Sector Snapshot 2019
Appendix A - Definition ListTerm Definition Rationale
Life sciences sector
As defined by the scope of the project, this includes all entities involved in sciences that have a direct or indirect impact on human life. This does not include animal sciences in terms of companion animals and sporting animals, but includes organisations involved in veterinary pharmaceuticals.
This definition includes all businesses, organisations, government sectors, and all individuals employed that support the growing life sciences industry i.e. sciences relating directly or indirectly to human life, including those used in the primary industries but not in sporting and companion animal life sciences. This sector is broken down into digital health, food & agriculture, pharmaceuticals, research institutes, funding bodies, support services and government & regulatory.
Food & agriculture
This category includes all organisations that develop and sell technological innovations (chemical and biological) to improve, or create new processes for food, agricultural, or environmental purposes. These innovations act on the life of an organism i.e. agricultural animal, crop or pest, or on an ecological system, directly or indirectly related to human life.
This has been modified from the Department of Industry definition. This sector is broken down into research and companies.
Medical technology & digital health
Medical technology includes a wide range of medical devices (including in vitro diagnostics) used to diagnose, monitor or treat diseases in humans that are used within a hospital, general practitioner or home setting. Digital health includes eHealth (Information and communication technologies that work to improve, prevent, diagnose, treat, monitor and manage) and mHealth (mobile health that works to allow patients to manage their health - wearable or mobile data collection) that captures data about patient treatments and non-drug factors.
The definition for medical technology is obtained from the AusBiotech website. This category is broken down into companies, research, and clinical. The definition for digital health is a combination of the Nature and EU definition of digital health. This category is broken down into the un-regulated applications and software, as well as the regulated.
The TGA classifies digital health/software under medical devices, and some companies can fit into either one of the categories. To reduce the misclassification of companies, the two categories have been combined.
Pharmaceuticals This is defined as the industry concerned with the discovery, research, development, regulation and commercialisation of human and veterinary medicines.
This is the general definition for the industry including all cellular and regenerative therapeutic products.
Government & regulatory
This is defined as the bodies that govern businesses, research institutes and workers within the life sciences sector. The sector answers to, and finds guidance about ethics, regulations, funding, laws and governance, from government & regulatory bodies such as the Therapeutic Goods Administration (TGA; for therapeutics, medical technology and digital health technology), Food Standards Australia New Zealand (FSANZ; for food biotechnologies & GM foods), Office of Gene Technology Regulator (OGTR; for GMO products), Australian Pesticides and Veterinary Medicines Authority (APVMA; for agricultural and veterinary products, i.e. animal medicines and agricultural chemicals). Furthermore, the sector is supported by several federal and state government departments that specifically aid the growth of the sector such as Austrade.
Information from government websites, including:
tga.gov.au
foodstandards.gov.au
ogtr.gov.au
apvma.gov.au
This sector is broken down into federal, state and local.
Funding bodies This category is defined by organised entities that privately invest in research, business development and commercialisation of life sciences companies and/or organisations.
This definition should include any entity (business or organisation) that invests large amounts of money to companies in return for a stake in the company or equity but does not include stakeholders through Australian Securities Exchange (ASX). This also includes business incubators and accelerators that operate in the life sciences industry.
Support services This category includes all organised entities that provide support for life science companies and/or organisations.
This sector should include any company or entity that supports the sectors including IP management firms, contract research organisations (CROs), contract manufacturing organisations (CMOs), and distributors.
Research institutes
This is defined by organised entities with the purpose of research in life sciences, either privately or publicly.
Universities and private research institutions will be considered.
Life sciences employee
A person employed (for tax purposes) within Australia for a life sciences company/institution/government organisation that operates in Australia.
Any person working in Australia that supports the sector and pays Australian taxes.
Current Data collection for this report occurred between July and September 2019.
The most current and reliable available sources were used for data collection, including government websites, company websites, peer reviewed websites/ databases.
Company size Defined by the number of employees, where:
a small company has less than 20 employees;
a medium company has less than 100 employees; and a large company has over 100 employees.
This follows the AusBiotech definition of company sizes on its website.

Australia’s Life Sciences Sector Snapshot 2019 | 15
Appendix B - Statistics methodology
Overview
The comprehensive list of 1,654 organisations obtained in 2017 was verified using various public databases . Companies with no websites, those which were acquired, insolvent, irrelevant or without products/patents were removed. New companies were identified using the AusBiotech member list and sector databases in combination with the databases referred to previously. Of the resulting list of 1,852 organisations, 650 random organisations were further probed to determine their employee numbers along with the percentage of employees that work in the life sciences sector, gender distribution as well as whether they were public or private organisations . The percentage of staff involved in life sciences in each category was determined based on company/organisational background.
The assumptions made for the proportion of staff directly involved in the life sciences sector are as below:
• In large universities (over 35,000 students) 15 per cent of the staff were assumed to be involved in the life sciences, whereas in smaller universities (less than 35,000 students) 25 per cent of the staff were assumed to work in life sciences.
• 10 per cent of hospital staff are estimated to be involved in the life sciences sector i.e. involved in research, including physicians that are involved in clinical trials.
• For organisations that have less than 30 employees, it was assumed that 100 per cent of the employees are involved in the sector as smaller organisations usually have employees that perform overlapping functions.
These percentages were used to determine the total number of employees directly involved in the life sciences in each organisation.
Total number of employees x percentage involved in life sciences = total number of life sciences employees
The size of each organisation was determined based on the total number of employees, accordingly the proportion of small, medium and large organisations in the sector was determined. This information was used to extrapolate the total number of employees in the life sciences sector.
Detailed methodology
A refined list of 1,852 life sciences organisations was randomised and information on 650 companies/organisations was obtained. Of this, complete employee numbers were obtained for 515 companies/organisations. These numbers were multiplied by the per centage of employees in each organisation/company that were involved in life sciences to obtain the number of employees that are in life sciences in each organisation/company.
Number of life sciences employees= total employee numbers x percentage of the employees involved in life sciences
The 515 life sciences companies/organisations were stratified by each sub-sector and then grouped into small, medium and large organisations based on the total number of employees. The average number of employees and standard deviation (SD) for each group was also obtained using standard Microsoft Excel functions.
Based on the proportion of small (S), medium (M) and large (L) organisations in the sample group, the total number of companies in each group were determined as below.
(nS/M/L ÷ nsample size of S/M/L) x 1,852 = total number of S/M/L life sciences companies/organisations
The SD and standard error (SE) for each group was calculated. The total employee numbers for each group was calculated as below.
Total number of employeessmall/medium/large= average number of life sciences employees small/
medium/large x total number of life sciences companies/organisations small/medium/large
The total employee numbers in each group was combined to obtain an estimated total for the entire sector and all the standard errors were combined to obtain the total SE. The 95% confidence interval (CI) was calculated using the estimated total +/- 2 SE. The results are as below.
Total number of life sciences employees 243,406
SE 20,19595% CI 203,016 – 283,795
Statistically, based on the data collected, a confident projection of the total employee number can be obtained. The very large CI is predominantly due to large organisations with sizes ranging from 200 to 6,000 employees. This range is much lower for small and medium organisations. Reducing the CI would require data to be collected for all organisations on the list and is not feasible within the resources allotted to this study.
3 AusBiotech Member Directory, Biotechgate, ASX, APVMA, Google, AVCAL members directory, and the list of independent medical research institutes, AAMRI.4 Of the 650 organisations, 135 (21 per cent) did not have actual employee numbers. Employee numbers were obtained via the company website, annual reports, Company360, Bloomberg, ZoomInfo, and Owler. Information on gender distribution was obtained via the company website or public report database from the workplace gender equality agency (WGEA).5 Based on actual percentages from 8 different universities: University of Wollongong, QLD University of Technology, Central Queensland University, Murdoch University, University of Sydney, Western Sydney University, Flinders University, Australian National University.

16 | Australia’s Life Sciences Sector Snapshot 2019