Australian vocational education and training statistics ... · Web view1 Listed on (TGA) as...
46
Australian vocational education and training statistics Total VET students and courses 2017 National Centre for Vocational Education Research Highlights This publication provides an estimate of the nature and extent of vocational education and training (VET) delivered by Australian training providers in domestic and overseas locations in 2017. This picture of training activity is known as ‘total VET activity’ (TVA), to reflect that the information reports on students who undertook government-subsidised training and those who undertook training on a fee-for-service basis. In 2017: training activity was reported by 4193 training providers there were an estimated 4.2 million students enrolled in VET with an Australian training provider in 2017, a 0.7% increase from 2016 the estimated participation rate of VET students in Australia as a proportion of the Australian population aged 15 to 64 years remained steady at 24.1%, with participation highest among those aged 15 to 19 years (46.1%) there were 3.4 million program enrolments, a 7.6% decrease from 2016 nationally recognised training accounted for 87.6% of all program enrolments, a 2.4 percentage point increase there were 763 700 program completions (preliminary) a total 784.8 million VET hours were delivered, a 3.9% decrease from 2016 there were 29.0 million subject enrolments, a 3.5% decrease from 2016 there were 13.5 million Commonwealth or state funded subject enrolments, a 6.3% decrease from 2016. Commonwealth or state funded subject enrolments represented 46.3% of all subject enrolments in 2017
Transcript of Australian vocational education and training statistics ... · Web view1 Listed on (TGA) as...

Australian vocational education and training statistics
Total VET students and courses 2017
National Centre for Vocational Education Research
HighlightsThis publication provides an estimate of the nature and extent of vocational education and training (VET) delivered by Australian training providers in domestic and overseas locations in 2017. This picture of training activity is known as ‘total VET activity’ (TVA), to reflect that the information reports on students who undertook government-subsidised training and those who undertook training on a fee-for-service basis.
In 2017: training activity was reported by 4193 training providers there were an estimated 4.2 million students enrolled in VET with an Australian
training provider in 2017, a 0.7% increase from 2016 the estimated participation rate of VET students in Australia as a proportion of the
Australian population aged 15 to 64 years remained steady at 24.1%, with participation highest among those aged 15 to 19 years (46.1%)
there were 3.4 million program enrolments, a 7.6% decrease from 2016 nationally recognised training accounted for 87.6% of all program enrolments, a 2.4
percentage point increase there were 763 700 program completions (preliminary) a total 784.8 million VET hours were delivered, a 3.9% decrease from 2016 there were 29.0 million subject enrolments, a 3.5% decrease from 2016 there were 13.5 million Commonwealth or state funded subject enrolments, a 6.3%
decrease from 2016. Commonwealth or state funded subject enrolments represented 46.3% of all subject enrolments in 2017
subject only enrolments increased by 19.3% to 5.2 million, representing 17.8% of all subject enrolments (14.4% in 2016). Domestic fee-for-service subject only enrolments increased by 20.0% to 4.9 million.

Publisher’s note
For clarity in interpreting the figures presented in this publication, please print in colour.
© Commonwealth of Australia, 2018
With the exception of cover design, artwork, photographs, all logos, and any other material where copyright is owned by a third party, all
material presented in this document is provided under a Creative Commons Attribution 3.0 Australia
<http://creativecommons.org/licenses/by/3.0/au>.
The details of the relevant licence conditions are available on the Creative Commons website (accessible using the links provided) as is the
full legal code for the CC BY 3.0 AU licence <creativecommons.org/licenses/by/3.0/legalcode>.
This document should be attributed as NCVER 2018, Australian vocational education and training statistics: Total VET students and courses 2017, NCVER, Adelaide.
This work has been produced by NCVER on behalf of the Australian Government and state and territory governments, with funding provided
through the Australian Government Department of Education and Training.
The views and opinions expressed in this document are those of NCVER and do not necessarily reflect the views of the Australian
Government or state and territory governments.
ISSN 2206-5156
TD/TNC 131.17
Comments and suggestions regarding this publication are welcomed and should be forwarded to NCVER.
Published by NCVER, ABN 87 007 967 311
Level 5, 60 Light Square, Adelaide, SA 5000
PO Box 8288 Station Arcade, Adelaide SA 5000, Australia
Phone +61 8 8230 8400 Email [email protected]
Web <https://www.ncver.edu.au> <http://www.lsay.edu.au>
Follow us: <https://twitter.com/ncver> <https://www.linkedin.com/company/ncver>

11
ContentsContents 3Introduction 4Scope 5More information 6Summary 7Tables
11Terms 23Explanatory notes 26
Tables
1 Total VET summary table, 2015—17 (’000) 112a Estimated VET students in Australia by state or territory of student residence, 2017 (’000) 122b Estimated participation rate of VET students in Australia as a proportion of the Australian population
aged 15 to 64 years, 2015—17 (%) 12
3 Estimated total VET students by provider type and state or territory of student residence, 2017 (’000) 124 Estimated total VET students by provider type and the state or territory where the training was
delivered, 2017 (’000) 13
5 Estimated total VET students by state or territory of student residence and state or territory where the training was delivered, 2017 (%) 13
6 Estimated total VET student characteristics, 2015—17 147 Total VET program enrolments by level, field of education and type of accreditation, 2015—17 158a Total VET program enrolments by level, field of education, type of accreditation and selected
demographic characteristics, 2017 168b Total VET program enrolments by level, field of education, type of accreditation and selected
demographic characteristics, 2017 179 Total VET AQF program enrolments and preliminary completions by provider type, 2015—17 1810 Total VET program enrolments in the top 20 parent training packages, 2015—17 1911 Total VET subject enrolments and hours of delivery by provider type and funding source, 2015—17 2012 Total VET subject enrolments by subject result and delivery mode, 2015—17 2113 Total VET hours of delivery by subject result and delivery mode, 2015—17 2114 Load pass rates by funding source and provider type, 2017 (%) 2215 Estimated projected program completion rates and subject load pass rates by state or territory of
where training was delivered for total VET programs at certificate I and above, commencing in 2015—16 22
16 Estimated projected program completion rates and subject load pass rates by provider type for total VET programs at certificate I and above, commencing in 2015—16 22
Figures
1 Number of training providers by type, 2016—17 7
2 Estimated participation rate of VET students in Australia as a proportion of the Australian population by age, 2016—17 7
3 Program enrolments by qualification level, 2016—17 8
Total VET students and courses 2017

4 Program enrolments by type of accreditation, 2016—17 9
5 Subject enrolments by training provider type and funding source, 2017 10

Introduction In November 2012, the then Council of Australian Governments (COAG) Standing Council on Tertiary Education, Skills and Employment (SCOTESE) agreed to the introduction of mandatory reporting of nationally recognised training activity from 2014 onwards. Under the mandatory reporting requirements, all Australian training providers (excluding those exempted by regulators) delivering nationally recognised training to students, either in domestic or in overseas locations, are obliged to report information about students and their training. This publication provides an estimate of the extent and nature of vocational education and training (VET) delivered in 2017 by Australian training providers. This picture of training activity is known as ‘total VET activity’, to reflect that the information reports on students who undertook government-subsidised training and those who undertook training on a fee-for-service basis. Information in this publication is provided on the number of training providers, estimated students and participation rates, program enrolments, subject enrolments, hours of delivery, program completions and estimated program completion rates. Total VET activity (TVA) data are sourced from both the National VET Provider Collection and National VET in Schools Collection. These collections are compiled under the Australian Vocational Education and Training Management Information Statistical Standard (AVETMISS). The below diagram illustrates how TVA data are sourced and where duplicate training activity is removed.
Total VET students and courses 2017 5

De-duplication of training activity
Since the introduction of TVA, the National Centre for Vocational Education Research (NCVER) has applied a process to identify and remove duplicate training activity where the same activity is reported for the same training provider in the same collection period via different data submitters.
De-duplication of student counts
Vocational education and training by nature is diverse, spanning a wide range of learning engagements from full-time programs across multiple years and short ‘skill set’ programs, to single subject enrolments. Student participation can also be wide ranging, with some students receiving training from multiple training providers within the same year.The implementation of the USI provides a mechanism with which to better estimate student counts by identifying and potentially removing duplicate student records. NCVER has used a two-step process to de-duplicate student counts in Total VET students and courses 2017, which uses the USI where available and a count of distinct client identifiers within each submission for the residual data. For further information refer to the explanatory notes on pages 26—30.
ScopeThe 2017 data in this publication cover: the training delivered by 4193 Australian
training providers, including 3953 registered training organisations (RTOs) and 240 non-registered training providers
nationally recognised training as well as some non-nationally recognised training. In 2017, nationally recognised training accounted for 87.6% of all program enrolments compared with 85.2% in 2016
vocational education and training delivered by Australian training providers to students in both domestic and overseas locations. In 2017, an estimated 34 300 students received training in an overseas location.
It is estimated that of the 4892 RTOs listed on the national register (training.gov.au) in 2017: 81% submitted training activity data 10% had no enrolment activity during 2017 (nil return) or their activity was not within Total VET
students and courses publication scope 5% were exempt from reporting or closed their operations during 2017 and did not report data 4% did not submit training activity data.
6 Australian vocational education and training statistics

The following table compares reporting activity for training providers from 2015 to 2017.
Training providers reporting training activity in 2015–17
Registered training organisations1 Non-registered training providers2
Total training providers
2015 2016 2017 2015 2016 2017 2015 2016 2017
Number % Number % Number % Number Number Number Number Number Number
Submitted3 4082 83 4068 83 3953 81 249 243 240 4331 4311 4193Nil returns (estimated)4 427 9 532 11 512 10 na na na 427 532 512
Exempt or closed and did not submit 303 6 228 5 251 5 na na na 303 228 251
Missing (did not submit) 118 2 102 2 176 4 na na na 118 102 176
Total 4930 100 4930 100 4892 100 249 243 240 5179 5173 5132
1 Listed on <training.gov.au> (TGA) as registered in the respective year.2 Non-registered training providers in 2017 include 191 community education providers, 46 private training providers and 3 schools.3 Based on training providers with enrolments in total VET activity scope of reporting. 4 This represents RTOs who had no enrolment activity during the reporting year or their reported training activity was not within NCVER’s Total VET students and courses publication scope.na = not applicable.
Year-on-year training activity comparisons within this publication are presented for 2015 to 2017 only. 2014 was both the first and a transition year, whereby a number of training providers were granted exemptions from reporting, while others did not report their training activity. Many training providers also reported data for the first time. Where comparisons of training activity and estimated student counts are made within this publication, the de-duplication process outlined above has been applied to all years. For further information on the scope of the data and technical information, please refer to the explanatory notes on pages 26—30.
More informationData in this publication may be revised for a variety of reasons. For further information on reasons for data revisions please refer to the explanatory notes on pages 26-30.For the latest data and further year-on-year and state and territory comparisons using NCVER’s data visualisation tools and other resources visit the NCVER Portal <https://www.ncver.edu.au/data/collection/total-vet-students-and-courses>. Access to these data is governed by the National VET Data Policy (2017), agreed by the Council of Australian Governments (COAG) ministers responsible for skills. The National VET Data Policy can be viewed at <https://docs.education.gov.au/node/46116>.
Total VET students and courses 2017 7

SummaryTraining providersIn 2017, training activity was reported by 4193 training providers, including 3953 registered training organisations (RTOs) and 240 non-registered training providers.
Figure 1 Number of training providers by type, 2016–17
In 2017, compared with 2016: the total number of training providers reporting activity decreased from 4311 to 4193,
with declines in all provider types except community education providers, which increased in number, and TAFE institutes, which remained steady
the proportion of total training providers by type remained steady, with private providers accounting for the majority of total providers (75.3%), followed by community education providers (10.5%) and schools (9.5%).
Estimated student participation and student characteristics
Estimated student participation
In 2017, the estimated participation rate of VET students in Australia as a proportion of the Australian population aged 15 to 64 years is 24.1%. Consistent with 2016, the estimated participation rate is highest among those aged 15 to 19 years (46.1% in 2017).
Figure 2 Estimated participation rate of VET students in Australia as a proportion of the Australian population by age, 2016–17
Student characteristics
8 Australian vocational education and training statistics
Table 2b

In 2017, compared with 2016: the estimated number of students participating in VET remained steady at 4.2 million there was an increase in the estimated number of students among most age groups,
except those aged 14 years and under (decreasing by 17.7% to 19 400) and those aged 15 to 19 years (remaining steady at 705 100)
the number of Indigenous students decreased by 15.7% to an estimated 142 800 students, accounting for 3.4% of the total estimated VET student population
the estimated number of students studying full-time decreased by 5.1% to 454 100, while those studying part-time increased by 1.4% to 3.8 million
the number of apprentices and trainees undertaking off-the-job training increased by 5.3% to an estimated 355 200 students (accounting for 8.4% of total estimated VET students)
the number of international students (studying both onshore and offshore) increased by 10.4% to an estimated 186 300 students.
Program enrolments and completions
Australian Qualifications Framework (AQF) programs
In 2017, there were 2.8 million AQF program enrolments, a decrease of 4.6% from 2016. Non-AQF program enrolments decreased by 19.0% to 627 300, accounting for 18.5% of all program enrolments in 2017 (21.1% in 2016). The decrease in non-AQF enrolments was mainly due to a 23.4% decrease in other recognised course1 enrolments (much of this decrease was due to a decline in enrolments in skill sets).
Figure 3 Program enrolments by qualification level, 2016–17
In 2017, compared with 2016, program enrolments declined across all certificate levels, except for certificate III: diploma and above decreased by 18.1% to 512 600 certificate I decreased by 2.6% to 195 800 certificate II decreased by 0.1% to 599 600 certificate III increased by 2.6% to 996 100 certificate IV decreased by 8.0% to 455 300.
Type of accreditation1 ‘Other recognised courses’ include secondary education programs (Years 10 to 12), statements of attainment, bridging and enabling courses,
and other education not elsewhere classified.
Total VET students and courses 2017 9
Table 7
Table 7
Table 6
Table 6
Table 6
Table 6
Table 6
Table 6

In 2017, compared with 2016: national training package program enrolments decreased by 4.3% to 2.5 million, representing
74.0% of all VET program enrolments (71.4% in 2016)
program enrolments in the top 20 training packages (same in both years) decreased by 2.6% to 2.3 million, accounting for 92.1% of total training package program enrolments (90.6% in 2016)
Business Services remained the most popular training package despite a 14.1% decrease to360 200 enrolments, followed by Community Services with 335 200 enrolments
nationally recognised accredited course enrolments decreased by 11.5% to 370 300; higher-level qualifications2 increased by 16.4% to 3 100; locally recognised courses decreased by 16.0% to253 100; and skill sets decreased by 22.3% to 252 900.
Figure 4 Program enrolments by type of accreditation, 2016–17
Field of education
In 2017, compared with 2016: Management and commerce remained the most popular field of education despite a 9.5%
decrease to 655 500 program enrolments (representing 19.4% of all program enrolments in 2017) all fields of education experienced a decline in program enrolments, with Health recording the
largest decline (decreasing by 26.2% to 221 300 program enrolments).
Completions and completion rates
In 2017, there were 763 700 program completions (preliminary), with 33.5% at certificate III level(34.2% in 2016).The estimated national projected completion rate3 for total VET programs at certificate I and above commencing in 2016 is 47%. The estimated projected completion rate for certificate I and above programs delivered by different types of training providers in 2016 is: 48% for private training providers 47% for community education providers 43% for TAFEs.
Subject enrolments
2 Higher level qualifications are not a training package qualification or nationally recognised accredited course. They are accredited by higher education institutions with self-accrediting authority or state or territory accreditation authorities.
3 ‘Estimated projected completion rate’ is the percentage of programs that are estimated to be completed, according to statistical modelling developed by NCVER. For more information see technical paper: Total VET program completion rates available at <https://www.ncver.edu.au/publications/publications/all-publications/total-vet-program-completion-rates>.
10 Australian vocational education and training statistics
Table 7
Table 7
Table 10Table 10

In 2017, the total number of subject enrolments decreased by 3.5% to 29.0 million. In contrast, subject only enrolments increased by 19.3% to 5.2 million, representing 17.8% of all subject enrolments (14.4% in 2016).
In 2017, compared with 2016: Commonwealth or state-funded subject enrolments decreased by 6.3% to 13.5 million, with
enrolments at private providers declining by 12.9% to 4.7 million fee-for-service (domestic) subject enrolments decreased by 3.2% to 13.4 million, with
enrolments at TAFE declining by 15.9% to 1.4 million and enrolments at private providers declining by 1.9% to 10.1 million
fee-for-service (domestic) subject only enrolments increased by 20.0% to 4.9 million.
Figure 5 Subject enrolments by training provider type and funding source, 2017
Total VET students and courses 2017 11

TablesTable 1 Total VET summary table, 2015–17 (’000)
State or territory where the training was delivered 2015 2016 2017 2016–17
(’000) (’000) (’000) % % change
Estimated studentsNew South Wales 1 167.5 1 300.6 1 330.2 31.4 2.3Victoria 995.0 968.7 1 022.8 24.1 5.6Queensland 938.3 963.6 904.6 21.4 -6.1South Australia 218.1 236.1 230.8 5.4 -2.3Western Australia 368.5 373.5 373.4 8.8 -0.0Tasmania 63.4 64.0 54.1 1.3 -15.5Northern Territory 47.2 44.0 45.5 1.1 3.4Australian Capital Territory 69.4 74.9 76.4 1.8 2.0Overseas 34.8 33.1 34.3 0.8 3.7Other2 108.3 149.4 163.6 3.9 9.5
Total 4 010.4 4 207.7 4 235.6 100.0 0.7
Subject enrolmentsNew South Wales 8 697.2 9 673.1 9 262.5 31.9 -4.2Victoria 7 715.2 7 007.4 6 974.7 24.0 -0.5Queensland 7 254.2 7 349.3 6 906.5 23.8 -6.0South Australia 1 432.9 1 439.9 1 335.4 4.6 -7.3Western Australia 2 905.7 3 046.3 2 988.0 10.3 -1.9Tasmania 410.8 409.6 380.0 1.3 -7.2Northern Territory 245.3 278.1 294.5 1.0 5.9Australian Capital Territory 470.4 479.6 463.6 1.6 -3.3Overseas 445.6 407.9 425.7 1.5 4.4Other2 5.1 12.0 7.2 0.0 -40.6
Total 29 582.4 30 103.3 29 038.1 100.0 -3.5
Hours of deliveryNew South Wales 212 136.9 233 190.0 225 823.1 28.8 -3.2Victoria 256 660.8 227 376.9 221 145.3 28.2 -2.7Queensland 187 754.8 189 413.2 173 792.5 22.1 -8.2South Australia 44 099.4 42 644.0 39 013.3 5.0 -8.5Western Australia 81 438.9 80 895.7 82 488.8 10.5 2.0Tasmania 10 954.3 10 102.9 10 930.6 1.4 8.2Northern Territory 6 755.5 7 757.6 8 043.5 1.0 3.7Australian Capital Territory 12 733.4 12 397.7 11 443.9 1.5 -7.7Overseas 12 748.9 12 507.3 11 822.1 1.5 -5.5Other2 163.6 262.9 272.4 0.0 3.6
Total 825 446.5 816 548.1 784 775.7 100.0 -3.9
Program completions1
New South Wales 226.8 224.8 215.4 28.2 naVictoria 250.8 210.8 194.5 25.5 naQueensland 230.9 226.8 209.2 27.4 naSouth Australia 42.3 35.1 27.2 3.6 naWestern Australia 98.1 86.4 86.5 11.3 naTasmania 11.3 10.7 10.4 1.4 naNorthern Territory 6.0 5.9 6.3 0.8 naAustralian Capital Territory 18.8 15.4 12.1 1.6 na
Total 887.5 818.9 763.7 100.0 na
1 Program completions is based on state or territory of the training provider's head office. Program completions for 2017 are preliminary only. The 2017 data will be revised upwards in 2018.
2 Refers to other Australian territories (for example, Christmas Island) and where the delivery location is ‘not known’. For students, ‘other’ also includes instances where the student received training that was delivered in more than one state or territory.
For notes on the tables, see the explanatory notes on pages 26–30.
12 Australian vocational education and training statistics

Table 2a Estimated VET students in Australia by state or territory of student residence, 2017 (’000)
NSW Vic. Qld SA WA Tas. NT ACT Aust.
VET students in Australia14 years and under 5.1 7.4 3.1 1.0 0.8 0.2 0.5 0.3 19.315 to 19 years 199.1 169.6 162.4 36.4 73.2 10.8 5.2 9.2 683.520 to 24 years 176.7 140.4 124.9 38.7 52.0 10.8 6.2 9.7 586.925 to 44 years 495.8 382.1 371.3 108.0 159.3 27.4 24.6 25.5 1 682.045 to 64 years 280.2 212.7 218.6 67.9 75.5 17.6 11.5 11.7 943.865 years and over 23.2 17.4 13.3 5.4 3.8 1.0 0.6 0.9 69.3Not known 4.9 35.4 2.8 1.1 1.1 0.1 0.2 0.2 70.3Total estimated students
1 185.0 965.0 896.4 258.5 365.7 68.0 48.7 57.4 4 055.0
Australian population
14 years and under 1 464.8 1 166.4 966.7 305.6 502.2 93.5 53.7 78.2 4 632.015 to 19 years 469.8 373.8 310.8 103.3 154.7 32.1 15.1 24.3 1 484.120 to 24 years 539.7 465.3 343.2 115.7 172.0 31.6 17.6 33.8 1 719.225 to 44 years 2 215.5 1 841.9 1 348.7 443.5 757.4 121.0 84.2 129.2 6 942.745 to 64 years 1 918.7 1 517.1 1 217.1 444.0 634.3 142.3 57.7 93.5 6 026.165 years and over 1 252.5 959.1 741.9 311.4 359.9 100.3 17.8 51.2 3 794.8Total population 7 861.1 6 323.6 4 928.5 1 723.5 2 580.4 520.9 246.1 410.3 24 598.9
For notes on the tables, see the explanatory notes on pages 26–30.
Table 2b Estimated participation rate of VET students in Australia as a proportion of the Australian population aged 15 to 64 years, 2015–17 (%)
2015 2016 201715 to 19 years 48.0 46.3 46.1
20 to 24 years 34.6 34.2 34.1
25 to 44 years 23.3 24.3 24.2
45 to 64 years 14.2 15.5 15.7
15 to 64 years 23.4 24.1 24.1
For notes on the tables, see the explanatory notes on pages 26–30.
Table 3 Estimated total VET students by provider type and state or territory of student residence, 2017 (’000)
Provider type NSW Vic. Qld SA WA Tas. NT ACT Other1 Aust. Overseas TotalTAFE 250.9 148.5 89.7 51.2 59.1 19.2 2.8 9.9 5.2 636.7 43.5 680.2University 0.6 33.3 5.4 0.1 0.6 0.5 6.6 0.0 2.0 49.1 7.1 56.2
School 34.0 14.4 26.5 0.6 1.7 2.0 0.6 1.9 0.8 82.4 0.2 82.6
Community education provider
142.2 90.7 38.2 34.2 4.5 0.9 5.8 5.8 59.2 381.6 2.7 384.3
Enterprise provider 17.5 8.3 21.7 7.2 14.7 0.6 1.7 0.3 2.6 74.5 1.0 75.5
Private training providers
620.3 593.8 625.9 134.7 231.8 37.5 24.8 33.4 123.3 2 425.5 123.9 2 549.4
Attending more than one provider type
119.6 76.0 89.0 30.4 53.3 7.3 6.5 5.9 17.1 405.3 2.2 407.5
Total estimated students
1 185.0 965.0 896.4 258.5 365.7 68.0 48.7 57.4 210.3 4 055.0 180.6 4 235.6
1 Refers to other Australian territories (for example, Christmas Island) and where the delivery location is ‘not known’. For students, ‘other’ also includes instances where the student received training that was delivered in more than one state or territory.
For notes on the tables, see the explanatory notes on pages 26–30.
Total VET students and courses 2017 13

Table 4 Estimated total VET students by provider type and the state or territory where the training was delivered, 2017 (’000)
Provider type NSW Vic. Qld SA WA Tas. NT ACT Overseas Other TotalTAFE 281.5 149.3 84.1 49.9 56.1 18.3 2.1 12.9 23.4 2.6 680.2University 0.1 37.2 5.5 0.0 0.4 0.6 8.7 0.0 3.6 0.0 56.2School 33.8 14.9 26.6 0.6 1.7 2.0 0.5 2.3 - 0.1 82.6Community education provider 146.1 102.9 38.2 36.1 47.8 0.8 6.2 6.0 0.0 0.2 384.3
Enterprise provider 20.9 7.4 21.9 7.2 14.8 0.4 2.0 0.2 0.3 0.3 75.5Private training providers 741.5 644.2 651.0 112.8 207.6 27.0 21.3 50.1 6.9 87.1 2 549.4Attending more than one provider type
106.2 66.8 77.3 24.3 45.0 5.1 4.7 4.9 0.0 73.3 407.5
Total estimated students 1 330.2 1 022.8 904.6 230.8 373.4 54.1 45.5 76.4 34.3 163.6 4 235.6
For notes on the tables, see the explanatory notes on pages 26–30.
Table 5 Estimated total VET students by state or territory of student residence and state or territory where the training was delivered, 2017 (%)
State or territory of student residence
State or territory where the training was deliveredNSW Vic. Qld SA WA Tas. NT ACT Overseas Other Total
New South Wales 79.2 3.1 4.3 0.6 2.1 0.3 1.3 21.3 0.5 21.0 28.0
Victoria 3.6 83.8 2.5 0.9 0.8 0.5 1.0 6.3 0.4 15.9 22.8
Queensland 5.0 1.7 84.4 0.4 1.3 0.2 3.6 6.5 0.8 22.4 21.2
South Australia 1.2 0.8 0.8 92.2 0.4 0.1 0.6 0.7 0.0 7.3 6.1
Western Australia 2.3 1.1 1.8 0.3 75.5 0.2 2.0 1.7 0.1 14.2 8.6
Tasmania 0.4 0.4 0.3 0.1 0.2 93.9 0.1 0.5 0.1 2.4 1.6
Northern Territory 0.2 0.1 0.3 0.1 0.2 0.1 81.3 0.2 0.0 2.2 1.2
Australian Capital Territory 0.5 0.2 0.2 0.1 0.4 0.0 0.0 55.0 0.0 2.2 1.4
Overseas 4.1 4.2 2.7 1.9 4.3 2.8 1.5 1.8 95.5 1.2 4.3
Other 3.5 4.6 2.7 3.4 14.8 1.8 8.6 6.0 2.6 11.1 5.0
Total estimated students 100.0 100.0 100.0 100.0 100.0 100.0 100.0 100.0 100.0 100.0 100.0
For notes on the tables, see the explanatory notes on pages 26–30.
14 Australian vocational education and training statistics

Table 6 Estimated total VET student characteristics, 2015–17
Student characteristics 2015 2016 2017 2016–17
(’000) (’000) (’000) % % change
SexMales 2 084.3 2 096.9 2 144.7 50.6 2.3
Females 1 769.9 1 957.0 1 978.2 46.7 1.1
Not known 156.2 153.8 112.6 2.7 -26.8
Age14 years and under 22.6 23.6 19.4 0.5 -17.7
15 to 19 years 730.6 705.4 705.1 16.6 -0.0
20 to 24 years 635.0 634.6 643.3 15.2 1.4
25 to 44 years 1 658.6 1 751.8 1 776.8 42.0 1.4
45 to 64 years 839.6 929.0 950.2 22.4 2.3
65 years and over 59.8 67.5 69.5 1.6 2.9
Not known 64.0 95.8 71.2 1.7 -25.6
Student remoteness regionMajor cities 2 363.2 2 465.3 2 509.6 59.2 1.8
Inner regional 790.6 811.2 806.7 19.0 -0.6
Outer regional 408.3 405.7 395.3 9.3 -2.6
Remote 74.8 72.4 69.1 1.6 -4.7
Very remote 44.6 42.9 40.5 1.0 -5.6
Overseas 165.3 169.5 180.6 4.3 6.5
Not known 163.6 240.6 233.8 5.5 -2.8
Indigenous statusIndigenous 141.0 169.4 142.8 3.4 -15.7
Non-Indigenous 3 271.7 3 469.8 3 597.8 84.9 3.7
Not known 597.7 568.5 494.9 11.7 -12.9
Disability (including impairment or long-term condition)With a disability 177.2 180.5 180.0 4.2 -0.3
Without a disability 3 188.1 3 364.2 3 428.7 80.9 1.9
Not known 645.1 663.0 626.9 14.8 -5.4
School statusAt school 378.1 368.8 358.7 8.5 -2.8
Not at school 3 050.8 3 239.9 3 340.0 78.9 3.1
Not known 581.6 599.0 536.9 12.7 -10.4
Study modeFull-time 471.5 478.6 454.1 10.7 -5.1
Part-time 3 538.9 3 729.1 3 781.5 89.3 1.4
Apprentice/trainee statusApprentices and trainees undertaking off-the-job training 337.6 337.2 355.2 8.4 5.3
Not apprentices and trainees 3 672.8 3 870.5 3 880.4 91.6 0.3
SEIFA (IRSD)Quintile 1 – Most disadvantaged 775.7 776.7 760.3 18.0 -2.1
Quintile 2 785.3 803.3 805.7 19.0 0.3
Quintile 3 752.9 776.6 787.4 18.6 1.4
Quintile 4 746.1 765.6 775.6 18.3 1.3
Quintile 5 – Least disadvantaged 588.1 625.8 641.9 15.2 2.6
Not known 362.2 459.8 464.7 11.0 1.1
Student status (based on funding source)International students 155.6 168.7 186.3 4.4 10.4
Domestic students 3 854.8 4 039.0 4 049.3 95.6 0.3
Total estimated students 4 010.4 4 207.7 4 235.6 100.0 0.7
For notes on the tables, see the explanatory notes on pages 26–30.
Total VET students and courses 2017 15

Table 7 Total VET program enrolments by level, field of education and type of accreditation, 2015–17
2015 2016 2017 2016–17
('000) ('000) ('000) % % change
AQF level
Diploma or higher 649.0 625.8 512.6 15.1 -18.1
Graduate diploma 2.5 3.8 2.8 0.1 -26.8
Graduate certificate 3.8 4.1 3.8 0.1 -6.8
Bachelor degree (honours and pass) 2.4 1.8 2.3 0.1 29.2
Advanced diploma 71.0 66.6 73.7 2.2 10.8
Associate degree 0.8 0.8 0.7 0.0 -12.7
Diploma 568.5 548.8 429.3 12.7 -21.8
Certificate IV 541.9 495.0 455.3 13.4 -8.0
Certificate III 1 001.2 970.4 996.1 29.4 2.6
Certificate II 612.7 600.4 599.6 17.7 -0.1
Certificate I 212.6 201.0 195.8 5.8 -2.6
AQF sub-total 3 017.2 2 892.6 2 759.4 81.5 -4.6
Non-AQF level
Other recognised courses 432.6 687.6 526.5 15.5 -23.4
Non-award courses 74.6 86.9 100.8 3.0 16.0
Non-AQF sub-total 507.2 774.5 627.3 18.5 -19.0
Field of education
Natural and physical sciences 17.0 14.4 13.6 0.4 -6.1
Information technology 94.0 85.8 74.3 2.2 -13.4
Engineering and related technologies 508.1 475.0 473.7 14.0 -0.3
Architecture and building 269.9 257.2 257.2 7.6 -0.0
Agriculture, environmental and related studies 90.6 89.9 84.5 2.5 -6.0
Health 227.3 299.8 221.3 6.5 -26.2
Education 204.8 206.5 201.3 5.9 -2.5
Management and commerce 768.4 724.2 655.5 19.4 -9.5
Society and culture 501.5 486.7 467.9 13.8 -3.8
Creative arts 87.1 85.4 79.3 2.3 -7.2
Food, hospitality and personal services 274.5 281.4 272.6 8.0 -3.1
Mixed field programmes 327.5 335.1 332.6 9.8 -0.7
No field of education 153.7 325.6 252.9 7.5 -22.3
Type of accreditation
National training package qualifications 2 730.1 2 619.2 2 507.4 74.0 -4.3
Nationally recognised accredited courses 405.3 418.5 370.3 10.9 -11.5
Higher-level qualifications 3.3 2.6 3.1 0.1 16.4
Locally recognised courses 232.0 301.2 253.1 7.5 -16.0
Skill sets – nationally and locally recognised 153.7 325.5 252.9 7.5 -22.3
Total program enrolments 3 524.4 3 667.1 3 386.7 100.0 -7.6
For notes on the tables, see the explanatory notes on pages 26–30.
16 Australian vocational education and training statistics
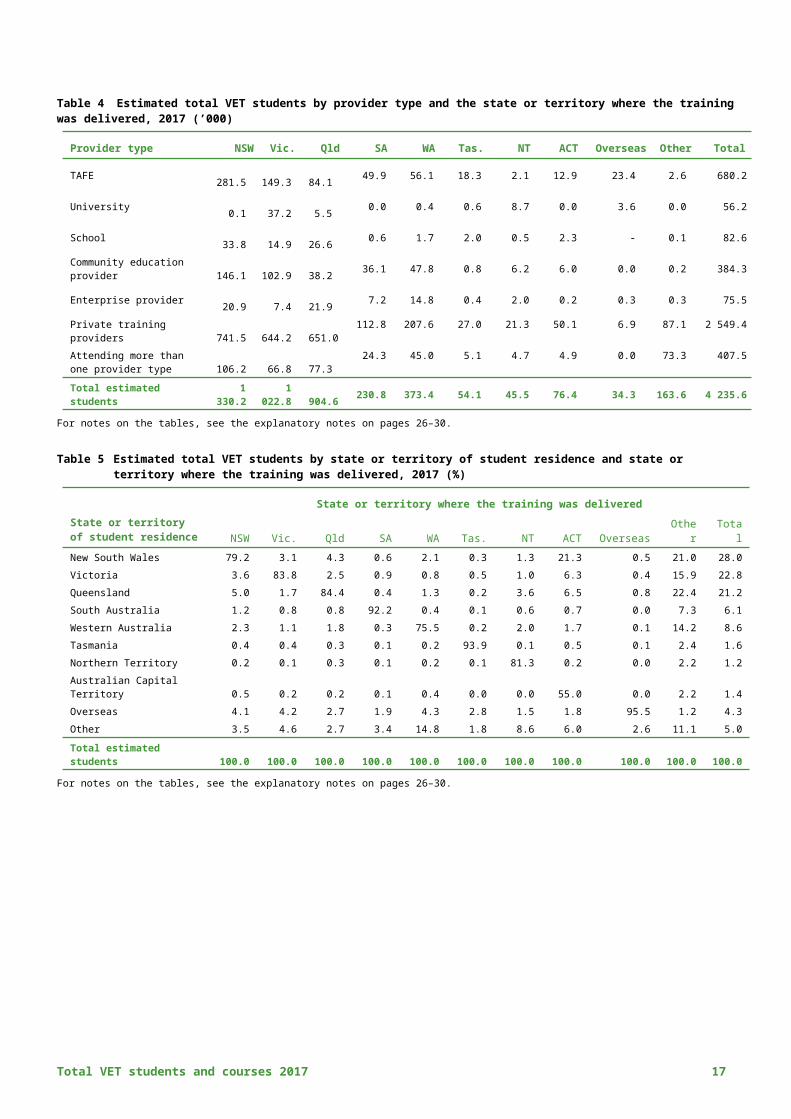
Table 8a Total VET program enrolments by level, field of education, type of accreditation and selected demographic characteristics, 2017
Total Male Female Aged 24 years and
under
Aged 25 to 44 years
Aged 45 to 64 years
Indigenous
(’000) % % % % % %
AQF level
Diploma or higher 512.6 10.8 20.2 11.6 20.3 12.6 7.7
Graduate diploma 2.8 0.0 0.1 0.0 0.1 0.2 0.0
Graduate certificate 3.8 0.0 0.2 0.1 0.2 0.2 0.0
Bachelor degree (honours and pass) 2.3 0.1 0.1 0.1 0.1 0.0 0.0
Advanced diploma 73.7 2.1 2.3 1.9 3.0 1.2 0.3
Associate degree 0.7 0.0 0.0 0.0 0.0 0.0 0.0
Diploma 429.3 8.5 17.5 9.6 17.0 11.1 7.3
Certificate IV 455.3 11.7 15.3 7.7 18.3 17.2 8.4
Certificate III 996.1 30.9 27.9 34.0 26.9 24.3 30.3
Certificate II 599.6 20.4 14.6 28.3 9.5 9.6 24.8
Certificate I 195.8 6.8 4.6 6.8 4.6 5.8 12.6
AQF sub-total 2 759.4 80.6 82.6 88.4 79.5 69.5 83.7
Non-AQF level
Other recognised courses 526.5 16.7 14.1 8.8 17.6 26.9 13.3
Non-award courses 100.8 2.7 3.3 2.8 2.8 3.6 3.0
Non-AQF sub-total 627.3 19.4 17.4 11.6 20.5 30.5 16.3
Field of education
Natural and physical sciences 13.6 0.3 0.5 0.4 0.4 0.4 0.2
Information technology 74.3 3.0 1.2 3.4 1.3 1.0 1.9
Engineering and related technologies 473.7 23.7 2.8 14.2 13.8 14.2 13.5
Architecture and building 257.2 12.8 1.5 9.5 6.6 5.0 5.9
Agriculture, environmental and related studies 84.5 3.4 1.5 2.9 2.1 2.4 5.0
Health 221.3 3.5 10.0 4.8 7.1 9.3 4.7
Education 201.3 3.7 8.6 3.2 8.1 8.1 5.2
Management and commerce 655.5 15.4 23.6 18.0 22.2 16.8 16.2
Society and culture 467.9 9.6 18.7 13.7 13.8 14.5 15.0
Creative arts 79.3 1.9 2.9 4.0 1.1 1.0 2.5
Food, hospitality and personal services 272.6 5.6 11.0 12.6 5.1 3.2 8.0
Mixed field programmes 332.6 8.8 11.2 9.0 9.8 11.3 13.0
No field of education 252.9 8.3 6.5 4.3 8.6 12.7 8.9
Type of accreditation
National training package qualifications 2 507.4 73.9 74.2 81.4 71.7 61.9 75.3
Nationally recognised accredited courses 370.3 9.5 12.7 8.7 11.5 14.3 10.8
Higher-level qualifications 3.1 0.1 0.1 0.1 0.1 0.0 0.0
Locally recognised courses 253.1 8.2 6.6 5.4 8.1 11.1 5.0
Skill sets – nationally and locally recognised 252.9 8.3 6.5 4.3 8.6 12.7 8.9
Total (%) na 100.0 100.0 100.0 100.0 100.0 100.0Total program enrolments ('000) 3 386.7 1 801.5 1 554.8 1 481.3 1 325.9 542.8 175.1
For notes on the tables, see the explanatory notes on pages 26–30.
Total VET students and courses 2017 17

Table 8b Total VET program enrolments by level, field of education, type of accreditation and selected demographic characteristics, 2017
Total From rural/
remote localities
With a disability
At school Full-time Part-time Apprentices and trainees (off-the-job)
(’000) % % % % % %AQF levelDiploma or higher 512.6 7.9 11.0 1.9 27.3 12.3 3.7
Graduate diploma 2.8 0.1 0.0 0.0 0.1 0.1 0.0
Graduate certificate 3.8 0.1 0.0 0.0 0.1 0.1 0.0
Bachelor degree (honours and pass) 2.3 0.0 0.0 0.0 0.1 0.1 -
Advanced diploma 73.7 0.5 0.8 0.2 4.1 1.7 0.3
Associate degree 0.7 0.0 0.0 0.0 0.0 0.0 -
Diploma 429.3 7.3 10.0 1.7 23.0 10.3 3.4
Certificate IV 455.3 10.4 10.3 1.6 17.8 12.4 5.7
Certificate III 996.1 31.5 30.7 25.3 31.1 29.0 82.4
Certificate II 599.6 22.2 18.9 55.6 11.5 19.1 7.2
Certificate I 195.8 6.9 11.8 11.2 3.8 6.2 1.0
AQF sub-total 2 759.4 79.0 82.7 95.5 91.6 79.1 100.0
Non-AQF levelOther recognised courses 526.5 18.1 13.8 2.9 7.0 17.5 -
Non-award courses 100.8 2.9 3.5 1.6 1.4 3.3 -
Non-AQF sub-total 627.3 21.0 17.3 4.5 8.4 20.9 -
Field of education Natural and physical sciences 13.6 0.2 0.4 0.5 0.7 0.3 0.3
Information technology 74.3 1.8 3.7 5.1 3.3 1.9 0.5
Engineering and related technologies 473.7 19.6 9.8 12.1 10.7 14.8 33.3
Architecture and building 257.2 5.7 4.2 9.7 6.4 7.9 15.2
Agriculture, environmental and related studies
84.5 6.1 3.2 3.6 3.0 2.4 3.4
Health 221.3 6.9 4.7 3.4 6.2 6.6 0.8
Education 201.3 6.4 4.6 0.8 8.0 5.5 2.1
Management and commerce 655.5 14.6 18.0 17.8 17.5 19.8 23.5
Society and culture 467.9 12.7 15.0 14.5 19.6 12.5 7.2
Creative arts 79.3 1.3 3.3 6.5 3.7 2.0 0.3
Food, hospitality and personal services 272.6 7.1 7.1 17.0 7.9 8.1 12.1
Mixed field programmes 332.6 7.7 18.1 7.7 9.9 9.8 1.3
No field of education 252.9 9.8 7.9 1.2 3.0 8.5 -
Type of accreditationNational training package qualifications 2 507.4 74.6 72.1 87.5 82.8 72.0 99.9
Nationally recognised accredited courses 370.3 8.2 13.8 8.6 10.9 10.9 0.1
Higher-level qualifications 3.1 0.0 0.1 0.0 0.1 0.1 -
Locally recognised courses 253.1 7.4 6.1 2.7 3.1 8.5 -
Skill sets – nationally and locally recognised
252.9 9.8 7.9 1.2 3.0 8.5 -
Total (%) na 100.0 100.0 100.0 100.0 100.0 100.0Total program enrolments ('000) 3 386.7 434.4 212.2 570.4 638.7 2 748.0 405.3
For notes on the tables, see the explanatory notes on pages 26–30.
18 Australian vocational education and training statistics
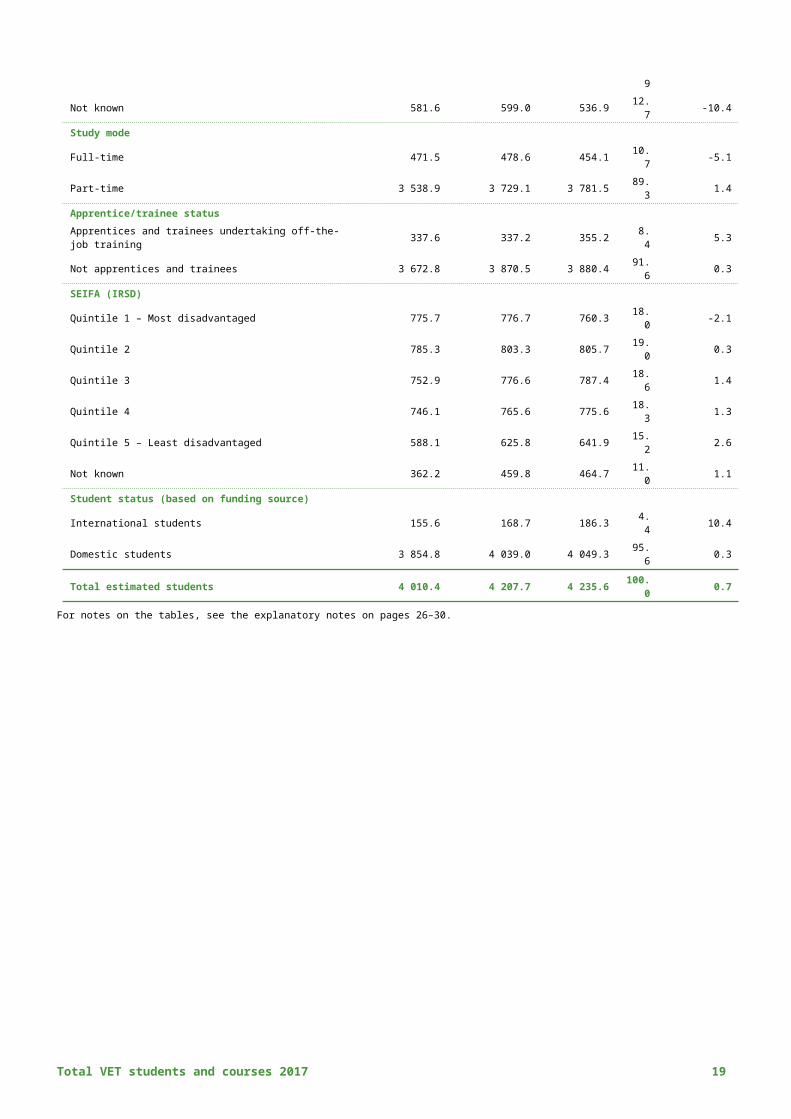
Table 9 Total VET AQF program enrolments and preliminary completions by provider type, 2015–17
Provider type Program enrolments Program completionsAQF program 2015 2016 2017 2016–17 2015 2016 Prelim. 2017
(’000) (’000) (’000) % % change (‘000) (’000) (’000) %
TAFE Diploma or higher 204.4 198.2 164.8 6.0 -16.9 50.6 45.6 40.0 5.2
Certificate IV 156.9 142.6 137.0 5.0 -3.9 51.0 42.4 37.4 4.9
Certificate III 332.4 324.4 340.3 12.3 4.9 98.9 88.2 81.9 10.7
Certificate II 189.7 176.3 180.3 6.5 2.2 49.3 47.3 42.9 5.6
Certificate I 61.4 60.4 61.9 2.2 2.5 13.8 12.4 11.9 1.6
Total TAFE 944.8 901.9 884.2 32.0 -2.0 263.7
236.0 214.1 28.0
UniversityDiploma or higher 20.1 20.1 20.3 0.7 0.9 7.1 7.5 7.2 0.9
Certificate IV 13.1 11.5 10.0 0.4 -12.5 5.1 4.8 3.8 0.5
Certificate III 23.5 21.7 22.3 0.8 2.8 5.6 5.1 4.2 0.6
Certificate II 12.6 11.4 11.9 0.4 3.7 3.0 2.9 2.4 0.3
Certificate I 3.9 4.2 3.6 0.1 -15.0 0.6 0.8 0.6 0.1
Total university 73.2 68.9 68.0 2.5 -1.2 21.4 21.1 18.2 2.4
SchoolDiploma or higher 0.5 0.6 0.6 0.0 8.1 0.2 0.2 0.3 0.0
Certificate IV 2.3 2.5 2.5 0.1 -0.5 1.0 1.0 0.9 0.1
Certificate III 25.6 25.2 27.2 1.0 7.6 4.2 4.0 3.7 0.5
Certificate II 144.4 147.3 137.6 5.0 -6.6 35.8 34.8 33.7 4.4
Certificate I 50.1 43.9 38.4 1.4 -12.6 20.5 16.8 15.8 2.1
Total school 223.0 219.5 206.3 7.5 -6.0 61.7 56.8 54.4 7.1
Community education provider
Diploma or higher 8.9 8.6 8.3 0.3 -3.5 2.3 2.9 2.8 0.4
Certificate IV 13.2 11.9 12.4 0.4 3.4 6.1 5.0 4.6 0.6
Certificate III 42.4 35.2 33.2 1.2 -5.6 12.1 11.3 10.8 1.4
Certificate II 21.6 19.2 24.6 0.9 28.3 6.5 5.9 6.7 0.9
Certificate I 11.7 12.4 12.7 0.5 2.8 2.3 3.3 3.1 0.4
Total community education provider
97.8 87.2 91.1 3.3 4.5 29.3 28.4 28.0 3.7
Enterprise providerDiploma or higher 3.4 4.0 3.3 0.1 -18.2 1.2 1.2 0.9 0.1
Certificate IV 7.5 7.3 6.7 0.2 -8.6 3.4 3.2 3.1 0.4
Certificate III 28.9 33.7 33.1 1.2 -1.9 9.7 11.0 12.5 1.6
Certificate II 19.0 27.3 27.7 1.0 1.2 6.6 9.8 11.2 1.5
Certificate I 12.9 14.5 11.8 0.4 -18.9 1.0 1.5 1.2 0.2
Total enterprise provider 71.8 86.9 82.5 3.0 -5.1 21.9 26.7 28.8 3.8
Private training providers Diploma or higher 411.6 394.3 315.4 11.4 -20.0 82.5 91.8 91.9 12.0
Certificate IV 348.9 319.1 286.7 10.4 -10.2 119.0 105.5 95.6 12.5
Certificate III 548.3 530.3 540.1 19.6 1.9 178.7 160.9 142.8 18.7
Certificate II 225.3 218.9 217.6 7.9 -0.6 90.4 76.1 76.7 10.0
Certificate I 72.6 65.6 67.5 2.4 2.8 19.0 15.5 13.0 1.7
Total private training providers 1 606.6
1 528.2 1 427.3 51.7 -6.6 489.6
449.8 420.1 55.0
Total Diploma or higher 649.0 625.8 512.6 18.6 -18.1 143.9 149.2 143.0 18.7
Certificate IV 541.9 495.0 455.3 16.5 -8.0 185.5 162.0 145.4 19.0
Certificate III 1 001.2 970.4 996.1 36.1 2.6 309.2 280.7 256.0 33.5
Certificate II 612.7 600.4 599.6 21.7 -0.1 191.6 176.8 173.6 22.7
Certificate I 212.6 201.0 195.8 7.1 -2.6 57.3 50.2 45.6 6.0
Total 3 017.2 2 892.6 2 759.4 100.0 -4.6 887.5 818.9 763.7 100.0
Note: Program completion rates cannot be derived from the program enrolments and completions reported in the table above. Program completions for 2017 are preliminary only. The 2017 data will be revised upwards in 2018.
For notes on the tables, see the explanatory notes on pages 26–30.
Total VET students and courses 2017 19
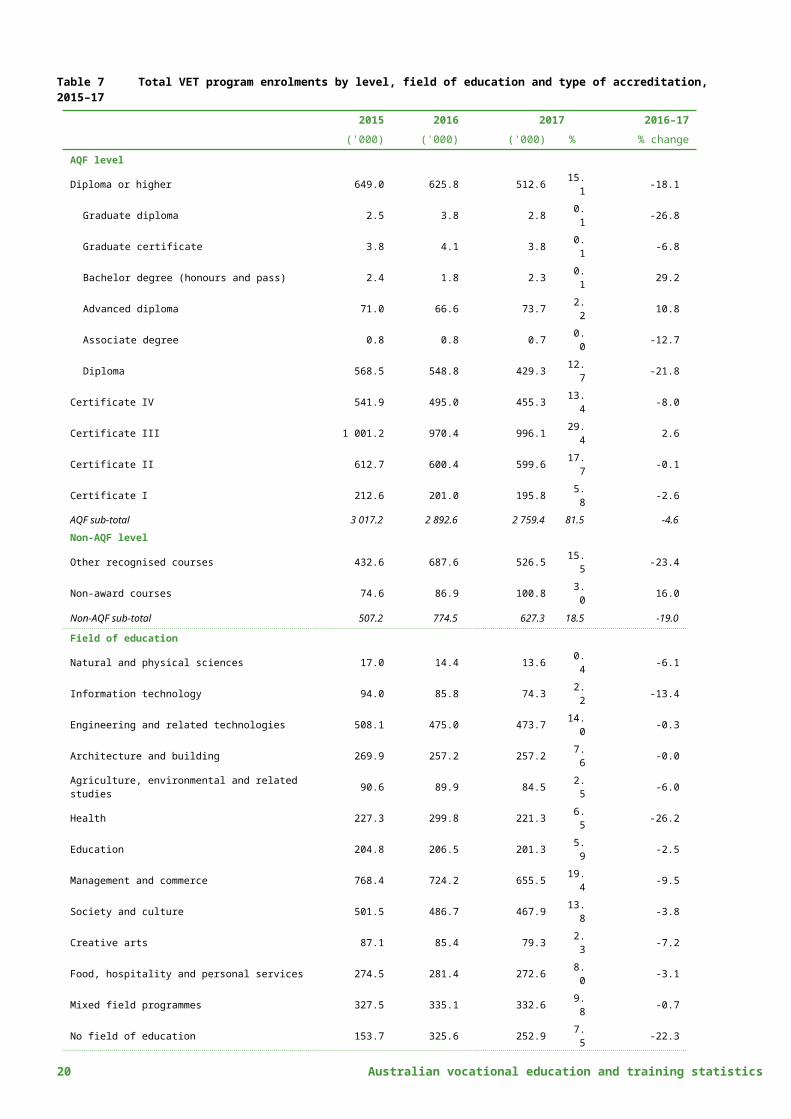
Table 10 Total VET program enrolments in the top 20 parent training packages, 2015–17
Parent training package 2015 2016 2017 2016–17
(’000) (’000) (’000) % % change
Business Services (BSA, BSB) 458.9 419.2 360.2 14.4 -14.1
Community Services (CHC) 362.7 367.5 335.2 13.4 -8.8
Tourism, Travel and Hospitality (SIT, THH, THT) 233.7 243.0 233.4 9.3 -4.0
Construction, Plumbing & Services Integrated Framework (BCF, BCG, BCP, CPC)
205.9 197.2 196.9 7.9 -0.2
Sport, Fitness and Recreation (SIS, SRC, SRF, SRO, SRS) 128.6 120.8 115.3 4.6 -4.6
Transport and Logistics (TDT, TLI) 118.5 99.1 98.3 3.9 -0.8
Health (HLT) 108.5 102.5 96.1 3.8 -6.2
Financial Services (FNA, FNB, FNS) 106.8 103.3 93.2 3.7 -9.8
Resources and Infrastructure (BCC, DRT, MNC, MNM, MNQ, RII) 106.3 92.7 85.1 3.4 -8.2
Information and Communications Technology (ICA, ICT) 99.4 99.2 80.8 3.2 -18.5
Property Services (CPP, PRD, PRM, PRS) 83.0 74.4 78.9 3.1 6.0
Agriculture, Horticulture and Conservation and Land Management (AHC, RTD, RTE, RTF, RUA, RUH, AGF, AGR)
72.5 73.5 72.2 2.9 -1.9
Automotive Industry Retail, Service and Repair (AUR) 57.7 55.0 69.0 2.8 25.5
Creative Arts and Culture (CUA, CUE, CUV) 42.7 43.7 69.0 2.8 57.9
Electrotechnology (UEE, UTE, UTL) 59.4 58.8 63.7 2.5 8.2
Retail Services (SIR, WRP, WRR, WRW) 51.4 54.4 59.2 2.4 8.7
Foundation Skills (FSK) 20.6 29.8 57.0 2.3 91.2
Metal and Engineering (MEM) 60.0 55.9 55.5 2.2 -0.6
Hairdressing and Beauty Services (SHB, SIH, WRH) 22.2 32.7 49.2 2.0 50.7
Training and Education (BSZ, TAA, TAE) 61.9 49.2 42.2 1.7 -14.2
Program enrolments in top 20 training packages 2 460.7 2 372.0 2 310.3 92.1 -2.6
Other training packages 269.4 247.1 197.1 7.9 -20.2
Total program enrolments in training packages 2 730.1 2 619.2 2 507.4 100.0 -4.3
Total program enrolments in non-training packages 794.3 1 047.9 879.3 na -16.1
Total program enrolments 3 524.4 3 667.1 3 386.7 na -7.6
For notes on the tables, see the explanatory notes on pages 26–30.
20 Australian vocational education and training statistics

Table 11 Total VET subject enrolments and hours of delivery by provider type and funding source, 2015–17
Provider type Subject enrolments Hours of delivery
Funding source 2015 2016 2017 2016–17 2015 2016 2017 2016–17
(’000) (’000) (’000) % % change (’000) (’000) (’000) % % change
TAFE Commonwealth/state funding 5 816.3 6 155.8 5 984.6 20.6 -2.8 192 269.1 196 343.8 195 394.4 24.9 -0.5
Fee-for-service – domestic 1 982.3 1 717.9 1 445.2 5.0 -15.9 56 386.3 52 163.2 46 372.5 5.9 -11.1
Fee-for-service – international
708.9 658.9 638.5 2.2 -3.1 26 036.3 24 867.8 22 550.0 2.9 -9.3
Total TAFE 8 507.6 8 532.6 8 068.4 27.8 -5.4 274 691.6 273 374.8 264 316.9 33.7 -3.3
UniversityCommonwealth/state funding 492.6 494.6 502.5 1.7 1.6 19 722.6 20 195.9 20 808.8 2.7 3.0
Fee-for-service – domestic 137.6 102.0 90.1 0.3 -11.6 5 190.5 3 878.3 3 210.4 0.4 -17.2
Fee-for-service – international
42.5 44.0 43.1 0.1 -2.1 2 318.1 2 534.1 2 500.7 0.3 -1.3
Total university 672.7 640.6 635.7 2.2 -0.8 27 231.1 26 608.4 26 519.9 3.4 -0.3
SchoolCommonwealth/state funding 1 503.3 1 453.2 1 330.0 4.6 -8.5 30 643.6 27 796.4 27 230.5 3.5 -2.0
Fee-for-service – domestic 63.6 78.1 89.8 0.3 15.0 1 916.0 2 081.6 2 138.0 0.3 2.7
Fee-for-service – international
0.6 0.9 0.7 0.0 -24.6 16.7 45.3 27.7 0.0 -38.8
Total school 1 567.5 1 532.2 1 420.5 4.9 -7.3 32 576.4 29 923.3 29 396.2 3.7 -1.8
Community education providerCommonwealth/state funding 577.2 583.2 633.5 2.2 8.6 21 362.9 21 423.6 21 455.1 2.7 0.1
Fee-for-service – domestic 413.2 1 053.6 1 105.9 3.8 5.0 8 985.3 8 742.7 15 624.8 2.0 78.7
Fee-for-service – international
22.3 23.2 28.3 0.1 22.0 1 230.5 1 258.4 1 603.4 0.2 27.4
Total community education provider
1 012.7 1 660.0 1 767.7 6.1 6.5 31 578.7 31 424.8 38 683.3 4.9 23.1
Enterprise providerCommonwealth/state funding 245.6 279.8 302.2 1.0 8.0 5 919.5 6 776.6 6 914.8 0.9 2.0
Fee-for-service – domestic 408.4 536.2 510.7 1.8 -4.8 8 245.1 10 179.3 9 100.7 1.2 -10.6
Fee-for-service – international
0.6 1.3 2.1 0.0 60.8 14.3 33.1 48.8 0.0 47.6
Total enterprise provider 654.5 817.3 815.0 2.8 -0.3 14 178.9 16 988.9 16 064.3 2.0 -5.4
Private training providersCommonwealth/state funding 6 146.1 5 400.1 4 705.9 16.2 -12.9 185 390.3 162 874.7 141 661.3 18.1 -13.0
Fee-for-service – domestic 10 016.8 10 313.6 10 115.7 34.8 -1.9 224 674.1 233 730.1 213 535.5 27.2 -8.6
Fee-for-service – international
1 004.5 1 207.0 1 509.2 5.2 25.0 35 125.5 41 623.1 54 598.3 7.0 31.2
Total private training providers
17 167.4 16 920.7 16 330.9 56.2 -3.5 445 189.9 438 228.0 409 795.2 52.2 -6.5
Total Commonwealth/state funding 14 781.1 14 366.7 13 458.7 46.3 -6.3 455 307.9 435 411.0 413 464.9 52.7 -5.0
Fee-for-service – domestic 13 022.0 13 801.3 13 357.5 46.0 -3.2 305 397.3 310 775.4 289 981.9 37.0 -6.7
Fee-for-service – international
1 779.4 1 935.3 2 222.0 7.7 14.8 64 741.4 70 361.7 81 328.9 10.4 15.6
Total 29 582.4 30 103.3 29 038.1 100.0 -3.5 825 446.5 816 548.1 784 775.7 100.0
-3.9
For notes on the tables, see the explanatory notes on pages 26–30.
Total VET students and courses 2017 21

Table 12 Total VET subject enrolments by subject result and delivery mode, 2015–17
2015 2016 2017 2016–17
(’000) (’000) (’000) % % change
Subject result
Competency achieved/passed 18 433.3 19 135.1 19 242.8 66.3 0.6
Recognition of prior learning – granted 1 261.0 1 108.7 994.0 3.4 -10.3
Recognition of prior learning – not granted 5.8 4.5 2.3 0.0 -47.3
Competency not achieved/failed 1 350.3 1 268.7 1 190.7 4.1 -6.1
Withdrawn/discontinued 2 470.7 2 550.7 2 225.9 7.7 -12.7
Continuing enrolment 5 687.8 5 648.0 4 976.1 17.1 -11.9
Non-assessable enrolment – satisfactorily completed 339.8 349.5 356.1 1.2 1.9
Non-assessable enrolment – withdrawn or not satisfactorily completed 33.7 38.1 50.1 0.2 31.5
Delivery mode
Classroom-based 18 202.3 18 727.4 18 834.7 64.9 0.6
Electronic-based 4 650.6 4 706.1 4 109.8 14.2 -12.7
Employment-based 3 103.8 2 971.1 2 543.0 8.8 -14.4
Other 2 276.4 2 532.7 2 500.4 8.6 -1.3
Not applicable – recognition of prior learning 1 349.3 1 165.9 1 050.1 3.6 -9.9
Subject only enrolments 3 314.0 4 345.2 5 182.6 17.8 19.3
Total subject enrolments 29 582.4 30 103.3 29 038.1 100.0 -3.5
For notes on the tables, see the explanatory notes on pages 26–30.
Table 13 Total VET hours of delivery by subject result and delivery mode, 2015–17
2015 2016 2017 2016–17
(’000) (’000) (’000) % % change
Subject result
Competency achieved/passed 614 159.5 608 104.1 605 822.4 77.2 -0.4
Recognition of prior learning – granted 48 932.4 44 028.0 38 315.7 4.9 -13.0
Recognition of prior learning – not granted 211.0 233.9 102.2 0.0 -56.3
Competency not achieved/failed 49 732.8 45 256.3 41 565.7 5.3 -8.2
Withdrawn/discontinued 102 184.1 106 493.8 87 822.0 11.2 -17.5
Continuing enrolment - - - - -
Non-assessable enrolment – satisfactorily completed 8 919.1 10 948.9 9 148.3 1.2 -16.4
Non-assessable enrolment – withdrawn or not satisfactorily completed 1 307.6 1 483.2 1 999.3 0.3 34.8
Delivery mode
Classroom-based 534 784.9 528 500.0 526 206.1 67.1 -0.4
Electronic-based 101 438.5 103 290.6 90 669.1 11.6 -12.2
Employment-based 82 890.2 78 680.9 71 308.1 9.1 -9.4
Other 57 189.5 61 814.7 58 174.4 7.4 -5.9
Not applicable – recognition of prior learning 49 143.4 44 261.8 38 418.0 4.9 -13.2
Total hours of delivery 825 446.5 816 548.1 784 775.7 100.0 -3.9
For notes on the tables, see the explanatory notes on pages 26–30.
22 Australian vocational education and training statistics

Table 14 Load pass rates by funding source and provider type, 2017 (%)
Funding source TAFE University School Community education
provider
Enterprise provider
Private training
providers
Total
Commonwealth/state funding 79.6 75.9 78.8 80.6 90.7 87.7 82.4
Fee-for-service – domestic 79.5 78.9 81.4 94.8 90.6 84.9 84.7
Fee-for-service – international 91.1 80.6 71.6 91.4 97.8 79.2 82.7
Overall load pass rate 80.6 76.7 79.0 87.1 90.7 85.1 83.3
For notes on the tables, see the explanatory notes on pages 26–30.
Table 15 Estimated projected program completion rates and subject load pass rates by state or territory of where training was delivered for total VET programs at certificate I and above, commencing in 2015–16
State or territory of where training was delivered
Estimated projected program completion rate (%)
Subject load pass rate (%)
2015 2016 2015 2016
New South Wales 40.8 49.1 74.1 75.2
Victoria 42.2 44.6 80.2 80.4
Queensland 43.9 47.1 83.8 81.1
South Australia 38.0 39.2 88.2 85.9
Western Australia 37.5 47.8 84.8 83.9
Tasmania 38.7 40.2 84.2 83.7
Northern Territory 38.8 40.0 84.0 81.2
Australian Capital Territory 41.9 47.6 81.0 84.3
Overseas 62.6 77.5 93.9 96.2
Other 51.2 60.3 60.0 69.4
Australia 41.7 46.9 80.6 80.1
Note: Projected rates of completion may not be directly comparable across jurisdictions, with rates being impacted by differing jurisdictional enrolment practices and funding policies.
For notes on the tables, see the explanatory notes on pages 26-30.
Table 16 Estimated projected program completion rates and subject load pass rates by provider type for total VET programs at certificate I and above, commencing in 2015–16
Provider type Estimated projected program completion rate (%)
Subject load pass rate (%)
2015 2016 2015 2016
School 48.0 53.5 77.9 79.3
TAFE 38.8 43.2 80.8 80.3
University 44.6 48.6 78.2 76.9
Enterprise provider 45.1 52.0 88.6 85.7
Community education provider 39.1 47.4 83.2 85.2
Private training provider 42.4 47.5 80.5 79.7
Total 41.7 46.9 80.6 80.1
For notes on the tables, see the explanatory notes on pages 26–30.
Total VET students and courses 2017 23

TermsThe information included in this publication is, unless stated otherwise, derived from the National VET Provider Collection and the National VET in Schools Collection. These collections are compiled under the Australian Vocational Education and Training Management Information Statistical Standard (AVETMISS). For other terms and definitions, refer to the terms and definitions paper at <http://www.ncver.edu.au/publications/publications/all-publications/total-vet-students-and-courses-2017>.Age of the student as at 30 June of the collection year. It is generally reported in age ranges.Apprentice/trainee status indicates whether a student is undertaking some training under an Apprenticeship/Traineeship Training Contract.Australian Qualifications Framework (AQF) is a nationally consistent framework of credentials offered in post-compulsory education and training. It covers qualifications from certificate I through to a doctoral degree. For more details of the AQF, go to <http://www.aqf.edu.au>.Community education providers have a primary focus on education and training for personal and community development.Delivery mode is the predominant style or mode of delivery for a subject enrolment. Recognised modes of delivery include classroom–based (college or campus), electronic-based (online or remote access), employment-based (as delivered by enterprise providers), other (for example, correspondence) or not applicable (for example, recognition of prior learning).Disability refers to whether the student self-identifies as having a disability, impairment or long-term condition.Domestic students (based on funding source) are students whose citizenship status is Australian, New Zealand or permanent resident for the purpose of undertaking education and training.Enrolment (module/unit/subject) is the registration of a student at a training delivery location for the purpose of undertaking a module, unit of competency or subject.Enterprise providers are registered training organisations whose primary business is not the delivery of training and development. Fee-for-service funding — domestic is the revenue provided by a student whose citizenship status is Australian, New Zealand or permanent resident for the purpose of undertaking education and training.Fee-for-service funding — international is the revenue provided by a student who holds a student visa or a temporary residency permit or who resides in an overseas country for the purpose of undertaking education and training.Field of education describes the broad area of study related to a qualification or subject in which a student is enrolled.Full-time students are those students whose program of study constitutes at least 75% of the normal full-time study load. The previous Australian Government Department of Education, Employment and Workplace Relations (DEEWR) defined a full-time study load as 720 contact hours in a year. Therefore, any student undertaking 540 hours or more is regarded as a full-time student.Funding source refers to the predominant source of the funding for a subject enrolment.Higher level qualifications are not a training package qualification or nationally recognised accredited course. They are accredited by higher education institutions with self-accrediting authority or state or territory accreditation authorities.Hours of delivery are based on the agreed nominal hour values for each subject. Indigenous status indicates whether a student self-identifies as being of Aboriginal or Torres Strait Islander descent.24 Australian vocational education and training statistics

International students (based on funding source) are students who hold a student visa or a temporary residency permit or who reside in an overseas country for the purpose of undertaking education and training.Locally recognised courses include local courses and skill sets developed by training providers, industry, enterprise, community education or professional bodies to meet an identified training need.Nationally recognised training is a program of training leading to vocational qualifications and credentials that are recognised across Australia delivered by registered training organisations (RTOs).Non-nationally recognised training includes locally recognised courses, higher level qualifications and locally recognised skill sets.Off-the-job training for apprentices and trainees refers to training that takes place away from a person’s job, usually off the premises (for example, at TAFE) but may also be on the premises (for example, in a special training area).Other government providers include government departments and training providers such as agricultural colleges.Other recognised courses include junior secondary education (Year 10), senior secondary education (Years 11 and 12), statements of attainment, bridging and enabling courses, and other education not elsewhere classified. ‘Other’ state of delivery includes other Australian territories (for example, Christmas Island) and ‘not known’. For students, ‘other’ also includes a mixed category (where the student is associated with more than one state or territory of training delivery location).Overseas (training delivery) includes training delivered by Australian providers to students who are located in another country and who are not normally based in Australia. In this publication, overseas (training delivery) is identified by ‘overseas’ training delivery locations.Overseas (residence) includes students who have provided an overseas address location as their usual place of residence. In this publication, overseas (residence) is identified by ‘overseas’ in state or territory of student residence.Private training providers include education/training businesses or centres, professional associations, industry associations, equipment/product manufacturers and suppliers, and other private training providers not elsewhere classified. Program includes a qualification, course or skill set.Program completion indicates that a student has completed a structured and integrated program of education or training.Projected program completion rate is the percentage of programs that are estimated to be completed, according to statistical modelling developed by NCVER. For further information see explanatory notes on pages 26‒30. Provider type refers to the type of institution or organisation providing the training.Recognition of prior learning is status or credit obtained for courses or subjects on the basis of recognised competencies gained previously through informal/formal training, experience in the workplace, voluntary work, social or domestic activity. Registered training organisations (RTOs) are training providers registered by the Australian Skills Quality Authority (ASQA) or, in some cases, a state or territory registering and accrediting body, to deliver training and/or conduct assessment and issue nationally recognised qualifications in accordance with the Australian Quality Training Framework or the VET Quality Framework.Reporting hours count the hours of delivery on the finalisation of an enrolment. Consequently, the hours for an enrolment associated with ‘continuing studies’ are shown only for the year in which the final outcome is reported.School status indicates whether a student is still at school or not.
Total VET students and courses 2017 25

SEIFA Index of Relative Disadvantage (IRSD) is a general socio-economic index that summarises information about the economic and social resources of people and households within an area. This index focuses on disadvantage. A high score (or quintile) reflects a relative lack of disadvantage rather than relative advantage.Skill sets are groupings of units of competency that have been combined to provide a clearly defined statement of the skills and knowledge required by an individual to meet industry needs or a licensing or regulatory requirement. They may be either a nationally recognised skill set that has been endorsed in a national training package or a locally recognised skill set.State or territory of student residence is the state or territory in which the student usually resides.State or territory of training provider’s head office is the state or territory in which the training provider’s head office is located. State or territory where the training was delivered is the state or territory relating to the specific training location where the activity was delivered. State or territory where the training was delivered — other refers to other Australian territories (for example, Christmas Island) and where the delivery location is ‘not known’. For students, ‘other’ also includes instances where the student received training that was delivered in more than one state or territory. State or territory where the training was delivered — overseas refers to training that was delivered by Australian providers to students who are located in another country and who are not normally based in Australia. Students (estimated) are individuals who were enrolled in a subject or completed a program during the reporting period.Student remoteness region is the degree of remoteness of a location in terms of the ease or difficulty people face in accessing services in non-metropolitan Australia. The Australian Standard Geographical Classification (ASGC) divides Australia into six Remoteness Areas and is used for collection and dissemination of geographically classified statistics.Subject load pass rate is the ratio of hours, or full-year training equivalents (FYTEs), attributed to students who gain competencies/passed assessment in an assessable module or unit of competency to all students who were assessed and either passed, failed or withdrew. The calculation is based on the annual hours (or FYTEs) for each assessable module or unit of competency and includes competencies achieved/units passed through recognition of prior learning (RPL).Subject only enrolment is an enrolment in a stand-alone subject (unit of competency or module) not a full program (qualification, course or skill set).Technical and further education (TAFE) institutes are government training providers that provide a range of technical and VET courses and other programs (for example, entry and bridging courses, language and literacy courses, adult basic education courses, senior secondary certificate of education courses, personal enrichment courses, and small business courses).Total VET activity (TVA) from 1 January 2014, all registered training organisations, including private providers, unless granted an exemption, are required to collect and report full AVETMISS data on all nationally recognised training, in accordance with the National VET Provider Collection Data Requirements Policy.Training packages comprise a set of nationally endorsed standards, guidelines and qualifications for training and for recognising and assessing skills. They are developed by industry with the aim of meeting the needs of an industry or group of industries. For further information refer to <http://www.training.gov.au>.Training providers are organisations that deliver VET programs. Training providers include private training providers, schools, community education providers, enterprise providers, TAFE institutes and universities.
26 Australian vocational education and training statistics

Unique student identifier (USI) uniquely identifies an individual who accesses vocational education and training over his or her lifetime.Universities include Australia’s universities, which have been established or recognised under state or territory legislation, except the Australian National University, which is constituted under an Act of the Australian Parliament. Vocational education and training (VET) is post-compulsory education and training that provides people with occupational or work-related knowledge and skills. It also includes programs that provide the basis for subsequent vocational programs.
Total VET students and courses 2017 27

Explanatory notes
Scope1 Data in this publication cover the training reported by 4193 Australian training providers,
including registered training organisations and non-registered training providers (including a number of schools, community education providers, enterprise providers and private training providers).
2 Activity covered in this publication includes VET delivered by: TAFE institutes universities community education providers enterprise providers private training providers schools Australian VET institutions delivering VET at overseas campuses.
3 This publication does not cover the following types of training: recreation, leisure and personal enrichment credit transfer any activity where revenue was earned from another training providers in terms of sub-
contracted, auspicing, partnership or similar arrangements superseded training reported with national outcome identifier ‘61 — superseded training’.
Student counts and training activity counts4 Since the introduction of total VET activity (TVA), NCVER has applied a process to identify and
remove duplicate training activity where the same activity is reported for the same training provider in the same collection period via different data submitters.
5 When duplicate training activity is identified, the following hierarchy is applied, whereby only the training activity at the highest hierarchy level is reported: data submitted by a state training authority data submitted by a Board of Study (or state training authority on behalf of a Board of
Study) data submitted directly to the NCVER by a registered training organisation.
6 Prior to 2015, if a student was enrolled with more than one training provider during a collection period, it was possible for them to be counted more than once. From 1 January 2015, all new and continuing students undertaking nationally recognised VET in Australia are required to have a unique student identifier (USI) to receive a qualification or statement of attainment. The USI is a randomly generated alpha-numeric code recorded against any nationally recognised training undertaken and remains with an individual for life. The implementation of the USI provides a mechanism with which to better estimate student counts by identifying and potentially removing duplicate student records. NCVER has used a two-step process to de-duplicate student counts in Total VET students and courses 2017, which uses the USI where available and a count of distinct client identifiers within each submission for the residual data. Caution must be used when comparing de-duplicated student counts due to differing rates of duplication in student numbers across years, which in part could be due to varying rates of USI provision.For further information on the de-duplication of student counts in Total VET students and courses 2017, refer to the fact sheet located at <https://www.ncver.edu.au/__data/assets/pdf_file/0029/58079/De-duplication-of-training-activity-and-student-counts-in-TVA.pdf> or the technical paper located at
28 Australian vocational education and training statistics

<https://www.ncver.edu.au/__data/assets/pdf_file/0028/796213/Technical-paper-Counting-students-in-Total-VET-students-and-courses.pdf>.
Total VET students and courses 2017 29

Training providers counts7 The number of training providers is a distinct count of training providers who submitted data
within each state or territory and training provider category. Some training providers deliver VET in more than one state or territory and/or report data under more than one training provider type. Therefore, the training providers are counted in each state/territory category and provider type category, but are only counted once in the total.
8 ‘Provider type’ in this publication is based on the self-reported training provider type data element. This data element may be different from that reported in Government-funded students and courses. Provider type used in the government-funded series is based on a field derived by NCVER, whereby each training provider within a data submission is classified to a provider type according to their funding source. For further information refer to <https://www.ncver.edu.au/data/collection/government-funded-students-and-courses>.
Data sources9 In November 2012, the then COAG Standing Council on Tertiary Education Skills and
Employment (SCOTESE) agreed to the introduction of mandatory reporting of nationally recognised training activity from 2014 onwards. This is referred to as ‘total VET activity’, to reflect that the information reports on students who undertook government-subsidised training and those who undertook training on a fee-for-service basis.
10The information contained in this publication is, unless otherwise stated, derived from the National VET Provider Collection and the National VET in Schools Collection, with duplicated activity removed. For the National VET Provider Collection, data can be reported to NCVER directly by the training providers or via state training authorities. For the National VET in Schools Collection, data are reported directly by the boards of studies and via the state training authorities to NCVER. These collections are compiled under the Australian Vocational Education and Training Management Information Statistical Standard, release 7.0. For further information on AVETMISS go to <http://www.ncver.edu.au/avetmiss/21055.html>.
Data treatment11Note that the percentages presented in this publication are reported to one decimal place. Other
numbers have been rounded after aggregation to the nearest hundred. Rounding can lead to situations where the numbers in the body of a given table might not add to the rounded totals.
12A dash (-) represents a true zero figure, with no activity reported in these categories.
Data revisions13The data in this publication may be revised for several reasons. For consistency of reporting,
some previously reported data are rebased using data collected for the current year. For example, if a training provider was reported in the current year with provider type of ‘school’ but in the previous year the same provider was reported as ‘community education provider’, NCVER will adjust the previously reported provider type to match that of the current year.
14The estimated student counts presented in this publication for 2015 will be different to the estimated student counts presented in Total VET students and courses 2015, due to the de-duplication method applied. In this publication, improvements to the de-duplication of training activity process were implemented, making better use of submitted USIs. As a result, the estimated student counts reported in this publication may not match those reported in previous years.
15 In addition to the above, a small amount of data can be submitted to NCVER after the reporting window has closed. These data will not be included in the current publication. However, they will be included in the following year’s publication resulting in minor variations in the data.
30 Australian vocational education and training statistics

Data quality and comparability issues16Data on skill sets presented in this publication may be incomplete due to differences in the
reporting of skill sets enrolments and completions across jurisdictions and by individual training providers.From 2015 to 2016, there was a significant increase in skill sets enrolments in New South Wales, which can be attributed to the commencement of Smart and Skilled Targeted Priorities Prevocational and Part Qualifications program in late 2015 and a number of policy changes implemented in 2016 after the first stage review of Smart and Skilled.The decrease in the number of skill sets enrolments in 2017 may in part be due to a natural drop in activity in NSW as initial demand was met.
Missing training activity17 Registered training organisations who delivered nationally recognised training in 2017 but
were not expected to submit data, include those training organisations who: were granted full exemptions from reporting requirements as the training was part of a vital
community service or the training could not be reported as it would conflict with defence and national security legislation and/or could jeopardise the personal safety of border protection, customs, and national security or police personnel
were not operating at the time of data submission. 18 The current collection coverage issues are outlined below:
It is estimated 176 registered training organisations did not report data on 2017 training activity.
Of the 4193 training providers who reported data on 2017 training activity, it is not known whether they reported all of their training activity. For example, some training providers may have only reported their Commonwealth or state-funded activity and not their fee-for-service activity. Furthermore, some data on training activity delivered in overseas locations are likely to be missing. NCVER is unable to estimate the completeness of the data reported or estimate the size of the missing activity.
Not known information19 Caution should be taken when using data with a large number of ‘not known’ responses. Data
are reported as ‘not known’ for the following reasons: information was not collected partial reporting exemptions4 are present that allow training providers to submit ‘not known’
student demographic data a student has not responded to a question on the enrolment form a student has asked for their information not to be disclosed and used for reporting
purposes invalid information was supplied where duplicate student records have conflicting demographic information; for example,
where the same student is reported as both Indigenous and non-Indigenous.The extent of the ‘not known’ data for selected student characteristics is illustrated in the following table.
Proportion of estimated students with ‘not known’ data, 2015–17 (%)
2015 2016 2017
Sex 3.9 3.7 2.7
Age 1.6 2.3 1.7
4 Enterprise providers and other training providers who deliver selected short units or subjects are eligible for partial reporting exemptions. Training providers delivering vital community services may also choose to submit student data with reduced demographic information.
Total VET students and courses 2017 31

Indigenous status 14.9 13.5 11.7
Disability status 16.1 15.8 14.8
Student remoteness 4.1 5.7 5.5
SEIFA 9.0 10.9 11.0
At school status 14.5 14.2 12.7
SEIFA = Socio-Economic Indexes For Areas. For further information refer to <http://www.abs.gov.au/websitedbs/censushome.nsf/home/seifa>.
State and territory information20 State and territory information in this publication is reported on three different bases.
Predominantly, the information presented relates to the state or territory where the training was delivered. This is the state or territory in which the training was actually delivered. The category of ‘other’ includes other Australian territories (for example, Christmas Island) and ‘not known’. For students, ‘other’ also includes a mixed category (where the student is associated with more than one state or territory of training delivery location).
State or territory of training provider’s head office is only presented for program completions (since training delivery location is not collected and is not easily derived) and is the state or territory in which the training provider’s head office is located. The category of ‘other’ includes other Australian territories and ‘not known’.
In relation to student and program completions, it is also possible to present the state or territory of a student’s residence. This is the state or territory in which the student usually resides. The category of ‘other’ includes other Australian territories and ‘not known’.
These definitions of state or territory are different from those reported in Government-funded students and courses, where state or territory is based on the state or territory that funds the training.
Training packages21 The coverage of training packages is constantly changing as new training packages are
developed and existing training packages are reviewed to meet emerging requirements across industries. For further information refer to <https://training.gov.au>.
Programs completed22 Data for programs completed in 2017 are based on preliminary data submissions to the 2017
National VET Provider Collection and the National VET in Schools Collection. Preliminary program completions for 2017 will be revised upwards in the 2018 collections to accommodate further notification of programs completed.
Program completion rates23Completion rates are simple to calculate with a cohort of students who start together in a very
short program with a defined end date. The context in VET is, however, far more complex. Program lengths vary and may span several years, students commence at different times, and many study part-time. Waiting for all students to complete or ‘drop out’ of their training before calculating an actual completion rate gives a reliable answer, but is somewhat impractical. For this reason, the NCVER estimates projected program completion rates for the two most recent years, and reports the actual (or close to final) completion rates for prior years. For more details, see: The likelihood of completing a VET qualification: a model-based approach, available at <http://www.ncver.edu.au/publications/2272.html>.For recent improvements to government-funded completion rates see VET program completion rates: an evaluation of the current method available at <http://www.ncver.edu.au/publications/2898.html>.
32 Australian vocational education and training statistics

For total VET program completion rates see technical paper: Total VET program completion rates available at <https://www.ncver.edu.au/publications/publications/all-publications/total-vet-program-completion-rates>.
Total VET students and courses 2017 33

Apprentices and trainees24 In this publication, the number of apprentices and trainees undertaking off-the-job training in
2017 (355 200) exceeds the number of apprentices and trainees in-training as at 31 December 2017, derived from the National Apprentice and Trainee Collection. The key reasons for differences between the collections include: The data in this publication are based on an estimated count of students enrolled in the VET
system at any time during the 2017 calendar year. This figure can include apprentices and trainees who later cancelled or withdrew from their training contract. ‘In-training’ data derived from the National Apprentice and Trainee Collection refer to apprentices and trainees who are actively training under the terms of their training contract at a point in time (such as 31 December 2017). For example, there were 275 300 apprentices and trainees in-training as at March 31, 2017. However, the number had declined to 256 100 by 31 December 2017 due to the cancellation/withdrawal, expiry and completion of contracts (source: Apprentice and Trainee Collection, December 2017).
The data in this publication comprise apprentices and trainees undertaking nationally recognised training at a training provider within the calendar year, whereas data derived from the National Apprentice and Trainee Collection comprise all apprentices and trainees, including those without any off-the-job training in the calendar year.
Australian Bureau of Statistics data25 Participation rates are derived by calculating the number of VET students in Australia as a
percentage of the estimated Australian residential population in the corresponding age groups. The figures for all years are based on ABS population figures (cat.no.3101.0, September 2017).
26 Socio-Economic Indexes for Areas (SEIFA) is an ABS-developed product that ranks areas in Australia according to relative socioeconomic advantage and disadvantage. The Index of Relative Socio-Economic Disadvantage (IRSD) is one of four indexes in the SEIFA suite. Further information on SEIFA can be found at <http://www.abs.gov.au/websitedbs/censushome.nsf/home/seifa>.
27 Student remoteness is based on the Access/Remoteness Index of Australia (ARIA+), which was developed by the National Centre for Social Applications of Geographic Information Systems (GISCA). ARIA+ is now the standard ABS-endorsed measure of remoteness. Student remoteness (ARIA+) is determined from ARIA+ remoteness regions and ABS SA2 regions. For more details of ARIA+ refer to <http://www.adelaide.edu.au/apmrc/research/projects/category/about_aria.html>.
28 Rural/remote localities comprise the ‘outer regional’, ‘remote’ and ‘very remote’ categories of the ARIA+ classification.
VET Student Loans scheme29 As of 1 January 2017, the VET FEE-HELP scheme has been replaced with the VET Student Loans
scheme, introducing some changes to student and course eligibility. The VET FEE-HELP scheme was in place throughout 2016 and was an income-contingent loan scheme that assisted eligible students undertaking certain VET courses (diploma, advanced diploma, graduate certificate and graduate diploma) with an approved provider by paying for all or part of their tuition costs.
30 It is not possible to identify students assisted by either the VET FEE-HELP or VET Student Loans schemes in the National VET Provider Collection, without using the USI as a matching key. Where data are presented by funding source, such as the number of subjects or hours of delivery, activity undertaken with VET FEE-HELP or VET Student Loans assistance may appear as either Commonwealth/state funding or fee-for-service (domestic).
34 Australian vocational education and training statistics