Australian Securities Exchange2011/08/25 · Seven Group Holdings Limited | ABN 46 142 003 469...
38
Seven Group Holdings Limited | ABN 46 142 003 469 38-42 Pirrama Road | Pyrmont NSW 2009 Australia | Postal Address: PO Box 777 | Pyrmont NSW 2009 Australia Telephone +61 2 8777 7777 | Facsimile +61 2 8777 7192 25 August 2011 Company Announcements Office Australian Securities Exchange Limited Level 6, 20 Bridge Street SYDNEY NSW 2000 By Electronic Lodgement Total pages: 38 (including cover letter) In accordance with the Listing Rules, following is the Preliminary Final Report of the Company for the financial year ended 30 June 2011, and the Media Release. Yours faithfully For and on behalf of Seven Group Holdings Limited Warren Coatsworth Company Secretary For personal use only
Transcript of Australian Securities Exchange2011/08/25 · Seven Group Holdings Limited | ABN 46 142 003 469...
Seven Group Holdings Limited | ABN 46 142 003 469 38-42 Pirrama Road | Pyrmont NSW 2009 Australia | Postal Address: PO Box 777 | Pyrmont NSW 2009 Australia
Telephone +61 2 8777 7777 | Facsimile +61 2 8777 7192
25 August 2011 Company Announcements Office Australian Securities Exchange Limited Level 6, 20 Bridge Street SYDNEY NSW 2000 By Electronic Lodgement Total pages: 38 (including cover letter) In accordance with the Listing Rules, following is the Preliminary Final Report of the Company for the financial year ended 30 June 2011, and the Media Release. Yours faithfully For and on behalf of Seven Group Holdings Limited
Warren Coatsworth Company Secretary
For
per
sona
l use
onl
y
Appendix 4E - Preliminary Final ReportSEVEN GROUP HOLDINGS AND ITS CONTROLLED ENTITIESFOR THE YEAR ENDED 30 JUNE 2011
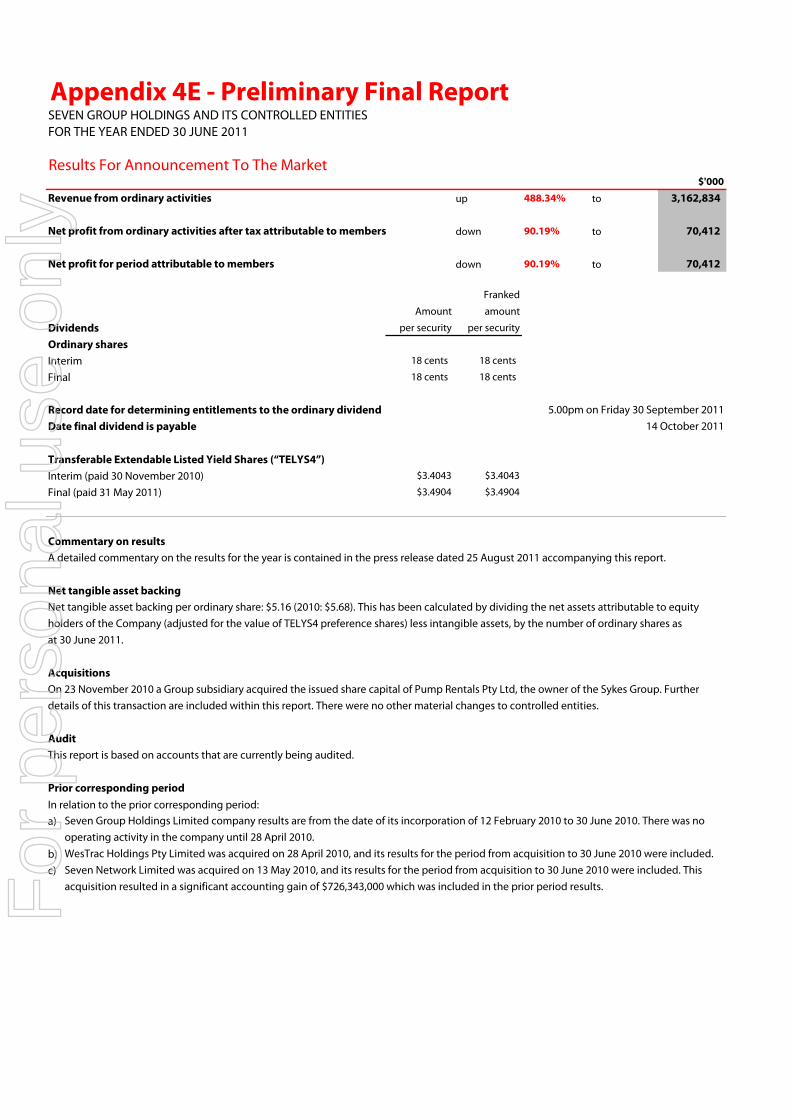
Results For Announcement To The Market
$'000
Revenue from ordinary activities up 488.34% to 3,162,834
Net profit from ordinary activities after tax attributable to members down 90.19% to 70,412
Net profit for period attributable to members down 90.19% to 70,412
Franked
Amount amount
Dividends per security per security
Ordinary sharesInterim 18 cents 18 cents
Final 18 cents 18 cents
Record date for determining entitlements to the ordinary dividend 5.00pm on Friday 30 September 2011Date final dividend is payable 14 October 2011
Transferable Extendable Listed Yield Shares (“TELYS4”)Interim (paid 30 November 2010) $3.4043 $3.4043
Final (paid 31 May 2011) $3.4904 $3.4904
Commentary on resultsA detailed commentary on the results for the year is contained in the press release dated 25 August 2011 accompanying this report.
Net tangible asset backingNet tangible asset backing per ordinary share: $5.16 (2010: $5.68). This has been calculated by dividing the net assets attributable to equity holders of the Company (adjusted for the value of TELYS4 preference shares) less intangible assets, by the number of ordinary shares asat 30 June 2011.
AcquisitionsOn 23 November 2010 a Group subsidiary acquired the issued share capital of Pump Rentals Pty Ltd, the owner of the Sykes Group. Further details of this transaction are included within this report. There were no other material changes to controlled entities.
AuditThis report is based on accounts that are currently being audited.
Prior corresponding periodIn relation to the prior corresponding period:a) Seven Group Holdings Limited company results are from the date of its incorporation of 12 February 2010 to 30 June 2010. There was no
operating activity in the company until 28 April 2010.b) WesTrac Holdings Pty Limited was acquired on 28 April 2010, and its results for the period from acquisition to 30 June 2010 were included.c) Seven Network Limited was acquired on 13 May 2010, and its results for the period from acquisition to 30 June 2010 were included. This
acquisition resulted in a significant accounting gain of $726,343,000 which was included in the prior period results.For
per
sona
l use
onl
y
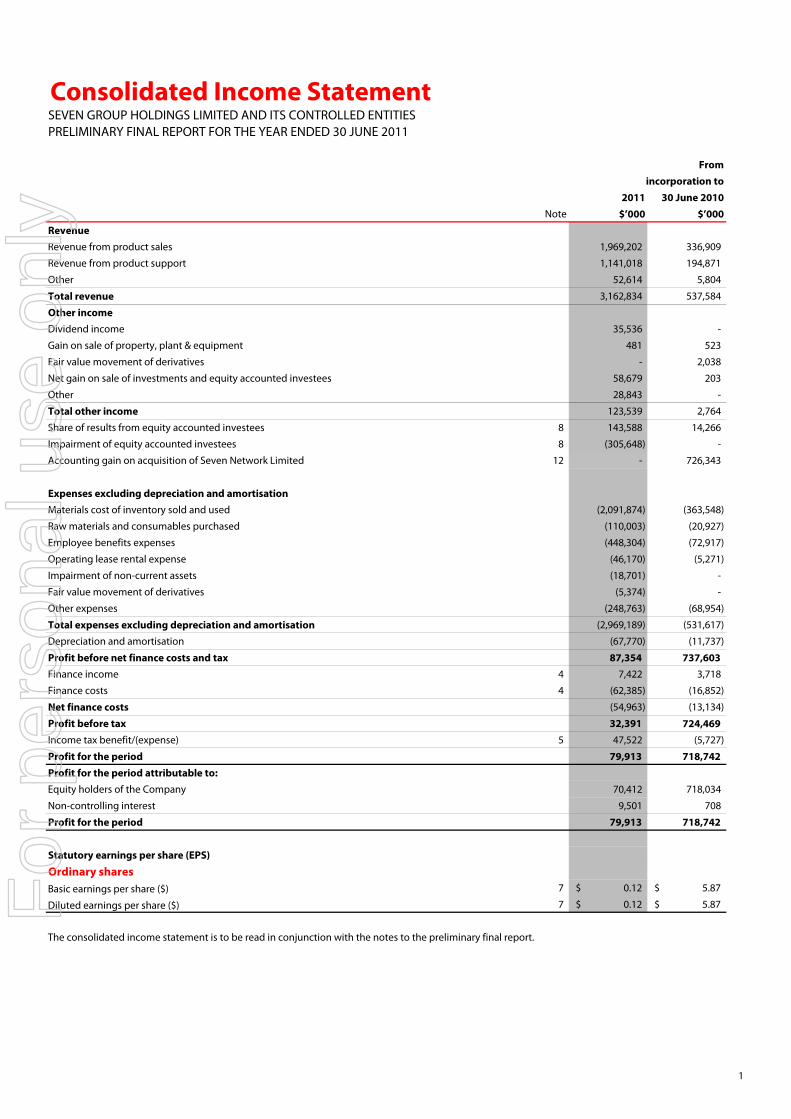
Consolidated Income StatementSEVEN GROUP HOLDINGS LIMITED AND ITS CONTROLLED ENTITIESPRELIMINARY FINAL REPORT FOR THE YEAR ENDED 30 JUNE 2011
Fromincorporation to
2011 30 June 2010Note $’000 $’000
RevenueRevenue from product sales 1,969,202 336,909
Revenue from product support 1,141,018 194,871
Other 52,614 5,804
Total revenue 3,162,834 537,584
Other incomeDividend income 35,536 -
Gain on sale of property, plant & equipment 481 523
Fair value movement of derivatives - 2,038
Net gain on sale of investments and equity accounted investees 58,679 203
Other 28,843 -
Total other income 123,539 2,764
Share of results from equity accounted investees 8 143,588 14,266
Impairment of equity accounted investees 8 (305,648) -
Accounting gain on acquisition of Seven Network Limited 12 - 726,343
Expenses excluding depreciation and amortisationMaterials cost of inventory sold and used (2,091,874) (363,548)
Raw materials and consumables purchased (110,003) (20,927)
Employee benefits expenses (448,304) (72,917)
Operating lease rental expense (46,170) (5,271)
Impairment of non-current assets (18,701) -
Fair value movement of derivatives (5,374) -
Other expenses (248,763) (68,954)
Total expenses excluding depreciation and amortisation (2,969,189) (531,617)
Depreciation and amortisation (67,770) (11,737)
Profit before net finance costs and tax 87,354 737,603 Finance income 4 7,422 3,718
Finance costs 4 (62,385) (16,852)
Net finance costs (54,963) (13,134)
Profit before tax 32,391 724,469 Income tax benefit/(expense) 5 47,522 (5,727)
Profit for the period 79,913 718,742 Profit for the period attributable to:Equity holders of the Company 70,412 718,034
Non-controlling interest 9,501 708
Profit for the period 79,913 718,742
Statutory earnings per share (EPS)
Ordinary sharesBasic earnings per share ($) (a) 7 0.12$ 5.87$
Diluted earnings per share ($) (a) 7 0.12$ 5.87$
The consolidated income statement is to be read in conjunction with the notes to the preliminary final report.
1
For
per
sona
l use
onl
y

Consolidated Statement of Comprehensive IncomeSEVEN GROUP HOLDINGS LIMITED AND ITS CONTROLLED ENTITIESPRELIMINARY FINAL REPORT FOR THE YEAR ENDED 30 JUNE 2011
Fromincorporation to
2011 30 June 2010Note $’000 $’000
Profit for the period 79,913 718,742
Other comprehensive income
Net change in fair value of available-for-sale financial assets 11 27,304 24,024
Impairment of available-for-sale financial asset reclassified to profit or loss 11 2,910 -
Cash flow hedges: effective portion of changes in fair value (21,114) 9,693
Foreign currency differences for foreign operations (164,741) 40,037
Income tax on items of other comprehensive income 11 12,223 (9,560)
Other comprehensive (expense)/income for the period, net of tax (143,418) 64,194
Total comprehensive (expense)/income for the period (63,505) 782,936
Total comprehensive (expense)/income for the period attributable to:
Equity holders of the Company (72,347) 780,786
Non-controlling interest 8,842 2,150
Total comprehensive (expense)/income for the period (63,505) 782,936
The consolidated statement of comprehensive income is to be read in conjunction with the notes to the preliminary final report.
2
For
per
sona
l use
onl
y
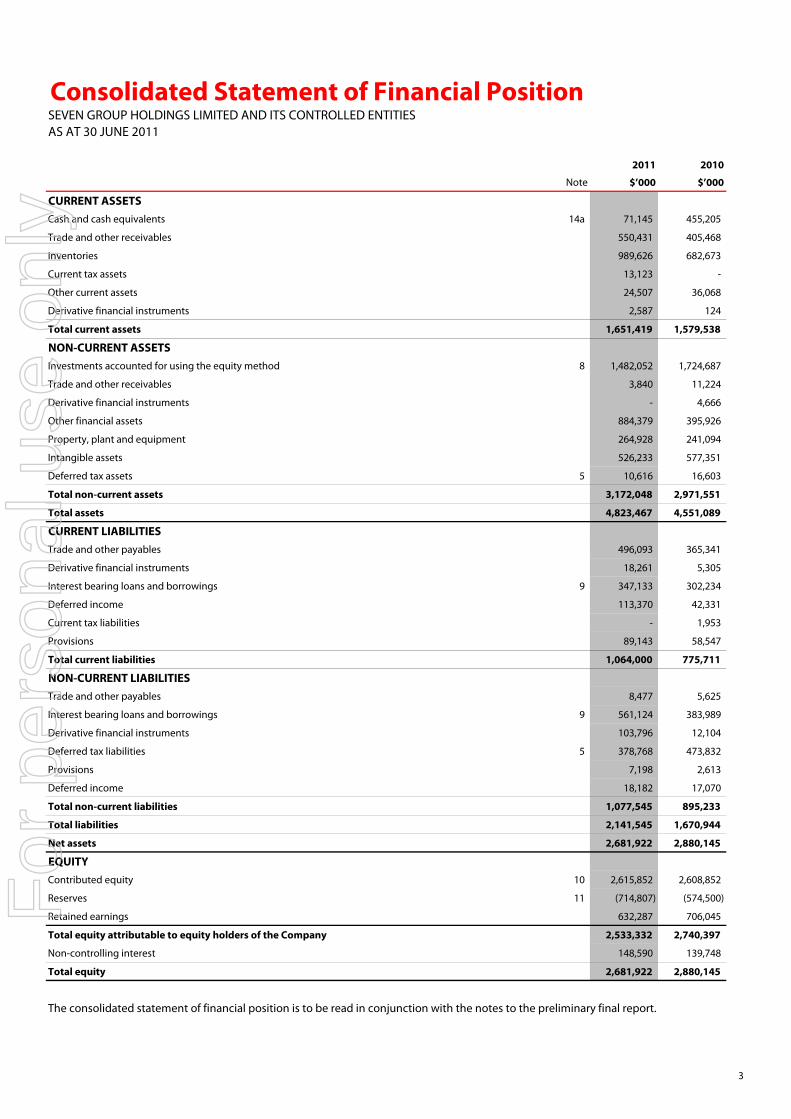
Consolidated Statement of Financial PositionSEVEN GROUP HOLDINGS LIMITED AND ITS CONTROLLED ENTITIESAS AT 30 JUNE 2011
2011 2010
Note $’000 $’000
CURRENT ASSETSCash and cash equivalents 14a 71,145 455,205
Trade and other receivables 550,431 405,468
Inventories 989,626 682,673
Current tax assets 13,123 -
Other current assets 24,507 36,068
Derivative financial instruments 2,587 124
Total current assets 1,651,419 1,579,538
NON-CURRENT ASSETSInvestments accounted for using the equity method 8 1,482,052 1,724,687
Trade and other receivables 3,840 11,224
Derivative financial instruments - 4,666
Other financial assets 884,379 395,926
Property, plant and equipment 264,928 241,094
Intangible assets 526,233 577,351
Deferred tax assets 5 10,616 16,603
Total non-current assets 3,172,048 2,971,551
Total assets 4,823,467 4,551,089
CURRENT LIABILITIESTrade and other payables 496,093 365,341
Derivative financial instruments 18,261 5,305
Interest bearing loans and borrowings 9 347,133 302,234
Deferred income 113,370 42,331
Current tax liabilities - 1,953
Provisions 89,143 58,547
Total current liabilities 1,064,000 775,711
NON-CURRENT LIABILITIESTrade and other payables 8,477 5,625
Interest bearing loans and borrowings 9 561,124 383,989
Derivative financial instruments 103,796 12,104
Deferred tax liabilities 5 378,768 473,832
Provisions 7,198 2,613
Deferred income 18,182 17,070
Total non-current liabilities 1,077,545 895,233
Total liabilities 2,141,545 1,670,944
Net assets 2,681,922 2,880,145
EQUITYContributed equity 10 2,615,852 2,608,852
Reserves 11 (714,807) (574,500)
Retained earnings 632,287 706,045
Total equity attributable to equity holders of the Company 2,533,332 2,740,397
Non-controlling interest 148,590 139,748
Total equity 2,681,922 2,880,145
The consolidated statement of financial position is to be read in conjunction with the notes to the preliminary final report.
3
For
per
sona
l use
onl
y
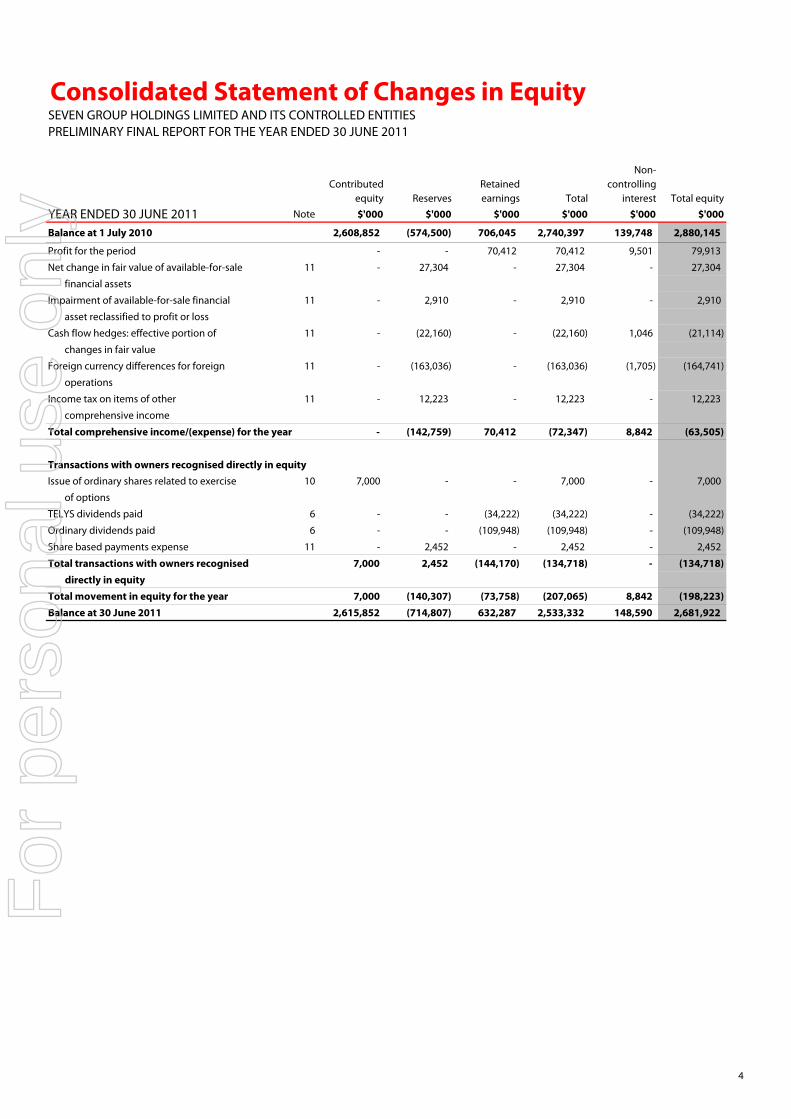
Consolidated Statement of Changes in EquitySEVEN GROUP HOLDINGS LIMITED AND ITS CONTROLLED ENTITIESPRELIMINARY FINAL REPORT FOR THE YEAR ENDED 30 JUNE 2011
Total equity
YEAR ENDED 30 JUNE 2011 Note $'000 $'000 $'000 $'000 $'000 $'000
Balance at 1 July 2010 2,608,852 (574,500) 706,045 2,740,397 139,748 2,880,145
Profit for the period - - 70,412 70,412 9,501 79,913
Net change in fair value of available-for-sale 11 - 27,304 - 27,304 - 27,304
financial assets
Impairment of available-for-sale financial 11 - 2,910 - 2,910 - 2,910
asset reclassified to profit or loss
Cash flow hedges: effective portion of 11 - (22,160) - (22,160) 1,046 (21,114)
changes in fair value
Foreign currency differences for foreign 11 - (163,036) - (163,036) (1,705) (164,741)
operations
Income tax on items of other 11 - 12,223 - 12,223 - 12,223
comprehensive income
Total comprehensive income/(expense) for the year - (142,759) 70,412 (72,347) 8,842 (63,505)
Transactions with owners recognised directly in equityIssue of ordinary shares related to exercise 10 7,000 - - 7,000 - 7,000
of options
TELYS dividends paid 6 - - (34,222) (34,222) - (34,222)
Ordinary dividends paid 6 - - (109,948) (109,948) - (109,948)
Share based payments expense 11 - 2,452 - 2,452 - 2,452
Total transactions with owners recognised 7,000 2,452 (144,170) (134,718) - (134,718) directly in equity
Total movement in equity for the year 7,000 (140,307) (73,758) (207,065) 8,842 (198,223) Balance at 30 June 2011 2,615,852 (714,807) 632,287 2,533,332 148,590 2,681,922
Retained earnings Total
Non-controlling
interestContributed
equity Reserves
4
For
per
sona
l use
onl
y

Consolidated Statement of Changes in EquitySEVEN GROUP HOLDINGS LIMITED AND ITS CONTROLLED ENTITIESPRELIMINARY FINAL REPORT FOR THE YEAR ENDED 30 JUNE 2011
CONSOLIDATED STATEMENT OF CHANGES IN EQUITY (CONTINUED)
Total equity
PERIOD ENDED 30 JUNE 2010 Note $'000 $'000 $'000 $'000 $'000 $'000
Balance at incorporation - - - - - -
Profit for the period - - 718,034 718,034 708 718,742
Net change in fair value of available-for-sale 11 - 24,024 - 24,024 - 24,024
financial assets
Cash flow hedges: effective portion of 11 - 8,923 - 8,923 770 9,693
changes in fair value
Foreign currency differences for foreign 11 - 39,365 - 39,365 672 40,037
operations
Income tax on items of other 11 - (9,560) - (9,560) - (9,560)
comprehensive income
Total comprehensive income for the period - 62,752 718,034 780,786 2,150 782,936
Transactions with owners recognised directly in equityIssue of ordinary shares for cash 10 10,000 - - 10,000 - 10,000
Issue of ordinary shares related to acquisition 10 2,171,687 - - 2,171,687 - 2,171,687
Issue of TELYS4 related to acquisitions 10 427,165 - - 427,165 - 427,165
TELYS dividends paid 6 - - (11,989) (11,989) - (11,989)
Share based payments expense 11 - 1,836 - 1,836 - 1,836
Replacement of share options related 11 - 3,498 - 3,498 - 3,498
to business combination
Non-controlling interest on acquisition - - - - 137,229 137,229
of subsidiaries
Other changes in non-controlling interest - - - - 369 369
Acquisition of subsidiary under common 11 - (642,586) - (642,586) - (642,586)
control
Total transactions with owners recognised 2,608,852 (637,252) (11,989) 1,959,611 137,598 2,097,209 directly in equity
Total movement in equity for the period 2,608,852 (574,500) 706,045 2,740,397 139,748 2,880,145 Balance at end of the period 2,608,852 (574,500) 706,045 2,740,397 139,748 2,880,145
The consolidated statement of changes in equity is to be read in conjunction with the notes to the preliminary final report.
Non-controlling
interestReservesRetained earnings Total
Contributed equity
5
For
per
sona
l use
onl
y
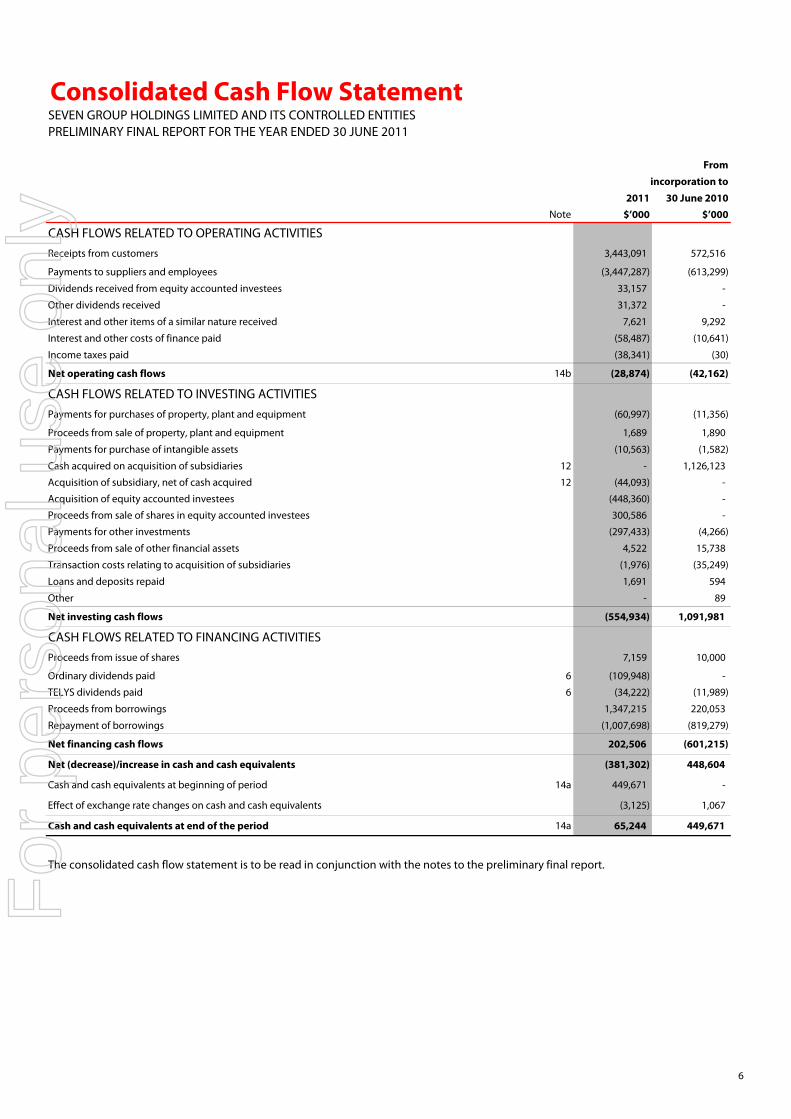
Consolidated Cash Flow StatementSEVEN GROUP HOLDINGS LIMITED AND ITS CONTROLLED ENTITIESPRELIMINARY FINAL REPORT FOR THE YEAR ENDED 30 JUNE 2011
From
incorporation to
2011 30 June 2010Note $’000 $’000
CASH FLOWS RELATED TO OPERATING ACTIVITIESReceipts from customers 3,443,091 572,516
Payments to suppliers and employees (3,447,287) (613,299)
Dividends received from equity accounted investees 33,157 -
Other dividends received 31,372 -
Interest and other items of a similar nature received 7,621 9,292
Interest and other costs of finance paid (58,487) (10,641)
Income taxes paid (38,341) (30)
Net operating cash flows 14b (28,874) (42,162)
CASH FLOWS RELATED TO INVESTING ACTIVITIESPayments for purchases of property, plant and equipment (60,997) (11,356)
Proceeds from sale of property, plant and equipment 1,689 1,890
Payments for purchase of intangible assets (10,563) (1,582)
Cash acquired on acquisition of subsidiaries 12 - 1,126,123
Acquisition of subsidiary, net of cash acquired 12 (44,093) -
Acquisition of equity accounted investees (448,360) -
Proceeds from sale of shares in equity accounted investees 300,586 -
Payments for other investments (297,433) (4,266)
Proceeds from sale of other financial assets 4,522 15,738
Transaction costs relating to acquisition of subsidiaries (1,976) (35,249)
Loans and deposits repaid 1,691 594
Other - 89
Net investing cash flows (554,934) 1,091,981
CASH FLOWS RELATED TO FINANCING ACTIVITIESProceeds from issue of shares 7,159 10,000
Ordinary dividends paid 6 (109,948) -
TELYS dividends paid 6 (34,222) (11,989)
Proceeds from borrowings 1,347,215 220,053
Repayment of borrowings (1,007,698) (819,279)
Net financing cash flows 202,506 (601,215)
Net (decrease)/increase in cash and cash equivalents (381,302) 448,604
Cash and cash equivalents at beginning of period 14a 449,671 -
Effect of exchange rate changes on cash and cash equivalents (3,125) 1,067
Cash and cash equivalents at end of the period 14a 65,244 449,671
The consolidated cash flow statement is to be read in conjunction with the notes to the preliminary final report.
6
For
per
sona
l use
onl
y
Notes to the Preliminary Final ReportSEVEN GROUP HOLDINGS LIMITED AND ITS CONTROLLED ENTITIESPRELIMINARY FINAL REPORT FOR THE YEAR ENDED 30 JUNE 2011
1. STATEMENT OF SIGNIFICANT ACCOUNTING POLICIESSeven Group Holdings Limited (the “Company”) is a company domiciled in Australia, whose shares are publicly traded on the Australian Securities Exchange ('ASX'). The company was incorporated on 12 February 2010. The preliminary final report coversthe year ended 30 June 2011 and comprises the Company and its subsidiaries (together referred to as the "Group"), the Group's interest in associates and jointly controlled entities.
In relation to the prior corresponding period:a) Seven Group Holdings Limited company results are from the date of its incorporation of 12 February 2010 to 30 June 2010. There
was no operating activity in the company until 28 April 2010.b) WesTrac Holdings Pty Limited was acquired on 28 April 2010, and its results for the period from acquisition to 30 June 2010
were included.c) Seven Network Limited was acquired on 13 May 2010, and its results for the period from acquisition to 30 June 2010 were included.
(A) BASIS OF PREPARATIONThe preliminary final report has been prepared in accordance with the Australian Accounting Standards (AASBs) (including Australianinterpretations) adopted by the Australian Accounting Standards Board (AASB) and the Corporations Act 2001.
The preliminary final report does not include all notes of the type normally included within the annual financial report and thereforecan not be expected to provide as full an understanding of the financial performance, financial position and financing and investingactivities of the Group as the full financial report.
The preliminary final report is presented in Australian dollars and all values are rounded to the nearest thousand dollars ($’000) unless otherwise stated under the option available to the Company under ASIC Class Order 98/100 dated 10 July 1998.
The preliminary final report is prepared on the historical cost basis except that the following assets and liabilities are stated at their fairvalue: derivative financial instruments, financial instruments at fair value through profit or loss and investments in available forsale assets.
The accounting policies used by the Group in this preliminary final report are consistent with those applied by the Group in itsconsolidated financial statements for the period ended 30 June 2010.
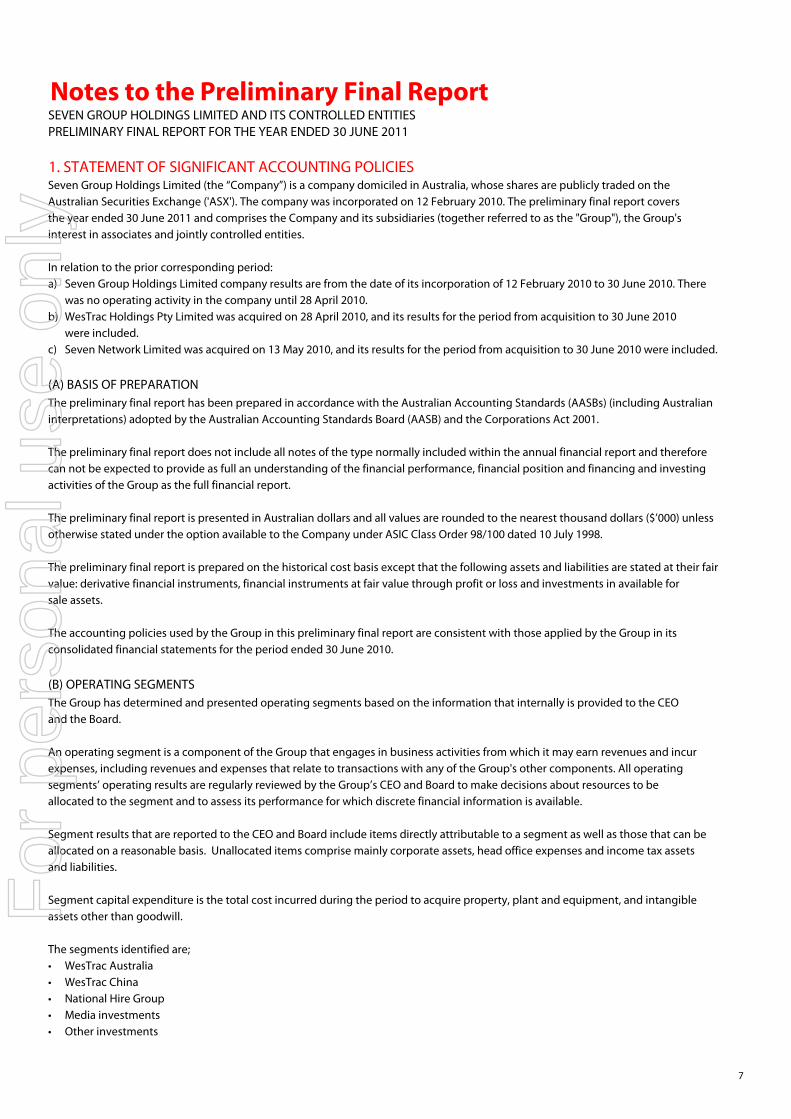
(B) OPERATING SEGMENTSThe Group has determined and presented operating segments based on the information that internally is provided to the CEO and the Board.
An operating segment is a component of the Group that engages in business activities from which it may earn revenues and incurexpenses, including revenues and expenses that relate to transactions with any of the Group's other components. All operating segments’ operating results are regularly reviewed by the Group’s CEO and Board to make decisions about resources to be allocated to the segment and to assess its performance for which discrete financial information is available.
Segment results that are reported to the CEO and Board include items directly attributable to a segment as well as those that can be allocated on a reasonable basis. Unallocated items comprise mainly corporate assets, head office expenses and income tax assets and liabilities.
Segment capital expenditure is the total cost incurred during the period to acquire property, plant and equipment, and intangible assets other than goodwill.
The segments identified are;• WesTrac Australia• WesTrac China• National Hire Group• Media investments• Other investments
7
For
per
sona
l use
onl
y
Notes to the Preliminary Final ReportSEVEN GROUP HOLDINGS LIMITED AND ITS CONTROLLED ENTITIESPRELIMINARY FINAL REPORT FOR THE YEAR ENDED 30 JUNE 2011
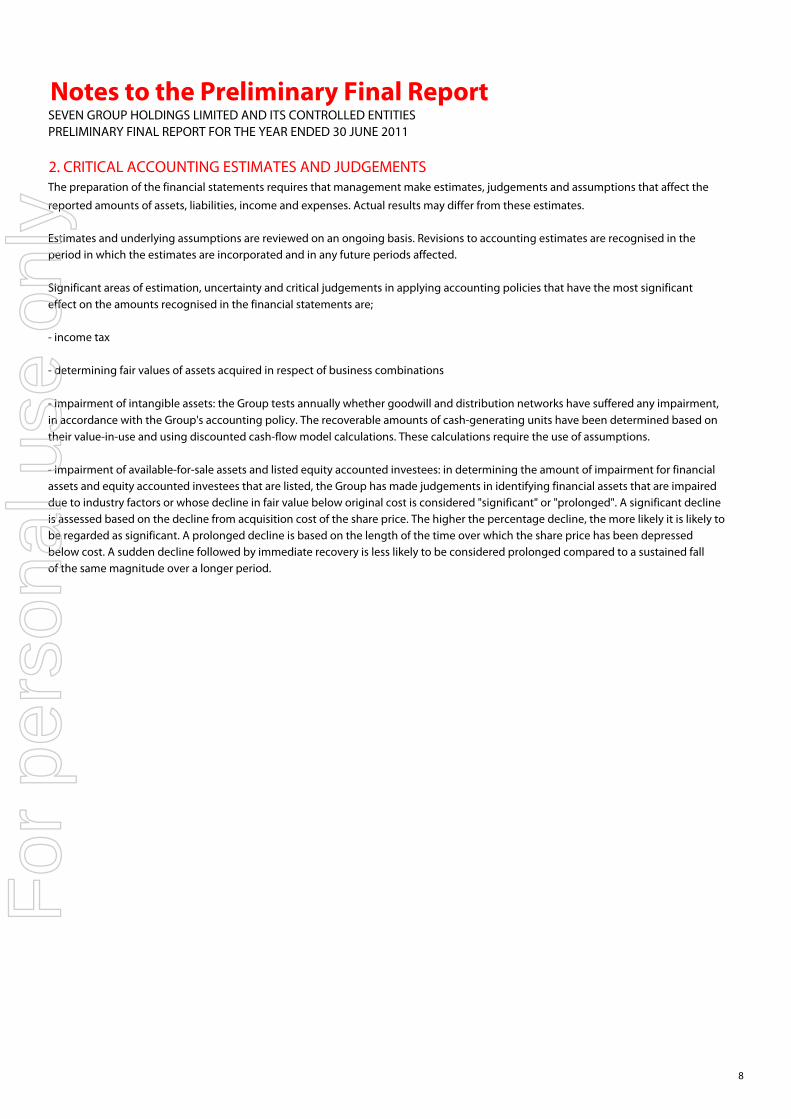
2. CRITICAL ACCOUNTING ESTIMATES AND JUDGEMENTSThe preparation of the financial statements requires that management make estimates, judgements and assumptions that affect the
reported amounts of assets, liabilities, income and expenses. Actual results may differ from these estimates.
Estimates and underlying assumptions are reviewed on an ongoing basis. Revisions to accounting estimates are recognised in theperiod in which the estimates are incorporated and in any future periods affected.
Significant areas of estimation, uncertainty and critical judgements in applying accounting policies that have the most significant effect on the amounts recognised in the financial statements are;
- income tax
- determining fair values of assets acquired in respect of business combinations
- impairment of intangible assets: the Group tests annually whether goodwill and distribution networks have suffered any impairment, in accordance with the Group's accounting policy. The recoverable amounts of cash-generating units have been determined based ontheir value-in-use and using discounted cash-flow model calculations. These calculations require the use of assumptions.
- impairment of available-for-sale assets and listed equity accounted investees: in determining the amount of impairment for financialassets and equity accounted investees that are listed, the Group has made judgements in identifying financial assets that are impaireddue to industry factors or whose decline in fair value below original cost is considered "significant" or "prolonged". A significant declineis assessed based on the decline from acquisition cost of the share price. The higher the percentage decline, the more likely it is likely tobe regarded as significant. A prolonged decline is based on the length of the time over which the share price has been depressedbelow cost. A sudden decline followed by immediate recovery is less likely to be considered prolonged compared to a sustained fall of the same magnitude over a longer period.
8
For
per
sona
l use
onl
y
Notes to the Preliminary Final ReportSEVEN GROUP HOLDINGS LIMITED AND ITS CONTROLLED ENTITIESPRELIMINARY FINAL REPORT FOR THE YEAR ENDED 30 JUNE 2011
3. OPERATING SEGMENTS
REPORTABLE SEGMENTS
Identification of reportable segments
The Group has identified its operating segments based on the internal reports that are reviewed and used by the executive management team (the chief operating decision makers) in assessing performance and in determining the allocation of resources.
The operating segments are identified by management based on the manner in which products are sold, the nature of services provided and country of origin. In the prior period, the 2010 segment results are included from the date of acquisition being28 April 2010 for the WesTrac Group, and 13 May 2010 for Seven Network Limited ("SNL").
• WesTrac Australia - WesTrac Australia is an authorised Caterpillar dealer in Western Australia, New South Wales and the Australian Capital Territory, providing heavy equipment sales and support to customers.
• WesTrac China - operates as one of the four authorised Caterpillar dealers in China, providing heavy equipment sales and support to customers.
• National Hire Group - represents the Group's operations in the manufacture, assembly, sales and support of lighting, power generation and dewatering equipment rental equipment as well as distribution of Perkins engines, via National Hires' investment in Coates Hire Pty Limited, Allight Holdings Pty Ltd and The Sykes Group.
• Media investments - relates to investments in listed and unlisted media organisations, including but not limited to, Seven WestMedia Limited and Consolidated Media Holdings Limited.
• Other investments - incorporates operations in broadband, telephony, other listed investments and property.
The Group is domiciled in Australia and operates predominantly in two countries, Australia and China. Segment revenues are allocatedbased on the country in which the customer is located. The WesTrac China segment represents all revenue derived from China.
Accounting policies
The accounting policies used by the Group in reporting segments internally are the same as those described in Note 1.
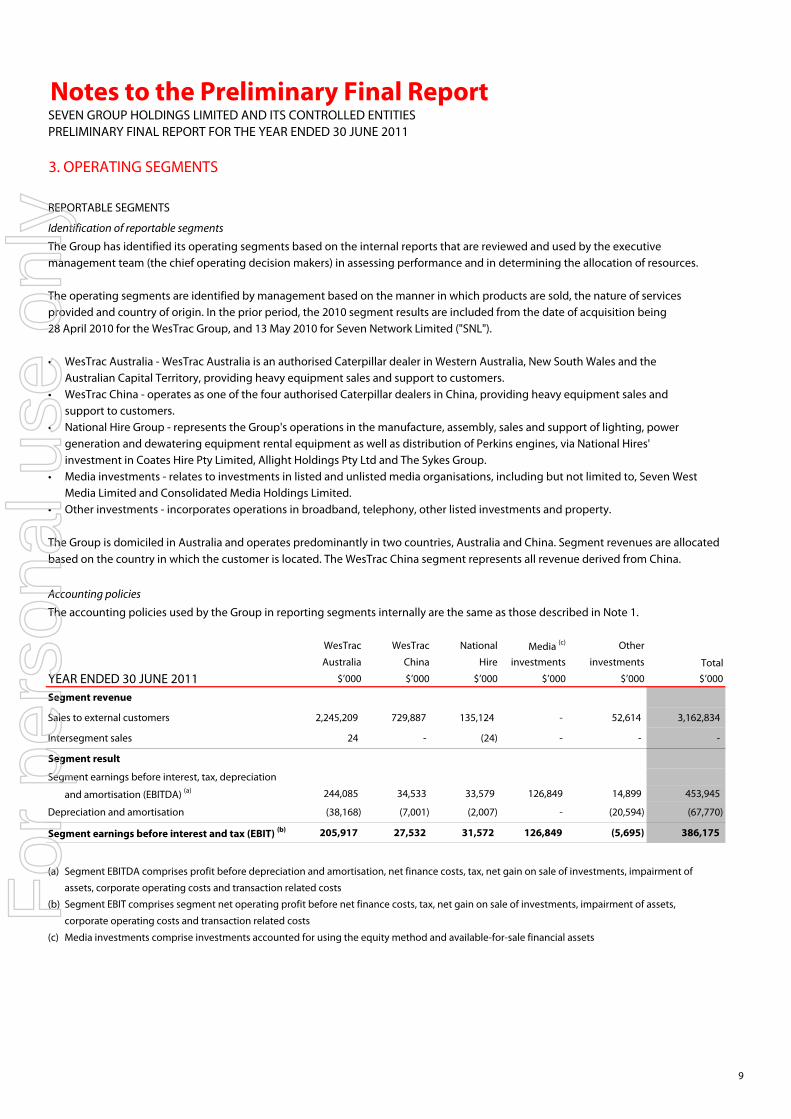
WesTrac WesTrac National Media (c) Other
Australia China Hire investments investments
YEAR ENDED 30 JUNE 2011 $’000 $’000 $’000 $’000 $’000 $’000
Segment revenue
Sales to external customers 2,245,209 729,887 135,124 - 52,614 3,162,834
Intersegment sales 24 - (24) - - -
Segment result
Segment earnings before interest, tax, depreciation
and amortisation (EBITDA) (a) 244,085 34,533 33,579 126,849 14,899 453,945
Depreciation and amortisation (38,168) (7,001) (2,007) - (20,594) (67,770)
Segment earnings before interest and tax (EBIT) (b) 205,917 27,532 31,572 126,849 (5,695) 386,175
(a) Segment EBITDA comprises profit before depreciation and amortisation, net finance costs, tax, net gain on sale of investments, impairment of
assets, corporate operating costs and transaction related costs
(b) Segment EBIT comprises segment net operating profit before net finance costs, tax, net gain on sale of investments, impairment of assets,
corporate operating costs and transaction related costs
(c) Media investments comprise investments accounted for using the equity method and available-for-sale financial assets
Total
9
For
per
sona
l use
onl
y

Notes to the Preliminary Final ReportSEVEN GROUP HOLDINGS LIMITED AND ITS CONTROLLED ENTITIESPRELIMINARY FINAL REPORT FOR THE YEAR ENDED 30 JUNE 2011
3. OPERATING SEGMENTS (CONTINUED)
WesTrac WesTrac National Media Other
Australia China Hire investments investments
YEAR ENDED 30 JUNE 2011 $’000 $’000 $’000 $’000 $’000 $’000
Balance sheetInvestments accounted for using the equity method 14,119 1,256 331,268 1,089,278 46,131 1,482,052
Other segment assets 1,257,689 760,205 183,839 259,965 777,626 3,239,324
Segment assets 1,271,808 761,461 515,107 1,349,243 823,757 4,721,376
Segment liabilities (440,286) (165,641) (50,210) (8,543) (32,227) (696,907)
Other segment information
Capital expenditure (40,865) (12,272) (1,280) - (17,143) (71,560)
Share of results of equity accounted investees
included in segment EBIT 930 149 22,838 118,401 1,270 143,588
Impairment of assets recognised in profit or loss (4,131) - - (315,598) (4,620) (324,349)
WesTrac WesTrac National Media Other
Australia China Hire investments investments
PERIOD ENDED 30 JUNE 2010 $’000 $’000 $’000 $’000 $’000 $’000
Segment revenueSales to external customers 358,607 155,720 15,834 - 7,423 537,584
Intersegment sales 411 - (411) - - -
Segment resultSegment earnings before interest, tax, depreciation
and amortisation (EBITDA) (a) 40,365 8,049 2,557 10,761 (1,580) 60,152
Depreciation and amortisation (5,840) (1,187) (193) - (4,517) (11,737)
Segment earnings before interest and tax (EBIT) (b) 34,525 6,862 2,364 10,761 (6,097) 48,415
Balance sheetInvestments accounted for using the equity method 13,187 - 312,960 1,344,164 54,376 1,724,687
Other segment assets 965,751 755,058 81,900 29,608 533,495 2,365,812
Segment assets 978,938 755,058 394,860 1,373,772 587,871 4,090,499
Segment liabilities (293,368) (125,576) (18,456) - (54,678) (492,078)
Other segment informationCapital expenditure (4,173) (1,481) (977) - (6,611) (13,242)
Share of results of equity accounted investees
included in segment EBIT 803 - 2,702 10,761 - 14,266
Total
Total
10
For
per
sona
l use
onl
y
Notes to the Preliminary Final ReportSEVEN GROUP HOLDINGS LIMITED AND ITS CONTROLLED ENTITIESPRELIMINARY FINAL REPORT FOR THE YEAR ENDED 30 JUNE 2011
3. OPERATING SEGMENTS (CONTINUED)
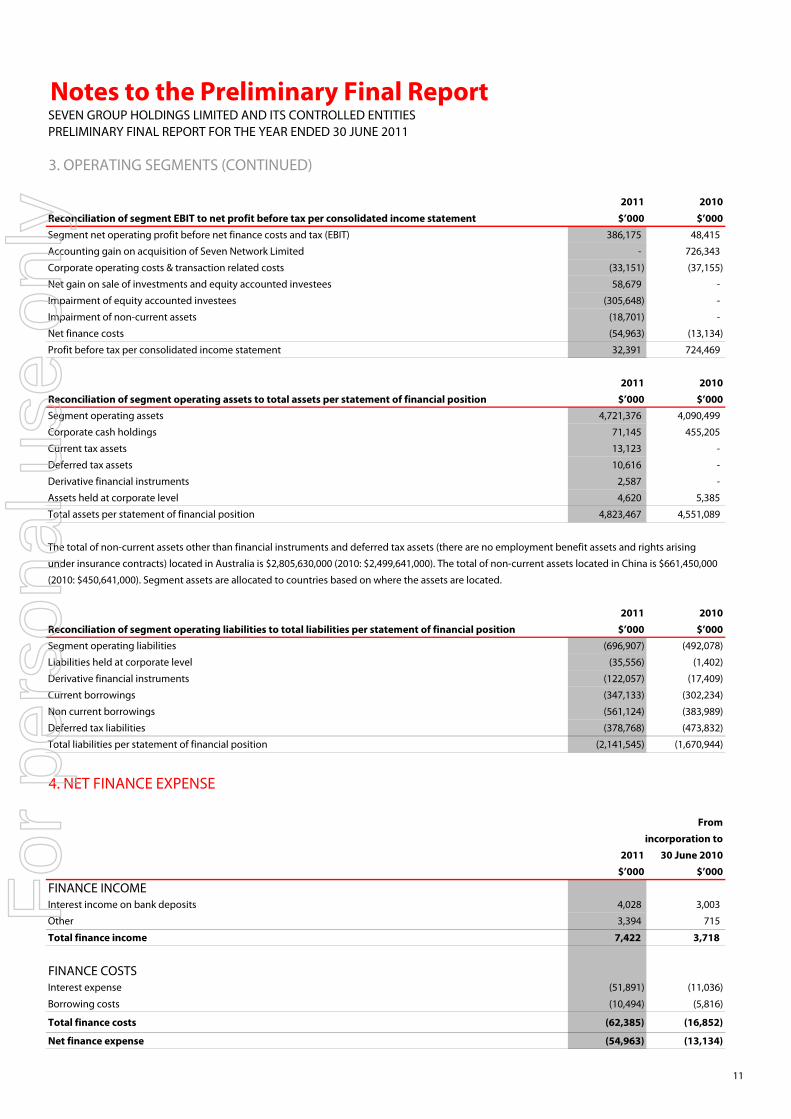
2011 2010
Reconciliation of segment EBIT to net profit before tax per consolidated income statement $’000 $’000Segment net operating profit before net finance costs and tax (EBIT) 386,175 48,415
Accounting gain on acquisition of Seven Network Limited - 726,343
Corporate operating costs & transaction related costs (33,151) (37,155)
Net gain on sale of investments and equity accounted investees 58,679 -
Impairment of equity accounted investees (305,648) -
Impairment of non-current assets (18,701) -
Net finance costs (54,963) (13,134)
Profit before tax per consolidated income statement 32,391 724,469
2011 2010Reconciliation of segment operating assets to total assets per statement of financial position $’000 $’000Segment operating assets 4,721,376 4,090,499
Corporate cash holdings 71,145 455,205
Current tax assets 13,123 -
Deferred tax assets 10,616 -
Derivative financial instruments 2,587 -
Assets held at corporate level 4,620 5,385
Total assets per statement of financial position 4,823,467 4,551,089
The total of non-current assets other than financial instruments and deferred tax assets (there are no employment benefit assets and rights arising
under insurance contracts) located in Australia is $2,805,630,000 (2010: $2,499,641,000). The total of non-current assets located in China is $661,450,000
(2010: $450,641,000). Segment assets are allocated to countries based on where the assets are located.
2011 2010Reconciliation of segment operating liabilities to total liabilities per statement of financial position $’000 $’000Segment operating liabilities (696,907) (492,078)
Liabilities held at corporate level (35,556) (1,402)
Derivative financial instruments (122,057) (17,409)
Current borrowings (347,133) (302,234)
Non current borrowings (561,124) (383,989)
Deferred tax liabilities (378,768) (473,832)
Total liabilities per statement of financial position (2,141,545) (1,670,944)
4. NET FINANCE EXPENSE
Fromincorporation to
2011 30 June 2010$’000 $’000
FINANCE INCOMEInterest income on bank deposits 4,028 3,003
Other 3,394 715
Total finance income 7,422 3,718
FINANCE COSTSInterest expense (51,891) (11,036)
Borrowing costs (10,494) (5,816)
Total finance costs (62,385) (16,852)
Net finance expense (54,963) (13,134)
11
For
per
sona
l use
onl
y
Notes to the Preliminary Final ReportSEVEN GROUP HOLDINGS LIMITED AND ITS CONTROLLED ENTITIESPRELIMINARY FINAL REPORT FOR THE YEAR ENDED 30 JUNE 2011
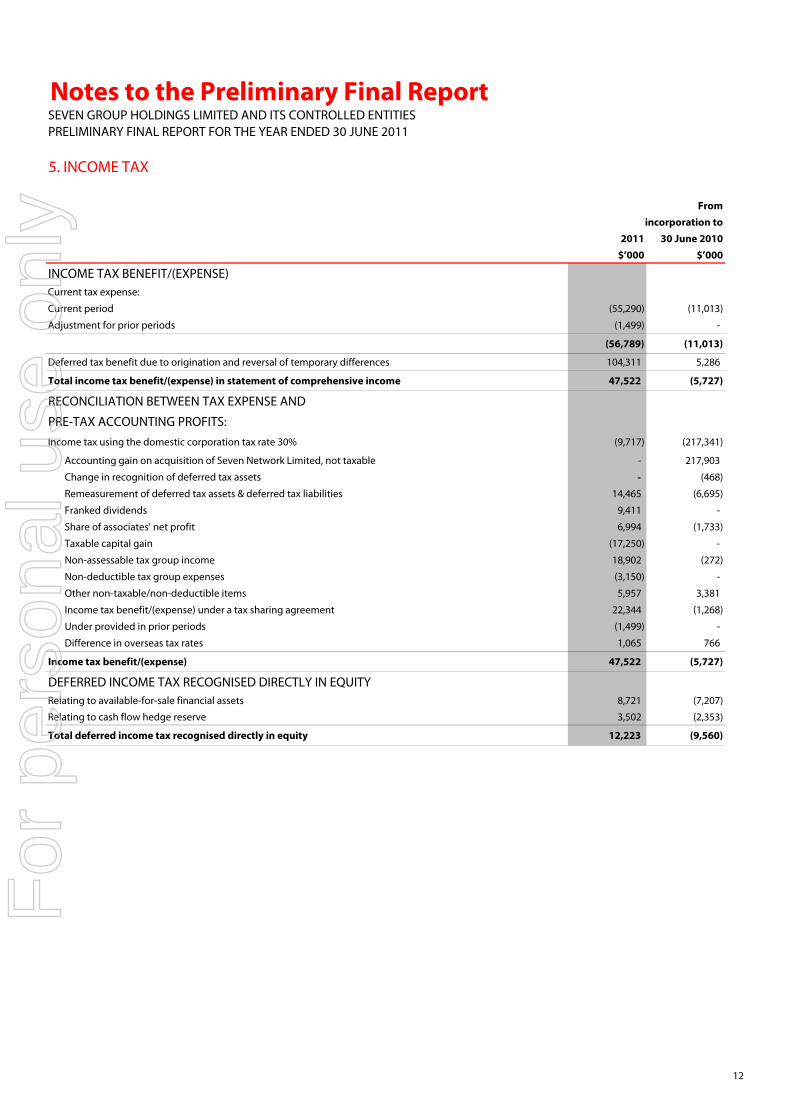
5. INCOME TAX
Fromincorporation to
2011 30 June 2010$’000 $’000
INCOME TAX BENEFIT/(EXPENSE)Current tax expense:
Current period (55,290) (11,013)
Adjustment for prior periods (1,499) -
(56,789) (11,013)
Deferred tax benefit due to origination and reversal of temporary differences 104,311 5,286
Total income tax benefit/(expense) in statement of comprehensive income 47,522 (5,727)
RECONCILIATION BETWEEN TAX EXPENSE AND
PRE-TAX ACCOUNTING PROFITS:Income tax using the domestic corporation tax rate 30% (9,717) (217,341)
Accounting gain on acquisition of Seven Network Limited, not taxable - 217,903
Change in recognition of deferred tax assets - (468)
Remeasurement of deferred tax assets & deferred tax liabilities 14,465 (6,695)
Franked dividends 9,411 -
Share of associates' net profit 6,994 (1,733)
Taxable capital gain (17,250) -
Non-assessable tax group income 18,902 (272)
Non-deductible tax group expenses (3,150) -
Other non-taxable/non-deductible items 5,957 3,381
Income tax benefit/(expense) under a tax sharing agreement 22,344 (1,268)
Under provided in prior periods (1,499) -
Difference in overseas tax rates 1,065 766
Income tax benefit/(expense) 47,522 (5,727)
DEFERRED INCOME TAX RECOGNISED DIRECTLY IN EQUITYRelating to available-for-sale financial assets 8,721 (7,207)
Relating to cash flow hedge reserve 3,502 (2,353)
Total deferred income tax recognised directly in equity 12,223 (9,560)
12
For
per
sona
l use
onl
y
Notes to the Preliminary Final ReportSEVEN GROUP HOLDINGS LIMITED AND ITS CONTROLLED ENTITIESPRELIMINARY FINAL REPORT FOR THE YEAR ENDED 30 JUNE 2011
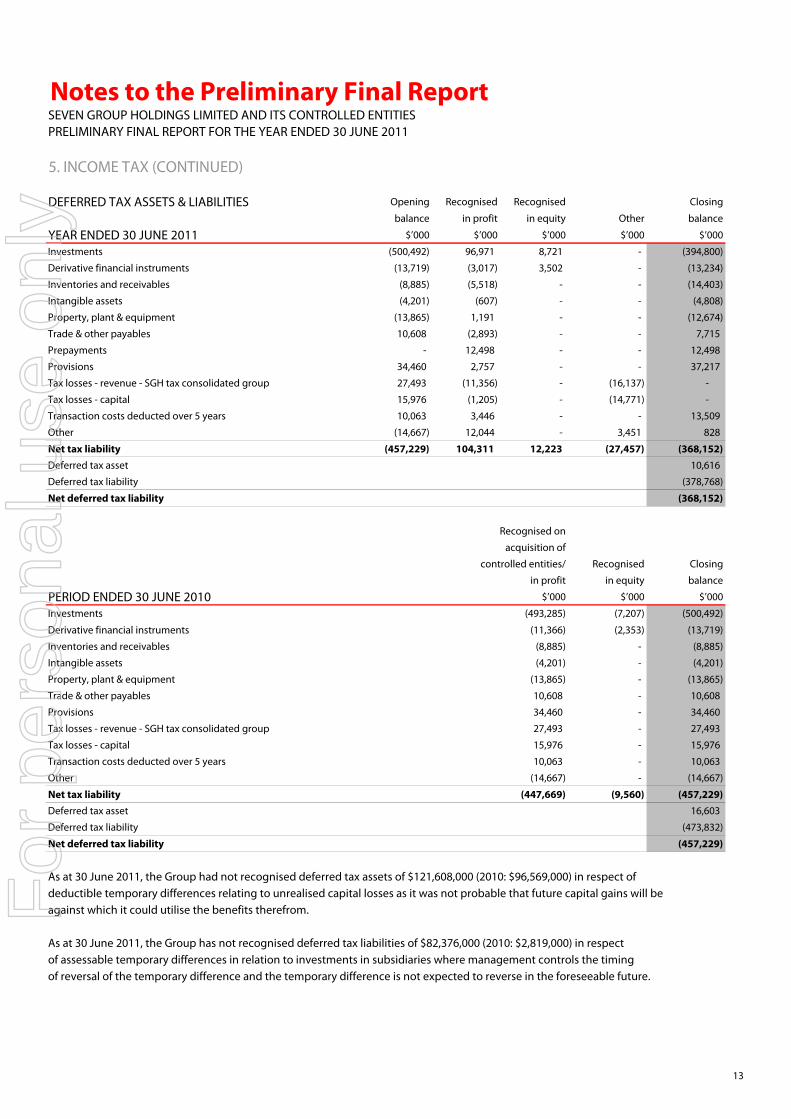
5. INCOME TAX (CONTINUED)
DEFERRED TAX ASSETS & LIABILITIES Opening Recognised Recognised Closing
balance in profit in equity Other balance
YEAR ENDED 30 JUNE 2011 $’000 $’000 $’000 $’000 $’000
Investments (500,492) 96,971 8,721 - (394,800)
Derivative financial instruments (13,719) (3,017) 3,502 - (13,234)
Inventories and receivables (8,885) (5,518) - - (14,403)
Intangible assets (4,201) (607) - - (4,808)
Property, plant & equipment (13,865) 1,191 - - (12,674)
Trade & other payables 10,608 (2,893) - - 7,715
Prepayments - 12,498 - - 12,498
Provisions 34,460 2,757 - - 37,217
Tax losses - revenue - SGH tax consolidated group 27,493 (11,356) - (16,137) -
Tax losses - capital 15,976 (1,205) - (14,771) -
Transaction costs deducted over 5 years 10,063 3,446 - - 13,509
Other (14,667) 12,044 - 3,451 828
Net tax liability (457,229) 104,311 12,223 (27,457) (368,152) Deferred tax asset 10,616
Deferred tax liability (378,768)
Net deferred tax liability (368,152)
Recognised on
acquisition of
controlled entities/ Recognised Closing
in profit in equity balance
PERIOD ENDED 30 JUNE 2010 $’000 $’000 $’000
Investments (493,285) (7,207) (500,492)
Derivative financial instruments (11,366) (2,353) (13,719)
Inventories and receivables (8,885) - (8,885)
Intangible assets (4,201) - (4,201)
Property, plant & equipment (13,865) - (13,865)
Trade & other payables 10,608 - 10,608
Provisions 34,460 - 34,460
Tax losses - revenue - SGH tax consolidated group 27,493 - 27,493
Tax losses - capital 15,976 - 15,976
Transaction costs deducted over 5 years 10,063 - 10,063
Other (14,667) - (14,667)
Net tax liability (447,669) (9,560) (457,229) Deferred tax asset 16,603
Deferred tax liability (473,832)
Net deferred tax liability (457,229)
As at 30 June 2011, the Group had not recognised deferred tax assets of $121,608,000 (2010: $96,569,000) in respect of deductible temporary differences relating to unrealised capital losses as it was not probable that future capital gains will be against which it could utilise the benefits therefrom.
As at 30 June 2011, the Group has not recognised deferred tax liabilities of $82,376,000 (2010: $2,819,000) in respect of assessable temporary differences in relation to investments in subsidiaries where management controls the timing of reversal of the temporary difference and the temporary difference is not expected to reverse in the foreseeable future.
13
For
per
sona
l use
onl
y
Notes to the Preliminary Final ReportSEVEN GROUP HOLDINGS LIMITED AND ITS CONTROLLED ENTITIESPRELIMINARY FINAL REPORT FOR THE YEAR ENDED 30 JUNE 2011
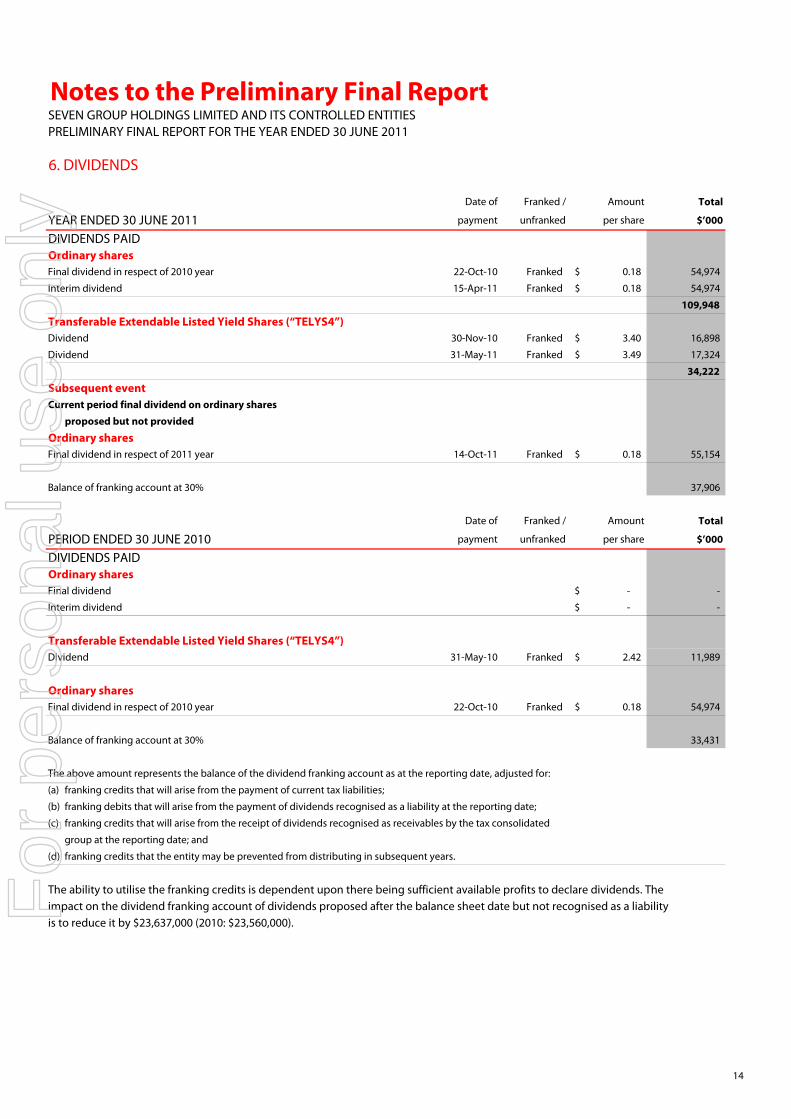
6. DIVIDENDS
Date of Franked / Amount Total
YEAR ENDED 30 JUNE 2011 payment unfranked per share $’000
DIVIDENDS PAID Ordinary sharesFinal dividend in respect of 2010 year 22-Oct-10 Franked 0.18$ 54,974
Interim dividend 15-Apr-11 Franked 0.18$ 54,974
109,948
Transferable Extendable Listed Yield Shares (“TELYS4”)Dividend 30-Nov-10 Franked 3.40$ 16,898
Dividend 31-May-11 Franked 3.49$ 17,324
34,222
Subsequent eventCurrent period final dividend on ordinary shares
proposed but not provided
Ordinary sharesFinal dividend in respect of 2011 year 14-Oct-11 Franked 0.18$ 55,154
Balance of franking account at 30% 37,906
Date of Franked / Amount Total
PERIOD ENDED 30 JUNE 2010 payment unfranked per share $’000
DIVIDENDS PAID Ordinary sharesFinal dividend -$ -
Interim dividend -$ -
Transferable Extendable Listed Yield Shares (“TELYS4”)Dividend 31-May-10 Franked 2.42$ 11,989
Ordinary sharesFinal dividend in respect of 2010 year 22-Oct-10 Franked 0.18$ 54,974
Balance of franking account at 30% 33,431
The above amount represents the balance of the dividend franking account as at the reporting date, adjusted for:
(a) franking credits that will arise from the payment of current tax liabilities;
(b) franking debits that will arise from the payment of dividends recognised as a liability at the reporting date;
(c) franking credits that will arise from the receipt of dividends recognised as receivables by the tax consolidated
group at the reporting date; and
(d) franking credits that the entity may be prevented from distributing in subsequent years.
The ability to utilise the franking credits is dependent upon there being sufficient available profits to declare dividends. Theimpact on the dividend franking account of dividends proposed after the balance sheet date but not recognised as a liabilityis to reduce it by $23,637,000 (2010: $23,560,000).
14
For
per
sona
l use
onl
y

Notes to the Preliminary Final ReportSEVEN GROUP HOLDINGS LIMITED AND ITS CONTROLLED ENTITIESPRELIMINARY FINAL REPORT FOR THE YEAR ENDED 30 JUNE 2011
7. EARNINGS PER SHARE
Fromincorporation to
2011 30 June 2010$’000 $’000
EARNINGS RECONCILIATIONNet profit attributable to equity holders of the Company 70,412 718,034
Allocated earnings to category of share:
- Ordinary shares 36,126 714,907
- TELYS4 34,286 3,127
70,412 718,034
Weighted average number of shares
Number for basic earnings per share:
- Ordinary shares 305,571,925 122,015,245
- TELYS4 4,963,640 3,860,609
Effect of share options on issue:
- Ordinary shares 584,969 -
Number for diluted earnings per share:
- Ordinary shares 306,156,894 122,015,245
- TELYS4 4,963,640 3,860,609
Statutory earnings per share
Ordinary shares - total earnings per share from continuing operations: (a)
- Basic ($) 0.12 5.87
- Diluted ($) 0.12 5.87
TELYS4 - total earnings per TELYS4:
- Basic ($) 6.91 0.81
- Diluted ($) 6.91 0.81
(a) In relation to the prior period, the Company's incorporation date of 12 February 2010 was used to determine the weighted averagenumber of shares on issue for statutory EPS. If the weighted average number of shares was calculated from the Company's firstday of operations, being 28 April 2010, the weighted average number of shares on issue would have been 263,096,885, resulting in a basic and diluted adjusted EPS of $2.72.
Of the 5,775,000 (2010: 6,875,000) options exercisable at 30 June 2011, 3,525,000 are dilutive. The weighted average number of dilutiveshares is 584,969 (2010: nil). As at 30 June 2011, 2,250,000 (2010: 6,875,000) options were anti-dilutive and have not been included in theabove diluted earnings per share calculation.
15
For
per
sona
l use
onl
y
Notes to the Preliminary Final ReportSEVEN GROUP HOLDINGS LIMITED AND ITS CONTROLLED ENTITIESPRELIMINARY FINAL REPORT FOR THE YEAR ENDED 30 JUNE 2011
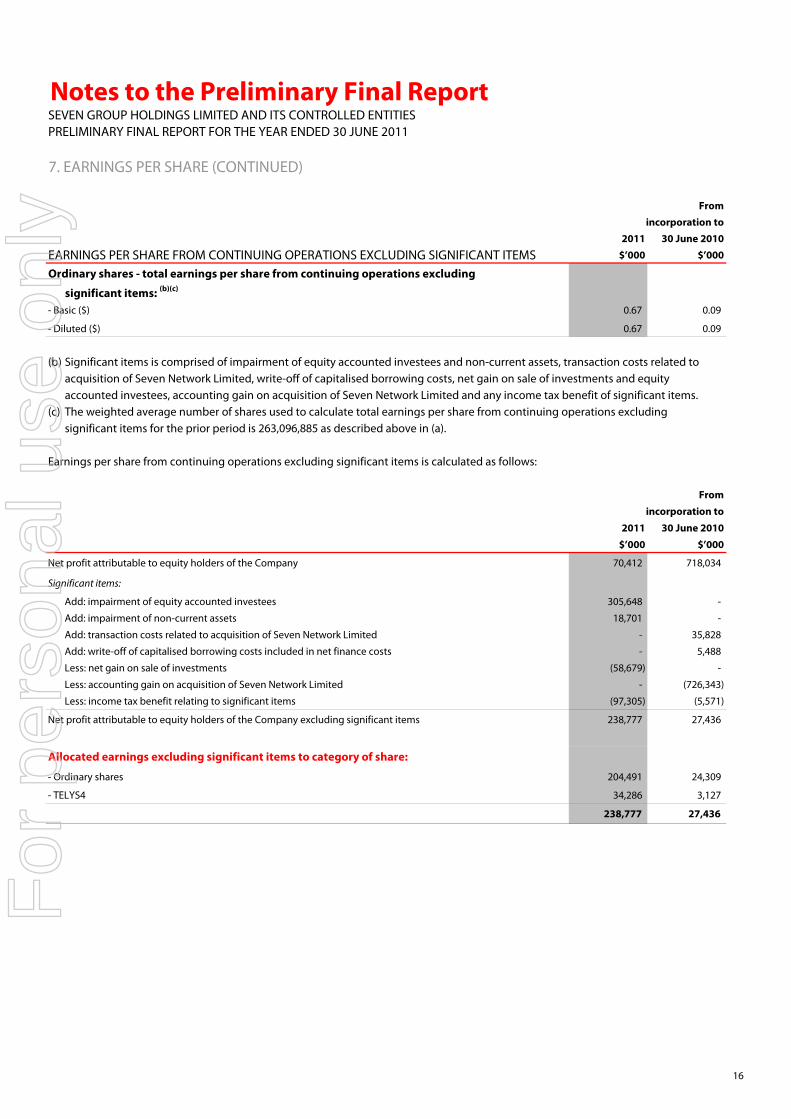
7. EARNINGS PER SHARE (CONTINUED)
Fromincorporation to
2011 30 June 2010
EARNINGS PER SHARE FROM CONTINUING OPERATIONS EXCLUDING SIGNIFICANT ITEMS $’000 $’000
Ordinary shares - total earnings per share from continuing operations excluding
significant items: (b)(c)
- Basic ($) 0.67 0.09
- Diluted ($) 0.67 0.09
(b) Significant items is comprised of impairment of equity accounted investees and non-current assets, transaction costs related to acquisition of Seven Network Limited, write-off of capitalised borrowing costs, net gain on sale of investments and equity accounted investees, accounting gain on acquisition of Seven Network Limited and any income tax benefit of significant items.
(c) The weighted average number of shares used to calculate total earnings per share from continuing operations excludingsignificant items for the prior period is 263,096,885 as described above in (a).
Earnings per share from continuing operations excluding significant items is calculated as follows:
From
incorporation to
2011 30 June 2010
$’000 $’000
Net profit attributable to equity holders of the Company 70,412 718,034
Significant items:
Add: impairment of equity accounted investees 305,648 -
Add: impairment of non-current assets 18,701 -
Add: transaction costs related to acquisition of Seven Network Limited - 35,828
Add: write-off of capitalised borrowing costs included in net finance costs - 5,488
Less: net gain on sale of investments (58,679) -
Less: accounting gain on acquisition of Seven Network Limited - (726,343)
Less: income tax benefit relating to significant items (97,305) (5,571)
Net profit attributable to equity holders of the Company excluding significant items 238,777 27,436
Allocated earnings excluding significant items to category of share:
- Ordinary shares 204,491 24,309
- TELYS4 34,286 3,127
238,777 27,436
16
For
per
sona
l use
onl
y

Notes to the Preliminary Final ReportSEVEN GROUP HOLDINGS LIMITED AND ITS CONTROLLED ENTITIESPRELIMINARY FINAL REPORT FOR THE YEAR ENDED 30 JUNE 2011
8. INVESTMENTS ACCOUNTED FOR USING THE EQUITY METHOD
2011 2010
$’000 $’000
Investments in associates and jointly controlled entities 1,482,052 1,724,687
2011 2010Country of Balance Ownership Ownership
Investee Principal activities incorporation date interest interest
EQUITY ACCOUNTED INVESTMENTS AND JOINTLY CONTROLLED ENTITIESAdelaide Broadcast Property Pty Limited Property management Australia 30-Jun 40.0% 40.0%
Adelaide Broadcast Property Trust Property management Australia 30-Jun 40.0% 40.0%
Apac Energy Rental Pte Limited Rental services Singapore 31-Dec 20.0% 20.0%
Consolidated Media Holdings Limited Media Australia 30-Jun 24.4% 22.4%
Energy Power Systems Australia Distribution and rental of Australia 30-Jun 40.0% 40.0%
Pty Limited CAT engine products
Flagship Property Holdings Pty Limited Property management Australia 31-Dec 46.8% 46.8%
Mo's Mobiles Pty Limited Mobile phone retailer Australia 30-Jun 25.0% 25.0%
P2 Pty Limited Dormant Australia 30-Jun 50.0% 50.0%
P4 Pty Limited Dormant Australia 30-Jun 50.0% 50.0%
Premier Capital Developments Pty Ltd Property management Australia 30-Jun 25.0% 25.0%
Revy Investments Pty Limited Property management Australia 30-Jun 25.0% 25.0%
Revy Investments Trust Property management Australia 30-Jun 25.0% 25.0%
Sydney Broadcast Property Pty Ltd Property management Australia 30-Jun 40.0% 40.0%
Sydney Broadcast Property Trust Property management Australia 30-Jun 40.0% 40.0%
Vuecast Operations Pty Limited ** Programme production Australia 30-Jun 50.0% 50.0%
West Australian Newspapers
Holdings Limited Media Australia 30-Jun - 23.8%
Seven West Media Limited Media Australia 30-Jun 29.6% -
Coates Group Holdings Pty Limited*** Rental services Australia 30-Jun 46.1% 46.1%
Seven Media Group Pty Limited* Media Australia 30-Jun - 45.0%
* - in the prior period the company determined its interest in Seven Media Group Pty Limited (SMG) was 45% after considering vesting
conditions for options issued under SMG’s Management Equity Plan including options issued during the period ended 30 June 2010. On 12 April 2011
the remaining 55% of SMG was acquired. Concurrently, the operational subsidiaries of SMG were sold to West Australian Newspapers Holdings Limited.
Refer to 'Creation of Seven West Media Limited' below for further information.
** - entity was placed into Member's Voluntary Liquidation on 17 June 2011.
*** - interest held by National Hire Group Limited, which is 66.2% owned by WesTrac Pty Ltd. Effective interest is 30.52%.
From
incorporation to
2011 30 June 2010
$’000 $’000
SHARE OF INVESTEES' NET PROFITShare of operating profit before tax 157,814 16,081
Share of income tax expense (14,226) (1,815)
Share of net profit of equity accounted investees 143,588 14,266
ASSOCIATED AND JOINTLYCONTROLLED ENTITIES
17
For
per
sona
l use
onl
y
Notes to the Preliminary Final ReportSEVEN GROUP HOLDINGS LIMITED AND ITS CONTROLLED ENTITIESPRELIMINARY FINAL REPORT FOR THE YEAR ENDED 30 JUNE 2011
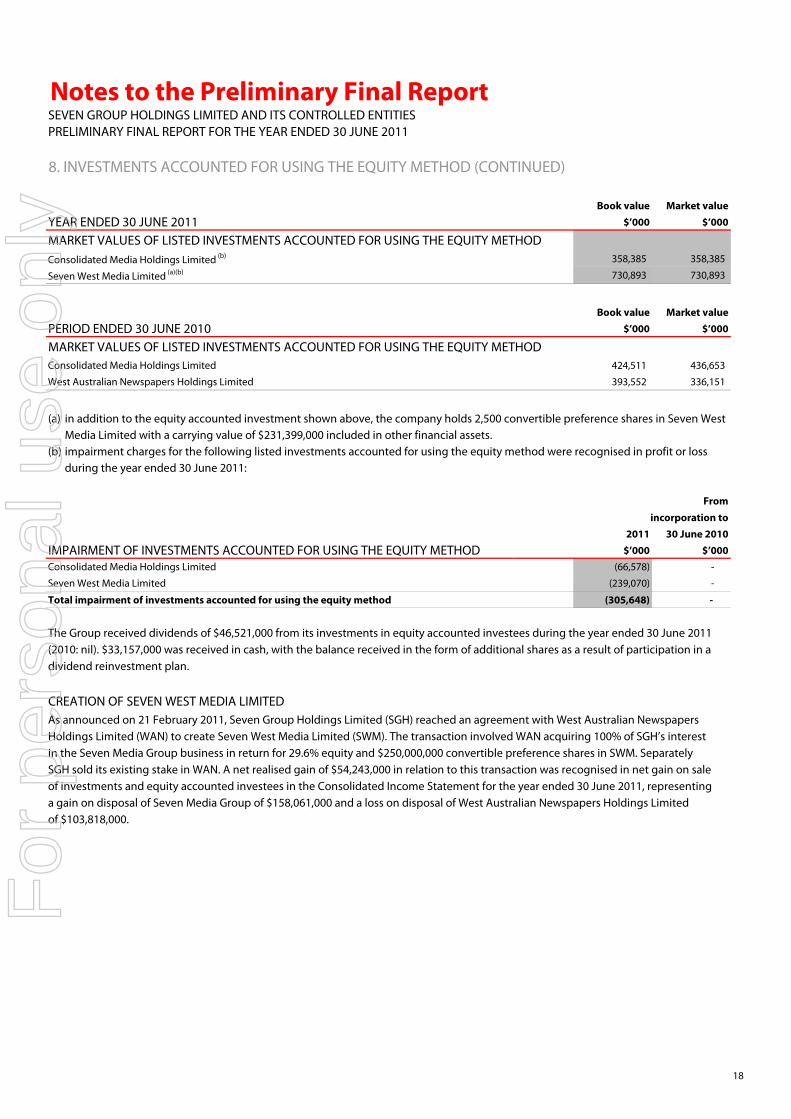
8. INVESTMENTS ACCOUNTED FOR USING THE EQUITY METHOD (CONTINUED)
Book value Market value
YEAR ENDED 30 JUNE 2011 $’000 $’000
MARKET VALUES OF LISTED INVESTMENTS ACCOUNTED FOR USING THE EQUITY METHODConsolidated Media Holdings Limited (b) 358,385 358,385
Seven West Media Limited (a)(b) 730,893 730,893
Book value Market value
PERIOD ENDED 30 JUNE 2010 $’000 $’000
MARKET VALUES OF LISTED INVESTMENTS ACCOUNTED FOR USING THE EQUITY METHODConsolidated Media Holdings Limited 424,511 436,653
West Australian Newspapers Holdings Limited 393,552 336,151
(a) in addition to the equity accounted investment shown above, the company holds 2,500 convertible preference shares in Seven WestMedia Limited with a carrying value of $231,399,000 included in other financial assets.
(b) impairment charges for the following listed investments accounted for using the equity method were recognised in profit or lossduring the year ended 30 June 2011:
From
incorporation to2011 30 June 2010
IMPAIRMENT OF INVESTMENTS ACCOUNTED FOR USING THE EQUITY METHOD $’000 $’000Consolidated Media Holdings Limited (66,578) -
Seven West Media Limited (239,070) -
Total impairment of investments accounted for using the equity method (305,648) -
The Group received dividends of $46,521,000 from its investments in equity accounted investees during the year ended 30 June 2011(2010: nil). $33,157,000 was received in cash, with the balance received in the form of additional shares as a result of participation in adividend reinvestment plan.
CREATION OF SEVEN WEST MEDIA LIMITEDAs announced on 21 February 2011, Seven Group Holdings Limited (SGH) reached an agreement with West Australian Newspapers Holdings Limited (WAN) to create Seven West Media Limited (SWM). The transaction involved WAN acquiring 100% of SGH’s interest in the Seven Media Group business in return for 29.6% equity and $250,000,000 convertible preference shares in SWM. Separately SGH sold its existing stake in WAN. A net realised gain of $54,243,000 in relation to this transaction was recognised in net gain on sale of investments and equity accounted investees in the Consolidated Income Statement for the year ended 30 June 2011, representing a gain on disposal of Seven Media Group of $158,061,000 and a loss on disposal of West Australian Newspapers Holdings Limited of $103,818,000.
18
For
per
sona
l use
onl
y
Notes to the Preliminary Final ReportSEVEN GROUP HOLDINGS LIMITED AND ITS CONTROLLED ENTITIESPRELIMINARY FINAL REPORT FOR THE YEAR ENDED 30 JUNE 2011
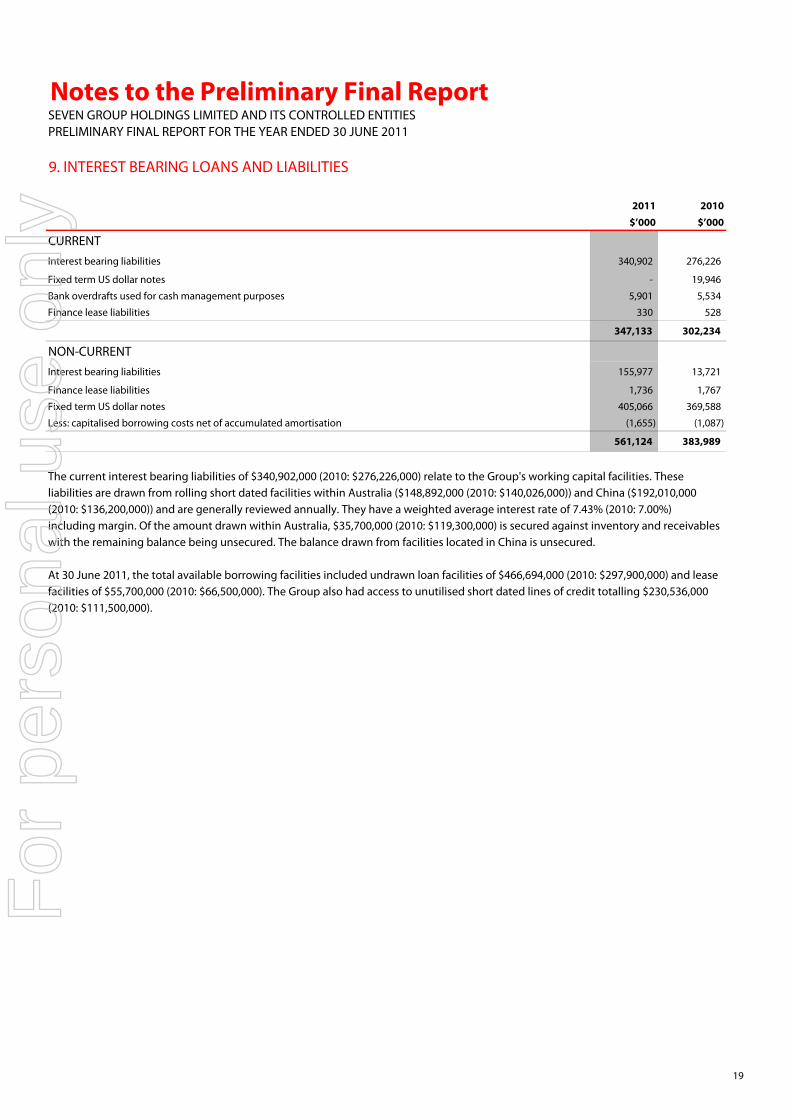
9. INTEREST BEARING LOANS AND LIABILITIES
2011 2010
$’000 $’000
CURRENTInterest bearing liabilities 340,902 276,226
Fixed term US dollar notes - 19,946
Bank overdrafts used for cash management purposes 5,901 5,534
Finance lease liabilities 330 528
347,133 302,234
NON-CURRENTInterest bearing liabilities 155,977 13,721
Finance lease liabilities 1,736 1,767
Fixed term US dollar notes 405,066 369,588
Less: capitalised borrowing costs net of accumulated amortisation (1,655) (1,087)
561,124 383,989
The current interest bearing liabilities of $340,902,000 (2010: $276,226,000) relate to the Group's working capital facilities. Theseliabilities are drawn from rolling short dated facilities within Australia ($148,892,000 (2010: $140,026,000)) and China ($192,010,000(2010: $136,200,000)) and are generally reviewed annually. They have a weighted average interest rate of 7.43% (2010: 7.00%) including margin. Of the amount drawn within Australia, $35,700,000 (2010: $119,300,000) is secured against inventory and receivables with the remaining balance being unsecured. The balance drawn from facilities located in China is unsecured.
At 30 June 2011, the total available borrowing facilities included undrawn loan facilities of $466,694,000 (2010: $297,900,000) and lease facilities of $55,700,000 (2010: $66,500,000). The Group also had access to unutilised short dated lines of credit totalling $230,536,000(2010: $111,500,000).
19
For
per
sona
l use
onl
y
Notes to the Preliminary Final ReportSEVEN GROUP HOLDINGS LIMITED AND ITS CONTROLLED ENTITIESPRELIMINARY FINAL REPORT FOR THE YEAR ENDED 30 JUNE 2011
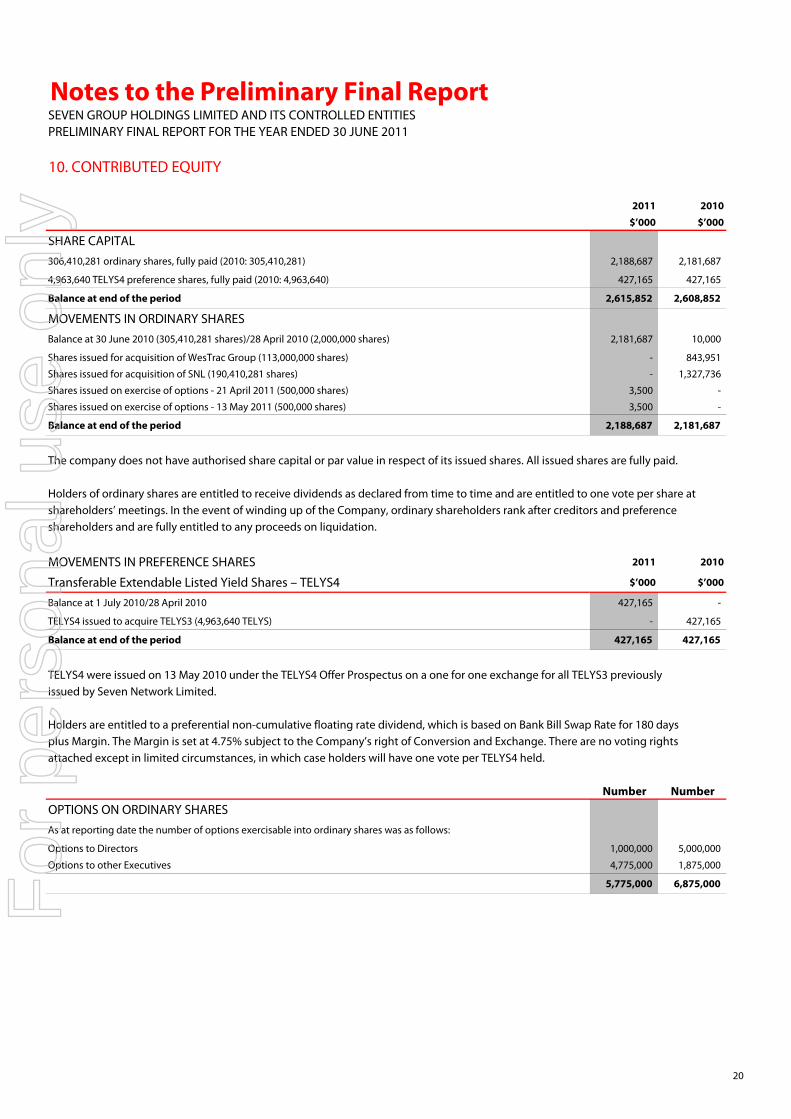
10. CONTRIBUTED EQUITY
2011 2010
$’000 $’000
SHARE CAPITAL306,410,281 ordinary shares, fully paid (2010: 305,410,281) 2,188,687 2,181,687
4,963,640 TELYS4 preference shares, fully paid (2010: 4,963,640) 427,165 427,165
Balance at end of the period 2,615,852 2,608,852
MOVEMENTS IN ORDINARY SHARESBalance at 30 June 2010 (305,410,281 shares)/28 April 2010 (2,000,000 shares) 2,181,687 10,000
Shares issued for acquisition of WesTrac Group (113,000,000 shares) - 843,951
Shares issued for acquisition of SNL (190,410,281 shares) - 1,327,736
Shares issued on exercise of options - 21 April 2011 (500,000 shares) 3,500 -
Shares issued on exercise of options - 13 May 2011 (500,000 shares) 3,500 -
Balance at end of the period 2,188,687 2,181,687
The company does not have authorised share capital or par value in respect of its issued shares. All issued shares are fully paid.
Holders of ordinary shares are entitled to receive dividends as declared from time to time and are entitled to one vote per share at shareholders’ meetings. In the event of winding up of the Company, ordinary shareholders rank after creditors and preference shareholders and are fully entitled to any proceeds on liquidation.
MOVEMENTS IN PREFERENCE SHARES 2011 2010
Transferable Extendable Listed Yield Shares – TELYS4 $’000 $’000
Balance at 1 July 2010/28 April 2010 427,165 -
TELYS4 issued to acquire TELYS3 (4,963,640 TELYS) - 427,165
Balance at end of the period 427,165 427,165
TELYS4 were issued on 13 May 2010 under the TELYS4 Offer Prospectus on a one for one exchange for all TELYS3 previously issued by Seven Network Limited.
Holders are entitled to a preferential non-cumulative floating rate dividend, which is based on Bank Bill Swap Rate for 180 days plus Margin. The Margin is set at 4.75% subject to the Company’s right of Conversion and Exchange. There are no voting rights attached except in limited circumstances, in which case holders will have one vote per TELYS4 held.
Number Number
OPTIONS ON ORDINARY SHARESAs at reporting date the number of options exercisable into ordinary shares was as follows:
Options to Directors 1,000,000 5,000,000
Options to other Executives 4,775,000 1,875,000
5,775,000 6,875,000
20
For
per
sona
l use
onl
y

Notes to the Preliminary Final ReportSEVEN GROUP HOLDINGS LIMITED AND ITS CONTROLLED ENTITIESPRELIMINARY FINAL REPORT FOR THE YEAR ENDED 30 JUNE 2011
11. RESERVESEmployee Foreign
equity Common Cash flow Fair currency
benefits control hedge value translation
reserve reserve reserve reserve reserve Total
YEAR ENDED 30 JUNE 2011 $’000 $’000 $’000 $’000 $’000 $’000
As at 1 July 2010 5,334 (642,586) 6,570 16,817 39,365 (574,500) Fair value movement on available-for-sale financial assets - - - 27,304 - 27,304
Tax effect of net loss on available-for-sale financial assets - - - 8,721 - 8,721
Impairment of available-for-sale financial asset - - - 2,910 - 2,910
reclassified to profit or loss
Net loss on cash flow hedges - - (20,997) - - (20,997)
Tax effect of net loss on cash flow hedges - - 3,502 - - 3,502
Movement in reserves of associates 734 - (1,163) - - (429)
Currency translation differences - - - - (163,036) (163,036)
Share based payment expense 1,718 - - - - 1,718
At 30 June 2011 7,786 (642,586) (12,088) 55,752 (123,671) (714,807)
Employee Foreign
equity Common Cash flow Fair currency
benefits control hedge value translation
reserve reserve reserve reserve reserve Total
PERIOD ENDED 30 JUNE 2010 $’000 $’000 $’000 $’000 $’000 $’000
On incorporation - - - - - - Acquisition of subsidiary - (642,586) - - - (642,586)
Fair value movement on available-for-sale financial assets - - - 24,024 - 24,024
Tax effect of net gain on available-for-sale financial assets - - - (7,207) - (7,207)
Net gain on cash flow hedges - - 8,923 - - 8,923
Tax effect of net gain on cash flow hedges - - (2,353) - - (2,353)
Currency translation differences - - - - 39,365 39,365
Share based payment expense 1,836 - - - - 1,836
Replacement of share options related to business 3,498 - - - - 3,498
combination
At 30 June 2010 5,334 (642,586) 6,570 16,817 39,365 (574,500)
Employee equity benefits reservesThis reserve is used to record the value of equity benefits provided to employees and Directors as part of their remuneration.
Common control reserveIn the prior period the acquisition of WesTrac Group by the Company was accounted for as a common control transaction. As aconsequence, the difference between the fair value of the consideration paid and the existing book values of assets and liabilitiesof the WesTrac Group were debited to a common control reserve. Upon disposal of all interests in WesTrac Group by the Group this reserve would be transferred to retained earnings.
Cash flow hedge reserveThis reserve records the effective portion of the cumulative net change in fair value of hedging instruments related to cash flowhedged transactions that have not yet occurred.
Fair value reserveThe fair value reserve comprises the cumulative net change in the fair value of available-for-sale financial assets until the investments are derecognised or impaired.
Foreign currency translation reserveThis reserve records the foreign currency differences arising from the translation of the financial statements of foreign operations.
21
For
per
sona
l use
onl
y
Notes to the Preliminary Final ReportSEVEN GROUP HOLDINGS LIMITED AND ITS CONTROLLED ENTITIESPRELIMINARY FINAL REPORT FOR THE YEAR ENDED 30 JUNE 2011
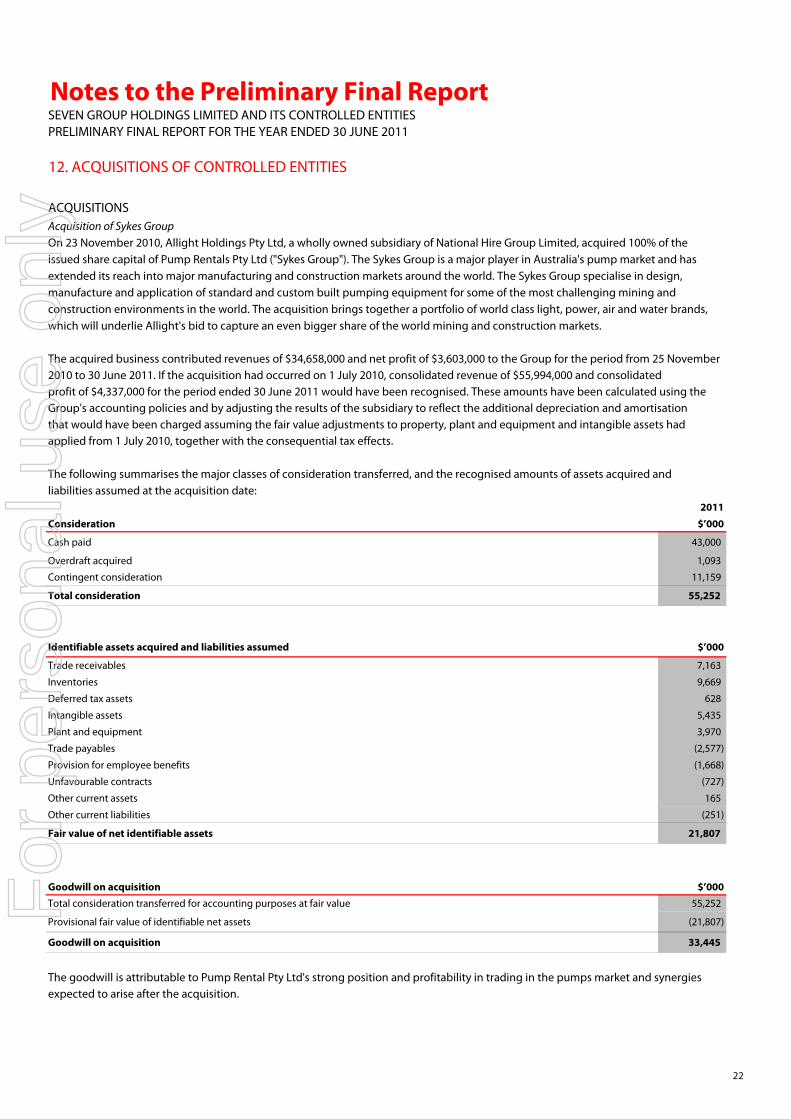
12. ACQUISITIONS OF CONTROLLED ENTITIES
ACQUISITIONSAcquisition of Sykes GroupOn 23 November 2010, Allight Holdings Pty Ltd, a wholly owned subsidiary of National Hire Group Limited, acquired 100% of the issued share capital of Pump Rentals Pty Ltd ("Sykes Group"). The Sykes Group is a major player in Australia's pump market and has extended its reach into major manufacturing and construction markets around the world. The Sykes Group specialise in design,manufacture and application of standard and custom built pumping equipment for some of the most challenging mining and construction environments in the world. The acquisition brings together a portfolio of world class light, power, air and water brands,which will underlie Allight's bid to capture an even bigger share of the world mining and construction markets.
The acquired business contributed revenues of $34,658,000 and net profit of $3,603,000 to the Group for the period from 25 November 2010 to 30 June 2011. If the acquisition had occurred on 1 July 2010, consolidated revenue of $55,994,000 and consolidated profit of $4,337,000 for the period ended 30 June 2011 would have been recognised. These amounts have been calculated using the Group's accounting policies and by adjusting the results of the subsidiary to reflect the additional depreciation and amortisation that would have been charged assuming the fair value adjustments to property, plant and equipment and intangible assets hadapplied from 1 July 2010, together with the consequential tax effects.
The following summarises the major classes of consideration transferred, and the recognised amounts of assets acquired and liabilities assumed at the acquisition date:
2011
Consideration $’000
Cash paid 43,000
Overdraft acquired 1,093
Contingent consideration 11,159
Total consideration 55,252
Identifiable assets acquired and liabilities assumed $’000
Trade receivables 7,163
Inventories 9,669
Deferred tax assets 628
Intangible assets 5,435
Plant and equipment 3,970
Trade payables (2,577)
Provision for employee benefits (1,668)
Unfavourable contracts (727)
Other current assets 165
Other current liabilities (251)
Fair value of net identifiable assets 21,807
Goodwill on acquisition $’000Total consideration transferred for accounting purposes at fair value 55,252
Provisional fair value of identifiable net assets (21,807)
Goodwill on acquisition 33,445
The goodwill is attributable to Pump Rental Pty Ltd's strong position and profitability in trading in the pumps market and synergiesexpected to arise after the acquisition.
22
For
per
sona
l use
onl
y
Notes to the Preliminary Final ReportSEVEN GROUP HOLDINGS LIMITED AND ITS CONTROLLED ENTITIESPRELIMINARY FINAL REPORT FOR THE YEAR ENDED 30 JUNE 2011
12. ACQUISITIONS OF CONTROLLED ENTITIES (CONTINUED)
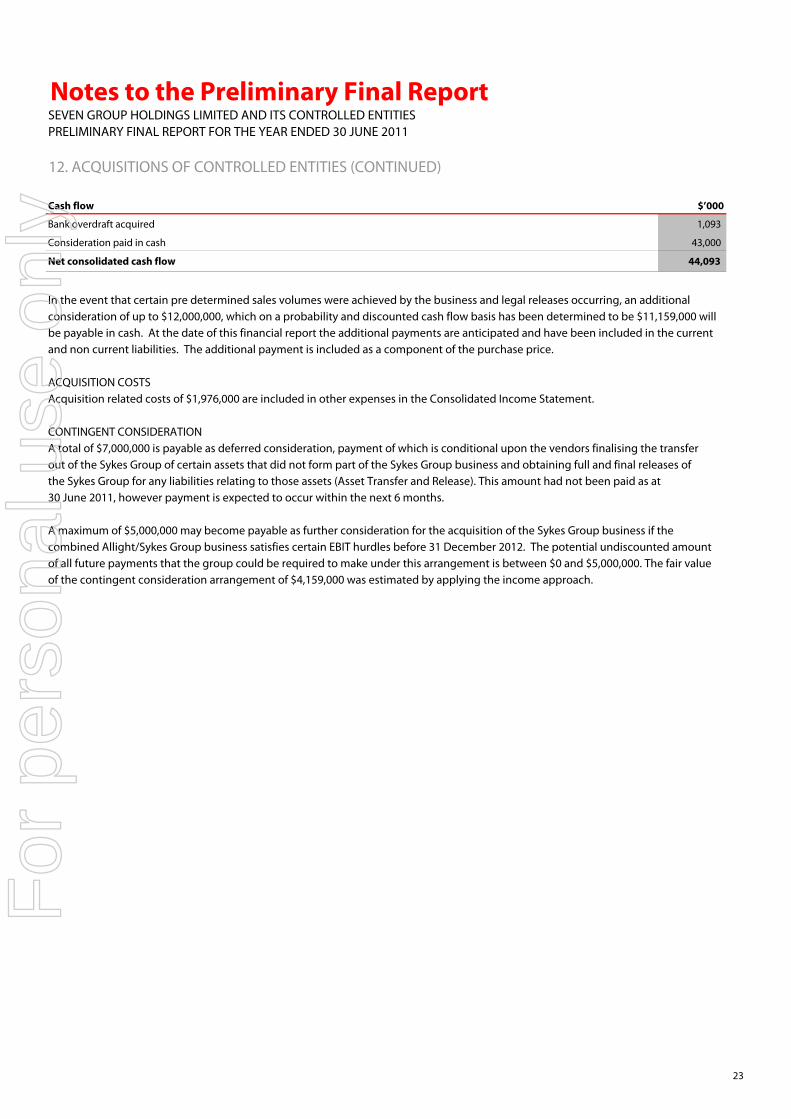
Cash flow $’000
Bank overdraft acquired 1,093
Consideration paid in cash 43,000
Net consolidated cash flow 44,093
In the event that certain pre determined sales volumes were achieved by the business and legal releases occurring, an additional consideration of up to $12,000,000, which on a probability and discounted cash flow basis has been determined to be $11,159,000 willbe payable in cash. At the date of this financial report the additional payments are anticipated and have been included in the currentand non current liabilities. The additional payment is included as a component of the purchase price.
ACQUISITION COSTSAcquisition related costs of $1,976,000 are included in other expenses in the Consolidated Income Statement.
CONTINGENT CONSIDERATIONA total of $7,000,000 is payable as deferred consideration, payment of which is conditional upon the vendors finalising the transferout of the Sykes Group of certain assets that did not form part of the Sykes Group business and obtaining full and final releases ofthe Sykes Group for any liabilities relating to those assets (Asset Transfer and Release). This amount had not been paid as at30 June 2011, however payment is expected to occur within the next 6 months.
A maximum of $5,000,000 may become payable as further consideration for the acquisition of the Sykes Group business if thecombined Allight/Sykes Group business satisfies certain EBIT hurdles before 31 December 2012. The potential undiscounted amountof all future payments that the group could be required to make under this arrangement is between $0 and $5,000,000. The fair valueof the contingent consideration arrangement of $4,159,000 was estimated by applying the income approach.
23
For
per
sona
l use
onl
y
Notes to the Preliminary Final ReportSEVEN GROUP HOLDINGS LIMITED AND ITS CONTROLLED ENTITIESPRELIMINARY FINAL REPORT FOR THE YEAR ENDED 30 JUNE 2011
12. ACQUISITIONS OF CONTROLLED ENTITIES (CONTINUED)
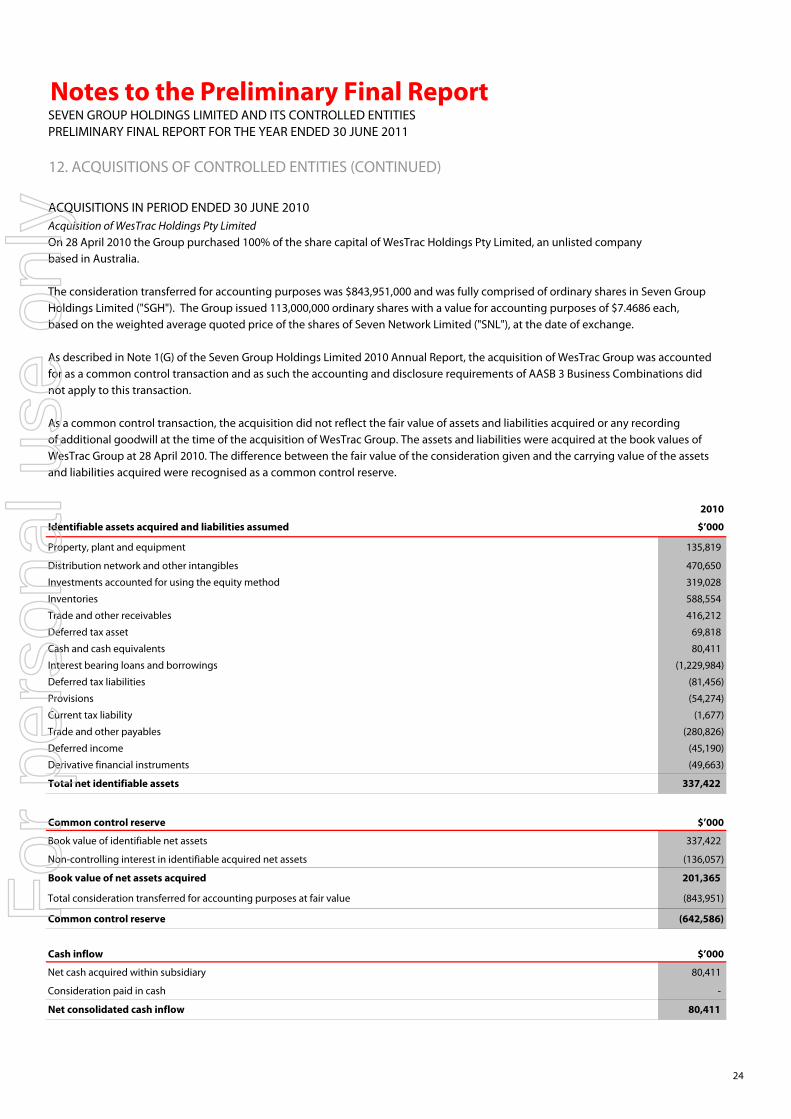
ACQUISITIONS IN PERIOD ENDED 30 JUNE 2010Acquisition of WesTrac Holdings Pty LimitedOn 28 April 2010 the Group purchased 100% of the share capital of WesTrac Holdings Pty Limited, an unlisted company based in Australia.
The consideration transferred for accounting purposes was $843,951,000 and was fully comprised of ordinary shares in Seven Group Holdings Limited ("SGH"). The Group issued 113,000,000 ordinary shares with a value for accounting purposes of $7.4686 each, based on the weighted average quoted price of the shares of Seven Network Limited ("SNL"), at the date of exchange.
As described in Note 1(G) of the Seven Group Holdings Limited 2010 Annual Report, the acquisition of WesTrac Group was accounted for as a common control transaction and as such the accounting and disclosure requirements of AASB 3 Business Combinations didnot apply to this transaction.
As a common control transaction, the acquisition did not reflect the fair value of assets and liabilities acquired or any recording of additional goodwill at the time of the acquisition of WesTrac Group. The assets and liabilities were acquired at the book values of WesTrac Group at 28 April 2010. The difference between the fair value of the consideration given and the carrying value of the assets and liabilities acquired were recognised as a common control reserve.
2010
Identifiable assets acquired and liabilities assumed $’000
Property, plant and equipment 135,819
Distribution network and other intangibles 470,650
Investments accounted for using the equity method 319,028
Inventories 588,554
Trade and other receivables 416,212
Deferred tax asset 69,818
Cash and cash equivalents 80,411
Interest bearing loans and borrowings (1,229,984)
Deferred tax liabilities (81,456)
Provisions (54,274)
Current tax liability (1,677)
Trade and other payables (280,826)
Deferred income (45,190)
Derivative financial instruments (49,663)
Total net identifiable assets 337,422
Common control reserve $’000
Book value of identifiable net assets 337,422
Non-controlling interest in identifiable acquired net assets (136,057)
Book value of net assets acquired 201,365
Total consideration transferred for accounting purposes at fair value (843,951)
Common control reserve (642,586)
Cash inflow $’000
Net cash acquired within subsidiary 80,411
Consideration paid in cash -
Net consolidated cash inflow 80,411
24
For
per
sona
l use
onl
y
Notes to the Preliminary Final ReportSEVEN GROUP HOLDINGS LIMITED AND ITS CONTROLLED ENTITIESPRELIMINARY FINAL REPORT FOR THE YEAR ENDED 30 JUNE 2011
12. ACQUISITIONS OF CONTROLLED ENTITIES (CONTINUED)
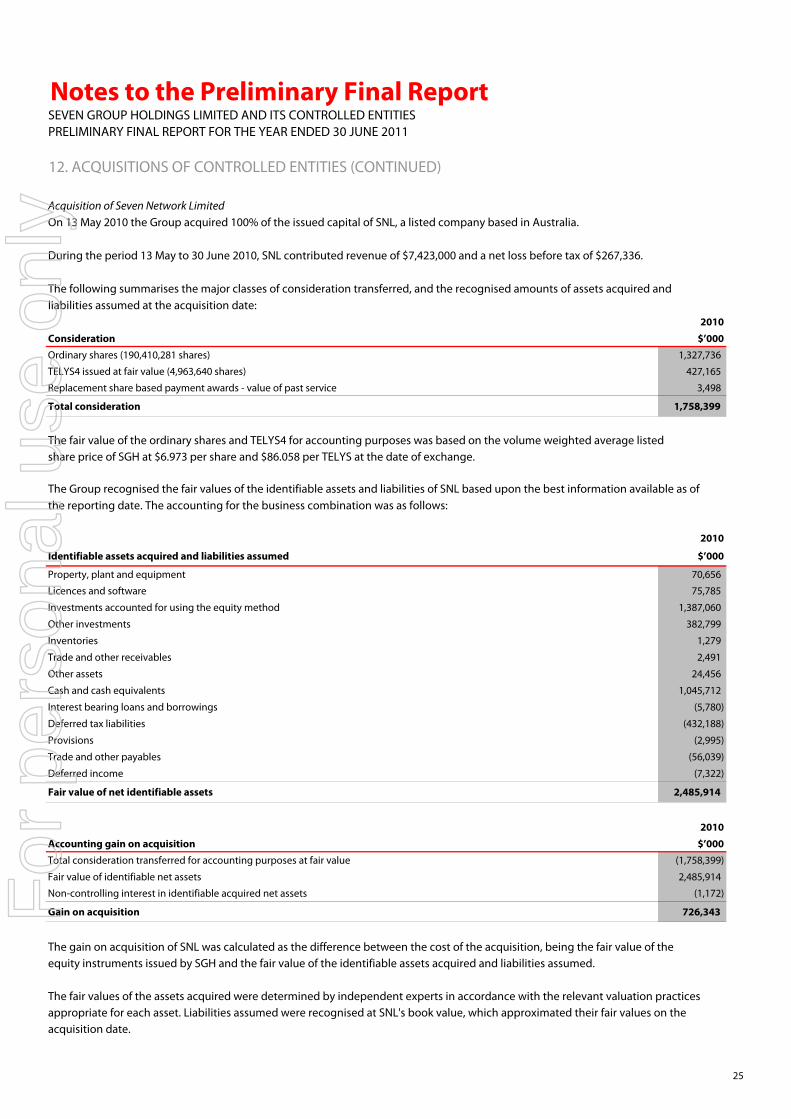
Acquisition of Seven Network LimitedOn 13 May 2010 the Group acquired 100% of the issued capital of SNL, a listed company based in Australia.
During the period 13 May to 30 June 2010, SNL contributed revenue of $7,423,000 and a net loss before tax of $267,336.
The following summarises the major classes of consideration transferred, and the recognised amounts of assets acquired and liabilities assumed at the acquisition date:
2010
Consideration $’000Ordinary shares (190,410,281 shares) 1,327,736
TELYS4 issued at fair value (4,963,640 shares) 427,165
Replacement share based payment awards - value of past service 3,498
Total consideration 1,758,399
The fair value of the ordinary shares and TELYS4 for accounting purposes was based on the volume weighted average listed share price of SGH at $6.973 per share and $86.058 per TELYS at the date of exchange.
The Group recognised the fair values of the identifiable assets and liabilities of SNL based upon the best information available as of the reporting date. The accounting for the business combination was as follows:
2010
Identifiable assets acquired and liabilities assumed $’000
Property, plant and equipment 70,656
Licences and software 75,785
Investments accounted for using the equity method 1,387,060
Other investments 382,799
Inventories 1,279
Trade and other receivables 2,491
Other assets 24,456
Cash and cash equivalents 1,045,712
Interest bearing loans and borrowings (5,780)
Deferred tax liabilities (432,188)
Provisions (2,995)
Trade and other payables (56,039)
Deferred income (7,322)
Fair value of net identifiable assets 2,485,914
2010
Accounting gain on acquisition $’000Total consideration transferred for accounting purposes at fair value (1,758,399)
Fair value of identifiable net assets 2,485,914
Non-controlling interest in identifiable acquired net assets (1,172)
Gain on acquisition 726,343
The gain on acquisition of SNL was calculated as the difference between the cost of the acquisition, being the fair value of the equity instruments issued by SGH and the fair value of the identifiable assets acquired and liabilities assumed.
The fair values of the assets acquired were determined by independent experts in accordance with the relevant valuation practicesappropriate for each asset. Liabilities assumed were recognised at SNL's book value, which approximated their fair values on the acquisition date.
25
For
per
sona
l use
onl
y
Notes to the Preliminary Final ReportSEVEN GROUP HOLDINGS LIMITED AND ITS CONTROLLED ENTITIESPRELIMINARY FINAL REPORT FOR THE YEAR ENDED 30 JUNE 2011
12. ACQUISITIONS OF CONTROLLED ENTITIES (CONTINUED)
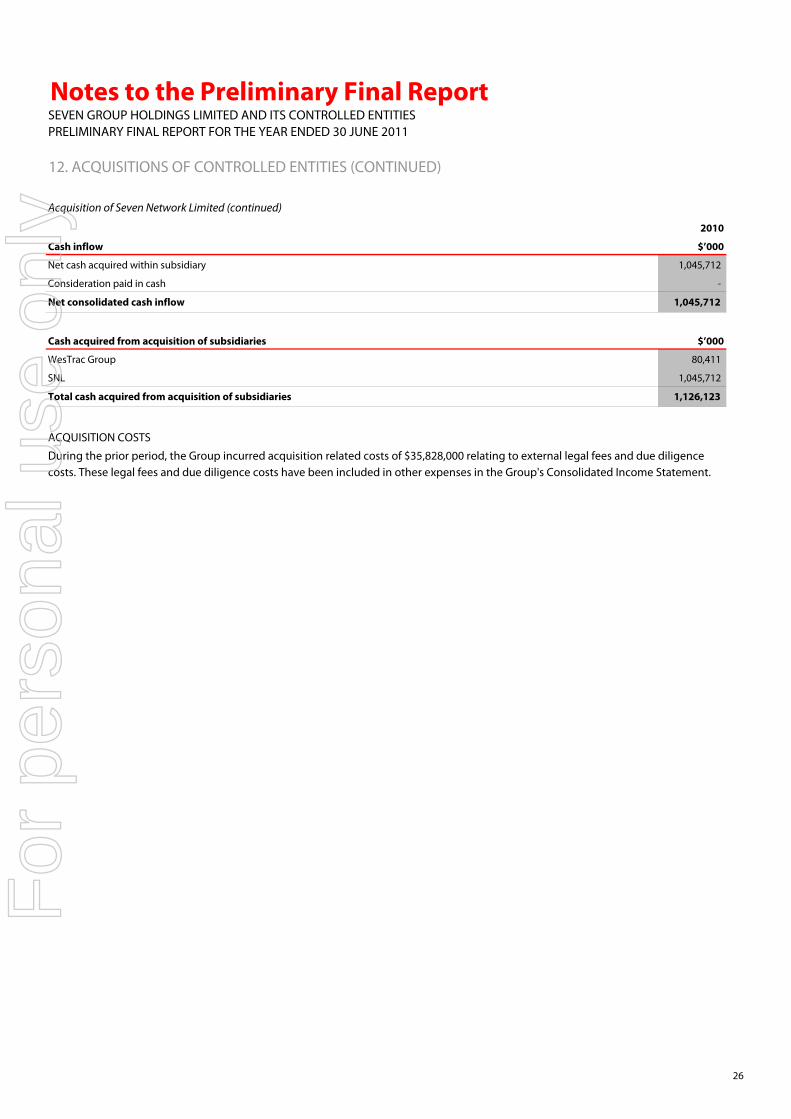
Acquisition of Seven Network Limited (continued)
2010
Cash inflow $’000
Net cash acquired within subsidiary 1,045,712
Consideration paid in cash -
Net consolidated cash inflow 1,045,712
Cash acquired from acquisition of subsidiaries $’000
WesTrac Group 80,411
SNL 1,045,712
Total cash acquired from acquisition of subsidiaries 1,126,123
ACQUISITION COSTS
During the prior period, the Group incurred acquisition related costs of $35,828,000 relating to external legal fees and due diligencecosts. These legal fees and due diligence costs have been included in other expenses in the Group's Consolidated Income Statement.
26
For
per
sona
l use
onl
y

Notes to the Preliminary Final ReportSEVEN GROUP HOLDINGS LIMITED AND ITS CONTROLLED ENTITIESPRELIMINARY FINAL REPORT FOR THE YEAR ENDED 30 JUNE 2011
13. COMMITMENTS
2011 2010
$’000 $’000
Capital expenditure commitments
Payable:
Not later than one year 23,261 26,543
Finance lease commitments
Payable:
Not later than one year 1,368 889
Later than one year but not later than five years 1,800 1,686
Later than five years 1,685 2,081
Minimum lease payments (a) 4,853 4,656
Less future finance charges (2,787) (2,361)
2,066 2,295
Operating lease commitments (b)
Payable:
Not later than one year 48,353 37,563
Later than one year but not later than five years 199,673 102,237
Later than five years 237,900 95,517
485,926 235,317
Other operating commitments (c)
Payable:
Not later than one year 6,710 7,089
Later than one year but not later than five years 2,465 7,468
9,175 14,557
Other commitments (d)
Payable:
Not later than one year - 292,860
- 292,860
(a) Minimum future lease payments include the aggregate of all lease payments and any guaranteed residual value.
(b) The Group leases various offices and sites under non-cancellable operating leases. The leases have varying terms, escalation
clauses and renewal rights. On renewal, the terms of the leases are renegotiated.
(c) Other operating commitments includes commitments for operating expenses and acquisitions of inventory contracted for at the
reporting date but not recognised as liabilities.
(d) Other commitments in the prior period related to the Group's contractual obligation to invest in Agricultural Bank of China.
This commitment was settled in July 2010.
27
For
per
sona
l use
onl
y

Notes to the Preliminary Final ReportSEVEN GROUP HOLDINGS LIMITED AND ITS CONTROLLED ENTITIESPRELIMINARY FINAL REPORT FOR THE YEAR ENDED 30 JUNE 2011
14a. CASH AND CASH EQUIVALENTS
2011 2010Note $’000 $’000
Bank balances 62,145 126,404
Call deposits 9,000 328,801
Cash and cash equivalents 71,145 455,205 Bank overdrafts used for cash management purposes 9 (5,901) (5,534)
Cash and cash equivalents in the cash flow statement 65,244 449,671
14b. NOTES TO THE CASH FLOW STATEMENT
2011 2010
$’000 $’000
Reconciliation of profit for the period to net cash flows related to
operating activities:
Profit after tax 79,913 718,742
Depreciation and amortisation:
Property, plant and equipment 52,540 8,733
Intangible assets 15,230 3,004
Other 156 26
Accounting gain on acquisition of Seven Network Limited - (726,343)
Transaction costs associated with acquisition of WesTrac Group & Seven Network Limited - 35,249
Transaction costs associated with acquisition of Sykes Group 1,976 -
Share option expense 1,718 -
Gain on sale of investments and equity accounted investees (58,679) -
Gain on sale of non-current assets (481) -
Impairment of non-current assets 18,701 -
Impairment of equity accounted investees 305,648 -
Fair value movement of derivatives 5,374 -
Share of results from equity accounted investees (143,588) (14,266)
Dividends received from associates 33,157 -
Foreign exchange loss (349) 1,568
Other 4,966 7,606
Movement in:
Trade and other receivables (130,806) (2,742)
Inventories (358,445) (112,267)
Other assets (4,366) (23,879)
Trade and other payables 254,230 33,484
Provisions 8,008 1,517
Tax balances (113,777) 27,406
Net operating cash flows (28,874) (42,162)
NON CASH INVESTING AND FINANCING ACTIVITIES
Acquisition of WesTrac Group via issue of equity instruments - 843,951
Acquisition of SNL via issue of equity instruments - 1,754,901
Acquisition of equity accounted investees - dividend reinvestment plan 13,364 -
Total non cash investing and financing activities 13,364 2,598,852
28
For
per
sona
l use
onl
y
Notes to the Preliminary Final ReportSEVEN GROUP HOLDINGS LIMITED AND ITS CONTROLLED ENTITIESPRELIMINARY FINAL REPORT FOR THE YEAR ENDED 30 JUNE 2011
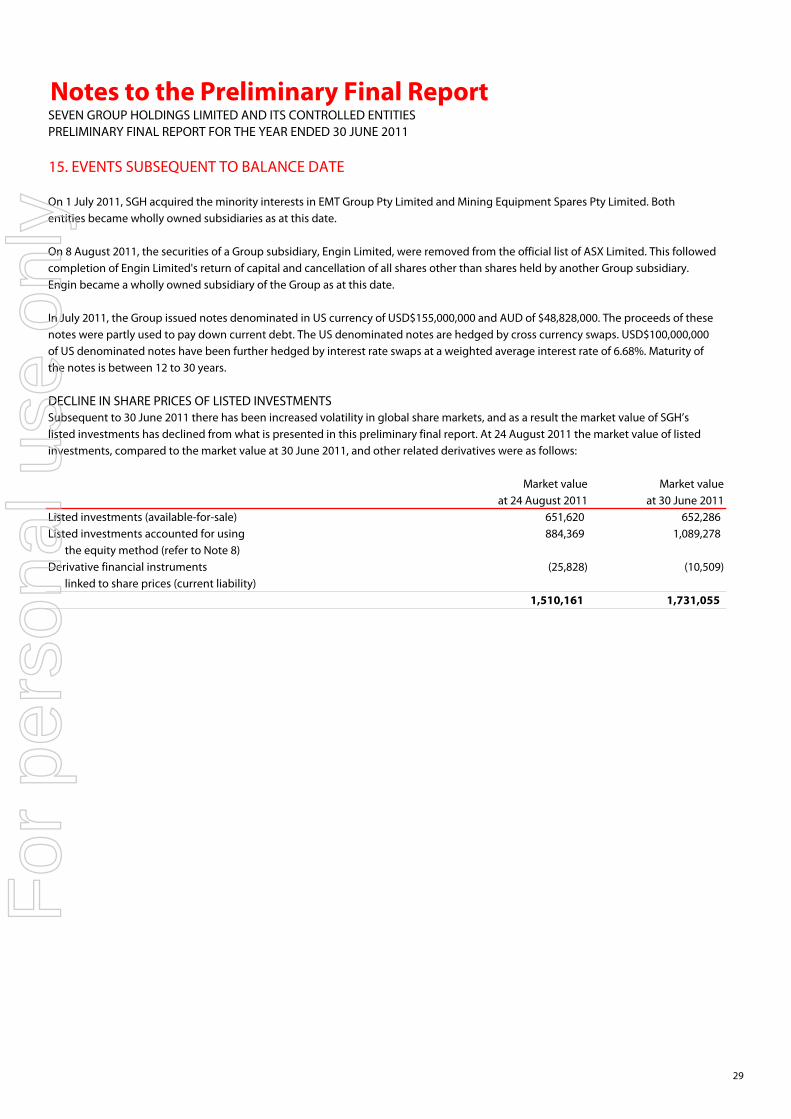
15. EVENTS SUBSEQUENT TO BALANCE DATE
On 1 July 2011, SGH acquired the minority interests in EMT Group Pty Limited and Mining Equipment Spares Pty Limited. Bothentities became wholly owned subsidiaries as at this date. On 8 August 2011, the securities of a Group subsidiary, Engin Limited, were removed from the official list of ASX Limited. This followedcompletion of Engin Limited's return of capital and cancellation of all shares other than shares held by another Group subsidiary.Engin became a wholly owned subsidiary of the Group as at this date.
In July 2011, the Group issued notes denominated in US currency of USD$155,000,000 and AUD of $48,828,000. The proceeds of these notes were partly used to pay down current debt. The US denominated notes are hedged by cross currency swaps. USD$100,000,000 of US denominated notes have been further hedged by interest rate swaps at a weighted average interest rate of 6.68%. Maturity ofthe notes is between 12 to 30 years.
DECLINE IN SHARE PRICES OF LISTED INVESTMENTSSubsequent to 30 June 2011 there has been increased volatility in global share markets, and as a result the market value of SGH’slisted investments has declined from what is presented in this preliminary final report. At 24 August 2011 the market value of listedinvestments, compared to the market value at 30 June 2011, and other related derivatives were as follows:
Market value Market valueat 24 August 2011 at 30 June 2011
Listed investments (available-for-sale) 651,620 652,286 Listed investments accounted for using 884,369 1,089,278
the equity method (refer to Note 8)Derivative financial instruments (25,828) (10,509)
linked to share prices (current liability)1,510,161 1,731,055
29
For
per
sona
l use
onl
y

Notes to the Preliminary Final ReportSEVEN GROUP HOLDINGS LIMITED AND ITS CONTROLLED ENTITIESPRELIMINARY FINAL REPORT FOR THE YEAR ENDED 30 JUNE 2011
AUDIT
This report is based on accounts which are in the process of being audited.
Warren CoatsworthCompany Secretary Date: 25 August 2011
30
For
per
sona
l use
onl
y
Seven Group Holdings Limited | ABN 46 142 003 469 38-42 Pirrama Road | Pyrmont NSW 2009 Australia | Postal Address: PO Box 777 | Pyrmont NSW 2009 Australia
Telephone +61 2 8777 7777 | Facsimile +61 2 8777 7192
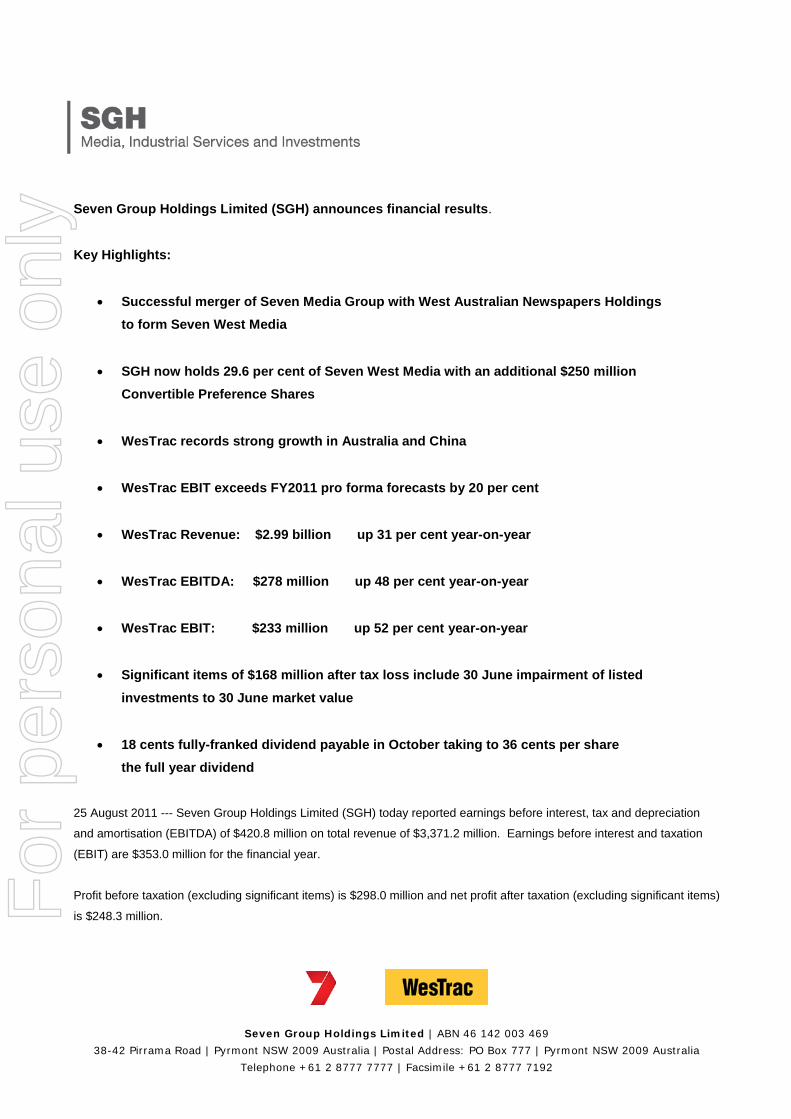
Seven Group Holdings Limited (SGH) announces financial results.
Key Highlights:
• Successful merger of Seven Media Group with West Australian Newspapers Holdings to form Seven West Media
• SGH now holds 29.6 per cent of Seven West Media with an additional $250 million Convertible Preference Shares
• WesTrac records strong growth in Australia and China
• WesTrac EBIT exceeds FY2011 pro forma forecasts by 20 per cent
• WesTrac Revenue: $2.99 billion up 31 per cent year-on-year
• WesTrac EBITDA: $278 million up 48 per cent year-on-year
• WesTrac EBIT: $233 million up 52 per cent year-on-year
• Significant items of $168 million after tax loss include 30 June impairment of listed investments to 30 June market value
• 18 cents fully-franked dividend payable in October taking to 36 cents per share the full year dividend
25 August 2011 --- Seven Group Holdings Limited (SGH) today reported earnings before interest, tax and depreciation
and amortisation (EBITDA) of $420.8 million on total revenue of $3,371.2 million. Earnings before interest and taxation
(EBIT) are $353.0 million for the financial year.
Profit before taxation (excluding significant items) is $298.0 million and net profit after taxation (excluding significant items)
is $248.3 million. For
per
sona
l use
onl
y

2
The result was underpinned by total trading revenue of $3,162.8 million, being 31 per cent higher than the pro forma
2010 result. The result was driven by SGH’s strongly performing core businesses: WesTrac and National Hire.
Seven West Media was formed following West Australian Newspapers Holdings shareholder approval for that
company to acquire Seven Media Group from SGH and KKR and create Seven West Media. SGH has a 29.6 per
cent shareholding in Seven West Media, now one of the largest media companies listed on the Australian Securities
Exchange.
Today’s result reflects SGH’s sale of its shareholding in Seven Media Group to West Australian Newspapers earlier
this year, and the writing down of investments, including Seven West Media and Consolidated Media Holdings, to
reflect share prices of both companies at 30 June 2011. Significant items total a $168.4 million loss net of tax.
EBITDA represents profit before net finance costs and taxation, excluding depreciation, amortisation, impairment
and gains on sale of investments.
Financial Results
Results for year
ended 30 June 2011 Reported profit before tax $32.4m Reported profit after tax $79.9m Statutory EPS 12 cents Final Dividend per Ordinary Share 18 cents Profit before tax (excluding significant items) $298.0m Profit after tax (excluding significant items) $248.3m EPS (excluding significant items) 67 cents
Twelve month pro forma results
Results for year
ended 30 June 2011
Pro forma year
ended 30 June 2010 Total revenue & other income $3,371.2m $2,498.3m EBITDA (excluding significant items) $420.8m $246.2m EBIT (excluding significant items $353.0m $181.2m Profit before tax (excluding significant items) $298.0m $147.7m Net Profit after tax (excluding significant items) $248.3m N/A
The company reports a profit before taxation of $32.4 million and a net profit after taxation of $79.9 million with profit
attributable to shareholders of SGH of $70.4 million.
Meaningful corresponding comparisons on earnings are difficult due to changes in the company’s structure resulting
from the one-off effects of both the SGH merger and the recent Seven West Media transaction.
For
per
sona
l use
onl
y

3
Excluding National Hire, SGH delivered annual revenue and other income of $3,212.7 million, up 10 per cent on the
pro forma 2011 number contained in the merger scheme documentation for the formation of SGH. SGH recorded
EBITDA of $387.2 million, up 24 per cent, EBIT of $321.4 million, up 35 per cent, and net profit after taxation
excluding significant items of $221.7 million, up 18 per cent on the forecast 2011 merger scheme documentation
respectively.
Net profit after taxation and significant items is $79.9 million.
SGH has net assets of $2,681.9 million, including a listed securities portfolio of $652.3 million, excluding Seven West
Media and Consolidated Media Holdings, and $522.4 million in available undrawn facilities at 30 June 2011.
In addition to its 29.6 per cent shareholding in Seven West Media, Seven Group Holdings retains its current
24.4 per cent shareholding in Consolidated Media Holdings (which owns 25 per cent of Foxtel and 50 per cent of
Premier Media Group), 100 per cent of industrial equipment business, WesTrac, and 66.2 per cent of National Hire
Limited (which owns 46.2 per cent of Coates Hire).
Dividend
A final dividend of 18 cents per share (fully franked) has been declared – taking the total dividend for the 2010-2011
financial year to 36 cents fully franked on ordinary shares.
Review of Operations
WesTrac
WesTrac has out-performed on all key measurements outlined in the merger scheme documents for the
formation of SGH.
WesTrac (excluding National Hire) delivered an EBITDA of $278.6 million and EBIT of $233.4 million on
revenue and other income of $2,989.5 million across the financial year. The strong performance saw revenues
up 31 per cent, EBITDA up 48 per cent and EBIT up 52 per cent on the pro forma 2010 result.
In Australia, the company delivered revenue and other income of $2,256 million – up $620.5 million on the 2010
pro-forma result. EBITDA was $244.1 million – up 50 per cent on the pro forma 2010 result.
The company’s growth in Australia is being driven by expansion in coal and iron ore mining – with a 48 per cent
growth in product sales to $1,232.3 million. The company has also delivered $1,012.9 million in product
support revenues – 26 per cent up the pro forma 2010 result.
For
per
sona
l use
onl
y
4
The strong performance sees a strengthening in WesTrac Australia’s EBITDA and EBIT margins over the past
twelve months.
While WesTrac China continues to see significant growth driven by high margin sales, the reported
performance is impacted by changes in the Australian and US Dollar exchange rate. The company has
delivered on revenue, EBITDA and EBIT targets outlined in the merger scheme documentation.
In China, the company delivered an EBITDA of $34.5 million on revenue and other income of $733.5 million.
The 2011 result for China has been impacted by the strong Australian Dollar, however revenue and other
income increased by 13 per cent and EBITDA increased by 36 per cent on the pro forma 2010 result.
National Hire Group
SGH has a 66.2 per cent shareholding in National Hire Group. National Hire Group has reported NPAT of
$26.5 million for the twelve months to June 2011. This includes a $22.8 million share of profit from equity
accounted investments (Coates Group). Coates Group delivered revenues of $1,064 million, up 20 per cent
on the prior corresponding period. National Hire delivered revenues of $133.5 million – up 57 per cent on the
previous financial year.
Media Investments
Seven West Media
SGH’s share of Seven Media Group and West Australian Newspapers results are included up to 11 April 2011
with results incorporated into Seven West Media after that date at the new ownership level. SGH has a
29.6 per cent shareholding in Seven West Media.
Seven West Media has reported a group profit after taxation of $115.1 million and a pro forma EBITDA
of $617.5 million – delivering at the upper end of market guidance for EBITDA issued in May 2011. EBITDA is
up 12 per cent and EBIT is up 14 per cent on a 4 per cent increase in revenues on the pro forma pcp provided
in the documentation for West Australian Newspapers Holdings acquisition of Seven Media Group.
Seven West Media’s television business, the Seven Network, delivered 23 per cent growth in EBITDA,
magazine publishing business, Pacific Magazines, delivered 0.9 per cent growth in EBITDA in a challenging
market and the company’s online business, Yahoo!7, delivered 14.4 per cent growth in EBITDA.
West Australian Newspapers’ EBITDA was slightly down on the 2009-2010 financial year. For
per
sona
l use
onl
y

5
More Australians watch Seven than any other television network. Seven is the most-watched network for total
viewers, 16-39s, 18-49s and 25-54s in primetime on primary channels across the current television year.
7TWO is the most-watched digital channel for total viewers and its people 25+ target audience and 7mate is
the most-watched digital channel in its men 16-54 target audience. Seven continues to lead the market in
television advertising revenue. Recent industry figures put Seven’s share of the advertising revenue market at
37.6 per cent.
West Australian Newspapers delivered a strong performance despite a challenging market. The West
Australian has increased its total readership by 1.3 per cent over the past twelve months consolidating its
circulation in a challenging market. Consolidated advertising revenues are up 0.5 per cent on the previous
financial year – with strong growth recorded for the company’s radio and regional newspaper businesses.
Over the past twelve months, Seven West Media’s magazine publishing business, Pacific Magazines, has
secured the largest circulation share increase of any Australian magazine publishing company. It is the only
major publishing company to increase advertising share – up from 26.2 per cent in 2009-2010 to 28.0 per cent
in 2010-2011.
Seven West Media’s online and new media presence through Yahoo!7, a joint venture with Yahoo! Inc
continues its strong momentum, delivering an EBITDA margin of 39.2 per cent over the past twelve months.
EBITDA is up 14.0 per cent on the 2009-2010 financial year.
Consolidated Media Holdings
SGH’s current shareholding in Consolidated Media Holdings is 24 per cent. Consolidated Media owns 50 per
cent of subscription television programming company, The Premier Media Group, which owns and operates
Fox Sports, Fox Sports News, Speed, Fuel TV and the How To Channel as well as 25 per cent of pay television
company Foxtel. Consolidated Media Holdings has reported NPAT of $101.7 million.
Investments
Agricultural Bank of China
The company’s future development in China is underlined by a memorandum of understanding and an
investment agreement with the Agricultural Bank of China, one of the four biggest national banks in China –
with SGH one of a number of cornerstone investors in the bank’s successful initial public offering in Hong Kong
and Shanghai. As part of the investment agreement, WesTrac invested $293 million as a cornerstone investor
in the Agricultural Bank of China initial public offering in July 2010. The investment has a carrying value at 30
June 2011 of $297.8 million.
For
per
sona
l use
onl
y
6
Vividwireless
vividwireless’ first phase of development in Perth was successfully launched as the first 4G network in
Australia, providing high-speed and affordable wireless broadband, and the company has now completed the
next stage in its development with a phased rollout of its business with metropolitan networks in Sydney,
Melbourne, Canberra, Adelaide and Brisbane. Vividwireless’s trials of new TD-LTE technology are achieving
download speeds in excess of 100Mbps.
Listed Investment Portfolio
SGH’s listed portfolio is an important pool of liquidity available to the group, invested in high yielding listed
securities providing income and franking credits.
*Note:
Included in this presentation is data prepared for management of Seven Group Holdings and other associated entities and
investments. This data is included for information purposes only and has not been subject to the same level of review by the
company as the statutory accounts and so is merely provided for indicative purposes. The company and its employees do not
warrant the data and disclaim any liability flowing from the use of this data by any party.
For
per
sona
l use
onl
y