Australian Gambling Statistics
820
Australian Gambling Statistics 1993–94 to 2018–19 36th edition
Transcript of Australian Gambling Statistics

Australian Gambling Statistics 1993–94 to 2018–19
36th edition

Australian Gambling Statistics, 1993–94 to 2018–19 36th edition Explanatory Notes Released April, 2021 Prepared by Queensland Government Statistician's Office, Queensland Treasury ISSN: 1833-6337 The cooperation of all Australian state and territory governments is gratefully acknowledged. Queensland Government Statistician's Office www.qgso.qld.gov.au Disclaimer While great care has been taken in the preparation of this publication and each Australian state and territory has been asked to verify its own data in detail, it is nevertheless necessary to caution users concerning the complete accuracy of all data. No warranty is given as to the correctness or completeness of the information in this publication. The State of Queensland and each Australian state and territory expressly disclaim all and any liability (including all liability from or attributable to any negligent or wrongful act or omission) to any persons whatsoever in respect of anything done or omitted to be done by any such person in reliance, whether in whole or in part, upon any of the material in this publication. Licence This document is licensed under a Creative Commons Attribution 4.0 International licence. You are free to copy, communicate and adapt the work, as long as you attribute the authors.
© The State of Queensland (Queensland Treasury) 2021 To view a copy of this licence, visit http://creativecommons.org/licenses/by/4.0/ To attribute this work, cite Queensland Government Statistician's Office, Queensland Treasury, Australian Gambling Statistics, Explanatory notes, 36th edition, 2021.

Australian Gambling Statistics 1993–94 to 2018–19, 36th edition
Contents
PART 1: EXPLANATORY NOTES ............................................................................................... iv
1.1 Introduction ........................................................................................................................... 1
1.2 Scope of the publication ....................................................................................................... 1
1.3 Background .......................................................................................................................... 1
1.4 Glossary ............................................................................................................................... 2
1.5 Overview of gambling data .................................................................................................. 6
1.6 Notes on data specific to each state and territory ................................................................ 8
1.6.1 New South Wales ...................................................................................................... 8
1.6.2 Victoria .................................................................................................................... 11
1.6.3 Queensland ............................................................................................................. 13
1.6.4 South Australia ........................................................................................................ 14
1.6.5 Western Australia .................................................................................................... 17
1.6.6 Tasmania ................................................................................................................. 19
1.6.7 Australian Capital Territory ...................................................................................... 21
1.6.8 Northern Territory .................................................................................................... 23
1.7 Cautionary note .................................................................................................................. 24
PART 2: LIST OF TABLES ......................................................................................................... 25
2.1 Summary tables .................................................................................................................. 26
2.2 Tables by state ................................................................................................................... 26
2.3 Tables by gambling product ............................................................................................... 38

Australian Gambling Statistics 1993–94 to 2018–19, 36th edition
PART 1: EXPLANATORY NOTES

Australian Gambling Statistics 1993–94 to 2018–19, 36th edition
1
1.1 Introduction Australian Gambling Statistics (AGS) is the official collection of Australian data on legalised regulated gambling for which accurate figures are available. This publication is produced by the Queensland Government Statistician’s Office (QGSO) in cooperation with all state and territory governments. QGSO is a part of Queensland Treasury and is the principal demographic and social statistics research agency for the Queensland Government.
1.2 Scope of the publication The 36th edition of AGS updates data for the financial years 1993–94 to 2018–19. The publication comprises statistics on turnover, expenditure and government revenue from gambling activities conducted in Australian states and territories. It is important to note that the statistics for each individual state or territory include turnover and expenditure generated by overseas and interstate visitors as well as those generated by residents of that state or territory.
All dollar figures are given in nominal terms except where a table is denoted as being in real terms. See Glossary item ‘Consumer Price Index (CPI)’ for an explanation of how real dollar figures are calculated for this publication.
1.3 Background The development of a database of statistics on gambling on a national basis was formally proposed at the June 1983 Conference of Government Racing Officials held in Darwin. The conference agreed to draw attention to the relative absence of reliable economic and social data on gambling, and resolved that this information be collected, collated and shared on a national basis.
Led by the existing statistical collections of the (then) Tasmanian Racing and Gaming Commission, it was recommended that the racing and gaming administrations of other state and territory governments develop their own statistical base to assist in the development of a national gambling statistical record.
At the September 1983 Racing and Gaming Ministers’ Conference held in Melbourne, it was resolved:
That the Conference approve the establishment of a National Statistical Data Bank and each state and territory agree to submit all available racing and gaming statistics in a consistent format to the Tasmanian Racing and Gaming Commission for collation and analysis. A report is to be presented detailing the data to each Minister. A review of the effectiveness of this service will be undertaken at the next Racing and Gaming Ministers’ Conference.
In line with the conference resolution the Commission, with the assistance of a firm of economic consultants, extracted from published records a significant quantity of data relating to gambling turnover in each state and territory since 1972. This information was circulated to each state and territory for the purposes of correction and the addition of data that were not readily obtainable from available sources.
The first consolidation and assessment of these data was produced for the Racing and Gaming Ministers’ Conference in late 1984. At the Commission’s request, it was subsequently approved that the report be made publicly available. The Tasmanian Gaming Commission continued to produce annual statistics until 2004, when QGSO (formerly the Office of Economic and Statistical Research), within Queensland Treasury, was endorsed by jurisdictional CEOs to produce the publication on an ongoing basis.

Australian Gambling Statistics 1993–94 to 2018–19, 36th edition
2
1.4 Glossary Bookmakers off-course: These figures relate to the amount wagered via off-course bookmakers. In Tasmania, it represents the figure for sports betting or amounts wagered on events other than horse racing or greyhound racing.
Bookmakers on-course: These figures relate to the amount wagered via bookmakers at the race track on both horse and greyhound racing. A player can wager any amount above a set minimum and will receive the bookmaker’s odds at the time of making the wager. Those odds stand, irrespective of whether the bookmaker alters the odds at a later time. Bookmakers are licensed in each jurisdiction. In the Northern Territory, off-course bookmaker racing is included in this category.
Casino gaming: The various figures reported under this heading represent wagers at casinos and include wagers on table games, gaming machines and keno systems.
Casino turnover: The casino turnover figure is a combination of handle and turnover. Turnover is the amount wagered on a gambling activity whereas handle is a term used to describe the amount of money exchanged for gaming chips at a gaming table. It is difficult, if not impossible, to record the amount of each wager made on a table game. Therefore, it is difficult to report casino turnover accurately. Hence, the only amount that can be reported for table games is handle. Readers are therefore urged to use casino turnover figures with care.
Consumer Price Index (CPI): The CPI is a measure of change over time in the retail price of a constant basket of goods and services which is representative of consumption patterns of employee households in metropolitan areas.
Table 1 Consumer Price Index(a), 1993–94 to 2018–19
Year Consumer price index Inflation rate (%) Deflator factor
1993–94 61.4 1.8 0.538
1994–95 63.4 3.3 0.556
1995–96 66.1 4.3 0.579
1996–97 67.0 1.4 0.587
1997–98 67.0 0.0 0.587
1998–99 67.8 1.2 0.594
1999–00 69.4 2.4 0.608
2000–01 73.6 6.1 0.645
2001–02 75.7 2.9 0.663
2002–03 78.0 3.0 0.684
2003–04 79.9 2.4 0.700
2004–05 81.8 2.4 0.717
2005–06 84.4 3.2 0.740
2006–07 86.9 3.0 0.762
2007–08 89.8 3.3 0.787
2008–09 92.6 3.1 0.812
2009–10 94.8 2.4 0.831
2010–11 97.7 3.1 0.856
2011–12 100.0 2.4 0.876
2012–13 102.3 2.3 0.897
2013–14 105.0 2.6 0.920
2014–15 106.8 1.7 0.936
2015–16 108.3 1.4 0.949
2016–17 110.2 1.8 0.966
2017–18 112.3 1.9 0.984
2018–19 114.1 1.6 1.000
Source: Derived from Australian Bureau of Statistics, Consumer Price Index, ABS 6401.0
(a) Average of four quarters.
Expenditure (gross profit): These figures relate to the net amount lost or, in other words, the amount wagered less the amount won, by people who gamble. Conversely, by definition, it is the gross profit (or gross winnings) due to the operators of each form of gambling. Expenditure data reported by Tasmania is monthly in arrears, aligning with taxation collected.

Australian Gambling Statistics 1993–94 to 2018–19, 36th edition
3
Football Pools (Pools): The Pools is a numbers game of chance where the winning numbers are based on the results of the matches.
Each week, 38 soccer matches are selected to form a ‘match list’. Each match is assigned a number from one to 38. The results of the matches are then collected and ranked, with scored draws ranked highest and home score wins ranked lowest. The six highest–ranked match numbers are then used as the official results numbers for the Pools draw. There is also a supplementary number selected, which is the seventh–highest ranked match result. To play the Pools, players select six numbers from the 38. If the selected numbers are the same as the official results numbers, the player wins one of the five prize divisions.
The Pools is administered by South Australian Lotteries on behalf of the Australian Soccer Pools Bloc. The Bloc was formed in June 1989 by lottery jurisdictions in Australia. Its purpose is to promote the game of Soccer Pools and produce accurate and uniform prize pools and dividends for subscribers to the game.
Gambling: The placement of a wager or bet on the outcome of a future uncertain event. In this document, gambling includes lawful gaming, racing and sports betting activities. The statistics presented in this publication are for legalised regulated gambling for which accurate figures are available, and hence do not represent turnover or expenditure on all forms of gambling.
Gaming: All legal forms of gambling other than racing and sports betting, such as lotteries, poker and gaming machines, casino gaming, football pools, interactive gaming and minor gaming (which is the collective name given to raffles, bingo, lucky envelopes and the like).
Gaming machines: All jurisdictions, except Western Australia, have a state–wide gaming machine (poker machine) network operating in clubs and/or hotels. The data reported under this heading do not include gaming machine data from casinos.
Gaming machines accurately record the amount of wagers played on the machines. So, turnover is an actual figure for each jurisdiction. In most jurisdictions operators must return at least 85 per cent of wagers to players as winnings, either by cash or a mixture of cash and product. Gaming machines may be linked together to offer major jackpots.
Government revenue: The revenue received by state governments from gambling activities that are subject to state taxes and levies.
Household disposable income (HDI): This is defined as gross household income less income tax payable, other current taxes on income, wealth etc., consumer debt interest, interest payable by unincorporated enterprises and dwellings owned by persons, net non–life insurance premiums and other current transfers payable by households.
Information on HDI by state and territory has been derived from data taken from the ABS. Data on HDI were taken from the revised ABS series on ‘Household gross disposable income’, reported by state and territory in the Australian National Accounts: State Accounts.
When interpreting gambling figures as a proportion of HDI by state and territory, users of the data should note that such data represent expenditure within the jurisdiction concerned, and do not adjust for interstate or international gamblers. No relevant data are collected on interstate gamblers.

Australian Gambling Statistics 1993–94 to 2018–19, 36th edition
4
Table 2 Gross household disposable income(a), all states and territories, 1993–94 to 2018–19
Year NSW Vic Qld SA WA Tas ACT NT Australia
1993–94 114,974 76,263 51,237 24,532 28,002 6,904 7,461 2,658 312,032
1994–95 120,929 79,847 54,836 25,347 30,125 7,251 7,814 3,042 329,192
1995–96 128,963 84,406 58,423 26,815 31,761 7,615 8,129 3,301 349,414
1996–97 137,143 88,005 63,019 27,652 33,388 7,782 8,522 3,502 369,013
1997–98 142,524 92,453 65,353 28,786 34,884 7,916 8,643 3,567 384,126
1998–99 148,039 97,361 67,752 28,821 36,931 8,021 9,109 3,893 399,927
1999–00 157,621 101,956 71,423 30,428 39,065 8,420 10,099 4,340 423,351
2000–01 172,805 111,505 78,552 33,218 41,681 8,768 11,757 4,834 463,119
2001–02 176,782 120,678 87,379 36,773 47,515 9,814 12,021 5,322 496,285
2002–03 180,980 125,697 88,906 37,610 49,309 10,207 13,519 5,297 511,526
2003–04 194,778 132,826 99,163 40,583 53,801 11,305 14,395 5,617 552,469
2004–05 209,127 141,514 110,537 42,455 57,628 12,350 15,432 6,388 595,432
2005–06 217,438 149,341 121,180 44,163 61,064 13,469 16,372 7,169 630,197
2006–07 233,740 161,046 136,859 48,154 70,166 14,600 18,071 7,732 690,369
2007–08 252,107 176,846 150,500 52,703 81,948 16,012 20,289 8,502 758,907
2008–09 273,200 192,272 168,369 58,968 91,973 17,743 22,425 9,573 834,523
2009–10 284,002 198,359 173,335 60,859 96,204 18,302 24,171 10,499 865,730
2010–11 307,118 211,902 184,408 64,912 105,900 18,855 27,140 11,142 931,377
2011–12 325,702 220,506 193,276 66,714 117,386 19,107 29,591 11,966 984,248
2012–13 333,558 230,028 193,257 67,637 124,804 18,807 32,229 12,807 1,013,127
2013–14 355,234 245,734 198,768 69,260 131,316 19,384 33,013 13,918 1,066,628
2014–15 371,769 249,653 207,922 75,924 138,093 21,071 33,354 14,987 1,112,775
2015–16 382,262 252,887 214,175 78,688 139,156 22,060 34,269 15,511 1,139,009
2016–17 392,950 263,719 219,044 81,055 136,176 22,619 35,788 15,866 1,167,215
2017–18 404,328 273,656 226,594 83,323 138,669 23,330 36,441 16,065 1,202,407
2018–19 416,296 282,483 234,986 84,880 139,808 24,322 37,654 15,645 1,236,073
(a) Original data.
Source: Australian Bureau of Statistics, Australian National Accounts: State Accounts, ABS 5220.0.
— $m —
Instant lottery: Commonly known as ‘scratchies’, where a player scratches a coating off the ticket to identify whether the ticket is a winner. Prizes in the instant lottery are paid on a set return to player and are based on the number of tickets in a set, the cost to purchase the tickets, and a set percentage retained by the operator for costs. The operation of instant lotteries is the same as for lotteries.
Interactive gaming: Defined as gambling on activities conducted via the internet. It specifically excludes wagering in the form of racing and sports betting, and lotteries via the internet. Interactive gambling services provided to Australian residents by an internet casino are banned under the Commonwealth Interactive Gambling Act 2001 (IGA) which came into effect in August 2001.
Keno (clubs and hotels): A computerised keno system operates in clubs and hotels in New South Wales, Queensland, South Australia, Victoria, Tasmania, Australian Capital Territory and the Northern Territory. In 1998−99, Keno was introduced into Star City Casino, Sydney (now known as The Star). Keno is a game where a player wagers that their chosen numbers match any of the 20 numbers randomly selected from a group of 80 numbers via a computer system or a ball-draw device. In most states, Keno is linked to all venues within a particular jurisdiction, enabling the operator to offer large jackpot prizes. Keno has a fixed pay scale such that the payout for each wager is established by rules and is independent of the total wagers made on the game.
Lotteries: Lotteries are conducted Australia-wide by both government and commercial operators. There are three components to a lottery: the purchase of a ticket, a draw and a prize. A person whose ticket is selected in a lottery wins a prize based on the total amounts wagered after deduction of a set percentage by the operator to cover costs. Lottery tickets are sold at various outlets around Australia, such as newsagents. The same operators may also conduct Lotto, Pools and Instant lottery.

Australian Gambling Statistics 1993–94 to 2018–19, 36th edition
5
Lotto: The figures reported in this section cover a variety of lottery games, commonly known as Tattslotto, Gold Lotto, Lotto, X-Lotto or Powerball, depending on the jurisdiction. Lotto is a game where a player selects any six numbers from one to 45 in anticipation that those numbers will be among eight numbered balls, randomly drawn from a ball-draw device containing 45 balls numbered from one to 45. The first six of the eight balls drawn are known as the ‘winning numbers’ and the last two balls are called ‘supplementary numbers’.
There are five prize divisions, with Division 1 being the major prize. The prize payout for each division is dependent on the amount of wagers made, less the operator’s costs. A player wins if their selected numbers match those randomly drawn in a set combination.
Minor gaming: The collective name given to raffles, bingo, lucky envelopes and the like.
On-course totalisator: These figures relate to the amount wagered on a racetrack, during race meetings, or at authorised auditoria.
Point of consumption tax: Australian state or territory government tax on wagering revenue of betting operators from betting transactions with customers in the state or territory where the bet was placed. Also refer to section 1.5 Overview of gambling data - Point of consumption tax.
Population: Population data from the ABS have been used to calculate the figures presented in the per capita tables. These population data exclude all persons under the age of 18 years. The per capita calculations are undertaken by dividing the relevant financial data for a given financial year by the mean resident population aged 18 years and over in the region during the relevant financial year. Mean estimates for the populations of the states and territories are presented below. Note that the same caveat relating to the influence of visitors on the estimates reported in the HDI tables is also relevant to the interpretation of those reported in the per capita tables.
Table 3 Mean estimated resident population aged 18 years and over, all states and territories, 1993–94 to 2018–19
Year NSW Vic Qld SA WA Tas ACT NT Australia (a)
1993–94 4.481 3.339 2.292 1.102 1.232 0.345 0.218 0.117 13.1271994–95 4.530 3.358 2.350 1.106 1.257 0.346 0.222 0.121 13.2911995–96 4.586 3.389 2.405 1.110 1.284 0.348 0.225 0.124 13.4741996–97 4.647 3.424 2.454 1.116 1.311 0.349 0.228 0.128 13.6591997–98 4.704 3.459 2.496 1.124 1.336 0.350 0.230 0.132 13.8321998–99 4.761 3.498 2.537 1.132 1.360 0.350 0.232 0.134 14.0071999–00 4.824 3.542 2.581 1.140 1.383 0.351 0.235 0.137 14.1952000–01 4.892 3.591 2.631 1.147 1.407 0.353 0.239 0.139 14.4012001–02 4.955 3.643 2.691 1.156 1.430 0.354 0.243 0.141 14.6162002–03 5.003 3.695 2.765 1.166 1.454 0.358 0.247 0.141 14.8312003–04 5.044 3.747 2.840 1.176 1.479 0.363 0.250 0.142 15.0432004–05 5.083 3.801 2.913 1.187 1.507 0.367 0.253 0.144 15.2572005–06 5.128 3.862 2.986 1.200 1.538 0.371 0.256 0.147 15.4902006–07 5.191 3.936 3.063 1.214 1.578 0.374 0.262 0.150 15.7702007–08 5.282 4.021 3.146 1.231 1.628 0.379 0.267 0.155 16.1112008–09 5.381 4.118 3.234 1.248 1.684 0.384 0.273 0.161 16.4852009–10 5.470 4.209 3.311 1.266 1.734 0.389 0.279 0.165 16.8252010–11 5.543 4.281 3.373 1.281 1.782 0.393 0.285 0.168 17.1092011–12 5.613 4.360 3.441 1.294 1.838 0.396 0.291 0.171 17.4062012–13 5.691 4.455 3.512 1.307 1.892 0.397 0.296 0.176 17.7292013–14 5.778 4.552 3.575 1.320 1.928 0.399 0.301 0.180 18.0352014–15 5.866 4.652 3.628 1.332 1.948 0.401 0.306 0.181 18.3162015–16 5.958 4.761 3.680 1.342 1.962 0.404 0.311 0.183 18.6042016–17 6.063 4.880 3.741 1.352 1.974 0.408 0.317 0.184 18.9232017–18 6.171 5.001 3.810 1.364 1.988 0.413 0.324 0.184 19.2592018–19 6.269 5.118 3.881 1.376 2.008 0.419 0.329 0.184 19.588
(a) Includes Other Territories comprising Jervis Bay Territory, Christmas Island, the Cocos (Keeling) Islands and Norfolk Island.
Source: Derived from Australian Bureau of Statistics, Australian Demographic Statistics, ABS 3101.0.
— m —

Australian Gambling Statistics 1993–94 to 2018–19, 36th edition
6
Racing betting: Within the context of this report, racing betting comprises legal betting with bookmakers and totalisators, both on racecourses and off-course (TAB). It is related to betting on the outcome of horse and greyhound races.
‘Real’ variables: Refers to data that have had the effects of inflation removed. This is achieved by specifying a base year (in this instance 2018–19) and ‘deflating’ each previous year by the CPI (see Table 1). This means that all data in a table showing real values may be compared directly, the effects of inflation having been removed.
Revised figures: Figures with a ‘revised’ (R) notation indicate that data have been revised from the previous edition of the AGS publication.
Sports betting: The wagering on approved types of local, national or international sporting activities (other than the established forms of horse and greyhound racing), whether on or off-course, in person, by telephone, or via the internet.
Totalisator Agency Board (TAB): This form of wagering is Australia-wide and is the amount wagered at TAB outlets (other than those on a race track). Totalisator wagering is where a player makes a ‘unit’ wager (a unit being any multiple of 50 cents or one dollar depending on the jurisdiction). Totalisator betting is sometimes called pari-mutuel betting. The operator deducts a percentage of the total units wagered (for costs including tax) and the remainder is returned as dividends (winnings) to players in multiples of the unit wagered.
In several jurisdictions, the TAB has been privatised. There are three TAB pools: the Victorian pool (known as the SuperTAB, to which Australian Capital Territory and Western Australia are parties), the New South Wales pool, and the Queensland pool (to which Tasmania, South Australia and the Northern Territory are parties). Each jurisdiction retains the deductions from wagers made in that particular jurisdiction.
Turnover: An expression used to describe the amount wagered. This does not include any additional charges that may also be paid at the point of purchase, such as selling agents’ commission in the case of lotteries (except where noted in tables).
Wagering: All legal forms of gambling on racing and sporting events.
1.5 Overview of gambling data Sources of data
State and territory government racing and gaming authorities provide data on turnover, expenditure and government revenue for each form of gambling within their jurisdiction. Where actual data are not available, the relevant authorities are encouraged to estimate the data and provide explanations of estimation methods. The methods that have been used to estimate missing values are elaborated upon in section 1.6.
Legislative restrictions preclude several jurisdictions from releasing data until the close of the calendar year relating to the statistics. Users should note that the statistics are not available until after this period.
Relevant legislation
Gambling policy and legislation in Australia has traditionally been the role of the states and territories rather than the Commonwealth. Relevant state-based legislation is detailed in state and territory summaries in section 1.6.
Goods and services tax
On 1 July 2000, the goods and services tax (GST) replaced wholesale sales tax, which was applied at varying rates to a range of products. The GST is a broad-based tax of ten per cent on most supplies of goods and services consumed in Australia. This includes gaming products. Therefore, the gaming tax revenue figures shown in this publication from 2000−01 onwards are not comparable with those of preceding years.
Point of consumption tax
Point of consumption tax (POCT) commenced in six states and territories from 1 July 2017 to 30 June 2019 including New South Wales, Victoria, Queensland, South Australia, Western Australia and the Australian Capital Territory. Prior to the introduction of POCT, wagering tax on racing and sports betting was payable in the state or territory where the licensee operated, not at the point of consumption in the state or territory where the bet occurred.
South Australia was the only state or territory that reported point of consumption tax in the 35th and 36th editions of AGS. Care should be taken when interpreting data impacted by POCT. These data should be treated as a break in

Australian Gambling Statistics 1993–94 to 2018–19, 36th edition
7
series and not compared with data from earlier editions. For further information refer to jurisdictional explanatory notes and table footnotes.
Forms of gambling
The following table provides an overview of the types of gambling that are legally permitted and currently being undertaken by Australian residents and overseas visitors in each state and territory.
Table 4 Forms of gambling currently undertaken, by state and territory
NSW Vic Qld SA WA Tas ACT NT
Racing and betting
Sports betting
Lotteries
Gaming machines Casino only Hotels and clubs only
Casino gaming
Keno Casino only
Football pools
Interactive gaming Legal interactive gaming is currently only undertaken in the Northern Territory.
Minor gaming
Betting exchange Betting exchange wagering is currently only undertaken in the Northern Territory. Betfair surrendered its
Tasmanian Gaming Licence in November 2016.
Abbreviations
- nil or rounded to zero
E Estimated data
NA Not applicable
R Revised data
U Unavailable data

Australian Gambling Statistics 1993–94 to 2018–19, 36th edition
8
1.6 Notes on data specific to each state and territory
1.6.1 New South Wales
Legislation
Legislation governing the regulation, supervision and control of gambling activities in New South Wales includes:
Betting Tax Act 2001
Casino Control Act 1992
Charitable Fundraising Act 1991
Community Gaming Act 2018
Gambling (Two-Up) Act 1998
Gaming and Liquor Administration Act 2007
Gaming Machines Act 2001
Gaming Machines Regulation 2010
Gaming Machines Tax Act 2001
Liquor Act 2007
Public Lotteries Act 1996
Betting and Racing Act 1998
Registered Clubs Act 1976
Totalizator Act 1997
Unlawful Gambling Act 1998.
New developments
On 2 July 2018 reforms to the gambling advertising restrictions under the Betting and Racing Act 1998 and the Totalizator Act 1997 came into effect. It is unlawful to offer to a person in NSW any inducement to participate in any gambling activity, including an inducement to open a betting account or to bet more frequently. Under the changes this now includes a prohibition on any inducement offered with a disclaimer (e.g. ‘not available to NSW residents’).
In 2018 a review was conducted of the Lotteries and Art Unions Act 1901 which provided for gaming activities for charitable, social, not-for-profit or trade promotion purposes. This resulted in the Act being repealed and replaced with the new Community Gaming Act 2018 (CGA) in October 2018. The CGA commenced in 2020.
On 1 January 2020, the NSW Government implemented the POCT through the Betting Tax Amendment (Point of Consumption) Bill 2018. The bill stipulates that POCT is set at 10% of net wagering revenue derived from NSW customers. The POCT does not replace existing wagering taxes paid by Tabcorp, but there is a protocol in place to ensure that this income is not subject to double taxation.
General industry information
The figures presented for New South Wales in this publication were provided by the Independent Liquor and Gaming Authority, Liquor and Gaming NSW and the NSW Department of Customer Service.
Number of gaming machines (as at 30 June 2019)
Clubs – 68,676
Hotels – 22,612
Casinos – 1,500

Australian Gambling Statistics 1993–94 to 2018–19, 36th edition
9
Number of venues with gaming machines (as at 30 June 2019)
Clubs – 1,102
Hotels – 1,390
Casinos – 1
Gaming machine duty rates
Gaming machine (poker machine) duty rates for clubs and hotels are in Tables 5 and 6.
Table 5 Annual club gaming machine – marginal tax rates
Annual gaming revenue (a) (b)
From 1 September
Up to $200,000 $200,001 to $1,000,000
$1,000,001 to $5,000,000
$5,000,001 to $10,000,000
$10,000,001 to $20,000,000
$20,000,001 and above
Clubs earning
up to 1,000,000
Clubs earning 1,000,001 and
over (c)
— % —
2009 – – 10.0 21.0 26.0 29.0 30.9
2010 – – 10.0 21.0 26.0 29.0 30.9
2011 – – 10.0 19.9 24.4 26.4 28.4
2012 – – 10.0 19.9 24.4 26.4 28.4
2013 – – 10.0 19.9 24.4 26.4 28.4
2014 – – 10.0 19.9 24.4 26.4 28.4
2015 – – 10.0 19.9 24.4 26.4 28.4
2016 – – 10.0 19.9 24.4 26.4 28.4
2017 – – 10.0 19.9 24.4 26.4 28.4
2018 – – 29.9 19.9 24.4 26.4 28.4(a) For gaming revenue higher than $1 million from 2011, rates shown are before the 1.85 percentage point ClubGRANTS Scheme (formerly Community
Development and Support Expenditure (CDSE) scheme) duty rate reduction. Under the ClubGRANTS Scheme, marginal duty rates on gaming revenue above $1 million are reduced by 1.85 percentage points if clubs contribute 1.85% of gaming revenue in excess of $1 million to eligible community projects.
(b) For gaming revenue higher than $1 million, rates shown are before the 1.5 percentage point Community Development and Support Expenditure (CDSE) Scheme duty rate reduction. Under the CDSE Scheme, marginal duty rates on gaming revenue above $1 million are reduced by 1.5 percentage points if clubs contribute 1.5% of gaming revenue in excess of $1 million to eligible community projects.
(c) For clubs earning gaming revenue above $1 million a year from 1 September 2007, the benefit of the tax-free threshold in the $200,000 to $1 million revenue range will be withdrawn dollar for dollar as gaming revenue exceeds $1 million, with complete withdrawal when revenue reaches $1.8 million.
Clubs annual tax rates
Annual tax rates over $250,000 include a 0.4% contribution to the Infrastructure Grants (Category 3) of the ClubGRANTS Scheme.
Clubs that make more than $1 million in gaming machine profits annually can either:
Pay an additional 1.85% on the amount over $1m
Contribute the same amount to community projects under the ClubGRANTS Scheme.
Table 6 Annual hotel gaming machine rates
Annual gaming revenue
From 1 July Up to $25,000 $25,001 to $200,000
$200,001 to $400,000
$400,001 to $1,000,000
$1,000,001 to $5,000,000
$5,000,001 and above
— % —
2009 5.1 15.1 23.7 29.4 34.4 47.3
2010 – – 33.0 33.0 36.0 50.0
2011 – – 33.0 33.0 36.0 50.0
2012 – – 33.0 33.0 36.0 50.0
2013 – – 33.0 33.0 36.0 50.0
2014 – – 33.0 33.0 36.0 50.0
2015 – – 33.0 33.0 36.0 50.0
2016 – – 33.0 33.0 36.0 50.0
2017 – – 33.0 33.0 36.0 50.0
2018 – – 33.0 33.0 36.0 50.0

Australian Gambling Statistics 1993–94 to 2018–19, 36th edition
10
Number of gaming, racing and wagering licences issued (as at 30 June 2019)
Bookmakers – 145
Sports betting – 30
Totalisator – 1
Race clubs
— Thoroughbred – 130
— Harness – 31
— Greyhound – 31
Public lotteries – 1
Keno – 1
Casino – 1
Restricted gaming facility – 1
Inter-venue linked gaming system (Jackpot links) were retired and de-licensed in 2020.
Amendments to previous publication (35th edition)
Nil.
Notes to the Tables for 2018–19
Casino Government revenue from gaming figure does not include contributions to the Responsible Gambling Fund required by the Casino Control Act 1992 or the Gaming Machines Act 2001.
Lotteries, Pools, Lotto
Turnover figures are net sales (that is, not including agent commission).
Specific notes
Nil.

Australian Gambling Statistics 1993–94 to 2018–19, 36th edition
11
1.6.2 Victoria
Legislation
Legislation governing the regulation, supervision and control of gambling activities in Victoria includes:
Casino Control Act 1991
Casino (Management Agreement) Act 1993
Gambling Regulation Act 2003
Victorian Commission for Gambling and Liquor Regulation Act 2011
Racing Act 1958.
The Victorian legislation can be accessed from the Victorian Legislation and Parliamentary Documents website at www.legislation.vic.gov.au under Victorian Law Today.
New developments
National Consumer Protection Framework for Online Wagering
On 26 May 2019, restrictions under the National Consumer Protection Framework for Online Wagering were introduced in Victoria. These restrictions:
prohibit wagering service providers from offering credit, vouchers or other rewards to an account holder as an incentive to refer their family or friends to open a betting account
stop operators from providing complementary or free bets on the condition that account holders can only use the winnings to continue to bet, rather than giving customers an option to withdraw the funds
require consumers to opt-in to receive direct marketing from a wagering service provider
provide consumers with simple and easy-to-use tools to set limits on the amount of money that can be deposited into their betting accounts
ensure consumers can easily close their betting account if they choose to do so, while also restricting gambling providers from offering credit or other rewards to encourage consumers to keep their betting account open.
Lottery licence
A new Public Lottery Licence issued to Tattersall’s Sweeps Pty Ltd commenced on 1 July 2018.
Point of consumption wagering and betting tax
POCT commenced in Victoria on 1 January 2019. The POCT applies at a rate of eight per cent of the net wagering revenue derived from all wagering and betting activity by customers located in Victoria.
Prior to 1 January 2019, wagering and betting in Victoria was taxed on a place of supply basis, and only applied to the Victorian wagering and betting licensee.
The 36th edition of the AGS only contains pre-POCT Victorian data. The Victorian data in this report reflects the period from 1 July 2018 to 31 December 2018.
General industry Information
Nil.
Amendments to previous publication (35th edition)
Nil.

Australian Gambling Statistics 1993–94 to 2018–19, 36th edition
12
Notes to the Tables for 2018-19
Nil.
Specific notes
Nil.

Australian Gambling Statistics 1993–94 to 2018–19, 36th edition
13
1.6.3 Queensland
Legislation
Breakwater Island Casino Agreement Act 1984
Brisbane Casino Agreement Act 1992
Cairns Casino Agreement Act 1993
Casino Control Act 1982
Charitable and Non-Profit Gaming Act 1999
Gaming Machine Act 1991
Interactive Gambling (Player Protection) Act 1998
Jupiters Casino Agreement Act 1983
Keno Act 1996
Lotteries Act 1997
Queen’s Wharf Brisbane Act 2016
Wagering Act 1998
Betting Tax Act 2018.
New developments
Tabcorp Gaming Solutions (Qld) Pty Ltd (TGS) was prescribed as an approved financier in the Gaming Machine Regulation 2002. This will enable TGS to undertake certain business activities in Queensland including leasing electronic gaming machines and associated systems to licensed premises, under terms contained within a Venue Service Agreement.
The Transport and Other Legislation (Road Safety, Technology and Other Matters) Amendment Bill 2020 was introduced into Parliament on 17 March 2020. The Bill will establish a digital licensing App that will enable access to digital licensing and identity products, including driver licences and photo identification cards. The Bill will amend relevant liquor and gambling legislation to ensure digital identification will be accepted in venues such as pubs, clubs and casinos as evidence of a person’s age. In addition, the Bill will clarify that inspector seizure powers do not apply to digital devices used to display identification.
General industry Information
Nil.
Amendments to previous publication (35th edition)
Nil.
Notes to the Tables for 2018–19
Nil.
Specific notes
Nil.

Australian Gambling Statistics 1993–94 to 2018–19, 36th edition
14
1.6.4 South Australia
Legislation
Authorised Betting Operations Act 2000
Casino Act 1997
Gaming Machines Act 1992
Independent Gambling Authority Act 1995 (renamed Gambling Administration Act 1995)
Lottery and Gaming Act 1936
State Lotteries Act 1966.
New developments
Gambling Review—Reform to SA gambling laws
On 1 December 2018, the Independent Gambling Authority (IGA) ceased operations and all gambling regulation, operational and enforcement responsibilities were transferred to Consumer and Business Services (CBS).
This decision was part of a reform package announced in the 2018-19 State Budget aimed at developing a more effective approach to gambling regulation in South Australia.
These reforms were informed by the conclusion of retired Supreme Court Judge Tim Anderson QC in his Administrative Review of Gambling Regulation in South Australia, which was tabled in Parliament on 4 September 2018.
As part of these reforms, the Attorney-General has committed to a broad view of all gambling regulation in SA and other aspects raised in Mr Anderson’s report, including online gambling.
Delivery of these reforms will occur in stages to allow for operational changes and further consultation on different aspects of the reforms.
The State Government has begun seeking views from industry and the non-government sector on the future of gambling regulation in SA.
Preliminary consultation has commenced with key gambling industry, representatives of charitable, gambling support and social welfare organisations about the issues they would like to see covered in the review ahead of a period of broader public consultation. Some of the issues being considered include the:
National Consumer Protection Framework (NCPF) for Interactive Wagering
recommendations from the Administrative Review of Gambling conducted by the Hon Tim Anderson QC
self-exclusion barring process
Advertising and Responsible Gambling Codes of Practice
Social Effect Inquiry Process – a pre-requisite for an application for a gaming machine licence
simplification of trade promotion lottery and associated legislation
legislative scheme for the movement and trading of gaming machine entitlements
other legislative opportunities to streamline and modernise the State’s gambling laws.

Australian Gambling Statistics 1993–94 to 2018–19, 36th edition
15
National Consumer Protection Framework (NCPF) for Interactive Wagering
On 26 May 2019, the Gambling Codes of Practice Notice 2013 (the Codes) was amended to implement the first set of measures (for which individual states and territory governments are responsible) as part of the National Consumer Protection Framework for interactive wagering.
One of the proposals in relation to a voluntary opt-out pre-commitment scheme was for pre-commitment limits (net betting losses by the account holder, deposits made to the account or a combination of both). Those limits are set by the account holder who can opt which limits apply to them. That is, they can choose to limit their net betting losses or deposits they make to their account or a combination of these.
Several interactive wagering service providers made representations regarding that proposal.
As a result of those representations, the Liquor and Gambling Commissioner decided to change the proposed amendment to the Codes in relation to voluntary opt-out pre-commitment schemes so that pre-commitment limits are applied in the same manner as is currently the case in the South Australian Codes, i.e. they may apply at the election of the gambling provider.
A review of the current SA Codes of Practice is scheduled to commence in the near future. As part of that review, the Commissioner intends to revisit the matter of consumers being able to choose which pre-commitment limits apply to them.
Other measures were implemented by individual states and territory governments as follows:
Restrictions on inducements*
The offer of any credit, voucher, rewards or other benefit as an incentive to open an account or refer another person to open an account is prohibited.
Any credit, voucher, rewards or other benefit (that is directed at encouraging customers to gamble) that is not part of an approved loyalty program must not be offered in a jurisdiction that only permits such inducements as part of an approved loyalty program.
Winnings from a complimentary betting credit or token must be able to be withdrawn without being subject to any turnover requirements.
All direct marketing to customers may only be sent to customers who provide their express consent to receive this material.
A customer must be able to unsubscribe from receiving direct marketing materials.
*South Australia already has had a ban on inducements (except under certain circumstances) for many years through the Responsible Gambling Code of Practice (refer to clause 54)
Account closure
The process for account closure must be prominent and clearly articulated on the interactive wagering service provider’s website and within each customer’s ‘My Account’ window.
The account closure process must commence immediately upon receipt of the account closure request and result in the account being closed after all bets have been settled.
A customer must not be encouraged or induced to keep their account open following their request to close their account. However, an interactive wagering service provider may explain the effects of an account closure and ask the customer if the customer wishes to proceed.
General industry information
Administrative review of gambling regulation in South Australia
As part of its response to an independent review of the Liquor Licensing Act 1997, the South Australian Government announced that it would conduct an administrative review of the arrangements for regulating commercial gambling in South Australia.
The Honourable Tim Anderson QC was appointed to conduct this review and provided his findings to the Government to assist with the development of future commercial gambling arrangements.

Australian Gambling Statistics 1993–94 to 2018–19, 36th edition
16
Mr Anderson recommended there be a single regulator to eliminate duplication and confusion, therefore, the Independent Gambling Authority (IGA) was dissolved in December 2018 and the Liquor and Gambling Commissioner assumed all responsibility for all gambling functions in South Australia, including those previously undertaken by the former IGA.
On 4 June 2018, a new team, the Gambling Reform and Operations Team, was created within Consumer and Business Services (CBS) to assist with knowledge retention, succession planning, process improvement and centralising expertise in relation to gambling and wagering matters within CBS.
Amendments to previous publication (35th edition)
Bookmaker racing expenditure data for 2016–17 and 2017–18 have been revised to provide a consistent comparison metric for 2018–19.
Notes to the Tables for 2018–19
Nil.
Specific notes
Nil.

Australian Gambling Statistics 1993–94 to 2018–19, 36th edition
17
1.6.5 Western Australia
Legislation
Legislation governing the regulation, supervision and control of gambling activities in Western Australia includes:
Betting Control Act 1954
Bookmakers Betting Levy Act 1954
Casino (Burswood Island) Agreement Act 1985
Casino Control Act 1984
Gaming and Betting (Contracts and Securities) Act 1985
Gaming and Wagering Commission Act 1987
Gaming and Wagering Commission (Continuing Lotteries Levy) Act 2000
Racing and Wagering Western Australia Act 2003
Racing and Wagering Western Australia Tax Act 2003
Racing Restriction Act 2003
Racing Bets Levy Act 2009.
New developments
On 9 October 2018, the Western Australian Government announced the decision to sell the Western Australian TAB (WATAB). The WATAB is currently operated by Racing and Wagering Western Australia. The transaction will see the grant of a licence to operate wagering in Western Australia and the transfer of WATAB assets to a private sector Licensee.
A POCT was introduced on 1 January 2019, overseen by the Office of the State Revenue, to replace the tax regime that previously applied to wagering in Western Australia. As well as simplifying wagering taxes, the new tax regime ensures online wagering operators pay tax on wagering conducted in Western Australia. 30% of point of consumption tax revenue is returned to the Western Australian wagering industry.
The Gaming and Wagering Legislation Amendment Act 2018 was proclaimed to come into operation on 1 February 2019 and contained amendments to the Betting Control Act 1954 and the Gaming and Wagering Commission Act 1987 to implement the government’s policy of supporting a strong and sustainable racing industry and responsible gambling practices in Western Australia.
The Racing Bets Levy Amendment Regulations 2018 came into effect on 7 July 2018 to decrease the threshold for defining a premium harness race meeting from $50,000 to $30,000 and to amend the calculation method for fixed odds wagers to a ‘greater of’.
On 1 June 2019 regulation 43 of the Gaming and Wagering Commission Regulations 1988 was amended to make various changes to the requirements surrounding gambling advertising and inducements. Some of the amendments were required to implement measures of the National Consumer Protection Framework for Online Wagering.
General industry information
The casino gaming operations tax rates were as follows:
electronic gaming machines - 12.42% on and from 24 December 2015
fully automated table games - 12.92% on and from 24 December 2014
table games - 9.37% on and from 24 December 2014

Australian Gambling Statistics 1993–94 to 2018–19, 36th edition
18
international commission business tax - 1.75% on and from 24 December 2014 (a guaranteed minimum of $36.2 million was required to be paid between 1 July 2014 to 30 June 2018)
As at 30 June 2019, Crown Perth had approval to operate a maximum of 350 table games, and 2,500 electronic gaming machines.
Amendments to previous publication (35th edition)
Some of the TAB figures for previous years have been revised, as some fixed odds racing data had inadvertently been combined with sports betting.
Notes to the Tables for 2018–19
Nil.
Specific notes
Nil.

Australian Gambling Statistics 1993–94 to 2018–19, 36th edition
19
1.6.6 Tasmania
Legislation
Legislation governing the regulation, supervision and control of gambling activities in Tasmania includes:
Gaming Control Act 1993
TT-Line Gaming Act 1993
Racing Regulation Act 2004.
New developments
Following the Tasmanian Liquor and Gaming Commission’s first review of the Responsible Gambling Mandatory Code of Practice for Tasmania in 2017, the remaining harm minimisation measures introduced under the Code took effect from 1 November 2018. These reforms aim to further ensure gambling is offered in a responsible way while providing informed consumer choice.
The National Consumer Protection Framework for online wagering in Australia commenced on 26 November 2018. Through 2018-19, the first six harm minimisation measures were implemented in Tasmania providing a minimum level of player protection across Australia and complementing Tasmania’s existing harm minimisation framework.
UBET TAS Pty Ltd rebranded its trading name from UBET to TAB, with the change process commencing in November 2018 and concluding in January 2019.
General industry information
Totalizator and fixed odds wagering is offered in Tasmania by UBET TAS (previously known as TOTE Tasmania), a subsidiary of Tabcorp Holdings Limited. UBET TAS offers wagering products on thoroughbred, harness and greyhound racing, including fixed odds wagering products for sports betting and race wagering. Further subsidiaries licensed in Tasmania are Tattersall’s Sweeps Pty Limited (for draw lotteries) and Golden Casket Lottery Corporation Limited (for scratch lotteries).
Bookmakers offer traditional fixed price wagering on course at certain racing events in Tasmania.
There are two land-based casinos operating in Tasmania: Wrest Point in Sandy Bay (Hobart) and the Country Club at Prospect (Launceston). Both casinos are owned and operated by the Federal Group.
Ninety-five hotels and clubs in Tasmania offered gaming in the form of gaming machines and keno. These gaming services are owned and operated by Network Gaming, which is part of the Federal Group. Individual hotels and clubs rent gaming equipment from Network Gaming.
Thirty-six gaming machines operated on the Spirit of Tasmania I and II ferries by Admirals Casino Pty Ltd.
There are no providers of major lotteries currently operating in Tasmania. However, as mentioned above, two companies: Tattersalls Sweeps (licensed in Victoria) and Golden Casket (licensed in Queensland), hold foreign games permits that allow their products to be offered from accredited outlets in Tasmania.
Minor gaming in Tasmania consists of activities such as lucky envelopes (e.g. beer/cash tickets), bingo, and raffles conducted for the benefit of not-for-profit organisations. Various minor games are currently approved.
Amendments to previous publication (35th edition)
In the Notes to the Tables for 2017–18, under ‘Racing’, the indexed wagering levy applying to UBET TAS in 2017–18 was $7.28 million instead of $7.42 million.

Australian Gambling Statistics 1993–94 to 2018–19, 36th edition
20
Notes to the Tables for 2018–19
Racing Bookmakers’ on-course racing expenditure was estimated at 5.5% of turnover.
Government revenue from racing (bookmakers) includes both tax and product levies
received.
An annual wagering levy equal to 4.7 million fee units applies to UBET Tasmania. The
levy was $7.28 million in 2017–18 and $7.42 million in 2018–19 and has not been
included in the government revenue from racing figures. The levy is adjusted where the
growth in net wagering revenue falls below CPI in the calendar year.
Gaming No revenue is received for minor gaming activities.
Lottery turnover figures are net and do not include lottery agent’s commissions.
Lottery, Lotto and instant lottery expenditure was estimated at 40% of turnover
(subscriptions).
Pools expenditure was estimated at 50% of turnover (subscriptions).
Sports betting Government revenue from sports betting includes tax paid on Australian and overseas non-racing events.
Government revenue from betting exchanges is no longer recorded in interactive gaming and has been apportioned between government revenue from sports betting and government revenue from racing.
Tipstar ceased trading in September 2007 and no figures are reported for bookmaker (and other) pool betting.
Specific notes
Nil.

Australian Gambling Statistics 1993–94 to 2018–19, 36th edition
21
1.6.7 Australian Capital Territory
Legislation
The Gambling and Racing Control Act 1999 is the establishing legislation for the Australian Capital Territory (ACT) Gambling and Racing Commission. The Act outlines the functions and powers of the Commission and other administrative matters. In respect of specific gaming and racing activities, the following legislation is administered by the Commission and includes all subordinate legislation:
Casino Control Act 2006
Gaming Machine Act 2004
Interactive Gambling Act 1998
Lotteries Act 1964
Pool Betting Act 1964
Race and Sports Bookmaking Act 2001
Racing Act 1999
Totalisator Act 2014
Unlawful Gambling Act 2009
Casino (Electronic Gaming) Act 2017.
New developments
On 27 November 2018, the ACT Legislative Assembly passed the Gaming Legislation Amendment Bill 2018 which among other reforms provided the legislative mechanism to achieve the ACT Government’s commitment to reduce the number of gaming machine authorisations in the Territory to 4,000 by May 2020. It should be noted that this is a sinking target as it operates in conjunction with the existing trading scheme that provides that one in every four machine authorisations traded is forfeited.
On 18 September 2018, the ACT Legislative Assembly passed the Betting Operations Tax Act 2018. This provides the legislative framework for an ACT POCT of 15% on betting operator’s net annual ACT betting revenue. Liability is for operators earning over $150,000 betting revenue in the ACT, with those earning under exempt.
General industry information
ACTTAB was purchased by Tabcorp ACT Ltd in October 2014 and, as part of the sale negotiations, it was agreed that the tax rate for Tabcorp ACT Ltd be set at zero per cent. Tabcorp ACT Ltd now pays an annual licence fee as determined by the Minister.
Amendments to previous publication (35th edition)
Nil.

Australian Gambling Statistics 1993–94 to 2018–19, 36th edition
22
Notes to the Tables for 2018–19
Gaming machines
The Government revenue from gaming machine figure does not include the levy on all gaming machine licensees of 0.75% of gross gaming machine revenue.
Racing Bookmaker on-course expenditure was calculated by assuming that bookmaker expenditure was equivalent to 5.5% of turnover.
TAB operations include both on-course and off-course activity. The ACT levies an annual licence fee on the TAB.
Sports betting Expenditure figures for sports betting are not available, as licensees are not required to provide this information.
Specific notes
Nil.

Australian Gambling Statistics 1993–94 to 2018–19, 36th edition
23
1.6.8 Northern Territory
Legislation
Legislation governing the regulation, supervision and control of gambling activities in the Northern Territory includes:
Gaming Control Act 1993
Gaming Machine Act 1995
Racing and Betting Act 1983
Soccer Football Pools Act 1978
Totalisator Licensing and Regulation Act 2000
Unlawful Betting Act 1989.
New developments
Nil.
General industry information
Pool lottery products have ceased.
Amendments to previous publication (35th edition)
Bookmaker racing revenue for 2017-18 has been revised from 6.956 million to 7.531 million.
Notes to the Tables for 2018–19
On and Off -Course Totalisator Revenue
Is determined based on a ratio of gross profit to total revenue.
Racing Revenue Bookmakers
This amount includes revenue (tax) from betting exchange operators for both racing and sports categories.
Bet Exchange Volume (turnover) / Commission (expenditure)
These amounts have not been included as requested.
Racing and Sports Betting Revenue (Bookmakers)
Gross profit tax is not based on turnover and is also capped and therefore cannot be determined as relative to racing or sports. Therefore, all revenue is reported as racing revenue.
This amount includes revenue from betting exchange operators for both racing and sports categories.
Interactive Gaming turnover/ expenditure
Licensee(s) relaunched.
Specific Notes
Nil.

Australian Gambling Statistics 1993–94 to 2018–19, 36th edition
24
1.7 Cautionary note While all care has been taken in the preparation of this publication, and the relevant authorities of each state and territory have verified their own data in detail, it is nevertheless necessary to caution users about its complete accuracy.
All tables should be read in conjunction with the explanatory notes in Part 1 of this report.
In some instances, data contained in previous editions have been corrected or amended. These corrections or amendments are noted within the relevant table(s).
Caution should be used when comparing data between states and territories, as each jurisdiction has its own systems, processes and reporting methods. Also, the availability of certain data can vary between jurisdictions.
Data on government revenue from gambling for years prior to 2000−01 are not comparable with data from 2000−01 onwards, due to the introduction of the GST on 1 July 2000.
In particular, readers are urged to use casino handle figures with extreme care. Please read section 1.4 Glossary, which has information on casino handle (under casino turnover) and a warning on its usage, before using any of this data.

Australian Gambling Statistics 1993–94 to 2018–19, 36th edition
25
PART 2: LIST OF TABLES

Australian Gambling Statistics 1993–94 to 2018–19, 36th edition
26
2.1 Summary tables
Summary table 2018−19
Table number State Table name
Summary table A All states Total Gambling Turnover, 2018−19
Summary table B All states Per Capita Gambling Turnover, 2018−19
Summary table C All states Percentage Change in Gambling Turnover, 2017−18 to 2018−19
Summary table D All states Total Gambling Expenditure, 2018−19
Summary table E All states Per Capita Gambling Expenditure, 2018−19
Summary table F All states Percentage Change in Gambling Expenditure, 2017−18 to 2018−19
2.2 Tables by state
New South Wales
Table number Table name
NSW 1 Total Racing Turnover
NSW 2 Real Racing Turnover
NSW 3 Per Capita Racing Turnover
NSW 4 Real Per Capita Racing Turnover
NSW 5 Total Racing Expenditure
NSW 6 Real Racing Expenditure
NSW 7 Per Capita Racing Expenditure
NSW 8 Real Per Capita Racing Expenditure
NSW 9 Racing Expenditure as a Percentage of Household Disposable Income
NSW 10 Racing Expenditure Share of Market
NSW 11 Government Revenue from Racing
NSW 12 Real Government Revenue from Racing
NSW 13 Per Capita Revenue from Racing
NSW 14 Real Per Capita Revenue from Racing
NSW 15 Government Revenue from Racing as a Percentage of Total Gambling Revenue
NSW 16 Total Gaming Turnover
NSW 17 Real Gaming Turnover
NSW 18 Per Capita Gaming Turnover
NSW 19 Real Per Capita Gaming Turnover
NSW 20 Total Gaming Expenditure
NSW 21 Real Gaming Expenditure
NSW 22 Per Capita Gaming Expenditure
NSW 23 Real Per Capita Gaming Expenditure
NSW 24 Gaming Expenditure as a Percentage of Household Disposable Income
NSW 25 Gaming Expenditure Share of Market
NSW 26 Government Revenue from Gaming
NSW 27 Real Government Revenue from Gaming
NSW 28 Per Capita Revenue from Gaming
NSW 29 Real Per Capita Revenue from Gaming

Australian Gambling Statistics 1993–94 to 2018–19, 36th edition
27
NSW 30 Government Revenue from Gaming as a Percentage of Total Gambling Revenue
NSW 31 Total Sports Betting Turnover
NSW 32 Real Sports Betting Turnover
NSW 33 Per Capita Sports Betting Turnover
NSW 34 Real Per Capita Sports Betting Turnover
NSW 35 Total Sports Betting Expenditure
NSW 36 Real Sports Betting Expenditure
NSW 37 Per Capita Sports Betting Expenditure
NSW 38 Real Per Capita Sports Betting Expenditure
NSW 39 Sports Betting Expenditure as a Percentage of Household Disposable Income
NSW 40 Sports Betting Expenditure Share of Market
NSW 41 Government Revenue from Sports Betting
NSW 42 Real Government Revenue from Sports Betting
NSW 43 Per Capita Revenue from Sports Betting
NSW 44 Real Per Capita Revenue from Sports Betting
NSW 45 Government Revenue from Sports Betting as a Percentage of Total Gambling Revenue
NSW 46 Total Gambling Turnover
NSW 47 Real Gambling Turnover
NSW 48 Per Capita Gambling Turnover
NSW 49 Real Per Capita Gambling Turnover
NSW 50 Total Gambling Expenditure
NSW 51 Real Gambling Expenditure
NSW 52 Per Capita Gambling Expenditure
NSW 53 Real Per Capita Gambling Expenditure
NSW 54 Gambling Expenditure Percentage of Household Disposable Income
NSW 55 Gambling Expenditure as a Percentage of Total Gambling Revenue
NSW 56 Government Revenue from Gambling
NSW 57 Real Government Revenue from Gambling
NSW 58 Per Capita Revenue from Gambling
NSW 59 Real Per Capita Revenue from Gambling
NSW 60 Government Revenue from Gambling as a Percentage of Total Gambling Revenue
NSW 61 Gaming Machines Operating as at 30 June
Victoria
VIC 1 Total Racing Turnover
VIC 2 Real Racing Turnover
VIC 3 Per Capita Racing Turnover
VIC 4 Real Per Capita Racing Turnover
VIC 5 Total Racing Expenditure
VIC 6 Real Racing Expenditure
VIC 7 Per Capita Racing Expenditure
VIC 8 Real Per Capita Racing Expenditure
VIC 9 Racing Expenditure as a Percentage of Household Disposable Income

Australian Gambling Statistics 1993–94 to 2018–19, 36th edition
28
VIC 10 Racing Expenditure Share of Market
VIC 11 Government Revenue from Racing
VIC 12 Real Government Revenue from Racing
VIC 13 Per Capita Revenue from Racing
VIC 14 Real Per Capita Revenue from Racing
VIC 15 Government Revenue from Racing as a Percentage of Total Gambling Revenue
VIC 16 Total Gaming Turnover
VIC 17 Real Gaming Turnover
VIC 18 Per Capita Gaming Turnover
VIC 19 Real Per Capita Gaming Turnover
VIC 20 Total Gaming Expenditure
VIC 21 Real Gaming Expenditure
VIC 22 Per Capita Gaming Expenditure
VIC 23 Real Per Capita Gaming Expenditure
VIC 24 Gaming Expenditure as a Percentage of Household Disposable Income
VIC 25 Gaming Expenditure Share of Market
VIC 26 Government Revenue from Gaming
VIC 27 Real Government Revenue from Gaming
VIC 28 Per Capita Revenue from Gaming
VIC 29 Real Per Capita Revenue from Gaming
VIC 30 Government Revenue from Gaming as a Percentage of Total Gambling Revenue
VIC 31 Total Sports Betting Turnover
VIC 32 Real Sports Betting Turnover
VIC 33 Per Capita Sports Betting Turnover
VIC 34 Real Per Capita Sports Betting Turnover
VIC 35 Total Sports Betting Expenditure
VIC 36 Real Sports Betting Expenditure
VIC 37 Per Capita Sports Betting Expenditure
VIC 38 Real Per Capita Sports Betting Expenditure
VIC 39 Sports Betting Expenditure as a Percentage of Household Disposable Income
VIC 40 Sports Betting Expenditure Share of Market
VIC 41 Government Revenue from Sports Betting
VIC 42 Real Government Revenue from Sports Betting
VIC 43 Per Capita Revenue from Sports Betting
VIC 44 Real Per Capita Revenue from Sports Betting
VIC 45 Government Revenue from Sports Betting as a Percentage of Total Gambling Revenue
VIC 46 Total Gambling Turnover
VIC 47 Real Gambling Turnover
VIC 48 Per Capita Gambling Turnover
VIC 49 Real Per Capita Gambling Turnover
VIC 50 Total Gambling Expenditure
VIC 51 Real Gambling Expenditure
VIC 52 Per Capita Gambling Expenditure

Australian Gambling Statistics 1993–94 to 2018–19, 36th edition
29
VIC 53 Real Per Capita Gambling Expenditure
VIC 54 Gambling Expenditure Percentage of Household Disposable Income
VIC 55 Gambling Expenditure as a Percentage of Total Gambling Revenue
VIC 56 Government Revenue from Gambling
VIC 57 Real Government Revenue from Gambling
VIC 58 Per Capita Revenue from Gambling
VIC 59 Real Per Capita Revenue from Gambling
VIC 60 Government Revenue from Gambling as a Percentage of Total Gambling Revenue
VIC 61 Gaming Machines Operating as at 30 June
Queensland
QLD 1 Total Racing Turnover
QLD 2 Real Racing Turnover
QLD 3 Per Capita Racing Turnover
QLD 4 Real Per Capita Racing Turnover
QLD 5 Total Racing Expenditure
QLD 6 Real Racing Expenditure
QLD 7 Per Capita Racing Expenditure
QLD 8 Real Per Capita Racing Expenditure
QLD 9 Racing Expenditure as a Percentage of Household Disposable Income
QLD 10 Racing Expenditure Share of Market
QLD 11 Government Revenue from Racing
QLD 12 Real Government Revenue from Racing
QLD 13 Per Capita Revenue from Racing
QLD 14 Real Per Capita Revenue from Racing
QLD 15 Government Revenue from Racing as a Percentage of Total Gambling Revenue
QLD 16 Total Gaming Turnover
QLD 17 Real Gaming Turnover
QLD 18 Per Capita Gaming Turnover
QLD 19 Real Per Capita Gaming Turnover
QLD 20 Total Gaming Expenditure
QLD 21 Real Gaming Expenditure
QLD 22 Per Capita Gaming Expenditure
QLD 23 Real Per Capita Gaming Expenditure
QLD 24 Gaming Expenditure as a Percentage of Household Disposable Income
QLD 25 Gaming Expenditure Share of Market
QLD 26 Government Revenue from Gaming
QLD 27 Real Government Revenue from Gaming
QLD 28 Per Capita Revenue from Gaming
QLD 29 Real Per Capita Revenue from Gaming
QLD 30 Government Revenue from Gaming as a Percentage of Total Gambling Revenue
QLD 31 Total Sports Betting Turnover
QLD 32 Real Sports Betting Turnover

Australian Gambling Statistics 1993–94 to 2018–19, 36th edition
30
QLD 33 Per Capita Sports Betting Turnover
QLD 34 Real Per Capita Sports Betting Turnover
QLD 35 Total Sports Betting Expenditure
QLD 36 Real Sports Betting Expenditure
QLD 37 Per Capita Sports Betting Expenditure
QLD 38 Real Per Capita Sports Betting Expenditure
QLD 39 Sports Betting Expenditure as a Percentage of Household Disposable Income
QLD 40 Sports Betting Expenditure Share of Market
QLD 41 Government Revenue from Sports Betting
QLD 42 Real Government Revenue from Sports Betting
QLD 43 Per Capita Revenue from Sports Betting
QLD 44 Real Per Capita Revenue from Sports Betting
QLD 45 Government Revenue from Sports Betting as a Percentage of Total Gambling Revenue
QLD 46 Total Gambling Turnover
QLD 47 Real Gambling Turnover
QLD 48 Per Capita Gambling Turnover
QLD 49 Real Per Capita Gambling Turnover
QLD 50 Total Gambling Expenditure
QLD 51 Real Gambling Expenditure
QLD 52 Per Capita Gambling Expenditure
QLD 53 Real Per Capita Gambling Expenditure
QLD 54 Gambling Expenditure Percentage of Household Disposable Income
QLD 55 Gambling Expenditure as a Percentage of Total Gambling Revenue
QLD 56 Government Revenue from Gambling
QLD 57 Real Government Revenue from Gambling
QLD 58 Per Capita Revenue from Gambling
QLD 59 Real Per Capita Revenue from Gambling
QLD 60 Government Revenue from Gambling as a Percentage of Total Gambling Revenue
QLD 61 Gaming Machines Operating as at 30 June
South Australia
SA 1 Total Racing Turnover
SA 2 Real Racing Turnover
SA 3 Per Capita Racing Turnover
SA 4 Real Per Capita Racing Turnover
SA 5 Total Racing Expenditure
SA 6 Real Racing Expenditure
SA 7 Per Capita Racing Expenditure
SA 8 Real Per Capita Racing Expenditure
SA 9 Racing Expenditure as a Percentage of Household Disposable Income
SA 10 Racing Expenditure Share of Market
SA 11 Government Revenue from Racing
SA 12 Real Government Revenue from Racing

Australian Gambling Statistics 1993–94 to 2018–19, 36th edition
31
SA 13 Per Capita Revenue from Racing
SA 14 Real Per Capita Revenue from Racing
SA 15 Government Revenue from Racing as a Percentage of Total Gambling Revenue
SA 16 Total Gaming Turnover
SA 17 Real Gaming Turnover
SA 18 Per Capita Gaming Turnover
SA 19 Real Per Capita Gaming Turnover
SA 20 Total Gaming Expenditure
SA 21 Real Gaming Expenditure
SA 22 Per Capita Gaming Expenditure
SA 23 Real Per Capita Gaming Expenditure
SA 24 Gaming Expenditure as a Percentage of Household Disposable Income
SA 25 Gaming Expenditure Share of Market
SA 26 Government Revenue from Gaming
SA 27 Real Government Revenue from Gaming
SA 28 Per Capita Revenue from Gaming
SA 29 Real Per Capita Revenue from Gaming
SA 30 Government Revenue from Gaming as a Percentage of Total Gambling Revenue
SA 31 Total Sports Betting Turnover
SA 32 Real Sports Betting Turnover
SA 33 Per Capita Sports Betting Turnover
SA 34 Real Per Capita Sports Betting Turnover
SA 35 Total Sports Betting Expenditure
SA 36 Real Sports Betting Expenditure
SA 37 Per Capita Sports Betting Expenditure
SA 38 Real Per Capita Sports Betting Expenditure
SA 39 Sports Betting Expenditure as a Percentage of Household Disposable Income
SA 40 Sports Betting Expenditure Share of Market
SA 41 Government Revenue from Sports Betting
SA 42 Real Government Revenue from Sports Betting
SA 43 Per Capita Revenue from Sports Betting
SA 44 Real Per Capita Revenue from Sports Betting
SA 45 Government Revenue from Sports Betting as a Percentage of Total Gambling Revenue
SA 46 Total Gambling Turnover
SA 47 Real Gambling Turnover
SA 48 Per Capita Gambling Turnover
SA 49 Real Per Capita Gambling Turnover
SA 50 Total Gambling Expenditure
SA 51 Real Gambling Expenditure
SA 52 Per Capita Gambling Expenditure
SA 53 Real Per Capita Gambling Expenditure
SA 54 Gambling Expenditure Percentage of Household Disposable Income
SA 55 Gambling Expenditure as a Percentage of Total Gambling Revenue

Australian Gambling Statistics 1993–94 to 2018–19, 36th edition
32
SA 56 Government Revenue from Gambling
SA 57 Real Government Revenue from Gambling
SA 58 Per Capita Revenue from Gambling
SA 59 Real Per Capita Revenue from Gambling
SA 60 Government Revenue from Gambling as a Percentage of Total Gambling Revenue
SA 61 Gaming Machines Operating as at 30 June
Western Australia
WA 1 Total Racing Turnover
WA 2 Real Racing Turnover
WA 3 Per Capita Racing Turnover
WA 4 Real Per Capita Racing Turnover
WA 5 Total Racing Expenditure
WA 6 Real Racing Expenditure
WA 7 Per Capita Racing Expenditure
WA 8 Real Per Capita Racing Expenditure
WA 9 Racing Expenditure as a Percentage of Household Disposable Income
WA 10 Racing Expenditure Share of Market
WA 11 Government Revenue from Racing
WA 12 Real Government Revenue from Racing
WA 13 Per Capita Revenue from Racing
WA 14 Real Per Capita Revenue from Racing
WA 15 Government Revenue from Racing as a Percentage of Total Gambling Revenue
WA 16 Total Gaming Turnover
WA 17 Real Gaming Turnover
WA 18 Per Capita Gaming Turnover
WA 19 Real Per Capita Gaming Turnover
WA 20 Total Gaming Expenditure
WA 21 Real Gaming Expenditure
WA 22 Per Capita Gaming Expenditure
WA 23 Real Per Capita Gaming Expenditure
WA 24 Gaming Expenditure as a Percentage of Household Disposable Income
WA 25 Gaming Expenditure Share of Market
WA 26 Government Revenue from Gaming
WA 27 Real Government Revenue from Gaming
WA 28 Per Capita Revenue from Gaming
WA 29 Real Per Capita Revenue from Gaming
WA 30 Government Revenue from Gaming as a Percentage of Total Gambling Revenue
WA 31 Total Sports Betting Turnover
WA 32 Real Sports Betting Turnover
WA 33 Per Capita Sports Betting Turnover
WA 34 Real Per Capita Sports Betting Turnover
WA 35 Total Sports Betting Expenditure

Australian Gambling Statistics 1993–94 to 2018–19, 36th edition
33
WA 36 Real Sports Betting Expenditure
WA 37 Per Capita Sports Betting Expenditure
WA 38 Real Per Capita Sports Betting Expenditure
WA 39 Sports Betting Expenditure as a Percentage of Household Disposable Income
WA 40 Sports Betting Expenditure Share of Market
WA 41 Government Revenue from Sports Betting
WA 42 Real Government Revenue from Sports Betting
WA 43 Per Capita Revenue from Sports Betting
WA 44 Real Per Capita Revenue from Sports Betting
WA 45 Government Revenue from Sports Betting as a Percentage of Total Gambling Revenue
WA 46 Total Gambling Turnover
WA 47 Real Gambling Turnover
WA 48 Per Capita Gambling Turnover
WA 49 Real Per Capita Gambling Turnover
WA 50 Total Gambling Expenditure
WA 51 Real Gambling Expenditure
WA 52 Per Capita Gambling Expenditure
WA 53 Real Per Capita Gambling Expenditure
WA 54 Gambling Expenditure Percentage of Household Disposable Income
WA 55 Gambling Expenditure as a Percentage of Total Gambling Revenue
WA 56 Government Revenue from Gambling
WA 57 Real Government Revenue from Gambling
WA 58 Per Capita Revenue from Gambling
WA 59 Real Per Capita Revenue from Gambling
WA 60 Government Revenue from Gambling as a Percentage of Total Gambling Revenue
WA 61 Gaming Machines Operating as at 30 June
Tasmania
TAS 1 Total Racing Turnover
TAS 2 Real Racing Turnover
TAS 3 Per Capita Racing Turnover
TAS 4 Real Per Capita Racing Turnover
TAS 5 Total Racing Expenditure
TAS 6 Real Racing Expenditure
TAS 7 Per Capita Racing Expenditure
TAS 8 Real Per Capita Racing Expenditure
TAS 9 Racing Expenditure as a Percentage of Household Disposable Income
TAS 10 Racing Expenditure Share of Market
TAS 11 Government Revenue from Racing
TAS 12 Real Government Revenue from Racing
TAS 13 Per Capita Revenue from Racing
TAS 14 Real Per Capita Revenue from Racing
TAS 15 Government Revenue from Racing as a Percentage of Total Gambling Revenue

Australian Gambling Statistics 1993–94 to 2018–19, 36th edition
34
TAS 16 Total Gaming Turnover
TAS 17 Real Gaming Turnover
TAS 18 Per Capita Gaming Turnover
TAS 19 Real Per Capita Gaming Turnover
TAS 20 Total Gaming Expenditure
TAS 21 Real Gaming Expenditure
TAS 22 Per Capita Gaming Expenditure
TAS 23 Real Per Capita Gaming Expenditure
TAS 24 Gaming Expenditure as a Percentage of Household Disposable Income
TAS 25 Gaming Expenditure Share of Market
TAS 26 Government Revenue from Gaming
TAS 27 Real Government Revenue from Gaming
TAS 28 Per Capita Revenue from Gaming
TAS 29 Real Per Capita Revenue from Gaming
TAS 30 Government Revenue from Gaming as a Percentage of Total Gambling Revenue
TAS 31 Total Sports Betting Turnover
TAS 32 Real Sports Betting Turnover
TAS 33 Per Capita Sports Betting Turnover
TAS 34 Real Per Capita Sports Betting Turnover
TAS 35 Total Sports Betting Expenditure
TAS 36 Real Sports Betting Expenditure
TAS 37 Per Capita Sports Betting Expenditure
TAS 38 Real Per Capita Sports Betting Expenditure
TAS 39 Sports Betting Expenditure as a Percentage of Household Disposable Income
TAS 40 Sports Betting Expenditure Share of Market
TAS 41 Government Revenue from Sports Betting
TAS 42 Real Government Revenue from Sports Betting
TAS 43 Per Capita Revenue from Sports Betting
TAS 44 Real Per Capita Revenue from Sports Betting
TAS 45 Government Revenue from Sports Betting as a Percentage of Total Gambling Revenue
TAS 46 Total Gambling Turnover
TAS 47 Real Gambling Turnover
TAS 48 Per Capita Gambling Turnover
TAS 49 Real Per Capita Gambling Turnover
TAS 50 Total Gambling Expenditure
TAS 51 Real Gambling Expenditure
TAS 52 Per Capita Gambling Expenditure
TAS 53 Real Per Capita Gambling Expenditure
TAS 54 Gambling Expenditure Percentage of Household Disposable Income
TAS 55 Gambling Expenditure as a Percentage of Total Gambling Revenue
TAS 56 Government Revenue from Gambling
TAS 57 Real Government Revenue from Gambling
TAS 58 Per Capita Revenue from Gambling

Australian Gambling Statistics 1993–94 to 2018–19, 36th edition
35
TAS 59 Real Per Capita Revenue from Gambling
TAS 60 Government Revenue from Gambling as a Percentage of Total Gambling Revenue
TAS 61 Gaming Machines Operating as at 30 June
Australian Capital Territory
ACT 1 Total Racing Turnover
ACT 2 Real Racing Turnover
ACT 3 Per Capita Racing Turnover
ACT 4 Real Per Capita Racing Turnover
ACT 5 Total Racing Expenditure
ACT 6 Real Racing Expenditure
ACT 7 Per Capita Racing Expenditure
ACT 8 Real Per Capita Racing Expenditure
ACT 9 Racing Expenditure as a Percentage of Household Disposable Income
ACT 10 Racing Expenditure Share of Market
ACT 11 Government Revenue from Racing
ACT 12 Real Government Revenue from Racing
ACT 13 Per Capita Revenue from Racing
ACT 14 Real Per Capita Revenue from Racing
ACT 15 Government Revenue from Racing as a Percentage of Total Gambling Revenue
ACT 16 Total Gaming Turnover
ACT 17 Real Gaming Turnover
ACT 18 Per Capita Gaming Turnover
ACT 19 Real Per Capita Gaming Turnover
ACT 20 Total Gaming Expenditure
ACT 21 Real Gaming Expenditure
ACT 22 Per Capita Gaming Expenditure
ACT 23 Real Per Capita Gaming Expenditure
ACT 24 Gaming Expenditure as a Percentage of Household Disposable Income
ACT 25 Gaming Expenditure Share of Market
ACT 26 Government Revenue from Gaming
ACT 27 Real Government Revenue from Gaming
ACT 28 Per Capita Revenue from Gaming
ACT 29 Real Per Capita Revenue from Gaming
ACT 30 Government Revenue from Gaming as a Percentage of Total Gambling Revenue
ACT 31 Total Sports Betting Turnover
ACT 32 Real Sports Betting Turnover
ACT 33 Per Capita Sports Betting Turnover
ACT 34 Real Per Capita Sports Betting Turnover
ACT 35 Total Sports Betting Expenditure
ACT 36 Real Sports Betting Expenditure
ACT 37 Per Capita Sports Betting Expenditure
ACT 38 Real Per Capita Sports Betting Expenditure
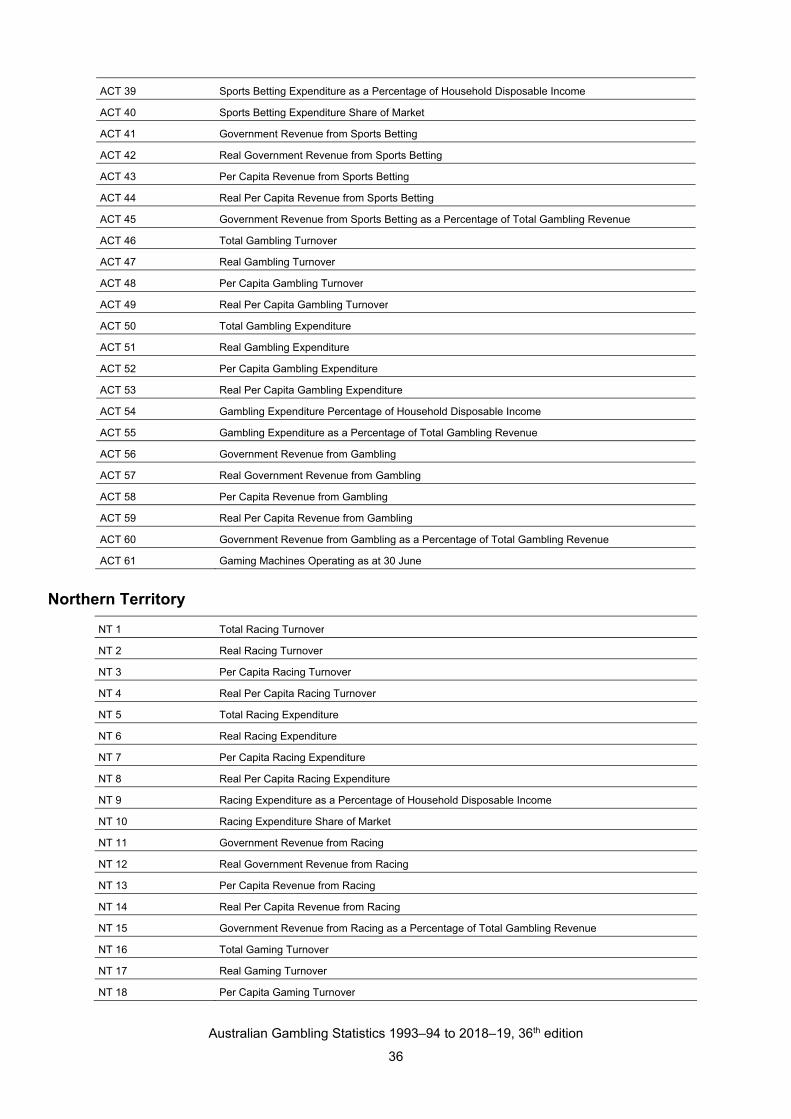
Australian Gambling Statistics 1993–94 to 2018–19, 36th edition
36
ACT 39 Sports Betting Expenditure as a Percentage of Household Disposable Income
ACT 40 Sports Betting Expenditure Share of Market
ACT 41 Government Revenue from Sports Betting
ACT 42 Real Government Revenue from Sports Betting
ACT 43 Per Capita Revenue from Sports Betting
ACT 44 Real Per Capita Revenue from Sports Betting
ACT 45 Government Revenue from Sports Betting as a Percentage of Total Gambling Revenue
ACT 46 Total Gambling Turnover
ACT 47 Real Gambling Turnover
ACT 48 Per Capita Gambling Turnover
ACT 49 Real Per Capita Gambling Turnover
ACT 50 Total Gambling Expenditure
ACT 51 Real Gambling Expenditure
ACT 52 Per Capita Gambling Expenditure
ACT 53 Real Per Capita Gambling Expenditure
ACT 54 Gambling Expenditure Percentage of Household Disposable Income
ACT 55 Gambling Expenditure as a Percentage of Total Gambling Revenue
ACT 56 Government Revenue from Gambling
ACT 57 Real Government Revenue from Gambling
ACT 58 Per Capita Revenue from Gambling
ACT 59 Real Per Capita Revenue from Gambling
ACT 60 Government Revenue from Gambling as a Percentage of Total Gambling Revenue
ACT 61 Gaming Machines Operating as at 30 June
Northern Territory
NT 1 Total Racing Turnover
NT 2 Real Racing Turnover
NT 3 Per Capita Racing Turnover
NT 4 Real Per Capita Racing Turnover
NT 5 Total Racing Expenditure
NT 6 Real Racing Expenditure
NT 7 Per Capita Racing Expenditure
NT 8 Real Per Capita Racing Expenditure
NT 9 Racing Expenditure as a Percentage of Household Disposable Income
NT 10 Racing Expenditure Share of Market
NT 11 Government Revenue from Racing
NT 12 Real Government Revenue from Racing
NT 13 Per Capita Revenue from Racing
NT 14 Real Per Capita Revenue from Racing
NT 15 Government Revenue from Racing as a Percentage of Total Gambling Revenue
NT 16 Total Gaming Turnover
NT 17 Real Gaming Turnover
NT 18 Per Capita Gaming Turnover

Australian Gambling Statistics 1993–94 to 2018–19, 36th edition
37
NT 19 Real Per Capita Gaming Turnover
NT 20 Total Gaming Expenditure
NT 21 Real Gaming Expenditure
NT 22 Per Capita Gaming Expenditure
NT 23 Real Per Capita Gaming Expenditure
NT 24 Gaming Expenditure as a Percentage of Household Disposable Income
NT 25 Gaming Expenditure Share of Market
NT 26 Government Revenue from Gaming
NT 27 Real Government Revenue from Gaming
NT 28 Per Capita Revenue from Gaming
NT 29 Real Per Capita Revenue from Gaming
NT 30 Government Revenue from Gaming as a Percentage of Total Gambling Revenue
NT 31 Total Sports Betting Turnover
NT 32 Real Sports Betting Turnover
NT 33 Per Capita Sports Betting Turnover
NT 34 Real Per Capita Sports Betting Turnover
NT 35 Total Sports Betting Expenditure
NT 36 Real Sports Betting Expenditure
NT 37 Per Capita Sports Betting Expenditure
NT 38 Real Per Capita Sports Betting Expenditure
NT 39 Sports Betting Expenditure as a Percentage of Household Disposable Income
NT 40 Sports Betting Expenditure Share of Market
NT 41 Government Revenue from Sports Betting
NT 42 Real Government Revenue from Sports Betting
NT 43 Per Capita Revenue from Sports Betting
NT 44 Real Per Capita Revenue from Sports Betting
NT 45 Government Revenue from Sports Betting as a Percentage of Total Gambling Revenue
NT 46 Total Gambling Turnover
NT 47 Real Gambling Turnover
NT 48 Per Capita Gambling Turnover
NT 49 Real Per Capita Gambling Turnover
NT 50 Total Gambling Expenditure
NT 51 Real Gambling Expenditure
NT 52 Per Capita Gambling Expenditure
NT 53 Real Per Capita Gambling Expenditure
NT 54 Gambling Expenditure Percentage of Household Disposable Income
NT 55 Gambling Expenditure as a Percentage of Total Gambling Revenue
NT 56 Government Revenue from Gambling
NT 57 Real Government Revenue from Gambling
NT 58 Per Capita Revenue from Gambling
NT 59 Real Per Capita Revenue from Gambling
NT 60 Government Revenue from Gambling as a Percentage of Total Gambling Revenue
NT 61 Gaming Machines Operating as at 30 June

Australian Gambling Statistics 1993–94 to 2018–19, 36th edition
38
2.3 Tables by gambling product
Product Table number Table name
On-course totalisator On Tot 1 On-Course Totalisator Turnover
On Tot 2 Real On-Course Totalisator Turnover
On Tot 3 Per Capita On-Course Totalisator Turnover
On Tot 4 Real Per Capita On-Course Totalisator Turnover
On Tot 5 On-Course Totalisator Expenditure
On Tot 6 Real On-Course Totalisator Expenditure
On Tot 7 Per Capita On-Course Totalisator Expenditure
On Tot 8 Real Per Capita On-Course Totalisator Expenditure
On Tot 9
On-Course Totalisator Expenditure as a Percentage of Household Disposable Income
On Tot 10 Government Revenue from On-Course Totalisator
On Tot 11 Real Government Revenue from On-Course Totalisator
On Tot 12 Per Capita Government Revenue from On-Course Totalisator
On Tot 13 Real Per Capita Government Revenue from On-Course Totalisator
On Tot 14
On-Course Totalisator Revenue as a Percentage of Total State Gambling Revenue
TAB TAB 1 TAB Turnover
TAB 2 Real TAB Turnover
TAB 3 Per Capita TAB Turnover
TAB 4 Real Per Capita TAB Turnover
TAB 5 TAB Expenditure
TAB 6 Real TAB Expenditure
TAB 7 Per Capita TAB Expenditure
TAB 8 Real Per Capita TAB Expenditure
TAB 9 TAB Expenditure as a Percentage of Household Disposable Income
TAB 10 Government Revenue from TAB
TAB 11 Real Government Revenue from TAB
TAB 12 Per Capita Government Revenue from TAB
TAB 13 Real Per Capita Government Revenue from TAB
TAB 14 TAB Revenue as a Percentage of Total State Gambling Revenue
On-course bookmaker On Book 1 On-Course Bookmaker Turnover
On Book 2 Real On-Course Bookmaker Turnover
On Book 3 Per Capita On-Course Bookmaker Turnover
On Book 4 Real Per Capita On-Course Bookmaker Turnover
On Book 5 On-Course Bookmaker Expenditure
On Book 6 Real On-Course Bookmaker Expenditure
On Book 7 Per Capita On-Course Bookmaker Expenditure
On Book 8 Real Per Capita On-Course Bookmaker Expenditure
On Book 9
On-Course Bookmaker Expenditure as a Percentage of Household Disposable Income
Off-course bookmaker Off Book 1 Off-Course Bookmaker Turnover
Off Book 2 Real Off-Course Bookmaker Turnover
Off Book 3 Per Capita Off-Course Bookmaker Turnover

Australian Gambling Statistics 1993–94 to 2018–19, 36th edition
39
Off Book 4 Real Per Capita Off-Course Bookmaker Turnover
Off Book 5 Off-Course Bookmaker Expenditure
Off Book 6 Real Off-Course Bookmaker Expenditure
Off Book 7 Per Capita Off-Course Bookmaker Expenditure
Off Book 8 Real Per Capita Off-Course Bookmaker Expenditure
Off Book 9
Off-Course Bookmaker Expenditure as a Percentage of Household Disposable Income
Bookmakers Book 10 Government Revenue from Bookmakers
Book 11 Real Government Revenue from Bookmakers
Book 12 Per Capita Government Revenue from Bookmakers
Book 13 Real Per Capita Government Revenue from Bookmakers
Book 14 Bookmakers Revenue as a Percentage of Total State Gambling Revenue
Racing Racing 1 Total Racing Turnover
Racing 2 Real Total Racing Turnover
Racing 3 Per Capita Total Racing Turnover
Racing 4 Real Per Capita Total Racing Turnover
Racing 5 Total Racing Expenditure
Racing 6 Real Total Racing Expenditure
Racing 7 Per Capita Total Racing Expenditure
Racing 8 Real Per Capita Total Racing Expenditure
Racing 9
Total Racing Expenditure as a Percentage of Household Disposable Income
Racing 10 Government Revenue from Total Racing
Racing 11 Real Government Revenue from Total Racing
Racing 12 Per Capita Government Revenue from Total Racing
Racing 13 Real Per Capita Government Revenue from Total Racing
Racing 14 Total Racing Revenue as a Percentage of Total State Gambling Revenue
Casino Casino 1 Casino Turnover
Casino 2 Real Casino Turnover
Casino 3 Per Capita Casino Turnover
Casino 4 Real Per Capita Casino Turnover
Casino 5 Casino Expenditure
Casino 6 Real Casino Expenditure
Casino 7 Per Capita Casino Expenditure
Casino 8 Real Per Capita Casino Expenditure
Casino 9 Casino Expenditure as a Percentage of Household Disposable Income
Casino 10 Government Revenue from Casino Gaming
Casino 11 Real Government Revenue from Casino Gaming
Casino 12 Per Capita Government Revenue from Casino Gaming
Casino 13 Real Per Capita Government Revenue from Casino Gaming
Casino 14 Casino Revenue as a Percentage of Total State Gambling Revenue
Minor gaming Minor Gaming 1 Minor Gaming Turnover
Minor Gaming 2 Real Minor Gaming Turnover
Minor Gaming 3 Per Capita Minor Gaming Turnover
Minor Gaming 4 Real Per Capita Minor Gaming Turnover

Australian Gambling Statistics 1993–94 to 2018–19, 36th edition
40
Minor Gaming 5 Minor Gaming Expenditure
Minor Gaming 6 Real Minor Gaming Expenditure
Minor Gaming 7 Per Capita Minor Gaming Expenditure
Minor Gaming 8 Real Per Capita Minor Gaming Expenditure
Minor Gaming 9
Minor Gaming Expenditure as a Percentage of Household Disposable Income
Minor Gaming 10 Government Revenue from Minor Gaming
Minor Gaming 11 Real Government Revenue from Minor Gaming
Minor Gaming 12 Per Capita Government Revenue from Minor Gaming
Minor Gaming 13 Real Per Capita Government Revenue from Minor Gaming
Minor Gaming 14
Minor Gaming Revenue as a Percentage of Total State Gambling Revenue
Lottery Lottery 1 Lottery Turnover
Lottery 2 Real Lottery Turnover
Lottery 3 Per Capita Lottery Turnover
Lottery 4 Real Per Capita Lottery Turnover
Lottery 5 Lottery Expenditure
Lottery 6 Real Lottery Expenditure
Lottery 7 Per Capita Lottery Expenditure
Lottery 8 Real Per Capita Lottery Expenditure
Lottery 9 Lottery Expenditure as a Percentage of Household Disposable Income
Lotto Lotto 1 Lotto-Tattslotto Turnover
Lotto 2 Real Lotto-Tattslotto Turnover
Lotto 3 Per Capita Lotto-Tattslotto Turnover
Lotto 4 Real Per Capita Lotto-Tattslotto Turnover
Lotto 5 Lotto-Tattslotto Expenditure
Lotto 6 Real Lotto-Tattslotto Expenditure
Lotto 7 Per Capita Lotto-Tattslotto Expenditure
Lotto 8 Real Per Capita Lotto-Tattslotto Expenditure
Lotto 9
Lotto-Tattslotto Expenditure as a Percentage of Household Disposable Income
Instant Lotto Instant Lotto 1 Instant Lottery Turnover
Instant Lotto 2 Real Instant Lottery Turnover
Instant Lotto 3 Per Capita Instant Lottery Turnover
Instant Lotto 4 Real Per Capita Instant Lottery Turnover
Instant Lotto 5 Instant Lottery Expenditure
Instant Lotto 6 Real Instant Lottery Expenditure
Instant Lotto 7 Per Capita Instant Lottery Expenditure
Instant Lotto 8 Real Per Capita Instant Lottery Expenditure
Instant Lotto 9
Instant Lottery Expenditure as a Percentage of Household Disposable Income
Pools Pools 1 Pools Turnover
Pools 2 Real Pools Turnover
Pools 3 Per Capita Pools Turnover
Pools 4 Real Per Capita Pools Turnover
Pools 5 Pools Expenditure

Australian Gambling Statistics 1993–94 to 2018–19, 36th edition
41
Pools 6 Real Pools Expenditure
Pools 7 Per Capita Pools Expenditure
Pools 8 Real Per Capita Pools Expenditure
Pools 9 Pools Expenditure as a Percentage of Household Disposable Income
Keno Keno 1 Keno Turnover
Keno 2 Real Keno Turnover
Keno 3 Per Capita Keno Turnover
Keno 4 Real Per Capita Keno Turnover
Keno 5 Keno Expenditure
Keno 6 Real Keno Expenditure
Keno 7 Per Capita Keno Expenditure
Keno 8 Real Per Capita Keno Expenditure
Keno 9 Keno Expenditure as a Percentage of Household Disposable Income
Gaming machines Gaming Machines 1 Gaming Machines Turnover
Gaming Machines 2 Real Gaming Machines Turnover
Gaming Machines 3 Per Capita Gaming Machines Turnover
Gaming Machines 4 Real Per Capita Gaming Machines Turnover
Gaming Machines 5 Gaming Machines Expenditure
Gaming Machines 6 Real Gaming Machines Expenditure
Gaming Machines 7 Per Capita Gaming Machines Expenditure
Gaming Machines 8 Real Per Capita Gaming Machines Expenditure
Gaming Machines 9
Gaming Machines Expenditure as a Percentage of Household Disposable Income
Gaming Gaming 1 Total Gaming Turnover
Gaming 2 Real Total Gaming Turnover
Gaming 3 Per Capita Total Gaming Turnover
Gaming 4 Real Per Capita Total Gaming Turnover
Gaming 5 Total Gaming Expenditure
Gaming 6 Real Total Gaming Expenditure
Gaming 7 Per Capita Total Gaming Expenditure
Gaming 8 Real Per Capita Total Gaming Expenditure
Gaming 9
Total Gaming Expenditure as a Percentage of Household Disposable Income
Gaming 10 Government Revenue from Total Gaming
Gaming 11 Real Government Revenue from Total Gaming
Gaming 12 Per Capita Government Revenue from Total Gaming
Gaming 13 Real Per Capita Government Revenue from Total Gaming
Gaming 14 Total Gaming Revenue as a Percentage of Total State Gambling Revenue
TAB fixed odds TAB FO 1 TAB Fixed Odds Turnover
TAB FO 2 Real TAB Fixed Odds Turnover
TAB FO 3 Per Capita TAB Fixed Odds Turnover
TAB FO 4 Real Per Capita TAB Fixed Odds Turnover
TAB FO 5 TAB Fixed Odds Expenditure
TAB FO 6 Real TAB Fixed Odds Expenditure
TAB FO 7 Per Capita TAB Fixed Odds Expenditure
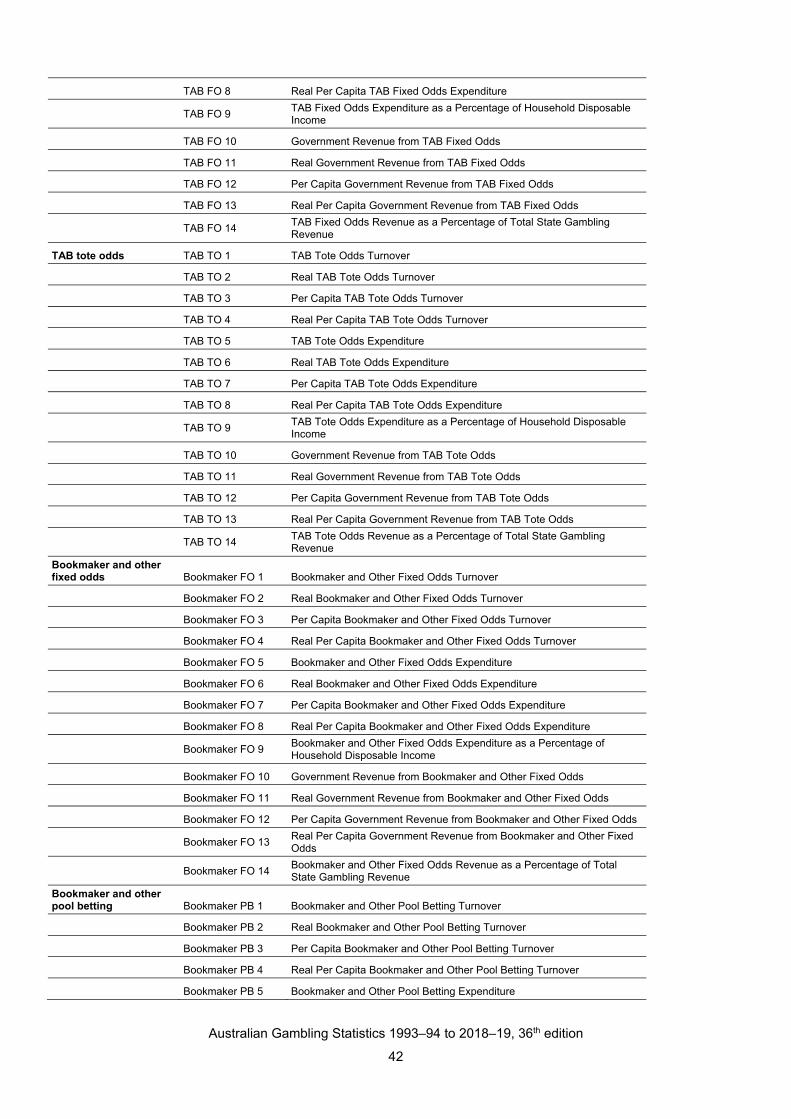
Australian Gambling Statistics 1993–94 to 2018–19, 36th edition
42
TAB FO 8 Real Per Capita TAB Fixed Odds Expenditure
TAB FO 9
TAB Fixed Odds Expenditure as a Percentage of Household Disposable Income
TAB FO 10 Government Revenue from TAB Fixed Odds
TAB FO 11 Real Government Revenue from TAB Fixed Odds
TAB FO 12 Per Capita Government Revenue from TAB Fixed Odds
TAB FO 13 Real Per Capita Government Revenue from TAB Fixed Odds
TAB FO 14
TAB Fixed Odds Revenue as a Percentage of Total State Gambling Revenue
TAB tote odds TAB TO 1 TAB Tote Odds Turnover
TAB TO 2 Real TAB Tote Odds Turnover
TAB TO 3 Per Capita TAB Tote Odds Turnover
TAB TO 4 Real Per Capita TAB Tote Odds Turnover
TAB TO 5 TAB Tote Odds Expenditure
TAB TO 6 Real TAB Tote Odds Expenditure
TAB TO 7 Per Capita TAB Tote Odds Expenditure
TAB TO 8 Real Per Capita TAB Tote Odds Expenditure
TAB TO 9
TAB Tote Odds Expenditure as a Percentage of Household Disposable Income
TAB TO 10 Government Revenue from TAB Tote Odds
TAB TO 11 Real Government Revenue from TAB Tote Odds
TAB TO 12 Per Capita Government Revenue from TAB Tote Odds
TAB TO 13 Real Per Capita Government Revenue from TAB Tote Odds
TAB TO 14
TAB Tote Odds Revenue as a Percentage of Total State Gambling Revenue
Bookmaker and other fixed odds Bookmaker FO 1 Bookmaker and Other Fixed Odds Turnover
Bookmaker FO 2 Real Bookmaker and Other Fixed Odds Turnover
Bookmaker FO 3 Per Capita Bookmaker and Other Fixed Odds Turnover
Bookmaker FO 4 Real Per Capita Bookmaker and Other Fixed Odds Turnover
Bookmaker FO 5 Bookmaker and Other Fixed Odds Expenditure
Bookmaker FO 6 Real Bookmaker and Other Fixed Odds Expenditure
Bookmaker FO 7 Per Capita Bookmaker and Other Fixed Odds Expenditure
Bookmaker FO 8 Real Per Capita Bookmaker and Other Fixed Odds Expenditure
Bookmaker FO 9
Bookmaker and Other Fixed Odds Expenditure as a Percentage of Household Disposable Income
Bookmaker FO 10 Government Revenue from Bookmaker and Other Fixed Odds
Bookmaker FO 11 Real Government Revenue from Bookmaker and Other Fixed Odds
Bookmaker FO 12 Per Capita Government Revenue from Bookmaker and Other Fixed Odds
Bookmaker FO 13
Real Per Capita Government Revenue from Bookmaker and Other Fixed Odds
Bookmaker FO 14
Bookmaker and Other Fixed Odds Revenue as a Percentage of Total State Gambling Revenue
Bookmaker and other pool betting Bookmaker PB 1 Bookmaker and Other Pool Betting Turnover
Bookmaker PB 2 Real Bookmaker and Other Pool Betting Turnover
Bookmaker PB 3 Per Capita Bookmaker and Other Pool Betting Turnover
Bookmaker PB 4 Real Per Capita Bookmaker and Other Pool Betting Turnover
Bookmaker PB 5 Bookmaker and Other Pool Betting Expenditure

Australian Gambling Statistics 1993–94 to 2018–19, 36th edition
43
Bookmaker PB 6 Real Bookmaker and Other Pool Betting Expenditure
Bookmaker PB 7 Per Capita Bookmaker and Other Pool Betting Expenditure
Bookmaker PB 8 Real Per Capita Bookmaker and Other Pool Betting Expenditure
Bookmaker PB 9
Bookmaker and Other Pool Betting Expenditure as a Percentage of Household Disposable Income
Bookmaker PB 10 Government Revenue from Bookmaker and Other Pool Betting
Bookmaker PB 11 Real Government Revenue from Bookmaker and Other Pool Betting
Bookmaker PB 12 Per Capita Government Revenue from Bookmaker and Other Pool Betting
Bookmaker PB 13
Real Per Capita Government Revenue from Bookmaker and Other Pool Betting
Bookmaker PB 14
Bookmaker and Other Pool Betting Revenue as a Percentage of Total State Gambling Revenue
Sports betting Sports Betting 1 Total Sports Betting Turnover
Sports Betting 2 Real Total Sports Betting Turnover
Sports Betting 3 Per Capita Total Sports Betting Turnover
Sports Betting 4 Real Per Capita Total Sports Betting Turnover
Sports Betting 5 Total Sports Betting Expenditure
Sports Betting 6 Real Total Sports Betting Expenditure
Sports Betting 7 Per Capita Total Sports Betting Expenditure
Sports Betting 8 Real Per Capita Total Sports Betting Expenditure
Sports Betting 9
Total Sports Betting Expenditure as a Percentage of Household Disposable Income
Sports Betting 10 Government Revenue from Total Sports Betting
Sports Betting 11 Real Government Revenue from Total Sports Betting
Sports Betting 12 Per Capita Government Revenue from Total Sports Betting
Sports Betting 13 Real Per Capita Government Revenue from Total Sports Betting
Sports Betting 14
Total Sports Betting Revenue as a Percentage of Total State Gambling Revenue
All gambling All Gambling 1 Total Gambling Turnover
All Gambling 2 Real Total Gambling Turnover
All Gambling 3 Per Capita Total Gambling Turnover
All Gambling 4 Real Per Capita Total Gambling Turnover
All Gambling 5 Total Gambling Expenditure
All Gambling 6 Real Total Gambling Expenditure
All Gambling 7 Per Capita Total Gambling Expenditure
All Gambling 8 Real Per Capita Total Gambling Expenditure
All Gambling 9
Total Gambling Expenditure as a Percentage of Household Disposable Income
All Gambling 10 Government Revenue from Total Gambling
All Gambling 11 Real Government Revenue from Total Gambling
All Gambling 12 Per Capita Government Revenue from Total Gambling
All Gambling 13 Real Per Capita Government Revenue from Total Gambling
All Gambling 14 Total Australian Gambling Expenditure
All Gambling 15 Total Real Australian Gambling Expenditure
All Gambling 16 Total Australian Per Capita Gambling Expenditure
All Gambling 17 Total Real Australian Per Capita Gambling Expenditure
All Gambling 18
Total Australian Gambling Expenditure as a Percentage of Household Disposable Income

Australian Gambling Statistics 1993–94 to 2018–19, 36th edition
44
All Gambling 19 Total Government Revenue from Gambling
All Gambling 20 Real Total Government Revenue from Gambling
All Gambling 21 Per Capita Total Government Revenue from Gambling
All Gambling 22 Real Per Capita Total Government Revenue from Gambling
All Gambling 23 Racing Revenue Components
All Gambling 24 Real Racing Revenue Components
All Gambling 25 Per Capita Racing Revenue Components
All Gambling 26 Real Per Capita Racing Revenue Components
All Gambling 27 Sports Betting Revenue Components
All Gambling 28 Real Sports Betting Revenue Components
All Gambling 29 Per Capita Sports Betting Revenue Components
All Gambling 30 Real Per Capita Sports Betting Revenue Components
All Gambling 31 Total Gaming Machines Operating as at 30 June

Australian Gambling Statistics36th editionSummary tables 2018–19
Released April 2021
Prepared by Queensland Government Statistician's Office, Queensland Treasury.ISSN: 1833-6337
The cooperation of all Australian state and territory governments is gratefully acknowledged.
Queensland Government Statistician's Officewww.qgso.qld.gov.au
Data should be read in conjunction with the Explanatory notes. Refer to the Glossary section for a full description of terms.
Disclaimer
No warranty is given as to the correctness or completeness of the information in this publication.
Licence
© The State of Queensland (Queensland Treasury) 2021
To view a copy of this licence, visit http://creativecommons.org/licenses/by/4.0/
While great care has been taken in the preparation of this publication and each Australian state and territory has been asked to verify its own data in detail, it is nevertheless necessary to caution users concerning the complete accuracy of all data.
The State of Queensland and each Australian state and territory expressly disclaim all and any liability (including all liability from or attributable to any negligent or wrongful act or omission) to any persons whatsoever in respect of anything done or omitted to be done by any such person in reliance, whether in whole or in part, upon any of the material in this publication.
This document is licensed under a Creative Commons Attribution 4.0 International licence. You are free to copy, communicate and adapt the work, as long as you attribute the authors.
To attribute this work, cite Queensland Government Statistician's Office, Queensland Treasury, Australian Gambling Statistics, Summary tables , 36th edition, 2021.

2018–19
Off-course bookmaker - - - - 11.369 - - - 11.369 On-course bookmaker 0.799 720.061 14,521.838 - 8.068 0.560 - 12.960 15,264.286 On-course totalisator 1.104 36.764 3.267 - 9.064 4.733 71.274 20.342 146.547 TAB 85.533 5,733.270 48.403 1,839.399 558.620 298.840 1,161.695 1,817.246 11,543.007
Total Racing 87.436 6,490.095 14,573.508 1,839.399 587.121 304.132 1,232.969 1,850.548 26,965.209
Casino 125.355 - 1,055.710 8,145.991 - - 13,633.681 3,276.193 26,236.930 Gaming Machines 1,981.380 86,036.009 1,160.291 26,820.376 7,651.148 - 29,916.099 - 153,565.303 Instant Lottery 4.702 104.291 3.685 169.306 32.001 11.104 59.275 111.867 496.232 Interactive Gaming - - 0.861 - - - - - 0.861 Keno 71.127 611.662 42.641 405.404 120.648 - 91.156 - 1,342.639 Lotteries 4.725 274.306 - - - 2.233 - - 281.264 Lotto 52.860 1,440.873 120.312 1,143.367 385.983 106.910 1,555.619 873.384 5,679.308 Minor Gaming - - - - - - - 74.216 74.216 Pools - - - - - 0.022 - - 0.022
Total Gaming 2,240.149 88,467.141 2,383.500 36,684.444 8,189.780 120.269 45,255.831 4,335.660 187,676.774
Bookmaker (and other) Fixed Odds - 520.482 7,536.435 - 0.900 - - 0.004 8,057.821 Bookmaker (and other) Pool Betting - - - - - - - - - Tab Fixed Odds 104.966 1,078.275 - 172.048 71.977 54.427 1,392.343 163.351 3,037.386 Tab Tote Odds - 12.753 - 1.505 0.038 0.061 2.364 0.825 17.546
Total Sports Betting 104.966 1,611.510 7,536.435 173.552 72.915 54.488 1,394.706 164.180 11,112.753
Total All Gambling 2,432.551 96,568.746 24,493.443 38,697.396 8,849.816 478.890 47,883.506 6,350.388 225,754.736
Notes: These data should be read in conjunction with the explanatory notes, and footnotes from State and Product Tables.
Totals may not add up due to rounding.
Australian Gambling Statistics, 1993–94 to 2018–19, 36th edition
SUMMARY TABLE ATOTAL GAMBLING TURNOVER
GAMBLING FROM Value ($ million)
QLD SA TAS VIC ACT NSW NT WA AUSTRALIA
1

2018–19
Off-course bookmaker - - - - 8.26 - - - 0.58 On-course bookmaker 2.43 114.86 78,853.18 - 5.86 1.34 - 6.46 779.26 On-course totalisator 3.35 5.86 17.74 - 6.58 11.30 13.93 10.13 7.48 TAB 259.66 914.56 262.83 473.94 405.83 713.37 226.98 905.21 589.28
Total Racing 265.44 1,035.29 79,133.75 473.94 426.54 726.01 240.91 921.79 1,376.60
Casino 380.55 - 5,732.48 2,098.89 - - 2,663.86 1,631.94 1,339.43 Gaming Machines 6,015.09 13,724.34 6,300.35 6,910.51 5,558.49 - 5,845.24 - 7,839.68 Instant Lottery 14.27 16.64 20.01 43.62 23.25 26.51 11.58 55.72 25.33 Interactive Gaming - - 4.68 - - - - - 0.04 Keno 215.93 97.57 231.54 104.46 87.65 - 17.81 - 68.54 Lotteries 14.34 43.76 - - - 5.33 - - 14.36 Lotto 160.47 229.85 653.29 294.60 280.41 255.21 303.95 435.05 289.94 Minor Gaming - - - - - - - 36.97 3.79 Pools - - - - - 0.05 - - 0.00
Total Gaming 6,800.66 14,112.16 12,942.34 9,452.07 5,949.80 287.10 8,842.44 2,159.68 9,581.11
Bookmaker (and other) Fixed Odds - 83.03 40,922.63 - 0.65 - - 0.00 411.36 Bookmaker (and other) Pool Betting - - - - - - - - - Tab Fixed Odds 318.66 172.00 - 44.33 52.29 129.92 272.05 81.37 155.06 Tab Tote Odds - 2.03 - 0.39 0.03 0.15 0.46 0.41 0.90
Total Sports Betting 318.66 257.07 40,922.63 44.72 52.97 130.07 272.51 81.78 567.32
Total All Gambling 7,384.76 15,404.51 132,998.72 9,970.72 6,429.31 1,143.18 9,355.86 3,163.25 11,525.04
Notes: These data should be read in conjunction with the explanatory notes, and footnotes from State and Product Tables.
Totals may not add up due to rounding.
GAMBLING FROM Value ($)
QLD SA TAS
Australian Gambling Statistics, 1993–94 to 2018–19, 36th edition
VIC ACT NSW NT
SUMMARY TABLE BPER CAPITA GAMBLING TURNOVER
WA AUSTRALIA
2

SUMMARY TABLE CPERCENTAGE CHANGE IN GAMBLING TURNOVER
2017–18 to 2018–19
Off-course bookmaker NA NA NA NA 120.4 NA NA NA 120.4 On-course bookmaker -23.0 30.5 15.1 NA -7.3 -18.2 NA -25.9 15.6 On-course totalisator -26.2 -16.3 -22.5 NA -12.4 -13.7 -44.5 -16.4 -32.8 TAB -2.2 -0.2 -18.2 -7.7 -8.8 -18.7 -48.3 -3.0 -11.1
Total Racing -2.8 2.4 14.9 -7.7 -7.8 -18.6 -48.1 -3.4 2.1
Casino -11.7 NA -4.1 5.5 NA NA 4.8 0.4 4.0 Gaming Machines -1.1 3.4 3.7 2.8 1.0 NA 1.1 NA 2.7 Instant Lottery -5.4 -7.6 -7.6 -6.8 -3.9 -3.7 -2.9 4.5 -3.9 Interactive Gaming NA NA 86,000.0 NA NA NA NA NA 86,000.0 Keno 43.5 -3.2 -10.8 5.8 1.6 NA -4.8 NA 1.2 Lotteries 222.3 125.1 NA NA NA 255.8 NA NA 126.9 Lotto 17.0 26.7 3.6 26.8 26.2 22.8 25.7 17.0 24.1 Minor Gaming NA NA NA NA NA NA NA -7.8 -7.8 Pools NA NA NA NA NA -90.4 NA NA -99.8
Total Gaming -0.3 3.9 -0.2 4.0 1.9 20.9 2.9 3.3 3.5
Bookmaker (and other) Fixed Odds NA 82.9 14.0 NA 0.4 NA NA 100.0 16.8 Bookmaker (and other) Pool Betting NA NA NA NA NA NA NA NA NATab Fixed Odds 21.8 3.8 NA -9.8 0.6 -27.4 -43.6 0.1 -25.8 Tab Tote Odds NA 2.6 NA 0.3 -1.1 66.2 -58.1 -23.3 -15.4
Total Sports Betting 21.8 20.6 14.0 -9.7 0.6 -27.4 -43.7 -0.1 0.9
Total All Gambling 0.4 4.0 12.9 3.3 1.2 -12.6 -2.0 1.2 3.2
Notes: These data should be read in conjunction with the explanatory notes, and footnotes from State and Product Tables.
Percentage change tables should be used with caution.
For each category, a percentage change figure is provided only where there is reliable data available for consecutive years.
NA = Not applicable
Australian Gambling Statistics, 1993–94 to 2018–19, 36th edition
AUSTRALIA
GAMBLING FROM Percentage (%)
ACT NSW NT QLD SA TAS VIC WA
3

SUMMARY TABLE DTOTAL GAMBLING EXPENDITURE
2018–19
Off-course bookmaker - - - - 0.939 - - - 0.939 On-course bookmaker 0.044 39.603 1,502.684 - 0.390 0.031 - 0.648 1,543.400 On-course totalisator 0.202 6.415 0.531 - 1.544 0.679 12.471 3.489 25.330 TAB 16.654 944.965 9.014 310.794 99.028 39.315 213.643 306.107 1,939.521
Total Racing 16.900 990.983 1,512.229 310.794 101.901 40.025 226.114 310.244 3,509.190
Casino 25.676 1,404.761 92.405 917.073 123.985 81.079 1,679.079 533.412 4,857.470 Gaming Machines 166.974 6,531.403 106.836 2,427.182 681.649 104.497 2,698.707 - 12,717.248 Instant Lottery 1.740 36.272 1.474 67.722 10.560 4.162 20.566 38.673 181.169 Interactive Gaming - - 0.818 - - - - - 0.818 Keno 11.267 151.307 10.044 100.829 22.184 33.026 21.985 - 350.642 Lotteries 1.654 103.142 - - - 0.858 - - 105.654 Lotto 21.140 576.156 48.003 454.711 142.716 40.725 619.609 391.498 2,294.558 Minor Gaming - - - - - - - 31.913 31.913 Pools - - - - - 0.003 - - 0.003
Total Gaming 228.451 8,803.041 259.580 3,967.518 981.094 264.349 5,039.946 995.496 20,539.475
Bookmaker (and other) Fixed Odds - 28.626 551.062 - 0.050 - - 0.002 579.740 Bookmaker (and other) Pool Betting - - - - - - - - - Tab Fixed Odds - 140.500 - 17.334 8.188 2.488 198.064 10.488 377.064 Tab Tote Odds - 3.188 - 0.376 0.010 0.015 0.537 0.207 4.333
Total Sports Betting - 172.314 551.062 17.711 8.248 2.504 198.602 10.697 961.137
Total All Gambling 245.351 9,966.338 2,322.871 4,296.022 1,091.243 306.878 5,464.661 1,316.437 25,009.802
Notes: These data should be read in conjunction with the explanatory notes, and footnotes from State and Product Tables.
Totals may not add up due to rounding.
Australian Gambling Statistics, 1993–94 to 2018–19, 36th edition
WA AUSTRALIA
GAMBLING FROM Value ($ million)
QLD SA TAS VIC ACT NSW NT
4

SUMMARY TABLE EPER CAPITA GAMBLING EXPENDITURE
2018–19
Off-course bookmaker - - - - 0.68 - - - 0.05 On-course bookmaker 0.13 6.32 8,159.53 - 0.28 0.07 - 0.32 78.79 On-course totalisator 0.61 1.02 2.88 - 1.12 1.62 2.44 1.74 1.29 TAB 50.56 150.74 48.95 80.08 71.94 93.85 41.74 152.48 99.01
Total Racing 51.31 158.08 8,211.36 80.08 74.03 95.55 44.18 154.54 179.15
Casino 77.95 224.09 501.76 236.29 90.07 193.55 328.07 265.70 247.98 Gaming Machines 506.90 1,041.88 580.12 625.38 495.21 249.45 527.29 - 649.23 Instant Lottery 5.28 5.79 8.00 17.45 7.67 9.93 4.02 19.26 9.25 Interactive Gaming - - 4.44 - - - - - 0.04 Keno 34.20 24.14 54.54 25.98 16.12 78.84 4.30 - 17.90 Lotteries 5.02 16.45 - - - 2.05 - - 5.39 Lotto 64.18 91.91 260.65 117.16 103.68 97.22 121.06 195.01 117.14 Minor Gaming - - - - - - - 15.90 1.63 Pools - - - - - 0.01 - - 0.00
Total Gaming 693.53 1,404.25 1,409.51 1,022.27 712.76 631.04 984.74 495.88 1,048.56
Bookmaker (and other) Fixed Odds - 4.57 2,992.25 - 0.04 - - 0.00 29.60 Bookmaker (and other) Pool Betting - - - - - - - - - Tab Fixed Odds - 22.41 - 4.47 5.95 5.94 38.70 5.22 19.25 Tab Tote Odds - 0.51 - 0.10 0.01 0.04 0.10 0.10 0.22
Total Sports Betting - 27.49 2,992.25 4.56 5.99 5.98 38.80 5.33 49.07
Total All Gambling 744.84 1,589.82 12,613.13 1,106.91 792.78 732.56 1,067.73 655.74 1,276.78
Notes: These data should be read in conjunction with the explanatory notes, and footnotes from State and Product Tables.
Totals may not add up due to rounding.
Australian Gambling Statistics, 1993–94 to 2018–19, 36th edition
NSW NT WA AUSTRALIA
GAMBLING FROM Value ($)
QLD SA TAS VIC ACT
5

SUMMARY TABLE FPERCENTAGE CHANGE IN GAMBLING EXPENDITURE
2017–18 to 2018–19
Off-course bookmaker NA NA NA NA 281.7 NA NA NA 281.7On-course bookmaker -22.8 30.5 8.7 NA -6.0 -18.4 NA -25.9 9.2On-course totalisator -24.9 -16.0 -23.7 NA -12.8 -9.7 -45.1 -16.4 -33.4TAB 5.9 -1.6 -17.3 -3.0 -5.2 -6.2 -48.1 -3.2 -11.1
Total Racing 5.3 -0.8 8.5 -3.0 -4.6 -6.3 -48.0 -3.4 -3.4
Casino 3.6 -10.8 -4.1 13.8 -31.3 -0.1 -5.3 -5.4 -4.8Gaming Machines -0.7 2.3 3.3 2.0 -0.1 -1.5 0.1 NA 1.6Instant Lottery -5.4 -7.6 -7.6 -6.8 -1.8 -9.8 -2.9 4.3 -4.1Interactive Gaming NA NA 81,700.0 NA NA NA NA NA 81,700.0Keno -15.0 -3.1 -4.4 3.0 -2.9 6.5 -4.7 NA -1.1Lotteries 222.4 125.9 NA NA NA 241.9 NA NA 127.6Lotto 17.0 26.7 3.6 26.7 26.1 16.9 25.7 17.1 23.8Minor Gaming NA NA NA NA NA NA NA -7.8 -7.8Pools NA NA NA NA NA -97.2 NA NA -100.0
Total Gaming 0.8 1.7 0.5 6.8 -2.8 2.4 0.6 2.6 2.2
Bookmaker (and other) Fixed Odds NA 82.9 0.0 NA -16.7 NA NA NA 2.3Bookmaker (and other) Pool Betting NA NA NA NA NA NA NA NA NATab Fixed Odds NA -11.6 NA -15.2 -14.9 -23.6 -46.5 -32.4 -34.8Tab Tote Odds NA 2.6 NA 0.3 -1.1 70.8 -58.6 -23.3 -14.5
Total Sports Betting NA -3.0 0.0 -14.9 -14.9 -23.4 -46.6 -32.3 -16.4
Total All Gambling 1.1 1.3 5.4 5.9 -3.1 0.9 -6.0 0.7 0.5
Notes: These data should be read in conjunction with the explanatory notes, and footnotes from State and Product Tables.
Percentage change tables should be used with caution.
For each category, a percentage change figure is provided only where there is reliable data available for consecutive years.
NA = Not applicable
WA AUSTRALIA
Australian Gambling Statistics, 1993–94 to 2018–19, 36th edition
GAMBLING FROM Percentage (%)
QLD SA TAS VIC ACT NSW NT
6

Australian Gambling Statistics36th editionState tables 2018–19
Released April 2021
Prepared by Queensland Government Statistician's Office, Queensland Treasury.
ISSN: 1833-6337
The cooperation of all Australian state and territory governments is gratefully acknowledged.
Queensland Government Statistician's Office
www.qgso.qld.gov.au
Data should be read in conjunction with the Explanatory notes.
Refer to the Glossary section for a full description of terms.
Disclaimer
No warranty is given as to the correctness or completeness of the information in this publication.
Licence
© The State of Queensland (Queensland Treasury) 2021
To view a copy of this licence, visit http://creativecommons.org/licenses/by/4.0/
While great care has been taken in the preparation of this publication and each Australian state and territory has been asked to verify its own data in detail, it is nevertheless necessary to caution users concerning the complete accuracy of all data.
The State of Queensland and each Australian state and territory expressly disclaim all and any liability (including all liability from or attributable to any negligent or wrongful act or omission) to any persons whatsoever in respect of anything done or omitted to be done by any such person in reliance, whether in whole or in part, upon any of the material in this publication.
This document is licensed under a Creative Commons Attribution 4.0 International licence. You are free to copy, communicate and adapt the work, as long as you attribute the authors.
To attribute this work, cite Queensland Government Statistician's Office, Queensland Treasury, Australian Gambling Statistics, State tables , 36th edition, 2021.

Table Number Table Name Page Number
NSW 1 Total Racing Turnover 9
NSW 2 Real Racing Turnover 10
NSW 3 Per Capita Racing Turnover 11
NSW 4 Real Per Capita Racing Turnover 12
NSW 5 Total Racing Expenditure 13
NSW 6 Real Racing Expenditure 14
NSW 7 Per Capita Racing Expenditure 15
NSW 8 Real Per Capita Racing Expenditure 16
NSW 9 Racing Expenditure as a Percentage of HDI 17
NSW 10 Racing Expenditure Share of Market 18
NSW 11 Government Revenue from Racing 19
NSW 12 Real Government Revenue from Racing 20
NSW 13 Per Capita Revenue from Racing 21
NSW 14 Real Per Capita Revenue from Racing 22 NSW 15 Government Revenue from Racing as a Percentage of Total Gambling Revenue 23
NSW 16 Total Gaming Turnover 24
NSW 17 Real Gaming Turnover 25
NSW 18 Per Capita Gaming Turnover 26
NSW 19 Real Per Capita Gaming Turnover 27
NSW 20 Total Gaming Expenditure 28
NSW 21 Real Gaming Expenditure 29
NSW 22 Per Capita Gaming Expenditure 30
NSW 23 Real Per Capita Gaming Expenditure 31
NSW 24 Gaming Expenditure as a Percentage of HDI 32
NSW 25 Gaming Expenditure Share of Market 33
NSW 26 Government Revenue from Gaming 34
NSW 27 Real Government Revenue from Gaming 35
NSW 28 Per Capita Revenue from Gaming 36
NSW 29 Real Per Capita Revenue from Gaming 37 NSW 30 Government Revenue from Gaming as a Percentage of Total Gambling Revenue 38
NSW 31 Total Sportsbetting Turnover 39
NSW 32 Real Sportsbetting Turnover 40
NSW 33 Per Capita Sportsbetting Turnover 41
NSW 34 Real Per Capita Sportsbetting Turnover 42
NSW 35 Total Sportsbetting Expenditure 43
NSW 36 Real Sportsbetting Expenditure 44
NSW 37 Per Capita Sportsbetting Expenditure 45
NSW 38 Real Per Capita Sportsbetting Expenditure 46
NSW 39 Sportsbetting Expenditure as a Percentage of HDI 47
NSW 40 Sportsbetting Expenditure Share of Market 48
NSW 41 Government Revenue from Sportsbetting 49
NSW 42 Real Government Revenue from Sportsbetting 50
NSW 43 Per Capita Revenue from Sportsbetting 51
NSW 44 Real Per Capita Revenue from Sportsbetting 52 NSW 45 Government Revenue from Sportsbetting as a Percentage of Total Gambling Revenue 53
NSW 46 Total Gambling Turnover 54
NSW 47 Real Gambling Turnover 55
NSW 48 Per Capita Gambling Turnover 56
NSW 49 Real Per Capita Gambling Turnover 57
NSW 50 Total Gambling Expenditure 58
NSW 51 Real Gambling Expenditure 59
NSW 52 Per Capita Gambling Expenditure 60
NSW 53 Real Per Capita Gambling Expenditure 61
NSW 54 Gambling Expenditure Percentage of HDI 62 NSW 55 Gambling Expenditure as a Percentage of Total Gambling Revenue 63
NSW 56 Government Revenue from Gambling 64
NSW 57 Real Government Revenue from Gambling 65
NSW 58 Per Capita Revenue from Gambling 66
NSW 59 Real Per Capita Revenue from Gambling 67 NSW 60 Government Revenue from Gambling as a Percentage of Total Gambling Revenue 68
NSW 61 Gaming Machines Operating as at 30 June 69
Australian Gambling Statistics, 1993–94 to 2018–2019, 36th edition
1

Table Number Table Name Page Number
VIC 1 Total Racing Turnover 70 VIC 2 Real Racing Turnover 71 VIC 3 Per Capita Racing Turnover 72 VIC 4 Real Per Capita Racing Turnover 73 VIC 5 Total Racing Expenditure 74 VIC 6 Real Racing Expenditure 75 VIC 7 Per Capita Racing Expenditure 76 VIC 8 Real Per Capita Racing Expenditure 77 VIC 9 Racing Expenditure as a Percentage of HDI 78 VIC 10 Racing Expenditure Share of Market 79 VIC 11 Government Revenue from Racing 80 VIC 12 Real Government Revenue from Racing 81 VIC 13 Per Capita Revenue from Racing 82 VIC 14 Real Per Capita Revenue from Racing 83 VIC 15 Government Revenue from Racing as a Percentage of Total Gambling Revenue 84 VIC 16 Total Gaming Turnover 85 VIC 17 Real Gaming Turnover 86 VIC 18 Per Capita Gaming Turnover 87 VIC 19 Real Per Capita Gaming Turnover 88 VIC 20 Total Gaming Expenditure 89 VIC 21 Real Gaming Expenditure 90 VIC 22 Per Capita Gaming Expenditure 91 VIC 23 Real Per Capita Gaming Expenditure 92 VIC 24 Gaming Expenditure as a Percentage of HDI 93 VIC 25 Gaming Expenditure Share of Market 94 VIC 26 Government Revenue from Gaming 95 VIC 27 Real Government Revenue from Gaming 96 VIC 28 Per Capita Revenue from Gaming 97 VIC 29 Real Per Capita Revenue from Gaming 98 VIC 30 Government Revenue from Gaming as a Percentage of Total Gambling Revenue 99 VIC 31 Total Sportsbetting Turnover 100 VIC 32 Real Sportsbetting Turnover 101 VIC 33 Per Capita Sportsbetting Turnover 102 VIC 34 Real Per Capita Sportsbetting Turnover 103 VIC 35 Total Sportsbetting Expenditure 104 VIC 36 Real Sportsbetting Expenditure 105 VIC 37 Per Capita Sportsbetting Expenditure 106 VIC 38 Real Per Capita Sportsbetting Expenditure 107 VIC 39 Sportsbetting Expenditure as a Percentage of HDI 108 VIC 40 Sportsbetting Expenditure Share of Market 109 VIC 41 Government Revenue from Sportsbetting 110 VIC 42 Real Government Revenue from Sportsbetting 111 VIC 43 Per Capita Revenue from Sportsbetting 112 VIC 44 Real Per Capita Revenue from Sportsbetting 113 VIC 45 Government Revenue from Sportsbetting as a Percentage of Total Gambling Revenue 114 VIC 46 Total Gambling Turnover 115 VIC 47 Real Gambling Turnover 116 VIC 48 Per Capita Gambling Turnover 117 VIC 49 Real Per Capita Gambling Turnover 118 VIC 50 Total Gambling Expenditure 119 VIC 51 Real Gambling Expenditure 120 VIC 52 Per Capita Gambling Expenditure 121 VIC 53 Real Per Capita Gambling Expenditure 122 VIC 54 Gambling Expenditure Percentage of HDI 123 VIC 55 Gambling Expenditure as a Percentage of Total Gambling Revenue 124 VIC 56 Government Revenue from Gambling 125 VIC 57 Real Government Revenue from Gambling 126 VIC 58 Per Capita Revenue from Gambling 127 VIC 59 Real Per Capita Revenue from Gambling 128 VIC 60 Government Revenue from Gambling as a Percentage of Total Gambling Revenue 129 VIC 61 Gaming Machines Operating as at 30 June 130
Australian Gambling Statistics, 1993–94 to 2018–2019, 36th edition
2

Table Number Table Name Page Number
QLD 1 Total Racing Turnover 131 QLD 2 Real Racing Turnover 132 QLD 3 Per Capita Racing Turnover 133 QLD 4 Real Per Capita Racing Turnover 134 QLD 5 Total Racing Expenditure 135 QLD 6 Real Racing Expenditure 136 QLD 7 Per Capita Racing Expenditure 137 QLD 8 Real Per Capita Racing Expenditure 138 QLD 9 Racing Expenditure as a Percentage of HDI 139 QLD 10 Racing Expenditure Share of Market 140 QLD 11 Government Revenue from Racing 141 QLD 12 Real Government Revenue from Racing 142 QLD 13 Per Capita Revenue from Racing 143 QLD 14 Real Per Capita Revenue from Racing 144 QLD 15 Government Revenue from Racing as a Percentage of Total Gambling Revenue 145 QLD 16 Total Gaming Turnover 146 QLD 17 Real Gaming Turnover 147 QLD 18 Per Capita Gaming Turnover 148 QLD 19 Real Per Capita Gaming Turnover 149 QLD 20 Total Gaming Expenditure 150 QLD 21 Real Gaming Expenditure 151 QLD 22 Per Capita Gaming Expenditure 152 QLD 23 Real Per Capita Gaming Expenditure 153 QLD 24 Gaming Expenditure as a Percentage of HDI 154 QLD 25 Gaming Expenditure Share of Market 155 QLD 26 Government Revenue from Gaming 156 QLD 27 Real Government Revenue from Gaming 157 QLD 28 Per Capita Revenue from Gaming 158 QLD 29 Real Per Capita Revenue from Gaming 159 QLD 30 Government Revenue from Gaming as a Percentage of Total Gambling Revenue 160 QLD 31 Total Sportsbetting Turnover 161 QLD 32 Real Sportsbetting Turnover 162 QLD 33 Per Capita Sportsbetting Turnover 163 QLD 34 Real Per Capita Sportsbetting Turnover 164 QLD 35 Total Sportsbetting Expenditure 165 QLD 36 Real Sportsbetting Expenditure 166 QLD 37 Per Capita Sportsbetting Expenditure 167 QLD 38 Real Per Capita Sportsbetting Expenditure 168 QLD 39 Sportsbetting Expenditure as a Percentage of HDI 169 QLD 40 Sportsbetting Expenditure Share of Market 170 QLD 41 Government Revenue from Sportsbetting 171 QLD 42 Real Government Revenue from Sportsbetting 172 QLD 43 Per Capita Revenue from Sportsbetting 173 QLD 44 Real Per Capita Revenue from Sportsbetting 174 QLD 45 Government Revenue from Sportsbetting as a Percentage of Total Gambling Revenue 175 QLD 46 Total Gambling Turnover 176 QLD 47 Real Gambling Turnover 177 QLD 48 Per Capita Gambling Turnover 178 QLD 49 Real Per Capita Gambling Turnover 179 QLD 50 Total Gambling Expenditure 180 QLD 51 Real Gambling Expenditure 181 QLD 52 Per Capita Gambling Expenditure 182 QLD 53 Real Per Capita Gambling Expenditure 183 QLD 54 Gambling Expenditure Percentage of HDI 184 QLD 55 Gambling Expenditure as a Percentage of Total Gambling Revenue 185 QLD 56 Government Revenue from Gambling 186 QLD 57 Real Government Revenue from Gambling 187 QLD 58 Per Capita Revenue from Gambling 188 QLD 59 Real Per Capita Revenue from Gambling 189 QLD 60 Government Revenue from Gambling as a Percentage of Total Gambling Revenue 190 QLD 61 Gaming Machines Operating as at 30 June 191
Australian Gambling Statistics, 1993–94 to 2018–2019, 36th edition
3

Table Number Table Name Page Number
SA 1 Total Racing Turnover 192 SA 2 Real Racing Turnover 193 SA 3 Per Capita Racing Turnover 194 SA 4 Real Per Capita Racing Turnover 195 SA 5 Total Racing Expenditure 196 SA 6 Real Racing Expenditure 197 SA 7 Per Capita Racing Expenditure 198 SA 8 Real Per Capita Racing Expenditure 199 SA 9 Racing Expenditure as a Percentage of HDI 200 SA 10 Racing Expenditure Share of Market 201 SA 11 Government Revenue from Racing 202 SA 12 Real Government Revenue from Racing 203 SA 13 Per Capita Revenue from Racing 204 SA 14 Real Per Capita Revenue from Racing 205 SA 15 Government Revenue from Racing as a Percentage of Total Gambling Revenue 206 SA 16 Total Gaming Turnover 207 SA 17 Real Gaming Turnover 208 SA 18 Per Capita Gaming Turnover 209 SA 19 Real Per Capita Gaming Turnover 210 SA 20 Total Gaming Expenditure 211 SA 21 Real Gaming Expenditure 212 SA 22 Per Capita Gaming Expenditure 213 SA 23 Real Per Capita Gaming Expenditure 214 SA 24 Gaming Expenditure as a Percentage of HDI 215 SA 25 Gaming Expenditure Share of Market 216 SA 26 Government Revenue from Gaming 217 SA 27 Real Government Revenue from Gaming 218 SA 28 Per Capita Revenue from Gaming 219 SA 29 Real Per Capita Revenue from Gaming 220 SA 30 Government Revenue from Gaming as a Percentage of Total Gambling Revenue 221 SA 31 Total Sportsbetting Turnover 222 SA 32 Real Sportsbetting Turnover 223 SA 33 Per Capita Sportsbetting Turnover 224 SA 34 Real Per Capita Sportsbetting Turnover 225 SA 35 Total Sportsbetting Expenditure 226 SA 36 Real Sportsbetting Expenditure 227 SA 37 Per Capita Sportsbetting Expenditure 228 SA 38 Real Per Capita Sportsbetting Expenditure 229 SA 39 Sportsbetting Expenditure as a Percentage of HDI 230 SA 40 Sportsbetting Expenditure Share of Market 231 SA 41 Government Revenue from Sportsbetting 232 SA 42 Real Government Revenue from Sportsbetting 233 SA 43 Per Capita Revenue from Sportsbetting 234 SA 44 Real Per Capita Revenue from Sportsbetting 235 SA 45 Government Revenue from Sportsbetting as a Percentage of Total Gambling Revenue 236 SA 46 Total Gambling Turnover 237 SA 47 Real Gambling Turnover 238 SA 48 Per Capita Gambling Turnover 239 SA 49 Real Per Capita Gambling Turnover 240 SA 50 Total Gambling Expenditure 241 SA 51 Real Gambling Expenditure 242 SA 52 Per Capita Gambling Expenditure 243 SA 53 Real Per Capita Gambling Expenditure 244 SA 54 Gambling Expenditure Percentage of HDI 245 SA 55 Gambling Expenditure as a Percentage of Total Gambling Revenue 246 SA 56 Government Revenue from Gambling 247 SA 57 Real Government Revenue from Gambling 248 SA 58 Per Capita Revenue from Gambling 249 SA 59 Real Per Capita Revenue from Gambling 250 SA 60 Government Revenue from Gambling as a Percentage of Total Gambling Revenue 251 SA 61 Gaming Machines Operating as at 30 June 252
Australian Gambling Statistics, 1993–94 to 2018–2019, 36th edition
4

Table Number Table Name Page Number
WA 1 Total Racing Turnover 253 WA 2 Real Racing Turnover 254 WA 3 Per Capita Racing Turnover 255 WA 4 Real Per Capita Racing Turnover 256 WA 5 Total Racing Expenditure 257 WA 6 Real Racing Expenditure 258 WA 7 Per Capita Racing Expenditure 259 WA 8 Real Per Capita Racing Expenditure 260 WA 9 Racing Expenditure as a Percentage of HDI 261 WA 10 Racing Expenditure Share of Market 262 WA 11 Government Revenue from Racing 263 WA 12 Real Government Revenue from Racing 264 WA 13 Per Capita Revenue from Racing 265 WA 14 Real Per Capita Revenue from Racing 266 WA 15 Government Revenue from Racing as a Percentage of Total Gambling Revenue 267 WA 16 Total Gaming Turnover 268 WA 17 Real Gaming Turnover 269 WA 18 Per Capita Gaming Turnover 270 WA 19 Real Per Capita Gaming Turnover 271 WA 20 Total Gaming Expenditure 272 WA 21 Real Gaming Expenditure 273 WA 22 Per Capita Gaming Expenditure 274 WA 23 Real Per Capita Gaming Expenditure 275 WA 24 Gaming Expenditure as a Percentage of HDI 276 WA 25 Gaming Expenditure Share of Market 277 WA 26 Government Revenue from Gaming 278 WA 27 Real Government Revenue from Gaming 279 WA 28 Per Capita Revenue from Gaming 280 WA 29 Real Per Capita Revenue from Gaming 281 WA 30 Government Revenue from Gaming as a Percentage of Total Gambling Revenue 282 WA 31 Total Sportsbetting Turnover 283 WA 32 Real Sportsbetting Turnover 284 WA 33 Per Capita Sportsbetting Turnover 285 WA 34 Real Per Capita Sportsbetting Turnover 286 WA 35 Total Sportsbetting Expenditure 287 WA 36 Real Sportsbetting Expenditure 288 WA 37 Per Capita Sportsbetting Expenditure 289 WA 38 Real Per Capita Sportsbetting Expenditure 290 WA 39 Sportsbetting Expenditure as a Percentage of HDI 291 WA 40 Sportsbetting Expenditure Share of Market 292 WA 41 Government Revenue from Sportsbetting 293 WA 42 Real Government Revenue from Sportsbetting 294 WA 43 Per Capita Revenue from Sportsbetting 295 WA 44 Real Per Capita Revenue from Sportsbetting 296 WA 45 Government Revenue from Sportsbetting as a Percentage of Total Gambling Revenue 297 WA 46 Total Gambling Turnover 298 WA 47 Real Gambling Turnover 299 WA 48 Per Capita Gambling Turnover 300 WA 49 Real Per Capita Gambling Turnover 301 WA 50 Total Gambling Expenditure 302 WA 51 Real Gambling Expenditure 303 WA 52 Per Capita Gambling Expenditure 304 WA 53 Real Per Capita Gambling Expenditure 305 WA 54 Gambling Expenditure Percentage of HDI 306 WA 55 Gambling Expenditure as a Percentage of Total Gambling Revenue 307 WA 56 Government Revenue from Gambling 308 WA 57 Real Government Revenue from Gambling 309 WA 58 Per Capita Revenue from Gambling 310 WA 59 Real Per Capita Revenue from Gambling 311 WA 60 Government Revenue from Gambling as a Percentage of Total Gambling Revenue 312 WA 61 Gaming Machines Operating as at 30 June 313
Australian Gambling Statistics, 1993–94 to 2018–2019, 36th edition
5

Table Number Table Name Page Number
TAS 1 Total Racing Turnover 314 TAS 2 Real Racing Turnover 315 TAS 3 Per Capita Racing Turnover 316 TAS 4 Real Per Capita Racing Turnover 317 TAS 5 Total Racing Expenditure 318 TAS 6 Real Racing Expenditure 319 TAS 7 Per Capita Racing Expenditure 320 TAS 8 Real Per Capita Racing Expenditure 321 TAS 9 Racing Expenditure as a Percentage of HDI 322 TAS 10 Racing Expenditure Share of Market 323 TAS 11 Government Revenue from Racing 324 TAS 12 Real Government Revenue from Racing 325 TAS 13 Per Capita Revenue from Racing 326 TAS 14 Real Per Capita Revenue from Racing 327 TAS 15 Government Revenue from Racing as a Percentage of Total Gambling Revenue 328 TAS 16 Total Gaming Turnover 329 TAS 17 Real Gaming Turnover 330 TAS 18 Per Capita Gaming Turnover 331 TAS 19 Real Per Capita Gaming Turnover 332 TAS 20 Total Gaming Expenditure 333 TAS 21 Real Gaming Expenditure 334 TAS 22 Per Capita Gaming Expenditure 335 TAS 23 Real Per Capita Gaming Expenditure 336 TAS 24 Gaming Expenditure as a Percentage of HDI 337 TAS 25 Gaming Expenditure Share of Market 338 TAS 26 Government Revenue from Gaming 339 TAS 27 Real Government Revenue from Gaming 340 TAS 28 Per Capita Revenue from Gaming 341 TAS 29 Real Per Capita Revenue from Gaming 342 TAS 30 Government Revenue from Gaming as a Percentage of Total Gambling Revenue 343 TAS 31 Total Sportsbetting Turnover 344 TAS 32 Real Sportsbetting Turnover 345 TAS 33 Per Capita Sportsbetting Turnover 346 TAS 34 Real Per Capita Sportsbetting Turnover 347 TAS 35 Total Sportsbetting Expenditure 348 TAS 36 Real Sportsbetting Expenditure 349 TAS 37 Per Capita Sportsbetting Expenditure 350 TAS 38 Real Per Capita Sportsbetting Expenditure 351 TAS 39 Sportsbetting Expenditure as a Percentage of HDI 352 TAS 40 Sportsbetting Expenditure Share of Market 353 TAS 41 Government Revenue from Sportsbetting 354 TAS 42 Real Government Revenue from Sportsbetting 355 TAS 43 Per Capita Revenue from Sportsbetting 356 TAS 44 Real Per Capita Revenue from Sportsbetting 357 TAS 45 Government Revenue from Sportsbetting as a Percentage of Total Gambling Revenue 358 TAS 46 Total Gambling Turnover 359 TAS 47 Real Gambling Turnover 360 TAS 48 Per Capita Gambling Turnover 361 TAS 49 Real Per Capita Gambling Turnover 362 TAS 50 Total Gambling Expenditure 363 TAS 51 Real Gambling Expenditure 364 TAS 52 Per Capita Gambling Expenditure 365 TAS 53 Real Per Capita Gambling Expenditure 366 TAS 54 Gambling Expenditure Percentage of HDI 367 TAS 55 Gambling Expenditure as a Percentage of Total Gambling Revenue 368 TAS 56 Government Revenue from Gambling 369 TAS 57 Real Government Revenue from Gambling 370 TAS 58 Per Capita Revenue from Gambling 371 TAS 59 Real Per Capita Revenue from Gambling 372 TAS 60 Government Revenue from Gambling as a Percentage of Total Gambling Revenue 373 TAS 61 Gaming Machines Operating as at 30 June 374
Australian Gambling Statistics, 1993–94 to 2018–2019, 36th edition
6
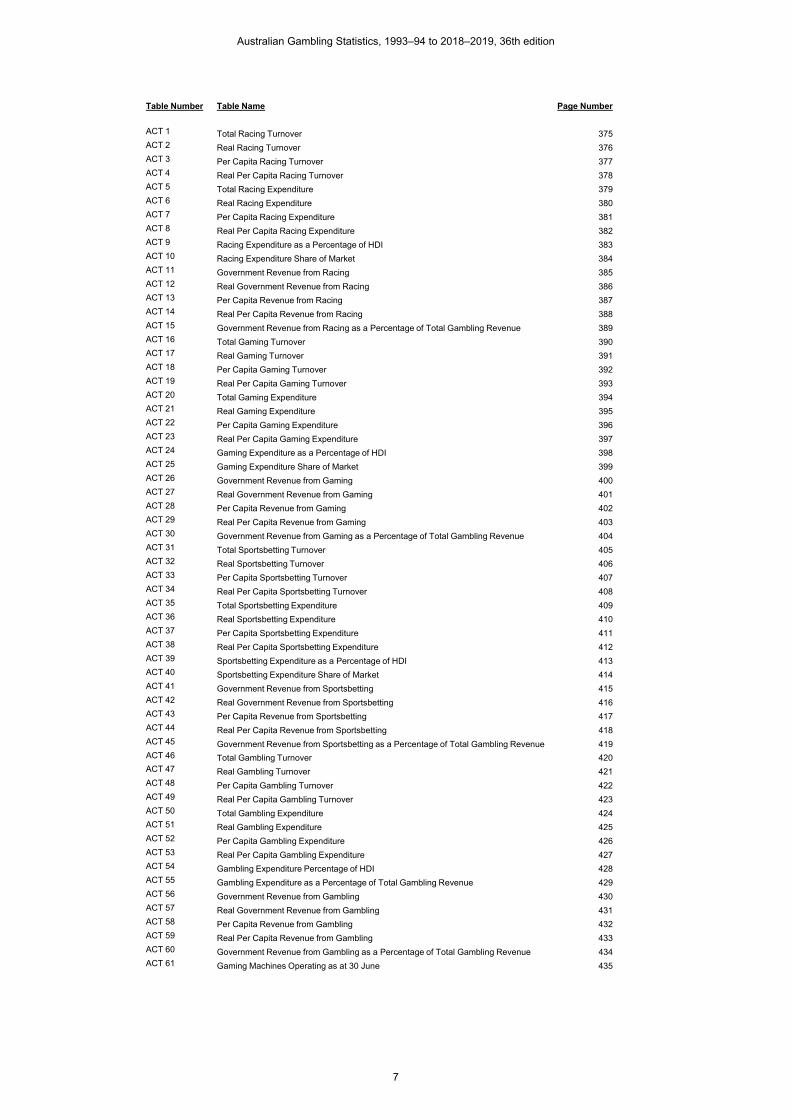
Table Number Table Name Page Number
ACT 1 Total Racing Turnover 375 ACT 2 Real Racing Turnover 376 ACT 3 Per Capita Racing Turnover 377 ACT 4 Real Per Capita Racing Turnover 378 ACT 5 Total Racing Expenditure 379 ACT 6 Real Racing Expenditure 380 ACT 7 Per Capita Racing Expenditure 381 ACT 8 Real Per Capita Racing Expenditure 382 ACT 9 Racing Expenditure as a Percentage of HDI 383 ACT 10 Racing Expenditure Share of Market 384 ACT 11 Government Revenue from Racing 385 ACT 12 Real Government Revenue from Racing 386 ACT 13 Per Capita Revenue from Racing 387 ACT 14 Real Per Capita Revenue from Racing 388 ACT 15 Government Revenue from Racing as a Percentage of Total Gambling Revenue 389 ACT 16 Total Gaming Turnover 390 ACT 17 Real Gaming Turnover 391 ACT 18 Per Capita Gaming Turnover 392 ACT 19 Real Per Capita Gaming Turnover 393 ACT 20 Total Gaming Expenditure 394 ACT 21 Real Gaming Expenditure 395 ACT 22 Per Capita Gaming Expenditure 396 ACT 23 Real Per Capita Gaming Expenditure 397 ACT 24 Gaming Expenditure as a Percentage of HDI 398 ACT 25 Gaming Expenditure Share of Market 399 ACT 26 Government Revenue from Gaming 400 ACT 27 Real Government Revenue from Gaming 401 ACT 28 Per Capita Revenue from Gaming 402 ACT 29 Real Per Capita Revenue from Gaming 403 ACT 30 Government Revenue from Gaming as a Percentage of Total Gambling Revenue 404 ACT 31 Total Sportsbetting Turnover 405 ACT 32 Real Sportsbetting Turnover 406 ACT 33 Per Capita Sportsbetting Turnover 407 ACT 34 Real Per Capita Sportsbetting Turnover 408 ACT 35 Total Sportsbetting Expenditure 409 ACT 36 Real Sportsbetting Expenditure 410 ACT 37 Per Capita Sportsbetting Expenditure 411 ACT 38 Real Per Capita Sportsbetting Expenditure 412 ACT 39 Sportsbetting Expenditure as a Percentage of HDI 413 ACT 40 Sportsbetting Expenditure Share of Market 414 ACT 41 Government Revenue from Sportsbetting 415 ACT 42 Real Government Revenue from Sportsbetting 416 ACT 43 Per Capita Revenue from Sportsbetting 417 ACT 44 Real Per Capita Revenue from Sportsbetting 418 ACT 45 Government Revenue from Sportsbetting as a Percentage of Total Gambling Revenue 419 ACT 46 Total Gambling Turnover 420 ACT 47 Real Gambling Turnover 421 ACT 48 Per Capita Gambling Turnover 422 ACT 49 Real Per Capita Gambling Turnover 423 ACT 50 Total Gambling Expenditure 424 ACT 51 Real Gambling Expenditure 425 ACT 52 Per Capita Gambling Expenditure 426 ACT 53 Real Per Capita Gambling Expenditure 427 ACT 54 Gambling Expenditure Percentage of HDI 428 ACT 55 Gambling Expenditure as a Percentage of Total Gambling Revenue 429 ACT 56 Government Revenue from Gambling 430 ACT 57 Real Government Revenue from Gambling 431 ACT 58 Per Capita Revenue from Gambling 432 ACT 59 Real Per Capita Revenue from Gambling 433 ACT 60 Government Revenue from Gambling as a Percentage of Total Gambling Revenue 434 ACT 61 Gaming Machines Operating as at 30 June 435
Australian Gambling Statistics, 1993–94 to 2018–2019, 36th edition
7

Table Number Table Name Page Number
NT 1 Total Racing Turnover 436 NT 2 Real Racing Turnover 437 NT 3 Per Capita Racing Turnover 438 NT 4 Real Per Capita Racing Turnover 439 NT 5 Total Racing Expenditure 440 NT 6 Real Racing Expenditure 441 NT 7 Per Capita Racing Expenditure 442 NT 8 Real Per Capita Racing Expenditure 443 NT 9 Racing Expenditure as a Percentage of HDI 444 NT 10 Racing Expenditure Share of Market 445 NT 11 Government Revenue from Racing 446 NT 12 Real Government Revenue from Racing 447 NT 13 Per Capita Revenue from Racing 448 NT 14 Real Per Capita Revenue from Racing 449 NT 15 Government Revenue from Racing as a Percentage of Total Gambling Revenue 450 NT 16 Total Gaming Turnover 451 NT 17 Real Gaming Turnover 452 NT 18 Per Capita Gaming Turnover 453 NT 19 Real Per Capita Gaming Turnover 454 NT 20 Total Gaming Expenditure 455 NT 21 Real Gaming Expenditure 456 NT 22 Per Capita Gaming Expenditure 457 NT 23 Real Per Capita Gaming Expenditure 458 NT 24 Gaming Expenditure as a Percentage of HDI 459 NT 25 Gaming Expenditure Share of Market 460 NT 26 Government Revenue from Gaming 461 NT 27 Real Government Revenue from Gaming 462 NT 28 Per Capita Revenue from Gaming 463 NT 29 Real Per Capita Revenue from Gaming 464 NT 30 Government Revenue from Gaming as a Percentage of Total Gambling Revenue 465 NT 31 Total Sportsbetting Turnover 466 NT 32 Real Sportsbetting Turnover 467 NT 33 Per Capita Sportsbetting Turnover 468 NT 34 Real Per Capita Sportsbetting Turnover 469 NT 35 Total Sportsbetting Expenditure 470 NT 36 Real Sportsbetting Expenditure 471 NT 37 Per Capita Sportsbetting Expenditure 472 NT 38 Real Per Capita Sportsbetting Expenditure 473 NT 39 Sportsbetting Expenditure as a Percentage of HDI 474 NT 40 Sportsbetting Expenditure Share of Market 475 NT 41 Government Revenue from Sportsbetting 476 NT 42 Real Government Revenue from Sportsbetting 477 NT 43 Per Capita Revenue from Sportsbetting 478 NT 44 Real Per Capita Revenue from Sportsbetting 479 NT 45 Government Revenue from Sportsbetting as a Percentage of Total Gambling Revenue 480 NT 46 Total Gambling Turnover 481 NT 47 Real Gambling Turnover 482 NT 48 Per Capita Gambling Turnover 483 NT 49 Real Per Capita Gambling Turnover 484 NT 50 Total Gambling Expenditure 485 NT 51 Real Gambling Expenditure 486 NT 52 Per Capita Gambling Expenditure 487 NT 53 Real Per Capita Gambling Expenditure 488 NT 54 Gambling Expenditure Percentage of HDI 489 NT 55 Gambling Expenditure as a Percentage of Total Gambling Revenue 490 NT 56 Government Revenue from Gambling 491 NT 57 Real Government Revenue from Gambling 492 NT 58 Per Capita Revenue from Gambling 493 NT 59 Real Per Capita Revenue from Gambling 494 NT 60 Government Revenue from Gambling as a Percentage of Total Gambling Revenue 495 NT 61 Gaming Machines Operating as at 30 June 496
Australian Gambling Statistics, 1993–94 to 2018–2019, 36th edition
8

TABLE NSW 1NEW SOUTH WALES
TOTAL RACING TURNOVER
1993-94 - 780.074 419.978 3,329.177 4,529.2291994-95 - 833.762 406.165 3,467.924 4,707.8511995-96 - 691.531 405.414 3,574.283 4,671.2281996-97 - 610.200 388.900 3,625.400 4,624.5001997-98 - 610.658 394.923 3,554.474 4,560.0551998-99 - 558.778 325.700 3,672.300 4,556.7781999-00 - 489.000 299.200 3,772.700 4,560.9002000-01 - 483.625 275.800 3,912.400 4,671.8252001-02 - 475.660 - (1) 4,485.000 (2) 4,960.6602002-03 - 605.140 - (1) 4,642.100 (2) 5,247.2402003-04 - 670.321 282.633 4,343.950 5,296.9042004-05 - 629.900 264.610 4,448.803 5,343.3132005-06 - 583.406 285.165 4,285.428 5,153.9992006-07 - 599.344 306.822 4,322.166 5,228.3322007-08 - 523.830 248.259 4,175.968 4,948.0572008-09 - 563.219 314.868 4,470.149 5,348.2362009-10 - 473.378 218.232 4,673.163 5,364.7732010-11 0.007 (3) 433.246 (4) 182.814 4,676.901 5,292.9682011-12 8.072 497.307 261.539 4,922.237 5,689.1552012-13 3.986 193.947 (5) 148.379 5,215.581 5,561.893 (6)
2013-14 0.504 703.683 82.026 5,327.549 6,113.7622014-15 0.562 461.599 81.663 5,408.595 5,952.4192015-16 0.178 (7) 646.992 59.003 5,554.138 6,260.311 (6)
2016-17 - (8) 561.876 48.289 5,599.373 6,209.538 (6)(9)
2017-18 - 551.642 (10) 43.924 5,742.505 6,338.0712018-19 - 720.061 36.764 5,733.270 (11) 6,490.095
Notes: These data should be read in conjunction with the explanatory notes.
(1) Figure is included in TAB turnover (discrete data were not available).
(2) TAB turnover includes on and off-course totalisator (racing and FootyTAB), fixed odds racing and sports betting.
(3) Figure includes racing premises and sports premises betting (bets taken 24/7 away from a racecourse), commencing Dec 2010.
(4) Figure includes on course and all racing offices, from this period on.
(5) 2012-13 figure incomplete due to resource restrictions.
(6) Total racing figure incomplete due to data for one or more components being unavailable.
(7) Data only available from 01/07/2015-31/01/2016.
(8) No data available after 31/01/2016.
(9) Gross turnover provided by NSW licensed interactive wagering service providers for 2016-17.
(10) Turnover provided by NSW bookmakers operating from approved offices and premises.
(11) Figure from totalisator racing, fixed odds racing and computer simulated racing events.
TOTAL RACING
Value ($ million)
BOOKMAKERS OFF COURSE
BOOKMAKERS ON COURSE
ON-COURSE TOTALISATOR
TAB
Australian Gambling Statistics, 1993–94 to 2018–19, 36th edition
9

TABLE NSW 2NEW SOUTH WALES
REAL RACING TURNOVER
1993-94 - 1,449.616 780.448 6,186.630 8,416.6941994-95 - 1,500.509 730.969 6,241.169 8,472.6471995-96 - 1,193.702 699.814 6,169.829 8,063.3451996-97 - 1,039.161 662.291 6,174.002 7,875.4541997-98 - 1,039.941 672.548 6,053.216 7,765.7061998-99 - 940.362 548.118 6,180.080 7,668.5601999-00 - 803.961 491.912 6,202.667 7,498.5402000-01 - 749.750 427.565 6,065.283 7,242.5982001-02 - 716.946 - (1) 6,760.086 (2) 7,477.0322002-03 - 885.211 - (1) 6,790.559 (2) 7,675.7702003-04 - 957.242 403.610 6,203.313 7,564.1652004-05 - 878.626 369.095 6,205.482 7,453.2032005-06 - 788.704 385.513 5,793.452 6,967.6692006-07 - 786.941 402.858 5,675.019 6,864.8182007-08 - 665.579 315.438 5,305.991 6,287.0082008-09 - 693.988 387.975 5,508.035 6,589.9972009-10 - 569.751 262.661 5,624.556 6,456.9682010-11 0.008 (3) 505.971 (4) 213.501 5,461.969 6,181.4502011-12 9.210 567.427 298.416 5,616.272 6,491.3262012-13 4.446 216.318 (5) 165.494 5,817.183 6,203.441 (6)
2013-14 0.548 764.669 89.135 5,789.270 6,643.6212014-15 0.600 493.150 87.245 5,778.284 6,359.2792015-16 0.188 (7) 681.642 62.163 5,851.590 6,595.582 (6)
2016-17 - (8) 581.761 49.998 5,797.536 6,429.295 (6)(9)
2017-18 - 560.484 (10) 44.628 5,834.549 6,439.6612018-19 - 720.061 36.764 5,733.270 (11) 6,490.095
Notes: These data should be read in conjunction with the explanatory notes.
(1) Figure is included in TAB turnover (discrete data were not available).
(2) TAB turnover includes on and off-course totalisator (racing and FootyTAB), fixed odds racing and sports betting.
(3) Figure includes racing premises and sports premises betting (bets taken 24/7 away from a racecourse), commencing Dec 2010.
(4) Figure includes on course and all racing offices, from this period on.
(5) 2012-13 figure incomplete due to resource restrictions.
(6) Total racing figure incomplete due to data for one or more components being unavailable.
(7) Data only available from 01/07/2015-31/01/2016.
(8) No data available after 31/01/2016.
(9) Gross turnover provided by NSW licensed interactive wagering service providers for 2016-17.
(10) Turnover provided by NSW bookmakers operating from approved offices and premises.
(11) Figure from totalisator racing, fixed odds racing and computer simulated racing events.
TOTAL RACING
Value ($ million)
BOOKMAKERS OFF COURSE
BOOKMAKERS ON COURSE
ON-COURSE TOTALISATOR
TAB
Australian Gambling Statistics, 1993–94 to 2018–19, 36th edition
10

TABLE NSW 3NEW SOUTH WALES
PER CAPITA RACING TURNOVER
1993-94 - 174.10 93.73 743.03 1,010.861994-95 - 184.07 89.67 765.63 1,039.371995-96 - 150.78 88.40 779.35 1,018.531996-97 - 131.31 83.69 780.17 995.171997-98 - 129.82 83.96 755.66 969.441998-99 - 117.36 68.41 771.29 957.061999-00 - 101.38 62.03 782.13 945.542000-01 - 98.86 56.38 799.79 955.032001-02 - 96.00 - (1) 905.21 (2) 1,001.222002-03 - 120.95 - (1) 927.82 (2) 1,048.772003-04 - 132.91 56.04 861.28 1,050.222004-05 - 123.92 52.06 875.24 1,051.222005-06 - 113.78 55.61 835.74 1,005.132006-07 - 115.45 59.10 832.57 1,007.122007-08 - 99.18 47.00 790.67 936.852008-09 - 104.67 58.52 830.75 993.942009-10 - 86.54 39.90 854.36 980.802010-11 0.00 (3) 78.16 (4) 32.98 843.74 954.882011-12 1.44 88.60 46.60 876.96 1,013.592012-13 0.70 34.08 (5) 26.07 916.45 977.30 (6)
2013-14 0.09 121.80 14.20 922.11 1,058.192014-15 0.10 78.69 13.92 922.00 1,014.702015-16 0.03 (7) 108.59 9.90 932.19 1,050.71 (6)
2016-17 - (8) 92.67 7.96 923.50 1,024.13 (6)(9)
2017-18 - 89.40 (10) 7.12 930.61 1,027.122018-19 - 114.86 5.86 914.56 (11) 1,035.29
Notes: These data should be read in conjunction with the explanatory notes.
(1) Figure is included in TAB turnover (discrete data were not available).
(2) TAB turnover includes on and off-course totalisator (racing and FootyTAB), fixed odds racing and sports betting.
(3) Figure includes racing premises and sports premises betting (bets taken 24/7 away from a racecourse), commencing Dec 2010.
(4) Figure includes on course and all racing offices, from this period on.
(5) 2012-13 figure incomplete due to resource restrictions.
(6) Total racing figure incomplete due to data for one or more components being unavailable.
(7) Data only available from 01/07/2015-31/01/2016.
(8) No data available after 31/01/2016.
(9) Gross turnover provided by NSW licensed interactive wagering service providers for 2016-17.
(10) Turnover provided by NSW bookmakers operating from approved offices and premises.
(11) Figure from totalisator racing, fixed odds racing and computer simulated racing events.
TOTAL RACING
Value ($)
BOOKMAKERS OFF COURSE
BOOKMAKERS ON COURSE
ON-COURSE TOTALISATOR
TAB
Australian Gambling Statistics, 1993–94 to 2018–19, 36th edition
11

TABLE NSW 4NEW SOUTH WALES
REAL PER CAPITA RACING TURNOVER
1993-94 - 323.54 174.19 1,380.77 1,878.501994-95 - 331.27 161.38 1,377.89 1,870.551995-96 - 260.28 152.59 1,345.29 1,758.161996-97 - 223.62 142.52 1,328.61 1,694.751997-98 - 221.08 142.98 1,286.87 1,650.941998-99 - 197.50 115.12 1,298.00 1,610.621999-00 - 166.67 101.98 1,285.90 1,554.552000-01 - 153.27 87.40 1,239.89 1,480.562001-02 - 144.70 - (1) 1,364.40 (2) 1,509.102002-03 - 176.93 - (1) 1,357.23 (2) 1,534.162003-04 - 189.79 80.02 1,229.94 1,499.762004-05 - 172.86 72.61 1,220.84 1,466.312005-06 - 153.81 75.18 1,129.83 1,358.832006-07 - 151.59 77.60 1,093.16 1,322.352007-08 - 126.02 59.72 1,004.62 1,190.372008-09 - 128.97 72.10 1,023.63 1,224.712009-10 - 104.16 48.02 1,028.30 1,180.482010-11 0.00 (3) 91.28 (4) 38.52 985.37 1,115.172011-12 1.64 101.09 53.17 1,000.61 1,156.512012-13 0.78 38.01 (5) 29.08 1,022.16 1,090.03 (6)
2013-14 0.09 132.35 15.43 1,002.03 1,149.902014-15 0.10 84.07 14.87 985.02 1,084.062015-16 0.03 (7) 114.40 10.43 982.11 1,106.98 (6)
2016-17 - (8) 95.95 8.25 956.18 1,060.38 (6)(9)
2017-18 - 90.83 (10) 7.23 945.52 1,043.582018-19 - 114.86 5.86 914.56 (11) 1,035.29
Notes: These data should be read in conjunction with the explanatory notes.
(1) Figure is included in TAB turnover (discrete data were not available).
(2) TAB turnover includes on and off-course totalisator (racing and FootyTAB), fixed odds racing and sports betting.
(3) Figure includes racing premises and sports premises betting (bets taken 24/7 away from a racecourse), commencing Dec 2010.
(4) Figure includes on course and all racing offices, from this period on.
(5) 2012-13 figure incomplete due to resource restrictions.
(6) Total racing figure incomplete due to data for one or more components being unavailable.
(7) Data only available from 01/07/2015-31/01/2016.
(8) No data available after 31/01/2016.
(9) Gross turnover provided by NSW licensed interactive wagering service providers for 2016-17.
(10) Turnover provided by NSW bookmakers operating from approved offices and premises.
(11) Figure from totalisator racing, fixed odds racing and computer simulated racing events.
TOTAL RACING
Value ($)
BOOKMAKERS OFF COURSE
BOOKMAKERS ON COURSE
ON-COURSE TOTALISATOR
TAB
Australian Gambling Statistics, 1993–94 to 2018–19, 36th edition
12

TABLE NSW 5NEW SOUTH WALES
TOTAL RACING EXPENDITURE
1993-94 - 42.904 61.863 490.388 595.1551994-95 - 45.857 64.986 554.868 665.7111995-96 - 38.034 62.249 549.652 649.9351996-97 - 33.561 60.200 576.400 670.1611997-98 - 33.586 59.896 533.852 627.3341998-99 - 30.733 52.112 587.568 670.4131999-00 - 26.895 47.872 603.632 678.3992000-01 - 26.599 44.128 625.984 696.7112001-02 - 26.161 - (1) 717.600 (2) 743.7612002-03 - 33.283 (3) - (1) 742.736 (2) 776.0192003-04 - 36.853 45.221 680.873 762.9472004-05 - 34.645 44.801 745.007 824.4532005-06 - 32.087 48.046 718.421 798.5542006-07 - 32.963 51.636 726.365 810.9642007-08 - 28.811 40.059 (4) 705.068 (4) 773.9382008-09 - 30.977 50.569 748.647 830.1932009-10 - 26.036 35.651 787.725 849.4122010-11 - 23.828 30.091 808.376 862.2952011-12 - 27.337 45.079 858.342 930.7582012-13 - 10.667 25.285 925.310 961.2622013-14 0.027 (3) 38.702 14.234 944.798 997.7612014-15 0.031 25.388 14.345 954.133 993.8972015-16 0.010 (5) 35.585 (6) 10.036 963.185 1,008.816 (7)
2016-17 - 30.903 (8) 8.344 936.934 976.181 (7)
2017-18 - 30.340 7.638 960.602 (9) 998.5802018-19 - 39.603 6.415 944.965 990.983
Notes: These data should be read in conjunction with the explanatory notes.
(1) Figure is included in TAB expenditure (discrete data were not available).
(2) Figure is inclusive of both TAB and on-course totalisator expenditure (discrete data were not available).
(3) Bookmaker betting expenditure is estimated at 5.5% of turnover.
(4) Figure represents actual expenditure, from this period on.
(5) No data available after 31/01/2016.
(6) Data only available from 01/07/2015-31/01/2016.
(7) Total racing figure incomplete due to data for one or more components being unavailable.
(8) Expenditure was estimated at 5.5% of gross turnover provided by NSW bookmakers operating from approved offices and premises, from this period on.
(9) Figure from totalisator racing, fixed odds racing and computer simulated racing events.
TOTAL RACING
Value ($ million)
BOOKMAKERS OFF COURSE
BOOKMAKERS ON COURSE
ON-COURSE TOTALISATOR
TAB
Australian Gambling Statistics, 1993–94 to 2018–19, 36th edition
13

TABLE NSW 6NEW SOUTH WALES
REAL RACING EXPENDITURE
1993-94 - 79.729 114.960 911.291 1,105.9791994-95 - 82.528 116.954 998.587 1,198.0701995-96 - 65.654 107.452 948.794 1,121.9001996-97 - 57.154 102.520 981.601 1,141.2741997-98 - 57.196 102.002 909.142 1,068.3401998-99 - 51.720 87.699 988.813 1,128.2321999-00 - 44.218 78.706 992.427 1,115.3512000-01 - 41.236 68.410 970.445 1,080.0912001-02 - 39.432 - (1) 1,081.614 (2) 1,121.0452002-03 - 48.687 (3) - (1) 1,086.489 (2) 1,135.1772003-04 - 52.627 64.577 972.311 1,089.5152004-05 - 48.325 62.491 1,039.185 1,150.0012005-06 - 43.378 64.953 971.230 1,079.5622006-07 - 43.281 67.798 953.720 1,064.7992007-08 - 36.607 50.899 (4) 895.860 (4) 983.3672008-09 - 38.169 62.310 922.469 1,022.9482009-10 - 31.337 42.909 948.095 1,022.3412010-11 - 27.828 35.142 944.071 1,007.0412011-12 - 31.192 51.435 979.368 1,061.9952012-13 - 11.897 28.202 1,032.042 1,072.1412013-14 0.029 (3) 42.056 15.468 1,026.680 1,084.2342014-15 0.033 27.123 15.326 1,019.350 1,061.8322015-16 0.011 (5) 37.491 (6) 10.573 1,014.768 1,062.843 (7)
2016-17 - 31.997 (8) 8.639 970.092 1,010.728 (7)
2017-18 - 30.826 7.760 975.999 (9) 1,014.5862018-19 - 39.603 6.415 944.965 990.983
Notes: These data should be read in conjunction with the explanatory notes.
(1) Figure is included in TAB expenditure (discrete data were not available).
(2) Figure is inclusive of both TAB and on-course totalisator expenditure (discrete data were not available).
(3) Bookmaker betting expenditure is estimated at 5.5% of turnover.
(4) Figure represents actual expenditure, from this period on.
(5) No data available after 31/01/2016.
(6) Data only available from 01/07/2015-31/01/2016.
(7) Total racing figure incomplete due to data for one or more components being unavailable.
(8) Expenditure was estimated at 5.5% of gross turnover provided by NSW bookmakers operating from approved offices and premises, from this period on.
(9) Figure from totalisator racing, fixed odds racing and computer simulated racing events.
TOTAL RACING
Value ($ million)
BOOKMAKERS OFF COURSE
BOOKMAKERS ON COURSE
ON-COURSE TOTALISATOR
TAB
Australian Gambling Statistics, 1993–94 to 2018–19, 36th edition
14

TABLE NSW 7NEW SOUTH WALES
PER CAPITA RACING EXPENDITURE
1993-94 - 9.58 13.81 109.45 132.831994-95 - 10.12 14.35 122.50 146.971995-96 - 8.29 13.57 119.85 141.711996-97 - 7.22 12.95 124.04 144.211997-98 - 7.14 12.73 113.49 133.371998-99 - 6.45 10.95 123.41 140.811999-00 - 5.58 9.92 125.14 140.642000-01 - 5.44 9.02 127.97 142.422001-02 - 5.28 - (1) 144.83 (2) 150.112002-03 - 6.65 (3) - (1) 148.45 (2) 155.102003-04 - 7.31 8.97 135.00 151.272004-05 - 6.82 8.81 146.57 162.202005-06 - 6.26 9.37 140.11 155.732006-07 - 6.35 9.95 (4) 139.92 (4) 156.212007-08 - 5.46 7.58 133.50 146.542008-09 - 5.76 9.40 139.13 154.292009-10 - 4.76 6.52 144.01 155.292010-11 - 4.30 5.43 145.84 155.562011-12 - 4.87 8.03 152.92 165.832012-13 - 1.87 4.44 162.59 168.912013-14 0.00 (3) 6.70 2.46 163.53 172.702014-15 0.01 4.33 2.45 162.65 169.432015-16 0.00 (5) 5.97 (6) 1.68 161.66 169.32 (7)
2016-17 - 5.10 (8) 1.38 154.53 161.00 (7)
2017-18 - 4.92 1.24 155.67 (9) 161.832018-19 - 6.32 1.02 150.74 158.08
Notes: These data should be read in conjunction with the explanatory notes.
(1) Figure is included in TAB expenditure (discrete data were not available).
(2) Figure is inclusive of both TAB and on-course totalisator expenditure (discrete data were not available).
(3) Bookmaker betting expenditure is estimated at 5.5% of turnover.
(4) Figure represents actual expenditure, from this period on.
(5) No data available after 31/01/2016.
(6) Data only available from 01/07/2015-31/01/2016.
(7) Total racing figure incomplete due to data for one or more components being unavailable.
(8) Expenditure was estimated at 5.5% of gross turnover provided by NSW bookmakers operating from approved offices and premises, from this period on.
(9) Figure from totalisator racing, fixed odds racing and computer simulated racing events.
TOTAL RACING
Value ($)
BOOKMAKERS OFF COURSE
BOOKMAKERS ON COURSE
ON-COURSE TOTALISATOR
TAB
Australian Gambling Statistics, 1993–94 to 2018–19, 36th edition
15

TABLE NSW 8NEW SOUTH WALES
REAL PER CAPITA RACING EXPENDITURE
1993-94 - 17.79 25.66 203.39 246.841994-95 - 18.22 25.82 220.46 264.501995-96 - 14.32 23.43 206.88 244.621996-97 - 12.30 22.06 211.24 245.601997-98 - 12.16 21.68 193.28 227.121998-99 - 10.86 18.42 207.68 236.961999-00 - 9.17 16.32 205.74 231.232000-01 - 8.43 13.98 198.38 220.802001-02 - 7.96 - (1) 218.30 (2) 226.262002-03 - 9.73 (3) - (1) 217.16 (2) 226.892003-04 - 10.43 12.80 192.78 216.022004-05 - 9.51 12.29 204.44 226.252005-06 - 8.46 12.67 189.41 210.542006-07 - 8.34 13.06 183.71 205.112007-08 - 6.93 9.64 (4) 169.62 (4) 186.192008-09 - 7.09 11.58 171.43 190.112009-10 - 5.73 7.84 173.33 186.912010-11 - 5.02 6.34 170.32 181.682011-12 - 5.56 9.16 174.49 189.212012-13 - 2.09 4.96 181.34 188.392013-14 0.01 (3) 7.28 2.68 177.70 187.662014-15 0.01 4.62 2.61 173.77 181.012015-16 0.00 (5) 6.29 (6) 1.77 170.32 178.38 (7)
2016-17 - 5.28 (8) 1.42 160.00 166.70 (7)
2017-18 - 5.00 1.26 158.17 (9) 164.422018-19 - 6.32 1.02 150.74 158.08
Notes: These data should be read in conjunction with the explanatory notes.
(1) Figure is included in TAB expenditure (discrete data were not available).
(2) Figure is inclusive of both TAB and on-course totalisator expenditure (discrete data were not available).
(3) Bookmaker betting expenditure is estimated at 5.5% of turnover.
(4) Figure represents actual expenditure, from this period on.
(5) No data available after 31/01/2016.
(6) Data only available from 01/07/2015-31/01/2016.
(7) Total racing figure incomplete due to data for one or more components being unavailable.
(8) Expenditure was estimated at 5.5% of gross turnover provided by NSW bookmakers operating from approved offices and premises, from this period on.
(9) Figure from totalisator racing, fixed odds racing and computer simulated racing events.
TOTAL RACING
Value ($)
BOOKMAKERS OFF COURSE
BOOKMAKERS ON COURSE
ON-COURSE TOTALISATOR
TAB
Australian Gambling Statistics, 1993–94 to 2018–19, 36th edition
16

TABLE NSW 9NEW SOUTH WALES
RACING EXPENDITUREAS A % OF HDI
1993-94 - 0.037 0.054 0.427 0.5181994-95 - 0.038 0.054 0.459 0.5501995-96 - 0.029 0.048 0.426 0.5041996-97 - 0.024 0.044 0.420 0.4891997-98 - 0.024 0.042 0.375 0.4401998-99 - 0.021 0.035 0.397 0.4531999-00 - 0.017 0.030 0.383 0.4302000-01 - 0.015 0.026 0.362 0.4032001-02 - 0.015 - (1) 0.406 (2) 0.4212002-03 - 0.018 (3) - (1) 0.410 (2) 0.4292003-04 - 0.019 0.023 0.350 0.3922004-05 - 0.017 0.021 0.356 0.3942005-06 - 0.015 0.022 0.330 0.3672006-07 - 0.014 0.022 0.311 0.3472007-08 - 0.011 0.016 (4) 0.280 (4) 0.3072008-09 - 0.011 0.019 0.274 0.3042009-10 - 0.009 0.013 0.277 0.2992010-11 - 0.008 0.010 0.263 0.2812011-12 - 0.008 0.014 0.264 0.2862012-13 - 0.003 0.008 0.277 0.2882013-14 0.000 (3) 0.011 0.004 0.266 0.2812014-15 0.000 0.007 0.004 0.257 0.2672015-16 0.000 (5) 0.009 (6) 0.003 0.252 0.264 (7)
2016-17 - 0.008 (8) 0.002 0.238 0.248 (7)
2017-18 - 0.008 0.002 0.238 (9) 0.2472018-19 - 0.010 0.002 0.227 0.238
Notes: These data should be read in conjunction with the explanatory notes.
(1) Figure is included in TAB expenditure (discrete data were not available).
(2) Figure is inclusive of both TAB and on-course totalisator expenditure (discrete data were not available).
(3) Bookmaker betting expenditure is estimated at 5.5% of turnover.
(4) Figure represents actual expenditure, from this period on.
(5) No data available after 31/01/2016.
(6) Data only available from 01/07/2015-31/01/2016.
(7) Total racing figure incomplete due to data for one or more components being unavailable.
(8) Expenditure was estimated at 5.5% of gross turnover provided by NSW bookmakers operating from approved offices and premises, from this period on.
(9) Figure from totalisator racing, fixed odds racing and computer simulated racing events.
Percentage (%)
BOOKMAKERS OFF COURSE
BOOKMAKERS ON COURSE
ON-COURSE TOTALISATOR
TAB TOTAL RACING
Australian Gambling Statistics, 1993–94 to 2018–19, 36th edition
17

TABLE NSW 10NEW SOUTH WALES
RACING EXPENDITURESHARE OF MARKET
1993-94 - 7.21 10.39 82.401994-95 - 6.89 9.76 83.351995-96 - 5.85 9.58 84.571996-97 - 5.01 8.98 86.011997-98 - 5.35 9.55 85.101998-99 - 4.58 7.77 87.641999-00 - 3.96 7.06 88.982000-01 - 3.82 6.33 89.852001-02 - 3.52 - (1) 96.48 (2)
2002-03 - 4.29 (3) - (1) 95.71 (2)
2003-04 - 4.83 5.93 89.242004-05 - 4.20 5.43 90.362005-06 - 4.02 6.02 89.972006-07 - 4.06 6.37 89.572007-08 - 3.72 5.18 (4) 91.10 (4)
2008-09 - 3.73 6.09 90.182009-10 - 3.07 4.20 92.742010-11 - 2.76 3.49 93.752011-12 - 2.94 4.84 92.222012-13 - 1.11 2.63 96.262013-14 0.00 (3) 3.88 1.43 94.692014-15 0.00 2.55 1.44 96.002015-16 0.00 (5) 3.53 (6) 0.99 95.482016-17 - 3.17 (7) 0.85 95.982017-18 - 3.04 0.76 96.20 (8)
2018-19 - 4.00 0.65 95.36
Notes: These data should be read in conjunction with the explanatory notes.
(1) Figure is included in TAB expenditure (discrete data were not available).
(2) Figure is inclusive of both TAB and on-course totalisator expenditure (discrete data were not available).
(3) Bookmaker betting expenditure is estimated at 5.5% of turnover.
(4) Figure represents actual expenditure, from this period on.
(5) No data available after 31/01/2016.
(6) Data only available from 01/07/2015-31/01/2016.
(7) Expenditure was estimated at 5.5% of gross turnover provided by NSW bookmakers operating from approved offices and premises, from this period on.
(8) Figure from totalisator racing, fixed odds racing and computer simulated racing events.
ON-COURSE TOTALISATOR
TAB
Percentage (%)
BOOKMAKERS OFF COURSE
BOOKMAKERS ON COURSE
Australian Gambling Statistics, 1993–94 to 2018–19, 36th edition
18

TABLE NSW 11NEW SOUTH WALES
GOVERNMENT REVENUE FROM RACING
1993-94 7.815 62.948 250.556 321.3191994-95 8.368 61.608 262.946 332.9221995-96 6.932 57.707 271.564 336.2031996-97 6.116 54.773 276.692 337.5811997-98 6.207 46.506 231.161 283.8741998-99 5.615 23.465 160.538 189.6181999-00 4.900 22.229 162.964 190.0932000-01 4.779 8.639 122.523 135.9412001-02 3.671 (1) - (2) 136.302 (3) 139.9732002-03 - - 141.775 141.7752003-04 - - 147.423 147.4232004-05 - - 153.164 153.1642005-06 - - 146.099 146.0992006-07 - - 147.862 147.8622007-08 - - 141.843 141.8432008-09 - - 152.183 152.1832009-10 - - 157.195 157.1952010-11 - - 151.605 151.6052011-12 - - 148.651 148.6512012-13 - - 145.519 145.5192013-14 - - 141.935 141.9352014-15 - - 144.347 144.3472015-16 - - 119.396 119.3962016-17 - - 96.323 96.3232017-18 - - 96.947 96.9472018-19 - - 83.782 (4)(5) 83.782
Notes: These data should be read in conjunction with the explanatory notes.
Data for the gambling revenue received by states and territories from 1 July 2000
onwards are not comparable with that of preceding years because of the impact
of changes brought about by the introduction of the GST.
(1) State tax on bookmakers’ turnover was abolished on 30 March 2002.
(2) On-course totalisator revenue included in TAB revenue, from this period on.
(3) Government revenue from TAB includes on-course totalisators, from this period on.
(4) The NSW Government implemented the point of consumption tax (POCT) on 1 January 2019, through
the Betting Tax Amendment (point of consumption) Bill 2018. The Bill provides for a tax of 10% of wagering
operator's revenue derived from NSW customers. POCT does not distinguish
between racing and sports betting, and the revenue for the 2018-19 FY is $41m.
(5) Does not include offsets afforded to TAB due to POCT as per Section 11 of the Betting Tax Act 2001 .
This is due to the design of the offsets not distinguishing between racing and sportsbetting.
Value ($ million)
BOOKMAKERSON-COURSE
TOTALISATORTAB TOTAL RACING
Australian Gambling Statistics, 1993–94 to 2018–19, 36th edition
19

TABLE NSW 12NEW SOUTH WALES
REAL GOVERNMENT REVENUE FROM RACING
1993-94 14.523 116.977 465.610 597.1091994-95 15.060 110.875 473.220 599.1551995-96 11.966 99.612 468.766 580.3441996-97 10.415 93.278 471.202 574.8951997-98 10.570 79.199 393.664 483.4331998-99 9.449 39.489 270.168 319.1061999-00 8.056 36.547 267.928 312.5302000-01 7.409 13.393 189.944 210.7452001-02 5.533 (1) - (2) 205.443 (3) 210.9762002-03 - - 207.391 207.3912003-04 - - 210.525 210.5252004-05 - - 213.643 213.6432005-06 - - 197.511 197.5112006-07 - - 194.143 194.1432007-08 - - 180.226 180.2262008-09 - - 187.517 187.5172009-10 - - 189.198 189.1982010-11 - - 177.054 177.0542011-12 - - 169.611 169.6112012-13 - - 162.304 162.3042013-14 - - 154.236 154.2362014-15 - - 154.213 154.2132015-16 - - 125.790 125.7902016-17 - - 99.732 99.7322017-18 - - 98.501 98.5012018-19 - - 83.782 (4)(5) 83.782
Notes: These data should be read in conjunction with the explanatory notes.
Data for the gambling revenue received by states and territories from 1 July 2000
onwards are not comparable with that of preceding years because of the impact
of changes brought about by the introduction of the GST.
(1) State tax on bookmakers’ turnover was abolished on 30 March 2002.
(2) On-course totalisator revenue included in TAB revenue, from this period on.
(3) Government revenue from TAB includes on-course totalisators, from this period on.
(4) The NSW Government implemented the point of consumption tax (POCT) on 1 January 2019, through
the Betting Tax Amendment (point of consumption) Bill 2018. The Bill provides for a tax of 10% of wagering
operator's revenue derived from NSW customers. POCT does not distinguish
between racing and sports betting, and the revenue for the 2018-19 FY is $41m.
(5) Does not include offsets afforded to TAB due to POCT as per Section 11 of the Betting Tax Act 2001 .
This is due to the design of the offsets not distinguishing between racing and sportsbetting.
Value ($ million)
BOOKMAKERSON-COURSE
TOTALISATORTAB TOTAL RACING
Australian Gambling Statistics, 1993–94 to 2018–19, 36th edition
20

TABLE NSW 13NEW SOUTH WALES
PER CAPITA REVENUE FROM RACING
1993-94 1.74 14.05 55.92 71.711994-95 1.85 13.60 58.05 73.501995-96 1.51 12.58 59.21 73.311996-97 1.32 11.79 59.54 72.651997-98 1.32 9.89 49.14 60.351998-99 1.18 4.93 33.72 39.831999-00 1.02 4.61 33.78 39.412000-01 0.98 1.77 25.05 27.792001-02 0.74 (1) - (2) 27.51 (3) 28.252002-03 - - 28.34 28.342003-04 - - 29.23 29.232004-05 - - 30.13 30.132005-06 - - 28.49 28.492006-07 - - 28.48 28.482007-08 - - 26.86 26.862008-09 - - 28.28 28.282009-10 - - 28.74 28.742010-11 - - 27.35 27.352011-12 - - 26.48 26.482012-13 - - 25.57 25.572013-14 - - 24.57 24.572014-15 - - 24.61 24.612015-16 - - 20.04 20.042016-17 - - 15.89 15.892017-18 - - 15.71 15.712018-19 - - 13.36 (4)(5) 13.36
Notes: These data should be read in conjunction with the explanatory notes.
Data for the gambling revenue received by states and territories from 1 July 2000
onwards are not comparable with that of preceding years because of the impact
of changes brought about by the introduction of the GST.
(1) State tax on bookmakers’ turnover was abolished on 30 March 2002.
(2) On-course totalisator revenue included in TAB revenue, from this period on.
(3) Government revenue from TAB includes on-course totalisators, from this period on.
(4) The NSW Government implemented the point of consumption tax (POCT) on 1 January 2019, through
the Betting Tax Amendment (point of consumption) Bill 2018. The Bill provides for a tax of 10% of wagering
operator's revenue derived from NSW customers. POCT does not distinguish
between racing and sports betting, and the revenue for the 2018-19 FY is $41m.
(5) Does not include offsets afforded to TAB due to POCT as per Section 11 of the Betting Tax Act 2001 .
This is due to the design of the offsets not distinguishing between racing and sportsbetting.
Value ($)
BOOKMAKERSON-COURSE
TOTALISATORTAB TOTAL RACING
Australian Gambling Statistics, 1993–94 to 2018–19, 36th edition
21

TABLE NSW 14NEW SOUTH WALES
REAL PER CAPITA REVENUE FROM RACING
1993-94 3.24 26.11 103.92 133.271994-95 3.32 24.48 104.48 132.281995-96 2.61 21.72 102.21 126.541996-97 2.24 20.07 101.40 123.711997-98 2.25 16.84 83.69 102.771998-99 1.98 8.29 56.74 67.021999-00 1.67 7.58 55.55 64.792000-01 1.51 2.74 38.83 43.082001-02 1.12 (1) - (2) 41.46 (3) 42.582002-03 - - 41.45 41.452003-04 - - 41.74 41.742004-05 - - 42.03 42.032005-06 - - 38.52 38.522006-07 - - 37.40 37.402007-08 - - 34.12 34.122008-09 - - 34.85 34.852009-10 - - 34.59 34.592010-11 - - 31.94 31.942011-12 - - 30.22 30.222012-13 - - 28.52 28.522013-14 - - 26.70 26.702014-15 - - 26.29 26.292015-16 - - 21.11 21.112016-17 - - 16.45 16.452017-18 - - 15.96 15.962018-19 - - 13.36 (4)(5) 13.36
Notes: These data should be read in conjunction with the explanatory notes.
Data for the gambling revenue received by states and territories from 1 July 2000
onwards are not comparable with that of preceding years because of the impact
of changes brought about by the introduction of the GST.
(1) State tax on bookmakers’ turnover was abolished on 30 March 2002.
(2) On-course totalisator revenue included in TAB revenue, from this period on.
(3) Government revenue from TAB includes on-course totalisators, from this period on.
(4) The NSW Government implemented the point of consumption tax (POCT) on 1 January 2019, through
the Betting Tax Amendment (point of consumption) Bill 2018. The Bill provides for a tax of 10% of wagering
operator's revenue derived from NSW customers. POCT does not distinguish
between racing and sports betting, and the revenue for the 2018-19 FY is $41m.
(5) Does not include offsets afforded to TAB due to POCT as per Section 11 of the Betting Tax Act 2001 .
This is due to the design of the offsets not distinguishing between racing and sportsbetting.
Value ($)
BOOKMAKERSON-COURSE
TOTALISATORTAB TOTAL RACING
Australian Gambling Statistics, 1993–94 to 2018–19, 36th edition
22

TABLE NSW 15NEW SOUTH WALES
GOVERNMENT REVENUE FROM RACINGAS A % OF TOTAL GAMBLING REVENUE
1993-94 0.77 6.24 24.82 31.831994-95 0.77 5.70 24.32 30.801995-96 0.58 4.86 22.85 28.291996-97 0.49 4.43 22.37 27.301997-98 0.46 3.45 17.14 21.051998-99 0.40 1.67 11.42 13.491999-00 0.32 1.44 10.56 12.322000-01 0.40 0.73 10.28 11.412001-02 0.31 (1) - (2) 11.37 (3) 11.682002-03 - - 11.24 11.242003-04 - - 11.21 11.212004-05 - - 10.72 10.722005-06 - - 9.60 9.602006-07 - - 8.93 8.932007-08 - - 9.15 9.152008-09 - - 9.16 9.162009-10 - - 11.07 11.072010-11 - - 8.67 8.672011-12 - - 8.30 8.302012-13 - - 7.83 7.832013-14 - - 7.51 7.512014-15 - - 6.96 6.962015-16 - - 5.43 5.432016-17 - - 4.32 4.322017-18 - - 4.16 4.162018-19 - - 3.36 (4)(5) 3.36
Notes: These data should be read in conjunction with the explanatory notes.
Data for the gambling revenue received by states and territories from 1 July 2000
onwards are not comparable with that of preceding years because of the impact
of changes brought about by the introduction of the GST.
(1) State tax on bookmakers’ turnover was abolished on 30 March 2002.
(2) On-course totalisator revenue included in TAB revenue, from this period on.
(3) Government revenue from TAB includes on-course totalisators, from this period on.
(4) The NSW Government implemented the point of consumption tax (POCT) on 1 January 2019, through
the Betting Tax Amendment (point of consumption) Bill 2018. The Bill provides for a tax of 10% of wagering
operator's revenue derived from NSW customers. POCT does not distinguish
between racing and sports betting, and the revenue for the 2018-19 FY is $41m.
(5) Does not include offsets afforded to TAB due to POCT as per Section 11 of the Betting Tax Act 2001 .
This is due to the design of the offsets not distinguishing between racing and sportsbetting.
ON-COURSE TOTALISATOR
TAB TOTAL RACING
Percentage (%)
BOOKMAKERS
Australian Gambling Statistics, 1993–94 to 2018–19, 36th edition
23

TABLE NSW 16NEW SOUTH WALES
TOTAL GAMING TURNOVER
1993-94 - 18,880.838 179.576 - 249.585 136.971 476.629 - 11.297 19,934.8961994-95 - 22,486.497 177.557 - 349.349 118.650 546.392 - 7.593 23,686.0381995-96 1,650.000 24,376.037 170.568 - 352.120 132.980 575.353 - 7.758 27,264.8161996-97 2,134.547 26,001.479 166.073 - 360.700 133.795 603.414 - 7.069 29,407.0771997-98 2,635.039 30,540.143 171.288 - 384.400 134.338 626.544 - 7.145 34,498.8971998-99 2,832.880 34,522.289 169.193 - 358.500 147.679 638.765 - 7.589 38,676.8951999-00 2,872.447 38,821.992 181.542 - 365.800 121.395 634.738 - 8.301 43,006.2152000-01 3,124.022 38,922.493 177.684 - 340.800 112.729 771.351 - 8.774 43,457.8532001-02 3,153.550 42,842.728 189.937 - - U 103.610 782.001 - 7.756 47,079.582 (3)
2002-03 - U 47,730.741 185.906 - 336.000 112.642 857.375 - 8.056 49,230.7202003-04 - U 50,314.522 179.301 - 339.600 129.999 866.557 - 7.162 51,837.1412004-05 - U 53,953.655 180.507 - 348.033 112.447 895.041 - 7.165 55,496.8482005-06 - U 56,534.739 162.914 - 338.266 129.296 919.209 - 6.435 58,090.8592006-07 - U 59,972.491 148.841 - 347.787 102.345 953.166 - 6.141 61,530.7712007-08 - U 55,003.556 152.146 - 351.500 111.169 1,032.531 - 6.548 56,657.4502008-09 - U 57,510.475 161.426 - 443.602 113.922 1,144.136 - 6.600 59,380.1612009-10 - U 58,485.414 30.966 (4) - 461.953 17.550 (4) 266.984 (4) - 1.476 (4) 59,264.3432010-11 - U 62,254.556 135.485 - 509.402 92.925 929.129 - 5.676 63,927.1732011-12 - U 65,246.704 140.688 - 542.958 146.781 987.720 - 6.333 67,071.1842012-13 - U 66,919.170 121.756 - 545.167 84.580 1,149.539 - 4.983 68,825.1952013-14 - U 69,371.053 120.716 - 538.545 109.400 1,013.545 - 4.160 71,157.4202014-15 - U 74,297.266 125.220 - 576.353 64.875 1,072.626 - 4.229 76,140.5692015-16 - U 79,056.858 123.990 - 617.885 125.507 (5) 1,129.955 - 3.484 81,057.6792016-17 - U 80,336.670 118.230 - 646.131 117.498 1,060.147 - 4.239 82,282.9152017-18 - U 83,174.002 112.862 - 631.596 121.855 1,136.987 - 5.132 85,182.4342018-19 - U 86,036.009 (6) 104.291 - 611.662 274.306 1,440.873 - - (7) 88,467.141
Notes: These data should be read in conjunction with the explanatory notes.
(1) Turnover figure is net and does not include agent commission.
(2) NSW does not collect information relating to minor gaming.
(3) Total turnover figure incomplete from this period on, due to data for one or more components being unavailable.
(4) Data only available for three months April to June 2010.
(5) Includes new product "Set for Life", commenced 7 August 2015.
(6) Club and hotel gaming machine data are provided based on club and hotel financial years respectively. For clubs this runs from September to August; for hotels this runs from July to June.
(7) Pools was withdrawn from the Australian Lottery Market on 23 June 2018.
NA = Not applicable
U = Unavailable data
KENO
Value ($ million)
CASINOGAMING
MACHINESINSTANT LOTTERY
INTERACTIVE GAMING (NA)
LOTTERIESLOTTO
(1)MINOR GAMING
(2)POOLS TOTAL GAMING
Australian Gambling Statistics, 1993–94 to 2018–19, 36th edition
24

TABLE NSW 17NEW SOUTH WALES
REAL GAMING TURNOVER
1993-94 - 35,086.378 333.707 - 463.805 254.534 885.723 - 20.993 37,045.1411994-95 - 40,468.601 319.547 - 628.718 213.533 983.333 - 13.665 42,627.3961995-96 2,848.185 42,077.244 294.430 - 607.820 229.546 993.159 - 13.392 47,063.7751996-97 3,635.102 44,280.131 282.820 - 614.267 227.851 1,027.605 - 12.038 50,079.8131997-98 4,487.432 52,009.408 291.701 - 654.627 228.776 1,066.995 - 12.168 58,751.1071998-99 4,767.427 58,097.244 284.733 - 603.316 248.528 1,074.972 - 12.771 65,088.9921999-00 4,722.567 63,826.935 298.472 - 601.409 199.585 1,043.568 - 13.648 70,706.1832000-01 4,843.083 60,340.441 275.458 - 528.333 174.761 1,195.804 - 13.602 67,371.4812001-02 4,753.237 64,575.367 286.285 - - U 156.168 1,178.683 - 11.690 70,961.431 (3)
2002-03 - U 69,821.507 271.947 - 491.508 164.775 1,254.186 - 11.784 72,015.7072003-04 - U 71,850.901 256.048 - 484.961 185.643 1,237.474 - 10.228 74,025.2542004-05 - U 75,258.093 251.783 - 485.459 156.848 1,248.462 - 9.994 77,410.6402005-06 - U 76,429.073 220.243 - 457.300 174.795 1,242.675 - 8.699 78,532.7852006-07 - U 78,744.088 195.429 - 456.646 134.379 1,251.510 - 8.063 80,790.1152007-08 - U 69,887.592 193.317 - 446.616 141.251 1,311.935 - 8.320 71,989.0322008-09 - U 70,863.339 198.906 - 546.598 140.373 1,409.783 - 8.132 73,167.1312009-10 - U 70,392.255 37.270 (4) - 556.000 21.123 (4) 321.338 (4) - 1.776 (4) 71,329.7632010-11 - U 72,704.655 158.228 - 594.911 108.523 1,085.093 - 6.629 74,658.0392011-12 - U 74,446.489 160.525 - 619.515 167.477 1,126.989 - 7.226 76,528.2212012-13 - U 74,638.097 135.800 - 608.050 94.336 1,282.135 - 5.558 76,763.9762013-14 - U 75,383.211 131.178 - 585.219 118.882 1,101.386 - 4.520 77,324.3962014-15 - U 79,375.637 133.779 - 615.748 69.309 1,145.942 - 4.518 81,344.9342015-16 - U 83,290.743 130.630 - 650.976 132.229 (5) 1,190.470 - 3.671 85,398.7182016-17 - U 83,179.801 122.414 - 668.998 121.656 1,097.666 - 4.389 85,194.9242017-18 - U 84,507.156 114.671 - 641.720 123.808 1,155.211 - 5.214 86,547.7802018-19 - U 86,036.009 (6) 104.291 - 611.662 274.306 1,440.873 - - (7) 88,467.141
Notes: These data should be read in conjunction with the explanatory notes.
(1) Turnover figure is net and does not include agent commission.
(2) NSW does not collect information relating to minor gaming.
(3) Total turnover figure incomplete from this period on, due to data for one or more components being unavailable.
(4) Data only available for three months April to June 2010.
(5) Includes new product "Set for Life", commenced 7 August 2015.
(6) Club and hotel gaming machine data are provided based on club and hotel financial years respectively. For clubs this runs from September to August; for hotels this runs from July to June.
(7) Pools was withdrawn from the Australian Lottery Market on 23 June 2018.
NA = Not applicable
U = Unavailable data
KENO
Value ($ million)
CASINOGAMING
MACHINESINSTANT LOTTERY
INTERACTIVE GAMING (NA)
LOTTERIESLOTTO
(1)MINOR GAMING
(2)POOLS TOTAL GAMING
Australian Gambling Statistics, 1993–94 to 2018–19, 36th edition
25

TABLE NSW 18NEW SOUTH WALES
PER CAPITA GAMING TURNOVER
1993-94 - 4,213.96 40.08 - 55.70 30.57 106.38 - 2.52 4,449.211994-95 - 4,964.45 39.20 - 77.13 26.19 120.63 - 1.68 5,229.281995-96 359.77 5,315.05 37.19 - 76.78 29.00 125.45 - 1.69 5,944.931996-97 459.34 5,595.37 35.74 - 77.62 28.79 129.85 - 1.52 6,328.241997-98 560.19 6,492.63 36.41 - 81.72 28.56 133.20 - 1.52 7,334.241998-99 594.99 7,250.68 35.54 - 75.30 31.02 134.16 - 1.59 8,123.271999-00 595.50 8,048.33 37.64 - 75.84 25.17 131.59 - 1.72 8,915.772000-01 638.62 7,956.68 36.32 - 69.67 23.04 157.68 - 1.79 8,883.812001-02 636.49 8,647.01 38.34 - - U 20.91 157.83 - 1.57 9,502.14 (3)
2002-03 - U 9,539.95 37.16 - 67.16 22.51 171.36 - 1.61 9,839.752003-04 - U 9,975.92 35.55 - 67.33 25.78 171.81 - 1.42 10,277.812004-05 - U 10,614.62 35.51 - 68.47 22.12 176.09 - 1.41 10,918.222005-06 - U 11,025.36 31.77 - 65.97 25.22 179.26 - 1.25 11,328.832006-07 - U 11,552.32 28.67 - 66.99 19.71 183.61 - 1.18 11,852.482007-08 - U 10,414.25 28.81 - 66.55 21.05 195.50 - 1.24 10,727.392008-09 - U 10,687.95 30.00 - 82.44 21.17 212.63 - 1.23 11,035.422009-10 - U 10,692.45 5.66 (4) - 84.46 3.21 (4) 48.81 (4) - 0.27 (4) 10,834.852010-11 - U 11,231.06 24.44 - 91.90 16.76 167.62 - 1.02 11,532.812011-12 - U 11,624.49 25.07 - 96.73 26.15 175.97 - 1.13 11,949.542012-13 - U 11,758.63 21.39 - 95.79 14.86 201.99 - 0.88 12,093.552013-14 - U 12,006.96 20.89 - 93.21 18.94 175.43 - 0.72 12,316.152014-15 - U 12,665.35 21.35 - 98.25 11.06 182.85 - 0.72 12,979.572015-16 - U 13,268.68 20.81 - 103.70 21.06 (5) 189.65 - 0.58 13,604.492016-17 - U 13,249.86 19.50 - 106.57 19.38 174.85 - 0.70 13,570.852017-18 - U 13,478.84 18.29 - 102.35 19.75 184.26 - 0.83 13,804.322018-19 - U 13,724.34 (6) 16.64 - 97.57 43.76 229.85 - - (7) 14,112.16
Notes: These data should be read in conjunction with the explanatory notes.
(1) Turnover figure is net and does not include agent commission.
(2) NSW does not collect information relating to minor gaming.
(3) Total turnover figure incomplete from this period on, due to data for one or more components being unavailable.
(4) Data only available for three months April to June 2010.
(5) Includes new product "Set for Life", commenced 7 August 2015.
(6) Club and hotel gaming machine data are provided based on club and hotel financial years respectively. For clubs this runs from September to August; for hotels this runs from July to June.
(7) Pools was withdrawn from the Australian Lottery Market on 23 June 2018.
NA = Not applicable
U = Unavailable data
KENO
Value ($)
CASINOGAMING
MACHINESINSTANT LOTTERY
INTERACTIVE GAMING (NA)
LOTTERIESLOTTO
(1)MINOR GAMING
(2)POOLS TOTAL GAMING
Australian Gambling Statistics, 1993–94 to 2018–19, 36th edition
26

TABLE NSW 19NEW SOUTH WALES
REAL PER CAPITA GAMING TURNOVER
1993-94 - 7,830.82 74.48 - 103.52 56.81 197.68 - 4.69 8,267.991994-95 - 8,934.45 70.55 - 138.81 47.14 217.10 - 3.02 9,411.061995-96 621.03 9,174.69 64.20 - 132.53 50.05 216.55 - 2.92 10,261.971996-97 782.25 9,528.84 60.86 - 132.19 49.03 221.13 - 2.59 10,776.901997-98 954.00 11,056.86 62.01 - 139.17 48.64 226.84 - 2.59 12,490.101998-99 1,001.30 12,202.10 59.80 - 126.71 52.20 225.78 - 2.68 13,670.571999-00 979.05 13,232.19 61.88 - 124.68 41.38 216.35 - 2.83 14,658.352000-01 990.04 12,335.01 56.31 - 108.00 35.73 244.45 - 2.78 13,772.322001-02 959.35 13,033.34 57.78 - - U 31.52 237.90 - 2.36 14,322.25 (3)
2002-03 - U 13,955.23 54.35 - 98.24 32.93 250.67 - 2.36 14,393.782003-04 - U 14,245.97 50.77 - 96.15 36.81 245.36 - 2.03 14,677.082004-05 - U 14,805.97 49.53 - 95.51 30.86 245.62 - 1.97 15,229.452005-06 - U 14,905.13 42.95 - 89.18 34.09 242.35 - 1.70 15,315.402006-07 - U 15,168.23 37.64 - 87.96 25.89 241.07 - 1.55 15,562.352007-08 - U 13,232.36 36.60 - 84.56 26.74 248.40 - 1.58 13,630.242008-09 - U 13,169.50 36.97 - 101.58 26.09 262.00 - 1.51 13,597.642009-10 - U 12,869.29 6.81 (4) - 101.65 3.86 (4) 58.75 (4) - 0.32 (4) 13,040.682010-11 - U 13,116.32 28.55 - 107.33 19.58 195.76 - 1.20 13,468.722011-12 - U 13,263.54 28.60 - 110.37 29.84 200.79 - 1.29 13,634.432012-13 - U 13,114.96 23.86 - 106.84 16.58 225.29 - 0.98 13,488.502013-14 - U 13,047.57 22.70 - 101.29 20.58 190.63 - 0.78 13,383.552014-15 - U 13,531.05 22.81 - 104.97 11.82 195.35 - 0.77 13,866.752015-16 - U 13,979.28 21.92 - 109.26 22.19 (5) 199.81 - 0.62 14,333.082016-17 - U 13,718.77 20.19 - 110.34 20.06 181.04 - 0.72 14,051.122017-18 - U 13,694.88 18.58 - 103.99 20.06 187.21 - 0.85 14,025.582018-19 - U 13,724.34 (6) 16.64 - 97.57 43.76 229.85 - - (7) 14,112.16
Notes: These data should be read in conjunction with the explanatory notes.
(1) Turnover figure is net and does not include agent commission.
(2) NSW does not collect information relating to minor gaming.
(3) Total turnover figure incomplete from this period on, due to data for one or more components being unavailable.
(4) Data only available for three months April to June 2010.
(5) Includes new product "Set for Life", commenced 7 August 2015.
(6) Club and hotel gaming machine data are provided based on club and hotel financial years respectively. For clubs this runs from September to August; for hotels this runs from July to June.
(7) Pools was withdrawn from the Australian Lottery Market on 23 June 2018.
NA = Not applicable
U = Unavailable data
KENO
Value ($)
CASINOGAMING
MACHINESINSTANT LOTTERY
INTERACTIVE GAMING (NA)
LOTTERIESLOTTO
(1)MINOR GAMING
(2)POOLS TOTAL GAMING
Australian Gambling Statistics, 1993–94 to 2018–19, 36th edition
27

TABLE NSW 20NEW SOUTH WALES
TOTAL GAMING EXPENDITURE
1993-94 - 1,950.045 65.724 - 62.396 47.527 190.652 - 5.649 2,321.9921994-95 - 2,214.359 64.985 - 87.337 41.091 218.557 - 3.797 2,630.1261995-96 279.400 2,397.475 62.428 - 88.030 46.076 229.913 - 3.879 3,107.2011996-97 361.450 2,484.320 60.783 - 90.175 46.358 241.126 - 3.535 3,287.7471997-98 446.200 2,989.084 62.691 - 96.100 46.554 250.285 - 3.573 3,894.4871998-99 479.700 3,487.487 61.925 - 89.625 51.167 255.190 - 3.795 4,428.8891999-00 486.400 3,882.199 66.418 - 91.450 42.067 253.599 - 4.151 4,826.2842000-01 529.000 4,119.488 73.242 - 85.200 43.481 331.928 - 4.630 5,186.9692001-02 534.000 4,306.997 78.342 - - U 39.938 337.702 - 4.126 5,301.105 (2)
2002-03 541.000 4,459.395 76.646 - 36.300 E 43.938 372.318 - 4.296 5,533.8932003-04 551.000 4,673.437 73.914 - 84.007 E 50.297 377.824 - 3.825 5,814.3042004-05 543.900 4,914.997 74.361 - 86.212 E 43.542 392.878 - 3.809 6,059.6992005-06 638.000 5,023.552 67.189 - 83.918 E 50.299 405.652 - 3.446 6,272.0562006-07 687.093 5,206.100 61.160 - 80.294 E 39.662 422.089 - 3.256 6,499.6542007-08 704.287 4,644.682 62.374 - 88.665 (3) 42.850 456.483 - 3.497 6,002.8382008-09 747.799 4,772.059 66.232 - 105.416 44.150 505.339 - 3.766 6,244.7612009-10 734.881 4,758.584 11.333 (4) - 112.634 6.049 (4) 106.747 (4) - 0.738 (4) 5,730.966 (2)
2010-11 902.001 4,996.829 49.587 - 123.607 31.790 371.416 - 2.838 6,478.0682011-12 953.716 5,179.488 51.492 - 134.199 51.682 394.873 - 3.166 6,768.6162012-13 1,057.507 5,250.473 44.563 - 134.713 29.941 459.579 - 2.491 6,979.2672013-14 1,140.491 5,402.834 43.887 - 133.246 38.728 405.210 - 2.080 7,166.4762014-15 1,417.992 5,744.291 43.598 - 142.771 23.359 428.862 - 2.114 7,802.9872015-16 1,508.123 6,102.629 43.119 - 153.175 47.016 (5) 451.798 - 1.742 8,307.6022016-17 1,543.554 6,188.420 41.121 - 160.027 44.031 423.825 - 2.119 8,403.0972017-18 1,574.819 6,386.773 39.253 - 156.091 45.656 454.603 - 2.566 8,659.7612018-19 1,404.761 6,531.403 (6) 36.272 - 151.307 103.142 576.156 - - (7) 8,803.041
Notes: These data should be read in conjunction with the explanatory notes.
(1) NSW does not collect information relating to minor gaming.
(2) Total expenditure figure incomplete due to data for one or more components being unavailable.
(3) Represents actual keno expenditure, from this period on.
(4) Data only available for three months April to June 2010.
(5) Includes new product "Set for Life", commenced 7 August 2015.
(6) Club and hotel gaming machine data are provided based on club and hotel financial years respectively. For clubs this runs from September to August; for hotels this runs from July to June.
(7) Pools was withdrawn from the Australian Lottery Market on 23 June 2018.
E = Estimated data
NA = Not applicable
U = Unavailable data
KENO
Value ($ million)
CASINOGAMING
MACHINESINSTANT LOTTERY
INTERACTIVE GAMING (NA)
LOTTERIES LOTTOMINOR GAMING
(1)POOLS TOTAL GAMING
Australian Gambling Statistics, 1993–94 to 2018–19, 36th edition
28

TABLE NSW 21NEW SOUTH WALES
REAL GAMING EXPENDITURE
1993-94 - 3,623.780 122.135 - 115.951 88.320 354.289 - 10.497 4,314.9721994-95 - 3,985.148 116.953 - 157.179 73.951 393.334 - 6.833 4,733.3981995-96 482.293 4,138.455 107.761 - 151.955 79.535 396.869 - 6.696 5,363.5651996-97 615.544 4,230.760 103.513 - 153.567 78.947 410.634 - 6.020 5,598.9841997-98 759.872 5,090.365 106.762 - 163.657 79.281 426.232 - 6.085 6,632.2531998-99 807.283 5,869.060 104.213 - 150.829 86.108 429.457 - 6.387 7,453.3371999-00 799.686 6,382.693 109.197 - 150.352 69.162 416.940 - 6.825 7,934.8562000-01 820.094 6,386.326 113.545 - 132.083 67.407 514.579 - 7.178 8,041.2112001-02 804.880 6,491.788 118.082 - - U 60.197 509.007 - 6.219 7,990.173 (2)
2002-03 791.386 6,523.294 112.119 - 53.100 E 64.273 544.634 - 6.284 8,095.0922003-04 786.847 6,673.832 105.552 - 119.965 E 71.826 539.546 - 5.462 8,303.0302004-05 758.667 6,855.760 103.724 - 120.254 E 60.735 548.012 - 5.313 8,452.4652005-06 862.509 6,791.319 90.833 - 113.448 E 67.999 548.399 - 4.659 8,479.1662006-07 902.155 6,835.627 80.303 - 105.426 E 52.076 554.204 - 4.275 8,534.0682007-08 894.868 5,901.539 79.252 - 112.658 (3) 54.445 580.008 - 4.443 7,627.2142008-09 921.424 5,880.042 81.610 - 129.892 54.401 622.669 - 4.640 7,694.6792009-10 884.493 5,727.367 13.640 (4) - 135.565 7.280 (4) 128.479 (4) - 0.888 (4) 6,897.713 (2)
2010-11 1,053.412 5,835.601 57.911 - 144.356 37.126 433.762 - 3.314 7,565.4822011-12 1,088.190 5,909.796 58.752 - 153.121 58.969 450.550 - 3.612 7,722.9912012-13 1,179.487 5,856.099 49.703 - 150.252 33.395 512.590 - 2.778 7,784.3052013-14 1,239.334 5,871.080 47.691 - 144.794 42.084 440.328 - 2.260 7,787.5702014-15 1,514.915 6,136.925 46.578 - 152.530 24.956 458.176 - 2.258 8,336.3372015-16 1,588.890 6,429.455 45.428 - 161.378 49.534 (5) 475.994 - 1.835 8,752.5152016-17 1,598.181 6,407.429 42.576 - 165.690 45.589 438.824 - 2.194 8,700.4842017-18 1,600.061 6,489.143 39.882 - 158.593 46.388 461.890 - 2.607 8,798.5642018-19 1,404.761 6,531.403 (6) 36.272 - 151.307 103.142 576.156 - - (7) 8,803.041
Notes: These data should be read in conjunction with the explanatory notes.
(1) NSW does not collect information relating to minor gaming.
(2) Total expenditure figure incomplete due to data for one or more components being unavailable.
(3) Represents actual keno expenditure, from this period on.
(4) Data only available for three months April to June 2010.
(5) Includes new product "Set for Life", commenced 7 August 2015.
(6) Club and hotel gaming machine data are provided based on club and hotel financial years respectively. For clubs this runs from September to August; for hotels this runs from July to June.
(7) Pools was withdrawn from the Australian Lottery Market on 23 June 2018.
E = Estimated data
NA = Not applicable
U = Unavailable data
KENO
Value ($ million)
CASINOGAMING
MACHINESINSTANT LOTTERY
INTERACTIVE GAMING (NA)
LOTTERIES LOTTOMINOR GAMING
(1)POOLS TOTAL GAMING
Australian Gambling Statistics, 1993–94 to 2018–19, 36th edition
29

TABLE NSW 22NEW SOUTH WALES
PER CAPITA GAMING EXPENDITURE
1993-94 - 435.22 14.67 - 13.93 10.61 42.55 - 1.26 518.241994-95 - 488.87 14.35 - 19.28 9.07 48.25 - 0.84 580.671995-96 60.92 522.76 13.61 - 19.19 10.05 50.13 - 0.85 677.511996-97 77.78 534.61 13.08 - 19.41 9.98 51.89 - 0.76 707.501997-98 94.86 635.46 13.33 - 20.43 9.90 53.21 - 0.76 827.941998-99 100.75 732.47 13.01 - 18.82 10.75 53.60 - 0.80 930.191999-00 100.84 804.83 13.77 - 18.96 8.72 52.57 - 0.86 1,000.552000-01 108.14 842.12 14.97 - 17.42 8.89 67.85 - 0.95 1,060.342001-02 107.78 869.29 15.81 - - U 8.06 68.16 - 0.83 1,069.93 (2)
2002-03 108.13 891.30 15.32 - 7.26 E 8.78 74.42 - 0.86 1,106.062003-04 109.25 926.61 14.66 - 16.66 E 9.97 74.91 - 0.76 1,152.812004-05 107.00 966.96 14.63 - 16.96 E 8.57 77.29 - 0.75 1,192.162005-06 124.42 979.69 13.10 - 16.37 E 9.81 79.11 - 0.67 1,223.172006-07 132.35 1,002.83 11.78 - 15.47 E 7.64 81.31 - 0.63 1,252.012007-08 133.35 879.41 11.81 - 16.79 (3) 8.11 86.43 - 0.66 1,136.562008-09 138.97 886.86 12.31 - 19.59 8.20 93.91 - 0.70 1,160.552009-10 134.35 869.98 2.07 (4) - 20.59 1.11 (4) 19.52 (4) - 0.13 (4) 1,047.75 (2)
2010-11 162.73 901.46 8.95 - 22.30 5.74 67.01 - 0.51 1,168.682011-12 169.92 922.79 9.17 - 23.91 9.21 70.35 - 0.56 1,205.912012-13 185.82 922.58 7.83 - 23.67 5.26 80.75 - 0.44 1,226.352013-14 197.40 935.14 7.60 - 23.06 6.70 70.13 - 0.36 1,240.402014-15 241.72 979.22 7.43 - 24.34 3.98 73.11 - 0.36 1,330.162015-16 253.12 1,024.25 7.24 - 25.71 7.89 (5) 75.83 - 0.29 1,394.322016-17 254.58 1,020.65 6.78 - 26.39 7.26 69.90 - 0.35 1,385.922017-18 255.21 1,035.01 6.36 - 25.30 7.40 73.67 - 0.42 1,403.372018-19 224.09 1,041.88 (6) 5.79 - 24.14 16.45 91.91 - - (7) 1,404.25
Notes: These data should be read in conjunction with the explanatory notes.
(1) NSW does not collect information relating to minor gaming.
(2) Total expenditure figure incomplete due to data for one or more components being unavailable.
(3) Represents actual keno expenditure, from this period on.
(4) Data only available for three months April to June 2010.
(5) Includes new product "Set for Life", commenced 7 August 2015.
(6) Club and hotel gaming machine data are provided based on club and hotel financial years respectively. For clubs this runs from September to August; for hotels this runs from July to June.
(7) Pools was withdrawn from the Australian Lottery Market on 23 June 2018.
E = Estimated data
NA = Not applicable
U = Unavailable data
KENO
Value ($)
CASINOGAMING
MACHINESINSTANT LOTTERY
INTERACTIVE GAMING (NA)
LOTTERIES LOTTOMINOR GAMING
(1)POOLS TOTAL GAMING
Australian Gambling Statistics, 1993–94 to 2018–19, 36th edition
30

TABLE NSW 23NEW SOUTH WALES
REAL PER CAPITA GAMING EXPENDITURE
1993-94 - 808.78 27.26 - 25.88 19.71 79.07 - 2.34 963.051994-95 - 879.82 25.82 - 34.70 16.33 86.84 - 1.51 1,045.021995-96 105.16 902.37 23.50 - 33.13 17.34 86.54 - 1.46 1,169.491996-97 132.46 910.44 22.28 - 33.05 16.99 88.37 - 1.30 1,204.871997-98 161.54 1,082.18 22.70 - 34.79 16.85 90.61 - 1.29 1,409.971998-99 169.55 1,232.67 21.89 - 31.68 18.09 90.20 - 1.34 1,565.421999-00 165.79 1,323.22 22.64 - 31.17 14.34 86.44 - 1.41 1,645.002000-01 167.65 1,305.52 23.21 - 27.00 13.78 105.19 - 1.47 1,643.812001-02 162.45 1,310.25 23.83 - - U 12.15 102.73 - 1.26 1,612.67 (2)
2002-03 158.17 1,303.81 22.41 - 10.61 E 12.85 108.86 - 1.26 1,617.972003-04 156.01 1,323.23 20.93 - 23.79 E 14.24 106.98 - 1.08 1,646.252004-05 149.26 1,348.77 20.41 - 23.66 E 11.95 107.81 - 1.05 1,662.902005-06 168.21 1,324.44 17.71 - 22.12 E 13.26 106.95 - 0.91 1,653.602006-07 173.78 1,316.73 15.47 - 20.31 E 10.03 106.75 - 0.82 1,643.892007-08 169.43 1,117.38 15.01 - 21.33 (3) 10.31 109.82 - 0.84 1,444.122008-09 171.24 1,092.77 15.17 - 24.14 10.11 115.72 - 0.86 1,430.012009-10 161.71 1,047.09 2.49 (4) - 24.78 1.33 (4) 23.49 (4) - 0.16 (4) 1,261.06 (2)
2010-11 190.04 1,052.77 10.45 - 26.04 6.70 78.25 - 0.60 1,364.852011-12 193.87 1,052.90 10.47 - 27.28 10.51 80.27 - 0.64 1,375.942012-13 207.25 1,029.00 8.73 - 26.40 5.87 90.07 - 0.49 1,367.812013-14 214.51 1,016.19 8.25 - 25.06 7.28 76.21 - 0.39 1,347.902014-15 258.25 1,046.15 7.94 - 26.00 4.25 78.10 - 0.39 1,421.082015-16 266.67 1,079.10 7.62 - 27.09 8.31 (5) 79.89 - 0.31 1,469.002016-17 263.59 1,056.77 7.02 - 27.33 7.52 72.37 - 0.36 1,434.962017-18 259.30 1,051.60 6.46 - 25.70 7.52 74.85 - 0.42 1,425.862018-19 224.09 1,041.88 (6) 5.79 - 24.14 16.45 91.91 - - (7) 1,404.25
Notes: These data should be read in conjunction with the explanatory notes.
(1) NSW does not collect information relating to minor gaming.
(2) Total expenditure figure incomplete due to data for one or more components being unavailable.
(3) Represents actual keno expenditure, from this period on.
(4) Data only available for three months April to June 2010.
(5) Includes new product "Set for Life", commenced 7 August 2015.
(6) Club and hotel gaming machine data are provided based on club and hotel financial years respectively. For clubs this runs from September to August; for hotels this runs from July to June.
(7) Pools was withdrawn from the Australian Lottery Market on 23 June 2018.
E = Estimated data
NA = Not applicable
U = Unavailable data
KENO
Value ($)
CASINOGAMING
MACHINESINSTANT LOTTERY
INTERACTIVE GAMING (NA)
LOTTERIES LOTTOMINOR GAMING
(1)POOLS TOTAL GAMING
Australian Gambling Statistics, 1993–94 to 2018–19, 36th edition
31

TABLE NSW 24NEW SOUTH WALES
GAMING EXPENDITUREAS A % OF HDI
1993-94 - 1.696 0.057 - 0.054 0.041 0.166 - 0.005 2.0201994-95 - 1.831 0.054 - 0.072 0.034 0.181 - 0.003 2.1751995-96 0.217 1.859 0.048 - 0.068 0.036 0.178 - 0.003 2.4091996-97 0.264 1.811 0.044 - 0.066 0.034 0.176 - 0.003 2.3971997-98 0.313 2.097 0.044 - 0.067 0.033 0.176 - 0.003 2.7331998-99 0.324 2.356 0.042 - 0.061 0.035 0.172 - 0.003 2.9921999-00 0.309 2.463 0.042 - 0.058 0.027 0.161 - 0.003 3.0622000-01 0.306 2.384 0.042 - 0.049 0.025 0.192 - 0.003 3.0022001-02 0.302 2.436 0.044 - - U 0.023 0.191 - 0.002 2.999 (2)
2002-03 0.299 2.464 0.042 - 0.020 E 0.024 0.206 - 0.002 3.0582003-04 0.283 2.399 0.038 - 0.043 E 0.026 0.194 - 0.002 2.9852004-05 0.260 2.350 0.036 - 0.041 E 0.021 0.188 - 0.002 2.8982005-06 0.293 2.310 0.031 - 0.039 E 0.023 0.187 - 0.002 2.8852006-07 0.294 2.227 0.026 - 0.034 E 0.017 0.181 - 0.001 2.7812007-08 0.279 1.842 0.025 - 0.035 (3) 0.017 0.181 - 0.001 2.3812008-09 0.274 1.747 0.024 - 0.039 0.016 0.185 - 0.001 2.2862009-10 0.259 1.676 0.004 (4) - 0.040 0.002 (4) 0.038 (4) - 0.000 (4) 2.018 (2)
2010-11 0.294 1.627 0.016 - 0.040 0.010 0.121 - 0.001 2.1092011-12 0.293 1.590 0.016 - 0.041 0.016 0.121 - 0.001 2.0782012-13 0.317 1.574 0.013 - 0.040 0.009 0.138 - 0.001 2.0922013-14 0.321 1.521 0.012 - 0.038 0.011 0.114 - 0.001 2.0172014-15 0.381 1.545 0.012 - 0.038 0.006 0.115 - 0.001 2.0992015-16 0.395 1.596 0.011 - 0.040 0.012 (5) 0.118 - 0.000 2.1732016-17 0.393 1.575 0.010 - 0.041 0.011 0.108 - 0.001 2.1382017-18 0.389 1.580 0.010 - 0.039 0.011 0.112 - 0.001 2.1422018-19 0.337 1.569 (6) 0.009 - 0.036 0.025 0.138 - - (7) 2.115
Notes: These data should be read in conjunction with the explanatory notes.
(1) NSW does not collect information relating to minor gaming.
(2) Total expenditure figure incomplete due to data for one or more components being unavailable.
(3) Represents actual keno expenditure, from this period on.
(4) Data only available for three months April to June 2010.
(5) Includes new product "Set for Life", commenced 7 August 2015.
(6) Club and hotel gaming machine data are provided based on club and hotel financial years respectively. For clubs this runs from September to August; for hotels this runs from July to June.
(7) Pools was withdrawn from the Australian Lottery Market on 23 June 2018.
E = Estimated data
NA = Not applicable
U = Unavailable data
Percentage (%)
CASINOGAMING
MACHINESINSTANT LOTTERY
TOTAL GAMINGINTERACTIVE GAMING (NA)
KENO LOTTERIES LOTTOMINOR GAMING
(1)POOLS
Australian Gambling Statistics, 1993–94 to 2018–19, 36th edition
32

TABLE NSW 25NEW SOUTH WALES
GAMING EXPENDITURESHARE OF MARKET
1993-94 - 83.98 2.83 - 2.69 2.05 8.21 - 0.241994-95 - 84.19 2.47 - 3.32 1.56 8.31 - 0.141995-96 8.99 77.16 2.01 - 2.83 1.48 7.40 - 0.121996-97 10.99 75.56 1.85 - 2.74 1.41 7.33 - 0.111997-98 11.46 76.75 1.61 - 2.47 1.20 6.43 - 0.091998-99 10.83 78.74 1.40 - 2.02 1.16 5.76 - 0.091999-00 10.08 80.44 1.38 - 1.89 0.87 5.25 - 0.092000-01 10.20 79.42 1.41 - 1.64 0.84 6.40 - 0.092001-02 10.07 81.25 1.48 - - U 0.75 6.37 - 0.082002-03 9.78 80.58 1.39 - 0.66 E 0.79 6.73 - 0.082003-04 9.48 80.38 1.27 - 1.44 E 0.87 6.50 - 0.072004-05 8.98 81.11 1.23 - 1.42 E 0.72 6.48 - 0.062005-06 10.17 80.09 1.07 - 1.34 E 0.80 6.47 - 0.052006-07 10.57 80.10 0.94 - 1.24 E 0.61 6.49 - 0.052007-08 11.73 77.37 1.04 - 1.48 (2) 0.71 7.60 - 0.062008-09 11.97 76.42 1.06 - 1.69 0.71 8.09 - 0.062009-10 12.82 83.03 0.20 (3) - 1.97 0.11 (3) 1.86 (3) - 0.01 (3)
2010-11 13.92 77.13 0.77 - 1.91 0.49 5.73 - 0.042011-12 14.09 76.52 0.76 - 1.98 0.76 5.83 - 0.052012-13 15.15 75.23 0.64 - 1.93 0.43 6.58 - 0.042013-14 15.91 75.39 0.61 - 1.86 0.54 5.65 - 0.032014-15 18.17 73.62 0.56 - 1.83 0.30 5.50 - 0.032015-16 18.15 73.46 0.52 - 1.84 0.57 (4) 5.44 - 0.022016-17 18.37 73.64 0.49 - 1.90 0.52 5.04 - 0.032017-18 18.19 73.75 0.45 - 1.80 0.53 5.25 - 0.032018-19 15.96 74.19 (5) 0.41 - 1.72 1.17 6.54 - - (6)
Notes: These data should be read in conjunction with the explanatory notes.
(1) NSW does not collect information relating to minor gaming.
(2) Represents actual keno expenditure, from this period on.
(3) Data only available for three months April to June 2010.
(4) Includes new product "Set for Life", commenced 7 August 2015.
(5) Club and hotel gaming machine data are provided based on club and hotel financial years respectively. For clubs this runs from September to August; for hotels this runs from July to June.
(6) Pools was withdrawn from the Australian Lottery Market on 23 June 2018.
E = Estimated data
NA = Not applicable
U = Unavailable data
POOLS
Percentage (%)
CASINOGAMING
MACHINESINSTANT LOTTERY
INTERACTIVE GAMING (NA)
KENO LOTTERIES LOTTOMINOR GAMING
(1)
Australian Gambling Statistics, 1993–94 to 2018–19, 36th edition
33

TABLE NSW 26NEW SOUTH WALES
GOVERNMENT REVENUE FROM GAMING
1993-94 - 430.791 - 257.364 - 688.1551994-95 - 497.742 - 248.405 - 746.1471995-96 62.083 529.158 - 259.084 - 850.3251996-97 78.550 548.556 - 270.284 - 897.3901997-98 101.500 689.770 - 271.851 - 1,063.1211998-99 107.700 828.210 - 277.034 - 1,212.9441999-00 114.900 955.089 - 278.917 - 1,348.9062000-01 70.600 729.213 - 253.540 - 1,053.3532001-02 69.000 725.521 - 262.035 - 1,056.5562002-03 69.400 764.700 - 281.649 - 1,115.7492003-04 70.200 807.978 - 285.388 - 1,163.5662004-05 76.200 899.125 - 295.479 - 1,270.8042005-06 80.710 998.499 - 292.104 - 1,371.3132006-07 88.620 1,122.709 - 290.912 - 1,502.2412007-08 82.260 1,007.023 - 313.473 - 1,402.7562008-09 93.230 1,063.126 - 344.093 - 1,500.4492009-10 91.390 1,078.292 - 82.802 (2) - 1,252.484 (3)
2010-11 121.020 1,162.501 - 302.014 - 1,585.5352011-12 133.360 1,165.565 - 332.129 - 1,631.0542012-13 154.370 1,193.130 - 353.275 - 1,700.7752013-14 164.270 1,248.082 - 322.245 - 1,734.5972014-15 221.199 1,364.536 - 327.087 - 1,912.8222015-16 237.221 1,474.248 - 357.142 - 2,068.6112016-17 256.596 1,531.988 - 335.701 - 2,124.2852017-18 254.137 1,610.851 - 356.095 - 2,221.0832018-19 243.549 1,688.617 - 469.965 - 2,402.131
Notes: These data should be read in conjunction with the explanatory notes.
Data for the gambling revenue received by states and territories from 1 July 2000 onwards are not comparable with that of preceding years because of
the impact of changes brought about by the introduction of the GST.
(1) NSW does not collect information relating to minor gaming.
(2) Data only available for three months April to June 2010.
(3) Total revenue figure incomplete due to data for one or more components being unavailable.
NA = Not applicable
TOTAL GAMING
Value ($ million)
CASINO GAMINGGAMING
MACHINES & KENO
INTERACTIVE GAMING (NA)
LOTTERIES & POOLS LOTTO
MINOR GAMING(1)
Australian Gambling Statistics, 1993–94 to 2018–19, 36th edition
34

TABLE NSW 27NEW SOUTH WALES
REAL GOVERNMENT REVENUE FROM GAMING
1993-94 - 800.542 - 478.261 - 1,278.8031994-95 - 895.779 - 447.051 - 1,342.8291995-96 107.166 913.418 - 447.224 - 1,467.8081996-97 133.769 934.183 - 460.290 - 1,528.2421997-98 172.853 1,174.668 - 462.958 - 1,810.4791998-99 181.247 1,393.787 - 466.218 - 2,041.2521999-00 188.906 1,570.254 - 458.565 - 2,217.7262000-01 109.449 1,130.478 - 393.056 - 1,632.9832001-02 104.001 1,093.553 - 394.956 - 1,592.5102002-03 101.520 1,118.619 - 412.002 - 1,632.1412003-04 100.248 1,153.821 - 407.544 - 1,661.6132004-05 106.289 1,254.158 - 412.153 - 1,772.6012005-06 109.112 1,349.867 - 394.894 - 1,853.8722006-07 116.358 1,474.121 - 381.968 - 1,972.4482007-08 104.520 1,279.525 - 398.299 - 1,782.3442008-09 114.876 1,309.964 - 423.985 - 1,848.8252009-10 109.996 1,297.818 - 99.659 (2) - 1,507.473 (3)
2010-11 141.335 1,357.639 - 352.710 - 1,851.6842011-12 152.164 1,329.910 - 378.959 - 1,861.0332012-13 172.176 1,330.754 - 394.024 - 1,896.9542013-14 178.507 1,356.249 - 350.173 - 1,884.9292014-15 236.318 1,457.805 - 349.444 - 2,043.5672015-16 249.925 1,553.201 - 376.269 - 2,179.3952016-17 265.677 1,586.205 - 347.582 - 2,199.4642017-18 258.210 1,636.671 - 361.803 - 2,256.6842018-19 243.549 1,688.617 - 469.965 - 2,402.131
Notes: These data should be read in conjunction with the explanatory notes.
Data for the gambling revenue received by states and territories from 1 July 2000 onwards are not comparable with that of preceding years because of
the impact of changes brought about by the introduction of the GST.
(1) NSW does not collect information relating to minor gaming.
(2) Data only available for three months April to June 2010.
(3) Total revenue figure incomplete due to data for one or more components being unavailable.
NA = Not applicable
TOTAL GAMING
Value ($ million)
CASINO GAMINGGAMING
MACHINES & KENO
INTERACTIVE GAMING (NA)
LOTTERIES & POOLS LOTTO
MINOR GAMING(1)
Australian Gambling Statistics, 1993–94 to 2018–19, 36th edition
35

TABLE NSW 28NEW SOUTH WALES
PER CAPITA REVENUE FROM GAMING
1993-94 - 96.15 - 57.44 - 153.591994-95 - 109.89 - 54.84 - 164.731995-96 13.54 115.38 - 56.49 - 185.411996-97 16.90 118.05 - 58.16 - 193.111997-98 21.58 146.64 - 57.79 - 226.011998-99 22.62 173.95 - 58.19 - 254.751999-00 23.82 198.00 - 57.82 - 279.652000-01 14.43 149.07 - 51.83 - 215.332001-02 13.93 146.43 - 52.89 - 213.252002-03 13.87 152.84 - 56.29 - 223.002003-04 13.92 160.20 - 56.58 - 230.702004-05 14.99 176.89 - 58.13 - 250.012005-06 15.74 194.73 - 56.97 - 267.432006-07 17.07 216.26 - 56.04 - 289.372007-08 15.57 190.67 - 59.35 - 265.592008-09 17.33 197.58 - 63.95 - 278.852009-10 16.71 197.14 - 15.14 (2) - 228.98 (3)
2010-11 21.83 209.72 - 54.48 - 286.042011-12 23.76 207.66 - 59.17 - 290.592012-13 27.12 209.65 - 62.08 - 298.852013-14 28.43 216.02 - 55.78 - 300.232014-15 37.71 232.61 - 55.76 - 326.082015-16 39.81 247.43 - 59.94 - 347.192016-17 42.32 252.67 - 55.37 - 350.362017-18 41.18 261.05 - 57.71 - 359.942018-19 38.85 269.37 - 74.97 - 383.18
Notes: These data should be read in conjunction with the explanatory notes.
Data for the gambling revenue received by states and territories from 1 July 2000 onwards are not comparable with that of preceding years because of
the impact of changes brought about by the introduction of the GST.
(1) NSW does not collect information relating to minor gaming.
(2) Data only available for three months April to June 2010.
(3) Total revenue figure incomplete due to data for one or more components being unavailable.
NA = Not applicable
TOTAL GAMING
Value ($)
CASINO GAMINGGAMING
MACHINES & KENO
INTERACTIVE GAMING (NA)
LOTTERIES & POOLS LOTTO
MINOR GAMING(1)
Australian Gambling Statistics, 1993–94 to 2018–19, 36th edition
36
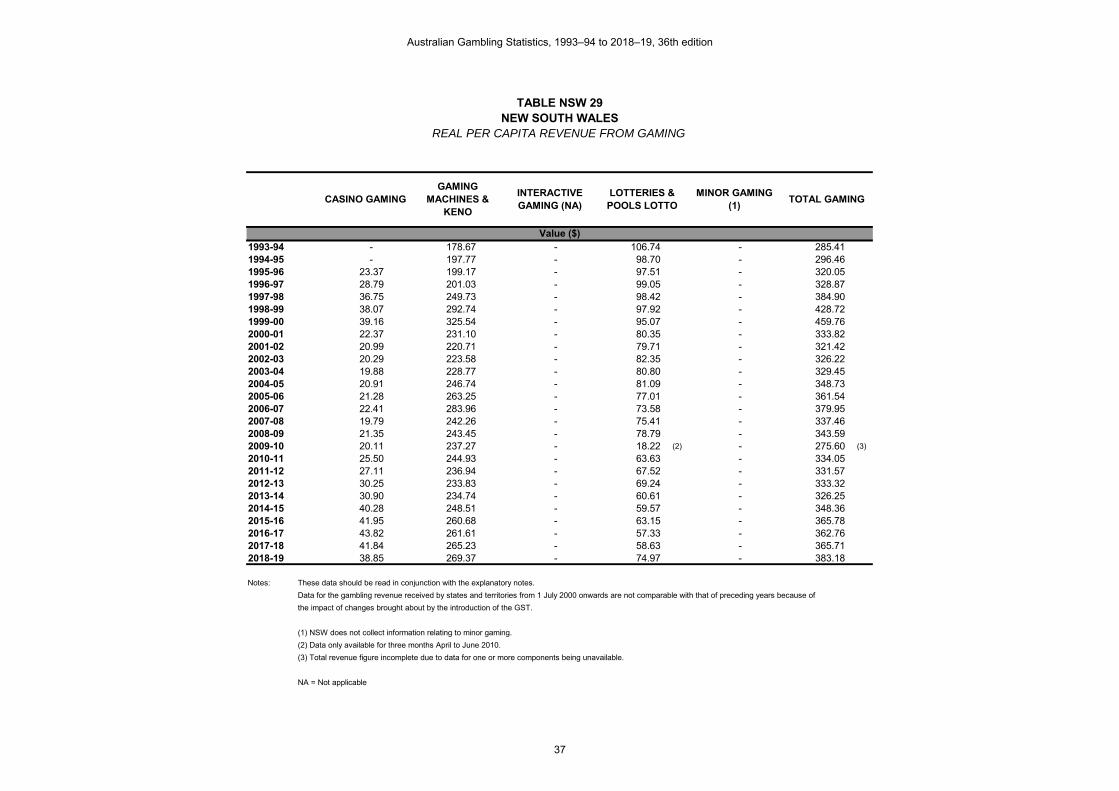
TABLE NSW 29NEW SOUTH WALES
REAL PER CAPITA REVENUE FROM GAMING
1993-94 - 178.67 - 106.74 - 285.411994-95 - 197.77 - 98.70 - 296.461995-96 23.37 199.17 - 97.51 - 320.051996-97 28.79 201.03 - 99.05 - 328.871997-98 36.75 249.73 - 98.42 - 384.901998-99 38.07 292.74 - 97.92 - 428.721999-00 39.16 325.54 - 95.07 - 459.762000-01 22.37 231.10 - 80.35 - 333.822001-02 20.99 220.71 - 79.71 - 321.422002-03 20.29 223.58 - 82.35 - 326.222003-04 19.88 228.77 - 80.80 - 329.452004-05 20.91 246.74 - 81.09 - 348.732005-06 21.28 263.25 - 77.01 - 361.542006-07 22.41 283.96 - 73.58 - 379.952007-08 19.79 242.26 - 75.41 - 337.462008-09 21.35 243.45 - 78.79 - 343.592009-10 20.11 237.27 - 18.22 (2) - 275.60 (3)
2010-11 25.50 244.93 - 63.63 - 334.052011-12 27.11 236.94 - 67.52 - 331.572012-13 30.25 233.83 - 69.24 - 333.322013-14 30.90 234.74 - 60.61 - 326.252014-15 40.28 248.51 - 59.57 - 348.362015-16 41.95 260.68 - 63.15 - 365.782016-17 43.82 261.61 - 57.33 - 362.762017-18 41.84 265.23 - 58.63 - 365.712018-19 38.85 269.37 - 74.97 - 383.18
Notes: These data should be read in conjunction with the explanatory notes.
Data for the gambling revenue received by states and territories from 1 July 2000 onwards are not comparable with that of preceding years because of
the impact of changes brought about by the introduction of the GST.
(1) NSW does not collect information relating to minor gaming.
(2) Data only available for three months April to June 2010.
(3) Total revenue figure incomplete due to data for one or more components being unavailable.
NA = Not applicable
TOTAL GAMING
Value ($)
CASINO GAMINGGAMING
MACHINES & KENO
INTERACTIVE GAMING (NA)
LOTTERIES & POOLS LOTTO
MINOR GAMING(1)
Australian Gambling Statistics, 1993–94 to 2018–19, 36th edition
37

TABLE NSW 30NEW SOUTH WALES
GOVERNMENT REVENUE FROM GAMINGAS A % OF TOTAL GAMBLING REVENUE
1993-94 - 42.67 - 25.49 - 68.171994-95 - 46.04 - 22.98 - 69.021995-96 5.22 44.53 - 21.80 - 71.561996-97 6.35 44.36 - 21.86 - 72.571997-98 7.53 51.15 - 20.16 - 78.831998-99 7.66 58.94 - 19.71 - 86.311999-00 7.45 61.92 - 18.08 - 87.452000-01 5.93 61.20 - 21.28 - 88.402001-02 5.76 60.52 - 21.86 - 88.132002-03 5.50 60.62 - 22.33 - 88.452003-04 5.34 61.45 - 21.70 - 88.492004-05 5.33 62.94 - 20.69 - 88.962005-06 5.30 65.60 - 19.19 - 90.092006-07 5.35 67.77 - 17.56 - 90.682007-08 5.30 64.93 - 20.21 - 90.452008-09 5.61 64.02 - 20.72 - 90.362009-10 6.44 75.97 - 5.83 (2) - 88.24 (3)
2010-11 6.92 66.49 - 17.27 - 90.692011-12 7.44 65.07 - 18.54 - 91.052012-13 8.31 64.21 - 19.01 - 91.532013-14 8.70 66.06 - 17.06 - 91.822014-15 10.67 65.83 - 15.78 - 92.292015-16 10.78 66.99 - 16.23 - 94.002016-17 11.50 68.67 - 15.05 - 95.222017-18 10.91 69.13 - 15.28 - 95.312018-19 9.76 67.66 - 18.83 - 96.26
Notes: These data should be read in conjunction with the explanatory notes.
Data for the gambling revenue received by states and territories from 1 July 2000 onwards are not comparable with that of preceding years because of
the impact of changes brought about by the introduction of the GST.
(1) NSW does not collect information relating to minor gaming.
(2) Data only available for three months April to June 2010.
(3) Total revenue figure incomplete due to data for one or more components being unavailable.
NA = Not applicable
Percentage (%)
TOTAL GAMINGCASINO GAMINGGAMING
MACHINES & KENO
INTERACTIVE GAMING (NA)
LOTTERIES & POOLS LOTTO
MINOR GAMING(1)
Australian Gambling Statistics, 1993–94 to 2018–19, 36th edition
38

TABLE NSW 31NEW SOUTH WALES
TOTAL SPORTSBETTING TURNOVER
1994-95 - - - 22.541 22.5411995-96 - - - 19.568 19.5681996-97 - - - 16.306 16.3061997-98 38.964 - - 15.728 54.6921998-99 51.120 - 42.600 11.956 105.6761999-00 59.209 - 81.500 20.738 161.4472000-01 53.457 - - U - U 53.457 (1)
2001-02 43.190 - - (2) - U 43.190 (1)
2002-03 50.792 - - (2) - U 50.792 (1)
2003-04 71.718 - 255.433 19.005 346.1562004-05 63.390 - 318.100 18.821 400.3112005-06 96.121 - 396.349 15.735 508.2052006-07 130.555 - 434.771 15.213 580.5392007-08 169.735 - 492.902 14.300 676.9372008-09 109.810 - 522.775 16.512 649.0972009-10 102.272 (3) - 642.961 14.439 759.6722010-11 89.826 - 749.003 16.082 854.9112011-12 84.751 - 806.283 15.744 906.7782012-13 90.287 - 767.368 15.811 873.4662013-14 155.009 (4) - 808.279 13.595 976.8832014-15 429.377 - 901.799 14.684 1,345.8602015-16 302.168 - 978.012 12.885 1,293.0652016-17 284.888 (1) - 992.989 14.685 1,292.562 (5)
2017-18 284.572 (6) - 1,038.725 12.432 1,335.7292018-19 520.482 - 1,078.275 12.753 1,611.510
Notes: These data should be read in conjunction with the explanatory notes.
(1) Figure incomplete due to data for one or more components being unavailable.
(2) Data included in TAB turnover table.
(3) Bookmakers declared events betting, from this period on.
(4) Includes turnover on sports betting at all racing offices, from this period on.
(5) Gross turnover provided by NSW licensed interactive wagering service providers for 2016-17.
(6) Turnover provided by NSW bookmakers operating from approved offices and premises.
U = Unavailable data
NA = Not applicable
TOTAL SPORTSBETTING
Value ($ million)
BOOKMAKER (AND OTHER) FIXED ODDS
BOOKMAKER (AND OTHER)
POOL BETTING (NA)
TAB FIXED ODDS TAB TOTE ODDS
Australian Gambling Statistics, 1993–94 to 2018–19, 36th edition
39

TABLE NSW 32NEW SOUTH WALES
REAL SPORTSBETTING TURNOVER
1994-95 - - - 40.567 40.5671995-96 - - - 33.778 33.7781996-97 - - - 27.769 27.7691997-98 66.355 - - 26.785 93.1401998-99 86.029 - 71.691 20.121 177.8411999-00 97.345 - 133.994 34.095 265.4342000-01 82.873 - - U - U 82.873 (1)
2001-02 65.099 - - (2) - U 65.099 (1)
2002-03 74.300 - - (2) - U 74.300 (1)
2003-04 102.416 - 364.767 27.140 494.3232004-05 88.421 - 443.707 26.253 558.3802005-06 129.946 - 535.823 21.272 687.0402006-07 171.419 - 570.856 19.975 762.2502007-08 215.666 - 626.282 18.170 860.1172008-09 135.306 - 644.154 20.346 799.8052009-10 123.093 (3) - 773.859 17.379 914.3312010-11 104.904 - 874.731 18.782 998.4172011-12 96.701 - 919.969 17.964 1,034.6342012-13 100.701 - 855.882 17.635 974.2182013-14 168.443 (4) - 878.330 14.773 1,061.5462014-15 458.726 - 963.439 15.688 1,437.8522015-16 318.351 - 1,030.389 13.575 1,362.3152016-17 294.970 (1) - 1,028.131 15.205 1,338.306 (5)
2017-18 289.133 (6) - 1,055.374 12.631 1,357.1392018-19 520.482 - 1,078.275 12.753 1,611.510
Notes: These data should be read in conjunction with the explanatory notes.
(1) Figure incomplete due to data for one or more components being unavailable.
(2) Data included in TAB turnover table.
(3) Bookmakers declared events betting, from this period on.
(4) Includes turnover on sports betting at all racing offices, from this period on.
(5) Gross turnover provided by NSW licensed interactive wagering service providers for 2016-17.
(6) Turnover provided by NSW bookmakers operating from approved offices and premises.
U = Unavailable data
NA = Not applicable
TOTAL SPORTSBETTING
Value ($ million)
BOOKMAKER (AND OTHER) FIXED ODDS
BOOKMAKER (AND OTHER)
POOL BETTING (NA)
TAB FIXED ODDS TAB TOTE ODDS
Australian Gambling Statistics, 1993–94 to 2018–19, 36th edition
40

TABLE NSW 33NEW SOUTH WALES
PER CAPITA SPORTSBETTING TURNOVER
1994-95 - - - 4.98 4.981995-96 - - - 4.27 4.271996-97 - - - 3.51 3.511997-98 8.28 - - 3.34 11.631998-99 10.74 - 8.95 2.51 22.201999-00 12.27 - 16.90 4.30 33.472000-01 10.93 - - U - U 10.93 (1)
2001-02 8.72 - - (2) - U 8.72 (1)
2002-03 10.15 - - (2) - U 10.15 (1)
2003-04 14.22 - 50.65 3.77 68.632004-05 12.47 - 62.58 3.70 78.762005-06 18.75 - 77.30 3.07 99.112006-07 25.15 - 83.75 2.93 111.832007-08 32.14 - 93.32 2.71 128.172008-09 20.41 - 97.15 3.07 120.632009-10 18.70 (3) - 117.55 2.64 138.892010-11 16.21 - 135.12 2.90 154.232011-12 15.10 - 143.65 2.80 161.552012-13 15.86 - 134.84 2.78 153.482013-14 26.83 (4) - 139.90 2.35 169.082014-15 73.20 - 153.73 2.50 229.432015-16 50.72 - 164.15 2.16 217.022016-17 46.99 (1) - 163.77 2.42 213.18 (5)
2017-18 46.12 (6) - 168.33 2.01 216.462018-19 83.03 - 172.00 2.03 257.07
Notes: These data should be read in conjunction with the explanatory notes.
(1) Figure incomplete due to data for one or more components being unavailable.
(2) Data included in TAB turnover table.
(3) Bookmakers declared events betting, from this period on.
(4) Includes turnover on sports betting at all racing offices, from this period on.
(5) Gross turnover provided by NSW licensed interactive wagering service providers for 2016-17.
(6) Turnover provided by NSW bookmakers operating from approved offices and premises.
U = Unavailable data
NA = Not applicable
TOTAL SPORTSBETTING
Value ($)
BOOKMAKER (AND OTHER) FIXED ODDS
BOOKMAKER (AND OTHER)
POOL BETTING (NA)
TAB FIXED ODDS TAB TOTE ODDS
Australian Gambling Statistics, 1993–94 to 2018–19, 36th edition
41
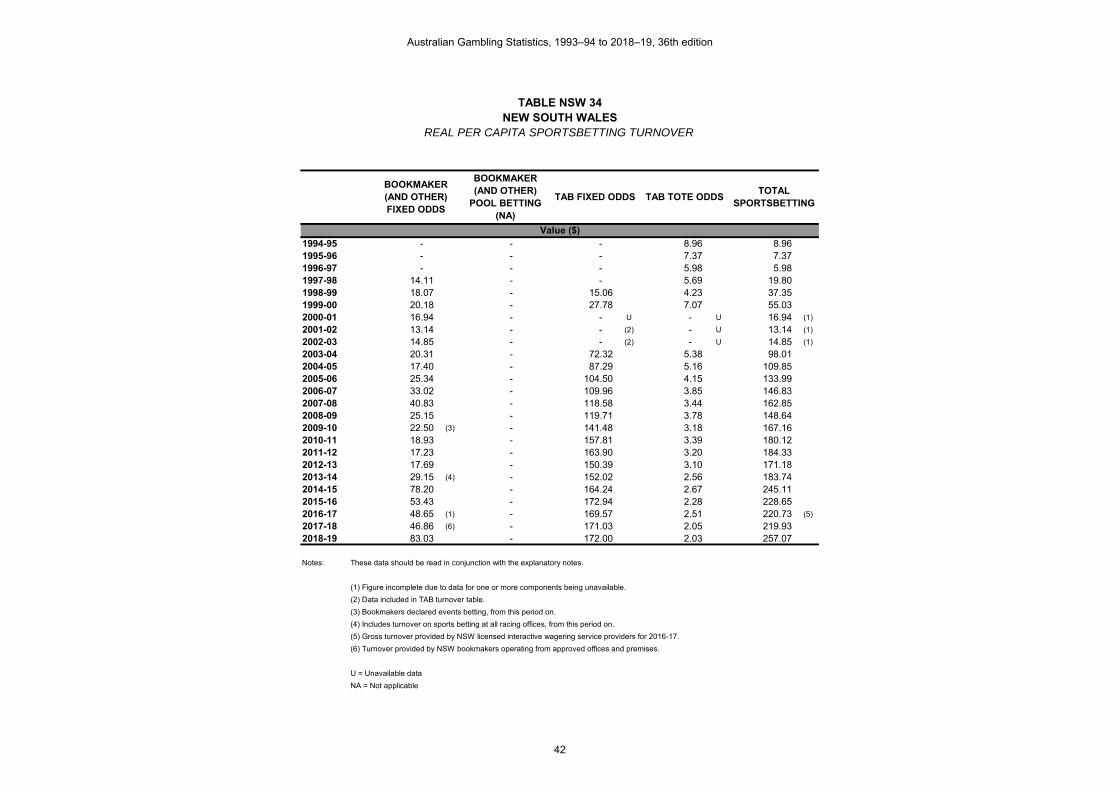
TABLE NSW 34NEW SOUTH WALES
REAL PER CAPITA SPORTSBETTING TURNOVER
1994-95 - - - 8.96 8.961995-96 - - - 7.37 7.371996-97 - - - 5.98 5.981997-98 14.11 - - 5.69 19.801998-99 18.07 - 15.06 4.23 37.351999-00 20.18 - 27.78 7.07 55.032000-01 16.94 - - U - U 16.94 (1)
2001-02 13.14 - - (2) - U 13.14 (1)
2002-03 14.85 - - (2) - U 14.85 (1)
2003-04 20.31 - 72.32 5.38 98.012004-05 17.40 - 87.29 5.16 109.852005-06 25.34 - 104.50 4.15 133.992006-07 33.02 - 109.96 3.85 146.832007-08 40.83 - 118.58 3.44 162.852008-09 25.15 - 119.71 3.78 148.642009-10 22.50 (3) - 141.48 3.18 167.162010-11 18.93 - 157.81 3.39 180.122011-12 17.23 - 163.90 3.20 184.332012-13 17.69 - 150.39 3.10 171.182013-14 29.15 (4) - 152.02 2.56 183.742014-15 78.20 - 164.24 2.67 245.112015-16 53.43 - 172.94 2.28 228.652016-17 48.65 (1) - 169.57 2.51 220.73 (5)
2017-18 46.86 (6) - 171.03 2.05 219.932018-19 83.03 - 172.00 2.03 257.07
Notes: These data should be read in conjunction with the explanatory notes.
(1) Figure incomplete due to data for one or more components being unavailable.
(2) Data included in TAB turnover table.
(3) Bookmakers declared events betting, from this period on.
(4) Includes turnover on sports betting at all racing offices, from this period on.
(5) Gross turnover provided by NSW licensed interactive wagering service providers for 2016-17.
(6) Turnover provided by NSW bookmakers operating from approved offices and premises.
U = Unavailable data
NA = Not applicable
TOTAL SPORTSBETTING
Value ($)
BOOKMAKER (AND OTHER) FIXED ODDS
BOOKMAKER (AND OTHER)
POOL BETTING (NA)
TAB FIXED ODDS TAB TOTE ODDS
Australian Gambling Statistics, 1993–94 to 2018–19, 36th edition
42

TABLE NSW 35NEW SOUTH WALES
TOTAL SPORTSBETTING EXPENDITURE
1994-95 - - - 5.635 5.6351995-96 - - - 4.892 4.8921996-97 - - - 4.077 4.0771997-98 1.948 - - 3.932 5.8801998-99 2.556 - - 2.989 5.5451999-00 3.256 - 8.017 4.496 15.7692000-01 2.940 - - U - U 2.940 (2)
2001-02 2.376 - - (3) - U 2.376 (2)
2002-03 2.794 - - (3) - U 2.794 (2)
2003-04 3.944 - 28.526 4.593 37.0632004-05 3.486 - 32.223 4.705 40.4142005-06 5.287 - 43.251 3.934 52.4722006-07 7.181 - 47.707 3.803 58.6912007-08 9.335 - 56.097 3.575 69.0072008-09 6.040 - 65.252 4.128 75.4202009-10 5.625 - 83.665 3.344 92.6342010-11 4.940 - 95.661 4.021 104.6222011-12 4.661 - 99.934 3.936 108.5312012-13 4.965 - 102.389 3.797 111.1512013-14 8.525 - 110.085 (4) 3.399 122.0092014-15 23.616 - 135.634 3.616 162.8662015-16 16.619 - 132.141 3.221 (5) 151.9812016-17 15.669 (2) - 132.955 3.671 152.295 (2)
2017-18 15.651 - 158.936 3.108 177.6952018-19 28.626 - 140.500 3.188 172.314
Notes: These data should be read in conjunction with the explanatory notes.
(1) Bookmaker betting expenditure figures are estimated at 5.5% of turnover.
(2) Figure incomplete due to data for one or more components being unavailable.
(3) Data included in TAB expenditure table.
(4) Figure includes declared betting events not previously collected, from this period on.
(5) TAB expenditure is calculated at 25.0% of Sportsbetting TAB Tote Odds Turnover, from this period on.
U = Unavailable data
NA = Not applicable
TOTAL SPORTSBETTING
Value ($ million)
BOOKMAKER (AND OTHER)
FIXED ODDS (1)
BOOKMAKER (AND OTHER)
POOL BETTING (NA)
TAB FIXED ODDS TAB TOTE ODDS
Australian Gambling Statistics, 1993–94 to 2018–19, 36th edition
43

TABLE NSW 36NEW SOUTH WALES
REAL SPORTSBETTING EXPENDITURE
1994-95 - - - 10.141 10.1411995-96 - - - 8.444 8.4441996-97 - - - 6.943 6.9431997-98 3.317 - - 6.696 10.0141998-99 4.301 - - 5.030 9.3321999-00 5.353 - 13.181 7.392 25.9262000-01 4.558 - - U - U 4.558 (2)
2001-02 3.581 - - (3) - U 3.581 (2)
2002-03 4.087 - - (3) - U 4.087 (2)
2003-04 5.632 - 40.736 6.559 52.9272004-05 4.863 - 44.947 6.563 56.3722005-06 7.147 - 58.471 5.318 70.9372006-07 9.429 - 62.639 4.993 77.0612007-08 11.861 - 71.277 4.542 87.6802008-09 7.442 - 80.402 5.086 92.9312009-10 6.770 - 100.698 4.025 111.4932010-11 5.769 - 111.719 4.696 122.1842011-12 5.318 - 114.025 4.491 123.8342012-13 5.538 - 114.199 4.235 123.9722013-14 9.264 - 119.626 (4) 3.694 132.5832014-15 25.230 - 144.905 3.863 173.9982015-16 17.509 - 139.218 3.394 (5) 160.1202016-17 16.224 (2) - 137.660 3.801 157.685 (2)
2017-18 15.902 - 161.484 3.158 180.5432018-19 28.626 - 140.500 3.188 172.314
Notes: These data should be read in conjunction with the explanatory notes.
(1) Bookmaker betting expenditure figures are estimated at 5.5% of turnover.
(2) Figure incomplete due to data for one or more components being unavailable.
(3) Data included in TAB expenditure table.
(4) Figure includes declared betting events not previously collected, from this period on.
(5) TAB expenditure is calculated at 25.0% of Sportsbetting TAB Tote Odds Turnover, from this period on.
U = Unavailable data
NA = Not applicable
TOTAL SPORTSBETTING
Value ($ million)
BOOKMAKER (AND OTHER)
FIXED ODDS (1)
BOOKMAKER (AND OTHER)
POOL BETTING (NA)
TAB FIXED ODDS TAB TOTE ODDS
Australian Gambling Statistics, 1993–94 to 2018–19, 36th edition
44

TABLE NSW 37NEW SOUTH WALES
PER CAPITA SPORTSBETTING EXPENDITURE
1994-95 - - - 1.24 1.241995-96 - - - 1.07 1.071996-97 - - - 0.88 0.881997-98 0.41 - - 0.84 1.251998-99 0.54 - - 0.63 1.161999-00 0.68 - 1.66 0.93 3.272000-01 0.60 - - U - U 0.60 (2)
2001-02 0.48 - - (3) - U 0.48 (2)
2002-03 0.56 - - (3) - U 0.56 (2)
2003-04 0.78 - 5.66 0.91 7.352004-05 0.69 - 6.34 0.93 7.952005-06 1.03 - 8.43 0.77 10.232006-07 1.38 - 9.19 0.73 11.312007-08 1.77 - 10.62 0.68 13.072008-09 1.12 - 12.13 0.77 14.022009-10 1.03 - 15.30 0.61 16.942010-11 0.89 - 17.26 0.73 18.872011-12 0.83 - 17.80 0.70 19.342012-13 0.87 - 17.99 0.67 19.532013-14 1.48 - 19.05 (4) 0.59 21.122014-15 4.03 - 23.12 0.62 27.762015-16 2.79 - 22.18 0.54 (5) 25.512016-17 2.58 (2) - 21.93 0.61 25.12 (2)
2017-18 2.54 - 25.76 0.50 28.802018-19 4.57 - 22.41 0.51 27.49
Notes: These data should be read in conjunction with the explanatory notes.
(1) Bookmaker betting expenditure figures are estimated at 5.5% of turnover.
(2) Figure incomplete due to data for one or more components being unavailable.
(3) Data included in TAB expenditure table.
(4) Figure includes declared betting events not previously collected, from this period on.
(5) TAB expenditure is calculated at 25.0% of Sportsbetting TAB Tote Odds Turnover, from this period on.
U = Unavailable data
NA = Not applicable
TOTAL SPORTSBETTING
Value ($)
BOOKMAKER (AND OTHER)
FIXED ODDS (1)
BOOKMAKER (AND OTHER)
POOL BETTING (NA)
TAB FIXED ODDS TAB TOTE ODDS
Australian Gambling Statistics, 1993–94 to 2018–19, 36th edition
45

TABLE NSW 38NEW SOUTH WALES
REAL PER CAPITA SPORTSBETTING EXPENDITURE
1994-95 - - - 2.24 2.241995-96 - - - 1.84 1.841996-97 - - - 1.49 1.491997-98 0.71 - - 1.42 2.131998-99 0.90 - - 1.06 1.961999-00 1.11 - 2.73 1.53 5.372000-01 0.93 - - U - U 0.93 (2)
2001-02 0.72 - - (3) - U 0.72 (2)
2002-03 0.82 - - (3) - U 0.82 (2)
2003-04 1.12 - 8.08 1.30 10.492004-05 0.96 - 8.84 1.29 11.092005-06 1.39 - 11.40 1.04 13.832006-07 1.82 - 12.07 0.96 14.842007-08 2.25 - 13.50 0.86 16.602008-09 1.38 - 14.94 0.95 17.272009-10 1.24 - 18.41 0.74 20.382010-11 1.04 - 20.15 0.85 22.042011-12 0.95 - 20.31 0.80 22.062012-13 0.97 - 20.07 0.74 21.782013-14 1.60 - 20.71 (4) 0.64 22.952014-15 4.30 - 24.70 0.66 29.662015-16 2.94 - 23.37 0.57 (5) 26.872016-17 2.68 (2) - 22.70 0.63 26.01 (2)
2017-18 2.58 - 26.17 0.51 29.262018-19 4.57 - 22.41 0.51 27.49
Notes: These data should be read in conjunction with the explanatory notes.
(1) Bookmaker betting expenditure figures are estimated at 5.5% of turnover.
(2) Figure incomplete due to data for one or more components being unavailable.
(3) Data included in TAB expenditure table.
(4) Figure includes declared betting events not previously collected, from this period on.
(5) TAB expenditure is calculated at 25.0% of Sportsbetting TAB Tote Odds Turnover, from this period on.
U = Unavailable data
NA = Not applicable
TOTAL SPORTSBETTING
Value ($)
BOOKMAKER (AND OTHER)
FIXED ODDS (1)
BOOKMAKER (AND OTHER)
POOL BETTING (NA)
TAB FIXED ODDS TAB TOTE ODDS
Australian Gambling Statistics, 1993–94 to 2018–19, 36th edition
46

TABLE NSW 39NEW SOUTH WALES
SPORTSBETTING EXPENDITUREAS A % OF HDI
1994-95 - - - 0.005 0.0051995-96 - - - 0.004 0.0041996-97 - - - 0.003 0.0031997-98 0.001 - - 0.003 0.0041998-99 0.002 - - 0.002 0.0041999-00 0.002 - 0.005 0.003 0.0102000-01 0.002 - - U - U 0.002 (2)
2001-02 0.001 - - (3) - U 0.001 (2)
2002-03 0.002 - - (3) - U 0.002 (2)
2003-04 0.002 - 0.015 0.002 0.0192004-05 0.002 - 0.015 0.002 0.0192005-06 0.002 - 0.020 0.002 0.0242006-07 0.003 - 0.020 0.002 0.0252007-08 0.004 - 0.022 0.001 0.0272008-09 0.002 - 0.024 0.002 0.0282009-10 0.002 - 0.029 0.001 0.0332010-11 0.002 - 0.031 0.001 0.0342011-12 0.001 - 0.031 0.001 0.0332012-13 0.001 - 0.031 0.001 0.0332013-14 0.002 - 0.031 (4) 0.001 0.0342014-15 0.006 - 0.036 0.001 0.0442015-16 0.004 - 0.035 0.001 (5) 0.0402016-17 0.004 (2) - 0.034 0.001 0.039 (2)
2017-18 0.004 - 0.039 0.001 0.0442018-19 0.007 - 0.034 0.001 0.041
Notes: These data should be read in conjunction with the explanatory notes.
(1) Bookmaker betting expenditure figures are estimated at 5.5% of turnover.
(2) Figure incomplete due to data for one or more components being unavailable.
(3) Data included in TAB expenditure table.
(4) Figure includes declared betting events not previously collected, from this period on.
(5) TAB expenditure is calculated at 25.0% of Sportsbetting TAB Tote Odds Turnover, from this period on.
U = Unavailable data
NA = Not applicable
Percentage (%)
BOOKMAKER (AND OTHER)
FIXED ODDS (1)
BOOKMAKER (AND OTHER)
POOL BETTING (NA)
TAB FIXED ODDS TAB TOTE ODDSTOTAL
SPORTSBETTING
Australian Gambling Statistics, 1993–94 to 2018–19, 36th edition
47

TABLE NSW 40NEW SOUTH WALES
SPORTSBETTING EXPENDITURESHARE OF MARKET
1994-95 - - - 100.001995-96 - - - 100.001996-97 - - - 100.001997-98 33.13 - - 66.871998-99 46.10 - - 53.901999-00 20.65 - 50.84 28.512000-01 100.00 - - U - U
2001-02 100.00 - - (2) - U
2002-03 100.00 - - (2) - U
2003-04 10.64 - 76.97 12.392004-05 8.63 - 79.73 11.642005-06 10.08 - 82.43 7.502006-07 12.24 - 81.29 6.482007-08 13.53 - 81.29 5.182008-09 8.01 - 86.52 5.472009-10 6.07 - 90.32 3.612010-11 4.72 - 91.43 3.842011-12 4.29 - 92.08 3.632012-13 4.47 - 92.12 3.422013-14 6.99 - 90.23 (3) 2.792014-15 14.50 - 83.28 2.222015-16 10.93 - 86.95 2.12 (4)
2016-17 10.29 (5) - 87.30 2.412017-18 8.81 - 89.44 1.752018-19 16.61 - 81.54 1.85
Notes: These data should be read in conjunction with the explanatory notes.
(1) Bookmaker betting expenditure figures are estimated at 5.5% of turnover.
(2) Data included in TAB expenditure table.
(3) Figure includes declared betting events not previously collected, from this period on.
(4) TAB Expenditure is calculated at 25.0% of Sportsbetting TAB Tote Odds Turnover, from this period on.
(5) Figure incomplete due to data for one or more components being unavailable.
U = Unavailable data
NA = Not applicable
TAB FIXED ODDS TAB TOTE ODDS
Percentage (%)
BOOKMAKER (AND OTHER)
FIXED ODDS (1)
BOOKMAKER (AND OTHER)
POOL BETTING (NA)
Australian Gambling Statistics, 1993–94 to 2018–19, 36th edition
48

TABLE NSW 41NEW SOUTH WALES
GOVERNMENT REVENUE FROM SPORTSBETTING
1994-95 - - - 1.981 1.9811995-96 - - - 1.697 1.6971996-97 - - - 1.655 1.6551997-98 0.411 - - 1.139 1.5501998-99 0.518 - 0.900 1.312 2.7301999-00 0.594 - 1.656 1.268 3.5182000-01 0.353 - 1.231 0.643 2.2272001-02 0.192 (1) - 1.528 0.653 2.3732002-03 - (2) - 3.180 0.718 3.8982003-04 - - 3.016 0.905 3.9212004-05 - - 3.573 0.900 (3) 4.4732005-06 - - 3.912 0.757 4.6692006-07 - - 5.882 0.724 6.6062007-08 - - 5.660 0.665 6.3252008-09 - - 7.173 0.775 7.9482009-10 - - 9.128 0.639 9.7672010-11 - - 10.437 0.769 11.2062011-12 - - 10.903 0.753 11.6562012-13 - - 11.171 0.723 11.8942013-14 - - 12.010 0.650 12.6602014-15 - - 14.798 0.702 15.5002015-16 - - 12.157 0.522 12.6792016-17 - - 9.879 0.496 10.3752017-18 - - 11.809 0.420 (4) 12.2292018-19 - - 9.273 (5)(6) 0.396 (5)(6) 9.669
Notes: These data should be read in conjunction with the explanatory notes.
Data for the gambling revenue received by states and territories from 1 July 2000 onwards are not comparable with that of
preceding years because of the impact of changes brought about by the introduction of the GST.
(1) State tax on bookmaker's turnover was abolished on 30 March 2002.
(2) Gross profit tax is not based on turnover and is also capped, therefore cannot be determined as relative to racing or sports.
(3) Government revenue data for TAB tote odds are for NSW investments only.
(4) Sportsbetting TAB Tote Odds revenue is only calculated off investments through the NSW Totalisator.
(5) The NSW Government implemented the point of consumption tax (POCT) on 1 January 2019, through
the Betting Tax Amendment (point of consumption) Bill 2018. The Bill provides for a tax of 10% of wagering
operator's revenue derived from NSW customers. The POCT does not distinguish
between racing and sports betting, and the revenue for the 2018-19 FY is $41m.
(6) Does not include offsets afforded to TAB due to POCT as per Section 11 of the Betting Tax Act 2001 .
This is due to the design of the offsets not distinguishing between racing and sportsbetting.
NA = Not applicable
TOTAL SPORTSBETTING
Value ($ million)
BOOKMAKER (AND OTHER) FIXED ODDS
BOOKMAKER (AND OTHER)
POOL BETTING (NA)
TAB FIXED ODDS TAB TOTE ODDS
Australian Gambling Statistics, 1993–94 to 2018–19, 36th edition
49
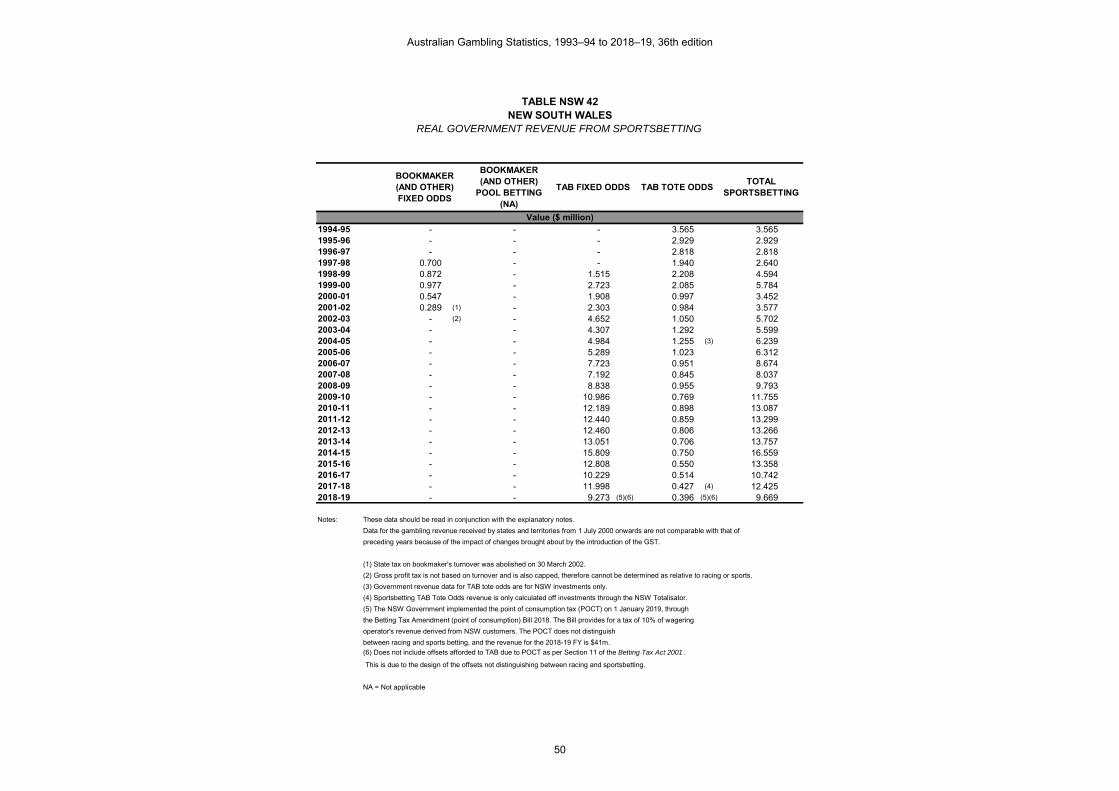
TABLE NSW 42NEW SOUTH WALES
REAL GOVERNMENT REVENUE FROM SPORTSBETTING
1994-95 - - - 3.565 3.5651995-96 - - - 2.929 2.9291996-97 - - - 2.818 2.8181997-98 0.700 - - 1.940 2.6401998-99 0.872 - 1.515 2.208 4.5941999-00 0.977 - 2.723 2.085 5.7842000-01 0.547 - 1.908 0.997 3.4522001-02 0.289 (1) - 2.303 0.984 3.5772002-03 - (2) - 4.652 1.050 5.7022003-04 - - 4.307 1.292 5.5992004-05 - - 4.984 1.255 (3) 6.2392005-06 - - 5.289 1.023 6.3122006-07 - - 7.723 0.951 8.6742007-08 - - 7.192 0.845 8.0372008-09 - - 8.838 0.955 9.7932009-10 - - 10.986 0.769 11.7552010-11 - - 12.189 0.898 13.0872011-12 - - 12.440 0.859 13.2992012-13 - - 12.460 0.806 13.2662013-14 - - 13.051 0.706 13.7572014-15 - - 15.809 0.750 16.5592015-16 - - 12.808 0.550 13.3582016-17 - - 10.229 0.514 10.7422017-18 - - 11.998 0.427 (4) 12.4252018-19 - - 9.273 (5)(6) 0.396 (5)(6) 9.669
Notes: These data should be read in conjunction with the explanatory notes.
Data for the gambling revenue received by states and territories from 1 July 2000 onwards are not comparable with that of
preceding years because of the impact of changes brought about by the introduction of the GST.
(1) State tax on bookmaker's turnover was abolished on 30 March 2002.
(2) Gross profit tax is not based on turnover and is also capped, therefore cannot be determined as relative to racing or sports.
(3) Government revenue data for TAB tote odds are for NSW investments only.
(4) Sportsbetting TAB Tote Odds revenue is only calculated off investments through the NSW Totalisator.
(5) The NSW Government implemented the point of consumption tax (POCT) on 1 January 2019, through
the Betting Tax Amendment (point of consumption) Bill 2018. The Bill provides for a tax of 10% of wagering
operator's revenue derived from NSW customers. The POCT does not distinguish
between racing and sports betting, and the revenue for the 2018-19 FY is $41m.
(6) Does not include offsets afforded to TAB due to POCT as per Section 11 of the Betting Tax Act 2001 .
This is due to the design of the offsets not distinguishing between racing and sportsbetting.
NA = Not applicable
TOTAL SPORTSBETTING
Value ($ million)
BOOKMAKER (AND OTHER) FIXED ODDS
BOOKMAKER (AND OTHER)
POOL BETTING (NA)
TAB FIXED ODDS TAB TOTE ODDS
Australian Gambling Statistics, 1993–94 to 2018–19, 36th edition
50

TABLE NSW 43NEW SOUTH WALES
PER CAPITA REVENUE FROM SPORTSBETTING
1994-95 - - - 0.44 0.441995-96 - - - 0.37 0.371996-97 - - - 0.36 0.361997-98 0.09 - - 0.24 0.331998-99 0.11 - 0.19 0.28 0.571999-00 0.12 - 0.34 0.26 0.732000-01 0.07 - 0.25 0.13 0.462001-02 0.04 (1) - 0.31 0.13 0.482002-03 - (2) - 0.64 0.14 0.782003-04 - - 0.60 0.18 0.782004-05 - - 0.70 0.18 (3) 0.882005-06 - - 0.76 0.15 0.912006-07 - - 1.13 0.14 1.272007-08 - - 1.07 0.13 1.202008-09 - - 1.33 0.14 1.482009-10 - - 1.67 0.12 1.792010-11 - - 1.88 0.14 2.022011-12 - - 1.94 0.13 2.082012-13 - - 1.96 0.13 2.092013-14 - - 2.08 0.11 2.192014-15 - - 2.52 0.12 2.642015-16 - - 2.04 0.09 2.132016-17 - - 1.63 0.08 1.712017-18 - - 1.91 0.07 (4) 1.982018-19 - - 1.48 (5)(6) 0.06 (5)(6) 1.54
Notes: These data should be read in conjunction with the explanatory notes.
Data for the gambling revenue received by states and territories from 1 July 2000 onwards are not comparable with that of
preceding years because of the impact of changes brought about by the introduction of the GST.
(1) State tax on bookmaker's turnover was abolished on 30 March 2002.
(2) Gross profit tax is not based on turnover and is also capped, therefore cannot be determined as relative to racing or sports.
(3) Government revenue data for TAB tote odds are for NSW investments only.
(4) Sportsbetting TAB Tote Odds revenue is only calculated off investments through the NSW Totalisator.
(5) The NSW Government implemented the point of consumption tax (POCT) on 1 January 2019, through
the Betting Tax Amendment (point of consumption) Bill 2018. The Bill provides for a tax of 10% of wagering
operator's revenue derived from NSW customers. The POCT does not distinguish
between racing and sports betting, and the revenue for the 2018-19 FY is $41m.
(6) Does not include offsets afforded to TAB due to POCT as per Section 11 of the Betting Tax Act 2001 .
This is due to the design of the offsets not distinguishing between racing and sportsbetting.
NA = Not applicable
TOTAL SPORTSBETTING
Value ($)
BOOKMAKER (AND OTHER) FIXED ODDS
BOOKMAKER (AND OTHER)
POOL BETTING (NA)
TAB FIXED ODDS TAB TOTE ODDS
Australian Gambling Statistics, 1993–94 to 2018–19, 36th edition
51

TABLE NSW 44NEW SOUTH WALES
REAL PER CAPITA REVENUE FROM SPORTSBETTING
1994-95 - - - 0.79 0.791995-96 - - - 0.64 0.641996-97 - - - 0.61 0.611997-98 0.15 - - 0.41 0.561998-99 0.18 - 0.32 0.46 0.961999-00 0.20 - 0.56 0.43 1.202000-01 0.11 - 0.39 0.20 0.712001-02 0.06 (1) - 0.46 0.20 0.722002-03 - (2) - 0.93 0.21 1.142003-04 - - 0.85 0.26 1.112004-05 - - 0.98 0.25 (3) 1.232005-06 - - 1.03 0.20 1.232006-07 - - 1.49 0.18 1.672007-08 - - 1.36 0.16 1.522008-09 - - 1.64 0.18 1.822009-10 - - 2.01 0.14 2.152010-11 - - 2.20 0.16 2.362011-12 - - 2.22 0.15 2.372012-13 - - 2.19 0.14 2.332013-14 - - 2.26 0.12 2.382014-15 - - 2.70 0.13 2.822015-16 - - 2.15 0.09 2.242016-17 - - 1.69 0.08 1.772017-18 - - 1.94 0.07 (4) 2.012018-19 - - 1.48 (5)(6) 0.06 (5)(6) 1.54
Notes: These data should be read in conjunction with the explanatory notes.
Data for the gambling revenue received by states and territories from 1 July 2000 onwards are not comparable with that of
preceding years because of the impact of changes brought about by the introduction of the GST.
(1) State tax on bookmaker's turnover was abolished on 30 March 2002.
(2) Gross profit tax is not based on turnover and is also capped, therefore cannot be determined as relative to racing or sports.
(3) Government revenue data for TAB tote odds are for NSW investments only.
(4) Sportsbetting TAB Tote Odds revenue is only calculated off investments through the NSW Totalisator.
(5) The NSW Government implemented the point of consumption tax (POCT) on 1 January 2019, through
the Betting Tax Amendment (point of consumption) Bill 2018. The Bill provides for a tax of 10% of wagering
operator's revenue derived from NSW customers. The POCT does not distinguish
between racing and sports betting, and the revenue for the 2018-19 FY is $41m.
(6) Does not include offsets afforded to TAB due to POCT as per Section 11 of the Betting Tax Act 2001 .
This is due to the design of the offsets not distinguishing between racing and sportsbetting.
NA = Not applicable
TOTAL SPORTSBETTING
Value ($)
BOOKMAKER (AND OTHER) FIXED ODDS
BOOKMAKER (AND OTHER)
POOL BETTING (NA)
TAB FIXED ODDS TAB TOTE ODDS
Australian Gambling Statistics, 1993–94 to 2018–19, 36th edition
52

TABLE NSW 45NEW SOUTH WALES
GOVERNMENT REVENUE FROM SPORTSBETTINGAS A % OF TOTAL GAMBLING REVENUE
1994-95 - - - 0.18 0.181995-96 - - - 0.14 0.141996-97 - - - 0.13 0.131997-98 0.03 - - 0.08 0.111998-99 0.04 - 0.06 0.09 0.191999-00 0.04 - 0.11 0.08 0.232000-01 0.03 - 0.10 0.05 0.192001-02 0.02 (1) - 0.13 0.05 0.202002-03 - (2) - 0.25 0.06 0.312003-04 - - 0.23 0.07 0.302004-05 - - 0.25 0.06 (3) 0.312005-06 - - 0.26 0.05 0.312006-07 - - 0.36 0.04 0.402007-08 - - 0.36 0.04 0.412008-09 - - 0.43 0.05 0.482009-10 - - 0.64 0.05 0.692010-11 - - 0.60 0.04 0.642011-12 - - 0.61 0.04 0.652012-13 - - 0.60 0.04 0.642013-14 - - 0.64 0.03 0.672014-15 - - 0.71 0.03 0.752015-16 - - 0.55 0.02 0.582016-17 - - 0.44 0.02 0.472017-18 - - 0.51 0.02 (4) 0.522018-19 - - 0.37 (5)(6) 0.02 (5)(6) 0.39
Notes: These data should be read in conjunction with the explanatory notes.
Data for the gambling revenue received by states and territories from 1 July 2000 onwards are not comparable with that of
preceding years because of the impact of changes brought about by the introduction of the GST.
(1) State tax on bookmaker's turnover was abolished on 30 March 2002.
(2) Gross profit tax is not based on turnover and is also capped, therefore cannot be determined as relative to racing or sports.
(3) Government revenue data for TAB tote odds are for NSW investments only.
(4) Sportsbetting TAB Tote Odds revenue is only calculated off investments through the NSW Totalisator.
(5) The NSW Government implemented the point of consumption tax (POCT) on 1 January 2019, through
the Betting Tax Amendment (point of consumption) Bill 2018. The Bill provides for a tax of 10% of wagering
operator's revenue derived from NSW customers. The POCT does not distinguish
between racing and sports betting, and the revenue for the 2018-19 FY is $41m.
(6) Does not include offsets afforded to TAB due to POCT as per Section 11 of the Betting Tax Act 2001 .
This is due to the design of the offsets not distinguishing between racing and sportsbetting.
NA = Not applicable
Percentage (%)
BOOKMAKER (AND OTHER) FIXED ODDS
BOOKMAKER (AND OTHER)
POOL BETTING (NA)
TAB FIXED ODDS TAB TOTE ODDSTOTAL
SPORTSBETTING
Australian Gambling Statistics, 1993–94 to 2018–19, 36th edition
53

TABLE NSW 46NEW SOUTH WALES
TOTAL GAMBLING TURNOVER
1993-94 19,934.896 4,529.229 - 24,464.1251994-95 23,686.038 4,707.851 22.541 28,416.4301995-96 27,264.816 4,671.228 19.568 31,955.6121996-97 29,407.077 4,624.500 16.306 34,047.8831997-98 34,498.897 4,560.055 54.692 39,113.6441998-99 38,676.895 4,556.778 105.676 43,339.3491999-00 43,006.215 4,560.900 161.447 47,728.5622000-01 43,457.853 4,671.825 53.457 48,183.1352001-02 47,079.582 4,960.660 43.190 52,083.4322002-03 49,230.720 5,247.240 50.792 54,528.7522003-04 51,837.141 5,296.904 346.156 57,480.2012004-05 55,496.848 5,343.313 400.311 61,240.4722005-06 58,090.859 5,153.999 508.205 63,753.0632006-07 61,530.771 5,228.332 580.539 67,339.6422007-08 56,657.450 4,948.057 676.937 62,282.4442008-09 59,380.161 5,348.236 649.097 65,377.4942009-10 59,264.343 5,364.773 759.672 65,388.7882010-11 63,927.173 5,292.968 854.911 70,075.0522011-12 67,071.184 5,689.155 906.778 73,667.1172012-13 68,825.195 5,561.893 873.466 75,260.5542013-14 71,157.420 6,113.762 976.883 78,248.0652014-15 76,140.569 5,952.419 1,345.860 83,438.8482015-16 81,057.679 6,260.311 1,293.065 88,611.0552016-17 82,282.915 6,209.538 1,292.562 89,785.0152017-18 85,182.434 6,338.071 1,335.729 92,856.2342018-19 88,467.141 6,490.095 1,611.510 96,568.746
Notes: These data should be read in conjunction with the explanatory notes.
Figure(s) may be incomplete for any period due to some unavailable turnover figures that are used to derive these numbers.
Value ($ million)
GAMING RACING SPORTSBETTING TOTAL GAMBLING
Australian Gambling Statistics, 1993–94 to 2018–19, 36th edition
54

TABLE NSW 47NEW SOUTH WALES
REAL GAMBLING TURNOVER
1993-94 37,045.141 8,416.694 - 45,461.8351994-95 42,627.396 8,472.647 40.567 51,140.6101995-96 47,063.775 8,063.345 33.778 55,160.8981996-97 50,079.813 7,875.454 27.769 57,983.0371997-98 58,751.107 7,765.706 93.140 66,609.9521998-99 65,088.992 7,668.560 177.841 72,935.3931999-00 70,706.183 7,498.540 265.434 78,470.1572000-01 67,371.481 7,242.598 82.873 74,696.9522001-02 70,961.431 7,477.032 65.099 78,503.5612002-03 72,015.707 7,675.770 74.300 79,765.7772003-04 74,025.254 7,564.165 494.323 82,083.7412004-05 77,410.640 7,453.203 558.380 85,422.2232005-06 78,532.785 6,967.669 687.040 86,187.4942006-07 80,790.115 6,864.818 762.250 88,417.1822007-08 71,989.032 6,287.008 860.117 79,136.1572008-09 73,167.131 6,589.997 799.805 80,556.9342009-10 71,329.763 6,456.968 914.331 78,701.0622010-11 74,658.039 6,181.450 998.417 81,837.9062011-12 76,528.221 6,491.326 1,034.634 84,054.1802012-13 76,763.976 6,203.441 974.218 83,941.6352013-14 77,324.396 6,643.621 1,061.546 85,029.5642014-15 81,344.934 6,359.279 1,437.852 89,142.0652015-16 85,398.718 6,595.582 1,362.315 93,356.6152016-17 85,194.924 6,429.295 1,338.306 92,962.5252017-18 86,547.780 6,439.661 1,357.139 94,344.5802018-19 88,467.141 6,490.095 1,611.510 96,568.746
Notes: These data should be read in conjunction with the explanatory notes.
Figure(s) may be incomplete for any period due to some unavailable turnover figures that are used to derive these numbers.
Value ($ million)
GAMING RACING SPORTSBETTING TOTAL GAMBLING
Australian Gambling Statistics, 1993–94 to 2018–19, 36th edition
55

TABLE NSW 48NEW SOUTH WALES
PER CAPITA GAMBLING TURNOVER
1993-94 4,449.21 1,010.86 - 5,460.071994-95 5,229.28 1,039.37 4.98 6,273.631995-96 5,944.93 1,018.53 4.27 6,967.731996-97 6,328.24 995.17 3.51 7,326.921997-98 7,334.24 969.44 11.63 8,315.311998-99 8,123.27 957.06 22.20 9,102.521999-00 8,915.77 945.54 33.47 9,894.782000-01 8,883.81 955.03 10.93 9,849.772001-02 9,502.14 1,001.22 8.72 10,512.072002-03 9,839.75 1,048.77 10.15 10,898.672003-04 10,277.81 1,050.22 68.63 11,396.672004-05 10,918.22 1,051.22 78.76 12,048.202005-06 11,328.83 1,005.13 99.11 12,433.072006-07 11,852.48 1,007.12 111.83 12,971.432007-08 10,727.39 936.85 128.17 11,792.422008-09 11,035.42 993.94 120.63 12,149.992009-10 10,834.85 980.80 138.89 11,954.542010-11 11,532.81 954.88 154.23 12,641.922011-12 11,949.54 1,013.59 161.55 13,124.692012-13 12,093.55 977.30 153.48 13,224.332013-14 12,316.15 1,058.19 169.08 13,543.422014-15 12,979.57 1,014.70 229.43 14,223.702015-16 13,604.49 1,050.71 217.02 14,872.232016-17 13,570.85 1,024.13 213.18 14,808.162017-18 13,804.32 1,027.12 216.46 15,047.902018-19 14,112.16 1,035.29 257.07 15,404.51
Notes: These data should be read in conjunction with the explanatory notes.
Figure(s) may be incomplete for any period due to some unavailable turnover figures that are used to derive these numbers.
Value ($)
GAMING RACING SPORTSBETTING TOTAL GAMBLING
Australian Gambling Statistics, 1993–94 to 2018–19, 36th edition
56

TABLE NSW 49NEW SOUTH WALES
REAL PER CAPITA GAMBLING TURNOVER
1993-94 8,267.99 1,878.50 - 10,146.491994-95 9,411.06 1,870.55 8.96 11,290.561995-96 10,261.97 1,758.16 7.37 12,027.501996-97 10,776.90 1,694.75 5.98 12,477.631997-98 12,490.10 1,650.94 19.80 14,160.841998-99 13,670.57 1,610.62 37.35 15,318.541999-00 14,658.35 1,554.55 55.03 16,267.932000-01 13,772.32 1,480.56 16.94 15,269.822001-02 14,322.25 1,509.10 13.14 15,844.492002-03 14,393.78 1,534.16 14.85 15,942.792003-04 14,677.08 1,499.76 98.01 16,274.852004-05 15,229.45 1,466.31 109.85 16,805.622005-06 15,315.40 1,358.83 133.99 16,808.212006-07 15,562.35 1,322.35 146.83 17,031.532007-08 13,630.24 1,190.37 162.85 14,983.462008-09 13,597.64 1,224.71 148.64 14,970.992009-10 13,040.68 1,180.48 167.16 14,388.322010-11 13,468.72 1,115.17 180.12 14,764.012011-12 13,634.43 1,156.51 184.33 14,975.272012-13 13,488.50 1,090.03 171.18 14,749.722013-14 13,383.55 1,149.90 183.74 14,717.192014-15 13,866.75 1,084.06 245.11 15,195.922015-16 14,333.08 1,106.98 228.65 15,668.712016-17 14,051.12 1,060.38 220.73 15,332.232017-18 14,025.58 1,043.58 219.93 15,289.102018-19 14,112.16 1,035.29 257.07 15,404.51
Notes: These data should be read in conjunction with the explanatory notes.
Figure(s) may be incomplete for any period due to some unavailable turnover figures that are used to derive these numbers.
Value ($)
GAMING RACING SPORTSBETTING TOTAL GAMBLING
Australian Gambling Statistics, 1993–94 to 2018–19, 36th edition
57
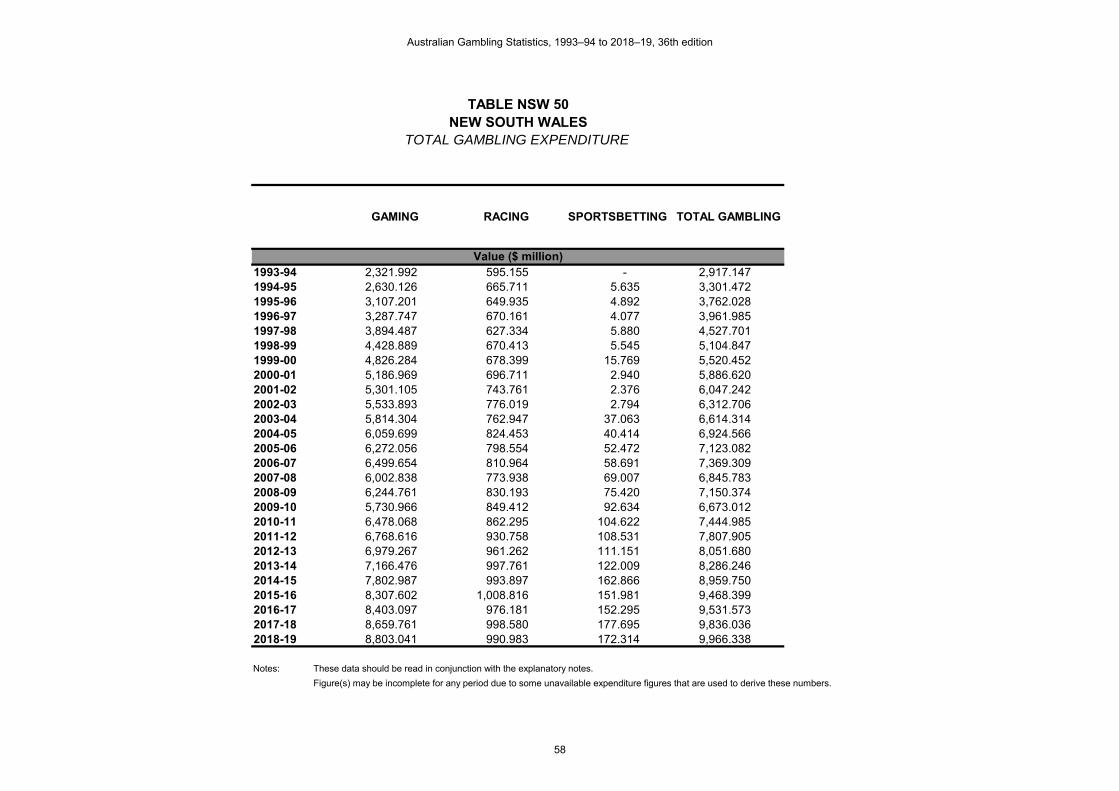
TABLE NSW 50NEW SOUTH WALES
TOTAL GAMBLING EXPENDITURE
1993-94 2,321.992 595.155 - 2,917.1471994-95 2,630.126 665.711 5.635 3,301.4721995-96 3,107.201 649.935 4.892 3,762.0281996-97 3,287.747 670.161 4.077 3,961.9851997-98 3,894.487 627.334 5.880 4,527.7011998-99 4,428.889 670.413 5.545 5,104.8471999-00 4,826.284 678.399 15.769 5,520.4522000-01 5,186.969 696.711 2.940 5,886.6202001-02 5,301.105 743.761 2.376 6,047.2422002-03 5,533.893 776.019 2.794 6,312.7062003-04 5,814.304 762.947 37.063 6,614.3142004-05 6,059.699 824.453 40.414 6,924.5662005-06 6,272.056 798.554 52.472 7,123.0822006-07 6,499.654 810.964 58.691 7,369.3092007-08 6,002.838 773.938 69.007 6,845.7832008-09 6,244.761 830.193 75.420 7,150.3742009-10 5,730.966 849.412 92.634 6,673.0122010-11 6,478.068 862.295 104.622 7,444.9852011-12 6,768.616 930.758 108.531 7,807.9052012-13 6,979.267 961.262 111.151 8,051.6802013-14 7,166.476 997.761 122.009 8,286.2462014-15 7,802.987 993.897 162.866 8,959.7502015-16 8,307.602 1,008.816 151.981 9,468.3992016-17 8,403.097 976.181 152.295 9,531.5732017-18 8,659.761 998.580 177.695 9,836.0362018-19 8,803.041 990.983 172.314 9,966.338
Notes: These data should be read in conjunction with the explanatory notes.
Figure(s) may be incomplete for any period due to some unavailable expenditure figures that are used to derive these numbers.
Value ($ million)
GAMING RACING SPORTSBETTING TOTAL GAMBLING
Australian Gambling Statistics, 1993–94 to 2018–19, 36th edition
58

TABLE NSW 51NEW SOUTH WALES
REAL GAMBLING EXPENDITURE
1993-94 4,314.972 1,105.979 - 5,420.9511994-95 4,733.398 1,198.070 10.141 5,941.6081995-96 5,363.565 1,121.900 8.444 6,493.9091996-97 5,598.984 1,141.274 6.943 6,747.2011997-98 6,632.253 1,068.340 10.014 7,710.6071998-99 7,453.337 1,128.232 9.332 8,590.9001999-00 7,934.856 1,115.351 25.926 9,076.1322000-01 8,041.211 1,080.091 4.558 9,125.8612001-02 7,990.173 1,121.045 3.581 9,114.7992002-03 8,095.092 1,135.177 4.087 9,234.3562003-04 8,303.030 1,089.515 52.927 9,445.4722004-05 8,452.465 1,150.001 56.372 9,658.8382005-06 8,479.166 1,079.562 70.937 9,629.6642006-07 8,534.068 1,064.799 77.061 9,675.9282007-08 7,627.214 983.367 87.680 8,698.2612008-09 7,694.679 1,022.948 92.931 8,810.5582009-10 6,897.713 1,022.341 111.493 8,031.5472010-11 7,565.482 1,007.041 122.184 8,694.7062011-12 7,722.991 1,061.995 123.834 8,908.8202012-13 7,784.305 1,072.141 123.972 8,980.4172013-14 7,787.570 1,084.234 132.583 9,004.3872014-15 8,336.337 1,061.832 173.998 9,572.1672015-16 8,752.515 1,062.843 160.120 9,975.4792016-17 8,700.484 1,010.728 157.685 9,868.8972017-18 8,798.564 1,014.586 180.543 9,993.6932018-19 8,803.041 990.983 172.314 9,966.338
Notes: These data should be read in conjunction with the explanatory notes.
Figure(s) may be incomplete for any period due to some unavailable expenditure figures that are used to derive these numbers.
Value ($ million)
GAMING RACING SPORTSBETTING TOTAL GAMBLING
Australian Gambling Statistics, 1993–94 to 2018–19, 36th edition
59

TABLE NSW 52NEW SOUTH WALES
PER CAPITA GAMBLING EXPENDITURE
1993-94 518.24 132.83 - 651.071994-95 580.67 146.97 1.24 728.881995-96 677.51 141.71 1.07 820.291996-97 707.50 144.21 0.88 852.601997-98 827.94 133.37 1.25 962.561998-99 930.19 140.81 1.16 1,072.171999-00 1,000.55 140.64 3.27 1,144.462000-01 1,060.34 142.42 0.60 1,203.362001-02 1,069.93 150.11 0.48 1,220.522002-03 1,106.06 155.10 0.56 1,261.722003-04 1,152.81 151.27 7.35 1,311.432004-05 1,192.16 162.20 7.95 1,362.312005-06 1,223.17 155.73 10.23 1,389.142006-07 1,252.01 156.21 11.31 1,419.532007-08 1,136.56 146.54 13.07 1,296.162008-09 1,160.55 154.29 14.02 1,328.852009-10 1,047.75 155.29 16.94 1,219.982010-11 1,168.68 155.56 18.87 1,343.122011-12 1,205.91 165.83 19.34 1,391.072012-13 1,226.35 168.91 19.53 1,414.792013-14 1,240.40 172.70 21.12 1,434.212014-15 1,330.16 169.43 27.76 1,527.362015-16 1,394.32 169.32 25.51 1,589.152016-17 1,385.92 161.00 25.12 1,572.032017-18 1,403.37 161.83 28.80 1,593.992018-19 1,404.25 158.08 27.49 1,589.82
Notes: These data should be read in conjunction with the explanatory notes.
Figure(s) may be incomplete for any period due to some unavailable expenditure figures that are used to derive these numbers.
Value ($)
GAMING RACING SPORTSBETTING TOTAL GAMBLING
Australian Gambling Statistics, 1993–94 to 2018–19, 36th edition
60

TABLE NSW 53NEW SOUTH WALES
REAL PER CAPITA GAMBLING EXPENDITURE
1993-94 963.05 246.84 - 1,209.891994-95 1,045.02 264.50 2.24 1,311.761995-96 1,169.49 244.62 1.84 1,415.961996-97 1,204.87 245.60 1.49 1,451.961997-98 1,409.97 227.12 2.13 1,639.221998-99 1,565.42 236.96 1.96 1,804.341999-00 1,645.00 231.23 5.37 1,881.612000-01 1,643.81 220.80 0.93 1,865.542001-02 1,612.67 226.26 0.72 1,839.652002-03 1,617.97 226.89 0.82 1,845.672003-04 1,646.25 216.02 10.49 1,872.772004-05 1,662.90 226.25 11.09 1,900.242005-06 1,653.60 210.54 13.83 1,877.972006-07 1,643.89 205.11 14.84 1,863.842007-08 1,444.12 186.19 16.60 1,646.912008-09 1,430.01 190.11 17.27 1,637.392009-10 1,261.06 186.91 20.38 1,468.352010-11 1,364.85 181.68 22.04 1,568.572011-12 1,375.94 189.21 22.06 1,587.212012-13 1,367.81 188.39 21.78 1,577.982013-14 1,347.90 187.66 22.95 1,558.512014-15 1,421.08 181.01 29.66 1,631.752015-16 1,469.00 178.38 26.87 1,674.262016-17 1,434.96 166.70 26.01 1,627.672017-18 1,425.86 164.42 29.26 1,619.542018-19 1,404.25 158.08 27.49 1,589.82
Notes: These data should be read in conjunction with the explanatory notes.
Figure(s) may be incomplete for any period due to some unavailable expenditure figures that are used to derive these numbers.
Value ($)
GAMING RACING SPORTSBETTING TOTAL GAMBLING
Australian Gambling Statistics, 1993–94 to 2018–19, 36th edition
61

TABLE NSW 54NEW SOUTH WALES
GAMBLING EXPENDITUREAS A % OF HDI
1993-94 2.020 0.518 - 2.5371994-95 2.175 0.550 0.005 2.7301995-96 2.409 0.504 0.004 2.9171996-97 2.397 0.489 0.003 2.8891997-98 2.733 0.440 0.004 3.1771998-99 2.992 0.453 0.004 3.4481999-00 3.062 0.430 0.010 3.5022000-01 3.002 0.403 0.002 3.4072001-02 2.999 0.421 0.001 3.4212002-03 3.058 0.429 0.002 3.4882003-04 2.985 0.392 0.019 3.3962004-05 2.898 0.394 0.019 3.3112005-06 2.885 0.367 0.024 3.2762006-07 2.781 0.347 0.025 3.1532007-08 2.381 0.307 0.027 2.7152008-09 2.286 0.304 0.028 2.6172009-10 2.018 0.299 0.033 2.3502010-11 2.109 0.281 0.034 2.4242011-12 2.078 0.286 0.033 2.3972012-13 2.092 0.288 0.033 2.4142013-14 2.017 0.281 0.034 2.3332014-15 2.099 0.267 0.044 2.4102015-16 2.173 0.264 0.040 2.4772016-17 2.138 0.248 0.039 2.4262017-18 2.142 0.247 0.044 2.4332018-19 2.115 0.238 0.041 2.394
Notes: These data should be read in conjunction with the explanatory notes.
Figure(s) may be incomplete for any period due to some unavailable expenditure figures that are used to derive these numbers.
RACING SPORTSBETTING TOTAL GAMBLING
Percentage (%)
GAMING
Australian Gambling Statistics, 1993–94 to 2018–19, 36th edition
62

TABLE NSW 55NEW SOUTH WALES
GAMBLING EXPENDITUREAS A % OF TOTAL GAMBLING EXPENDITURE
1993-94 79.60 20.40 -1994-95 79.67 20.16 0.171995-96 82.59 17.28 0.131996-97 82.98 16.91 0.101997-98 86.01 13.86 0.131998-99 86.76 13.13 0.111999-00 87.43 12.29 0.292000-01 88.11 11.84 0.052001-02 87.66 12.30 0.042002-03 87.66 12.29 0.042003-04 87.90 11.53 0.562004-05 87.51 11.91 0.582005-06 88.05 11.21 0.742006-07 88.20 11.00 0.802007-08 87.69 11.31 1.012008-09 87.33 11.61 1.052009-10 85.88 12.73 1.392010-11 87.01 11.58 1.412011-12 86.69 11.92 1.392012-13 86.68 11.94 1.382013-14 86.49 12.04 1.472014-15 87.09 11.09 1.822015-16 87.74 10.65 1.612016-17 88.16 10.24 1.602017-18 88.04 10.15 1.812018-19 88.33 9.94 1.73
Notes: These data should be read in conjunction with the explanatory notes.
Figure(s) may be incomplete for any period due to some unavailable expenditure figures that are used to derive these numbers.
Percentage (%)
GAMING RACING SPORTSBETTING
Australian Gambling Statistics, 1993–94 to 2018–19, 36th edition
63

TABLE NSW 56NEW SOUTH WALES
GOVERNMENT REVENUE FROM GAMBLING
1993-94 688.155 321.319 - 1,009.4741994-95 746.147 332.922 1.981 1,081.0501995-96 850.325 336.203 1.697 1,188.2251996-97 897.390 337.581 1.655 1,236.6261997-98 1,063.121 283.874 1.550 1,348.5451998-99 1,212.944 189.618 2.730 1,405.2921999-00 1,348.906 190.093 3.518 1,542.5172000-01 1,053.353 135.941 2.227 1,191.5212001-02 1,056.556 139.973 2.373 1,198.9022002-03 1,115.749 141.775 3.898 1,261.4222003-04 1,163.566 147.423 3.921 1,314.9102004-05 1,270.804 153.164 4.473 1,428.4412005-06 1,371.313 146.099 4.669 1,522.0812006-07 1,502.241 147.862 6.606 1,656.7092007-08 1,402.756 141.843 6.325 1,550.9242008-09 1,500.449 152.183 7.948 1,660.5802009-10 1,252.484 157.195 9.767 1,419.4462010-11 1,585.535 151.605 11.206 1,748.3462011-12 1,631.054 148.651 11.656 1,791.3612012-13 1,700.775 145.519 11.894 1,858.1882013-14 1,734.597 141.935 12.660 1,889.1922014-15 1,912.822 144.347 15.500 2,072.6692015-16 2,068.611 119.396 12.679 2,200.6862016-17 2,124.285 96.323 10.375 2,230.9832017-18 2,221.083 96.947 12.229 2,330.2592018-19 2,402.131 83.782 9.669 2,495.582
Notes: These data should be read in conjunction with the explanatory notes.
Figure(s) may be incomplete for any period due to some unavailable revenue figures that are used to derive these numbers.
Data for the gambling revenue received by states and territories from 1 July 2000 onwards are not comparable with that of
preceding years because of the impact of changes brought about by the introduction of the GST.
Value ($ million)
GAMING RACING SPORTSBETTING TOTAL GAMBLING
Australian Gambling Statistics, 1993–94 to 2018–19, 36th edition
64

TABLE NSW 57NEW SOUTH WALES
REAL GOVERNMENT REVENUE FROM GAMBLING
1993-94 1,278.803 597.109 - 1,875.9121994-95 1,342.829 599.155 3.565 1,945.5491995-96 1,467.808 580.344 2.929 2,051.0811996-97 1,528.242 574.895 2.818 2,105.9561997-98 1,810.479 483.433 2.640 2,296.5521998-99 2,041.252 319.106 4.594 2,364.9531999-00 2,217.726 312.530 5.784 2,536.0402000-01 1,632.983 210.745 3.452 1,847.1812001-02 1,592.510 210.976 3.577 1,807.0642002-03 1,632.141 207.391 5.702 1,845.2342003-04 1,661.613 210.525 5.599 1,877.7382004-05 1,772.601 213.643 6.239 1,992.4832005-06 1,853.872 197.511 6.312 2,057.6952006-07 1,972.448 194.143 8.674 2,175.2652007-08 1,782.344 180.226 8.037 1,970.6062008-09 1,848.825 187.517 9.793 2,046.1362009-10 1,507.473 189.198 11.755 1,708.4262010-11 1,851.684 177.054 13.087 2,041.8252011-12 1,861.033 169.611 13.299 2,043.9432012-13 1,896.954 162.304 13.266 2,072.5242013-14 1,884.929 154.236 13.757 2,052.9222014-15 2,043.567 154.213 16.559 2,214.3402015-16 2,179.395 125.790 13.358 2,318.5442016-17 2,199.464 99.732 10.742 2,309.9382017-18 2,256.684 98.501 12.425 2,367.6102018-19 2,402.131 83.782 9.669 2,495.582
Notes: These data should be read in conjunction with the explanatory notes.
Figure(s) may be incomplete for any period due to some unavailable revenue figures that are used to derive these numbers.
Data for the gambling revenue received by states and territories from 1 July 2000 onwards are not comparable with that of
preceding years because of the impact of changes brought about by the introduction of the GST.
Value ($ million)
GAMING RACING SPORTSBETTING TOTAL GAMBLING
Australian Gambling Statistics, 1993–94 to 2018–19, 36th edition
65

TABLE NSW 58NEW SOUTH WALES
PER CAPITA REVENUE FROM GAMBLING
1993-94 153.59 71.71 - 225.301994-95 164.73 73.50 0.44 238.671995-96 185.41 73.31 0.37 259.091996-97 193.11 72.65 0.36 266.121997-98 226.01 60.35 0.33 286.691998-99 254.75 39.83 0.57 295.151999-00 279.65 39.41 0.73 319.782000-01 215.33 27.79 0.46 243.582001-02 213.25 28.25 0.48 241.982002-03 223.00 28.34 0.78 252.122003-04 230.70 29.23 0.78 260.712004-05 250.01 30.13 0.88 281.032005-06 267.43 28.49 0.91 296.832006-07 289.37 28.48 1.27 319.132007-08 265.59 26.86 1.20 293.652008-09 278.85 28.28 1.48 308.612009-10 228.98 28.74 1.79 259.512010-11 286.04 27.35 2.02 315.412011-12 290.59 26.48 2.08 319.152012-13 298.85 25.57 2.09 326.512013-14 300.23 24.57 2.19 326.992014-15 326.08 24.61 2.64 353.322015-16 347.19 20.04 2.13 369.362016-17 350.36 15.89 1.71 367.952017-18 359.94 15.71 1.98 377.632018-19 383.18 13.36 1.54 398.09
Notes: These data should be read in conjunction with the explanatory notes.
Figure(s) may be incomplete for any period due to some unavailable revenue figures that are used to derive these numbers.
Data for the gambling revenue received by states and territories from 1 July 2000 onwards are not comparable with that of
preceding years because of the impact of changes brought about by the introduction of the GST.
Value ($)
GAMING RACING SPORTSBETTING TOTAL GAMBLING
Australian Gambling Statistics, 1993–94 to 2018–19, 36th edition
66

TABLE NSW 59NEW SOUTH WALES
REAL PER CAPITA REVENUE FROM GAMBLING
1993-94 285.41 133.27 - 418.681994-95 296.46 132.28 0.79 429.531995-96 320.05 126.54 0.64 447.231996-97 328.87 123.71 0.61 453.191997-98 384.90 102.77 0.56 488.231998-99 428.72 67.02 0.96 496.711999-00 459.76 64.79 1.20 525.762000-01 333.82 43.08 0.71 377.612001-02 321.42 42.58 0.72 364.722002-03 326.22 41.45 1.14 368.812003-04 329.45 41.74 1.11 372.302004-05 348.73 42.03 1.23 391.992005-06 361.54 38.52 1.23 401.292006-07 379.95 37.40 1.67 419.012007-08 337.46 34.12 1.52 373.112008-09 343.59 34.85 1.82 380.262009-10 275.60 34.59 2.15 312.342010-11 334.05 31.94 2.36 368.362011-12 331.57 30.22 2.37 364.152012-13 333.32 28.52 2.33 364.172013-14 326.25 26.70 2.38 355.332014-15 348.36 26.29 2.82 377.482015-16 365.78 21.11 2.24 389.142016-17 362.76 16.45 1.77 380.982017-18 365.71 15.96 2.01 383.692018-19 383.18 13.36 1.54 398.09
Notes: These data should be read in conjunction with the explanatory notes.
Figure(s) may be incomplete for any period due to some unavailable revenue figures that are used to derive these numbers.
Data for the gambling revenue received by states and territories from 1 July 2000 onwards are not comparable with that of
preceding years because of the impact of changes brought about by the introduction of the GST.
Value ($)
GAMING RACING SPORTSBETTING TOTAL GAMBLING
Australian Gambling Statistics, 1993–94 to 2018–19, 36th edition
67

TABLE NSW 60NEW SOUTH WALES
GOVERNMENT REVENUE FROM GAMBLINGAS A % OF TOTAL GAMBLING REVENUE
1993-94 68.17 31.83 -1994-95 69.02 30.80 0.181995-96 71.56 28.29 0.141996-97 72.57 27.30 0.131997-98 78.83 21.05 0.111998-99 86.31 13.49 0.191999-00 87.45 12.32 0.232000-01 88.40 11.41 0.192001-02 88.13 11.68 0.202002-03 88.45 11.24 0.312003-04 88.49 11.21 0.302004-05 88.96 10.72 0.312005-06 90.09 9.60 0.312006-07 90.68 8.93 0.402007-08 90.45 9.15 0.412008-09 90.36 9.16 0.482009-10 88.24 11.07 0.692010-11 90.69 8.67 0.642011-12 91.05 8.30 0.652012-13 91.53 7.83 0.642013-14 91.82 7.51 0.672014-15 92.29 6.96 0.752015-16 94.00 5.43 0.582016-17 95.22 4.32 0.472017-18 95.31 4.16 0.522018-19 96.26 3.36 0.39
Notes: These data should be read in conjunction with the explanatory notes.
Figure(s) may be incomplete for any period due to some unavailable revenue figures that are used to derive these numbers.
Data for the gambling revenue received by states and territories from 1 July 2000 onwards are not comparable with that of
preceding years because of the impact of changes brought about by the introduction of the GST.
Percentage (%)
GAMING RACING SPORTSBETTING
Australian Gambling Statistics, 1993–94 to 2018–19, 36th edition
68

TABLE NSW 61NEW SOUTH WALES
GAMING MACHINES OPERATING AS AT 30 JUNE
2001-02 1,500 76,830 24,628 102,958 2002-03 1,500 75,214 24,255 100,969 2003-04 1,500 74,990 24,166 100,656 2004-05 1,500 74,668 24,065 100,233 2005-06 1,500 74,280 24,254 100,034 2006-07 1,500 73,426 23,946 98,872 2007-08 1,500 73,251 24,023 98,774 2008-09 1,500 71,817 23,750 97,067 2009-10 1,500 71,845 23,825 97,170 2010-11 1,500 70,867 23,625 95,992 2011-12 1,500 70,746 23,364 95,610 2012-13 1,500 70,665 23,394 95,559 2013-14 1,500 70,201 23,311 95,012 2014-15 1,500 70,086 23,278 94,864 2015-16 1,500 69,874 23,034 94,408 2016-17 1,500 69,885 22,918 94,303 2017-18 1,500 69,314 R 22,652 93,466 2018-19 1,500 68,676 22,612 92,788
Notes: These data should be read in conjunction with the explanatory notes.
R = Revised data
NUMBER
CASINOS CLUBS HOTELS TOTAL MACHINES
Australian Gambling Statistics, 1993–94 to 2018–19, 36th edition
69

TABLE VIC 1VICTORIA
TOTAL RACING TURNOVER
1993-94 - 344.242 275.660 2,323.920 2,943.8221994-95 - 453.987 247.954 2,259.918 2,961.8591995-96 - 441.608 235.067 2,274.362 2,951.0371996-97 - 365.090 223.353 2,285.145 2,873.5881997-98 - 384.155 215.486 2,371.919 2,971.5601998-99 - 301.782 206.632 2,537.683 3,046.0971999-00 - 249.908 208.272 2,576.276 3,034.4562000-01 - 339.281 200.710 2,687.640 3,227.6312001-02 - 418.574 199.080 2,818.234 3,435.8882002-03 - 490.192 206.709 2,940.641 3,637.5422003-04 - 531.963 200.711 3,074.044 3,806.7182004-05 - 558.122 207.263 3,242.283 4,007.6682005-06 304.390 259.548 195.304 3,269.919 4,029.1612006-07 295.620 232.850 242.604 3,476.624 4,247.6982007-08 228.390 229.860 269.592 3,381.992 4,109.8342008-09 313.730 315.100 339.284 3,501.875 4,469.9892009-10 158.670 295.830 457.657 3,330.166 4,242.3232010-11 169.500 291.030 438.957 3,229.290 4,128.7772011-12 215.450 280.340 410.167 3,116.064 4,022.0212012-13 - U - U 452.630 2,990.484 3,443.114 (1)
2013-14 - U - U 326.140 2,791.871 3,118.0122014-15 - U - U 282.655 2,712.408 2,995.0632015-16 - U - U 177.858 2,542.446 2,720.3042016-17 - U - U 151.258 2,364.475 2,515.7332017-18 - U - U 128.424 2,247.446 2,375.8702018-19 - U - U 71.274 (2) 1,161.695 (2) 1,232.969
Notes: These data should be read in conjunction with the explanatory notes.
(1) Total racing figure incomplete from this period on, due to data for one or more components being unavailable.
(2) Point of consumption tax (POCT) introduced and applied from 1 Jan 2019. This figure only contains data from July 2018 to December 2018, pre-POCT.
U = Unavailable data
TOTAL RACING
Value ($ million)
BOOKMAKERS OFF COURSE
BOOKMAKERS ON COURSE
ON-COURSE TOTALISATOR
TAB
Australian Gambling Statistics, 1993–94 to 2018–19, 36th edition
70

TABLE VIC 2VICTORIA
REAL RACING TURNOVER
1993-94 - 639.707 512.261 4,318.555 5,470.5231994-95 - 817.033 446.239 4,067.139 5,330.4121995-96 - 762.292 405.766 3,925.941 5,093.9991996-97 - 621.743 380.367 3,891.568 4,893.6771997-98 - 654.210 366.969 4,039.343 5,060.5221998-99 - 507.866 347.739 4,270.644 5,126.2491999-00 - 410.872 342.418 4,235.635 4,988.9252000-01 - 525.978 311.155 4,166.572 5,003.7052001-02 - 630.902 300.066 4,247.827 5,178.7962002-03 - 717.063 302.378 4,301.630 5,321.0712003-04 - 759.662 286.622 4,389.843 5,436.1272004-05 - 778.505 289.104 4,522.549 5,590.1582005-06 411.504 350.882 264.031 4,420.590 5,447.0062006-07 388.150 305.733 318.540 4,564.819 5,577.2422007-08 290.193 292.060 342.544 4,297.164 5,221.9612008-09 386.572 388.260 418.059 4,314.945 5,507.8372009-10 190.973 356.057 550.829 4,008.143 5,106.0022010-11 197.952 339.883 512.641 3,771.361 4,821.8372011-12 245.828 319.868 468.001 3,555.429 4,589.1262012-13 - U - U 504.840 3,335.427 3,840.267 (1)
2013-14 - U - U 354.406 3,033.834 3,388.2392014-15 - U - U 301.975 2,897.807 3,199.7822015-16 - U - U 187.383 2,678.607 2,865.9902016-17 - U - U 156.611 2,448.154 2,604.7652017-18 - U - U 130.482 2,283.469 2,413.9522018-19 - U - U 71.274 (2) 1,161.695 (2) 1,232.969
Notes: These data should be read in conjunction with the explanatory notes.
(1) Total racing figure incomplete from this period on, due to data for one or more components being unavailable.
(2) Point of consumption tax (POCT) introduced and applied from 1 Jan 2019. This figure only contains data from July 2018 to December 2018, pre-POCT.
U = Unavailable data
TOTAL RACING
Value ($ million)
BOOKMAKERS OFF COURSE
BOOKMAKERS ON COURSE
ON-COURSE TOTALISATOR
TAB
Australian Gambling Statistics, 1993–94 to 2018–19, 36th edition
71

TABLE VIC 3VICTORIA
PER CAPITA RACING TURNOVER
1993-94 - 103.11 82.57 696.09 881.771994-95 - 135.19 73.83 672.94 881.961995-96 - 130.32 69.37 671.17 870.861996-97 - 106.62 65.23 667.37 839.231997-98 - 111.06 62.29 685.70 859.051998-99 - 86.28 59.08 725.51 870.871999-00 - 70.56 58.81 727.41 856.772000-01 - 94.47 55.89 748.35 898.702001-02 - 114.89 54.65 773.58 943.122002-03 - 132.68 55.95 795.94 984.572003-04 - 141.99 53.57 820.51 1,016.072004-05 - 146.85 54.53 853.08 1,054.472005-06 78.81 67.20 50.56 846.59 1,043.162006-07 75.12 59.17 61.64 883.39 1,079.322007-08 56.80 57.17 67.05 841.10 1,022.122008-09 76.19 76.52 82.39 850.39 1,085.492009-10 37.70 70.29 108.74 791.28 1,008.022010-11 39.59 67.98 102.53 754.28 964.382011-12 49.41 64.29 94.07 714.62 922.392012-13 - U - U 101.61 671.32 772.93 (1)
2013-14 - U - U 71.64 613.30 684.942014-15 - U - U 60.76 583.08 643.842015-16 - U - U 37.36 534.01 571.372016-17 - U - U 30.99 484.47 515.472017-18 - U - U 25.68 449.48 475.162018-19 - U - U 13.93 (2) 226.98 (2) 240.91
Notes: These data should be read in conjunction with the explanatory notes.
(1) Total racing figure incomplete from this period on, due to data for one or more components being unavailable.
(2) Point of consumption tax (POCT) introduced and applied from 1 Jan 2019. This figure only contains data from July 2018 to December 2018, pre-POCT.
U = Unavailable data
TOTAL RACING
Value ($)
BOOKMAKERS OFF COURSE
BOOKMAKERS ON COURSE
ON-COURSE TOTALISATOR
TAB
Australian Gambling Statistics, 1993–94 to 2018–19, 36th edition
72

TABLE VIC 4VICTORIA
REAL PER CAPITA RACING TURNOVER
1993-94 - 191.61 153.44 1,293.55 1,638.601994-95 - 243.29 132.88 1,211.09 1,587.251995-96 - 224.95 119.74 1,158.55 1,503.251996-97 - 181.58 111.09 1,136.53 1,429.191997-98 - 189.13 106.09 1,167.74 1,462.951998-99 - 145.20 99.42 1,220.96 1,465.571999-00 - 116.01 96.68 1,195.93 1,408.622000-01 - 146.45 86.64 1,160.14 1,393.232001-02 - 173.18 82.37 1,165.99 1,421.532002-03 - 194.09 81.84 1,164.32 1,440.252003-04 - 202.76 76.50 1,171.71 1,450.982004-05 - 204.83 76.07 1,189.94 1,470.842005-06 106.54 90.84 68.36 1,144.50 1,410.242006-07 98.63 77.69 80.94 1,159.90 1,417.152007-08 72.17 72.64 85.19 1,068.71 1,298.712008-09 93.88 94.28 101.52 1,047.84 1,337.522009-10 45.38 84.60 130.88 952.37 1,213.232010-11 46.24 79.39 119.74 880.90 1,126.272011-12 56.38 73.36 107.33 815.38 1,052.452012-13 - U - U 113.33 748.75 862.08 (1)
2013-14 - U - U 77.85 666.45 744.302014-15 - U - U 64.91 622.94 687.852015-16 - U - U 39.36 562.61 601.972016-17 - U - U 32.09 501.62 533.712017-18 - U - U 26.10 456.68 482.782018-19 - U - U 13.93 (2) 226.98 (2) 240.91
Notes: These data should be read in conjunction with the explanatory notes.
(1) Total racing figure incomplete from this period on, due to data for one or more components being unavailable.
(2) Point of consumption tax (POCT) introduced and applied from 1 Jan 2019. This figure only contains data from July 2018 to December 2018, pre-POCT.
U = Unavailable data
TOTAL RACING
Value ($)
BOOKMAKERS OFF COURSE
BOOKMAKERS ON COURSE
ON-COURSE TOTALISATOR
TAB
Australian Gambling Statistics, 1993–94 to 2018–19, 36th edition
73

TABLE VIC 5VICTORIA
TOTAL RACING EXPENDITURE
1993-94 - 18.925 41.377 348.820 409.1221994-95 - 24.952 38.160 346.696 409.8081995-96 - 26.496 37.611 363.898 428.0051996-97 - 21.905 35.736 365.623 423.2641997-98 - 17.338 34.477 379.507 431.3221998-99 - 15.693 33.061 406.029 454.7831999-00 - 12.955 33.324 412.204 458.4832000-01 - 17.575 33.233 452.706 503.5142001-02 - 21.682 (1) 32.934 472.229 526.8452002-03 - 25.392 34.148 492.267 551.8072003-04 - 27.556 33.243 515.036 575.8352004-05 - 28.911 34.319 543.223 606.4532005-06 15.767 (1) 13.445 32.170 548.863 610.2452006-07 15.313 12.062 39.008 582.841 649.2242007-08 11.831 11.907 46.563 581.023 651.3232008-09 16.251 16.322 57.283 597.036 686.8922009-10 8.219 15.323 78.731 575.274 677.5472010-11 8.780 15.075 74.131 560.076 658.0622011-12 11.160 14.521 70.540 541.433 637.6542012-13 - U - U 80.210 533.155 613.365 (2)
2013-14 - U - U 57.534 513.599 571.1332014-15 - U - U 51.005 491.730 542.7352015-16 - U - U 32.038 462.110 494.1482016-17 - U - U 27.104 431.670 458.7742017-18 - U - U 22.729 411.732 434.4622018-19 - U - U 12.471 (3) 213.643 (3) 226.114
Notes: These data should be read in conjunction with the explanatory notes.
(1) Expenditure is estimated at 5.18% of turnover, from this period on.
(2) Total racing figure incomplete from this period on, due to data for one or more components being unavailable.
(3) Point of consumption tax (POCT) introduced and applied from 1 Jan 2019. This figure only contains data from July 2018 to December 2018, pre-POCT.
U = Unavailable data
TOTAL RACING
Value ($ million)
BOOKMAKERS OFF COURSE
BOOKMAKERS ON COURSE
ON-COURSE TOTALISATOR
TAB
Australian Gambling Statistics, 1993–94 to 2018–19, 36th edition
74

TABLE VIC 6VICTORIA
REAL RACING EXPENDITURE
1993-94 - 35.168 76.890 648.215 760.2731994-95 - 44.907 68.676 623.943 737.5261995-96 - 45.737 64.923 628.151 738.8101996-97 - 37.304 60.858 622.651 720.8121997-98 - 29.526 58.714 646.295 734.5351998-99 - 26.410 55.638 683.302 765.3501999-00 - 21.299 54.788 677.701 753.7882000-01 - 27.246 51.520 701.817 780.5842001-02 - 32.681 (1) 49.640 711.774 794.0952002-03 - 37.144 49.952 720.098 807.1952003-04 - 39.351 47.472 735.489 822.3132004-05 - 40.327 47.870 757.723 845.9202005-06 21.316 (1) 18.176 43.490 742.006 824.9882006-07 20.106 15.837 51.218 765.272 852.4332007-08 15.032 15.129 59.163 738.249 827.5722008-09 20.024 20.112 70.583 735.657 846.3762009-10 9.892 18.443 94.760 692.392 815.4872010-11 10.254 17.606 86.575 654.091 768.5252011-12 12.734 16.568 80.486 617.775 727.5632012-13 - U - U 89.462 594.653 684.115 (2)
2013-14 - U - U 62.520 558.111 620.6312014-15 - U - U 54.491 525.341 579.8322015-16 - U - U 33.754 486.858 520.6122016-17 - U - U 28.063 446.947 475.0102017-18 - U - U 23.093 418.332 441.4252018-19 - U - U 12.471 (3) 213.643 (3) 226.114
Notes: These data should be read in conjunction with the explanatory notes.
(1) Expenditure is estimated at 5.18% of turnover, from this period on.
(2) Total racing figure incomplete from this period on, due to data for one or more components being unavailable.
(3) Point of consumption tax (POCT) introduced and applied from 1 Jan 2019. This figure only contains data from July 2018 to December 2018, pre-POCT.
U = Unavailable data
TOTAL RACING
Value ($ million)
BOOKMAKERS OFF COURSE
BOOKMAKERS ON COURSE
ON-COURSE TOTALISATOR
TAB
Australian Gambling Statistics, 1993–94 to 2018–19, 36th edition
75

TABLE VIC 7VICTORIA
PER CAPITA RACING EXPENDITURE
1993-94 - 5.67 12.39 104.48 122.551994-95 - 7.43 11.36 103.24 122.031995-96 - 7.82 11.10 107.39 126.311996-97 - 6.40 10.44 106.78 123.611997-98 - 5.01 9.97 109.71 124.691998-99 - 4.49 9.45 116.08 130.021999-00 - 3.66 9.41 116.39 129.452000-01 - 4.89 9.25 126.05 140.202001-02 - 5.95 (1) 9.04 129.62 144.612002-03 - 6.87 9.24 133.24 149.362003-04 - 7.36 8.87 137.47 153.702004-05 - 7.61 9.03 142.93 159.572005-06 4.08 (1) 3.48 8.33 142.10 157.992006-07 3.89 3.06 9.91 148.10 164.962007-08 2.94 2.96 11.58 144.50 161.982008-09 3.95 3.96 13.91 144.98 166.802009-10 1.95 3.64 18.71 136.69 160.992010-11 2.05 3.52 17.32 130.82 153.712011-12 2.56 3.33 16.18 124.17 146.242012-13 - U - U 18.01 119.69 137.69 (2)
2013-14 - U - U 12.64 112.82 125.462014-15 - U - U 10.96 105.71 116.672015-16 - U - U 6.73 97.06 103.792016-17 - U - U 5.55 88.45 94.002017-18 - U - U 4.55 82.34 86.892018-19 - U - U 2.44 (3) 41.74 (3) 44.18
Notes: These data should be read in conjunction with the explanatory notes.
(1) Expenditure is estimated at 5.18% of turnover, from this period on.
(2) Total racing figure incomplete from this period on, due to data for one or more components being unavailable.
(3) Point of consumption tax (POCT) introduced and applied from 1 Jan 2019. This figure only contains data from July 2018 to December 2018, pre-POCT.
U = Unavailable data
TOTAL RACING
Value ($)
BOOKMAKERS OFF COURSE
BOOKMAKERS ON COURSE
ON-COURSE TOTALISATOR
TAB
Australian Gambling Statistics, 1993–94 to 2018–19, 36th edition
76

TABLE VIC 8VICTORIA
REAL PER CAPITA RACING EXPENDITURE
1993-94 - 10.53 23.03 194.16 227.731994-95 - 13.37 20.45 185.79 219.621995-96 - 13.50 19.16 185.37 218.021996-97 - 10.89 17.77 181.84 210.511997-98 - 8.54 16.97 186.84 212.351998-99 - 7.55 15.91 195.35 218.811999-00 - 6.01 15.47 191.35 212.832000-01 - 7.59 14.35 195.41 217.352001-02 - 8.97 (1) 13.63 195.38 217.972002-03 - 10.05 13.52 194.91 218.482003-04 - 10.50 12.67 196.31 219.492004-05 - 10.61 12.60 199.37 222.572005-06 5.52 (1) 4.71 11.26 192.11 213.592006-07 5.11 4.02 13.01 194.45 216.602007-08 3.74 3.76 14.71 183.60 205.822008-09 4.86 4.88 17.14 178.65 205.532009-10 2.35 4.38 22.52 164.52 193.772010-11 2.40 4.11 20.22 152.78 179.512011-12 2.92 3.80 18.46 141.68 166.862012-13 - U - U 20.08 133.49 153.57 (2)
2013-14 - U - U 13.73 122.60 136.342014-15 - U - U 11.71 112.93 124.652015-16 - U - U 7.09 102.26 109.352016-17 - U - U 5.75 91.58 97.332017-18 - U - U 4.62 83.66 88.282018-19 - U - U 2.44 (3) 41.74 (3) 44.18
Notes: These data should be read in conjunction with the explanatory notes.
(1) Expenditure is estimated at 5.18% of turnover, from this period on.
(2) Total racing figure incomplete from this period on, due to data for one or more components being unavailable.
(3) Point of consumption tax (POCT) introduced and applied from 1 Jan 2019. This figure only contains data from July 2018 to December 2018, pre-POCT.
U = Unavailable data
TOTAL RACING
Value ($)
BOOKMAKERS OFF COURSE
BOOKMAKERS ON COURSE
ON-COURSE TOTALISATOR
TAB
Australian Gambling Statistics, 1993–94 to 2018–19, 36th edition
77

TABLE VIC 9VICTORIA
RACING EXPENDITUREAS A % OF HDI
1993-94 - 0.025 0.054 0.457 0.5361994-95 - 0.031 0.048 0.434 0.5131995-96 - 0.031 0.045 0.431 0.5071996-97 - 0.025 0.041 0.415 0.4811997-98 - 0.019 0.037 0.410 0.4671998-99 - 0.016 0.034 0.417 0.4671999-00 - 0.013 0.033 0.404 0.4502000-01 - 0.016 0.030 0.406 0.4522001-02 - 0.018 (1) 0.027 0.391 0.4372002-03 - 0.020 0.027 0.392 0.4392003-04 - 0.021 0.025 0.388 0.4342004-05 - 0.020 0.024 0.384 0.4292005-06 0.011 (1) 0.009 0.022 0.368 0.4092006-07 0.010 0.007 0.024 0.362 0.4032007-08 0.007 0.007 0.026 0.329 0.3682008-09 0.008 0.008 0.030 0.311 0.3572009-10 0.004 0.008 0.040 0.290 0.3422010-11 0.004 0.007 0.035 0.264 0.3112011-12 0.005 0.007 0.032 0.246 0.2892012-13 - U - U 0.035 0.232 0.267 (2)
2013-14 - U - U 0.023 0.209 0.2322014-15 - U - U 0.020 0.197 0.2172015-16 - U - U 0.013 0.183 0.1952016-17 - U - U 0.010 0.164 0.1742017-18 - U - U 0.008 0.150 0.1592018-19 - U - U 0.004 (3) 0.076 (3) 0.080
Notes: These data should be read in conjunction with the explanatory notes.
(1) Expenditure is estimated at 5.18% of turnover, from this period on.
(2) Total racing figure incomplete from this period on, due to data for one or more components being unavailable.
(3) Point of consumption tax (POCT) introduced and applied from 1 Jan 2019. This figure only contains data from July 2018 to December 2018, pre-POCT.
U = Unavailable data
Percentage (%)
BOOKMAKERS OFF COURSE
BOOKMAKERS ON COURSE
ON-COURSE TOTALISATOR
TAB TOTAL RACING
Australian Gambling Statistics, 1993–94 to 2018–19, 36th edition
78

TABLE VIC 10VICTORIA
RACING EXPENDITURESHARE OF MARKET
1993-94 - 4.63 10.11 85.261994-95 - 6.09 9.31 84.601995-96 - 6.19 8.79 85.021996-97 - 5.18 8.44 86.381997-98 - 4.02 7.99 87.991998-99 - 3.45 7.27 89.281999-00 - 2.83 7.27 89.912000-01 - 3.49 6.60 89.912001-02 - 4.12 (1) 6.25 89.632002-03 - 4.60 6.19 89.212003-04 - 4.79 5.77 89.442004-05 - 4.77 5.66 89.572005-06 2.58 (1) 2.20 5.27 89.942006-07 2.36 1.86 6.01 89.782007-08 1.82 1.83 7.15 89.212008-09 2.37 2.38 8.34 86.922009-10 1.21 2.26 11.62 84.912010-11 1.33 2.29 11.27 85.112011-12 1.75 2.28 11.06 84.912012-13 - U - U 13.08 86.922013-14 - U - U 10.07 89.932014-15 - U - U 9.40 90.602015-16 - U - U 6.48 93.522016-17 - U - U 5.91 94.092017-18 - U - U 5.23 94.772018-19 - U - U 5.52 (2) 94.48 (2)
Notes: These data should be read in conjunction with the explanatory notes.
(1) Expenditure is estimated at 5.18% of turnover, from this period on.
(2) Point of consumption tax (POCT) introduced and applied from 1 Jan 2019. This figure only contains data from July 2018 to December 2018, pre-POCT.
U = Unavailable data
ON-COURSE TOTALISATOR
TAB
Percentage (%)
BOOKMAKERS OFF COURSE
BOOKMAKERS ON COURSE
Australian Gambling Statistics, 1993–94 to 2018–19, 36th edition
79

TABLE VIC 11VICTORIA
GOVERNMENT REVENUE FROM RACING
1993-94 7.409 37.415 137.855 182.6791994-95 8.751 26.855 105.517 141.1231995-96 8.365 9.987 103.100 121.4521996-97 7.111 8.414 105.148 120.6731997-98 7.542 8.957 110.449 126.9481998-99 5.837 9.561 118.699 134.0971999-00 4.779 9.737 121.957 136.4732000-01 0.194 6.389 86.614 93.1972001-02 - U 6.357 91.149 97.506 (1)
2002-03 - U 6.607 95.246 101.8532003-04 - U 6.413 99.941 106.3542004-05 - U 6.689 105.887 112.5762005-06 - U 6.401 107.169 113.5702006-07 - U 7.454 111.381 118.8352007-08 - U 8.898 111.033 119.9312008-09 - U 10.946 114.094 125.0402009-10 - U 15.046 109.935 124.9802010-11 - U 14.166 107.030 121.1962011-12 - U 13.480 103.468 116.9482012-13 - U 6.963 47.514 54.4772013-14 - U 4.373 38.281 42.6542014-15 - U 3.876 37.371 41.2472015-16 - U 2.435 35.120 37.5552016-17 - U 2.060 32.807 34.8672017-18 - U 1.727 31.292 33.0192018-19 - U 0.948 (2) 16.237 (2) 17.185
Notes: These data should be read in conjunction with the explanatory notes.
Data for the gambling revenue received by states and territories from 1 July 2000 onwards are not comparable
with that of preceding years because of the impact of changes brought about by the introduction of the GST.
(1) Total racing figure incomplete from this period on, due to data for one or more components being unavailable.
(2) Point of consumption tax (POCT) introduced and applied from 1 Jan 2019. This figure only contains data from July 2018 to December 2018, pre-POCT.
U = Unavailable data
Value ($ million)
BOOKMAKERSON-COURSE
TOTALISATORTAB TOTAL RACING
Australian Gambling Statistics, 1993–94 to 2018–19, 36th edition
80

TABLE VIC 12VICTORIA
REAL GOVERNMENT REVENUE FROM RACING
1993-94 13.768 69.529 256.177 339.4741994-95 15.749 48.331 189.897 253.9771995-96 14.439 17.239 177.968 209.6471996-97 12.110 14.329 179.065 205.5041997-98 12.844 15.254 188.093 216.1911998-99 9.823 16.090 199.757 225.6711999-00 7.857 16.009 200.509 224.3742000-01 0.301 9.905 134.275 144.4812001-02 - U 9.582 137.386 146.967 (1)
2002-03 - U 9.665 139.328 148.9932003-04 - U 9.158 142.719 151.8772004-05 - U 9.330 147.698 157.0282005-06 - U 8.653 144.881 153.5352006-07 - U 9.787 146.244 156.0312007-08 - U 11.306 141.079 152.3842008-09 - U 13.487 140.585 154.0722009-10 - U 18.109 132.316 150.4252010-11 - U 16.544 124.996 141.5402011-12 - U 15.381 118.057 133.4382012-13 - U 7.766 52.995 60.7612013-14 - U 4.752 41.599 46.3502014-15 - U 4.141 39.925 44.0662015-16 - U 2.565 37.001 39.5662016-17 - U 2.133 33.968 36.1012017-18 - U 1.755 31.793 33.5482018-19 - U 0.948 (2) 16.237 (2) 17.185
Notes: These data should be read in conjunction with the explanatory notes.
Data for the gambling revenue received by states and territories from 1 July 2000 onwards are not comparable
with that of preceding years because of the impact of changes brought about by the introduction of the GST.
(1) Total racing figure incomplete from this period on, due to data for one or more components being unavailable.
(2) Point of consumption tax (POCT) introduced and applied from 1 Jan 2019. This figure only contains data from July 2018 to December 2018, pre-POCT.
U = Unavailable data
Value ($ million)
BOOKMAKERSON-COURSE
TOTALISATORTAB TOTAL RACING
Australian Gambling Statistics, 1993–94 to 2018–19, 36th edition
81

TABLE VIC 13VICTORIA
PER CAPITA REVENUE FROM RACING
1993-94 2.22 11.21 41.29 54.721994-95 2.61 8.00 31.42 42.021995-96 2.47 2.95 30.43 35.841996-97 2.08 2.46 30.71 35.241997-98 2.18 2.59 31.93 36.701998-99 1.67 2.73 33.94 38.341999-00 1.35 2.75 34.43 38.532000-01 0.05 1.78 24.12 25.952001-02 - U 1.74 25.02 26.76 (1)
2002-03 - U 1.79 25.78 27.572003-04 - U 1.71 26.68 28.392004-05 - U 1.76 27.86 29.622005-06 - U 1.66 27.75 29.402006-07 - U 1.89 28.30 30.202007-08 - U 2.21 27.61 29.832008-09 - U 2.66 27.71 30.362009-10 - U 3.57 26.12 29.702010-11 - U 3.31 25.00 28.312011-12 - U 3.09 23.73 26.822012-13 - U 1.56 10.67 12.232013-14 - U 0.96 8.41 9.372014-15 - U 0.83 8.03 8.872015-16 - U 0.51 7.38 7.892016-17 - U 0.42 6.72 7.142017-18 - U 0.35 6.26 6.602018-19 - U 0.19 (2) 3.17 (2) 3.36
Notes: These data should be read in conjunction with the explanatory notes.
Data for the gambling revenue received by states and territories from 1 July 2000 onwards are not comparable
with that of preceding years because of the impact of changes brought about by the introduction of the GST.
(1) Total racing figure incomplete from this period on, due to data for one or more components being unavailable.
(2) Point of consumption tax (POCT) introduced and applied from 1 Jan 2019. This figure only contains data from July 2018 to December 2018, pre-POCT.
U = Unavailable data
Value ($)
BOOKMAKERSON-COURSE
TOTALISATORTAB TOTAL RACING
Australian Gambling Statistics, 1993–94 to 2018–19, 36th edition
82

TABLE VIC 14VICTORIA
REAL PER CAPITA REVENUE FROM RACING
1993-94 4.12 20.83 76.73 101.681994-95 4.69 14.39 56.55 75.631995-96 4.26 5.09 52.52 61.871996-97 3.54 4.18 52.30 60.021997-98 3.71 4.41 54.38 62.501998-99 2.81 4.60 57.11 64.521999-00 2.22 4.52 56.61 63.352000-01 0.08 2.76 37.39 40.232001-02 - U 2.63 37.71 40.34 (1)
2002-03 - U 2.62 37.71 40.332003-04 - U 2.44 38.09 40.542004-05 - U 2.45 38.86 41.322005-06 - U 2.24 37.51 39.752006-07 - U 2.49 37.16 39.652007-08 - U 2.81 35.09 37.902008-09 - U 3.28 34.14 37.412009-10 - U 4.30 31.44 35.742010-11 - U 3.86 29.20 33.062011-12 - U 3.53 27.07 30.602012-13 - U 1.74 11.90 13.642013-14 - U 1.04 9.14 10.182014-15 - U 0.89 8.58 9.472015-16 - U 0.54 7.77 8.312016-17 - U 0.44 6.96 7.402017-18 - U 0.35 6.36 6.712018-19 - U 0.19 (2) 3.17 (2) 3.36
Notes: These data should be read in conjunction with the explanatory notes.
Data for the gambling revenue received by states and territories from 1 July 2000 onwards are not comparable
with that of preceding years because of the impact of changes brought about by the introduction of the GST.
(1) Total racing figure incomplete from this period on, due to data for one or more components being unavailable.
(2) Point of consumption tax (POCT) introduced and applied from 1 Jan 2019. This figure only contains data from July 2018 to December 2018, pre-POCT.
U = Unavailable data
Value ($)
BOOKMAKERSON-COURSE
TOTALISATORTAB TOTAL RACING
Australian Gambling Statistics, 1993–94 to 2018–19, 36th edition
83

TABLE VIC 15VICTORIA
GOVERNMENT REVENUE FROM RACINGAS A % OF TOTAL GAMBLING REVENUE
1993-94 1.00 5.02 18.51 24.531994-95 0.97 2.97 11.66 15.591995-96 0.80 0.95 9.81 11.551996-97 0.61 0.73 9.09 10.431997-98 0.58 0.69 8.52 9.791998-99 0.41 0.68 8.43 9.521999-00 0.31 0.64 8.02 8.982000-01 0.02 0.50 6.79 7.302001-02 - U 0.46 6.65 7.12 (1)
2002-03 - U 0.50 7.18 7.682003-04 - U 0.48 7.55 8.032004-05 - U 0.49 7.73 8.222005-06 - U 0.44 7.44 7.882006-07 - U 0.50 7.49 7.992007-08 - U 0.57 7.08 7.652008-09 - U 0.67 6.99 7.662009-10 - U 0.93 6.83 7.762010-11 - U 0.87 6.57 7.442011-12 - U 0.79 6.05 6.842012-13 - U 0.45 3.05 3.502013-14 - U 0.29 2.53 2.822014-15 - U 0.24 2.31 2.562015-16 - U 0.14 2.09 2.232016-17 - U 0.13 2.01 2.132017-18 - U 0.10 1.84 1.942018-19 - U 0.05 (2) 0.91 (2) 0.97
Notes: These data should be read in conjunction with the explanatory notes.
Data for the gambling revenue received by states and territories from 1 July 2000 onwards are not comparable
with that of preceding years because of the impact of changes brought about by the introduction of the GST.
(1) Total racing figure incomplete from this period on, due to data for one or more components being unavailable.
(2) Point of consumption tax (POCT) introduced and applied from 1 Jan 2019. This figure only contains data from July 2018 to December 2018, pre-POCT.
U = Unavailable data
ON-COURSE TOTALISATOR
TAB TOTAL RACING
Percentage (%)
BOOKMAKERS
Australian Gambling Statistics, 1993–94 to 2018–19, 36th edition
84

TABLE VIC 16VICTORIA
TOTAL GAMING TURNOVER
1993-94 - 7,230.076 102.715 - 7.976 12.589 637.307 201.624 4.332 8,196.6191994-95 2,926.130 10,090.519 83.761 - 39.917 12.392 677.779 202.118 3.004 14,035.6201995-96 3,991.848 13,367.223 72.425 - 31.343 12.487 702.756 171.218 3.529 18,352.8291996-97 6,534.036 15,893.958 60.443 - 29.704 12.277 643.911 - U 2.658 23,176.987 (1)
1997-98 13,048.195 18,097.817 59.174 - 28.505 13.034 672.039 - U 2.488 31,921.2521998-99 9,098.222 20,543.570 59.536 - 28.675 13.554 705.167 - U 2.512 30,451.2361999-00 10,651.658 22,387.654 64.036 - 27.246 12.962 708.362 - U 2.201 33,854.1192000-01 10,283.089 23,889.687 57.453 - 28.481 13.115 757.402 - U 2.220 35,031.4472001-02 8,384.000 25,427.705 55.899 - 28.547 13.864 763.140 - U 2.038 34,675.1932002-03 8,211.718 23,265.472 59.417 - 25.509 14.650 839.209 - U 2.184 32,418.1592003-04 7,656.865 23,248.504 61.965 - 27.968 15.331 864.153 - U 1.905 31,876.6912004-05 7,869.770 23,820.186 57.457 - 27.262 15.361 867.498 - U 1.899 32,659.4332005-06 7,974.568 24,440.244 57.206 - 26.933 16.040 898.006 - U 1.734 33,414.7312006-07 8,176.040 25,231.010 57.951 - 29.551 16.683 936.557 - U 1.757 34,449.5492007-08 8,875.224 26,204.474 54.011 - 27.150 17.218 990.931 - U 2.055 36,171.0632008-09 9,071.130 27,664.238 43.536 - 27.228 3.528 1,048.933 - U 2.459 37,861.0522009-10 9,647.859 26,798.449 39.373 - 24.022 4.315 1,045.523 - U 2.149 37,561.6892010-11 10,461.842 27,555.690 42.568 - 23.708 2.929 1,015.427 - U 1.942 39,104.1062011-12 10,971.437 27,587.198 51.458 - 29.114 (2) 2.886 1,141.214 - U 2.593 39,785.9002012-13 11,393.489 25,838.813 43.465 - 58.292 2.866 1,268.263 - U 2.937 38,608.1252013-14 11,635.430 26,632.511 39.724 - 62.301 2.700 1,179.730 - U 2.257 39,554.6532014-15 13,491.567 27,546.894 40.512 - 69.349 1.712 (3) 1,203.122 - U 2.164 42,355.3202015-16 14,570.456 28,287.069 49.142 - 81.849 - 1,287.044 (4) - U 1.559 44,277.1192016-17 11,833.561 28,467.049 57.992 (5) - 97.518 - 1,200.923 (5) - U 2.396 (5) 41,659.4392017-18 13,008.558 29,579.794 61.017 - 95.748 - 1,237.579 - U 3.037 43,985.7332018-19 13,633.681 29,916.099 59.275 - 91.156 - 1,555.619 - U - (6) 45,255.831
Notes: These data should be read in conjunction with the explanatory notes.
(1) Total gaming figure incomplete from this period on, due to data for one or more components being unavailable.
(2) New keno licence commenced 14 April 2012, replacing previous club keno arrangements. New keno game rolled out into a much larger number of venues.
(3) Intralot surrendered licence and ceased trading 31 January 2015.
(4) "Set for Life" lottery product introduced in 2015-16.
(5) Net sales (exclude agent commission), from this period on.
(6) Pools was withdrawn from the Australian Lottery Market on 23 June 2018.
NA = Not applicable
U = Unavailable data
KENO
Value ($ million)
CASINOGAMING
MACHINESINSTANT LOTTERY
INTERACTIVE GAMING (NA)
LOTTERIES LOTTO MINOR GAMING POOLS TOTAL GAMING
Australian Gambling Statistics, 1993–94 to 2018–19, 36th edition
85

TABLE VIC 17VICTORIA
REAL GAMING TURNOVER
1993-94 - 13,435.695 190.876 - 14.822 23.394 1,184.312 374.679 8.050 15,231.8281994-95 5,266.111 18,159.751 150.743 - 71.838 22.302 1,219.788 363.749 5.406 25,259.6881995-96 6,890.618 23,074.132 125.018 - 54.103 21.555 1,213.078 295.552 6.092 31,680.1481996-97 11,127.366 27,067.173 102.934 - 50.585 20.908 1,096.571 - U 4.527 39,470.063 (1)
1997-98 22,220.881 30,820.312 100.772 - 48.544 22.197 1,144.472 - U 4.237 54,361.4161998-99 15,311.315 34,572.586 100.193 - 48.257 22.810 1,186.719 - U 4.227 51,246.1071999-00 17,512.308 36,807.368 105.281 - 44.795 21.311 1,164.612 - U 3.619 55,659.2942000-01 15,941.582 37,035.507 89.068 - 44.153 20.332 1,174.179 - U 3.442 54,308.2622001-02 12,636.914 38,326.303 84.255 - 43.028 20.897 1,150.255 - U 3.072 52,264.7232002-03 12,012.270 34,033.210 86.916 - 37.315 21.430 1,227.612 - U 3.195 47,421.9482003-04 10,934.272 33,199.678 88.488 - 39.939 21.893 1,234.041 - U 2.720 45,521.0322004-05 10,977.271 33,225.956 80.145 - 38.027 21.427 1,210.043 - U 2.649 45,555.5172005-06 10,780.784 33,040.662 77.337 - 36.411 21.684 1,214.010 - U 2.344 45,173.2322006-07 10,735.169 33,128.403 76.090 - 38.801 21.905 1,229.703 - U 2.307 45,232.3772007-08 11,276.871 33,295.440 68.626 - 34.497 21.877 1,259.078 - U 2.611 45,959.0012008-09 11,177.278 34,087.360 53.644 - 33.550 4.347 1,292.476 - U 3.030 46,651.6852009-10 11,612.032 32,254.251 47.389 - 28.913 5.193 1,258.377 - U 2.586 45,208.7422010-11 12,217.975 32,181.210 49.713 - 27.688 3.421 1,185.877 - U 2.268 45,668.1522011-12 12,518.410 31,476.993 58.714 - 33.219 (2) 3.293 1,302.125 - U 2.959 45,395.7122012-13 12,707.694 28,819.243 48.479 - 65.016 3.197 1,414.553 - U 3.276 43,061.4572013-14 12,643.834 28,940.662 43.167 - 67.700 2.934 1,281.974 - U 2.453 42,982.7232014-15 14,413.743 29,429.781 43.281 - 74.089 1.829 (3) 1,285.358 - U 2.312 45,250.3932015-16 15,350.776 29,801.981 51.774 - 86.232 - 1,355.972 (4) - U 1.642 46,648.3772016-17 12,252.353 29,474.504 60.044 (5) - 100.969 - 1,243.424 (5) - U 2.481 (5) 43,133.7752017-18 13,217.065 30,053.913 61.995 - 97.283 - 1,257.415 - U 3.085 44,690.7582018-19 13,633.681 29,916.099 59.275 - 91.156 - 1,555.619 - U - (6) 45,255.831
Notes: These data should be read in conjunction with the explanatory notes.
(1) Total gaming figure incomplete from this period on, due to data for one or more components being unavailable.
(2) New keno licence commenced 14 April 2012, replacing previous club keno arrangements. New keno game rolled out into a much larger number of venues.
(3) Intralot surrendered licence and ceased trading 31 January 2015.
(4) "Set for Life" lottery product introduced in 2015-16.
(5) Net sales (exclude agent commission), from this period on.
(6) Pools was withdrawn from the Australian Lottery Market on 23 June 2018.
NA = Not applicable
U = Unavailable data
KENO
Value ($ million)
CASINOGAMING
MACHINESINSTANT LOTTERY
INTERACTIVE GAMING (NA)
LOTTERIES LOTTO MINOR GAMING POOLS TOTAL GAMING
Australian Gambling Statistics, 1993–94 to 2018–19, 36th edition
86

TABLE VIC 18VICTORIA
PER CAPITA GAMING TURNOVER
1993-94 - 2,165.64 30.77 - 2.39 3.77 190.89 60.39 1.30 2,455.151994-95 871.32 3,004.69 24.94 - 11.89 3.69 201.82 60.19 0.89 4,179.431995-96 1,178.00 3,944.70 21.37 - 9.25 3.68 207.39 50.53 1.04 5,415.971996-97 1,908.25 4,641.80 17.65 - 8.68 3.59 188.05 - U 0.78 6,768.80 (1)
1997-98 3,772.11 5,231.91 17.11 - 8.24 3.77 194.28 - U 0.72 9,228.131998-99 2,601.14 5,873.31 17.02 - 8.20 3.88 201.60 - U 0.72 8,705.871999-00 3,007.48 6,321.12 18.08 - 7.69 3.66 200.00 - U 0.62 9,558.662000-01 2,863.23 6,651.85 16.00 - 7.93 3.65 210.89 - U 0.62 9,754.162001-02 2,301.33 6,979.68 15.34 - 7.84 3.81 209.48 - U 0.56 9,518.032002-03 2,222.65 6,297.23 16.08 - 6.90 3.97 227.15 - U 0.59 8,774.582003-04 2,043.73 6,205.36 16.54 - 7.47 4.09 230.66 - U 0.51 8,508.352004-05 2,070.63 6,267.38 15.12 - 7.17 4.04 228.25 - U 0.50 8,593.102005-06 2,064.63 6,327.62 14.81 - 6.97 4.15 232.50 - U 0.45 8,651.122006-07 2,077.49 6,411.08 14.73 - 7.51 4.24 237.97 - U 0.45 8,753.472007-08 2,207.28 6,517.08 13.43 - 6.75 4.28 246.45 - U 0.51 8,995.782008-09 2,202.83 6,717.97 10.57 - 6.61 0.86 254.72 - U 0.60 9,194.162009-10 2,292.42 6,367.56 9.36 - 5.71 1.03 248.43 - U 0.51 8,925.012010-11 2,443.63 6,436.35 9.94 - 5.54 0.68 237.18 - U 0.45 9,133.782011-12 2,516.14 6,326.71 11.80 - 6.68 (2) 0.66 261.72 - U 0.59 9,124.312012-13 2,557.67 5,800.43 9.76 - 13.09 0.64 284.71 - U 0.66 8,666.952013-14 2,555.99 5,850.44 8.73 - 13.69 0.59 259.15 - U 0.50 8,689.092014-15 2,900.25 5,921.70 8.71 - 14.91 0.37 (3) 258.63 - U 0.47 9,105.032015-16 3,060.37 5,941.40 10.32 - 17.19 - 270.33 (4) - U 0.33 9,299.942016-17 2,424.67 5,832.82 11.88 (5) - 19.98 - 246.07 (5) - U 0.49 (5) 8,535.912017-18 2,601.64 5,915.79 12.20 - 19.15 - 247.51 - U 0.61 8,796.902018-19 2,663.86 5,845.24 11.58 - 17.81 - 303.95 - U - (6) 8,842.44
Notes: These data should be read in conjunction with the explanatory notes.
(1) Total gaming figure incomplete from this period on, due to data for one or more components being unavailable.
(2) New keno licence commenced 14 April 2012, replacing previous club keno arrangements. New keno game rolled out into a much larger number of venues.
(3) Intralot surrendered licence and ceased trading 31 January 2015.
(4) "Set for Life" lottery product introduced in 2015-16.
(5) Net sales (exclude agent commission), from this period on.
(6) Pools was withdrawn from the Australian Lottery Market on 23 June 2018.
NA = Not applicable
U = Unavailable data
KENO
Value ($)
CASINOGAMING
MACHINESINSTANT LOTTERY
INTERACTIVE GAMING (NA)
LOTTERIES LOTTO MINOR GAMING POOLS TOTAL GAMING
Australian Gambling Statistics, 1993–94 to 2018–19, 36th edition
87

TABLE VIC 19VICTORIA
REAL PER CAPITA GAMING TURNOVER
1993-94 - 4,024.42 57.17 - 4.44 7.01 354.74 112.23 2.41 4,562.421994-95 1,568.11 5,407.49 44.89 - 21.39 6.64 363.22 108.31 1.61 7,521.661995-96 2,033.44 6,809.23 36.89 - 15.97 6.36 357.98 87.22 1.80 9,348.891996-97 3,249.73 7,904.92 30.06 - 14.77 6.11 320.25 - U 1.32 11,527.16 (1)
1997-98 6,423.85 8,909.86 29.13 - 14.03 6.42 330.86 - U 1.22 15,715.371998-99 4,377.44 9,884.15 28.64 - 13.80 6.52 339.28 - U 1.21 14,651.031999-00 4,944.58 10,392.51 29.73 - 12.65 6.02 328.83 - U 1.02 15,715.322000-01 4,438.78 10,312.17 24.80 - 12.29 5.66 326.94 - U 0.96 15,121.602001-02 3,468.72 10,520.23 23.13 - 11.81 5.74 315.73 - U 0.84 14,346.202002-03 3,251.34 9,211.72 23.53 - 10.10 5.80 332.28 - U 0.86 12,835.632003-04 2,918.52 8,861.48 23.62 - 10.66 5.84 329.38 - U 0.73 12,150.232004-05 2,888.26 8,742.16 21.09 - 10.01 5.64 318.38 - U 0.70 11,986.222005-06 2,791.16 8,554.28 20.02 - 9.43 5.61 314.31 - U 0.61 11,695.422006-07 2,727.76 8,417.78 19.33 - 9.86 5.57 312.46 - U 0.59 11,493.342007-08 2,804.57 8,280.61 17.07 - 8.58 5.44 313.13 - U 0.65 11,430.052008-09 2,714.29 8,277.76 13.03 - 8.15 1.06 313.86 - U 0.74 11,328.882009-10 2,759.13 7,663.91 11.26 - 6.87 1.23 299.00 - U 0.61 10,742.022010-11 2,853.82 7,516.76 11.61 - 6.47 0.80 276.99 - U 0.53 10,666.982011-12 2,870.91 7,218.78 13.47 - 7.62 (2) 0.76 298.62 - U 0.68 10,410.832012-13 2,852.69 6,469.49 10.88 - 14.60 0.72 317.55 - U 0.74 9,666.662013-14 2,777.51 6,357.48 9.48 - 14.87 0.64 281.61 - U 0.54 9,442.142014-15 3,098.49 6,326.46 9.30 - 15.93 0.39 (3) 276.31 - U 0.50 9,727.382015-16 3,224.27 6,259.59 10.87 - 18.11 - 284.81 (4) - U 0.34 9,798.002016-17 2,510.48 6,039.25 12.30 (5) - 20.69 - 254.77 (5) - U 0.51 (5) 8,838.002017-18 2,643.34 6,010.61 12.40 - 19.46 - 251.48 - U 0.62 8,937.902018-19 2,663.86 5,845.24 11.58 - 17.81 - 303.95 - U - (6) 8,842.44
Notes: These data should be read in conjunction with the explanatory notes.
(1) Total gaming figure incomplete from this period on, due to data for one or more components being unavailable.
(2) New keno licence commenced 14 April 2012, replacing previous club keno arrangements. New keno game rolled out into a much larger number of venues.
(3) Intralot surrendered licence and ceased trading 31 January 2015.
(4) "Set for Life" lottery product introduced in 2015-16.
(5) Net sales (exclude agent commission), from this period on.
(6) Pools was withdrawn from the Australian Lottery Market on 23 June 2018.
NA = Not applicable
U = Unavailable data
KENO
Value ($)
CASINOGAMING
MACHINESINSTANT LOTTERY
INTERACTIVE GAMING (NA)
LOTTERIES LOTTO MINOR GAMING POOLS TOTAL GAMING
Australian Gambling Statistics, 1993–94 to 2018–19, 36th edition
88

TABLE VIC 20VICTORIA
TOTAL GAMING EXPENDITURE
1993-94 - 679.663 41.086 - 2.473 5.036 254.923 113.721 2.166 1,099.0671994-95 357.847 908.146 33.504 - 12.374 4.957 271.112 113.336 1.502 1,702.7781995-96 490.900 1,246.309 28.970 - 8.702 4.995 281.102 51.365 1.765 2,114.1081996-97 578.966 1,455.797 24.177 - 7.159 4.911 257.564 - U 1.329 2,329.903 (1)
1997-98 742.292 1,711.290 23.670 - 7.084 5.214 268.815 - U 1.244 2,759.6091998-99 721.852 1,954.192 23.814 - 7.197 5.422 282.067 - U 1.256 2,995.8001999-00 823.869 2,170.560 25.614 - 6.783 5.185 283.345 - U 1.101 3,316.4572000-01 945.746 2,366.042 22.981 - 6.856 5.246 302.961 - U 1.110 3,650.9422001-02 911.198 2,562.876 22.360 (2) - 6.598 5.546 (2) 305.256 (2) - U 1.019 (3) 3,814.8532002-03 951.747 2,334.322 23.767 - 6.087 5.860 335.684 - U 1.092 3,658.5592003-04 963.759 2,290.934 24.786 - 6.689 6.132 345.661 - U 0.953 3,638.9142004-05 921.560 2,393.024 22.983 - 6.561 6.144 346.999 - U 0.950 3,698.2212005-06 1,027.127 2,472.454 22.882 - 6.342 6.416 359.202 - U 0.867 3,895.2902006-07 1,062.475 2,543.166 23.180 - 7.269 6.673 374.623 - U 0.878 4,018.2642007-08 1,101.370 2,611.508 21.604 - 6.548 6.887 396.372 - U 1.027 4,145.3162008-09 1,218.258 2,707.278 17.414 - 6.587 1.411 419.573 - U 1.229 4,371.7502009-10 1,320.069 2,597.183 15.749 - 5.841 1.726 418.209 - U 1.074 4,359.8522010-11 1,349.467 2,651.368 17.027 - 5.787 1.172 406.171 - U 0.971 4,431.9632011-12 1,528.040 2,681.452 20.583 - 7.048 (4) 1.155 456.485 - U 1.296 4,696.0592012-13 1,536.120 2,490.490 17.386 - 13.894 1.146 507.305 - U 1.469 4,567.8102013-14 1,556.771 2,504.343 15.890 - 14.997 1.080 471.892 - U 1.129 4,566.1012014-15 1,864.388 2,571.926 15.219 (5) - 16.738 0.685 (6) 481.221 - U 1.082 4,951.2592015-16 1,851.694 2,616.703 17.053 - 19.701 - 512.609 (7) - U 0.780 5,018.5402016-17 1,556.268 2,609.530 20.131 (8) - 23.354 - 478.294 (8) - U 1.198 4,688.7752017-18 1,773.563 2,695.284 21.179 - 23.063 - 493.057 - U 1.518 5,007.6652018-19 1,679.079 2,698.707 20.566 - 21.985 - 619.609 - U - (9) 5,039.946
Notes: These data should be read in conjunction with the explanatory notes.
(1) Total expenditure incomplete from this period on, due to data for one or more components being unavailable.
(2) Expenditure estimated at 40.0% of turnover, from this period on.
(3) Expenditure estimated at 50.0% of turnover, from this period on.
(4) New keno licence commenced 14 April 2012, replacing previous club keno arrangements. New keno game rolled out into a much larger number of venues.
(5) Data are for turnover minus prizes won by players, from this period on.
(6) Intralot surrendered licence and ceased trading 31 January 2015.
(7) Expenditure estimated at 40.0% of turnover, except for the "Set for Life" lottery product estimated at 36.8% of turnover (introduced in 2015-16).
(8) Net sales (exclude agent commission), from this period on.
(9) Pools was withdrawn from the Australian Lottery Market on 23 June 2018.
NA = Not applicable
U = Unavailable data
KENO
Value ($ million)
CASINOGAMING
MACHINESINSTANT LOTTERY
INTERACTIVE GAMING (NA)
LOTTERIES LOTTO MINOR GAMING POOLS TOTAL GAMING
Australian Gambling Statistics, 1993–94 to 2018–19, 36th edition
89

TABLE VIC 21VICTORIA
REAL GAMING EXPENDITURE
1993-94 - 1,263.023 76.350 - 4.595 9.358 473.725 211.328 4.025 2,042.4031994-95 644.012 1,634.376 60.297 - 22.270 8.921 487.915 203.969 2.703 3,064.4631995-96 847.378 2,151.344 50.007 - 15.021 8.622 485.231 88.665 3.047 3,649.3151996-97 985.970 2,479.201 41.173 - 12.192 8.363 438.628 - U 2.263 3,967.791 (1)
1997-98 1,264.112 2,914.301 40.310 - 12.064 8.879 457.788 - U 2.119 4,699.5731998-99 1,214.798 3,288.692 40.076 - 12.112 9.125 474.688 - U 2.114 5,041.6041999-00 1,354.517 3,568.601 42.112 - 11.152 8.525 465.845 - U 1.810 5,452.5612000-01 1,466.163 3,668.008 35.627 - 10.629 8.133 469.672 - U 1.721 5,659.9522001-02 1,373.417 3,862.935 33.702 (2) - 9.945 8.359 (2) 460.102 (2) - U 1.536 (3) 5,749.9962002-03 1,392.235 3,414.694 34.767 - 8.904 8.572 491.045 - U 1.597 5,351.8152003-04 1,376.282 3,271.534 35.395 - 9.552 8.757 493.616 - U 1.361 5,196.4972004-05 1,285.452 3,337.947 32.058 - 9.152 8.570 484.017 - U 1.325 5,158.5212005-06 1,388.569 3,342.500 30.934 - 8.574 8.674 485.604 - U 1.172 5,266.0262006-07 1,395.033 3,339.186 30.435 - 9.544 8.762 491.881 - U 1.153 5,275.9952007-08 1,399.402 3,318.186 27.450 - 8.320 8.751 503.631 - U 1.305 5,267.0442008-09 1,501.115 3,335.858 21.457 - 8.116 1.739 516.990 - U 1.514 5,386.7892009-10 1,588.817 3,125.935 18.956 - 7.030 2.077 503.351 - U 1.293 5,247.4592010-11 1,575.990 3,096.429 19.885 - 6.758 1.369 474.351 - U 1.134 5,175.9162011-12 1,743.494 3,059.537 23.485 - 8.042 (4) 1.318 520.849 - U 1.479 5,358.2032012-13 1,713.307 2,777.761 19.391 - 15.497 1.278 565.821 - U 1.638 5,094.6932013-14 1,691.691 2,721.386 17.267 - 16.296 1.174 512.789 - U 1.226 4,961.8302014-15 1,991.823 2,747.722 16.259 (5) - 17.882 0.732 (6) 514.113 - U 1.156 5,289.6872015-16 1,950.861 2,756.840 17.966 - 20.756 - 540.062 (7) - U 0.821 5,287.3072016-17 1,611.345 2,701.882 20.843 (8) - 24.180 - 495.221 (8) - U 1.240 4,854.7122017-18 1,801.991 2,738.485 21.519 - 23.433 - 500.960 - U 1.543 5,087.9312018-19 1,679.079 2,698.707 20.566 - 21.985 - 619.609 - U - (9) 5,039.946
Notes: These data should be read in conjunction with the explanatory notes.
(1) Total expenditure incomplete from this period on, due to data for one or more components being unavailable.
(2) Expenditure estimated at 40.0% of turnover, from this period on.
(3) Expenditure estimated at 50.0% of turnover, from this period on.
(4) New keno licence commenced 14 April 2012, replacing previous club keno arrangements. New keno game rolled out into a much larger number of venues.
(5) Data are for turnover minus prizes won by players, from this period on.
(6) Intralot surrendered licence and ceased trading 31 January 2015.
(7) Expenditure estimated at 40.0% of turnover, except for the "Set for Life" lottery product estimated at 36.8% of turnover (introduced in 2015-16).
(8) Net sales (exclude agent commission), from this period on.
(9) Pools was withdrawn from the Australian Lottery Market on 23 June 2018.
NA = Not applicable
U = Unavailable data
KENO
Value ($ million)
CASINOGAMING
MACHINESINSTANT LOTTERY
INTERACTIVE GAMING (NA)
LOTTERIES LOTTO MINOR GAMING POOLS TOTAL GAMING
Australian Gambling Statistics, 1993–94 to 2018–19, 36th edition
90

TABLE VIC 22VICTORIA
PER CAPITA GAMING EXPENDITURE
1993-94 - 203.58 12.31 - 0.74 1.51 76.36 34.06 0.65 329.211994-95 106.56 270.42 9.98 - 3.68 1.48 80.73 33.75 0.45 507.041995-96 144.87 367.79 8.55 - 2.57 1.47 82.95 15.16 0.52 623.881996-97 169.09 425.16 7.06 - 2.09 1.43 75.22 - U 0.39 680.44 (1)
1997-98 214.59 494.72 6.84 - 2.05 1.51 77.71 - U 0.36 797.781998-99 206.37 558.69 6.81 - 2.06 1.55 80.64 - U 0.36 856.491999-00 232.62 612.85 7.23 - 1.92 1.46 80.00 - U 0.31 936.402000-01 263.33 658.80 6.40 - 1.91 1.46 84.36 - U 0.31 1,016.572001-02 250.12 703.49 6.14 (2) - 1.81 1.52 (2) 83.79 (2) - U 0.28 (3) 1,047.142002-03 257.61 631.83 6.43 - 1.65 1.59 90.86 - U 0.30 990.262003-04 257.24 611.48 6.62 - 1.79 1.64 92.26 - U 0.25 971.282004-05 242.47 629.63 6.05 - 1.73 1.62 91.30 - U 0.25 973.052005-06 265.92 640.12 5.92 - 1.64 1.66 93.00 - U 0.22 1,008.502006-07 269.97 646.21 5.89 - 1.85 1.70 95.19 - U 0.22 1,021.022007-08 273.91 649.48 5.37 - 1.63 1.71 98.58 - U 0.26 1,030.942008-09 295.84 657.43 4.23 - 1.60 0.34 101.89 - U 0.30 1,061.632009-10 313.66 617.12 3.74 - 1.39 0.41 99.37 - U 0.26 1,035.942010-11 315.20 619.30 3.98 - 1.35 0.27 94.87 - U 0.23 1,035.202011-12 350.43 614.95 4.72 - 1.62 (4) 0.26 104.69 - U 0.30 1,076.972012-13 344.84 559.08 3.90 - 3.12 0.26 113.88 - U 0.33 1,025.412013-14 341.98 550.14 3.49 - 3.29 0.24 103.66 - U 0.25 1,003.052014-15 400.78 552.88 3.27 (5) - 3.60 0.15 (6) 103.45 - U 0.23 1,064.362015-16 388.93 549.61 3.58 - 4.14 - 107.67 (7) - U 0.16 1,054.092016-17 318.88 534.69 4.12 (8) - 4.79 - 98.00 (8) - U 0.25 960.722017-18 354.70 539.04 4.24 - 4.61 - 98.61 - U 0.30 1,001.502018-19 328.07 527.29 4.02 - 4.30 - 121.06 - U - (9) 984.74
Notes: These data should be read in conjunction with the explanatory notes.
(1) Total expenditure incomplete from this period on, due to data for one or more components being unavailable.
(2) Expenditure estimated at 40.0% of turnover, from this period on.
(3) Expenditure estimated at 50.0% of turnover, from this period on.
(4) New keno licence commenced 14 April 2012, replacing previous club keno arrangements. New keno game rolled out into a much larger number of venues.
(5) Data are for turnover minus prizes won by players, from this period on.
(6) Intralot surrendered licence and ceased trading 31 January 2015.
(7) Expenditure estimated at 40.0% of turnover, except for the "Set for Life" lottery product estimated at 36.8% of turnover (introduced in 2015-16).
(8) Net sales (exclude agent commission), from this period on.
(9) Pools was withdrawn from the Australian Lottery Market on 23 June 2018.
NA = Not applicable
U = Unavailable data
KENO
Value ($)
CASINOGAMING
MACHINESINSTANT LOTTERY
INTERACTIVE GAMING (NA)
LOTTERIES LOTTO MINOR GAMING POOLS TOTAL GAMING
Australian Gambling Statistics, 1993–94 to 2018–19, 36th edition
91

TABLE VIC 23VICTORIA
REAL PER CAPITA GAMING EXPENDITURE
1993-94 - 378.32 22.87 - 1.38 2.80 141.90 63.30 1.21 611.771994-95 191.77 486.67 17.95 - 6.63 2.66 145.29 60.74 0.80 912.521995-96 250.06 634.87 14.76 - 4.43 2.54 143.19 26.17 0.90 1,076.921996-97 287.95 724.05 12.02 - 3.56 2.44 128.10 - 0.66 1,158.791997-98 365.44 842.50 11.65 - 3.49 2.57 132.34 - U 0.61 1,358.60 (1)
1998-99 347.31 940.22 11.46 - 3.46 2.61 135.71 - U 0.60 1,441.371999-00 382.45 1,007.59 11.89 - 3.15 2.41 131.53 - U 0.51 1,539.522000-01 408.24 1,021.32 9.92 - 2.96 2.26 130.78 - U 0.48 1,575.962001-02 376.99 1,060.34 9.25 (2) - 2.73 2.29 (2) 126.29 (2) - U 0.42 (3) 1,578.322002-03 376.83 924.25 9.41 - 2.41 2.32 132.91 - U 0.43 1,448.572003-04 367.35 873.22 9.45 - 2.55 2.34 131.75 - U 0.36 1,387.022004-05 338.22 878.25 8.43 - 2.41 2.25 127.35 - U 0.35 1,357.272005-06 359.50 865.38 8.01 - 2.22 2.25 125.72 - U 0.30 1,363.382006-07 354.47 848.47 7.73 - 2.43 2.23 124.98 - U 0.29 1,340.612007-08 348.03 825.24 6.83 - 2.07 2.18 125.25 - U 0.32 1,309.922008-09 364.53 810.08 5.21 - 1.97 0.42 125.55 - U 0.37 1,308.132009-10 377.52 742.75 4.50 - 1.67 0.49 119.60 - U 0.31 1,246.852010-11 368.11 723.25 4.64 - 1.58 0.32 110.80 - U 0.26 1,208.972011-12 399.84 701.66 5.39 - 1.84 (4) 0.30 119.45 - U 0.34 1,228.822012-13 384.61 623.57 4.35 - 3.48 0.29 127.02 - U 0.37 1,143.682013-14 371.62 597.82 3.79 - 3.58 0.26 112.65 - U 0.27 1,089.982014-15 428.18 590.67 3.50 (5) - 3.84 0.16 (6) 110.52 - U 0.25 1,137.112015-16 409.76 579.05 3.77 - 4.36 - 113.43 (7) - U 0.17 1,110.542016-17 330.16 553.61 4.27 (8) - 4.95 - 101.47 (8) - U 0.25 994.722017-18 360.39 547.68 4.30 - 4.69 - 100.19 - U 0.31 1,017.562018-19 328.07 527.29 4.02 - 4.30 - 121.06 - U - (9) 984.74
Notes: These data should be read in conjunction with the explanatory notes.
(1) Total expenditure incomplete from this period on, due to data for one or more components being unavailable.
(2) Expenditure estimated at 40.0% of turnover, from this period on.
(3) Expenditure estimated at 50.0% of turnover, from this period on.
(4) New keno licence commenced 14 April 2012, replacing previous club keno arrangements. New keno game rolled out into a much larger number of venues.
(5) Data are for turnover minus prizes won by players, from this period on.
(6) Intralot surrendered licence and ceased trading 31 January 2015.
(7) Expenditure estimated at 40.0% of turnover, except for the "Set for Life" lottery product estimated at 36.8% of turnover (introduced in 2015-16).
(8) Net sales (exclude agent commission), from this period on.
(9) Pools was withdrawn from the Australian Lottery Market on 23 June 2018.
NA = Not applicable
U = Unavailable data
KENO
Value ($)
CASINOGAMING
MACHINESINSTANT LOTTERY
INTERACTIVE GAMING (NA)
LOTTERIES LOTTO MINOR GAMING POOLS TOTAL GAMING
Australian Gambling Statistics, 1993–94 to 2018–19, 36th edition
92

TABLE VIC 24VICTORIA
GAMING EXPENDITUREAS A % OF HDI
1993-94 - 0.891 0.054 - 0.003 0.007 0.334 0.149 0.003 1.4411994-95 0.448 1.137 0.042 - 0.015 0.006 0.340 0.142 0.002 2.1331995-96 0.582 1.477 0.034 - 0.010 0.006 0.333 0.061 0.002 2.5051996-97 0.658 1.654 0.027 - 0.008 0.006 0.293 - U 0.002 2.647 (1)
1997-98 0.803 1.851 0.026 - 0.008 0.006 0.291 - U 0.001 2.9851998-99 0.741 2.007 0.024 - 0.007 0.006 0.290 - U 0.001 3.0771999-00 0.808 2.129 0.025 - 0.007 0.005 0.278 - U 0.001 3.2532000-01 0.848 2.122 0.021 - 0.006 0.005 0.272 - U 0.001 3.2742001-02 0.755 2.124 0.019 (2) - 0.005 0.005 (2) 0.253 (2) - U 0.001 (3) 3.1612002-03 0.757 1.857 0.019 - 0.005 0.005 0.267 - U 0.001 2.9112003-04 0.726 1.725 0.019 - 0.005 0.005 0.260 - U 0.001 2.7402004-05 0.651 1.691 0.016 - 0.005 0.004 0.245 - U 0.001 2.6132005-06 0.688 1.656 0.015 - 0.004 0.004 0.241 - U 0.001 2.6082006-07 0.660 1.579 0.014 - 0.005 0.004 0.233 - U 0.001 2.4952007-08 0.623 1.477 0.012 - 0.004 0.004 0.224 - U 0.001 2.3442008-09 0.634 1.408 0.009 - 0.003 0.001 0.218 - U 0.001 2.2742009-10 0.665 1.309 0.008 - 0.003 0.001 0.211 - U 0.001 2.1982010-11 0.637 1.251 0.008 - 0.003 0.001 0.192 - U 0.000 2.0922011-12 0.693 1.216 0.009 - 0.003 (4) 0.001 0.207 - U 0.001 2.1302012-13 0.668 1.083 0.008 - 0.006 0.000 0.221 - U 0.001 1.9862013-14 0.634 1.019 0.006 - 0.006 0.000 0.192 - U 0.000 1.8582014-15 0.747 1.030 0.006 (5) - 0.007 0.000 (6) 0.193 - U 0.000 1.9832015-16 0.732 1.035 0.007 - 0.008 - 0.203 (7) - U 0.000 1.9842016-17 0.590 0.990 0.008 (8) - 0.009 - 0.181 (8) - U 0.000 1.7782017-18 0.648 0.985 0.008 - 0.008 - 0.180 - U 0.001 1.8302018-19 0.594 0.955 0.007 - 0.008 - 0.219 - U - (9) 1.784
Notes: These data should be read in conjunction with the explanatory notes.
(1) Total expenditure incomplete from this period on, due to data for one or more components being unavailable.
(2) Expenditure estimated at 40.0% of turnover, from this period on.
(3) Expenditure estimated at 50.0% of turnover, from this period on.
(4) New keno licence commenced 14 April 2012, replacing previous club keno arrangements. New keno game rolled out into a much larger number of venues.
(5) Data are for turnover minus prizes won by players, from this period on.
(6) Intralot surrendered licence and ceased trading 31 January 2015.
(7) Expenditure estimated at 40.0% of turnover, except for the "Set for Life" lottery product estimated at 36.8% of turnover (introduced in 2015-16).
(8) Net sales (exclude agent commission), from this period on.
(9) Pools was withdrawn from the Australian Lottery Market on 23 June 2018.
NA = Not applicable
U = Unavailable data
Percentage (%)
CASINOGAMING
MACHINESINSTANT LOTTERY
TOTAL GAMINGINTERACTIVE GAMING (NA)
KENO LOTTERIES LOTTO MINOR GAMING POOLS
Australian Gambling Statistics, 1993–94 to 2018–19, 36th edition
93

TABLE VIC 25VICTORIA
GAMING EXPENDITURESHARE OF MARKET
1993-94 - 61.84 3.74 - 0.22 0.46 23.19 10.35 0.201994-95 21.02 53.33 1.97 - 0.73 0.29 15.92 6.66 0.091995-96 23.22 58.95 1.37 - 0.41 0.24 13.30 2.43 0.081996-97 24.85 62.48 1.04 - 0.31 0.21 11.05 - U 0.061997-98 26.90 62.01 0.86 - 0.26 0.19 9.74 - U 0.051998-99 24.10 65.23 0.79 - 0.24 0.18 9.42 - U 0.041999-00 24.84 65.45 0.77 - 0.20 0.16 8.54 - U 0.032000-01 25.90 64.81 0.63 - 0.19 0.14 8.30 - U 0.032001-02 23.89 67.18 0.59 (1) - 0.17 0.15 (1) 8.00 (1) - U 0.03 (2)
2002-03 26.01 63.80 0.65 - 0.17 0.16 9.18 - U 0.032003-04 26.48 62.96 0.68 - 0.18 0.17 9.50 - U 0.032004-05 24.92 64.71 0.62 - 0.18 0.17 9.38 - U 0.032005-06 26.37 63.47 0.59 - 0.16 0.16 9.22 - U 0.022006-07 26.44 63.29 0.58 - 0.18 0.17 9.32 - U 0.022007-08 26.57 63.00 0.52 - 0.16 0.17 9.56 - U 0.022008-09 27.87 61.93 0.40 - 0.15 0.03 9.60 - U 0.032009-10 30.28 59.57 0.36 - 0.13 0.04 9.59 - U 0.022010-11 30.45 59.82 0.38 - 0.13 0.03 9.16 - U 0.022011-12 32.54 57.10 0.44 - 0.15 (3) 0.02 9.72 - U 0.032012-13 33.63 54.52 0.38 - 0.30 0.03 11.11 - U 0.032013-14 34.09 54.85 0.35 - 0.33 0.02 10.33 - U 0.022014-15 37.65 51.94 0.31 (4) - 0.34 0.01 (5) 9.72 - U 0.022015-16 36.90 52.14 0.34 - 0.39 - 10.21 (6) - U 0.022016-17 33.19 55.65 0.43 (7) - 0.50 - 10.20 (7) - U 0.032017-18 35.42 53.82 0.42 - 0.46 - 9.85 - U 0.032018-19 33.32 53.55 0.41 - 0.44 - 12.29 - U - (8)
Notes: These data should be read in conjunction with the explanatory notes.
(1) Expenditure estimated at 40.0% of turnover, from this period on.
(2) Expenditure estimated at 50.0% of turnover, from this period on.
(3) New keno licence commenced 14 April 2012, replacing previous club keno arrangements. New keno game rolled out into a much larger number of venues.
(4) Data are for turnover minus prizes won by players, from this period on.
(5) Intralot surrendered licence and ceased trading 31 January 2015.
(6) Expenditure estimated at 40.0% of turnover, except for the "Set for Life" lottery product estimated at 36.8% of turnover (introduced in 2015-16).
(7) Net sales (exclude agent commission), from this period on.
(8) Pools was withdrawn from the Australian Lottery Market on 23 June 2018.
NA = Not applicable
U = Unavailable data
POOLS
Percentage (%)
CASINOGAMING
MACHINESINSTANT LOTTERY
INTERACTIVE GAMING (NA)
KENO LOTTERIES LOTTO MINOR GAMING
Australian Gambling Statistics, 1993–94 to 2018–19, 36th edition
94

TABLE VIC 26VICTORIA
GOVERNMENT REVENUE FROM GAMING
1993-94 - 263.190 - 290.329 8.407 561.9261994-95 67.766 391.611 - 296.621 7.030 763.0281995-96 110.400 513.846 - 297.900 6.874 929.0201996-97 128.164 629.010 - 274.417 4.141 1,035.7321997-98 174.584 706.726 - 285.874 1.058 1,168.2421998-99 155.411 822.790 - 293.820 0.334 1,272.3551999-00 155.114 935.353 - 291.087 0.372 1,381.9262000-01 105.860 802.990 - 272.804 0.390 1,182.0442001-02 99.732 904.626 - 265.819 0.361 1,270.5382002-03 98.995 827.679 - 294.982 0.406 1,222.0622003-04 98.787 811.516 - 304.969 0.391 1,215.6632004-05 107.129 842.459 - 303.824 0.415 1,253.8272005-06 113.686 911.124 - 297.679 1.138 1,323.6272006-07 118.046 933.075 - 311.733 1.185 1,364.0392007-08 121.310 992.861 - 328.570 1.305 1,444.0462008-09 136.364 1,021.162 - 342.835 1.295 1,501.6562009-10 149.456 985.336 - 340.180 1.184 1,476.1562010-11 165.659 1,002.127 - 329.515 - U 1,497.301 (1)
2011-12 195.302 1,013.627 - 370.351 - U 1,579.2802012-13 201.280 886.749 - 406.729 - U 1,494.7582013-14 207.677 874.160 - 378.098 - U 1,459.9352014-15 205.440 965.638 - 390.579 - U 1,561.6572015-16 218.640 988.836 - 423.423 - U 1,630.8992016-17 207.683 982.718 - 396.439 (2) - U 1,586.8392017-18 216.869 1,028.806 - 409.177 - U 1,654.8522018-19 215.157 1,028.643 - 508.299 (3) - U 1,752.099
Notes: These data should be read in conjunction with the explanatory notes.
Data for the gambling revenue received by states and territories from 1 July 2000 onwards are not comparable with that of preceding years because of
the impact of changes brought about by the introduction of the GST.
(1) Total gaming figure incomplete due to data for one or more components being unavailable, from this period on.
(2) Net sales (exclude agent commission), from this period on.
(3) Pools was withdrawn from the Australian Lottery Market on 23 June 2018.
NA = Not applicable
U = Unavailable data
TOTAL GAMING
Value ($ million)
CASINO GAMINGGAMING
MACHINES & KENO
INTERACTIVE GAMING (NA)
LOTTERIES & POOLS LOTTO
MINOR GAMING
Australian Gambling Statistics, 1993–94 to 2018–19, 36th edition
95
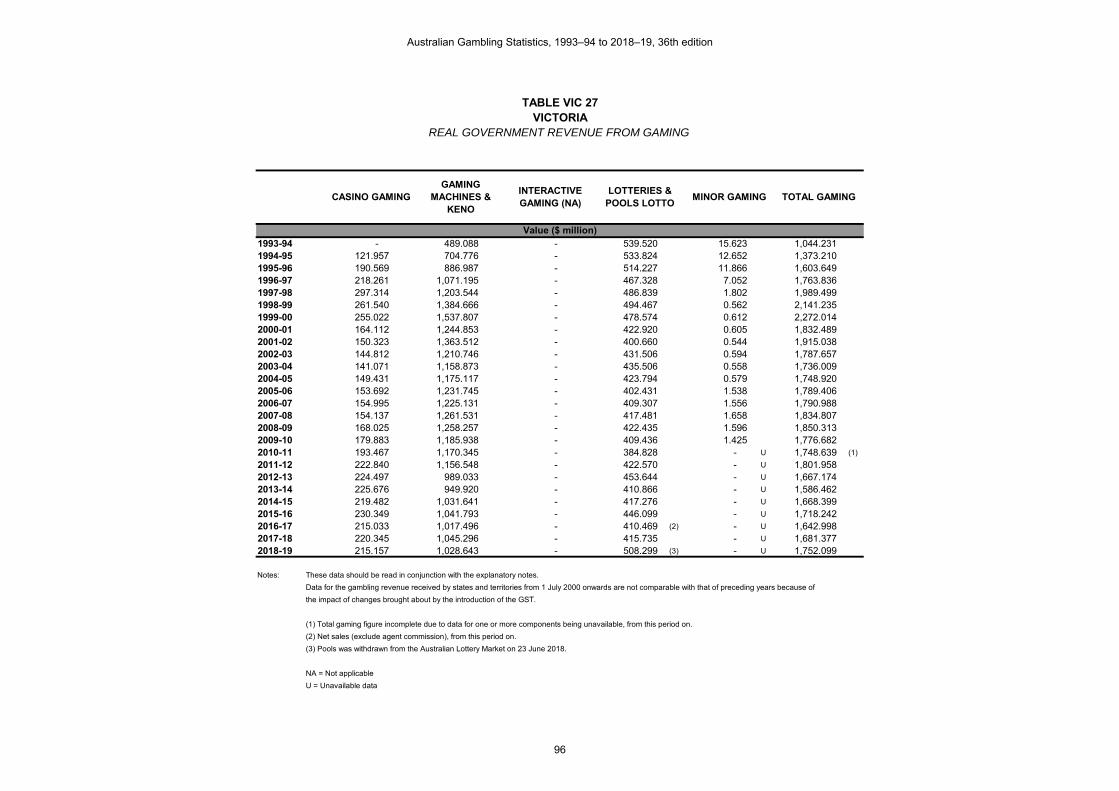
TABLE VIC 27VICTORIA
REAL GOVERNMENT REVENUE FROM GAMING
1993-94 - 489.088 - 539.520 15.623 1,044.2311994-95 121.957 704.776 - 533.824 12.652 1,373.2101995-96 190.569 886.987 - 514.227 11.866 1,603.6491996-97 218.261 1,071.195 - 467.328 7.052 1,763.8361997-98 297.314 1,203.544 - 486.839 1.802 1,989.4991998-99 261.540 1,384.666 - 494.467 0.562 2,141.2351999-00 255.022 1,537.807 - 478.574 0.612 2,272.0142000-01 164.112 1,244.853 - 422.920 0.605 1,832.4892001-02 150.323 1,363.512 - 400.660 0.544 1,915.0382002-03 144.812 1,210.746 - 431.506 0.594 1,787.6572003-04 141.071 1,158.873 - 435.506 0.558 1,736.0092004-05 149.431 1,175.117 - 423.794 0.579 1,748.9202005-06 153.692 1,231.745 - 402.431 1.538 1,789.4062006-07 154.995 1,225.131 - 409.307 1.556 1,790.9882007-08 154.137 1,261.531 - 417.481 1.658 1,834.8072008-09 168.025 1,258.257 - 422.435 1.596 1,850.3132009-10 179.883 1,185.938 - 409.436 1.425 1,776.6822010-11 193.467 1,170.345 - 384.828 - U 1,748.639 (1)
2011-12 222.840 1,156.548 - 422.570 - U 1,801.9582012-13 224.497 989.033 - 453.644 - U 1,667.1742013-14 225.676 949.920 - 410.866 - U 1,586.4622014-15 219.482 1,031.641 - 417.276 - U 1,668.3992015-16 230.349 1,041.793 - 446.099 - U 1,718.2422016-17 215.033 1,017.496 - 410.469 (2) - U 1,642.9982017-18 220.345 1,045.296 - 415.735 - U 1,681.3772018-19 215.157 1,028.643 - 508.299 (3) - U 1,752.099
Notes: These data should be read in conjunction with the explanatory notes.
Data for the gambling revenue received by states and territories from 1 July 2000 onwards are not comparable with that of preceding years because of
the impact of changes brought about by the introduction of the GST.
(1) Total gaming figure incomplete due to data for one or more components being unavailable, from this period on.
(2) Net sales (exclude agent commission), from this period on.
(3) Pools was withdrawn from the Australian Lottery Market on 23 June 2018.
NA = Not applicable
U = Unavailable data
TOTAL GAMING
Value ($ million)
CASINO GAMINGGAMING
MACHINES & KENO
INTERACTIVE GAMING (NA)
LOTTERIES & POOLS LOTTO
MINOR GAMING
Australian Gambling Statistics, 1993–94 to 2018–19, 36th edition
96
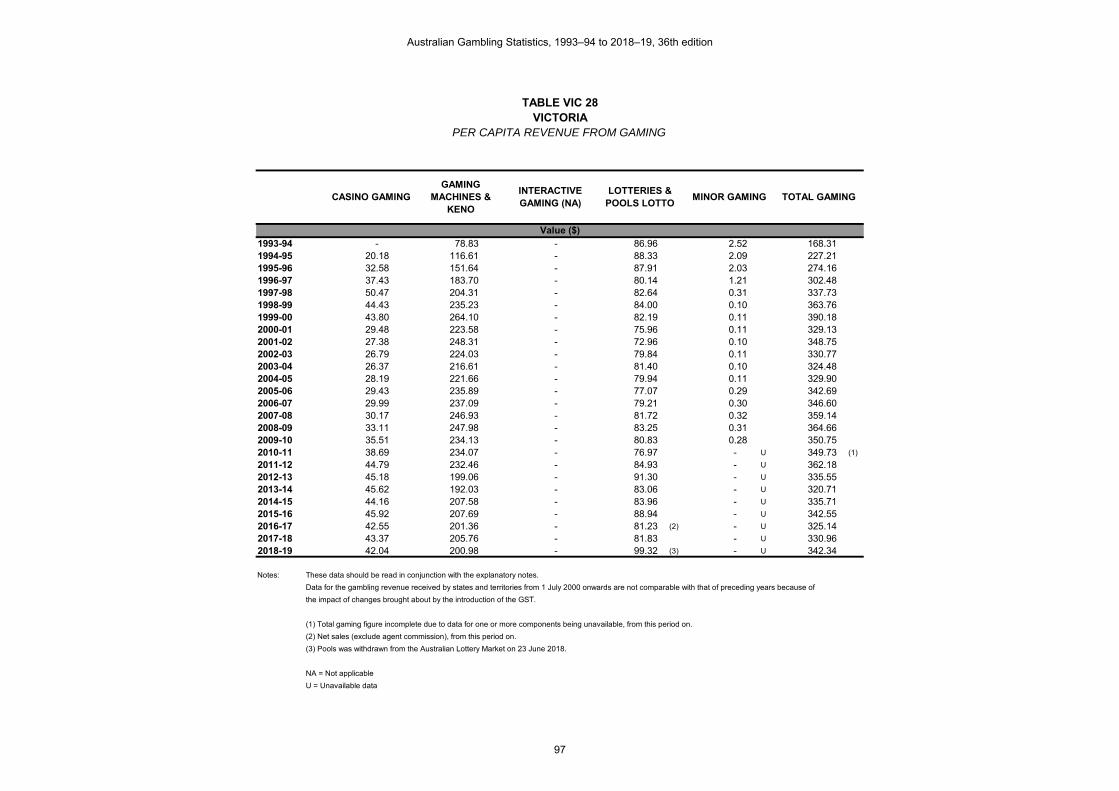
TABLE VIC 28VICTORIA
PER CAPITA REVENUE FROM GAMING
1993-94 - 78.83 - 86.96 2.52 168.311994-95 20.18 116.61 - 88.33 2.09 227.211995-96 32.58 151.64 - 87.91 2.03 274.161996-97 37.43 183.70 - 80.14 1.21 302.481997-98 50.47 204.31 - 82.64 0.31 337.731998-99 44.43 235.23 - 84.00 0.10 363.761999-00 43.80 264.10 - 82.19 0.11 390.182000-01 29.48 223.58 - 75.96 0.11 329.132001-02 27.38 248.31 - 72.96 0.10 348.752002-03 26.79 224.03 - 79.84 0.11 330.772003-04 26.37 216.61 - 81.40 0.10 324.482004-05 28.19 221.66 - 79.94 0.11 329.902005-06 29.43 235.89 - 77.07 0.29 342.692006-07 29.99 237.09 - 79.21 0.30 346.602007-08 30.17 246.93 - 81.72 0.32 359.142008-09 33.11 247.98 - 83.25 0.31 364.662009-10 35.51 234.13 - 80.83 0.28 350.752010-11 38.69 234.07 - 76.97 - U 349.73 (1)
2011-12 44.79 232.46 - 84.93 - U 362.182012-13 45.18 199.06 - 91.30 - U 335.552013-14 45.62 192.03 - 83.06 - U 320.712014-15 44.16 207.58 - 83.96 - U 335.712015-16 45.92 207.69 - 88.94 - U 342.552016-17 42.55 201.36 - 81.23 (2) - U 325.142017-18 43.37 205.76 - 81.83 - U 330.962018-19 42.04 200.98 - 99.32 (3) - U 342.34
Notes: These data should be read in conjunction with the explanatory notes.
Data for the gambling revenue received by states and territories from 1 July 2000 onwards are not comparable with that of preceding years because of
the impact of changes brought about by the introduction of the GST.
(1) Total gaming figure incomplete due to data for one or more components being unavailable, from this period on.
(2) Net sales (exclude agent commission), from this period on.
(3) Pools was withdrawn from the Australian Lottery Market on 23 June 2018.
NA = Not applicable
U = Unavailable data
TOTAL GAMING
Value ($)
CASINO GAMINGGAMING
MACHINES & KENO
INTERACTIVE GAMING (NA)
LOTTERIES & POOLS LOTTO
MINOR GAMING
Australian Gambling Statistics, 1993–94 to 2018–19, 36th edition
97

TABLE VIC 29VICTORIA
REAL PER CAPITA REVENUE FROM GAMING
1993-94 - 146.50 - 161.60 4.68 312.781994-95 36.32 209.86 - 158.96 3.77 408.911995-96 56.24 261.75 - 151.75 3.50 473.241996-97 63.74 312.84 - 136.48 2.06 515.131997-98 85.95 347.93 - 140.74 0.52 575.151998-99 74.77 395.87 - 141.37 0.16 612.171999-00 72.01 434.20 - 135.12 0.17 641.502000-01 45.70 346.62 - 117.76 0.17 510.242001-02 41.26 374.27 - 109.98 0.15 525.662002-03 39.20 327.71 - 116.80 0.16 483.862003-04 37.65 309.32 - 116.24 0.15 463.372004-05 39.32 309.19 - 111.51 0.15 460.162005-06 39.79 318.90 - 104.19 0.40 463.282006-07 39.38 311.30 - 104.00 0.40 455.082007-08 38.33 313.74 - 103.83 0.41 456.322008-09 40.80 305.55 - 102.58 0.39 449.332009-10 42.74 281.79 - 97.29 0.34 422.162010-11 45.19 273.36 - 89.89 - U 408.44 (1)
2011-12 51.10 265.24 - 96.91 - U 413.252012-13 50.40 222.02 - 101.84 - U 374.262013-14 49.57 208.67 - 90.26 - U 348.502014-15 47.18 221.77 - 89.70 - U 358.652015-16 48.38 218.82 - 93.70 - U 360.902016-17 44.06 208.48 - 84.10 (2) - U 336.652017-18 44.07 209.05 - 83.14 - U 336.272018-19 42.04 200.98 - 99.32 (3) - U 342.34
Notes: These data should be read in conjunction with the explanatory notes.
Data for the gambling revenue received by states and territories from 1 July 2000 onwards are not comparable with that of preceding years because of
the impact of changes brought about by the introduction of the GST.
(1) Total gaming figure incomplete due to data for one or more components being unavailable, from this period on.
(2) Net sales (exclude agent commission), from this period on.
(3) Pools was withdrawn from the Australian Lottery Market on 23 June 2018.
NA = Not applicable
U = Unavailable data
TOTAL GAMING
Value ($)
CASINO GAMINGGAMING
MACHINES & KENO
INTERACTIVE GAMING (NA)
LOTTERIES & POOLS LOTTO
MINOR GAMING
Australian Gambling Statistics, 1993–94 to 2018–19, 36th edition
98

TABLE VIC 30VICTORIA
GOVERNMENT REVENUE FROM GAMINGAS A % OF TOTAL GAMBLING REVENUE
1993-94 - 35.35 - 38.99 1.13 75.471994-95 7.49 43.26 - 32.77 0.78 84.301995-96 10.50 48.88 - 28.34 0.65 88.371996-97 11.07 54.35 - 23.71 0.36 89.501997-98 13.47 54.52 - 22.05 0.08 90.121998-99 11.04 58.44 - 20.87 0.02 90.371999-00 10.20 61.53 - 19.15 0.02 90.912000-01 8.29 62.91 - 21.37 0.03 92.612001-02 7.28 66.03 - 19.40 0.03 92.742002-03 7.47 62.43 - 22.25 0.03 92.182003-04 7.46 61.28 - 23.03 0.03 91.802004-05 7.83 61.54 - 22.19 0.03 91.592005-06 7.89 63.26 - 20.67 0.08 91.902006-07 7.94 62.77 - 20.97 0.08 91.762007-08 7.74 63.31 - 20.95 0.08 92.082008-09 8.36 62.59 - 21.01 0.08 92.042009-10 9.28 61.20 - 21.13 0.07 91.692010-11 10.17 61.52 - 20.23 - U 91.92 (1)
2011-12 11.42 59.26 - 21.65 - U 92.332012-13 12.92 56.94 - 26.12 - U 95.982013-14 13.74 57.81 - 25.01 - U 96.562014-15 12.73 59.82 - 24.19 - U 96.742015-16 13.01 58.83 - 25.19 - U 97.032016-17 12.69 60.06 - 24.23 (2) - U 96.992017-18 12.73 60.37 - 24.01 - U 97.102018-19 12.10 57.85 - 28.59 (3) - U 98.54
Notes: These data should be read in conjunction with the explanatory notes.
Data for the gambling revenue received by states and territories from 1 July 2000 onwards are not comparable with that of preceding years because of
the impact of changes brought about by the introduction of the GST.
(1) Total gaming figure incomplete due to data for one or more components being unavailable, from this period on.
(2) Net sales (exclude agent commission), from this period on.
(3) Pools was withdrawn from the Australian Lottery Market on 23 June 2018.
NA = Not applicable
U = Unavailable data
Percentage (%)
TOTAL GAMINGCASINO GAMINGGAMING
MACHINES & KENO
INTERACTIVE GAMING (NA)
LOTTERIES & POOLS LOTTO
MINOR GAMING
Australian Gambling Statistics, 1993–94 to 2018–19, 36th edition
99

TABLE VIC 31VICTORIA
TOTAL SPORTSBETTING TURNOVER
1994-95 3.349 - 12.823 6.795 22.9671995-96 1.735 - 17.455 9.104 28.2941996-97 1.259 - 19.848 7.537 28.6441997-98 1.312 - 33.149 9.010 43.4711998-99 5.113 - 37.900 9.381 52.3941999-00 9.660 - 45.954 12.142 67.7562000-01 55.921 0.744 49.534 10.796 116.9952001-02 99.149 1.568 80.630 12.363 193.7102002-03 116.771 1.627 78.837 11.828 209.0632003-04 117.193 1.858 78.926 12.813 210.7902004-05 51.465 2.566 113.166 13.250 180.4472005-06 91.932 2.589 147.233 13.571 255.3252006-07 108.406 2.488 184.983 10.770 306.6472007-08 47.580 1.035 (1) 275.162 11.940 335.7172008-09 93.450 - 341.858 11.081 446.3892009-10 72.370 - 654.311 10.952 737.6332010-11 - U - 861.854 10.131 871.985 (2)
2011-12 - U - 1,024.402 9.323 1,033.7252012-13 - U - 1,138.195 8.696 1,146.8912013-14 - U - 1,367.457 7.932 1,375.3902014-15 - U - 1,660.810 6.509 1,667.3192015-16 - U - 1,907.190 6.229 1,913.4192016-17 - U - 2,202.010 6.217 2,208.2272017-18 - U - 2,470.632 5.648 2,476.2802018-19 - U - 1,392.343 (3) 2.364 (3) 1,394.706
Notes: These data should be read in conjunction with the explanatory notes.
(1) Tipstar ceased operations in 2007.
(2) Total sportsbetting turnover incomplete due to data for one or more components being unavailable, from this period on.
(3) Point of consumption tax (POCT) introduced and applied from 1 Jan 2019. This figure only contains data from July 2018 to December 2018, pre-POCT.
U = Unavailable data
TOTAL SPORTSBETTING
Value ($ million)
BOOKMAKER (AND OTHER) FIXED ODDS
BOOKMAKER (AND OTHER)
POOL BETTINGTAB FIXED ODDS TAB TOTE ODDS
Australian Gambling Statistics, 1993–94 to 2018–19, 36th edition
100

TABLE VIC 32VICTORIA
REAL SPORTSBETTING TURNOVER
1994-95 6.027 - 23.077 12.229 41.3331995-96 2.995 - 30.130 15.715 48.8401996-97 2.144 - 33.801 12.835 48.7801997-98 2.234 - 56.452 15.344 74.0301998-99 8.605 - 63.782 15.787 88.1731999-00 15.882 - 75.553 19.963 111.3972000-01 86.693 1.153 76.791 16.737 181.3742001-02 149.444 2.363 121.531 18.634 291.9722002-03 170.815 2.380 115.324 17.302 305.8222003-04 167.356 2.653 112.709 18.297 301.0162004-05 71.787 3.579 157.851 18.482 251.6992005-06 124.282 3.500 199.044 18.347 345.1732006-07 142.337 3.267 242.883 14.141 402.6292007-08 60.455 1.315 (1) 349.621 15.171 426.5622008-09 115.147 - 421.231 13.654 550.0322009-10 87.104 - 787.520 13.181 887.8052010-11 - U - 1,006.526 11.832 1,018.357 (2)
2011-12 - U - 1,168.843 10.638 1,179.4802012-13 - U - 1,269.482 9.699 1,279.1812013-14 - U - 1,485.970 8.620 1,494.5902014-15 - U - 1,774.330 6.954 1,781.2842015-16 - U - 2,009.329 6.563 2,015.8922016-17 - U - 2,279.940 6.437 2,286.3772017-18 - U - 2,510.232 5.738 2,515.9712018-19 - U - 1,392.343 (3) 2.364 (3) 1,394.706
Notes: These data should be read in conjunction with the explanatory notes.
(1) Tipstar ceased operations in 2007.
(2) Total sportsbetting turnover incomplete due to data for one or more components being unavailable, from this period on.
(3) Point of consumption tax (POCT) introduced and applied from 1 Jan 2019. This figure only contains data from July 2018 to December 2018, pre-POCT.
U = Unavailable data
TOTAL SPORTSBETTING
Value ($ million)
BOOKMAKER (AND OTHER) FIXED ODDS
BOOKMAKER (AND OTHER)
POOL BETTINGTAB FIXED ODDS TAB TOTE ODDS
Australian Gambling Statistics, 1993–94 to 2018–19, 36th edition
101

TABLE VIC 33VICTORIA
PER CAPITA SPORTSBETTING TURNOVER
1994-95 1.00 - 3.82 2.02 6.841995-96 0.51 - 5.15 2.69 8.351996-97 0.37 - 5.80 2.20 8.371997-98 0.38 - 9.58 2.60 12.571998-99 1.46 - 10.84 2.68 14.981999-00 2.73 - 12.98 3.43 19.132000-01 15.57 0.21 13.79 3.01 32.582001-02 27.22 0.43 22.13 3.39 53.172002-03 31.61 0.44 21.34 3.20 56.592003-04 31.28 0.50 21.07 3.42 56.262004-05 13.54 0.68 29.78 3.49 47.482005-06 23.80 0.67 38.12 3.51 66.102006-07 27.55 0.63 47.00 2.74 77.922007-08 11.83 0.26 (1) 68.43 2.97 83.492008-09 22.69 - 83.02 2.69 108.402009-10 17.20 - 155.47 2.60 175.272010-11 - U - 201.31 2.37 203.67 (2)
2011-12 - U - 234.93 2.14 237.072012-13 - U - 255.51 1.95 257.462013-14 - U - 300.39 1.74 302.142014-15 - U - 357.02 1.40 358.422015-16 - U - 400.59 1.31 401.892016-17 - U - 451.19 1.27 452.462017-18 - U - 494.11 1.13 495.242018-19 - U - 272.05 (3) 0.46 (3) 272.51
Notes: These data should be read in conjunction with the explanatory notes.
(1) Tipstar ceased operations in 2007.
(2) Total sportsbetting turnover incomplete due to data for one or more components being unavailable, from this period on.
(3) Point of consumption tax (POCT) introduced and applied from 1 Jan 2019. This figure only contains data from July 2018 to December 2018, pre-POCT.
U = Unavailable data
TOTAL SPORTSBETTING
Value ($)
BOOKMAKER (AND OTHER) FIXED ODDS
BOOKMAKER (AND OTHER)
POOL BETTINGTAB FIXED ODDS TAB TOTE ODDS
Australian Gambling Statistics, 1993–94 to 2018–19, 36th edition
102

TABLE VIC 34VICTORIA
REAL PER CAPITA SPORTSBETTING TURNOVER
1994-95 1.79 - 6.87 3.64 12.311995-96 0.88 - 8.89 4.64 14.411996-97 0.63 - 9.87 3.75 14.251997-98 0.65 - 16.32 4.44 21.401998-99 2.46 - 18.23 4.51 25.211999-00 4.48 - 21.33 5.64 31.452000-01 24.14 0.32 21.38 4.66 50.502001-02 41.02 0.65 33.36 5.11 80.142002-03 46.23 0.64 31.21 4.68 82.782003-04 44.67 0.71 30.08 4.88 80.352004-05 18.89 0.94 41.53 4.86 66.232005-06 32.18 0.91 51.53 4.75 89.372006-07 36.17 0.83 61.72 3.59 102.312007-08 15.04 0.33 (1) 86.95 3.77 106.092008-09 27.96 - 102.29 3.32 133.572009-10 20.70 - 187.12 3.13 210.952010-11 - U - 235.10 2.76 237.86 (2)
2011-12 - U - 268.06 2.44 270.502012-13 - U - 284.98 2.18 287.162013-14 - U - 326.43 1.89 328.322014-15 - U - 381.42 1.49 382.922015-16 - U - 422.04 1.38 423.422016-17 - U - 467.15 1.32 468.472017-18 - U - 502.03 1.15 503.182018-19 - U - 272.05 (3) 0.46 (3) 272.51
Notes: These data should be read in conjunction with the explanatory notes.
(1) Tipstar ceased operations in 2007.
(2) Total sportsbetting turnover incomplete due to data for one or more components being unavailable, from this period on.
(3) Point of consumption tax (POCT) introduced and applied from 1 Jan 2019. This figure only contains data from July 2018 to December 2018, pre-POCT.
U = Unavailable data
TOTAL SPORTSBETTING
Value ($)
BOOKMAKER (AND OTHER) FIXED ODDS
BOOKMAKER (AND OTHER)
POOL BETTINGTAB FIXED ODDS TAB TOTE ODDS
Australian Gambling Statistics, 1993–94 to 2018–19, 36th edition
103

TABLE VIC 35VICTORIA
TOTAL SPORTSBETTING EXPENDITURE
1994-95 0.201 - 1.010 1.046 2.2571995-96 0.521 - 1.746 1.457 3.7241996-97 0.378 - 1.985 1.206 3.5691997-98 0.060 - 4.664 1.442 6.1661998-99 0.444 - 4.268 1.501 6.2131999-00 1.108 - 4.609 1.943 7.6602000-01 6.470 0.297 5.764 2.171 14.7022001-02 10.664 0.627 (1) 10.808 (2) 2.483 24.5822002-03 13.282 0.387 9.838 2.328 (3) 25.8352003-04 19.857 0.431 13.125 2.782 36.1952004-05 4.935 0.501 15.569 3.032 24.0372005-06 4.644 0.442 21.121 3.111 29.3182006-07 6.017 0.417 27.117 2.467 36.0182007-08 3.024 0.171 (4) 33.825 2.750 39.7702008-09 5.215 - 40.274 2.559 48.0482009-10 4.038 (5) - 77.001 2.129 83.1682010-11 - U - 90.997 2.389 93.386 (6)
2011-12 - U - 126.244 2.194 128.4382012-13 - U - 158.107 1.974 160.0812013-14 - U - 211.684 1.817 213.5012014-15 - U - 258.258 1.488 259.7462015-16 - U - 279.526 1.419 280.9452016-17 - U - 326.071 1.420 327.4912017-18 - U - 370.402 1.297 371.6992018-19 - U - 198.064 (7) 0.537 (7) 198.602
Notes: These data should be read in conjunction with the explanatory notes.
(1) Expenditure estimated by applying retention rates of 10% or 40% as applicable. Applies solely to the pool
betting competition, Tipstar, and does not in any way relate to bookmakers.
(2) Expenditure estimated by subtracting payouts from current sales on decided events, from this period on.
(3) Expenditure for TAB tote odds was estimated using actual data. In preceding years a retention factor was used.
(4) Tipstar ceased operations in 2007.
(5) Expenditure estimated at 5.58% of turnover.
(6) Total sportsbetting figure incomplete due to data for one or more components being unavailable, from this period on.
(7) Point of consumption tax (POCT) introduced and applied from 1 Jan 2019. This figure only contains data from July 2018 to December 2018, pre-POCT.
U = Unavailable data
TOTAL SPORTSBETTING
Value ($ million)
BOOKMAKER (AND OTHER) FIXED ODDS
BOOKMAKER (AND OTHER)
POOL BETTINGTAB FIXED ODDS TAB TOTE ODDS
Australian Gambling Statistics, 1993–94 to 2018–19, 36th edition
104

TABLE VIC 36VICTORIA
REAL SPORTSBETTING EXPENDITURE
1994-95 0.362 - 1.818 1.882 4.0621995-96 0.899 - 3.014 2.515 6.4281996-97 0.644 - 3.380 2.054 6.0781997-98 0.102 - 7.943 2.456 10.5011998-99 0.747 - 7.183 2.526 10.4561999-00 1.822 - 7.578 3.194 12.5942000-01 10.030 0.460 8.936 3.366 22.7922001-02 16.073 0.945 (1) 16.291 (2) 3.743 37.0522002-03 19.429 0.566 14.391 3.405 (3) 37.7922003-04 28.356 0.615 18.743 3.973 51.6882004-05 6.884 0.699 21.717 4.229 33.5282005-06 6.278 0.598 28.553 4.206 39.6352006-07 7.900 0.548 35.605 3.239 47.2922007-08 3.842 0.217 (4) 42.978 3.494 50.5322008-09 6.425 - 49.625 3.153 59.2032009-10 4.860 (5) - 92.677 2.562 100.1002010-11 - U - 106.272 2.790 109.062 (6)
2011-12 - U - 144.044 2.503 146.5482012-13 - U - 176.344 2.202 178.5462013-14 - U - 230.030 1.974 232.0042014-15 - U - 275.910 1.590 277.5002015-16 - U - 294.496 1.495 295.9912016-17 - U - 337.611 1.470 339.0812017-18 - U - 376.339 1.318 377.6572018-19 - U - 198.064 (7) 0.537 (7) 198.602
Notes: These data should be read in conjunction with the explanatory notes.
(1) Expenditure estimated by applying retention rates of 10% or 40% as applicable. Applies solely to the pool
betting competition, Tipstar, and does not in any way relate to bookmakers.
(2) Expenditure estimated by subtracting payouts from current sales on decided events, from this period on.
(3) Expenditure for TAB tote odds was estimated using actual data. In preceding years a retention factor was used.
(4) Tipstar ceased operations in 2007.
(5) Expenditure estimated at 5.58% of turnover.
(6) Total sportsbetting figure incomplete due to data for one or more components being unavailable, from this period on.
(7) Point of consumption tax (POCT) introduced and applied from 1 Jan 2019. This figure only contains data from July 2018 to December 2018, pre-POCT.
U = Unavailable data
TOTAL SPORTSBETTING
Value ($ million)
BOOKMAKER (AND OTHER) FIXED ODDS
BOOKMAKER (AND OTHER)
POOL BETTINGTAB FIXED ODDS TAB TOTE ODDS
Australian Gambling Statistics, 1993–94 to 2018–19, 36th edition
105

TABLE VIC 37VICTORIA
PER CAPITA SPORTSBETTING EXPENDITURE
1994-95 0.06 - 0.30 0.31 0.671995-96 0.15 - 0.52 0.43 1.101996-97 0.11 - 0.58 0.35 1.041997-98 0.02 - 1.35 0.42 1.781998-99 0.13 - 1.22 0.43 1.781999-00 0.31 - 1.30 0.55 2.162000-01 1.80 0.08 1.60 0.60 4.092001-02 2.93 0.17 (1) 2.97 (2) 0.68 6.752002-03 3.60 0.10 2.66 0.63 (3) 6.992003-04 5.30 0.12 3.50 0.74 9.662004-05 1.30 0.13 4.10 0.80 6.322005-06 1.20 0.11 5.47 0.81 7.592006-07 1.53 0.11 6.89 0.63 9.152007-08 0.75 0.04 (4) 8.41 0.68 9.892008-09 1.27 - 9.78 0.62 11.672009-10 0.96 (5) - 18.30 0.51 19.762010-11 - U - 21.25 0.56 21.81 (6)
2011-12 - U - 28.95 0.50 29.462012-13 - U - 35.49 0.44 35.942013-14 - U - 46.50 0.40 46.902014-15 - U - 55.52 0.32 55.842015-16 - U - 58.71 0.30 59.012016-17 - U - 66.81 0.29 67.102017-18 - U - 74.08 0.26 74.342018-19 - U - 38.70 (7) 0.10 (7) 38.80
Notes: These data should be read in conjunction with the explanatory notes.
(1) Expenditure estimated by applying retention rates of 10% or 40% as applicable. Applies solely to the pool
betting competition, Tipstar, and does not in any way relate to bookmakers.
(2) Expenditure estimated by subtracting payouts from current sales on decided events, from this period on.
(3) Expenditure for TAB tote odds was estimated using actual data. In preceding years a retention factor was used.
(4) Tipstar ceased operations in 2007.
(5) Expenditure estimated at 5.58% of turnover.
(6) Total sportsbetting figure incomplete due to data for one or more components being unavailable, from this period on.
(7) Point of consumption tax (POCT) introduced and applied from 1 Jan 2019. This figure only contains data from July 2018 to December 2018, pre-POCT.
U = Unavailable data
TOTAL SPORTSBETTING
Value ($)
BOOKMAKER (AND OTHER) FIXED ODDS
BOOKMAKER (AND OTHER)
POOL BETTINGTAB FIXED ODDS TAB TOTE ODDS
Australian Gambling Statistics, 1993–94 to 2018–19, 36th edition
106

TABLE VIC 38VICTORIA
REAL PER CAPITA SPORTSBETTING EXPENDITURE
1994-95 0.11 - 0.54 0.56 1.211995-96 0.27 - 0.89 0.74 1.901996-97 0.19 - 0.99 0.60 1.781997-98 0.03 - 2.30 0.71 3.041998-99 0.21 - 2.05 0.72 2.991999-00 0.51 - 2.14 0.90 3.562000-01 2.79 0.13 2.49 0.94 6.352001-02 4.41 0.26 (1) 4.47 (2) 1.03 10.172002-03 5.26 0.15 3.90 0.92 (3) 10.232003-04 7.57 0.16 5.00 1.06 13.802004-05 1.81 0.18 5.71 1.11 8.822005-06 1.63 0.15 7.39 1.09 10.262006-07 2.01 0.14 9.05 0.82 12.022007-08 0.96 0.05 (4) 10.69 0.87 12.572008-09 1.56 - 12.05 0.77 14.382009-10 1.15 (5) - 22.02 0.61 23.782010-11 - U - 24.82 0.65 25.47 (6)
2011-12 - U - 33.03 0.57 33.612012-13 - U - 39.59 0.49 40.082013-14 - U - 50.53 0.43 50.972014-15 - U - 59.31 0.34 59.652015-16 - U - 61.86 0.31 62.172016-17 - U - 69.18 0.30 69.482017-18 - U - 75.27 0.26 75.532018-19 - U - 38.70 (7) 0.10 (7) 38.80
Notes: These data should be read in conjunction with the explanatory notes.
(1) Expenditure estimated by applying retention rates of 10% or 40% as applicable. Applies solely to the pool
betting competition, Tipstar, and does not in any way relate to bookmakers.
(2) Expenditure estimated by subtracting payouts from current sales on decided events, from this period on.
(3) Expenditure for TAB tote odds was estimated using actual data. In preceding years a retention factor was used.
(4) Tipstar ceased operations in 2007.
(5) Expenditure estimated at 5.58% of turnover.
(6) Total sportsbetting figure incomplete due to data for one or more components being unavailable, from this period on.
(7) Point of consumption tax (POCT) introduced and applied from 1 Jan 2019. This figure only contains data from July 2018 to December 2018, pre-POCT.
U = Unavailable data
TOTAL SPORTSBETTING
Value ($)
BOOKMAKER (AND OTHER) FIXED ODDS
BOOKMAKER (AND OTHER)
POOL BETTINGTAB FIXED ODDS TAB TOTE ODDS
Australian Gambling Statistics, 1993–94 to 2018–19, 36th edition
107

TABLE VIC 39VICTORIA
SPORTSBETTING EXPENDITUREAS A % OF HDI
1994-95 0.000 - 0.001 0.001 0.0031995-96 0.001 - 0.002 0.002 0.0041996-97 0.000 - 0.002 0.001 0.0041997-98 0.000 - 0.005 0.002 0.0071998-99 0.000 - 0.004 0.002 0.0061999-00 0.001 - 0.005 0.002 0.0082000-01 0.006 0.000 0.005 0.002 0.0132001-02 0.009 0.001 (1) 0.009 (2) 0.002 0.0202002-03 0.011 0.000 0.008 0.002 (3) 0.0212003-04 0.015 0.000 0.010 0.002 0.0272004-05 0.003 0.000 0.011 0.002 0.0172005-06 0.003 0.000 0.014 0.002 0.0202006-07 0.004 0.000 0.017 0.002 0.0222007-08 0.002 0.000 (4) 0.019 0.002 0.0222008-09 0.003 - 0.021 0.001 0.0252009-10 0.002 (5) - 0.039 0.001 0.0422010-11 - U - 0.043 0.001 0.044 (6)
2011-12 - U - 0.057 0.001 0.0582012-13 - U - 0.069 0.001 0.0702013-14 - U - 0.086 0.001 0.0872014-15 - U - 0.103 0.001 0.1042015-16 - U - 0.111 0.001 0.1112016-17 - U - 0.124 0.001 0.1242017-18 - U - 0.135 0.000 0.1362018-19 - U - 0.070 (7) 0.000 (7) 0.070
Notes: These data should be read in conjunction with the explanatory notes.
(1) Expenditure estimated by applying retention rates of 10% or 40% as applicable. Applies solely to the pool
betting competition, Tipstar, and does not in any way relate to bookmakers.
(2) Expenditure estimated by subtracting payouts from current sales on decided events, from this period on.
(3) Expenditure for TAB tote odds was estimated using actual data. In preceding years a retention factor was used.
(4) Tipstar ceased operations in 2007.
(5) Expenditure estimated at 5.58% of turnover.
(6) Total sportsbetting figure incomplete due to data for one or more components being unavailable, from this period on.
(7) Point of consumption tax (POCT) introduced and applied from 1 Jan 2019. This figure only contains data from July 2018 to December 2018, pre-POCT.
U = Unavailable data
Percentage (%)
BOOKMAKER (AND OTHER) FIXED ODDS
BOOKMAKER (AND OTHER)
POOL BETTINGTAB FIXED ODDS TAB TOTE ODDS
TOTAL SPORTSBETTING
Australian Gambling Statistics, 1993–94 to 2018–19, 36th edition
108

TABLE VIC 40VICTORIA
SPORTSBETTING EXPENDITURESHARE OF MARKET
1994-95 8.91 - 44.75 46.341995-96 13.99 - 46.89 39.121996-97 10.59 - 55.62 33.791997-98 0.97 - 75.64 23.391998-99 7.15 - 68.69 24.161999-00 14.46 - 60.17 25.372000-01 44.01 2.02 39.21 14.772001-02 43.38 2.55 (1) 43.97 (2) 10.102002-03 51.41 1.50 38.08 9.01 (3)
2003-04 54.86 1.19 36.26 7.692004-05 20.53 2.08 64.77 12.612005-06 15.84 1.51 72.04 10.612006-07 16.71 1.16 75.29 6.852007-08 7.60 0.43 (4) 85.05 6.912008-09 10.85 - 83.82 5.332009-10 4.86 (5) - 92.58 2.562010-11 - U - 97.44 2.562011-12 - U - 98.29 1.712012-13 - U - 98.77 1.232013-14 - U - 99.15 0.852014-15 - U - 99.43 0.572015-16 - U - 99.49 0.512016-17 - U - 99.57 0.432017-18 - U - 99.65 0.352018-19 - U - 99.73 (6) 0.27 (6)
Notes: These data should be read in conjunction with the explanatory notes.
(1) Expenditure estimated by applying retention rates of 10% or 40% as applicable. Applies solely to the pool
betting competition, Tipstar, and does not in any way relate to bookmakers.
(2) Expenditure estimated by subtracting payouts from current sales on decided events, from this period on.
(3) Expenditure for TAB tote odds was estimated using actual data. In preceding years a retention factor was used.
(4) Tipstar ceased operations in 2007.
(5) Expenditure estimated at 5.58% of turnover.
(6) Point of consumption tax (POCT) introduced and applied from 1 Jan 2019. This figure only contains data from July 2018 to December 2018, pre-POCT.
U = Unavailable data
TAB FIXED ODDS TAB TOTE ODDS
Percentage (%)
BOOKMAKER (AND OTHER) FIXED ODDS
BOOKMAKER (AND OTHER)
POOL BETTING
Australian Gambling Statistics, 1993–94 to 2018–19, 36th edition
109

TABLE VIC 41VICTORIA
GOVERNMENT REVENUE FROM SPORTSBETTING
1994-95 0.067 - 0.550 0.383 1.0001995-96 0.035 - 0.280 0.513 0.8281996-97 0.025 - 0.390 0.425 0.8401997-98 0.026 - 0.644 0.508 1.1781998-99 0.070 - 0.854 0.532 1.4561999-00 0.113 - 0.922 0.689 1.7242000-01 0.016 0.026 0.630 0.417 1.0892001-02 - U 0.252 1.182 0.479 1.913 (1)
2002-03 - U 0.249 1.076 0.450 1.7752003-04 - U 0.252 1.432 0.534 2.2182004-05 - U 0.293 1.700 0.579 2.5722005-06 - U 0.258 2.291 0.594 3.1432006-07 - U 0.243 2.958 0.471 3.6722007-08 - U 0.100 (2) 3.690 0.526 4.3162008-09 - U - 4.394 0.489 4.8832009-10 - U - 8.401 0.407 8.8082010-11 - U - 9.928 0.457 10.3852011-12 - U - 13.773 0.419 14.1922012-13 - U - 7.906 0.210 8.1162013-14 - U - 9.272 0.138 9.4102014-15 - U - 11.312 0.113 11.4252015-16 - U - 12.243 0.108 12.3512016-17 - U - 14.282 0.108 14.3902017-18 - U - 16.224 (3) 0.099 R 16.322 R
2018-19 - U - 8.675 (4) 0.041 (4) 8.716
Notes: These data should be read in conjunction with the explanatory notes.
Data for the gambling revenue received by states and territories from 1 July 2000 onwards are not comparable with that of
preceding years because of the impact of changes brought about by the introduction of the GST.
(1) Total sportsbetting figure incomplete from this period on, due to data for one or more components being unavailable.
(2) Tipstar ceased operations in 2007.
(3) Figures are from verified tax received.
(4) Point of consumption tax (POCT) introduced and applied from 1 Jan 2019. This figure only contains data from July 2018 to December 2018, pre-POCT.
U = Unavailable data
R = Revised data
TOTAL SPORTSBETTING
Value ($ million)
BOOKMAKER (AND OTHER) FIXED ODDS
BOOKMAKER (AND OTHER)
POOL BETTINGTAB FIXED ODDS TAB TOTE ODDS
Australian Gambling Statistics, 1993–94 to 2018–19, 36th edition
110

TABLE VIC 42VICTORIA
REAL GOVERNMENT REVENUE FROM SPORTSBETTING
1994-95 0.121 - 0.990 0.689 1.8001995-96 0.060 - 0.483 0.886 1.4291996-97 0.043 - 0.664 0.724 1.4311997-98 0.044 - 1.097 0.865 2.0061998-99 0.118 - 1.437 0.895 2.4501999-00 0.186 - 1.516 1.133 2.8342000-01 0.025 0.040 0.977 0.646 1.6882001-02 - U 0.380 1.782 0.722 2.883 (1)
2002-03 - U 0.364 1.574 0.658 2.5972003-04 - U 0.360 2.045 0.763 3.1672004-05 - U 0.409 2.371 0.808 3.5882005-06 - U 0.349 3.097 0.803 4.2492006-07 - U 0.319 3.884 0.618 4.8212007-08 - U 0.127 (2) 4.689 0.668 5.4842008-09 - U - 5.414 0.603 6.0172009-10 - U - 10.111 0.490 10.6012010-11 - U - 11.595 0.534 12.1282011-12 - U - 15.715 0.478 16.1932012-13 - U - 8.818 0.234 9.0522013-14 - U - 10.075 0.150 10.2252014-15 - U - 12.085 0.121 12.2062015-16 - U - 12.899 0.114 13.0122016-17 - U - 14.787 0.112 14.8992017-18 - U - 16.484 (3) 0.100 R 16.584 R
2018-19 - U - 8.675 (4) 0.041 (4) 8.716
Notes: These data should be read in conjunction with the explanatory notes.
Data for the gambling revenue received by states and territories from 1 July 2000 onwards are not comparable with that of
preceding years because of the impact of changes brought about by the introduction of the GST.
(1) Total sportsbetting figure incomplete from this period on, due to data for one or more components being unavailable.
(2) Tipstar ceased operations in 2007.
(3) Figures are from verified tax received.
(4) Point of consumption tax (POCT) introduced and applied from 1 Jan 2019. This figure only contains data from July 2018 to December 2018, pre-POCT.
U = Unavailable data
R = Revised data
TOTAL SPORTSBETTING
Value ($ million)
BOOKMAKER (AND OTHER) FIXED ODDS
BOOKMAKER (AND OTHER)
POOL BETTINGTAB FIXED ODDS TAB TOTE ODDS
Australian Gambling Statistics, 1993–94 to 2018–19, 36th edition
111
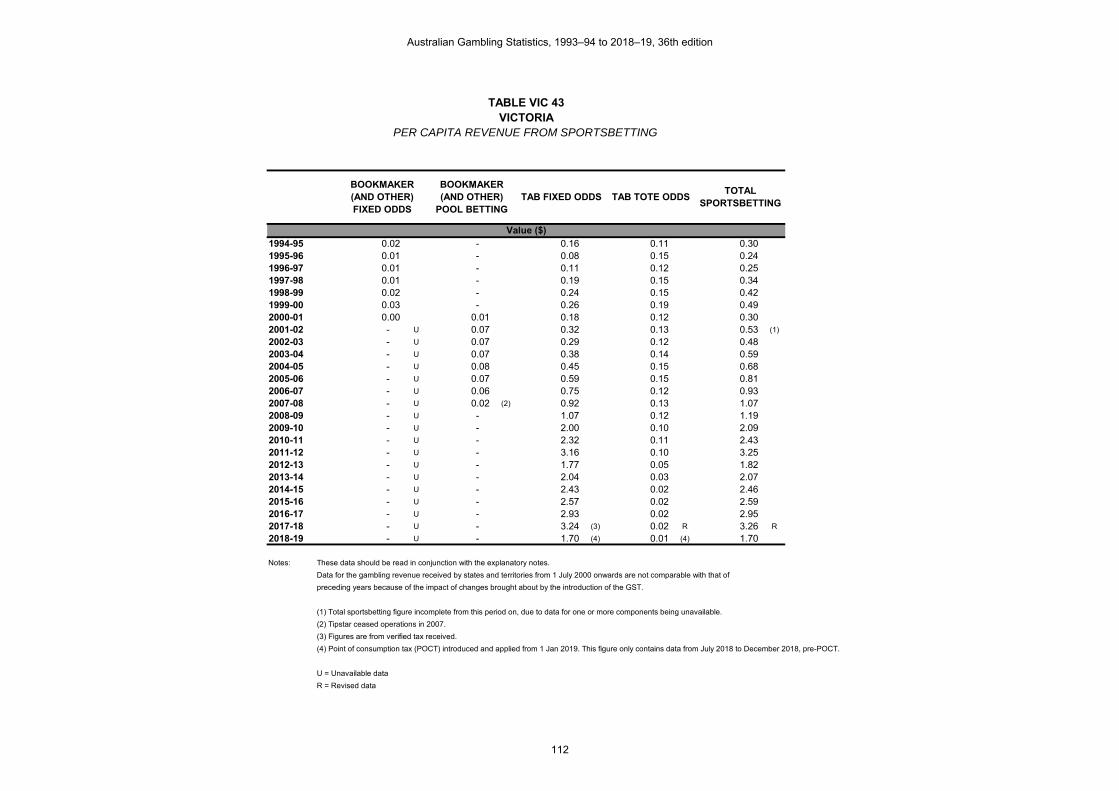
TABLE VIC 43VICTORIA
PER CAPITA REVENUE FROM SPORTSBETTING
1994-95 0.02 - 0.16 0.11 0.301995-96 0.01 - 0.08 0.15 0.241996-97 0.01 - 0.11 0.12 0.251997-98 0.01 - 0.19 0.15 0.341998-99 0.02 - 0.24 0.15 0.421999-00 0.03 - 0.26 0.19 0.492000-01 0.00 0.01 0.18 0.12 0.302001-02 - U 0.07 0.32 0.13 0.53 (1)
2002-03 - U 0.07 0.29 0.12 0.482003-04 - U 0.07 0.38 0.14 0.592004-05 - U 0.08 0.45 0.15 0.682005-06 - U 0.07 0.59 0.15 0.812006-07 - U 0.06 0.75 0.12 0.932007-08 - U 0.02 (2) 0.92 0.13 1.072008-09 - U - 1.07 0.12 1.192009-10 - U - 2.00 0.10 2.092010-11 - U - 2.32 0.11 2.432011-12 - U - 3.16 0.10 3.252012-13 - U - 1.77 0.05 1.822013-14 - U - 2.04 0.03 2.072014-15 - U - 2.43 0.02 2.462015-16 - U - 2.57 0.02 2.592016-17 - U - 2.93 0.02 2.952017-18 - U - 3.24 (3) 0.02 R 3.26 R
2018-19 - U - 1.70 (4) 0.01 (4) 1.70
Notes: These data should be read in conjunction with the explanatory notes.
Data for the gambling revenue received by states and territories from 1 July 2000 onwards are not comparable with that of
preceding years because of the impact of changes brought about by the introduction of the GST.
(1) Total sportsbetting figure incomplete from this period on, due to data for one or more components being unavailable.
(2) Tipstar ceased operations in 2007.
(3) Figures are from verified tax received.
(4) Point of consumption tax (POCT) introduced and applied from 1 Jan 2019. This figure only contains data from July 2018 to December 2018, pre-POCT.
U = Unavailable data
R = Revised data
TOTAL SPORTSBETTING
Value ($)
BOOKMAKER (AND OTHER) FIXED ODDS
BOOKMAKER (AND OTHER)
POOL BETTINGTAB FIXED ODDS TAB TOTE ODDS
Australian Gambling Statistics, 1993–94 to 2018–19, 36th edition
112

TABLE VIC 44VICTORIA
REAL PER CAPITA REVENUE FROM SPORTSBETTING
1994-95 0.04 - 0.29 0.21 0.541995-96 0.02 - 0.14 0.26 0.421996-97 0.01 - 0.19 0.21 0.421997-98 0.01 - 0.32 0.25 0.581998-99 0.03 - 0.41 0.26 0.701999-00 0.05 - 0.43 0.32 0.802000-01 0.01 0.01 0.27 0.18 0.472001-02 - U 0.10 0.49 0.20 0.79 (1)
2002-03 - U 0.10 0.43 0.18 0.702003-04 - U 0.10 0.55 0.20 0.852004-05 - U 0.11 0.62 0.21 0.942005-06 - U 0.09 0.80 0.21 1.102006-07 - U 0.08 0.99 0.16 1.232007-08 - U 0.03 (2) 1.17 0.17 1.362008-09 - U - 1.31 0.15 1.462009-10 - U - 2.40 0.12 2.522010-11 - U - 2.71 0.12 2.832011-12 - U - 3.60 0.11 3.712012-13 - U - 1.98 0.05 2.032013-14 - U - 2.21 0.03 2.252014-15 - U - 2.60 0.03 2.622015-16 - U - 2.71 0.02 2.732016-17 - U - 3.03 0.02 3.052017-18 - U - 3.30 (3) 0.02 R 3.32 R
2018-19 - U - 1.70 (4) 0.01 (4) 1.70
Notes: These data should be read in conjunction with the explanatory notes.
Data for the gambling revenue received by states and territories from 1 July 2000 onwards are not comparable with that of
preceding years because of the impact of changes brought about by the introduction of the GST.
(1) Total sportsbetting figure incomplete from this period on, due to data for one or more components being unavailable.
(2) Tipstar ceased operations in 2007.
(3) Figures are from verified tax received.
(4) Point of consumption tax (POCT) introduced and applied from 1 Jan 2019. This figure only contains data from July 2018 to December 2018, pre-POCT.
U = Unavailable data
R = Revised data
TOTAL SPORTSBETTING
Value ($)
BOOKMAKER (AND OTHER) FIXED ODDS
BOOKMAKER (AND OTHER)
POOL BETTINGTAB FIXED ODDS TAB TOTE ODDS
Australian Gambling Statistics, 1993–94 to 2018–19, 36th edition
113

TABLE VIC 45VICTORIA
GOVERNMENT REVENUE FROM SPORTSBETTINGAS A % OF TOTAL GAMBLING REVENUE
1994-95 0.01 - 0.06 0.04 0.111995-96 0.00 - 0.03 0.05 0.081996-97 0.00 - 0.03 0.04 0.071997-98 0.00 - 0.05 0.04 0.091998-99 0.00 - 0.06 0.04 0.101999-00 0.01 - 0.06 0.05 0.112000-01 0.00 0.00 0.05 0.03 0.092001-02 - U 0.02 0.09 0.03 0.14 (1)
2002-03 - U 0.02 0.08 0.03 0.132003-04 - U 0.02 0.11 0.04 0.172004-05 - U 0.02 0.12 0.04 0.192005-06 - U 0.02 0.16 0.04 0.222006-07 - U 0.02 0.20 0.03 0.252007-08 - U 0.01 (2) 0.24 0.03 0.282008-09 - U - 0.27 0.03 0.302009-10 - U - 0.52 0.03 0.552010-11 - U - 0.61 0.03 0.642011-12 - U - 0.81 0.02 0.832012-13 - U - 0.51 0.01 0.522013-14 - U - 0.61 0.01 0.622014-15 - U - 0.70 0.01 0.712015-16 - U - 0.73 0.01 0.732016-17 - U - 0.87 0.01 0.882017-18 - U - 0.95 (3) 0.01 R 0.96 R
2018-19 - U - 0.49 (4) 0.00 (4) 0.49
Notes: These data should be read in conjunction with the explanatory notes.
Data for the gambling revenue received by states and territories from 1 July 2000 onwards are not comparable with that of
preceding years because of the impact of changes brought about by the introduction of the GST.
(1) Total sportsbetting figure incomplete from this period on, due to data for one or more components being unavailable.
(2) Tipstar ceased operations in 2007.
(3) Figures are from verified tax received.
(4) Point of consumption tax (POCT) introduced and applied from 1 Jan 2019. This figure only contains data from July 2018 to December 2018, pre-POCT.
U = Unavailable data
R = Revised data
Percentage (%)
BOOKMAKER (AND OTHER) FIXED ODDS
BOOKMAKER (AND OTHER)
POOL BETTINGTAB FIXED ODDS TAB TOTE ODDS
TOTAL SPORTSBETTING
Australian Gambling Statistics, 1993–94 to 2018–19, 36th edition
114

TABLE VIC 46VICTORIA
TOTAL GAMBLING TURNOVER
1993-94 8,196.619 2,943.822 - 11,140.4411994-95 14,035.620 2,961.859 22.967 17,020.4461995-96 18,352.829 2,951.037 28.294 21,332.1601996-97 23,176.987 2,873.588 28.644 26,079.2191997-98 31,921.252 2,971.560 43.471 34,936.2831998-99 30,451.236 3,046.097 52.394 33,549.7271999-00 33,854.119 3,034.456 67.756 36,956.3312000-01 35,031.447 3,227.631 116.995 38,376.0732001-02 34,675.193 3,435.888 193.710 38,304.7912002-03 32,418.159 3,637.542 209.063 36,264.7642003-04 31,876.691 3,806.718 210.790 35,894.1992004-05 32,659.433 4,007.668 180.447 36,847.5482005-06 33,414.731 4,029.161 255.325 37,699.2172006-07 34,449.549 4,247.698 306.647 39,003.8942007-08 36,171.063 4,109.834 335.717 40,616.6142008-09 37,861.052 4,469.989 446.389 42,777.4302009-10 37,561.689 4,242.323 737.633 42,541.6452010-11 39,104.106 4,128.777 871.985 44,104.8682011-12 39,785.900 4,022.021 1,033.725 44,841.6462012-13 38,608.125 3,443.114 1,146.891 43,198.1302013-14 39,554.653 3,118.012 1,375.390 44,048.0552014-15 42,355.320 2,995.063 1,667.319 47,017.7022015-16 44,277.119 2,720.304 1,913.419 48,910.8422016-17 41,659.439 2,515.733 2,208.227 46,383.3992017-18 43,985.733 2,375.870 2,476.280 48,837.8822018-19 45,255.831 1,232.969 1,394.706 47,883.506
Notes: These data should be read in conjunction with the explanatory notes.
Figure(s) may be incomplete for any period due to some unavailable turnover figures that are used to derive these numbers.
Value ($ million)
GAMING RACING SPORTSBETTING TOTAL GAMBLING
Australian Gambling Statistics, 1993–94 to 2018–19, 36th edition
115

TABLE VIC 47VICTORIA
REAL GAMBLING TURNOVER
1993-94 15,231.828 5,470.523 - 20,702.3501994-95 25,259.688 5,330.412 41.333 30,631.4341995-96 31,680.148 5,093.999 48.840 36,822.9871996-97 39,470.063 4,893.677 48.780 44,412.5211997-98 54,361.416 5,060.522 74.030 59,495.9691998-99 51,246.107 5,126.249 88.173 56,460.5291999-00 55,659.294 4,988.925 111.397 60,759.6162000-01 54,308.262 5,003.705 181.374 59,493.3412001-02 52,264.723 5,178.796 291.972 57,735.4912002-03 47,421.948 5,321.071 305.822 53,048.8412003-04 45,521.032 5,436.127 301.016 51,258.1742004-05 45,555.517 5,590.158 251.699 51,397.3742005-06 45,173.232 5,447.006 345.173 50,965.4112006-07 45,232.377 5,577.242 402.629 51,212.2472007-08 45,959.001 5,221.961 426.562 51,607.5242008-09 46,651.685 5,507.837 550.032 52,709.5552009-10 45,208.742 5,106.002 887.805 51,202.5492010-11 45,668.152 4,821.837 1,018.357 51,508.3462011-12 45,395.712 4,589.126 1,179.480 51,164.3182012-13 43,061.457 3,840.267 1,279.181 48,180.9062013-14 42,982.723 3,388.239 1,494.590 47,865.5532014-15 45,250.393 3,199.782 1,781.284 50,231.4592015-16 46,648.377 2,865.990 2,015.892 51,530.2592016-17 43,133.775 2,604.765 2,286.377 48,024.9162017-18 44,690.758 2,413.952 2,515.971 49,620.6802018-19 45,255.831 1,232.969 1,394.706 47,883.506
Notes: These data should be read in conjunction with the explanatory notes.
Figure(s) may be incomplete for any period due to some unavailable turnover figures that are used to derive these numbers.
Value ($ million)
GAMING RACING SPORTSBETTING TOTAL GAMBLING
Australian Gambling Statistics, 1993–94 to 2018–19, 36th edition
116

TABLE VIC 48VICTORIA
PER CAPITA GAMBLING TURNOVER
1993-94 2,455.15 881.77 - 3,336.921994-95 4,179.43 881.96 6.84 5,068.231995-96 5,415.97 870.86 8.35 6,295.171996-97 6,768.80 839.23 8.37 7,616.391997-98 9,228.13 859.05 12.57 10,099.751998-99 8,705.87 870.87 14.98 9,591.721999-00 9,558.66 856.77 19.13 10,434.572000-01 9,754.16 898.70 32.58 10,685.442001-02 9,518.03 943.12 53.17 10,514.332002-03 8,774.58 984.57 56.59 9,815.732003-04 8,508.35 1,016.07 56.26 9,580.682004-05 8,593.10 1,054.47 47.48 9,695.042005-06 8,651.12 1,043.16 66.10 9,760.382006-07 8,753.47 1,079.32 77.92 9,910.712007-08 8,995.78 1,022.12 83.49 10,101.392008-09 9,194.16 1,085.49 108.40 10,388.052009-10 8,925.01 1,008.02 175.27 10,108.292010-11 9,133.78 964.38 203.67 10,301.842011-12 9,124.31 922.39 237.07 10,283.772012-13 8,666.95 772.93 257.46 9,697.342013-14 8,689.09 684.94 302.14 9,676.172014-15 9,105.03 643.84 358.42 10,107.292015-16 9,299.94 571.37 401.89 10,273.212016-17 8,535.91 515.47 452.46 9,503.842017-18 8,796.90 475.16 495.24 9,767.302018-19 8,842.44 240.91 272.51 9,355.86
Notes: These data should be read in conjunction with the explanatory notes.
Figure(s) may be incomplete for any period due to some unavailable turnover figures that are used to derive these numbers.
Value ($)
GAMING RACING SPORTSBETTING TOTAL GAMBLING
Australian Gambling Statistics, 1993–94 to 2018–19, 36th edition
117

TABLE VIC 49VICTORIA
REAL PER CAPITA GAMBLING TURNOVER
1993-94 4,562.42 1,638.60 - 6,201.021994-95 7,521.66 1,587.25 12.31 9,121.221995-96 9,348.89 1,503.25 14.41 10,866.551996-97 11,527.16 1,429.19 14.25 12,970.601997-98 15,715.37 1,462.95 21.40 17,199.721998-99 14,651.03 1,465.57 25.21 16,141.811999-00 15,715.32 1,408.62 31.45 17,155.392000-01 15,121.60 1,393.23 50.50 16,565.342001-02 14,346.20 1,421.53 80.14 15,847.882002-03 12,835.63 1,440.25 82.78 14,358.662003-04 12,150.23 1,450.98 80.35 13,681.552004-05 11,986.22 1,470.84 66.23 13,523.282005-06 11,695.42 1,410.24 89.37 13,195.022006-07 11,493.34 1,417.15 102.31 13,012.802007-08 11,430.05 1,298.71 106.09 12,834.842008-09 11,328.88 1,337.52 133.57 12,799.972009-10 10,742.02 1,213.23 210.95 12,166.202010-11 10,666.98 1,126.27 237.86 12,031.112011-12 10,410.83 1,052.45 270.50 11,733.782012-13 9,666.66 862.08 287.16 10,815.902013-14 9,442.14 744.30 328.32 10,514.772014-15 9,727.38 687.85 382.92 10,798.152015-16 9,798.00 601.97 423.42 10,823.392016-17 8,838.00 533.71 468.47 9,840.182017-18 8,937.90 482.78 503.18 9,923.862018-19 8,842.44 240.91 272.51 9,355.86
Notes: These data should be read in conjunction with the explanatory notes.
Figure(s) may be incomplete for any period due to some unavailable turnover figures that are used to derive these numbers.
Value ($)
GAMING RACING SPORTSBETTING TOTAL GAMBLING
Australian Gambling Statistics, 1993–94 to 2018–19, 36th edition
118

TABLE VIC 50VICTORIA
TOTAL GAMBLING EXPENDITURE
1993-94 1,099.067 409.122 - 1,508.1891994-95 1,702.778 409.808 2.257 2,114.8441995-96 2,114.108 428.005 3.724 2,545.8371996-97 2,329.903 423.264 3.569 2,756.7361997-98 2,759.609 431.322 6.166 3,197.0971998-99 2,995.800 454.783 6.213 3,456.7961999-00 3,316.457 458.483 7.660 3,782.6002000-01 3,650.942 503.514 14.702 4,169.1582001-02 3,814.853 526.845 24.582 4,366.2802002-03 3,658.559 551.807 25.835 4,236.2012003-04 3,638.914 575.835 36.195 4,250.9442004-05 3,698.221 606.453 24.037 4,328.7112005-06 3,895.290 610.245 29.318 4,534.8532006-07 4,018.264 649.224 36.018 4,703.5062007-08 4,145.316 651.323 39.770 4,836.4092008-09 4,371.750 686.892 48.048 5,106.6902009-10 4,359.852 677.547 83.168 5,120.5672010-11 4,431.963 658.062 93.386 5,183.4112011-12 4,696.059 637.654 128.438 5,462.1512012-13 4,567.810 613.365 160.081 5,341.2562013-14 4,566.101 571.133 213.501 5,350.7352014-15 4,951.259 542.735 259.746 5,753.7402015-16 5,018.540 494.148 280.945 5,793.6332016-17 4,688.775 458.774 327.491 5,475.0402017-18 5,007.665 434.462 371.699 5,813.8262018-19 5,039.946 226.114 198.602 5,464.661
Notes: These data should be read in conjunction with the explanatory notes.
Figure(s) may be incomplete for any period due to some unavailable expenditure figures that are used to derive these numbers.
Value ($ million)
GAMING RACING SPORTSBETTING TOTAL GAMBLING
Australian Gambling Statistics, 1993–94 to 2018–19, 36th edition
119

TABLE VIC 51VICTORIA
REAL GAMBLING EXPENDITURE
1993-94 2,042.403 760.273 - 2,802.6771994-95 3,064.463 737.526 4.062 3,806.0511995-96 3,649.315 738.810 6.428 4,394.5541996-97 3,967.791 720.812 6.078 4,694.6811997-98 4,699.573 734.535 10.501 5,444.6081998-99 5,041.604 765.350 10.456 5,817.4101999-00 5,452.561 753.788 12.594 6,218.9432000-01 5,659.952 780.584 22.792 6,463.3282001-02 5,749.996 794.095 37.052 6,581.1432002-03 5,351.815 807.195 37.792 6,196.8022003-04 5,196.497 822.313 51.688 6,070.4972004-05 5,158.521 845.920 33.528 6,037.9702005-06 5,266.026 824.988 39.635 6,130.6482006-07 5,275.995 852.433 47.292 6,175.7192007-08 5,267.044 827.572 50.532 6,145.1482008-09 5,386.789 846.376 59.203 6,292.3682009-10 5,247.459 815.487 100.100 6,163.0452010-11 5,175.916 768.525 109.062 6,053.5032011-12 5,358.203 727.563 146.548 6,232.3142012-13 5,094.693 684.115 178.546 5,957.3542013-14 4,961.830 620.631 232.004 5,814.4662014-15 5,289.687 579.832 277.500 6,147.0192015-16 5,287.307 520.612 295.991 6,103.9102016-17 4,854.712 475.010 339.081 5,668.8032017-18 5,087.931 441.425 377.657 5,907.0132018-19 5,039.946 226.114 198.602 5,464.661
Notes: These data should be read in conjunction with the explanatory notes.
Figure(s) may be incomplete for any period due to some unavailable expenditure figures that are used to derive these numbers.
Value ($ million)
GAMING RACING SPORTSBETTING TOTAL GAMBLING
Australian Gambling Statistics, 1993–94 to 2018–19, 36th edition
120

TABLE VIC 52VICTORIA
PER CAPITA GAMBLING EXPENDITURE
1993-94 329.21 122.55 - 451.751994-95 507.04 122.03 0.67 629.741995-96 623.88 126.31 1.10 751.281996-97 680.44 123.61 1.04 805.101997-98 797.78 124.69 1.78 924.251998-99 856.49 130.02 1.78 988.281999-00 936.40 129.45 2.16 1,068.012000-01 1,016.57 140.20 4.09 1,160.862001-02 1,047.14 144.61 6.75 1,198.512002-03 990.26 149.36 6.99 1,146.612003-04 971.28 153.70 9.66 1,134.642004-05 973.05 159.57 6.32 1,138.942005-06 1,008.50 157.99 7.59 1,174.082006-07 1,021.02 164.96 9.15 1,195.142007-08 1,030.94 161.98 9.89 1,202.822008-09 1,061.63 166.80 11.67 1,240.112009-10 1,035.94 160.99 19.76 1,216.692010-11 1,035.20 153.71 21.81 1,210.722011-12 1,076.97 146.24 29.46 1,252.662012-13 1,025.41 137.69 35.94 1,199.032013-14 1,003.05 125.46 46.90 1,175.412014-15 1,064.36 116.67 55.84 1,236.872015-16 1,054.09 103.79 59.01 1,216.892016-17 960.72 94.00 67.10 1,121.822017-18 1,001.50 86.89 74.34 1,162.732018-19 984.74 44.18 38.80 1,067.73
Notes: These data should be read in conjunction with the explanatory notes.
Figure(s) may be incomplete for any period due to some unavailable expenditure figures that are used to derive these numbers.
Value ($)
GAMING RACING SPORTSBETTING TOTAL GAMBLING
Australian Gambling Statistics, 1993–94 to 2018–19, 36th edition
121
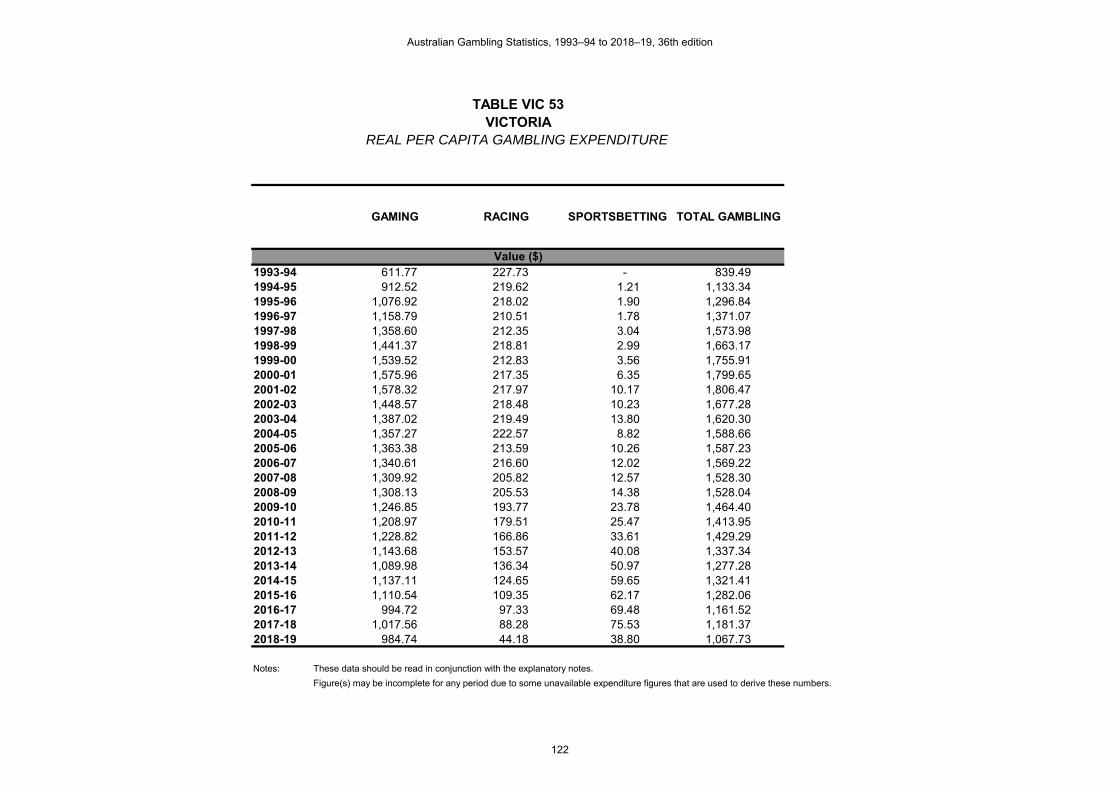
TABLE VIC 53VICTORIA
REAL PER CAPITA GAMBLING EXPENDITURE
1993-94 611.77 227.73 - 839.491994-95 912.52 219.62 1.21 1,133.341995-96 1,076.92 218.02 1.90 1,296.841996-97 1,158.79 210.51 1.78 1,371.071997-98 1,358.60 212.35 3.04 1,573.981998-99 1,441.37 218.81 2.99 1,663.171999-00 1,539.52 212.83 3.56 1,755.912000-01 1,575.96 217.35 6.35 1,799.652001-02 1,578.32 217.97 10.17 1,806.472002-03 1,448.57 218.48 10.23 1,677.282003-04 1,387.02 219.49 13.80 1,620.302004-05 1,357.27 222.57 8.82 1,588.662005-06 1,363.38 213.59 10.26 1,587.232006-07 1,340.61 216.60 12.02 1,569.222007-08 1,309.92 205.82 12.57 1,528.302008-09 1,308.13 205.53 14.38 1,528.042009-10 1,246.85 193.77 23.78 1,464.402010-11 1,208.97 179.51 25.47 1,413.952011-12 1,228.82 166.86 33.61 1,429.292012-13 1,143.68 153.57 40.08 1,337.342013-14 1,089.98 136.34 50.97 1,277.282014-15 1,137.11 124.65 59.65 1,321.412015-16 1,110.54 109.35 62.17 1,282.062016-17 994.72 97.33 69.48 1,161.522017-18 1,017.56 88.28 75.53 1,181.372018-19 984.74 44.18 38.80 1,067.73
Notes: These data should be read in conjunction with the explanatory notes.
Figure(s) may be incomplete for any period due to some unavailable expenditure figures that are used to derive these numbers.
Value ($)
GAMING RACING SPORTSBETTING TOTAL GAMBLING
Australian Gambling Statistics, 1993–94 to 2018–19, 36th edition
122

TABLE VIC 54VICTORIA
GAMBLING EXPENDITUREAS A % OF HDI
1993-94 1.441 0.536 - 1.9781994-95 2.133 0.513 0.003 2.6491995-96 2.505 0.507 0.004 3.0161996-97 2.647 0.481 0.004 3.1321997-98 2.985 0.467 0.007 3.4581998-99 3.077 0.467 0.006 3.5501999-00 3.253 0.450 0.008 3.7102000-01 3.274 0.452 0.013 3.7392001-02 3.161 0.437 0.020 3.6182002-03 2.911 0.439 0.021 3.3702003-04 2.740 0.434 0.027 3.2002004-05 2.613 0.429 0.017 3.0592005-06 2.608 0.409 0.020 3.0372006-07 2.495 0.403 0.022 2.9212007-08 2.344 0.368 0.022 2.7352008-09 2.274 0.357 0.025 2.6562009-10 2.198 0.342 0.042 2.5812010-11 2.092 0.311 0.044 2.4462011-12 2.130 0.289 0.058 2.4772012-13 1.986 0.267 0.070 2.3222013-14 1.858 0.232 0.087 2.1772014-15 1.983 0.217 0.104 2.3052015-16 1.984 0.195 0.111 2.2912016-17 1.778 0.174 0.124 2.0762017-18 1.830 0.159 0.136 2.1252018-19 1.784 0.080 0.070 1.935
Notes: These data should be read in conjunction with the explanatory notes.
Figure(s) may be incomplete for any period due to some unavailable expenditure figures that are used to derive these numbers.
RACING SPORTSBETTING TOTAL GAMBLING
Percentage (%)
GAMING
Australian Gambling Statistics, 1993–94 to 2018–19, 36th edition
123

TABLE VIC 55VICTORIA
GAMBLING EXPENDITUREAS A % OF TOTAL GAMBLING EXPENDITURE
1993-94 72.87 27.13 -1994-95 80.52 19.38 0.111995-96 83.04 16.81 0.151996-97 84.52 15.35 0.131997-98 86.32 13.49 0.191998-99 86.66 13.16 0.181999-00 87.68 12.12 0.202000-01 87.57 12.08 0.352001-02 87.37 12.07 0.562002-03 86.36 13.03 0.612003-04 85.60 13.55 0.852004-05 85.43 14.01 0.562005-06 85.90 13.46 0.652006-07 85.43 13.80 0.772007-08 85.71 13.47 0.822008-09 85.61 13.45 0.942009-10 85.14 13.23 1.622010-11 85.50 12.70 1.802011-12 85.97 11.67 2.352012-13 85.52 11.48 3.002013-14 85.34 10.67 3.992014-15 86.05 9.43 4.512015-16 86.62 8.53 4.852016-17 85.64 8.38 5.982017-18 86.13 7.47 6.392018-19 92.23 4.14 3.63
Notes: These data should be read in conjunction with the explanatory notes.
Figure(s) may be incomplete for any period due to some unavailable expenditure figures that are used to derive these numbers.
Percentage (%)
GAMING RACING SPORTSBETTING
Australian Gambling Statistics, 1993–94 to 2018–19, 36th edition
124

TABLE VIC 56VICTORIA
GOVERNMENT REVENUE FROM GAMBLING
1993-94 561.926 182.679 - 744.6051994-95 763.028 141.123 1.000 905.1511995-96 929.020 121.452 0.828 1,051.3001996-97 1,035.732 120.673 0.840 1,157.2451997-98 1,168.242 126.948 1.178 1,296.3681998-99 1,272.355 134.097 1.456 1,407.9081999-00 1,381.926 136.473 1.724 1,520.1232000-01 1,182.044 93.197 1.089 1,276.3302001-02 1,270.538 97.506 1.913 1,369.9572002-03 1,222.062 101.853 1.775 1,325.6902003-04 1,215.663 106.354 2.218 1,324.2352004-05 1,253.827 112.576 2.572 1,368.9752005-06 1,323.627 113.570 3.143 1,440.3402006-07 1,364.039 118.835 3.672 1,486.5462007-08 1,444.046 119.931 4.316 1,568.2932008-09 1,501.656 125.040 4.883 1,631.5792009-10 1,476.156 124.980 8.808 1,609.9442010-11 1,497.301 121.196 10.385 1,628.8822011-12 1,579.280 116.948 14.192 1,710.4202012-13 1,494.758 54.477 8.116 1,557.3512013-14 1,459.935 42.654 9.410 1,511.9982014-15 1,561.657 41.247 11.425 1,614.3292015-16 1,630.899 37.555 12.351 1,680.8052016-17 1,586.839 34.867 14.390 1,636.0962017-18 1,654.852 33.019 16.322 1,704.1932018-19 1,752.099 17.185 8.716 1,777.999
Notes: These data should be read in conjunction with the explanatory notes.
Figure(s) may be incomplete for any period due to some unavailable revenue figures that are used to derive these numbers.
Data for the gambling revenue received by states and territories from 1 July 2000 onwards are not comparable with that of
preceding years because of the impact of changes brought about by the introduction of the GST.
Value ($ million)
GAMING RACING SPORTSBETTING TOTAL GAMBLING
Australian Gambling Statistics, 1993–94 to 2018–19, 36th edition
125

TABLE VIC 57VICTORIA
REAL GOVERNMENT REVENUE FROM GAMBLING
1993-94 1,044.231 339.474 - 1,383.7041994-95 1,373.210 253.977 1.800 1,628.9861995-96 1,603.649 209.647 1.429 1,814.7251996-97 1,763.836 205.504 1.431 1,970.7711997-98 1,989.499 216.191 2.006 2,207.6951998-99 2,141.235 225.671 2.450 2,369.3551999-00 2,272.014 224.374 2.834 2,499.2222000-01 1,832.489 144.481 1.688 1,978.6582001-02 1,915.038 146.967 2.883 2,064.8892002-03 1,787.657 148.993 2.597 1,939.2472003-04 1,736.009 151.877 3.167 1,891.0542004-05 1,748.920 157.028 3.588 1,909.5362005-06 1,789.406 153.535 4.249 1,947.1902006-07 1,790.988 156.031 4.821 1,951.8402007-08 1,834.807 152.384 5.484 1,992.6752008-09 1,850.313 154.072 6.017 2,010.4012009-10 1,776.682 150.425 10.601 1,937.7072010-11 1,748.639 141.540 12.128 1,902.3072011-12 1,801.958 133.438 16.193 1,951.5892012-13 1,667.174 60.761 9.052 1,736.9872013-14 1,586.462 46.350 10.225 1,643.0382014-15 1,668.399 44.066 12.206 1,724.6722015-16 1,718.242 39.566 13.012 1,770.8202016-17 1,642.998 36.101 14.899 1,693.9982017-18 1,681.377 33.548 16.584 1,731.5092018-19 1,752.099 17.185 8.716 1,777.999
Notes: These data should be read in conjunction with the explanatory notes.
Figure(s) may be incomplete for any period due to some unavailable revenue figures that are used to derive these numbers.
Data for the gambling revenue received by states and territories from 1 July 2000 onwards are not comparable with that of
preceding years because of the impact of changes brought about by the introduction of the GST.
Value ($ million)
GAMING RACING SPORTSBETTING TOTAL GAMBLING
Australian Gambling Statistics, 1993–94 to 2018–19, 36th edition
126

TABLE VIC 58VICTORIA
PER CAPITA REVENUE FROM GAMBLING
1993-94 168.31 54.72 - 223.031994-95 227.21 42.02 0.30 269.531995-96 274.16 35.84 0.24 310.241996-97 302.48 35.24 0.25 337.971997-98 337.73 36.70 0.34 374.771998-99 363.76 38.34 0.42 402.511999-00 390.18 38.53 0.49 429.202000-01 329.13 25.95 0.30 355.382001-02 348.75 26.76 0.53 376.042002-03 330.77 27.57 0.48 358.822003-04 324.48 28.39 0.59 353.462004-05 329.90 29.62 0.68 360.192005-06 342.69 29.40 0.81 372.912006-07 346.60 30.20 0.93 377.722007-08 359.14 29.83 1.07 390.042008-09 364.66 30.36 1.19 396.212009-10 350.75 29.70 2.09 382.542010-11 349.73 28.31 2.43 380.472011-12 362.18 26.82 3.25 392.262012-13 335.55 12.23 1.82 349.602013-14 320.71 9.37 2.07 332.152014-15 335.71 8.87 2.46 347.032015-16 342.55 7.89 2.59 353.042016-17 325.14 7.14 2.95 335.232017-18 330.96 6.60 3.26 340.832018-19 342.34 3.36 1.70 347.40
Notes: These data should be read in conjunction with the explanatory notes.
Figure(s) may be incomplete for any period due to some unavailable revenue figures that are used to derive these numbers.
Data for the gambling revenue received by states and territories from 1 July 2000 onwards are not comparable with that of
preceding years because of the impact of changes brought about by the introduction of the GST.
Value ($)
GAMING RACING SPORTSBETTING TOTAL GAMBLING
Australian Gambling Statistics, 1993–94 to 2018–19, 36th edition
127

TABLE VIC 59VICTORIA
REAL PER CAPITA REVENUE FROM GAMBLING
1993-94 312.78 101.68 - 414.461994-95 408.91 75.63 0.54 485.071995-96 473.24 61.87 0.42 535.531996-97 515.13 60.02 0.42 575.561997-98 575.15 62.50 0.58 638.221998-99 612.17 64.52 0.70 677.391999-00 641.50 63.35 0.80 705.652000-01 510.24 40.23 0.47 550.942001-02 525.66 40.34 0.79 566.792002-03 483.86 40.33 0.70 524.892003-04 463.37 40.54 0.85 504.752004-05 460.16 41.32 0.94 502.422005-06 463.28 39.75 1.10 504.132006-07 455.08 39.65 1.23 495.952007-08 456.32 37.90 1.36 495.582008-09 449.33 37.41 1.46 488.202009-10 422.16 35.74 2.52 460.422010-11 408.44 33.06 2.83 444.332011-12 413.25 30.60 3.71 447.572012-13 374.26 13.64 2.03 389.932013-14 348.50 10.18 2.25 360.932014-15 358.65 9.47 2.62 370.752015-16 360.90 8.31 2.73 371.942016-17 336.65 7.40 3.05 347.102017-18 336.27 6.71 3.32 346.292018-19 342.34 3.36 1.70 347.40
Notes: These data should be read in conjunction with the explanatory notes.
Figure(s) may be incomplete for any period due to some unavailable revenue figures that are used to derive these numbers.
Data for the gambling revenue received by states and territories from 1 July 2000 onwards are not comparable with that of
preceding years because of the impact of changes brought about by the introduction of the GST.
Value ($)
GAMING RACING SPORTSBETTING TOTAL GAMBLING
Australian Gambling Statistics, 1993–94 to 2018–19, 36th edition
128

TABLE VIC 60VICTORIA
GOVERNMENT REVENUE FROM GAMBLINGAS A % OF TOTAL GAMBLING REVENUE
1993-94 75.47 24.53 -1994-95 84.30 15.59 0.111995-96 88.37 11.55 0.081996-97 89.50 10.43 0.071997-98 90.12 9.79 0.091998-99 90.37 9.52 0.101999-00 90.91 8.98 0.112000-01 92.61 7.30 0.092001-02 92.74 7.12 0.142002-03 92.18 7.68 0.132003-04 91.80 8.03 0.172004-05 91.59 8.22 0.192005-06 91.90 7.88 0.222006-07 91.76 7.99 0.252007-08 92.08 7.65 0.282008-09 92.04 7.66 0.302009-10 91.69 7.76 0.552010-11 91.92 7.44 0.642011-12 92.33 6.84 0.832012-13 95.98 3.50 0.522013-14 96.56 2.82 0.622014-15 96.74 2.56 0.712015-16 97.03 2.23 0.732016-17 96.99 2.13 0.882017-18 97.10 1.94 0.962018-19 98.54 0.97 0.49
Notes: These data should be read in conjunction with the explanatory notes.
Figure(s) may be incomplete for any period due to some unavailable revenue figures that are used to derive these numbers.
Data for the gambling revenue received by states and territories from 1 July 2000 onwards are not comparable with that of
preceding years because of the impact of changes brought about by the introduction of the GST.
Percentage (%)
GAMING RACING SPORTSBETTING
Australian Gambling Statistics, 1993–94 to 2018–19, 36th edition
129

TABLE VIC 61VICTORIA
GAMING MACHINES OPERATING AS AT 30 JUNE
2001-02 2,500 13,671 13,729 29,900 2002-03 2,500 13,556 13,704 29,760 2003-04 2,500 13,474 13,658 29,632 2004-05 2,500 13,397 13,727 29,624 2005-06 2,500 13,490 13,657 29,647 2006-07 2,500 13,594 13,685 29,779 2007-08 2,500 13,465 13,332 29,297 2008-09 2,500 13,434 13,338 29,272 2009-10 2,489 12,988 13,565 29,042 2010-11 2,500 12,895 13,663 29,058 2011-12 2,500 12,689 13,187 28,376 2012-13 2,500 12,796 13,272 28,568 2013-14 2,500 12,915 13,445 28,860 2014-15 2,628 12,738 13,526 28,892 2015-16 2,628 12,721 13,609 28,958 2016-17 2,628 12,748 13,617 28,993 2017-18 2,628 12,780 13,604 29,012 2018-19 2,628 12,826 13,622 29,076
Notes: These data should be read in conjunction with the explanatory notes.
NUMBER
CASINOS CLUBS HOTELS TOTAL MACHINES
Australian Gambling Statistics, 1993–94 to 2018–19, 36th edition
130

TABLE QLD 1QUEENSLAND
TOTAL RACING TURNOVER
1993-94 - 359.460 156.915 1,249.199 1,765.5741994-95 - 347.402 164.393 1,281.074 1,792.8691995-96 - 306.100 157.600 1,295.100 1,758.8001996-97 - 265.400 147.600 1,329.000 1,742.0001997-98 - 256.800 129.600 1,344.900 1,731.3001998-99 - 228.200 114.700 1,418.100 1,761.0001999-00 - 199.600 - (2) 1,526.065 1,725.6652000-01 - - (3) - 1,551.565 (4) 1,551.5652001-02 - - - 1,590.191 1,590.1912002-03 - - - 1,686.593 1,686.5932003-04 - - - 1,808.578 1,808.5782004-05 - - - 1,915.544 1,915.5442005-06 - - - 1,931.923 1,931.9232006-07 - - - 2,065.409 2,065.4092007-08 - - - 2,066.364 2,066.3642008-09 - - - 2,230.662 2,230.6622009-10 - - - 2,214.088 2,214.0882010-11 - - - 2,239.010 2,239.0102011-12 - - - 2,248.818 2,248.8182012-13 - - - 2,202.268 2,202.2682013-14 - - - 2,153.231 2,153.2312014-15 - - - 2,068.511 2,068.5112015-16 - - - 2,172.839 2,172.8392016-17 - - - 2,023.651 2,023.6512017-18 - - - 1,992.090 1,992.0902018-19 - - - 1,839.399 1,839.399
Notes: These data should be read in conjunction with the explanatory notes.
(1) Total racing figure incomplete due to data for one or more components being unavailable.
(2) Turnover is under $1 million for small on-course clubs running their own tote, from this period on.
(3) Figure is included in TAB turnover, from this period on.
(4) Includes both on and off-course betting, from this period on.
U = Unavailable data
TOTAL RACING (1)
Value ($ million)
BOOKMAKERS OFF COURSE (U)
BOOKMAKERS ON COURSE
ON-COURSE TOTALISATOR
TAB
Australian Gambling Statistics, 1993–94 to 2018–19, 36th edition
131

TABLE QLD 2QUEENSLAND
REAL RACING TURNOVER
1993-94 - 667.987 291.596 2,321.394 3,280.9771994-95 - 625.214 295.856 2,305.529 3,226.5991995-96 - 528.381 272.045 2,235.566 3,035.9921996-97 - 451.972 251.361 2,263.267 2,966.6001997-98 - 437.327 220.707 2,290.345 2,948.3781998-99 - 384.036 193.028 2,386.508 2,963.5711999-00 - 328.161 - (2) 2,508.992 2,837.1522000-01 - - (3) - 2,405.347 (4) 2,405.3472001-02 - - - 2,396.840 2,396.8402002-03 - - - 2,467.183 2,467.1832003-04 - - - 2,582.713 2,582.7132004-05 - - - 2,671.926 2,671.9262005-06 - - - 2,611.758 2,611.7582006-07 - - - 2,711.889 2,711.8892007-08 - - - 2,625.524 2,625.5242008-09 - - - 2,748.580 2,748.5802009-10 - - - 2,664.846 2,664.8462010-11 - - - 2,614.852 2,614.8522011-12 - - - 2,565.901 2,565.9012012-13 - - - 2,456.293 2,456.2932013-14 - - - 2,339.844 2,339.8442014-15 - - - 2,209.898 2,209.8982015-16 - - - 2,289.205 2,289.2052016-17 - - - 2,095.269 2,095.2692017-18 - - - 2,024.020 2,024.0202018-19 - - - 1,839.399 1,839.399
Notes: These data should be read in conjunction with the explanatory notes.
(1) Total racing figure incomplete due to data for one or more components being unavailable.
(2) Turnover is under $1 million for small on-course clubs running their own tote, from this period on.
(3) Figure is included in TAB turnover, from this period on.
(4) Includes both on and off-course betting, from this period on.
U = Unavailable data
TOTAL RACING (1)
Value ($ million)
BOOKMAKERS OFF COURSE (U)
BOOKMAKERS ON COURSE
ON-COURSE TOTALISATOR
TAB
Australian Gambling Statistics, 1993–94 to 2018–19, 36th edition
132

TABLE QLD 3QUEENSLAND
PER CAPITA RACING TURNOVER
1993-94 - 156.83 68.46 545.01 770.301994-95 - 147.85 69.96 545.21 763.021995-96 - 127.28 65.53 538.51 731.321996-97 - 108.16 60.15 541.64 709.961997-98 - 102.88 51.92 538.81 693.611998-99 - 89.95 45.21 558.95 694.101999-00 - 77.33 - (2) 591.23 668.562000-01 - - (3) - 589.80 (4) 589.802001-02 - - - 590.85 590.852002-03 - - - 610.08 610.082003-04 - - - 636.74 636.742004-05 - - - 657.47 657.472005-06 - - - 647.06 647.062006-07 - - - 674.41 674.412007-08 - - - 656.75 656.752008-09 - - - 689.76 689.762009-10 - - - 668.81 668.812010-11 - - - 663.72 663.722011-12 - - - 653.53 653.532012-13 - - - 626.98 626.982013-14 - - - 602.27 602.272014-15 - - - 570.19 570.192015-16 - - - 590.48 590.482016-17 - - - 540.89 540.892017-18 - - - 522.79 522.792018-19 - - - 473.94 473.94
Notes: These data should be read in conjunction with the explanatory notes.
(1) Total racing figure incomplete due to data for one or more components being unavailable.
(2) Turnover is under $1 million for small on-course clubs running their own tote, from this period on.
(3) Figure is included in TAB turnover, from this period on.
(4) Includes both on and off-course betting, from this period on.
U = Unavailable data
TOTAL RACING (1)
Value ($)
BOOKMAKERS OFF COURSE (U)
BOOKMAKERS ON COURSE
ON-COURSE TOTALISATOR
TAB
Australian Gambling Statistics, 1993–94 to 2018–19, 36th edition
133

TABLE QLD 4QUEENSLAND
REAL PER CAPITA RACING TURNOVER
1993-94 - 291.43 127.22 1,012.79 1,431.441994-95 - 266.08 125.91 981.21 1,373.201995-96 - 219.70 113.12 929.56 1,262.381996-97 - 184.20 102.44 922.40 1,209.051997-98 - 175.21 88.42 917.58 1,181.211998-99 - 151.37 76.08 940.64 1,168.091999-00 - 127.14 - (2) 972.03 1,099.172000-01 - - (3) - 914.34 (4) 914.342001-02 - - - 890.57 890.572002-03 - - - 892.43 892.432003-04 - - - 909.29 909.292004-05 - - - 917.09 917.092005-06 - - - 874.75 874.752006-07 - - - 885.50 885.502007-08 - - - 834.47 834.472008-09 - - - 849.91 849.912009-10 - - - 804.96 804.962010-11 - - - 775.13 775.132011-12 - - - 745.68 745.682012-13 - - - 699.30 699.302013-14 - - - 654.47 654.472014-15 - - - 609.17 609.172015-16 - - - 622.11 622.112016-17 - - - 560.03 560.032017-18 - - - 531.17 531.172018-19 - - - 473.94 473.94
Notes: These data should be read in conjunction with the explanatory notes.
(1) Total racing figure incomplete due to data for one or more components being unavailable.
(2) Turnover is under $1 million for small on-course clubs running their own tote, from this period on.
(3) Figure is included in TAB turnover, from this period on.
(4) Includes both on and off-course betting, from this period on.
U = Unavailable data
TOTAL RACING (1)
Value ($)
BOOKMAKERS OFF COURSE (U)
BOOKMAKERS ON COURSE
ON-COURSE TOTALISATOR
TAB
Australian Gambling Statistics, 1993–94 to 2018–19, 36th edition
134

TABLE QLD 5QUEENSLAND
TOTAL RACING EXPENDITURE
1993-94 - 19.770 32.304 205.184 257.2581994-95 - 18.950 27.800 213.600 260.3501995-96 - 16.899 26.600 218.800 262.2991996-97 - 14.740 24.900 224.100 263.7401997-98 - 14.100 21.900 227.300 263.3001998-99 - 12.600 19.400 239.700 271.7001999-00 - 10.900 - (2) 240.033 250.9332000-01 - - (3) - 244.997 (4) 244.9972001-02 - - - 252.572 252.5722002-03 - - - 266.673 266.6732003-04 - - - 287.020 287.0202004-05 - - - 304.181 304.1812005-06 - - - 308.844 308.8442006-07 - - - 328.634 328.6342007-08 - - - 328.820 328.8202008-09 - - - 355.849 355.8492009-10 - - - 349.614 349.6142010-11 - - - 348.011 348.0112011-12 - - - 355.894 355.8942012-13 - - - 357.290 357.2902013-14 - - - 345.594 345.5942014-15 - - - 339.189 339.1892015-16 - - - 332.026 332.0262016-17 - - - 323.661 323.6612017-18 - - - 320.311 320.3112018-19 - - - 310.794 310.794
Notes: These data should be read in conjunction with the explanatory notes.
(1) Total racing figure incomplete due to data for one or more components being unavailable.
(2) Expenditure is under $1 million for small on-course clubs running their own tote, from this period on.
(3) Figure is included in TAB expenditure, from this period on.
(4) Includes both on and off-course betting, from this period on.
U = Unavailable data
TOTAL RACING (1)
Value ($ million)
BOOKMAKERS OFF COURSE (U)
BOOKMAKERS ON COURSE
ON-COURSE TOTALISATOR
TAB
Australian Gambling Statistics, 1993–94 to 2018–19, 36th edition
135

TABLE QLD 6QUEENSLAND
REAL RACING EXPENDITURE
1993-94 - 36.739 60.030 381.295 478.0641994-95 - 34.104 50.031 384.413 468.5481995-96 - 29.171 45.916 377.687 452.7741996-97 - 25.102 42.404 381.639 449.1451997-98 - 24.012 37.295 387.089 448.3961998-99 - 21.204 32.648 403.389 457.2411999-00 - 17.921 - (2) 394.636 412.5572000-01 - - (3) - 379.812 (4) 379.8122001-02 - - - 380.693 380.6932002-03 - - - 390.095 390.0952003-04 - - - 409.875 409.8752004-05 - - - 424.292 424.2922005-06 - - - 417.524 417.5242006-07 - - - 431.498 431.4982007-08 - - - 417.799 417.7992008-09 - - - 438.471 438.4712009-10 - - - 420.791 420.7912010-11 - - - 406.428 406.4282011-12 - - - 406.075 406.0752012-13 - - - 398.502 398.5022013-14 - - - 375.545 375.5452014-15 - - - 362.373 362.3732015-16 - - - 349.808 349.8082016-17 - - - 335.116 335.1162017-18 - - - 325.445 325.4452018-19 - - - 310.794 310.794
Notes: These data should be read in conjunction with the explanatory notes.
(1) Total racing figure incomplete due to data for one or more components being unavailable.
(2) Expenditure is under $1 million for small on-course clubs running their own tote, from this period on.
(3) Figure is included in TAB expenditure, from this period on.
(4) Includes both on and off-course betting, from this period on.
U = Unavailable data
TOTAL RACING (1)
Value ($ million)
BOOKMAKERS OFF COURSE (U)
BOOKMAKERS ON COURSE
ON-COURSE TOTALISATOR
TAB
Australian Gambling Statistics, 1993–94 to 2018–19, 36th edition
136

TABLE QLD 7QUEENSLAND
PER CAPITA RACING EXPENDITURE
1993-94 - 8.63 14.09 89.52 112.241994-95 - 8.06 11.83 90.91 110.801995-96 - 7.03 11.06 90.98 109.071996-97 - 6.01 10.15 91.33 107.491997-98 - 5.65 8.77 91.06 105.491998-99 - 4.97 7.65 94.48 107.091999-00 - 4.22 - (2) 92.99 97.222000-01 - - (3) - 93.13 (4) 93.132001-02 - - - 93.85 93.852002-03 - - - 96.46 96.462003-04 - - - 101.05 101.052004-05 - - - 104.40 104.402005-06 - - - 103.44 103.442006-07 - - - 107.31 107.312007-08 - - - 104.51 104.512008-09 - - - 110.04 110.042009-10 - - - 105.61 105.612010-11 - - - 103.16 103.162011-12 - - - 103.43 103.432012-13 - - - 101.72 101.722013-14 - - - 96.66 96.662014-15 - - - 93.50 93.502015-16 - - - 90.23 90.232016-17 - - - 86.51 86.512017-18 - - - 84.06 84.062018-19 - - - 80.08 80.08
Notes: These data should be read in conjunction with the explanatory notes.
(1) Total racing figure incomplete due to data for one or more components being unavailable.
(2) Expenditure is under $1 million for small on-course clubs running their own tote, from this period on.
(3) Figure is included in TAB expenditure, from this period on.
(4) Includes both on and off-course betting, from this period on.
U = Unavailable data
TOTAL RACING (1)
Value ($)
BOOKMAKERS OFF COURSE (U)
BOOKMAKERS ON COURSE
ON-COURSE TOTALISATOR
TAB
Australian Gambling Statistics, 1993–94 to 2018–19, 36th edition
137

TABLE QLD 8QUEENSLAND
REAL PER CAPITA RACING EXPENDITURE
1993-94 - 16.03 26.19 166.35 208.571994-95 - 14.51 21.29 163.60 199.411995-96 - 12.13 19.09 157.04 188.271996-97 - 10.23 17.28 155.54 183.051997-98 - 9.62 14.94 155.08 179.641998-99 - 8.36 12.87 159.00 180.221999-00 - 6.94 - (2) 152.89 159.832000-01 - - (3) - 144.38 (4) 144.382001-02 - - - 141.45 141.452002-03 - - - 141.11 141.112003-04 - - - 144.30 144.302004-05 - - - 145.63 145.632005-06 - - - 139.84 139.842006-07 - - - 140.90 140.902007-08 - - - 132.79 132.792008-09 - - - 135.58 135.582009-10 - - - 127.11 127.112010-11 - - - 120.48 120.482011-12 - - - 118.01 118.012012-13 - - - 113.45 113.452013-14 - - - 105.04 105.042014-15 - - - 99.89 99.892015-16 - - - 95.06 95.062016-17 - - - 89.57 89.572017-18 - - - 85.41 85.412018-19 - - - 80.08 80.08
Notes: These data should be read in conjunction with the explanatory notes.
(1) Total racing figure incomplete due to data for one or more components being unavailable.
(2) Expenditure is under $1 million for small on-course clubs running their own tote, from this period on.
(3) Figure is included in TAB expenditure, from this period on.
(4) Includes both on and off-course betting, from this period on.
U = Unavailable data
TOTAL RACING (1)
Value ($)
BOOKMAKERS OFF COURSE (U)
BOOKMAKERS ON COURSE
ON-COURSE TOTALISATOR
TAB
Australian Gambling Statistics, 1993–94 to 2018–19, 36th edition
138

TABLE QLD 9QUEENSLAND
RACING EXPENDITUREAS A % OF HDI
1993-94 - 0.039 0.063 0.400 0.5021994-95 - 0.035 0.051 0.390 0.4751995-96 - 0.029 0.046 0.375 0.4491996-97 - 0.023 0.040 0.356 0.4191997-98 - 0.022 0.034 0.348 0.4031998-99 - 0.019 0.029 0.354 0.4011999-00 - 0.015 - (2) 0.336 0.3512000-01 - - (3) - 0.312 (4) 0.3122001-02 - - - 0.289 0.2892002-03 - - - 0.300 0.3002003-04 - - - 0.289 0.2892004-05 - - - 0.275 0.2752005-06 - - - 0.255 0.2552006-07 - - - 0.240 0.2402007-08 - - - 0.218 0.2182008-09 - - - 0.211 0.2112009-10 - - - 0.202 0.2022010-11 - - - 0.189 0.1892011-12 - - - 0.184 0.1842012-13 - - - 0.185 0.1852013-14 - - - 0.174 0.1742014-15 - - - 0.163 0.1632015-16 - - - 0.155 0.1552016-17 - - - 0.148 0.1482017-18 - - - 0.141 0.1412018-19 - - - 0.132 0.132
Notes: These data should be read in conjunction with the explanatory notes.
(1) Total racing figure incomplete due to data for one or more components being unavailable.
(2) Expenditure is under $1 million for small on-course clubs running their own tote, from this period on.
(3) Figure is included in TAB expenditure, from this period on.
(4) Includes both on and off-course betting, from this period on.
U = Unavailable data
Percentage (%)
BOOKMAKERS OFF COURSE (U)
BOOKMAKERS ON COURSE
ON-COURSE TOTALISATOR
TABTOTAL RACING
(1)
Australian Gambling Statistics, 1993–94 to 2018–19, 36th edition
139

TABLE QLD 10QUEENSLAND
RACING EXPENDITURESHARE OF MARKET
1993-94 - 7.69 12.56 79.761994-95 - 7.28 10.68 82.041995-96 - 6.44 10.14 83.421996-97 - 5.59 9.44 84.971997-98 - 5.36 8.32 86.331998-99 - 4.64 7.14 88.221999-00 - 4.34 - (1) 95.662000-01 - - (2) - 100.00 (3)
2001-02 - - - 100.002002-03 - - - 100.002003-04 - - - 100.002004-05 - - - 100.002005-06 - - - 100.002006-07 - - - 100.002007-08 - - - 100.002008-09 - - - 100.002009-10 - - - 100.002010-11 - - - 100.002011-12 - - - 100.002012-13 - - - 100.002013-14 - - - 100.002014-15 - - - 100.002015-16 - - - 100.002016-17 - - - 100.002017-18 - - - 100.002018-19 - - - 100.00
Notes: These data should be read in conjunction with the explanatory notes.
(1) Expenditure is under $1 million for small on-course clubs running their own tote, from this period on.
(2) Figure is included in TAB expenditure, from this period on.
(3) Includes both on and off-course betting, from this period on.
U = Unavailable data
ON-COURSE TOTALISATOR
TAB
Percentage (%)
BOOKMAKERS OFF COURSE (U)
BOOKMAKERS ON COURSE
Australian Gambling Statistics, 1993–94 to 2018–19, 36th edition
140

TABLE QLD 11QUEENSLAND
GOVERNMENT REVENUE FROM RACING
1993-94 3.594 5.203 65.915 74.7121994-95 3.614 5.394 68.429 77.4371995-96 3.037 5.118 69.757 77.9121996-97 2.700 5.100 72.000 79.8001997-98 2.600 4.200 73.100 79.9001998-99 2.300 3.700 75.700 81.7001999-00 2.000 - (1) 48.007 50.0072000-01 - (2) - 26.549 (3) 26.5492001-02 - - 26.904 26.9042002-03 - - 28.416 28.4162003-04 - - 30.580 30.5802004-05 - - 32.384 32.3842005-06 - - 33.692 33.6922006-07 - - 35.851 35.8512007-08 - - 35.871 35.8712008-09 - - 38.820 38.8202009-10 - - 38.140 38.1402010-11 - - 37.965 37.9652011-12 - - 38.825 38.8252012-13 - - 38.977 38.9772013-14 - - 37.701 37.7012014-15 - - 11.795 11.7952015-16 - - 10.805 10.8052016-17 - - 10.020 10.0202017-18 - - 9.545 9.5452018-19 - - - U -
Notes: These data should be read in conjunction with the explanatory notes.
Data for the gambling revenue received by states and territories from 1 July 2000 onwards are not comparable
with that of preceding years because of the impact of changes brought about by the introduction of the GST.
(1) Data are combined with Government Revenue from TAB, from this period on.
(2) Bookmaker turnover tax was abolished on 30 June 2000.
(3) Includes both on and off-course betting, from this period on.
U = Unavailable data
Value ($ million)
BOOKMAKERSON-COURSE
TOTALISATORTAB TOTAL RACING
Australian Gambling Statistics, 1993–94 to 2018–19, 36th edition
141

TABLE QLD 12QUEENSLAND
REAL GOVERNMENT REVENUE FROM RACING
1993-94 6.679 9.669 122.490 138.8381994-95 6.504 9.707 123.151 139.3621995-96 5.242 8.835 120.413 134.4901996-97 4.598 8.685 122.615 135.8981997-98 4.428 7.153 124.488 136.0691998-99 3.871 6.227 127.395 137.4921999-00 3.288 - (1) 78.928 82.2162000-01 - (2) - 41.158 (3) 41.1582001-02 - - 40.551 40.5512002-03 - - 41.568 41.5682003-04 - - 43.669 43.6692004-05 - - 45.171 45.1712005-06 - - 45.548 45.5482006-07 - - 47.073 47.0732007-08 - - 45.578 45.5782008-09 - - 47.833 47.8332009-10 - - 45.905 45.9052010-11 - - 44.338 44.3382011-12 - - 44.299 44.2992012-13 - - 43.473 43.4732013-14 - - 40.968 40.9682014-15 - - 12.601 12.6012015-16 - - 11.384 11.3842016-17 - - 10.375 10.3752017-18 - - 9.698 9.6982018-19 - - - U -
Notes: These data should be read in conjunction with the explanatory notes.
Data for the gambling revenue received by states and territories from 1 July 2000 onwards are not comparable
with that of preceding years because of the impact of changes brought about by the introduction of the GST.
(1) Data are combined with Government Revenue from TAB, from this period on.
(2) Bookmaker turnover tax was abolished on 30 June 2000.
(3) Includes both on and off-course betting, from this period on.
U = Unavailable data
Value ($ million)
BOOKMAKERSON-COURSE
TOTALISATORTAB TOTAL RACING
Australian Gambling Statistics, 1993–94 to 2018–19, 36th edition
142

TABLE QLD 13QUEENSLAND
PER CAPITA REVENUE FROM RACING
1993-94 1.57 2.27 28.76 32.601994-95 1.54 2.30 29.12 32.961995-96 1.26 2.13 29.01 32.401996-97 1.10 2.08 29.34 32.521997-98 1.04 1.68 29.29 32.011998-99 0.91 1.46 29.84 32.201999-00 0.77 - (1) 18.60 19.372000-01 - (2) - 10.09 (3) 10.092001-02 - - 10.00 10.002002-03 - - 10.28 10.282003-04 - - 10.77 10.772004-05 - - 11.12 11.122005-06 - - 11.28 11.282006-07 - - 11.71 11.712007-08 - - 11.40 11.402008-09 - - 12.00 12.002009-10 - - 11.52 11.522010-11 - - 11.25 11.252011-12 - - 11.28 11.282012-13 - - 11.10 11.102013-14 - - 10.55 10.552014-15 - - 3.25 3.252015-16 - - 2.94 2.942016-17 - - 2.68 2.682017-18 - - 2.50 2.502018-19 - - - U -
Notes: These data should be read in conjunction with the explanatory notes.
Data for the gambling revenue received by states and territories from 1 July 2000 onwards are not comparable
with that of preceding years because of the impact of changes brought about by the introduction of the GST.
(1) Data are combined with Government Revenue from TAB, from this period on.
(2) Bookmaker turnover tax was abolished on 30 June 2000.
(3) Includes both on and off-course betting, from this period on.
U = Unavailable data
Value ($)
BOOKMAKERSON-COURSE
TOTALISATORTAB TOTAL RACING
Australian Gambling Statistics, 1993–94 to 2018–19, 36th edition
143

TABLE QLD 14QUEENSLAND
REAL PER CAPITA REVENUE FROM RACING
1993-94 2.91 4.22 53.44 60.571994-95 2.77 4.13 52.41 59.311995-96 2.18 3.67 50.07 55.921996-97 1.87 3.54 49.97 55.391997-98 1.77 2.87 49.87 54.511998-99 1.53 2.45 50.21 54.191999-00 1.27 - (1) 30.58 31.852000-01 - (2) - 15.65 (3) 15.652001-02 - - 15.07 15.072002-03 - - 15.04 15.042003-04 - - 15.37 15.372004-05 - - 15.50 15.502005-06 - - 15.26 15.262006-07 - - 15.37 15.372007-08 - - 14.49 14.492008-09 - - 14.79 14.792009-10 - - 13.87 13.872010-11 - - 13.14 13.142011-12 - - 12.87 12.872012-13 - - 12.38 12.382013-14 - - 11.46 11.462014-15 - - 3.47 3.472015-16 - - 3.09 3.092016-17 - - 2.77 2.772017-18 - - 2.54 2.542018-19 - - - U -
Notes: These data should be read in conjunction with the explanatory notes.
Data for the gambling revenue received by states and territories from 1 July 2000 onwards are not comparable
with that of preceding years because of the impact of changes brought about by the introduction of the GST.
(1) Data are combined with Government Revenue from TAB, from this period on.
(2) Bookmaker turnover tax was abolished on 30 June 2000.
(3) Includes both on and off-course betting, from this period on.
U = Unavailable data
Value ($)
BOOKMAKERSON-COURSE
TOTALISATORTAB TOTAL RACING
Australian Gambling Statistics, 1993–94 to 2018–19, 36th edition
144

TABLE QLD 15QUEENSLAND
GOVERNMENT REVENUE FROM RACINGAS A % OF TOTAL GAMBLING REVENUE
1993-94 1.07 1.55 19.64 22.261994-95 0.94 1.40 17.76 20.101995-96 0.73 1.23 16.74 18.701996-97 0.61 1.15 16.18 17.931997-98 0.51 0.83 14.37 15.711998-99 0.39 0.63 12.89 13.911999-00 0.33 - (1) 7.82 8.152000-01 - (2) - 5.21 (3) 5.212001-02 - - 4.78 4.782002-03 - - 4.49 4.492003-04 - - 4.25 4.252004-05 - - 4.05 4.052005-06 - - 4.01 4.012006-07 - - 4.39 4.392007-08 - - 4.08 4.082008-09 - - 4.19 4.192009-10 - - 4.13 4.132010-11 - - 4.01 4.012011-12 - - 3.87 3.872012-13 - - 3.75 3.752013-14 - - 3.61 3.612014-15 - - 1.09 1.092015-16 - - 0.95 0.952016-17 - - 0.88 0.882017-18 - - 0.80 0.802018-19 - - - U -
Notes: These data should be read in conjunction with the explanatory notes.
Data for the gambling revenue received by states and territories from 1 July 2000 onwards are not comparable
with that of preceding years because of the impact of changes brought about by the introduction of the GST.
(1) Data are combined with Government Revenue from TAB, from this period on.
(2) Bookmaker turnover tax was abolished on 30 June 2000.
(3) Includes both on and off-course betting, from this period on.
U = Unavailable data
ON-COURSE TOTALISATOR
TAB TOTAL RACING
Percentage (%)
BOOKMAKERS
Australian Gambling Statistics, 1993–94 to 2018–19, 36th edition
145

TABLE QLD 16QUEENSLAND
TOTAL GAMING TURNOVER
1993-94 1,111.571 2,336.000 220.353 - - 12.400 335.789 183.027 7.173 4,206.3131994-95 1,691.913 2,698.000 215.393 - - 10.100 377.265 184.914 4.555 5,182.1401995-96 2,479.747 3,049.621 192.308 - - 10.376 395.617 201.412 4.668 6,333.7491996-97 2,880.000 3,505.287 205.271 - - 7.100 375.234 191.400 3.417 7,167.7091997-98 4,478.000 4,058.130 236.684 - 152.595 5.800 402.557 235.303 3.002 9,572.0711998-99 5,139.000 5,214.254 247.465 - 200.916 6.381 454.319 233.650 3.232 11,499.2171999-00 5,834.000 6,348.113 252.629 0.039 198.679 3.912 462.618 129.000 3.383 13,232.3732000-01 5,837.000 7,534.235 215.470 13.000 219.445 2.568 498.994 - (1) 3.824 14,324.536 (2)
2001-02 5,640.517 8,544.513 220.941 - (3) 237.243 1.688 502.275 - 3.295 15,150.4722002-03 5,675.618 (4) 10,038.249 217.467 - 254.750 1.722 549.733 - 3.294 16,740.8332003-04 5,921.080 12,176.068 224.850 - 277.522 1.676 558.687 - 2.978 19,162.8612004-05 5,725.715 14,393.736 226.902 - 314.652 1.307 581.818 - 3.191 21,247.3212005-06 5,512.349 15,962.271 221.818 - 335.229 1.593 612.121 - 2.938 22,648.3192006-07 5,303.247 15,361.427 231.304 - 332.896 1.333 664.211 - 3.103 21,897.5212007-08 5,604.050 17,141.617 232.424 - 342.404 1.335 701.072 - 3.218 24,026.1192008-09 6,041.125 18,189.755 234.122 - 370.192 1.422 776.380 - 3.440 25,616.4362009-10 5,867.520 17,720.509 226.588 - 366.650 1.224 775.841 - 3.299 24,961.6312010-11 5,995.546 18,856.420 215.196 - 401.963 1.443 744.472 - 2.877 26,217.9172011-12 6,209.103 19,895.643 217.765 - 425.445 1.109 834.092 - 3.031 27,586.1882012-13 6,050.237 20,715.674 196.027 - 441.159 0.797 940.830 - 3.130 28,347.8542013-14 5,920.062 21,501.850 191.237 - 443.544 - (5) 805.869 - 2.481 28,865.0432014-15 6,824.447 22,909.324 194.644 - 425.523 - 823.043 - 2.316 31,179.2972015-16 7,131.292 24,186.179 189.644 - 400.006 - 905.456 - 1.940 32,814.5172016-17 7,533.593 24,770.003 183.124 - 404.776 - 844.027 - 2.488 33,738.0102017-18 7,720.032 26,082.118 181.693 - 383.037 - 901.514 - 2.891 35,271.2852018-19 8,145.991 26,820.376 169.306 - 405.404 - 1,143.367 - - (6) 36,684.444
Notes: These data should be read in conjunction with the explanatory notes.
(1) Reliable figures are no longer available since the introduction of the Charitable and Non-Profit Gaming Act 1999 .
(2) Total gaming figure incomplete from this period on, due to data for one or more components being unavailable.
(3) Interactive gaming was banned in August 2001.
(4) Casino turnover includes actual turnover for keno and gaming machines and handle for table games, from this period on.
(5) No longer operational.
(6) Pools was withdrawn from the Australian Lottery Market on 23 June 2018.
KENO
Value ($ million)
CASINOGAMING
MACHINESINSTANT LOTTERY
INTERACTIVE GAMING
LOTTERIES LOTTO MINOR GAMING POOLS TOTAL GAMING
Australian Gambling Statistics, 1993–94 to 2018–19, 36th edition
146

TABLE QLD 17QUEENSLAND
REAL GAMING TURNOVER
1993-94 2,065.638 4,341.003 409.483 - - 23.043 623.999 340.120 13.330 7,816.6171994-95 3,044.910 4,855.549 387.639 - - 18.177 678.958 332.787 8.198 9,326.2171995-96 4,280.471 5,264.172 331.957 - - 17.911 682.903 347.672 8.058 10,933.1431996-97 4,904.597 5,969.451 349.573 - - 12.091 639.018 325.951 5.819 12,206.5011997-98 7,625.967 6,910.935 403.069 - 259.867 9.877 685.549 400.717 5.112 16,301.0941998-99 8,648.376 8,775.020 416.457 - 338.120 10.739 764.569 393.207 5.439 19,351.9271999-00 9,591.634 10,436.883 415.345 0.064 326.647 6.432 760.587 212.088 5.562 21,755.2412000-01 9,048.936 11,680.112 334.037 20.154 340.199 3.981 773.576 - (1) 5.928 22,206.923 (2)
2001-02 8,501.757 12,878.850 333.017 - (3) 357.588 2.544 757.062 - 4.966 22,835.7842002-03 8,302.410 (4) 14,684.157 318.115 - 372.654 2.519 804.161 - 4.819 24,488.8342003-04 8,455.510 17,387.852 321.094 - 396.311 2.393 797.825 - 4.253 27,365.2372004-05 7,986.602 20,077.326 316.498 - 438.897 1.823 811.558 - 4.451 29,637.1562005-06 7,452.121 21,579.326 299.875 - 453.195 2.154 827.524 - 3.972 30,618.1662006-07 6,963.182 20,169.607 303.703 - 437.094 1.750 872.111 - 4.074 28,751.5212007-08 7,120.513 21,780.161 295.318 - 435.059 1.696 890.783 - 4.089 30,527.6192008-09 7,443.762 22,413.078 288.481 - 456.144 1.752 956.641 - 4.239 31,564.0972009-10 7,062.068 21,328.165 272.718 - 441.295 1.473 933.792 - 3.971 30,043.4822010-11 7,001.963 22,021.674 251.319 - 469.437 1.685 869.440 - 3.360 30,618.8772011-12 7,084.587 22,700.929 248.470 - 485.433 1.265 951.699 - 3.458 31,475.8412012-13 6,748.114 23,105.165 218.638 - 492.045 0.889 1,049.352 - 3.491 31,617.6942013-14 6,433.134 23,365.344 207.811 - 481.984 - (5) 875.711 - 2.696 31,366.6802014-15 7,290.912 24,475.223 207.948 - 454.608 - 879.300 - 2.474 33,310.4662015-16 7,513.208 25,481.468 199.800 - 421.428 - 953.948 - 2.044 34,571.8962016-17 7,800.208 25,646.618 189.605 - 419.101 - 873.897 - 2.576 34,932.0052017-18 7,843.772 26,500.175 184.605 - 389.177 - 915.964 - 2.938 35,836.6312018-19 8,145.991 26,820.376 169.306 - 405.404 - 1,143.367 - - (6) 36,684.444
Notes: These data should be read in conjunction with the explanatory notes.
(1) Reliable figures are no longer available since the introduction of the Charitable and Non-Profit Gaming Act 1999 .
(2) Total gaming figure incomplete from this period on, due to data for one or more components being unavailable.
(3) Interactive gaming was banned in August 2001.
(4) Casino turnover includes actual turnover for keno and gaming machines and handle for table games, from this period on.
(5) No longer operational.
(6) Pools was withdrawn from the Australian Lottery Market on 23 June 2018.
KENO
Value ($ million)
CASINOGAMING
MACHINESINSTANT LOTTERY
INTERACTIVE GAMING
LOTTERIES LOTTO MINOR GAMING POOLS TOTAL GAMING
Australian Gambling Statistics, 1993–94 to 2018–19, 36th edition
147

TABLE QLD 18QUEENSLAND
PER CAPITA GAMING TURNOVER
1993-94 484.96 1,019.16 96.14 - - 5.41 146.50 79.85 3.13 1,835.161994-95 720.06 1,148.24 91.67 - - 4.30 160.56 78.70 1.94 2,205.461995-96 1,031.09 1,268.04 79.96 - - 4.31 164.50 83.75 1.94 2,633.601996-97 1,173.75 1,428.59 83.66 - - 2.89 152.93 78.01 1.39 2,921.221997-98 1,794.02 1,625.81 94.82 - 61.13 2.32 161.28 94.27 1.20 3,834.861998-99 2,025.54 2,055.20 97.54 - 79.19 2.52 179.07 92.09 1.27 4,532.431999-00 2,260.21 2,459.39 97.87 0.02 76.97 1.52 179.23 49.98 1.31 5,126.492000-01 2,218.82 2,863.99 81.91 4.94 83.42 0.98 189.68 - (1) 1.45 5,445.18 (2)
2001-02 2,095.79 3,174.80 82.09 - (3) 88.15 0.63 186.63 - 1.22 5,629.312002-03 2,052.99 (4) 3,631.04 78.66 - 92.15 0.62 198.85 - 1.19 6,055.502003-04 2,084.62 4,286.80 79.16 - 97.71 0.59 196.70 - 1.05 6,746.632004-05 1,965.24 4,940.36 77.88 - 108.00 0.45 199.70 - 1.10 7,292.722005-06 1,846.24 5,346.22 74.29 - 112.28 0.53 205.02 - 0.98 7,585.562006-07 1,731.65 5,015.90 75.53 - 108.70 0.44 216.88 - 1.01 7,150.112007-08 1,781.14 5,448.14 73.87 - 108.83 0.42 222.82 - 1.02 7,636.252008-09 1,868.03 5,624.62 72.39 - 114.47 0.44 240.07 - 1.06 7,921.092009-10 1,772.39 5,352.80 68.44 - 110.75 0.37 234.36 - 1.00 7,540.112010-11 1,777.29 5,589.69 63.79 - 119.16 0.43 220.69 - 0.85 7,771.902011-12 1,804.44 5,781.92 63.29 - 123.64 0.32 242.40 - 0.88 8,016.892012-13 1,722.50 5,897.73 55.81 - 125.60 0.23 267.85 - 0.89 8,070.612013-14 1,655.87 6,014.18 53.49 - 124.06 - (5) 225.41 - 0.69 8,073.702014-15 1,881.18 6,315.04 53.65 - 117.30 - 226.87 - 0.64 8,594.692015-16 1,937.97 6,572.75 51.54 - 108.70 - 246.06 - 0.53 8,917.552016-17 2,013.61 6,620.64 48.95 - 108.19 - 225.60 - 0.66 9,017.652017-18 2,025.99 6,844.81 47.68 - 100.52 - 236.59 - 0.76 9,256.352018-19 2,098.89 6,910.51 43.62 - 104.46 - 294.60 - - (6) 9,452.07
Notes: These data should be read in conjunction with the explanatory notes.
(1) Reliable figures are no longer available since the introduction of the Charitable and Non-Profit Gaming Act 1999 .
(2) Total gaming figure incomplete from this period on, due to data for one or more components being unavailable.
(3) Interactive gaming was banned in August 2001.
(4) Casino turnover includes actual turnover for keno and gaming machines and handle for table games, from this period on.
(5) No longer operational.
(6) Pools was withdrawn from the Australian Lottery Market on 23 June 2018.
KENO
Value ($)
CASINOGAMING
MACHINESINSTANT LOTTERY
INTERACTIVE GAMING
LOTTERIES LOTTO MINOR GAMING POOLS TOTAL GAMING
Australian Gambling Statistics, 1993–94 to 2018–19, 36th edition
148

TABLE QLD 19QUEENSLAND
REAL PER CAPITA GAMING TURNOVER
1993-94 901.21 1,893.92 178.65 - - 10.05 272.24 148.39 5.82 3,410.281994-95 1,295.88 2,066.47 164.97 - - 7.74 288.96 141.63 3.49 3,969.131995-96 1,779.83 2,188.86 138.03 - - 7.45 283.95 144.56 3.35 4,546.041996-97 1,998.88 2,432.87 142.47 - - 4.93 260.43 132.84 2.37 4,974.791997-98 3,055.20 2,768.73 161.48 - 104.11 3.96 274.65 160.54 2.05 6,530.721998-99 3,408.77 3,458.68 164.15 - 133.27 4.23 301.36 154.98 2.14 7,627.581999-00 3,715.99 4,043.46 160.91 0.02 126.55 2.49 294.67 82.17 2.15 8,428.422000-01 3,439.77 4,439.96 126.98 7.66 129.32 1.51 294.06 - (1) 2.25 8,441.51 (2)
2001-02 3,158.91 4,785.26 123.74 - (3) 132.87 0.95 281.29 - 1.85 8,484.862002-03 3,003.15 (4) 5,311.56 115.07 - 134.80 0.91 290.88 - 1.74 8,858.122003-04 2,976.91 6,121.70 113.05 - 139.53 0.84 280.89 - 1.50 9,634.422004-05 2,741.24 6,891.14 108.63 - 150.64 0.63 278.55 - 1.53 10,172.362005-06 2,495.93 7,227.53 100.44 - 151.79 0.72 277.16 - 1.33 10,254.892006-07 2,273.66 6,585.90 99.17 - 142.72 0.57 284.77 - 1.33 9,388.122007-08 2,263.12 6,922.41 93.86 - 138.28 0.54 283.12 - 1.30 9,702.622008-09 2,301.75 6,930.55 89.20 - 141.05 0.54 295.81 - 1.31 9,760.222009-10 2,133.22 6,442.56 82.38 - 133.30 0.45 282.07 - 1.20 9,075.172010-11 2,075.62 6,527.98 74.50 - 139.16 0.50 257.73 - 1.00 9,076.492011-12 2,058.87 6,597.17 72.21 - 141.07 0.37 276.58 - 1.01 9,147.272012-13 1,921.18 6,578.02 62.25 - 140.08 0.25 298.75 - 0.99 9,001.532013-14 1,799.38 6,535.40 58.13 - 134.81 - (5) 244.94 - 0.75 8,773.422014-15 2,009.77 6,746.69 57.32 - 125.31 - 242.38 - 0.68 9,182.162015-16 2,041.76 6,924.75 54.30 - 114.53 - 259.24 - 0.56 9,395.132016-17 2,084.87 6,854.94 50.68 - 112.02 - 233.58 - 0.69 9,336.782017-18 2,058.46 6,954.52 48.45 - 102.13 - 240.38 - 0.77 9,404.712018-19 2,098.89 6,910.51 43.62 - 104.46 - 294.60 - - (6) 9,452.07
Notes: These data should be read in conjunction with the explanatory notes.
(1) Reliable figures are no longer available since the introduction of the Charitable and Non-Profit Gaming Act 1999 .
(2) Total gaming figure incomplete from this period on, due to data for one or more components being unavailable.
(3) Interactive gaming was banned in August 2001.
(4) Casino turnover includes actual turnover for keno and gaming machines and handle for table games, from this period on.
(5) No longer operational.
(6) Pools was withdrawn from the Australian Lottery Market on 23 June 2018.
KENO
Value ($)
CASINOGAMING
MACHINESINSTANT LOTTERY
INTERACTIVE GAMING
LOTTERIES LOTTO MINOR GAMING POOLS TOTAL GAMING
Australian Gambling Statistics, 1993–94 to 2018–19, 36th edition
149

TABLE QLD 20QUEENSLAND
TOTAL GAMING EXPENDITURE
1993-94 230.095 338.720 88.141 - - 4.588 134.316 100.665 3.587 900.1111994-95 253.787 391.210 86.157 - - 3.737 150.906 101.703 2.278 989.7771995-96 388.675 450.529 76.923 - - 3.632 152.786 110.777 2.334 1,185.6561996-97 450.351 519.003 82.108 - - 2.485 150.094 105.270 1.708 1,311.0191997-98 468.347 602.295 94.673 - 38.591 2.030 161.023 129.417 1.501 1,497.8771998-99 476.800 757.411 98.986 - 52.406 2.419 201.862 128.508 1.728 1,720.1201999-00 530.700 871.303 101.051 - 54.160 1.320 205.560 - (1) 1.807 1,765.901 (2)
2000-01 543.001 1,014.000 86.187 - 53.565 1.015 221.389 - 2.038 1,921.1952001-02 541.137 1,129.402 88.376 - 65.186 0.700 222.898 - 1.760 2,049.4592002-03 530.047 1,277.604 86.986 - 67.019 0.610 243.859 - 1.759 2,207.8842003-04 592.123 1,498.979 89.940 - 68.471 0.563 248.108 - 1.591 2,499.7752004-05 549.425 1,677.468 90.761 - 79.914 0.442 258.468 - 1.703 2,658.1812005-06 578.400 1,775.561 88.727 - 86.012 0.605 271.762 - 1.568 2,802.6352006-07 525.803 1,676.657 92.522 - 79.343 0.468 294.481 - 1.654 2,670.9282007-08 560.346 1,802.217 93.769 - 86.249 0.470 310.076 - 1.714 2,854.8422008-09 579.785 1,860.606 93.659 - 96.438 0.557 342.388 - 1.832 2,975.2652009-10 550.179 1,775.511 90.635 - 89.151 0.482 342.062 - 1.757 2,849.7772010-11 568.710 1,868.357 86.079 - 100.424 0.578 328.858 - 1.534 2,954.5402011-12 588.375 1,948.128 87.106 - 107.561 0.367 368.081 - 1.615 3,101.2332012-13 570.542 2,004.751 78.411 - 109.325 0.303 413.823 - 1.667 3,178.8222013-14 556.996 2,063.705 76.495 - 110.333 - (3) 324.347 - 1.241 3,133.1172014-15 690.337 2,182.839 77.858 - 102.561 - 329.190 - 1.158 3,383.9432015-16 701.870 2,266.511 75.858 - 104.901 - 360.356 - 0.970 3,510.4662016-17 715.859 2,286.277 73.250 - 101.148 - 335.962 - 1.244 3,513.7402017-18 805.852 2,378.540 72.677 - 97.908 - 358.860 - 1.446 R 3,715.282 R
2018-19 917.073 2,427.182 67.722 - 100.829 - 454.711 - - (4) 3,967.518
Notes: These data should be read in conjunction with the explanatory notes.
(1) Reliable figures are no longer available since the introduction of the Charitable and Non-Profit Gaming Act 1999 .
(2) Total gaming figure incomplete from this period on, due to data for one or more components being unavailable.
(3) No longer operational.
(4) Pools was withdrawn from the Australian Lottery Market on 23 June 2018.
NA = Not applicable
R = Revised data
KENO
Value ($ million)
CASINOGAMING
MACHINESINSTANT LOTTERY
INTERACTIVE GAMING (NA)
LOTTERIES LOTTO MINOR GAMING POOLS TOTAL GAMING
Australian Gambling Statistics, 1993–94 to 2018–19, 36th edition
150

TABLE QLD 21QUEENSLAND
REAL GAMING EXPENDITURE
1993-94 427.587 629.445 163.793 - - 8.526 249.600 187.066 6.665 1,672.6821994-95 456.737 704.055 155.056 - - 6.725 271.583 183.033 4.099 1,781.2871995-96 670.920 777.691 132.783 - - 6.269 263.736 191.220 4.029 2,046.6471996-97 766.941 883.854 139.829 - - 4.232 255.608 179.273 2.909 2,232.6461997-98 797.588 1,025.699 161.227 - 65.720 3.457 274.220 220.395 2.556 2,550.8621998-99 802.402 1,274.640 166.583 - 88.194 4.071 339.712 216.265 2.908 2,894.7741999-00 872.520 1,432.502 166.137 - 89.044 2.170 337.960 - (1) 2.971 2,903.304 (2)
2000-01 841.799 1,571.976 133.613 - 83.040 1.574 343.213 - 3.159 2,978.3742001-02 815.637 1,702.309 133.206 - 98.253 1.055 335.966 - 2.653 3,089.0792002-03 775.364 1,868.905 127.245 - 98.037 0.892 356.722 - 2.573 3,229.7382003-04 845.572 2,140.595 128.437 - 97.779 0.804 354.307 - 2.272 3,569.7662004-05 766.374 2,339.842 126.599 - 111.469 0.617 360.528 - 2.375 3,707.8052005-06 781.936 2,400.373 119.950 - 116.279 0.818 367.394 - 2.120 3,788.8702006-07 690.381 2,201.456 121.482 - 104.178 0.614 386.655 - 2.172 3,506.9382007-08 711.976 2,289.900 119.144 - 109.589 0.597 393.983 - 2.178 3,627.3662008-09 714.400 2,292.604 115.405 - 118.829 0.686 421.884 - 2.257 3,666.0662009-10 662.188 2,136.981 109.087 - 107.301 0.580 411.701 - 2.115 3,429.9532010-11 664.174 2,181.981 100.528 - 117.281 0.675 384.060 - 1.791 3,450.4912011-12 671.336 2,222.814 99.388 - 122.727 0.419 419.980 - 1.843 3,538.5072012-13 636.352 2,235.993 87.455 - 121.935 0.338 461.556 - 1.859 3,545.4902013-14 605.269 2,242.559 83.125 - 119.895 - (3) 352.457 - 1.349 3,404.6542014-15 737.523 2,332.041 83.180 - 109.571 - 351.691 - 1.237 3,615.2422015-16 739.459 2,387.894 79.921 - 110.519 - 379.655 - 1.022 3,698.4692016-17 741.193 2,367.189 75.842 - 104.728 - 347.852 - 1.288 3,638.0922017-18 818.769 2,416.664 73.842 - 99.477 - 364.612 - 1.469 R 3,774.833 R
2018-19 917.073 2,427.182 67.722 - 100.829 - 454.711 - - (4) 3,967.518
Notes: These data should be read in conjunction with the explanatory notes.
(1) Reliable figures are no longer available since the introduction of the Charitable and Non-Profit Gaming Act 1999 .
(2) Total gaming figure incomplete from this period on, due to data for one or more components being unavailable.
(3) No longer operational.
(4) Pools was withdrawn from the Australian Lottery Market on 23 June 2018.
NA = Not applicable
R = Revised data
KENO
Value ($ million)
CASINOGAMING
MACHINESINSTANT LOTTERY
INTERACTIVE GAMING (NA)
LOTTERIES LOTTO MINOR GAMING POOLS TOTAL GAMING
Australian Gambling Statistics, 1993–94 to 2018–19, 36th edition
151

TABLE QLD 22QUEENSLAND
PER CAPITA GAMING EXPENDITURE
1993-94 100.39 147.78 38.45 - - 2.00 58.60 43.92 1.56 392.711994-95 108.01 166.49 36.67 - - 1.59 64.22 43.28 0.97 421.241995-96 161.61 187.33 31.98 - - 1.51 63.53 46.06 0.97 493.001996-97 183.54 211.52 33.46 - - 1.01 61.17 42.90 0.70 534.311997-98 187.63 241.30 37.93 - 15.46 0.81 64.51 51.85 0.60 600.101998-99 187.93 298.53 39.02 - 20.66 0.95 79.56 50.65 0.68 677.991999-00 205.60 337.56 39.15 - 20.98 0.51 79.64 - (1) 0.70 684.15 (2)
2000-01 206.41 385.45 32.76 - 20.36 0.39 84.16 - 0.77 730.302001-02 201.06 419.64 32.84 - 24.22 0.26 82.82 - 0.65 761.502002-03 191.73 462.14 31.46 - 24.24 0.22 88.21 - 0.64 798.642003-04 208.47 527.74 31.66 - 24.11 0.20 87.35 - 0.56 880.092004-05 188.58 575.76 31.15 - 27.43 0.15 88.71 - 0.58 912.372005-06 193.72 594.69 29.72 - 28.81 0.20 91.02 - 0.53 938.682006-07 171.69 547.47 30.21 - 25.91 0.15 96.16 - 0.54 872.132007-08 178.10 572.80 29.80 - 27.41 0.15 98.55 - 0.54 907.362008-09 179.28 575.33 28.96 - 29.82 0.17 105.87 - 0.57 920.012009-10 166.19 536.33 27.38 - 26.93 0.15 103.33 - 0.53 860.832010-11 168.59 553.85 25.52 - 29.77 0.17 97.48 - 0.45 875.832011-12 170.99 566.15 25.31 - 31.26 0.11 106.97 - 0.47 901.262012-13 162.43 570.75 22.32 - 31.12 0.09 117.82 - 0.47 905.012013-14 155.79 577.23 21.40 - 30.86 - (3) 90.72 - 0.35 876.352014-15 190.29 601.71 21.46 - 28.27 - 90.74 - 0.32 932.802015-16 190.74 615.94 20.61 - 28.51 - 97.93 - 0.26 953.992016-17 191.34 611.09 19.58 - 27.04 - 89.80 - 0.33 939.172017-18 211.48 624.21 19.07 - 25.69 - 94.18 - 0.38 R 975.01 R
2018-19 236.29 625.38 17.45 - 25.98 - 117.16 - - (4) 1,022.27
Notes: These data should be read in conjunction with the explanatory notes.
(1) Reliable figures are no longer available since the introduction of the Charitable and Non-Profit Gaming Act 1999 .
(2) Total gaming figure incomplete from this period on, due to data for one or more components being unavailable.
(3) No longer operational.
(4) Pools was withdrawn from the Australian Lottery Market on 23 June 2018.
NA = Not applicable
R = Revised data
KENO
Value ($)
CASINOGAMING
MACHINESINSTANT LOTTERY
INTERACTIVE GAMING (NA)
LOTTERIES LOTTO MINOR GAMING POOLS TOTAL GAMING
Australian Gambling Statistics, 1993–94 to 2018–19, 36th edition
152
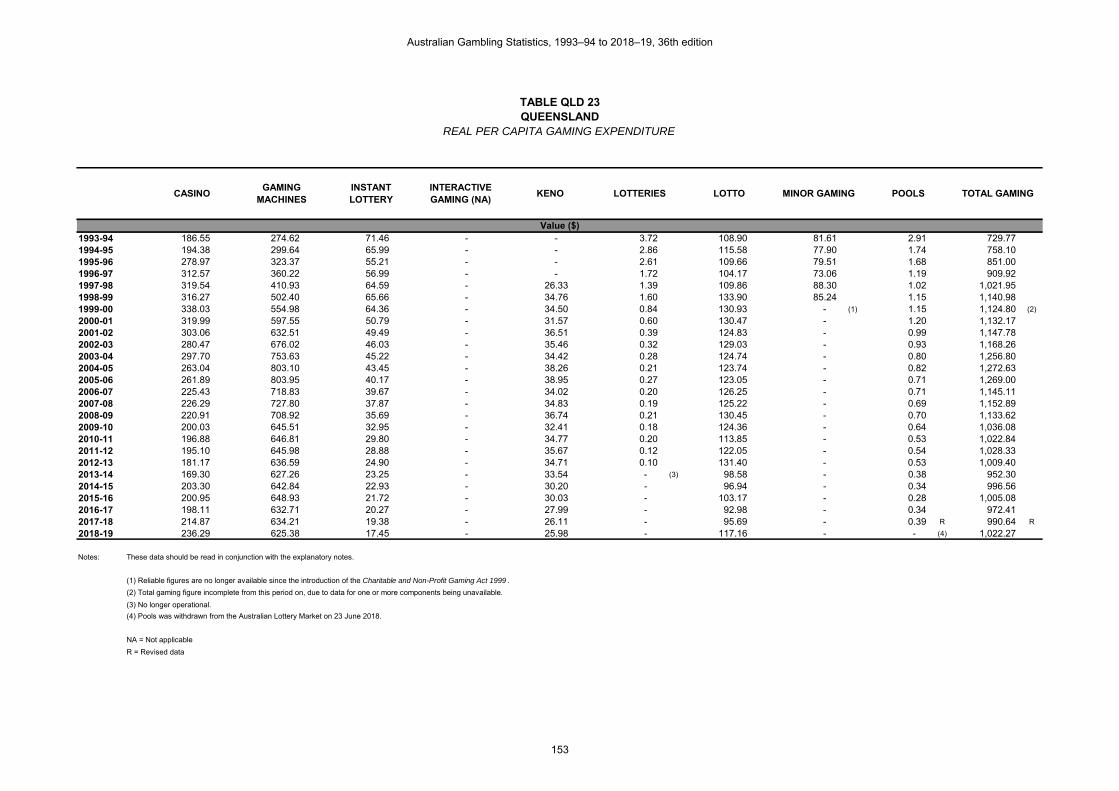
TABLE QLD 23QUEENSLAND
REAL PER CAPITA GAMING EXPENDITURE
1993-94 186.55 274.62 71.46 - - 3.72 108.90 81.61 2.91 729.771994-95 194.38 299.64 65.99 - - 2.86 115.58 77.90 1.74 758.101995-96 278.97 323.37 55.21 - - 2.61 109.66 79.51 1.68 851.001996-97 312.57 360.22 56.99 - - 1.72 104.17 73.06 1.19 909.921997-98 319.54 410.93 64.59 - 26.33 1.39 109.86 88.30 1.02 1,021.951998-99 316.27 502.40 65.66 - 34.76 1.60 133.90 85.24 1.15 1,140.981999-00 338.03 554.98 64.36 - 34.50 0.84 130.93 - (1) 1.15 1,124.80 (2)
2000-01 319.99 597.55 50.79 - 31.57 0.60 130.47 - 1.20 1,132.172001-02 303.06 632.51 49.49 - 36.51 0.39 124.83 - 0.99 1,147.782002-03 280.47 676.02 46.03 - 35.46 0.32 129.03 - 0.93 1,168.262003-04 297.70 753.63 45.22 - 34.42 0.28 124.74 - 0.80 1,256.802004-05 263.04 803.10 43.45 - 38.26 0.21 123.74 - 0.82 1,272.632005-06 261.89 803.95 40.17 - 38.95 0.27 123.05 - 0.71 1,269.002006-07 225.43 718.83 39.67 - 34.02 0.20 126.25 - 0.71 1,145.112007-08 226.29 727.80 37.87 - 34.83 0.19 125.22 - 0.69 1,152.892008-09 220.91 708.92 35.69 - 36.74 0.21 130.45 - 0.70 1,133.622009-10 200.03 645.51 32.95 - 32.41 0.18 124.36 - 0.64 1,036.082010-11 196.88 646.81 29.80 - 34.77 0.20 113.85 - 0.53 1,022.842011-12 195.10 645.98 28.88 - 35.67 0.12 122.05 - 0.54 1,028.332012-13 181.17 636.59 24.90 - 34.71 0.10 131.40 - 0.53 1,009.402013-14 169.30 627.26 23.25 - 33.54 - (3) 98.58 - 0.38 952.302014-15 203.30 642.84 22.93 - 30.20 - 96.94 - 0.34 996.562015-16 200.95 648.93 21.72 - 30.03 - 103.17 - 0.28 1,005.082016-17 198.11 632.71 20.27 - 27.99 - 92.98 - 0.34 972.412017-18 214.87 634.21 19.38 - 26.11 - 95.69 - 0.39 R 990.64 R
2018-19 236.29 625.38 17.45 - 25.98 - 117.16 - - (4) 1,022.27
Notes: These data should be read in conjunction with the explanatory notes.
(1) Reliable figures are no longer available since the introduction of the Charitable and Non-Profit Gaming Act 1999 .
(2) Total gaming figure incomplete from this period on, due to data for one or more components being unavailable.
(3) No longer operational.
(4) Pools was withdrawn from the Australian Lottery Market on 23 June 2018.
NA = Not applicable
R = Revised data
KENO
Value ($)
CASINOGAMING
MACHINESINSTANT LOTTERY
INTERACTIVE GAMING (NA)
LOTTERIES LOTTO MINOR GAMING POOLS TOTAL GAMING
Australian Gambling Statistics, 1993–94 to 2018–19, 36th edition
153

TABLE QLD 24QUEENSLAND
GAMING EXPENDITUREAS A % OF HDI
1993-94 0.449 0.661 0.172 - - 0.009 0.262 0.196 0.007 1.7571994-95 0.463 0.713 0.157 - - 0.007 0.275 0.185 0.004 1.8051995-96 0.665 0.771 0.132 - - 0.006 0.262 0.190 0.004 2.0291996-97 0.715 0.824 0.130 - - 0.004 0.238 0.167 0.003 2.0801997-98 0.717 0.922 0.145 - 0.059 0.003 0.246 0.198 0.002 2.2921998-99 0.704 1.118 0.146 - 0.077 0.004 0.298 0.190 0.003 2.5391999-00 0.743 1.220 0.141 - 0.076 0.002 0.288 - (1) 0.003 2.472 (2)
2000-01 0.691 1.291 0.110 - 0.068 0.001 0.282 - 0.003 2.4462001-02 0.619 1.293 0.101 - 0.075 0.001 0.255 - 0.002 2.3452002-03 0.596 1.437 0.098 - 0.075 0.001 0.274 - 0.002 2.4832003-04 0.597 1.512 0.091 - 0.069 0.001 0.250 - 0.002 2.5212004-05 0.497 1.518 0.082 - 0.072 0.000 0.234 - 0.002 2.4052005-06 0.477 1.465 0.073 - 0.071 0.000 0.224 - 0.001 2.3132006-07 0.384 1.225 0.068 - 0.058 0.000 0.215 - 0.001 1.9522007-08 0.372 1.197 0.062 - 0.057 0.000 0.206 - 0.001 1.8972008-09 0.344 1.105 0.056 - 0.057 0.000 0.203 - 0.001 1.7672009-10 0.317 1.024 0.052 - 0.051 0.000 0.197 - 0.001 1.6442010-11 0.308 1.013 0.047 - 0.054 0.000 0.178 - 0.001 1.6022011-12 0.304 1.008 0.045 - 0.056 0.000 0.190 - 0.001 1.6052012-13 0.295 1.037 0.041 - 0.057 0.000 0.214 - 0.001 1.6452013-14 0.280 1.038 0.038 - 0.056 - (3) 0.163 - 0.001 1.5762014-15 0.332 1.050 0.037 - 0.049 - 0.158 - 0.001 1.6282015-16 0.328 1.058 0.035 - 0.049 - 0.168 - 0.000 1.6392016-17 0.327 1.044 0.033 - 0.046 - 0.153 - 0.001 1.6042017-18 0.356 1.050 0.032 - 0.043 - 0.158 - 0.001 R 1.640 R
2018-19 0.390 1.033 0.029 - 0.043 - 0.194 - - (4) 1.688
Notes: These data should be read in conjunction with the explanatory notes.
(1) Reliable figures are no longer available since the introduction of the Charitable and Non-Profit Gaming Act 1999 .
(2) Total gaming figure incomplete from this period on, due to data for one or more components being unavailable.
(3) No longer operational.
(4) Pools was withdrawn from the Australian Lottery Market on 23 June 2018.
NA = Not applicable
R = Revised data
Percentage (%)
CASINOGAMING
MACHINESINSTANT LOTTERY
TOTAL GAMINGINTERACTIVE GAMING (NA)
KENO LOTTERIES LOTTO MINOR GAMING POOLS
Australian Gambling Statistics, 1993–94 to 2018–19, 36th edition
154
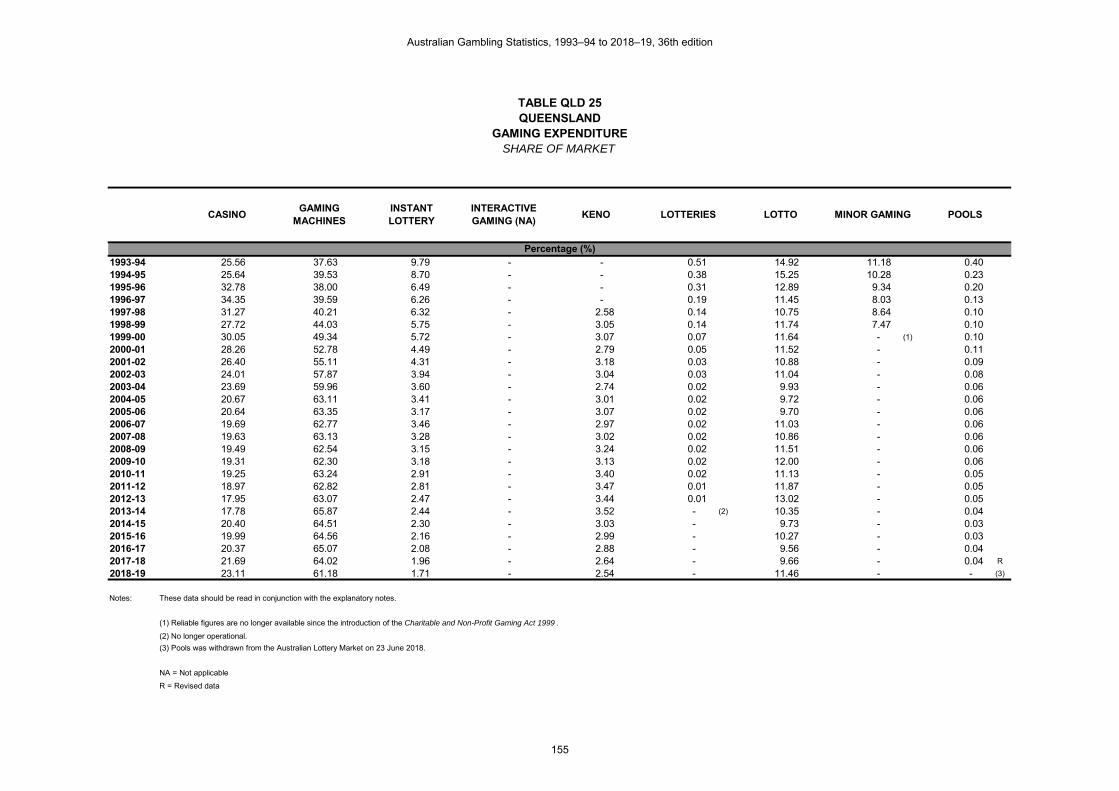
TABLE QLD 25QUEENSLAND
GAMING EXPENDITURESHARE OF MARKET
1993-94 25.56 37.63 9.79 - - 0.51 14.92 11.18 0.401994-95 25.64 39.53 8.70 - - 0.38 15.25 10.28 0.231995-96 32.78 38.00 6.49 - - 0.31 12.89 9.34 0.201996-97 34.35 39.59 6.26 - - 0.19 11.45 8.03 0.131997-98 31.27 40.21 6.32 - 2.58 0.14 10.75 8.64 0.101998-99 27.72 44.03 5.75 - 3.05 0.14 11.74 7.47 0.101999-00 30.05 49.34 5.72 - 3.07 0.07 11.64 - (1) 0.102000-01 28.26 52.78 4.49 - 2.79 0.05 11.52 - 0.112001-02 26.40 55.11 4.31 - 3.18 0.03 10.88 - 0.092002-03 24.01 57.87 3.94 - 3.04 0.03 11.04 - 0.082003-04 23.69 59.96 3.60 - 2.74 0.02 9.93 - 0.062004-05 20.67 63.11 3.41 - 3.01 0.02 9.72 - 0.062005-06 20.64 63.35 3.17 - 3.07 0.02 9.70 - 0.062006-07 19.69 62.77 3.46 - 2.97 0.02 11.03 - 0.062007-08 19.63 63.13 3.28 - 3.02 0.02 10.86 - 0.062008-09 19.49 62.54 3.15 - 3.24 0.02 11.51 - 0.062009-10 19.31 62.30 3.18 - 3.13 0.02 12.00 - 0.062010-11 19.25 63.24 2.91 - 3.40 0.02 11.13 - 0.052011-12 18.97 62.82 2.81 - 3.47 0.01 11.87 - 0.052012-13 17.95 63.07 2.47 - 3.44 0.01 13.02 - 0.052013-14 17.78 65.87 2.44 - 3.52 - (2) 10.35 - 0.042014-15 20.40 64.51 2.30 - 3.03 - 9.73 - 0.032015-16 19.99 64.56 2.16 - 2.99 - 10.27 - 0.032016-17 20.37 65.07 2.08 - 2.88 - 9.56 - 0.042017-18 21.69 64.02 1.96 - 2.64 - 9.66 - 0.04 R
2018-19 23.11 61.18 1.71 - 2.54 - 11.46 - - (3)
Notes: These data should be read in conjunction with the explanatory notes.
(1) Reliable figures are no longer available since the introduction of the Charitable and Non-Profit Gaming Act 1999 .
(2) No longer operational.
(3) Pools was withdrawn from the Australian Lottery Market on 23 June 2018.
NA = Not applicable
R = Revised data
POOLS
Percentage (%)
CASINOGAMING
MACHINESINSTANT LOTTERY
INTERACTIVE GAMING (NA)
KENO LOTTERIES LOTTO MINOR GAMING
Australian Gambling Statistics, 1993–94 to 2018–19, 36th edition
155

TABLE QLD 26QUEENSLAND
GOVERNMENT REVENUE FROM GAMING
1993-94 46.652 70.080 - 140.751 3.492 260.9751994-95 49.338 79.947 - 175.073 3.536 307.8941995-96 71.482 90.819 - 172.596 3.851 338.7481996-97 76.200 100.600 - 184.800 3.569 365.1691997-98 80.383 185.650 - 159.515 2.875 428.4231998-99 83.304 238.125 - 180.974 2.965 505.3681999-00 90.837 286.015 - 186.205 0.382 563.4392000-01 48.000 275.891 0.227 158.813 0.043 482.9742001-02 47.422 328.974 (1) - (2) 159.636 - (3) 536.032 (4)
2002-03 47.696 386.103 - 170.056 - 603.8552003-04 49.857 465.213 - 173.560 - 688.6302004-05 53.086 533.678 - 180.622 - 767.3862005-06 53.190 567.678 - 185.520 - 806.3882006-07 50.451 530.344 (5) - 199.277 - 780.0722007-08 51.517 583.104 - 208.131 - 842.7532008-09 54.930 606.356 - 225.267 - 886.5532009-10 86.886 572.184 - 223.642 - 882.7122010-11 82.065 611.052 - 214.441 - 907.5582011-12 85.054 642.225 - 235.676 - 962.9552012-13 82.733 660.941 - 255.874 - 999.5482013-14 84.716 684.028 - 236.796 - 1,005.5402014-15 97.788 731.848 - 241.390 - 1,071.0262015-16 100.089 768.817 - 259.734 - 1,128.6402016-17 104.049 780.037 - 243.498 - 1,127.5842017-18 98.716 822.078 - 257.602 - 1,178.3962018-19 110.319 844.103 - 314.180 - 1,268.602
Notes: These data should be read in conjunction with the explanatory notes.
Data for the gambling revenue received by states and territories from 1 July 2000 onwards are not comparable with that of preceding years because
of the impact of changes brought about by the introduction of the GST.
(1) From July 2001 the gaming machine revenue includes gaming machine tax and major facility levy.
(2) Interactive gaming was banned in August 2001.
(3) Reliable figures are no longer available since the introduction of the Charitable and Non-Profit Gaming Act 1999 .
(4) Total gaming revenue incomplete from this period on, due to data for one or more components being unavailable.
(5) From July 2006 the gaming machine revenue includes gaming machine tax and health services levy.
TOTAL GAMING
Value ($ million)
CASINO GAMINGGAMING
MACHINES & KENO
INTERACTIVE GAMING
LOTTERIES & POOLS
MINOR GAMING
Australian Gambling Statistics, 1993–94 to 2018–19, 36th edition
156

TABLE QLD 27QUEENSLAND
REAL GOVERNMENT REVENUE FROM GAMING
1993-94 86.694 130.230 - 261.558 6.489 484.9711994-95 88.793 143.879 - 315.076 6.364 554.1121995-96 123.390 156.769 - 297.930 6.647 584.7371996-97 129.767 171.320 - 314.712 6.078 621.8771997-98 136.891 316.159 - 271.652 4.896 729.5981998-99 140.192 400.738 - 304.559 4.990 850.4791999-00 149.344 470.235 - 306.138 0.628 926.3462000-01 74.413 427.706 0.352 246.203 0.067 748.7412001-02 71.478 495.851 (1) - (2) 240.614 - (3) 807.943 (4)
2002-03 69.771 564.799 - 248.761 - 883.3312003-04 71.198 664.340 - 247.850 - 983.3882004-05 74.048 744.409 - 251.943 - 1,070.4002005-06 71.908 767.442 - 250.804 - 1,090.1532006-07 66.242 696.344 (5) - 261.651 - 1,024.2382007-08 65.458 740.893 - 264.452 - 1,070.8032008-09 67.684 747.141 - 277.570 - 1,092.3942009-10 104.575 688.673 - 269.172 - 1,062.4202010-11 95.840 713.624 - 250.437 - 1,059.9012011-12 97.047 732.779 - 268.906 - 1,098.7322012-13 92.276 737.179 - 285.388 - 1,114.8432013-14 92.058 743.310 - 257.318 - 1,092.6872014-15 104.472 781.871 - 257.890 - 1,144.2332015-16 105.450 809.991 - 273.644 - 1,189.0852016-17 107.731 807.643 - 252.116 - 1,167.4902017-18 100.298 835.255 - 261.731 - 1,197.2842018-19 110.319 844.103 - 314.180 - 1,268.602
Notes: These data should be read in conjunction with the explanatory notes.
Data for the gambling revenue received by states and territories from 1 July 2000 onwards are not comparable with that of preceding years because
of the impact of changes brought about by the introduction of the GST.
(1) From July 2001 the gaming machine revenue includes gaming machine tax and major facility levy.
(2) Interactive gaming was banned in August 2001.
(3) Reliable figures are no longer available since the introduction of the Charitable and Non-Profit Gaming Act 1999 .
(4) Total gaming revenue incomplete from this period on, due to data for one or more components being unavailable.
(5) From July 2006 the gaming machine revenue includes gaming machine tax and health services levy.
TOTAL GAMING
Value ($ million)
CASINO GAMINGGAMING
MACHINES & KENO
INTERACTIVE GAMING
LOTTERIES & POOLS
MINOR GAMING
Australian Gambling Statistics, 1993–94 to 2018–19, 36th edition
157

TABLE QLD 28QUEENSLAND
PER CAPITA REVENUE FROM GAMING
1993-94 20.35 30.57 - 61.41 1.52 113.861994-95 21.00 34.02 - 74.51 1.50 131.041995-96 29.72 37.76 - 71.77 1.60 140.851996-97 31.06 41.00 - 75.32 1.45 148.831997-98 32.20 74.38 - 63.91 1.15 171.641998-99 32.83 93.86 - 71.33 1.17 199.191999-00 35.19 110.81 - 72.14 0.15 218.292000-01 18.25 104.87 0.09 60.37 0.02 183.592001-02 17.62 122.23 (1) - (2) 59.31 - (3) 199.17 (4)
2002-03 17.25 139.66 - 61.51 - 218.432003-04 17.55 163.79 - 61.10 - 242.442004-05 18.22 183.17 - 61.99 - 263.392005-06 17.81 190.13 - 62.14 - 270.082006-07 16.47 173.17 (5) - 65.07 - 254.712007-08 16.37 185.33 - 66.15 - 267.852008-09 16.99 187.50 - 69.66 - 274.142009-10 26.25 172.84 - 67.56 - 266.642010-11 24.33 181.14 - 63.57 - 269.032011-12 24.72 186.64 - 68.49 - 279.852012-13 23.55 188.17 - 72.85 - 284.572013-14 23.70 191.33 - 66.23 - 281.252014-15 26.96 201.74 - 66.54 - 295.232015-16 27.20 208.93 - 70.58 - 306.722016-17 27.81 208.49 - 65.08 - 301.392017-18 25.91 215.74 - 67.60 - 309.252018-19 28.42 217.49 - 80.95 - 326.87
Notes: These data should be read in conjunction with the explanatory notes.
Data for the gambling revenue received by states and territories from 1 July 2000 onwards are not comparable with that of preceding years because
of the impact of changes brought about by the introduction of the GST.
(1) From July 2001 the gaming machine revenue includes gaming machine tax and major facility levy.
(2) Interactive gaming was banned in August 2001.
(3) Reliable figures are no longer available since the introduction of the Charitable and Non-Profit Gaming Act 1999 .
(4) Total gaming revenue incomplete from this period on, due to data for one or more components being unavailable.
(5) From July 2006 the gaming machine revenue includes gaming machine tax and health services levy.
TOTAL GAMING
Value ($)
CASINO GAMINGGAMING
MACHINES & KENO
INTERACTIVE GAMING
LOTTERIES & POOLS
MINOR GAMING
Australian Gambling Statistics, 1993–94 to 2018–19, 36th edition
158

TABLE QLD 29QUEENSLAND
REAL PER CAPITA REVENUE FROM GAMING
1993-94 37.82 56.82 - 114.11 2.83 211.591994-95 37.79 61.23 - 134.09 2.71 235.821995-96 51.31 65.19 - 123.88 2.76 243.141996-97 52.89 69.82 - 128.26 2.48 253.451997-98 54.84 126.66 - 108.83 1.96 292.301998-99 55.26 157.95 - 120.04 1.97 335.221999-00 57.86 182.18 - 118.60 0.24 358.892000-01 28.29 162.58 0.13 93.59 0.03 284.622001-02 26.56 184.24 (1) - (2) 89.40 - (3) 300.20 (4)
2002-03 25.24 204.30 - 89.98 - 319.522003-04 25.07 233.89 - 87.26 - 346.222004-05 25.42 255.50 - 86.47 - 367.392005-06 24.08 257.04 - 84.00 - 365.122006-07 21.63 227.37 (5) - 85.44 - 334.442007-08 20.80 235.48 - 84.05 - 340.332008-09 20.93 231.03 - 85.83 - 337.792009-10 31.59 208.03 - 81.31 - 320.922010-11 28.41 211.54 - 74.24 - 314.192011-12 28.20 212.95 - 78.15 - 319.302012-13 26.27 209.87 - 81.25 - 317.392013-14 25.75 207.91 - 71.97 - 305.632014-15 28.80 215.53 - 71.09 - 315.412015-16 28.66 220.12 - 74.36 - 323.142016-17 28.79 215.87 - 67.39 - 312.052017-18 26.32 219.20 - 68.69 - 314.212018-19 28.42 217.49 - 80.95 - 326.87
Notes: These data should be read in conjunction with the explanatory notes.
Data for the gambling revenue received by states and territories from 1 July 2000 onwards are not comparable with that of preceding years because
of the impact of changes brought about by the introduction of the GST.
(1) From July 2001 the gaming machine revenue includes gaming machine tax and major facility levy.
(2) Interactive gaming was banned in August 2001.
(3) Reliable figures are no longer available since the introduction of the Charitable and Non-Profit Gaming Act 1999 .
(4) Total gaming revenue incomplete from this period on, due to data for one or more components being unavailable.
(5) From July 2006 the gaming machine revenue includes gaming machine tax and health services levy.
TOTAL GAMING
Value ($)
CASINO GAMINGGAMING
MACHINES & KENO
INTERACTIVE GAMING
LOTTERIES & POOLS
MINOR GAMING
Australian Gambling Statistics, 1993–94 to 2018–19, 36th edition
159

TABLE QLD 30QUEENSLAND
GOVERNMENT REVENUE FROM GAMINGAS A % OF TOTAL GAMBLING REVENUE
1993-94 13.90 20.88 - 41.93 1.04 77.741994-95 12.80 20.75 - 45.43 0.92 79.901995-96 17.16 21.80 - 41.42 0.92 81.301996-97 17.12 22.61 - 41.53 0.80 82.071997-98 15.81 36.51 - 31.37 0.57 84.251998-99 14.18 40.54 - 30.81 0.50 86.041999-00 14.80 46.59 - 30.33 0.06 91.782000-01 9.42 54.12 0.04 31.15 0.01 94.742001-02 8.42 58.40 (1) - (2) 28.34 - (3) 95.15 (4)
2002-03 7.54 61.02 - 26.88 - 95.442003-04 6.93 64.62 - 24.11 - 95.652004-05 6.63 66.67 - 22.56 - 95.872005-06 6.32 67.49 - 22.06 - 95.872006-07 6.17 64.89 (5) - 24.38 - 95.452007-08 5.85 66.25 - 23.65 - 95.752008-09 5.93 65.42 - 24.31 - 95.662009-10 9.42 62.02 - 24.24 - 95.682010-11 8.66 64.49 - 22.63 - 95.782011-12 8.47 63.97 - 23.47 - 95.912012-13 7.95 63.52 - 24.59 - 96.062013-14 8.10 65.42 - 22.65 - 96.182014-15 9.03 67.57 - 22.29 - 98.892015-16 8.78 67.46 - 22.79 - 99.042016-17 9.14 68.56 - 21.40 - 99.102017-18 8.31 69.19 - 21.68 - 99.182018-19 8.70 66.54 - 24.77 - 100.00
Notes: These data should be read in conjunction with the explanatory notes.
Data for the gambling revenue received by states and territories from 1 July 2000 onwards are not comparable with that of preceding years because
of the impact of changes brought about by the introduction of the GST.
(1) From July 2001 the gaming machine revenue includes gaming machine tax and major facility levy.
(2) Interactive gaming was banned in August 2001.
(3) Reliable figures are no longer available since the introduction of the Charitable and Non-Profit Gaming Act 1999 .
(4) Total gaming revenue incomplete from this period on, due to data for one or more components being unavailable.
(5) From July 2006 the gaming machine revenue includes gaming machine tax and health services levy.
TOTAL GAMING
Percentage (%)
CASINO GAMINGGAMING
MACHINES & KENO
INTERACTIVE GAMING
LOTTERIES & POOLS
MINOR GAMING
Australian Gambling Statistics, 1993–94 to 2018–19, 36th edition
160

TABLE QLD 31QUEENSLAND
TOTAL SPORTSBETTING TURNOVER
1995-96 1.200 - - 2.800 4.0001996-97 1.300 - - 3.100 4.4001997-98 0.100 - - 2.500 2.6001998-99 0.027 - - 3.300 3.3271999-00 0.050 - 8.544 4.478 13.0722000-01 - U - 15.332 2.195 17.5272001-02 - U - 23.252 2.885 26.1372002-03 - U - 26.909 3.134 30.0432003-04 - U - 43.167 3.643 46.8102004-05 - U - 44.468 4.067 48.5352005-06 - U - 66.566 3.662 70.2282006-07 - U - 82.555 4.230 86.7852007-08 - U - 105.806 3.620 109.4262008-09 - U - 121.892 3.456 125.3482009-10 - U - 147.025 2.953 149.9782010-11 - U - 144.603 2.747 147.3502011-12 - U - 155.430 2.411 157.8412012-13 - U - 146.548 2.244 148.7922013-14 - U - 155.476 1.983 157.4592014-15 - U - 152.071 1.784 153.8552015-16 - U - 182.501 1.731 184.2322016-17 - U - 163.300 1.608 164.9082017-18 - U - 190.718 1.500 192.2182018-19 - U - 172.048 1.505 173.552
Notes: These data should be read in conjunction with the explanatory notes.
(1) Total sportsbetting turnover incomplete due to data for one or more components being unavailable.
U = Unavailable data
TOTAL SPORTSBETTING
(1)
Value ($ million)
BOOKMAKER (AND OTHER) FIXED ODDS
BOOKMAKER (AND OTHER)
POOL BETTING (U)TAB FIXED ODDS TAB TOTE ODDS
Australian Gambling Statistics, 1993–94 to 2018–19, 36th edition
161

TABLE QLD 32QUEENSLAND
REAL SPORTSBETTING TURNOVER
1995-96 2.071 - - 4.833 6.9051996-97 2.214 - - 5.279 7.4931997-98 0.170 - - 4.257 4.4281998-99 0.045 - - 5.554 5.5991999-00 0.082 - 14.047 7.362 21.4922000-01 - U - 23.769 3.403 27.1722001-02 - U - 35.047 4.348 39.3952002-03 - U - 39.363 4.584 43.9482003-04 - U - 61.644 5.202 66.8462004-05 - U - 62.027 5.673 67.7002005-06 - U - 89.990 4.951 94.9412006-07 - U - 108.395 5.554 113.9492007-08 - U - 134.437 4.600 139.0372008-09 - U - 150.193 4.258 154.4512009-10 - U - 176.957 3.554 180.5112010-11 - U - 168.876 3.208 172.0842011-12 - U - 177.346 2.751 180.0972012-13 - U - 163.452 2.503 165.9552013-14 - U - 168.951 2.155 171.1052014-15 - U - 162.465 1.906 164.3712015-16 - U - 192.275 1.824 194.0992016-17 - U - 169.079 1.665 170.7442017-18 - U - 193.775 1.524 195.2992018-19 - U - 172.048 1.505 173.552
Notes: These data should be read in conjunction with the explanatory notes.
(1) Total sportsbetting turnover incomplete due to data for one or more components being unavailable.
U = Unavailable data
TOTAL SPORTSBETTING
(1)
Value ($ million)
BOOKMAKER (AND OTHER) FIXED ODDS
BOOKMAKER (AND OTHER)
POOL BETTING (U)TAB FIXED ODDS TAB TOTE ODDS
Australian Gambling Statistics, 1993–94 to 2018–19, 36th edition
162

TABLE QLD 33QUEENSLAND
PER CAPITA SPORTSBETTING TURNOVER
1995-96 0.50 - - 1.16 1.661996-97 0.53 - - 1.26 1.791997-98 0.04 - - 1.00 1.041998-99 0.01 - - 1.30 1.311999-00 0.02 - 3.31 1.73 5.062000-01 - U - 5.83 0.83 6.662001-02 - U - 8.64 1.07 9.712002-03 - U - 9.73 1.13 10.872003-04 - U - 15.20 1.28 16.482004-05 - U - 15.26 1.40 16.662005-06 - U - 22.29 1.23 23.522006-07 - U - 26.96 1.38 28.342007-08 - U - 33.63 1.15 34.782008-09 - U - 37.69 1.07 38.762009-10 - U - 44.41 0.89 45.302010-11 - U - 42.87 0.81 43.682011-12 - U - 45.17 0.70 45.872012-13 - U - 41.72 0.64 42.362013-14 - U - 43.49 0.55 44.042014-15 - U - 41.92 0.49 42.412015-16 - U - 49.60 0.47 50.072016-17 - U - 43.65 0.43 44.082017-18 - U - 50.05 0.39 50.442018-19 - U - 44.33 0.39 44.72
Notes: These data should be read in conjunction with the explanatory notes.
(1) Total sportsbetting turnover incomplete due to data for one or more components being unavailable.
U = Unavailable data
TOTAL SPORTSBETTING
(1)
Value ($)
BOOKMAKER (AND OTHER) FIXED ODDS
BOOKMAKER (AND OTHER)
POOL BETTING (U)TAB FIXED ODDS TAB TOTE ODDS
Australian Gambling Statistics, 1993–94 to 2018–19, 36th edition
163

TABLE QLD 34QUEENSLAND
REAL PER CAPITA SPORTSBETTING TURNOVER
1995-96 0.86 - - 2.01 2.871996-97 0.90 - - 2.15 3.051997-98 0.07 - - 1.71 1.771998-99 0.02 - - 2.19 2.211999-00 0.03 - 5.44 2.85 8.332000-01 - U - 9.04 1.29 10.332001-02 - U - 13.02 1.62 14.642002-03 - U - 14.24 1.66 15.902003-04 - U - 21.70 1.83 23.532004-05 - U - 21.29 1.95 23.242005-06 - U - 30.14 1.66 31.802006-07 - U - 35.39 1.81 37.212007-08 - U - 42.73 1.46 44.192008-09 - U - 46.44 1.32 47.762009-10 - U - 53.45 1.07 54.532010-11 - U - 50.06 0.95 51.012011-12 - U - 51.54 0.80 52.342012-13 - U - 46.53 0.71 47.252013-14 - U - 47.26 0.60 47.862014-15 - U - 44.78 0.53 45.312015-16 - U - 52.25 0.50 52.752016-17 - U - 45.19 0.44 45.642017-18 - U - 50.85 0.40 51.252018-19 - U - 44.33 0.39 44.72
Notes: These data should be read in conjunction with the explanatory notes.
(1) Total sportsbetting turnover incomplete due to data for one or more components being unavailable.
U = Unavailable data
TOTAL SPORTSBETTING
(1)
Value ($)
BOOKMAKER (AND OTHER) FIXED ODDS
BOOKMAKER (AND OTHER)
POOL BETTING (U)TAB FIXED ODDS TAB TOTE ODDS
Australian Gambling Statistics, 1993–94 to 2018–19, 36th edition
164

TABLE QLD 35QUEENSLAND
TOTAL SPORTSBETTING EXPENDITURE
1995-96 - - - 0.700 0.7001996-97 - - - 0.800 0.8001997-98 - - - 0.600 0.6001998-99 - - - 0.800 0.8001999-00 - - 0.805 1.401 2.2062000-01 - U - 1.628 0.578 2.2062001-02 - U - 2.965 0.721 3.6862002-03 - U - 3.117 0.783 3.9002003-04 - U - 5.545 0.954 6.4992004-05 - U - 5.812 0.978 6.7902005-06 - U - 8.556 0.915 9.4712006-07 - U - 11.143 1.058 12.2012007-08 - U - 12.775 0.905 13.6802008-09 - U - 12.359 0.864 13.2232009-10 - U - 15.227 0.738 15.9652010-11 - U - 18.112 0.687 18.7992011-12 - U - 19.769 0.603 20.3722012-13 - U - 19.789 0.561 20.3502013-14 - U - 20.418 0.496 20.9142014-15 - U - 21.218 0.446 21.6642015-16 - U - 15.290 0.433 15.7232016-17 - U - 17.892 0.402 18.2942017-18 - U - 20.440 0.375 20.8152018-19 - U - 17.334 0.376 17.711
Notes: These data should be read in conjunction with the explanatory notes.
(1) Total sportsbetting expenditure incomplete due to data for one or more components being unavailable.
U = Unavailable data
TOTAL SPORTSBETTING
(1)
Value ($ million)
BOOKMAKER (AND OTHER) FIXED ODDS
BOOKMAKER (AND OTHER)
POOL BETTING (U)TAB FIXED ODDS TAB TOTE ODDS
Australian Gambling Statistics, 1993–94 to 2018–19, 36th edition
165

TABLE QLD 36QUEENSLAND
REAL SPORTSBETTING EXPENDITURE
1995-96 - - - 1.208 1.2081996-97 - - - 1.362 1.3621997-98 - - - 1.022 1.0221998-99 - - - 1.346 1.3461999-00 - - 1.323 2.303 3.6272000-01 - U - 2.524 0.896 3.4202001-02 - U - 4.469 1.087 5.5562002-03 - U - 4.560 1.145 5.7052003-04 - U - 7.918 1.362 9.2812004-05 - U - 8.107 1.364 9.4712005-06 - U - 11.567 1.237 12.8042006-07 - U - 14.631 1.389 16.0202007-08 - U - 16.231 1.150 17.3812008-09 - U - 15.229 1.065 16.2932009-10 - U - 18.327 0.888 19.2152010-11 - U - 21.152 0.802 21.9552011-12 - U - 22.556 0.688 23.2442012-13 - U - 22.072 0.626 22.6972013-14 - U - 22.188 0.539 22.7272014-15 - U - 22.668 0.476 23.1452015-16 - U - 16.109 0.456 16.5652016-17 - U - 18.525 0.416 18.9412017-18 - U - 20.768 0.381 21.1482018-19 - U - 17.334 0.376 17.711
Notes: These data should be read in conjunction with the explanatory notes.
(1) Total sportsbetting expenditure incomplete due to data for one or more components being unavailable.
U = Unavailable data
TOTAL SPORTSBETTING
(1)
Value ($ million)
BOOKMAKER (AND OTHER) FIXED ODDS
BOOKMAKER (AND OTHER)
POOL BETTING (U)TAB FIXED ODDS TAB TOTE ODDS
Australian Gambling Statistics, 1993–94 to 2018–19, 36th edition
166

TABLE QLD 37QUEENSLAND
PER CAPITA SPORTSBETTING EXPENDITURE
1995-96 - - - 0.29 0.291996-97 - - - 0.33 0.331997-98 - - - 0.24 0.241998-99 - - - 0.32 0.321999-00 - - 0.31 0.54 0.852000-01 - U - 0.62 0.22 0.842001-02 - U - 1.10 0.27 1.372002-03 - U - 1.13 0.28 1.412003-04 - U - 1.95 0.34 2.292004-05 - U - 1.99 0.34 2.332005-06 - U - 2.87 0.31 3.172006-07 - U - 3.64 0.35 3.982007-08 - U - 4.06 0.29 4.352008-09 - U - 3.82 0.27 4.092009-10 - U - 4.60 0.22 4.822010-11 - U - 5.37 0.20 5.572011-12 - U - 5.75 0.18 5.922012-13 - U - 5.63 0.16 5.792013-14 - U - 5.71 0.14 5.852014-15 - U - 5.85 0.12 5.972015-16 - U - 4.16 0.12 4.272016-17 - U - 4.78 0.11 4.892017-18 - U - 5.36 0.10 5.462018-19 - U - 4.47 0.10 4.56
Notes: These data should be read in conjunction with the explanatory notes.
(1) Total sportsbetting expenditure incomplete due to data for one or more components being unavailable.
U = Unavailable data
TOTAL SPORTSBETTING
(1)
Value ($)
BOOKMAKER (AND OTHER) FIXED ODDS
BOOKMAKER (AND OTHER)
POOL BETTING (U)TAB FIXED ODDS TAB TOTE ODDS
Australian Gambling Statistics, 1993–94 to 2018–19, 36th edition
167

TABLE QLD 38QUEENSLAND
REAL PER CAPITA SPORTSBETTING EXPENDITURE
1995-96 - - - 0.50 0.501996-97 - - - 0.56 0.561997-98 - - - 0.41 0.411998-99 - - - 0.53 0.531999-00 - - 0.51 0.89 1.412000-01 - U - 0.96 0.34 1.302001-02 - U - 1.66 0.40 2.062002-03 - U - 1.65 0.41 2.062003-04 - U - 2.79 0.48 3.272004-05 - U - 2.78 0.47 3.252005-06 - U - 3.87 0.41 4.292006-07 - U - 4.78 0.45 5.232007-08 - U - 5.16 0.37 5.522008-09 - U - 4.71 0.33 5.042009-10 - U - 5.54 0.27 5.802010-11 - U - 6.27 0.24 6.512011-12 - U - 6.56 0.20 6.762012-13 - U - 6.28 0.18 6.462013-14 - U - 6.21 0.15 6.362014-15 - U - 6.25 0.13 6.382015-16 - U - 4.38 0.12 4.502016-17 - U - 4.95 0.11 5.062017-18 - U - 5.45 0.10 5.552018-19 - U - 4.47 0.10 4.56
Notes: These data should be read in conjunction with the explanatory notes.
(1) Total sportsbetting expenditure incomplete due to data for one or more components being unavailable.
U = Unavailable data
TOTAL SPORTSBETTING
(1)
Value ($)
BOOKMAKER (AND OTHER) FIXED ODDS
BOOKMAKER (AND OTHER)
POOL BETTING (U)TAB FIXED ODDS TAB TOTE ODDS
Australian Gambling Statistics, 1993–94 to 2018–19, 36th edition
168

TABLE QLD 39QUEENSLAND
SPORTSBETTING EXPENDITUREAS A % OF HDI
1995-96 - - - 0.001 0.0011996-97 - - - 0.001 0.0011997-98 - - - 0.001 0.0011998-99 - - - 0.001 0.0011999-00 - - 0.001 0.002 0.0032000-01 - U - 0.002 0.001 0.0032001-02 - U - 0.003 0.001 0.0042002-03 - U - 0.004 0.001 0.0042003-04 - U - 0.006 0.001 0.0072004-05 - U - 0.005 0.001 0.0062005-06 - U - 0.007 0.001 0.0082006-07 - U - 0.008 0.001 0.0092007-08 - U - 0.008 0.001 0.0092008-09 - U - 0.007 0.001 0.0082009-10 - U - 0.009 0.000 0.0092010-11 - U - 0.010 0.000 0.0102011-12 - U - 0.010 0.000 0.0112012-13 - U - 0.010 0.000 0.0112013-14 - U - 0.010 0.000 0.0112014-15 - U - 0.010 0.000 0.0102015-16 - U - 0.007 0.000 0.0072016-17 - U - 0.008 0.000 0.0082017-18 - U - 0.009 0.000 0.0092018-19 - U - 0.007 0.000 0.008
Notes: These data should be read in conjunction with the explanatory notes.
(1) Total sportsbetting expenditure incomplete due to data for one or more components being unavailable.
U = Unavailable data
Percentage (%)
BOOKMAKER (AND OTHER) FIXED ODDS
BOOKMAKER (AND OTHER)
POOL BETTING (U)TAB FIXED ODDS TAB TOTE ODDS
TOTAL SPORTSBETTING
(1)
Australian Gambling Statistics, 1993–94 to 2018–19, 36th edition
169

TABLE QLD 40QUEENSLAND
SPORTSBETTING EXPENDITURESHARE OF MARKET
1995-96 - - - 100.001996-97 - - - 100.001997-98 - - - 100.001998-99 - - - 100.001999-00 - - 36.49 63.512000-01 - U - 73.80 26.202001-02 - U - 80.44 19.562002-03 - U - 79.92 20.082003-04 - U - 85.32 14.682004-05 - U - 85.60 14.402005-06 - U - 90.34 9.662006-07 - U - 91.33 8.672007-08 - U - 93.38 6.622008-09 - U - 93.47 6.532009-10 - U - 95.38 4.622010-11 - U - 96.35 3.652011-12 - U - 97.04 2.962012-13 - U - 97.24 2.762013-14 - U - 97.63 2.372014-15 - U - 97.94 2.062015-16 - U - 97.25 2.752016-17 - U - 97.80 2.202017-18 - U - 98.20 1.802018-19 - U - 97.88 2.12
Notes: These data should be read in conjunction with the explanatory notes.
U = Unavailable data
TAB FIXED ODDS TAB TOTE ODDS
Percentage (%)
BOOKMAKER (AND OTHER) FIXED ODDS
BOOKMAKER (AND OTHER)
POOL BETTING (U)
Australian Gambling Statistics, 1993–94 to 2018–19, 36th edition
170

TABLE QLD 41QUEENSLAND
GOVERNMENT REVENUE FROM SPORTSBETTING
1997-98 - - - 0.200 0.2001998-99 - - - 0.300 0.3001999-00 - - 0.161 0.280 0.4412000-01 - - 0.178 0.063 0.2412001-02 - - 0.323 0.079 0.4022002-03 - - 0.340 0.086 0.4262003-04 - - 0.605 0.104 0.7092004-05 - - 0.605 0.107 0.7122005-06 - - 0.933 0.100 1.0332006-07 - - 1.216 0.115 1.3312007-08 - - 1.394 0.099 1.4922008-09 - - 1.348 0.094 1.4422009-10 - - 1.661 0.081 1.7422010-11 - - 1.976 0.075 2.0512011-12 - - 2.157 0.066 2.2232012-13 - - 1.984 0.061 2.0452013-14 - - 2.227 0.054 2.2812014-15 - - 0.193 0.022 0.2152015-16 - - 0.140 0.021 0.1612016-17 - - 0.163 0.020 0.182 2017-18 - - 0.186 0.018 0.204 2018-19 - - - U - U - U
Notes: These data should be read in conjunction with the explanatory notes.
Data for the gambling revenue received by states and territories from 1 July 2000 onwards are not comparable with that of
preceding years because of the impact of changes brought about by the introduction of the GST.
(1) Total revenue from sportsbetting incomplete due to data for one or more components being unavailable.
U = Unavailable data
TOTAL SPORTSBETTING
(1)
Value ($ million)
BOOKMAKER (AND OTHER) FIXED ODDS
(U)
BOOKMAKER (AND OTHER)
POOL BETTING (U)TAB FIXED ODDS TAB TOTE ODDS
Australian Gambling Statistics, 1993–94 to 2018–19, 36th edition
171

TABLE QLD 42QUEENSLAND
REAL GOVERNMENT REVENUE FROM SPORTSBETTING
1997-98 - - - 0.341 0.3411998-99 - - - 0.505 0.5051999-00 - - 0.265 0.460 0.7252000-01 - - 0.276 0.098 0.3742001-02 - - 0.487 0.119 0.6062002-03 - - 0.497 0.126 0.6232003-04 - - 0.864 0.149 1.0122004-05 - - 0.844 0.149 0.9932005-06 - - 1.261 0.135 1.3972006-07 - - 1.597 0.151 1.7482007-08 - - 1.771 0.125 1.8962008-09 - - 1.661 0.116 1.7772009-10 - - 1.999 0.097 2.0972010-11 - - 2.308 0.088 2.3952011-12 - - 2.461 0.075 2.5362012-13 - - 2.213 0.068 2.2812013-14 - - 2.420 0.059 2.4792014-15 - - 0.206 0.024 0.2302015-16 - - 0.147 0.022 0.1702016-17 - - 0.168 0.020 0.189 2017-18 - - 0.189 0.019 0.207 2018-19 - - - U - U - U
Notes: These data should be read in conjunction with the explanatory notes.
Data for the gambling revenue received by states and territories from 1 July 2000 onwards are not comparable with that of
preceding years because of the impact of changes brought about by the introduction of the GST.
(1) Total revenue from sportsbetting incomplete due to data for one or more components being unavailable.
U = Unavailable data
TOTAL SPORTSBETTING
(1)
Value ($ million)
BOOKMAKER (AND OTHER) FIXED ODDS
(U)
BOOKMAKER (AND OTHER)
POOL BETTING (U)TAB FIXED ODDS TAB TOTE ODDS
Australian Gambling Statistics, 1993–94 to 2018–19, 36th edition
172

TABLE QLD 43QUEENSLAND
PER CAPITA REVENUE FROM SPORTSBETTING
1997-98 - - - 0.08 0.081998-99 - - - 0.12 0.121999-00 - - 0.06 0.11 0.172000-01 - - 0.07 0.02 0.092001-02 - - 0.12 0.03 0.152002-03 - - 0.12 0.03 0.152003-04 - - 0.21 0.04 0.252004-05 - - 0.21 0.04 0.242005-06 - - 0.31 0.03 0.352006-07 - - 0.40 0.04 0.432007-08 - - 0.44 0.03 0.472008-09 - - 0.42 0.03 0.452009-10 - - 0.50 0.02 0.532010-11 - - 0.59 0.02 0.612011-12 - - 0.63 0.02 0.652012-13 - - 0.56 0.02 0.582013-14 - - 0.62 0.02 0.642014-15 - - 0.05 0.01 0.062015-16 - - 0.04 0.01 0.042016-17 - - 0.04 0.01 0.05 2017-18 - - 0.05 0.00 0.05 2018-19 - - - U - U - U
Notes: These data should be read in conjunction with the explanatory notes.
Data for the gambling revenue received by states and territories from 1 July 2000 onwards are not comparable with that of
preceding years because of the impact of changes brought about by the introduction of the GST.
(1) Total revenue from sportsbetting incomplete due to data for one or more components being unavailable.
U = Unavailable data
TOTAL SPORTSBETTING
(1)
Value ($)
BOOKMAKER (AND OTHER) FIXED ODDS
(U)
BOOKMAKER (AND OTHER)
POOL BETTING (U)TAB FIXED ODDS TAB TOTE ODDS
Australian Gambling Statistics, 1993–94 to 2018–19, 36th edition
173
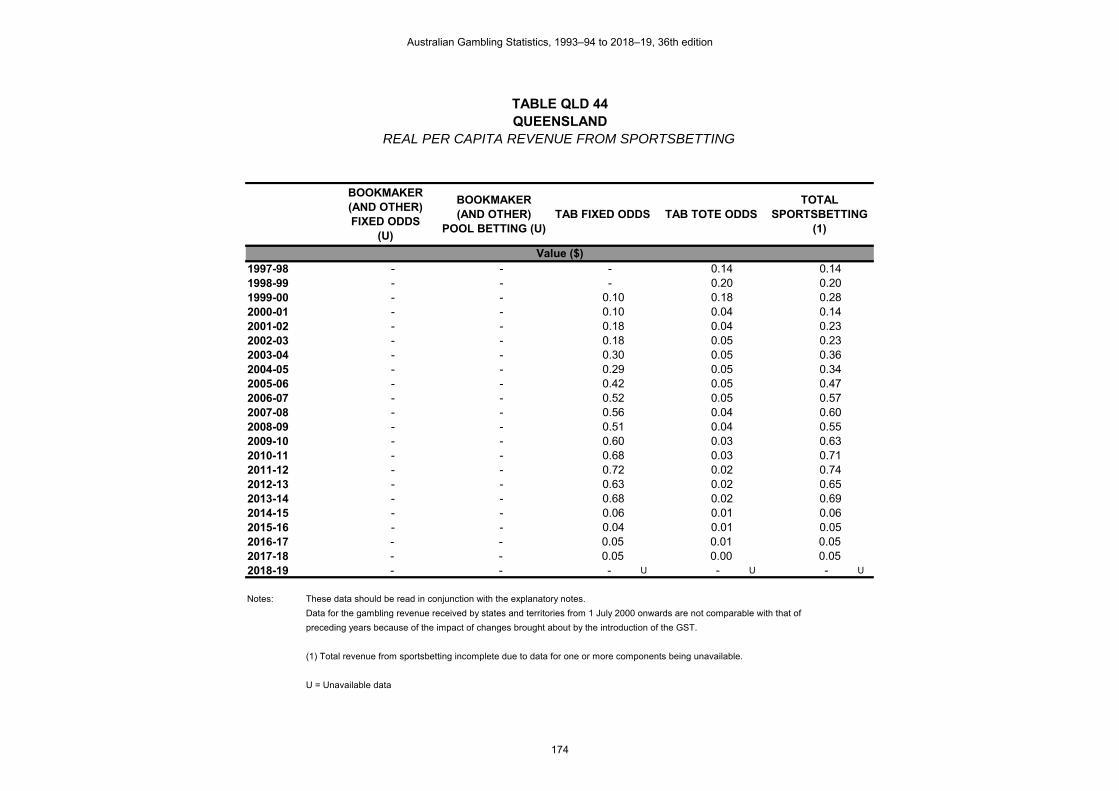
TABLE QLD 44QUEENSLAND
REAL PER CAPITA REVENUE FROM SPORTSBETTING
1997-98 - - - 0.14 0.141998-99 - - - 0.20 0.201999-00 - - 0.10 0.18 0.282000-01 - - 0.10 0.04 0.142001-02 - - 0.18 0.04 0.232002-03 - - 0.18 0.05 0.232003-04 - - 0.30 0.05 0.362004-05 - - 0.29 0.05 0.342005-06 - - 0.42 0.05 0.472006-07 - - 0.52 0.05 0.572007-08 - - 0.56 0.04 0.602008-09 - - 0.51 0.04 0.552009-10 - - 0.60 0.03 0.632010-11 - - 0.68 0.03 0.712011-12 - - 0.72 0.02 0.742012-13 - - 0.63 0.02 0.652013-14 - - 0.68 0.02 0.692014-15 - - 0.06 0.01 0.062015-16 - - 0.04 0.01 0.052016-17 - - 0.05 0.01 0.05 2017-18 - - 0.05 0.00 0.05 2018-19 - - - U - U - U
Notes: These data should be read in conjunction with the explanatory notes.
Data for the gambling revenue received by states and territories from 1 July 2000 onwards are not comparable with that of
preceding years because of the impact of changes brought about by the introduction of the GST.
(1) Total revenue from sportsbetting incomplete due to data for one or more components being unavailable.
U = Unavailable data
TOTAL SPORTSBETTING
(1)
Value ($)
BOOKMAKER (AND OTHER) FIXED ODDS
(U)
BOOKMAKER (AND OTHER)
POOL BETTING (U)TAB FIXED ODDS TAB TOTE ODDS
Australian Gambling Statistics, 1993–94 to 2018–19, 36th edition
174

TABLE QLD 45QUEENSLAND
GOVERNMENT REVENUE FROM SPORTSBETTINGAS A % OF TOTAL GAMBLING REVENUE
1997-98 - - - 0.04 0.041998-99 - - - 0.05 0.051999-00 - - 0.03 0.05 0.072000-01 - - 0.03 0.01 0.052001-02 - - 0.06 0.01 0.072002-03 - - 0.05 0.01 0.072003-04 - - 0.08 0.01 0.102004-05 - - 0.08 0.01 0.092005-06 - - 0.11 0.01 0.122006-07 - - 0.15 0.01 0.162007-08 - - 0.16 0.01 0.172008-09 - - 0.15 0.01 0.162009-10 - - 0.18 0.01 0.192010-11 - - 0.21 0.01 0.222011-12 - - 0.21 0.01 0.222012-13 - - 0.19 0.01 0.202013-14 - - 0.21 0.01 0.222014-15 - - 0.02 0.00 0.022015-16 - - 0.01 0.00 0.012016-17 - - 0.01 0.00 0.02 2017-18 - - 0.02 0.00 0.02 2018-19 - - - U - U - U
Notes: These data should be read in conjunction with the explanatory notes.
Data for the gambling revenue received by states and territories from 1 July 2000 onwards are not comparable with that of
preceding years because of the impact of changes brought about by the introduction of the GST.
(1) Total revenue from sportsbetting incomplete due to data for one or more components being unavailable.
U = Unavailable data
Percentage (%)
BOOKMAKER (AND OTHER) FIXED ODDS
(U)
BOOKMAKER (AND OTHER)
POOL BETTING (U)TAB FIXED ODDS TAB TOTE ODDS
TOTAL SPORTSBETTING
(1)
Australian Gambling Statistics, 1993–94 to 2018–19, 36th edition
175

TABLE QLD 46QUEENSLAND
TOTAL GAMBLING TURNOVER
1993-94 4,206.313 1,765.574 - 5,971.8871994-95 5,182.140 1,792.869 - 6,975.0091995-96 6,333.749 1,758.800 4.000 8,096.5491996-97 7,167.709 1,742.000 4.400 8,914.1091997-98 9,572.071 1,731.300 2.600 11,305.9711998-99 11,499.217 1,761.000 3.327 13,263.5441999-00 13,232.373 1,725.665 13.072 14,971.1102000-01 14,324.536 1,551.565 17.527 15,893.6282001-02 15,150.472 1,590.191 26.137 16,766.8002002-03 16,740.833 1,686.593 30.043 18,457.4692003-04 19,162.861 1,808.578 46.810 21,018.2492004-05 21,247.321 1,915.544 48.535 23,211.4002005-06 22,648.319 1,931.923 70.228 24,650.4702006-07 21,897.521 2,065.409 86.785 24,049.7152007-08 24,026.119 2,066.364 109.426 26,201.9092008-09 25,616.436 2,230.662 125.348 27,972.4462009-10 24,961.631 2,214.088 149.978 27,325.6972010-11 26,217.917 2,239.010 147.350 28,604.2772011-12 27,586.188 2,248.818 157.841 29,992.8472012-13 28,347.854 2,202.268 148.792 30,698.9142013-14 28,865.043 2,153.231 157.459 31,175.7332014-15 31,179.297 2,068.511 153.855 33,401.6632015-16 32,814.517 2,172.839 184.232 35,171.5882016-17 33,738.010 2,023.651 164.908 35,926.5692017-18 35,271.285 1,992.090 192.218 37,455.5922018-19 36,684.444 1,839.399 173.552 38,697.396
Notes: These data should be read in conjunction with the explanatory notes.
Figure(s) may be incomplete for any period due to some unavailable turnover figures that are used to derive these numbers.
Value ($ million)
GAMING RACING SPORTSBETTING TOTAL GAMBLING
Australian Gambling Statistics, 1993–94 to 2018–19, 36th edition
176

TABLE QLD 47QUEENSLAND
REAL GAMBLING TURNOVER
1993-94 7,816.617 3,280.977 - 11,097.5941994-95 9,326.217 3,226.599 - 12,552.8161995-96 10,933.143 3,035.992 6.905 13,976.0401996-97 12,206.501 2,966.600 7.493 15,180.5951997-98 16,301.094 2,948.378 4.428 19,253.9001998-99 19,351.927 2,963.571 5.599 22,321.0971999-00 21,755.241 2,837.152 21.492 24,613.8852000-01 22,206.923 2,405.347 27.172 24,639.4422001-02 22,835.784 2,396.840 39.395 25,272.0202002-03 24,488.834 2,467.183 43.948 26,999.9642003-04 27,365.237 2,582.713 66.846 30,014.7962004-05 29,637.156 2,671.926 67.700 32,376.7822005-06 30,618.166 2,611.758 94.941 33,324.8652006-07 28,751.521 2,711.889 113.949 31,577.3592007-08 30,527.619 2,625.524 139.037 33,292.1812008-09 31,564.097 2,748.580 154.451 34,467.1282009-10 30,043.482 2,664.846 180.511 32,888.8402010-11 30,618.877 2,614.852 172.084 33,405.8142011-12 31,475.841 2,565.901 180.097 34,221.8382012-13 31,617.694 2,456.293 165.955 34,239.9422013-14 31,366.680 2,339.844 171.105 33,877.6302014-15 33,310.466 2,209.898 164.371 35,684.7352015-16 34,571.896 2,289.205 194.099 37,055.2002016-17 34,932.005 2,095.269 170.744 37,198.0182017-18 35,836.631 2,024.020 195.299 38,055.9492018-19 36,684.444 1,839.399 173.552 38,697.396
Notes: These data should be read in conjunction with the explanatory notes.
Figure(s) may be incomplete for any period due to some unavailable turnover figures that are used to derive these numbers.
Value ($ million)
GAMING RACING SPORTSBETTING TOTAL GAMBLING
Australian Gambling Statistics, 1993–94 to 2018–19, 36th edition
177

TABLE QLD 48QUEENSLAND
PER CAPITA GAMBLING TURNOVER
1993-94 1,835.16 770.30 - 2,605.451994-95 2,205.46 763.02 - 2,968.481995-96 2,633.60 731.32 1.66 3,366.571996-97 2,921.22 709.96 1.79 3,632.971997-98 3,834.86 693.61 1.04 4,529.521998-99 4,532.43 694.10 1.31 5,227.841999-00 5,126.49 668.56 5.06 5,800.112000-01 5,445.18 589.80 6.66 6,041.642001-02 5,629.31 590.85 9.71 6,229.872002-03 6,055.50 610.08 10.87 6,676.452003-04 6,746.63 636.74 16.48 7,399.852004-05 7,292.72 657.47 16.66 7,966.852005-06 7,585.56 647.06 23.52 8,256.142006-07 7,150.11 674.41 28.34 7,852.862007-08 7,636.25 656.75 34.78 8,327.782008-09 7,921.09 689.76 38.76 8,649.612009-10 7,540.11 668.81 45.30 8,254.222010-11 7,771.90 663.72 43.68 8,479.302011-12 8,016.89 653.53 45.87 8,716.292012-13 8,070.61 626.98 42.36 8,739.952013-14 8,073.70 602.27 44.04 8,720.012014-15 8,594.69 570.19 42.41 9,207.302015-16 8,917.55 590.48 50.07 9,558.102016-17 9,017.65 540.89 44.08 9,602.622017-18 9,256.35 522.79 50.44 9,829.582018-19 9,452.07 473.94 44.72 9,970.72
Notes: These data should be read in conjunction with the explanatory notes.
Figure(s) may be incomplete for any period due to some unavailable turnover figures that are used to derive these numbers.
Value ($)
GAMING RACING SPORTSBETTING TOTAL GAMBLING
Australian Gambling Statistics, 1993–94 to 2018–19, 36th edition
178

TABLE QLD 49QUEENSLAND
REAL PER CAPITA GAMBLING TURNOVER
1993-94 3,410.28 1,431.44 - 4,841.731994-95 3,969.13 1,373.20 - 5,342.341995-96 4,546.04 1,262.38 2.87 5,811.291996-97 4,974.79 1,209.05 3.05 6,186.891997-98 6,530.72 1,181.21 1.77 7,713.701998-99 7,627.58 1,168.09 2.21 8,797.881999-00 8,428.42 1,099.17 8.33 9,535.922000-01 8,441.51 914.34 10.33 9,366.182001-02 8,484.86 890.57 14.64 9,390.072002-03 8,858.12 892.43 15.90 9,766.442003-04 9,634.42 909.29 23.53 10,567.242004-05 10,172.36 917.09 23.24 11,112.682005-06 10,254.89 874.75 31.80 11,161.442006-07 9,388.12 885.50 37.21 10,310.832007-08 9,702.62 834.47 44.19 10,581.292008-09 9,760.22 849.91 47.76 10,657.892009-10 9,075.17 804.96 54.53 9,934.672010-11 9,076.49 775.13 51.01 9,902.642011-12 9,147.27 745.68 52.34 9,945.292012-13 9,001.53 699.30 47.25 9,748.082013-14 8,773.42 654.47 47.86 9,475.742014-15 9,182.16 609.17 45.31 9,836.632015-16 9,395.13 622.11 52.75 10,069.982016-17 9,336.78 560.03 45.64 9,942.452017-18 9,404.71 531.17 51.25 9,987.132018-19 9,452.07 473.94 44.72 9,970.72
Notes: These data should be read in conjunction with the explanatory notes.
Figure(s) may be incomplete for any period due to some unavailable turnover figures that are used to derive these numbers.
Value ($)
GAMING RACING SPORTSBETTING TOTAL GAMBLING
Australian Gambling Statistics, 1993–94 to 2018–19, 36th edition
179

TABLE QLD 50QUEENSLAND
TOTAL GAMBLING EXPENDITURE
1993-94 900.111 257.258 - 1,157.3691994-95 989.777 260.350 - 1,250.1271995-96 1,185.656 262.299 0.700 1,448.6551996-97 1,311.019 263.740 0.800 1,575.5591997-98 1,497.877 263.300 0.600 1,761.7771998-99 1,720.120 271.700 0.800 1,992.6201999-00 1,765.901 250.933 2.206 2,019.0402000-01 1,921.195 244.997 2.206 2,168.3982001-02 2,049.459 252.572 3.686 2,305.7172002-03 2,207.884 266.673 3.900 2,478.4572003-04 2,499.775 287.020 6.499 2,793.2942004-05 2,658.181 304.181 6.790 2,969.1522005-06 2,802.635 308.844 9.471 3,120.9502006-07 2,670.928 328.634 12.201 3,011.7632007-08 2,854.842 328.820 13.680 3,197.3412008-09 2,975.265 355.849 13.223 3,344.3372009-10 2,849.777 349.614 15.965 3,215.3562010-11 2,954.540 348.011 18.799 3,321.3502011-12 3,101.233 355.894 20.372 3,477.4992012-13 3,178.822 357.290 20.350 3,556.4622013-14 3,133.117 345.594 20.914 3,499.6252014-15 3,383.943 339.189 21.664 3,744.7962015-16 3,510.466 332.026 15.723 3,858.2152016-17 3,513.740 323.661 18.294 3,855.6962017-18 3,715.282 320.311 20.815 4,056.4082018-19 3,967.518 310.794 17.711 4,296.022
Notes: These data should be read in conjunction with the explanatory notes.
Figure(s) may be incomplete for any period due to some unavailable expenditure figures that are used to derive these numbers.
Value ($ million)
GAMING RACING SPORTSBETTING TOTAL GAMBLING
Australian Gambling Statistics, 1993–94 to 2018–19, 36th edition
180

TABLE QLD 51QUEENSLAND
REAL GAMBLING EXPENDITURE
1993-94 1,672.682 478.064 - 2,150.7461994-95 1,781.287 468.548 - 2,249.8351995-96 2,046.647 452.774 1.208 2,500.6291996-97 2,232.646 449.145 1.362 2,683.1531997-98 2,550.862 448.396 1.022 3,000.2801998-99 2,894.774 457.241 1.346 3,353.3621999-00 2,903.304 412.557 3.627 3,319.4882000-01 2,978.374 379.812 3.420 3,361.6062001-02 3,089.079 380.693 5.556 3,475.3282002-03 3,229.738 390.095 5.705 3,625.5382003-04 3,569.766 409.875 9.281 3,988.9222004-05 3,707.805 424.292 9.471 4,141.5682005-06 3,788.870 417.524 12.804 4,219.1982006-07 3,506.938 431.498 16.020 3,954.4562007-08 3,627.366 417.799 17.381 4,062.5462008-09 3,666.066 438.471 16.293 4,120.8302009-10 3,429.953 420.791 19.215 3,869.9592010-11 3,450.491 406.428 21.955 3,878.8742011-12 3,538.507 406.075 23.244 3,967.8262012-13 3,545.490 398.502 22.697 3,966.6892013-14 3,404.654 375.545 22.727 3,802.9262014-15 3,615.242 362.373 23.145 4,000.7612015-16 3,698.469 349.808 16.565 4,064.8422016-17 3,638.092 335.116 18.941 3,992.1492017-18 3,774.833 325.445 21.148 4,121.4262018-19 3,967.518 310.794 17.711 4,296.022
Notes: These data should be read in conjunction with the explanatory notes.
Figure(s) may be incomplete for any period due to some unavailable expenditure figures that are used to derive these numbers.
Value ($ million)
GAMING RACING SPORTSBETTING TOTAL GAMBLING
Australian Gambling Statistics, 1993–94 to 2018–19, 36th edition
181

TABLE QLD 52QUEENSLAND
PER CAPITA GAMBLING EXPENDITURE
1993-94 392.71 112.24 - 504.941994-95 421.24 110.80 - 532.041995-96 493.00 109.07 0.29 602.361996-97 534.31 107.49 0.33 642.121997-98 600.10 105.49 0.24 705.821998-99 677.99 107.09 0.32 785.391999-00 684.15 97.22 0.85 782.222000-01 730.30 93.13 0.84 824.272001-02 761.50 93.85 1.37 856.712002-03 798.64 96.46 1.41 896.512003-04 880.09 101.05 2.29 983.432004-05 912.37 104.40 2.33 1,019.102005-06 938.68 103.44 3.17 1,045.292006-07 872.13 107.31 3.98 983.422007-08 907.36 104.51 4.35 1,016.212008-09 920.01 110.04 4.09 1,034.132009-10 860.83 105.61 4.82 971.262010-11 875.83 103.16 5.57 984.562011-12 901.26 103.43 5.92 1,010.602012-13 905.01 101.72 5.79 1,012.522013-14 876.35 96.66 5.85 978.862014-15 932.80 93.50 5.97 1,032.272015-16 953.99 90.23 4.27 1,048.492016-17 939.17 86.51 4.89 1,030.572017-18 975.01 84.06 5.46 1,064.542018-19 1,022.27 80.08 4.56 1,106.91
Notes: These data should be read in conjunction with the explanatory notes.
Figure(s) may be incomplete for any period due to some unavailable expenditure figures that are used to derive these numbers.
Value ($)
GAMING RACING SPORTSBETTING TOTAL GAMBLING
Australian Gambling Statistics, 1993–94 to 2018–19, 36th edition
182

TABLE QLD 53QUEENSLAND
REAL PER CAPITA GAMBLING EXPENDITURE
1993-94 729.77 208.57 - 938.341994-95 758.10 199.41 - 957.501995-96 851.00 188.27 0.50 1,039.771996-97 909.92 183.05 0.56 1,093.531997-98 1,021.95 179.64 0.41 1,202.001998-99 1,140.98 180.22 0.53 1,321.731999-00 1,124.80 159.83 1.41 1,286.042000-01 1,132.17 144.38 1.30 1,277.852001-02 1,147.78 141.45 2.06 1,291.292002-03 1,168.26 141.11 2.06 1,311.432003-04 1,256.80 144.30 3.27 1,404.372004-05 1,272.63 145.63 3.25 1,421.512005-06 1,269.00 139.84 4.29 1,413.132006-07 1,145.11 140.90 5.23 1,291.232007-08 1,152.89 132.79 5.52 1,291.202008-09 1,133.62 135.58 5.04 1,274.242009-10 1,036.08 127.11 5.80 1,168.992010-11 1,022.84 120.48 6.51 1,149.832011-12 1,028.33 118.01 6.76 1,153.102012-13 1,009.40 113.45 6.46 1,129.312013-14 952.30 105.04 6.36 1,063.702014-15 996.56 99.89 6.38 1,102.822015-16 1,005.08 95.06 4.50 1,104.652016-17 972.41 89.57 5.06 1,067.042017-18 990.64 85.41 5.55 1,081.602018-19 1,022.27 80.08 4.56 1,106.91
Notes: These data should be read in conjunction with the explanatory notes.
Figure(s) may be incomplete for any period due to some unavailable expenditure figures that are used to derive these numbers.
Value ($)
GAMING RACING SPORTSBETTING TOTAL GAMBLING
Australian Gambling Statistics, 1993–94 to 2018–19, 36th edition
183

TABLE QLD 54QUEENSLAND
GAMBLING EXPENDITUREAS A % OF HDI
1993-94 1.757 0.502 - 2.2591994-95 1.805 0.475 - 2.2801995-96 2.029 0.449 0.001 2.4801996-97 2.080 0.419 0.001 2.5001997-98 2.292 0.403 0.001 2.6961998-99 2.539 0.401 0.001 2.9411999-00 2.472 0.351 0.003 2.8272000-01 2.446 0.312 0.003 2.7602001-02 2.345 0.289 0.004 2.6392002-03 2.483 0.300 0.004 2.7882003-04 2.521 0.289 0.007 2.8172004-05 2.405 0.275 0.006 2.6862005-06 2.313 0.255 0.008 2.5752006-07 1.952 0.240 0.009 2.2012007-08 1.897 0.218 0.009 2.1242008-09 1.767 0.211 0.008 1.9862009-10 1.644 0.202 0.009 1.8552010-11 1.602 0.189 0.010 1.8012011-12 1.605 0.184 0.011 1.7992012-13 1.645 0.185 0.011 1.8402013-14 1.576 0.174 0.011 1.7612014-15 1.628 0.163 0.010 1.8012015-16 1.639 0.155 0.007 1.8012016-17 1.604 0.148 0.008 1.7602017-18 1.640 0.141 0.009 1.7902018-19 1.688 0.132 0.008 1.828
Notes: These data should be read in conjunction with the explanatory notes.
Figure(s) may be incomplete for any period due to some unavailable expenditure figures that are used to derive these numbers.
RACING SPORTSBETTING TOTAL GAMBLING
Percentage (%)
GAMING
Australian Gambling Statistics, 1993–94 to 2018–19, 36th edition
184

TABLE QLD 55QUEENSLAND
GAMBLING EXPENDITUREAS A % OF TOTAL GAMBLING EXPENDITURE
1993-94 77.77 22.23 -1994-95 79.17 20.83 -1995-96 81.85 18.11 0.051996-97 83.21 16.74 0.051997-98 85.02 14.95 0.031998-99 86.32 13.64 0.041999-00 87.46 12.43 0.112000-01 88.60 11.30 0.102001-02 88.89 10.95 0.162002-03 89.08 10.76 0.162003-04 89.49 10.28 0.232004-05 89.53 10.24 0.232005-06 89.80 9.90 0.302006-07 88.68 10.91 0.412007-08 89.29 10.28 0.432008-09 88.96 10.64 0.402009-10 88.63 10.87 0.502010-11 88.96 10.48 0.572011-12 89.18 10.23 0.592012-13 89.38 10.05 0.572013-14 89.53 9.88 0.602014-15 90.36 9.06 0.582015-16 90.99 8.61 0.412016-17 91.13 8.39 0.472017-18 91.59 7.90 0.512018-19 92.35 7.23 0.41
Notes: These data should be read in conjunction with the explanatory notes.
Figure(s) may be incomplete for any period due to some unavailable expenditure figures that are used to derive these numbers.
Percentage (%)
GAMING RACING SPORTSBETTING
Australian Gambling Statistics, 1993–94 to 2018–19, 36th edition
185

TABLE QLD 56QUEENSLAND
GOVERNMENT REVENUE FROM GAMBLING
1993-94 260.975 74.712 - 335.6871994-95 307.894 77.437 - 385.3311995-96 338.748 77.912 - 416.6601996-97 365.169 79.800 - 444.9691997-98 428.423 79.900 0.200 508.5231998-99 505.368 81.700 0.300 587.3681999-00 563.439 50.007 0.441 613.8872000-01 482.974 26.549 0.241 509.7642001-02 536.032 26.904 0.402 563.3382002-03 603.855 28.416 0.426 632.6972003-04 688.630 30.580 0.709 719.9192004-05 767.386 32.384 0.712 800.4822005-06 806.388 33.692 1.033 841.1142006-07 780.072 35.851 1.331 817.2542007-08 842.753 35.871 1.492 880.1162008-09 886.553 38.820 1.442 926.8152009-10 882.712 38.140 1.742 922.5942010-11 907.558 37.965 2.051 947.5742011-12 962.955 38.825 2.223 1,004.0032012-13 999.548 38.977 2.045 1,040.5702013-14 1,005.540 37.701 2.281 1,045.5222014-15 1,071.026 11.795 0.215 1,083.0362015-16 1,128.640 10.805 0.161 1,139.6062016-17 1,127.584 10.020 0.182 1,137.7872017-18 1,178.396 9.545 0.204 1,188.1452018-19 1,268.602 - - 1,268.602
Notes: These data should be read in conjunction with the explanatory notes.
Figure(s) may be incomplete for any period due to some unavailable revenue figures that are used to derive these numbers.
Data for the gambling revenue received by states and territories from 1 July 2000 onwards are not comparable with that of
preceding years because of the impact of changes brought about by the introduction of the GST.
Value ($ million)
GAMING RACING SPORTSBETTING TOTAL GAMBLING
Australian Gambling Statistics, 1993–94 to 2018–19, 36th edition
186

TABLE QLD 57QUEENSLAND
REAL GOVERNMENT REVENUE FROM GAMBLING
1993-94 484.971 138.838 - 623.8091994-95 554.112 139.362 - 693.4741995-96 584.737 134.490 - 719.2271996-97 621.877 135.898 - 757.7761997-98 729.598 136.069 0.341 866.0071998-99 850.479 137.492 0.505 988.4761999-00 926.346 82.216 0.725 1,009.2872000-01 748.741 41.158 0.374 790.2732001-02 807.943 40.551 0.606 849.1002002-03 883.331 41.568 0.623 925.5222003-04 983.388 43.669 1.012 1,028.0702004-05 1,070.400 45.171 0.993 1,116.5652005-06 1,090.153 45.548 1.397 1,137.0982006-07 1,024.238 47.073 1.748 1,073.0582007-08 1,070.803 45.578 1.896 1,118.2772008-09 1,092.394 47.833 1.777 1,142.0042009-10 1,062.420 45.905 2.097 1,110.4222010-11 1,059.901 44.338 2.395 1,106.6352011-12 1,098.732 44.299 2.536 1,145.5672012-13 1,114.843 43.473 2.281 1,160.5972013-14 1,092.687 40.968 2.479 1,136.1342014-15 1,144.233 12.601 0.230 1,157.0642015-16 1,189.085 11.384 0.170 1,200.6382016-17 1,167.490 10.375 0.189 1,178.0542017-18 1,197.284 9.698 0.207 1,207.1892018-19 1,268.602 - - 1,268.602
Notes: These data should be read in conjunction with the explanatory notes.
Figure(s) may be incomplete for any period due to some unavailable revenue figures that are used to derive these numbers.
Data for the gambling revenue received by states and territories from 1 July 2000 onwards are not comparable with that of
preceding years because of the impact of changes brought about by the introduction of the GST.
Value ($ million)
GAMING RACING SPORTSBETTING TOTAL GAMBLING
Australian Gambling Statistics, 1993–94 to 2018–19, 36th edition
187

TABLE QLD 58QUEENSLAND
PER CAPITA REVENUE FROM GAMBLING
1993-94 113.86 32.60 - 146.461994-95 131.04 32.96 - 163.991995-96 140.85 32.40 - 173.251996-97 148.83 32.52 - 181.351997-98 171.64 32.01 0.08 203.731998-99 199.19 32.20 0.12 231.511999-00 218.29 19.37 0.17 237.832000-01 183.59 10.09 0.09 193.782001-02 199.17 10.00 0.15 209.312002-03 218.43 10.28 0.15 228.862003-04 242.44 10.77 0.25 253.462004-05 263.39 11.12 0.24 274.752005-06 270.08 11.28 0.35 281.712006-07 254.71 11.71 0.43 266.852007-08 267.85 11.40 0.47 279.732008-09 274.14 12.00 0.45 286.592009-10 266.64 11.52 0.53 278.692010-11 269.03 11.25 0.61 280.892011-12 279.85 11.28 0.65 291.782012-13 284.57 11.10 0.58 296.252013-14 281.25 10.55 0.64 292.442014-15 295.23 3.25 0.06 298.542015-16 306.72 2.94 0.04 309.702016-17 301.39 2.68 0.05 304.112017-18 309.25 2.50 0.05 311.812018-19 326.87 - - 326.87
Notes: These data should be read in conjunction with the explanatory notes.
Figure(s) may be incomplete for any period due to some unavailable revenue figures that are used to derive these numbers.
Data for the gambling revenue received by states and territories from 1 July 2000 onwards are not comparable with that of
preceding years because of the impact of changes brought about by the introduction of the GST.
Value ($)
GAMING RACING SPORTSBETTING TOTAL GAMBLING
Australian Gambling Statistics, 1993–94 to 2018–19, 36th edition
188

TABLE QLD 59QUEENSLAND
REAL PER CAPITA REVENUE FROM GAMBLING
1993-94 211.59 60.57 - 272.161994-95 235.82 59.31 - 295.131995-96 243.14 55.92 - 299.061996-97 253.45 55.39 - 308.831997-98 292.30 54.51 0.14 346.951998-99 335.22 54.19 0.20 389.611999-00 358.89 31.85 0.28 391.022000-01 284.62 15.65 0.14 300.412001-02 300.20 15.07 0.23 315.492002-03 319.52 15.04 0.23 334.782003-04 346.22 15.37 0.36 361.952004-05 367.39 15.50 0.34 383.242005-06 365.12 15.26 0.47 380.852006-07 334.44 15.37 0.57 350.382007-08 340.33 14.49 0.60 355.422008-09 337.79 14.79 0.55 353.132009-10 320.92 13.87 0.63 335.422010-11 314.19 13.14 0.71 328.042011-12 319.30 12.87 0.74 332.922012-13 317.39 12.38 0.65 330.422013-14 305.63 11.46 0.69 317.782014-15 315.41 3.47 0.06 318.952015-16 323.14 3.09 0.05 326.282016-17 312.05 2.77 0.05 314.882017-18 314.21 2.54 0.05 316.812018-19 326.87 - - 326.87
Notes: These data should be read in conjunction with the explanatory notes.
Figure(s) may be incomplete for any period due to some unavailable revenue figures that are used to derive these numbers.
Data for the gambling revenue received by states and territories from 1 July 2000 onwards are not comparable with that of
preceding years because of the impact of changes brought about by the introduction of the GST.
Value ($)
GAMING RACING SPORTSBETTING TOTAL GAMBLING
Australian Gambling Statistics, 1993–94 to 2018–19, 36th edition
189

TABLE QLD 60QUEENSLAND
GOVERNMENT REVENUE FROM GAMBLINGAS A % OF TOTAL GAMBLING REVENUE
1993-94 77.74 22.26 -1994-95 79.90 20.10 -1995-96 81.30 18.70 -1996-97 82.07 17.93 -1997-98 84.25 15.71 0.041998-99 86.04 13.91 0.051999-00 91.78 8.15 0.072000-01 94.74 5.21 0.052001-02 95.15 4.78 0.072002-03 95.44 4.49 0.072003-04 95.65 4.25 0.102004-05 95.87 4.05 0.092005-06 95.87 4.01 0.122006-07 95.45 4.39 0.162007-08 95.75 4.08 0.172008-09 95.66 4.19 0.162009-10 95.68 4.13 0.192010-11 95.78 4.01 0.222011-12 95.91 3.87 0.222012-13 96.06 3.75 0.202013-14 96.18 3.61 0.222014-15 98.89 1.09 0.022015-16 99.04 0.95 0.012016-17 99.10 0.88 0.022017-18 99.18 0.80 0.022018-19 100.00 - -
Notes: These data should be read in conjunction with the explanatory notes.
Figure(s) may be incomplete for any period due to some unavailable revenue figures that are used to derive these numbers.
Data for the gambling revenue received by states and territories from 1 July 2000 onwards are not comparable with that of
preceding years because of the impact of changes brought about by the introduction of the GST.
Percentage (%)
GAMING RACING SPORTSBETTING
Australian Gambling Statistics, 1993–94 to 2018–19, 36th edition
190

TABLE QLD 61QUEENSLAND
GAMING MACHINES OPERATING AS AT 30 JUNE
2001-02 3,468 19,280 17,013 39,761 2002-03 3,487 19,911 17,522 40,920 2003-04 3,570 20,441 17,813 41,824 2004-05 3,656 21,102 18,832 43,590 2005-06 3,601 22,024 18,556 44,181 2006-07 3,580 22,788 18,610 44,978 2007-08 3,461 22,901 18,754 45,116 2008-09 3,603 23,061 18,714 45,378 2009-10 3,622 23,332 18,894 45,848 2010-11 3,610 23,399 18,748 45,757 2011-12 3,692 23,479 18,981 46,152 2012-13 3,671 23,682 19,304 46,657 2013-14 3,866 23,566 19,231 46,663 2014-15 3,829 23,578 19,290 46,697 2015-16 3,746 23,488 19,247 46,481 2016-17 4,024 23,478 19,099 46,601 2017-18 4,047 23,011 19,166 46,224 2018-19 3,910 22,614 19,187 45,711
Notes: These data should be read in conjunction with the explanatory notes.
NUMBER
CASINOS CLUBS HOTELS TOTAL MACHINES
Australian Gambling Statistics, 1993–94 to 2018–19, 36th edition
191

TABLE SA 1SOUTH AUSTRALIA
TOTAL RACING TURNOVER
1993-94 5.060 142.933 60.692 526.852 735.5371994-95 4.630 129.345 57.053 513.283 704.3111995-96 3.508 87.293 53.029 496.392 640.2221996-97 3.044 78.838 53.912 522.926 658.7201997-98 1.768 74.567 51.063 590.304 717.7021998-99 1.654 68.044 48.635 617.823 736.1561999-00 1.122 73.528 48.742 616.363 739.7552000-01 0.725 98.320 48.378 630.254 777.6772001-02 0.663 139.969 43.920 622.050 806.6022002-03 0.598 100.340 44.227 631.043 776.2082003-04 0.350 97.207 40.362 663.895 801.8142004-05 0.019 149.642 45.592 683.780 879.0332005-06 0.021 87.556 37.400 657.715 782.6922006-07 0.050 84.672 36.512 700.604 821.8382007-08 0.056 72.430 32.024 671.135 775.6452008-09 0.059 59.621 31.614 717.910 809.2042009-10 26.427 30.312 29.949 739.724 826.4122010-11 19.562 25.663 27.600 777.362 850.1872011-12 10.681 17.688 29.864 749.566 807.7992012-13 10.199 12.810 (1) 21.960 654.681 699.6502013-14 5.269 5.439 - (2) 648.967 659.675 (3)
2014-15 4.379 10.947 - 660.621 675.9472015-16 3.703 10.463 - 668.275 682.4412016-17 5.708 10.095 11.663 R 627.062 654.528 R
2017-18 5.159 8.702 10.347 R 612.348 636.556 R
2018-19 11.369 8.068 9.064 558.620 587.121
Notes: These data should be read in conjunction with the explanatory notes.
(1) Total turnover on course bets, from this period on.
(2) Data are not available as a result of the agreement made pursuant to Section 14 of the Authorised Betting Operations Act 2000 .
(3) Total racing figure incomplete from this period on, due to data for one or more components being unavailable.
R = Revised data
TOTAL RACING
Value ($ million)
BOOKMAKERS OFF COURSE
BOOKMAKERS ON COURSE
ON-COURSE TOTALISATOR
TAB
Australian Gambling Statistics, 1993–94 to 2018–19, 36th edition
192

TABLE SA 2SOUTH AUSTRALIA
REAL RACING TURNOVER
1993-94 9.403 265.613 112.784 979.052 1,366.8531994-95 8.333 232.780 102.677 923.747 1,267.5381995-96 6.055 150.683 91.537 856.858 1,105.1341996-97 5.184 134.260 91.811 890.535 1,121.7901997-98 3.011 126.986 86.960 1,005.279 1,222.2361998-99 2.784 114.511 81.847 1,039.729 1,238.8701999-00 1.845 120.887 80.136 1,013.358 1,216.2252000-01 1.124 152.423 74.999 977.065 1,205.6112001-02 0.999 210.970 66.199 937.595 1,215.7632002-03 0.875 146.779 64.696 923.103 1,135.4532003-04 0.500 138.815 57.638 948.065 1,145.0182004-05 0.027 208.730 63.595 953.781 1,226.1332005-06 0.028 118.367 50.561 889.162 1,058.1182006-07 0.066 111.175 47.940 919.895 1,079.0762007-08 0.071 92.030 40.690 852.745 985.5362008-09 0.073 73.464 38.954 884.595 997.0862009-10 31.807 36.483 36.046 890.322 994.6582010-11 22.846 29.971 32.233 907.851 992.9002011-12 12.187 20.182 34.075 855.255 921.6992012-13 11.375 14.288 (1) 24.493 730.197 780.3532013-14 5.726 5.910 - (2) 705.211 716.847 (3)
2014-15 4.678 11.695 - 705.776 722.1492015-16 3.901 11.023 - 704.064 718.9892016-17 5.910 10.452 12.076 R 649.254 677.692 R
2017-18 5.242 8.841 10.512 R 622.163 646.759 R
2018-19 11.369 8.068 9.064 558.620 587.121
Notes: These data should be read in conjunction with the explanatory notes.
(1) Total turnover on course bets, from this period on.
(2) Data are not available as a result of the agreement made pursuant to Section 14 of the Authorised Betting Operations Act 2000 .
(3) Total racing figure incomplete from this period on, due to data for one or more components being unavailable.
R = Revised data
TOTAL RACING
Value ($ million)
BOOKMAKERS OFF COURSE
BOOKMAKERS ON COURSE
ON-COURSE TOTALISATOR
TAB
Australian Gambling Statistics, 1993–94 to 2018–19, 36th edition
193
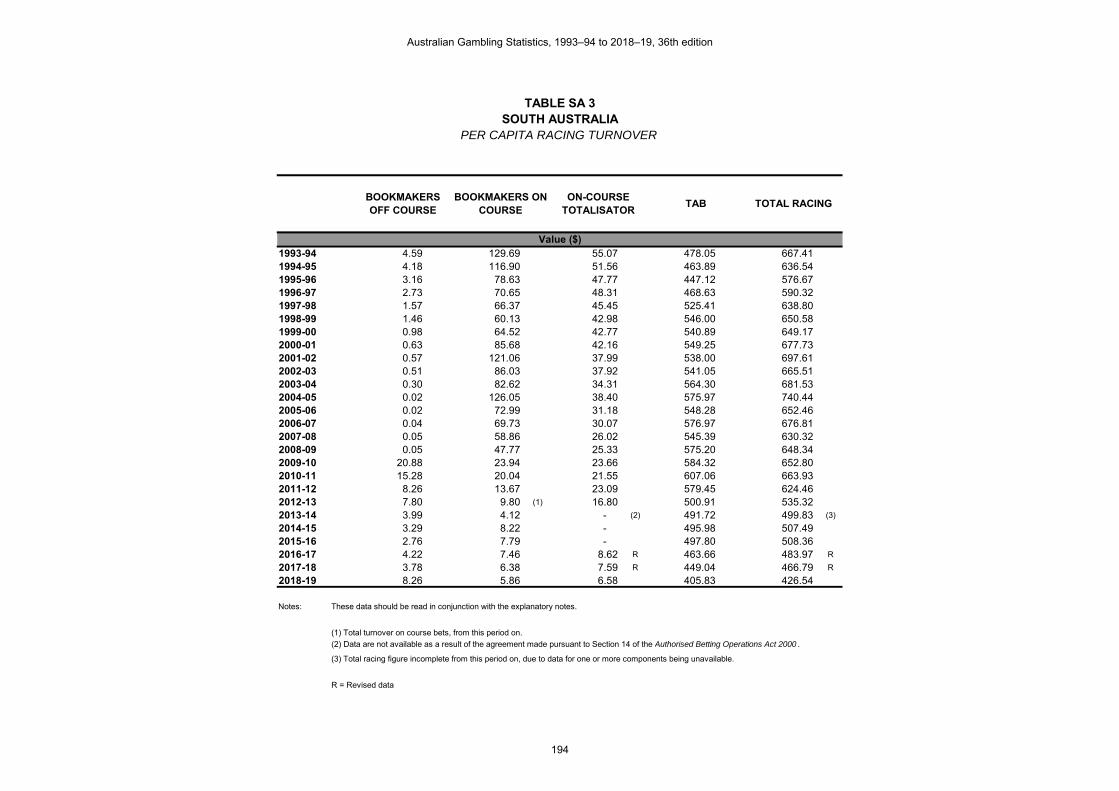
TABLE SA 3SOUTH AUSTRALIA
PER CAPITA RACING TURNOVER
1993-94 4.59 129.69 55.07 478.05 667.411994-95 4.18 116.90 51.56 463.89 636.541995-96 3.16 78.63 47.77 447.12 576.671996-97 2.73 70.65 48.31 468.63 590.321997-98 1.57 66.37 45.45 525.41 638.801998-99 1.46 60.13 42.98 546.00 650.581999-00 0.98 64.52 42.77 540.89 649.172000-01 0.63 85.68 42.16 549.25 677.732001-02 0.57 121.06 37.99 538.00 697.612002-03 0.51 86.03 37.92 541.05 665.512003-04 0.30 82.62 34.31 564.30 681.532004-05 0.02 126.05 38.40 575.97 740.442005-06 0.02 72.99 31.18 548.28 652.462006-07 0.04 69.73 30.07 576.97 676.812007-08 0.05 58.86 26.02 545.39 630.322008-09 0.05 47.77 25.33 575.20 648.342009-10 20.88 23.94 23.66 584.32 652.802010-11 15.28 20.04 21.55 607.06 663.932011-12 8.26 13.67 23.09 579.45 624.462012-13 7.80 9.80 (1) 16.80 500.91 535.322013-14 3.99 4.12 - (2) 491.72 499.83 (3)
2014-15 3.29 8.22 - 495.98 507.492015-16 2.76 7.79 - 497.80 508.362016-17 4.22 7.46 8.62 R 463.66 483.97 R
2017-18 3.78 6.38 7.59 R 449.04 466.79 R
2018-19 8.26 5.86 6.58 405.83 426.54
Notes: These data should be read in conjunction with the explanatory notes.
(1) Total turnover on course bets, from this period on.
(2) Data are not available as a result of the agreement made pursuant to Section 14 of the Authorised Betting Operations Act 2000 .
(3) Total racing figure incomplete from this period on, due to data for one or more components being unavailable.
R = Revised data
TOTAL RACING
Value ($)
BOOKMAKERS OFF COURSE
BOOKMAKERS ON COURSE
ON-COURSE TOTALISATOR
TAB
Australian Gambling Statistics, 1993–94 to 2018–19, 36th edition
194

TABLE SA 4SOUTH AUSTRALIA
REAL PER CAPITA RACING TURNOVER
1993-94 8.53 241.01 102.34 888.37 1,240.251994-95 7.53 210.38 92.80 834.86 1,145.571995-96 5.45 135.73 82.45 771.80 995.431996-97 4.65 120.32 82.28 798.07 1,005.311997-98 2.68 113.03 77.40 894.76 1,087.861998-99 2.46 101.20 72.33 918.86 1,094.851999-00 1.62 106.08 70.32 889.27 1,067.292000-01 0.98 132.83 65.36 851.49 1,050.672001-02 0.86 182.46 57.25 810.91 1,051.492002-03 0.75 125.85 55.47 791.46 973.532003-04 0.42 117.99 48.99 805.84 973.252004-05 0.02 175.82 53.57 803.41 1,032.822005-06 0.02 98.67 42.15 741.22 882.062006-07 0.05 91.56 39.48 757.56 888.652007-08 0.06 74.79 33.07 692.98 800.892008-09 0.06 58.86 31.21 708.75 798.872009-10 25.13 28.82 28.47 703.28 785.702010-11 17.84 23.40 25.17 708.96 775.372011-12 9.42 15.60 26.34 661.15 712.512012-13 8.70 10.93 (1) 18.74 558.69 597.072013-14 4.34 4.48 - (2) 534.33 543.15 (3)
2014-15 3.51 8.78 - 529.88 542.172015-16 2.91 8.21 - 524.46 535.582016-17 4.37 7.73 8.93 R 480.07 501.10 R
2017-18 3.84 6.48 7.71 R 456.24 474.27 R
2018-19 8.26 5.86 6.58 405.83 426.54
Notes: These data should be read in conjunction with the explanatory notes.
(1) Total turnover on course bets, from this period on.
(2) Data are not available as a result of the agreement made pursuant to Section 14 of the Authorised Betting Operations Act 2000 .
(3) Total racing figure incomplete from this period on, due to data for one or more components being unavailable.
R = Revised data
TOTAL RACING
Value ($)
BOOKMAKERS OFF COURSE
BOOKMAKERS ON COURSE
ON-COURSE TOTALISATOR
TAB
Australian Gambling Statistics, 1993–94 to 2018–19, 36th edition
195

TABLE SA 5SOUTH AUSTRALIA
TOTAL RACING EXPENDITURE
1993-94 0.396 5.960 9.459 82.115 97.9301994-95 0.273 7.117 8.860 79.710 95.9601995-96 0.279 4.073 8.297 77.350 89.9991996-97 0.239 4.314 8.435 81.514 94.5021997-98 0.150 3.737 7.989 91.655 103.5311998-99 0.151 3.947 6.210 96.429 106.7371999-00 0.090 3.701 6.215 96.549 106.5552000-01 0.070 7.235 6.266 96.452 110.0232001-02 0.065 3.828 - U 95.200 (1) 99.093 (2)
2002-03 0.073 2.047 - U 99.853 101.9732003-04 0.035 2.323 - U 104.620 106.9782004-05 0.005 3.542 - U 110.804 114.3512005-06 0.004 1.903 - U 104.035 105.9422006-07 0.021 1.401 - U 110.232 111.6542007-08 0.018 1.353 - U 95.669 97.0402008-09 0.025 1.791 - U 113.820 115.6362009-10 0.880 1.064 - U 133.428 135.3722010-11 0.167 0.878 - U 126.856 127.9012011-12 0.308 1.078 - U 128.581 129.9672012-13 0.543 (3) 0.706 (4) - U 98.400 99.6492013-14 0.046 -0.024 - U 113.101 113.1232014-15 0.383 0.958 - U 111.011 112.3522015-16 0.258 0.728 - U 109.527 110.5132016-17 0.172 R 0.285 R 1.979 R 106.867 109.303 R
2017-18 0.246 R 0.415 R 1.771 R 104.410 106.842 R
2018-19 0.939 0.390 1.544 99.028 101.901
Notes: These data should be read in conjunction with the explanatory notes.
(1) Calculated by applying the same ratio of expenditure to turnover in 2000-01 (15.3%) to the figure for 2001-02.
(2) Total racing figure incomplete from this period on, due to data for one or more components being unavailable.
(3) Profit from phone bets is estimated based on the proportion of bets taken (turnover) between on and off course.
Profit data are collected as a whole and not split into on and off course.
(4) Represents profit from all on-course bets, from this period on.
U = Unavailable data
R = Revised data
TOTAL RACING
Value ($ million)
BOOKMAKERS OFF COURSE
BOOKMAKERS ON COURSE
ON-COURSE TOTALISATOR
TAB
Australian Gambling Statistics, 1993–94 to 2018–19, 36th edition
196

TABLE SA 6SOUTH AUSTRALIA
REAL RACING EXPENDITURE
1993-94 0.735 11.076 17.579 152.595 181.9851994-95 0.491 12.808 15.945 143.453 172.6981995-96 0.482 7.031 14.322 133.519 155.3541996-97 0.407 7.347 14.365 138.817 160.9351997-98 0.255 6.364 13.605 156.087 176.3121998-99 0.254 6.642 10.451 162.279 179.6271999-00 0.148 6.085 10.218 158.735 175.1862000-01 0.109 11.216 9.714 149.527 170.5662001-02 0.098 5.770 - U 143.492 (1) 149.359 (2)
2002-03 0.107 2.994 - U 146.067 149.1682003-04 0.050 3.317 - U 149.401 152.7682004-05 0.007 4.941 - U 154.557 159.5042005-06 0.005 2.573 - U 140.644 143.2232006-07 0.028 1.840 - U 144.735 146.6022007-08 0.023 1.719 - U 121.557 123.2992008-09 0.031 2.207 - U 140.247 142.4852009-10 1.059 1.281 - U 160.592 162.9322010-11 0.195 1.025 - U 148.150 149.3712011-12 0.351 1.230 - U 146.711 148.2922012-13 0.606 (3) 0.787 (4) - U 109.750 111.1432013-14 0.050 -0.026 - U 122.903 122.9272014-15 0.409 1.023 - U 118.599 120.0312015-16 0.272 0.767 - U 115.393 116.4322016-17 0.178 R 0.295 R 2.049 R 110.649 113.172 R
2017-18 0.250 R 0.422 R 1.799 R 106.083 108.554 R
2018-19 0.939 0.390 1.544 99.028 101.901
Notes: These data should be read in conjunction with the explanatory notes.
(1) Calculated by applying the same ratio of expenditure to turnover in 2000-01 (15.3%) to the figure for 2001-02.
(2) Total racing figure incomplete from this period on, due to data for one or more components being unavailable.
(3) Profit from phone bets is estimated based on the proportion of bets taken (turnover) between on and off course.
Profit data are collected as a whole and not split into on and off course.
(4) Represents profit from all on-course bets, from this period on.
U = Unavailable data
R = Revised data
TOTAL RACING
Value ($ million)
BOOKMAKERS OFF COURSE
BOOKMAKERS ON COURSE
ON-COURSE TOTALISATOR
TAB
Australian Gambling Statistics, 1993–94 to 2018–19, 36th edition
197

TABLE SA 7SOUTH AUSTRALIA
PER CAPITA RACING EXPENDITURE
1993-94 0.36 5.41 8.58 74.51 88.861994-95 0.25 6.43 8.01 72.04 86.731995-96 0.25 3.67 7.47 69.67 81.071996-97 0.21 3.87 7.56 73.05 84.691997-98 0.13 3.33 7.11 81.58 92.151998-99 0.13 3.49 5.49 85.22 94.331999-00 0.08 3.25 5.45 84.73 93.512000-01 0.06 6.31 5.46 84.06 95.882001-02 0.06 3.31 - U 82.34 (1) 85.70 (2)
2002-03 0.06 1.76 - U 85.61 87.432003-04 0.03 1.97 - U 88.93 90.932004-05 0.00 2.98 - U 93.33 96.322005-06 0.00 1.59 - U 86.72 88.312006-07 0.02 1.15 - U 90.78 91.952007-08 0.01 1.10 - U 77.74 78.862008-09 0.02 1.43 - U 91.19 92.652009-10 0.70 0.84 - U 105.40 106.932010-11 0.13 0.69 - U 99.06 99.882011-12 0.24 0.83 - U 99.40 100.472012-13 0.42 (3) 0.54 (4) - U 75.29 76.242013-14 0.03 -0.02 - U 85.70 85.712014-15 0.29 0.72 - U 83.34 84.352015-16 0.19 0.54 - U 81.59 82.322016-17 0.13 R 0.21 R 1.46 R 79.02 80.82 R
2017-18 0.18 R 0.30 R 1.30 R 76.56 78.35 R
2018-19 0.68 0.28 1.12 71.94 74.03
Notes: These data should be read in conjunction with the explanatory notes.
(1) Calculated by applying the same ratio of expenditure to turnover in 2000-01 (15.3%) to the figure for 2001-02.
(2) Total racing figure incomplete from this period on, due to data for one or more components being unavailable.
(3) Profit from phone bets is estimated based on the proportion of bets taken (turnover) between on and off course.
Profit data are collected as a whole and not split into on and off course.
(4) Represents profit from all on-course bets, from this period on.
U = Unavailable data
R = Revised data
TOTAL RACING
Value ($)
BOOKMAKERS OFF COURSE
BOOKMAKERS ON COURSE
ON-COURSE TOTALISATOR
TAB
Australian Gambling Statistics, 1993–94 to 2018–19, 36th edition
198

TABLE SA 8SOUTH AUSTRALIA
REAL PER CAPITA RACING EXPENDITURE
1993-94 0.67 10.05 15.95 138.46 165.131994-95 0.44 11.58 14.41 129.65 156.081995-96 0.43 6.33 12.90 120.27 139.931996-97 0.36 6.58 12.87 124.40 144.221997-98 0.23 5.66 12.11 138.93 156.931998-99 0.22 5.87 9.24 143.41 158.741999-00 0.13 5.34 8.97 139.30 153.732000-01 0.09 9.77 8.47 130.31 148.642001-02 0.08 4.99 - 124.10 129.182002-03 0.09 2.57 - U 125.24 (1) 127.90 (2)
2003-04 0.04 2.82 - U 126.99 129.852004-05 0.01 4.16 - U 130.19 134.362005-06 0.00 2.14 - U 117.24 119.392006-07 0.02 1.51 - U 119.19 120.732007-08 0.02 1.40 - U 98.78 100.202008-09 0.02 1.77 - U 112.37 114.162009-10 0.84 1.01 - U 126.85 128.702010-11 0.15 0.80 - U 115.69 116.652011-12 0.27 0.95 - U 113.41 114.642012-13 0.46 (3) 0.60 (4) - U 83.97 85.042013-14 0.04 -0.02 - U 93.12 93.142014-15 0.31 0.77 - U 89.04 90.122015-16 0.20 0.57 - U 85.96 86.732016-17 0.13 R 0.22 R 1.52 R 81.82 83.68 R
2017-18 0.18 R 0.31 R 1.32 R 77.79 79.60 R
2018-19 0.68 0.28 1.12 71.94 74.03
Notes: These data should be read in conjunction with the explanatory notes.
(1) Calculated by applying the same ratio of expenditure to turnover in 2000-01 (15.3%) to the figure for 2001-02.
(2) Total racing figure incomplete from this period on, due to data for one or more components being unavailable.
(3) Profit from phone bets is estimated based on the proportion of bets taken (turnover) between on and off course.
Profit data are collected as a whole and not split into on and off course.
(4) Represents profit from all on-course bets, from this period on.
U = Unavailable data
R = Revised data
TOTAL RACING
Value ($)
BOOKMAKERS OFF COURSE
BOOKMAKERS ON COURSE
ON-COURSE TOTALISATOR
TAB
Australian Gambling Statistics, 1993–94 to 2018–19, 36th edition
199

TABLE SA 9SOUTH AUSTRALIA
RACING EXPENDITUREAS A % OF HDI
1993-94 0.002 0.024 0.039 0.335 0.3991994-95 0.001 0.028 0.035 0.314 0.3791995-96 0.001 0.015 0.031 0.288 0.3361996-97 0.001 0.016 0.031 0.295 0.3421997-98 0.001 0.013 0.028 0.318 0.3601998-99 0.001 0.014 0.022 0.335 0.3701999-00 0.000 0.012 0.020 0.317 0.3502000-01 0.000 0.022 0.019 0.290 0.3312001-02 0.000 0.010 - 0.259 0.2692002-03 0.000 0.005 - U 0.265 (1) 0.271 (2)
2003-04 0.000 0.006 - U 0.258 0.2642004-05 0.000 0.008 - U 0.261 0.2692005-06 0.000 0.004 - U 0.236 0.2402006-07 0.000 0.003 - U 0.229 0.2322007-08 0.000 0.003 - U 0.182 0.1842008-09 0.000 0.003 - U 0.193 0.1962009-10 0.001 0.002 - U 0.219 0.2222010-11 0.000 0.001 - U 0.195 0.1972011-12 0.000 0.002 - U 0.193 0.1952012-13 0.001 (3) 0.001 (4) - U 0.145 0.1472013-14 0.000 -0.000 - U 0.163 0.1632014-15 0.001 0.001 - U 0.146 0.1482015-16 0.000 0.001 - U 0.139 0.1402016-17 0.000 R 0.000 R 0.002 R 0.132 0.135 R
2017-18 0.000 R 0.000 R 0.002 R 0.125 0.128 R
2018-19 0.001 0.000 0.002 0.117 0.120
Notes: These data should be read in conjunction with the explanatory notes.
(1) Calculated by applying the same ratio of expenditure to turnover in 2000-01 (15.3%) to the figure for 2001-02.
(2) Total racing figure incomplete from this period on, due to data for one or more components being unavailable.
(3) Profit from phone bets is estimated based on the proportion of bets taken (turnover) between on and off course.
Profit data are collected as a whole and not split into on and off course.
(4) Represents profit from all on-course bets, from this period on.
U = Unavailable data
R = Revised data
Percentage (%)
BOOKMAKERS OFF COURSE
BOOKMAKERS ON COURSE
ON-COURSE TOTALISATOR
TAB TOTAL RACING
Australian Gambling Statistics, 1993–94 to 2018–19, 36th edition
200

TABLE SA 10SOUTH AUSTRALIA
RACING EXPENDITURESHARE OF MARKET
1993-94 0.40 6.09 9.66 83.851994-95 0.28 7.42 9.23 83.071995-96 0.31 4.53 9.22 85.951996-97 0.25 4.56 8.93 86.261997-98 0.14 3.61 7.72 88.531998-99 0.14 3.70 5.82 90.341999-00 0.08 3.47 5.83 90.612000-01 0.06 6.58 5.70 87.672001-02 0.07 3.86 - U 96.072002-03 0.07 2.01 - U 97.92 (1)
2003-04 0.03 2.17 - U 97.802004-05 0.00 3.10 - U 96.902005-06 0.00 1.80 - U 98.202006-07 0.02 1.25 - U 98.732007-08 0.02 1.39 - U 98.592008-09 0.02 1.55 - U 98.432009-10 0.65 0.79 - U 98.562010-11 0.13 0.69 - U 99.182011-12 0.24 0.83 - U 98.932012-13 0.54 (2) 0.71 (3) - U 98.752013-14 0.04 -0.02 - U 99.982014-15 0.34 0.85 - U 98.812015-16 0.23 0.66 - U 99.112016-17 0.16 R 0.26 R 1.81 R 97.772017-18 0.23 R 0.39 R 1.66 R 97.722018-19 0.92 0.38 1.51 97.18
Notes: These data should be read in conjunction with the explanatory notes.
(1) Calculated by applying the same ratio of expenditure to turnover in 2000-01 (15.3%) to the figure for 2001-02.
(2) Profit from phone bets is estimated based on the proportion of bets taken (turnover) between on and off course.
Profit data are collected as a whole and not split into on and off course.
(3) Represents profit from all on-course bets, from this period on.
U = Unavailable data
R = Revised data
ON-COURSE TOTALISATOR
TAB
Percentage (%)
BOOKMAKERS OFF COURSE
BOOKMAKERS ON COURSE
Australian Gambling Statistics, 1993–94 to 2018–19, 36th edition
201

TABLE SA 11SOUTH AUSTRALIA
GOVERNMENT REVENUE FROM RACING
1993-94 1.567 1.870 23.546 26.9831994-95 1.192 1.795 20.361 23.3481995-96 0.538 1.646 20.012 22.1961996-97 0.471 1.673 20.530 22.6741997-98 0.416 1.310 22.488 24.2141998-99 0.334 1.220 22.117 23.6711999-00 0.366 1.222 22.204 23.7922000-01 0.502 1.304 13.920 15.7262001-02 0.295 (1) - U - U 0.295 (2)
2002-03 - 1.210 5.971 7.1812003-04 - 1.060 6.277 7.3372004-05 - 1.203 6.648 7.8512005-06 - - (3) 6.606 6.6062006-07 - - 7.251 7.2512007-08 - - 6.870 6.8702008-09 - - 7.512 7.5122009-10 - - 6.641 6.6412010-11 - - 1.522 1.5222011-12 - - 0.771 0.7712012-13 - - 0.890 0.8902013-14 - - - (4) - (5)
2014-15 - - - -2015-16 - - - -2016-17 - - - -2017-18 14.800 (6) - 16.245 (7) 31.0452018-19 17.027 (8) - 16.954 33.981
Notes: These data should be read in conjunction with the explanatory notes.
Data for the gambling revenue received by states and territories from 1 July 2000 onwards are not comparable
with that of preceding years because of the impact of changes brought about by the introduction of the GST.
(1) Bookmakers' tax abolished from 1 December 2001.
(2) Total racing figure incomplete due to data for one or more components being unavailable.
(3) On-course totalisator tax abolished from 1 July 2006.
(4) Duty on TAB racing abolished 1 July 2013.
(5) All taxes for racing in SA were abolished.
(6) Point of consumption tax (POCT) commenced 1 July 2017. This amount represents 11 months of 2017-18,
as taxation payments are made in arrears. Includes interstate bookmakers and interstate TABs. Includes
revenue from racing and sportsbetting.
(7) POCT commenced 1 July 2017. This amount represents 11 months of 2017-18,
as taxation payments are made in arrears. Revenue from SA TAB only, not interstate TABs.
(8) Includes revenue from racing and sportsbetting.
U = Unavailable data
Value ($ million)
BOOKMAKERSON-COURSE
TOTALISATORTAB TOTAL RACING
Australian Gambling Statistics, 1993–94 to 2018–19, 36th edition
202

TABLE SA 12SOUTH AUSTRALIA
REAL GOVERNMENT REVENUE FROM RACING
1993-94 2.912 3.475 43.756 50.1431994-95 2.145 3.230 36.643 42.0191995-96 0.929 2.841 34.544 38.3141996-97 0.802 2.849 34.962 38.6131997-98 0.708 2.231 38.297 41.2361998-99 0.562 2.053 37.220 39.8361999-00 0.602 2.009 36.505 39.1162000-01 0.778 2.022 21.580 24.3802001-02 0.445 (1) - U - U 0.445 (2)
2002-03 - 1.770 8.735 10.5052003-04 - 1.514 8.964 10.4772004-05 - 1.678 9.273 10.9512005-06 - - (3) 8.931 8.9312006-07 - - 9.521 9.5212007-08 - - 8.729 8.7292008-09 - - 9.256 9.2562009-10 - - 7.993 7.9932010-11 - - 1.777 1.7772011-12 - - 0.880 0.8802012-13 - - 0.993 0.9932013-14 - - - (4) - (5)
2014-15 - - - -2015-16 - - - -2016-17 - - - -2017-18 15.037 (6) - 16.505 (7) 31.5432018-19 17.027 (8) - 16.954 33.981
Notes: These data should be read in conjunction with the explanatory notes.
Data for the gambling revenue received by states and territories from 1 July 2000 onwards are not comparable
with that of preceding years because of the impact of changes brought about by the introduction of the GST.
(1) Bookmakers' tax abolished from 1 December 2001.
(2) Total racing figure incomplete due to data for one or more components being unavailable.
(3) On-course totalisator tax abolished from 1 July 2006.
(4) Duty on TAB racing abolished 1 July 2013.
(5) All taxes for racing in SA were abolished.
(6) Point of consumption tax (POCT) commenced 1 July 2017. This amount represents 11 months of 2017-18,
as taxation payments are made in arrears. Includes interstate bookmakers and interstate TABs. Includes
revenue from racing and sportsbetting.
(7) POCT commenced 1 July 2017. This amount represents 11 months of 2017-18,
as taxation payments are made in arrears. Revenue from SA TAB only, not interstate TABs.
(8) Includes revenue from racing and sportsbetting.
U = Unavailable data
Value ($ million)
BOOKMAKERSON-COURSE
TOTALISATORTAB TOTAL RACING
Australian Gambling Statistics, 1993–94 to 2018–19, 36th edition
203
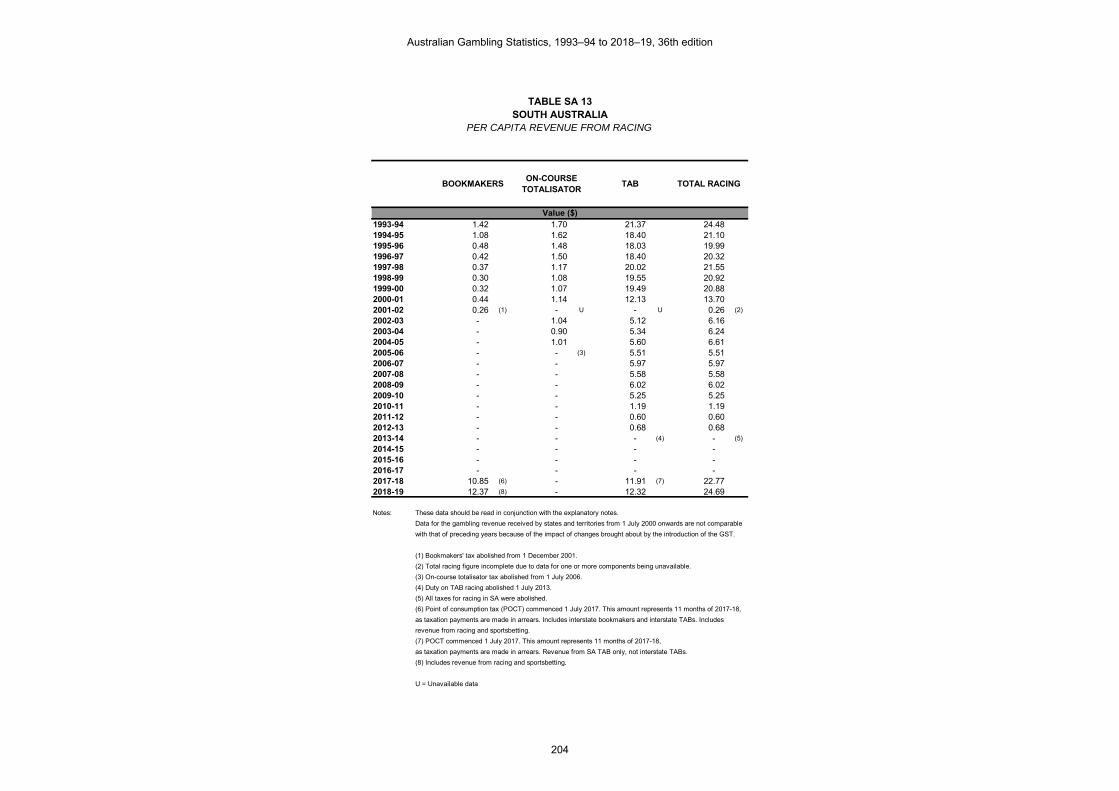
TABLE SA 13SOUTH AUSTRALIA
PER CAPITA REVENUE FROM RACING
1993-94 1.42 1.70 21.37 24.481994-95 1.08 1.62 18.40 21.101995-96 0.48 1.48 18.03 19.991996-97 0.42 1.50 18.40 20.321997-98 0.37 1.17 20.02 21.551998-99 0.30 1.08 19.55 20.921999-00 0.32 1.07 19.49 20.882000-01 0.44 1.14 12.13 13.702001-02 0.26 (1) - U - U 0.26 (2)
2002-03 - 1.04 5.12 6.162003-04 - 0.90 5.34 6.242004-05 - 1.01 5.60 6.612005-06 - - (3) 5.51 5.512006-07 - - 5.97 5.972007-08 - - 5.58 5.582008-09 - - 6.02 6.022009-10 - - 5.25 5.252010-11 - - 1.19 1.192011-12 - - 0.60 0.602012-13 - - 0.68 0.682013-14 - - - (4) - (5)
2014-15 - - - -2015-16 - - - -2016-17 - - - -2017-18 10.85 (6) - 11.91 (7) 22.772018-19 12.37 (8) - 12.32 24.69
Notes: These data should be read in conjunction with the explanatory notes.
Data for the gambling revenue received by states and territories from 1 July 2000 onwards are not comparable
with that of preceding years because of the impact of changes brought about by the introduction of the GST.
(1) Bookmakers' tax abolished from 1 December 2001.
(2) Total racing figure incomplete due to data for one or more components being unavailable.
(3) On-course totalisator tax abolished from 1 July 2006.
(4) Duty on TAB racing abolished 1 July 2013.
(5) All taxes for racing in SA were abolished.
(6) Point of consumption tax (POCT) commenced 1 July 2017. This amount represents 11 months of 2017-18,
as taxation payments are made in arrears. Includes interstate bookmakers and interstate TABs. Includes
revenue from racing and sportsbetting.
(7) POCT commenced 1 July 2017. This amount represents 11 months of 2017-18,
as taxation payments are made in arrears. Revenue from SA TAB only, not interstate TABs.
(8) Includes revenue from racing and sportsbetting.
U = Unavailable data
Value ($)
BOOKMAKERSON-COURSE
TOTALISATORTAB TOTAL RACING
Australian Gambling Statistics, 1993–94 to 2018–19, 36th edition
204

TABLE SA 14SOUTH AUSTRALIA
REAL PER CAPITA REVENUE FROM RACING
1993-94 2.64 3.15 39.70 45.501994-95 1.94 2.92 33.12 37.981995-96 0.84 2.56 31.12 34.511996-97 0.72 2.55 31.33 34.601997-98 0.63 1.99 34.09 36.701998-99 0.50 1.81 32.89 35.201999-00 0.53 1.76 32.04 34.332000-01 0.68 1.76 18.81 21.252001-02 0.38 (1) - U - U 0.38 (2)
2002-03 - 1.52 7.49 9.012003-04 - 1.29 7.62 8.912004-05 - 1.41 7.81 9.222005-06 - - (3) 7.44 7.442006-07 - - 7.84 7.842007-08 - - 7.09 7.092008-09 - - 7.42 7.422009-10 - - 6.31 6.312010-11 - - 1.39 1.392011-12 - - 0.68 0.682012-13 - - 0.76 0.762013-14 - - - (4) - (5)
2014-15 - - - -2015-16 - - - -2016-17 - - - -2017-18 11.03 (6) - 12.10 (7) 23.132018-19 12.37 (8) - 12.32 24.69
Notes: These data should be read in conjunction with the explanatory notes.
Data for the gambling revenue received by states and territories from 1 July 2000 onwards are not comparable
with that of preceding years because of the impact of changes brought about by the introduction of the GST.
(1) Bookmakers' tax abolished from 1 December 2001.
(2) Total racing figure incomplete due to data for one or more components being unavailable.
(3) On-course totalisator tax abolished from 1 July 2006.
(4) Duty on TAB racing abolished 1 July 2013.
(5) All taxes for racing in SA were abolished.
(6) Point of consumption tax (POCT) commenced 1 July 2017. This amount represents 11 months of 2017-18,
as taxation payments are made in arrears. Includes interstate bookmakers and interstate TABs. Includes
revenue from racing and sportsbetting.
(7) POCT commenced 1 July 2017. This amount represents 11 months of 2017-18,
as taxation payments are made in arrears. Revenue from SA TAB only, not interstate TABs.
(8) Includes revenue from racing and sportsbetting.
U = Unavailable data
Value ($)
BOOKMAKERSON-COURSE
TOTALISATORTAB TOTAL RACING
Australian Gambling Statistics, 1993–94 to 2018–19, 36th edition
205

TABLE SA 15SOUTH AUSTRALIA
GOVERNMENT REVENUE FROM RACINGAS A % OF TOTAL GAMBLING REVENUE
1993-94 1.20 1.44 18.08 20.721994-95 0.66 0.99 11.26 12.911995-96 0.24 0.73 8.90 9.871996-97 0.19 0.67 8.27 9.141997-98 0.15 0.46 7.94 8.551998-99 0.11 0.39 6.99 7.481999-00 0.11 0.36 6.51 6.982000-01 0.17 0.44 4.66 5.272001-02 0.10 (1) - U - U 0.10 (2)
2002-03 - 0.34 1.70 2.042003-04 - 0.27 1.60 1.872004-05 - 0.30 1.63 1.932005-06 - - (3) 1.62 1.622006-07 - - 1.69 1.692007-08 - - 1.66 1.662008-09 - - 1.80 1.802009-10 - - 1.63 1.632010-11 - - 0.37 0.372011-12 - - 0.18 0.182012-13 - - 0.21 0.212013-14 - - - (4) - (5)
2014-15 - - - -2015-16 - - - -2016-17 - - - -2017-18 3.76 (6) - 4.13 (7) 7.892018-19 4.16 (8) - 4.14 8.29
Notes: These data should be read in conjunction with the explanatory notes.
Data for the gambling revenue received by states and territories from 1 July 2000 onwards are not comparable
with that of preceding years because of the impact of changes brought about by the introduction of the GST.
(1) Bookmakers' tax abolished from 1 December 2001.
(2) Total racing figure incomplete due to data for one or more components being unavailable.
(3) On-course totalisator tax abolished from 1 July 2006.
(4) Duty on TAB racing abolished 1 July 2013.
(5) All taxes for racing in SA were abolished.
(6) Point of consumption tax (POCT) commenced 1 July 2017. This amount represents 11 months of 2017-18,
as taxation payments are made in arrears. Includes interstate bookmakers and interstate TABs. Includes
revenue from racing and sportsbetting.
(7) POCT commenced 1 July 2017. This amount represents 11 months of 2017-18,
as taxation payments are made in arrears. Revenue from SA TAB only, not interstate TABs.
(8) Includes revenue from racing and sportsbetting.
U = Unavailable data
ON-COURSE TOTALISATOR
TAB TOTAL RACING
Percentage (%)
BOOKMAKERS
Australian Gambling Statistics, 1993–94 to 2018–19, 36th edition
206

TABLE SA 16SOUTH AUSTRALIA
TOTAL GAMING TURNOVER
1993-94 457.433 - 38.374 - 76.621 - 169.627 100.983 2.255 845.2931994-95 319.687 1,489.947 29.697 - 70.425 - 167.908 47.070 0.817 2,125.5511995-96 344.235 2,621.657 26.298 - 70.431 - 172.908 43.918 0.787 3,280.2341996-97 265.600 3,023.746 25.359 - 71.961 - 166.759 49.000 0.570 3,602.9951997-98 282.396 3,291.676 25.833 - 71.818 - 180.407 57.300 0.566 3,909.9961998-99 296.865 3,723.706 28.860 - 69.308 - 188.684 57.489 0.609 4,365.5211999-00 305.449 4,123.067 30.866 - 68.620 - 194.925 35.951 0.607 4,759.4852000-01 339.380 4,644.183 37.099 - 61.689 - 210.089 14.124 0.716 5,307.2802001-02 377.132 5,225.052 37.920 - 64.838 - 210.493 19.371 (1) 0.605 5,935.4112002-03 396.716 5,852.719 39.864 - 67.155 - 228.150 15.454 0.742 6,600.8002003-04 476.620 6,501.871 39.812 - 70.425 - 234.237 17.984 0.622 7,341.5712004-05 441.800 6,994.895 40.343 - 73.821 - 234.068 24.200 0.585 7,809.7122005-06 479.324 7,338.956 38.383 - 76.581 - 232.566 23.026 0.558 8,189.3942006-07 528.460 8,009.339 37.139 - 78.523 - 233.066 26.497 0.518 8,913.5422007-08 485.541 7,814.242 39.929 - 79.506 - 246.567 19.058 0.581 8,685.4242008-09 532.037 7,900.106 38.886 - 90.753 - 263.372 - (2) 0.694 8,825.8482009-10 535.194 7,747.294 40.189 - 92.566 - 257.284 - 0.665 8,673.1922010-11 511.609 7,988.753 39.113 (3) - 95.866 - 253.330 - 0.631 8,889.3022011-12 533.699 7,996.290 40.737 - 99.407 - 282.794 - 0.694 8,953.6212012-13 537.642 7,901.741 38.506 - 104.922 - 318.025 - 0.692 8,901.5282013-14 299.913 (4) 7,995.860 35.667 - 103.336 - 289.261 - 0.595 8,724.632 (5)
2014-15 - (6) 8,055.708 32.382 - 109.183 - 299.586 - 0.507 8,497.3662015-16 - 8,000.393 32.416 - 112.907 - 318.094 - 0.500 8,464.3102016-17 - 7,595.027 33.129 - 108.545 - 293.554 - 0.645 8,030.9002017-18 - 7,576.140 33.305 - 118.790 - 305.799 - 0.719 8,034.7532018-19 - 7,651.148 32.001 - 120.648 - 385.983 - - (7) 8,189.780
Notes: These data should be read in conjunction with the explanatory notes.
(1) Turnover and expenditure figures do not include bingo and instant tickets as these data are no longer collected.
(2) From 1 Sept 2008, a licence is no longer required for lotteries where the total prize value does not exceed $5,000.
(3) Data provided are for gross sales, i.e. include agent commission, from this period on.
(4) July - December 2013.
(5) Total gaming figure incomplete from this period on, due to data for one or more components being unavailable.
(6) Turnover data no longer provided to SA Government.
(7) Pools was withdrawn from the Australian Lottery Market on 23 June 2018.
NA = Not applicable
KENO
Value ($ million)
CASINOGAMING
MACHINESINSTANT LOTTERY
INTERACTIVE GAMING (NA)
LOTTERIES(NA)
LOTTO MINOR GAMING POOLS TOTAL GAMING
Australian Gambling Statistics, 1993–94 to 2018–19, 36th edition
207

TABLE SA 17SOUTH AUSTRALIA
REAL GAMING TURNOVER
1993-94 850.051 - 71.311 - 142.385 - 315.219 187.657 4.190 1,570.8131994-95 575.336 2,681.435 53.445 - 126.743 - 302.181 84.711 1.470 3,825.3211995-96 594.209 4,525.432 45.395 - 121.576 - 298.469 75.810 1.358 5,662.2501996-97 452.313 5,149.394 43.186 - 122.549 - 283.988 83.446 0.971 6,135.8471997-98 480.916 5,605.675 43.993 - 122.305 - 307.230 97.581 0.964 6,658.6651998-99 499.591 6,266.591 48.568 - 116.638 - 317.535 96.748 1.025 7,346.6951999-00 502.186 6,778.702 50.747 - 112.818 - 320.475 59.107 0.998 7,825.0322000-01 526.131 7,199.746 57.514 - 95.635 - 325.695 21.896 1.110 8,227.7262001-02 568.438 7,875.541 57.156 - 97.728 - 317.269 29.197 (1) 0.912 8,946.2402002-03 580.324 8,561.477 58.314 - 98.236 - 333.743 22.606 1.085 9,655.7862003-04 680.630 9,284.900 56.853 - 100.569 - 334.499 25.682 0.888 10,484.0202004-05 616.252 9,756.938 56.273 - 102.970 - 326.493 33.756 0.816 10,893.4982005-06 647.996 9,921.503 51.890 - 103.530 - 314.405 31.129 0.754 11,071.2072006-07 693.870 10,516.290 48.764 - 103.101 - 306.016 34.791 0.680 11,703.5112007-08 616.929 9,928.786 50.734 - 101.020 - 313.288 24.215 0.738 11,035.7112008-09 655.566 9,734.364 47.915 - 111.824 - 324.522 - (2) 0.855 10,875.0462009-10 644.152 9,324.538 48.371 - 111.411 - 309.664 - 0.800 10,438.9372010-11 597.488 9,329.751 45.679 (3) - 111.958 - 295.854 - 0.737 10,381.4672011-12 608.951 9,123.767 46.481 - 113.423 - 322.668 - 0.792 10,216.0822012-13 599.657 8,813.183 42.948 - 117.024 - 354.708 - 0.772 9,928.2932013-14 325.905 (4) 8,688.835 38.758 - 112.292 - 314.330 - 0.647 9,480.767 (5)
2014-15 - (6) 8,606.332 34.595 - 116.646 - 320.063 - 0.542 9,078.1782015-16 - 8,428.854 34.152 - 118.954 - 335.130 - 0.527 8,917.6162016-17 - 7,863.817 34.301 - 112.386 - 303.943 - 0.668 8,315.1152017-18 - 7,697.574 33.839 - 120.694 - 310.700 - 0.731 8,163.5382018-19 - 7,651.148 32.001 - 120.648 - 385.983 - - (7) 8,189.780
Notes: These data should be read in conjunction with the explanatory notes.
(1) Turnover and expenditure figures do not include bingo and instant tickets as these data are no longer collected.
(2) From 1 Sept 2008, a licence is no longer required for lotteries where the total prize value does not exceed $5,000.
(3) Data provided are for gross sales, i.e. include agent commission, from this period on.
(4) July - December 2013.
(5) Total gaming figure incomplete from this period on, due to data for one or more components being unavailable.
(6) Turnover data no longer provided to SA Government.
(7) Pools was withdrawn from the Australian Lottery Market on 23 June 2018.
NA = Not applicable
KENO
Value ($ million)
CASINOGAMING
MACHINESINSTANT LOTTERY
INTERACTIVE GAMING (NA)
LOTTERIES(NA)
LOTTO MINOR GAMING POOLS TOTAL GAMING
Australian Gambling Statistics, 1993–94 to 2018–19, 36th edition
208

TABLE SA 18SOUTH AUSTRALIA
PER CAPITA GAMING TURNOVER
1993-94 415.06 - 34.82 - 69.52 - 153.92 91.63 2.05 767.001994-95 288.93 1,346.58 26.84 - 63.65 - 151.75 42.54 0.74 1,921.021995-96 310.06 2,361.42 23.69 - 63.44 - 155.74 39.56 0.71 2,954.621996-97 238.02 2,709.77 22.73 - 64.49 - 149.44 43.91 0.51 3,228.871997-98 251.35 2,929.79 22.99 - 63.92 - 160.57 51.00 0.50 3,480.131998-99 262.35 3,290.82 25.50 - 61.25 - 166.75 50.81 0.54 3,858.021999-00 268.05 3,618.18 27.09 - 60.22 - 171.06 31.55 0.53 4,176.672000-01 295.76 4,047.32 32.33 - 53.76 - 183.09 12.31 0.62 4,625.192001-02 326.17 4,519.05 32.80 - 56.08 - 182.05 16.75 (1) 0.52 5,133.422002-03 340.14 5,018.06 34.18 - 57.58 - 195.61 13.25 0.64 5,659.462003-04 405.12 5,526.48 33.84 - 59.86 - 199.10 15.29 0.53 6,240.212004-05 372.14 5,892.06 33.98 - 62.18 - 197.16 20.38 0.49 6,578.412005-06 399.57 6,117.85 32.00 - 63.84 - 193.87 19.19 0.47 6,826.792006-07 435.20 6,595.93 30.59 - 64.67 - 191.94 21.82 0.43 7,340.572007-08 394.57 6,350.20 32.45 - 64.61 - 200.37 15.49 0.47 7,058.162008-09 426.27 6,329.63 31.16 - 72.71 - 211.02 - (2) 0.56 7,071.352009-10 422.76 6,119.74 31.75 - 73.12 - 203.23 - 0.53 6,851.132010-11 399.52 6,238.56 30.54 (3) - 74.86 - 197.83 - 0.49 6,941.822011-12 412.57 6,181.46 31.49 - 76.85 - 218.61 - 0.54 6,921.522012-13 411.36 6,045.82 29.46 - 80.28 - 243.33 - 0.53 6,810.792013-14 227.24 (4) 6,058.38 27.02 - 78.30 - 219.17 - 0.45 6,610.56 (5)
2014-15 - (6) 6,048.05 24.31 - 81.97 - 224.92 - 0.38 6,379.642015-16 - 5,959.55 24.15 - 84.11 - 236.95 - 0.37 6,305.132016-17 - 5,615.89 24.50 - 80.26 - 217.06 - 0.48 5,938.182017-18 - 5,555.64 24.42 - 87.11 - 224.24 - 0.53 5,891.942018-19 - 5,558.49 23.25 - 87.65 - 280.41 - - (7) 5,949.80
Notes: These data should be read in conjunction with the explanatory notes.
(1) Turnover and expenditure figures do not include bingo and instant tickets as these data are no longer collected.
(2) From 1 Sept 2008, a licence is no longer required for lotteries where the total prize value does not exceed $5,000.
(3) Data provided are for gross sales, i.e. include agent commission, from this period on.
(4) July - December 2013.
(5) Total gaming figure incomplete from this period on, due to data for one or more components being unavailable.
(6) Turnover data no longer provided to SA Government.
(7) Pools was withdrawn from the Australian Lottery Market on 23 June 2018.
NA = Not applicable
KENO
Value ($)
CASINOGAMING
MACHINESINSTANT LOTTERY
INTERACTIVE GAMING (NA)
LOTTERIES(NA)
LOTTO MINOR GAMING POOLS TOTAL GAMING
Australian Gambling Statistics, 1993–94 to 2018–19, 36th edition
209

TABLE SA 19SOUTH AUSTRALIA
REAL PER CAPITA GAMING TURNOVER
1993-94 771.32 - 64.71 - 129.20 - 286.02 170.28 3.80 1,425.321994-95 519.97 2,423.42 48.30 - 114.55 - 273.10 76.56 1.33 3,457.231995-96 535.23 4,076.22 40.89 - 109.51 - 268.84 68.28 1.22 5,100.191996-97 405.35 4,614.70 38.70 - 109.82 - 254.50 74.78 0.87 5,498.731997-98 428.04 4,989.39 39.16 - 108.86 - 273.45 86.85 0.86 5,926.621998-99 441.51 5,538.09 42.92 - 103.08 - 280.62 85.50 0.91 6,492.631999-00 440.69 5,948.63 44.53 - 99.00 - 281.23 51.87 0.88 6,866.832000-01 458.51 6,274.44 50.12 - 83.34 - 283.84 19.08 0.97 7,170.302001-02 491.63 6,811.40 49.43 - 84.52 - 274.40 25.25 (1) 0.79 7,737.432002-03 497.56 7,340.52 50.00 - 84.23 - 286.15 19.38 0.93 8,278.772003-04 578.52 7,892.01 48.32 - 85.48 - 284.32 21.83 0.75 8,911.242004-05 519.09 8,218.63 47.40 - 86.74 - 275.02 28.43 0.69 9,175.992005-06 540.18 8,270.70 43.26 - 86.30 - 262.09 25.95 0.63 9,229.112006-07 571.42 8,660.48 40.16 - 84.91 - 252.01 28.65 0.56 9,638.192007-08 501.34 8,068.58 41.23 - 82.09 - 254.59 19.68 0.60 8,968.112008-09 525.25 7,799.26 38.39 - 89.59 - 260.01 - (2) 0.69 8,713.182009-10 508.83 7,365.64 38.21 - 88.01 - 244.61 - 0.63 8,245.932010-11 466.59 7,285.77 35.67 (3) - 87.43 - 231.04 - 0.58 8,107.082011-12 470.74 7,053.05 35.93 - 87.68 - 249.44 - 0.61 7,897.452012-13 458.81 6,743.19 32.86 - 89.54 - 271.40 - 0.59 7,596.392013-14 246.94 (4) 6,583.44 29.37 - 85.08 - 238.16 - 0.49 7,183.48 (5)
2014-15 - (6) 6,461.45 25.97 - 87.58 - 240.30 - 0.41 6,815.702015-16 - 6,278.72 25.44 - 88.61 - 249.64 - 0.39 6,642.802016-17 - 5,814.63 25.36 - 83.10 - 224.74 - 0.49 6,148.332017-18 - 5,644.69 24.81 - 88.51 - 227.84 - 0.54 5,986.382018-19 - 5,558.49 23.25 - 87.65 - 280.41 - - (7) 5,949.80
Notes: These data should be read in conjunction with the explanatory notes.
(1) Turnover and expenditure figures do not include bingo and instant tickets as these data are no longer collected.
(2) From 1 Sept 2008, a licence is no longer required for lotteries where the total prize value does not exceed $5,000.
(3) Data provided are for gross sales, i.e. include agent commission, from this period on.
(4) July - December 2013.
(5) Total gaming figure incomplete from this period on, due to data for one or more components being unavailable.
(6) Turnover data no longer provided to SA Government.
(7) Pools was withdrawn from the Australian Lottery Market on 23 June 2018.
NA = Not applicable
KENO
Value ($)
CASINOGAMING
MACHINESINSTANT LOTTERY
INTERACTIVE GAMING (NA)
LOTTERIES(NA)
LOTTO MINOR GAMING POOLS TOTAL GAMING
Australian Gambling Statistics, 1993–94 to 2018–19, 36th edition
210
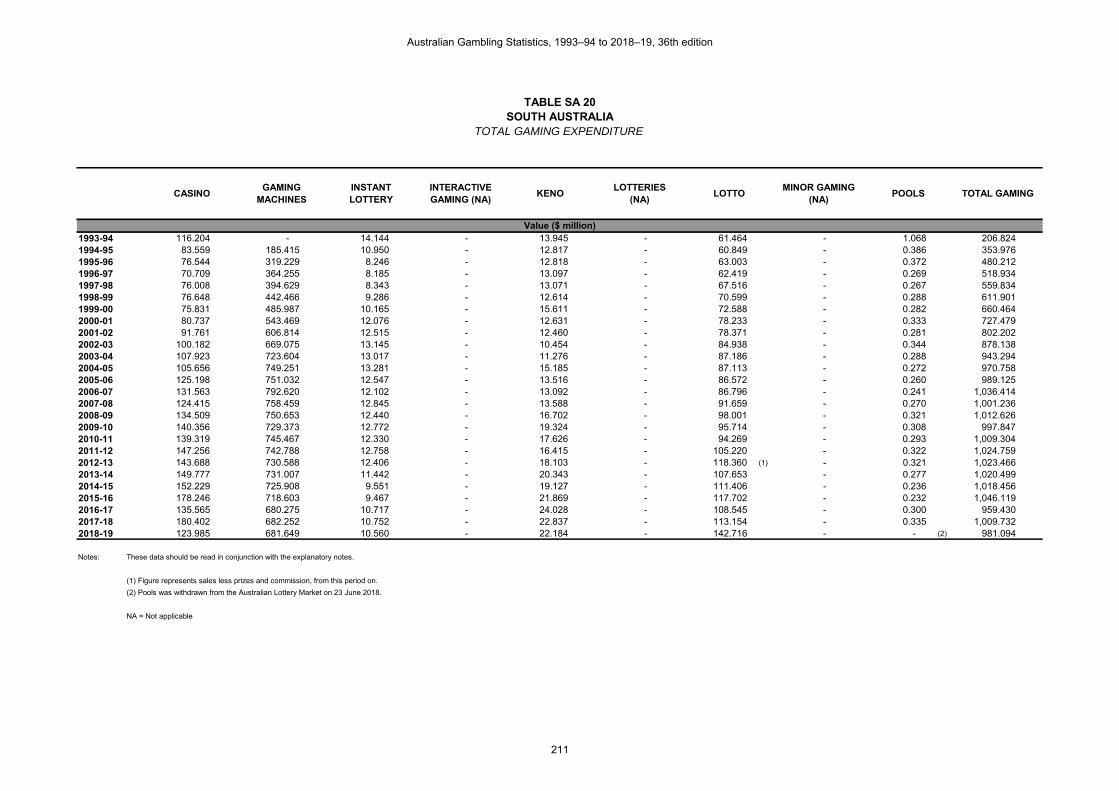
TABLE SA 20SOUTH AUSTRALIA
TOTAL GAMING EXPENDITURE
1993-94 116.204 - 14.144 - 13.945 - 61.464 - 1.068 206.8241994-95 83.559 185.415 10.950 - 12.817 - 60.849 - 0.386 353.9761995-96 76.544 319.229 8.246 - 12.818 - 63.003 - 0.372 480.2121996-97 70.709 364.255 8.185 - 13.097 - 62.419 - 0.269 518.9341997-98 76.008 394.629 8.343 - 13.071 - 67.516 - 0.267 559.8341998-99 76.648 442.466 9.286 - 12.614 - 70.599 - 0.288 611.9011999-00 75.831 485.987 10.165 - 15.611 - 72.588 - 0.282 660.4642000-01 80.737 543.469 12.076 - 12.631 - 78.233 - 0.333 727.4792001-02 91.761 606.814 12.515 - 12.460 - 78.371 - 0.281 802.2022002-03 100.182 669.075 13.145 - 10.454 - 84.938 - 0.344 878.1382003-04 107.923 723.604 13.017 - 11.276 - 87.186 - 0.288 943.2942004-05 105.656 749.251 13.281 - 15.185 - 87.113 - 0.272 970.7582005-06 125.198 751.032 12.547 - 13.516 - 86.572 - 0.260 989.1252006-07 131.563 792.620 12.102 - 13.092 - 86.796 - 0.241 1,036.4142007-08 124.415 758.459 12.845 - 13.588 - 91.659 - 0.270 1,001.2362008-09 134.509 750.653 12.440 - 16.702 - 98.001 - 0.321 1,012.6262009-10 140.356 729.373 12.772 - 19.324 - 95.714 - 0.308 997.8472010-11 139.319 745.467 12.330 - 17.626 - 94.269 - 0.293 1,009.3042011-12 147.256 742.788 12.758 - 16.415 - 105.220 - 0.322 1,024.7592012-13 143.688 730.588 12.406 - 18.103 - 118.360 (1) - 0.321 1,023.4662013-14 149.777 731.007 11.442 - 20.343 - 107.653 - 0.277 1,020.4992014-15 152.229 725.908 9.551 - 19.127 - 111.406 - 0.236 1,018.4562015-16 178.246 718.603 9.467 - 21.869 - 117.702 - 0.232 1,046.1192016-17 135.565 680.275 10.717 - 24.028 - 108.545 - 0.300 959.4302017-18 180.402 682.252 10.752 - 22.837 - 113.154 - 0.335 1,009.7322018-19 123.985 681.649 10.560 - 22.184 - 142.716 - - (2) 981.094
Notes: These data should be read in conjunction with the explanatory notes.
(1) Figure represents sales less prizes and commission, from this period on.
(2) Pools was withdrawn from the Australian Lottery Market on 23 June 2018.
NA = Not applicable
KENO
Value ($ million)
CASINOGAMING
MACHINESINSTANT LOTTERY
INTERACTIVE GAMING (NA)
LOTTERIES(NA)
LOTTOMINOR GAMING
(NA)POOLS TOTAL GAMING
Australian Gambling Statistics, 1993–94 to 2018–19, 36th edition
211

TABLE SA 21SOUTH AUSTRALIA
REAL GAMING EXPENDITURE
1993-94 215.943 - 26.283 - 25.914 - 114.220 - 1.984 384.3431994-95 150.380 333.689 19.707 - 23.067 - 109.509 - 0.694 637.0451995-96 132.128 551.044 14.234 - 22.126 - 108.754 - 0.642 828.9291996-97 120.416 620.321 13.939 - 22.304 - 106.299 - 0.458 883.7371997-98 129.440 672.047 14.208 - 22.260 - 114.979 - 0.455 953.3891998-99 128.990 744.622 15.627 - 21.228 - 118.810 - 0.485 1,029.7631999-00 124.673 799.007 16.712 - 25.666 - 119.341 - 0.464 1,085.8642000-01 125.164 842.525 18.721 - 19.581 - 121.282 - 0.516 1,127.7902001-02 138.308 914.630 18.863 - 18.781 - 118.126 - 0.424 1,209.1312002-03 146.548 978.737 19.229 - 15.292 - 124.249 - 0.503 1,284.5582003-04 154.118 1,033.332 18.589 - 16.103 - 124.505 - 0.411 1,347.0572004-05 147.376 1,045.104 18.525 - 21.181 - 121.511 - 0.379 1,354.0772005-06 169.255 1,015.317 16.962 - 18.272 - 117.036 - 0.351 1,337.1942006-07 172.743 1,040.713 15.890 - 17.190 - 113.963 - 0.316 1,360.8152007-08 158.082 963.699 16.321 - 17.265 - 116.462 - 0.343 1,272.1722008-09 165.739 924.941 15.328 - 20.580 - 120.755 - 0.396 1,247.7392009-10 168.931 877.863 15.372 - 23.258 - 115.200 - 0.371 1,200.9952010-11 162.705 870.602 14.400 - 20.585 - 110.093 - 0.342 1,178.7272011-12 168.019 847.521 14.557 - 18.730 - 120.056 - 0.367 1,169.2502012-13 160.262 814.859 13.837 - 20.191 - 132.012 (1) - 0.358 1,141.5202013-14 162.758 794.361 12.433 - 22.106 - 116.983 - 0.301 1,108.9422014-15 162.634 775.525 10.203 - 20.435 - 119.021 - 0.252 1,088.0702015-16 187.792 757.088 9.974 - 23.040 - 124.006 - 0.244 1,102.1442016-17 140.363 704.350 11.096 - 24.878 - 112.386 - 0.311 993.3842017-18 183.294 693.187 10.924 - 23.203 - 114.968 - 0.340 1,025.9162018-19 123.985 681.649 10.560 - 22.184 - 142.716 - - (2) 981.094
Notes: These data should be read in conjunction with the explanatory notes.
(1) Figure represents sales less prizes and commission, from this period on.
(2) Pools was withdrawn from the Australian Lottery Market on 23 June 2018.
NA = Not applicable
KENO
Value ($ million)
CASINOGAMING
MACHINESINSTANT LOTTERY
INTERACTIVE GAMING (NA)
LOTTERIES(NA)
LOTTOMINOR GAMING
(NA)POOLS TOTAL GAMING
Australian Gambling Statistics, 1993–94 to 2018–19, 36th edition
212

TABLE SA 22SOUTH AUSTRALIA
PER CAPITA GAMING EXPENDITURE
1993-94 105.44 - 12.83 - 12.65 - 55.77 - 0.97 187.671994-95 75.52 167.57 9.90 - 11.58 - 54.99 - 0.35 319.911995-96 68.95 287.54 7.43 - 11.55 - 56.75 - 0.34 432.541996-97 63.37 326.43 7.34 - 11.74 - 55.94 - 0.24 465.051997-98 67.65 351.24 7.43 - 11.63 - 60.09 - 0.24 498.291998-99 67.74 391.03 8.21 - 11.15 - 62.39 - 0.25 540.771999-00 66.55 426.48 8.92 - 13.70 - 63.70 - 0.25 579.592000-01 70.36 473.62 10.52 - 11.01 - 68.18 - 0.29 633.982001-02 79.36 524.82 10.82 - 10.78 - 67.78 - 0.24 693.812002-03 85.89 573.66 11.27 - 8.96 - 72.82 - 0.29 752.912003-04 91.73 615.05 11.06 - 9.58 - 74.11 - 0.24 801.782004-05 89.00 631.12 11.19 - 12.79 - 73.38 - 0.23 817.712005-06 104.37 626.07 10.46 - 11.27 - 72.17 - 0.22 824.552006-07 108.35 652.75 9.97 - 10.78 - 71.48 - 0.20 853.522007-08 101.11 616.36 10.44 - 11.04 - 74.49 - 0.22 813.652008-09 107.77 601.43 9.97 - 13.38 - 78.52 - 0.26 811.322009-10 110.87 576.15 10.09 - 15.26 - 75.61 - 0.24 788.222010-11 108.80 582.15 9.63 - 13.76 - 73.62 - 0.23 788.182011-12 113.83 574.21 9.86 - 12.69 - 81.34 - 0.25 792.182012-13 109.94 558.99 9.49 - 13.85 - 90.56 (1) - 0.25 783.082013-14 113.48 553.88 8.67 - 15.41 - 81.57 - 0.21 773.222014-15 114.29 545.00 7.17 - 14.36 - 83.64 - 0.18 764.642015-16 132.78 535.29 7.05 - 16.29 - 87.68 - 0.17 779.262016-17 100.24 503.01 7.92 - 17.77 - 80.26 - 0.22 709.422017-18 132.29 500.30 7.88 - 16.75 - 82.98 - 0.25 740.442018-19 90.07 495.21 7.67 - 16.12 - 103.68 - - (2) 712.76
Notes: These data should be read in conjunction with the explanatory notes.
(1) Figure represents sales less prizes and commission, from this period on.
(2) Pools was withdrawn from the Australian Lottery Market on 23 June 2018.
NA = Not applicable
KENO
Value ($)
CASINOGAMING
MACHINESINSTANT LOTTERY
INTERACTIVE GAMING (NA)
LOTTERIES(NA)
LOTTOMINOR GAMING
(NA)POOLS TOTAL GAMING
Australian Gambling Statistics, 1993–94 to 2018–19, 36th edition
213

TABLE SA 23SOUTH AUSTRALIA
REAL PER CAPITA GAMING EXPENDITURE
1993-94 195.94 - 23.85 - 23.51 - 103.64 - 1.80 348.741994-95 135.91 301.58 17.81 - 20.85 - 98.97 - 0.63 575.751995-96 119.01 496.35 12.82 - 19.93 - 97.96 - 0.58 746.651996-97 107.91 555.91 12.49 - 19.99 - 95.26 - 0.41 791.971997-98 115.21 598.16 12.65 - 19.81 - 102.34 - 0.40 848.571998-99 113.99 658.06 13.81 - 18.76 - 105.00 - 0.43 910.051999-00 109.41 701.17 14.67 - 22.52 - 104.73 - 0.41 952.902000-01 109.08 734.24 16.32 - 17.06 - 105.70 - 0.45 982.852001-02 119.62 791.05 16.31 - 16.24 - 102.16 - 0.37 1,045.752002-03 125.65 839.16 16.49 - 13.11 - 106.53 - 0.43 1,101.372003-04 131.00 878.31 15.80 - 13.69 - 105.83 - 0.35 1,144.982004-05 124.14 880.33 15.60 - 17.84 - 102.35 - 0.32 1,140.592005-06 141.09 846.38 14.14 - 15.23 - 97.56 - 0.29 1,114.702006-07 142.26 857.06 13.09 - 14.16 - 93.85 - 0.26 1,120.672007-08 128.46 783.14 13.26 - 14.03 - 94.64 - 0.28 1,033.822008-09 132.79 741.07 12.28 - 16.49 - 96.75 - 0.32 999.702009-10 133.44 693.44 12.14 - 18.37 - 91.00 - 0.29 948.692010-11 127.06 679.87 11.25 - 16.07 - 85.97 - 0.27 920.492011-12 129.89 655.17 11.25 - 14.48 - 92.81 - 0.28 903.882012-13 122.62 623.47 10.59 - 15.45 - 101.01 (1) - 0.27 873.412013-14 123.32 601.88 9.42 - 16.75 - 88.64 - 0.23 840.232014-15 122.10 582.25 7.66 - 15.34 - 89.36 - 0.19 816.902015-16 139.89 563.96 7.43 - 17.16 - 92.37 - 0.18 821.002016-17 103.79 520.81 8.20 - 18.40 - 83.10 - 0.23 734.522017-18 134.41 508.32 8.01 - 17.01 - 84.31 - 0.25 752.312018-19 90.07 495.21 7.67 - 16.12 - 103.68 - - (2) 712.76
Notes: These data should be read in conjunction with the explanatory notes.
(1) Figure represents sales less prizes and commission, from this period on.
(2) Pools was withdrawn from the Australian Lottery Market on 23 June 2018.
NA = Not applicable
KENO
Value ($)
CASINOGAMING
MACHINESINSTANT LOTTERY
INTERACTIVE GAMING (NA)
LOTTERIES(NA)
LOTTOMINOR GAMING
(NA)POOLS TOTAL GAMING
Australian Gambling Statistics, 1993–94 to 2018–19, 36th edition
214

TABLE SA 24SOUTH AUSTRALIA
GAMING EXPENDITUREAS A % OF HDI
1993-94 0.474 - 0.058 - 0.057 - 0.251 - 0.004 0.8431994-95 0.330 0.732 0.043 - 0.051 - 0.240 - 0.002 1.3971995-96 0.285 1.190 0.031 - 0.048 - 0.235 - 0.001 1.7911996-97 0.256 1.317 0.030 - 0.047 - 0.226 - 0.001 1.8771997-98 0.264 1.371 0.029 - 0.045 - 0.235 - 0.001 1.9451998-99 0.266 1.535 0.032 - 0.044 - 0.245 - 0.001 2.1231999-00 0.249 1.597 0.033 - 0.051 - 0.239 - 0.001 2.1712000-01 0.243 1.636 0.036 - 0.038 - 0.236 - 0.001 2.1902001-02 0.250 1.650 0.034 - 0.034 - 0.213 - 0.001 2.1812002-03 0.266 1.779 0.035 - 0.028 - 0.226 - 0.001 2.3352003-04 0.266 1.783 0.032 - 0.028 - 0.215 - 0.001 2.3242004-05 0.249 1.765 0.031 - 0.036 - 0.205 - 0.001 2.2872005-06 0.283 1.701 0.028 - 0.031 - 0.196 - 0.001 2.2402006-07 0.273 1.646 0.025 - 0.027 - 0.180 - 0.001 2.1522007-08 0.236 1.439 0.024 - 0.026 - 0.174 - 0.001 1.9002008-09 0.228 1.273 0.021 - 0.028 - 0.166 - 0.001 1.7172009-10 0.231 1.198 0.021 - 0.032 - 0.157 - 0.001 1.6402010-11 0.215 1.148 0.019 - 0.027 - 0.145 - 0.000 1.5552011-12 0.221 1.113 0.019 - 0.025 - 0.158 - 0.000 1.5362012-13 0.212 1.080 0.018 - 0.027 - 0.175 (1) - 0.000 1.5132013-14 0.216 1.055 0.017 - 0.029 - 0.155 - 0.000 1.4732014-15 0.201 0.956 0.013 - 0.025 - 0.147 - 0.000 1.3412015-16 0.227 0.913 0.012 - 0.028 - 0.150 - 0.000 1.3292016-17 0.167 0.839 0.013 - 0.030 - 0.134 - 0.000 1.1842017-18 0.217 0.819 0.013 - 0.027 - 0.136 - 0.000 1.2122018-19 0.146 0.803 0.012 - 0.026 - 0.168 - - (2) 1.156
Notes: These data should be read in conjunction with the explanatory notes.
(1) Figure represents sales less prizes and commission, from this period on.
(2) Pools was withdrawn from the Australian Lottery Market on 23 June 2018.
NA = Not applicable
Percentage (%)
CASINOGAMING
MACHINESINSTANT LOTTERY
TOTAL GAMINGINTERACTIVE GAMING (NA)
KENOLOTTERIES
(NA)LOTTO
MINOR GAMING (NA)
POOLS
Australian Gambling Statistics, 1993–94 to 2018–19, 36th edition
215

TABLE SA 25SOUTH AUSTRALIA
GAMING EXPENDITURESHARE OF MARKET
1993-94 56.18 - 6.84 - 6.74 - 29.72 - 0.521994-95 23.61 52.38 3.09 - 3.62 - 17.19 - 0.111995-96 15.94 66.48 1.72 - 2.67 - 13.12 - 0.081996-97 13.63 70.19 1.58 - 2.52 - 12.03 - 0.051997-98 13.58 70.49 1.49 - 2.33 - 12.06 - 0.051998-99 12.53 72.31 1.52 - 2.06 - 11.54 - 0.051999-00 11.48 73.58 1.54 - 2.36 - 10.99 - 0.042000-01 11.10 74.71 1.66 - 1.74 - 10.75 - 0.052001-02 11.44 75.64 1.56 - 1.55 - 9.77 - 0.042002-03 11.41 76.19 1.50 - 1.19 - 9.67 - 0.042003-04 11.44 76.71 1.38 - 1.20 - 9.24 - 0.032004-05 10.88 77.18 1.37 - 1.56 - 8.97 - 0.032005-06 12.66 75.93 1.27 - 1.37 - 8.75 - 0.032006-07 12.69 76.48 1.17 - 1.26 - 8.37 - 0.022007-08 12.43 75.75 1.28 - 1.36 - 9.15 - 0.032008-09 13.28 74.13 1.23 - 1.65 - 9.68 - 0.032009-10 14.07 73.09 1.28 - 1.94 - 9.59 - 0.032010-11 13.80 73.86 1.22 - 1.75 - 9.34 - 0.032011-12 14.37 72.48 1.24 - 1.60 - 10.27 - 0.032012-13 14.04 71.38 1.21 - 1.77 - 11.56 (1) - 0.032013-14 14.68 71.63 1.12 - 1.99 - 10.55 - 0.032014-15 14.95 71.28 0.94 - 1.88 - 10.94 - 0.022015-16 17.04 68.69 0.90 - 2.09 - 11.25 - 0.022016-17 14.13 70.90 1.12 - 2.50 - 11.31 - 0.032017-18 17.87 67.57 1.06 - 2.26 - 11.21 - 0.032018-19 12.64 69.48 1.08 - 2.26 - 14.55 - - (2)
Notes: These data should be read in conjunction with the explanatory notes.
(1) Figure represents sales less prizes and commission, from this period on.
(2) Pools was withdrawn from the Australian Lottery Market on 23 June 2018.
NA = Not applicable
POOLS
Percentage (%)
CASINOGAMING
MACHINESINSTANT LOTTERY
INTERACTIVE GAMING (NA)
KENOLOTTERIES
(NA)LOTTO
MINOR GAMING (NA)
Australian Gambling Statistics, 1993–94 to 2018–19, 36th edition
216

TABLE SA 26SOUTH AUSTRALIA
GOVERNMENT REVENUE FROM GAMING
1993-94 25.474 - - 77.785 - 103.2591994-95 20.338 62.578 - 74.435 - 157.3511995-96 17.908 110.109 - 74.594 - 202.6111996-97 18.767 134.499 - 72.132 - 225.3981997-98 20.331 160.676 - 77.932 - 258.9391998-99 20.789 191.270 - 80.378 - 292.4371999-00 19.881 211.778 - 85.216 - 316.8752000-01 13.979 189.916 - 78.783 - 282.6782001-02 15.970 213.071 - 76.013 - 305.0542002-03 17.389 245.285 - 81.532 - 344.2062003-04 17.036 283.521 - 83.280 - 383.8372004-05 18.008 296.285 - 84.429 - 398.7222005-06 20.976 293.420 - 85.305 - 399.7012006-07 22.284 313.848 - 86.093 - 422.2252007-08 20.234 295.037 - 91.654 - 406.9252008-09 21.293 292.748 - 95.129 - 409.1702009-10 21.573 282.660 - 96.974 - 401.2072010-11 21.354 291.590 - 94.196 (1) - 407.1402011-12 23.307 290.945 - 102.683 - 416.9352012-13 21.287 285.928 - 114.187 - 421.4022013-14 20.296 288.232 - 72.628 - 381.1562014-15 20.089 286.970 - 73.820 - 380.8792015-16 18.550 283.817 - 77.998 - 380.3652016-17 17.279 264.867 - 75.126 - 357.2722017-18 16.719 267.578 - 76.604 - 360.9012018-19 15.190 268.929 - 90.386 - 374.505
Notes: These data should be read in conjunction with the explanatory notes.
Data for the gambling revenue received by states and territories from 1 July 2000 onwards are not comparable with that of preceding years because of
the impact of changes brought about by the introduction of the GST.
(1) Includes Instant Scratchies, from this period on.
NA = Not applicable
Value ($ million)
TOTAL GAMINGCASINO GAMINGGAMING
MACHINESINTERACTIVE GAMING (NA)
LOTTERIES, POOLS AND KENO
MINOR GAMING (NA)
Australian Gambling Statistics, 1993–94 to 2018–19, 36th edition
217

TABLE SA 27SOUTH AUSTRALIA
REAL GOVERNMENT REVENUE FROM GAMING
1993-94 47.338 - - 144.548 - 191.8871994-95 36.602 112.621 - 133.960 - 283.1821995-96 30.912 190.067 - 128.762 - 349.7421996-97 31.960 229.050 - 122.840 - 383.8491997-98 34.623 273.629 - 132.717 - 440.9691998-99 34.986 321.887 - 135.267 - 492.1401999-00 32.686 348.183 - 140.103 - 520.9722000-01 21.671 294.421 - 122.135 - 438.2282001-02 24.071 321.155 - 114.572 - 459.7972002-03 25.437 358.808 - 119.267 - 503.5122003-04 24.328 404.878 - 118.927 - 548.1332004-05 25.119 413.278 - 117.767 - 556.1642005-06 28.357 396.673 - 115.323 - 540.3542006-07 29.259 412.084 - 113.040 - 554.3832007-08 25.709 374.874 - 116.456 - 517.0392008-09 26.237 360.719 - 117.216 - 504.1722009-10 25.965 340.206 - 116.717 - 482.8872010-11 24.938 340.537 - 110.008 (1) - 475.4832011-12 26.593 331.968 - 117.161 - 475.7232012-13 23.742 318.909 - 127.358 - 470.0092013-14 22.055 313.212 - 78.923 - 414.1902014-15 21.462 306.585 - 78.866 - 406.9132015-16 19.543 299.017 - 82.175 - 400.7352016-17 17.891 274.241 - 77.785 - 369.9162017-18 16.987 271.867 - 77.832 - 366.6862018-19 15.190 268.929 - 90.386 - 374.505
Notes: These data should be read in conjunction with the explanatory notes.
Data for the gambling revenue received by states and territories from 1 July 2000 onwards are not comparable with that of preceding years because of
the impact of changes brought about by the introduction of the GST.
(1) Includes Instant Scratchies, from this period on.
NA = Not applicable
Value ($ million)
TOTAL GAMINGCASINO GAMINGGAMING
MACHINESINTERACTIVE GAMING (NA)
LOTTERIES, POOLS AND KENO
MINOR GAMING (NA)
Australian Gambling Statistics, 1993–94 to 2018–19, 36th edition
218

TABLE SA 28SOUTH AUSTRALIA
PER CAPITA REVENUE FROM GAMING
1993-94 23.11 - - 70.58 - 93.691994-95 18.38 56.56 - 67.27 - 142.211995-96 16.13 99.18 - 67.19 - 182.501996-97 16.82 120.53 - 64.64 - 201.991997-98 18.10 143.01 - 69.36 - 230.471998-99 18.37 169.03 - 71.03 - 258.441999-00 17.45 185.85 - 74.78 - 278.072000-01 12.18 165.51 - 68.66 - 246.352001-02 13.81 184.28 - 65.74 - 263.842002-03 14.91 210.30 - 69.90 - 295.122003-04 14.48 240.99 - 70.79 - 326.262004-05 15.17 249.57 - 71.12 - 335.862005-06 17.49 244.60 - 71.11 - 333.202006-07 18.35 258.46 - 70.90 - 347.712007-08 16.44 239.76 - 74.48 - 330.692008-09 17.06 234.55 - 76.22 - 327.832009-10 17.04 223.28 - 76.60 - 316.922010-11 16.68 227.71 - 73.56 (1) - 317.942011-12 18.02 224.91 - 79.38 - 322.312012-13 16.29 218.77 - 87.37 - 322.432013-14 15.38 218.39 - 55.03 - 288.802014-15 15.08 215.45 - 55.42 - 285.962015-16 13.82 211.42 - 58.10 - 283.342016-17 12.78 195.85 - 55.55 - 264.172017-18 12.26 196.22 - 56.17 - 264.652018-19 11.04 195.37 - 65.66 - 272.07
Notes: These data should be read in conjunction with the explanatory notes.
Data for the gambling revenue received by states and territories from 1 July 2000 onwards are not comparable with that of preceding years because of
the impact of changes brought about by the introduction of the GST.
(1) Includes Instant Scratchies, from this period on.
NA = Not applicable
Value ($)
TOTAL GAMINGCASINO GAMINGGAMING
MACHINESINTERACTIVE GAMING (NA)
LOTTERIES, POOLS AND KENO
MINOR GAMING (NA)
Australian Gambling Statistics, 1993–94 to 2018–19, 36th edition
219

TABLE SA 29SOUTH AUSTRALIA
REAL PER CAPITA REVENUE FROM GAMING
1993-94 42.95 - - 131.16 - 174.111994-95 33.08 101.78 - 121.07 - 255.931995-96 27.84 171.20 - 115.98 - 315.021996-97 28.64 205.27 - 110.08 - 343.991997-98 30.82 243.55 - 118.13 - 392.491998-99 30.92 284.47 - 119.54 - 434.931999-00 28.68 305.55 - 122.95 - 457.182000-01 18.89 256.58 - 106.44 - 381.912001-02 20.82 277.76 - 99.09 - 397.672002-03 21.81 307.64 - 102.26 - 431.712003-04 20.68 344.14 - 101.09 - 465.902004-05 21.16 348.12 - 99.20 - 468.482005-06 23.64 330.67 - 96.14 - 450.452006-07 24.10 339.36 - 93.09 - 456.552007-08 20.89 304.64 - 94.64 - 420.172008-09 21.02 289.01 - 93.91 - 403.952009-10 20.51 268.74 - 92.20 - 381.442010-11 19.47 265.93 - 85.91 (1) - 371.312011-12 20.56 256.63 - 90.57 - 367.752012-13 18.17 244.01 - 97.44 - 359.622013-14 16.71 237.32 - 59.80 - 313.832014-15 16.11 230.18 - 59.21 - 305.502015-16 14.56 222.74 - 61.21 - 298.512016-17 13.23 202.78 - 57.52 - 273.522017-18 12.46 199.36 - 57.07 - 268.892018-19 11.04 195.37 - 65.66 - 272.07
Notes: These data should be read in conjunction with the explanatory notes.
Data for the gambling revenue received by states and territories from 1 July 2000 onwards are not comparable with that of preceding years because of
the impact of changes brought about by the introduction of the GST.
(1) Includes Instant Scratchies, from this period on.
NA = Not applicable
Value ($)
TOTAL GAMINGCASINO GAMINGGAMING
MACHINESINTERACTIVE GAMING (NA)
LOTTERIES, POOLS AND KENO
MINOR GAMING (NA)
Australian Gambling Statistics, 1993–94 to 2018–19, 36th edition
220

TABLE SA 30SOUTH AUSTRALIA
GOVERNMENT REVENUE FROM GAMINGAS A % OF TOTAL GAMBLING REVENUE
1993-94 19.56 - - 59.72 - 79.281994-95 11.25 34.60 - 41.16 - 87.011995-96 7.96 48.95 - 33.16 - 90.061996-97 7.56 54.19 - 29.06 - 90.821997-98 7.18 56.71 - 27.50 - 91.381998-99 6.57 60.48 - 25.42 - 92.471999-00 5.83 62.12 - 25.00 - 92.942000-01 4.68 63.61 - 26.39 - 94.692001-02 5.23 69.78 - 24.89 - 99.902002-03 4.95 69.78 - 23.20 - 97.932003-04 4.35 72.45 - 21.28 - 98.092004-05 4.43 72.85 - 20.76 - 98.042005-06 5.16 72.17 - 20.98 - 98.312006-07 5.19 73.03 - 20.03 - 98.262007-08 4.89 71.26 - 22.14 - 98.282008-09 5.11 70.20 - 22.81 - 98.122009-10 5.28 69.23 - 23.75 - 98.262010-11 5.22 71.27 - 23.02 (1) - 99.512011-12 5.57 69.57 - 24.55 - 99.692012-13 5.04 67.71 - 27.04 - 99.792013-14 5.32 75.50 - 19.02 - 99.842014-15 5.27 75.23 - 19.35 - 99.852015-16 4.87 74.53 - 20.48 - 99.882016-17 4.83 74.03 - 21.00 - 99.862017-18 4.25 68.02 - 19.47 - 91.742018-19 3.71 65.64 - 22.06 - 91.41
Notes: These data should be read in conjunction with the explanatory notes.
Data for the gambling revenue received by states and territories from 1 July 2000 onwards are not comparable with that of preceding years because of
the impact of changes brought about by the introduction of the GST.
(1) Includes Instant Scratchies, from this period on.
NA = Not applicable
Percentage (%)
TOTAL GAMINGCASINO GAMINGGAMING
MACHINESINTERACTIVE GAMING (NA)
LOTTERIES, POOLS AND KENO
MINOR GAMING (NA)
Australian Gambling Statistics, 1993–94 to 2018–19, 36th edition
221

TABLE SA 31SOUTH AUSTRALIA
TOTAL SPORTSBETTING TURNOVER
1994-95 1.099 - - 2.123 3.2221995-96 1.413 - - 2.269 3.6821996-97 1.865 - - 1.995 3.8601997-98 2.312 - - 2.767 5.0791998-99 2.580 - - 2.477 5.0571999-00 2.280 - - 3.306 5.5862000-01 2.107 - 2.288 1.866 6.2612001-02 7.439 - - U - U 7.4392002-03 11.533 - 10.803 0.027 22.3632003-04 8.540 - 14.104 0.018 22.6622004-05 6.841 - 17.494 0.043 24.3782005-06 7.453 - 27.931 - 35.3842006-07 6.167 - 34.098 - 40.2652007-08 4.219 - 42.789 - 47.0082008-09 3.092 - 58.980 - 62.0722009-10 3.092 - 48.862 - 51.9542010-11 1.653 - 54.624 0.044 56.3212011-12 1.792 - 57.825 0.031 59.6482012-13 1.281 (2) - 59.453 - 60.7342013-14 1.998 - 61.185 0.027 63.2102014-15 0.423 - 66.095 0.028 66.5462015-16 0.810 - 69.613 0.021 70.4442016-17 0.650 - 68.376 0.021 69.0472017-18 0.896 - 71.553 0.039 72.4882018-19 0.900 - 71.977 0.038 72.915
Notes: These data should be read in conjunction with the explanatory notes.
(1) Total sportsbetting turnover incomplete due to data for one or more components being unavailable.
(2) Total turnover all bets on and off course, from this period on.
U = Unavailable data
TOTAL SPORTSBETTING
(1)
Value ($ million)
BOOKMAKER (AND OTHER) FIXED ODDS
BOOKMAKER (AND OTHER)
POOL BETTING (U)TAB FIXED ODDS TAB TOTE ODDS
Australian Gambling Statistics, 1993–94 to 2018–19, 36th edition
222
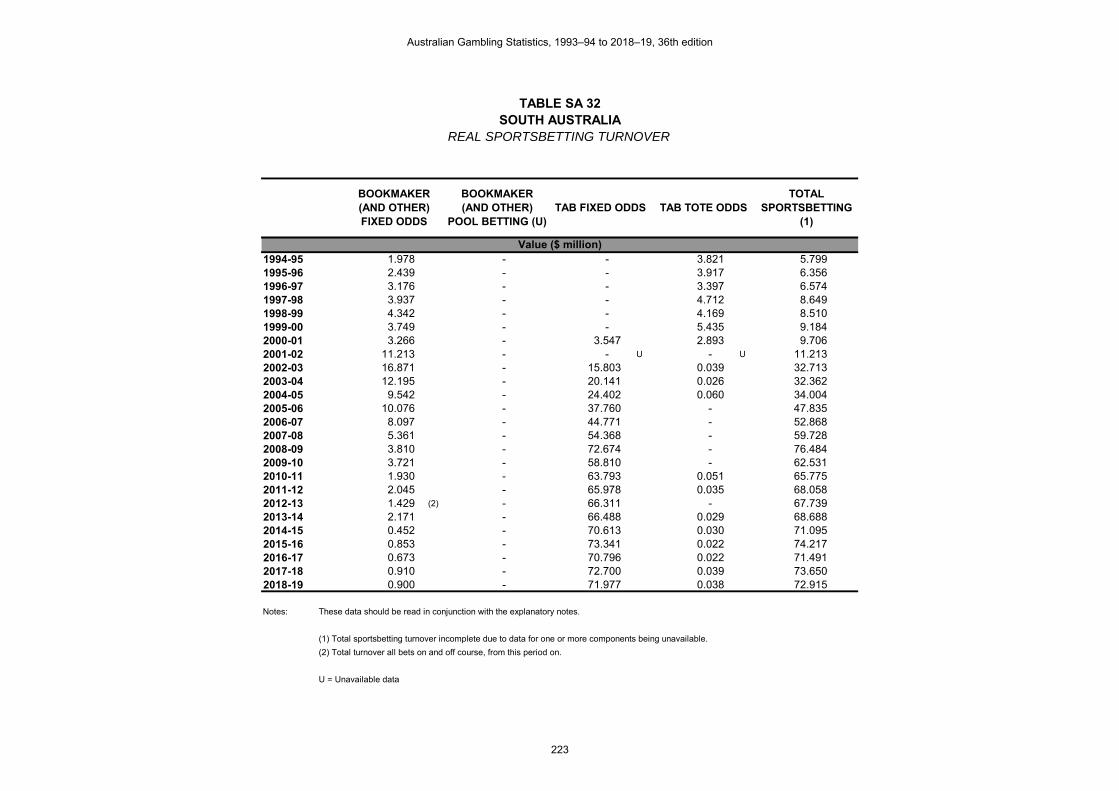
TABLE SA 32SOUTH AUSTRALIA
REAL SPORTSBETTING TURNOVER
1994-95 1.978 - - 3.821 5.7991995-96 2.439 - - 3.917 6.3561996-97 3.176 - - 3.397 6.5741997-98 3.937 - - 4.712 8.6491998-99 4.342 - - 4.169 8.5101999-00 3.749 - - 5.435 9.1842000-01 3.266 - 3.547 2.893 9.7062001-02 11.213 - - U - U 11.2132002-03 16.871 - 15.803 0.039 32.7132003-04 12.195 - 20.141 0.026 32.3622004-05 9.542 - 24.402 0.060 34.0042005-06 10.076 - 37.760 - 47.8352006-07 8.097 - 44.771 - 52.8682007-08 5.361 - 54.368 - 59.7282008-09 3.810 - 72.674 - 76.4842009-10 3.721 - 58.810 - 62.5312010-11 1.930 - 63.793 0.051 65.7752011-12 2.045 - 65.978 0.035 68.0582012-13 1.429 (2) - 66.311 - 67.7392013-14 2.171 - 66.488 0.029 68.6882014-15 0.452 - 70.613 0.030 71.0952015-16 0.853 - 73.341 0.022 74.2172016-17 0.673 - 70.796 0.022 71.4912017-18 0.910 - 72.700 0.039 73.6502018-19 0.900 - 71.977 0.038 72.915
Notes: These data should be read in conjunction with the explanatory notes.
(1) Total sportsbetting turnover incomplete due to data for one or more components being unavailable.
(2) Total turnover all bets on and off course, from this period on.
U = Unavailable data
TOTAL SPORTSBETTING
(1)
Value ($ million)
BOOKMAKER (AND OTHER) FIXED ODDS
BOOKMAKER (AND OTHER)
POOL BETTING (U)TAB FIXED ODDS TAB TOTE ODDS
Australian Gambling Statistics, 1993–94 to 2018–19, 36th edition
223

TABLE SA 33SOUTH AUSTRALIA
PER CAPITA SPORTSBETTING TURNOVER
1994-95 0.99 - - 1.92 2.911995-96 1.27 - - 2.04 3.321996-97 1.67 - - 1.79 3.461997-98 2.06 - - 2.46 4.521998-99 2.28 - - 2.19 4.471999-00 2.00 - - 2.90 4.902000-01 1.84 - 1.99 1.63 5.462001-02 6.43 - - U - U 6.432002-03 9.89 - 9.26 0.02 19.172003-04 7.26 - 11.99 0.02 19.262004-05 5.76 - 14.74 0.04 20.532005-06 6.21 - 23.28 - 29.502006-07 5.08 - 28.08 - 33.162007-08 3.43 - 34.77 - 38.202008-09 2.48 - 47.26 - 49.732009-10 2.44 - 38.60 - 41.042010-11 1.29 - 42.66 0.03 43.982011-12 1.39 - 44.70 0.02 46.112012-13 0.98 (2) - 45.49 - 46.472013-14 1.51 - 46.36 0.02 47.892014-15 0.32 - 49.62 0.02 49.962015-16 0.60 - 51.86 0.02 52.472016-17 0.48 - 50.56 0.02 51.052017-18 0.66 - 52.47 0.03 53.162018-19 0.65 - 52.29 0.03 52.97
Notes: These data should be read in conjunction with the explanatory notes.
(1) Total sportsbetting turnover incomplete due to data for one or more components being unavailable.
(2) Total turnover all bets on and off course, from this period on.
U = Unavailable data
TOTAL SPORTSBETTING
(1)
Value ($)
BOOKMAKER (AND OTHER) FIXED ODDS
BOOKMAKER (AND OTHER)
POOL BETTING (U)TAB FIXED ODDS TAB TOTE ODDS
Australian Gambling Statistics, 1993–94 to 2018–19, 36th edition
224

TABLE SA 34SOUTH AUSTRALIA
REAL PER CAPITA SPORTSBETTING TURNOVER
1994-95 1.79 - - 3.45 5.241995-96 2.20 - - 3.53 5.721996-97 2.85 - - 3.04 5.891997-98 3.50 - - 4.19 7.701998-99 3.84 - - 3.68 7.521999-00 3.29 - - 4.77 8.062000-01 2.85 - 3.09 2.52 8.462001-02 9.70 - - U - U 9.702002-03 14.46 - 13.55 0.03 28.052003-04 10.37 - 17.12 0.02 27.512004-05 8.04 - 20.55 0.05 28.642005-06 8.40 - 31.48 - 39.882006-07 6.67 - 36.87 - 43.542007-08 4.36 - 44.18 - 48.542008-09 3.05 - 58.23 - 61.282009-10 2.94 - 46.45 - 49.392010-11 1.51 - 49.82 0.04 51.362011-12 1.58 - 51.00 0.03 52.612012-13 1.09 (2) - 50.74 - 51.832013-14 1.65 - 50.38 0.02 52.042014-15 0.34 - 53.01 0.02 53.382015-16 0.64 - 54.63 0.02 55.282016-17 0.50 - 52.35 0.02 52.862017-18 0.67 - 53.31 0.03 54.012018-19 0.65 - 52.29 0.03 52.97
Notes: These data should be read in conjunction with the explanatory notes.
(1) Total sportsbetting turnover incomplete due to data for one or more components being unavailable.
(2) Total turnover all bets on and off course, from this period on.
U = Unavailable data
TOTAL SPORTSBETTING
(1)
Value ($)
BOOKMAKER (AND OTHER) FIXED ODDS
BOOKMAKER (AND OTHER)
POOL BETTING (U)TAB FIXED ODDS TAB TOTE ODDS
Australian Gambling Statistics, 1993–94 to 2018–19, 36th edition
225

TABLE SA 35SOUTH AUSTRALIA
TOTAL SPORTSBETTING EXPENDITURE
1994-95 0.083 - - 0.425 0.5081995-96 0.093 - - 0.454 0.5471996-97 0.130 - - 0.399 0.5291997-98 0.220 - - 0.553 0.7731998-99 0.213 - - 0.495 0.7081999-00 0.106 - - 0.661 0.7672000-01 0.052 - 0.246 0.373 0.6712001-02 0.081 - - U - U 0.0812002-03 -0.171 - 1.760 - U 1.5892003-04 0.225 - 2.456 - U 2.6812004-05 -0.058 - 2.032 0.003 1.9772005-06 0.111 - 2.801 - 2.9122006-07 0.530 - 3.410 - 3.9402007-08 0.552 - 3.625 - 4.1772008-09 0.418 - 5.072 - 5.4902009-10 0.067 - 7.546 - 7.6132010-11 0.094 - 7.808 0.005 7.9072011-12 0.130 - 8.811 0.013 8.9542012-13 0.182 (2) - 9.066 0.328 9.5762013-14 0.195 - 9.933 0.007 10.1352014-15 0.280 - 9.384 0.016 9.6802015-16 0.043 - 7.669 0.005 7.7172016-17 0.054 - 8.559 0.006 8.6192017-18 0.060 - 9.622 0.010 9.6922018-19 0.050 - 8.188 0.010 8.248
Notes: These data should be read in conjunction with the explanatory notes.
(1) Total sportsbetting expenditure incomplete due to data for one or more components being unavailable.
(2) Profit from all bets on and off course (Audit plus sports i.e. AAMI, Bay Sheffield etc.).
U = Unavailable data
TOTAL SPORTSBETTING
(1)
Value ($ million)
BOOKMAKER (AND OTHER) FIXED ODDS
BOOKMAKER (AND OTHER)
POOL BETTING (U)TAB FIXED ODDS TAB TOTE ODDS
Australian Gambling Statistics, 1993–94 to 2018–19, 36th edition
226

TABLE SA 36SOUTH AUSTRALIA
REAL SPORTSBETTING EXPENDITURE
1994-95 0.149 - - 0.765 0.9141995-96 0.161 - - 0.784 0.9441996-97 0.221 - - 0.679 0.9011997-98 0.375 - - 0.942 1.3161998-99 0.358 - - 0.833 1.1911999-00 0.174 - - 1.087 1.2612000-01 0.081 - 0.381 0.578 1.0402001-02 0.122 - - U - U 0.1222002-03 -0.250 - 2.575 - U 2.3242003-04 0.321 - 3.507 - U 3.8292004-05 -0.081 - 2.834 0.004 2.7582005-06 0.150 - 3.787 - 3.9372006-07 0.696 - 4.477 - 5.1732007-08 0.701 - 4.606 - 5.3072008-09 0.515 - 6.250 - 6.7652009-10 0.081 - 9.082 - 9.1632010-11 0.110 - 9.119 0.006 9.2342011-12 0.148 - 10.053 0.015 10.2172012-13 0.203 (2) - 10.112 0.366 10.6812013-14 0.212 - 10.794 0.008 11.0132014-15 0.299 - 10.025 0.017 10.3422015-16 0.045 - 8.080 0.005 8.1302016-17 0.056 - 8.862 0.006 8.9242017-18 0.061 - 9.776 0.010 9.8472018-19 0.050 - 8.188 0.010 8.248
Notes: These data should be read in conjunction with the explanatory notes.
(1) Total sportsbetting expenditure incomplete due to data for one or more components being unavailable.
(2) Profit from all bets on and off course (Audit plus sports i.e. AAMI, Bay Sheffield etc.).
U = Unavailable data
TOTAL SPORTSBETTING
(1)
Value ($ million)
BOOKMAKER (AND OTHER) FIXED ODDS
BOOKMAKER (AND OTHER)
POOL BETTING (U)TAB FIXED ODDS TAB TOTE ODDS
Australian Gambling Statistics, 1993–94 to 2018–19, 36th edition
227

TABLE SA 37SOUTH AUSTRALIA
PER CAPITA SPORTSBETTING EXPENDITURE
1994-95 0.08 - - 0.38 0.461995-96 0.08 - - 0.41 0.491996-97 0.12 - - 0.36 0.471997-98 0.20 - - 0.49 0.691998-99 0.19 - - 0.44 0.631999-00 0.09 - - 0.58 0.672000-01 0.05 - 0.21 0.33 0.582001-02 0.07 - - U - U 0.072002-03 -0.15 - 1.51 - U 1.362003-04 0.19 - 2.09 - U 2.282004-05 -0.05 - 1.71 0.00 1.672005-06 0.09 - 2.33 - 2.432006-07 0.44 - 2.81 - 3.242007-08 0.45 - 2.95 - 3.392008-09 0.33 - 4.06 - 4.402009-10 0.05 - 5.96 - 6.012010-11 0.07 - 6.10 0.00 6.172011-12 0.10 - 6.81 0.01 6.922012-13 0.14 (2) - 6.94 0.25 7.332013-14 0.15 - 7.53 0.01 7.682014-15 0.21 - 7.05 0.01 7.272015-16 0.03 - 5.71 0.00 5.752016-17 0.04 - 6.33 0.00 6.372017-18 0.04 - 7.06 0.01 7.112018-19 0.04 - 5.95 0.01 5.99
Notes: These data should be read in conjunction with the explanatory notes.
(1) Total sportsbetting expenditure incomplete due to data for one or more components being unavailable.
(2) Profit from all bets on and off course (Audit plus sports i.e. AAMI, Bay Sheffield etc.).
U = Unavailable data
TOTAL SPORTSBETTING
(1)
Value ($)
BOOKMAKER (AND OTHER) FIXED ODDS
BOOKMAKER (AND OTHER)
POOL BETTING (U)TAB FIXED ODDS TAB TOTE ODDS
Australian Gambling Statistics, 1993–94 to 2018–19, 36th edition
228

TABLE SA 38SOUTH AUSTRALIA
REAL PER CAPITA SPORTSBETTING EXPENDITURE
1994-95 0.14 - - 0.69 0.831995-96 0.14 - - 0.71 0.851996-97 0.20 - - 0.61 0.811997-98 0.33 - - 0.84 1.171998-99 0.32 - - 0.74 1.051999-00 0.15 - - 0.95 1.112000-01 0.07 - 0.33 0.50 0.912001-02 0.11 - - U - U 0.112002-03 -0.21 - 2.21 - U 1.992003-04 0.27 - 2.98 - U 3.252004-05 -0.07 - 2.39 0.00 2.322005-06 0.13 - 3.16 - 3.282006-07 0.57 - 3.69 - 4.262007-08 0.57 - 3.74 - 4.312008-09 0.41 - 5.01 - 5.422009-10 0.06 - 7.17 - 7.242010-11 0.09 - 7.12 0.00 7.212011-12 0.11 - 7.77 0.01 7.902012-13 0.16 (2) - 7.74 0.28 8.172013-14 0.16 - 8.18 0.01 8.342014-15 0.22 - 7.53 0.01 7.762015-16 0.03 - 6.02 0.00 6.062016-17 0.04 - 6.55 0.00 6.602017-18 0.04 - 7.17 0.01 7.222018-19 0.04 - 5.95 0.01 5.99
Notes: These data should be read in conjunction with the explanatory notes.
(1) Total sportsbetting expenditure incomplete due to data for one or more components being unavailable.
(2) Profit from all bets on and off course (Audit plus sports i.e. AAMI, Bay Sheffield etc.).
U = Unavailable data
TOTAL SPORTSBETTING
(1)
Value ($)
BOOKMAKER (AND OTHER) FIXED ODDS
BOOKMAKER (AND OTHER)
POOL BETTING (U)TAB FIXED ODDS TAB TOTE ODDS
Australian Gambling Statistics, 1993–94 to 2018–19, 36th edition
229

TABLE SA 39SOUTH AUSTRALIA
SPORTSBETTING EXPENDITUREAS A % OF HDI
1994-95 0.000 - - 0.002 0.0021995-96 0.000 - - 0.002 0.0021996-97 0.000 - - 0.001 0.0021997-98 0.001 - - 0.002 0.0031998-99 0.001 - - 0.002 0.0021999-00 0.000 - - 0.002 0.0032000-01 0.000 - 0.001 0.001 0.0022001-02 0.000 - - U - U 0.0002002-03 -0.000 - 0.005 - U 0.0042003-04 0.001 - 0.006 - U 0.0072004-05 -0.000 - 0.005 0.000 0.0052005-06 0.000 - 0.006 - 0.0072006-07 0.001 - 0.007 - 0.0082007-08 0.001 - 0.007 - 0.0082008-09 0.001 - 0.009 - 0.0092009-10 0.000 - 0.012 - 0.0132010-11 0.000 - 0.012 0.000 0.0122011-12 0.000 - 0.013 0.000 0.0132012-13 0.000 (2) - 0.013 0.000 0.0142013-14 0.000 - 0.014 0.000 0.0152014-15 0.000 - 0.012 0.000 0.0132015-16 0.000 - 0.010 0.000 0.0102016-17 0.000 - 0.011 0.000 0.0112017-18 0.000 - 0.012 0.000 0.0122018-19 0.000 - 0.010 0.000 0.010
Notes: These data should be read in conjunction with the explanatory notes.
(1) Total sportsbetting expenditure incomplete due to data for one or more components being unavailable.
(2) Profit from all bets on and off course (Audit plus sports i.e. AAMI, Bay Sheffield etc.).
U = Unavailable data
Percentage (%)
BOOKMAKER (AND OTHER) FIXED ODDS
BOOKMAKER (AND OTHER)
POOL BETTING (U)TAB FIXED ODDS TAB TOTE ODDS
TOTAL SPORTSBETTING
(1)
Australian Gambling Statistics, 1993–94 to 2018–19, 36th edition
230

TABLE SA 40SOUTH AUSTRALIA
SPORTSBETTING EXPENDITURESHARE OF MARKET
1994-95 16.34 - - 83.661995-96 17.00 - - 83.001996-97 24.57 - - 75.431997-98 28.46 - - 71.541998-99 30.08 - - 69.921999-00 13.82 - - 86.182000-01 7.75 - 36.66 55.592001-02 100.00 - - U - U
2002-03 -10.76 - 110.76 - U
2003-04 8.39 - 91.61 - U
2004-05 -2.93 - 102.78 0.152005-06 3.81 - 96.19 -2006-07 13.45 - 86.55 -2007-08 13.22 - 86.78 -2008-09 7.61 - 92.39 -2009-10 0.88 - 99.12 -2010-11 1.19 - 98.75 0.062011-12 1.45 - 98.40 0.152012-13 1.90 (1) - 94.67 3.432013-14 1.92 - 98.01 0.072014-15 2.89 - 96.94 0.172015-16 0.56 - 99.38 0.062016-17 0.63 - 99.30 0.072017-18 0.62 - 99.28 0.102018-19 0.61 - 99.28 0.12
Notes: These data should be read in conjunction with the explanatory notes.
(1) Profit from all bets on and off course (Audit plus sports i.e. AAMI, Bay Sheffield etc.).
U = Unavailable data
TAB FIXED ODDS TAB TOTE ODDS
Percentage (%)
BOOKMAKER (AND OTHER) FIXED ODDS
BOOKMAKER (AND OTHER)
POOL BETTING (U)
Australian Gambling Statistics, 1993–94 to 2018–19, 36th edition
231

TABLE SA 41SOUTH AUSTRALIA
GOVERNMENT REVENUE FROM SPORTSBETTING
1994-95 0.006 - - 0.141 0.1471995-96 0.005 - - 0.150 0.1551996-97 0.006 - - 0.104 0.1101997-98 0.035 - - 0.162 0.1971998-99 0.046 - - 0.103 0.1491999-00 0.039 - - 0.222 0.2612000-01 0.036 - - 0.104 0.1402001-02 0.015 (2) - - U - U 0.0152002-03 - - 0.106 - U 0.1062003-04 - - 0.147 - U 0.1472004-05 - - 0.122 - (3) 0.1222005-06 - - 0.268 - (3) 0.2682006-07 - - 0.247 - (3) 0.2472007-08 - - 0.257 - 0.2572008-09 - - 0.347 - 0.3472009-10 - - 0.453 - 0.4532010-11 - - 0.467 0.001 0.4682011-12 - - 0.528 - 0.5282012-13 - - - - -2013-14 - - 0.596 0.001 0.5972014-15 - - 0.563 0.001 0.5642015-16 - - 0.439 0.001 0.4402016-17 - - 0.511 0.001 0.5122017-18 - - 1.443 (4) 0.001 1.4442018-19 - - 1.228 0.001 1.230
Notes: These data should be read in conjunction with the explanatory notes.
Data for the gambling revenue received by states and territories from 1 July 2000 onwards are not comparable with that of
preceding years because of the impact of changes brought about by the introduction of the GST.
(1) Total sportsbetting revenue incomplete due to data for one or more components being unavailable.
(2) Bookmakers' tax abolished from 1 December 2001.
(3) Under $1,000.
(4) Includes point of consumption tax (POCT) which commenced on 1 July 2017. Revenue from SA TAB only, not interstate TABs.
U = Unavailable data
TOTAL SPORTSBETTING
(1)
Value ($ million)
BOOKMAKER (AND OTHER) FIXED ODDS
BOOKMAKER (AND OTHER)
POOL BETTING (U)
TAB FIXED ODDS TAB TOTE ODDS
Australian Gambling Statistics, 1993–94 to 2018–19, 36th edition
232
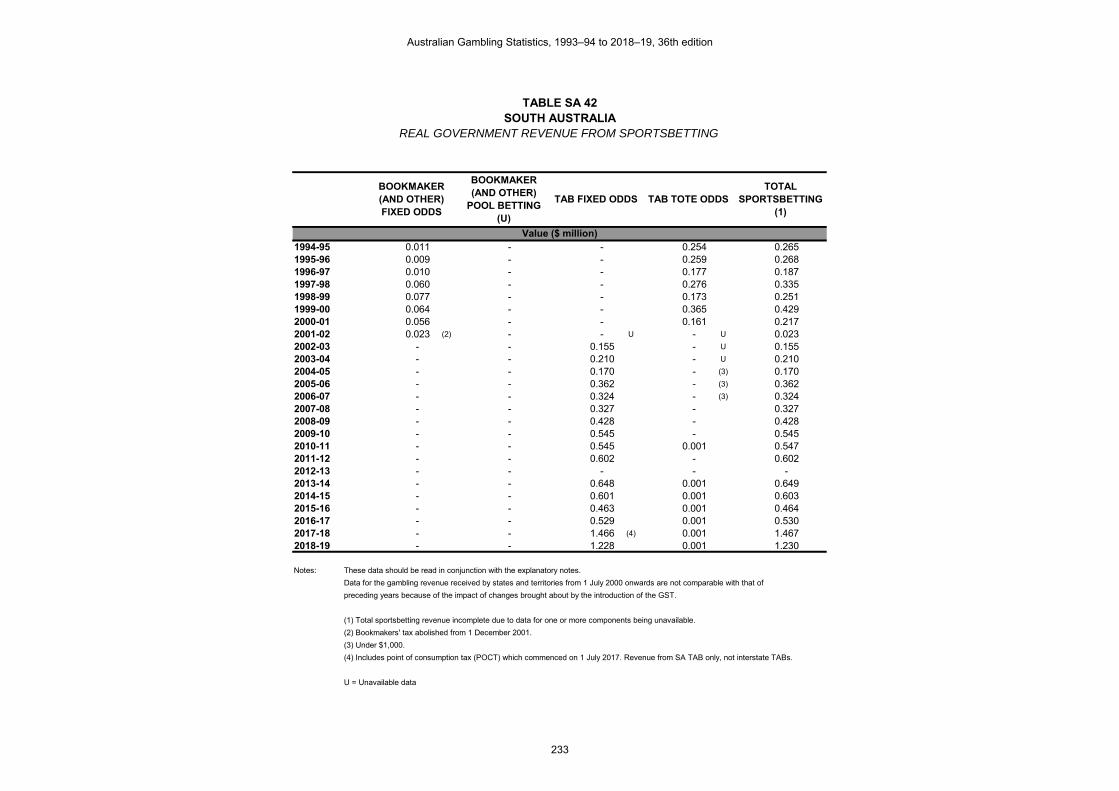
TABLE SA 42SOUTH AUSTRALIA
REAL GOVERNMENT REVENUE FROM SPORTSBETTING
1994-95 0.011 - - 0.254 0.2651995-96 0.009 - - 0.259 0.2681996-97 0.010 - - 0.177 0.1871997-98 0.060 - - 0.276 0.3351998-99 0.077 - - 0.173 0.2511999-00 0.064 - - 0.365 0.4292000-01 0.056 - - 0.161 0.2172001-02 0.023 (2) - - U - U 0.0232002-03 - - 0.155 - U 0.1552003-04 - - 0.210 - U 0.2102004-05 - - 0.170 - (3) 0.1702005-06 - - 0.362 - (3) 0.3622006-07 - - 0.324 - (3) 0.3242007-08 - - 0.327 - 0.3272008-09 - - 0.428 - 0.4282009-10 - - 0.545 - 0.5452010-11 - - 0.545 0.001 0.5472011-12 - - 0.602 - 0.6022012-13 - - - - -2013-14 - - 0.648 0.001 0.6492014-15 - - 0.601 0.001 0.6032015-16 - - 0.463 0.001 0.4642016-17 - - 0.529 0.001 0.5302017-18 - - 1.466 (4) 0.001 1.4672018-19 - - 1.228 0.001 1.230
Notes: These data should be read in conjunction with the explanatory notes.
Data for the gambling revenue received by states and territories from 1 July 2000 onwards are not comparable with that of
preceding years because of the impact of changes brought about by the introduction of the GST.
(1) Total sportsbetting revenue incomplete due to data for one or more components being unavailable.
(2) Bookmakers' tax abolished from 1 December 2001.
(3) Under $1,000.
(4) Includes point of consumption tax (POCT) which commenced on 1 July 2017. Revenue from SA TAB only, not interstate TABs.
U = Unavailable data
TOTAL SPORTSBETTING
(1)
Value ($ million)
BOOKMAKER (AND OTHER) FIXED ODDS
BOOKMAKER (AND OTHER)
POOL BETTING (U)
TAB FIXED ODDS TAB TOTE ODDS
Australian Gambling Statistics, 1993–94 to 2018–19, 36th edition
233

TABLE SA 43SOUTH AUSTRALIA
PER CAPITA REVENUE FROM SPORTSBETTING
1994-95 0.01 - - 0.13 0.131995-96 0.00 - - 0.14 0.141996-97 0.01 - - 0.09 0.101997-98 0.03 - - 0.14 0.181998-99 0.04 - - 0.09 0.131999-00 0.03 - - 0.19 0.232000-01 0.03 - - 0.09 0.122001-02 0.01 (2) - - U - U 0.012002-03 - - 0.09 - U 0.092003-04 - - 0.12 - U 0.122004-05 - - 0.10 - (3) 0.102005-06 - - 0.22 - (3) 0.222006-07 - - 0.20 - (3) 0.202007-08 - - 0.21 - 0.212008-09 - - 0.28 - 0.282009-10 - - 0.36 - 0.362010-11 - - 0.36 0.00 0.372011-12 - - 0.41 - 0.412012-13 - - - - -2013-14 - - 0.45 0.00 0.452014-15 - - 0.42 0.00 0.422015-16 - - 0.33 0.00 0.332016-17 - - 0.38 0.00 0.382017-18 - - 1.06 (4) 0.00 1.062018-19 - - 0.89 0.00 0.89
Notes: These data should be read in conjunction with the explanatory notes.
Data for the gambling revenue received by states and territories from 1 July 2000 onwards are not comparable with that of
preceding years because of the impact of changes brought about by the introduction of the GST.
(1) Total sportsbetting revenue incomplete due to data for one or more components being unavailable.
(2) Bookmakers' tax abolished from 1 December 2001.
(3) Under $1,000.
(4) Includes point of consumption tax (POCT) which commenced on 1 July 2017. Revenue from SA TAB only, not interstate TABs.
U = Unavailable data
TOTAL SPORTSBETTING
(1)
Value ($)
BOOKMAKER (AND OTHER) FIXED ODDS
BOOKMAKER (AND OTHER)
POOL BETTING (U)
TAB FIXED ODDS TAB TOTE ODDS
Australian Gambling Statistics, 1993–94 to 2018–19, 36th edition
234

TABLE SA 44SOUTH AUSTRALIA
REAL PER CAPITA REVENUE FROM SPORTSBETTING
1994-95 0.01 - - 0.23 0.241995-96 0.01 - - 0.23 0.241996-97 0.01 - - 0.16 0.171997-98 0.05 - - 0.25 0.301998-99 0.07 - - 0.15 0.221999-00 0.06 - - 0.32 0.382000-01 0.05 - - 0.14 0.192001-02 0.02 (2) - - U - U 0.022002-03 - - 0.13 - U 0.132003-04 - - 0.18 - U 0.182004-05 - - 0.14 - (3) 0.142005-06 - - 0.30 - (3) 0.302006-07 - - 0.27 - (3) 0.272007-08 - - 0.27 - 0.272008-09 - - 0.34 - 0.342009-10 - - 0.43 - 0.432010-11 - - 0.43 0.00 0.432011-12 - - 0.47 - 0.472012-13 - - - - -2013-14 - - 0.49 0.00 0.492014-15 - - 0.45 0.00 0.452015-16 - - 0.34 0.00 0.352016-17 - - 0.39 0.00 0.392017-18 - - 1.08 (4) 0.00 1.082018-19 - - 0.89 0.00 0.89
Notes: These data should be read in conjunction with the explanatory notes.
Data for the gambling revenue received by states and territories from 1 July 2000 onwards are not comparable with that of
preceding years because of the impact of changes brought about by the introduction of the GST.
(1) Total sportsbetting revenue incomplete due to data for one or more components being unavailable.
(2) Bookmakers' tax abolished from 1 December 2001.
(3) Under $1,000.
(4) Includes point of consumption tax (POCT) which commenced on 1 July 2017. Revenue from SA TAB only, not interstate TABs.
U = Unavailable data
TOTAL SPORTSBETTING
(1)
Value ($)
BOOKMAKER (AND OTHER) FIXED ODDS
BOOKMAKER (AND OTHER)
POOL BETTING (U)
TAB FIXED ODDS TAB TOTE ODDS
Australian Gambling Statistics, 1993–94 to 2018–19, 36th edition
235

TABLE SA 45SOUTH AUSTRALIA
GOVERNMENT REVENUE FROM SPORTSBETTINGAS A % OF TOTAL GAMBLING REVENUE
1994-95 0.00 - - 0.08 0.081995-96 0.00 - - 0.07 0.071996-97 0.00 - - 0.04 0.041997-98 0.01 - - 0.06 0.071998-99 0.01 - - 0.03 0.051999-00 0.01 - - 0.07 0.082000-01 0.01 - - 0.03 0.052001-02 0.00 (2) - - U - U 0.002002-03 - - 0.03 - U 0.032003-04 - - 0.04 - U 0.042004-05 - - 0.03 - (3) 0.032005-06 - - 0.07 - (3) 0.072006-07 - - 0.06 - (3) 0.062007-08 - - 0.06 - 0.062008-09 - - 0.08 - 0.082009-10 - - 0.11 - 0.112010-11 - - 0.11 0.00 0.112011-12 - - 0.13 - 0.132012-13 - - - - -2013-14 - - 0.16 0.00 0.162014-15 - - 0.15 0.00 0.152015-16 - - 0.12 0.00 0.122016-17 - - 0.14 0.00 0.142017-18 - - 0.37 (4) 0.00 0.372018-19 - - 0.30 0.00 0.30
Notes: These data should be read in conjunction with the explanatory notes.
Data for the gambling revenue received by states and territories from 1 July 2000 onwards are not comparable with that of
preceding years because of the impact of changes brought about by the introduction of the GST.
(1) Total sportsbetting revenue incomplete due to data for one or more components being unavailable.
(2) Bookmakers' tax abolished from 1 December 2001.
(3) Under $1,000.
(4) Includes point of consumption tax (POCT) which commenced on 1 July 2017. Revenue from SA TAB only, not interstate TABs.
U = Unavailable data
Percentage (%)
BOOKMAKER (AND OTHER) FIXED ODDS
BOOKMAKER (AND OTHER)
POOL BETTING (U)
TAB FIXED ODDS TAB TOTE ODDSTOTAL
SPORTSBETTING (1)
Australian Gambling Statistics, 1993–94 to 2018–19, 36th edition
236
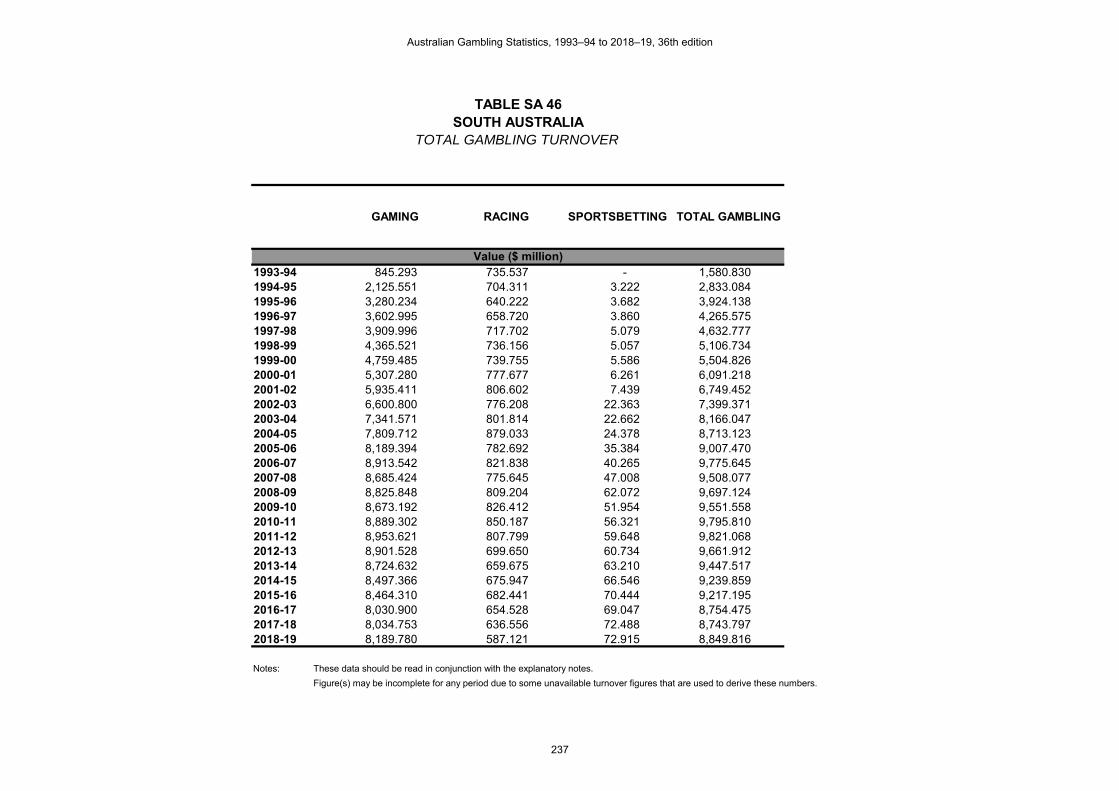
TABLE SA 46SOUTH AUSTRALIA
TOTAL GAMBLING TURNOVER
1993-94 845.293 735.537 - 1,580.8301994-95 2,125.551 704.311 3.222 2,833.0841995-96 3,280.234 640.222 3.682 3,924.1381996-97 3,602.995 658.720 3.860 4,265.5751997-98 3,909.996 717.702 5.079 4,632.7771998-99 4,365.521 736.156 5.057 5,106.7341999-00 4,759.485 739.755 5.586 5,504.8262000-01 5,307.280 777.677 6.261 6,091.2182001-02 5,935.411 806.602 7.439 6,749.4522002-03 6,600.800 776.208 22.363 7,399.3712003-04 7,341.571 801.814 22.662 8,166.0472004-05 7,809.712 879.033 24.378 8,713.1232005-06 8,189.394 782.692 35.384 9,007.4702006-07 8,913.542 821.838 40.265 9,775.6452007-08 8,685.424 775.645 47.008 9,508.0772008-09 8,825.848 809.204 62.072 9,697.1242009-10 8,673.192 826.412 51.954 9,551.5582010-11 8,889.302 850.187 56.321 9,795.8102011-12 8,953.621 807.799 59.648 9,821.0682012-13 8,901.528 699.650 60.734 9,661.9122013-14 8,724.632 659.675 63.210 9,447.5172014-15 8,497.366 675.947 66.546 9,239.8592015-16 8,464.310 682.441 70.444 9,217.1952016-17 8,030.900 654.528 69.047 8,754.4752017-18 8,034.753 636.556 72.488 8,743.7972018-19 8,189.780 587.121 72.915 8,849.816
Notes: These data should be read in conjunction with the explanatory notes.
Figure(s) may be incomplete for any period due to some unavailable turnover figures that are used to derive these numbers.
Value ($ million)
GAMING RACING SPORTSBETTING TOTAL GAMBLING
Australian Gambling Statistics, 1993–94 to 2018–19, 36th edition
237

TABLE SA 47SOUTH AUSTRALIA
REAL GAMBLING TURNOVER
1993-94 1,570.813 1,366.853 - 2,937.6661994-95 3,825.321 1,267.538 5.799 5,098.6571995-96 5,662.250 1,105.134 6.356 6,773.7391996-97 6,135.847 1,121.790 6.574 7,264.2111997-98 6,658.665 1,222.236 8.649 7,889.5501998-99 7,346.695 1,238.870 8.510 8,594.0761999-00 7,825.032 1,216.225 9.184 9,050.4422000-01 8,227.726 1,205.611 9.706 9,443.0432001-02 8,946.240 1,215.763 11.213 10,173.2162002-03 9,655.786 1,135.453 32.713 10,823.9522003-04 10,484.020 1,145.018 32.362 11,661.4012004-05 10,893.498 1,226.133 34.004 12,153.6352005-06 11,071.207 1,058.118 47.835 12,177.1602006-07 11,703.511 1,079.076 52.868 12,835.4562007-08 11,035.711 985.536 59.728 12,080.9752008-09 10,875.046 997.086 76.484 11,948.6162009-10 10,438.937 994.658 62.531 11,496.1262010-11 10,381.467 992.900 65.775 11,440.1422011-12 10,216.082 921.699 68.058 11,205.8392012-13 9,928.293 780.353 67.739 10,776.3852013-14 9,480.767 716.847 68.688 10,266.3022014-15 9,078.178 722.149 71.095 9,871.4222015-16 8,917.616 718.989 74.217 9,710.8212016-17 8,315.115 677.692 71.491 9,064.2982017-18 8,163.538 646.759 73.650 8,883.9472018-19 8,189.780 587.121 72.915 8,849.816
Notes: These data should be read in conjunction with the explanatory notes.
Figure(s) may be incomplete for any period due to some unavailable turnover figures that are used to derive these numbers.
Value ($ million)
GAMING RACING SPORTSBETTING TOTAL GAMBLING
Australian Gambling Statistics, 1993–94 to 2018–19, 36th edition
238

TABLE SA 48SOUTH AUSTRALIA
PER CAPITA GAMBLING TURNOVER
1993-94 767.00 667.41 - 1,434.411994-95 1,921.02 636.54 2.91 2,560.471995-96 2,954.62 576.67 3.32 3,534.611996-97 3,228.87 590.32 3.46 3,822.661997-98 3,480.13 638.80 4.52 4,123.451998-99 3,858.02 650.58 4.47 4,513.071999-00 4,176.67 649.17 4.90 4,830.742000-01 4,625.19 677.73 5.46 5,308.382001-02 5,133.42 697.61 6.43 5,837.472002-03 5,659.46 665.51 19.17 6,344.142003-04 6,240.21 681.53 19.26 6,941.002004-05 6,578.41 740.44 20.53 7,339.382005-06 6,826.79 652.46 29.50 7,508.752006-07 7,340.57 676.81 33.16 8,050.532007-08 7,058.16 630.32 38.20 7,726.692008-09 7,071.35 648.34 49.73 7,769.422009-10 6,851.13 652.80 41.04 7,544.972010-11 6,941.82 663.93 43.98 7,649.732011-12 6,921.52 624.46 46.11 7,592.092012-13 6,810.79 535.32 46.47 7,392.582013-14 6,610.56 499.83 47.89 7,158.292014-15 6,379.64 507.49 49.96 6,937.092015-16 6,305.13 508.36 52.47 6,865.962016-17 5,938.18 483.97 51.05 6,473.202017-18 5,891.94 466.79 53.16 6,411.892018-19 5,949.80 426.54 52.97 6,429.31
Notes: These data should be read in conjunction with the explanatory notes.
Figure(s) may be incomplete for any period due to some unavailable turnover figures that are used to derive these numbers.
Value ($)
GAMING RACING SPORTSBETTING TOTAL GAMBLING
Australian Gambling Statistics, 1993–94 to 2018–19, 36th edition
239

TABLE SA 49SOUTH AUSTRALIA
REAL PER CAPITA GAMBLING TURNOVER
1993-94 1,425.32 1,240.25 - 2,665.571994-95 3,457.23 1,145.57 5.24 4,608.051995-96 5,100.19 995.43 5.72 6,101.351996-97 5,498.73 1,005.31 5.89 6,509.931997-98 5,926.62 1,087.86 7.70 7,022.181998-99 6,492.63 1,094.85 7.52 7,595.001999-00 6,866.83 1,067.29 8.06 7,942.182000-01 7,170.30 1,050.67 8.46 8,229.432001-02 7,737.43 1,051.49 9.70 8,798.622002-03 8,278.77 973.53 28.05 9,280.342003-04 8,911.24 973.25 27.51 9,912.002004-05 9,175.99 1,032.82 28.64 10,237.452005-06 9,229.11 882.06 39.88 10,151.052006-07 9,638.19 888.65 43.54 10,570.382007-08 8,968.11 800.89 48.54 9,817.542008-09 8,713.18 798.87 61.28 9,573.342009-10 8,245.93 785.70 49.39 9,081.022010-11 8,107.08 775.37 51.36 8,933.822011-12 7,897.45 712.51 52.61 8,662.572012-13 7,596.39 597.07 51.83 8,245.292013-14 7,183.48 543.15 52.04 7,778.672014-15 6,815.70 542.17 53.38 7,411.252015-16 6,642.80 535.58 55.28 7,233.662016-17 6,148.33 501.10 52.86 6,702.292017-18 5,986.38 474.27 54.01 6,514.662018-19 5,949.80 426.54 52.97 6,429.31
Notes: These data should be read in conjunction with the explanatory notes.
Figure(s) may be incomplete for any period due to some unavailable turnover figures that are used to derive these numbers.
Value ($)
GAMING RACING SPORTSBETTING TOTAL GAMBLING
Australian Gambling Statistics, 1993–94 to 2018–19, 36th edition
240

TABLE SA 50SOUTH AUSTRALIA
TOTAL GAMBLING EXPENDITURE
1993-94 206.824 97.930 - 304.7551994-95 353.976 95.960 0.508 450.4441995-96 480.212 89.999 0.547 570.7581996-97 518.934 94.502 0.529 613.9651997-98 559.834 103.531 0.773 664.1381998-99 611.901 106.737 0.708 719.3461999-00 660.464 106.555 0.767 767.7862000-01 727.479 110.023 0.671 838.1732001-02 802.202 99.093 0.081 901.3762002-03 878.138 101.973 1.589 981.7002003-04 943.294 106.978 2.681 1,052.9532004-05 970.758 114.351 1.977 1,087.0862005-06 989.125 105.942 2.912 1,097.9792006-07 1,036.414 111.654 3.940 1,152.0082007-08 1,001.236 97.040 4.177 1,102.4532008-09 1,012.626 115.636 5.490 1,133.7522009-10 997.847 135.372 7.613 1,140.8322010-11 1,009.304 127.901 7.907 1,145.1122011-12 1,024.759 129.967 8.954 1,163.6802012-13 1,023.466 99.649 9.576 1,132.6912013-14 1,020.499 113.123 10.135 1,143.7572014-15 1,018.456 112.352 9.680 1,140.4882015-16 1,046.119 110.513 7.717 1,164.3492016-17 959.430 109.303 8.619 1,077.3522017-18 1,009.732 106.842 9.692 1,126.2652018-19 981.094 101.901 8.248 1,091.243
Notes: These data should be read in conjunction with the explanatory notes.
Figure(s) may be incomplete for any period due to some unavailable expenditure figures that are used to derive these numbers.
Value ($ million)
GAMING RACING SPORTSBETTING TOTAL GAMBLING
Australian Gambling Statistics, 1993–94 to 2018–19, 36th edition
241

TABLE SA 51SOUTH AUSTRALIA
REAL GAMBLING EXPENDITURE
1993-94 384.343 181.985 - 566.3281994-95 637.045 172.698 0.914 810.6571995-96 828.929 155.354 0.944 985.2271996-97 883.737 160.935 0.901 1,045.5731997-98 953.389 176.312 1.316 1,131.0171998-99 1,029.763 179.627 1.191 1,210.5811999-00 1,085.864 175.186 1.261 1,262.3112000-01 1,127.790 170.566 1.040 1,299.3962001-02 1,209.131 149.359 0.122 1,358.6132002-03 1,284.558 149.168 2.324 1,436.0512003-04 1,347.057 152.768 3.829 1,503.6542004-05 1,354.077 159.504 2.758 1,516.3392005-06 1,337.194 143.223 3.937 1,484.3532006-07 1,360.815 146.602 5.173 1,512.5902007-08 1,272.172 123.299 5.307 1,400.7782008-09 1,247.739 142.485 6.765 1,396.9882009-10 1,200.995 162.932 9.163 1,373.0902010-11 1,178.727 149.371 9.234 1,337.3312011-12 1,169.250 148.292 10.217 1,327.7592012-13 1,141.520 111.143 10.681 1,263.3442013-14 1,108.942 122.927 11.013 1,242.8822014-15 1,088.070 120.031 10.342 1,218.4432015-16 1,102.144 116.432 8.130 1,226.7062016-17 993.384 113.172 8.924 1,115.4802017-18 1,025.916 108.554 9.847 1,144.3182018-19 981.094 101.901 8.248 1,091.243
Notes: These data should be read in conjunction with the explanatory notes.
Figure(s) may be incomplete for any period due to some unavailable expenditure figures that are used to derive these numbers.
Value ($ million)
GAMING RACING SPORTSBETTING TOTAL GAMBLING
Australian Gambling Statistics, 1993–94 to 2018–19, 36th edition
242

TABLE SA 52SOUTH AUSTRALIA
PER CAPITA GAMBLING EXPENDITURE
1993-94 187.67 88.86 - 276.531994-95 319.91 86.73 0.46 407.101995-96 432.54 81.07 0.49 514.101996-97 465.05 84.69 0.47 550.211997-98 498.29 92.15 0.69 591.121998-99 540.77 94.33 0.63 635.721999-00 579.59 93.51 0.67 673.772000-01 633.98 95.88 0.58 730.452001-02 693.81 85.70 0.07 779.582002-03 752.91 87.43 1.36 841.702003-04 801.78 90.93 2.28 894.992004-05 817.71 96.32 1.67 915.692005-06 824.55 88.31 2.43 915.292006-07 853.52 91.95 3.24 948.712007-08 813.65 78.86 3.39 895.902008-09 811.32 92.65 4.40 908.372009-10 788.22 106.93 6.01 901.172010-11 788.18 99.88 6.17 894.242011-12 792.18 100.47 6.92 899.572012-13 783.08 76.24 7.33 866.652013-14 773.22 85.71 7.68 866.612014-15 764.64 84.35 7.27 856.252015-16 779.26 82.32 5.75 867.332016-17 709.42 80.82 6.37 796.612017-18 740.44 78.35 7.11 825.902018-19 712.76 74.03 5.99 792.78
Notes: These data should be read in conjunction with the explanatory notes.
Figure(s) may be incomplete for any period due to some unavailable expenditure figures that are used to derive these numbers.
Value ($)
GAMING RACING SPORTSBETTING TOTAL GAMBLING
Australian Gambling Statistics, 1993–94 to 2018–19, 36th edition
243

TABLE SA 53SOUTH AUSTRALIA
REAL PER CAPITA GAMBLING EXPENDITURE
1993-94 348.74 165.13 - 513.871994-95 575.75 156.08 0.83 732.651995-96 746.65 139.93 0.85 887.431996-97 791.97 144.22 0.81 937.011997-98 848.57 156.93 1.17 1,006.671998-99 910.05 158.74 1.05 1,069.851999-00 952.90 153.73 1.11 1,107.742000-01 982.85 148.64 0.91 1,132.402001-02 1,045.75 129.18 0.11 1,175.042002-03 1,101.37 127.90 1.99 1,231.262003-04 1,144.98 129.85 3.25 1,278.082004-05 1,140.59 134.36 2.32 1,277.272005-06 1,114.70 119.39 3.28 1,237.382006-07 1,120.67 120.73 4.26 1,245.662007-08 1,033.82 100.20 4.31 1,138.342008-09 999.70 114.16 5.42 1,119.282009-10 948.69 128.70 7.24 1,084.632010-11 920.49 116.65 7.21 1,044.352011-12 903.88 114.64 7.90 1,026.412012-13 873.41 85.04 8.17 966.622013-14 840.23 93.14 8.34 941.722014-15 816.90 90.12 7.76 914.782015-16 821.00 86.73 6.06 913.782016-17 734.52 83.68 6.60 824.802017-18 752.31 79.60 7.22 839.142018-19 712.76 74.03 5.99 792.78
Notes: These data should be read in conjunction with the explanatory notes.
Figure(s) may be incomplete for any period due to some unavailable expenditure figures that are used to derive these numbers.
Value ($)
GAMING RACING SPORTSBETTING TOTAL GAMBLING
Australian Gambling Statistics, 1993–94 to 2018–19, 36th edition
244

TABLE SA 54SOUTH AUSTRALIA
GAMBLING EXPENDITUREAS A % OF HDI
1993-94 0.843 0.399 - 1.2421994-95 1.397 0.379 0.002 1.7771995-96 1.791 0.336 0.002 2.1291996-97 1.877 0.342 0.002 2.2201997-98 1.945 0.360 0.003 2.3071998-99 2.123 0.370 0.002 2.4961999-00 2.171 0.350 0.003 2.5232000-01 2.190 0.331 0.002 2.5232001-02 2.181 0.269 0.000 2.4512002-03 2.335 0.271 0.004 2.6102003-04 2.324 0.264 0.007 2.5952004-05 2.287 0.269 0.005 2.5612005-06 2.240 0.240 0.007 2.4862006-07 2.152 0.232 0.008 2.3922007-08 1.900 0.184 0.008 2.0922008-09 1.717 0.196 0.009 1.9232009-10 1.640 0.222 0.013 1.8752010-11 1.555 0.197 0.012 1.7642011-12 1.536 0.195 0.013 1.7442012-13 1.513 0.147 0.014 1.6752013-14 1.473 0.163 0.015 1.6512014-15 1.341 0.148 0.013 1.5022015-16 1.329 0.140 0.010 1.4802016-17 1.184 0.135 0.011 1.3292017-18 1.212 0.128 0.012 1.3522018-19 1.156 0.120 0.010 1.286
Notes: These data should be read in conjunction with the explanatory notes.
Figure(s) may be incomplete for any period due to some unavailable expenditure figures that are used to derive these numbers.
RACING SPORTSBETTING TOTAL GAMBLING
Percentage (%)
GAMING
Australian Gambling Statistics, 1993–94 to 2018–19, 36th edition
245

TABLE SA 55SOUTH AUSTRALIA
GAMBLING EXPENDITUREAS A % OF TOTAL GAMBLING EXPENDITURE
1993-94 67.87 32.13 -1994-95 78.58 21.30 0.111995-96 84.14 15.77 0.101996-97 84.52 15.39 0.091997-98 84.29 15.59 0.121998-99 85.06 14.84 0.101999-00 86.02 13.88 0.102000-01 86.79 13.13 0.082001-02 89.00 10.99 0.012002-03 89.45 10.39 0.162003-04 89.59 10.16 0.252004-05 89.30 10.52 0.182005-06 90.09 9.65 0.272006-07 89.97 9.69 0.342007-08 90.82 8.80 0.382008-09 89.32 10.20 0.482009-10 87.47 11.87 0.672010-11 88.14 11.17 0.692011-12 88.06 11.17 0.772012-13 90.36 8.80 0.852013-14 89.22 9.89 0.892014-15 89.30 9.85 0.852015-16 89.85 9.49 0.662016-17 89.05 10.15 0.802017-18 89.65 9.49 0.862018-19 89.91 9.34 0.76
Notes: These data should be read in conjunction with the explanatory notes.
Figure(s) may be incomplete for any period due to some unavailable expenditure figures that are used to derive these numbers.
Percentage (%)
GAMING RACING SPORTSBETTING
Australian Gambling Statistics, 1993–94 to 2018–19, 36th edition
246
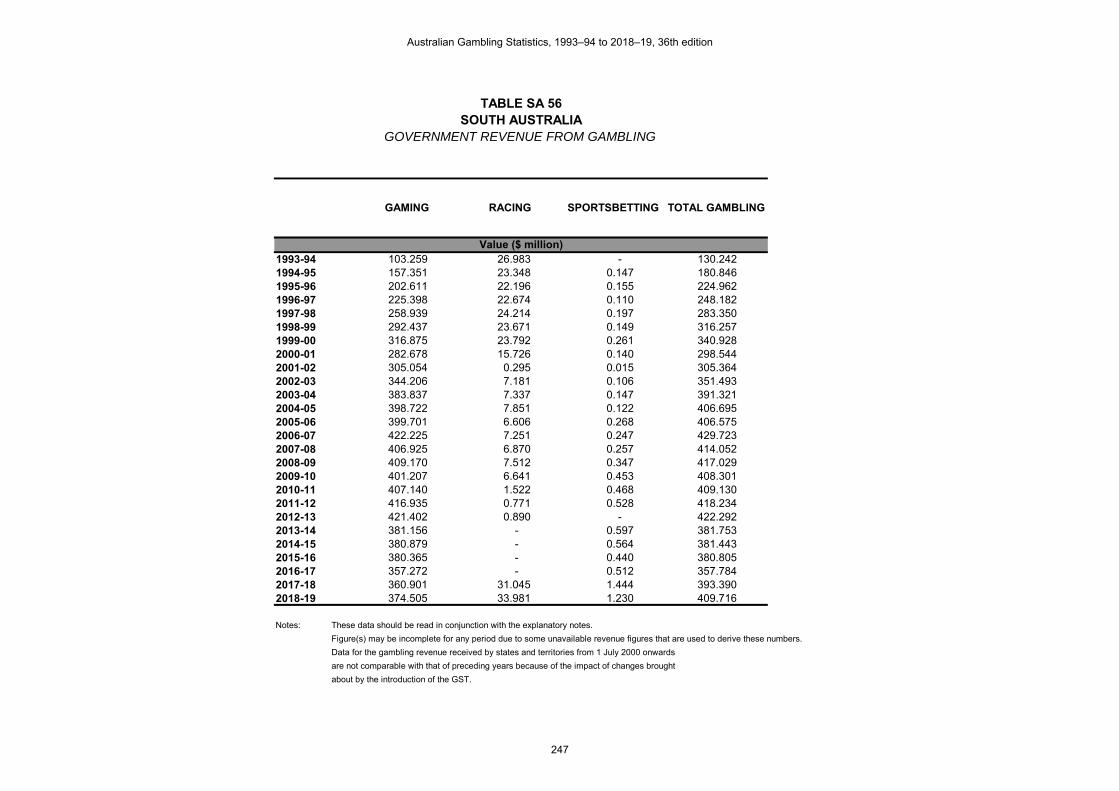
TABLE SA 56SOUTH AUSTRALIA
GOVERNMENT REVENUE FROM GAMBLING
1993-94 103.259 26.983 - 130.2421994-95 157.351 23.348 0.147 180.8461995-96 202.611 22.196 0.155 224.9621996-97 225.398 22.674 0.110 248.1821997-98 258.939 24.214 0.197 283.3501998-99 292.437 23.671 0.149 316.2571999-00 316.875 23.792 0.261 340.9282000-01 282.678 15.726 0.140 298.5442001-02 305.054 0.295 0.015 305.3642002-03 344.206 7.181 0.106 351.4932003-04 383.837 7.337 0.147 391.3212004-05 398.722 7.851 0.122 406.6952005-06 399.701 6.606 0.268 406.5752006-07 422.225 7.251 0.247 429.7232007-08 406.925 6.870 0.257 414.0522008-09 409.170 7.512 0.347 417.0292009-10 401.207 6.641 0.453 408.3012010-11 407.140 1.522 0.468 409.1302011-12 416.935 0.771 0.528 418.2342012-13 421.402 0.890 - 422.2922013-14 381.156 - 0.597 381.7532014-15 380.879 - 0.564 381.4432015-16 380.365 - 0.440 380.8052016-17 357.272 - 0.512 357.7842017-18 360.901 31.045 1.444 393.3902018-19 374.505 33.981 1.230 409.716
Notes: These data should be read in conjunction with the explanatory notes.
Figure(s) may be incomplete for any period due to some unavailable revenue figures that are used to derive these numbers.
Data for the gambling revenue received by states and territories from 1 July 2000 onwards
are not comparable with that of preceding years because of the impact of changes brought
about by the introduction of the GST.
Value ($ million)
GAMING RACING SPORTSBETTING TOTAL GAMBLING
Australian Gambling Statistics, 1993–94 to 2018–19, 36th edition
247

TABLE SA 57SOUTH AUSTRALIA
REAL GOVERNMENT REVENUE FROM GAMBLING
1993-94 191.887 50.143 - 242.0301994-95 283.182 42.019 0.265 325.4661995-96 349.742 38.314 0.268 388.3231996-97 383.849 38.613 0.187 422.6501997-98 440.969 41.236 0.335 482.5411998-99 492.140 39.836 0.251 532.2261999-00 520.972 39.116 0.429 560.5172000-01 438.228 24.380 0.217 462.8242001-02 459.797 0.445 0.023 460.2652002-03 503.512 10.505 0.155 514.1712003-04 548.133 10.477 0.210 558.8202004-05 556.164 10.951 0.170 567.2852005-06 540.354 8.931 0.362 549.6472006-07 554.383 9.521 0.324 564.2282007-08 517.039 8.729 0.327 526.0952008-09 504.172 9.256 0.428 513.8552009-10 482.887 7.993 0.545 491.4262010-11 475.483 1.777 0.547 477.8072011-12 475.723 0.880 0.602 477.2052012-13 470.009 0.993 - 471.0022013-14 414.190 - 0.649 414.8382014-15 406.913 - 0.603 407.5152015-16 400.735 - 0.464 401.1992016-17 369.916 - 0.530 370.4462017-18 366.686 31.543 1.467 399.6952018-19 374.505 33.981 1.230 409.716
Notes: These data should be read in conjunction with the explanatory notes.
Figure(s) may be incomplete for any period due to some unavailable revenue figures that are used to derive these numbers.
Data for the gambling revenue received by states and territories from 1 July 2000 onwards
are not comparable with that of preceding years because of the impact of changes brought
about by the introduction of the GST.
Value ($ million)
GAMING RACING SPORTSBETTING TOTAL GAMBLING
Australian Gambling Statistics, 1993–94 to 2018–19, 36th edition
248

TABLE SA 58SOUTH AUSTRALIA
PER CAPITA REVENUE FROM GAMBLING
1993-94 93.69 24.48 - 118.181994-95 142.21 21.10 0.13 163.441995-96 182.50 19.99 0.14 202.631996-97 201.99 20.32 0.10 222.411997-98 230.47 21.55 0.18 252.201998-99 258.44 20.92 0.13 279.491999-00 278.07 20.88 0.23 299.182000-01 246.35 13.70 0.12 260.182001-02 263.84 0.26 0.01 264.102002-03 295.12 6.16 0.09 301.372003-04 326.26 6.24 0.12 332.622004-05 335.86 6.61 0.10 342.572005-06 333.20 5.51 0.22 338.932006-07 347.71 5.97 0.20 353.892007-08 330.69 5.58 0.21 336.482008-09 327.83 6.02 0.28 334.132009-10 316.92 5.25 0.36 322.532010-11 317.94 1.19 0.37 319.502011-12 322.31 0.60 0.41 323.312012-13 322.43 0.68 - 323.112013-14 288.80 - 0.45 289.252014-15 285.96 - 0.42 286.382015-16 283.34 - 0.33 283.662016-17 264.17 - 0.38 264.552017-18 264.65 22.77 1.06 288.482018-19 272.07 24.69 0.89 297.65
Notes: These data should be read in conjunction with the explanatory notes.
Figure(s) may be incomplete for any period due to some unavailable revenue figures that are used to derive these numbers.
Data for the gambling revenue received by states and territories from 1 July 2000 onwards
are not comparable with that of preceding years because of the impact of changes brought
about by the introduction of the GST.
Value ($)
GAMING RACING SPORTSBETTING TOTAL GAMBLING
Australian Gambling Statistics, 1993–94 to 2018–19, 36th edition
249

TABLE SA 59SOUTH AUSTRALIA
REAL PER CAPITA REVENUE FROM GAMBLING
1993-94 174.11 45.50 - 219.611994-95 255.93 37.98 0.24 294.151995-96 315.02 34.51 0.24 349.781996-97 343.99 34.60 0.17 378.761997-98 392.49 36.70 0.30 429.491998-99 434.93 35.20 0.22 470.351999-00 457.18 34.33 0.38 491.882000-01 381.91 21.25 0.19 403.342001-02 397.67 0.38 0.02 398.072002-03 431.71 9.01 0.13 440.842003-04 465.90 8.91 0.18 474.992004-05 468.48 9.22 0.14 477.842005-06 450.45 7.44 0.30 458.192006-07 456.55 7.84 0.27 464.662007-08 420.17 7.09 0.27 427.532008-09 403.95 7.42 0.34 411.712009-10 381.44 6.31 0.43 388.192010-11 371.31 1.39 0.43 373.132011-12 367.75 0.68 0.47 368.902012-13 359.62 0.76 - 360.382013-14 313.83 - 0.49 314.322014-15 305.50 - 0.45 305.952015-16 298.51 - 0.35 298.862016-17 273.52 - 0.39 273.912017-18 268.89 23.13 1.08 293.102018-19 272.07 24.69 0.89 297.65
Notes: These data should be read in conjunction with the explanatory notes.
Figure(s) may be incomplete for any period due to some unavailable revenue figures that are used to derive these numbers.
Data for the gambling revenue received by states and territories from 1 July 2000 onwards
are not comparable with that of preceding years because of the impact of changes brought
about by the introduction of the GST.
Value ($)
GAMING RACING SPORTSBETTING TOTAL GAMBLING
Australian Gambling Statistics, 1993–94 to 2018–19, 36th edition
250

TABLE SA 60SOUTH AUSTRALIA
GOVERNMENT REVENUE FROM GAMBLINGAS A % OF TOTAL GAMBLING REVENUE
1993-94 79.28 20.72 -1994-95 87.01 12.91 0.081995-96 90.06 9.87 0.071996-97 90.82 9.14 0.041997-98 91.38 8.55 0.071998-99 92.47 7.48 0.051999-00 92.94 6.98 0.082000-01 94.69 5.27 0.052001-02 99.90 0.10 0.002002-03 97.93 2.04 0.032003-04 98.09 1.87 0.042004-05 98.04 1.93 0.032005-06 98.31 1.62 0.072006-07 98.26 1.69 0.062007-08 98.28 1.66 0.062008-09 98.12 1.80 0.082009-10 98.26 1.63 0.112010-11 99.51 0.37 0.112011-12 99.69 0.18 0.132012-13 99.79 0.21 -2013-14 99.84 - 0.162014-15 99.85 - 0.152015-16 99.88 - 0.122016-17 99.86 - 0.142017-18 91.74 7.89 0.372018-19 91.41 8.29 0.30
Notes: These data should be read in conjunction with the explanatory notes.
Figure(s) may be incomplete for any period due to some unavailable revenue figures that are used to derive these numbers.
Data for the gambling revenue received by states and territories from 1 July 2000 onwards
are not comparable with that of preceding years because of the impact of changes brought
about by the introduction of the GST.
Percentage (%)
GAMING RACING SPORTSBETTING
Australian Gambling Statistics, 1993–94 to 2018–19, 36th edition
251

TABLE SA 61SOUTH AUSTRALIA
GAMING MACHINES OPERATING AS AT 30 JUNE
2001-02 828 1,684 12,918 15,430 2002-03 899 1,757 13,084 15,740 2003-04 825 1,724 13,075 15,624 2004-05 939 1,699 12,363 15,001 2005-06 983 1,595 11,003 13,581 2006-07 979 1,603 10,978 13,560 2007-08 947 1,574 11,108 13,629 2008-09 983 1,558 11,179 13,720 2009-10 960 1,993 10,751 13,704 2010-11 985 1,962 10,764 13,711 2011-12 970 1,944 10,744 13,658 2012-13 974 1,901 10,712 13,587 2013-14 849 1,868 10,693 13,410 2014-15 917 1,813 10,564 13,294 2015-16 936 1,812 10,525 13,273 2016-17 898 1,789 10,421 13,108 2017-18 832 1,773 10,369 12,974 2018-19 834 1,223 10,907 12,964
Notes: These data should be read in conjunction with the explanatory notes.
NUMBER
CASINOS CLUBS HOTELS TOTAL MACHINES
Australian Gambling Statistics, 1993–94 to 2018–19, 36th edition
252

TABLE WA 1WESTERN AUSTRALIA
TOTAL RACING TURNOVER
1993-94 - 154.338 59.463 583.869 797.6701994-95 - 176.471 61.350 619.472 857.2931995-96 - 198.217 67.177 658.249 923.6431996-97 - 178.937 65.690 676.719 921.3461997-98 - 182.708 70.420 733.455 986.5831998-99 - 188.411 69.366 779.194 1,036.9711999-00 - 170.037 64.934 813.080 1,048.0512000-01 - 147.977 65.249 846.171 1,059.3972001-02 - 110.755 67.136 886.898 1,064.7892002-03 - 107.683 66.567 961.381 1,135.6312003-04 - 110.655 66.707 1,030.888 1,208.2502004-05 - 114.717 69.699 1,168.319 1,352.7352005-06 - 101.344 75.283 1,267.357 1,443.9842006-07 - 91.993 83.976 1,418.427 1,594.3962007-08 - 95.399 84.685 1,443.191 1,623.2752008-09 - 92.317 85.330 1,513.450 1,691.0972009-10 - 37.099 72.286 1,435.045 1,544.4302010-11 - 64.620 77.660 1,572.348 1,714.6282011-12 - 52.098 82.761 1,754.816 1,889.6752012-13 - 41.880 70.825 1,811.016 1,923.7212013-14 - 33.090 56.066 1,731.250 1,820.4062014-15 - 29.495 42.321 1,576.779 1,648.5952015-16 - 24.341 32.064 1,472.862 1,529.2672016-17 - 19.908 27.226 1,828.527 R 1,875.661 R
2017-18 - 17.501 24.339 1,873.469 R 1,915.309 R
2018-19 - 12.960 20.342 1,817.246 1,850.548
Notes: These data should be read in conjunction with the explanatory notes.
NA = Not applicable
R = Revised data
TOTAL RACING
Value ($ million)
BOOKMAKERS OFF COURSE
(NA)
BOOKMAKERS ON COURSE
ON-COURSE TOTALISATOR
TAB
Australian Gambling Statistics, 1993–94 to 2018–19, 36th edition
253

TABLE WA 2WESTERN AUSTRALIA
REAL RACING TURNOVER
1993-94 - 286.807 110.500 1,085.007 1,482.3151994-95 - 317.592 110.411 1,114.854 1,542.8571995-96 - 342.157 115.959 1,136.251 1,594.3671996-97 - 304.727 111.869 1,152.442 1,569.0381997-98 - 311.149 119.924 1,249.063 1,680.1361998-99 - 317.075 116.735 1,311.298 1,745.1091999-00 - 279.557 106.757 1,336.779 1,723.0922000-01 - 229.405 101.154 1,311.795 1,642.3532001-02 - 166.937 101.192 1,336.791 1,604.9202002-03 - 157.521 97.376 1,406.328 1,661.2242003-04 - 158.019 95.260 1,472.144 1,725.4232004-05 - 160.015 97.221 1,629.648 1,886.8832005-06 - 137.007 101.775 1,713.335 1,952.1162006-07 - 120.787 110.261 1,862.400 2,093.4472007-08 - 121.214 107.601 1,833.720 2,062.5352008-09 - 113.751 105.142 1,864.845 2,083.7392009-10 - 44.652 87.002 1,727.201 1,858.8552010-11 - 75.467 90.696 1,836.284 2,002.4472011-12 - 59.444 94.430 2,002.245 2,156.1192012-13 - 46.711 78.994 2,019.911 2,145.6162013-14 - 35.958 60.925 1,881.292 1,978.1752014-15 - 31.511 45.214 1,684.555 1,761.2802015-16 - 25.645 33.781 1,551.741 1,611.1672016-17 - 20.613 28.190 1,893.239 R 1,942.041 R
2017-18 - 17.782 24.729 1,903.498 R 1,946.009 R
2018-19 - 12.960 20.342 1,817.246 1,850.548
Notes: These data should be read in conjunction with the explanatory notes.
NA = Not applicable
R = Revised data
TOTAL RACING
Value ($ million)
BOOKMAKERS OFF COURSE
(NA)
BOOKMAKERS ON COURSE
ON-COURSE TOTALISATOR
TAB
Australian Gambling Statistics, 1993–94 to 2018–19, 36th edition
254
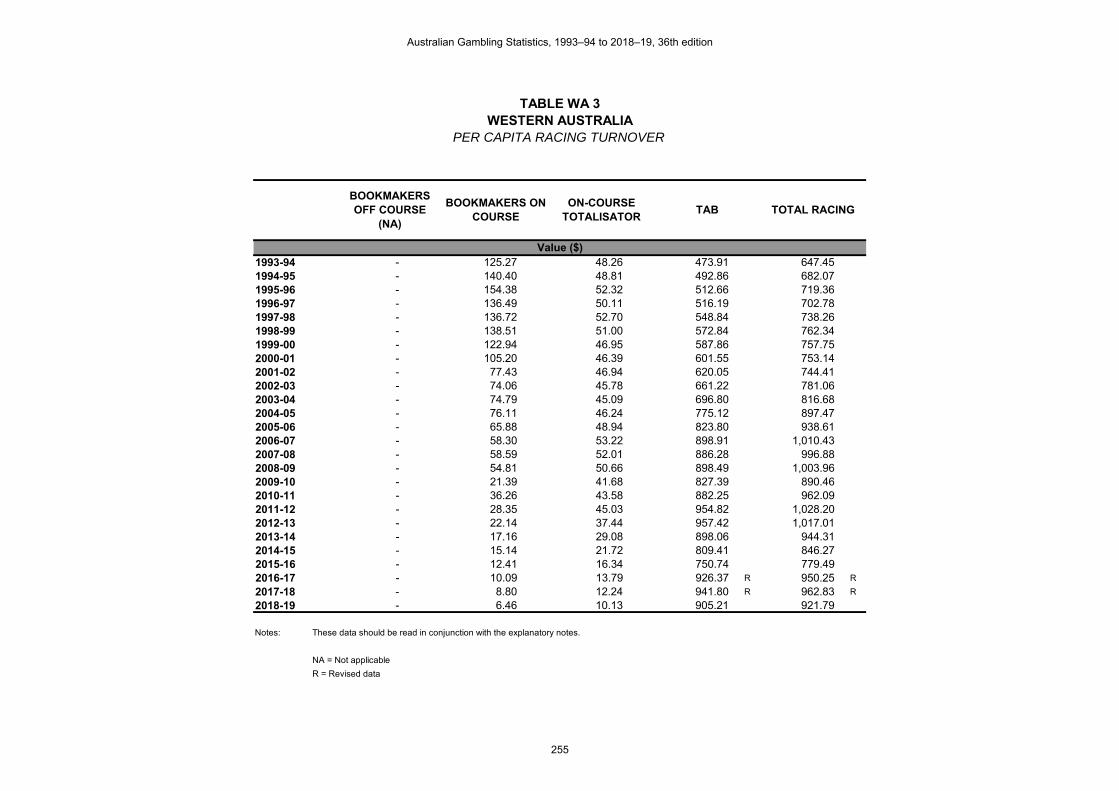
TABLE WA 3WESTERN AUSTRALIA
PER CAPITA RACING TURNOVER
1993-94 - 125.27 48.26 473.91 647.451994-95 - 140.40 48.81 492.86 682.071995-96 - 154.38 52.32 512.66 719.361996-97 - 136.49 50.11 516.19 702.781997-98 - 136.72 52.70 548.84 738.261998-99 - 138.51 51.00 572.84 762.341999-00 - 122.94 46.95 587.86 757.752000-01 - 105.20 46.39 601.55 753.142001-02 - 77.43 46.94 620.05 744.412002-03 - 74.06 45.78 661.22 781.062003-04 - 74.79 45.09 696.80 816.682004-05 - 76.11 46.24 775.12 897.472005-06 - 65.88 48.94 823.80 938.612006-07 - 58.30 53.22 898.91 1,010.432007-08 - 58.59 52.01 886.28 996.882008-09 - 54.81 50.66 898.49 1,003.962009-10 - 21.39 41.68 827.39 890.462010-11 - 36.26 43.58 882.25 962.092011-12 - 28.35 45.03 954.82 1,028.202012-13 - 22.14 37.44 957.42 1,017.012013-14 - 17.16 29.08 898.06 944.312014-15 - 15.14 21.72 809.41 846.272015-16 - 12.41 16.34 750.74 779.492016-17 - 10.09 13.79 926.37 R 950.25 R
2017-18 - 8.80 12.24 941.80 R 962.83 R
2018-19 - 6.46 10.13 905.21 921.79
Notes: These data should be read in conjunction with the explanatory notes.
NA = Not applicable
R = Revised data
TOTAL RACING
Value ($)
BOOKMAKERS OFF COURSE
(NA)
BOOKMAKERS ON COURSE
ON-COURSE TOTALISATOR
TAB
Australian Gambling Statistics, 1993–94 to 2018–19, 36th edition
255

TABLE WA 4WESTERN AUSTRALIA
REAL PER CAPITA RACING TURNOVER
1993-94 - 232.80 89.69 880.68 1,203.171994-95 - 252.68 87.84 886.99 1,227.511995-96 - 266.48 90.31 884.94 1,241.741996-97 - 232.44 85.33 879.06 1,196.831997-98 - 232.83 89.74 934.67 1,257.241998-99 - 233.10 85.82 964.02 1,282.941999-00 - 202.12 77.19 966.50 1,245.812000-01 - 163.09 71.91 932.57 1,167.572001-02 - 116.71 70.75 934.58 1,122.032002-03 - 108.34 66.97 967.24 1,142.552003-04 - 106.81 64.39 995.06 1,166.252004-05 - 106.16 64.50 1,081.19 1,251.862005-06 - 89.06 66.16 1,113.69 1,268.912006-07 - 76.55 69.88 1,180.27 1,326.692007-08 - 74.44 66.08 1,126.11 1,266.632008-09 - 67.53 62.42 1,107.10 1,237.052009-10 - 25.74 50.16 995.84 1,071.752010-11 - 42.35 50.89 1,030.35 1,123.582011-12 - 32.34 51.38 1,089.45 1,173.182012-13 - 24.69 41.76 1,067.86 1,134.312013-14 - 18.65 31.60 975.89 1,026.152014-15 - 16.18 23.21 864.73 904.122015-16 - 13.07 17.22 790.95 821.242016-17 - 10.44 14.28 959.16 R 983.88 R
2017-18 - 8.94 12.43 956.90 R 978.27 R
2018-19 - 6.46 10.13 905.21 921.79
Notes: These data should be read in conjunction with the explanatory notes.
NA = Not applicable
R = Revised data
TOTAL RACING
Value ($)
BOOKMAKERS OFF COURSE
(NA)
BOOKMAKERS ON COURSE
ON-COURSE TOTALISATOR
TAB
Australian Gambling Statistics, 1993–94 to 2018–19, 36th edition
256

TABLE WA 5WESTERN AUSTRALIA
TOTAL RACING EXPENDITURE
1993-94 - 8.498 10.363 105.277 124.1381994-95 - 9.716 10.669 107.635 128.0201995-96 - 10.911 11.667 114.210 136.7881996-97 - 8.948 11.400 117.357 137.7051997-98 - 9.135 12.112 126.177 147.4241998-99 - 9.421 11.931 133.780 155.1321999-00 - 8.502 11.117 139.867 159.4862000-01 - 7.399 11.197 145.172 163.7682001-02 - 5.538 11.534 152.407 169.4792002-03 - 5.384 11.416 164.914 181.7142003-04 - 5.533 11.440 177.307 194.2802004-05 - 7.019 11.988 201.156 220.1632005-06 - 5.070 12.948 218.375 236.3932006-07 - 4.600 14.401 240.313 259.3142007-08 - 4.770 14.524 249.212 268.5062008-09 - 4.616 14.634 257.622 276.8722009-10 - 1.855 12.397 238.394 252.6462010-11 - 3.231 13.319 258.854 275.4042011-12 - 2.605 14.935 285.867 303.4072012-13 - 2.094 12.146 300.835 315.0752013-14 - 1.654 9.615 290.777 302.0462014-15 - 1.475 7.258 272.869 281.6022015-16 - 1.217 5.499 257.744 264.4602016-17 - 0.995 4.669 314.057 R 319.721 R
2017-18 - 0.875 4.174 316.138 R 321.187 R
2018-19 - 0.648 3.489 306.107 310.244
Notes: These data should be read in conjunction with the explanatory notes.
NA = Not applicable
R = Revised data
TOTAL RACING
Value ($ million)
BOOKMAKERS OFF COURSE
(NA)
BOOKMAKERS ON COURSE
ON-COURSE TOTALISATOR
TAB
Australian Gambling Statistics, 1993–94 to 2018–19, 36th edition
257

TABLE WA 6WESTERN AUSTRALIA
REAL RACING EXPENDITURE
1993-94 - 15.792 19.258 195.637 230.6861994-95 - 17.486 19.201 193.709 230.3961995-96 - 18.834 20.139 197.146 236.1201996-97 - 15.238 19.414 199.857 234.5101997-98 - 15.557 20.627 214.878 251.0611998-99 - 15.855 20.079 225.137 261.0701999-00 - 13.978 18.277 229.954 262.2102000-01 - 11.470 17.358 225.056 253.8852001-02 - 8.347 17.385 229.718 255.4502002-03 - 7.876 16.700 241.240 265.8152003-04 - 7.901 16.337 253.201 277.4392004-05 - 9.791 16.722 280.586 307.0982005-06 - 6.854 17.504 295.221 319.5792006-07 - 6.040 18.909 315.532 340.4802007-08 - 6.061 18.454 316.649 341.1642008-09 - 5.688 18.032 317.437 341.1572009-10 - 2.233 14.921 286.928 304.0812010-11 - 3.773 15.555 302.305 321.6342011-12 - 2.972 17.041 326.174 346.1872012-13 - 2.336 13.547 335.535 351.4182013-14 - 1.797 10.448 315.978 328.2232014-15 - 1.576 7.754 291.520 300.8502015-16 - 1.282 5.793 271.547 278.6232016-17 - 1.030 4.834 325.172 R 331.036 R
2017-18 - 0.889 4.241 321.205 R 326.335 R
2018-19 - 0.648 3.489 306.107 310.244
Notes: These data should be read in conjunction with the explanatory notes.
NA = Not applicable
R = Revised data
TOTAL RACING
Value ($ million)
BOOKMAKERS OFF COURSE
(NA)
BOOKMAKERS ON COURSE
ON-COURSE TOTALISATOR
TAB
Australian Gambling Statistics, 1993–94 to 2018–19, 36th edition
258

TABLE WA 7WESTERN AUSTRALIA
PER CAPITA RACING EXPENDITURE
1993-94 - 6.90 8.41 85.45 100.761994-95 - 7.73 8.49 85.64 101.851995-96 - 8.50 9.09 88.95 106.531996-97 - 6.83 8.70 89.52 105.041997-98 - 6.84 9.06 94.42 110.321998-99 - 6.93 8.77 98.35 114.051999-00 - 6.15 8.04 101.12 115.312000-01 - 5.26 7.96 103.20 116.422001-02 - 3.87 8.06 106.55 118.492002-03 - 3.70 7.85 113.42 124.982003-04 - 3.74 7.73 119.85 131.322004-05 - 4.66 7.95 133.46 146.072005-06 - 3.30 8.42 141.95 153.662006-07 - 2.92 9.13 152.29 164.342007-08 - 2.93 8.92 153.04 164.892008-09 - 2.74 8.69 152.94 164.372009-10 - 1.07 7.15 137.45 145.672010-11 - 1.81 7.47 145.24 154.532011-12 - 1.42 8.13 155.54 165.092012-13 - 1.11 6.42 159.04 166.572013-14 - 0.86 4.99 150.84 156.682014-15 - 0.76 3.73 140.07 144.552015-16 - 0.62 2.80 131.38 134.802016-17 - 0.50 2.37 159.11 R 161.98 R
2017-18 - 0.44 2.10 158.92 R 161.46 R
2018-19 - 0.32 1.74 152.48 154.54
Notes: These data should be read in conjunction with the explanatory notes.
NA = Not applicable
R = Revised data
TOTAL RACING
Value ($)
BOOKMAKERS OFF COURSE
(NA)
BOOKMAKERS ON COURSE
ON-COURSE TOTALISATOR
TAB
Australian Gambling Statistics, 1993–94 to 2018–19, 36th edition
259

TABLE WA 8WESTERN AUSTRALIA
REAL PER CAPITA RACING EXPENDITURE
1993-94 - 12.82 15.63 158.79 187.241994-95 - 13.91 15.28 154.12 183.301995-96 - 14.67 15.69 153.54 183.901996-97 - 11.62 14.81 152.45 178.881997-98 - 11.64 15.43 160.79 187.871998-99 - 11.66 14.76 165.51 191.931999-00 - 10.11 13.21 166.26 189.582000-01 - 8.15 12.34 159.99 180.492001-02 - 5.84 12.15 160.60 178.592002-03 - 5.42 11.49 165.92 182.822003-04 - 5.34 11.04 171.14 187.532004-05 - 6.50 11.09 186.15 203.742005-06 - 4.46 11.38 191.90 207.732006-07 - 3.83 11.98 199.96 215.772007-08 - 3.72 11.33 194.46 209.512008-09 - 3.38 10.70 188.45 202.532009-10 - 1.29 8.60 165.43 175.322010-11 - 2.12 8.73 169.63 180.472011-12 - 1.62 9.27 177.48 188.372012-13 - 1.23 7.16 177.39 185.782013-14 - 0.93 5.42 163.91 170.262014-15 - 0.81 3.98 149.65 154.442015-16 - 0.65 2.95 138.41 142.022016-17 - 0.52 2.45 164.74 R 167.71 R
2017-18 - 0.45 2.13 161.47 R 164.05 R
2018-19 - 0.32 1.74 152.48 154.54
Notes: These data should be read in conjunction with the explanatory notes.
NA = Not applicable
R = Revised data
TOTAL RACING
Value ($)
BOOKMAKERS OFF COURSE
(NA)
BOOKMAKERS ON COURSE
ON-COURSE TOTALISATOR
TAB
Australian Gambling Statistics, 1993–94 to 2018–19, 36th edition
260

TABLE WA 9WESTERN AUSTRALIARACING EXPENDITURE
AS A % OF HDI
1993-94 - 0.030 0.037 0.376 0.4431994-95 - 0.032 0.035 0.357 0.4251995-96 - 0.034 0.037 0.360 0.4311996-97 - 0.027 0.034 0.351 0.4121997-98 - 0.026 0.035 0.362 0.4231998-99 - 0.026 0.032 0.362 0.4201999-00 - 0.022 0.028 0.358 0.4082000-01 - 0.018 0.027 0.348 0.3932001-02 - 0.012 0.024 0.321 0.3572002-03 - 0.011 0.023 0.334 0.3692003-04 - 0.010 0.021 0.330 0.3612004-05 - 0.012 0.021 0.349 0.3822005-06 - 0.008 0.021 0.358 0.3872006-07 - 0.007 0.021 0.342 0.3702007-08 - 0.006 0.018 0.304 0.3282008-09 - 0.005 0.016 0.280 0.3012009-10 - 0.002 0.013 0.248 0.2632010-11 - 0.003 0.013 0.244 0.2602011-12 - 0.002 0.013 0.244 0.2582012-13 - 0.002 0.010 0.241 0.2522013-14 - 0.001 0.007 0.221 0.2302014-15 - 0.001 0.005 0.198 0.2042015-16 - 0.001 0.004 0.185 0.1902016-17 - 0.001 0.003 0.231 R 0.235 R
2017-18 - 0.001 0.003 0.228 R 0.232 R
2018-19 - 0.000 0.002 0.219 0.222
Notes: These data should be read in conjunction with the explanatory notes.
NA = Not applicable
R = Revised data
Percentage (%)
BOOKMAKERS OFF COURSE
(NA)
BOOKMAKERS ON COURSE
ON-COURSE TOTALISATOR
TAB TOTAL RACING
Australian Gambling Statistics, 1993–94 to 2018–19, 36th edition
261

TABLE WA 10WESTERN AUSTRALIARACING EXPENDITURE
SHARE OF MARKET
1993-94 - 6.85 8.35 84.811994-95 - 7.59 8.33 84.081995-96 - 7.98 8.53 83.491996-97 - 6.50 8.28 85.221997-98 - 6.20 8.22 85.591998-99 - 6.07 7.69 86.241999-00 - 5.33 6.97 87.702000-01 - 4.52 6.84 88.642001-02 - 3.27 6.81 89.932002-03 - 2.96 6.28 90.752003-04 - 2.85 5.89 91.262004-05 - 3.19 5.45 91.372005-06 - 2.14 5.48 92.382006-07 - 1.77 5.55 92.672007-08 - 1.78 5.41 92.812008-09 - 1.67 5.29 93.052009-10 - 0.73 4.91 94.362010-11 - 1.17 4.84 93.992011-12 - 0.86 4.92 94.222012-13 - 0.66 3.85 95.482013-14 - 0.55 3.18 96.272014-15 - 0.52 2.58 96.902015-16 - 0.46 2.08 97.462016-17 - 0.31 1.46 98.23 R
2017-18 - 0.27 1.30 98.43 R
2018-19 - 0.21 1.12 98.67
Notes: These data should be read in conjunction with the explanatory notes.
NA = Not applicable
R = Revised data
ON-COURSE TOTALISATOR
TAB
Percentage (%)
BOOKMAKERS OFF COURSE
(NA)
BOOKMAKERS ON COURSE
Australian Gambling Statistics, 1993–94 to 2018–19, 36th edition
262

TABLE WA 11WESTERN AUSTRALIA
GOVERNMENT REVENUE FROM RACING
1993-94 1.730 2.870 35.032 39.6321994-95 1.990 3.077 37.169 42.2361995-96 2.233 3.354 38.924 44.5111996-97 - (1) - (1) 33.824 33.8241997-98 - - 36.670 36.6701998-99 - - 38.960 38.9601999-00 - - 40.654 40.6542000-01 - - 42.297 42.2972001-02 - - 44.345 44.3452002-03 - - 48.069 48.0692003-04 - - 51.544 51.5442004-05 - - 52.574 52.5742005-06 - - 57.031 57.0312006-07 - - 60.782 60.7822007-08 - - 29.681 29.6812008-09 - - 31.150 31.1502009-10 - - 29.721 29.7212010-11 - - 32.310 32.3102011-12 - - 35.747 35.7472012-13 - - 37.707 37.7072013-14 - - 36.756 36.7562014-15 - - 34.141 34.1412015-16 - - 32.249 32.2492016-17 - - 39.453 R 39.453 R
2017-18 - - 40.627 R 40.627 R
2018-19 - - 40.362 (2) 40.362
Notes: These data should be read in conjunction with the explanatory notes.
Data for the gambling revenue received by states and territories from 1 July 2000 onwards are not comparable
with that of preceding years because of the impact of changes brought about by the introduction of the GST.
(1) Government no longer collects revenue from bookmakers and on-course totalisator.
(2) Includes all government revenue collected between 1 July 2018 to 30 June 2019, but excludes point of consumption tax (POCT) revenue, which was introduced on 1 January 2019.
R = Revised data
Value ($ million)
BOOKMAKERSON-COURSE
TOTALISATORTAB TOTAL RACING
Australian Gambling Statistics, 1993–94 to 2018–19, 36th edition
263

TABLE WA 12WESTERN AUSTRALIA
REAL GOVERNMENT REVENUE FROM RACING
1993-94 3.215 5.333 65.100 73.6481994-95 3.581 5.538 66.892 76.0111995-96 3.855 5.790 67.190 76.8341996-97 - (1) - (1) 57.602 57.6021997-98 - - 62.448 62.4481998-99 - - 65.565 65.5651999-00 - - 66.839 66.8392000-01 - - 65.572 65.5722001-02 - - 66.840 66.8402002-03 - - 70.316 70.3162003-04 - - 73.607 73.6072004-05 - - 73.334 73.3342005-06 - - 77.100 77.1002006-07 - - 79.807 79.8072007-08 - - 37.713 37.7132008-09 - - 38.382 38.3822009-10 - - 35.772 35.7722010-11 - - 37.734 37.7342011-12 - - 40.787 40.7872012-13 - - 42.056 42.0562013-14 - - 39.942 39.9422014-15 - - 36.475 36.4752015-16 - - 33.976 33.9762016-17 - - 40.849 R 40.849 R
2017-18 - - 41.278 R 41.278 R
2018-19 - - 40.362 (2) 40.362
Notes: These data should be read in conjunction with the explanatory notes.
Data for the gambling revenue received by states and territories from 1 July 2000 onwards are not comparable
with that of preceding years because of the impact of changes brought about by the introduction of the GST.
(1) Government no longer collects revenue from bookmakers and on-course totalisator.
(2) Includes all government revenue collected between 1 July 2018 to 30 June 2019, but excludes point of consumption tax (POCT) revenue, which was introduced on 1 January 2019.
R = Revised data
Value ($ million)
BOOKMAKERSON-COURSE
TOTALISATORTAB TOTAL RACING
Australian Gambling Statistics, 1993–94 to 2018–19, 36th edition
264

TABLE WA 13WESTERN AUSTRALIA
PER CAPITA REVENUE FROM RACING
1993-94 1.40 2.33 28.43 32.171994-95 1.58 2.45 29.57 33.601995-96 1.74 2.61 30.32 34.671996-97 - (1) - (1) 25.80 25.801997-98 - - 27.44 27.441998-99 - - 28.64 28.641999-00 - - 29.39 29.392000-01 - - 30.07 30.072001-02 - - 31.00 31.002002-03 - - 33.06 33.062003-04 - - 34.84 34.842004-05 - - 34.88 34.882005-06 - - 37.07 37.072006-07 - - 38.52 38.522007-08 - - 18.23 18.232008-09 - - 18.49 18.492009-10 - - 17.14 17.142010-11 - - 18.13 18.132011-12 - - 19.45 19.452012-13 - - 19.93 19.932013-14 - - 19.07 19.072014-15 - - 17.53 17.532015-16 - - 16.44 16.442016-17 - - 19.99 R 19.99 R
2017-18 - - 20.42 R 20.42 R
2018-19 - - 20.11 (2) 20.11
Notes: These data should be read in conjunction with the explanatory notes.
Data for the gambling revenue received by states and territories from 1 July 2000 onwards are not comparable
with that of preceding years because of the impact of changes brought about by the introduction of the GST.
(1) Government no longer collects revenue from bookmakers and on-course totalisator.
(2) Includes all government revenue collected between 1 July 2018 to 30 June 2019, but excludes point of consumption tax (POCT) revenue, which was introduced on 1 January 2019.
R = Revised data
Value ($)
BOOKMAKERSON-COURSE
TOTALISATORTAB TOTAL RACING
Australian Gambling Statistics, 1993–94 to 2018–19, 36th edition
265

TABLE WA 14WESTERN AUSTRALIA
REAL PER CAPITA REVENUE FROM RACING
1993-94 2.61 4.33 52.84 59.781994-95 2.85 4.41 53.22 60.481995-96 3.00 4.51 52.33 59.841996-97 - (1) - (1) 43.94 43.941997-98 - - 46.73 46.731998-99 - - 48.20 48.201999-00 - - 48.32 48.322000-01 - - 46.62 46.622001-02 - - 46.73 46.732002-03 - - 48.36 48.362003-04 - - 49.75 49.752004-05 - - 48.65 48.652005-06 - - 50.12 50.122006-07 - - 50.58 50.582007-08 - - 23.16 23.162008-09 - - 22.79 22.792009-10 - - 20.62 20.622010-11 - - 21.17 21.172011-12 - - 22.19 22.192012-13 - - 22.23 22.232013-14 - - 20.72 20.722014-15 - - 18.72 18.722015-16 - - 17.32 17.322016-17 - - 20.70 R 20.70 R
2017-18 - - 20.75 R 20.75 R
2018-19 - - 20.11 (2) 20.11
Notes: These data should be read in conjunction with the explanatory notes.
Data for the gambling revenue received by states and territories from 1 July 2000 onwards are not comparable
with that of preceding years because of the impact of changes brought about by the introduction of the GST.
(1) Government no longer collects revenue from bookmakers and on-course totalisator.
(2) Includes all government revenue collected between 1 July 2018 to 30 June 2019, but excludes point of consumption tax (POCT) revenue, which was introduced on 1 January 2019.
R = Revised data
Value ($)
BOOKMAKERSON-COURSE
TOTALISATORTAB TOTAL RACING
Australian Gambling Statistics, 1993–94 to 2018–19, 36th edition
266

TABLE WA 15WESTERN AUSTRALIA
GOVERNMENT REVENUE FROM RACINGAS A % OF TOTAL GAMBLING REVENUE
1993-94 0.93 1.54 18.84 21.311994-95 0.97 1.49 18.04 20.501995-96 0.97 1.46 16.98 19.411996-97 - (1) - (1) 16.49 16.491997-98 - - 16.91 16.911998-99 - - 18.64 18.641999-00 - - 19.43 19.432000-01 - - 19.30 19.302001-02 - - 19.84 19.842002-03 - - 20.84 20.842003-04 - - 20.69 20.692004-05 - - 19.71 19.712005-06 - - 20.13 20.132006-07 - - 18.66 18.662007-08 - - 9.26 9.262008-09 - - 8.71 8.712009-10 - - 8.27 8.272010-11 - - 8.90 8.902011-12 - - 8.93 8.932012-13 - - 8.94 8.942013-14 - - 8.31 8.312014-15 - - 7.83 7.832015-16 - - 8.29 8.292016-17 - - 10.71 R 10.71 R
2017-18 - - 11.20 R 11.20 R
2018-19 - - 10.52 (2) 10.52
Notes: These data should be read in conjunction with the explanatory notes.
Data for the gambling revenue received by states and territories from 1 July 2000 onwards are not comparable
with that of preceding years because of the impact of changes brought about by the introduction of the GST.
(1) Government no longer collects revenue from bookmakers and on-course totalisator.
(2) Includes all government revenue collected between 1 July 2018 to 30 June 2019, but excludes point of consumption tax (POCT) revenue, which was introduced on 1 January 2019.
R = Revised data
ON-COURSE TOTALISATOR
TAB TOTAL RACING
Percentage (%)
BOOKMAKERS
Australian Gambling Statistics, 1993–94 to 2018–19, 36th edition
267

TABLE WA 16WESTERN AUSTRALIA
TOTAL GAMING TURNOVER
1993-94 1,662.219 - 69.510 - - - 240.220 54.238 3.812 2,029.9991994-95 1,993.248 - 71.037 - - - 274.830 56.032 1.808 2,396.9551995-96 2,045.548 - 78.656 - - - 310.357 65.245 2.353 2,502.1591996-97 1,787.300 - 75.170 - - - 306.480 64.520 1.800 2,235.2701997-98 1,708.705 - 74.145 - - - 327.847 60.026 1.585 2,172.3081998-99 1,360.761 - 79.969 - - - 349.373 60.726 1.565 1,852.3941999-00 1,374.095 - 84.063 - - - 359.110 56.540 1.479 1,875.2872000-01 1,338.402 - 72.623 - - - 380.971 53.843 1.641 1,847.4802001-02 1,388.857 - 73.569 - - - 379.748 50.129 1.369 1,893.6722002-03 1,204.476 - 78.635 - - - 410.837 50.683 1.378 1,746.0092003-04 1,358.912 - 81.773 - - - 421.929 51.509 1.306 1,915.4292004-05 1,475.654 - 81.977 - - - 436.586 51.561 1.546 2,047.3242005-06 1,645.321 - 83.430 - - - 461.765 49.290 1.171 2,240.9772006-07 2,157.178 - 97.253 - - - 500.784 49.246 0.959 2,805.4202007-08 2,312.312 - 103.869 - - - 549.285 51.884 0.975 3,018.3252008-09 2,548.195 - 102.377 - - - 620.999 54.010 1.480 (1) 3,327.0622009-10 2,554.741 - 99.552 - - - 600.146 46.337 1.785 3,302.5612010-11 2,571.322 - 98.812 - - - 583.237 56.699 1.295 3,311.3652011-12 2,982.873 - 100.041 - - - 661.209 56.541 1.431 3,802.0952012-13 2,951.508 - 94.956 - - - 724.490 58.521 1.421 3,830.8962013-14 3,443.577 - 96.896 - - - 699.051 62.335 1.077 4,302.9362014-15 3,672.959 - 96.769 - - - 728.242 53.699 1.355 4,553.0242015-16 4,309.088 - 96.158 - - - 792.350 73.886 1.048 5,272.5302016-17 3,501.490 (2) - 96.096 - - - 730.277 79.887 1.201 R 4,408.951 R
2017-18 3,263.388 - 107.002 - - - 746.193 80.490 1.368 4,198.4412018-19 3,276.193 - 111.867 - - - 873.384 74.216 - (3) 4,335.660
Notes: These data should be read in conjunction with the explanatory notes.
(1) Data are for gross sales, from this period on.
(2) Figure includes Hong Kong Dollars program.
(3) Pools was withdrawn from the Australian Lottery Market on 23 June 2018.
NA = Not applicable
R = Revised data
KENO(NA)
Value ($ million)
CASINOGAMING
MACHINES(NA)
INSTANT LOTTERY
(1)
INTERACTIVE GAMING (NA)
LOTTERIES(NA)
LOTTO(1)
MINOR GAMING POOLS TOTAL GAMING
Australian Gambling Statistics, 1993–94 to 2018–19, 36th edition
268
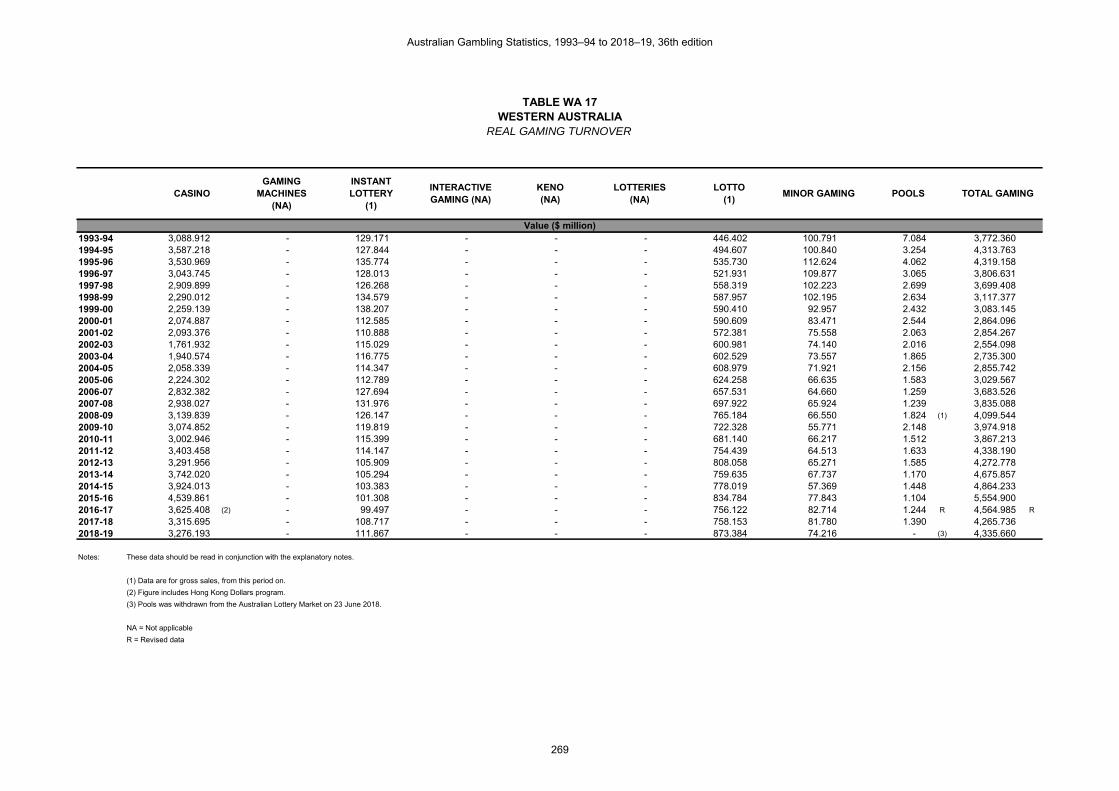
TABLE WA 17WESTERN AUSTRALIA
REAL GAMING TURNOVER
1993-94 3,088.912 - 129.171 - - - 446.402 100.791 7.084 3,772.3601994-95 3,587.218 - 127.844 - - - 494.607 100.840 3.254 4,313.7631995-96 3,530.969 - 135.774 - - - 535.730 112.624 4.062 4,319.1581996-97 3,043.745 - 128.013 - - - 521.931 109.877 3.065 3,806.6311997-98 2,909.899 - 126.268 - - - 558.319 102.223 2.699 3,699.4081998-99 2,290.012 - 134.579 - - - 587.957 102.195 2.634 3,117.3771999-00 2,259.139 - 138.207 - - - 590.410 92.957 2.432 3,083.1452000-01 2,074.887 - 112.585 - - - 590.609 83.471 2.544 2,864.0962001-02 2,093.376 - 110.888 - - - 572.381 75.558 2.063 2,854.2672002-03 1,761.932 - 115.029 - - - 600.981 74.140 2.016 2,554.0982003-04 1,940.574 - 116.775 - - - 602.529 73.557 1.865 2,735.3002004-05 2,058.339 - 114.347 - - - 608.979 71.921 2.156 2,855.7422005-06 2,224.302 - 112.789 - - - 624.258 66.635 1.583 3,029.5672006-07 2,832.382 - 127.694 - - - 657.531 64.660 1.259 3,683.5262007-08 2,938.027 - 131.976 - - - 697.922 65.924 1.239 3,835.0882008-09 3,139.839 - 126.147 - - - 765.184 66.550 1.824 (1) 4,099.5442009-10 3,074.852 - 119.819 - - - 722.328 55.771 2.148 3,974.9182010-11 3,002.946 - 115.399 - - - 681.140 66.217 1.512 3,867.2132011-12 3,403.458 - 114.147 - - - 754.439 64.513 1.633 4,338.1902012-13 3,291.956 - 105.909 - - - 808.058 65.271 1.585 4,272.7782013-14 3,742.020 - 105.294 - - - 759.635 67.737 1.170 4,675.8572014-15 3,924.013 - 103.383 - - - 778.019 57.369 1.448 4,864.2332015-16 4,539.861 - 101.308 - - - 834.784 77.843 1.104 5,554.9002016-17 3,625.408 (2) - 99.497 - - - 756.122 82.714 1.244 R 4,564.985 R
2017-18 3,315.695 - 108.717 - - - 758.153 81.780 1.390 4,265.7362018-19 3,276.193 - 111.867 - - - 873.384 74.216 - (3) 4,335.660
Notes: These data should be read in conjunction with the explanatory notes.
(1) Data are for gross sales, from this period on.
(2) Figure includes Hong Kong Dollars program.
(3) Pools was withdrawn from the Australian Lottery Market on 23 June 2018.
NA = Not applicable
R = Revised data
KENO(NA)
Value ($ million)
CASINOGAMING
MACHINES(NA)
INSTANT LOTTERY
(1)
INTERACTIVE GAMING (NA)
LOTTERIES(NA)
LOTTO(1)
MINOR GAMING POOLS TOTAL GAMING
Australian Gambling Statistics, 1993–94 to 2018–19, 36th edition
269

TABLE WA 18WESTERN AUSTRALIA
PER CAPITA GAMING TURNOVER
1993-94 1,349.19 - 56.42 - - - 194.98 44.02 3.09 1,647.711994-95 1,585.84 - 56.52 - - - 218.66 44.58 1.44 1,907.031995-96 1,593.13 - 61.26 - - - 241.71 50.81 1.83 1,948.751996-97 1,363.31 - 57.34 - - - 233.78 49.21 1.37 1,705.011997-98 1,278.62 - 55.48 - - - 245.33 44.92 1.19 1,625.531998-99 1,000.38 - 58.79 - - - 256.85 44.64 1.15 1,361.811999-00 993.48 - 60.78 - - - 259.64 40.88 1.07 1,355.842000-01 951.49 - 51.63 - - - 270.84 38.28 1.17 1,313.402001-02 970.98 - 51.43 - - - 265.49 35.05 0.96 1,323.902002-03 828.41 - 54.08 - - - 282.56 34.86 0.95 1,200.872003-04 918.52 - 55.27 - - - 285.19 34.82 0.88 1,294.682004-05 979.02 - 54.39 - - - 289.65 34.21 1.03 1,358.302005-06 1,069.49 - 54.23 - - - 300.15 32.04 0.76 1,456.672006-07 1,367.08 - 61.63 - - - 317.36 31.21 0.61 1,777.902007-08 1,420.02 - 63.79 - - - 337.32 31.86 0.60 1,853.602008-09 1,512.79 - 60.78 - - - 368.67 32.06 0.88 (1) 1,975.182009-10 1,472.97 - 57.40 - - - 346.02 26.72 1.03 1,904.142010-11 1,442.78 - 55.44 - - - 327.26 31.81 0.73 1,858.022011-12 1,623.03 - 54.43 - - - 359.77 30.76 0.78 2,068.782012-13 1,560.36 - 50.20 - - - 383.01 30.94 0.75 2,025.262013-14 1,786.31 - 50.26 - - - 362.62 32.34 0.56 2,232.092014-15 1,885.44 - 49.67 - - - 373.83 27.57 0.70 2,337.212015-16 2,196.41 - 49.01 - - - 403.87 37.66 0.53 2,687.492016-17 1,773.93 (2) - 48.68 - - - 369.97 40.47 0.61 R 2,233.67 R
2017-18 1,640.52 - 53.79 - - - 375.11 40.46 0.69 2,110.572018-19 1,631.94 - 55.72 - - - 435.05 36.97 - (3) 2,159.68
Notes: These data should be read in conjunction with the explanatory notes.
(1) Data are for gross sales, from this period on.
(2) Figure includes Hong Kong Dollars program.
(3) Pools was withdrawn from the Australian Lottery Market on 23 June 2018.
NA = Not applicable
R = Revised data
KENO(NA)
Value ($)
CASINOGAMING
MACHINES(NA)
INSTANT LOTTERY
(1)
INTERACTIVE GAMING (NA)
LOTTERIES(NA)
LOTTO(1)
MINOR GAMING POOLS TOTAL GAMING
Australian Gambling Statistics, 1993–94 to 2018–19, 36th edition
270

TABLE WA 19WESTERN AUSTRALIA
REAL PER CAPITA GAMING TURNOVER
1993-94 2,507.21 - 104.85 - - - 362.34 81.81 5.75 3,061.951994-95 2,854.01 - 101.71 - - - 393.51 80.23 2.59 3,432.061995-96 2,750.02 - 105.74 - - - 417.24 87.71 3.16 3,363.881996-97 2,321.70 - 97.65 - - - 398.12 83.81 2.34 2,903.611997-98 2,177.47 - 94.49 - - - 417.79 76.49 2.02 2,768.251998-99 1,683.53 - 98.94 - - - 432.24 75.13 1.94 2,291.781999-00 1,633.37 - 99.92 - - - 426.87 67.21 1.76 2,229.132000-01 1,475.06 - 80.04 - - - 419.87 59.34 1.81 2,036.122001-02 1,463.52 - 77.52 - - - 400.16 52.82 1.44 1,995.472002-03 1,211.82 - 79.11 - - - 413.34 50.99 1.39 1,756.652003-04 1,311.68 - 78.93 - - - 407.26 49.72 1.26 1,848.852004-05 1,365.61 - 75.86 - - - 404.03 47.72 1.43 1,894.652005-06 1,445.83 - 73.31 - - - 405.78 43.31 1.03 1,969.272006-07 1,794.98 - 80.92 - - - 416.70 40.98 0.80 2,334.382007-08 1,804.28 - 81.05 - - - 428.60 40.48 0.76 2,355.182008-09 1,864.03 - 74.89 - - - 454.27 39.51 1.08 (1) 2,433.782009-10 1,772.85 - 69.08 - - - 416.47 32.16 1.24 2,291.792010-11 1,684.97 - 64.75 - - - 382.19 37.15 0.85 2,169.912011-12 1,851.87 - 62.11 - - - 410.50 35.10 0.89 2,360.482012-13 1,740.35 - 55.99 - - - 427.19 34.51 0.84 2,258.872013-14 1,941.12 - 54.62 - - - 394.05 35.14 0.61 2,425.542014-15 2,014.31 - 53.07 - - - 399.38 29.45 0.74 2,496.962015-16 2,314.03 - 51.64 - - - 425.50 39.68 0.56 2,831.412016-17 1,836.71 (2) - 50.41 - - - 383.07 41.90 0.63 R 2,312.72 R
2017-18 1,666.81 - 54.65 - - - 381.13 41.11 0.70 2,144.402018-19 1,631.94 - 55.72 - - - 435.05 36.97 - (3) 2,159.68
Notes: These data should be read in conjunction with the explanatory notes.
(1) Data are for gross sales, from this period on.
(2) Figure includes Hong Kong Dollars program.
(3) Pools was withdrawn from the Australian Lottery Market on 23 June 2018.
NA = Not applicable
R = Revised data
KENO(NA)
Value ($)
CASINOGAMING
MACHINES(NA)
INSTANT LOTTERY
(1)
INTERACTIVE GAMING (NA)
LOTTERIES(NA)
LOTTO(1)
MINOR GAMING POOLS TOTAL GAMING
Australian Gambling Statistics, 1993–94 to 2018–19, 36th edition
271

TABLE WA 20WESTERN AUSTRALIA
TOTAL GAMING EXPENDITURE
1993-94 354.156 - 27.804 - - - 96.088 23.322 2.122 503.4921994-95 395.038 - 28.340 - - - 111.481 24.094 0.953 559.9061995-96 429.565 - 31.370 - - - 126.126 28.055 1.234 616.3501996-97 375.300 - 30.187 - - - 127.114 27.744 0.943 561.2881997-98 358.828 - 29.512 - - - 135.638 25.811 0.835 550.6241998-99 285.760 - 31.987 - - - 145.100 26.112 0.823 489.7821999-00 288.560 - 33.425 - - - 148.736 24.312 0.779 495.8122000-01 281.064 - 28.811 - - - 158.468 23.152 0.866 492.3612001-02 291.660 - 29.874 - - - 157.692 21.555 0.727 501.5082002-03 252.940 - 31.089 - - - 178.640 21.793 0.732 485.1942003-04 285.371 - 33.513 - - - 188.449 22.149 0.694 530.1762004-05 309.887 - 32.791 - - - 195.142 22.171 0.822 560.8132005-06 345.517 - 33.372 - - - 207.406 21.195 0.622 608.1122006-07 453.008 - 38.901 - - - 225.306 21.176 0.510 738.9012007-08 486.216 - 38.598 - - - 246.881 22.310 0.519 794.5242008-09 535.121 - 38.903 - - - 278.880 23.224 0.679 876.8072009-10 536.496 - 37.139 - - - 270.426 19.925 0.966 864.9522010-11 503.343 - 36.798 - - - 262.430 24.806 0.701 828.0782011-12 634.221 - 36.386 - - - 297.359 24.312 0.774 993.0522012-13 599.171 - 38.956 (1) - - - 325.892 (1) 25.164 0.770 (1) 989.9532013-14 774.421 - 39.705 - - - 314.387 26.804 0.583 1,155.9002014-15 834.534 - 37.714 - - - 327.771 23.090 0.734 1,223.8432015-16 741.891 - 36.101 - - - 354.830 31.770 0.568 1,165.1602016-17 622.849 (2) - 33.739 - - - 327.068 34.350 0.651 1,018.6572017-18 563.624 - 37.096 - - - 334.219 34.610 0.741 970.2902018-19 533.412 - 38.673 - - - 391.498 31.913 - (3) 995.496
Notes: These data should be read in conjunction with the explanatory notes.
(1) Data are for turnover minus prizes won by players, from this period on.
(2) Figure includes Hong Kong Dollars program.
(3) Pools was withdrawn from the Australian Lottery Market on 23 June 2018.
NA = Not applicable
KENO(NA)
Value ($ million)
CASINOGAMING
MACHINES(NA)
INSTANT LOTTERY
INTERACTIVE GAMING (NA)
LOTTERIES(NA)
LOTTO MINOR GAMING POOLS TOTAL GAMING
Australian Gambling Statistics, 1993–94 to 2018–19, 36th edition
272
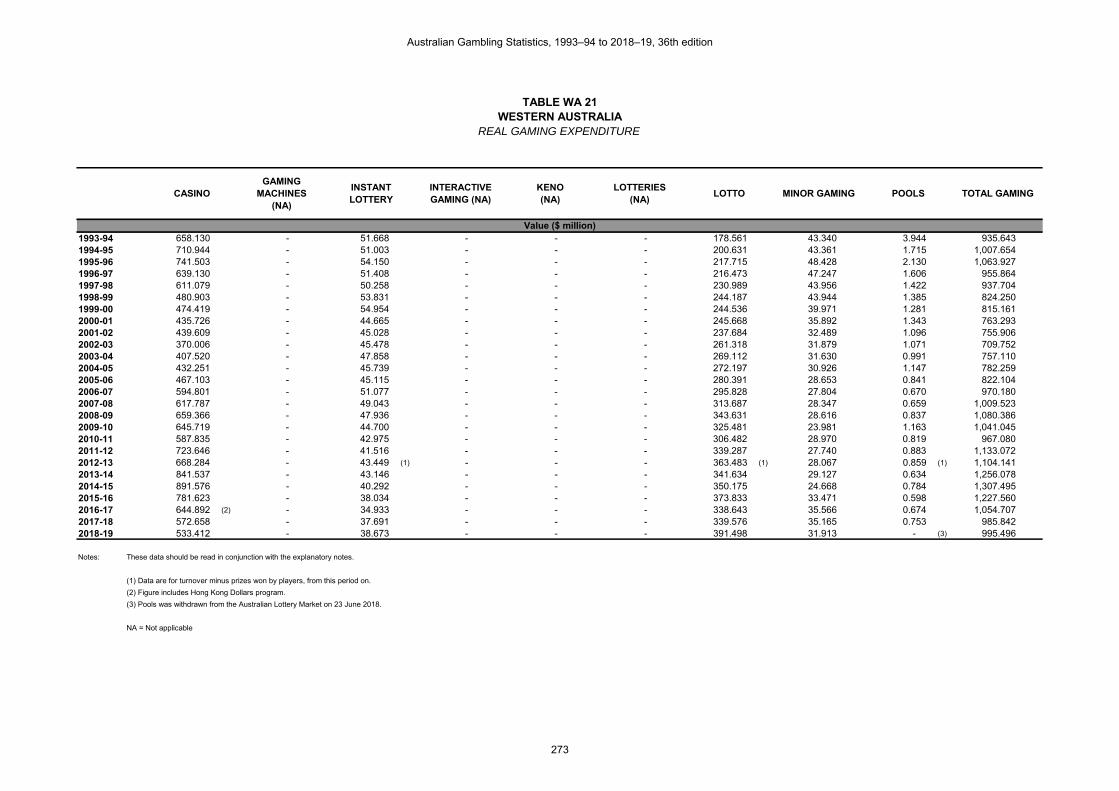
TABLE WA 21WESTERN AUSTRALIA
REAL GAMING EXPENDITURE
1993-94 658.130 - 51.668 - - - 178.561 43.340 3.944 935.6431994-95 710.944 - 51.003 - - - 200.631 43.361 1.715 1,007.6541995-96 741.503 - 54.150 - - - 217.715 48.428 2.130 1,063.9271996-97 639.130 - 51.408 - - - 216.473 47.247 1.606 955.8641997-98 611.079 - 50.258 - - - 230.989 43.956 1.422 937.7041998-99 480.903 - 53.831 - - - 244.187 43.944 1.385 824.2501999-00 474.419 - 54.954 - - - 244.536 39.971 1.281 815.1612000-01 435.726 - 44.665 - - - 245.668 35.892 1.343 763.2932001-02 439.609 - 45.028 - - - 237.684 32.489 1.096 755.9062002-03 370.006 - 45.478 - - - 261.318 31.879 1.071 709.7522003-04 407.520 - 47.858 - - - 269.112 31.630 0.991 757.1102004-05 432.251 - 45.739 - - - 272.197 30.926 1.147 782.2592005-06 467.103 - 45.115 - - - 280.391 28.653 0.841 822.1042006-07 594.801 - 51.077 - - - 295.828 27.804 0.670 970.1802007-08 617.787 - 49.043 - - - 313.687 28.347 0.659 1,009.5232008-09 659.366 - 47.936 - - - 343.631 28.616 0.837 1,080.3862009-10 645.719 - 44.700 - - - 325.481 23.981 1.163 1,041.0452010-11 587.835 - 42.975 - - - 306.482 28.970 0.819 967.0802011-12 723.646 - 41.516 - - - 339.287 27.740 0.883 1,133.0722012-13 668.284 - 43.449 (1) - - - 363.483 (1) 28.067 0.859 (1) 1,104.1412013-14 841.537 - 43.146 - - - 341.634 29.127 0.634 1,256.0782014-15 891.576 - 40.292 - - - 350.175 24.668 0.784 1,307.4952015-16 781.623 - 38.034 - - - 373.833 33.471 0.598 1,227.5602016-17 644.892 (2) - 34.933 - - - 338.643 35.566 0.674 1,054.7072017-18 572.658 - 37.691 - - - 339.576 35.165 0.753 985.8422018-19 533.412 - 38.673 - - - 391.498 31.913 - (3) 995.496
Notes: These data should be read in conjunction with the explanatory notes.
(1) Data are for turnover minus prizes won by players, from this period on.
(2) Figure includes Hong Kong Dollars program.
(3) Pools was withdrawn from the Australian Lottery Market on 23 June 2018.
NA = Not applicable
KENO(NA)
Value ($ million)
CASINOGAMING
MACHINES(NA)
INSTANT LOTTERY
INTERACTIVE GAMING (NA)
LOTTERIES(NA)
LOTTO MINOR GAMING POOLS TOTAL GAMING
Australian Gambling Statistics, 1993–94 to 2018–19, 36th edition
273

TABLE WA 22WESTERN AUSTRALIA
PER CAPITA GAMING EXPENDITURE
1993-94 287.46 - 22.57 - - - 77.99 18.93 1.72 408.671994-95 314.29 - 22.55 - - - 88.69 19.17 0.76 445.461995-96 334.56 - 24.43 - - - 98.23 21.85 0.96 480.031996-97 286.27 - 23.03 - - - 96.96 21.16 0.72 428.141997-98 268.51 - 22.08 - - - 101.50 19.31 0.62 412.031998-99 210.08 - 23.52 - - - 106.67 19.20 0.61 360.071999-00 208.63 - 24.17 - - - 107.54 17.58 0.56 358.472000-01 199.81 - 20.48 - - - 112.66 16.46 0.62 350.032001-02 203.91 - 20.89 - - - 110.25 15.07 0.51 350.612002-03 173.97 - 21.38 - - - 122.86 14.99 0.50 333.712003-04 192.89 - 22.65 - - - 127.38 14.97 0.47 358.362004-05 205.59 - 21.76 - - - 129.47 14.71 0.55 372.072005-06 224.59 - 21.69 - - - 134.82 13.78 0.40 395.282006-07 287.09 - 24.65 - - - 142.78 13.42 0.32 468.272007-08 298.59 - 23.70 - - - 151.61 13.70 0.32 487.932008-09 317.69 - 23.10 - - - 165.56 13.79 0.40 520.542009-10 309.32 - 21.41 - - - 155.92 11.49 0.56 498.702010-11 282.43 - 20.65 - - - 147.25 13.92 0.39 464.642011-12 345.09 - 19.80 - - - 161.80 13.23 0.42 540.342012-13 316.76 - 20.59 (1) - - - 172.29 (1) 13.30 0.41 (1) 523.352013-14 401.72 - 20.60 - - - 163.08 13.90 0.30 599.612014-15 428.39 - 19.36 - - - 168.25 11.85 0.38 628.242015-16 378.15 - 18.40 - - - 180.86 16.19 0.29 593.902016-17 315.55 (2) - 17.09 - - - 165.70 17.40 0.33 516.072017-18 283.34 - 18.65 - - - 168.01 17.40 0.37 487.772018-19 265.70 - 19.26 - - - 195.01 15.90 - (3) 495.88
Notes: These data should be read in conjunction with the explanatory notes.
(1) Data are for turnover minus prizes won by players, from this period on.
(2) Figure includes Hong Kong Dollars program.
(3) Pools was withdrawn from the Australian Lottery Market on 23 June 2018.
NA = Not applicable
KENO(NA)
Value ($)
CASINOGAMING
MACHINES(NA)
INSTANT LOTTERY
INTERACTIVE GAMING (NA)
LOTTERIES(NA)
LOTTO MINOR GAMING POOLS TOTAL GAMING
Australian Gambling Statistics, 1993–94 to 2018–19, 36th edition
274

TABLE WA 23WESTERN AUSTRALIA
REAL PER CAPITA GAMING EXPENDITURE
1993-94 534.19 - 41.94 - - - 144.93 35.18 3.20 759.441994-95 565.63 - 40.58 - - - 159.62 34.50 1.36 801.701995-96 577.50 - 42.17 - - - 169.56 37.72 1.66 828.621996-97 487.51 - 39.21 - - - 165.12 36.04 1.22 729.111997-98 457.27 - 37.61 - - - 172.85 32.89 1.06 701.681998-99 353.54 - 39.57 - - - 179.52 32.31 1.02 605.961999-00 343.01 - 39.73 - - - 176.80 28.90 0.93 589.372000-01 309.76 - 31.75 - - - 174.65 25.52 0.95 542.632001-02 307.34 - 31.48 - - - 166.17 22.71 0.77 528.472002-03 254.48 - 31.28 - - - 179.73 21.93 0.74 488.152003-04 275.45 - 32.35 - - - 181.90 21.38 0.67 511.752004-05 286.78 - 30.35 - - - 180.59 20.52 0.76 518.992005-06 303.62 - 29.33 - - - 182.26 18.63 0.55 534.382006-07 376.95 - 32.37 - - - 187.48 17.62 0.42 614.842007-08 379.39 - 30.12 - - - 192.64 17.41 0.40 619.962008-09 391.45 - 28.46 - - - 204.00 16.99 0.50 641.392009-10 372.30 - 25.77 - - - 187.66 13.83 0.67 600.232010-11 329.84 - 24.11 - - - 171.97 16.26 0.46 542.632011-12 393.75 - 22.59 - - - 184.61 15.09 0.48 616.522012-13 353.30 - 22.97 (1) - - - 192.16 (1) 14.84 0.45 (1) 583.722013-14 436.54 - 22.38 - - - 177.22 15.11 0.33 651.572014-15 457.67 - 20.68 - - - 179.76 12.66 0.40 671.182015-16 398.40 - 19.39 - - - 190.55 17.06 0.31 625.712016-17 326.72 (2) - 17.70 - - - 171.56 18.02 0.34 534.342017-18 287.88 - 18.95 - - - 170.71 17.68 0.38 495.592018-19 265.70 - 19.26 - - - 195.01 15.90 - (3) 495.88
Notes: These data should be read in conjunction with the explanatory notes.
(1) Data are for turnover minus prizes won by players, from this period on.
(2) Figure includes Hong Kong Dollars program.
(3) Pools was withdrawn from the Australian Lottery Market on 23 June 2018.
NA = Not applicable
KENO(NA)
Value ($)
CASINOGAMING
MACHINES(NA)
INSTANT LOTTERY
INTERACTIVE GAMING (NA)
LOTTERIES(NA)
LOTTO MINOR GAMING POOLS TOTAL GAMING
Australian Gambling Statistics, 1993–94 to 2018–19, 36th edition
275

TABLE WA 24WESTERN AUSTRALIAGAMING EXPENDITURE
AS A % OF HDI
1993-94 1.265 - 0.099 - - - 0.343 0.083 0.008 1.7981994-95 1.311 - 0.094 - - - 0.370 0.080 0.003 1.8591995-96 1.352 - 0.099 - - - 0.397 0.088 0.004 1.9411996-97 1.124 - 0.090 - - - 0.381 0.083 0.003 1.6811997-98 1.029 - 0.085 - - - 0.389 0.074 0.002 1.5781998-99 0.774 - 0.087 - - - 0.393 0.071 0.002 1.3261999-00 0.739 - 0.086 - - - 0.381 0.062 0.002 1.2692000-01 0.674 - 0.069 - - - 0.380 0.056 0.002 1.1812001-02 0.614 - 0.063 - - - 0.332 0.045 0.002 1.0552002-03 0.513 - 0.063 - - - 0.362 0.044 0.001 0.9842003-04 0.530 - 0.062 - - - 0.350 0.041 0.001 0.9852004-05 0.538 - 0.057 - - - 0.339 0.038 0.001 0.9732005-06 0.566 - 0.055 - - - 0.340 0.035 0.001 0.9962006-07 0.646 - 0.055 - - - 0.321 0.030 0.001 1.0532007-08 0.593 - 0.047 - - - 0.301 0.027 0.001 0.9702008-09 0.582 - 0.042 - - - 0.303 0.025 0.001 0.9532009-10 0.558 - 0.039 - - - 0.281 0.021 0.001 0.8992010-11 0.475 - 0.035 - - - 0.248 0.023 0.001 0.7822011-12 0.540 - 0.031 - - - 0.253 0.021 0.001 0.8462012-13 0.480 - 0.031 (1) - - - 0.261 (1) 0.020 0.001 (1) 0.7932013-14 0.590 - 0.030 - - - 0.239 0.020 0.000 0.8802014-15 0.604 - 0.027 - - - 0.237 0.017 0.001 0.8862015-16 0.533 - 0.026 - - - 0.255 0.023 0.000 0.8372016-17 0.457 (2) - 0.025 - - - 0.240 0.025 0.000 0.7482017-18 0.406 - 0.027 - - - 0.241 0.025 0.001 0.7002018-19 0.382 - 0.028 - - - 0.280 0.023 - (3) 0.712
Notes: These data should be read in conjunction with the explanatory notes.
(1) Data are for turnover minus prizes won by players, from this period on.
(2) Figure includes Hong Kong Dollars program.
(3) Pools was withdrawn from the Australian Lottery Market on 23 June 2018.
NA = Not applicable
Percentage (%)
CASINOGAMING
MACHINES(NA)
INSTANT LOTTERY
TOTAL GAMINGINTERACTIVE GAMING (NA)
KENO(NA)
LOTTERIES(NA)
LOTTO MINOR GAMING POOLS
Australian Gambling Statistics, 1993–94 to 2018–19, 36th edition
276

TABLE WA 25WESTERN AUSTRALIAGAMING EXPENDITURE
SHARE OF MARKET
1993-94 70.34 - 5.52 - - - 19.08 4.63 0.421994-95 70.55 - 5.06 - - - 19.91 4.30 0.171995-96 69.69 - 5.09 - - - 20.46 4.55 0.201996-97 66.86 - 5.38 - - - 22.65 4.94 0.171997-98 65.17 - 5.36 - - - 24.63 4.69 0.151998-99 58.34 - 6.53 - - - 29.63 5.33 0.171999-00 58.20 - 6.74 - - - 30.00 4.90 0.162000-01 57.08 - 5.85 - - - 32.19 4.70 0.182001-02 58.16 - 5.96 - - - 31.44 4.30 0.142002-03 52.13 - 6.41 - - - 36.82 4.49 0.152003-04 53.83 - 6.32 - - - 35.54 4.18 0.132004-05 55.26 - 5.85 - - - 34.80 3.95 0.152005-06 56.82 - 5.49 - - - 34.11 3.49 0.102006-07 61.31 - 5.26 - - - 30.49 2.87 0.072007-08 61.20 - 4.86 - - - 31.07 2.81 0.072008-09 61.03 - 4.44 - - - 31.81 2.65 0.082009-10 62.03 - 4.29 - - - 31.26 2.30 0.112010-11 60.78 - 4.44 - - - 31.69 3.00 0.082011-12 63.87 - 3.66 - - - 29.94 2.45 0.082012-13 60.53 - 3.94 (1) - - - 32.92 (1) 2.54 0.08 (1)
2013-14 67.00 - 3.43 - - - 27.20 2.32 0.052014-15 68.19 - 3.08 - - - 26.78 1.89 0.062015-16 63.67 - 3.10 - - - 30.45 2.73 0.052016-17 61.14 (2) - 3.31 - - - 32.11 3.37 0.062017-18 58.09 - 3.82 - - - 34.45 3.57 0.082018-19 53.58 - 3.88 - - - 39.33 3.21 - (3)
Notes: These data should be read in conjunction with the explanatory notes.
(1) Data are for turnover minus prizes won by players, from this period on.
(2) Figure includes Hong Kong Dollars program.
(3) Pools was withdrawn from the Australian Lottery Market on 23 June 2018.
NA = Not applicable
POOLS
Percentage (%)
CASINOGAMING
MACHINES(NA)
INSTANT LOTTERY
INTERACTIVE GAMING (NA)
KENO(NA)
LOTTERIES(NA)
LOTTO MINOR GAMING
Australian Gambling Statistics, 1993–94 to 2018–19, 36th edition
277

TABLE WA 26WESTERN AUSTRALIA
GOVERNMENT REVENUE FROM GAMING
1993-94 53.123 - - 92.685 0.524 146.3321994-95 59.256 - - 103.953 0.528 163.7371995-96 64.435 - - 119.785 0.464 184.6841996-97 56.300 - - 114.368 0.510 171.1781997-98 53.824 - - 125.715 0.500 180.0391998-99 42.864 - - 126.470 0.515 169.8491999-00 43.284 - - 124.611 0.496 168.3912000-01 42.159 - - 134.073 0.505 176.7372001-02 43.749 - - 134.722 0.482 178.9532002-03 37.941 - - 143.925 0.481 182.3472003-04 45.454 - - 151.255 0.479 197.1882004-05 51.665 - - 161.604 0.471 213.7402005-06 59.157 - - 166.207 0.472 225.8362006-07 76.900 - - 186.729 0.532 264.1612007-08 83.709 - - 205.514 0.581 289.8042008-09 90.824 - - 233.788 0.638 325.2502009-10 92.369 - - 234.803 0.618 327.7902010-11 89.627 - - 238.753 0.686 329.0662011-12 106.377 - - 256.977 0.694 364.0482012-13 106.340 - - 274.500 (1) 0.633 381.4732013-14 127.458 - - 271.291 0.691 399.4402014-15 110.284 - - 282.907 0.654 393.8452015-16 64.863 - - 281.428 0.769 347.0602016-17 61.872 (2) - - 265.320 0.768 327.9602017-18 60.963 - - 259.670 0.759 321.3922018-19 59.388 - - 281.650 0.837 341.875
Notes: These data should be read in conjunction with the explanatory notes.
Data for the gambling revenue received by states and territories from 1 July 2000 onwards are not comparable with that of preceding years because
of the impact of changes brought about by the introduction of the GST.
(1) Data are for total funding, from this period on.
(2) Figure includes Hong Kong Dollars program. Value includes additional tax ($7.53 million in 2018-19) for the Minimum Guarantee
on International Commission Business Tax, from this period on.
NA = Not applicable
Value ($ million)
TOTAL GAMINGCASINO GAMINGGAMING
MACHINES(NA)
INTERACTIVE GAMING (NA)
LOTTERIES & POOLS LOTTO
MINOR GAMING
Australian Gambling Statistics, 1993–94 to 2018–19, 36th edition
278

TABLE WA 27WESTERN AUSTRALIA
REAL GOVERNMENT REVENUE FROM GAMING
1993-94 98.719 - - 172.237 0.974 271.9301994-95 106.642 - - 187.083 0.950 294.6751995-96 111.226 - - 206.770 0.801 318.7961996-97 95.878 - - 194.767 0.869 291.5141997-98 91.661 - - 214.091 0.851 306.6041998-99 72.135 - - 212.835 0.867 285.8371999-00 71.163 - - 204.872 0.815 276.8502000-01 65.358 - - 207.850 0.783 273.9902001-02 65.941 - - 203.062 0.727 269.7302002-03 55.501 - - 210.536 0.704 266.7412003-04 64.910 - - 215.997 0.684 281.5912004-05 72.066 - - 225.416 0.657 298.1392005-06 79.974 - - 224.695 0.638 305.3072006-07 100.970 - - 245.176 0.699 346.8442007-08 106.361 - - 261.126 0.738 368.2252008-09 111.912 - - 288.069 0.786 400.7672009-10 111.174 - - 282.606 0.744 394.5242010-11 104.672 - - 278.830 0.801 384.3032011-12 121.376 - - 293.211 0.792 415.3792012-13 118.606 - - 306.163 (1) 0.706 425.4752013-14 138.504 - - 294.803 0.751 434.0582014-15 117.822 - - 302.244 0.699 420.7652015-16 68.337 - - 296.500 0.810 365.6472016-17 64.062 (2) - - 274.710 0.795 339.5672017-18 61.940 - - 263.832 0.771 326.5432018-19 59.388 - - 281.650 0.837 341.875
Notes: These data should be read in conjunction with the explanatory notes.
Data for the gambling revenue received by states and territories from 1 July 2000 onwards are not comparable with that of preceding years because
of the impact of changes brought about by the introduction of the GST.
(1) Data are for total funding, from this period on.
(2) Figure includes Hong Kong Dollars program. Value includes additional tax ($7.53 million in 2018-19) for the Minimum Guarantee
on International Commission Business Tax, from this period on.
NA = Not applicable
Value ($ million)
TOTAL GAMINGCASINO GAMINGGAMING
MACHINES(NA)
INTERACTIVE GAMING (NA)
LOTTERIES & POOLS LOTTO
MINOR GAMING
Australian Gambling Statistics, 1993–94 to 2018–19, 36th edition
279

TABLE WA 28WESTERN AUSTRALIA
PER CAPITA REVENUE FROM GAMING
1993-94 43.12 - - 75.23 0.43 118.771994-95 47.14 - - 82.71 0.42 130.271995-96 50.18 - - 93.29 0.36 143.841996-97 42.94 - - 87.24 0.39 130.571997-98 40.28 - - 94.07 0.37 134.721998-99 31.51 - - 92.98 0.38 124.871999-00 31.29 - - 90.09 0.36 121.752000-01 29.97 - - 95.31 0.36 125.642001-02 30.59 - - 94.19 0.34 125.112002-03 26.09 - - 98.99 0.33 125.412003-04 30.72 - - 102.24 0.32 133.282004-05 34.28 - - 107.22 0.31 141.812005-06 38.45 - - 108.04 0.31 146.802006-07 48.73 - - 118.34 0.34 167.412007-08 51.41 - - 126.21 0.36 177.972008-09 53.92 - - 138.79 0.38 193.092009-10 53.26 - - 135.38 0.36 188.992010-11 50.29 - - 133.97 0.38 184.642011-12 57.88 - - 139.83 0.38 198.082012-13 56.22 - - 145.12 (1) 0.33 201.672013-14 66.12 - - 140.73 0.36 207.202014-15 56.61 - - 145.22 0.34 202.172015-16 33.06 - - 143.45 0.39 176.902016-17 31.35 (2) - - 134.42 0.39 166.152017-18 30.65 - - 130.54 0.38 161.572018-19 29.58 - - 140.30 0.42 170.29
Notes: These data should be read in conjunction with the explanatory notes.
Data for the gambling revenue received by states and territories from 1 July 2000 onwards are not comparable with that of preceding years because
of the impact of changes brought about by the introduction of the GST.
(1) Data are for total funding, from this period on.
(2) Figure includes Hong Kong Dollars program. Value includes additional tax ($7.53 million in 2018-19) for the Minimum Guarantee
on International Commission Business Tax, from this period on.
NA = Not applicable
Value ($)
TOTAL GAMINGCASINO GAMINGGAMING
MACHINES(NA)
INTERACTIVE GAMING (NA)
LOTTERIES & POOLS LOTTO
MINOR GAMING
Australian Gambling Statistics, 1993–94 to 2018–19, 36th edition
280

TABLE WA 29WESTERN AUSTRALIA
REAL PER CAPITA REVENUE FROM GAMING
1993-94 80.13 - - 139.80 0.79 220.721994-95 84.85 - - 148.84 0.76 234.451995-96 86.63 - - 161.04 0.62 248.291996-97 73.13 - - 148.56 0.66 222.361997-98 68.59 - - 160.20 0.64 229.431998-99 53.03 - - 156.47 0.64 210.141999-00 51.45 - - 148.12 0.59 200.162000-01 46.46 - - 147.76 0.56 194.782001-02 46.10 - - 141.96 0.51 188.572002-03 38.17 - - 144.80 0.48 183.462003-04 43.87 - - 146.00 0.46 190.332004-05 47.81 - - 149.55 0.44 197.802005-06 51.98 - - 146.06 0.41 198.452006-07 63.99 - - 155.38 0.44 219.812007-08 65.32 - - 160.36 0.45 226.132008-09 66.44 - - 171.02 0.47 237.922009-10 64.10 - - 162.94 0.43 227.472010-11 58.73 - - 156.45 0.45 215.632011-12 66.04 - - 159.54 0.43 226.012012-13 62.70 - - 161.86 (1) 0.37 224.932013-14 71.85 - - 152.92 0.39 225.162014-15 60.48 - - 155.15 0.36 215.992015-16 34.83 - - 151.13 0.41 186.382016-17 32.46 (2) - - 139.17 0.40 172.032017-18 31.14 - - 132.63 0.39 164.152018-19 29.58 - - 140.30 0.42 170.29
Notes: These data should be read in conjunction with the explanatory notes.
Data for the gambling revenue received by states and territories from 1 July 2000 onwards are not comparable with that of preceding years because
of the impact of changes brought about by the introduction of the GST.
(1) Data are for total funding, from this period on.
(2) Figure includes Hong Kong Dollars program. Value includes additional tax ($7.53 million in 2018-19) for the Minimum Guarantee
on International Commission Business Tax, from this period on.
NA = Not applicable
Value ($)
TOTAL GAMINGCASINO GAMINGGAMING
MACHINES(NA)
INTERACTIVE GAMING (NA)
LOTTERIES & POOLS LOTTO
MINOR GAMING
Australian Gambling Statistics, 1993–94 to 2018–19, 36th edition
281

TABLE WA 30WESTERN AUSTRALIA
GOVERNMENT REVENUE FROM GAMINGAS A % OF TOTAL GAMBLING REVENUE
1993-94 28.57 - - 49.84 0.28 78.691994-95 28.76 - - 50.45 0.26 79.461995-96 28.10 - - 52.24 0.20 80.541996-97 27.45 - - 55.76 0.25 83.451997-98 24.82 - - 57.97 0.23 83.011998-99 20.51 - - 60.52 0.25 81.281999-00 20.69 - - 59.56 0.24 80.482000-01 19.24 - - 61.18 0.23 80.642001-02 19.57 - - 60.28 0.22 80.072002-03 16.45 - - 62.39 0.21 79.052003-04 18.25 - - 60.72 0.19 79.162004-05 19.37 - - 60.59 0.18 80.142005-06 20.88 - - 58.65 0.17 79.692006-07 23.61 - - 57.32 0.16 81.092007-08 26.12 - - 64.13 0.18 90.442008-09 25.40 - - 65.38 0.18 90.962009-10 25.70 - - 65.32 0.17 91.192010-11 24.69 - - 65.76 0.19 90.642011-12 26.56 - - 64.17 0.17 90.912012-13 25.21 - - 65.06 (1) 0.15 90.422013-14 28.83 - - 61.36 0.16 90.342014-15 25.29 - - 64.87 0.15 90.312015-16 16.68 - - 72.35 0.20 89.232016-17 16.80 (2) - - 72.04 0.21 89.042017-18 16.80 - - 71.55 0.21 88.562018-19 15.47 - - 73.39 0.22 89.08
Notes: These data should be read in conjunction with the explanatory notes.
Data for the gambling revenue received by states and territories from 1 July 2000 onwards are not comparable with that of preceding years because
of the impact of changes brought about by the introduction of the GST.
(1) Data are for total funding, from this period on.
(2) Figure includes Hong Kong Dollars program. Value includes additional tax ($7.53 million in 2018-19) for the Minimum Guarantee
on International Commission Business Tax, from this period on.
NA = Not applicable
Percentage (%)
TOTAL GAMINGCASINO GAMINGGAMING
MACHINES(NA)
INTERACTIVE GAMING (NA)
LOTTERIES & POOLS LOTTO
MINOR GAMING
Australian Gambling Statistics, 1993–94 to 2018–19, 36th edition
282

TABLE WA 31WESTERN AUSTRALIA
TOTAL SPORTSBETTING TURNOVER
1994-95 2.044 - - 1.205 3.2491995-96 1.848 - - 1.423 3.2711996-97 3.233 - - 1.731 4.9641997-98 6.903 - - 1.972 8.8751998-99 8.180 - - 2.877 11.0571999-00 9.523 - 0.927 3.159 13.6092000-01 11.108 - 6.745 1.250 19.1032001-02 8.133 - 15.823 1.626 25.5822002-03 6.789 - 20.231 1.847 28.8672003-04 8.019 - 30.531 2.261 40.8112004-05 4.288 - 34.577 2.814 41.6792005-06 2.573 - 54.258 2.598 59.4292006-07 7.347 - 60.897 2.613 70.8572007-08 6.646 - 73.502 2.651 82.7992008-09 8.851 - 90.301 2.298 101.4502009-10 1.448 - 166.368 1.995 169.8112010-11 0.082 - 155.444 2.025 157.5512011-12 0.072 - 179.601 1.714 181.3872012-13 - - 228.540 1.683 230.2232013-14 0.004 - 410.833 1.370 412.2072014-15 0.101 - 530.172 1.315 531.5882015-16 0.072 - 616.821 1.317 618.2102016-17 0.030 - 163.267 R 1.641 164.938 R
2017-18 0.002 - 163.251 R 1.075 164.328 R
2018-19 0.004 - 163.351 0.825 164.180
Notes: These data should be read in conjunction with the explanatory notes.
NA = Not applicable
R = Revised data
TOTAL SPORTSBETTING
Value ($ million)
BOOKMAKER (AND OTHER) FIXED ODDS
BOOKMAKER (AND OTHER)
POOL BETTING(NA)
TAB FIXED ODDS TAB TOTE ODDS
Australian Gambling Statistics, 1993–94 to 2018–19, 36th edition
283
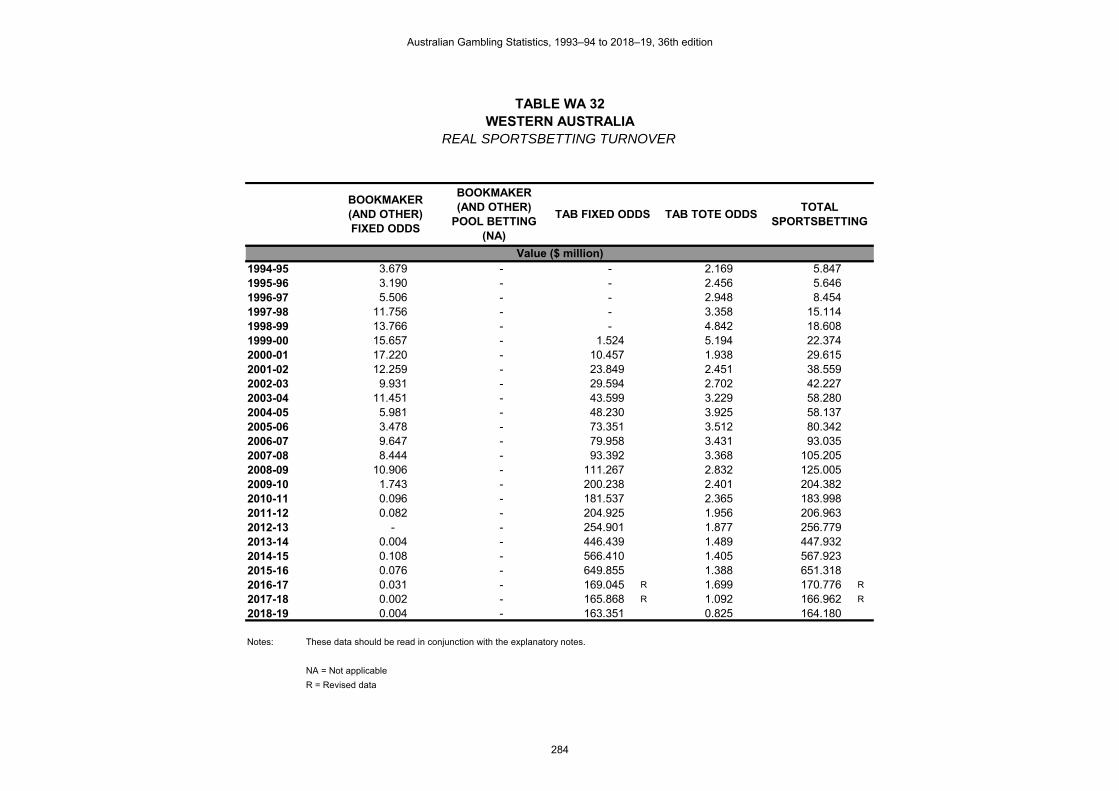
TABLE WA 32WESTERN AUSTRALIA
REAL SPORTSBETTING TURNOVER
1994-95 3.679 - - 2.169 5.8471995-96 3.190 - - 2.456 5.6461996-97 5.506 - - 2.948 8.4541997-98 11.756 - - 3.358 15.1141998-99 13.766 - - 4.842 18.6081999-00 15.657 - 1.524 5.194 22.3742000-01 17.220 - 10.457 1.938 29.6152001-02 12.259 - 23.849 2.451 38.5592002-03 9.931 - 29.594 2.702 42.2272003-04 11.451 - 43.599 3.229 58.2802004-05 5.981 - 48.230 3.925 58.1372005-06 3.478 - 73.351 3.512 80.3422006-07 9.647 - 79.958 3.431 93.0352007-08 8.444 - 93.392 3.368 105.2052008-09 10.906 - 111.267 2.832 125.0052009-10 1.743 - 200.238 2.401 204.3822010-11 0.096 - 181.537 2.365 183.9982011-12 0.082 - 204.925 1.956 206.9632012-13 - - 254.901 1.877 256.7792013-14 0.004 - 446.439 1.489 447.9322014-15 0.108 - 566.410 1.405 567.9232015-16 0.076 - 649.855 1.388 651.3182016-17 0.031 - 169.045 R 1.699 170.776 R
2017-18 0.002 - 165.868 R 1.092 166.962 R
2018-19 0.004 - 163.351 0.825 164.180
Notes: These data should be read in conjunction with the explanatory notes.
NA = Not applicable
R = Revised data
TOTAL SPORTSBETTING
Value ($ million)
BOOKMAKER (AND OTHER) FIXED ODDS
BOOKMAKER (AND OTHER)
POOL BETTING(NA)
TAB FIXED ODDS TAB TOTE ODDS
Australian Gambling Statistics, 1993–94 to 2018–19, 36th edition
284

TABLE WA 33WESTERN AUSTRALIA
PER CAPITA SPORTSBETTING TURNOVER
1994-95 1.63 - - 0.96 2.581995-96 1.44 - - 1.11 2.551996-97 2.47 - - 1.32 3.791997-98 5.17 - - 1.48 6.641998-99 6.01 - - 2.12 8.131999-00 6.89 - 0.67 2.28 9.842000-01 7.90 - 4.80 0.89 13.582001-02 5.69 - 11.06 1.14 17.882002-03 4.67 - 13.91 1.27 19.852003-04 5.42 - 20.64 1.53 27.592004-05 2.84 - 22.94 1.87 27.652005-06 1.67 - 35.27 1.69 38.632006-07 4.66 - 38.59 1.66 44.902007-08 4.08 - 45.14 1.63 50.852008-09 5.25 - 53.61 1.36 60.232009-10 0.83 - 95.92 1.15 97.912010-11 0.05 - 87.22 1.14 88.402011-12 0.04 - 97.72 0.93 98.702012-13 - - 120.82 0.89 121.712013-14 0.00 - 213.11 0.71 213.832014-15 0.05 - 272.15 0.68 272.882015-16 0.04 - 314.40 0.67 315.112016-17 0.02 - 82.71 R 0.83 83.56 R
2017-18 0.00 - 82.07 R 0.54 82.61 R
2018-19 0.00 - 81.37 0.41 81.78
Notes: These data should be read in conjunction with the explanatory notes.
NA = Not applicable
R = Revised data
TOTAL SPORTSBETTING
Value ($)
BOOKMAKER (AND OTHER) FIXED ODDS
BOOKMAKER (AND OTHER)
POOL BETTING(NA)
TAB FIXED ODDS TAB TOTE ODDS
Australian Gambling Statistics, 1993–94 to 2018–19, 36th edition
285
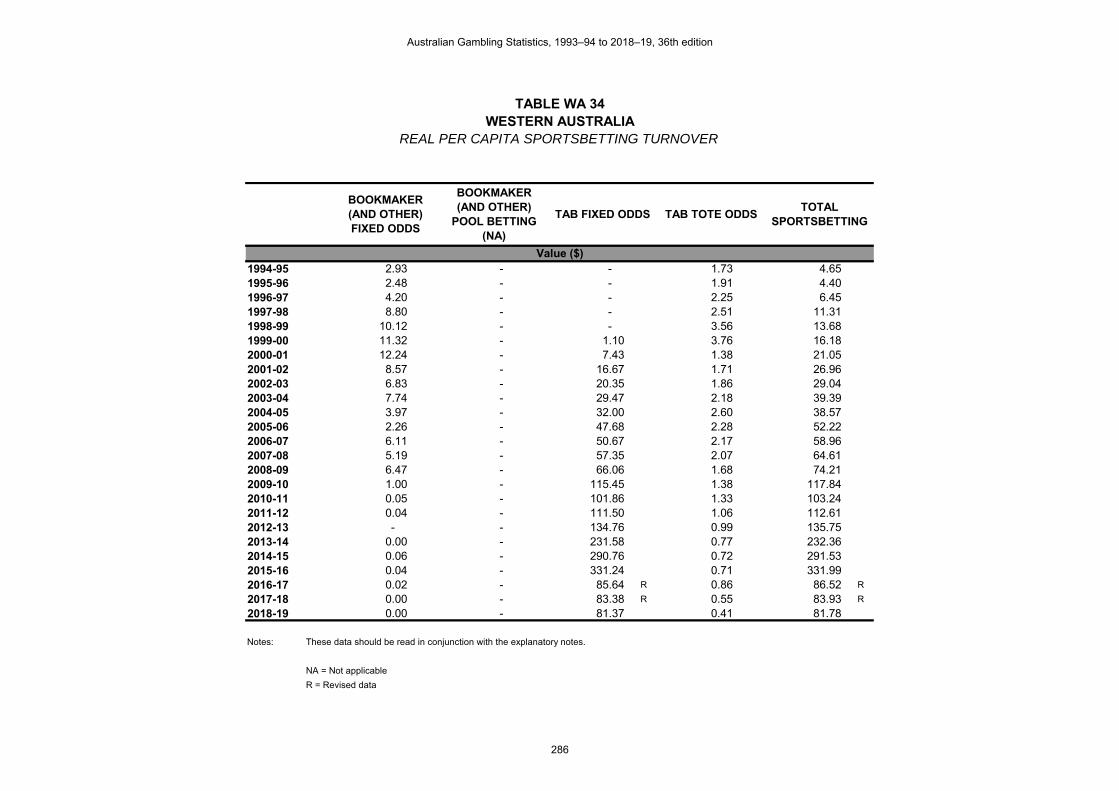
TABLE WA 34WESTERN AUSTRALIA
REAL PER CAPITA SPORTSBETTING TURNOVER
1994-95 2.93 - - 1.73 4.651995-96 2.48 - - 1.91 4.401996-97 4.20 - - 2.25 6.451997-98 8.80 - - 2.51 11.311998-99 10.12 - - 3.56 13.681999-00 11.32 - 1.10 3.76 16.182000-01 12.24 - 7.43 1.38 21.052001-02 8.57 - 16.67 1.71 26.962002-03 6.83 - 20.35 1.86 29.042003-04 7.74 - 29.47 2.18 39.392004-05 3.97 - 32.00 2.60 38.572005-06 2.26 - 47.68 2.28 52.222006-07 6.11 - 50.67 2.17 58.962007-08 5.19 - 57.35 2.07 64.612008-09 6.47 - 66.06 1.68 74.212009-10 1.00 - 115.45 1.38 117.842010-11 0.05 - 101.86 1.33 103.242011-12 0.04 - 111.50 1.06 112.612012-13 - - 134.76 0.99 135.752013-14 0.00 - 231.58 0.77 232.362014-15 0.06 - 290.76 0.72 291.532015-16 0.04 - 331.24 0.71 331.992016-17 0.02 - 85.64 R 0.86 86.52 R
2017-18 0.00 - 83.38 R 0.55 83.93 R
2018-19 0.00 - 81.37 0.41 81.78
Notes: These data should be read in conjunction with the explanatory notes.
NA = Not applicable
R = Revised data
TOTAL SPORTSBETTING
Value ($)
BOOKMAKER (AND OTHER) FIXED ODDS
BOOKMAKER (AND OTHER)
POOL BETTING(NA)
TAB FIXED ODDS TAB TOTE ODDS
Australian Gambling Statistics, 1993–94 to 2018–19, 36th edition
286

TABLE WA 35WESTERN AUSTRALIA
TOTAL SPORTSBETTING EXPENDITURE
1994-95 0.102 - - 0.301 0.4031995-96 0.092 - - 0.356 0.4481996-97 0.162 - - 0.433 0.5951997-98 0.345 - - 0.493 0.8381998-99 0.409 - - 0.613 1.0221999-00 0.476 - 0.080 0.673 1.2292000-01 0.560 - 0.661 0.314 1.5352001-02 0.407 - 1.637 0.409 2.4532002-03 0.339 - 1.987 0.464 2.7902003-04 0.401 - 3.240 0.568 4.2092004-05 0.214 - 3.952 0.706 4.8722005-06 0.130 - 6.699 0.652 7.4812006-07 0.367 - 7.279 0.656 8.3022007-08 0.332 - 7.742 0.666 8.7402008-09 0.443 - 9.459 0.577 10.4792009-10 0.072 - 18.651 0.501 19.2242010-11 0.004 - 14.666 0.508 15.1782011-12 0.004 - 16.518 0.433 16.9552012-13 - - 23.233 0.423 23.6562013-14 - - 53.049 0.344 53.3932014-15 0.005 - 71.451 0.330 71.7862015-16 0.004 - 80.119 0.331 80.4542016-17 0.001 - 11.385 R 0.442 11.828 R
2017-18 - - 15.526 R 0.270 15.796 R
2018-19 0.002 - 10.488 0.207 10.697
Notes: These data should be read in conjunction with the explanatory notes.
NA = Not applicable
R = Revised data
TOTAL SPORTSBETTING
Value ($ million)
BOOKMAKER (AND OTHER) FIXED ODDS
BOOKMAKER (AND OTHER)
POOL BETTING(NA)
TAB FIXED ODDS TAB TOTE ODDS
Australian Gambling Statistics, 1993–94 to 2018–19, 36th edition
287

TABLE WA 36WESTERN AUSTRALIA
REAL SPORTSBETTING EXPENDITURE
1994-95 0.184 - - 0.542 0.7251995-96 0.159 - - 0.615 0.7731996-97 0.276 - - 0.737 1.0131997-98 0.588 - - 0.840 1.4271998-99 0.688 - - 1.032 1.7201999-00 0.783 - 0.132 1.106 2.0212000-01 0.868 - 1.025 0.487 2.3802001-02 0.613 - 2.467 0.616 3.6972002-03 0.496 - 2.907 0.679 4.0812003-04 0.573 - 4.627 0.811 6.0112004-05 0.299 - 5.513 0.985 6.7962005-06 0.176 - 9.056 0.881 10.1142006-07 0.482 - 9.557 0.861 10.9012007-08 0.422 - 9.837 0.846 11.1052008-09 0.546 - 11.656 0.711 12.9122009-10 0.087 - 22.448 0.603 23.1382010-11 0.005 - 17.128 0.593 17.7262011-12 0.004 - 18.847 0.494 19.3452012-13 - - 25.913 0.472 26.3852013-14 - - 57.647 0.374 58.0202014-15 0.005 - 76.335 0.353 76.6932015-16 0.004 - 84.410 0.349 84.7632016-17 0.001 - 11.788 R 0.458 12.247 R
2017-18 - - 15.775 R 0.274 16.049 R
2018-19 0.002 - 10.488 0.207 10.697
Notes: These data should be read in conjunction with the explanatory notes.
NA = Not applicable
R = Revised data
TOTAL SPORTSBETTING
Value ($ million)
BOOKMAKER (AND OTHER) FIXED ODDS
BOOKMAKER (AND OTHER)
POOL BETTING(NA)
TAB FIXED ODDS TAB TOTE ODDS
Australian Gambling Statistics, 1993–94 to 2018–19, 36th edition
288

TABLE WA 37WESTERN AUSTRALIA
PER CAPITA SPORTSBETTING EXPENDITURE
1994-95 0.08 - - 0.24 0.321995-96 0.07 - - 0.28 0.351996-97 0.12 - - 0.33 0.451997-98 0.26 - - 0.37 0.631998-99 0.30 - - 0.45 0.751999-00 0.34 - 0.06 0.49 0.892000-01 0.40 - 0.47 0.22 1.092001-02 0.28 - 1.14 0.29 1.712002-03 0.23 - 1.37 0.32 1.922003-04 0.27 - 2.19 0.38 2.842004-05 0.14 - 2.62 0.47 3.232005-06 0.08 - 4.35 0.42 4.862006-07 0.23 - 4.61 0.42 5.262007-08 0.20 - 4.75 0.41 5.372008-09 0.26 - 5.62 0.34 6.222009-10 0.04 - 10.75 0.29 11.082010-11 0.00 - 8.23 0.29 8.522011-12 0.00 - 8.99 0.24 9.232012-13 - - 12.28 0.22 12.512013-14 - - 27.52 0.18 27.702014-15 0.00 - 36.68 0.17 36.852015-16 0.00 - 40.84 0.17 41.012016-17 0.00 - 5.77 R 0.22 5.99 R
2017-18 - - 7.80 R 0.14 7.94 R
2018-19 0.00 - 5.22 0.10 5.33
Notes: These data should be read in conjunction with the explanatory notes.
NA = Not applicable
R = Revised data
TOTAL SPORTSBETTING
Value ($)
BOOKMAKER (AND OTHER) FIXED ODDS
BOOKMAKER (AND OTHER)
POOL BETTING(NA)
TAB FIXED ODDS TAB TOTE ODDS
Australian Gambling Statistics, 1993–94 to 2018–19, 36th edition
289

TABLE WA 38WESTERN AUSTRALIA
REAL PER CAPITA SPORTSBETTING EXPENDITURE
1994-95 0.15 - - 0.43 0.581995-96 0.12 - - 0.48 0.601996-97 0.21 - - 0.56 0.771997-98 0.44 - - 0.63 1.071998-99 0.51 - - 0.76 1.261999-00 0.57 - 0.10 0.80 1.462000-01 0.62 - 0.73 0.35 1.692001-02 0.43 - 1.73 0.43 2.582002-03 0.34 - 2.00 0.47 2.812003-04 0.39 - 3.13 0.55 4.062004-05 0.20 - 3.66 0.65 4.512005-06 0.11 - 5.89 0.57 6.572006-07 0.31 - 6.06 0.55 6.912007-08 0.26 - 6.04 0.52 6.822008-09 0.32 - 6.92 0.42 7.672009-10 0.05 - 12.94 0.35 13.342010-11 0.00 - 9.61 0.33 9.952011-12 0.00 - 10.25 0.27 10.532012-13 - - 13.70 0.25 13.952013-14 - - 29.90 0.19 30.102014-15 0.00 - 39.18 0.18 39.372015-16 0.00 - 43.02 0.18 43.202016-17 0.00 - 5.97 R 0.23 6.20 R
2017-18 - - 7.93 R 0.14 8.07 R
2018-19 0.00 - 5.22 0.10 5.33
Notes: These data should be read in conjunction with the explanatory notes.
NA = Not applicable
R = Revised data
TOTAL SPORTSBETTING
Value ($)
BOOKMAKER (AND OTHER) FIXED ODDS
BOOKMAKER (AND OTHER)
POOL BETTING(NA)
TAB FIXED ODDS TAB TOTE ODDS
Australian Gambling Statistics, 1993–94 to 2018–19, 36th edition
290

TABLE WA 39WESTERN AUSTRALIA
SPORTSBETTING EXPENDITUREAS A % OF HDI
1994-95 0.000 - - 0.001 0.0011995-96 0.000 - - 0.001 0.0011996-97 0.000 - - 0.001 0.0021997-98 0.001 - - 0.001 0.0021998-99 0.001 - - 0.002 0.0031999-00 0.001 - 0.000 0.002 0.0032000-01 0.001 - 0.002 0.001 0.0042001-02 0.001 - 0.003 0.001 0.0052002-03 0.001 - 0.004 0.001 0.0062003-04 0.001 - 0.006 0.001 0.0082004-05 0.000 - 0.007 0.001 0.0082005-06 0.000 - 0.011 0.001 0.0122006-07 0.001 - 0.010 0.001 0.0122007-08 0.000 - 0.009 0.001 0.0112008-09 0.000 - 0.010 0.001 0.0112009-10 0.000 - 0.019 0.001 0.0202010-11 0.000 - 0.014 0.000 0.0142011-12 0.000 - 0.014 0.000 0.0142012-13 - - 0.019 0.000 0.0192013-14 - - 0.040 0.000 0.0412014-15 0.000 - 0.052 0.000 0.0522015-16 0.000 - 0.058 0.000 0.0582016-17 0.000 - 0.008 R 0.000 0.009 R
2017-18 - - 0.011 R 0.000 0.011 R
2018-19 0.000 - 0.008 0.000 0.008
Notes: These data should be read in conjunction with the explanatory notes.
NA = Not applicable
R = Revised data
Percentage (%)
BOOKMAKER (AND OTHER) FIXED ODDS
BOOKMAKER (AND OTHER)
POOL BETTING(NA)
TAB FIXED ODDS TAB TOTE ODDSTOTAL
SPORTSBETTING
Australian Gambling Statistics, 1993–94 to 2018–19, 36th edition
291

TABLE WA 40WESTERN AUSTRALIA
SPORTSBETTING EXPENDITURESHARE OF MARKET
1994-95 25.31 - - 74.691995-96 20.54 - - 79.461996-97 27.23 - - 72.771997-98 41.17 - - 58.831998-99 40.02 - - 59.981999-00 38.73 - 6.51 54.762000-01 36.48 - 43.06 20.462001-02 16.59 - 66.73 16.672002-03 12.15 - 71.22 16.632003-04 9.53 - 76.98 13.492004-05 4.39 - 81.12 14.492005-06 1.74 - 89.55 8.722006-07 4.42 - 87.68 7.902007-08 3.80 - 88.58 7.622008-09 4.23 - 90.27 5.512009-10 0.37 - 97.02 2.612010-11 0.03 - 96.63 3.352011-12 0.02 - 97.42 2.552012-13 - - 98.21 1.792013-14 - - 99.36 0.642014-15 0.01 - 99.53 0.462015-16 0.00 - 99.58 0.412016-17 0.01 - 96.25 R 3.742017-18 - - 98.29 R 1.712018-19 0.02 - 98.05 1.94
Notes: These data should be read in conjunction with the explanatory notes.
NA = Not applicable
R = Revised data
TAB FIXED ODDS TAB TOTE ODDS
Percentage (%)
BOOKMAKER (AND OTHER) FIXED ODDS
BOOKMAKER (AND OTHER)
POOL BETTING(NA)
Australian Gambling Statistics, 1993–94 to 2018–19, 36th edition
292

TABLE WA 41WESTERN AUSTRALIA
GOVERNMENT REVENUE FROM SPORTSBETTING
1994-95 0.020 - - 0.072 0.0921995-96 0.018 - - 0.085 0.1031996-97 0.032 - - 0.087 0.1191997-98 0.069 - - 0.099 0.1681998-99 0.020 - - 0.144 0.1641999-00 0.024 - 0.005 0.158 0.1872000-01 0.028 - 0.034 0.063 0.1252001-02 0.020 - 0.096 0.081 0.1972002-03 0.017 - 0.149 0.092 0.2582003-04 0.020 - 0.222 0.113 0.3552004-05 0.011 - 0.254 0.141 0.4062005-06 0.006 - 0.379 0.130 0.5152006-07 0.018 - 0.675 0.131 0.8242007-08 0.017 - 0.814 0.133 0.9642008-09 0.022 - 1.050 0.115 1.1872009-10 0.004 - 1.834 0.100 1.9382010-11 0.000 - 1.584 0.100 1.6842011-12 0.000 - 0.577 0.086 0.6632012-13 - - 2.626 0.084 2.7102013-14 - - 5.891 0.069 5.9602014-15 - - 8.070 0.066 8.1362015-16 - - 9.590 0.066 9.6562016-17 - - 0.816 R 0.082 0.898 R
2017-18 - - 0.830 R 0.054 0.884 R
2018-19 - - 1.512 (1) 0.032 (1) 1.544
Notes: These data should be read in conjunction with the explanatory notes.
Data for the gambling revenue received by states and territories from 1 July 2000 onwards are not comparable with that of
preceding years because of the impact of changes brought about by the introduction of the GST.
(1) Includes all government revenue collected between 1 July 2018 to 30 June 2019, but excludes point of consumption tax (POCT) revenue, which was introduced on 1 January 2019.
NA = Not applicable
R = Revised data
TOTAL SPORTSBETTING
Value ($ million)
BOOKMAKER (AND OTHER) FIXED ODDS
BOOKMAKER (AND OTHER)
POOL BETTING(NA)
TAB FIXED ODDS TAB TOTE ODDS
Australian Gambling Statistics, 1993–94 to 2018–19, 36th edition
293

TABLE WA 42WESTERN AUSTRALIA
REAL GOVERNMENT REVENUE FROM SPORTSBETTING
1994-95 0.036 - - 0.130 0.1661995-96 0.031 - - 0.147 0.1781996-97 0.054 - - 0.148 0.2031997-98 0.118 - - 0.169 0.2861998-99 0.034 - - 0.242 0.2761999-00 0.039 - 0.008 0.260 0.3072000-01 0.043 - 0.053 0.098 0.1942001-02 0.030 - 0.145 0.122 0.2972002-03 0.025 - 0.218 0.135 0.3772003-04 0.029 - 0.317 0.161 0.5072004-05 0.015 - 0.354 0.197 0.5662005-06 0.008 - 0.512 0.176 0.6962006-07 0.024 - 0.886 0.172 1.0822007-08 0.022 - 1.034 0.169 1.2252008-09 0.027 - 1.294 0.142 1.4632009-10 0.005 - 2.207 0.120 2.3332010-11 0.000 - 1.850 0.117 1.9672011-12 0.000 - 0.658 0.098 0.7572012-13 - - 2.929 0.094 3.0232013-14 - - 6.402 0.075 6.4772014-15 - - 8.622 0.071 8.6922015-16 - - 10.104 0.070 10.1732016-17 - - 0.845 R 0.085 0.930 R
2017-18 - - 0.843 R 0.055 0.898 R
2018-19 - - 1.512 (1) 0.032 (1) 1.544
Notes: These data should be read in conjunction with the explanatory notes.
Data for the gambling revenue received by states and territories from 1 July 2000 onwards are not comparable with that of
preceding years because of the impact of changes brought about by the introduction of the GST.
(1) Includes all government revenue collected between 1 July 2018 to 30 June 2019, but excludes point of consumption tax (POCT) revenue, which was introduced on 1 January 2019.
NA = Not applicable
R = Revised data
TOTAL SPORTSBETTING
Value ($ million)
BOOKMAKER (AND OTHER) FIXED ODDS
BOOKMAKER (AND OTHER)
POOL BETTING(NA)
TAB FIXED ODDS TAB TOTE ODDS
Australian Gambling Statistics, 1993–94 to 2018–19, 36th edition
294

TABLE WA 43WESTERN AUSTRALIA
PER CAPITA REVENUE FROM SPORTSBETTING
1994-95 0.02 - - 0.06 0.071995-96 0.01 - - 0.07 0.081996-97 0.02 - - 0.07 0.091997-98 0.05 - - 0.07 0.131998-99 0.01 - - 0.11 0.121999-00 0.02 - 0.00 0.11 0.142000-01 0.02 - 0.02 0.04 0.092001-02 0.01 - 0.07 0.06 0.142002-03 0.01 - 0.10 0.06 0.182003-04 0.01 - 0.15 0.08 0.242004-05 0.01 - 0.17 0.09 0.272005-06 0.00 - 0.25 0.08 0.332006-07 0.01 - 0.43 0.08 0.522007-08 0.01 - 0.50 0.08 0.592008-09 0.01 - 0.62 0.07 0.702009-10 0.00 - 1.06 0.06 1.122010-11 0.00 - 0.89 0.06 0.952011-12 0.00 - 0.31 0.05 0.362012-13 - - 1.39 0.04 1.432013-14 - - 3.06 0.04 3.092014-15 - - 4.14 0.03 4.182015-16 - - 4.89 0.03 4.922016-17 - - 0.41 R 0.04 0.45 R
2017-18 - - 0.42 R 0.03 0.44 R
2018-19 - - 0.75 (1) 0.02 (1) 0.77
Notes: These data should be read in conjunction with the explanatory notes.
Data for the gambling revenue received by states and territories from 1 July 2000 onwards are not comparable with that of
preceding years because of the impact of changes brought about by the introduction of the GST.
(1) Includes all government revenue collected between 1 July 2018 to 30 June 2019, but excludes point of consumption tax (POCT) revenue, which was introduced on 1 January 2019.
NA = Not applicable
R = Revised data
TOTAL SPORTSBETTING
Value ($)
BOOKMAKER (AND OTHER) FIXED ODDS
BOOKMAKER (AND OTHER)
POOL BETTING(NA)
TAB FIXED ODDS TAB TOTE ODDS
Australian Gambling Statistics, 1993–94 to 2018–19, 36th edition
295

TABLE WA 44WESTERN AUSTRALIA
REAL PER CAPITA REVENUE FROM SPORTSBETTING
1994-95 0.03 - - 0.10 0.131995-96 0.02 - - 0.11 0.141996-97 0.04 - - 0.11 0.151997-98 0.09 - - 0.13 0.211998-99 0.02 - - 0.18 0.201999-00 0.03 - 0.01 0.19 0.222000-01 0.03 - 0.04 0.07 0.142001-02 0.02 - 0.10 0.09 0.212002-03 0.02 - 0.15 0.09 0.262003-04 0.02 - 0.21 0.11 0.342004-05 0.01 - 0.24 0.13 0.382005-06 0.01 - 0.33 0.11 0.452006-07 0.01 - 0.56 0.11 0.692007-08 0.01 - 0.64 0.10 0.752008-09 0.02 - 0.77 0.08 0.872009-10 0.00 - 1.27 0.07 1.342010-11 0.00 - 1.04 0.07 1.102011-12 0.00 - 0.36 0.05 0.412012-13 - - 1.55 0.05 1.602013-14 - - 3.32 0.04 3.362014-15 - - 4.43 0.04 4.462015-16 - - 5.15 0.04 5.192016-17 - - 0.43 R 0.04 0.47 R
2017-18 - - 0.42 R 0.03 0.45 R
2018-19 - - 0.75 (1) 0.02 (1) 0.77
Notes: These data should be read in conjunction with the explanatory notes.
Data for the gambling revenue received by states and territories from 1 July 2000 onwards are not comparable with that of
preceding years because of the impact of changes brought about by the introduction of the GST.
(1) Includes all government revenue collected between 1 July 2018 to 30 June 2019, but excludes point of consumption tax (POCT) revenue, which was introduced on 1 January 2019.
NA = Not applicable
R = Revised data
TOTAL SPORTSBETTING
Value ($)
BOOKMAKER (AND OTHER) FIXED ODDS
BOOKMAKER (AND OTHER)
POOL BETTING(NA)
TAB FIXED ODDS TAB TOTE ODDS
Australian Gambling Statistics, 1993–94 to 2018–19, 36th edition
296

TABLE WA 45WESTERN AUSTRALIA
GOVERNMENT REVENUE FROM SPORTSBETTINGAS A % OF TOTAL GAMBLING REVENUE
1994-95 0.01 - - 0.03 0.041995-96 0.01 - - 0.04 0.041996-97 0.02 - - 0.04 0.061997-98 0.03 - - 0.05 0.081998-99 0.01 - - 0.07 0.081999-00 0.01 - 0.00 0.08 0.092000-01 0.01 - 0.02 0.03 0.062001-02 0.01 - 0.04 0.04 0.092002-03 0.01 - 0.06 0.04 0.112003-04 0.01 - 0.09 0.05 0.142004-05 0.00 - 0.10 0.05 0.152005-06 0.00 - 0.13 0.05 0.182006-07 0.01 - 0.21 0.04 0.252007-08 0.01 - 0.25 0.04 0.302008-09 0.01 - 0.29 0.03 0.332009-10 0.00 - 0.51 0.03 0.542010-11 0.00 - 0.44 0.03 0.462011-12 0.00 - 0.14 0.02 0.172012-13 - - 0.62 0.02 0.642013-14 - - 1.33 0.02 1.352014-15 - - 1.85 0.02 1.872015-16 - - 2.47 0.02 2.482016-17 - - 0.22 R 0.02 0.24 R
2017-18 - - 0.23 R 0.01 0.24 R
2018-19 - - 0.39 (1) 0.01 (1) 0.40
Notes: These data should be read in conjunction with the explanatory notes.
Data for the gambling revenue received by states and territories from 1 July 2000 onwards are not comparable with that of
preceding years because of the impact of changes brought about by the introduction of the GST.
(1) Includes all government revenue collected between 1 July 2018 to 30 June 2019, but excludes point of consumption tax (POCT) revenue, which was introduced on 1 January 2019.
NA = Not applicable
R = Revised data
Percentage (%)
BOOKMAKER (AND OTHER) FIXED ODDS
BOOKMAKER (AND OTHER)
POOL BETTING(NA)
TAB FIXED ODDS TAB TOTE ODDSTOTAL
SPORTSBETTING
Australian Gambling Statistics, 1993–94 to 2018–19, 36th edition
297

TABLE WA 46WESTERN AUSTRALIA
TOTAL GAMBLING TURNOVER
1993-94 2,029.999 797.670 - 2,827.6691994-95 2,396.955 857.293 3.249 3,257.4971995-96 2,502.159 923.643 3.271 3,429.0731996-97 2,235.270 921.346 4.964 3,161.5801997-98 2,172.308 986.583 8.875 3,167.7661998-99 1,852.394 1,036.971 11.057 2,900.4221999-00 1,875.287 1,048.051 13.609 2,936.9472000-01 1,847.480 1,059.397 19.103 2,925.9802001-02 1,893.672 1,064.789 25.582 2,984.0432002-03 1,746.009 1,135.631 28.867 2,910.5072003-04 1,915.429 1,208.250 40.811 3,164.4902004-05 2,047.324 1,352.735 41.679 3,441.7382005-06 2,240.977 1,443.984 59.429 3,744.3902006-07 2,805.420 1,594.396 70.857 4,470.6732007-08 3,018.325 1,623.275 82.799 4,724.3992008-09 3,327.062 1,691.097 101.450 5,119.6092009-10 3,302.561 1,544.430 169.811 5,016.8022010-11 3,311.365 1,714.628 157.551 5,183.5442011-12 3,802.095 1,889.675 181.387 5,873.1572012-13 3,830.896 1,923.721 230.223 5,984.8402013-14 4,302.936 1,820.406 412.207 6,535.5492014-15 4,553.024 1,648.595 531.588 6,733.2072015-16 5,272.530 1,529.267 618.210 7,420.0072016-17 4,408.951 1,875.661 164.938 6,449.5502017-18 4,198.441 1,915.309 164.328 6,278.0782018-19 4,335.660 1,850.548 164.180 6,350.388
Notes: These data should be read in conjunction with the explanatory notes.
Value ($ million)
GAMING RACING SPORTSBETTING TOTAL GAMBLING
Australian Gambling Statistics, 1993–94 to 2018–19, 36th edition
298

TABLE WA 47WESTERN AUSTRALIA
REAL GAMBLING TURNOVER
1993-94 3,772.360 1,482.315 - 5,254.6751994-95 4,313.763 1,542.857 5.847 5,862.4671995-96 4,319.158 1,594.367 5.646 5,919.1711996-97 3,806.631 1,569.038 8.454 5,384.1241997-98 3,699.408 1,680.136 15.114 5,394.6581998-99 3,117.377 1,745.109 18.608 4,881.0941999-00 3,083.145 1,723.092 22.374 4,828.6122000-01 2,864.096 1,642.353 29.615 4,536.0642001-02 2,854.267 1,604.920 38.559 4,497.7452002-03 2,554.098 1,661.224 42.227 4,257.5492003-04 2,735.300 1,725.423 58.280 4,519.0032004-05 2,855.742 1,886.883 58.137 4,800.7622005-06 3,029.567 1,952.116 80.342 5,062.0252006-07 3,683.526 2,093.447 93.035 5,870.0092007-08 3,835.088 2,062.535 105.205 6,002.8282008-09 4,099.544 2,083.739 125.005 6,308.2872009-10 3,974.918 1,858.855 204.382 6,038.1552010-11 3,867.213 2,002.447 183.998 6,053.6582011-12 4,338.190 2,156.119 206.963 6,701.2722012-13 4,272.778 2,145.616 256.779 6,675.1732013-14 4,675.857 1,978.175 447.932 7,101.9632014-15 4,864.233 1,761.280 567.923 7,193.4362015-16 5,554.900 1,611.167 651.318 7,817.3852016-17 4,564.985 1,942.041 170.776 6,677.8012017-18 4,265.736 1,946.009 166.962 6,378.7062018-19 4,335.660 1,850.548 164.180 6,350.388
Notes: These data should be read in conjunction with the explanatory notes.
Value ($ million)
GAMING RACING SPORTSBETTING TOTAL GAMBLING
Australian Gambling Statistics, 1993–94 to 2018–19, 36th edition
299

TABLE WA 48WESTERN AUSTRALIA
PER CAPITA GAMBLING TURNOVER
1993-94 1,647.71 647.45 - 2,295.161994-95 1,907.03 682.07 2.58 2,591.691995-96 1,948.75 719.36 2.55 2,670.661996-97 1,705.01 702.78 3.79 2,411.581997-98 1,625.53 738.26 6.64 2,370.431998-99 1,361.81 762.34 8.13 2,132.291999-00 1,355.84 757.75 9.84 2,123.432000-01 1,313.40 753.14 13.58 2,080.112001-02 1,323.90 744.41 17.88 2,086.202002-03 1,200.87 781.06 19.85 2,001.782003-04 1,294.68 816.68 27.59 2,138.952004-05 1,358.30 897.47 27.65 2,283.432005-06 1,456.67 938.61 38.63 2,433.912006-07 1,777.90 1,010.43 44.90 2,833.232007-08 1,853.60 996.88 50.85 2,901.322008-09 1,975.18 1,003.96 60.23 3,039.362009-10 1,904.14 890.46 97.91 2,892.512010-11 1,858.02 962.09 88.40 2,908.512011-12 2,068.78 1,028.20 98.70 3,195.682012-13 2,025.26 1,017.01 121.71 3,163.982013-14 2,232.09 944.31 213.83 3,390.232014-15 2,337.21 846.27 272.88 3,456.362015-16 2,687.49 779.49 315.11 3,782.092016-17 2,233.67 950.25 83.56 3,267.482017-18 2,110.57 962.83 82.61 3,156.022018-19 2,159.68 921.79 81.78 3,163.25
Notes: These data should be read in conjunction with the explanatory notes.
Value ($)
GAMING RACING SPORTSBETTING TOTAL GAMBLING
Australian Gambling Statistics, 1993–94 to 2018–19, 36th edition
300

TABLE WA 49WESTERN AUSTRALIA
REAL PER CAPITA GAMBLING TURNOVER
1993-94 3,061.95 1,203.17 - 4,265.111994-95 3,432.06 1,227.51 4.65 4,664.221995-96 3,363.88 1,241.74 4.40 4,610.011996-97 2,903.61 1,196.83 6.45 4,106.891997-98 2,768.25 1,257.24 11.31 4,036.801998-99 2,291.78 1,282.94 13.68 3,588.401999-00 2,229.13 1,245.81 16.18 3,491.112000-01 2,036.12 1,167.57 21.05 3,224.742001-02 1,995.47 1,122.03 26.96 3,144.462002-03 1,756.65 1,142.55 29.04 2,928.252003-04 1,848.85 1,166.25 39.39 3,054.502004-05 1,894.65 1,251.86 38.57 3,185.072005-06 1,969.27 1,268.91 52.22 3,290.402006-07 2,334.38 1,326.69 58.96 3,720.042007-08 2,355.18 1,266.63 64.61 3,686.422008-09 2,433.78 1,237.05 74.21 3,745.052009-10 2,291.79 1,071.75 117.84 3,481.382010-11 2,169.91 1,123.58 103.24 3,396.742011-12 2,360.48 1,173.18 112.61 3,646.272012-13 2,258.87 1,134.31 135.75 3,528.942013-14 2,425.54 1,026.15 232.36 3,684.052014-15 2,496.96 904.12 291.53 3,692.612015-16 2,831.41 821.24 331.99 3,984.642016-17 2,312.72 983.88 86.52 3,383.122017-18 2,144.40 978.27 83.93 3,206.602018-19 2,159.68 921.79 81.78 3,163.25
Notes: These data should be read in conjunction with the explanatory notes.
Value ($)
GAMING RACING SPORTSBETTING TOTAL GAMBLING
Australian Gambling Statistics, 1993–94 to 2018–19, 36th edition
301

TABLE WA 50WESTERN AUSTRALIA
TOTAL GAMBLING EXPENDITURE
1993-94 503.492 124.138 - 627.6301994-95 559.906 128.020 0.403 688.3291995-96 616.350 136.788 0.448 753.5861996-97 561.288 137.705 0.595 699.5881997-98 550.624 147.424 0.838 698.8861998-99 489.782 155.132 1.022 645.9361999-00 495.812 159.486 1.229 656.5272000-01 492.361 163.768 1.535 657.6642001-02 501.508 169.479 2.453 673.4402002-03 485.194 181.714 2.790 669.6982003-04 530.176 194.280 4.209 728.6652004-05 560.813 220.163 4.872 785.8482005-06 608.112 236.393 7.481 851.9862006-07 738.901 259.314 8.302 1,006.5172007-08 794.524 268.506 8.740 1,071.7702008-09 876.807 276.872 10.479 1,164.1592009-10 864.952 252.646 19.224 1,136.8222010-11 828.078 275.404 15.178 1,118.6602011-12 993.052 303.407 16.955 1,313.4142012-13 989.953 315.075 23.656 1,328.6842013-14 1,155.900 302.046 53.393 1,511.3392014-15 1,223.843 281.602 71.786 1,577.2312015-16 1,165.160 264.460 80.454 1,510.0742016-17 1,018.657 319.721 11.828 1,350.2062017-18 970.290 321.187 15.796 1,307.2732018-19 995.496 310.244 10.697 1,316.437
Notes: These data should be read in conjunction with the explanatory notes.
Value ($ million)
GAMING RACING SPORTSBETTING TOTAL GAMBLING
Australian Gambling Statistics, 1993–94 to 2018–19, 36th edition
302

TABLE WA 51WESTERN AUSTRALIA
REAL GAMBLING EXPENDITURE
1993-94 935.643 230.686 - 1,166.3291994-95 1,007.654 230.396 0.725 1,238.7751995-96 1,063.927 236.120 0.773 1,300.8201996-97 955.864 234.510 1.013 1,191.3871997-98 937.704 251.061 1.427 1,190.1921998-99 824.250 261.070 1.720 1,087.0401999-00 815.161 262.210 2.021 1,079.3912000-01 763.293 253.885 2.380 1,019.5582001-02 755.906 255.450 3.697 1,015.0532002-03 709.752 265.815 4.081 979.6482003-04 757.110 277.439 6.011 1,040.5592004-05 782.259 307.098 6.796 1,096.1522005-06 822.104 319.579 10.114 1,151.7972006-07 970.180 340.480 10.901 1,321.5602007-08 1,009.523 341.164 11.105 1,361.7922008-09 1,080.386 341.157 12.912 1,434.4552009-10 1,041.045 304.081 23.138 1,368.2642010-11 967.080 321.634 17.726 1,306.4392011-12 1,133.072 346.187 19.345 1,498.6052012-13 1,104.141 351.418 26.385 1,481.9442013-14 1,256.078 328.223 58.020 1,642.3222014-15 1,307.495 300.850 76.693 1,685.0382015-16 1,227.560 278.623 84.763 1,590.9462016-17 1,054.707 331.036 12.247 1,397.9902017-18 985.842 326.335 16.049 1,328.2272018-19 995.496 310.244 10.697 1,316.437
Notes: These data should be read in conjunction with the explanatory notes.
Value ($ million)
GAMING RACING SPORTSBETTING TOTAL GAMBLING
Australian Gambling Statistics, 1993–94 to 2018–19, 36th edition
303

TABLE WA 52WESTERN AUSTRALIA
PER CAPITA GAMBLING EXPENDITURE
1993-94 408.67 100.76 - 509.431994-95 445.46 101.85 0.32 547.641995-96 480.03 106.53 0.35 586.911996-97 428.14 105.04 0.45 533.631997-98 412.03 110.32 0.63 522.971998-99 360.07 114.05 0.75 474.871999-00 358.47 115.31 0.89 474.672000-01 350.03 116.42 1.09 467.542001-02 350.61 118.49 1.71 470.822002-03 333.71 124.98 1.92 460.602003-04 358.36 131.32 2.84 492.522004-05 372.07 146.07 3.23 521.372005-06 395.28 153.66 4.86 553.802006-07 468.27 164.34 5.26 637.872007-08 487.93 164.89 5.37 658.192008-09 520.54 164.37 6.22 691.132009-10 498.70 145.67 11.08 655.452010-11 464.64 154.53 8.52 627.692011-12 540.34 165.09 9.23 714.652012-13 523.35 166.57 12.51 702.432013-14 599.61 156.68 27.70 783.992014-15 628.24 144.55 36.85 809.642015-16 593.90 134.80 41.01 769.712016-17 516.07 161.98 5.99 684.042017-18 487.77 161.46 7.94 657.172018-19 495.88 154.54 5.33 655.74
Notes: These data should be read in conjunction with the explanatory notes.
Value ($)
GAMING RACING SPORTSBETTING TOTAL GAMBLING
Australian Gambling Statistics, 1993–94 to 2018–19, 36th edition
304

TABLE WA 53WESTERN AUSTRALIA
REAL PER CAPITA GAMBLING EXPENDITURE
1993-94 759.44 187.24 - 946.691994-95 801.70 183.30 0.58 985.581995-96 828.62 183.90 0.60 1,013.111996-97 729.11 178.88 0.77 908.761997-98 701.68 187.87 1.07 890.621998-99 605.96 191.93 1.26 799.151999-00 589.37 189.58 1.46 780.412000-01 542.63 180.49 1.69 724.822001-02 528.47 178.59 2.58 709.642002-03 488.15 182.82 2.81 673.782003-04 511.75 187.53 4.06 703.342004-05 518.99 203.74 4.51 727.242005-06 534.38 207.73 6.57 748.692006-07 614.84 215.77 6.91 837.522007-08 619.96 209.51 6.82 836.302008-09 641.39 202.53 7.67 851.592009-10 600.23 175.32 13.34 788.892010-11 542.63 180.47 9.95 733.052011-12 616.52 188.37 10.53 815.412012-13 583.72 185.78 13.95 783.452013-14 651.57 170.26 30.10 851.932014-15 671.18 154.44 39.37 864.982015-16 625.71 142.02 43.20 810.932016-17 534.34 167.71 6.20 708.252017-18 495.59 164.05 8.07 667.712018-19 495.88 154.54 5.33 655.74
Notes: These data should be read in conjunction with the explanatory notes.
Value ($)
GAMING RACING SPORTSBETTING TOTAL GAMBLING
Australian Gambling Statistics, 1993–94 to 2018–19, 36th edition
305

TABLE WA 54WESTERN AUSTRALIA
GAMBLING EXPENDITUREAS A % OF HDI
1993-94 1.798 0.443 - 2.2411994-95 1.859 0.425 0.001 2.2851995-96 1.941 0.431 0.001 2.3731996-97 1.681 0.412 0.002 2.0951997-98 1.578 0.423 0.002 2.0031998-99 1.326 0.420 0.003 1.7491999-00 1.269 0.408 0.003 1.6812000-01 1.181 0.393 0.004 1.5782001-02 1.055 0.357 0.005 1.4172002-03 0.984 0.369 0.006 1.3582003-04 0.985 0.361 0.008 1.3542004-05 0.973 0.382 0.008 1.3642005-06 0.996 0.387 0.012 1.3952006-07 1.053 0.370 0.012 1.4342007-08 0.970 0.328 0.011 1.3082008-09 0.953 0.301 0.011 1.2662009-10 0.899 0.263 0.020 1.1822010-11 0.782 0.260 0.014 1.0562011-12 0.846 0.258 0.014 1.1192012-13 0.793 0.252 0.019 1.0652013-14 0.880 0.230 0.041 1.1512014-15 0.886 0.204 0.052 1.1422015-16 0.837 0.190 0.058 1.0852016-17 0.748 0.235 0.009 0.9922017-18 0.700 0.232 0.011 0.9432018-19 0.712 0.222 0.008 0.942
Notes: These data should be read in conjunction with the explanatory notes.
RACING SPORTSBETTING TOTAL GAMBLING
Percentage (%)
GAMING
Australian Gambling Statistics, 1993–94 to 2018–19, 36th edition
306

TABLE WA 55WESTERN AUSTRALIA
GAMBLING EXPENDITUREAS A % OF TOTAL GAMBLING EXPENDITURE
1993-94 80.22 19.78 -1994-95 81.34 18.60 0.061995-96 81.79 18.15 0.061996-97 80.23 19.68 0.091997-98 78.79 21.09 0.121998-99 75.83 24.02 0.161999-00 75.52 24.29 0.192000-01 74.87 24.90 0.232001-02 74.47 25.17 0.362002-03 72.45 27.13 0.422003-04 72.76 26.66 0.582004-05 71.36 28.02 0.622005-06 71.38 27.75 0.882006-07 73.41 25.76 0.822007-08 74.13 25.05 0.822008-09 75.32 23.78 0.902009-10 76.09 22.22 1.692010-11 74.02 24.62 1.362011-12 75.61 23.10 1.292012-13 74.51 23.71 1.782013-14 76.48 19.99 3.532014-15 77.59 17.85 4.552015-16 77.16 17.51 5.332016-17 75.44 23.68 0.882017-18 74.22 24.57 1.212018-19 75.62 23.57 0.81
Notes: These data should be read in conjunction with the explanatory notes.
Percentage (%)
GAMING RACING SPORTSBETTING
Australian Gambling Statistics, 1993–94 to 2018–19, 36th edition
307

TABLE WA 56WESTERN AUSTRALIA
GOVERNMENT REVENUE FROM GAMBLING
1993-94 146.332 39.632 - 185.9641994-95 163.737 42.236 0.092 206.0651995-96 184.684 44.511 0.103 229.2981996-97 171.178 33.824 0.119 205.1211997-98 180.039 36.670 0.168 216.8771998-99 169.849 38.960 0.164 208.9731999-00 168.391 40.654 0.187 209.2322000-01 176.737 42.297 0.125 219.1592001-02 178.953 44.345 0.197 223.4952002-03 182.347 48.069 0.258 230.6742003-04 197.188 51.544 0.355 249.0872004-05 213.740 52.574 0.406 266.7202005-06 225.836 57.031 0.515 283.3822006-07 264.161 60.782 0.824 325.7672007-08 289.804 29.681 0.964 320.4492008-09 325.250 31.150 1.187 357.5872009-10 327.790 29.721 1.938 359.4492010-11 329.066 32.310 1.684 363.0602011-12 364.048 35.747 0.663 400.4582012-13 381.473 37.707 2.710 421.8902013-14 399.440 36.756 5.960 442.1562014-15 393.845 34.141 8.136 436.1222015-16 347.060 32.249 9.656 388.9652016-17 327.960 39.453 0.898 368.3112017-18 321.392 40.627 0.884 362.9032018-19 341.875 40.362 1.544 383.781
Notes: These data should be read in conjunction with the explanatory notes.
Figure(s) may be incomplete for any period due to some unavailable revenue figures that are used to derive these numbers.
Data for the gambling revenue received by states and territories from 1 July 2000 onwards are not comparable
with that of preceding years because of the impact of changes brought about by the introduction of the GST.
Value ($ million)
GAMING RACING SPORTSBETTING TOTAL GAMBLING
Australian Gambling Statistics, 1993–94 to 2018–19, 36th edition
308

TABLE WA 57WESTERN AUSTRALIA
REAL GOVERNMENT REVENUE FROM GAMBLING
1993-94 271.930 73.648 - 345.5781994-95 294.675 76.011 0.166 370.8521995-96 318.796 76.834 0.178 395.8081996-97 291.514 57.602 0.203 349.3181997-98 306.604 62.448 0.286 369.3381998-99 285.837 65.565 0.276 351.6791999-00 276.850 66.839 0.307 343.9972000-01 273.990 65.572 0.194 339.7562001-02 269.730 66.840 0.297 336.8662002-03 266.741 70.316 0.377 337.4352003-04 281.591 73.607 0.507 355.7052004-05 298.139 73.334 0.566 372.0392005-06 305.307 77.100 0.696 383.1032006-07 346.844 79.807 1.082 427.7332007-08 368.225 37.713 1.225 407.1632008-09 400.767 38.382 1.463 440.6122009-10 394.524 35.772 2.333 432.6282010-11 384.303 37.734 1.967 424.0042011-12 415.379 40.787 0.757 456.9232012-13 425.475 42.056 3.023 470.5542013-14 434.058 39.942 6.477 480.4762014-15 420.765 36.475 8.692 465.9322015-16 365.647 33.976 10.173 409.7962016-17 339.567 40.849 0.930 381.3462017-18 326.543 41.278 0.898 368.7202018-19 341.875 40.362 1.544 383.781
Notes: These data should be read in conjunction with the explanatory notes.
Figure(s) may be incomplete for any period due to some unavailable revenue figures that are used to derive these numbers.
Data for the gambling revenue received by states and territories from 1 July 2000 onwards are not comparable
with that of preceding years because of the impact of changes brought about by the introduction of the GST.
Value ($ million)
GAMING RACING SPORTSBETTING TOTAL GAMBLING
Australian Gambling Statistics, 1993–94 to 2018–19, 36th edition
309

TABLE WA 58WESTERN AUSTRALIA
PER CAPITA REVENUE FROM GAMBLING
1993-94 118.77 32.17 - 150.941994-95 130.27 33.60 0.07 163.951995-96 143.84 34.67 0.08 178.581996-97 130.57 25.80 0.09 156.461997-98 134.72 27.44 0.13 162.291998-99 124.87 28.64 0.12 153.631999-00 121.75 29.39 0.14 151.282000-01 125.64 30.07 0.09 155.802001-02 125.11 31.00 0.14 156.252002-03 125.41 33.06 0.18 158.652003-04 133.28 34.84 0.24 168.362004-05 141.81 34.88 0.27 176.962005-06 146.80 37.07 0.33 184.202006-07 167.41 38.52 0.52 206.452007-08 177.97 18.23 0.59 196.792008-09 193.09 18.49 0.70 212.292009-10 188.99 17.14 1.12 207.252010-11 184.64 18.13 0.95 203.722011-12 198.08 19.45 0.36 217.902012-13 201.67 19.93 1.43 223.042013-14 207.20 19.07 3.09 229.362014-15 202.17 17.53 4.18 223.872015-16 176.90 16.44 4.92 198.262016-17 166.15 19.99 0.45 186.592017-18 161.57 20.42 0.44 182.432018-19 170.29 20.11 0.77 191.17
Notes: These data should be read in conjunction with the explanatory notes.
Figure(s) may be incomplete for any period due to some unavailable revenue figures that are used to derive these numbers.
Data for the gambling revenue received by states and territories from 1 July 2000 onwards are not comparable
with that of preceding years because of the impact of changes brought about by the introduction of the GST.
Value ($)
GAMING RACING SPORTSBETTING TOTAL GAMBLING
Australian Gambling Statistics, 1993–94 to 2018–19, 36th edition
310

TABLE WA 59WESTERN AUSTRALIA
REAL PER CAPITA REVENUE FROM GAMBLING
1993-94 220.72 59.78 - 280.501994-95 234.45 60.48 0.13 295.051995-96 248.29 59.84 0.14 308.271996-97 222.36 43.94 0.15 266.451997-98 229.43 46.73 0.21 276.371998-99 210.14 48.20 0.20 258.541999-00 200.16 48.32 0.22 248.712000-01 194.78 46.62 0.14 241.542001-02 188.57 46.73 0.21 235.512002-03 183.46 48.36 0.26 232.082003-04 190.33 49.75 0.34 240.432004-05 197.80 48.65 0.38 246.832005-06 198.45 50.12 0.45 249.022006-07 219.81 50.58 0.69 271.072007-08 226.13 23.16 0.75 250.042008-09 237.92 22.79 0.87 261.582009-10 227.47 20.62 1.34 249.442010-11 215.63 21.17 1.10 237.912011-12 226.01 22.19 0.41 248.622012-13 224.93 22.23 1.60 248.772013-14 225.16 20.72 3.36 249.242014-15 215.99 18.72 4.46 239.182015-16 186.38 17.32 5.19 208.882016-17 172.03 20.70 0.47 193.202017-18 164.15 20.75 0.45 185.362018-19 170.29 20.11 0.77 191.17
Notes: These data should be read in conjunction with the explanatory notes.
Figure(s) may be incomplete for any period due to some unavailable revenue figures that are used to derive these numbers.
Data for the gambling revenue received by states and territories from 1 July 2000 onwards are not comparable
with that of preceding years because of the impact of changes brought about by the introduction of the GST.
Value ($)
GAMING RACING SPORTSBETTING TOTAL GAMBLING
Australian Gambling Statistics, 1993–94 to 2018–19, 36th edition
311

TABLE WA 60WESTERN AUSTRALIA
GOVERNMENT REVENUE FROM GAMBLINGAS A % OF TOTAL GAMBLING REVENUE
1993-94 78.69 21.31 -1994-95 79.46 20.50 0.041995-96 80.54 19.41 0.041996-97 83.45 16.49 0.061997-98 83.01 16.91 0.081998-99 81.28 18.64 0.081999-00 80.48 19.43 0.092000-01 80.64 19.30 0.062001-02 80.07 19.84 0.092002-03 79.05 20.84 0.112003-04 79.16 20.69 0.142004-05 80.14 19.71 0.152005-06 79.69 20.13 0.182006-07 81.09 18.66 0.252007-08 90.44 9.26 0.302008-09 90.96 8.71 0.332009-10 91.19 8.27 0.542010-11 90.64 8.90 0.462011-12 90.91 8.93 0.172012-13 90.42 8.94 0.642013-14 90.34 8.31 1.352014-15 90.31 7.83 1.872015-16 89.23 8.29 2.482016-17 89.04 10.71 0.242017-18 88.56 11.20 0.242018-19 89.08 10.52 0.40
Notes: These data should be read in conjunction with the explanatory notes.
Figure(s) may be incomplete for any period due to some unavailable revenue figures that are used to derive these numbers.
Data for the gambling revenue received by states and territories from 1 July 2000 onwards are not comparable
with that of preceding years because of the impact of changes brought about by the introduction of the GST.
Percentage (%)
GAMING RACING SPORTSBETTING
Australian Gambling Statistics, 1993–94 to 2018–19, 36th edition
312

TABLE WA 61WESTERN AUSTRALIA
GAMING MACHINES OPERATING AS AT 30 JUNE
2001-02 1,283 - - 1,283 2002-03 1,286 - - 1,286 2003-04 1,300 - - 1,300 2004-05 1,500 - - 1,500 2005-06 1,500 - - 1,500 2006-07 1,750 - - 1,750 2007-08 1,750 - - 1,750 2008-09 1,750 - - 1,750 2009-10 1,750 - - 1,750 2010-11 2,000 - - 2,000 2011-12 2,000 - - 2,000 2012-13 2,100 - - 2,100 2013-14 2,192 - - 2,192 2014-15 2,252 - - 2,252 2015-16 2,190 - - 2,190 2016-17 2,402 - - 2,402 2017-18 2,419 - - 2,419 2018-19 2,466 - - 2,466
Notes: These data should be read in conjunction with the explanatory notes.
NA = Not applicable
NUMBER
CASINOSCLUBS
(NA)HOTELS
(NA)TOTAL MACHINES
Australian Gambling Statistics, 1993–94 to 2018–19, 36th edition
313

TABLE TAS 1TASMANIA
TOTAL RACING TURNOVER
1993-94 - 27.732 13.276 221.512 262.5201994-95 - 20.218 14.244 267.060 301.5221995-96 - 15.365 14.089 253.145 282.5991996-97 - 16.894 13.532 226.116 256.5421997-98 - 14.891 12.626 204.833 232.3501998-99 - 11.603 11.491 206.855 229.9491999-00 - 10.301 10.849 195.108 216.2582000-01 - 11.376 10.987 208.395 230.7582001-02 - 6.674 10.445 229.493 246.6122002-03 - 4.460 9.701 261.980 276.1412003-04 - 4.424 10.296 273.879 288.5992004-05 - 4.316 11.291 286.660 302.2672005-06 - 5.193 11.564 302.550 319.3072006-07 - 4.212 11.586 366.891 382.6892007-08 - 4.514 11.660 466.290 482.4642008-09 - 4.600 10.818 631.156 646.5742009-10 - 3.863 10.580 712.341 726.7842010-11 - 2.890 10.331 933.736 946.9572011-12 - 2.220 9.268 915.285 926.7732012-13 - 1.740 6.661 198.217 206.6192013-14 - 1.378 7.632 282.909 291.9192014-15 - 1.269 7.798 326.044 335.1112015-16 - 0.905 6.536 381.671 389.1122016-17 - 0.851 5.903 R 369.543 376.297 R
2017-18 - 0.685 5.483 367.459 373.6272018-19 - 0.560 4.733 298.840 304.132
Notes: These data should be read in conjunction with the explanatory notes.
NA = Not applicable
R = Revised data
TOTAL RACING
Value ($ million)
BOOKMAKERS OFF COURSE
(NA)
BOOKMAKERS ON COURSE
ON-COURSE TOTALISATOR
TAB
Australian Gambling Statistics, 1993–94 to 2018–19, 36th edition
314

TABLE TAS 2TASMANIA
REAL RACING TURNOVER
1993-94 - 51.535 24.671 411.637 487.8431994-95 - 36.386 25.635 480.624 542.6441995-96 - 26.523 24.320 436.972 487.8151996-97 - 28.770 23.045 385.072 436.8871997-98 - 25.359 21.502 348.828 395.6891998-99 - 19.527 19.338 348.114 386.9791999-00 - 16.936 17.836 320.775 355.5472000-01 - 17.636 17.033 323.069 357.7382001-02 - 10.059 15.743 345.907 371.7102002-03 - 6.524 14.191 383.230 403.9452003-04 - 6.318 14.703 391.109 412.1292004-05 - 6.020 15.749 399.852 421.6222005-06 - 7.020 15.633 409.016 431.6702006-07 - 5.530 15.212 481.729 502.4722007-08 - 5.735 14.815 592.469 613.0192008-09 - 5.668 13.330 777.699 796.6962009-10 - 4.649 12.734 857.364 874.7472010-11 - 3.375 12.065 1,090.474 1,105.9142011-12 - 2.533 10.575 1,044.340 1,057.4482012-13 - 1.941 7.430 221.081 230.4522013-14 - 1.497 8.293 307.428 317.2192014-15 - 1.356 8.331 348.330 358.0172015-16 - 0.953 6.886 402.111 409.9512016-17 - 0.881 6.112 R 382.621 389.614 R
2017-18 - 0.696 5.571 373.349 379.6162018-19 - 0.560 4.733 298.840 304.132
Notes: These data should be read in conjunction with the explanatory notes.
NA = Not applicable
R = Revised data
TOTAL RACING
Value ($ million)
BOOKMAKERS OFF COURSE
(NA)
BOOKMAKERS ON COURSE
ON-COURSE TOTALISATOR
TAB
Australian Gambling Statistics, 1993–94 to 2018–19, 36th edition
315

TABLE TAS 3TASMANIA
PER CAPITA RACING TURNOVER
1993-94 - 80.47 38.53 642.80 761.801994-95 - 58.38 41.13 771.11 870.621995-96 - 44.18 40.51 727.95 812.641996-97 - 48.42 38.79 648.13 735.341997-98 - 42.60 36.12 586.05 664.771998-99 - 33.14 32.82 590.82 656.781999-00 - 29.33 30.89 555.46 615.682000-01 - 32.26 31.16 590.93 654.352001-02 - 18.84 29.48 647.72 696.042002-03 - 12.46 27.11 731.99 771.562003-04 - 12.19 28.36 754.52 795.072004-05 - 11.75 30.74 780.53 823.032005-06 - 14.01 31.20 816.35 861.572006-07 - 11.26 30.96 980.56 1,022.782007-08 - 11.92 30.79 1,231.42 1,274.132008-09 - 11.98 28.17 1,643.76 1,683.912009-10 - 9.93 27.19 1,830.60 1,867.712010-11 - 7.35 26.27 2,374.64 2,408.262011-12 - 5.61 23.42 2,313.34 2,342.372012-13 - 4.38 16.77 499.07 520.222013-14 - 3.45 19.13 708.94 731.522014-15 - 3.16 19.43 812.45 835.042015-16 - 2.24 16.19 945.36 963.792016-17 - 2.09 14.48 R 906.77 923.35 R
2017-18 - 1.66 13.28 889.90 904.832018-19 - 1.34 11.30 713.37 726.01
Notes: These data should be read in conjunction with the explanatory notes.
NA = Not applicable
R = Revised data
TOTAL RACING
Value ($)
BOOKMAKERS OFF COURSE
(NA)
BOOKMAKERS ON COURSE
ON-COURSE TOTALISATOR
TAB
Australian Gambling Statistics, 1993–94 to 2018–19, 36th edition
316

TABLE TAS 4TASMANIA
REAL PER CAPITA RACING TURNOVER
1993-94 - 149.55 71.59 1,194.52 1,415.661994-95 - 105.06 74.02 1,387.76 1,566.841995-96 - 76.27 69.93 1,256.56 1,402.761996-97 - 82.47 66.05 1,103.75 1,252.271997-98 - 72.55 61.52 998.03 1,132.101998-99 - 55.77 55.23 994.28 1,105.281999-00 - 48.22 50.78 913.23 1,012.232000-01 - 50.01 48.30 916.11 1,014.422001-02 - 28.39 44.43 976.29 1,049.122002-03 - 18.23 39.65 1,070.77 1,128.652003-04 - 17.40 40.51 1,077.48 1,135.392004-05 - 16.39 42.88 1,088.74 1,148.012005-06 - 18.94 42.18 1,103.62 1,164.752006-07 - 14.78 40.66 1,287.47 1,342.912007-08 - 15.15 39.13 1,564.64 1,618.922008-09 - 14.76 34.72 2,025.41 2,074.892009-10 - 11.95 32.72 2,203.28 2,247.952010-11 - 8.58 30.68 2,773.25 2,812.522011-12 - 6.40 26.73 2,639.52 2,672.642012-13 - 4.89 18.71 556.63 580.222013-14 - 3.75 20.78 770.38 794.922014-15 - 3.38 20.76 867.98 892.122015-16 - 2.36 17.06 995.99 1,015.412016-17 - 2.16 15.00 R 938.86 956.02 R
2017-18 - 1.69 13.49 904.16 919.342018-19 - 1.34 11.30 713.37 726.01
Notes: These data should be read in conjunction with the explanatory notes.
NA = Not applicable
R = Revised data
TOTAL RACING
Value ($)
BOOKMAKERS OFF COURSE
(NA)
BOOKMAKERS ON COURSE
ON-COURSE TOTALISATOR
TAB
Australian Gambling Statistics, 1993–94 to 2018–19, 36th edition
317

TABLE TAS 5TASMANIA
TOTAL RACING EXPENDITURE
1993-94 - 1.525 1.914 31.571 35.0101994-95 - 1.112 1.726 32.784 35.6221995-96 - 0.845 1.847 32.524 35.2161996-97 - 0.929 1.362 30.897 33.1881997-98 - 0.819 1.758 29.273 31.8501998-99 - 0.676 1.542 27.454 29.6721999-00 - 0.567 1.412 26.306 28.2852000-01 - 0.626 1.418 26.904 28.9482001-02 - 0.367 1.168 25.662 27.1972002-03 - 0.252 1.413 23.830 25.4952003-04 - 0.243 0.893 23.721 24.8572004-05 - 0.237 1.019 25.874 27.1302005-06 - 0.286 1.924 50.389 52.5992006-07 - 0.232 1.887 59.750 61.8692007-08 - 0.248 1.830 73.290 75.3682008-09 - 0.253 1.595 93.029 94.8772009-10 - 0.212 1.354 91.892 93.4582010-11 - 0.159 1.634 99.289 101.0822011-12 - 0.122 1.431 96.360 97.9132012-13 - 0.096 1.018 38.213 39.3272013-14 - 0.076 0.909 40.746 41.7312014-15 - 0.069 0.933 42.357 43.3592015-16 - 0.049 0.865 44.554 45.4682016-17 - 0.047 0.683 R 40.002 40.732 R
2017-18 - 0.038 0.752 41.929 42.7192018-19 - 0.031 0.679 39.315 40.025
Notes: These data should be read in conjunction with the explanatory notes.
(1) Expenditure is estimated as 5.5% of turnover (rounded to nearest $1,000).
NA = Not applicable
R = Revised data
TOTAL RACING
Value ($ million)
BOOKMAKERS OFF COURSE
(NA)
BOOKMAKERS ON COURSE
(1)
ON-COURSE TOTALISATOR
TAB
Australian Gambling Statistics, 1993–94 to 2018–19, 36th edition
318

TABLE TAS 6TASMANIA
REAL RACING EXPENDITURE
1993-94 - 2.834 3.557 58.669 65.0601994-95 - 2.001 3.106 59.001 64.1081995-96 - 1.459 3.188 56.142 60.7891996-97 - 1.582 2.319 52.617 56.5191997-98 - 1.395 2.994 49.851 54.2401998-99 - 1.138 2.595 46.202 49.9351999-00 - 0.932 2.321 43.249 46.5032000-01 - 0.970 2.198 41.709 44.8772001-02 - 0.553 1.760 38.679 40.9932002-03 - 0.369 2.067 34.859 37.2952003-04 - 0.347 1.275 33.874 35.4972004-05 - 0.331 1.421 36.091 37.8432005-06 - 0.387 2.601 68.121 71.1082006-07 - 0.305 2.478 78.452 81.2342007-08 - 0.315 2.325 93.122 95.7632008-09 - 0.312 1.965 114.629 116.9062009-10 - 0.255 1.630 110.600 112.4852010-11 - 0.186 1.908 115.956 118.0502011-12 - 0.139 1.633 109.947 111.7192012-13 - 0.107 1.135 42.621 43.8632013-14 - 0.083 0.988 44.277 45.3482014-15 - 0.074 0.997 45.252 46.3232015-16 - 0.052 0.911 46.940 47.9032016-17 - 0.049 0.707 R 41.418 42.174 R
2017-18 - 0.039 0.764 42.601 43.4042018-19 - 0.031 0.679 39.315 40.025
Notes: These data should be read in conjunction with the explanatory notes.
(1) Expenditure is estimated as 5.5% of turnover (rounded to nearest $1,000).
NA = Not applicable
R = Revised data
TOTAL RACING
Value ($ million)
BOOKMAKERS OFF COURSE
(NA)
BOOKMAKERS ON COURSE
(1)
ON-COURSE TOTALISATOR
TAB
Australian Gambling Statistics, 1993–94 to 2018–19, 36th edition
319

TABLE TAS 7TASMANIA
PER CAPITA RACING EXPENDITURE
1993-94 - 4.43 5.55 91.62 101.601994-95 - 3.21 4.98 94.66 102.861995-96 - 2.43 5.31 93.53 101.271996-97 - 2.66 3.90 88.56 95.131997-98 - 2.34 5.03 83.75 91.131998-99 - 1.93 4.40 78.41 84.751999-00 - 1.61 4.02 74.89 80.532000-01 - 1.78 4.02 76.29 82.092001-02 - 1.04 3.30 72.43 76.762002-03 - 0.70 3.95 66.58 71.232003-04 - 0.67 2.46 65.35 68.482004-05 - 0.65 2.77 70.45 73.872005-06 - 0.77 5.19 135.96 141.922006-07 - 0.62 5.04 159.69 165.352007-08 - 0.65 4.83 193.55 199.042008-09 - 0.66 4.15 242.28 247.092009-10 - 0.54 3.48 236.15 240.172010-11 - 0.40 4.16 252.51 257.072011-12 - 0.31 3.62 243.54 247.472012-13 - 0.24 2.56 96.21 99.022013-14 - 0.19 2.28 102.11 104.572014-15 - 0.17 2.32 105.55 108.042015-16 - 0.12 2.14 110.36 112.622016-17 - 0.12 1.68 R 98.16 99.95 R
2017-18 - 0.09 1.82 101.54 103.462018-19 - 0.07 1.62 93.85 95.55
Notes: These data should be read in conjunction with the explanatory notes.
(1) Expenditure is estimated as 5.5% of turnover (rounded to nearest $1,000).
NA = Not applicable
R = Revised data
TOTAL RACING
Value ($)
BOOKMAKERS OFF COURSE
(NA)
BOOKMAKERS ON COURSE
(1)
ON-COURSE TOTALISATOR
TAB
Australian Gambling Statistics, 1993–94 to 2018–19, 36th edition
320

TABLE TAS 8TASMANIA
REAL PER CAPITA RACING EXPENDITURE
1993-94 - 8.23 10.32 170.25 188.801994-95 - 5.78 8.97 170.36 185.111995-96 - 4.19 9.17 161.44 174.811996-97 - 4.53 6.65 150.82 162.001997-98 - 3.99 8.57 142.63 155.191998-99 - 3.25 7.41 131.96 142.621999-00 - 2.65 6.61 123.13 132.392000-01 - 2.75 6.23 118.27 127.262001-02 - 1.56 4.97 109.17 115.702002-03 - 1.03 5.78 97.40 104.202003-04 - 0.96 3.51 93.32 97.792004-05 - 0.90 3.87 98.27 103.042005-06 - 1.04 7.02 183.81 191.872006-07 - 0.81 6.62 209.67 217.112007-08 - 0.83 6.14 245.93 252.902008-09 - 0.81 5.12 298.53 304.462009-10 - 0.66 4.19 284.22 289.072010-11 - 0.47 4.85 294.89 300.222011-12 - 0.35 4.13 277.88 282.362012-13 - 0.27 2.86 107.31 110.442013-14 - 0.21 2.48 110.95 113.642014-15 - 0.18 2.48 112.76 115.432015-16 - 0.13 2.26 116.27 118.652016-17 - 0.12 1.74 R 101.63 103.48 R
2017-18 - 0.09 1.85 103.17 105.112018-19 - 0.07 1.62 93.85 95.55
Notes: These data should be read in conjunction with the explanatory notes.
(1) Expenditure is estimated as 5.5% of turnover (rounded to nearest $1,000).
NA = Not applicable
R = Revised data
TOTAL RACING
Value ($)
BOOKMAKERS OFF COURSE
(NA)
BOOKMAKERS ON COURSE
(1)
ON-COURSE TOTALISATOR
TAB
Australian Gambling Statistics, 1993–94 to 2018–19, 36th edition
321

TABLE TAS 9TASMANIA
RACING EXPENDITUREAS A % OF HDI
1993-94 - 0.022 0.028 0.457 0.5071994-95 - 0.015 0.024 0.452 0.4911995-96 - 0.011 0.024 0.427 0.4621996-97 - 0.012 0.018 0.397 0.4261997-98 - 0.010 0.022 0.370 0.4021998-99 - 0.008 0.019 0.342 0.3701999-00 - 0.007 0.017 0.312 0.3362000-01 - 0.007 0.016 0.307 0.3302001-02 - 0.004 0.012 0.261 0.2772002-03 - 0.002 0.014 0.233 0.2502003-04 - 0.002 0.008 0.210 0.2202004-05 - 0.002 0.008 0.210 0.2202005-06 - 0.002 0.014 0.374 0.3912006-07 - 0.002 0.013 0.409 0.4242007-08 - 0.002 0.011 0.458 0.4712008-09 - 0.001 0.009 0.524 0.5352009-10 - 0.001 0.007 0.502 0.5112010-11 - 0.001 0.009 0.527 0.5362011-12 - 0.001 0.007 0.504 0.5122012-13 - 0.001 0.005 0.203 0.2092013-14 - 0.000 0.005 0.210 0.2152014-15 - 0.000 0.004 0.201 0.2062015-16 - 0.000 0.004 0.202 0.2062016-17 - 0.000 0.003 R 0.177 0.180 R
2017-18 - 0.000 0.003 0.180 0.1832018-19 - 0.000 0.003 0.162 0.165
Notes: These data should be read in conjunction with the explanatory notes.
(1) Expenditure is estimated as 5.5% of turnover (rounded to nearest $1,000).
NA = Not applicable
R = Revised data
Percentage (%)
BOOKMAKERS OFF COURSE
(NA)
BOOKMAKERS ON COURSE
(1)
ON-COURSE TOTALISATOR
TAB TOTAL RACING
Australian Gambling Statistics, 1993–94 to 2018–19, 36th edition
322

TABLE TAS 10TASMANIA
RACING EXPENDITURESHARE OF MARKET
1993-94 - 4.36 5.47 90.181994-95 - 3.12 4.85 92.031995-96 - 2.40 5.24 92.361996-97 - 2.80 4.10 93.101997-98 - 2.57 5.52 91.911998-99 - 2.28 5.20 92.521999-00 - 2.00 4.99 93.002000-01 - 2.16 4.90 92.942001-02 - 1.35 4.29 94.362002-03 - 0.99 5.54 93.472003-04 - 0.98 3.59 95.432004-05 - 0.87 3.76 95.372005-06 - 0.54 3.66 95.802006-07 - 0.37 3.05 96.582007-08 - 0.33 2.43 97.242008-09 - 0.27 1.68 98.052009-10 - 0.23 1.45 98.322010-11 - 0.16 1.62 98.232011-12 - 0.12 1.46 98.412012-13 - 0.24 2.59 97.172013-14 - 0.18 2.18 97.642014-15 - 0.16 2.15 97.692015-16 - 0.11 1.90 97.992016-17 - 0.12 1.68 R 98.212017-18 - 0.09 1.76 98.152018-19 - 0.08 1.70 98.23
Notes: These data should be read in conjunction with the explanatory notes.
(1) Expenditure is estimated as 5.5% of turnover (rounded to nearest $1,000).
NA = Not applicable
R = Revised data
ON-COURSE TOTALISATOR
TAB
Percentage (%)
BOOKMAKERS OFF COURSE
(NA)
BOOKMAKERS ON COURSE
(1)
Australian Gambling Statistics, 1993–94 to 2018–19, 36th edition
323

TABLE TAS 11TASMANIA
GOVERNMENT REVENUE FROM RACING
1993-94 0.203 0.333 9.551 10.0871994-95 0.149 0.355 11.520 12.0241995-96 0.042 0.325 10.943 11.3101996-97 0.043 0.317 9.996 10.3561997-98 0.036 0.298 8.840 9.1741998-99 0.028 0.229 7.783 8.0401999-00 0.034 0.307 5.940 6.2812000-01 - (1) - (2) 0.709 (2) 0.7092001-02 - - - -2002-03 - - - -2003-04 - - - -2004-05 - - - -2005-06 - - - -2006-07 - - - -2007-08 5.065 (3) - - 5.0652008-09 7.180 - - 7.1802009-10 6.041 - - 6.0412010-11 2.089 (4) - - 2.0892011-12 1.826 - - 1.8262012-13 2.210 - - 2.2102013-14 2.244 - - 2.2442014-15 2.252 - - 2.2522015-16 2.491 - - 2.4912016-17 0.663 (5) - - 0.6632017-18 - - - -2018-19 - - - -
Notes: These data should be read in conjunction with the explanatory notes.
Data for the gambling revenue received by states and territories from 1 July 2000 onwards are not comparable
with that of preceding years because of the impact of changes brought about by the introduction of the GST.
(1) On-course bookmakers ceased to pay tax from 2000-01.
(2) Tote ceased to pay tax from 1 August 2000 on totalisator turnover following its corporatisation.
(3) Government revenue from racing (bookmakers) includes both tax and product levies received, from this period on.
(4) Product levy no longer payable by Betfair from October 2010.
(5) Betfair ceased operations in Tasmania in November 2016.
Value ($ million)
BOOKMAKERSON-COURSE
TOTALISATORTAB TOTAL RACING
Australian Gambling Statistics, 1993–94 to 2018–19, 36th edition
324

TABLE TAS 12TASMANIA
REAL GOVERNMENT REVENUE FROM RACING
1993-94 0.377 0.619 17.749 18.7451994-95 0.268 0.639 20.732 21.6391995-96 0.072 0.561 18.890 19.5231996-97 0.073 0.540 17.023 17.6361997-98 0.061 0.507 15.054 15.6231998-99 0.047 0.385 13.098 13.5301999-00 0.056 0.505 9.766 10.3272000-01 - (1) - (2) 1.099 (2) 1.0992001-02 - - - -2002-03 - - - -2003-04 - - - -2004-05 - - - -2005-06 - - - -2006-07 - - - -2007-08 6.436 (3) - - 6.4362008-09 8.847 - - 8.8472009-10 7.271 - - 7.2712010-11 2.440 (4) - - 2.4402011-12 2.083 - - 2.0832012-13 2.465 - - 2.4652013-14 2.438 - - 2.4382014-15 2.406 - - 2.4062015-16 2.624 - - 2.6242016-17 0.686 (5) - - 0.6862017-18 - - - -2018-19 - - - -
Notes: These data should be read in conjunction with the explanatory notes.
Data for the gambling revenue received by states and territories from 1 July 2000 onwards are not comparable
with that of preceding years because of the impact of changes brought about by the introduction of the GST.
(1) On-course bookmakers ceased to pay tax from 2000-01.
(2) Tote ceased to pay tax from 1 August 2000 on totalisator turnover following its corporatisation.
(3) Government revenue from racing (bookmakers) includes both tax and product levies received, from this period on.
(4) Product levy no longer payable by Betfair from October 2010.
(5) Betfair ceased operations in Tasmania in November 2016.
Value ($ million)
BOOKMAKERSON-COURSE
TOTALISATORTAB TOTAL RACING
Australian Gambling Statistics, 1993–94 to 2018–19, 36th edition
325

TABLE TAS 13TASMANIA
PER CAPITA REVENUE FROM RACING
1993-94 0.59 0.97 27.72 29.271994-95 0.43 1.03 33.26 34.721995-96 0.12 0.93 31.47 32.521996-97 0.12 0.91 28.65 29.681997-98 0.10 0.85 25.29 26.251998-99 0.08 0.65 22.23 22.961999-00 0.10 0.87 16.91 17.882000-01 - (1) - (2) 2.01 (2) 2.012001-02 - - - -2002-03 - - - -2003-04 - - - -2004-05 - - - -2005-06 - - - -2006-07 - - - -2007-08 13.38 (3) - - 13.382008-09 18.70 - - 18.702009-10 15.52 - - 15.522010-11 5.31 (4) - - 5.312011-12 4.62 - - 4.622012-13 5.57 - - 5.572013-14 5.62 - - 5.622014-15 5.61 - - 5.612015-16 6.17 - - 6.172016-17 1.63 (5) - - 1.632017-18 - - - -2018-19 - - - -
Notes: These data should be read in conjunction with the explanatory notes.
Data for the gambling revenue received by states and territories from 1 July 2000 onwards are not comparable
with that of preceding years because of the impact of changes brought about by the introduction of the GST.
(1) On-course bookmakers ceased to pay tax from 2000-01.
(2) Tote ceased to pay tax from 1 August 2000 on totalisator turnover following its corporatisation.
(3) Government revenue from racing (bookmakers) includes both tax and product levies received, from this period on.
(4) Product levy no longer payable by Betfair from October 2010.
(5) Betfair ceased operations in Tasmania in November 2016.
Value ($)
BOOKMAKERSON-COURSE
TOTALISATORTAB TOTAL RACING
Australian Gambling Statistics, 1993–94 to 2018–19, 36th edition
326
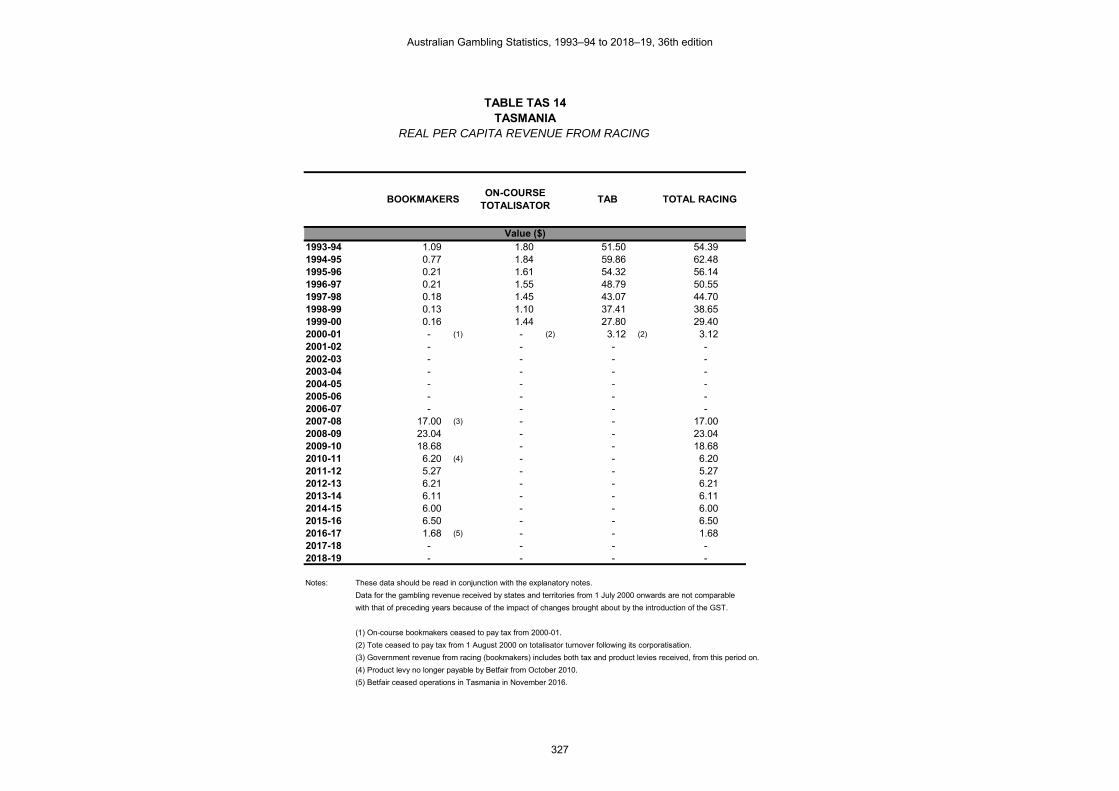
TABLE TAS 14TASMANIA
REAL PER CAPITA REVENUE FROM RACING
1993-94 1.09 1.80 51.50 54.391994-95 0.77 1.84 59.86 62.481995-96 0.21 1.61 54.32 56.141996-97 0.21 1.55 48.79 50.551997-98 0.18 1.45 43.07 44.701998-99 0.13 1.10 37.41 38.651999-00 0.16 1.44 27.80 29.402000-01 - (1) - (2) 3.12 (2) 3.122001-02 - - - -2002-03 - - - -2003-04 - - - -2004-05 - - - -2005-06 - - - -2006-07 - - - -2007-08 17.00 (3) - - 17.002008-09 23.04 - - 23.042009-10 18.68 - - 18.682010-11 6.20 (4) - - 6.202011-12 5.27 - - 5.272012-13 6.21 - - 6.212013-14 6.11 - - 6.112014-15 6.00 - - 6.002015-16 6.50 - - 6.502016-17 1.68 (5) - - 1.682017-18 - - - -2018-19 - - - -
Notes: These data should be read in conjunction with the explanatory notes.
Data for the gambling revenue received by states and territories from 1 July 2000 onwards are not comparable
with that of preceding years because of the impact of changes brought about by the introduction of the GST.
(1) On-course bookmakers ceased to pay tax from 2000-01.
(2) Tote ceased to pay tax from 1 August 2000 on totalisator turnover following its corporatisation.
(3) Government revenue from racing (bookmakers) includes both tax and product levies received, from this period on.
(4) Product levy no longer payable by Betfair from October 2010.
(5) Betfair ceased operations in Tasmania in November 2016.
Value ($)
BOOKMAKERSON-COURSE
TOTALISATORTAB TOTAL RACING
Australian Gambling Statistics, 1993–94 to 2018–19, 36th edition
327

TABLE TAS 15TASMANIA
GOVERNMENT REVENUE FROM RACINGAS A % OF TOTAL GAMBLING REVENUE
1993-94 0.45 0.74 21.20 22.391994-95 0.30 0.71 23.04 24.041995-96 0.08 0.62 21.00 21.711996-97 0.07 0.52 16.47 17.071997-98 0.06 0.47 14.05 14.581998-99 0.04 0.34 11.57 11.951999-00 0.05 0.42 8.08 8.542000-01 - (1) - (2) 1.24 (2) 1.242001-02 - - - -2002-03 - - - -2003-04 - - - -2004-05 - - - -2005-06 - - - -2006-07 - - - -2007-08 5.89 (3) - - 5.892008-09 8.03 - - 8.032009-10 6.76 - - 6.762010-11 2.50 (4) - - 2.502011-12 2.19 - - 2.192012-13 2.70 - - 2.702013-14 2.73 - - 2.732014-15 2.71 - - 2.712015-16 2.94 - - 2.942016-17 0.84 (5) - - 0.842017-18 - - - -2018-19 - - - -
Notes: These data should be read in conjunction with the explanatory notes.
Data for the gambling revenue received by states and territories from 1 July 2000 onwards are not comparable
with that of preceding years because of the impact of changes brought about by the introduction of the GST.
(1) On-course bookmakers ceased to pay tax from 2000-01.
(2) Tote ceased to pay tax from 1 August 2000 on totalisator turnover following its corporatisation.
(3) Government revenue from racing (bookmakers) includes both tax and product levies received, from this period on.
(4) Product levy no longer payable by Betfair from October 2010.
(5) Betfair ceased operations in Tasmania in November 2016.
ON-COURSE TOTALISATOR
TAB TOTAL RACING
Percentage (%)
BOOKMAKERS
Australian Gambling Statistics, 1993–94 to 2018–19, 36th edition
328

TABLE TAS 16TASMANIA
TOTAL GAMING TURNOVER
1993-94 803.839 - 13.995 - - 1.040 52.641 23.257 0.518 895.2901994-95 861.792 - 12.357 - 13.658 1.064 53.583 26.351 0.384 969.1891995-96 891.906 - 10.485 - 50.146 1.167 51.910 24.268 0.315 1,030.1971996-97 946.682 45.002 8.968 - 56.731 1.119 47.733 24.480 0.257 1,130.9721997-98 949.784 206.549 9.023 - 64.030 1.315 47.100 20.729 0.237 1,298.7671998-99 991.041 352.084 8.806 - 66.860 1.390 47.499 19.078 0.220 1,486.9781999-00 915.023 592.659 9.037 - 62.516 1.325 47.957 17.340 0.223 1,646.0802000-01 972.085 749.550 8.455 0.008 (2) 64.512 1.296 52.425 12.465 0.379 1,861.1752001-02 910.872 853.339 8.479 2.453 (2) 64.636 1.347 54.648 13.301 0.180 1,909.2552002-03 926.473 946.164 8.226 1.491 (2) 65.794 2.440 58.286 12.185 0.220 2,021.2792003-04 972.428 1,038.796 8.308 - NA 69.103 2.004 59.175 - (3) 0.198 2,150.0122004-05 1,018.482 1,081.989 8.113 - 78.782 2.040 59.411 - 0.205 2,249.0222005-06 971.277 953.028 8.305 - 82.144 2.005 62.369 - 0.181 2,079.3092006-07 - U - U 8.100 - - U 2.086 65.803 - 0.166 76.155 (4)
2007-08 - U - U 8.276 - - U 2.187 69.082 - 0.166 79.7112008-09 - U - U 8.986 - - U 1.121 67.011 - 0.227 77.3452009-10 - U - U 11.486 - - U 0.612 77.155 - 0.237 89.4902010-11 - U - U 10.893 - - U 0.628 71.668 - 0.199 83.3882011-12 - U - U 11.927 - - U 0.659 77.850 - 0.200 90.6362012-13 - U - U 10.386 - - U 0.650 98.887 - 0.276 110.1992013-14 - U - U 10.687 - - U 0.621 82.103 - 0.237 93.6492014-15 - U - U 11.685 - - U 0.639 81.256 - 0.193 93.7722015-16 - U - U 11.741 - - U 0.647 88.240 - 0.163 100.7902016-17 - U - U 11.596 (5) - - U 0.608 83.743 (5) - 0.196 96.1432017-18 - U - U 11.531 - - U 0.628 87.086 - 0.226 99.4702018-19 - U - U 11.104 - - U 2.233 106.910 - 0.022 120.269
Notes: These data should be read in conjunction with the explanatory notes.
(1) Figure is net and does not include lotteries’ agent commission.
(2) Turnover from interactive gaming is completely sourced from overseas players.
(3) Information on minor gaming turnover are no longer collected.
(4) Total gaming figure incomplete due to data for one or more components being unavailable, from this period on.
(5) Under subscription.
NA = Not applicable
U = Unavailable data
KENO
Value ($ million)
CASINOGAMING
MACHINESINSTANT LOTTERY
INTERACTIVE GAMING
LOTTERIES (1) LOTTO MINOR GAMING POOLS TOTAL GAMING
Australian Gambling Statistics, 1993–94 to 2018–19, 36th edition
329

TABLE TAS 17TASMANIA
REAL GAMING TURNOVER
1993-94 1,493.779 - 26.007 - - 1.933 97.823 43.219 0.963 1,663.7231994-95 1,550.954 - 22.239 - 24.580 1.915 96.432 47.423 0.691 1,744.2341995-96 1,539.584 - 18.099 - 86.561 2.014 89.606 41.891 0.544 1,778.2981996-97 1,612.185 76.638 15.272 - 96.612 1.906 81.289 41.690 0.438 1,926.0291997-98 1,617.468 351.750 15.366 - 109.042 2.239 80.211 35.301 0.404 2,211.7811998-99 1,667.814 592.519 14.820 - 112.518 2.339 79.936 32.106 0.370 2,502.4221999-00 1,504.382 974.386 14.857 - 102.782 2.179 78.846 28.509 0.367 2,706.3072000-01 1,506.996 1,162.006 13.108 0.012 (2) 100.011 2.009 81.273 19.324 0.588 2,885.3272001-02 1,372.926 1,286.208 12.780 3.697 (2) 97.424 2.030 82.369 20.048 0.271 2,877.7542002-03 1,355.264 1,384.068 12.033 2.181 (2) 96.245 3.569 85.262 17.824 0.322 2,956.7682003-04 1,388.661 1,483.437 11.864 - NA 98.682 2.862 84.504 - (3) 0.283 3,070.2922004-05 1,420.645 1,509.229 11.317 - 109.890 2.846 82.870 - 0.286 3,137.0832005-06 1,313.065 1,288.394 11.227 - 111.050 2.711 84.316 - 0.245 2,811.0092006-07 - U - U 10.635 - - U 2.739 86.400 - 0.218 99.992 (4)
2007-08 - U - U 10.515 - - U 2.779 87.776 - 0.211 101.2812008-09 - U - U 11.072 - - U 1.381 82.570 - 0.280 95.3032009-10 - U - U 13.824 - - U 0.737 92.863 - 0.285 107.7092010-11 - U - U 12.722 - - U 0.733 83.698 - 0.232 97.3862011-12 - U - U 13.609 - - U 0.752 88.827 - 0.228 103.4162012-13 - U - U 11.584 - - U 0.725 110.293 - 0.308 122.9102013-14 - U - U 11.613 - - U 0.675 89.219 - 0.258 101.7652014-15 - U - U 12.484 - - U 0.682 86.810 - 0.206 100.1822015-16 - U - U 12.369 - - U 0.681 92.966 - 0.171 106.1882016-17 - U - U 12.006 (5) - - U 0.629 86.707 (5) - 0.203 99.5462017-18 - U - U 11.715 - - U 0.638 88.482 - 0.230 101.0652018-19 - U - U 11.104 - - U 2.233 106.910 - 0.022 120.269
Notes: These data should be read in conjunction with the explanatory notes.
(1) Figure is net and does not include lotteries’ agent commission.
(2) Turnover from interactive gaming is completely sourced from overseas players.
(3) Information on minor gaming turnover are no longer collected.
(4) Total gaming figure incomplete due to data for one or more components being unavailable, from this period on.
(5) Under subscription.
NA = Not applicable
U = Unavailable data
KENO
Value ($ million)
CASINOGAMING
MACHINESINSTANT LOTTERY
INTERACTIVE GAMING
LOTTERIES (1) LOTTO MINOR GAMING POOLS TOTAL GAMING
Australian Gambling Statistics, 1993–94 to 2018–19, 36th edition
330

TABLE TAS 18TASMANIA
PER CAPITA GAMING TURNOVER
1993-94 2,332.65 - 40.61 - - 3.02 152.76 67.49 1.50 2,598.031994-95 2,488.35 - 35.68 - 39.44 3.07 154.72 76.09 1.11 2,798.451995-96 2,564.77 - 30.15 - 144.20 3.36 149.27 69.79 0.91 2,962.441996-97 2,713.52 128.99 25.71 - 162.61 3.21 136.82 70.17 0.74 3,241.761997-98 2,717.42 590.96 25.82 - 183.20 3.76 134.76 59.31 0.68 3,715.891998-99 2,830.59 1,005.62 25.15 - 190.96 3.97 135.67 54.49 0.63 4,247.081999-00 2,605.03 1,687.28 25.73 - 177.98 3.77 136.53 49.37 0.63 4,686.322000-01 2,756.49 2,125.46 23.98 0.02 (2) 182.93 3.68 148.66 35.35 1.07 5,277.642001-02 2,570.86 2,408.47 23.93 6.92 (2) 182.43 3.80 154.24 37.54 0.51 5,388.702002-03 2,588.63 2,643.65 22.98 4.17 (2) 183.83 6.82 162.86 34.05 0.61 5,647.592003-04 2,678.99 2,861.83 22.89 - NA 190.38 5.52 163.02 - (3) 0.55 5,923.172004-05 2,773.18 2,946.10 22.09 - 214.51 5.55 161.77 - 0.56 6,123.752005-06 2,620.74 2,571.50 22.41 - 221.64 5.41 168.29 - 0.49 5,610.472006-07 - U - U 21.65 - - U 5.58 175.87 - 0.44 203.53 (4)
2007-08 - U - U 21.86 - - U 5.78 182.44 - 0.44 210.512008-09 - U - U 23.40 - - U 2.92 174.52 - 0.59 201.432009-10 - U - U 29.52 - - U 1.57 198.28 - 0.61 229.972010-11 - U - U 27.70 - - U 1.60 182.26 - 0.51 212.072011-12 - U - U 30.14 - - U 1.67 196.76 - 0.51 229.082012-13 - U - U 26.15 - - U 1.64 248.97 - 0.69 277.462013-14 - U - U 26.78 - - U 1.56 205.74 - 0.59 234.672014-15 - U - U 29.12 - - U 1.59 202.47 - 0.48 233.662015-16 - U - U 29.08 - - U 1.60 218.56 - 0.40 249.652016-17 - U - U 28.45 (5) - - U 1.49 205.49 (5) - 0.48 235.912017-18 - U - U 27.92 - - U 1.52 210.90 - 0.55 240.892018-19 - U - U 26.51 - - U 5.33 255.21 - 0.05 287.10
Notes: These data should be read in conjunction with the explanatory notes.
(1) Figure is net and does not include lotteries’ agent commission.
(2) Turnover from interactive gaming is completely sourced from overseas players.
(3) Information on minor gaming turnover are no longer collected.
(4) Total gaming figure incomplete due to data for one or more components being unavailable, from this period on.
(5) Under subscription.
NA = Not applicable
U = Unavailable data
KENO
Value ($)
CASINOGAMING
MACHINESINSTANT LOTTERY
INTERACTIVE GAMING
LOTTERIES (1) LOTTO MINOR GAMING POOLS TOTAL GAMING
Australian Gambling Statistics, 1993–94 to 2018–19, 36th edition
331

TABLE TAS 19TASMANIA
REAL PER CAPITA GAMING TURNOVER
1993-94 4,334.77 - 75.47 - - 5.61 283.87 125.42 2.79 4,827.931994-95 4,478.25 - 64.21 - 70.97 5.53 278.44 136.93 2.00 5,036.331995-96 4,427.24 - 52.05 - 248.91 5.79 257.67 120.46 1.56 5,113.691996-97 4,621.08 219.67 43.78 - 276.92 5.46 233.00 119.50 1.25 5,520.671997-98 4,627.72 1,006.39 43.96 - 311.98 6.41 229.49 101.00 1.15 6,328.111998-99 4,763.58 1,692.34 42.33 - 321.37 6.68 228.31 91.70 1.06 7,147.371999-00 4,282.91 2,774.04 42.30 - 292.62 6.20 224.47 81.16 1.04 7,704.752000-01 4,273.31 3,295.04 37.17 0.04 (2) 283.60 5.70 230.46 54.80 1.67 8,181.772001-02 3,874.96 3,630.21 36.07 10.44 (2) 274.97 5.73 232.48 56.58 0.77 8,122.212002-03 3,786.70 3,867.18 33.62 6.09 (2) 268.91 9.97 238.23 49.80 0.90 8,261.412003-04 3,825.69 4,086.79 32.68 - NA 271.86 7.88 232.80 - (3) 0.78 8,458.492004-05 3,868.21 4,109.41 30.81 - 299.21 7.75 225.64 - 0.78 8,541.812005-06 3,542.97 3,476.40 30.29 - 299.64 7.31 227.51 - 0.66 7,584.782006-07 - U - U 28.42 - - U 7.32 230.91 - 0.58 267.24 (4)
2007-08 - U - U 27.77 - - U 7.34 231.81 - 0.56 267.472008-09 - U - U 28.84 - - U 3.60 215.04 - 0.73 248.202009-10 - U - U 35.53 - - U 1.89 238.64 - 0.73 276.792010-11 - U - U 32.35 - - U 1.87 212.86 - 0.59 247.672011-12 - U - U 34.40 - - U 1.90 224.51 - 0.58 261.382012-13 - U - U 29.17 - - U 1.83 277.69 - 0.78 309.462013-14 - U - U 29.10 - - U 1.69 223.57 - 0.65 255.012014-15 - U - U 31.11 - - U 1.70 216.31 - 0.51 249.642015-16 - U - U 30.64 - - U 1.69 230.27 - 0.42 263.022016-17 - U - U 29.46 (5) - - U 1.54 212.76 (5) - 0.50 244.262017-18 - U - U 28.37 - - U 1.54 214.28 - 0.56 244.752018-19 - U - U 26.51 - - U 5.33 255.21 - 0.05 287.10
Notes: These data should be read in conjunction with the explanatory notes.
(1) Figure is net and does not include lotteries’ agent commission.
(2) Turnover from interactive gaming is completely sourced from overseas players.
(3) Information on minor gaming turnover are no longer collected.
(4) Total gaming figure incomplete due to data for one or more components being unavailable, from this period on.
(5) Under subscription.
NA = Not applicable
U = Unavailable data
KENO
Value ($)
CASINOGAMING
MACHINESINSTANT LOTTERY
INTERACTIVE GAMING
LOTTERIES (1) LOTTO MINOR GAMING POOLS TOTAL GAMING
Australian Gambling Statistics, 1993–94 to 2018–19, 36th edition
332

TABLE TAS 20TASMANIA
TOTAL GAMING EXPENDITURE
1993-94 54.746 - 5.598 - - 0.416 21.056 9.016 0.259 91.0911994-95 58.871 - 4.943 - 2.317 0.426 21.433 13.703 0.192 101.8841995-96 62.386 - 4.194 - 12.261 0.467 20.764 12.619 0.157 112.8481996-97 74.231 5.537 2.354 - 15.719 0.315 16.336 12.730 0.086 127.3081997-98 75.642 23.666 2.368 - 16.266 0.345 16.140 10.779 0.080 145.2861998-99 82.167 39.291 2.307 - 16.477 0.364 16.150 9.921 0.077 166.7541999-00 77.070 60.773 2.368 - 15.176 0.347 16.305 9.017 0.078 181.1342000-01 76.267 80.988 2.215 0.015 (1) 18.312 0.340 17.825 6.482 0.133 202.5762001-02 87.811 98.821 2.221 (2) 0.128 (1) 17.576 0.353 (2) 18.580 (2) 6.709 0.063 (3) 232.2632002-03 88.382 111.768 2.155 0.033 (1) 15.960 0.639 19.817 5.873 0.077 244.7042003-04 96.386 123.664 2.177 - NA 16.929 0.525 20.119 - (4) 0.069 259.869 (5)
2004-05 102.036 125.714 2.126 - 19.958 0.534 20.200 - 0.072 270.6402005-06 99.770 109.367 3.322 - 20.352 0.802 24.948 - 0.091 258.6522006-07 101.927 112.154 3.240 - 20.780 0.834 26.321 - 0.083 265.3392007-08 109.280 117.298 3.310 - 22.363 0.875 27.633 - 0.083 280.8422008-09 113.914 123.977 3.594 - 25.792 0.448 26.804 - 0.114 294.6432009-10 108.565 119.644 4.594 - 25.024 0.245 30.862 - 0.118 289.0522010-11 110.709 118.624 4.357 - 27.601 0.251 28.667 - 0.099 290.3082011-12 106.140 115.064 4.771 - 27.654 0.264 31.140 - 0.100 285.1332012-13 92.532 113.337 4.154 - 29.166 0.260 39.555 - 0.138 279.1422013-14 90.590 111.049 4.275 - 32.425 0.249 32.841 - 0.119 271.5482014-15 92.594 113.860 4.674 - 30.207 0.255 32.502 - 0.097 274.1882015-16 89.804 114.244 4.696 - 33.336 0.259 35.296 - 0.081 277.7162016-17 84.340 110.328 4.638 - 31.773 0.243 33.497 - 0.098 264.9182017-18 81.161 106.086 4.612 - 31.007 0.251 34.835 - 0.113 258.0662018-19 81.079 104.497 4.162 - 33.026 0.858 40.725 - 0.003 264.349
Notes: These data should be read in conjunction with the explanatory notes.
(1) Expenditure from interactive gaming is completely sourced from overseas players.
(2) Expenditure estimated at 40.0% of turnover (subscriptions), from this period on.
(3) Expenditure estimated at 50.0% of turnover (subscriptions), from this period on..
(4) Data on minor gaming turnover are no longer collected, and therefore an estimate of expenditure can no longer be made.
(5) Total gaming figure incomplete due to data for one or more components being unavailable, from this period on.
NA = Not applicable
KENO
Value ($ million)
CASINOGAMING
MACHINESINSTANT LOTTERY
INTERACTIVE GAMING
LOTTERIES LOTTO MINOR GAMING POOLS TOTAL GAMING
Australian Gambling Statistics, 1993–94 to 2018–19, 36th edition
333
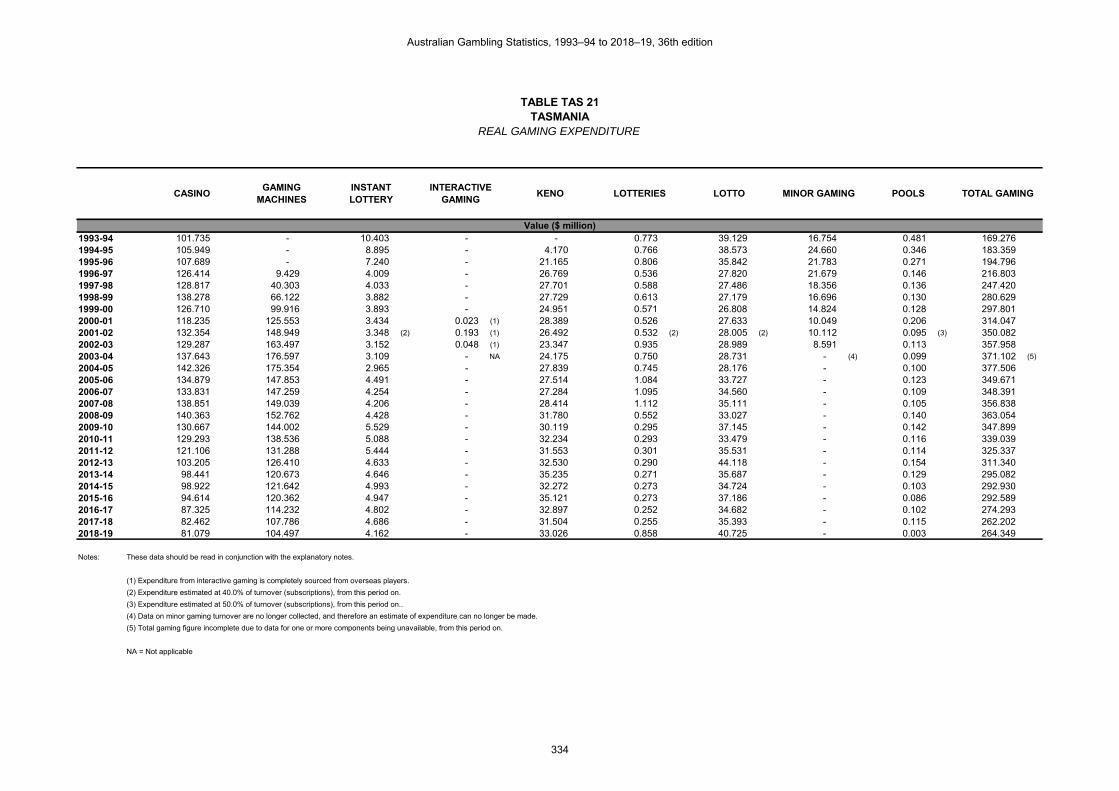
TABLE TAS 21TASMANIA
REAL GAMING EXPENDITURE
1993-94 101.735 - 10.403 - - 0.773 39.129 16.754 0.481 169.2761994-95 105.949 - 8.895 - 4.170 0.766 38.573 24.660 0.346 183.3591995-96 107.689 - 7.240 - 21.165 0.806 35.842 21.783 0.271 194.7961996-97 126.414 9.429 4.009 - 26.769 0.536 27.820 21.679 0.146 216.8031997-98 128.817 40.303 4.033 - 27.701 0.588 27.486 18.356 0.136 247.4201998-99 138.278 66.122 3.882 - 27.729 0.613 27.179 16.696 0.130 280.6291999-00 126.710 99.916 3.893 - 24.951 0.571 26.808 14.824 0.128 297.8012000-01 118.235 125.553 3.434 0.023 (1) 28.389 0.526 27.633 10.049 0.206 314.0472001-02 132.354 148.949 3.348 (2) 0.193 (1) 26.492 0.532 (2) 28.005 (2) 10.112 0.095 (3) 350.0822002-03 129.287 163.497 3.152 0.048 (1) 23.347 0.935 28.989 8.591 0.113 357.9582003-04 137.643 176.597 3.109 - NA 24.175 0.750 28.731 - (4) 0.099 371.102 (5)
2004-05 142.326 175.354 2.965 - 27.839 0.745 28.176 - 0.100 377.5062005-06 134.879 147.853 4.491 - 27.514 1.084 33.727 - 0.123 349.6712006-07 133.831 147.259 4.254 - 27.284 1.095 34.560 - 0.109 348.3912007-08 138.851 149.039 4.206 - 28.414 1.112 35.111 - 0.105 356.8382008-09 140.363 152.762 4.428 - 31.780 0.552 33.027 - 0.140 363.0542009-10 130.667 144.002 5.529 - 30.119 0.295 37.145 - 0.142 347.8992010-11 129.293 138.536 5.088 - 32.234 0.293 33.479 - 0.116 339.0392011-12 121.106 131.288 5.444 - 31.553 0.301 35.531 - 0.114 325.3372012-13 103.205 126.410 4.633 - 32.530 0.290 44.118 - 0.154 311.3402013-14 98.441 120.673 4.646 - 35.235 0.271 35.687 - 0.129 295.0822014-15 98.922 121.642 4.993 - 32.272 0.273 34.724 - 0.103 292.9302015-16 94.614 120.362 4.947 - 35.121 0.273 37.186 - 0.086 292.5892016-17 87.325 114.232 4.802 - 32.897 0.252 34.682 - 0.102 274.2932017-18 82.462 107.786 4.686 - 31.504 0.255 35.393 - 0.115 262.2022018-19 81.079 104.497 4.162 - 33.026 0.858 40.725 - 0.003 264.349
Notes: These data should be read in conjunction with the explanatory notes.
(1) Expenditure from interactive gaming is completely sourced from overseas players.
(2) Expenditure estimated at 40.0% of turnover (subscriptions), from this period on.
(3) Expenditure estimated at 50.0% of turnover (subscriptions), from this period on..
(4) Data on minor gaming turnover are no longer collected, and therefore an estimate of expenditure can no longer be made.
(5) Total gaming figure incomplete due to data for one or more components being unavailable, from this period on.
NA = Not applicable
KENO
Value ($ million)
CASINOGAMING
MACHINESINSTANT LOTTERY
INTERACTIVE GAMING
LOTTERIES LOTTO MINOR GAMING POOLS TOTAL GAMING
Australian Gambling Statistics, 1993–94 to 2018–19, 36th edition
334

TABLE TAS 22TASMANIA
PER CAPITA GAMING EXPENDITURE
1993-94 158.87 - 16.24 - - 1.21 61.10 26.16 0.75 264.341994-95 169.99 - 14.27 - 6.69 1.23 61.89 39.56 0.55 294.181995-96 179.40 - 12.06 - 35.26 1.34 59.71 36.29 0.45 324.511996-97 212.77 15.87 6.75 - 45.06 0.90 46.82 36.49 0.25 364.911997-98 216.42 67.71 6.78 - 46.54 0.99 46.18 30.84 0.23 415.681998-99 234.68 112.22 6.59 - 47.06 1.04 46.13 28.34 0.22 476.281999-00 219.42 173.02 6.74 - 43.21 0.99 46.42 25.67 0.22 515.682000-01 216.27 229.65 6.28 0.04 (1) 51.93 0.96 50.54 18.38 0.38 574.432001-02 247.84 278.91 6.27 (2) 0.36 (1) 49.61 1.00 (2) 52.44 (2) 18.94 0.18 (3) 655.542002-03 246.95 312.29 6.02 0.09 (1) 44.59 1.79 55.37 16.41 0.22 683.722003-04 265.54 340.69 6.00 - NA 46.64 1.45 55.43 - (4) 0.19 715.93 (5)
2004-05 277.83 342.30 5.79 - 54.34 1.45 55.00 - 0.20 736.912005-06 269.20 295.10 8.96 - 54.91 2.16 67.32 - 0.25 697.912006-07 272.41 299.74 8.66 - 55.54 2.23 70.35 - 0.22 709.152007-08 288.60 309.77 8.74 - 59.06 2.31 72.98 - 0.22 741.672008-09 296.67 322.88 9.36 - 67.17 1.17 69.81 - 0.30 767.362009-10 278.99 307.46 11.81 - 64.31 0.63 79.31 - 0.30 742.822010-11 281.55 301.68 11.08 - 70.19 0.64 72.90 - 0.25 738.302011-12 268.26 290.82 12.06 - 69.89 0.67 78.70 - 0.25 720.662012-13 232.97 285.36 10.46 - 73.43 0.65 99.59 - 0.35 702.822013-14 227.01 278.28 10.71 - 81.25 0.62 82.30 - 0.30 680.472014-15 230.73 283.72 11.65 - 75.27 0.64 80.99 - 0.24 683.232015-16 222.44 282.97 11.63 - 82.57 0.64 87.42 - 0.20 687.882016-17 206.95 270.72 11.38 - 77.96 0.60 82.19 - 0.24 650.052017-18 196.55 256.91 11.17 - 75.09 0.61 84.36 - 0.27 624.972018-19 193.55 249.45 9.93 - 78.84 2.05 97.22 - 0.01 631.04
Notes: These data should be read in conjunction with the explanatory notes.
(1) Expenditure from interactive gaming is completely sourced from overseas players.
(2) Expenditure estimated at 40.0% of turnover (subscriptions), from this period on.
(3) Expenditure estimated at 50.0% of turnover (subscriptions), from this period on..
(4) Data on minor gaming turnover are no longer collected, and therefore an estimate of expenditure can no longer be made.
(5) Total gaming figure incomplete due to data for one or more components being unavailable, from this period on.
NA = Not applicable
KENO
Value ($)
CASINOGAMING
MACHINESINSTANT LOTTERY
INTERACTIVE GAMING
LOTTERIES LOTTO MINOR GAMING POOLS TOTAL GAMING
Australian Gambling Statistics, 1993–94 to 2018–19, 36th edition
335
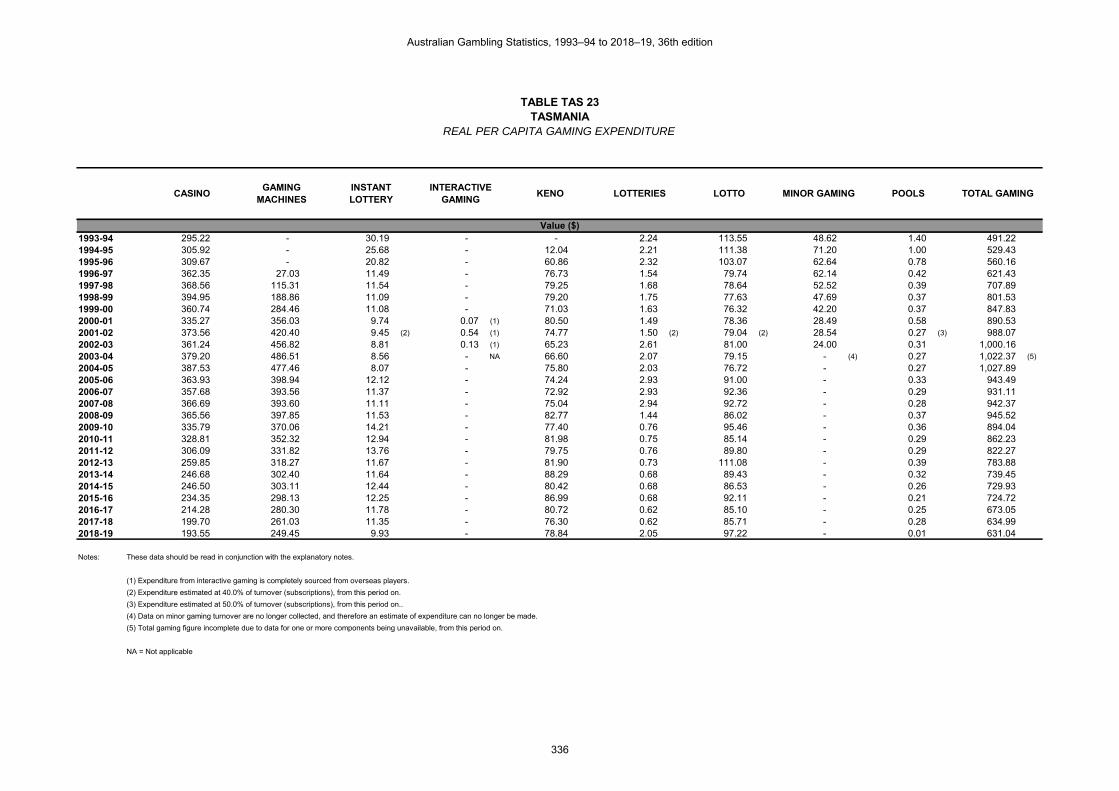
TABLE TAS 23TASMANIA
REAL PER CAPITA GAMING EXPENDITURE
1993-94 295.22 - 30.19 - - 2.24 113.55 48.62 1.40 491.221994-95 305.92 - 25.68 - 12.04 2.21 111.38 71.20 1.00 529.431995-96 309.67 - 20.82 - 60.86 2.32 103.07 62.64 0.78 560.161996-97 362.35 27.03 11.49 - 76.73 1.54 79.74 62.14 0.42 621.431997-98 368.56 115.31 11.54 - 79.25 1.68 78.64 52.52 0.39 707.891998-99 394.95 188.86 11.09 - 79.20 1.75 77.63 47.69 0.37 801.531999-00 360.74 284.46 11.08 - 71.03 1.63 76.32 42.20 0.37 847.832000-01 335.27 356.03 9.74 0.07 (1) 80.50 1.49 78.36 28.49 0.58 890.532001-02 373.56 420.40 9.45 (2) 0.54 (1) 74.77 1.50 (2) 79.04 (2) 28.54 0.27 (3) 988.072002-03 361.24 456.82 8.81 0.13 (1) 65.23 2.61 81.00 24.00 0.31 1,000.162003-04 379.20 486.51 8.56 - NA 66.60 2.07 79.15 - (4) 0.27 1,022.37 (5)
2004-05 387.53 477.46 8.07 - 75.80 2.03 76.72 - 0.27 1,027.892005-06 363.93 398.94 12.12 - 74.24 2.93 91.00 - 0.33 943.492006-07 357.68 393.56 11.37 - 72.92 2.93 92.36 - 0.29 931.112007-08 366.69 393.60 11.11 - 75.04 2.94 92.72 - 0.28 942.372008-09 365.56 397.85 11.53 - 82.77 1.44 86.02 - 0.37 945.522009-10 335.79 370.06 14.21 - 77.40 0.76 95.46 - 0.36 894.042010-11 328.81 352.32 12.94 - 81.98 0.75 85.14 - 0.29 862.232011-12 306.09 331.82 13.76 - 79.75 0.76 89.80 - 0.29 822.272012-13 259.85 318.27 11.67 - 81.90 0.73 111.08 - 0.39 783.882013-14 246.68 302.40 11.64 - 88.29 0.68 89.43 - 0.32 739.452014-15 246.50 303.11 12.44 - 80.42 0.68 86.53 - 0.26 729.932015-16 234.35 298.13 12.25 - 86.99 0.68 92.11 - 0.21 724.722016-17 214.28 280.30 11.78 - 80.72 0.62 85.10 - 0.25 673.052017-18 199.70 261.03 11.35 - 76.30 0.62 85.71 - 0.28 634.992018-19 193.55 249.45 9.93 - 78.84 2.05 97.22 - 0.01 631.04
Notes: These data should be read in conjunction with the explanatory notes.
(1) Expenditure from interactive gaming is completely sourced from overseas players.
(2) Expenditure estimated at 40.0% of turnover (subscriptions), from this period on.
(3) Expenditure estimated at 50.0% of turnover (subscriptions), from this period on..
(4) Data on minor gaming turnover are no longer collected, and therefore an estimate of expenditure can no longer be made.
(5) Total gaming figure incomplete due to data for one or more components being unavailable, from this period on.
NA = Not applicable
KENO
Value ($)
CASINOGAMING
MACHINESINSTANT LOTTERY
INTERACTIVE GAMING
LOTTERIES LOTTO MINOR GAMING POOLS TOTAL GAMING
Australian Gambling Statistics, 1993–94 to 2018–19, 36th edition
336
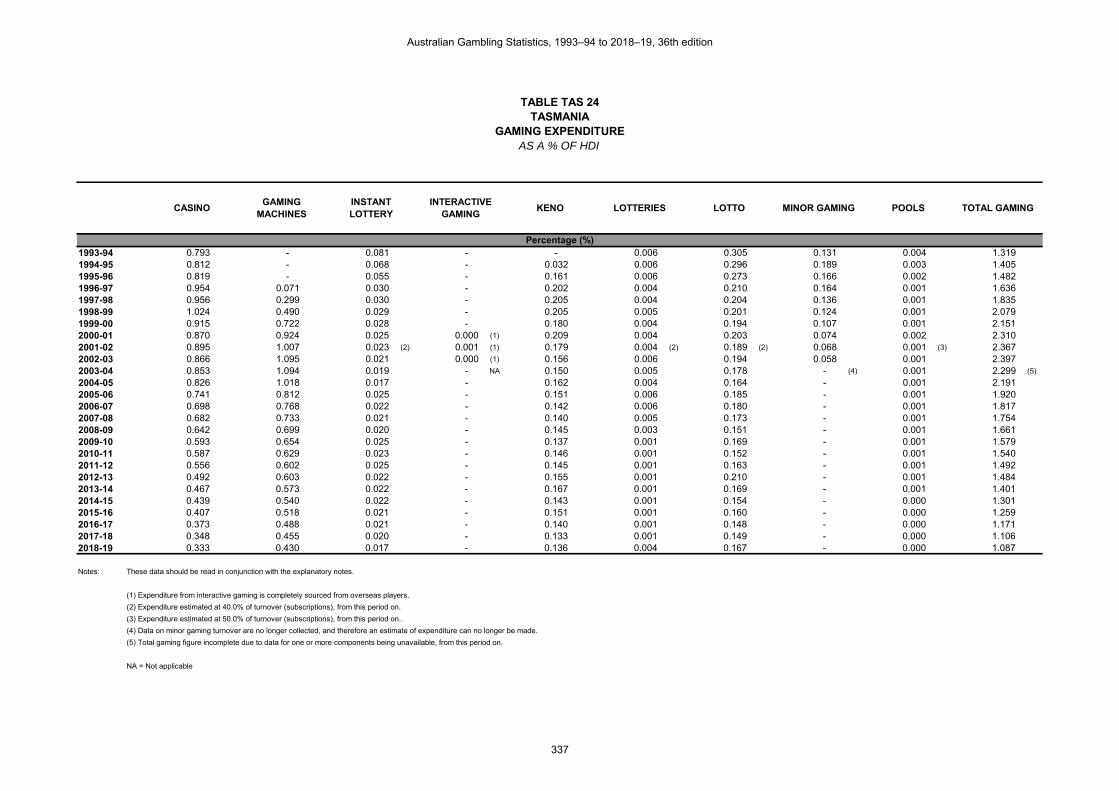
TABLE TAS 24TASMANIA
GAMING EXPENDITUREAS A % OF HDI
1993-94 0.793 - 0.081 - - 0.006 0.305 0.131 0.004 1.3191994-95 0.812 - 0.068 - 0.032 0.006 0.296 0.189 0.003 1.4051995-96 0.819 - 0.055 - 0.161 0.006 0.273 0.166 0.002 1.4821996-97 0.954 0.071 0.030 - 0.202 0.004 0.210 0.164 0.001 1.6361997-98 0.956 0.299 0.030 - 0.205 0.004 0.204 0.136 0.001 1.8351998-99 1.024 0.490 0.029 - 0.205 0.005 0.201 0.124 0.001 2.0791999-00 0.915 0.722 0.028 - 0.180 0.004 0.194 0.107 0.001 2.1512000-01 0.870 0.924 0.025 0.000 (1) 0.209 0.004 0.203 0.074 0.002 2.3102001-02 0.895 1.007 0.023 (2) 0.001 (1) 0.179 0.004 (2) 0.189 (2) 0.068 0.001 (3) 2.3672002-03 0.866 1.095 0.021 0.000 (1) 0.156 0.006 0.194 0.058 0.001 2.3972003-04 0.853 1.094 0.019 - NA 0.150 0.005 0.178 - (4) 0.001 2.299 (5)
2004-05 0.826 1.018 0.017 - 0.162 0.004 0.164 - 0.001 2.1912005-06 0.741 0.812 0.025 - 0.151 0.006 0.185 - 0.001 1.9202006-07 0.698 0.768 0.022 - 0.142 0.006 0.180 - 0.001 1.8172007-08 0.682 0.733 0.021 - 0.140 0.005 0.173 - 0.001 1.7542008-09 0.642 0.699 0.020 - 0.145 0.003 0.151 - 0.001 1.6612009-10 0.593 0.654 0.025 - 0.137 0.001 0.169 - 0.001 1.5792010-11 0.587 0.629 0.023 - 0.146 0.001 0.152 - 0.001 1.5402011-12 0.556 0.602 0.025 - 0.145 0.001 0.163 - 0.001 1.4922012-13 0.492 0.603 0.022 - 0.155 0.001 0.210 - 0.001 1.4842013-14 0.467 0.573 0.022 - 0.167 0.001 0.169 - 0.001 1.4012014-15 0.439 0.540 0.022 - 0.143 0.001 0.154 - 0.000 1.3012015-16 0.407 0.518 0.021 - 0.151 0.001 0.160 - 0.000 1.2592016-17 0.373 0.488 0.021 - 0.140 0.001 0.148 - 0.000 1.1712017-18 0.348 0.455 0.020 - 0.133 0.001 0.149 - 0.000 1.1062018-19 0.333 0.430 0.017 - 0.136 0.004 0.167 - 0.000 1.087
Notes: These data should be read in conjunction with the explanatory notes.
(1) Expenditure from interactive gaming is completely sourced from overseas players.
(2) Expenditure estimated at 40.0% of turnover (subscriptions), from this period on.
(3) Expenditure estimated at 50.0% of turnover (subscriptions), from this period on..
(4) Data on minor gaming turnover are no longer collected, and therefore an estimate of expenditure can no longer be made.
(5) Total gaming figure incomplete due to data for one or more components being unavailable, from this period on.
NA = Not applicable
Percentage (%)
CASINOGAMING
MACHINESINSTANT LOTTERY
TOTAL GAMINGINTERACTIVE
GAMINGKENO LOTTERIES LOTTO MINOR GAMING POOLS
Australian Gambling Statistics, 1993–94 to 2018–19, 36th edition
337

TABLE TAS 25TASMANIA
GAMING EXPENDITURESHARE OF MARKET
1993-94 60.10 - 6.15 - - 0.46 23.12 9.90 0.281994-95 57.78 - 4.85 - 2.27 0.42 21.04 13.45 0.191995-96 55.28 - 3.72 - 10.87 0.41 18.40 11.18 0.141996-97 58.31 4.35 1.85 - 12.35 0.25 12.83 10.00 0.071997-98 52.06 16.29 1.63 - 11.20 0.24 11.11 7.42 0.061998-99 49.27 23.56 1.38 - 9.88 0.22 9.68 5.95 0.051999-00 42.55 33.55 1.31 - 8.38 0.19 9.00 4.98 0.042000-01 37.65 39.98 1.09 0.01 (1) 9.04 0.17 8.80 3.20 0.072001-02 37.81 42.55 0.96 (2) 0.06 (1) 7.57 0.15 (2) 8.00 (2) 2.89 0.03 (3)
2002-03 36.12 45.67 0.88 0.01 (1) 6.52 0.26 8.10 2.40 0.032003-04 37.09 47.59 0.84 - NA 6.51 0.20 7.74 - (4) 0.032004-05 37.70 46.45 0.79 - 7.37 0.20 7.46 - 0.032005-06 38.57 42.28 1.28 - 7.87 0.31 9.65 - 0.042006-07 38.41 42.27 1.22 - 7.83 0.31 9.92 - 0.032007-08 38.91 41.77 1.18 - 7.96 0.31 9.84 - 0.032008-09 38.66 42.08 1.22 - 8.75 0.15 9.10 - 0.042009-10 37.56 41.39 1.59 - 8.66 0.08 10.68 - 0.042010-11 38.14 40.86 1.50 - 9.51 0.09 9.87 - 0.032011-12 37.22 40.35 1.67 - 9.70 0.09 10.92 - 0.042012-13 33.15 40.60 1.49 - 10.45 0.09 14.17 - 0.052013-14 33.36 40.89 1.57 - 11.94 0.09 12.09 - 0.042014-15 33.77 41.53 1.70 - 11.02 0.09 11.85 - 0.042015-16 32.34 41.14 1.69 - 12.00 0.09 12.71 - 0.032016-17 31.84 41.65 1.75 - 11.99 0.09 12.64 - 0.042017-18 31.45 41.11 1.79 - 12.02 0.10 13.50 - 0.042018-19 30.67 39.53 1.57 - 12.49 0.32 15.41 - 0.00
Notes: These data should be read in conjunction with the explanatory notes.
(1) Expenditure from interactive gaming is completely sourced from overseas players.
(2) Expenditure estimated at 40.0% of turnover (subscriptions), from this period on.
(3) Expenditure estimated at 50.0% of turnover (subscriptions), from this period on..
(4) Data on minor gaming turnover are no longer collected, and therefore an estimate of expenditure can no longer be made.
NA = Not applicable
POOLS
Percentage (%)
CASINOGAMING
MACHINESINSTANT LOTTERY
INTERACTIVE GAMING
KENO LOTTERIES LOTTO MINOR GAMING
Australian Gambling Statistics, 1993–94 to 2018–19, 36th edition
338

TABLE TAS 26TASMANIA
GOVERNMENT REVENUE FROM GAMING
1993-94 11.889 - - 22.025 1.046 34.9601994-95 14.611 0.545 - 21.646 1.179 37.9811995-96 16.772 2.152 - 20.840 0.998 40.7621996-97 27.036 4.546 - 17.711 0.992 50.2851997-98 23.641 10.361 - 18.891 0.847 53.7401998-99 23.334 15.476 - 19.676 0.742 59.2281999-00 23.174 22.364 - 21.040 0.649 67.2272000-01 15.949 20.424 - 19.711 0.405 56.4892001-02 18.692 24.639 0.005 20.523 0.245 64.1042002-03 20.215 28.005 0.001 21.701 0.273 70.1952003-04 21.868 32.063 - 21.939 0.283 76.1532004-05 23.510 32.670 - 22.152 0.053 78.3852005-06 21.924 29.207 0.970 (1) 22.919 0.021 75.0412006-07 22.285 29.943 4.998 (1) 24.182 - (2) 81.4082007-08 23.675 31.362 - (3) 25.311 - 80.3482008-09 24.740 33.312 - 23.449 - 81.5012009-10 23.554 32.101 - 26.950 - 82.6052010-11 23.842 32.019 - 25.100 - 80.9612011-12 23.549 30.398 - 27.267 - 81.2142012-13 19.643 30.449 - 29.361 - 79.4532013-14 20.600 30.475 - 28.399 - 79.4732014-15 20.781 31.243 - 28.264 - 80.2882015-16 20.039 31.514 - 30.293 - 81.8462016-17 18.746 30.421 - 28.829 - 77.9962017-18 18.014 29.278 - 29.906 - 77.1982018-19 17.693 (4) 29.305 (5) - 36.538 - 83.536
Notes: These data should be read in conjunction with the explanatory notes.
Data for the gambling revenue received by states and territories from 1 July 2000 onwards are not comparable with that of preceding years because of
the impact of changes brought about by the introduction of the GST.
(1) Government revenue from interactive gaming includes both tax and product levies received.
(2) Minor gaming revenue was incorrectly reported in previous years. No tax is received for minor gaming activities, only income is from application fees.
(3) Revenue from betting exchanges is no longer recorded in interactive gaming and has been apportioned between sportsbetting and racing.
(4) Amounts for unclaimed prizes may have been subsequently claimed.
Includes gaming machine unclaimed prizes for hotels and clubs.
Excludes keno unclaimed prizes for casinos, which are included under 'gaming machines and keno' revenue.
(5) Includes unclaimed prizes, from this period on. However, prizes may have been subsequently claimed.
Includes unclaimed keno prize amounts for casinos.
Excludes gaming machine unclaimed prizes for hotels and clubs, which are included under 'casino gaming' revenue.
Value ($ million)
TOTAL GAMINGCASINO GAMINGGAMING
MACHINES & KENO
INTERACTIVE GAMING
LOTTERIES & POOLS
MINOR GAMING
Australian Gambling Statistics, 1993–94 to 2018–19, 36th edition
339
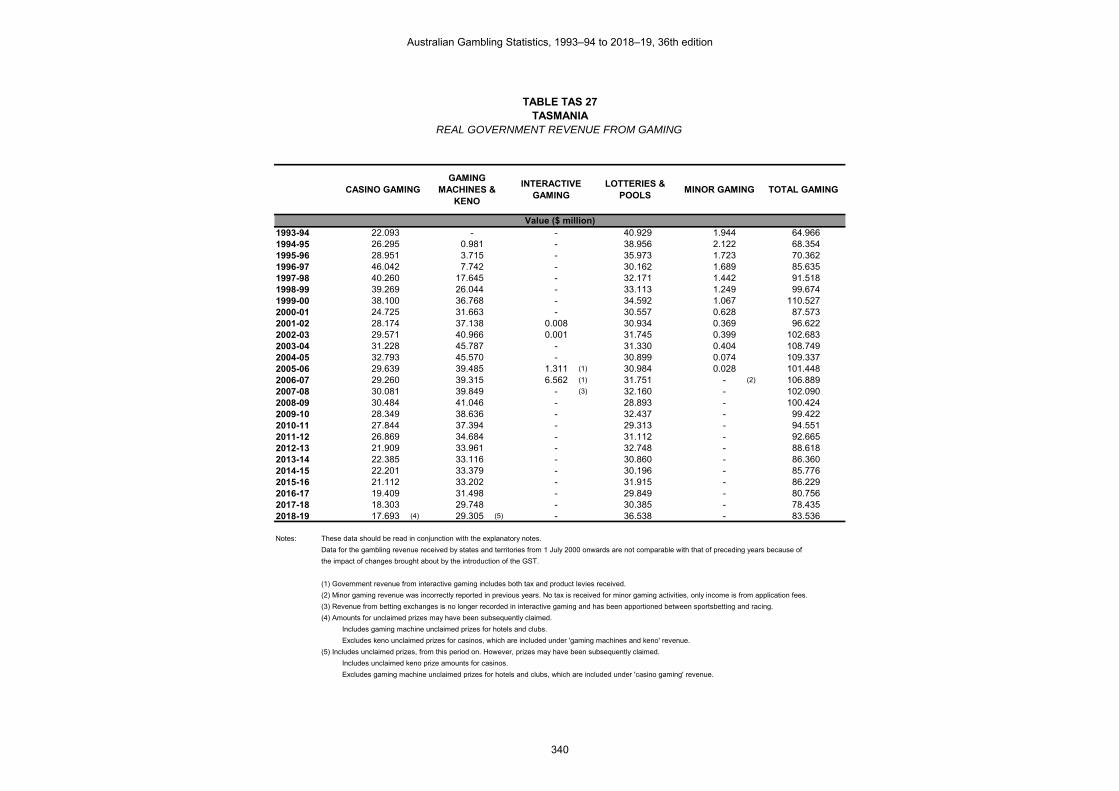
TABLE TAS 27TASMANIA
REAL GOVERNMENT REVENUE FROM GAMING
1993-94 22.093 - - 40.929 1.944 64.9661994-95 26.295 0.981 - 38.956 2.122 68.3541995-96 28.951 3.715 - 35.973 1.723 70.3621996-97 46.042 7.742 - 30.162 1.689 85.6351997-98 40.260 17.645 - 32.171 1.442 91.5181998-99 39.269 26.044 - 33.113 1.249 99.6741999-00 38.100 36.768 - 34.592 1.067 110.5272000-01 24.725 31.663 - 30.557 0.628 87.5732001-02 28.174 37.138 0.008 30.934 0.369 96.6222002-03 29.571 40.966 0.001 31.745 0.399 102.6832003-04 31.228 45.787 - 31.330 0.404 108.7492004-05 32.793 45.570 - 30.899 0.074 109.3372005-06 29.639 39.485 1.311 (1) 30.984 0.028 101.4482006-07 29.260 39.315 6.562 (1) 31.751 - (2) 106.8892007-08 30.081 39.849 - (3) 32.160 - 102.0902008-09 30.484 41.046 - 28.893 - 100.4242009-10 28.349 38.636 - 32.437 - 99.4222010-11 27.844 37.394 - 29.313 - 94.5512011-12 26.869 34.684 - 31.112 - 92.6652012-13 21.909 33.961 - 32.748 - 88.6182013-14 22.385 33.116 - 30.860 - 86.3602014-15 22.201 33.379 - 30.196 - 85.7762015-16 21.112 33.202 - 31.915 - 86.2292016-17 19.409 31.498 - 29.849 - 80.7562017-18 18.303 29.748 - 30.385 - 78.4352018-19 17.693 (4) 29.305 (5) - 36.538 - 83.536
Notes: These data should be read in conjunction with the explanatory notes.
Data for the gambling revenue received by states and territories from 1 July 2000 onwards are not comparable with that of preceding years because of
the impact of changes brought about by the introduction of the GST.
(1) Government revenue from interactive gaming includes both tax and product levies received.
(2) Minor gaming revenue was incorrectly reported in previous years. No tax is received for minor gaming activities, only income is from application fees.
(3) Revenue from betting exchanges is no longer recorded in interactive gaming and has been apportioned between sportsbetting and racing.
(4) Amounts for unclaimed prizes may have been subsequently claimed.
Includes gaming machine unclaimed prizes for hotels and clubs.
Excludes keno unclaimed prizes for casinos, which are included under 'gaming machines and keno' revenue.
(5) Includes unclaimed prizes, from this period on. However, prizes may have been subsequently claimed.
Includes unclaimed keno prize amounts for casinos.
Excludes gaming machine unclaimed prizes for hotels and clubs, which are included under 'casino gaming' revenue.
TOTAL GAMING
Value ($ million)
CASINO GAMINGGAMING
MACHINES & KENO
INTERACTIVE GAMING
LOTTERIES & POOLS
MINOR GAMING
Australian Gambling Statistics, 1993–94 to 2018–19, 36th edition
340

TABLE TAS 28TASMANIA
PER CAPITA REVENUE FROM GAMING
1993-94 34.50 - - 63.91 3.04 101.451994-95 42.19 1.57 - 62.50 3.40 109.671995-96 48.23 6.19 - 59.93 2.87 117.221996-97 77.49 13.03 - 50.77 2.84 144.131997-98 67.64 29.64 - 54.05 2.42 153.761998-99 66.65 44.20 - 56.20 2.12 169.171999-00 65.97 63.67 - 59.90 1.85 191.392000-01 45.23 57.92 - 55.89 1.15 160.182001-02 52.76 69.54 0.01 57.92 0.69 180.932002-03 56.48 78.25 0.00 60.63 0.76 196.132003-04 60.25 88.33 - 60.44 0.78 209.802004-05 64.01 88.96 - 60.32 0.14 213.432005-06 59.16 78.81 2.62 (1) 61.84 0.06 202.482006-07 59.56 80.03 13.36 (1) 64.63 - (2) 217.572007-08 62.52 82.82 - (3) 66.84 - 212.192008-09 64.43 86.76 - 61.07 - 212.262009-10 60.53 82.49 - 69.26 - 212.282010-11 60.63 81.43 - 63.83 - 205.902011-12 59.52 76.83 - 68.92 - 205.262012-13 49.46 76.66 - 73.92 - 200.042013-14 51.62 76.37 - 71.16 - 199.152014-15 51.78 77.85 - 70.43 - 200.062015-16 49.63 78.06 - 75.03 - 202.722016-17 46.00 74.65 - 70.74 - 191.382017-18 43.63 70.90 - 72.42 - 186.952018-19 42.23 (4) 69.96 (5) - 87.22 - 199.41
Notes: These data should be read in conjunction with the explanatory notes.
Data for the gambling revenue received by states and territories from 1 July 2000 onwards are not comparable with that of preceding years because of
the impact of changes brought about by the introduction of the GST.
(1) Government revenue from interactive gaming includes both tax and product levies received.
(2) Minor gaming revenue was incorrectly reported in previous years. No tax is received for minor gaming activities, only income is from application fees.
(3) Revenue from betting exchanges is no longer recorded in interactive gaming and has been apportioned between sportsbetting and racing.
(4) Amounts for unclaimed prizes may have been subsequently claimed.
Includes gaming machine unclaimed prizes for hotels and clubs.
Excludes keno unclaimed prizes for casinos, which are included under 'gaming machines and keno' revenue.
(5) Includes unclaimed prizes, from this period on. However, prizes may have been subsequently claimed.
Includes unclaimed keno prize amounts for casinos.
Excludes gaming machine unclaimed prizes for hotels and clubs, which are included under 'casino gaming' revenue.
TOTAL GAMING
Value ($)
CASINO GAMINGGAMING
MACHINES & KENO
INTERACTIVE GAMING
LOTTERIES & POOLS
MINOR GAMING
Australian Gambling Statistics, 1993–94 to 2018–19, 36th edition
341

TABLE TAS 29TASMANIA
REAL PER CAPITA REVENUE FROM GAMING
1993-94 64.11 - - 118.77 5.64 188.521994-95 75.93 2.83 - 112.48 6.13 197.371995-96 83.25 10.68 - 103.45 4.95 202.331996-97 131.97 22.19 - 86.45 4.84 245.461997-98 115.19 50.48 - 92.04 4.13 261.841998-99 112.16 74.39 - 94.58 3.57 284.691999-00 108.47 104.68 - 98.48 3.04 314.672000-01 70.11 89.78 - 86.65 1.78 248.332001-02 79.52 104.82 0.02 87.31 1.04 272.712002-03 82.62 114.46 0.00 88.70 1.12 286.902003-04 86.03 126.14 - 86.31 1.11 299.602004-05 89.29 124.08 - 84.13 0.20 297.712005-06 79.97 106.54 3.54 (1) 83.60 0.08 273.732006-07 78.20 105.07 17.54 (1) 84.86 - (2) 285.672007-08 79.44 105.24 - (3) 84.93 - 269.612008-09 79.39 106.90 - 75.25 - 261.542009-10 72.85 99.29 - 83.36 - 255.502010-11 70.81 95.10 - 74.55 - 240.462011-12 67.91 87.66 - 78.63 - 234.212012-13 55.16 85.51 - 82.45 - 223.122013-14 56.09 82.98 - 77.33 - 216.412014-15 55.32 83.17 - 75.24 - 213.742015-16 52.29 82.24 - 79.05 - 213.582016-17 47.63 77.29 - 73.24 - 198.162017-18 44.32 72.04 - 73.59 - 189.952018-19 42.23 (4) 69.96 (5) - 87.22 - 199.41
Notes: These data should be read in conjunction with the explanatory notes.
Data for the gambling revenue received by states and territories from 1 July 2000 onwards are not comparable with that of preceding years because of
the impact of changes brought about by the introduction of the GST.
(1) Government revenue from interactive gaming includes both tax and product levies received.
(2) Minor gaming revenue was incorrectly reported in previous years. No tax is received for minor gaming activities, only income is from application fees.
(3) Revenue from betting exchanges is no longer recorded in interactive gaming and has been apportioned between sportsbetting and racing.
(4) Amounts for unclaimed prizes may have been subsequently claimed.
Includes gaming machine unclaimed prizes for hotels and clubs.
Excludes keno unclaimed prizes for casinos, which are included under 'gaming machines and keno' revenue.
(5) Includes unclaimed prizes, from this period on. However, prizes may have been subsequently claimed.
Includes unclaimed keno prize amounts for casinos.
Excludes gaming machine unclaimed prizes for hotels and clubs, which are included under 'casino gaming' revenue.
TOTAL GAMING
Value ($)
CASINO GAMINGGAMING
MACHINES & KENO
INTERACTIVE GAMING
LOTTERIES & POOLS
MINOR GAMING
Australian Gambling Statistics, 1993–94 to 2018–19, 36th edition
342

TABLE TAS 30TASMANIA
GOVERNMENT REVENUE FROM GAMINGAS A % OF TOTAL GAMBLING REVENUE
1993-94 26.39 - - 48.89 2.32 77.611994-95 29.22 1.09 - 43.29 2.36 75.951995-96 32.19 4.13 - 40.00 1.92 78.231996-97 44.56 7.49 - 29.19 1.63 82.871997-98 37.56 16.46 - 30.01 1.35 85.381998-99 34.68 23.00 - 29.24 1.10 88.031999-00 31.51 30.41 - 28.61 0.88 91.422000-01 27.88 35.71 - 34.46 0.71 98.762001-02 29.15 38.43 0.01 32.01 0.38 99.982002-03 28.79 39.88 0.00 30.90 0.39 99.962003-04 28.70 42.09 - 28.80 0.37 99.962004-05 29.98 41.66 - 28.25 0.07 99.962005-06 29.20 38.91 1.29 (1) 30.53 0.03 99.962006-07 27.37 36.77 6.14 (1) 29.69 - (2) 99.972007-08 27.52 36.46 - (3) 29.43 - 93.412008-09 27.66 37.25 - 26.22 - 91.132009-10 26.37 35.94 - 30.17 - 92.482010-11 28.58 38.39 - 30.09 - 97.062011-12 28.22 36.43 - 32.68 - 97.342012-13 23.96 37.14 - 35.81 - 96.912013-14 25.08 37.10 - 34.58 - 96.762014-15 24.99 37.58 - 33.99 - 96.562015-16 23.63 37.17 - 35.73 - 96.532016-17 23.81 38.64 - 36.62 - 99.072017-18 23.33 37.93 - 38.74 - 100.002018-19 21.18 (4) 35.08 (5) - 43.74 - 100.00
Notes: These data should be read in conjunction with the explanatory notes.
Data for the gambling revenue received by states and territories from 1 July 2000 onwards are not comparable with that of preceding years because of
the impact of changes brought about by the introduction of the GST.
(1) Government revenue from interactive gaming includes both tax and product levies received.
(2) Minor gaming revenue was incorrectly reported in previous years. No tax is received for minor gaming activities, only income is from application fees.
(3) Revenue from betting exchanges is no longer recorded in interactive gaming and has been apportioned between sportsbetting and racing.
(4) Amounts for unclaimed prizes may have been subsequently claimed.
Includes gaming machine unclaimed prizes for hotels and clubs.
Excludes keno unclaimed prizes for casinos, which are included under 'gaming machines and keno' revenue.
(5) Includes unclaimed prizes, from this period on. However, prizes may have been subsequently claimed.
Includes unclaimed keno prize amounts for casinos.
Excludes gaming machine unclaimed prizes for hotels and clubs, which are included under 'casino gaming' revenue.
TOTAL GAMING
Percentage (%)
CASINO GAMINGGAMING
MACHINES & KENO
INTERACTIVE GAMING
LOTTERIES & POOLS
MINOR GAMING
Australian Gambling Statistics, 1993–94 to 2018–19, 36th edition
343

TABLE TAS 31TASMANIA
TOTAL SPORTSBETTING TURNOVER
1994-95 0.017 - - 0.063 0.0801995-96 5.224 - - 0.144 5.3681996-97 5.517 - - 0.177 5.6941997-98 3.248 - - 0.197 3.4451998-99 1.056 - - 0.198 1.2541999-00 0.540 - 1.002 0.230 1.7722000-01 0.243 0.035 1.339 0.177 1.7942001-02 0.000 (1) 4.446 2.706 0.182 7.3342002-03 - 1.821 3.027 0.157 5.0052003-04 - 0.198 3.766 0.174 4.1382004-05 - 0.216 4.470 0.161 4.8472005-06 - 0.231 5.827 0.157 6.2152006-07 - 0.208 7.183 0.161 7.5522007-08 - 0.109 (2) 18.934 0.150 19.1932008-09 - - 104.448 0.149 104.5972009-10 - - 33.490 0.123 33.6132010-11 - - 17.367 E 0.137 E 17.504 E
2011-12 - - 13.372 E 0.071 E 13.443 E
2012-13 - - 19.416 E 0.049 E 19.465 E
2013-14 - - 40.103 E 0.046 E 40.149 E
2014-15 - - 46.117 E 0.065 E 46.182 E
2015-16 - - 59.865 0.022 59.8872016-17 - - 58.727 (3)R 0.029 (3)R 58.756 R
2017-18 - - 74.973 R 0.037 75.010 R
2018-19 - - 54.427 0.061 54.488
Notes: These data should be read in conjunction with the explanatory notes.
(1) No data from 2001-02 onwards.
(2) Tipstar ceased operations in 2007.
(3) Since the merger of Tabcorp and the Tatts Group in December 2017, some figures may have been incorrectly classified.
E = Estimated data
R = Revised data
TOTAL SPORTSBETTING
Value ($ million)
BOOKMAKER (AND OTHER) FIXED ODDS
BOOKMAKER (AND OTHER)
POOL BETTINGTAB FIXED ODDS TAB TOTE ODDS
Australian Gambling Statistics, 1993–94 to 2018–19, 36th edition
344

TABLE TAS 32TASMANIA
REAL SPORTSBETTING TURNOVER
1994-95 0.031 - - 0.113 0.1441995-96 9.018 - - 0.249 9.2661996-97 9.395 - - 0.301 9.6971997-98 5.531 - - 0.335 5.8671998-99 1.777 - - 0.333 2.1101999-00 0.888 - 1.647 0.378 2.9132000-01 0.377 0.054 2.076 0.274 2.7812001-02 0.000 (1) 6.701 4.079 0.274 11.0552002-03 - 2.664 4.428 0.230 7.3212003-04 - 0.283 5.378 0.248 5.9092004-05 - 0.301 6.235 0.225 6.7612005-06 - 0.312 7.877 0.212 8.4022006-07 - 0.273 9.431 0.211 9.9162007-08 - 0.138 (2) 24.058 0.191 24.3872008-09 - - 128.699 0.184 128.8822009-10 - - 40.308 0.148 40.4562010-11 - - 20.282 E 0.160 E 20.442 E
2011-12 - - 15.257 E 0.081 E 15.338 E
2012-13 - - 21.655 E 0.055 E 21.710 E
2013-14 - - 43.579 E 0.050 E 43.629 E
2014-15 - - 49.269 E 0.069 E 49.339 E
2015-16 - - 63.071 0.023 63.0942016-17 - - 60.805 (3)R 0.030 (3)R 60.836 R
2017-18 - - 76.174 R 0.038 76.212 R
2018-19 - - 54.427 0.061 54.488
Notes: These data should be read in conjunction with the explanatory notes.
(1) No data from 2001-02 onwards.
(2) Tipstar ceased operations in 2007.
(3) Since the merger of Tabcorp and the Tatts Group in December 2017, some figures may have been incorrectly classified.
E = Estimated data
R = Revised data
TOTAL SPORTSBETTING
Value ($ million)
BOOKMAKER (AND OTHER) FIXED ODDS
BOOKMAKER (AND OTHER)
POOL BETTINGTAB FIXED ODDS TAB TOTE ODDS
Australian Gambling Statistics, 1993–94 to 2018–19, 36th edition
345

TABLE TAS 33TASMANIA
PER CAPITA SPORTSBETTING TURNOVER
1994-95 0.05 - - 0.18 0.231995-96 15.02 - - 0.41 15.441996-97 15.81 - - 0.51 16.321997-98 9.29 - - 0.56 9.861998-99 3.02 - - 0.57 3.581999-00 1.54 - 2.85 0.65 5.042000-01 0.69 0.10 3.80 0.50 5.092001-02 0.00 (1) 12.55 7.64 0.51 20.702002-03 - 5.09 8.46 0.44 13.982003-04 - 0.55 10.38 0.48 11.402004-05 - 0.59 12.17 0.44 13.202005-06 - 0.62 15.72 0.42 16.772006-07 - 0.56 19.20 0.43 20.182007-08 - 0.29 (2) 50.00 0.40 50.692008-09 - - 272.02 0.39 272.412009-10 - - 86.06 0.32 86.382010-11 - - 44.17 E 0.35 E 44.52 E
2011-12 - - 33.80 E 0.18 E 33.98 E
2012-13 - - 48.88 E 0.12 E 49.01 E
2013-14 - - 100.49 E 0.12 E 100.61 E
2014-15 - - 114.92 E 0.16 E 115.08 E
2015-16 - - 148.28 0.05 148.332016-17 - - 144.10 (3)R 0.07 (3)R 144.17 R
2017-18 - - 181.57 R 0.09 181.66 R
2018-19 - - 129.92 0.15 130.07
Notes: These data should be read in conjunction with the explanatory notes.
(1) No data from 2001-02 onwards.
(2) Tipstar ceased operations in 2007.
(3) Since the merger of Tabcorp and the Tatts Group in December 2017, some figures may have been incorrectly classified.
E = Estimated data
R = Revised data
TOTAL SPORTSBETTING
Value ($)
BOOKMAKER (AND OTHER) FIXED ODDS
BOOKMAKER (AND OTHER)
POOL BETTINGTAB FIXED ODDS TAB TOTE ODDS
Australian Gambling Statistics, 1993–94 to 2018–19, 36th edition
346

TABLE TAS 34TASMANIA
REAL PER CAPITA SPORTSBETTING TURNOVER
1994-95 0.09 - - 0.33 0.421995-96 25.93 - - 0.71 26.651996-97 26.93 - - 0.86 27.791997-98 15.83 - - 0.96 16.791998-99 5.08 - - 0.95 6.031999-00 2.53 - 4.69 1.08 8.292000-01 1.07 0.15 5.89 0.78 7.892001-02 0.00 (1) 18.91 11.51 0.77 31.202002-03 - 7.44 12.37 0.64 20.462003-04 - 0.78 14.82 0.68 16.282004-05 - 0.82 16.98 0.61 18.412005-06 - 0.84 21.26 0.57 22.672006-07 - 0.73 25.21 0.56 26.502007-08 - 0.37 (2) 63.53 0.50 64.402008-09 - - 335.18 0.48 335.662009-10 - - 103.59 0.38 103.972010-11 - - 51.58 E 0.41 E 51.99 E
2011-12 - - 38.56 E 0.20 E 38.77 E
2012-13 - - 54.52 E 0.14 E 54.66 E
2013-14 - - 109.20 E 0.13 E 109.33 E
2014-15 - - 122.77 E 0.17 E 122.94 E
2015-16 - - 156.22 0.06 156.282016-17 - - 149.20 (3)R 0.07 (3)R 149.28 R
2017-18 - - 184.48 R 0.09 184.57 R
2018-19 - - 129.92 0.15 130.07
Notes: These data should be read in conjunction with the explanatory notes.
(1) No data from 2001-02 onwards.
(2) Tipstar ceased operations in 2007.
(3) Since the merger of Tabcorp and the Tatts Group in December 2017, some figures may have been incorrectly classified.
E = Estimated data
R = Revised data
TOTAL SPORTSBETTING
Value ($)
BOOKMAKER (AND OTHER) FIXED ODDS
BOOKMAKER (AND OTHER)
POOL BETTINGTAB FIXED ODDS TAB TOTE ODDS
Australian Gambling Statistics, 1993–94 to 2018–19, 36th edition
347

TABLE TAS 35TASMANIA
TOTAL SPORTSBETTING EXPENDITURE
1994-95 - - - 0.026 0.0261995-96 - - - 0.029 0.0291996-97 - - - 0.029 0.0291997-98 - - - 0.032 0.0321998-99 - - - 0.036 0.0361999-00 - - 0.151 0.039 0.1902000-01 - 0.014 0.163 0.023 0.2002001-02 - 0.422 0.257 0.020 0.6992002-03 - 0.173 (1) 0.352 0.027 0.5522003-04 - 0.018 0.471 0.015 0.5042004-05 - 0.054 0.578 0.014 0.6462005-06 - 0.055 0.804 0.014 0.8732006-07 - 0.051 1.113 0.014 1.1782007-08 - 0.026 (2) 2.204 0.022 2.2522008-09 - - 6.360 0.022 6.3822009-10 - - 0.871 0.046 0.9172010-11 - - 1.046 0.024 1.0702011-12 - - 1.086 0.012 1.0982012-13 - - 1.897 -0.041 (3) 1.8562013-14 - - 2.875 0.011 2.8862014-15 - - 3.136 0.016 3.1522015-16 - - 3.253 0.005 3.2582016-17 - - 3.372 (4)R 0.007 (4)R 3.379 R
2017-18 - - 3.259 R 0.009 3.268 R
2018-19 - - 2.488 0.015 2.504
Notes: These data should be read in conjunction with the explanatory notes.
(1) Expenditure estimated at 9.5 % of turnover.
(2) Tipstar ceased operations in 2007.
(3) Player expenditure in 2012-13 for sportsbetting totalisator was a negative amount due to a totalisator pool jackpotting,
resulting in more dividends paid than turnover received.
(4) Since the merger of Tabcorp and the Tatts Group in December 2017, some figures may have been incorrectly classified.
NA = Not applicable
R = Revised data
TOTAL SPORTSBETTING
Value ($ million)
BOOKMAKER (AND OTHER) FIXED ODDS
(NA)
BOOKMAKER (AND OTHER)
POOL BETTINGTAB FIXED ODDS TAB TOTE ODDS
Australian Gambling Statistics, 1993–94 to 2018–19, 36th edition
348

TABLE TAS 36TASMANIA
REAL SPORTSBETTING EXPENDITURE
1994-95 - - - 0.047 0.0471995-96 - - - 0.050 0.0501996-97 - - - 0.049 0.0491997-98 - - - 0.054 0.0541998-99 - - - 0.061 0.0611999-00 - - 0.248 0.064 0.3122000-01 - 0.022 0.253 0.036 0.3102001-02 - 0.636 0.387 0.030 1.0542002-03 - 0.253 (1) 0.515 0.039 0.8072003-04 - 0.026 0.673 0.021 0.7202004-05 - 0.075 0.806 0.020 0.9012005-06 - 0.074 1.087 0.019 1.1802006-07 - 0.067 1.461 0.018 1.5472007-08 - 0.033 (2) 2.800 0.028 2.8612008-09 - - 7.837 0.027 7.8642009-10 - - 1.048 0.055 1.1042010-11 - - 1.222 0.028 1.2502011-12 - - 1.239 0.014 1.2532012-13 - - 2.116 -0.046 (3) 2.0702013-14 - - 3.124 0.012 3.1362014-15 - - 3.350 0.017 3.3672015-16 - - 3.427 0.005 3.4322016-17 - - 3.491 (4)R 0.008 (4)R 3.499 R
2017-18 - - 3.311 R 0.009 3.320 R
2018-19 - - 2.488 0.015 2.504
Notes: These data should be read in conjunction with the explanatory notes.
(1) Expenditure estimated at 9.5 % of turnover.
(2) Tipstar ceased operations in 2007.
(3) Player expenditure in 2012-13 for sportsbetting totalisator was a negative amount due to a totalisator pool jackpotting,
resulting in more dividends paid than turnover received.
(4) Since the merger of Tabcorp and the Tatts Group in December 2017, some figures may have been incorrectly classified.
NA = Not applicable
R = Revised data
TOTAL SPORTSBETTING
Value ($ million)
BOOKMAKER (AND OTHER) FIXED ODDS
(NA)
BOOKMAKER (AND OTHER)
POOL BETTINGTAB FIXED ODDS TAB TOTE ODDS
Australian Gambling Statistics, 1993–94 to 2018–19, 36th edition
349

TABLE TAS 37TASMANIA
PER CAPITA SPORTSBETTING EXPENDITURE
1994-95 - - - 0.08 0.081995-96 - - - 0.08 0.081996-97 - - - 0.08 0.081997-98 - - - 0.09 0.091998-99 - - - 0.10 0.101999-00 - - 0.43 0.11 0.542000-01 - 0.04 0.46 0.07 0.572001-02 - 1.19 0.73 0.06 1.972002-03 - 0.48 (1) 0.98 0.08 1.542003-04 - 0.05 1.30 0.04 1.392004-05 - 0.15 1.57 0.04 1.762005-06 - 0.15 2.17 0.04 2.362006-07 - 0.14 2.97 0.04 3.152007-08 - 0.07 (2) 5.82 0.06 5.952008-09 - - 16.56 0.06 16.622009-10 - - 2.24 0.12 2.362010-11 - - 2.66 0.06 2.722011-12 - - 2.74 0.03 2.782012-13 - - 4.78 -0.10 (3) 4.672013-14 - - 7.20 0.03 7.232014-15 - - 7.81 0.04 7.852015-16 - - 8.06 0.01 8.072016-17 - - 8.27 (4)R 0.02 (4)R 8.29 R
2017-18 - - 7.89 R 0.02 7.91 R
2018-19 - - 5.94 0.04 5.98
Notes: These data should be read in conjunction with the explanatory notes.
(1) Expenditure estimated at 9.5 % of turnover.
(2) Tipstar ceased operations in 2007.
(3) Player expenditure in 2012-13 for sportsbetting totalisator was a negative amount due to a totalisator pool jackpotting,
resulting in more dividends paid than turnover received.
(4) Since the merger of Tabcorp and the Tatts Group in December 2017, some figures may have been incorrectly classified.
NA = Not applicable
R = Revised data
TOTAL SPORTSBETTING
Value ($)
BOOKMAKER (AND OTHER) FIXED ODDS
(NA)
BOOKMAKER (AND OTHER)
POOL BETTINGTAB FIXED ODDS TAB TOTE ODDS
Australian Gambling Statistics, 1993–94 to 2018–19, 36th edition
350

TABLE TAS 38TASMANIA
REAL PER CAPITA SPORTSBETTING EXPENDITURE
1994-95 - - - 0.14 0.141995-96 - - - 0.14 0.141996-97 - - - 0.14 0.141997-98 - - - 0.16 0.161998-99 - - - 0.17 0.171999-00 - - 0.71 0.18 0.892000-01 - 0.06 0.72 0.10 0.882001-02 - 1.80 1.09 0.09 2.972002-03 - 0.71 (1) 1.44 0.11 2.262003-04 - 0.07 1.85 0.06 1.982004-05 - 0.21 2.20 0.05 2.452005-06 - 0.20 2.93 0.05 3.182006-07 - 0.18 3.91 0.05 4.132007-08 - 0.09 (2) 7.40 0.07 7.562008-09 - - 20.41 0.07 20.482009-10 - - 2.69 0.14 2.842010-11 - - 3.11 0.07 3.182011-12 - - 3.13 0.03 3.172012-13 - - 5.33 -0.12 (3) 5.212013-14 - - 7.83 0.03 7.862014-15 - - 8.35 0.04 8.392015-16 - - 8.49 0.01 8.502016-17 - - 8.57 (4)R 0.02 (4)R 8.59 R
2017-18 - - 8.02 R 0.02 8.04 R
2018-19 - - 5.94 0.04 5.98
Notes: These data should be read in conjunction with the explanatory notes.
(1) Expenditure estimated at 9.5 % of turnover.
(2) Tipstar ceased operations in 2007.
(3) Player expenditure in 2012-13 for sportsbetting totalisator was a negative amount due to a totalisator pool jackpotting,
resulting in more dividends paid than turnover received.
(4) Since the merger of Tabcorp and the Tatts Group in December 2017, some figures may have been incorrectly classified.
NA = Not applicable
R = Revised data
TOTAL SPORTSBETTING
Value ($)
BOOKMAKER (AND OTHER) FIXED ODDS
(NA)
BOOKMAKER (AND OTHER)
POOL BETTINGTAB FIXED ODDS TAB TOTE ODDS
Australian Gambling Statistics, 1993–94 to 2018–19, 36th edition
351

TABLE TAS 39TASMANIA
SPORTSBETTING EXPENDITUREAS A % OF HDI
1994-95 - - - 0.000 0.0001995-96 - - - 0.000 0.0001996-97 - - - 0.000 0.0001997-98 - - - 0.000 0.0001998-99 - - - 0.000 0.0001999-00 - - 0.002 0.000 0.0022000-01 - 0.000 0.002 0.000 0.0022001-02 - 0.004 0.003 0.000 0.0072002-03 - 0.002 (1) 0.003 0.000 0.0052003-04 - 0.000 0.004 0.000 0.0042004-05 - 0.000 0.005 0.000 0.0052005-06 - 0.000 0.006 0.000 0.0062006-07 - 0.000 0.008 0.000 0.0082007-08 - 0.000 (2) 0.014 0.000 0.0142008-09 - - 0.036 0.000 0.0362009-10 - - 0.005 0.000 0.0052010-11 - - 0.006 0.000 0.0062011-12 - - 0.006 0.000 0.0062012-13 - - 0.010 -0.000 (3) 0.0102013-14 - - 0.015 0.000 0.0152014-15 - - 0.015 0.000 0.0152015-16 - - 0.015 0.000 0.0152016-17 - - 0.015 (4)R 0.000 (4)R 0.015 R
2017-18 - - 0.014 R 0.000 0.014 R
2018-19 - - 0.010 0.000 0.010
Notes: These data should be read in conjunction with the explanatory notes.
(1) Expenditure estimated at 9.5 % of turnover.
(2) Tipstar ceased operations in 2007.
(3) Player expenditure in 2012-13 for sportsbetting totalisator was a negative amount due to a totalisator pool jackpotting,
resulting in more dividends paid than turnover received.
(4) Since the merger of Tabcorp and the Tatts Group in December 2017, some figures may have been incorrectly classified.
NA = Not applicable
R = Revised data
Percentage (%)
BOOKMAKER (AND OTHER) FIXED ODDS
(NA)
BOOKMAKER (AND OTHER)
POOL BETTINGTAB FIXED ODDS TAB TOTE ODDS
TOTAL SPORTSBETTING
Australian Gambling Statistics, 1993–94 to 2018–19, 36th edition
352

TABLE TAS 40TASMANIA
SPORTSBETTING EXPENDITURESHARE OF MARKET
1994-95 - - - 100.001995-96 - - - 100.001996-97 - - - 100.001997-98 - - - 100.001998-99 - - - 100.001999-00 - - 79.47 20.532000-01 - 7.00 81.50 11.502001-02 - 60.37 36.77 2.862002-03 - 31.34 (1) 63.77 4.892003-04 - 3.57 93.45 2.982004-05 - 8.36 89.47 2.172005-06 - 6.30 92.10 1.602006-07 - 4.33 94.48 1.192007-08 - 1.15 (2) 97.87 0.982008-09 - - 99.66 0.342009-10 - - 94.98 5.022010-11 - - 97.76 2.242011-12 - - 98.91 1.092012-13 - - 102.21 -2.21 (3)
2013-14 - - 99.62 0.382014-15 - - 99.49 0.512015-16 - - 99.85 0.152016-17 - - 99.78 (4)R 0.22 (4)R
2017-18 - - 99.72 R 0.282018-19 - - 99.39 0.61
Notes: These data should be read in conjunction with the explanatory notes.
(1) Expenditure estimated at 9.5 % of turnover.
(2) Tipstar ceased operations in 2007.
(3) Player expenditure in 2012-13 for sportsbetting totalisator was a negative amount due to a totalisator pool jackpotting,
resulting in more dividends paid than turnover received.
(4) Since the merger of Tabcorp and the Tatts Group in December 2017, some figures may have been incorrectly classified.
NA = Not applicable
R = Revised data
TAB FIXED ODDS TAB TOTE ODDS
Percentage (%)
BOOKMAKER (AND OTHER) FIXED ODDS
(NA)
BOOKMAKER (AND OTHER)
POOL BETTING
Australian Gambling Statistics, 1993–94 to 2018–19, 36th edition
353

TABLE TAS 41TASMANIA
GOVERNMENT REVENUE FROM SPORTSBETTING
1994-95 - - - 0.003 0.0031995-96 0.026 - - 0.007 0.0331996-97 0.028 - - 0.008 0.0361997-98 0.016 - - 0.009 0.0251998-99 0.005 - - 0.009 0.0141999-00 0.016 - 0.004 0.009 0.0302000-01 0.001 - - U - U 0.001 (1)
2001-02 - U 0.011 - U - U 0.0112002-03 - U 0.030 - U - U 0.0302003-04 - U 0.032 - U - U 0.0322004-05 - U 0.030 - U - U 0.0302005-06 - U 0.029 - U - U 0.0292006-07 - U 0.027 - U - U 0.0272007-08 0.591 (2) 0.014 (3) - U - U 0.6052008-09 0.755 - - U - U 0.7552009-10 0.678 - - U - U 0.6782010-11 0.364 - - U - U 0.3642011-12 0.394 - - U - U 0.3942012-13 0.327 - - U - U 0.3272013-14 0.417 - - U - U 0.4172014-15 0.608 - - U - U 0.6082015-16 0.454 - - U - U 0.4542016-17 0.068 (4) - - U - U 0.0682017-18 - - - U - U -2018-19 - - - U - U -
Notes: These data should be read in conjunction with the explanatory notes.
Data for the gambling revenue received by states and territories from 1 July 2000 onwards are not comparable with that of
preceding years because of the impact of changes brought about by the introduction of the GST.
(1) Total sportsbetting figure incomplete from this period on, due to data for one or more components being unavailable.
(2) Includes tax paid on Australian and overseas non-racing events, from this period on.
(3) Tipstar ceased operations in 2007.
(4) Betfair ceased operations in Tasmania in November 2016.
U = Unavailable data
TOTAL SPORTSBETTING
Value ($ million)
BOOKMAKER (AND OTHER) FIXED ODDS
BOOKMAKER (AND OTHER)
POOL BETTINGTAB FIXED ODDS TAB TOTE ODDS
Australian Gambling Statistics, 1993–94 to 2018–19, 36th edition
354

TABLE TAS 42TASMANIA
REAL GOVERNMENT REVENUE FROM SPORTSBETTING
1994-95 - - - 0.005 0.0051995-96 0.045 - - 0.012 0.0571996-97 0.048 - - 0.014 0.0611997-98 0.027 - - 0.015 0.0431998-99 0.008 - - 0.015 0.0241999-00 0.027 - 0.007 0.016 0.0492000-01 0.002 - - U - U 0.002 (1)
2001-02 - U 0.017 - U - U 0.0172002-03 - U 0.044 - U - U 0.0442003-04 - U 0.046 - U - U 0.0462004-05 - U 0.042 - U - U 0.0422005-06 - U 0.039 - U - U 0.0392006-07 - U 0.035 - U - U 0.0352007-08 0.751 (2) 0.018 (3) - U - U 0.7692008-09 0.930 - - U - U 0.9302009-10 0.816 - - U - U 0.8162010-11 0.425 - - U - U 0.4252011-12 0.450 - - U - U 0.4502012-13 0.365 - - U - U 0.3652013-14 0.453 - - U - U 0.4532014-15 0.650 - - U - U 0.6502015-16 0.478 - - U - U 0.4782016-17 0.071 (4) - - U - U 0.0712017-18 - - - U - U -2018-19 - - - U - U -
Notes: These data should be read in conjunction with the explanatory notes.
Data for the gambling revenue received by states and territories from 1 July 2000 onwards are not comparable with that of
preceding years because of the impact of changes brought about by the introduction of the GST.
(1) Total sportsbetting figure incomplete from this period on, due to data for one or more components being unavailable.
(2) Includes tax paid on Australian and overseas non-racing events, from this period on.
(3) Tipstar ceased operations in 2007.
(4) Betfair ceased operations in Tasmania in November 2016.
U = Unavailable data
TOTAL SPORTSBETTING
Value ($ million)
BOOKMAKER (AND OTHER) FIXED ODDS
BOOKMAKER (AND OTHER)
POOL BETTINGTAB FIXED ODDS TAB TOTE ODDS
Australian Gambling Statistics, 1993–94 to 2018–19, 36th edition
355

TABLE TAS 43TASMANIA
PER CAPITA REVENUE FROM SPORTSBETTING
1994-95 - - - 0.01 0.011995-96 0.07 - - 0.02 0.091996-97 0.08 - - 0.02 0.101997-98 0.05 - - 0.03 0.071998-99 0.01 - - 0.03 0.041999-00 0.05 - 0.01 0.03 0.082000-01 0.00 - - U - U 0.00 (1)
2001-02 - U 0.03 - U - U 0.032002-03 - U 0.08 - U - U 0.082003-04 - U 0.09 - U - U 0.092004-05 - U 0.08 - U - U 0.082005-06 - U 0.08 - U - U 0.082006-07 - U 0.07 - U - U 0.072007-08 1.56 (2) 0.04 (3) - U - U 1.602008-09 1.97 - - U - U 1.972009-10 1.74 - - U - U 1.742010-11 0.93 - - U - U 0.932011-12 1.00 - - U - U 1.002012-13 0.82 - - U - U 0.822013-14 1.04 - - U - U 1.042014-15 1.52 - - U - U 1.522015-16 1.12 - - U - U 1.122016-17 0.17 (4) - - U - U 0.172017-18 - - - U - U -2018-19 - - - U - U -
Notes: These data should be read in conjunction with the explanatory notes.
Data for the gambling revenue received by states and territories from 1 July 2000 onwards are not comparable with that of
preceding years because of the impact of changes brought about by the introduction of the GST.
(1) Total sportsbetting figure incomplete from this period on, due to data for one or more components being unavailable.
(2) Includes tax paid on Australian and overseas non-racing events, from this period on.
(3) Tipstar ceased operations in 2007.
(4) Betfair ceased operations in Tasmania in November 2016.
U = Unavailable data
TOTAL SPORTSBETTING
Value ($)
BOOKMAKER (AND OTHER) FIXED ODDS
BOOKMAKER (AND OTHER)
POOL BETTINGTAB FIXED ODDS TAB TOTE ODDS
Australian Gambling Statistics, 1993–94 to 2018–19, 36th edition
356

TABLE TAS 44TASMANIA
REAL PER CAPITA REVENUE FROM SPORTSBETTING
1994-95 - - - 0.02 0.021995-96 0.13 - - 0.03 0.161996-97 0.14 - - 0.04 0.181997-98 0.08 - - 0.04 0.121998-99 0.02 - - 0.04 0.071999-00 0.08 - 0.02 0.04 0.142000-01 0.01 - - U - U 0.01 (1)
2001-02 - U 0.05 - U - U 0.052002-03 - U 0.12 - U - U 0.122003-04 - U 0.13 - U - U 0.132004-05 - U 0.11 - U - U 0.112005-06 - U 0.11 - U - U 0.112006-07 - U 0.09 - U - U 0.092007-08 1.98 (2) 0.05 (3) - U - U 2.032008-09 2.42 - - U - U 2.422009-10 2.10 - - U - U 2.102010-11 1.08 - - U - U 1.082011-12 1.14 - - U - U 1.142012-13 0.92 - - U - U 0.922013-14 1.13 - - U - U 1.132014-15 1.62 - - U - U 1.622015-16 1.18 - - U - U 1.182016-17 0.17 (4) - - U - U 0.172017-18 - - - U - U -2018-19 - - - U - U -
Notes: These data should be read in conjunction with the explanatory notes.
Data for the gambling revenue received by states and territories from 1 July 2000 onwards are not comparable with that of
preceding years because of the impact of changes brought about by the introduction of the GST.
(1) Total sportsbetting figure incomplete from this period on, due to data for one or more components being unavailable.
(2) Includes tax paid on Australian and overseas non-racing events, from this period on.
(3) Tipstar ceased operations in 2007.
(4) Betfair ceased operations in Tasmania in November 2016.
U = Unavailable data
TOTAL SPORTSBETTING
Value ($)
BOOKMAKER (AND OTHER) FIXED ODDS
BOOKMAKER (AND OTHER)
POOL BETTINGTAB FIXED ODDS TAB TOTE ODDS
Australian Gambling Statistics, 1993–94 to 2018–19, 36th edition
357

TABLE TAS 45TASMANIA
GOVERNMENT REVENUE FROM SPORTSBETTINGAS A % OF TOTAL GAMBLING REVENUE
1994-95 - - - 0.01 0.011995-96 0.05 - - 0.01 0.061996-97 0.05 - - 0.01 0.061997-98 0.03 - - 0.01 0.041998-99 0.01 - - 0.01 0.021999-00 0.02 - 0.01 0.01 0.042000-01 0.00 - - U - U 0.00 (1)
2001-02 - U 0.02 - U - U 0.022002-03 - U 0.04 - U - U 0.042003-04 - U 0.04 - U - U 0.042004-05 - U 0.04 - U - U 0.042005-06 - U 0.04 - U - U 0.042006-07 - U 0.03 - U - U 0.032007-08 0.69 (2) 0.02 (3) - U - U 0.702008-09 0.84 - - U - U 0.842009-10 0.76 - - U - U 0.762010-11 0.44 - - U - U 0.442011-12 0.47 - - U - U 0.472012-13 0.40 - - U - U 0.402013-14 0.51 - - U - U 0.512014-15 0.73 - - U - U 0.732015-16 0.54 - - U - U 0.542016-17 0.09 (4) - - U - U 0.092017-18 - - - U - U -2018-19 - - - U - U -
Notes: These data should be read in conjunction with the explanatory notes.
Data for the gambling revenue received by states and territories from 1 July 2000 onwards are not comparable with that of
preceding years because of the impact of changes brought about by the introduction of the GST.
(1) Total sportsbetting figure incomplete from this period on, due to data for one or more components being unavailable.
(2) Includes tax paid on Australian and overseas non-racing events, from this period on.
(3) Tipstar ceased operations in 2007.
(4) Betfair ceased operations in Tasmania in November 2016.
U = Unavailable data
Percentage (%)
BOOKMAKER (AND OTHER) FIXED ODDS
BOOKMAKER (AND OTHER)
POOL BETTINGTAB FIXED ODDS TAB TOTE ODDS
TOTAL SPORTSBETTING
Australian Gambling Statistics, 1993–94 to 2018–19, 36th edition
358

TABLE TAS 46TASMANIA
TOTAL GAMBLING TURNOVER
1993-94 895.290 262.520 - 1,157.8101994-95 969.189 301.522 0.080 1,270.7911995-96 1,030.197 282.599 5.368 1,318.1641996-97 1,130.972 256.542 5.694 1,393.2081997-98 1,298.767 232.350 3.445 1,534.5621998-99 1,486.978 229.949 1.254 1,718.1811999-00 1,646.080 216.258 1.772 1,864.1092000-01 1,861.175 230.758 1.794 2,093.7272001-02 1,909.255 246.612 7.334 2,163.2012002-03 2,021.279 276.141 5.005 2,302.4252003-04 2,150.012 288.599 4.138 2,442.7492004-05 2,249.022 302.267 4.847 2,556.1362005-06 2,079.309 319.307 6.215 2,404.8312006-07 76.155 382.689 7.552 466.3962007-08 79.711 482.464 19.193 581.3682008-09 77.345 646.574 104.597 828.5162009-10 89.490 726.784 33.613 849.8872010-11 83.388 946.957 17.504 1,047.8492011-12 90.636 926.773 13.443 1,030.8522012-13 110.199 206.619 19.465 336.2832013-14 93.649 291.919 40.149 425.7172014-15 93.772 335.111 46.182 475.0652015-16 100.790 389.112 59.887 549.7892016-17 96.143 376.297 58.756 531.1962017-18 99.470 373.627 75.010 548.1072018-19 120.269 304.132 54.488 478.890
Notes: These data should be read in conjunction with the explanatory notes.
Figure(s) may be incomplete for any period due to some unavailable turnover figures that are used to derive these numbers.
Value ($ million)
GAMING RACING SPORTSBETTING TOTAL GAMBLING
Australian Gambling Statistics, 1993–94 to 2018–19, 36th edition
359

TABLE TAS 47TASMANIA
REAL GAMBLING TURNOVER
1993-94 1,663.723 487.843 - 2,151.5651994-95 1,744.234 542.644 0.144 2,287.0231995-96 1,778.298 487.815 9.266 2,275.3781996-97 1,926.029 436.887 9.697 2,372.6131997-98 2,211.781 395.689 5.867 2,613.3361998-99 2,502.422 386.979 2.110 2,891.5111999-00 2,706.307 355.547 2.913 3,064.7682000-01 2,885.327 357.738 2.781 3,245.8462001-02 2,877.754 371.710 11.055 3,260.5192002-03 2,956.768 403.945 7.321 3,368.0352003-04 3,070.292 412.129 5.909 3,488.3312004-05 3,137.083 421.622 6.761 3,565.4662005-06 2,811.009 431.670 8.402 3,251.0812006-07 99.992 502.472 9.916 612.3802007-08 101.281 613.019 24.387 738.6872008-09 95.303 796.696 128.882 1,020.8822009-10 107.709 874.747 40.456 1,022.9132010-11 97.386 1,105.914 20.442 1,223.7422011-12 103.416 1,057.448 15.338 1,176.2022012-13 122.910 230.452 21.710 375.0722013-14 101.765 317.219 43.629 462.6122014-15 100.182 358.017 49.339 507.5372015-16 106.188 409.951 63.094 579.2332016-17 99.546 389.614 60.836 549.9952017-18 101.065 379.616 76.212 556.8922018-19 120.269 304.132 54.488 478.890
Notes: These data should be read in conjunction with the explanatory notes.
Figure(s) may be incomplete for any period due to some unavailable turnover figures that are used to derive these numbers.
Value ($ million)
GAMING RACING SPORTSBETTING TOTAL GAMBLING
Australian Gambling Statistics, 1993–94 to 2018–19, 36th edition
360

TABLE TAS 48TASMANIA
PER CAPITA GAMBLING TURNOVER
1993-94 2,598.03 761.80 - 3,359.831994-95 2,798.45 870.62 0.23 3,669.301995-96 2,962.44 812.64 15.44 3,790.521996-97 3,241.76 735.34 16.32 3,993.421997-98 3,715.89 664.77 9.86 4,390.521998-99 4,247.08 656.78 3.58 4,907.431999-00 4,686.32 615.68 5.04 5,307.042000-01 5,277.64 654.35 5.09 5,937.072001-02 5,388.70 696.04 20.70 6,105.442002-03 5,647.59 771.56 13.98 6,433.132003-04 5,923.17 795.07 11.40 6,729.642004-05 6,123.75 823.03 13.20 6,959.982005-06 5,610.47 861.57 16.77 6,488.812006-07 203.53 1,022.78 20.18 1,246.492007-08 210.51 1,274.13 50.69 1,535.332008-09 201.43 1,683.91 272.41 2,157.762009-10 229.97 1,867.71 86.38 2,184.072010-11 212.07 2,408.26 44.52 2,664.852011-12 229.08 2,342.37 33.98 2,605.422012-13 277.46 520.22 49.01 846.682013-14 234.67 731.52 100.61 1,066.802014-15 233.66 835.04 115.08 1,183.782015-16 249.65 963.79 148.33 1,361.782016-17 235.91 923.35 144.17 1,303.432017-18 240.89 904.83 181.66 1,327.382018-19 287.10 726.01 130.07 1,143.18
Notes: These data should be read in conjunction with the explanatory notes.
Figure(s) may be incomplete for any period due to some unavailable turnover figures that are used to derive these numbers.
Value ($)
GAMING RACING SPORTSBETTING TOTAL GAMBLING
Australian Gambling Statistics, 1993–94 to 2018–19, 36th edition
361

TABLE TAS 49TASMANIA
REAL PER CAPITA GAMBLING TURNOVER
1993-94 4,827.93 1,415.66 - 6,243.591994-95 5,036.33 1,566.84 0.42 6,603.591995-96 5,113.69 1,402.76 26.65 6,543.101996-97 5,520.67 1,252.27 27.79 6,800.731997-98 6,328.11 1,132.10 16.79 7,476.991998-99 7,147.37 1,105.28 6.03 8,258.681999-00 7,704.75 1,012.23 8.29 8,725.272000-01 8,181.77 1,014.42 7.89 9,204.082001-02 8,122.21 1,049.12 31.20 9,202.522002-03 8,261.41 1,128.65 20.46 9,410.522003-04 8,458.49 1,135.39 16.28 9,610.162004-05 8,541.81 1,148.01 18.41 9,708.242005-06 7,584.78 1,164.75 22.67 8,772.192006-07 267.24 1,342.91 26.50 1,636.652007-08 267.47 1,618.92 64.40 1,950.792008-09 248.20 2,074.89 335.66 2,658.752009-10 276.79 2,247.95 103.97 2,628.712010-11 247.67 2,812.52 51.99 3,112.172011-12 261.38 2,672.64 38.77 2,972.792012-13 309.46 580.22 54.66 944.352013-14 255.01 794.92 109.33 1,159.262014-15 249.64 892.12 122.94 1,264.692015-16 263.02 1,015.41 156.28 1,434.712016-17 244.26 956.02 149.28 1,349.562017-18 244.75 919.34 184.57 1,348.662018-19 287.10 726.01 130.07 1,143.18
Notes: These data should be read in conjunction with the explanatory notes.
Figure(s) may be incomplete for any period due to some unavailable turnover figures that are used to derive these numbers.
Value ($)
GAMING RACING SPORTSBETTING TOTAL GAMBLING
Australian Gambling Statistics, 1993–94 to 2018–19, 36th edition
362

TABLE TAS 50TASMANIA
TOTAL GAMBLING EXPENDITURE
1993-94 91.091 35.010 - 126.1021994-95 101.884 35.622 0.026 137.5321995-96 112.848 35.216 0.029 148.0931996-97 127.308 33.188 0.029 160.5251997-98 145.286 31.850 0.032 177.1681998-99 166.754 29.672 0.036 196.4621999-00 181.134 28.285 0.190 209.6092000-01 202.576 28.948 0.200 231.7242001-02 232.263 27.197 0.699 260.1592002-03 244.704 25.495 0.552 270.7512003-04 259.869 24.857 0.504 285.2302004-05 270.640 27.130 0.646 298.4162005-06 258.652 52.599 0.873 312.1242006-07 265.339 61.869 1.178 328.3862007-08 280.842 75.368 2.252 358.4622008-09 294.643 94.877 6.382 395.9022009-10 289.052 93.458 0.917 383.4272010-11 290.308 101.082 1.070 392.4602011-12 285.133 97.913 1.098 384.1442012-13 279.142 39.327 1.856 320.3252013-14 271.548 41.731 2.886 316.1652014-15 274.188 43.359 3.152 320.6992015-16 277.716 45.468 3.258 326.4422016-17 264.918 40.732 3.379 309.0292017-18 258.066 42.719 3.268 304.0522018-19 264.349 40.025 2.504 306.878
Notes: These data should be read in conjunction with the explanatory notes.
Figure(s) may be incomplete for any period due to some unavailable expenditure figures that are used to derive these numbers.
Value ($ million)
GAMING RACING SPORTSBETTING TOTAL GAMBLING
Australian Gambling Statistics, 1993–94 to 2018–19, 36th edition
363

TABLE TAS 51TASMANIA
REAL GAMBLING EXPENDITURE
1993-94 169.276 65.060 - 234.3361994-95 183.359 64.108 0.047 247.5141995-96 194.796 60.789 0.050 255.6351996-97 216.803 56.519 0.049 273.3711997-98 247.420 54.240 0.054 301.7141998-99 280.629 49.935 0.061 330.6241999-00 297.801 46.503 0.312 344.6172000-01 314.047 44.877 0.310 359.2352001-02 350.082 40.993 1.054 392.1282002-03 357.958 37.295 0.807 396.0602003-04 371.102 35.497 0.720 407.3182004-05 377.506 37.843 0.901 416.2502005-06 349.671 71.108 1.180 421.9592006-07 348.391 81.234 1.547 431.1722007-08 356.838 95.763 2.861 455.4622008-09 363.054 116.906 7.864 487.8232009-10 347.899 112.485 1.104 461.4882010-11 339.039 118.050 1.250 458.3392011-12 325.337 111.719 1.253 438.3082012-13 311.340 43.863 2.070 357.2742013-14 295.082 45.348 3.136 343.5662014-15 292.930 46.323 3.367 342.6202015-16 292.589 47.903 3.432 343.9252016-17 274.293 42.174 3.499 319.9652017-18 262.202 43.404 3.320 308.9262018-19 264.349 40.025 2.504 306.878
Notes: These data should be read in conjunction with the explanatory notes.
Figure(s) may be incomplete for any period due to some unavailable expenditure figures that are used to derive these numbers.
Value ($ million)
GAMING RACING SPORTSBETTING TOTAL GAMBLING
Australian Gambling Statistics, 1993–94 to 2018–19, 36th edition
364

TABLE TAS 52TASMANIA
PER CAPITA GAMBLING EXPENDITURE
1993-94 264.34 101.60 - 365.931994-95 294.18 102.86 0.08 397.111995-96 324.51 101.27 0.08 425.861996-97 364.91 95.13 0.08 460.121997-98 415.68 91.13 0.09 506.891998-99 476.28 84.75 0.10 561.131999-00 515.68 80.53 0.54 596.752000-01 574.43 82.09 0.57 657.092001-02 655.54 76.76 1.97 734.282002-03 683.72 71.23 1.54 756.502003-04 715.93 68.48 1.39 785.792004-05 736.91 73.87 1.76 812.542005-06 697.91 141.92 2.36 842.192006-07 709.15 165.35 3.15 877.652007-08 741.67 199.04 5.95 946.662008-09 767.36 247.09 16.62 1,031.072009-10 742.82 240.17 2.36 985.342010-11 738.30 257.07 2.72 998.092011-12 720.66 247.47 2.78 970.902012-13 702.82 99.02 4.67 806.512013-14 680.47 104.57 7.23 792.282014-15 683.23 108.04 7.85 799.132015-16 687.88 112.62 8.07 808.572016-17 650.05 99.95 8.29 758.292017-18 624.97 103.46 7.91 736.342018-19 631.04 95.55 5.98 732.56
Notes: These data should be read in conjunction with the explanatory notes.
Figure(s) may be incomplete for any period due to some unavailable expenditure figures that are used to derive these numbers.
Value ($)
GAMING RACING SPORTSBETTING TOTAL GAMBLING
Australian Gambling Statistics, 1993–94 to 2018–19, 36th edition
365

TABLE TAS 53TASMANIA
REAL PER CAPITA GAMBLING EXPENDITURE
1993-94 491.22 188.80 - 680.011994-95 529.43 185.11 0.14 714.681995-96 560.16 174.81 0.14 735.111996-97 621.43 162.00 0.14 783.581997-98 707.89 155.19 0.16 863.231998-99 801.53 142.62 0.17 944.321999-00 847.83 132.39 0.89 981.112000-01 890.53 127.26 0.88 1,018.662001-02 988.07 115.70 2.97 1,106.752002-03 1,000.16 104.20 2.26 1,106.622003-04 1,022.37 97.79 1.98 1,122.142004-05 1,027.89 103.04 2.45 1,133.392005-06 943.49 191.87 3.18 1,138.552006-07 931.11 217.11 4.13 1,152.352007-08 942.37 252.90 7.56 1,202.822008-09 945.52 304.46 20.48 1,270.472009-10 894.04 289.07 2.84 1,185.952010-11 862.23 300.22 3.18 1,165.632011-12 822.27 282.36 3.17 1,107.802012-13 783.88 110.44 5.21 899.532013-14 739.45 113.64 7.86 860.942014-15 729.93 115.43 8.39 853.752015-16 724.72 118.65 8.50 851.872016-17 673.05 103.48 8.59 785.122017-18 634.99 105.11 8.04 748.142018-19 631.04 95.55 5.98 732.56
Notes: These data should be read in conjunction with the explanatory notes.
Figure(s) may be incomplete for any period due to some unavailable expenditure figures that are used to derive these numbers.
Value ($)
GAMING RACING SPORTSBETTING TOTAL GAMBLING
Australian Gambling Statistics, 1993–94 to 2018–19, 36th edition
366

TABLE TAS 54TASMANIA
GAMBLING EXPENDITUREAS A % OF HDI
1993-94 1.319 0.507 - 1.8271994-95 1.405 0.491 0.000 1.8971995-96 1.482 0.462 0.000 1.9451996-97 1.636 0.426 0.000 2.0631997-98 1.835 0.402 0.000 2.2381998-99 2.079 0.370 0.000 2.4491999-00 2.151 0.336 0.002 2.4892000-01 2.310 0.330 0.002 2.6432001-02 2.367 0.277 0.007 2.6512002-03 2.397 0.250 0.005 2.6532003-04 2.299 0.220 0.004 2.5232004-05 2.191 0.220 0.005 2.4162005-06 1.920 0.391 0.006 2.3172006-07 1.817 0.424 0.008 2.2492007-08 1.754 0.471 0.014 2.2392008-09 1.661 0.535 0.036 2.2312009-10 1.579 0.511 0.005 2.0952010-11 1.540 0.536 0.006 2.0812011-12 1.492 0.512 0.006 2.0102012-13 1.484 0.209 0.010 1.7032013-14 1.401 0.215 0.015 1.6312014-15 1.301 0.206 0.015 1.5222015-16 1.259 0.206 0.015 1.4802016-17 1.171 0.180 0.015 1.3662017-18 1.106 0.183 0.014 1.3032018-19 1.087 0.165 0.010 1.262
Notes: These data should be read in conjunction with the explanatory notes.
Figure(s) may be incomplete for any period due to some unavailable expenditure figures that are used to derive these numbers.
RACING SPORTSBETTING TOTAL GAMBLING
Percentage (%)
GAMING
Australian Gambling Statistics, 1993–94 to 2018–19, 36th edition
367

TABLE TAS 55TASMANIA
GAMBLING EXPENDITUREAS A % OF TOTAL GAMBLING EXPENDITURE
1993-94 72.24 27.76 -1994-95 74.08 25.90 0.021995-96 76.20 23.78 0.021996-97 79.31 20.67 0.021997-98 82.00 17.98 0.021998-99 84.88 15.10 0.021999-00 86.42 13.49 0.092000-01 87.42 12.49 0.092001-02 89.28 10.45 0.272002-03 90.38 9.42 0.202003-04 91.11 8.71 0.182004-05 90.69 9.09 0.222005-06 82.87 16.85 0.282006-07 80.80 18.84 0.362007-08 78.35 21.03 0.632008-09 74.42 23.96 1.612009-10 75.39 24.37 0.242010-11 73.97 25.76 0.272011-12 74.23 25.49 0.292012-13 87.14 12.28 0.582013-14 85.89 13.20 0.912014-15 85.50 13.52 0.982015-16 85.07 13.93 1.002016-17 85.73 13.18 1.092017-18 84.88 14.05 1.072018-19 86.14 13.04 0.82
Notes: These data should be read in conjunction with the explanatory notes.
Figure(s) may be incomplete for any period due to some unavailable expenditure figures that are used to derive these numbers.
Percentage (%)
GAMING RACING SPORTSBETTING
Australian Gambling Statistics, 1993–94 to 2018–19, 36th edition
368

TABLE TAS 56TASMANIA
GOVERNMENT REVENUE FROM GAMBLING
1993-94 34.960 10.087 - 45.0471994-95 37.981 12.024 0.003 50.0081995-96 40.762 11.310 0.033 52.1051996-97 50.285 10.356 0.036 60.6771997-98 53.740 9.174 0.025 62.9391998-99 59.228 8.040 0.014 67.2821999-00 67.227 6.281 0.030 73.5382000-01 56.489 0.709 0.001 57.1992001-02 64.104 - 0.011 64.1152002-03 70.195 - 0.030 70.2252003-04 76.153 - 0.032 76.1852004-05 78.385 - 0.030 78.4152005-06 75.041 - 0.029 75.0702006-07 81.408 - 0.027 81.4352007-08 80.348 5.065 0.605 86.0182008-09 81.501 7.180 0.755 89.4362009-10 82.605 6.041 0.678 89.3242010-11 80.961 2.089 0.364 83.4142011-12 81.214 1.826 0.394 83.4342012-13 79.453 2.210 0.327 81.9912013-14 79.473 2.244 0.417 82.1342014-15 80.288 2.252 0.608 83.1482015-16 81.846 2.491 0.454 84.7912016-17 77.996 0.663 0.068 78.7272017-18 77.198 - - 77.1982018-19 83.536 - - 83.536
Notes: These data should be read in conjunction with the explanatory notes.
Figure(s) may be incomplete for any period due to some unavailable revenue figures that are used to derive these numbers.
Data for the gambling revenue received by states and territories from 1 July 2000 onwards are not comparable with that of
preceding years because of the impact of changes brought about by the introduction of the GST.
Value ($ million)
GAMING RACING SPORTSBETTING TOTAL GAMBLING
Australian Gambling Statistics, 1993–94 to 2018–19, 36th edition
369

TABLE TAS 57TASMANIA
REAL GOVERNMENT REVENUE FROM GAMBLING
1993-94 64.966 18.745 - 83.7111994-95 68.354 21.639 0.005 89.9991995-96 70.362 19.523 0.057 89.9421996-97 85.635 17.636 0.061 103.3321997-98 91.518 15.623 0.043 107.1841998-99 99.674 13.530 0.024 113.2281999-00 110.527 10.327 0.049 120.9032000-01 87.573 1.099 0.002 88.6742001-02 96.622 - 0.017 96.6382002-03 102.683 - 0.044 102.7272003-04 108.749 - 0.046 108.7952004-05 109.337 - 0.042 109.3782005-06 101.448 - 0.039 101.4872006-07 106.889 - 0.035 106.9242007-08 102.090 6.436 0.769 109.2952008-09 100.424 8.847 0.930 110.2012009-10 99.422 7.271 0.816 107.5092010-11 94.551 2.440 0.425 97.4162011-12 92.665 2.083 0.450 95.1982012-13 88.618 2.465 0.365 91.4482013-14 86.360 2.438 0.453 89.2522014-15 85.776 2.406 0.650 88.8322015-16 86.229 2.624 0.478 89.3322016-17 80.756 0.686 0.071 81.5142017-18 78.435 - - 78.4352018-19 83.536 - - 83.536
Notes: These data should be read in conjunction with the explanatory notes.
Figure(s) may be incomplete for any period due to some unavailable revenue figures that are used to derive these numbers.
Data for the gambling revenue received by states and territories from 1 July 2000 onwards are not comparable with that of
preceding years because of the impact of changes brought about by the introduction of the GST.
Value ($ million)
GAMING RACING SPORTSBETTING TOTAL GAMBLING
Australian Gambling Statistics, 1993–94 to 2018–19, 36th edition
370

TABLE TAS 58TASMANIA
PER CAPITA REVENUE FROM GAMBLING
1993-94 101.45 29.27 - 130.721994-95 109.67 34.72 0.01 144.391995-96 117.22 32.52 0.09 149.831996-97 144.13 29.68 0.10 173.921997-98 153.76 26.25 0.07 180.071998-99 169.17 22.96 0.04 192.171999-00 191.39 17.88 0.08 209.362000-01 160.18 2.01 0.00 162.202001-02 180.93 - 0.03 180.962002-03 196.13 - 0.08 196.212003-04 209.80 - 0.09 209.892004-05 213.43 - 0.08 213.512005-06 202.48 - 0.08 202.562006-07 217.57 - 0.07 217.642007-08 212.19 13.38 1.60 227.162008-09 212.26 18.70 1.97 232.922009-10 212.28 15.52 1.74 229.552010-11 205.90 5.31 0.93 212.142011-12 205.26 4.62 1.00 210.882012-13 200.04 5.57 0.82 206.432013-14 199.15 5.62 1.04 205.822014-15 200.06 5.61 1.52 207.192015-16 202.72 6.17 1.12 210.022016-17 191.38 1.63 0.17 193.182017-18 186.95 - - 186.952018-19 199.41 - - 199.41
Notes: These data should be read in conjunction with the explanatory notes.
Figure(s) may be incomplete for any period due to some unavailable revenue figures that are used to derive these numbers.
Data for the gambling revenue received by states and territories from 1 July 2000 onwards are not comparable with that of
preceding years because of the impact of changes brought about by the introduction of the GST.
Value ($)
GAMING RACING SPORTSBETTING TOTAL GAMBLING
Australian Gambling Statistics, 1993–94 to 2018–19, 36th edition
371

TABLE TAS 59TASMANIA
REAL PER CAPITA REVENUE FROM GAMBLING
1993-94 188.52 54.39 - 242.921994-95 197.37 62.48 0.02 259.861995-96 202.33 56.14 0.16 258.641996-97 245.46 50.55 0.18 296.191997-98 261.84 44.70 0.12 306.661998-99 284.69 38.65 0.07 323.401999-00 314.67 29.40 0.14 344.212000-01 248.33 3.12 0.01 251.452001-02 272.71 - 0.05 272.752002-03 286.90 - 0.12 287.032003-04 299.60 - 0.13 299.722004-05 297.71 - 0.11 297.822005-06 273.73 - 0.11 273.842006-07 285.67 - 0.09 285.772007-08 269.61 17.00 2.03 288.632008-09 261.54 23.04 2.42 287.002009-10 255.50 18.68 2.10 276.282010-11 240.46 6.20 1.08 247.742011-12 234.21 5.27 1.14 240.612012-13 223.12 6.21 0.92 230.252013-14 216.41 6.11 1.13 223.662014-15 213.74 6.00 1.62 221.352015-16 213.58 6.50 1.18 221.272016-17 198.16 1.68 0.17 200.022017-18 189.95 - - 189.952018-19 199.41 - - 199.41
Notes: These data should be read in conjunction with the explanatory notes.
Figure(s) may be incomplete for any period due to some unavailable revenue figures that are used to derive these numbers.
Data for the gambling revenue received by states and territories from 1 July 2000 onwards are not comparable with that of
preceding years because of the impact of changes brought about by the introduction of the GST.
Value ($)
GAMING RACING SPORTSBETTING TOTAL GAMBLING
Australian Gambling Statistics, 1993–94 to 2018–19, 36th edition
372

TABLE TAS 60TASMANIA
GOVERNMENT REVENUE FROM GAMBLINGAS A % OF TOTAL GAMBLING REVENUE
1993-94 77.61 22.39 -1994-95 75.95 24.04 0.011995-96 78.23 21.71 0.061996-97 82.87 17.07 0.061997-98 85.38 14.58 0.041998-99 88.03 11.95 0.021999-00 91.42 8.54 0.042000-01 98.76 1.24 0.002001-02 99.98 - 0.022002-03 99.96 - 0.042003-04 99.96 - 0.042004-05 99.96 - 0.042005-06 99.96 - 0.042006-07 99.97 - 0.032007-08 93.41 5.89 0.702008-09 91.13 8.03 0.842009-10 92.48 6.76 0.762010-11 97.06 2.50 0.442011-12 97.34 2.19 0.472012-13 96.91 2.70 0.402013-14 96.76 2.73 0.512014-15 96.56 2.71 0.732015-16 96.53 2.94 0.542016-17 99.07 0.84 0.092017-18 100.00 - -2018-19 100.00 - -
Notes: These data should be read in conjunction with the explanatory notes.
Figure(s) may be incomplete for any period due to some unavailable revenue figures that are used to derive these numbers.
Data for the gambling revenue received by states and territories from 1 July 2000 onwards are not comparable with that of
preceding years because of the impact of changes brought about by the introduction of the GST.
Percentage (%)
GAMING RACING SPORTSBETTING
Australian Gambling Statistics, 1993–94 to 2018–19, 36th edition
373
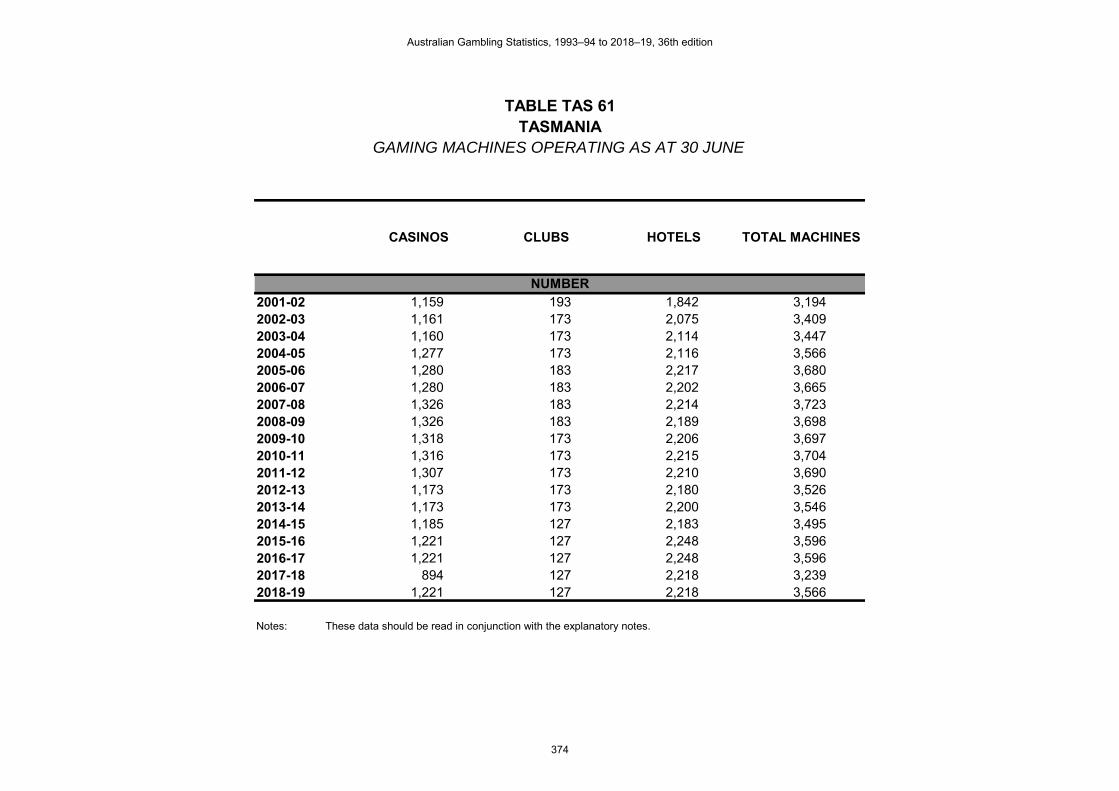
TABLE TAS 61TASMANIA
GAMING MACHINES OPERATING AS AT 30 JUNE
2001-02 1,159 193 1,842 3,194 2002-03 1,161 173 2,075 3,409 2003-04 1,160 173 2,114 3,447 2004-05 1,277 173 2,116 3,566 2005-06 1,280 183 2,217 3,680 2006-07 1,280 183 2,202 3,665 2007-08 1,326 183 2,214 3,723 2008-09 1,326 183 2,189 3,698 2009-10 1,318 173 2,206 3,697 2010-11 1,316 173 2,215 3,704 2011-12 1,307 173 2,210 3,690 2012-13 1,173 173 2,180 3,526 2013-14 1,173 173 2,200 3,546 2014-15 1,185 127 2,183 3,495 2015-16 1,221 127 2,248 3,596 2016-17 1,221 127 2,248 3,596 2017-18 894 127 2,218 3,239 2018-19 1,221 127 2,218 3,566
Notes: These data should be read in conjunction with the explanatory notes.
NUMBER
CASINOS CLUBS HOTELS TOTAL MACHINES
Australian Gambling Statistics, 1993–94 to 2018–19, 36th edition
374

TABLE ACT 1AUSTRALIAN CAPITAL TERRITORY
TOTAL RACING TURNOVER
1993-94 - 35.646 7.365 87.199 130.2101994-95 - 33.935 5.836 83.465 123.2361995-96 - 31.062 6.878 102.631 140.5711996-97 - 22.452 5.356 112.880 140.6881997-98 - 22.527 4.918 113.027 140.4721998-99 - 21.100 7.244 115.128 143.4721999-00 - 18.716 4.409 110.915 134.0402000-01 - 15.670 7.071 129.171 151.9122001-02 - 13.233 8.017 126.538 147.7882002-03 - 10.955 7.049 128.905 146.9092003-04 - 8.760 5.940 151.210 165.9102004-05 - 13.890 3.200 157.582 174.6722005-06 - 13.272 5.013 168.134 186.4192006-07 - 9.734 4.037 158.325 172.0962007-08 - 10.440 3.549 159.633 173.6222008-09 - 10.107 4.656 170.022 184.7852009-10 - 10.778 4.465 160.006 175.2492010-11 - 7.871 3.705 155.800 167.3762011-12 - 4.804 3.651 152.800 161.2552012-13 - 3.717 3.494 145.638 152.8492013-14 - 2.644 2.926 136.415 141.9852014-15 - 1.383 3.355 132.578 137.3162015-16 - 1.523 2.430 105.005 108.9582016-17 - 1.555 1.954 96.247 99.7562017-18 - 1.037 1.495 87.449 89.9812018-19 - 0.799 1.104 85.533 87.436
Notes: These data should be read in conjunction with the explanatory notes.
NA = Not applicable
TOTAL RACING
Value ($ million)
BOOKMAKERS OFF COURSE
(NA)
BOOKMAKERS ON COURSE
ON-COURSE TOTALISATOR
TAB
Australian Gambling Statistics, 1993–94 to 2018–19, 36th edition
375

TABLE ACT 2AUSTRALIAN CAPITAL TERRITORY
REAL RACING TURNOVER
1993-94 - 66.241 13.686 162.042 241.9701994-95 - 61.072 10.503 150.211 221.7861995-96 - 53.618 11.873 177.159 242.6501996-97 - 38.235 9.121 192.233 239.5901997-98 - 38.363 8.375 192.483 239.2221998-99 - 35.509 12.191 193.748 241.4481999-00 - 30.771 7.249 182.354 220.3742000-01 - 24.293 10.962 200.250 235.5052001-02 - 19.946 12.084 190.726 222.7562002-03 - 16.025 10.311 188.565 214.9012003-04 - 12.510 8.483 215.933 236.9252004-05 - 19.375 4.464 219.806 243.6442005-06 - 17.942 6.777 227.300 252.0192006-07 - 12.781 5.301 207.881 225.9632007-08 - 13.265 4.509 202.830 220.6042008-09 - 12.454 5.737 209.498 227.6892009-10 - 12.972 5.374 192.581 210.9272010-11 - 9.192 4.327 181.953 195.4722011-12 - 5.481 4.166 174.345 183.9922012-13 - 4.146 3.897 162.437 170.4802013-14 - 2.873 3.180 148.238 154.2902014-15 - 1.478 3.584 141.640 146.7022015-16 - 1.605 2.560 110.629 114.7932016-17 - 1.610 2.023 99.653 103.2862017-18 - 1.054 1.519 88.851 91.4232018-19 - 0.799 1.104 85.533 87.436
Notes: These data should be read in conjunction with the explanatory notes.
NA = Not applicable
TOTAL RACING
Value ($ million)
BOOKMAKERS OFF COURSE
(NA)
BOOKMAKERS ON COURSE
ON-COURSE TOTALISATOR
TAB
Australian Gambling Statistics, 1993–94 to 2018–19, 36th edition
376

TABLE ACT 3AUSTRALIAN CAPITAL TERRITORYPER CAPITA RACING TURNOVER
1993-94 - 163.14 33.71 399.08 595.931994-95 - 153.06 26.32 376.46 555.851995-96 - 137.80 30.51 455.30 623.611996-97 - 98.41 23.48 494.78 616.671997-98 - 97.96 21.39 491.51 610.851998-99 - 90.80 31.17 495.46 617.441999-00 - 79.48 18.72 471.04 569.242000-01 - 65.46 29.54 539.61 634.602001-02 - 54.37 32.94 519.90 607.212002-03 - 44.36 28.54 521.99 594.892003-04 - 35.05 23.76 604.96 663.772004-05 - 54.95 12.66 623.43 691.042005-06 - 51.76 19.55 655.74 727.052006-07 - 37.22 15.44 605.43 658.092007-08 - 39.07 13.28 597.44 649.792008-09 - 37.06 17.07 623.47 677.612009-10 - 38.67 16.02 574.07 628.752010-11 - 27.65 13.01 547.22 587.882011-12 - 16.52 12.56 525.52 554.602012-13 - 12.54 11.78 491.21 515.532013-14 - 8.79 9.72 453.28 471.792014-15 - 4.53 10.98 433.93 449.442015-16 - 4.90 7.82 337.70 350.422016-17 - 4.90 6.16 303.54 314.602017-18 - 3.20 4.62 270.04 277.862018-19 - 2.43 3.35 259.66 265.44
Notes: These data should be read in conjunction with the explanatory notes.
NA = Not applicable
TOTAL RACING
Value ($)
BOOKMAKERS OFF COURSE
(NA)
BOOKMAKERS ON COURSE
ON-COURSE TOTALISATOR
TAB
Australian Gambling Statistics, 1993–94 to 2018–19, 36th edition
377

TABLE ACT 4AUSTRALIAN CAPITAL TERRITORY
REAL PER CAPITA RACING TURNOVER
1993-94 - 303.17 62.64 741.62 1,107.421994-95 - 275.46 47.37 677.51 1,000.351995-96 - 237.87 52.67 785.92 1,076.461996-97 - 167.59 39.98 842.60 1,050.171997-98 - 166.82 36.42 837.03 1,040.271998-99 - 152.81 52.46 833.80 1,039.081999-00 - 130.68 30.78 774.43 935.892000-01 - 101.48 45.79 836.53 983.812001-02 - 81.95 49.65 783.63 915.222002-03 - 64.89 41.76 763.57 870.222003-04 - 50.05 33.94 863.90 947.892004-05 - 76.65 17.66 869.60 963.912005-06 - 69.98 26.43 886.49 982.902006-07 - 48.87 20.27 794.93 864.072007-08 - 49.65 16.88 759.10 825.632008-09 - 45.67 21.04 768.23 834.942009-10 - 46.54 19.28 690.94 756.762010-11 - 32.29 15.20 639.08 686.562011-12 - 18.85 14.33 599.62 632.802012-13 - 13.98 13.14 547.87 575.002013-14 - 9.55 10.57 492.57 512.682014-15 - 4.84 11.73 463.59 480.162015-16 - 5.16 8.23 355.79 369.182016-17 - 5.08 6.38 314.28 325.742017-18 - 3.25 4.69 274.37 282.312018-19 - 2.43 3.35 259.66 265.44
Notes: These data should be read in conjunction with the explanatory notes.
NA = Not applicable
TOTAL RACING
Value ($)
BOOKMAKERS OFF COURSE
(NA)
BOOKMAKERS ON COURSE
ON-COURSE TOTALISATOR
TAB
Australian Gambling Statistics, 1993–94 to 2018–19, 36th edition
378

TABLE ACT 5AUSTRALIAN CAPITAL TERRITORY
TOTAL RACING EXPENDITURE
1993-94 - 1.960 1.143 13.538 16.6411994-95 - 1.866 0.875 12.520 15.2611995-96 - 1.708 1.031 15.394 18.1331996-97 - 1.235 0.803 16.932 18.9701997-98 - 1.239 1.469 16.223 18.9311998-99 - 1.161 1.169 18.575 20.9051999-00 - 1.130 0.694 17.480 19.3042000-01 - 0.780 1.103 21.253 23.1362001-02 - 0.728 (1) 1.023 20.080 21.8312002-03 - 0.553 0.945 20.456 21.9542003-04 - 0.481 0.267 23.794 24.5422004-05 - 0.764 0.176 24.307 25.2472005-06 - 0.730 0.276 26.000 27.0062006-07 - 0.535 0.222 26.835 27.5922007-08 - 0.574 0.568 26.330 27.4722008-09 - 0.565 0.541 26.858 27.9642009-10 - 0.592 0.245 26.432 27.2692010-11 - 0.433 0.203 24.654 25.2902011-12 - 0.264 0.201 24.345 24.8102012-13 - 0.204 0.192 23.740 24.1362013-14 - 0.145 0.161 22.668 22.9742014-15 - 0.076 0.185 22.089 22.3502015-16 - 0.083 0.451 19.244 19.7782016-17 - 0.085 0.350 17.230 17.6652017-18 - 0.057 0.269 15.731 16.0572018-19 - 0.044 0.202 16.654 16.900
Notes: These data should be read in conjunction with the explanatory notes.
(1) Bookmakers' on-course expenditure is calculated by applying an expenditure to turnover ratio of 5.5%, from this period on.
NA = Not applicable
TOTAL RACING
Value ($ million)
BOOKMAKERS OFF COURSE
(NA)
BOOKMAKERS ON COURSE
ON-COURSE TOTALISATOR
TAB
Australian Gambling Statistics, 1993–94 to 2018–19, 36th edition
379

TABLE ACT 6AUSTRALIAN CAPITAL TERRITORY
REAL RACING EXPENDITURE
1993-94 - 3.642 2.125 25.157 30.9241994-95 - 3.358 1.575 22.532 27.4651995-96 - 2.948 1.780 26.573 31.3011996-97 - 2.103 1.367 28.835 32.3061997-98 - 2.110 2.502 27.628 32.2391998-99 - 1.954 1.967 31.260 35.1811999-00 - 1.858 1.141 28.739 31.7382000-01 - 1.209 1.710 32.948 35.8672001-02 - 1.097 (1) 1.542 30.266 32.9052002-03 - 0.809 1.382 29.923 32.1152003-04 - 0.687 0.381 33.979 35.0472004-05 - 1.066 0.245 33.905 35.2162005-06 - 0.987 0.373 35.149 36.5092006-07 - 0.702 0.291 35.234 36.2282007-08 - 0.729 0.722 33.455 34.9062008-09 - 0.696 0.667 33.094 34.4572009-10 - 0.713 0.295 31.813 32.8212010-11 - 0.506 0.237 28.792 29.5352011-12 - 0.301 0.229 27.778 28.3082012-13 - 0.228 0.214 26.478 26.9202013-14 - 0.158 0.175 24.633 24.9652014-15 - 0.081 0.198 23.599 23.8782015-16 - 0.087 0.475 20.275 20.8372016-17 - 0.088 0.362 17.840 18.2902017-18 - 0.058 0.273 15.983 16.3142018-19 - 0.044 0.202 16.654 16.900
Notes: These data should be read in conjunction with the explanatory notes.
(1) Bookmakers' on-course expenditure is calculated by applying an expenditure to turnover ratio of 5.5%, from this period on.
NA = Not applicable
TOTAL RACING
Value ($ million)
BOOKMAKERS OFF COURSE
(NA)
BOOKMAKERS ON COURSE
ON-COURSE TOTALISATOR
TAB
Australian Gambling Statistics, 1993–94 to 2018–19, 36th edition
380

TABLE ACT 7AUSTRALIAN CAPITAL TERRITORY
PER CAPITA RACING EXPENDITURE
1993-94 - 8.97 5.23 61.96 76.161994-95 - 8.42 3.95 56.47 68.831995-96 - 7.58 4.57 68.29 80.441996-97 - 5.41 3.52 74.22 83.151997-98 - 5.39 6.39 70.55 82.321998-99 - 5.00 5.03 79.94 89.971999-00 - 4.80 2.95 74.23 81.982000-01 - 3.26 4.61 88.78 96.652001-02 - 2.99 (1) 4.20 82.50 89.702002-03 - 2.24 3.83 82.83 88.902003-04 - 1.92 1.07 95.19 98.192004-05 - 3.02 0.70 96.16 99.882005-06 - 2.85 1.08 101.40 105.332006-07 - 2.05 0.85 102.62 105.512007-08 - 2.15 2.13 98.54 102.822008-09 - 2.07 1.98 98.49 102.542009-10 - 2.12 0.88 94.83 97.832010-11 - 1.52 0.71 86.59 88.832011-12 - 0.91 0.69 83.73 85.332012-13 - 0.69 0.65 80.07 81.412013-14 - 0.48 0.53 75.32 76.342014-15 - 0.25 0.61 72.30 73.152015-16 - 0.27 1.45 61.89 63.612016-17 - 0.27 1.10 54.34 55.712017-18 - 0.18 0.83 48.58 49.582018-19 - 0.13 0.61 50.56 51.31
Notes: These data should be read in conjunction with the explanatory notes.
(1) Bookmakers' on-course expenditure is calculated by applying an expenditure to turnover ratio of 5.5%, from this period on.
NA = Not applicable
TOTAL RACING
Value ($)
BOOKMAKERS OFF COURSE
(NA)
BOOKMAKERS ON COURSE
ON-COURSE TOTALISATOR
TAB
Australian Gambling Statistics, 1993–94 to 2018–19, 36th edition
381

TABLE ACT 8AUSTRALIAN CAPITAL TERRITORY
REAL PER CAPITA RACING EXPENDITURE
1993-94 - 16.67 9.72 115.14 141.531994-95 - 15.15 7.10 101.63 123.881995-96 - 13.08 7.90 117.88 138.861996-97 - 9.22 5.99 126.39 141.601997-98 - 9.18 10.88 120.14 140.191998-99 - 8.41 8.47 134.53 151.401999-00 - 7.89 4.85 122.05 134.782000-01 - 5.05 7.14 137.64 149.832001-02 - 4.51 (1) 6.34 124.35 135.202002-03 - 3.28 5.60 121.17 130.052003-04 - 2.75 1.53 135.94 140.212004-05 - 4.22 0.97 134.14 139.322005-06 - 3.85 1.46 137.09 142.392006-07 - 2.69 1.11 134.74 138.542007-08 - 2.73 2.70 125.21 130.642008-09 - 2.55 2.44 121.36 126.352009-10 - 2.56 1.06 114.14 117.752010-11 - 1.78 0.83 101.13 103.742011-12 - 1.04 0.79 95.53 97.362012-13 - 0.77 0.72 89.31 90.802013-14 - 0.52 0.58 81.85 82.952014-15 - 0.27 0.65 77.24 78.152015-16 - 0.28 1.53 65.20 67.012016-17 - 0.28 1.14 56.26 57.682017-18 - 0.18 0.84 49.36 50.382018-19 - 0.13 0.61 50.56 51.31
Notes: These data should be read in conjunction with the explanatory notes.
(1) Bookmakers' on-course expenditure is calculated by applying an expenditure to turnover ratio of 5.5%, from this period on.
NA = Not applicable
TOTAL RACING
Value ($)
BOOKMAKERS OFF COURSE
(NA)
BOOKMAKERS ON COURSE
ON-COURSE TOTALISATOR
TAB
Australian Gambling Statistics, 1993–94 to 2018–19, 36th edition
382

TABLE ACT 9AUSTRALIAN CAPITAL TERRITORY
RACING EXPENDITUREAS A % OF HDI
1993-94 - 0.026 0.015 0.181 0.2231994-95 - 0.024 0.011 0.160 0.1951995-96 - 0.021 0.013 0.189 0.2231996-97 - 0.014 0.009 0.199 0.2231997-98 - 0.014 0.017 0.188 0.2191998-99 - 0.013 0.013 0.204 0.2291999-00 - 0.011 0.007 0.173 0.1912000-01 - 0.007 0.009 0.181 0.1972001-02 - 0.006 (1) 0.009 0.167 0.1822002-03 - 0.004 0.007 0.151 0.1622003-04 - 0.003 0.002 0.165 0.1702004-05 - 0.005 0.001 0.158 0.1642005-06 - 0.004 0.002 0.159 0.1652006-07 - 0.003 0.001 0.148 0.1532007-08 - 0.003 0.003 0.130 0.1352008-09 - 0.003 0.002 0.120 0.1252009-10 - 0.002 0.001 0.109 0.1132010-11 - 0.002 0.001 0.091 0.0932011-12 - 0.001 0.001 0.082 0.0842012-13 - 0.001 0.001 0.074 0.0752013-14 - 0.000 0.000 0.069 0.0702014-15 - 0.000 0.001 0.066 0.0672015-16 - 0.000 0.001 0.056 0.0582016-17 - 0.000 0.001 0.048 0.0492017-18 - 0.000 0.001 0.043 0.0442018-19 - 0.000 0.001 0.044 0.045
Notes: These data should be read in conjunction with the explanatory notes.
(1) Bookmakers' on-course expenditure is calculated by applying an expenditure to turnover ratio of 5.5%, from this period on.
NA = Not applicable
Percentage (%)
BOOKMAKERS OFF COURSE
(NA)
BOOKMAKERS ON COURSE
ON-COURSE TOTALISATOR
TAB TOTAL RACING
Australian Gambling Statistics, 1993–94 to 2018–19, 36th edition
383

TABLE ACT 10AUSTRALIAN CAPITAL TERRITORY
RACING EXPENDITURESHARE OF MARKET
1993-94 - 11.78 6.87 81.351994-95 - 12.23 5.73 82.041995-96 - 9.42 5.69 84.891996-97 - 6.51 4.23 89.261997-98 - 6.54 7.76 85.701998-99 - 5.55 5.59 88.851999-00 - 5.85 3.60 90.552000-01 - 3.37 4.77 91.862001-02 - 3.33 (1) 4.69 91.982002-03 - 2.52 4.30 93.182003-04 - 1.96 1.09 96.952004-05 - 3.03 0.70 96.282005-06 - 2.70 1.02 96.272006-07 - 1.94 0.80 97.262007-08 - 2.09 2.07 95.842008-09 - 2.02 1.93 96.042009-10 - 2.17 0.90 96.932010-11 - 1.71 0.80 97.492011-12 - 1.06 0.81 98.132012-13 - 0.85 0.80 98.362013-14 - 0.63 0.70 98.672014-15 - 0.34 0.83 98.832015-16 - 0.42 2.28 97.302016-17 - 0.48 1.98 97.542017-18 - 0.35 1.68 97.972018-19 - 0.26 1.20 98.54
Notes: These data should be read in conjunction with the explanatory notes.
(1) Bookmakers' on-course expenditure is calculated by applying an expenditure to turnover ratio of 5.5%, from this period on.
NA = Not applicable
ON-COURSE TOTALISATOR
TAB
Percentage (%)
BOOKMAKERS OFF COURSE
(NA)
BOOKMAKERS ON COURSE
Australian Gambling Statistics, 1993–94 to 2018–19, 36th edition
384

TABLE ACT 11AUSTRALIAN CAPITAL TERRITORY
GOVERNMENT REVENUE FROM RACING
1993-94 0.399 0.425 5.032 5.8561994-95 0.373 0.360 4.785 5.5181995-96 0.413 0.395 5.901 6.7091996-97 0.243 - (1) 3.624 3.8671997-98 0.203 - 5.580 5.7831998-99 0.167 - 4.380 4.5471999-00 0.187 - 4.182 4.3692000-01 0.156 - 1.718 1.8742001-02 0.092 - 1.405 1.4972002-03 0.073 - 1.553 (2) 1.6262003-04 - (3) - 5.351 5.3512004-05 - - 7.159 7.1592005-06 - - 6.000 6.0002006-07 - - 6.800 6.8002007-08 - - 8.551 8.5512008-09 - - 5.689 5.6892009-10 - - 8.555 8.5552010-11 - - 1.217 1.2172011-12 - - 1.349 1.3492012-13 - - 3.979 3.9792013-14 - - 4.161 4.1612014-15 - - - U - (4)
2015-16 - - - U -2016-17 - - - U -2017-18 - - - U -2018-19 - - - U -
Notes: These data should be read in conjunction with the explanatory notes.
Data for the gambling revenue received by states and territories from 1 July 2000 onwards are not comparable
with that of preceding years because of the impact of changes brought about by the introduction of the GST.
(1) On-course totalisator revenue included in TAB revenue, from this period on.
(2) Government revenue from TAB is in the form of an annual licence fee.
(3) Bookmakers' tax abolished in September 2003.
(4) Total racing figure incomplete from this period on, due to data for one or more components being unavailable.
U = Unavailable data
Value ($ million)
BOOKMAKERSON-COURSE
TOTALISATORTAB TOTAL RACING
Australian Gambling Statistics, 1993–94 to 2018–19, 36th edition
385

TABLE ACT 12AUSTRALIAN CAPITAL TERRITORY
REAL GOVERNMENT REVENUE FROM RACING
1993-94 0.741 0.790 9.351 10.8821994-95 0.671 0.648 8.611 9.9311995-96 0.713 0.682 10.186 11.5811996-97 0.414 - (1) 6.172 6.5851997-98 0.346 - 9.503 9.8481998-99 0.281 - 7.371 7.6521999-00 0.307 - 6.876 7.1832000-01 0.242 - 2.663 2.9052001-02 0.139 - 2.118 2.2562002-03 0.107 - 2.272 (2) 2.3792003-04 - (3) - 7.641 7.6412004-05 - - 9.986 9.9862005-06 - - 8.111 8.1112006-07 - - 8.928 8.9282007-08 - - 10.865 10.8652008-09 - - 7.010 7.0102009-10 - - 10.297 10.2972010-11 - - 1.421 1.4212011-12 - - 1.539 1.5392012-13 - - 4.438 4.4382013-14 - - 4.522 4.5222014-15 - - - U - (4)
2015-16 - - - U -2016-17 - - - U -2017-18 - - - U -2018-19 - - - U -
Notes: These data should be read in conjunction with the explanatory notes.
Data for the gambling revenue received by states and territories from 1 July 2000 onwards are not comparable
with that of preceding years because of the impact of changes brought about by the introduction of the GST.
(1) On-course totalisator revenue included in TAB revenue, from this period on.
(2) Government revenue from TAB is in the form of an annual licence fee.
(3) Bookmakers' tax abolished in September 2003.
(4) Total racing figure incomplete from this period on, due to data for one or more components being unavailable.
U = Unavailable data
Value ($ million)
BOOKMAKERSON-COURSE
TOTALISATORTAB TOTAL RACING
Australian Gambling Statistics, 1993–94 to 2018–19, 36th edition
386

TABLE ACT 13AUSTRALIAN CAPITAL TERRITORY
PER CAPITA REVENUE FROM RACING
1993-94 1.83 1.95 23.03 26.801994-95 1.68 1.62 21.58 24.891995-96 1.83 1.75 26.18 29.761996-97 1.07 - (1) 15.88 16.951997-98 0.88 - 24.26 25.151998-99 0.72 - 18.85 19.571999-00 0.79 - 17.76 18.552000-01 0.65 - 7.18 7.832001-02 0.38 - 5.77 6.152002-03 0.30 - 6.29 (2) 6.582003-04 - (3) - 21.41 21.412004-05 - - 28.32 28.322005-06 - - 23.40 23.402006-07 - - 26.00 26.002007-08 - - 32.00 32.002008-09 - - 20.86 20.862009-10 - - 30.69 30.692010-11 - - 4.27 4.272011-12 - - 4.64 4.642012-13 - - 13.42 13.422013-14 - - 13.83 13.832014-15 - - - U - (4)
2015-16 - - - U -2016-17 - - - U -2017-18 - - - U -2018-19 - - - U -
Notes: These data should be read in conjunction with the explanatory notes.
Data for the gambling revenue received by states and territories from 1 July 2000 onwards are not comparable
with that of preceding years because of the impact of changes brought about by the introduction of the GST.
(1) On-course totalisator revenue included in TAB revenue, from this period on.
(2) Government revenue from TAB is in the form of an annual licence fee.
(3) Bookmakers' tax abolished in September 2003.
(4) Total racing figure incomplete from this period on, due to data for one or more components being unavailable.
U = Unavailable data
Value ($)
BOOKMAKERSON-COURSE
TOTALISATORTAB TOTAL RACING
Australian Gambling Statistics, 1993–94 to 2018–19, 36th edition
387

TABLE ACT 14AUSTRALIAN CAPITAL TERRITORY
REAL PER CAPITA REVENUE FROM RACING
1993-94 3.39 3.61 42.80 49.801994-95 3.03 2.92 38.84 44.791995-96 3.16 3.02 45.19 51.381996-97 1.81 - (1) 27.05 28.871997-98 1.50 - 41.32 42.831998-99 1.21 - 31.72 32.931999-00 1.31 - 29.20 30.512000-01 1.01 - 11.13 12.142001-02 0.57 - 8.70 9.272002-03 0.43 - 9.20 (2) 9.632003-04 - (3) - 30.57 30.572004-05 - - 39.51 39.512005-06 - - 31.64 31.642006-07 - - 34.14 34.142007-08 - - 40.66 40.662008-09 - - 25.71 25.712009-10 - - 36.94 36.942010-11 - - 4.99 4.992011-12 - - 5.29 5.292012-13 - - 14.97 14.972013-14 - - 15.02 15.022014-15 - - - U - (4)
2015-16 - - - U -2016-17 - - - U -2017-18 - - - U -2018-19 - - - U -
Notes: These data should be read in conjunction with the explanatory notes.
Data for the gambling revenue received by states and territories from 1 July 2000 onwards are not comparable
with that of preceding years because of the impact of changes brought about by the introduction of the GST.
(1) On-course totalisator revenue included in TAB revenue, from this period on.
(2) Government revenue from TAB is in the form of an annual licence fee.
(3) Bookmakers' tax abolished in September 2003.
(4) Total racing figure incomplete from this period on, due to data for one or more components being unavailable.
U = Unavailable data
Value ($)
BOOKMAKERSON-COURSE
TOTALISATORTAB TOTAL RACING
Australian Gambling Statistics, 1993–94 to 2018–19, 36th edition
388

TABLE ACT 15AUSTRALIAN CAPITAL TERRITORY
GOVERNMENT REVENUE FROM RACINGAS A % OF TOTAL GAMBLING REVENUE
1993-94 0.84 0.90 10.61 12.351994-95 0.72 0.70 9.25 10.671995-96 0.78 0.75 11.13 12.661996-97 0.52 - (1) 7.82 8.341997-98 0.40 - 11.09 11.491998-99 0.31 - 8.04 8.351999-00 0.30 - 6.74 7.042000-01 0.33 - 3.60 3.932001-02 0.20 - 3.12 3.322002-03 0.15 - 3.24 (2) 3.392003-04 - (3) - 9.53 9.532004-05 - - 12.80 12.802005-06 - - 11.29 11.292006-07 - - 12.56 12.562007-08 - - 14.30 14.302008-09 - - 10.04 10.042009-10 - - 14.27 14.272010-11 - - 2.31 2.312011-12 - - 2.53 2.532012-13 - - 7.00 7.002013-14 - - 7.58 7.582014-15 - - - U - (4)
2015-16 - - - U -2016-17 - - - U -2017-18 - - - U -2018-19 - - - U -
Notes: These data should be read in conjunction with the explanatory notes.
Data for the gambling revenue received by states and territories from 1 July 2000 onwards are not comparable
with that of preceding years because of the impact of changes brought about by the introduction of the GST.
(1) On-course totalisator revenue included in TAB revenue, from this period on.
(2) Government revenue from TAB is in the form of an annual licence fee.
(3) Bookmakers' tax abolished in September 2003.
(4) Total racing figure incomplete from this period on, due to data for one or more components being unavailable.
U = Unavailable data
ON-COURSE TOTALISATOR
TAB TOTAL RACING
Percentage (%)
BOOKMAKERS
Australian Gambling Statistics, 1993–94 to 2018–19, 36th edition
389

TABLE ACT 16AUSTRALIAN CAPITAL TERRITORY
TOTAL GAMING TURNOVER
1993-94 178.400 767.000 6.975 - - 2.961 27.059 - 0.215 982.6101994-95 191.208 1,035.501 6.380 - - 2.649 28.751 - 0.122 1,264.6111995-96 141.454 1,163.641 5.714 - - 3.005 30.810 - 0.208 1,344.8321996-97 85.990 1,159.641 5.177 - - 2.873 29.317 - 0.144 1,283.1421997-98 83.478 1,249.467 5.465 - - 2.937 30.099 - 0.181 1,371.6271998-99 99.387 1,419.859 5.585 - - 3.282 30.338 - 0.192 1,558.6431999-00 89.900 1,584.076 6.452 - - 2.643 31.258 - 0.216 1,714.5452000-01 92.992 1,692.527 6.105 - - 2.625 35.362 - 0.242 1,829.8532001-02 90.231 1,855.229 6.085 - 2.206 2.438 34.228 - 0.195 1,990.6122002-03 91.353 1,980.130 6.049 - 2.307 2.838 37.688 - 0.213 2,120.5782003-04 90.127 2,077.192 5.982 - 2.124 2.989 36.704 - 0.207 2,215.3252004-05 86.066 2,040.464 5.957 - 2.637 2.541 36.481 - 0.232 2,174.3782005-06 88.753 2,164.144 5.575 - 2.594 3.062 37.343 - 0.165 2,301.6362006-07 82.549 2,151.862 5.402 - 3.497 2.431 39.196 - 0.221 2,285.1582007-08 85.307 2,111.078 6.534 - 3.348 2.623 40.741 - 0.301 2,249.9322008-09 98.059 2,085.222 5.145 - 3.465 2.642 44.350 - 0.212 2,239.0952009-10 100.262 2,078.209 5.781 - 3.300 2.633 46.146 - 0.192 2,236.5232010-11 94.525 2,191.852 4.540 - 3.700 2.435 42.033 - 0.160 2,339.2452011-12 92.306 2,214.846 5.907 - 3.800 4.419 43.539 - 0.163 2,364.9802012-13 84.970 2,225.433 5.603 - 4.050 2.270 52.904 - 0.164 2,375.3942013-14 86.020 2,176.372 5.323 - 4.158 3.100 48.486 - 0.149 2,323.6082014-15 88.333 2,016.448 5.380 - 3.953 1.690 49.259 - 0.125 2,165.1882015-16 113.554 2,047.705 5.491 - 5.219 1.425 46.972 - 0.079 2,220.4452016-17 155.075 2,064.675 4.622 - 13.343 1.186 40.565 - 0.096 2,279.5622017-18 142.007 2,003.683 4.970 - 49.578 1.466 45.192 - 0.112 2,247.0082018-19 125.355 1,981.380 4.702 - 71.127 4.725 52.860 - - (1) 2,240.149
Notes: These data should be read in conjunction with the explanatory notes.
(1) Pools was withdrawn from the Australian Lottery Market on 23 June 2018.
NA = Not applicable
KENO
Value ($ million)
CASINOGAMING
MACHINESINSTANT LOTTERY
INTERACTIVE GAMING (NA)
LOTTERIES LOTTOMINOR GAMING
(NA)POOLS TOTAL GAMING
Australian Gambling Statistics, 1993–94 to 2018–19, 36th edition
390

TABLE ACT 17AUSTRALIAN CAPITAL TERRITORY
REAL GAMING TURNOVER
1993-94 331.522 1,425.321 12.962 - - 5.502 50.284 - 0.400 1,825.9901994-95 344.114 1,863.575 11.482 - - 4.767 51.743 - 0.220 2,275.9001995-96 244.174 2,008.645 9.863 - - 5.187 53.183 - 0.359 2,321.4121996-97 146.440 1,974.851 8.816 - - 4.893 49.926 - 0.245 2,185.1721997-98 142.162 2,127.824 9.307 - - 5.002 51.258 - 0.308 2,335.8601998-99 167.257 2,389.468 9.399 - - 5.523 51.056 - 0.323 2,623.0261999-00 147.804 2,604.367 10.608 - - 4.345 51.391 - 0.355 2,818.8702000-01 144.163 2,623.877 9.464 - - 4.069 54.821 - 0.375 2,836.7692001-02 136.002 2,796.323 9.172 - 3.325 3.675 51.591 - 0.294 3,000.3812002-03 133.633 2,896.575 8.849 - 3.375 4.151 55.131 - 0.312 3,102.0252003-04 128.705 2,966.303 8.543 - 3.033 4.268 52.415 - 0.296 3,163.5622004-05 120.050 2,846.173 8.309 - 3.678 3.544 50.886 - 0.324 3,032.9652005-06 119.985 2,925.697 7.537 - 3.507 4.140 50.484 - 0.223 3,111.5722006-07 108.387 2,825.402 7.093 - 4.592 3.192 51.464 - 0.290 3,000.4202007-08 108.391 2,682.339 8.302 - 4.254 3.333 51.766 - 0.382 2,858.7672008-09 120.826 2,569.372 6.340 - 4.270 3.255 54.647 - 0.261 2,758.9712009-10 120.674 2,501.304 6.958 - 3.972 3.169 55.541 - 0.231 2,691.8492010-11 110.392 2,559.778 5.302 - 4.321 2.844 49.089 - 0.187 2,731.9132011-12 105.321 2,527.139 6.740 - 4.336 5.042 49.678 - 0.186 2,698.4422012-13 94.771 2,482.130 6.249 - 4.517 2.532 59.006 - 0.183 2,649.3892013-14 93.475 2,364.991 5.784 - 4.518 3.369 52.688 - 0.162 2,524.9872014-15 94.371 2,154.276 5.748 - 4.223 1.806 52.626 - 0.134 2,313.1832015-16 119.635 2,157.370 5.785 - 5.499 1.501 49.488 - 0.083 2,339.3612016-17 160.563 2,137.744 4.786 - 13.815 1.228 42.001 - 0.099 2,360.2362017-18 144.283 2,035.799 5.050 - 50.373 1.489 45.916 - 0.114 2,283.0242018-19 125.355 1,981.380 4.702 - 71.127 4.725 52.860 - - (1) 2,240.149
Notes: These data should be read in conjunction with the explanatory notes.
(1) Pools was withdrawn from the Australian Lottery Market on 23 June 2018.
NA = Not applicable
KENO
Value ($ million)
CASINOGAMING
MACHINESINSTANT LOTTERY
INTERACTIVE GAMING (NA)
LOTTERIES LOTTOMINOR GAMING
(NA)POOLS TOTAL GAMING
Australian Gambling Statistics, 1993–94 to 2018–19, 36th edition
391

TABLE ACT 18AUSTRALIAN CAPITAL TERRITORYPER CAPITA GAMING TURNOVER
1993-94 816.48 3,510.32 31.92 - - 13.55 123.84 - 0.98 4,497.101994-95 862.43 4,670.54 28.78 - - 11.95 129.68 - 0.55 5,703.921995-96 627.53 5,162.22 25.35 - - 13.33 136.68 - 0.92 5,966.031996-97 376.91 5,082.96 22.69 - - 12.59 128.50 - 0.63 5,624.291997-98 363.01 5,433.39 23.76 - - 12.77 130.89 - 0.79 5,964.611998-99 427.72 6,110.43 24.04 - - 14.12 130.56 - 0.83 6,707.691999-00 381.79 6,727.28 27.40 - - 11.22 132.75 - 0.92 7,281.362000-01 388.47 7,070.45 25.50 - - 10.97 147.72 - 1.01 7,644.122001-02 370.73 7,622.47 25.00 - 9.06 10.02 140.63 - 0.80 8,178.712002-03 369.92 8,018.33 24.49 - 9.34 11.49 152.61 - 0.86 8,587.062003-04 360.58 8,310.38 23.93 - 8.50 11.96 146.84 - 0.83 8,863.022004-05 340.50 8,072.51 23.57 - 10.43 10.05 144.33 - 0.92 8,602.302005-06 346.15 8,440.40 21.74 - 10.12 11.94 145.64 - 0.64 8,976.632006-07 315.66 8,228.65 20.66 - 13.37 9.30 149.88 - 0.85 8,738.372007-08 319.27 7,900.84 24.45 - 12.53 9.82 152.48 - 1.13 8,420.512008-09 359.58 7,646.55 18.87 - 12.71 9.69 162.63 - 0.78 8,210.812009-10 359.72 7,456.14 20.74 - 11.84 9.45 165.56 - 0.69 8,024.132010-11 332.00 7,698.47 15.95 - 13.00 8.55 147.63 - 0.56 8,216.172011-12 317.46 7,617.42 20.32 - 13.07 15.20 149.74 - 0.56 8,133.772012-13 286.59 7,506.01 18.90 - 13.66 7.66 178.44 - 0.55 8,011.802013-14 285.83 7,231.72 17.69 - 13.82 10.30 161.11 - 0.50 7,720.962014-15 289.12 6,599.92 17.61 - 12.94 5.53 161.23 - 0.41 7,086.762015-16 365.20 6,585.56 17.66 - 16.78 4.58 151.07 - 0.25 7,141.112016-17 489.06 6,511.42 14.58 - 42.08 3.74 127.93 - 0.30 7,189.122017-18 438.51 6,187.29 15.35 - 153.09 4.53 139.55 - 0.35 6,938.672018-19 380.55 6,015.09 14.27 - 215.93 14.34 160.47 - - (1) 6,800.66
Notes: These data should be read in conjunction with the explanatory notes.
(1) Pools was withdrawn from the Australian Lottery Market on 23 June 2018.
NA = Not applicable
KENO
Value ($)
CASINOGAMING
MACHINESINSTANT LOTTERY
INTERACTIVE GAMING (NA)
LOTTERIES LOTTOMINOR GAMING
(NA)POOLS TOTAL GAMING
Australian Gambling Statistics, 1993–94 to 2018–19, 36th edition
392

TABLE ACT 19AUSTRALIAN CAPITAL TERRITORY
REAL PER CAPITA GAMING TURNOVER
1993-94 1,517.27 6,523.25 59.32 - - 25.18 230.13 - 1.83 8,356.991994-95 1,552.10 8,405.50 51.79 - - 21.50 233.38 - 0.99 10,265.261995-96 1,083.22 8,910.88 43.76 - - 23.01 235.94 - 1.59 10,298.391996-97 641.88 8,656.20 38.64 - - 21.45 218.84 - 1.07 9,578.081997-98 618.20 9,252.98 40.47 - - 21.75 222.90 - 1.34 10,157.641998-99 719.80 10,283.19 40.45 - - 23.77 219.72 - 1.39 11,288.311999-00 627.70 11,060.27 45.05 - - 18.45 218.25 - 1.51 11,971.222000-01 602.23 10,961.11 39.54 - - 17.00 229.01 - 1.57 11,850.462001-02 558.78 11,489.09 37.68 - 13.66 15.10 211.97 - 1.21 12,327.492002-03 541.13 11,729.37 35.83 - 13.67 16.81 223.25 - 1.26 12,561.322003-04 514.92 11,867.51 34.18 - 12.13 17.08 209.70 - 1.18 12,656.702004-05 474.95 11,260.07 32.87 - 14.55 14.02 201.32 - 1.28 11,999.052005-06 467.95 11,410.54 29.39 - 13.68 16.14 196.89 - 0.87 12,135.472006-07 414.47 10,804.25 27.12 - 17.56 12.21 196.80 - 1.11 11,473.512007-08 405.66 10,038.82 31.07 - 15.92 12.47 193.74 - 1.43 10,699.122008-09 443.07 9,421.94 23.25 - 15.66 11.94 200.39 - 0.96 10,117.202009-10 432.95 8,974.11 24.96 - 14.25 11.37 199.27 - 0.83 9,657.742010-11 387.73 8,990.75 18.62 - 15.18 9.99 172.41 - 0.66 9,595.342011-12 362.23 8,691.48 23.18 - 14.91 17.34 170.86 - 0.64 9,280.642012-13 319.65 8,371.80 21.08 - 15.24 8.54 199.02 - 0.62 8,935.942013-14 310.60 7,858.47 19.22 - 15.01 11.19 175.07 - 0.54 8,390.112014-15 308.88 7,051.04 18.81 - 13.82 5.91 172.25 - 0.44 7,571.152015-16 384.76 6,938.25 18.61 - 17.68 4.83 159.16 - 0.27 7,523.552016-17 506.37 6,741.86 15.09 - 43.57 3.87 132.46 - 0.31 7,443.542017-18 445.54 6,286.46 15.59 - 155.55 4.60 141.79 - 0.35 7,049.882018-19 380.55 6,015.09 14.27 - 215.93 14.34 160.47 - - (1) 6,800.66
Notes: These data should be read in conjunction with the explanatory notes.
(1) Pools was withdrawn from the Australian Lottery Market on 23 June 2018.
NA = Not applicable
KENO
Value ($)
CASINOGAMING
MACHINESINSTANT LOTTERY
INTERACTIVE GAMING (NA)
LOTTERIES LOTTOMINOR GAMING
(NA)POOLS TOTAL GAMING
Australian Gambling Statistics, 1993–94 to 2018–19, 36th edition
393

TABLE ACT 20AUSTRALIAN CAPITAL TERRITORY
TOTAL GAMING EXPENDITURE
1993-94 34.629 99.710 2.790 - - 1.066 10.824 - 0.108 149.1261994-95 39.580 108.563 2.552 - - 0.954 11.500 - 0.061 163.2101995-96 29.281 117.518 2.286 - - 1.082 12.244 - 0.104 162.5151996-97 17.800 118.913 2.071 - - 1.005 11.668 - 0.064 151.5211997-98 17.280 127.163 2.186 - - 1.028 12.063 - 0.179 159.8991998-99 16.285 147.193 2.142 - - 1.148 12.386 - 0.085 179.2391999-00 17.700 156.835 2.469 - - 0.925 12.492 - 0.096 190.5172000-01 18.394 167.610 2.334 - - 0.919 14.139 - 0.106 203.5022001-02 16.221 174.402 2.324 - 0.713 0.853 13.688 - 0.874 209.0752002-03 18.411 182.553 2.310 - 0.628 0.993 15.070 - 0.095 220.0602003-04 19.146 191.712 2.286 - 0.578 1.046 14.678 - 0.092 229.5382004-05 19.058 185.182 2.270 - 0.717 0.890 14.588 - 0.102 222.8072005-06 18.913 191.963 2.120 - 0.706 1.072 14.934 - 0.067 229.7752006-07 18.171 184.719 2.053 - 0.951 0.851 15.675 - 0.092 222.5122007-08 17.703 177.932 2.499 - 0.911 0.918 16.294 - 0.132 216.3892008-09 18.836 175.114 1.904 - 0.943 0.925 17.737 - 0.098 215.5572009-10 19.785 173.433 2.139 - 0.909 0.922 18.455 - 0.090 215.7332010-11 19.140 180.313 1.680 - 1.016 0.852 16.809 - 0.075 219.8852011-12 18.449 181.592 2.186 - 1.048 1.547 17.411 - 0.080 222.3132012-13 17.086 177.155 2.073 - 1.102 0.795 21.157 - 0.080 219.4482013-14 17.378 170.618 1.969 - 0.650 1.085 19.390 - 0.073 211.1632014-15 16.840 167.454 1.991 - 1.182 0.592 19.700 - 0.061 207.8202015-16 21.360 168.493 2.032 - 1.461 0.479 18.785 - 0.040 212.6502016-17 34.480 168.754 1.896 - 2.705 0.473 17.678 - 0.053 226.0392017-18 24.777 168.090 1.839 - 13.263 0.513 18.073 - 0.056 226.6112018-19 25.676 166.974 1.740 - 11.267 1.654 21.140 - - (1) 228.451
Notes: These data should be read in conjunction with the explanatory notes.
(1) Pools was withdrawn from the Australian Lottery Market on 23 June 2018.
NA = Not applicable
KENO
Value ($ million)
CASINOGAMING
MACHINESINSTANT LOTTERY
INTERACTIVE GAMING (NA)
LOTTERIES LOTTOMINOR GAMING
(NA)POOLS TOTAL GAMING
Australian Gambling Statistics, 1993–94 to 2018–19, 36th edition
394
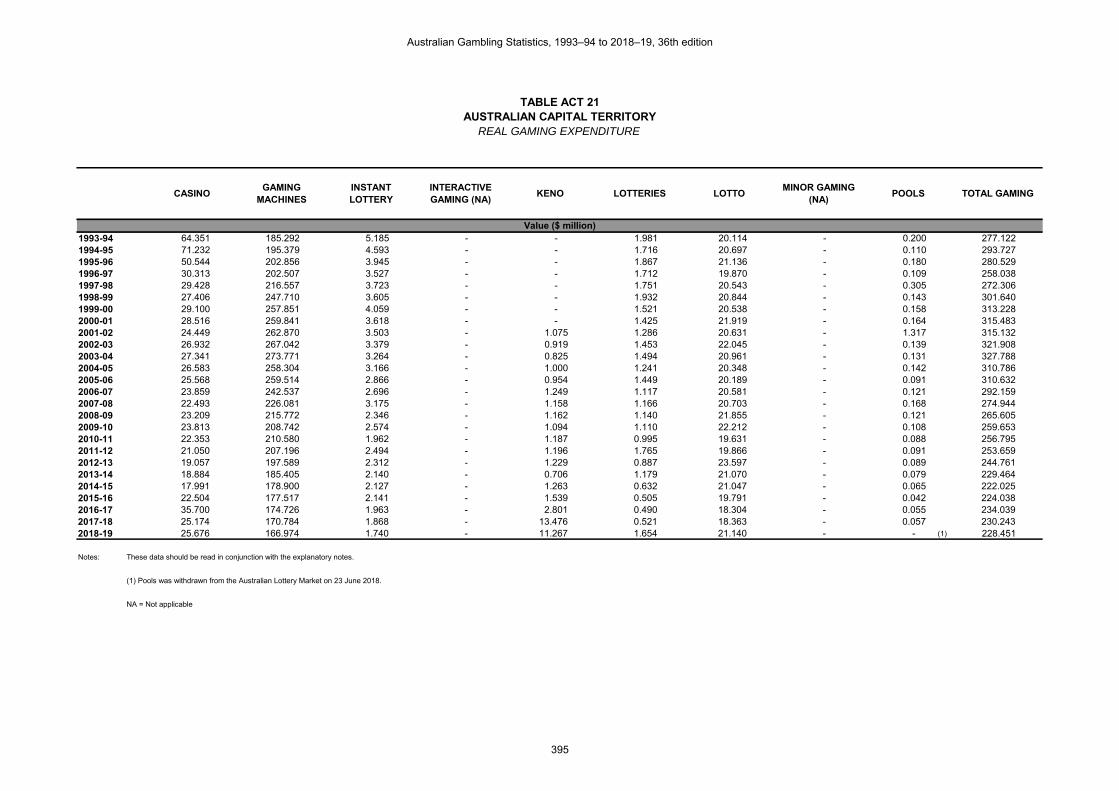
TABLE ACT 21AUSTRALIAN CAPITAL TERRITORY
REAL GAMING EXPENDITURE
1993-94 64.351 185.292 5.185 - - 1.981 20.114 - 0.200 277.1221994-95 71.232 195.379 4.593 - - 1.716 20.697 - 0.110 293.7271995-96 50.544 202.856 3.945 - - 1.867 21.136 - 0.180 280.5291996-97 30.313 202.507 3.527 - - 1.712 19.870 - 0.109 258.0381997-98 29.428 216.557 3.723 - - 1.751 20.543 - 0.305 272.3061998-99 27.406 247.710 3.605 - - 1.932 20.844 - 0.143 301.6401999-00 29.100 257.851 4.059 - - 1.521 20.538 - 0.158 313.2282000-01 28.516 259.841 3.618 - - 1.425 21.919 - 0.164 315.4832001-02 24.449 262.870 3.503 - 1.075 1.286 20.631 - 1.317 315.1322002-03 26.932 267.042 3.379 - 0.919 1.453 22.045 - 0.139 321.9082003-04 27.341 273.771 3.264 - 0.825 1.494 20.961 - 0.131 327.7882004-05 26.583 258.304 3.166 - 1.000 1.241 20.348 - 0.142 310.7862005-06 25.568 259.514 2.866 - 0.954 1.449 20.189 - 0.091 310.6322006-07 23.859 242.537 2.696 - 1.249 1.117 20.581 - 0.121 292.1592007-08 22.493 226.081 3.175 - 1.158 1.166 20.703 - 0.168 274.9442008-09 23.209 215.772 2.346 - 1.162 1.140 21.855 - 0.121 265.6052009-10 23.813 208.742 2.574 - 1.094 1.110 22.212 - 0.108 259.6532010-11 22.353 210.580 1.962 - 1.187 0.995 19.631 - 0.088 256.7952011-12 21.050 207.196 2.494 - 1.196 1.765 19.866 - 0.091 253.6592012-13 19.057 197.589 2.312 - 1.229 0.887 23.597 - 0.089 244.7612013-14 18.884 185.405 2.140 - 0.706 1.179 21.070 - 0.079 229.4642014-15 17.991 178.900 2.127 - 1.263 0.632 21.047 - 0.065 222.0252015-16 22.504 177.517 2.141 - 1.539 0.505 19.791 - 0.042 224.0382016-17 35.700 174.726 1.963 - 2.801 0.490 18.304 - 0.055 234.0392017-18 25.174 170.784 1.868 - 13.476 0.521 18.363 - 0.057 230.2432018-19 25.676 166.974 1.740 - 11.267 1.654 21.140 - - (1) 228.451
Notes: These data should be read in conjunction with the explanatory notes.
(1) Pools was withdrawn from the Australian Lottery Market on 23 June 2018.
NA = Not applicable
KENO
Value ($ million)
CASINOGAMING
MACHINESINSTANT LOTTERY
INTERACTIVE GAMING (NA)
LOTTERIES LOTTOMINOR GAMING
(NA)POOLS TOTAL GAMING
Australian Gambling Statistics, 1993–94 to 2018–19, 36th edition
395

TABLE ACT 22AUSTRALIAN CAPITAL TERRITORY
PER CAPITA GAMING EXPENDITURE
1993-94 158.49 456.34 12.77 - - 4.88 49.54 - 0.49 682.501994-95 178.52 489.66 11.51 - - 4.30 51.87 - 0.28 736.151995-96 129.90 521.34 10.14 - - 4.80 54.32 - 0.46 720.961996-97 78.02 521.22 9.08 - - 4.41 51.14 - 0.28 664.151997-98 75.14 552.98 9.51 - - 4.47 52.46 - 0.78 695.331998-99 70.08 633.45 9.22 - - 4.94 53.30 - 0.37 771.361999-00 75.17 666.05 10.49 - - 3.93 53.05 - 0.41 809.092000-01 76.84 700.18 9.75 - - 3.84 59.06 - 0.44 850.122001-02 66.65 716.56 9.55 - 2.93 3.50 56.24 - 3.59 859.012002-03 74.55 739.23 9.35 - 2.54 4.02 61.02 - 0.38 891.112003-04 76.60 767.00 9.15 - 2.31 4.18 58.72 - 0.37 918.332004-05 75.40 732.62 8.98 - 2.84 3.52 57.71 - 0.40 881.472005-06 73.76 748.68 8.27 - 2.75 4.18 58.24 - 0.26 896.152006-07 69.49 706.36 7.85 - 3.64 3.25 59.94 - 0.35 850.882007-08 66.25 665.92 9.35 - 3.41 3.44 60.98 - 0.49 809.852008-09 69.07 642.15 6.98 - 3.46 3.39 65.04 - 0.36 790.452009-10 70.98 622.24 7.67 - 3.26 3.31 66.21 - 0.32 774.002010-11 67.23 633.32 5.90 - 3.57 2.99 59.04 - 0.26 772.312011-12 63.45 624.54 7.52 - 3.60 5.32 59.88 - 0.28 764.592012-13 57.63 597.51 6.99 - 3.72 2.68 71.36 - 0.27 740.162013-14 57.74 566.94 6.54 - 2.16 3.61 64.43 - 0.24 701.662014-15 55.12 548.08 6.52 - 3.87 1.94 64.48 - 0.20 680.202015-16 68.70 541.89 6.54 - 4.70 1.54 60.41 - 0.13 683.902016-17 108.74 532.20 5.98 - 8.53 1.49 55.75 - 0.17 712.872017-18 76.51 519.06 5.68 - 40.96 1.58 55.81 - 0.17 699.772018-19 77.95 506.90 5.28 - 34.20 5.02 64.18 - - (1) 693.53
Notes: These data should be read in conjunction with the explanatory notes.
(1) Pools was withdrawn from the Australian Lottery Market on 23 June 2018.
NA = Not applicable
KENO
Value ($)
CASINOGAMING
MACHINESINSTANT LOTTERY
INTERACTIVE GAMING (NA)
LOTTERIES LOTTOMINOR GAMING
(NA)POOLS TOTAL GAMING
Australian Gambling Statistics, 1993–94 to 2018–19, 36th edition
396
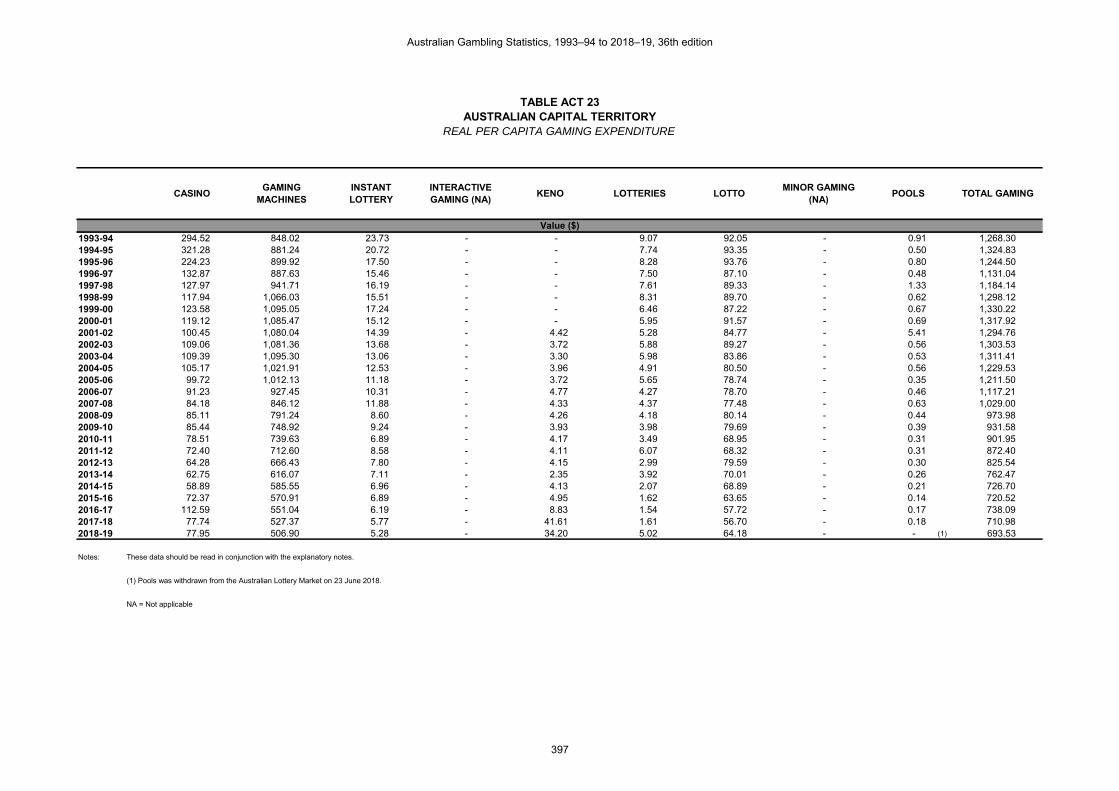
TABLE ACT 23AUSTRALIAN CAPITAL TERRITORY
REAL PER CAPITA GAMING EXPENDITURE
1993-94 294.52 848.02 23.73 - - 9.07 92.05 - 0.91 1,268.301994-95 321.28 881.24 20.72 - - 7.74 93.35 - 0.50 1,324.831995-96 224.23 899.92 17.50 - - 8.28 93.76 - 0.80 1,244.501996-97 132.87 887.63 15.46 - - 7.50 87.10 - 0.48 1,131.041997-98 127.97 941.71 16.19 - - 7.61 89.33 - 1.33 1,184.141998-99 117.94 1,066.03 15.51 - - 8.31 89.70 - 0.62 1,298.121999-00 123.58 1,095.05 17.24 - - 6.46 87.22 - 0.67 1,330.222000-01 119.12 1,085.47 15.12 - - 5.95 91.57 - 0.69 1,317.922001-02 100.45 1,080.04 14.39 - 4.42 5.28 84.77 - 5.41 1,294.762002-03 109.06 1,081.36 13.68 - 3.72 5.88 89.27 - 0.56 1,303.532003-04 109.39 1,095.30 13.06 - 3.30 5.98 83.86 - 0.53 1,311.412004-05 105.17 1,021.91 12.53 - 3.96 4.91 80.50 - 0.56 1,229.532005-06 99.72 1,012.13 11.18 - 3.72 5.65 78.74 - 0.35 1,211.502006-07 91.23 927.45 10.31 - 4.77 4.27 78.70 - 0.46 1,117.212007-08 84.18 846.12 11.88 - 4.33 4.37 77.48 - 0.63 1,029.002008-09 85.11 791.24 8.60 - 4.26 4.18 80.14 - 0.44 973.982009-10 85.44 748.92 9.24 - 3.93 3.98 79.69 - 0.39 931.582010-11 78.51 739.63 6.89 - 4.17 3.49 68.95 - 0.31 901.952011-12 72.40 712.60 8.58 - 4.11 6.07 68.32 - 0.31 872.402012-13 64.28 666.43 7.80 - 4.15 2.99 79.59 - 0.30 825.542013-14 62.75 616.07 7.11 - 2.35 3.92 70.01 - 0.26 762.472014-15 58.89 585.55 6.96 - 4.13 2.07 68.89 - 0.21 726.702015-16 72.37 570.91 6.89 - 4.95 1.62 63.65 - 0.14 720.522016-17 112.59 551.04 6.19 - 8.83 1.54 57.72 - 0.17 738.092017-18 77.74 527.37 5.77 - 41.61 1.61 56.70 - 0.18 710.982018-19 77.95 506.90 5.28 - 34.20 5.02 64.18 - - (1) 693.53
Notes: These data should be read in conjunction with the explanatory notes.
(1) Pools was withdrawn from the Australian Lottery Market on 23 June 2018.
NA = Not applicable
KENO
Value ($)
CASINOGAMING
MACHINESINSTANT LOTTERY
INTERACTIVE GAMING (NA)
LOTTERIES LOTTOMINOR GAMING
(NA)POOLS TOTAL GAMING
Australian Gambling Statistics, 1993–94 to 2018–19, 36th edition
397

TABLE ACT 24AUSTRALIAN CAPITAL TERRITORY
GAMING EXPENDITUREAS A % OF HDI
1993-94 0.464 1.336 0.037 - - 0.014 0.145 - 0.001 1.9991994-95 0.507 1.389 0.033 - - 0.012 0.147 - 0.001 2.0891995-96 0.360 1.446 0.028 - - 0.013 0.151 - 0.001 1.9991996-97 0.209 1.395 0.024 - - 0.012 0.137 - 0.001 1.7781997-98 0.200 1.471 0.025 - - 0.012 0.140 - 0.002 1.8501998-99 0.179 1.616 0.024 - - 0.013 0.136 - 0.001 1.9681999-00 0.175 1.553 0.024 - - 0.009 0.124 - 0.001 1.8862000-01 0.156 1.426 0.020 - - 0.008 0.120 - 0.001 1.7312001-02 0.135 1.451 0.019 - 0.006 0.007 0.114 - 0.007 1.7392002-03 0.136 1.350 0.017 - 0.005 0.007 0.111 - 0.001 1.6282003-04 0.133 1.332 0.016 - 0.004 0.007 0.102 - 0.001 1.5952004-05 0.123 1.200 0.015 - 0.005 0.006 0.095 - 0.001 1.4442005-06 0.116 1.173 0.013 - 0.004 0.007 0.091 - 0.000 1.4032006-07 0.101 1.022 0.011 - 0.005 0.005 0.087 - 0.001 1.2312007-08 0.087 0.877 0.012 - 0.004 0.005 0.080 - 0.001 1.0672008-09 0.084 0.781 0.008 - 0.004 0.004 0.079 - 0.000 0.9612009-10 0.082 0.718 0.009 - 0.004 0.004 0.076 - 0.000 0.8932010-11 0.071 0.664 0.006 - 0.004 0.003 0.062 - 0.000 0.8102011-12 0.062 0.614 0.007 - 0.004 0.005 0.059 - 0.000 0.7512012-13 0.053 0.550 0.006 - 0.003 0.002 0.066 - 0.000 0.6812013-14 0.053 0.517 0.006 - 0.002 0.003 0.059 - 0.000 0.6402014-15 0.050 0.502 0.006 - 0.004 0.002 0.059 - 0.000 0.6232015-16 0.062 0.492 0.006 - 0.004 0.001 0.055 - 0.000 0.6212016-17 0.096 0.472 0.005 - 0.008 0.001 0.049 - 0.000 0.6322017-18 0.068 0.461 0.005 - 0.036 0.001 0.050 - 0.000 0.6222018-19 0.068 0.443 0.005 - 0.030 0.004 0.056 - - (1) 0.607
Notes: These data should be read in conjunction with the explanatory notes.
(1) Pools was withdrawn from the Australian Lottery Market on 23 June 2018.
NA = Not applicable
Percentage (%)
CASINOGAMING
MACHINESINSTANT LOTTERY
TOTAL GAMINGINTERACTIVE GAMING (NA)
KENO LOTTERIES LOTTOMINOR GAMING
(NA)POOLS
Australian Gambling Statistics, 1993–94 to 2018–19, 36th edition
398

TABLE ACT 25AUSTRALIAN CAPITAL TERRITORY
GAMING EXPENDITURESHARE OF MARKET
1993-94 23.22 66.86 1.87 - - 0.71 7.26 - 0.071994-95 24.25 66.52 1.56 - - 0.58 7.05 - 0.041995-96 18.02 72.31 1.41 - - 0.67 7.53 - 0.061996-97 11.75 78.48 1.37 - - 0.66 7.70 - 0.041997-98 10.81 79.53 1.37 - - 0.64 7.54 - 0.111998-99 9.09 82.12 1.20 - - 0.64 6.91 - 0.051999-00 9.29 82.32 1.30 - - 0.49 6.56 - 0.052000-01 9.04 82.36 1.15 - - 0.45 6.95 - 0.052001-02 7.76 83.42 1.11 - 0.34 0.41 6.55 - 0.422002-03 8.37 82.96 1.05 - 0.29 0.45 6.85 - 0.042003-04 8.34 83.52 1.00 - 0.25 0.46 6.39 - 0.042004-05 8.55 83.11 1.02 - 0.32 0.40 6.55 - 0.052005-06 8.23 83.54 0.92 - 0.31 0.47 6.50 - 0.032006-07 8.17 83.02 0.92 - 0.43 0.38 7.04 - 0.042007-08 8.18 82.23 1.15 - 0.42 0.42 7.53 - 0.062008-09 8.74 81.24 0.88 - 0.44 0.43 8.23 - 0.052009-10 9.17 80.39 0.99 - 0.42 0.43 8.55 - 0.042010-11 8.70 82.00 0.76 - 0.46 0.39 7.64 - 0.032011-12 8.30 81.68 0.98 - 0.47 0.70 7.83 - 0.042012-13 7.79 80.73 0.94 - 0.50 0.36 9.64 - 0.042013-14 8.23 80.80 0.93 - 0.31 0.51 9.18 - 0.032014-15 8.10 80.58 0.96 - 0.57 0.28 9.48 - 0.032015-16 10.04 79.23 0.96 - 0.69 0.23 8.83 - 0.022016-17 15.25 74.66 0.84 - 1.20 0.21 7.82 - 0.022017-18 10.93 74.18 0.81 - 5.85 0.23 7.98 - 0.022018-19 11.24 73.09 0.76 - 4.93 0.72 9.25 - - (1)
Notes: These data should be read in conjunction with the explanatory notes.
(1) Pools was withdrawn from the Australian Lottery Market on 23 June 2018.
NA = Not applicable
POOLS
Percentage (%)
CASINOGAMING
MACHINESINSTANT LOTTERY
INTERACTIVE GAMING (NA)
KENO LOTTERIES LOTTOMINOR GAMING
(NA)
Australian Gambling Statistics, 1993–94 to 2018–19, 36th edition
399

TABLE ACT 26AUSTRALIAN CAPITAL TERRITORY
GOVERNMENT REVENUE FROM GAMING
1993-94 11.078 18.641 - 11.333 0.501 41.5531994-95 10.886 23.025 - 11.734 0.566 46.2111995-96 7.504 25.755 - 12.363 0.635 46.2571996-97 3.561 26.583 - 11.549 0.690 42.3831997-98 3.456 28.173 - 11.920 0.863 44.4121998-99 3.257 32.371 - 13.206 0.910 49.7441999-00 3.595 37.668 - 13.632 1.996 56.8912000-01 3.678 26.661 - 13.155 1.445 44.9392001-02 1.788 26.552 - 12.628 1.387 42.3552002-03 2.056 27.784 - 13.594 1.477 44.9112003-04 2.089 33.002 - 13.172 1.681 49.9442004-05 2.099 31.410 - 12.886 1.644 48.0392005-06 1.919 31.403 - 13.145 - 46.4672006-07 1.981 31.416 - 13.416 - 46.8132007-08 1.930 34.674 - 14.170 - 50.7742008-09 2.053 34.121 - 14.551 - 50.7252009-10 2.157 33.843 - 15.077 - 51.0772010-11 2.081 35.361 - 13.655 - 51.0972011-12 2.022 35.720 (2) - 14.213 - 51.9552012-13 1.862 34.891 - 16.089 - 52.8422013-14 1.898 33.661 - 15.160 - 50.7192014-15 1.837 33.083 - 14.841 - 49.7612015-16 2.300 33.357 - 14.730 - 50.3872016-17 2.758 33.437 - 13.527 - 49.7222017-18 2.667 32.491 - 13.737 - 48.8952018-19 2.866 32.385 - 16.432 - 51.683
Notes: These data should be read in conjunction with the explanatory notes.
Data for the gambling revenue received by states and territories from 1 July 2000 onwards are not comparable with that of preceding years because of the
impact of changes brought about by the introduction of the GST.
(1) Revenue from Tattersall's keno is included as part of revenue from lotteries, pools and lotto.
(2) Revenue does not include the levy on all gaming machine licensees of 0.75% of gross gaming machine revenue that commenced on 1 July 2011.
NA = Not applicable
Value ($ million)
TOTAL GAMINGCASINO GAMINGGAMING
MACHINESINTERACTIVE GAMING (NA)
LOTTERIES, POOLS LOTTO &
KENO (1)MINOR GAMING
Australian Gambling Statistics, 1993–94 to 2018–19, 36th edition
400

TABLE ACT 27AUSTRALIAN CAPITAL TERRITORY
REAL GOVERNMENT REVENUE FROM GAMING
1993-94 20.586 34.641 - 21.060 0.931 77.2181994-95 19.591 41.438 - 21.117 1.019 83.1651995-96 12.953 44.458 - 21.341 1.096 79.8481996-97 6.064 45.270 - 19.668 1.175 72.1781997-98 5.886 47.978 - 20.300 1.470 75.6331998-99 5.481 54.477 - 22.224 1.531 83.7141999-00 5.911 61.930 - 22.412 3.282 93.5342000-01 5.702 41.332 - 20.394 2.240 69.6682001-02 2.695 40.021 - 19.034 2.091 63.8402002-03 3.008 40.643 - 19.886 2.161 65.6972003-04 2.983 47.128 - 18.810 2.401 71.3222004-05 2.928 43.813 - 17.974 2.293 67.0082005-06 2.594 42.454 - 17.771 - 62.8192006-07 2.601 41.249 - 17.615 - 61.4662007-08 2.452 44.057 - 18.004 - 64.5142008-09 2.530 42.043 - 17.929 - 62.5022009-10 2.596 40.733 - 18.146 - 61.4762010-11 2.430 41.297 - 15.947 - 59.6742011-12 2.307 40.757 (2) - 16.217 - 59.2812012-13 2.077 38.916 - 17.945 - 58.9372013-14 2.062 36.578 - 16.474 - 55.1152014-15 1.963 35.344 - 15.855 - 53.1622015-16 2.423 35.143 - 15.519 - 53.0852016-17 2.856 34.620 - 14.006 - 51.4822017-18 2.710 33.012 - 13.957 - 49.6792018-19 2.866 32.385 - 16.432 - 51.683
Notes: These data should be read in conjunction with the explanatory notes.
Data for the gambling revenue received by states and territories from 1 July 2000 onwards are not comparable with that of preceding years because of the
impact of changes brought about by the introduction of the GST.
(1) Revenue from Tattersall's keno is included as part of revenue from lotteries, pools and lotto.
(2) Revenue does not include the levy on all gaming machine licensees of 0.75% of gross gaming machine revenue that commenced on 1 July 2011.
NA = Not applicable
Value ($ million)
TOTAL GAMINGCASINO GAMINGGAMING
MACHINESINTERACTIVE GAMING (NA)
LOTTERIES, POOLS LOTTO &
KENO (1)MINOR GAMING
Australian Gambling Statistics, 1993–94 to 2018–19, 36th edition
401

TABLE ACT 28AUSTRALIAN CAPITAL TERRITORY
PER CAPITA REVENUE FROM GAMING
1993-94 50.70 85.31 - 51.87 2.29 190.181994-95 49.10 103.85 - 52.93 2.55 208.431995-96 33.29 114.26 - 54.85 2.82 205.211996-97 15.61 116.52 - 50.62 3.02 185.771997-98 15.03 122.51 - 51.83 3.75 193.131998-99 14.02 139.31 - 56.83 3.92 214.081999-00 15.27 159.97 - 57.89 8.48 241.612000-01 15.36 111.37 - 54.95 6.04 187.732001-02 7.35 109.09 - 51.88 5.70 174.022002-03 8.33 112.51 - 55.05 5.98 181.862003-04 8.36 132.03 - 52.70 6.73 199.812004-05 8.30 124.26 - 50.98 6.50 190.052005-06 7.48 122.48 - 51.27 - 181.232006-07 7.58 120.13 - 51.30 - 179.012007-08 7.22 129.77 - 53.03 - 190.022008-09 7.53 125.12 - 53.36 - 186.012009-10 7.74 121.42 - 54.09 - 183.252010-11 7.31 124.20 - 47.96 - 179.472011-12 6.95 122.85 (2) - 48.88 - 178.692012-13 6.28 117.68 - 54.27 - 178.232013-14 6.31 111.85 - 50.37 - 168.532014-15 6.01 108.28 - 48.58 - 162.872015-16 7.40 107.28 - 47.37 - 162.052016-17 8.70 105.45 - 42.66 - 156.812017-18 8.24 100.33 - 42.42 - 150.992018-19 8.70 98.31 - 49.88 - 156.90
Notes: These data should be read in conjunction with the explanatory notes.
Data for the gambling revenue received by states and territories from 1 July 2000 onwards are not comparable with that of preceding years because of the
impact of changes brought about by the introduction of the GST.
(1) Revenue from Tattersall's keno is included as part of revenue from lotteries, pools and lotto.
(2) Revenue does not include the levy on all gaming machine licensees of 0.75% of gross gaming machine revenue that commenced on 1 July 2011.
NA = Not applicable
Value ($)
TOTAL GAMINGCASINO GAMINGGAMING
MACHINESINTERACTIVE GAMING (NA)
LOTTERIES, POOLS LOTTO &
KENO (1)MINOR GAMING
Australian Gambling Statistics, 1993–94 to 2018–19, 36th edition
402

TABLE ACT 29AUSTRALIAN CAPITAL TERRITORY
REAL PER CAPITA REVENUE FROM GAMING
1993-94 94.22 158.54 - 96.39 4.26 353.401994-95 88.37 186.90 - 95.25 4.59 375.111995-96 57.46 197.23 - 94.67 4.86 354.221996-97 26.58 198.43 - 86.21 5.15 316.371997-98 25.59 208.64 - 88.27 6.39 328.891998-99 23.59 234.44 - 95.64 6.59 360.271999-00 25.10 263.00 - 95.18 13.94 397.222000-01 23.82 172.66 - 85.19 9.36 291.032001-02 11.07 164.43 - 78.20 8.59 262.302002-03 12.18 164.58 - 80.52 8.75 266.032003-04 11.93 188.55 - 75.25 9.60 285.342004-05 11.58 173.33 - 71.11 9.07 265.102005-06 10.12 165.57 - 69.31 - 245.002006-07 9.95 157.74 - 67.36 - 235.042007-08 9.18 164.89 - 67.38 - 241.452008-09 9.28 154.17 - 65.75 - 229.202009-10 9.31 146.14 - 65.11 - 220.562010-11 8.54 145.05 - 56.01 - 209.592011-12 7.93 140.17 (2) - 55.77 - 203.882012-13 7.00 131.26 - 60.52 - 198.782013-14 6.85 121.54 - 54.74 - 183.142014-15 6.42 115.68 - 51.90 - 174.002015-16 7.79 113.02 - 49.91 - 170.732016-17 9.01 109.18 - 44.17 - 162.362017-18 8.37 101.94 - 43.10 - 153.412018-19 8.70 98.31 - 49.88 - 156.90
Notes: These data should be read in conjunction with the explanatory notes.
Data for the gambling revenue received by states and territories from 1 July 2000 onwards are not comparable with that of preceding years because of the
impact of changes brought about by the introduction of the GST.
(1) Revenue from Tattersall's keno is included as part of revenue from lotteries, pools and lotto.
(2) Revenue does not include the levy on all gaming machine licensees of 0.75% of gross gaming machine revenue that commenced on 1 July 2011.
NA = Not applicable
Value ($)
TOTAL GAMINGCASINO GAMINGGAMING
MACHINESINTERACTIVE GAMING (NA)
LOTTERIES, POOLS LOTTO &
KENO (1)MINOR GAMING
Australian Gambling Statistics, 1993–94 to 2018–19, 36th edition
403

TABLE ACT 30AUSTRALIAN CAPITAL TERRITORY
GOVERNMENT REVENUE FROM GAMINGAS A % OF TOTAL GAMBLING REVENUE
1993-94 23.37 39.32 - 23.90 1.06 87.651994-95 21.04 44.51 - 22.68 1.09 89.331995-96 14.16 48.59 - 23.32 1.20 87.271996-97 7.68 57.33 - 24.91 1.49 91.411997-98 6.87 55.98 - 23.68 1.71 88.251998-99 5.98 59.41 - 24.24 1.67 91.301999-00 5.79 60.69 - 21.96 3.22 91.662000-01 7.70 55.85 - 27.55 3.03 94.132001-02 3.97 58.94 - 28.03 3.08 94.022002-03 4.28 57.90 - 28.33 3.08 93.592003-04 3.72 58.78 - 23.46 2.99 88.962004-05 3.75 56.15 - 23.03 2.94 85.872005-06 3.61 59.11 - 24.74 - 87.472006-07 3.66 58.04 - 24.79 - 86.492007-08 3.23 57.99 - 23.70 - 84.922008-09 3.62 60.22 - 25.68 - 89.522009-10 3.60 56.45 - 25.15 - 85.192010-11 3.95 67.10 - 25.91 - 96.962011-12 3.79 67.01 (2) - 26.66 - 97.472012-13 3.28 61.40 - 28.31 - 92.992013-14 3.46 61.33 - 27.62 - 92.402014-15 3.69 66.48 - 29.82 - 99.992015-16 4.56 66.20 - 29.23 - 100.002016-17 5.55 67.25 - 27.21 - 100.002017-18 5.45 66.45 - 28.09 - 100.002018-19 5.55 62.66 - 31.79 - 100.00
Notes: These data should be read in conjunction with the explanatory notes.
Data for the gambling revenue received by states and territories from 1 July 2000 onwards are not comparable with that of preceding years because of the
impact of changes brought about by the introduction of the GST.
(1) Revenue from Tattersall's keno is included as part of revenue from lotteries, pools and lotto.
(2) Revenue does not include the levy on all gaming machine licensees of 0.75% of gross gaming machine revenue that commenced on 1 July 2011.
NA = Not applicable
Percentage (%)
TOTAL GAMINGCASINO GAMINGGAMING
MACHINESINTERACTIVE GAMING (NA)
LOTTERIES, POOLS LOTTO &
KENO (1)MINOR GAMING
Australian Gambling Statistics, 1993–94 to 2018–19, 36th edition
404

TABLE ACT 31AUSTRALIAN CAPITAL TERRITORY
TOTAL SPORTSBETTING TURNOVER
1995-96 14.712 - - - 14.7121996-97 67.352 - - - 67.3521997-98 78.730 0.083 - - 78.8131998-99 95.863 0.145 - - 96.0081999-00 163.268 - U - - 163.268 (1)
2000-01 325.247 - U - - 325.2472001-02 491.822 - U 1.922 0.091 493.8352002-03 625.848 - U 2.255 - 628.1032003-04 277.768 - U 3.560 - 281.3282004-05 260.558 - U 3.905 - 264.4632005-06 172.986 - U 5.789 - 178.7752006-07 101.545 - U 6.243 - 107.7882007-08 121.008 - U 8.595 - 129.6032008-09 76.887 - U 10.760 - 87.6472009-10 88.248 - U 15.568 - 103.8162010-11 109.169 - U 16.249 - 125.4182011-12 - - U 19.379 - 19.3792012-13 0.768 - U 19.137 - 19.9052013-14 2.039 - U 29.982 - 32.0212014-15 1.207 - U 30.013 - 31.2202015-16 - - U 36.178 - 36.1782016-17 - - U 62.798 - 62.7982017-18 - - U 86.186 - 86.1862018-19 - - U 104.966 - 104.966
Notes: These data should be read in conjunction with the explanatory notes.
(1) Total sportsbetting turnover incomplete from this period on, due to data for one or more components being unavailable.
U = Unavailable data
TOTAL SPORTSBETTING
Value ($ million)
BOOKMAKER (AND OTHER) FIXED ODDS
BOOKMAKER (AND OTHER)
POOL BETTINGTAB FIXED ODDS TAB TOTE ODDS
Australian Gambling Statistics, 1993–94 to 2018–19, 36th edition
405

TABLE ACT 32AUSTRALIAN CAPITAL TERRITORYREAL SPORTSBETTING TURNOVER
1995-96 25.395 - - - 25.3951996-97 114.699 - - - 114.6991997-98 134.076 0.141 - - 134.2171998-99 161.327 0.244 - - 161.5711999-00 268.428 - U - - 268.428 (1)
2000-01 504.221 - U - - 504.2212001-02 741.306 - U 2.897 0.137 744.3402002-03 915.503 - U 3.299 - 918.8022003-04 396.662 - U 5.084 - 401.7462004-05 363.443 - U 5.447 - 368.8902005-06 233.859 - U 7.826 - 241.6852006-07 133.329 - U 8.197 - 141.5262007-08 153.753 - U 10.921 - 164.6742008-09 94.739 - U 13.258 - 107.9972009-10 106.214 - U 18.737 - 124.9522010-11 127.494 - U 18.977 - 146.4712011-12 - - U 22.111 - 22.1112012-13 0.857 - U 21.344 - 22.2012013-14 2.216 - U 32.580 - 34.7962014-15 1.290 - U 32.064 - 33.3542015-16 - - U 38.116 - 38.1162016-17 - - U 65.020 - 65.0202017-18 - - U 87.567 - 87.5672018-19 - - U 104.966 - 104.966
Notes: These data should be read in conjunction with the explanatory notes.
(1) Total sportsbetting turnover incomplete from this period on, due to data for one or more components being unavailable.
U = Unavailable data
TOTAL SPORTSBETTING
Value ($ million)
BOOKMAKER (AND OTHER) FIXED ODDS
BOOKMAKER (AND OTHER)
POOL BETTINGTAB FIXED ODDS TAB TOTE ODDS
Australian Gambling Statistics, 1993–94 to 2018–19, 36th edition
406

TABLE ACT 33AUSTRALIAN CAPITAL TERRITORY
PER CAPITA SPORTSBETTING TURNOVER
1995-96 65.27 - - - 65.271996-97 295.22 - - - 295.221997-98 342.36 0.36 - - 342.721998-99 412.55 0.62 - - 413.171999-00 693.37 - U - - 693.37 (1)
2000-01 1,358.70 - U - - 1,358.702001-02 2,020.72 - U 7.90 0.37 2,028.992002-03 2,534.31 - U 9.13 - 2,543.442003-04 1,111.29 - U 14.24 - 1,125.532004-05 1,030.82 - U 15.45 - 1,046.272005-06 674.66 - U 22.58 - 697.242006-07 388.30 - U 23.87 - 412.182007-08 452.88 - U 32.17 - 485.052008-09 281.95 - U 39.46 - 321.402009-10 316.61 - U 55.85 - 372.472010-11 383.44 - U 57.07 - 440.512011-12 - - U 66.65 - 66.652012-13 2.59 - U 64.55 - 67.142013-14 6.78 - U 99.63 - 106.402014-15 3.95 - U 98.23 - 102.182015-16 - - U 116.35 - 116.352016-17 - - U 198.05 - 198.052017-18 - - U 266.14 - 266.142018-19 - - U 318.66 - 318.66
Notes: These data should be read in conjunction with the explanatory notes.
(1) Total sportsbetting turnover incomplete from this period on, due to data for one or more components being unavailable.
U = Unavailable data
TOTAL SPORTSBETTING
Value ($)
BOOKMAKER (AND OTHER) FIXED ODDS
BOOKMAKER (AND OTHER)
POOL BETTINGTAB FIXED ODDS TAB TOTE ODDS
Australian Gambling Statistics, 1993–94 to 2018–19, 36th edition
407
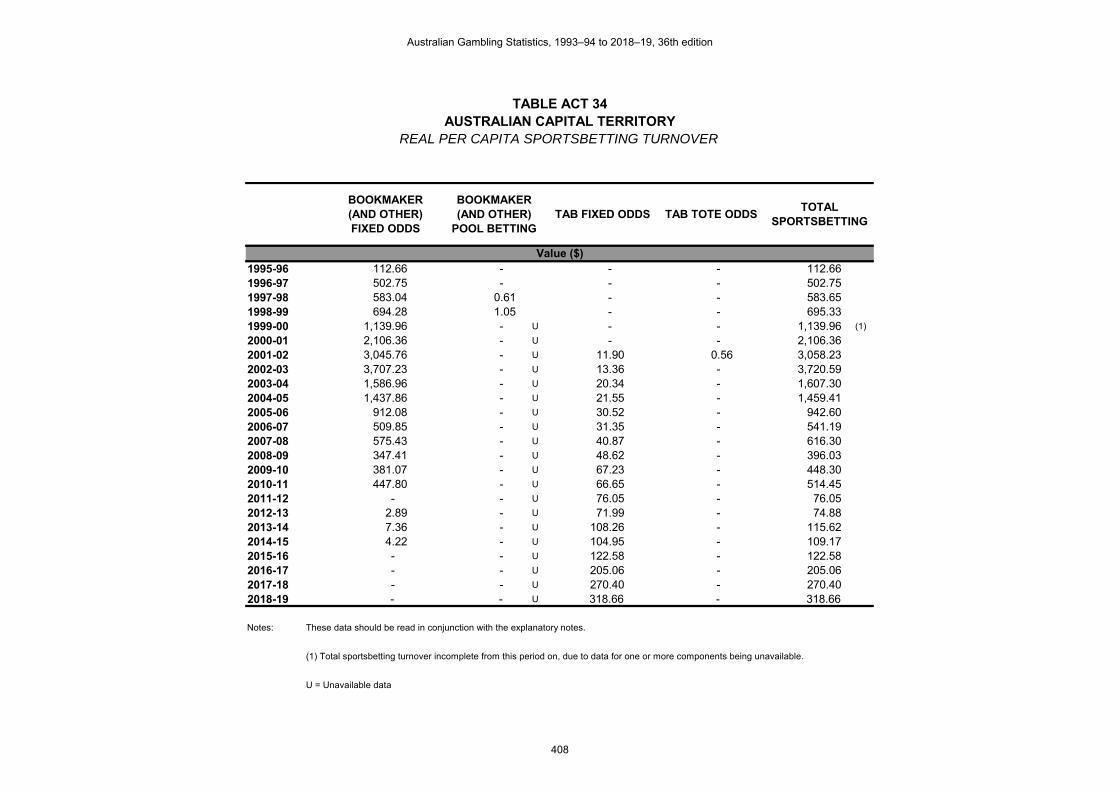
TABLE ACT 34AUSTRALIAN CAPITAL TERRITORY
REAL PER CAPITA SPORTSBETTING TURNOVER
1995-96 112.66 - - - 112.661996-97 502.75 - - - 502.751997-98 583.04 0.61 - - 583.651998-99 694.28 1.05 - - 695.331999-00 1,139.96 - U - - 1,139.96 (1)
2000-01 2,106.36 - U - - 2,106.362001-02 3,045.76 - U 11.90 0.56 3,058.232002-03 3,707.23 - U 13.36 - 3,720.592003-04 1,586.96 - U 20.34 - 1,607.302004-05 1,437.86 - U 21.55 - 1,459.412005-06 912.08 - U 30.52 - 942.602006-07 509.85 - U 31.35 - 541.192007-08 575.43 - U 40.87 - 616.302008-09 347.41 - U 48.62 - 396.032009-10 381.07 - U 67.23 - 448.302010-11 447.80 - U 66.65 - 514.452011-12 - - U 76.05 - 76.052012-13 2.89 - U 71.99 - 74.882013-14 7.36 - U 108.26 - 115.622014-15 4.22 - U 104.95 - 109.172015-16 - - U 122.58 - 122.582016-17 - - U 205.06 - 205.062017-18 - - U 270.40 - 270.402018-19 - - U 318.66 - 318.66
Notes: These data should be read in conjunction with the explanatory notes.
(1) Total sportsbetting turnover incomplete from this period on, due to data for one or more components being unavailable.
U = Unavailable data
TOTAL SPORTSBETTING
Value ($)
BOOKMAKER (AND OTHER) FIXED ODDS
BOOKMAKER (AND OTHER)
POOL BETTINGTAB FIXED ODDS TAB TOTE ODDS
Australian Gambling Statistics, 1993–94 to 2018–19, 36th edition
408

TABLE ACT 35AUSTRALIAN CAPITAL TERRITORY
TOTAL SPORTSBETTING EXPENDITURE
2001-02 - - 0.372 0.038 0.4102002-03 - - 0.436 - U 0.4362003-04 - U - U - U - U - U
2004-05 - U - U - U - U - U
2005-06 - U - U - U - U - U
2006-07 - U - U - U - U - U
2007-08 - U - U - U - U - U
2008-09 - U - U - U - U - U
2009-10 - U - U - U - U - U
2010-11 - U - U - U - U - U
2011-12 - U - U - U - U - U
2012-13 - U - U - U - U - U
2013-14 - U - U - U - U - U
2014-15 - U - U - U - U - U
2015-16 - U - U - U - U - U
2016-17 - U - U - U - U - U
2017-18 - U - U - U - U - U
2018-19 - U - U - U - U - U
Notes: These data should be read in conjunction with the explanatory notes.
U = Unavailable data
TOTAL SPORTSBETTING
Value ($ million)
BOOKMAKER (AND OTHER) FIXED ODDS
BOOKMAKER (AND OTHER)
POOL BETTINGTAB FIXED ODDS TAB TOTE ODDS
Australian Gambling Statistics, 1993–94 to 2018–19, 36th edition
409

TABLE ACT 36AUSTRALIAN CAPITAL TERRITORY
REAL SPORTSBETTING EXPENDITURE
2001-02 - - 0.561 0.057 0.6182002-03 - - 0.638 - U 0.6382003-04 - U - U - U - U - U
2004-05 - U - U - U - U - U
2005-06 - U - U - U - U - U
2006-07 - U - U - U - U - U
2007-08 - U - U - U - U - U
2008-09 - U - U - U - U - U
2009-10 - U - U - U - U - U
2010-11 - U - U - U - U - U
2011-12 - U - U - U - U - U
2012-13 - U - U - U - U - U
2013-14 - U - U - U - U - U
2014-15 - U - U - U - U - U
2015-16 - U - U - U - U - U
2016-17 - U - U - U - U - U
2017-18 - U - U - U - U - U
2018-19 - U - U - U - U - U
Notes: These data should be read in conjunction with the explanatory notes.
U = Unavailable data
TOTAL SPORTSBETTING
Value ($ million)
BOOKMAKER (AND OTHER) FIXED ODDS
BOOKMAKER (AND OTHER)
POOL BETTINGTAB FIXED ODDS TAB TOTE ODDS
Australian Gambling Statistics, 1993–94 to 2018–19, 36th edition
410

TABLE ACT 37AUSTRALIAN CAPITAL TERRITORY
PER CAPITA SPORTSBETTING EXPENDITURE
2001-02 - - 1.53 0.16 1.682002-03 - - 1.77 - U 1.772003-04 - U - U - U - U - U
2004-05 - U - U - U - U - U
2005-06 - U - U - U - U - U
2006-07 - U - U - U - U - U
2007-08 - U - U - U - U - U
2008-09 - U - U - U - U - U
2009-10 - U - U - U - U - U
2010-11 - U - U - U - U - U
2011-12 - U - U - U - U - U
2012-13 - U - U - U - U - U
2013-14 - U - U - U - U - U
2014-15 - U - U - U - U - U
2015-16 - U - U - U - U - U
2016-17 - U - U - U - U - U
2017-18 - U - U - U - U - U
2018-19 - U - U - U - U - U
Notes: These data should be read in conjunction with the explanatory notes.
U = Unavailable data
TOTAL SPORTSBETTING
Value ($)
BOOKMAKER (AND OTHER) FIXED ODDS
BOOKMAKER (AND OTHER)
POOL BETTINGTAB FIXED ODDS TAB TOTE ODDS
Australian Gambling Statistics, 1993–94 to 2018–19, 36th edition
411
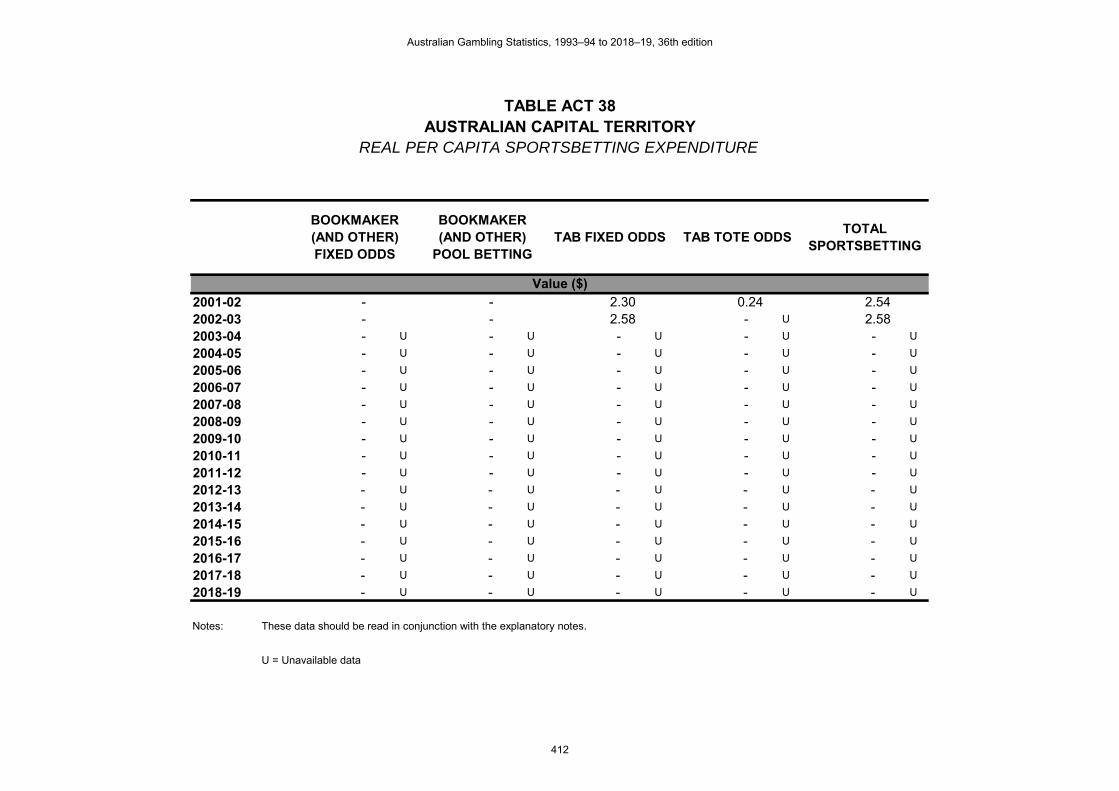
TABLE ACT 38AUSTRALIAN CAPITAL TERRITORY
REAL PER CAPITA SPORTSBETTING EXPENDITURE
2001-02 - - 2.30 0.24 2.542002-03 - - 2.58 - U 2.582003-04 - U - U - U - U - U
2004-05 - U - U - U - U - U
2005-06 - U - U - U - U - U
2006-07 - U - U - U - U - U
2007-08 - U - U - U - U - U
2008-09 - U - U - U - U - U
2009-10 - U - U - U - U - U
2010-11 - U - U - U - U - U
2011-12 - U - U - U - U - U
2012-13 - U - U - U - U - U
2013-14 - U - U - U - U - U
2014-15 - U - U - U - U - U
2015-16 - U - U - U - U - U
2016-17 - U - U - U - U - U
2017-18 - U - U - U - U - U
2018-19 - U - U - U - U - U
Notes: These data should be read in conjunction with the explanatory notes.
U = Unavailable data
TOTAL SPORTSBETTING
Value ($)
BOOKMAKER (AND OTHER) FIXED ODDS
BOOKMAKER (AND OTHER)
POOL BETTINGTAB FIXED ODDS TAB TOTE ODDS
Australian Gambling Statistics, 1993–94 to 2018–19, 36th edition
412

TABLE ACT 39AUSTRALIAN CAPITAL TERRITORYSPORTSBETTING EXPENDITURE
AS A % OF HDI
2001-02 - - 0.003 0.000 0.0032002-03 - - 0.003 - U 0.0032003-04 - U - U - U - U - U
2004-05 - U - U - U - U - U
2005-06 - U - U - U - U - U
2006-07 - U - U - U - U - U
2007-08 - U - U - U - U - U
2008-09 - U - U - U - U - U
2009-10 - U - U - U - U - U
2010-11 - U - U - U - U - U
2011-12 - U - U - U - U - U
2012-13 - U - U - U - U - U
2013-14 - U - U - U - U - U
2014-15 - U - U - U - U - U
2015-16 - U - U - U - U - U
2016-17 - U - U - U - U - U
2017-18 - U - U - U - U - U
2018-19 - U - U - U - U - U
Notes: These data should be read in conjunction with the explanatory notes.
U = Unavailable data
Percentage (%)
BOOKMAKER (AND OTHER) FIXED ODDS
BOOKMAKER (AND OTHER)
POOL BETTINGTAB FIXED ODDS TAB TOTE ODDS
TOTAL SPORTSBETTING
Australian Gambling Statistics, 1993–94 to 2018–19, 36th edition
413

TABLE ACT 40AUSTRALIAN CAPITAL TERRITORYSPORTSBETTING EXPENDITURE
SHARE OF MARKET
2001-02 - - 90.73 9.272002-03 - - 100.00 - U
2003-04 - U - U - U - U
2004-05 - U - U - U - U
2005-06 - U - U - U - U
2006-07 - U - U - U - U
2007-08 - U - U - U - U
2008-09 - U - U - U - U
2009-10 - U - U - U - U
2010-11 - U - U - U - U
2011-12 - U - U - U - U
2012-13 - U - U - U - U
2013-14 - U - U - U - U
2014-15 - U - U - U - U
2015-16 - U - U - U - U
2016-17 - U - U - U - U
2017-18 - U - U - U - U
2018-19 - U - U - U - U
Notes: These data should be read in conjunction with the explanatory notes.
U = Unavailable data
TAB FIXED ODDS TAB TOTE ODDS
Percentage (%)
BOOKMAKER (AND OTHER) FIXED ODDS
BOOKMAKER (AND OTHER)
POOL BETTING
Australian Gambling Statistics, 1993–94 to 2018–19, 36th edition
414

TABLE ACT 41AUSTRALIAN CAPITAL TERRITORY
GOVERNMENT REVENUE FROM SPORTSBETTING
1995-96 0.039 - - - 0.0391996-97 0.116 - - - 0.1161997-98 0.127 0.006 - - 0.1331998-99 0.183 0.010 - - 0.1931999-00 0.808 - U - - 0.808 (1)
2000-01 0.928 - U - - 0.9282001-02 1.196 - U - - 1.1962002-03 1.448 - U - - 1.4482003-04 0.848 - U - - 0.8482004-05 0.743 - U - - 0.7432005-06 0.658 - U - - 0.6582006-07 0.512 - U - - 0.5122007-08 0.466 - U - - 0.4662008-09 0.247 - U - - 0.2472009-10 0.324 - U - - 0.3242010-11 0.384 - U - - 0.3842011-12 - - U - - -2012-13 0.003 - U - - 0.0032013-14 0.009 - U - - 0.0092014-15 0.004 - U - - 0.0042015-16 - - U - - -2016-17 - - U - - -2017-18 - - U - - -2018-19 - - U - - -
Notes: These data should be read in conjunction with the explanatory notes.
Data for the gambling revenue received by states and territories from 1 July 2000 onwards are not comparable with that of preceding
years because of the impact of changes brought about by the introduction of the GST.
(1) Total sportsbetting revenue incomplete from this period on, due to data for one or more components being unavailable.
U = Unavailable data
NA = Not applicable
TOTAL SPORTSBETTING
Value ($ million)
BOOKMAKER (AND OTHER) FIXED ODDS
BOOKMAKER (AND OTHER)
POOL BETTING
TAB FIXED ODDS (NA)
TAB TOTE ODDS (NA)
Australian Gambling Statistics, 1993–94 to 2018–19, 36th edition
415

TABLE ACT 42AUSTRALIAN CAPITAL TERRITORY
REAL GOVERNMENT REVENUE FROM SPORTSBETTING
1995-96 0.067 - - - 0.0671996-97 0.198 - - - 0.1981997-98 0.216 0.010 - - 0.2261998-99 0.308 0.017 - - 0.3251999-00 1.328 - U - - 1.328 (1)
2000-01 1.439 - U - - 1.4392001-02 1.803 - U - - 1.8032002-03 2.118 - U - - 2.1182003-04 1.211 - U - - 1.2112004-05 1.036 - U - - 1.0362005-06 0.890 - U - - 0.8902006-07 0.672 - U - - 0.6722007-08 0.592 - U - - 0.5922008-09 0.304 - U - - 0.3042009-10 0.390 - U - - 0.3902010-11 0.448 - U - - 0.4482011-12 - - U - - -2012-13 0.003 - U - - 0.0032013-14 0.010 - U - - 0.0102014-15 0.004 - U - - 0.0042015-16 - - U - - -2016-17 - - U - - -2017-18 - - U - - -2018-19 - - U - - -
Notes: These data should be read in conjunction with the explanatory notes.
Data for the gambling revenue received by states and territories from 1 July 2000 onwards are not comparable with that of preceding
years because of the impact of changes brought about by the introduction of the GST.
(1) Total sportsbetting revenue incomplete from this period on, due to data for one or more components being unavailable.
U = Unavailable data
NA = Not applicable
TOTAL SPORTSBETTING
Value ($ million)
BOOKMAKER (AND OTHER) FIXED ODDS
BOOKMAKER (AND OTHER)
POOL BETTING
TAB FIXED ODDS (NA)
TAB TOTE ODDS (NA)
Australian Gambling Statistics, 1993–94 to 2018–19, 36th edition
416

TABLE ACT 43AUSTRALIAN CAPITAL TERRITORY
PER CAPITA REVENUE FROM SPORTSBETTING
1995-96 0.17 - - - 0.171996-97 0.51 - - - 0.511997-98 0.55 0.03 - - 0.581998-99 0.79 0.04 - - 0.831999-00 3.43 - U - - 3.43 (1)
2000-01 3.88 - U - - 3.882001-02 4.91 - U - - 4.912002-03 5.86 - U - - 5.862003-04 3.39 - U - - 3.392004-05 2.94 - U - - 2.942005-06 2.57 - U - - 2.572006-07 1.96 - U - - 1.962007-08 1.74 - U - - 1.742008-09 0.91 - U - - 0.912009-10 1.16 - U - - 1.162010-11 1.35 - U - - 1.352011-12 - - U - - -2012-13 0.01 - U - - 0.012013-14 0.03 - U - - 0.032014-15 0.01 - U - - 0.012015-16 - - U - - -2016-17 - - U - - -2017-18 - - U - - -2018-19 - - U - - -
Notes: These data should be read in conjunction with the explanatory notes.
Data for the gambling revenue received by states and territories from 1 July 2000 onwards are not comparable with that of preceding
years because of the impact of changes brought about by the introduction of the GST.
(1) Total sportsbetting revenue incomplete from this period on, due to data for one or more components being unavailable.
U = Unavailable data
NA = Not applicable
TOTAL SPORTSBETTING
Value ($)
BOOKMAKER (AND OTHER) FIXED ODDS
BOOKMAKER (AND OTHER)
POOL BETTING
TAB FIXED ODDS (NA)
TAB TOTE ODDS (NA)
Australian Gambling Statistics, 1993–94 to 2018–19, 36th edition
417

TABLE ACT 44AUSTRALIAN CAPITAL TERRITORY
REAL PER CAPITA REVENUE FROM SPORTSBETTING
1995-96 0.30 - - - 0.301996-97 0.87 - - - 0.871997-98 0.94 0.04 - - 0.981998-99 1.33 0.07 - - 1.401999-00 5.64 - U - - 5.64 (1)
2000-01 6.01 - U - - 6.012001-02 7.41 - U - - 7.412002-03 8.58 - U - - 8.582003-04 4.84 - U - - 4.842004-05 4.10 - U - - 4.102005-06 3.47 - U - - 3.472006-07 2.57 - U - - 2.572007-08 2.22 - U - - 2.222008-09 1.12 - U - - 1.122009-10 1.40 - U - - 1.402010-11 1.58 - U - - 1.582011-12 - - U - - -2012-13 0.01 - U - - 0.012013-14 0.03 - U - - 0.032014-15 0.01 - U - - 0.012015-16 - - U - - -2016-17 - - U - - -2017-18 - - U - - -2018-19 - - U - - -
Notes: These data should be read in conjunction with the explanatory notes.
Data for the gambling revenue received by states and territories from 1 July 2000 onwards are not comparable with that of preceding
years because of the impact of changes brought about by the introduction of the GST.
(1) Total sportsbetting revenue incomplete from this period on, due to data for one or more components being unavailable.
U = Unavailable data
NA = Not applicable
TOTAL SPORTSBETTING
Value ($)
BOOKMAKER (AND OTHER) FIXED ODDS
BOOKMAKER (AND OTHER)
POOL BETTING
TAB FIXED ODDS (NA)
TAB TOTE ODDS (NA)
Australian Gambling Statistics, 1993–94 to 2018–19, 36th edition
418
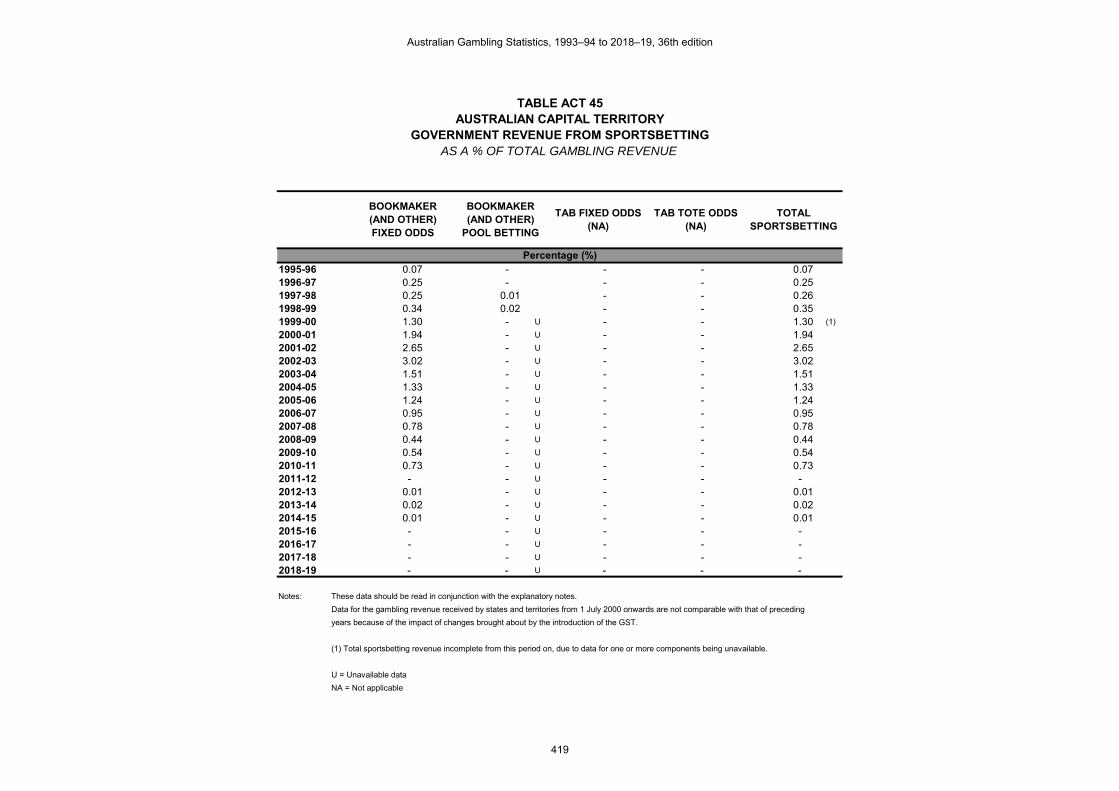
TABLE ACT 45AUSTRALIAN CAPITAL TERRITORY
GOVERNMENT REVENUE FROM SPORTSBETTINGAS A % OF TOTAL GAMBLING REVENUE
1995-96 0.07 - - - 0.071996-97 0.25 - - - 0.251997-98 0.25 0.01 - - 0.261998-99 0.34 0.02 - - 0.351999-00 1.30 - U - - 1.30 (1)
2000-01 1.94 - U - - 1.942001-02 2.65 - U - - 2.652002-03 3.02 - U - - 3.022003-04 1.51 - U - - 1.512004-05 1.33 - U - - 1.332005-06 1.24 - U - - 1.242006-07 0.95 - U - - 0.952007-08 0.78 - U - - 0.782008-09 0.44 - U - - 0.442009-10 0.54 - U - - 0.542010-11 0.73 - U - - 0.732011-12 - - U - - -2012-13 0.01 - U - - 0.012013-14 0.02 - U - - 0.022014-15 0.01 - U - - 0.012015-16 - - U - - -2016-17 - - U - - -2017-18 - - U - - -2018-19 - - U - - -
Notes: These data should be read in conjunction with the explanatory notes.
Data for the gambling revenue received by states and territories from 1 July 2000 onwards are not comparable with that of preceding
years because of the impact of changes brought about by the introduction of the GST.
(1) Total sportsbetting revenue incomplete from this period on, due to data for one or more components being unavailable.
U = Unavailable data
NA = Not applicable
Percentage (%)
BOOKMAKER (AND OTHER) FIXED ODDS
BOOKMAKER (AND OTHER)
POOL BETTING
TAB FIXED ODDS (NA)
TAB TOTE ODDS (NA)
TOTAL SPORTSBETTING
Australian Gambling Statistics, 1993–94 to 2018–19, 36th edition
419

TABLE ACT 46AUSTRALIAN CAPITAL TERRITORY
TOTAL GAMBLING TURNOVER
1993-94 982.610 130.210 - 1,112.8201994-95 1,264.611 123.236 - 1,387.8471995-96 1,344.832 140.571 14.712 1,500.1151996-97 1,283.142 140.688 67.352 1,491.1821997-98 1,371.627 140.472 78.813 1,590.9121998-99 1,558.643 143.472 96.008 1,798.1231999-00 1,714.545 134.040 163.268 2,011.8532000-01 1,829.853 151.912 325.247 2,307.0122001-02 1,990.612 147.788 493.835 2,632.2352002-03 2,120.578 146.909 628.103 2,895.5902003-04 2,215.325 165.910 281.328 2,662.5632004-05 2,174.378 174.672 264.463 2,613.5132005-06 2,301.636 186.419 178.775 2,666.8302006-07 2,285.158 172.096 107.788 2,565.0422007-08 2,249.932 173.622 129.603 2,553.1572008-09 2,239.095 184.785 87.647 2,511.5272009-10 2,236.523 175.249 103.816 2,515.5882010-11 2,339.245 167.376 125.418 2,632.0392011-12 2,364.980 161.255 19.379 2,545.6142012-13 2,375.394 152.849 19.905 2,548.1482013-14 2,323.608 141.985 32.021 2,497.6142014-15 2,165.188 137.316 31.220 2,333.7242015-16 2,220.445 108.958 36.178 2,365.5812016-17 2,279.562 99.756 62.798 2,442.1162017-18 2,247.008 89.981 86.186 2,423.1752018-19 2,240.149 87.436 104.966 2,432.551
Notes: These data should be read in conjunction with the explanatory notes.
Figure(s) may be incomplete for any period due to some unavailable turnover figures that are used to derive these numbers.
Value ($ million)
GAMING RACING SPORTSBETTING TOTAL GAMBLING
Australian Gambling Statistics, 1993–94 to 2018–19, 36th edition
420

TABLE ACT 47AUSTRALIAN CAPITAL TERRITORY
REAL GAMBLING TURNOVER
1993-94 1,825.990 241.970 - 2,067.9601994-95 2,275.900 221.786 - 2,497.6861995-96 2,321.412 242.650 25.395 2,589.4571996-97 2,185.172 239.590 114.699 2,539.4611997-98 2,335.860 239.222 134.217 2,709.2991998-99 2,623.026 241.448 161.571 3,026.0451999-00 2,818.870 220.374 268.428 3,307.6722000-01 2,836.769 235.505 504.221 3,576.4962001-02 3,000.381 222.756 744.340 3,967.4772002-03 3,102.025 214.901 918.802 4,235.7282003-04 3,163.562 236.925 401.746 3,802.2332004-05 3,032.965 243.644 368.890 3,645.4992005-06 3,111.572 252.019 241.685 3,605.2762006-07 3,000.420 225.963 141.526 3,367.9092007-08 2,858.767 220.604 164.674 3,244.0452008-09 2,758.971 227.689 107.997 3,094.6572009-10 2,691.849 210.927 124.952 3,027.7282010-11 2,731.913 195.472 146.471 3,073.8552011-12 2,698.442 183.992 22.111 2,904.5462012-13 2,649.389 170.480 22.201 2,842.0692013-14 2,524.987 154.290 34.796 2,714.0742014-15 2,313.183 146.702 33.354 2,493.2392015-16 2,339.361 114.793 38.116 2,492.2702016-17 2,360.236 103.286 65.020 2,528.5432017-18 2,283.024 91.423 87.567 2,462.0152018-19 2,240.149 87.436 104.966 2,432.551
Notes: These data should be read in conjunction with the explanatory notes.
Figure(s) may be incomplete for any period due to some unavailable turnover figures that are used to derive these numbers.
Value ($ million)
GAMING RACING SPORTSBETTING TOTAL GAMBLING
Australian Gambling Statistics, 1993–94 to 2018–19, 36th edition
421

TABLE ACT 48AUSTRALIAN CAPITAL TERRITORY
PER CAPITA GAMBLING TURNOVER
1993-94 4,497.10 595.93 - 5,093.031994-95 5,703.92 555.85 - 6,259.771995-96 5,966.03 623.61 65.27 6,654.901996-97 5,624.29 616.67 295.22 6,536.171997-98 5,964.61 610.85 342.72 6,918.181998-99 6,707.69 617.44 413.17 7,738.311999-00 7,281.36 569.24 693.37 8,543.972000-01 7,644.12 634.60 1,358.70 9,637.432001-02 8,178.71 607.21 2,028.99 10,814.912002-03 8,587.06 594.89 2,543.44 11,725.392003-04 8,863.02 663.77 1,125.53 10,652.322004-05 8,602.30 691.04 1,046.27 10,339.612005-06 8,976.63 727.05 697.24 10,400.932006-07 8,738.37 658.09 412.18 9,808.642007-08 8,420.51 649.79 485.05 9,555.352008-09 8,210.81 677.61 321.40 9,209.822009-10 8,024.13 628.75 372.47 9,025.362010-11 8,216.17 587.88 440.51 9,244.552011-12 8,133.77 554.60 66.65 8,755.022012-13 8,011.80 515.53 67.14 8,594.472013-14 7,720.96 471.79 106.40 8,299.152014-15 7,086.76 449.44 102.18 7,638.382015-16 7,141.11 350.42 116.35 7,607.872016-17 7,189.12 314.60 198.05 7,701.772017-18 6,938.67 277.86 266.14 7,482.662018-19 6,800.66 265.44 318.66 7,384.76
Notes: These data should be read in conjunction with the explanatory notes.
Figure(s) may be incomplete for any period due to some unavailable turnover figures that are used to derive these numbers.
Value ($)
GAMING RACING SPORTSBETTING TOTAL GAMBLING
Australian Gambling Statistics, 1993–94 to 2018–19, 36th edition
422

TABLE ACT 49AUSTRALIAN CAPITAL TERRITORY
REAL PER CAPITA GAMBLING TURNOVER
1993-94 8,356.99 1,107.42 - 9,464.411994-95 10,265.26 1,000.35 - 11,265.611995-96 10,298.39 1,076.46 112.66 11,487.511996-97 9,578.08 1,050.17 502.75 11,131.001997-98 10,157.64 1,040.27 583.65 11,781.561998-99 11,288.31 1,039.08 695.33 13,022.721999-00 11,971.22 935.89 1,139.96 14,047.082000-01 11,850.46 983.81 2,106.36 14,940.632001-02 12,327.49 915.22 3,058.23 16,300.942002-03 12,561.32 870.22 3,720.59 17,152.142003-04 12,656.70 947.89 1,607.30 15,211.882004-05 11,999.05 963.91 1,459.41 14,422.372005-06 12,135.47 982.90 942.60 14,060.972006-07 11,473.51 864.07 541.19 12,878.772007-08 10,699.12 825.63 616.30 12,141.042008-09 10,117.20 834.94 396.03 11,348.172009-10 9,657.74 756.76 448.30 10,862.802010-11 9,595.34 686.56 514.45 10,796.352011-12 9,280.64 632.80 76.05 9,989.482012-13 8,935.94 575.00 74.88 9,585.812013-14 8,390.11 512.68 115.62 9,018.412014-15 7,571.15 480.16 109.17 8,160.482015-16 7,523.55 369.18 122.58 8,015.312016-17 7,443.54 325.74 205.06 7,974.342017-18 7,049.88 282.31 270.40 7,602.602018-19 6,800.66 265.44 318.66 7,384.76
Notes: These data should be read in conjunction with the explanatory notes.
Figure(s) may be incomplete for any period due to some unavailable turnover figures that are used to derive these numbers.
Value ($)
GAMING RACING SPORTSBETTING TOTAL GAMBLING
Australian Gambling Statistics, 1993–94 to 2018–19, 36th edition
423
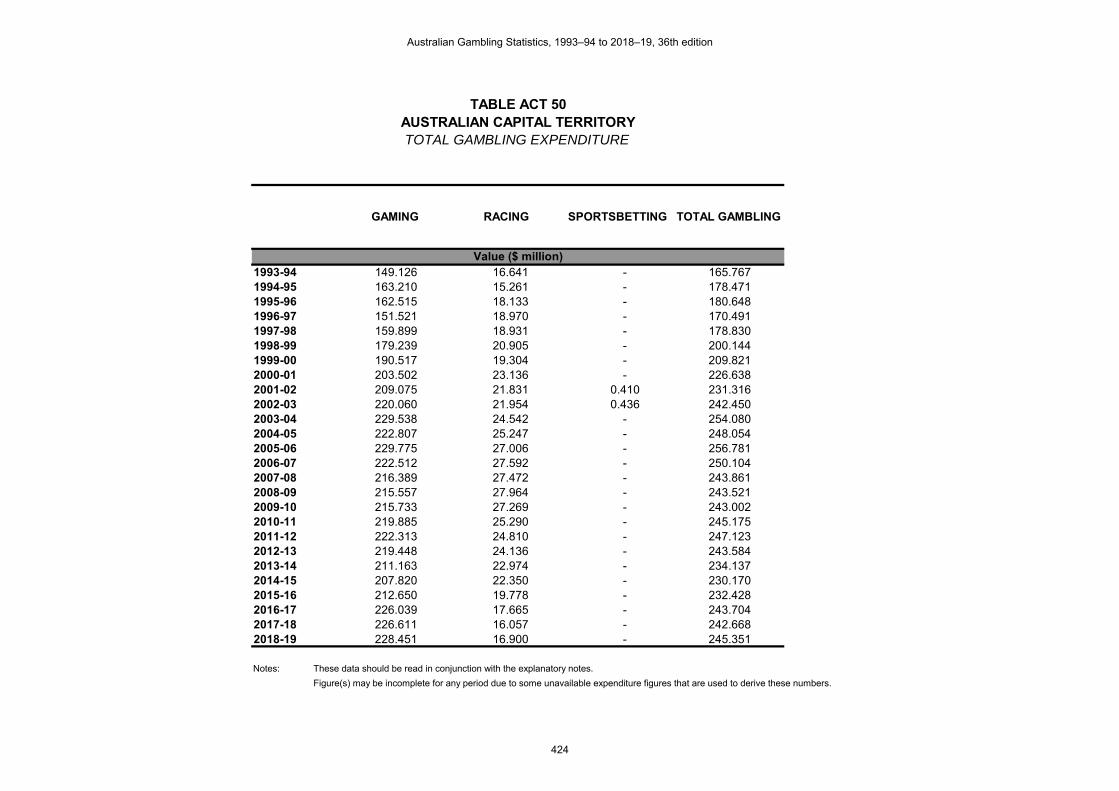
TABLE ACT 50AUSTRALIAN CAPITAL TERRITORYTOTAL GAMBLING EXPENDITURE
1993-94 149.126 16.641 - 165.7671994-95 163.210 15.261 - 178.4711995-96 162.515 18.133 - 180.6481996-97 151.521 18.970 - 170.4911997-98 159.899 18.931 - 178.8301998-99 179.239 20.905 - 200.1441999-00 190.517 19.304 - 209.8212000-01 203.502 23.136 - 226.6382001-02 209.075 21.831 0.410 231.3162002-03 220.060 21.954 0.436 242.4502003-04 229.538 24.542 - 254.0802004-05 222.807 25.247 - 248.0542005-06 229.775 27.006 - 256.7812006-07 222.512 27.592 - 250.1042007-08 216.389 27.472 - 243.8612008-09 215.557 27.964 - 243.5212009-10 215.733 27.269 - 243.0022010-11 219.885 25.290 - 245.1752011-12 222.313 24.810 - 247.1232012-13 219.448 24.136 - 243.5842013-14 211.163 22.974 - 234.1372014-15 207.820 22.350 - 230.1702015-16 212.650 19.778 - 232.4282016-17 226.039 17.665 - 243.7042017-18 226.611 16.057 - 242.6682018-19 228.451 16.900 - 245.351
Notes: These data should be read in conjunction with the explanatory notes.
Figure(s) may be incomplete for any period due to some unavailable expenditure figures that are used to derive these numbers.
Value ($ million)
GAMING RACING SPORTSBETTING TOTAL GAMBLING
Australian Gambling Statistics, 1993–94 to 2018–19, 36th edition
424

TABLE ACT 51AUSTRALIAN CAPITAL TERRITORY
REAL GAMBLING EXPENDITURE
1993-94 277.122 30.924 - 308.0461994-95 293.727 27.465 - 321.1921995-96 280.529 31.301 - 311.8291996-97 258.038 32.306 - 290.3441997-98 272.306 32.239 - 304.5451998-99 301.640 35.181 - 336.8211999-00 313.228 31.738 - 344.9652000-01 315.483 35.867 - 351.3502001-02 315.132 32.905 0.618 348.6552002-03 321.908 32.115 0.638 354.6612003-04 327.788 35.047 - 362.8352004-05 310.786 35.216 - 346.0022005-06 310.632 36.509 - 347.1412006-07 292.159 36.228 - 328.3872007-08 274.944 34.906 - 309.8502008-09 265.605 34.457 - 300.0622009-10 259.653 32.821 - 292.4742010-11 256.795 29.535 - 286.3302011-12 253.659 28.308 - 281.9672012-13 244.761 26.920 - 271.6812013-14 229.464 24.965 - 254.4292014-15 222.025 23.878 - 245.9032015-16 224.038 20.837 - 244.8762016-17 234.039 18.290 - 252.3292017-18 230.243 16.314 - 246.5582018-19 228.451 16.900 - 245.351
Notes: These data should be read in conjunction with the explanatory notes.
Figure(s) may be incomplete for any period due to some unavailable expenditure figures that are used to derive these numbers.
Value ($ million)
GAMING RACING SPORTSBETTING TOTAL GAMBLING
Australian Gambling Statistics, 1993–94 to 2018–19, 36th edition
425

TABLE ACT 52AUSTRALIAN CAPITAL TERRITORY
PER CAPITA GAMBLING EXPENDITURE
1993-94 682.50 76.16 - 758.661994-95 736.15 68.83 - 804.981995-96 720.96 80.44 - 801.401996-97 664.15 83.15 - 747.301997-98 695.33 82.32 - 777.651998-99 771.36 89.97 - 861.331999-00 809.09 81.98 - 891.072000-01 850.12 96.65 - 946.772001-02 859.01 89.70 1.68 950.392002-03 891.11 88.90 1.77 981.782003-04 918.33 98.19 - 1,016.522004-05 881.47 99.88 - 981.352005-06 896.15 105.33 - 1,001.472006-07 850.88 105.51 - 956.392007-08 809.85 102.82 - 912.672008-09 790.45 102.54 - 893.002009-10 774.00 97.83 - 871.842010-11 772.31 88.83 - 861.132011-12 764.59 85.33 - 849.922012-13 740.16 81.41 - 821.572013-14 701.66 76.34 - 778.002014-15 680.20 73.15 - 753.362015-16 683.90 63.61 - 747.502016-17 712.87 55.71 - 768.582017-18 699.77 49.58 - 749.352018-19 693.53 51.31 - 744.84
Notes: These data should be read in conjunction with the explanatory notes.
Figure(s) may be incomplete for any period due to some unavailable expenditure figures that are used to derive these numbers.
Value ($)
GAMING RACING SPORTSBETTING TOTAL GAMBLING
Australian Gambling Statistics, 1993–94 to 2018–19, 36th edition
426

TABLE ACT 53AUSTRALIAN CAPITAL TERRITORY
REAL PER CAPITA GAMBLING EXPENDITURE
1993-94 1,268.30 141.53 - 1,409.831994-95 1,324.83 123.88 - 1,448.711995-96 1,244.50 138.86 - 1,383.361996-97 1,131.04 141.60 - 1,272.641997-98 1,184.14 140.19 - 1,324.331998-99 1,298.12 151.40 - 1,449.521999-00 1,330.22 134.78 - 1,465.002000-01 1,317.92 149.83 - 1,467.752001-02 1,294.76 135.20 2.54 1,432.502002-03 1,303.53 130.05 2.58 1,436.162003-04 1,311.41 140.21 - 1,451.622004-05 1,229.53 139.32 - 1,368.862005-06 1,211.50 142.39 - 1,353.892006-07 1,117.21 138.54 - 1,255.742007-08 1,029.00 130.64 - 1,159.632008-09 973.98 126.35 - 1,100.332009-10 931.58 117.75 - 1,049.332010-11 901.95 103.74 - 1,005.682011-12 872.40 97.36 - 969.762012-13 825.54 90.80 - 916.332013-14 762.47 82.95 - 845.422014-15 726.70 78.15 - 804.852015-16 720.52 67.01 - 787.542016-17 738.09 57.68 - 795.782017-18 710.98 50.38 - 761.362018-19 693.53 51.31 - 744.84
Notes: These data should be read in conjunction with the explanatory notes.
Figure(s) may be incomplete for any period due to some unavailable expenditure figures that are used to derive these numbers.
Value ($)
GAMING RACING SPORTSBETTING TOTAL GAMBLING
Australian Gambling Statistics, 1993–94 to 2018–19, 36th edition
427

TABLE ACT 54AUSTRALIAN CAPITAL TERRITORY
GAMBLING EXPENDITUREAS A % OF HDI
1993-94 1.999 0.223 - 2.2221994-95 2.089 0.195 - 2.2841995-96 1.999 0.223 - 2.2221996-97 1.778 0.223 - 2.0011997-98 1.850 0.219 - 2.0691998-99 1.968 0.229 - 2.1971999-00 1.886 0.191 - 2.0782000-01 1.731 0.197 - 1.9282001-02 1.739 0.182 0.003 1.9242002-03 1.628 0.162 0.003 1.7932003-04 1.595 0.170 - 1.7652004-05 1.444 0.164 - 1.6072005-06 1.403 0.165 - 1.5682006-07 1.231 0.153 - 1.3842007-08 1.067 0.135 - 1.2022008-09 0.961 0.125 - 1.0862009-10 0.893 0.113 - 1.0052010-11 0.810 0.093 - 0.9032011-12 0.751 0.084 - 0.8352012-13 0.681 0.075 - 0.7562013-14 0.640 0.070 - 0.7092014-15 0.623 0.067 - 0.6902015-16 0.621 0.058 - 0.6782016-17 0.632 0.049 - 0.6812017-18 0.622 0.044 - 0.6662018-19 0.607 0.045 - 0.652
Notes: These data should be read in conjunction with the explanatory notes.
Figure(s) may be incomplete for any period due to some unavailable expenditure figures that are used to derive these numbers.
RACING SPORTSBETTING TOTAL GAMBLING
Percentage (%)
GAMING
Australian Gambling Statistics, 1993–94 to 2018–19, 36th edition
428

TABLE ACT 55AUSTRALIAN CAPITAL TERRITORY
GAMBLING EXPENDITUREAS A % OF TOTAL GAMBLING EXPENDITURE
1993-94 89.96 10.04 -1994-95 91.45 8.55 -1995-96 89.96 10.04 -1996-97 88.87 11.13 -1997-98 89.41 10.59 -1998-99 89.56 10.44 -1999-00 90.80 9.20 -2000-01 89.79 10.21 -2001-02 90.39 9.44 0.182002-03 90.77 9.06 0.182003-04 90.34 9.66 -2004-05 89.82 10.18 -2005-06 89.48 10.52 -2006-07 88.97 11.03 -2007-08 88.73 11.27 -2008-09 88.52 11.48 -2009-10 88.78 11.22 -2010-11 89.68 10.32 -2011-12 89.96 10.04 -2012-13 90.09 9.91 -2013-14 90.19 9.81 -2014-15 90.29 9.71 -2015-16 91.49 8.51 -2016-17 92.75 7.25 -2017-18 93.38 6.62 -2018-19 93.11 6.89 -
Notes: These data should be read in conjunction with the explanatory notes.
Figure(s) may be incomplete for any period due to some unavailable expenditure figures that are used to derive these numbers.
Percentage (%)
GAMING RACING SPORTSBETTING
Australian Gambling Statistics, 1993–94 to 2018–19, 36th edition
429

TABLE ACT 56AUSTRALIAN CAPITAL TERRITORY
GOVERNMENT REVENUE FROM GAMBLING
1993-94 41.553 5.856 - 47.4091994-95 46.211 5.518 - 51.7291995-96 46.257 6.709 0.039 53.0051996-97 42.383 3.867 0.116 46.3661997-98 44.412 5.783 0.133 50.3281998-99 49.744 4.547 0.193 54.4841999-00 56.891 4.369 0.808 62.0682000-01 44.939 1.874 0.928 47.7412001-02 42.355 1.497 1.196 45.0482002-03 44.911 1.626 1.448 47.9852003-04 49.944 5.351 0.848 56.1432004-05 48.039 7.159 0.743 55.9412005-06 46.467 6.000 0.658 53.1252006-07 46.813 6.800 0.512 54.1252007-08 50.774 8.551 0.466 59.7912008-09 50.725 5.689 0.247 56.6612009-10 51.077 8.555 0.324 59.9562010-11 51.097 1.217 0.384 52.6982011-12 51.955 1.349 - 53.3042012-13 52.842 3.979 0.003 56.8242013-14 50.719 4.161 0.009 54.8892014-15 49.761 - 0.004 49.7652015-16 50.387 - - 50.3872016-17 49.722 - - 49.7222017-18 48.895 - - 48.8952018-19 51.683 - - 51.683
Notes: These data should be read in conjunction with the explanatory notes.
Figure(s) may be incomplete for any period due to some unavailable revenue figures that are used to derive these numbers.
Data for the gambling revenue received by states and territories from 1 July 2000 onwards are not comparable
with that of preceding years because of the impact of changes brought about by the introduction of the GST.
Value ($ million)
GAMING RACING SPORTSBETTING TOTAL GAMBLING
Australian Gambling Statistics, 1993–94 to 2018–19, 36th edition
430

TABLE ACT 57AUSTRALIAN CAPITAL TERRITORY
REAL GOVERNMENT REVENUE FROM GAMBLING
1993-94 77.218 10.882 - 88.1001994-95 83.165 9.931 - 93.0961995-96 79.848 11.581 0.067 91.4961996-97 72.178 6.585 0.198 78.9611997-98 75.633 9.848 0.226 85.7081998-99 83.714 7.652 0.325 91.6911999-00 93.534 7.183 1.328 102.0462000-01 69.668 2.905 1.439 74.0122001-02 63.840 2.256 1.803 67.8992002-03 65.697 2.379 2.118 70.1932003-04 71.322 7.641 1.211 80.1742004-05 67.008 9.986 1.036 78.0302005-06 62.819 8.111 0.890 71.8192006-07 61.466 8.928 0.672 71.0662007-08 64.514 10.865 0.592 75.9712008-09 62.502 7.010 0.304 69.8172009-10 61.476 10.297 0.390 72.1622010-11 59.674 1.421 0.448 61.5442011-12 59.281 1.539 - 60.8202012-13 58.937 4.438 0.003 63.3782013-14 55.115 4.522 0.010 59.6462014-15 53.162 - 0.004 53.1672015-16 53.085 - - 53.0852016-17 51.482 - - 51.4822017-18 49.679 - - 49.6792018-19 51.683 - - 51.683
Notes: These data should be read in conjunction with the explanatory notes.
Figure(s) may be incomplete for any period due to some unavailable revenue figures that are used to derive these numbers.
Data for the gambling revenue received by states and territories from 1 July 2000 onwards are not comparable
with that of preceding years because of the impact of changes brought about by the introduction of the GST.
Value ($ million)
GAMING RACING SPORTSBETTING TOTAL GAMBLING
Australian Gambling Statistics, 1993–94 to 2018–19, 36th edition
431

TABLE ACT 58AUSTRALIAN CAPITAL TERRITORY
PER CAPITA REVENUE FROM GAMBLING
1993-94 190.18 26.80 - 216.981994-95 208.43 24.89 - 233.321995-96 205.21 29.76 0.17 235.141996-97 185.77 16.95 0.51 203.231997-98 193.13 25.15 0.58 218.851998-99 214.08 19.57 0.83 234.471999-00 241.61 18.55 3.43 263.592000-01 187.73 7.83 3.88 199.442001-02 174.02 6.15 4.91 185.092002-03 181.86 6.58 5.86 194.312003-04 199.81 21.41 3.39 224.622004-05 190.05 28.32 2.94 221.312005-06 181.23 23.40 2.57 207.192006-07 179.01 26.00 1.96 206.972007-08 190.02 32.00 1.74 223.772008-09 186.01 20.86 0.91 207.782009-10 183.25 30.69 1.16 215.112010-11 179.47 4.27 1.35 185.092011-12 178.69 4.64 - 183.332012-13 178.23 13.42 0.01 191.662013-14 168.53 13.83 0.03 182.392014-15 162.87 - 0.01 162.882015-16 162.05 - - 162.052016-17 156.81 - - 156.812017-18 150.99 - - 150.992018-19 156.90 - - 156.90
Notes: These data should be read in conjunction with the explanatory notes.
Figure(s) may be incomplete for any period due to some unavailable revenue figures that are used to derive these numbers.
Data for the gambling revenue received by states and territories from 1 July 2000 onwards are not comparable
with that of preceding years because of the impact of changes brought about by the introduction of the GST.
Value ($)
GAMING RACING SPORTSBETTING TOTAL GAMBLING
Australian Gambling Statistics, 1993–94 to 2018–19, 36th edition
432

TABLE ACT 59AUSTRALIAN CAPITAL TERRITORY
REAL PER CAPITA REVENUE FROM GAMBLING
1993-94 353.40 49.80 - 403.211994-95 375.11 44.79 - 419.901995-96 354.22 51.38 0.30 405.901996-97 316.37 28.87 0.87 346.101997-98 328.89 42.83 0.98 372.711998-99 360.27 32.93 1.40 394.591999-00 397.22 30.51 5.64 433.372000-01 291.03 12.14 6.01 309.182001-02 262.30 9.27 7.41 278.972002-03 266.03 9.63 8.58 284.242003-04 285.34 30.57 4.84 320.762004-05 265.10 39.51 4.10 308.702005-06 245.00 31.64 3.47 280.102006-07 235.04 34.14 2.57 271.762007-08 241.45 40.66 2.22 284.322008-09 229.20 25.71 1.12 256.022009-10 220.56 36.94 1.40 258.902010-11 209.59 4.99 1.58 216.162011-12 203.88 5.29 - 209.182012-13 198.78 14.97 0.01 213.762013-14 183.14 15.02 0.03 198.192014-15 174.00 - 0.01 174.022015-16 170.73 - - 170.732016-17 162.36 - - 162.362017-18 153.41 - - 153.412018-19 156.90 - - 156.90
Notes: These data should be read in conjunction with the explanatory notes.
Figure(s) may be incomplete for any period due to some unavailable revenue figures that are used to derive these numbers.
Data for the gambling revenue received by states and territories from 1 July 2000 onwards are not comparable
with that of preceding years because of the impact of changes brought about by the introduction of the GST.
Value ($)
GAMING RACING SPORTSBETTING TOTAL GAMBLING
Australian Gambling Statistics, 1993–94 to 2018–19, 36th edition
433
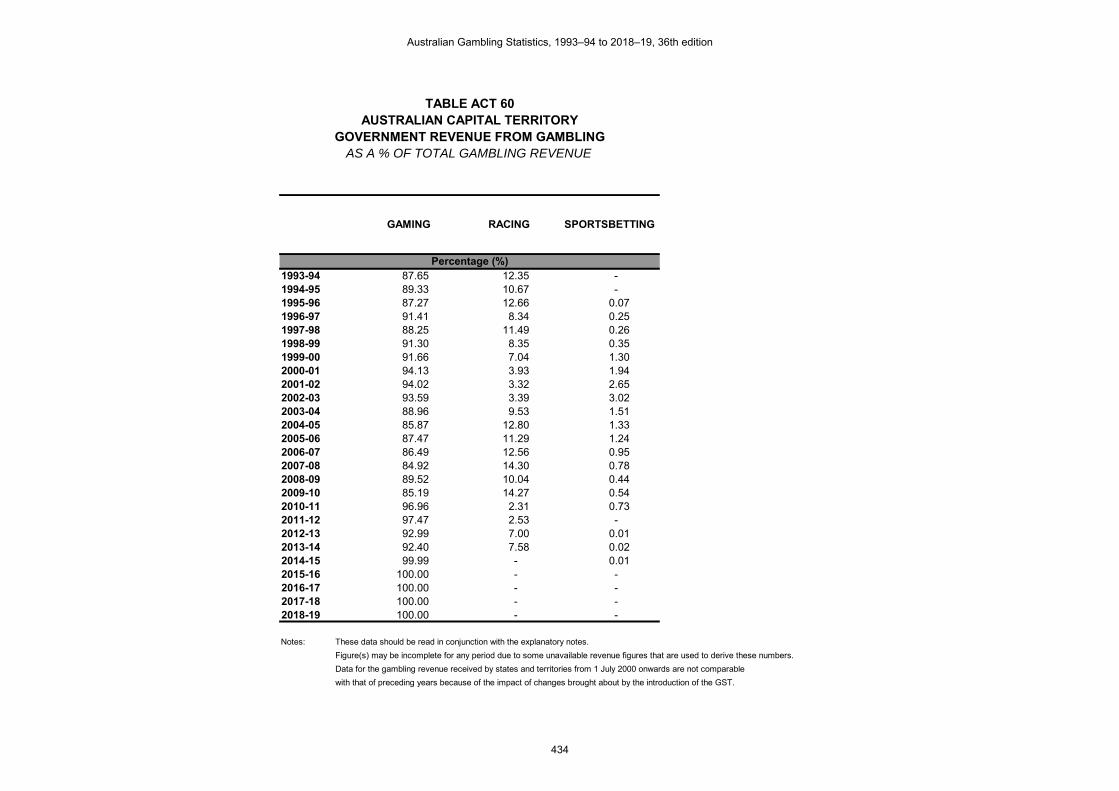
TABLE ACT 60AUSTRALIAN CAPITAL TERRITORY
GOVERNMENT REVENUE FROM GAMBLINGAS A % OF TOTAL GAMBLING REVENUE
1993-94 87.65 12.35 -1994-95 89.33 10.67 -1995-96 87.27 12.66 0.071996-97 91.41 8.34 0.251997-98 88.25 11.49 0.261998-99 91.30 8.35 0.351999-00 91.66 7.04 1.302000-01 94.13 3.93 1.942001-02 94.02 3.32 2.652002-03 93.59 3.39 3.022003-04 88.96 9.53 1.512004-05 85.87 12.80 1.332005-06 87.47 11.29 1.242006-07 86.49 12.56 0.952007-08 84.92 14.30 0.782008-09 89.52 10.04 0.442009-10 85.19 14.27 0.542010-11 96.96 2.31 0.732011-12 97.47 2.53 -2012-13 92.99 7.00 0.012013-14 92.40 7.58 0.022014-15 99.99 - 0.012015-16 100.00 - -2016-17 100.00 - -2017-18 100.00 - -2018-19 100.00 - -
Notes: These data should be read in conjunction with the explanatory notes.
Figure(s) may be incomplete for any period due to some unavailable revenue figures that are used to derive these numbers.
Data for the gambling revenue received by states and territories from 1 July 2000 onwards are not comparable
with that of preceding years because of the impact of changes brought about by the introduction of the GST.
Percentage (%)
GAMING RACING SPORTSBETTING
Australian Gambling Statistics, 1993–94 to 2018–19, 36th edition
434

TABLE ACT 61AUSTRALIAN CAPITAL TERRITORY
GAMING MACHINES OPERATING AS AT 30 JUNE
2001-02 - 4,910 60 4,970 2002-03 - 4,960 60 5,020 2003-04 - 4,930 70 5,000 2004-05 - 5,056 88 5,144 2005-06 - 5,066 84 5,150 2006-07 - 5,097 82 5,179 2007-08 - 5,087 72 5,159 2008-09 - 5,085 72 5,157 2009-10 - 5,014 70 5,084 2010-11 - 4,954 70 5,024 2011-12 - 4,918 68 4,986 2012-13 - 4,906 68 4,974 2013-14 - 4,906 68 4,974 2014-15 - 4,956 66 5,022 2015-16 - 4,585 50 4,635 2016-17 - 4,502 50 4,552 2017-18 - 4,412 50 4,462 2018-19 - 3,823 50 3,873
Notes: These data should be read in conjunction with the explanatory notes.
NA = Not applicable
NUMBER
CASINOS(NA)
CLUBS HOTELS TOTAL MACHINES
Australian Gambling Statistics, 1993–94 to 2018–19, 36th edition
435

TABLE NT 1NORTHERN TERRITORY
TOTAL RACING TURNOVER
1993-94 - 20.037 6.172 60.634 86.8431994-95 - 25.317 7.628 69.235 102.1801995-96 - 67.867 10.693 72.000 150.5601996-97 - 63.919 13.700 87.900 165.5191997-98 - 73.636 12.232 74.095 159.9631998-99 - 90.567 16.563 70.240 177.3701999-00 - 99.284 16.163 67.819 183.2662000-01 - 190.851 13.663 70.796 275.3102001-02 - 525.683 17.193 76.987 619.8632002-03 - 835.720 18.100 86.119 939.9392003-04 - 1,097.880 17.982 91.337 1,207.1992004-05 - 1,533.900 12.543 101.914 1,648.3572005-06 - 1,769.852 15.020 106.722 1,891.5942006-07 - 2,728.782 13.896 128.750 2,871.4282007-08 - 3,023.818 11.387 135.071 3,170.2762008-09 - 3,521.731 15.303 148.758 3,685.7922009-10 - 3,925.390 18.515 134.762 4,078.6682010-11 - 4,068.233 17.151 118.570 4,203.9542011-12 - 4,224.384 19.178 118.183 4,361.7452012-13 - 4,950.365 15.484 106.039 5,071.8882013-14 - 5,764.289 13.336 99.514 5,877.1392014-15 - 6,301.958 12.341 65.466 6,379.7652015-16 - 7,201.813 8.000 76.200 7,286.0132016-17 - 10,576.576 5.200 63.200 10,644.9762017-18 - 12,621.973 4.216 E 59.149 12,685.3382018-19 - 14,521.838 3.267 48.403 14,573.508
Notes: These data should be read in conjunction with the explanatory notes.
(1) Off-course bookmaker racing turnover is included in on-course bookmaker racing turnover.
(2) Includes figures from corporate bookmakers and registered on-course bookmakers.
E = Estimated data
TOTAL RACING
Value ($ million)
BOOKMAKERS OFF COURSE (1)
BOOKMAKERS ON COURSE
(2)
ON-COURSE TOTALISATOR
TAB
Australian Gambling Statistics, 1993–94 to 2018–19, 36th edition
436

TABLE NT 2NORTHERN TERRITORY
REAL RACING TURNOVER
1993-94 - 37.235 11.469 112.677 161.3811994-95 - 45.563 13.728 124.601 183.8921995-96 - 117.150 18.458 124.284 259.8931996-97 - 108.853 23.331 149.692 281.8761997-98 - 125.401 20.831 126.183 272.4151998-99 - 152.414 27.874 118.206 298.4941999-00 - 163.232 26.573 111.501 301.3062000-01 - 295.871 21.181 109.753 426.8052001-02 - 792.344 25.914 116.040 934.2982002-03 - 1,222.508 26.477 125.977 1,374.9622003-04 - 1,567.811 25.679 130.432 1,723.9222004-05 - 2,139.584 17.496 142.156 2,299.2362005-06 - 2,392.656 20.305 144.277 2,557.2382006-07 - 3,582.900 18.245 169.049 3,770.1952007-08 - 3,842.067 14.468 171.621 4,028.1572008-09 - 4,339.412 18.856 183.297 4,541.5642009-10 - 4,724.547 22.285 162.198 4,909.0302010-11 - 4,751.130 20.030 138.473 4,909.6332011-12 - 4,820.023 21.882 134.846 4,976.7512012-13 - 5,521.375 17.270 118.270 5,656.9152013-14 - 6,263.861 14.492 108.139 6,386.4912014-15 - 6,732.709 13.185 69.941 6,815.8352015-16 - 7,587.506 8.428 80.281 7,676.2152016-17 - 10,950.883 5.384 65.437 11,021.7042017-18 - 12,824.284 4.284 E 60.097 12,888.6652018-19 - 14,521.838 3.267 48.403 14,573.508
Notes: These data should be read in conjunction with the explanatory notes.
(1) Off-course bookmaker racing turnover is included in on-course bookmaker racing turnover.
(2) Includes figures from corporate bookmakers and registered on-course bookmakers.
E = Estimated data
TOTAL RACING
Value ($ million)
BOOKMAKERS OFF COURSE (1)
BOOKMAKERS ON COURSE
(2)
ON-COURSE TOTALISATOR
TAB
Australian Gambling Statistics, 1993–94 to 2018–19, 36th edition
437

TABLE NT 3NORTHERN TERRITORY
PER CAPITA RACING TURNOVER
1993-94 - 170.66 52.57 516.44 739.671994-95 - 209.89 63.24 574.00 847.141995-96 - 545.41 85.93 578.62 1,209.971996-97 - 497.96 106.73 684.78 1,289.471997-98 - 559.36 92.92 562.84 1,215.121998-99 - 674.29 123.31 522.95 1,320.551999-00 - 724.31 117.91 494.76 1,336.992000-01 - 1,368.64 97.98 507.69 1,974.312001-02 - 3,729.04 121.96 546.12 4,397.132002-03 - 5,909.11 127.98 608.92 6,646.012003-04 - 7,732.91 126.66 643.33 8,502.902004-05 - 10,652.08 87.10 707.74 11,446.922005-06 - 12,047.10 102.24 726.44 12,875.782006-07 - 18,141.21 92.38 855.94 19,089.532007-08 - 19,478.66 73.35 870.09 20,422.102008-09 - 21,895.73 95.14 924.88 22,915.752009-10 - 23,732.93 111.94 814.77 24,659.642010-11 - 24,209.48 102.07 705.59 25,017.132011-12 - 24,676.15 112.02 690.35 25,478.522012-13 - 28,096.98 87.88 601.85 28,786.712013-14 - 32,075.95 74.21 553.76 32,703.922014-15 - 34,741.53 68.03 360.90 35,170.472015-16 - 39,426.24 43.80 417.16 39,887.192016-17 - 57,558.97 28.30 343.94 57,931.212017-18 - 68,410.85 22.85 E 320.59 68,754.292018-19 - 78,853.18 17.74 262.83 79,133.75
Notes: These data should be read in conjunction with the explanatory notes.
(1) Off-course bookmaker racing turnover is included in on-course bookmaker racing turnover.
(2) Includes figures from corporate bookmakers and registered on-course bookmakers.
E = Estimated data
TOTAL RACING
Value ($)
BOOKMAKERS OFF COURSE (1)
BOOKMAKERS ON COURSE
(2)
ON-COURSE TOTALISATOR
TAB
Australian Gambling Statistics, 1993–94 to 2018–19, 36th edition
438

TABLE NT 4NORTHERN TERRITORY
REAL PER CAPITA RACING TURNOVER
1993-94 - 317.14 97.69 959.70 1,374.531994-95 - 377.74 113.81 1,033.03 1,524.591995-96 - 941.47 148.34 998.81 2,088.611996-97 - 848.02 181.76 1,166.17 2,195.951997-98 - 952.58 158.24 958.51 2,069.331998-99 - 1,134.75 207.52 880.06 2,222.341999-00 - 1,190.84 193.86 813.44 2,198.142000-01 - 2,121.76 151.90 787.06 3,060.722001-02 - 5,620.66 183.83 823.15 6,627.642002-03 - 8,643.97 187.21 890.74 9,721.922003-04 - 11,042.87 180.87 918.70 12,142.442004-05 - 14,858.22 121.50 987.20 15,966.922005-06 - 16,286.43 138.22 982.07 17,406.722006-07 - 23,819.47 121.30 1,123.86 25,064.622007-08 - 24,749.61 93.20 1,105.54 25,948.352008-09 - 26,979.51 117.23 1,139.62 28,236.362009-10 - 28,564.63 134.73 980.65 29,680.022010-11 - 28,273.30 119.20 824.03 29,216.532011-12 - 28,155.49 127.82 787.69 29,071.002012-13 - 31,337.88 98.02 671.27 32,107.172013-14 - 34,855.87 80.64 601.75 35,538.262014-15 - 37,116.19 72.68 385.57 37,574.442015-16 - 41,537.71 46.14 439.50 42,023.342016-17 - 59,595.99 29.30 356.11 59,981.412017-18 - 69,507.37 23.22 E 325.72 69,856.322018-19 - 78,853.18 17.74 262.83 79,133.75
Notes: These data should be read in conjunction with the explanatory notes.
(1) Off-course bookmaker racing turnover is included in on-course bookmaker racing turnover.
(2) Includes figures from corporate bookmakers and registered on-course bookmakers.
E = Estimated data
TOTAL RACING
Value ($)
BOOKMAKERS OFF COURSE (1)
BOOKMAKERS ON COURSE
(2)
ON-COURSE TOTALISATOR
TAB
Australian Gambling Statistics, 1993–94 to 2018–19, 36th edition
439

TABLE NT 5NORTHERN TERRITORY
TOTAL RACING EXPENDITURE
1993-94 - 0.985 0.975 10.878 12.8381994-95 - 1.103 1.198 12.054 14.3551995-96 - 1.407 1.282 12.988 15.6771996-97 - 2.495 2.100 13.900 18.4951997-98 - 4.700 1.946 11.757 18.4031998-99 - 6.329 2.484 11.540 20.3531999-00 - 8.639 2.660 11.166 22.4652000-01 - 11.305 2.186 11.327 24.8182001-02 - 28.912 2.750 12.317 43.9792002-03 - 46.854 2.896 13.779 63.5292003-04 - 33.591 2.809 14.432 50.8322004-05 - 51.600 1.982 16.102 69.6842005-06 - 72.202 2.373 16.862 91.4372006-07 - 126.944 2.196 20.343 149.4832007-08 - 143.055 1.822 21.611 166.4882008-09 - 191.805 2.448 23.801 218.0552009-10 - 228.019 2.928 21.562 252.5092010-11 - 277.207 2.744 18.971 298.9222011-12 - 357.642 3.068 18.909 379.6202012-13 - 435.174 2.433 15.306 452.9132013-14 - 494.434 2.244 16.458 513.1372014-15 - 638.914 1.914 11.071 651.8992015-16 - 809.259 1.200 13.300 823.7592016-17 - 1,135.741 0.900 11.500 1,148.1412017-18 - 1,381.806 0.696 E 10.904 1,393.4062018-19 - 1,502.684 0.531 9.014 1,512.229
Notes: These data should be read in conjunction with the explanatory notes.
(1) Off-course bookmaker racing turnover is included in on-course bookmaker racing turnover.
(2) Includes figures from corporate bookmakers and registered on-course bookmakers.
E = Estimated data
TOTAL RACING
Value ($ million)
BOOKMAKERS OFF COURSE (1)
BOOKMAKERS ON COURSE
(2)
ON-COURSE TOTALISATOR
TAB
Australian Gambling Statistics, 1993–94 to 2018–19, 36th edition
440

TABLE NT 6NORTHERN TERRITORY
REAL RACING EXPENDITURE
1993-94 - 1.830 1.812 20.215 23.8571994-95 - 1.985 2.156 21.693 25.8341995-96 - 2.429 2.213 22.420 27.0611996-97 - 4.249 3.576 23.671 31.4971997-98 - 8.004 3.314 20.022 31.3401998-99 - 10.651 4.180 19.421 34.2521999-00 - 14.203 4.373 18.358 36.9352000-01 - 17.526 3.389 17.560 38.4752001-02 - 43.578 4.145 18.565 66.2882002-03 - 68.539 4.236 20.156 92.9322003-04 - 47.969 4.011 20.609 72.5902004-05 - 71.975 2.765 22.460 97.2002005-06 - 97.610 3.208 22.796 123.6132006-07 - 166.678 2.883 26.710 196.2722007-08 - 181.766 2.315 27.459 211.5402008-09 - 236.339 3.017 29.327 268.6832009-10 - 274.440 3.524 25.952 303.9162010-11 - 323.739 3.205 22.156 349.0992011-12 - 408.070 3.501 21.575 433.1462012-13 - 485.370 2.714 17.071 505.1552013-14 - 537.285 2.439 17.885 557.6092014-15 - 682.585 2.045 11.828 696.4572015-16 - 852.599 1.264 14.012 867.8752016-17 - 1,175.936 0.932 11.907 1,188.7742017-18 - 1,403.954 0.707 E 11.079 1,415.7402018-19 - 1,502.684 0.531 9.014 1,512.229
Notes: These data should be read in conjunction with the explanatory notes.
(1) Off-course bookmaker racing turnover is included in on-course bookmaker racing turnover.
(2) Includes figures from corporate bookmakers and registered on-course bookmakers.
E = Estimated data
TOTAL RACING
Value ($ million)
BOOKMAKERS OFF COURSE (1)
BOOKMAKERS ON COURSE
(2)
ON-COURSE TOTALISATOR
TAB
Australian Gambling Statistics, 1993–94 to 2018–19, 36th edition
441

TABLE NT 7NORTHERN TERRITORY
PER CAPITA RACING EXPENDITURE
1993-94 - 8.39 8.30 92.65 109.351994-95 - 9.14 9.93 99.94 119.011995-96 - 11.31 10.30 104.38 125.991996-97 - 19.44 16.36 108.29 144.081997-98 - 35.70 14.78 89.31 139.791998-99 - 47.12 18.49 85.92 151.531999-00 - 63.02 19.41 81.46 163.892000-01 - 81.07 15.68 81.23 177.982001-02 - 205.09 19.51 87.37 311.972002-03 - 331.29 20.48 97.43 449.192003-04 - 236.60 19.79 101.65 358.032004-05 - 358.33 13.76 111.82 483.922005-06 - 491.47 16.15 114.78 622.402006-07 - 843.94 14.60 135.24 993.782007-08 - 921.52 11.74 139.21 1,072.472008-09 - 1,192.51 15.22 147.98 1,355.722009-10 - 1,378.60 17.70 130.36 1,526.672010-11 - 1,649.62 16.33 112.89 1,778.842011-12 - 2,089.12 17.92 110.46 2,217.502012-13 - 2,469.93 13.81 86.87 2,570.622013-14 - 2,751.33 12.49 91.58 2,855.402014-15 - 3,522.21 10.55 61.03 3,593.802015-16 - 4,430.28 6.57 72.81 4,509.662016-17 - 6,180.84 4.90 62.58 6,248.322017-18 - 7,489.36 3.77 E 59.10 7,552.232018-19 - 8,159.53 2.88 48.95 8,211.36
Notes: These data should be read in conjunction with the explanatory notes.
(1) Off-course bookmaker racing turnover is included in on-course bookmaker racing turnover.
(2) Includes figures from corporate bookmakers and registered on-course bookmakers.
E = Estimated data
TOTAL RACING
Value ($)
BOOKMAKERS OFF COURSE (1)
BOOKMAKERS ON COURSE
(2)
ON-COURSE TOTALISATOR
TAB
Australian Gambling Statistics, 1993–94 to 2018–19, 36th edition
442
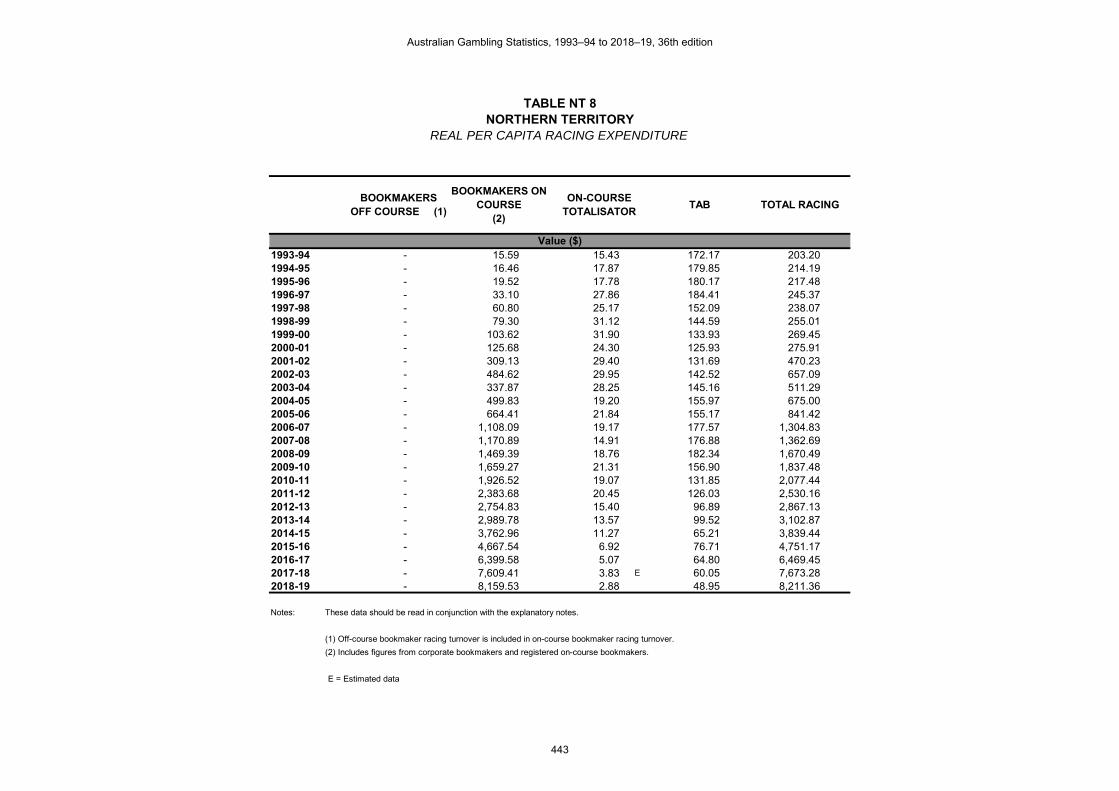
TABLE NT 8NORTHERN TERRITORY
REAL PER CAPITA RACING EXPENDITURE
1993-94 - 15.59 15.43 172.17 203.201994-95 - 16.46 17.87 179.85 214.191995-96 - 19.52 17.78 180.17 217.481996-97 - 33.10 27.86 184.41 245.371997-98 - 60.80 25.17 152.09 238.071998-99 - 79.30 31.12 144.59 255.011999-00 - 103.62 31.90 133.93 269.452000-01 - 125.68 24.30 125.93 275.912001-02 - 309.13 29.40 131.69 470.232002-03 - 484.62 29.95 142.52 657.092003-04 - 337.87 28.25 145.16 511.292004-05 - 499.83 19.20 155.97 675.002005-06 - 664.41 21.84 155.17 841.422006-07 - 1,108.09 19.17 177.57 1,304.832007-08 - 1,170.89 14.91 176.88 1,362.692008-09 - 1,469.39 18.76 182.34 1,670.492009-10 - 1,659.27 21.31 156.90 1,837.482010-11 - 1,926.52 19.07 131.85 2,077.442011-12 - 2,383.68 20.45 126.03 2,530.162012-13 - 2,754.83 15.40 96.89 2,867.132013-14 - 2,989.78 13.57 99.52 3,102.872014-15 - 3,762.96 11.27 65.21 3,839.442015-16 - 4,667.54 6.92 76.71 4,751.172016-17 - 6,399.58 5.07 64.80 6,469.452017-18 - 7,609.41 3.83 E 60.05 7,673.282018-19 - 8,159.53 2.88 48.95 8,211.36
Notes: These data should be read in conjunction with the explanatory notes.
(1) Off-course bookmaker racing turnover is included in on-course bookmaker racing turnover.
(2) Includes figures from corporate bookmakers and registered on-course bookmakers.
E = Estimated data
TOTAL RACING
Value ($)
BOOKMAKERS OFF COURSE (1)
BOOKMAKERS ON COURSE
(2)
ON-COURSE TOTALISATOR
TAB
Australian Gambling Statistics, 1993–94 to 2018–19, 36th edition
443

TABLE NT 9NORTHERN TERRITORYRACING EXPENDITURE
AS A % OF HDI
1993-94 - 0.037 0.037 0.409 0.4831994-95 - 0.036 0.039 0.396 0.4721995-96 - 0.043 0.039 0.393 0.4751996-97 - 0.071 0.060 0.397 0.5281997-98 - 0.132 0.055 0.330 0.5161998-99 - 0.163 0.064 0.296 0.5231999-00 - 0.199 0.061 0.257 0.5182000-01 - 0.234 0.045 0.234 0.5132001-02 - 0.543 0.052 0.231 0.8262002-03 - 0.885 0.055 0.260 1.1992003-04 - 0.598 0.050 0.257 0.9052004-05 - 0.808 0.031 0.252 1.0912005-06 - 1.007 0.033 0.235 1.2752006-07 - 1.642 0.028 0.263 1.9332007-08 - 1.683 0.021 0.254 1.9582008-09 - 2.004 0.026 0.249 2.2782009-10 - 2.172 0.028 0.205 2.4052010-11 - 2.488 0.025 0.170 2.6832011-12 - 2.989 0.026 0.158 3.1722012-13 - 3.398 0.019 0.120 3.5362013-14 - 3.552 0.016 0.118 3.6872014-15 - 4.263 0.013 0.074 4.3502015-16 - 5.217 0.008 0.086 5.3112016-17 - 7.158 0.006 0.072 7.2362017-18 - 8.601 0.004 E 0.068 8.6742018-19 - 9.605 0.003 0.058 9.666
Notes: These data should be read in conjunction with the explanatory notes.
(1) Off-course bookmaker racing turnover is included in on-course bookmaker racing turnover.
(2) Includes figures from corporate bookmakers and registered on-course bookmakers.
E = Estimated data
Percentage (%)
BOOKMAKERS OFF COURSE (1)
BOOKMAKERS ON COURSE
(2)
ON-COURSE TOTALISATOR
TAB TOTAL RACING
Australian Gambling Statistics, 1993–94 to 2018–19, 36th edition
444

TABLE NT 10NORTHERN TERRITORYRACING EXPENDITURE
SHARE OF MARKET
1993-94 - 7.67 7.59 84.731994-95 - 7.68 8.35 83.971995-96 - 8.97 8.18 82.851996-97 - 13.49 11.35 75.161997-98 - 25.54 10.57 63.891998-99 - 31.10 12.20 56.701999-00 - 38.46 11.84 49.702000-01 - 45.55 8.81 45.642001-02 - 65.74 6.25 28.012002-03 - 73.75 4.56 21.692003-04 - 66.08 5.53 28.392004-05 - 74.05 2.84 23.112005-06 - 78.96 2.60 18.442006-07 - 84.92 1.47 13.612007-08 - 85.93 1.09 12.982008-09 - 87.96 1.12 10.922009-10 - 90.30 1.16 8.542010-11 - 92.74 0.92 6.352011-12 - 94.21 0.81 4.982012-13 - 96.08 0.54 3.382013-14 - 96.36 0.44 3.212014-15 - 98.01 0.29 1.702015-16 - 98.24 0.15 1.612016-17 - 98.92 0.08 1.002017-18 - 99.17 0.05 E 0.782018-19 - 99.37 0.04 0.60
Notes: These data should be read in conjunction with the explanatory notes.
(1) Off-course bookmaker racing turnover is included in on-course bookmaker racing turnover.
(2) Includes figures from corporate bookmakers and registered on-course bookmakers.
E = Estimated data
ON-COURSE TOTALISATOR
TAB
Percentage (%)
BOOKMAKERS OFF COURSE (1)
BOOKMAKERS ON COURSE
(2)
Australian Gambling Statistics, 1993–94 to 2018–19, 36th edition
445

TABLE NT 11NORTHERN TERRITORY
GOVERNMENT REVENUE FROM RACING
1993-94 0.294 - 1.990 2.2841994-95 0.389 - 2.340 2.7291995-96 1.048 - 2.432 3.4801996-97 0.979 - 2.547 3.5261997-98 1.092 - 2.390 3.4821998-99 1.311 - 3.054 4.3651999-00 1.491 - 5.223 6.7142000-01 1.467 - 5.440 6.9072001-02 2.070 0.825 3.695 6.5902002-03 2.928 0.868 4.134 7.9302003-04 3.366 0.843 4.330 8.5392004-05 4.971 0.595 4.831 10.3972005-06 5.748 0.712 5.059 11.5192006-07 8.971 0.659 6.103 15.7332007-08 9.899 0.729 8.664 19.2922008-09 10.654 0.979 9.520 21.1532009-10 6.075 (1) 0.948 8.848 15.8712010-11 2.242 (2) 0.878 6.071 9.1902011-12 2.372 0.982 6.051 9.4052012-13 2.414 0.556 3.499 6.4692013-14 2.718 0.482 3.534 6.7342014-15 4.811 0.765 4.428 10.0042015-16 5.234 0.157 1.743 7.1342016-17 5.652 (3) 0.094 1.206 6.9522017-18 7.531 R 0.033 E 0.521 8.085 R
2018-19 7.327 0.017 0.315 7.659
Notes: These data should be read in conjunction with the explanatory notes.
Data for the gambling revenue received by states and territories from 1 July 2000 onwards are not comparable
with that of preceding years because of the impact of changes brought about by the introduction of the GST.
(1) Changes in taxes payable by bookmakers were introduced in January 2010.
(2) Gross profit tax is not based on turnover and is capped. Therefore this cannot be determined
as relative to racing or sports. As a consequence, all revenue is reported as racing revenue.
(3) Includes revenue from Betting Exchange Operators for both Racing and Sports categories.
E = Estimated data
R = Revised data
Value ($ million)
BOOKMAKERSON-COURSE
TOTALISATORTAB TOTAL RACING
Australian Gambling Statistics, 1993–94 to 2018–19, 36th edition
446

TABLE NT 12NORTHERN TERRITORY
REAL GOVERNMENT REVENUE FROM RACING
1993-94 0.546 - 3.698 4.2441994-95 0.700 - 4.211 4.9111995-96 1.809 - 4.198 6.0071996-97 1.667 - 4.338 6.0051997-98 1.860 - 4.070 5.9301998-99 2.206 - 5.140 7.3461999-00 2.451 - 8.587 11.0382000-01 2.274 - 8.433 10.7082001-02 3.120 1.243 5.569 9.9332002-03 4.283 1.270 6.047 11.6002003-04 4.807 1.204 6.183 12.1942004-05 6.934 0.830 6.739 14.5022005-06 7.770 0.963 6.839 15.5722006-07 11.779 0.865 8.013 20.6572007-08 12.578 0.926 11.008 24.5122008-09 13.128 1.206 11.730 26.0642009-10 7.312 (1) 1.141 10.649 19.1022010-11 2.618 (2) 1.026 7.090 10.7332011-12 2.706 1.120 6.904 10.7312012-13 2.692 0.620 3.903 7.2152013-14 2.954 0.524 3.840 7.3172014-15 5.139 0.818 4.730 10.6872015-16 5.514 0.166 1.836 7.5162016-17 5.852 (3) 0.098 1.248 7.1982017-18 7.652 R 0.034 E 0.529 8.215 R
2018-19 7.327 0.017 0.315 7.659
Notes: These data should be read in conjunction with the explanatory notes.
Data for the gambling revenue received by states and territories from 1 July 2000 onwards are not comparable
with that of preceding years because of the impact of changes brought about by the introduction of the GST.
(1) Changes in taxes payable by bookmakers were introduced in January 2010.
(2) Gross profit tax is not based on turnover and is capped. Therefore this cannot be determined
as relative to racing or sports. As a consequence, all revenue is reported as racing revenue.
(3) Includes revenue from Betting Exchange Operators for both Racing and Sports categories.
E = Estimated data
R = Revised data
Value ($ million)
BOOKMAKERSON-COURSE
TOTALISATORTAB TOTAL RACING
Australian Gambling Statistics, 1993–94 to 2018–19, 36th edition
447

TABLE NT 13NORTHERN TERRITORY
PER CAPITA REVENUE FROM RACING
1993-94 2.50 - 16.95 19.451994-95 3.23 - 19.40 22.631995-96 8.42 - 19.54 27.971996-97 7.63 - 19.84 27.471997-98 8.30 - 18.16 26.451998-99 9.76 - 22.74 32.501999-00 10.88 - 38.10 48.982000-01 10.52 - 39.01 49.532001-02 14.68 5.85 26.21 46.752002-03 20.70 6.14 29.23 56.072003-04 23.71 5.94 30.50 60.142004-05 34.52 4.13 33.55 72.202005-06 39.12 4.85 34.44 78.412006-07 59.64 4.38 40.57 104.592007-08 63.77 4.70 55.81 124.272008-09 66.24 6.09 59.19 131.512009-10 36.73 (1) 5.73 53.50 95.962010-11 13.34 (2) 5.23 36.13 54.692011-12 13.86 5.74 35.35 54.942012-13 13.70 3.16 19.86 36.722013-14 15.12 2.68 19.66 37.472014-15 26.52 4.22 24.41 55.152015-16 28.65 0.86 9.54 39.052016-17 30.76 (3) 0.51 6.56 37.832017-18 40.82 R 0.18 E 2.82 43.82 R
2018-19 39.79 0.09 1.71 41.59
Notes: These data should be read in conjunction with the explanatory notes.
Data for the gambling revenue received by states and territories from 1 July 2000 onwards are not comparable
with that of preceding years because of the impact of changes brought about by the introduction of the GST.
(1) Changes in taxes payable by bookmakers were introduced in January 2010.
(2) Gross profit tax is not based on turnover and is capped. Therefore this cannot be determined
as relative to racing or sports. As a consequence, all revenue is reported as racing revenue.
(3) Includes revenue from Betting Exchange Operators for both Racing and Sports categories.
E = Estimated data
R = Revised data
Value ($)
BOOKMAKERSON-COURSE
TOTALISATORTAB TOTAL RACING
Australian Gambling Statistics, 1993–94 to 2018–19, 36th edition
448
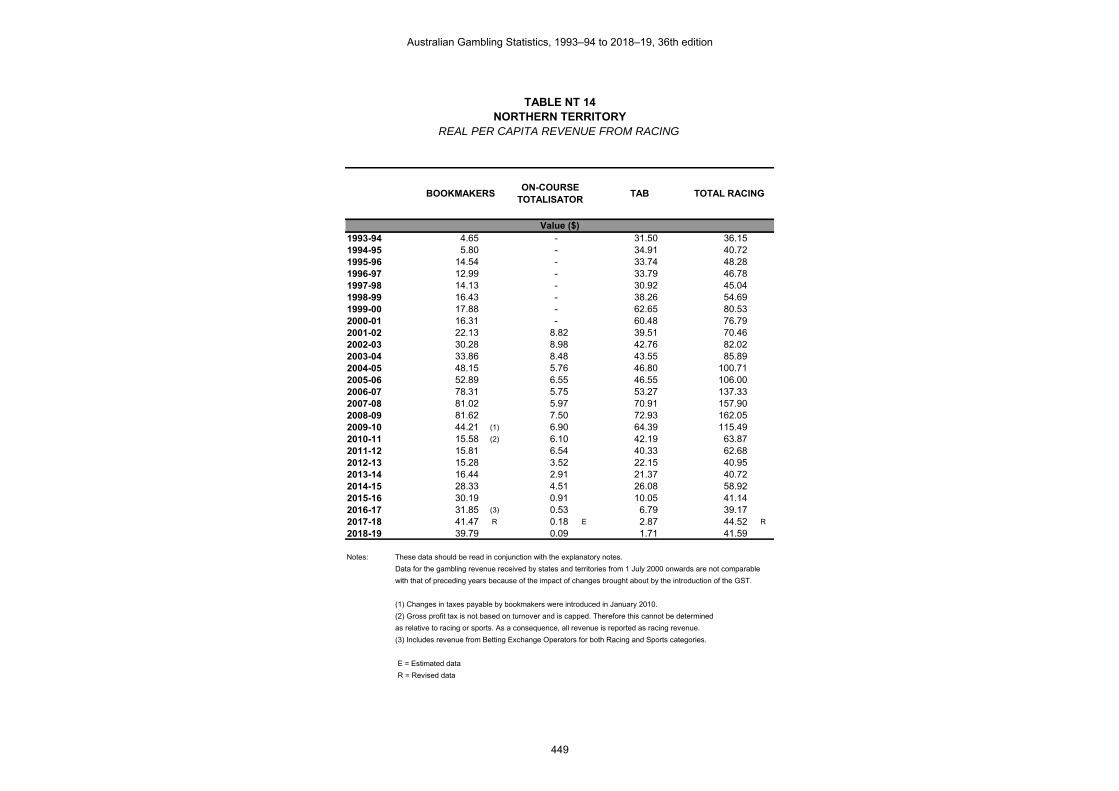
TABLE NT 14NORTHERN TERRITORY
REAL PER CAPITA REVENUE FROM RACING
1993-94 4.65 - 31.50 36.151994-95 5.80 - 34.91 40.721995-96 14.54 - 33.74 48.281996-97 12.99 - 33.79 46.781997-98 14.13 - 30.92 45.041998-99 16.43 - 38.26 54.691999-00 17.88 - 62.65 80.532000-01 16.31 - 60.48 76.792001-02 22.13 8.82 39.51 70.462002-03 30.28 8.98 42.76 82.022003-04 33.86 8.48 43.55 85.892004-05 48.15 5.76 46.80 100.712005-06 52.89 6.55 46.55 106.002006-07 78.31 5.75 53.27 137.332007-08 81.02 5.97 70.91 157.902008-09 81.62 7.50 72.93 162.052009-10 44.21 (1) 6.90 64.39 115.492010-11 15.58 (2) 6.10 42.19 63.872011-12 15.81 6.54 40.33 62.682012-13 15.28 3.52 22.15 40.952013-14 16.44 2.91 21.37 40.722014-15 28.33 4.51 26.08 58.922015-16 30.19 0.91 10.05 41.142016-17 31.85 (3) 0.53 6.79 39.172017-18 41.47 R 0.18 E 2.87 44.52 R
2018-19 39.79 0.09 1.71 41.59
Notes: These data should be read in conjunction with the explanatory notes.
Data for the gambling revenue received by states and territories from 1 July 2000 onwards are not comparable
with that of preceding years because of the impact of changes brought about by the introduction of the GST.
(1) Changes in taxes payable by bookmakers were introduced in January 2010.
(2) Gross profit tax is not based on turnover and is capped. Therefore this cannot be determined
as relative to racing or sports. As a consequence, all revenue is reported as racing revenue.
(3) Includes revenue from Betting Exchange Operators for both Racing and Sports categories.
E = Estimated data
R = Revised data
Value ($)
BOOKMAKERSON-COURSE
TOTALISATORTAB TOTAL RACING
Australian Gambling Statistics, 1993–94 to 2018–19, 36th edition
449

TABLE NT 15NORTHERN TERRITORY
GOVERNMENT REVENUE FROM RACINGAS A % OF TOTAL GAMBLING REVENUE
1993-94 2.18 - 14.74 16.911994-95 2.43 - 14.61 17.041995-96 5.18 - 12.01 17.191996-97 3.95 - 10.27 14.211997-98 3.86 - 8.45 12.321998-99 4.20 - 9.78 13.971999-00 4.01 - 14.04 18.052000-01 4.77 - 17.69 22.472001-02 6.24 2.49 11.13 19.862002-03 8.21 2.43 11.59 22.222003-04 8.78 2.20 11.29 22.272004-05 10.91 1.31 10.60 22.812005-06 10.42 1.29 9.17 20.882006-07 14.17 1.04 9.64 24.862007-08 13.88 1.02 12.15 27.052008-09 14.56 1.34 13.01 28.922009-10 10.03 (1) 1.56 14.60 26.192010-11 4.48 (2) 1.76 12.15 18.392011-12 4.46 1.85 11.39 17.702012-13 4.54 1.05 6.58 12.162013-14 4.68 0.83 6.09 11.602014-15 7.03 1.12 6.47 14.622015-16 6.23 0.19 2.08 8.502016-17 6.85 (3) 0.11 1.46 8.422017-18 7.98 R 0.03 E 0.55 8.57 R
2018-19 7.61 0.02 0.33 7.95
Notes: These data should be read in conjunction with the explanatory notes.
Data for the gambling revenue received by states and territories from 1 July 2000 onwards are not comparable
with that of preceding years because of the impact of changes brought about by the introduction of the GST.
(1) Changes in taxes payable by bookmakers were introduced in January 2010.
(2) Gross profit tax is not based on turnover and is capped. Therefore this cannot be determined
as relative to racing or sports. As a consequence, all revenue is reported as racing revenue.
(3) Includes revenue from Betting Exchange Operators for both Racing and Sports categories.
E = Estimated data
R = Revised data
ON-COURSE TOTALISATOR
TAB TOTAL RACING
Percentage (%)
BOOKMAKERS
Australian Gambling Statistics, 1993–94 to 2018–19, 36th edition
450

TABLE NT 16NORTHERN TERRITORY
TOTAL GAMING TURNOVER
1993-94 277.905 45.807 4.676 - - 2.204 19.626 - 0.119 350.3371994-95 329.126 48.797 4.008 - - 2.218 23.409 - 0.076 407.6341995-96 521.407 75.214 3.365 - - 3.599 29.393 - 0.088 633.0661996-97 409.490 181.109 2.812 - - 4.285 27.797 - 0.066 625.5591997-98 454.527 232.408 3.490 - - 4.429 29.856 - 0.052 724.7621998-99 531.938 260.242 3.530 2.589 - 3.260 29.756 - 0.073 831.3881999-00 603.630 281.930 3.792 105.659 - 1.956 29.959 - 0.077 1,027.0032000-01 694.474 297.792 3.751 263.056 - 0.755 30.864 - 0.078 1,290.7702001-02 722.667 335.182 3.310 318.590 - - U 30.053 - 0.072 1,409.873 (1)
2002-03 763.226 351.863 3.380 460.411 - - U 29.589 - 0.068 1,608.5372003-04 809.200 393.388 3.671 361.595 - - U 29.269 - 0.058 1,597.1812004-05 929.900 456.000 3.659 316.600 - - U 30.385 - 0.073 1,736.6172005-06 973.524 530.110 3.853 360.902 - - U 36.128 - 0.061 1,904.5782006-07 1,018.839 601.879 3.665 161.046 - - U 36.135 - 0.059 1,821.6232007-08 1,100.954 (2) 698.437 3.210 88.386 36.338 (3) - U 37.545 - 0.051 1,964.9212008-09 1,176.082 769.047 3.460 19.994 38.229 - U 40.463 - 0.046 2,047.3212009-10 1,135.563 684.254 3.996 - 38.569 - U 41.860 - 0.047 1,904.2882010-11 1,093.187 613.472 4.178 - 37.291 - U 39.608 - 0.051 1,787.7882011-12 1,112.940 619.801 4.265 - 45.953 - U 45.787 - 0.061 1,828.8072012-13 1,099.131 611.804 3.745 - 50.981 - U 72.889 - 0.099 1,838.6492013-14 1,089.095 706.072 4.190 - 51.610 - U 88.251 - 0.177 1,939.3962014-15 1,081.232 870.405 4.761 - 50.963 - U 98.992 - 0.219 2,106.5712015-16 1,038.930 931.862 4.425 0.009 48.022 - U 111.735 - 0.191 2,135.1742016-17 998.937 990.492 4.097 0.005 47.761 - U 102.055 - 0.222 2,143.5702017-18 1,100.323 1,119.211 3.990 0.001 47.801 - U 116.106 - 0.256 2,387.6882018-19 1,055.710 1,160.291 3.685 0.861 (5) 42.641 - U 120.312 - - (4) 2,383.500
Notes: These data should be read in conjunction with the explanatory notes.
(1) Total gaming figure incomplete from this period on, due to data for one or more components being unavailable.
(2) Excludes community keno, from this period on.
(3) Community keno was previously included in casino turnover.
(4) Pools was withdrawn from the Australian Lottery Market on 23 June 2018.
(5) Licensee(s) relaunched.
NA = Not applicable
U = Unavailable data
KENO
Value ($ million)
CASINOGAMING
MACHINESINSTANT LOTTERY
INTERACTIVE GAMING
LOTTERIES LOTTOMINOR GAMING
(NA)POOLS TOTAL GAMING
Australian Gambling Statistics, 1993–94 to 2018–19, 36th edition
451

TABLE NT 17NORTHERN TERRITORY
REAL GAMING TURNOVER
1993-94 516.433 85.123 8.689 - - 4.096 36.471 - 0.221 651.0331994-95 592.323 87.819 7.213 - - 3.992 42.129 - 0.137 733.6131995-96 900.038 129.832 5.809 - - 6.212 50.737 - 0.152 1,092.7811996-97 697.355 308.426 4.789 - - 7.297 47.338 - 0.112 1,065.3181997-98 774.053 395.787 5.943 - - 7.543 50.844 - 0.089 1,234.2591998-99 895.194 437.959 5.941 4.357 - 5.486 50.076 - 0.123 1,399.1351999-00 992.423 463.519 6.234 173.713 - 3.216 49.255 - 0.127 1,688.4882000-01 1,076.623 461.659 5.815 407.808 - 1.170 47.848 - 0.121 2,001.0442001-02 1,089.251 505.208 4.989 480.200 - - U 45.297 - 0.109 2,125.054 (1)
2002-03 1,116.463 514.712 4.944 673.499 - - U 43.283 - 0.099 2,353.0012003-04 1,155.566 561.772 5.242 516.370 - - U 41.797 - 0.083 2,280.8302004-05 1,297.085 636.059 5.104 441.614 - - U 42.383 - 0.102 2,422.3472005-06 1,316.103 716.654 5.209 487.902 - - U 48.841 - 0.082 2,574.7912006-07 1,337.739 790.269 4.812 211.454 - - U 47.445 - 0.077 2,391.7972007-08 1,398.874 (2) 887.435 4.079 112.303 46.172 (3) - U 47.705 - 0.065 2,496.6322008-09 1,449.146 947.606 4.263 24.636 47.104 - U 49.858 - 0.057 2,522.6712009-10 1,366.748 823.559 4.809 - 46.421 - U 50.383 - 0.056 2,291.9752010-11 1,276.690 716.450 4.880 - 43.551 - U 46.257 - 0.060 2,087.8872011-12 1,269.864 707.193 4.867 - 52.433 - U 52.243 - 0.069 2,086.6692012-13 1,225.912 682.374 4.177 - 56.862 - U 81.296 - 0.110 2,050.7312013-14 1,183.484 767.265 4.553 - 56.083 - U 95.899 - 0.192 2,107.4772014-15 1,155.136 929.899 5.087 - 54.446 - U 105.758 - 0.234 2,250.5602015-16 1,094.570 981.768 4.662 0.009 50.594 - U 117.719 - 0.201 2,249.5232016-17 1,034.289 1,025.546 4.242 0.005 49.451 - U 105.667 - 0.230 2,219.4312017-18 1,117.960 1,137.150 4.054 0.001 48.567 - U 117.967 - 0.260 2,425.9592018-19 1,055.710 1,160.291 3.685 0.861 (5) 42.641 - U 120.312 - - (4) 2,383.500
Notes: These data should be read in conjunction with the explanatory notes.
(1) Total gaming figure incomplete from this period on, due to data for one or more components being unavailable.
(2) Excludes community keno, from this period on.
(3) Community keno was previously included in casino turnover.
(4) Pools was withdrawn from the Australian Lottery Market on 23 June 2018.
(5) Licensee(s) relaunched.
NA = Not applicable
U = Unavailable data
KENO
Value ($ million)
CASINOGAMING
MACHINESINSTANT LOTTERY
INTERACTIVE GAMING
LOTTERIES LOTTOMINOR GAMING
(NA)POOLS TOTAL GAMING
Australian Gambling Statistics, 1993–94 to 2018–19, 36th edition
452

TABLE NT 18NORTHERN TERRITORY
PER CAPITA GAMING TURNOVER
1993-94 2,367.00 390.15 39.83 - - 18.77 167.16 - 1.01 2,983.931994-95 2,728.68 404.56 33.23 - - 18.39 194.08 - 0.63 3,379.561995-96 4,190.26 604.45 27.04 - - 28.92 236.22 - 0.71 5,087.611996-97 3,190.12 1,410.92 21.91 - - 33.38 216.55 - 0.51 4,873.401997-98 3,452.70 1,765.43 26.51 - - 33.64 226.79 - 0.40 5,505.471998-99 3,960.36 1,937.54 26.28 19.28 - 24.27 221.54 - 0.54 6,189.811999-00 4,403.70 2,056.78 27.66 770.82 - 14.27 218.56 - 0.56 7,492.352000-01 4,980.24 2,135.54 26.90 1,886.44 - 5.41 221.33 - 0.56 9,256.412001-02 5,126.39 2,377.68 23.48 2,259.98 - - U 213.18 - 0.51 10,001.23 (1)
2002-03 5,396.53 2,487.91 23.90 3,255.42 - - U 209.21 - 0.48 11,373.462003-04 5,699.59 2,770.83 25.86 2,546.89 - - U 206.16 - 0.41 11,249.732004-05 6,457.64 3,166.67 25.41 2,198.61 - - U 211.01 - 0.51 12,059.842005-06 6,626.63 3,608.38 26.23 2,456.60 - - U 245.92 - 0.41 12,964.162006-07 6,773.34 4,001.35 24.37 1,070.65 - - U 240.23 - 0.39 12,110.332007-08 7,092.07 (2) 4,499.15 20.68 569.36 234.08 (3) - U 241.86 - 0.33 12,657.522008-09 7,312.08 4,781.41 21.51 124.31 237.68 - U 251.57 - 0.29 12,728.852009-10 6,865.62 4,137.00 24.16 - 233.19 - U 253.09 - 0.28 11,513.332010-11 6,505.40 3,650.69 24.86 - 221.91 - U 235.70 - 0.30 10,638.872011-12 6,501.08 3,620.48 24.91 - 268.43 - U 267.46 - 0.36 10,682.722012-13 6,238.38 3,472.44 21.25 - 289.36 - U 413.70 - 0.56 10,435.692013-14 6,060.38 3,929.01 23.32 - 287.19 - U 491.08 - 0.98 10,791.962014-15 5,960.63 4,798.38 26.25 - 280.95 - U 545.72 - 1.21 11,613.142015-16 5,687.61 5,101.47 24.23 0.05 262.90 - U 611.69 - 1.04 11,688.992016-17 5,436.33 5,390.38 22.30 0.03 259.92 - U 555.40 - 1.21 11,665.562017-18 5,963.73 6,066.10 21.63 0.01 259.08 - U 629.29 - 1.39 12,941.222018-19 5,732.48 6,300.35 20.01 4.68 (5) 231.54 - U 653.29 - - (4) 12,942.34
Notes: These data should be read in conjunction with the explanatory notes.
(1) Total gaming figure incomplete from this period on, due to data for one or more components being unavailable.
(2) Excludes community keno, from this period on.
(3) Community keno was previously included in casino turnover.
(4) Pools was withdrawn from the Australian Lottery Market on 23 June 2018.
(5) Licensee(s) relaunched.
NA = Not applicable
U = Unavailable data
KENO
Value ($)
CASINOGAMING
MACHINESINSTANT LOTTERY
INTERACTIVE GAMING
LOTTERIES LOTTOMINOR GAMING
(NA)POOLS TOTAL GAMING
Australian Gambling Statistics, 1993–94 to 2018–19, 36th edition
453

TABLE NT 19NORTHERN TERRITORY
REAL PER CAPITA GAMING TURNOVER
1993-94 4,398.61 725.02 74.01 - - 34.88 310.64 - 1.88 5,545.051994-95 4,910.75 728.08 59.80 - - 33.09 349.28 - 1.13 6,082.141995-96 7,233.12 1,043.39 46.68 - - 49.93 407.75 - 1.22 8,782.081996-97 5,432.72 2,402.78 37.31 - - 56.85 368.78 - 0.88 8,299.321997-98 5,879.89 3,006.50 45.15 - - 57.29 386.23 - 0.67 9,375.731998-99 6,664.86 3,260.67 44.23 32.44 - 40.85 372.82 - 0.91 10,416.781999-00 7,240.08 3,381.54 45.48 1,267.30 - 23.46 359.34 - 0.92 12,318.122000-01 7,720.72 3,310.66 41.70 2,924.49 - 8.39 343.13 - 0.87 14,349.962001-02 7,726.83 3,583.80 35.39 3,406.40 - - U 321.32 - 0.77 15,074.51 (1)
2002-03 7,894.16 3,639.37 34.96 4,762.10 - - U 306.04 - 0.70 16,637.332003-04 8,139.22 3,956.84 36.92 3,637.05 - - U 294.40 - 0.58 16,065.012004-05 9,007.54 4,417.07 35.44 3,066.77 - - U 294.33 - 0.71 16,821.862005-06 8,958.51 4,878.15 35.46 3,321.07 - - U 332.45 - 0.56 17,526.202006-07 8,893.42 5,253.79 31.99 1,405.77 - - U 315.42 - 0.52 15,900.902007-08 9,011.19 (2) 5,716.63 26.27 723.43 297.43 (3) - U 307.30 - 0.42 16,082.662008-09 9,009.81 5,891.57 26.50 153.17 292.86 - U 309.98 - 0.35 15,684.252009-10 8,263.36 4,979.24 29.08 - 280.66 - U 304.61 - 0.34 13,857.292010-11 7,597.40 4,263.49 29.04 - 259.17 - U 275.27 - 0.35 12,424.722011-12 7,417.74 4,130.97 28.43 - 306.28 - U 305.17 - 0.41 12,188.982012-13 6,957.96 3,872.98 23.71 - 322.73 - U 461.42 - 0.63 11,639.422013-14 6,585.61 4,269.52 25.34 - 312.08 - U 533.64 - 1.07 11,727.262014-15 6,368.05 5,126.36 28.04 - 300.15 - U 583.02 - 1.29 12,406.922015-16 5,992.21 5,374.68 25.52 0.05 276.97 - U 644.45 - 1.10 12,314.992016-17 5,628.72 5,581.14 23.09 0.03 269.12 - U 575.05 - 1.25 12,078.412017-18 6,059.32 6,163.33 21.97 0.01 263.23 - U 639.38 - 1.41 13,148.652018-19 5,732.48 6,300.35 20.01 4.68 (5) 231.54 - U 653.29 - - (4) 12,942.34
Notes: These data should be read in conjunction with the explanatory notes.
(1) Total gaming figure incomplete from this period on, due to data for one or more components being unavailable.
(2) Excludes community keno, from this period on.
(3) Community keno was previously included in casino turnover.
(4) Pools was withdrawn from the Australian Lottery Market on 23 June 2018.
(5) Licensee(s) relaunched.
NA = Not applicable
U = Unavailable data
KENO
Value ($)
CASINOGAMING
MACHINESINSTANT LOTTERY
INTERACTIVE GAMING
LOTTERIES LOTTOMINOR GAMING
(NA)POOLS TOTAL GAMING
Australian Gambling Statistics, 1993–94 to 2018–19, 36th edition
454

TABLE NT 20NORTHERN TERRITORY
TOTAL GAMING EXPENDITURE
1993-94 33.505 3.494 1.870 - - 0.806 7.850 - 0.047 47.5731994-95 36.851 3.600 1.603 - - 0.887 9.364 - 0.030 52.3351995-96 58.398 6.384 1.346 - - 1.440 11.757 - 0.035 79.3601996-97 45.863 15.373 1.125 - - 1.714 11.119 - 0.026 75.2201997-98 47.414 19.731 1.396 - - 1.772 11.942 - 0.021 82.2761998-99 54.280 24.297 1.410 0.136 - 1.304 11.902 - 0.029 93.3581999-00 62.385 26.474 1.517 5.387 - 0.782 11.984 - 0.031 108.5602000-01 69.111 27.992 1.500 14.757 - 0.302 12.346 - 0.039 126.0472001-02 69.554 36.870 1.324 15.046 - - U 12.021 - 0.036 134.851 (1)
2002-03 72.978 42.041 1.352 18.510 - - U 11.836 - 0.034 146.7512003-04 80.894 45.000 1.468 14.688 - - U 11.708 - 0.029 153.7872004-05 87.100 49.900 1.464 14.100 - - U 12.154 - 0.036 164.7542005-06 98.535 56.834 1.541 14.753 - - U 14.451 - 0.030 186.1452006-07 105.245 63.709 1.466 6.812 - - U 14.454 - 0.030 191.7162007-08 107.306 (2) 72.064 1.284 3.771 10.119 (3) - U 15.018 - 0.026 209.5882008-09 114.730 78.665 1.384 0.761 8.180 - U 16.185 - 0.023 219.9292009-10 109.662 69.582 1.598 - 8.967 - U 16.744 - 0.023 206.5762010-11 101.244 62.550 1.671 - 9.131 - U 15.843 - 0.025 190.4642011-12 104.895 62.674 1.706 - 13.227 - U 18.314 - 0.030 200.8452012-13 102.740 61.135 1.498 - 14.922 - U 29.112 - 0.049 209.4572013-14 102.325 68.838 1.676 - 15.167 - U 35.301 - 0.088 223.3952014-15 105.351 82.629 1.905 - 14.208 - U 39.595 - 0.109 243.7982015-16 101.877 87.075 1.770 0.008 11.401 - U 44.569 - 0.095 246.7952016-17 97.125 92.648 1.639 0.005 13.754 - U 40.707 - 0.111 245.9902017-18 96.384 103.397 1.596 0.001 10.501 - U 46.339 - 0.128 258.3462018-19 92.405 106.836 1.474 0.818 (5) 10.044 - U 48.003 - - (4) 259.580
Notes: These data should be read in conjunction with the explanatory notes.
(1) Total gaming figure incomplete from this period on, due to data for one or more components being unavailable.
(2) Excludes community keno, from this period on.
(3) Community keno was previously included in casino turnover.
(4) Pools was withdrawn from the Australian Lottery Market on 23 June 2018.
(5) Licensee(s) relaunched.
NA = Not applicable
U = Unavailable data
KENO
Value ($ million)
CASINOGAMING
MACHINESINSTANT LOTTERY
INTERACTIVE GAMING
LOTTERIES LOTTOMINOR GAMING
(NA)POOLS TOTAL GAMING
Australian Gambling Statistics, 1993–94 to 2018–19, 36th edition
455
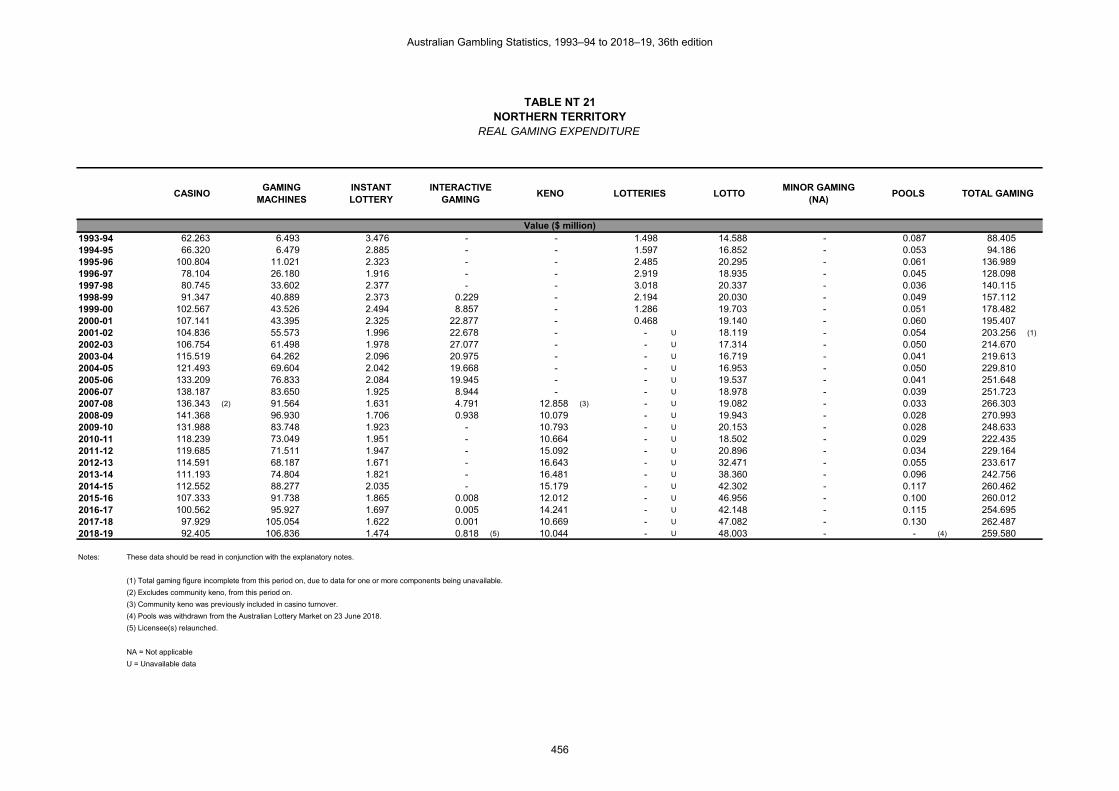
TABLE NT 21NORTHERN TERRITORY
REAL GAMING EXPENDITURE
1993-94 62.263 6.493 3.476 - - 1.498 14.588 - 0.087 88.4051994-95 66.320 6.479 2.885 - - 1.597 16.852 - 0.053 94.1861995-96 100.804 11.021 2.323 - - 2.485 20.295 - 0.061 136.9891996-97 78.104 26.180 1.916 - - 2.919 18.935 - 0.045 128.0981997-98 80.745 33.602 2.377 - - 3.018 20.337 - 0.036 140.1151998-99 91.347 40.889 2.373 0.229 - 2.194 20.030 - 0.049 157.1121999-00 102.567 43.526 2.494 8.857 - 1.286 19.703 - 0.051 178.4822000-01 107.141 43.395 2.325 22.877 - 0.468 19.140 - 0.060 195.4072001-02 104.836 55.573 1.996 22.678 - - U 18.119 - 0.054 203.256 (1)
2002-03 106.754 61.498 1.978 27.077 - - U 17.314 - 0.050 214.6702003-04 115.519 64.262 2.096 20.975 - - U 16.719 - 0.041 219.6132004-05 121.493 69.604 2.042 19.668 - - U 16.953 - 0.050 229.8102005-06 133.209 76.833 2.084 19.945 - - U 19.537 - 0.041 251.6482006-07 138.187 83.650 1.925 8.944 - - U 18.978 - 0.039 251.7232007-08 136.343 (2) 91.564 1.631 4.791 12.858 (3) - U 19.082 - 0.033 266.3032008-09 141.368 96.930 1.706 0.938 10.079 - U 19.943 - 0.028 270.9932009-10 131.988 83.748 1.923 - 10.793 - U 20.153 - 0.028 248.6332010-11 118.239 73.049 1.951 - 10.664 - U 18.502 - 0.029 222.4352011-12 119.685 71.511 1.947 - 15.092 - U 20.896 - 0.034 229.1642012-13 114.591 68.187 1.671 - 16.643 - U 32.471 - 0.055 233.6172013-14 111.193 74.804 1.821 - 16.481 - U 38.360 - 0.096 242.7562014-15 112.552 88.277 2.035 - 15.179 - U 42.302 - 0.117 260.4622015-16 107.333 91.738 1.865 0.008 12.012 - U 46.956 - 0.100 260.0122016-17 100.562 95.927 1.697 0.005 14.241 - U 42.148 - 0.115 254.6952017-18 97.929 105.054 1.622 0.001 10.669 - U 47.082 - 0.130 262.4872018-19 92.405 106.836 1.474 0.818 (5) 10.044 - U 48.003 - - (4) 259.580
Notes: These data should be read in conjunction with the explanatory notes.
(1) Total gaming figure incomplete from this period on, due to data for one or more components being unavailable.
(2) Excludes community keno, from this period on.
(3) Community keno was previously included in casino turnover.
(4) Pools was withdrawn from the Australian Lottery Market on 23 June 2018.
(5) Licensee(s) relaunched.
NA = Not applicable
U = Unavailable data
KENO
Value ($ million)
CASINOGAMING
MACHINESINSTANT LOTTERY
INTERACTIVE GAMING
LOTTERIES LOTTOMINOR GAMING
(NA)POOLS TOTAL GAMING
Australian Gambling Statistics, 1993–94 to 2018–19, 36th edition
456

TABLE NT 22NORTHERN TERRITORY
PER CAPITA GAMING EXPENDITURE
1993-94 285.37 29.76 15.93 - - 6.86 66.86 - 0.40 405.191994-95 305.52 29.85 13.29 - - 7.36 77.63 - 0.25 433.891995-96 469.31 51.31 10.82 - - 11.57 94.49 - 0.28 637.771996-97 357.29 119.76 8.76 - - 13.35 86.62 - 0.21 586.001997-98 360.17 149.88 10.60 - - 13.46 90.71 - 0.16 624.991998-99 404.12 180.89 10.50 1.01 - 9.71 88.61 - 0.22 695.071999-00 455.12 193.14 11.07 39.30 - 5.70 87.43 - 0.22 791.982000-01 495.61 200.74 10.76 105.83 - 2.17 88.54 - 0.28 903.912001-02 493.40 261.55 9.39 106.73 - - U 85.27 - 0.26 956.59 (1)
2002-03 516.00 297.26 9.56 130.88 - - U 83.69 - 0.24 1,037.632003-04 569.78 316.96 10.34 103.45 - - U 82.47 - 0.20 1,083.202004-05 604.86 346.53 10.17 97.92 - - U 84.40 - 0.25 1,144.132005-06 670.71 386.86 10.49 100.42 - - U 98.37 - 0.21 1,267.062006-07 699.68 423.54 9.75 45.29 - - U 96.09 - 0.20 1,274.542007-08 691.24 (2) 464.22 8.27 24.29 65.19 (3) - U 96.74 - 0.17 1,350.112008-09 713.31 489.09 8.61 4.73 50.86 - U 100.63 - 0.14 1,367.372009-10 663.02 420.69 9.66 - 54.22 - U 101.23 - 0.14 1,248.962010-11 602.49 372.22 9.94 - 54.34 - U 94.28 - 0.15 1,133.422011-12 612.73 366.10 9.97 - 77.26 - U 106.98 - 0.18 1,173.212012-13 583.13 346.99 8.50 - 84.69 - U 165.23 - 0.28 1,188.822013-14 569.40 383.06 9.33 - 84.40 - U 196.43 - 0.49 1,243.102014-15 580.78 455.52 10.50 - 78.33 - U 218.28 - 0.60 1,344.012015-16 557.72 476.69 9.69 0.04 62.41 - U 243.99 - 0.52 1,351.082016-17 528.57 504.20 8.92 0.02 74.85 - U 221.53 - 0.60 1,338.712017-18 522.40 560.41 8.65 0.01 56.92 - U 251.16 - 0.69 1,400.232018-19 501.76 580.12 8.00 4.44 (5) 54.54 - U 260.65 - - (4) 1,409.51
Notes: These data should be read in conjunction with the explanatory notes.
(1) Total gaming figure incomplete from this period on, due to data for one or more components being unavailable.
(2) Excludes community keno, from this period on.
(3) Community keno was previously included in casino turnover.
(4) Pools was withdrawn from the Australian Lottery Market on 23 June 2018.
(5) Licensee(s) relaunched.
NA = Not applicable
U = Unavailable data
KENO
Value ($)
CASINOGAMING
MACHINESINSTANT LOTTERY
INTERACTIVE GAMING
LOTTERIES LOTTOMINOR GAMING
(NA)POOLS TOTAL GAMING
Australian Gambling Statistics, 1993–94 to 2018–19, 36th edition
457

TABLE NT 23NORTHERN TERRITORY
REAL PER CAPITA GAMING EXPENDITURE
1993-94 530.31 55.30 29.60 - - 12.76 124.25 - 0.74 752.971994-95 549.84 53.71 23.92 - - 13.24 139.71 - 0.44 780.861995-96 810.11 88.57 18.67 - - 19.97 163.10 - 0.49 1,100.911996-97 608.47 203.95 14.92 - - 22.74 147.51 - 0.35 997.951997-98 613.36 255.25 18.06 - - 22.92 154.49 - 0.27 1,064.351998-99 680.10 304.43 17.67 1.70 - 16.34 149.12 - 0.37 1,169.721999-00 748.26 317.54 18.20 64.61 - 9.38 143.74 - 0.37 1,302.092000-01 768.33 311.20 16.68 164.06 - 3.36 137.25 - 0.43 1,401.312001-02 743.68 394.22 14.16 160.87 - - U 128.53 - 0.39 1,441.84 (1)
2002-03 754.82 434.84 13.98 191.45 - - U 122.42 - 0.35 1,517.872003-04 813.66 452.63 14.77 147.74 - - U 117.76 - 0.29 1,546.842004-05 843.70 483.36 14.18 136.58 - - U 117.73 - 0.35 1,595.902005-06 906.73 522.99 14.18 135.76 - - U 132.98 - 0.28 1,712.932006-07 918.68 556.11 12.80 59.46 - - U 126.17 - 0.26 1,673.482007-08 878.29 (2) 589.83 10.51 30.87 82.82 (3) - U 122.92 - 0.21 1,715.452008-09 878.93 602.64 10.61 5.83 62.67 - U 123.99 - 0.18 1,684.852009-10 798.00 506.34 11.63 - 65.25 - U 121.84 - 0.17 1,503.232010-11 703.62 434.71 11.61 - 63.46 - U 110.11 - 0.17 1,323.682011-12 699.12 417.72 11.37 - 88.16 - U 122.06 - 0.20 1,338.632012-13 650.39 387.01 9.48 - 94.46 - U 184.29 - 0.31 1,325.952013-14 618.75 416.26 10.13 - 91.71 - U 213.46 - 0.53 1,350.842014-15 620.48 486.66 11.22 - 83.68 - U 233.20 - 0.64 1,435.882015-16 587.59 502.22 10.21 0.05 65.76 - U 257.06 - 0.55 1,423.432016-17 547.27 522.05 9.23 0.03 77.50 - U 229.37 - 0.63 1,386.082017-18 530.77 569.39 8.79 0.01 57.83 - U 255.18 - 0.70 1,422.672018-19 501.76 580.12 8.00 4.44 (5) 54.54 - U 260.65 - - (4) 1,409.51
Notes: These data should be read in conjunction with the explanatory notes.
(1) Total gaming figure incomplete from this period on, due to data for one or more components being unavailable.
(2) Excludes community keno, from this period on.
(3) Community keno was previously included in casino turnover.
(4) Pools was withdrawn from the Australian Lottery Market on 23 June 2018.
(5) Licensee(s) relaunched.
NA = Not applicable
U = Unavailable data
KENO
Value ($)
CASINOGAMING
MACHINESINSTANT LOTTERY
INTERACTIVE GAMING
LOTTERIES LOTTOMINOR GAMING
(NA)POOLS TOTAL GAMING
Australian Gambling Statistics, 1993–94 to 2018–19, 36th edition
458

TABLE NT 24NORTHERN TERRITORYGAMING EXPENDITURE
AS A % OF HDI
1993-94 1.261 0.131 0.070 - - 0.030 0.295 - 0.002 1.7901994-95 1.211 0.118 0.053 - - 0.029 0.308 - 0.001 1.7201995-96 1.769 0.193 0.041 - - 0.044 0.356 - 0.001 2.4041996-97 1.310 0.439 0.032 - - 0.049 0.317 - 0.001 2.1481997-98 1.329 0.553 0.039 - - 0.050 0.335 - 0.001 2.3071998-99 1.394 0.624 0.036 0.003 - 0.033 0.306 - 0.001 2.3981999-00 1.437 0.610 0.035 0.124 - 0.018 0.276 - 0.001 2.5012000-01 1.430 0.579 0.031 0.305 - 0.006 0.255 - 0.001 2.6082001-02 1.307 0.693 0.025 0.283 - - U 0.226 - 0.001 2.534 (1)
2002-03 1.378 0.794 0.026 0.349 - - U 0.223 - 0.001 2.7702003-04 1.440 0.801 0.026 0.261 - - U 0.208 - 0.001 2.7382004-05 1.363 0.781 0.023 0.221 - - U 0.190 - 0.001 2.5792005-06 1.374 0.793 0.021 0.206 - - U 0.202 - 0.000 2.5972006-07 1.361 0.824 0.019 0.088 - - U 0.187 - 0.000 2.4802007-08 1.262 (2) 0.848 0.015 0.044 0.119 (3) - U 0.177 - 0.000 2.4652008-09 1.198 0.822 0.014 0.008 0.085 - U 0.169 - 0.000 2.2972009-10 1.045 0.663 0.015 - 0.085 - U 0.159 - 0.000 1.9682010-11 0.909 0.561 0.015 - 0.082 - U 0.142 - 0.000 1.7092011-12 0.877 0.524 0.014 - 0.111 - U 0.153 - 0.000 1.6782012-13 0.802 0.477 0.012 - 0.117 - U 0.227 - 0.000 1.6352013-14 0.735 0.495 0.012 - 0.109 - U 0.254 - 0.001 1.6052014-15 0.703 0.551 0.013 - 0.095 - U 0.264 - 0.001 1.6272015-16 0.657 0.561 0.011 0.000 0.074 - U 0.287 - 0.001 1.5912016-17 0.612 0.584 0.010 0.000 0.087 - U 0.257 - 0.001 1.5502017-18 0.600 0.644 0.010 0.000 0.065 - U 0.288 - 0.001 1.6082018-19 0.591 0.683 0.009 0.005 (5) 0.064 - U 0.307 - - (4) 1.659
Notes: These data should be read in conjunction with the explanatory notes.
(1) Total gaming figure incomplete from this period on, due to data for one or more components being unavailable.
(2) Excludes community keno, from this period on.
(3) Community keno was previously included in casino turnover.
(4) Pools was withdrawn from the Australian Lottery Market on 23 June 2018.
(5) Licensee(s) relaunched.
NA = Not applicable
U = Unavailable data
Percentage (%)
CASINOGAMING
MACHINESINSTANT LOTTERY
TOTAL GAMINGINTERACTIVE
GAMINGKENO LOTTERIES LOTTO
MINOR GAMING(NA)
POOLS
Australian Gambling Statistics, 1993–94 to 2018–19, 36th edition
459
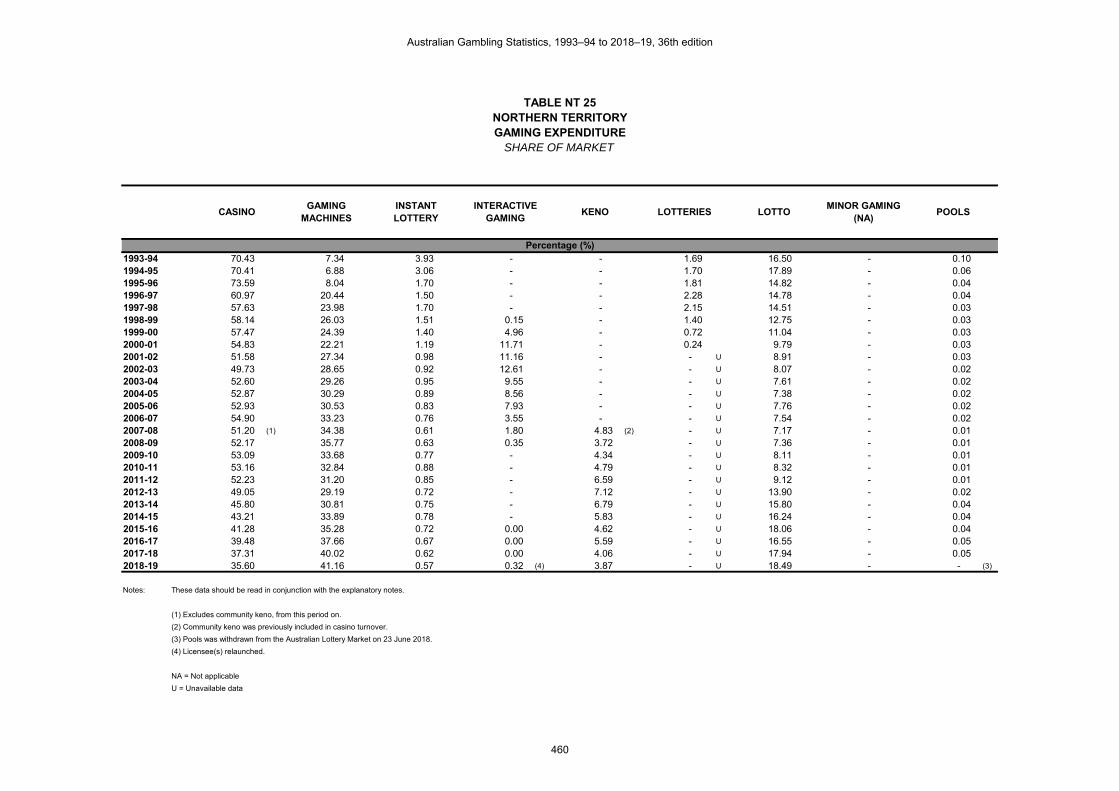
TABLE NT 25NORTHERN TERRITORYGAMING EXPENDITURE
SHARE OF MARKET
1993-94 70.43 7.34 3.93 - - 1.69 16.50 - 0.101994-95 70.41 6.88 3.06 - - 1.70 17.89 - 0.061995-96 73.59 8.04 1.70 - - 1.81 14.82 - 0.041996-97 60.97 20.44 1.50 - - 2.28 14.78 - 0.041997-98 57.63 23.98 1.70 - - 2.15 14.51 - 0.031998-99 58.14 26.03 1.51 0.15 - 1.40 12.75 - 0.031999-00 57.47 24.39 1.40 4.96 - 0.72 11.04 - 0.032000-01 54.83 22.21 1.19 11.71 - 0.24 9.79 - 0.032001-02 51.58 27.34 0.98 11.16 - - U 8.91 - 0.032002-03 49.73 28.65 0.92 12.61 - - U 8.07 - 0.022003-04 52.60 29.26 0.95 9.55 - - U 7.61 - 0.022004-05 52.87 30.29 0.89 8.56 - - U 7.38 - 0.022005-06 52.93 30.53 0.83 7.93 - - U 7.76 - 0.022006-07 54.90 33.23 0.76 3.55 - - U 7.54 - 0.022007-08 51.20 (1) 34.38 0.61 1.80 4.83 (2) - U 7.17 - 0.012008-09 52.17 35.77 0.63 0.35 3.72 - U 7.36 - 0.012009-10 53.09 33.68 0.77 - 4.34 - U 8.11 - 0.012010-11 53.16 32.84 0.88 - 4.79 - U 8.32 - 0.012011-12 52.23 31.20 0.85 - 6.59 - U 9.12 - 0.012012-13 49.05 29.19 0.72 - 7.12 - U 13.90 - 0.022013-14 45.80 30.81 0.75 - 6.79 - U 15.80 - 0.042014-15 43.21 33.89 0.78 - 5.83 - U 16.24 - 0.042015-16 41.28 35.28 0.72 0.00 4.62 - U 18.06 - 0.042016-17 39.48 37.66 0.67 0.00 5.59 - U 16.55 - 0.052017-18 37.31 40.02 0.62 0.00 4.06 - U 17.94 - 0.052018-19 35.60 41.16 0.57 0.32 (4) 3.87 - U 18.49 - - (3)
Notes: These data should be read in conjunction with the explanatory notes.
(1) Excludes community keno, from this period on.
(2) Community keno was previously included in casino turnover.
(3) Pools was withdrawn from the Australian Lottery Market on 23 June 2018.
(4) Licensee(s) relaunched.
NA = Not applicable
U = Unavailable data
POOLS
Percentage (%)
CASINOGAMING
MACHINESINSTANT LOTTERY
INTERACTIVE GAMING
KENO LOTTERIES LOTTOMINOR GAMING
(NA)
Australian Gambling Statistics, 1993–94 to 2018–19, 36th edition
460

TABLE NT 26NORTHERN TERRITORY
GOVERNMENT REVENUE FROM GAMING
1993-94 2.738 0.411 - 8.072 - 11.2211994-95 2.998 0.341 - 9.444 - 12.7831995-96 3.282 1.606 - 11.586 - 16.4741996-97 2.320 7.437 - 11.164 - 20.9211997-98 2.352 10.140 - 11.706 - 24.1981998-99 2.872 11.420 0.011 11.875 - 26.1781999-00 4.395 12.443 0.431 12.349 - 29.6182000-01 0.820 10.111 1.178 11.160 - 23.2692001-02 0.826 13.434 0.843 10.617 - 25.7202002-03 0.645 14.647 0.740 10.615 - 26.6472003-04 2.127 15.681 0.591 10.474 - 28.8732004-05 5.225 17.665 0.562 10.851 - 34.3032005-06 9.085 20.363 0.593 12.829 - 42.8702006-07 10.117 23.284 0.273 13.118 - 46.7922007-08 11.043 26.684 0.151 13.291 - 51.1692008-09 11.597 (1) 25.921 0.031 13.775 - 51.3242009-10 11.185 19.039 - (2) 14.304 - 44.5282010-11 10.466 16.695 - 13.633 - 40.7942011-12 11.097 16.875 - 15.760 - 43.7322012-13 11.177 16.454 - 19.115 - 46.7462013-14 11.238 19.142 - 20.927 - 51.3062014-15 11.055 23.759 - 23.626 - 58.4402015-16 22.245 28.650 - 25.942 - 76.8372016-17 21.025 31.197 - 23.392 - 75.6142017-18 21.020 38.920 - 26.314 - 86.2542018-19 20.345 40.819 - 27.487 - 88.651
Notes: These data should be read in conjunction with the explanatory notes.
Data for the gambling revenue received by states and territories from 1 July 2000 onwards are not comparable with that of preceding years
because of the impact of changes brought about by the introduction of the GST.
(1) Includes community keno, from this period on.
(2) Interactive gaming licensees do not pay tax, from this period on.
NA = Not applicable
Value ($ million)
TOTAL GAMINGCASINO GAMINGGAMING
MACHINESINTERACTIVE
GAMINGLOTTERIES &
POOLSMINOR GAMING
(NA)
Australian Gambling Statistics, 1993–94 to 2018–19, 36th edition
461

TABLE NT 27NORTHERN TERRITORY
REAL GOVERNMENT REVENUE FROM GAMING
1993-94 5.088 0.764 - 15.000 - 20.8521994-95 5.395 0.614 - 16.996 - 23.0051995-96 5.665 2.772 - 19.999 - 28.4371996-97 3.951 12.665 - 19.012 - 35.6281997-98 4.005 17.268 - 19.935 - 41.2091998-99 4.833 19.219 0.019 19.984 - 44.0551999-00 7.226 20.457 0.709 20.303 - 48.6952000-01 1.271 15.675 1.826 17.301 - 36.0732001-02 1.245 20.249 1.271 16.002 - 38.7662002-03 0.944 21.426 1.082 15.528 - 38.9802003-04 3.037 22.393 0.844 14.957 - 41.2322004-05 7.288 24.640 0.784 15.136 - 47.8482005-06 12.281 27.529 0.801 17.343 - 57.9552006-07 13.284 30.572 0.358 17.224 - 61.4382007-08 14.031 33.905 0.192 16.888 - 65.0152008-09 14.290 (1) 31.940 0.039 16.973 - 63.2412009-10 13.462 22.915 - (2) 17.216 - 53.5932010-11 12.223 19.498 - 15.921 - 47.6422011-12 12.662 19.254 - 17.982 - 49.8982012-13 12.467 18.352 - 21.319 - 52.1382013-14 12.212 20.800 - 22.741 - 55.7532014-15 11.811 25.383 - 25.241 - 62.4352015-16 23.436 30.184 - 27.331 - 80.9522016-17 21.769 32.301 - 24.219 - 78.2902017-18 21.357 39.544 - 26.736 - 87.6372018-19 20.345 40.819 - 27.487 - 88.651
Notes: These data should be read in conjunction with the explanatory notes.
Data for the gambling revenue received by states and territories from 1 July 2000 onwards are not comparable with that of preceding years
because of the impact of changes brought about by the introduction of the GST.
(1) Includes community keno, from this period on.
(2) Interactive gaming licensees do not pay tax, from this period on.
NA = Not applicable
Value ($ million)
TOTAL GAMINGCASINO GAMINGGAMING
MACHINESINTERACTIVE
GAMINGLOTTERIES &
POOLSMINOR GAMING
(NA)
Australian Gambling Statistics, 1993–94 to 2018–19, 36th edition
462

TABLE NT 28NORTHERN TERRITORY
PER CAPITA REVENUE FROM GAMING
1993-94 23.32 3.50 - 68.75 - 95.571994-95 24.86 2.83 - 78.30 - 105.981995-96 26.38 12.91 - 93.11 - 132.391996-97 18.07 57.94 - 86.97 - 162.981997-98 17.87 77.03 - 88.92 - 183.811998-99 21.38 85.02 0.08 88.41 - 194.901999-00 32.06 90.78 3.14 90.09 - 216.072000-01 5.88 72.51 8.45 80.03 - 166.872001-02 5.86 95.30 5.98 75.31 - 182.452002-03 4.56 103.56 5.23 75.06 - 188.412003-04 14.98 110.45 4.16 73.77 - 203.372004-05 36.28 122.67 3.90 75.35 - 238.222005-06 61.84 138.61 4.04 87.32 - 291.812006-07 67.26 154.79 1.81 87.21 - 311.082007-08 71.14 171.89 0.97 85.62 - 329.622008-09 72.10 (1) 161.16 0.19 85.64 - 319.102009-10 67.62 115.11 - (2) 86.48 - 269.212010-11 62.28 99.35 - 81.13 - 242.762011-12 64.82 98.57 - 92.06 - 255.452012-13 63.44 93.39 - 108.49 - 265.322013-14 62.53 106.51 - 116.45 - 285.502014-15 60.95 130.98 - 130.25 - 322.172015-16 121.78 156.84 - 142.02 - 420.642016-17 114.42 169.78 - 127.30 - 411.502017-18 113.93 210.95 - 142.62 - 467.502018-19 110.47 221.65 - 149.25 - 481.37
Notes: These data should be read in conjunction with the explanatory notes.
Data for the gambling revenue received by states and territories from 1 July 2000 onwards are not comparable with that of preceding years
because of the impact of changes brought about by the introduction of the GST.
(1) Includes community keno, from this period on.
(2) Interactive gaming licensees do not pay tax, from this period on.
NA = Not applicable
Value ($)
TOTAL GAMINGCASINO GAMINGGAMING
MACHINESINTERACTIVE
GAMINGLOTTERIES &
POOLSMINOR GAMING
(NA)
Australian Gambling Statistics, 1993–94 to 2018–19, 36th edition
463

TABLE NT 29NORTHERN TERRITORY
REAL PER CAPITA REVENUE FROM GAMING
1993-94 43.34 6.51 - 127.76 - 177.601994-95 44.73 5.09 - 140.91 - 190.731995-96 45.53 22.28 - 160.72 - 228.531996-97 30.78 98.67 - 148.11 - 277.561997-98 30.43 131.17 - 151.43 - 313.031998-99 35.98 143.09 0.14 148.79 - 327.991999-00 52.71 149.24 5.17 148.12 - 355.252000-01 9.12 112.41 13.10 124.07 - 258.692001-02 8.83 143.64 9.01 113.51 - 275.002002-03 6.67 151.50 7.65 109.79 - 275.612003-04 21.39 157.73 5.94 105.35 - 290.412004-05 50.61 171.11 5.44 105.11 - 332.282005-06 83.60 187.39 5.46 118.05 - 394.492006-07 88.31 203.25 2.38 114.51 - 408.452007-08 90.39 218.41 1.23 108.79 - 418.812008-09 88.84 (1) 198.58 0.24 105.53 - 393.192009-10 81.39 138.54 - (2) 104.09 - 324.022010-11 72.74 116.03 - 94.75 - 283.512011-12 73.96 112.47 - 105.04 - 291.472012-13 70.76 104.16 - 121.00 - 295.922013-14 67.95 115.75 - 126.54 - 310.242014-15 65.11 139.93 - 139.15 - 344.192015-16 128.30 165.24 - 149.62 - 443.172016-17 118.47 175.79 - 131.81 - 426.062017-18 115.75 214.33 - 144.91 - 474.992018-19 110.47 221.65 - 149.25 - 481.37
Notes: These data should be read in conjunction with the explanatory notes.
Data for the gambling revenue received by states and territories from 1 July 2000 onwards are not comparable with that of preceding years
because of the impact of changes brought about by the introduction of the GST.
(1) Includes community keno, from this period on.
(2) Interactive gaming licensees do not pay tax, from this period on.
NA = Not applicable
Value ($)
TOTAL GAMINGCASINO GAMINGGAMING
MACHINESINTERACTIVE
GAMINGLOTTERIES &
POOLSMINOR GAMING
(NA)
Australian Gambling Statistics, 1993–94 to 2018–19, 36th edition
464

TABLE NT 30NORTHERN TERRITORY
GOVERNMENT REVENUE FROM GAMINGAS A % OF TOTAL GAMBLING REVENUE
1993-94 20.27 3.04 - 59.77 - 83.091994-95 18.72 2.13 - 58.95 - 79.801995-96 16.21 7.93 - 57.23 - 81.381996-97 9.35 29.98 - 45.00 - 84.331997-98 8.32 35.87 - 41.40 - 85.591998-99 9.19 36.56 0.04 38.01 - 83.801999-00 11.81 33.45 1.16 33.20 - 79.622000-01 2.67 32.89 3.83 36.30 - 75.692001-02 2.49 40.48 2.54 31.99 - 77.492002-03 1.81 41.05 2.07 29.75 - 74.672003-04 5.55 40.89 1.54 27.31 - 75.292004-05 11.46 38.76 1.23 23.81 - 75.272005-06 16.47 36.91 1.07 23.25 - 77.702006-07 15.98 36.78 0.43 20.72 - 73.922007-08 15.49 37.42 0.21 18.64 - 71.752008-09 15.85 (1) 35.44 0.04 18.83 - 70.162009-10 18.46 31.42 - (2) 23.61 - 73.492010-11 20.94 33.40 - 27.27 - 81.612011-12 20.88 31.76 - 29.66 - 82.302012-13 21.00 30.92 - 35.92 - 87.842013-14 19.36 32.98 - 36.06 - 88.402014-15 16.15 34.71 - 34.52 - 85.382015-16 26.49 34.12 - 30.89 - 91.502016-17 25.46 37.78 - 28.33 - 91.582017-18 22.28 41.26 - 27.89 - 91.432018-19 21.12 42.38 - 28.54 - 92.05
Notes: These data should be read in conjunction with the explanatory notes.
Data for the gambling revenue received by states and territories from 1 July 2000 onwards are not comparable with that of preceding years
because of the impact of changes brought about by the introduction of the GST.
(1) Includes community keno, from this period on.
(2) Interactive gaming licensees do not pay tax, from this period on.
NA = Not applicable
Percentage (%)
TOTAL GAMINGCASINO GAMINGGAMING
MACHINESINTERACTIVE
GAMINGLOTTERIES &
POOLSMINOR GAMING
(NA)
Australian Gambling Statistics, 1993–94 to 2018–19, 36th edition
465

TABLE NT 31NORTHERN TERRITORY
TOTAL SPORTSBETTING TURNOVER
1994-95 56.354 - - - 56.3541995-96 64.628 - - - 64.6281996-97 85.036 - - - 85.0361997-98 154.520 - - - 154.5201998-99 188.379 - - - 188.3791999-00 239.486 - - - 239.4862000-01 339.566 - - - 339.5662001-02 513.574 - 0.906 - 514.4802002-03 609.388 - 1.168 - 610.5562003-04 634.588 - 1.546 - 636.1342004-05 660.800 - 2.212 - 663.0122005-06 742.430 - 3.819 - 746.2492006-07 897.198 (1) - - (2) - 897.1982007-08 1,106.156 - - - 1,106.1562008-09 1,166.295 - - - 1,166.2952009-10 1,274.752 - - - 1,274.7522010-11 1,473.944 - - - 1,473.9442011-12 1,507.221 - - - 1,507.2212012-13 2,223.300 - - - 2,223.3002013-14 2,746.430 - - - 2,746.4302014-15 3,354.530 - - - 3,354.5302015-16 5,548.809 - - - 5,548.8092016-17 5,561.340 - - - 5,561.3402017-18 6,613.187 - - - 6,613.1872018-19 7,536.435 - - - 7,536.435
Notes: These data should be read in conjunction with the explanatory notes.
(1) Bookmaker fixed odds include TAB fixed odds, from this period on.
(2) TAB fixed odds are included with bookmaker fixed odds, from this period on.
NA = Not applicable
TOTAL SPORTSBETTING
Value ($ million)
BOOKMAKER (AND OTHER) FIXED ODDS
BOOKMAKER (AND OTHER)
POOL BETTING(NA)
TAB FIXED ODDSTAB TOTE ODDS
(NA)
Australian Gambling Statistics, 1993–94 to 2018–19, 36th edition
466
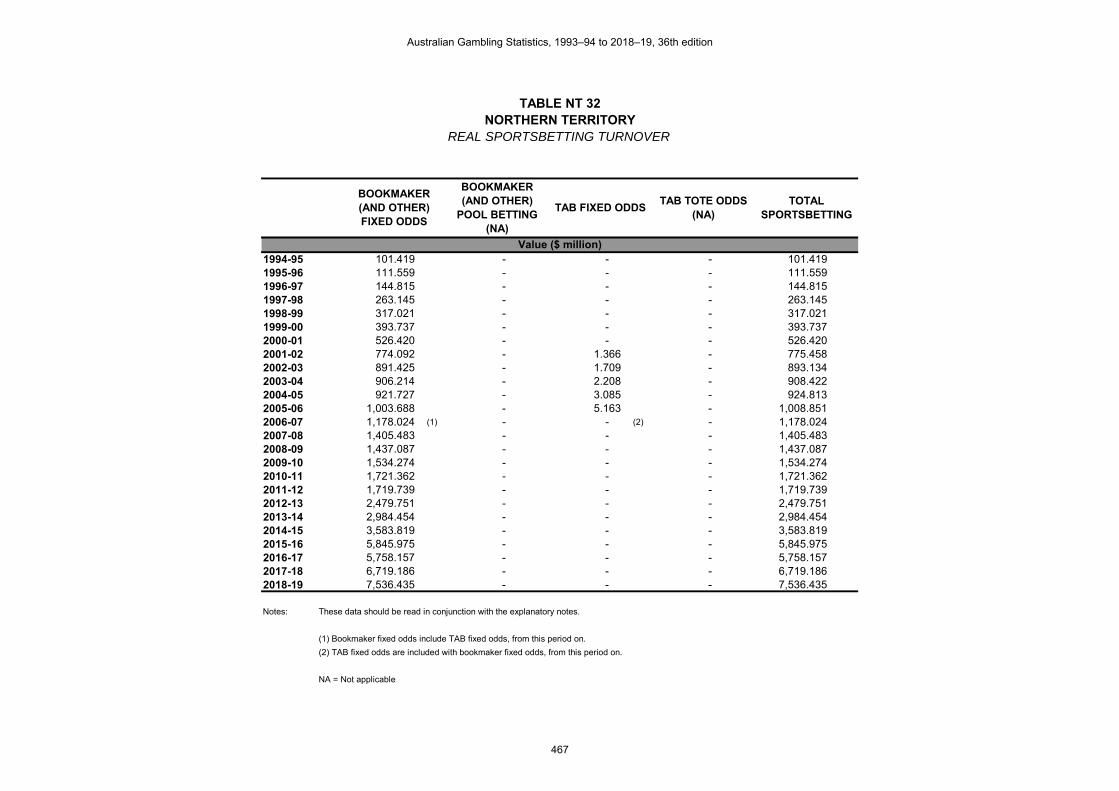
TABLE NT 32NORTHERN TERRITORY
REAL SPORTSBETTING TURNOVER
1994-95 101.419 - - - 101.4191995-96 111.559 - - - 111.5591996-97 144.815 - - - 144.8151997-98 263.145 - - - 263.1451998-99 317.021 - - - 317.0211999-00 393.737 - - - 393.7372000-01 526.420 - - - 526.4202001-02 774.092 - 1.366 - 775.4582002-03 891.425 - 1.709 - 893.1342003-04 906.214 - 2.208 - 908.4222004-05 921.727 - 3.085 - 924.8132005-06 1,003.688 - 5.163 - 1,008.8512006-07 1,178.024 (1) - - (2) - 1,178.0242007-08 1,405.483 - - - 1,405.4832008-09 1,437.087 - - - 1,437.0872009-10 1,534.274 - - - 1,534.2742010-11 1,721.362 - - - 1,721.3622011-12 1,719.739 - - - 1,719.7392012-13 2,479.751 - - - 2,479.7512013-14 2,984.454 - - - 2,984.4542014-15 3,583.819 - - - 3,583.8192015-16 5,845.975 - - - 5,845.9752016-17 5,758.157 - - - 5,758.1572017-18 6,719.186 - - - 6,719.1862018-19 7,536.435 - - - 7,536.435
Notes: These data should be read in conjunction with the explanatory notes.
(1) Bookmaker fixed odds include TAB fixed odds, from this period on.
(2) TAB fixed odds are included with bookmaker fixed odds, from this period on.
NA = Not applicable
TOTAL SPORTSBETTING
Value ($ million)
BOOKMAKER (AND OTHER) FIXED ODDS
BOOKMAKER (AND OTHER)
POOL BETTING(NA)
TAB FIXED ODDSTAB TOTE ODDS
(NA)
Australian Gambling Statistics, 1993–94 to 2018–19, 36th edition
467

TABLE NT 33NORTHERN TERRITORY
PER CAPITA SPORTSBETTING TURNOVER
1994-95 467.21 - - - 467.211995-96 519.38 - - - 519.381996-97 662.47 - - - 662.471997-98 1,173.77 - - - 1,173.771998-99 1,402.51 - - - 1,402.511999-00 1,747.14 - - - 1,747.142000-01 2,435.11 - - - 2,435.112001-02 3,643.14 - 6.43 - 3,649.572002-03 4,308.79 - 8.26 - 4,317.052003-04 4,469.72 - 10.89 - 4,480.612004-05 4,588.89 - 15.36 - 4,604.252005-06 5,053.60 - 26.00 - 5,079.602006-07 5,964.66 (1) - - (2) - 5,964.662007-08 7,125.57 - - - 7,125.572008-09 7,251.23 - - - 7,251.232009-10 7,707.15 - - - 7,707.152010-11 8,771.23 - - - 8,771.232011-12 8,804.22 - - - 8,804.222012-13 12,618.87 - - - 12,618.872013-14 15,282.78 - - - 15,282.782014-15 18,492.91 - - - 18,492.912015-16 30,376.89 - - - 30,376.892016-17 30,265.47 - - - 30,265.472017-18 35,843.35 - - - 35,843.352018-19 40,922.63 - - - 40,922.63
Notes: These data should be read in conjunction with the explanatory notes.
(1) Bookmaker fixed odds include TAB fixed odds, from this period on.
(2) TAB fixed odds are included with bookmaker fixed odds, from this period on.
NA = Not applicable
TOTAL SPORTSBETTING
Value ($)
BOOKMAKER (AND OTHER) FIXED ODDS
BOOKMAKER (AND OTHER)
POOL BETTING(NA)
TAB FIXED ODDSTAB TOTE ODDS
(NA)
Australian Gambling Statistics, 1993–94 to 2018–19, 36th edition
468

TABLE NT 34NORTHERN TERRITORY
REAL PER CAPITA SPORTSBETTING TURNOVER
1994-95 840.84 - - - 840.841995-96 896.54 - - - 896.541996-97 1,128.18 - - - 1,128.181997-98 1,998.92 - - - 1,998.921998-99 2,360.27 - - - 2,360.271999-00 2,872.45 - - - 2,872.452000-01 3,775.08 - - - 3,775.082001-02 5,491.19 - 9.69 - 5,500.872002-03 6,302.99 - 12.08 - 6,315.072003-04 6,382.91 - 15.55 - 6,398.462004-05 6,400.88 - 21.43 - 6,422.312005-06 6,831.94 - 35.14 - 6,867.092006-07 7,831.62 (1) - - (2) - 7,831.622007-08 9,053.76 - - - 9,053.762008-09 8,934.83 - - - 8,934.832009-10 9,276.23 - - - 9,276.232010-11 10,243.58 - - - 10,243.582011-12 10,045.62 - - - 10,045.622012-13 14,074.42 - - - 14,074.422013-14 16,607.29 - - - 16,607.292014-15 19,756.94 - - - 19,756.942015-16 32,003.72 - - - 32,003.722016-17 31,336.57 - - - 31,336.572017-18 36,417.86 - - - 36,417.862018-19 40,922.63 - - - 40,922.63
Notes: These data should be read in conjunction with the explanatory notes.
(1) Bookmaker fixed odds include TAB fixed odds, from this period on.
(2) TAB fixed odds are included with bookmaker fixed odds, from this period on.
NA = Not applicable
TOTAL SPORTSBETTING
Value ($)
BOOKMAKER (AND OTHER) FIXED ODDS
BOOKMAKER (AND OTHER)
POOL BETTING(NA)
TAB FIXED ODDSTAB TOTE ODDS
(NA)
Australian Gambling Statistics, 1993–94 to 2018–19, 36th edition
469

TABLE NT 35NORTHERN TERRITORY
TOTAL SPORTSBETTING EXPENDITURE
1994-95 2.666 - - - 2.6661995-96 2.676 - - - 2.6761996-97 6.644 - - - 6.6441997-98 10.450 - - - 10.4501998-99 8.559 - - - 8.5591999-00 16.689 - - - 16.6892000-01 19.890 - - - 19.8902001-02 37.982 - 0.021 - 38.0032002-03 40.088 - 0.027 - 40.1152003-04 62.684 - 0.036 - 62.7202004-05 37.900 - 0.051 - 37.9512005-06 41.272 - 0.458 - 41.7302006-07 50.046 (1) - - (2) - 50.0462007-08 67.900 - - - 67.9002008-09 62.445 - - - 62.4452009-10 83.984 - - - 83.9842010-11 80.867 - - - 80.8672011-12 112.383 - - - 112.3832012-13 158.494 - - - 158.4942013-14 203.113 - - - 203.1132014-15 285.700 - - - 285.7002015-16 380.556 - - - 380.5562016-17 460.880 - - - 460.8802017-18 551.244 - - - 551.2442018-19 551.062 - - - 551.062
Notes: These data should be read in conjunction with the explanatory notes.
(1) Bookmaker fixed odds include TAB fixed odds, from this period on.
(2) TAB fixed odds are included with bookmaker fixed odds, from this period on.
NA = Not applicable
TOTAL SPORTSBETTING
Value ($ million)
BOOKMAKER (AND OTHER) FIXED ODDS
BOOKMAKER (AND OTHER)
POOL BETTING(NA)
TAB FIXED ODDSTAB TOTE ODDS
(NA)
Australian Gambling Statistics, 1993–94 to 2018–19, 36th edition
470

TABLE NT 36NORTHERN TERRITORY
REAL SPORTSBETTING EXPENDITURE
1994-95 4.798 - - - 4.7981995-96 4.619 - - - 4.6191996-97 11.315 - - - 11.3151997-98 17.796 - - - 17.7961998-99 14.404 - - - 14.4041999-00 27.438 - - - 27.4382000-01 30.835 - - - 30.8352001-02 57.249 - 0.032 - 57.2812002-03 58.642 - 0.039 - 58.6812003-04 89.515 - 0.051 - 89.5662004-05 52.865 - 0.071 - 52.9372005-06 55.796 - 0.619 - 56.4152006-07 65.711 (1) - - (2) - 65.7112007-08 86.274 - - - 86.2742008-09 76.944 - - - 76.9442009-10 101.082 - - - 101.0822010-11 94.441 - - - 94.4412011-12 128.229 - - - 128.2292012-13 176.776 - - - 176.7762013-14 220.716 - - - 220.7162014-15 305.228 - - - 305.2282015-16 400.937 - - - 400.9372016-17 477.191 - - - 477.1912017-18 560.080 - - - 560.0802018-19 551.062 - - - 551.062
Notes: These data should be read in conjunction with the explanatory notes.
(1) Bookmaker fixed odds include TAB fixed odds, from this period on.
(2) TAB fixed odds are included with bookmaker fixed odds, from this period on.
NA = Not applicable
TOTAL SPORTSBETTING
Value ($ million)
BOOKMAKER (AND OTHER) FIXED ODDS
BOOKMAKER (AND OTHER)
POOL BETTING(NA)
TAB FIXED ODDSTAB TOTE ODDS
(NA)
Australian Gambling Statistics, 1993–94 to 2018–19, 36th edition
471

TABLE NT 37NORTHERN TERRITORY
PER CAPITA SPORTSBETTING EXPENDITURE
1994-95 22.10 - - - 22.101995-96 21.51 - - - 21.511996-97 51.76 - - - 51.761997-98 79.38 - - - 79.381998-99 63.72 - - - 63.721999-00 121.75 - - - 121.752000-01 142.64 - - - 142.642001-02 269.43 - 0.15 - 269.582002-03 283.45 - 0.19 - 283.642003-04 441.51 - 0.25 - 441.772004-05 263.19 - 0.35 - 263.552005-06 280.93 - 3.12 - 284.052006-07 332.71 (1) - - (2) - 332.712007-08 437.39 - - - 437.392008-09 388.24 - - - 388.242009-10 507.77 - - - 507.772010-11 481.23 - - - 481.232011-12 656.47 - - - 656.472012-13 899.57 - - - 899.572013-14 1,130.24 - - - 1,130.242014-15 1,575.01 - - - 1,575.012015-16 2,083.35 - - - 2,083.352016-17 2,508.17 - - - 2,508.172017-18 2,987.73 - - - 2,987.732018-19 2,992.25 - - - 2,992.25
Notes: These data should be read in conjunction with the explanatory notes.
(1) Bookmaker fixed odds include TAB fixed odds, from this period on.
(2) TAB fixed odds are included with bookmaker fixed odds, from this period on.
NA = Not applicable
TOTAL SPORTSBETTING
Value ($)
BOOKMAKER (AND OTHER) FIXED ODDS
BOOKMAKER (AND OTHER)
POOL BETTING(NA)
TAB FIXED ODDSTAB TOTE ODDS
(NA)
Australian Gambling Statistics, 1993–94 to 2018–19, 36th edition
472

TABLE NT 38NORTHERN TERRITORY
REAL PER CAPITA SPORTSBETTING EXPENDITURE
1994-95 39.78 - - - 39.781995-96 37.12 - - - 37.121996-97 88.15 - - - 88.151997-98 135.18 - - - 135.181998-99 107.24 - - - 107.241999-00 200.17 - - - 200.172000-01 221.12 - - - 221.122001-02 406.11 - 0.22 - 406.332002-03 414.64 - 0.28 - 414.922003-04 630.50 - 0.36 - 630.862004-05 367.12 - 0.49 - 367.612005-06 379.79 - 4.21 - 384.012006-07 436.85 (1) - - (2) - 436.852007-08 555.75 - - - 555.752008-09 478.38 - - - 478.382009-10 611.14 - - - 611.142010-11 562.00 - - - 562.002011-12 749.03 - - - 749.032012-13 1,003.33 - - - 1,003.332013-14 1,228.20 - - - 1,228.202014-15 1,682.66 - - - 1,682.662015-16 2,194.92 - - - 2,194.922016-17 2,596.93 - - - 2,596.932017-18 3,035.62 - - - 3,035.622018-19 2,992.25 - - - 2,992.25
Notes: These data should be read in conjunction with the explanatory notes.
(1) Bookmaker fixed odds include TAB fixed odds, from this period on.
(2) TAB fixed odds are included with bookmaker fixed odds, from this period on.
NA = Not applicable
TOTAL SPORTSBETTING
Value ($)
BOOKMAKER (AND OTHER) FIXED ODDS
BOOKMAKER (AND OTHER)
POOL BETTING(NA)
TAB FIXED ODDSTAB TOTE ODDS
(NA)
Australian Gambling Statistics, 1993–94 to 2018–19, 36th edition
473

TABLE NT 39NORTHERN TERRITORY
SPORTSBETTING EXPENDITUREAS A % OF HDI
1994-95 0.088 - - - 0.0881995-96 0.081 - - - 0.0811996-97 0.190 - - - 0.1901997-98 0.293 - - - 0.2931998-99 0.220 - - - 0.2201999-00 0.385 - - - 0.3852000-01 0.411 - - - 0.4112001-02 0.714 - 0.000 - 0.7142002-03 0.757 - 0.001 - 0.7572003-04 1.116 - 0.001 - 1.1172004-05 0.593 - 0.001 - 0.5942005-06 0.576 - 0.006 - 0.5822006-07 0.647 (1) - - (2) - 0.6472007-08 0.799 - - - 0.7992008-09 0.652 - - - 0.6522009-10 0.800 - - - 0.8002010-11 0.726 - - - 0.7262011-12 0.939 - - - 0.9392012-13 1.238 - - - 1.2382013-14 1.459 - - - 1.4592014-15 1.906 - - - 1.9062015-16 2.453 - - - 2.4532016-17 2.905 - - - 2.9052017-18 3.431 - - - 3.4312018-19 3.522 - - - 3.522
Notes: These data should be read in conjunction with the explanatory notes.
(1) Bookmaker fixed odds include TAB fixed odds, from this period on.
(2) TAB fixed odds are included with bookmaker fixed odds, from this period on.
NA = Not applicable
Percentage (%)
BOOKMAKER (AND OTHER) FIXED ODDS
BOOKMAKER (AND OTHER)
POOL BETTING(NA)
TAB FIXED ODDSTAB TOTE ODDS
(NA)TOTAL
SPORTSBETTING
Australian Gambling Statistics, 1993–94 to 2018–19, 36th edition
474

TABLE NT 40NORTHERN TERRITORY
SPORTSBETTING EXPENDITURESHARE OF MARKET
1994-95 100.00 - - -1995-96 100.00 - - -1996-97 100.00 - - -1997-98 100.00 - - -1998-99 100.00 - - -1999-00 100.00 - - -2000-01 100.00 - - -2001-02 99.94 - 0.06 -2002-03 99.93 - 0.07 -2003-04 99.94 - 0.06 -2004-05 99.87 - 0.13 -2005-06 98.90 - 1.10 -2006-07 100.00 (1) - - (2) -2007-08 100.00 - - -2008-09 100.00 - - -2009-10 100.00 - - -2010-11 100.00 - - -2011-12 100.00 - - -2012-13 100.00 - - -2013-14 100.00 - - -2014-15 100.00 - - -2015-16 100.00 - - -2016-17 100.00 - - -2017-18 100.00 - - -2018-19 100.00 - - -
Notes: These data should be read in conjunction with the explanatory notes.
(1) Bookmaker fixed odds include TAB fixed odds, from this period on.
(2) TAB fixed odds are included with bookmaker fixed odds, from this period on.
NA = Not applicable
TAB FIXED ODDSTAB TOTE ODDS
(NA)
Percentage (%)
BOOKMAKER (AND OTHER) FIXED ODDS
BOOKMAKER (AND OTHER)
POOL BETTING(NA)
Australian Gambling Statistics, 1993–94 to 2018–19, 36th edition
475

TABLE NT 41NORTHERN TERRITORY
GOVERNMENT REVENUE FROM SPORTSBETTING
1994-95 0.507 - - - 0.5071995-96 0.289 - - - 0.2891996-97 0.362 - - - 0.3621997-98 0.592 - - - 0.5921998-99 0.696 - - - 0.6961999-00 0.867 - - - 0.8672000-01 0.568 - - - 0.5682001-02 0.881 - - - 0.8812002-03 1.107 - - - 1.1072003-04 0.938 - - - 0.9382004-05 0.876 - - - 0.8762005-06 0.783 - - - 0.7832006-07 0.774 - - - 0.7742007-08 0.853 - - - 0.8532008-09 0.671 - - - 0.6712009-10 0.193 (1) - - - 0.1932010-11 - (2) - - - -2011-12 - - - - -2012-13 - - - - -2013-14 - - - - -2014-15 - - - - -2015-16 - - - - -2016-17 - - - - -2017-18 - - - - -2018-19 - - - - -
Notes: These data should be read in conjunction with the explanatory notes.
Data for the gambling revenue received by states and territories from 1 July 2000 onwards are not comparable with that of preceding
years because of the impact of changes brought about by the introduction of the GST.
(1) Changes in taxes payable by bookmakers were introduced in January 2010.
(2) Gross profit tax is not based on turnover and is capped. Therefore this cannot be determined as relative to racing or sports.
As a consequence, all revenue is reported as racing revenue.
NA = Not applicable
TOTAL SPORTSBETTING
Value ($ million)
BOOKMAKER (AND OTHER) FIXED ODDS
BOOKMAKER (AND OTHER)
POOL BETTING(NA)
TAB FIXED ODDS(NA)
TAB TOTE ODDS(NA)
Australian Gambling Statistics, 1993–94 to 2018–19, 36th edition
476

TABLE NT 42NORTHERN TERRITORY
REAL GOVERNMENT REVENUE FROM SPORTSBETTING
1994-95 0.912 - - - 0.9121995-96 0.499 - - - 0.4991996-97 0.616 - - - 0.6161997-98 1.008 - - - 1.0081998-99 1.171 - - - 1.1711999-00 1.425 - - - 1.4252000-01 0.881 - - - 0.8812001-02 1.328 - - - 1.3282002-03 1.619 - - - 1.6192003-04 1.339 - - - 1.3392004-05 1.222 - - - 1.2222005-06 1.059 - - - 1.0592006-07 1.016 - - - 1.0162007-08 1.084 - - - 1.0842008-09 0.827 - - - 0.8272009-10 0.232 (1) - - - 0.2322010-11 - (2) - - - -2011-12 - - - - -2012-13 - - - - -2013-14 - - - - -2014-15 - - - - -2015-16 - - - - -2016-17 - - - - -2017-18 - - - - -2018-19 - - - - -
Notes: These data should be read in conjunction with the explanatory notes.
Data for the gambling revenue received by states and territories from 1 July 2000 onwards are not comparable with that of preceding
years because of the impact of changes brought about by the introduction of the GST.
(1) Changes in taxes payable by bookmakers were introduced in January 2010.
(2) Gross profit tax is not based on turnover and is capped. Therefore this cannot be determined as relative to racing or sports.
As a consequence, all revenue is reported as racing revenue.
NA = Not applicable
TOTAL SPORTSBETTING
Value ($ million)
BOOKMAKER (AND OTHER) FIXED ODDS
BOOKMAKER (AND OTHER)
POOL BETTING(NA)
TAB FIXED ODDS(NA)
TAB TOTE ODDS(NA)
Australian Gambling Statistics, 1993–94 to 2018–19, 36th edition
477

TABLE NT 43NORTHERN TERRITORY
PER CAPITA REVENUE FROM SPORTSBETTING
1994-95 4.20 - - - 4.201995-96 2.32 - - - 2.321996-97 2.82 - - - 2.821997-98 4.50 - - - 4.501998-99 5.18 - - - 5.181999-00 6.33 - - - 6.332000-01 4.07 - - - 4.072001-02 6.25 - - - 6.252002-03 7.83 - - - 7.832003-04 6.61 - - - 6.612004-05 6.08 - - - 6.082005-06 5.33 - - - 5.332006-07 5.15 - - - 5.152007-08 5.49 - - - 5.492008-09 4.17 - - - 4.172009-10 1.17 (1) - - - 1.172010-11 - (2) - - - -2011-12 - - - - -2012-13 - - - - -2013-14 - - - - -2014-15 - - - - -2015-16 - - - - -2016-17 - - - - -2017-18 - - - - -2018-19 - - - - -
Notes: These data should be read in conjunction with the explanatory notes.
Data for the gambling revenue received by states and territories from 1 July 2000 onwards are not comparable with that of preceding
years because of the impact of changes brought about by the introduction of the GST.
(1) Changes in taxes payable by bookmakers were introduced in January 2010.
(2) Gross profit tax is not based on turnover and is capped. Therefore this cannot be determined as relative to racing or sports.
As a consequence, all revenue is reported as racing revenue.
NA = Not applicable
TOTAL SPORTSBETTING
Value ($)
BOOKMAKER (AND OTHER) FIXED ODDS
BOOKMAKER (AND OTHER)
POOL BETTING(NA)
TAB FIXED ODDS(NA)
TAB TOTE ODDS(NA)
Australian Gambling Statistics, 1993–94 to 2018–19, 36th edition
478

TABLE NT 44NORTHERN TERRITORY
REAL PER CAPITA REVENUE FROM SPORTSBETTING
1994-95 7.56 - - - 7.561995-96 4.01 - - - 4.011996-97 4.80 - - - 4.801997-98 7.66 - - - 7.661998-99 8.72 - - - 8.721999-00 10.40 - - - 10.402000-01 6.31 - - - 6.312001-02 9.42 - - - 9.422002-03 11.45 - - - 11.452003-04 9.43 - - - 9.432004-05 8.49 - - - 8.492005-06 7.21 - - - 7.212006-07 6.76 - - - 6.762007-08 6.98 - - - 6.982008-09 5.14 - - - 5.142009-10 1.40 (1) - - - 1.402010-11 - (2) - - - -2011-12 - - - - -2012-13 - - - - -2013-14 - - - - -2014-15 - - - - -2015-16 - - - - -2016-17 - - - - -2017-18 - - - - -2018-19 - - - - -
Notes: These data should be read in conjunction with the explanatory notes.
Data for the gambling revenue received by states and territories from 1 July 2000 onwards are not comparable with that of preceding
years because of the impact of changes brought about by the introduction of the GST.
(1) Changes in taxes payable by bookmakers were introduced in January 2010.
(2) Gross profit tax is not based on turnover and is capped. Therefore this cannot be determined as relative to racing or sports.
As a consequence, all revenue is reported as racing revenue.
NA = Not applicable
TOTAL SPORTSBETTING
Value ($)
BOOKMAKER (AND OTHER) FIXED ODDS
BOOKMAKER (AND OTHER)
POOL BETTING(NA)
TAB FIXED ODDS(NA)
TAB TOTE ODDS(NA)
Australian Gambling Statistics, 1993–94 to 2018–19, 36th edition
479

TABLE NT 45NORTHERN TERRITORY
GOVERNMENT REVENUE FROM SPORTSBETTINGAS A % OF TOTAL GAMBLING REVENUE
1994-95 3.16 - - - 3.161995-96 1.43 - - - 1.431996-97 1.46 - - - 1.461997-98 2.09 - - - 2.091998-99 2.23 - - - 2.231999-00 2.33 - - - 2.332000-01 1.85 - - - 1.852001-02 2.65 - - - 2.652002-03 3.10 - - - 3.102003-04 2.45 - - - 2.452004-05 1.92 - - - 1.922005-06 1.42 - - - 1.422006-07 1.22 - - - 1.222007-08 1.20 - - - 1.202008-09 0.92 - - - 0.922009-10 0.32 (1) - - - 0.322010-11 - (2) - - - -2011-12 - - - - -2012-13 - - - - -2013-14 - - - - -2014-15 - - - - -2015-16 - - - - -2016-17 - - - - -2017-18 - - - - -2018-19 - - - - -
Notes: These data should be read in conjunction with the explanatory notes.
Data for the gambling revenue received by states and territories from 1 July 2000 onwards are not comparable with that of preceding
years because of the impact of changes brought about by the introduction of the GST.
(1) Changes in taxes payable by bookmakers were introduced in January 2010.
(2) Gross profit tax is not based on turnover and is capped. Therefore this cannot be determined as relative to racing or sports.
As a consequence, all revenue is reported as racing revenue.
NA = Not applicable
Percentage (%)
BOOKMAKER (AND OTHER) FIXED ODDS
BOOKMAKER (AND OTHER)
POOL BETTING(NA)
TAB FIXED ODDS(NA)
TAB TOTE ODDS(NA)
TOTAL SPORTSBETTING
Australian Gambling Statistics, 1993–94 to 2018–19, 36th edition
480

TABLE NT 46NORTHERN TERRITORY
TOTAL GAMBLING TURNOVER
1993-94 350.337 86.843 - 437.1801994-95 407.634 102.180 56.354 566.1681995-96 633.066 150.560 64.628 848.2541996-97 625.559 165.519 85.036 876.1141997-98 724.762 159.963 154.520 1,039.2451998-99 831.388 177.370 188.379 1,197.1371999-00 1,027.003 183.266 239.486 1,449.7552000-01 1,290.770 275.310 339.566 1,905.6462001-02 1,409.873 619.863 514.480 2,544.2162002-03 1,608.537 939.939 610.556 3,159.0322003-04 1,597.181 1,207.199 636.134 3,440.5142004-05 1,736.617 1,648.357 663.012 4,047.9862005-06 1,904.578 1,891.594 746.249 4,542.4212006-07 1,821.623 2,871.428 897.198 5,590.2492007-08 1,964.921 3,170.276 1,106.156 6,241.3532008-09 2,047.321 3,685.792 1,166.295 6,899.4082009-10 1,904.288 4,078.668 1,274.752 7,257.7082010-11 1,787.788 4,203.954 1,473.944 7,465.6872011-12 1,828.807 4,361.745 1,507.221 7,697.7732012-13 1,838.649 5,071.888 2,223.300 9,133.8372013-14 1,939.396 5,877.139 2,746.430 10,562.9652014-15 2,106.571 6,379.765 3,354.530 11,840.8672015-16 2,135.174 7,286.013 5,548.809 14,969.9962016-17 2,143.570 10,644.976 5,561.340 18,349.8862017-18 2,387.688 12,685.338 6,613.187 21,686.2132018-19 2,383.500 14,573.508 7,536.435 24,493.443
Notes: These data should be read in conjunction with the explanatory notes.
Figure(s) may be incomplete for any period due to some unavailable turnover figures that are used to derive these numbers.
Value ($ million)
GAMING RACING SPORTSBETTING TOTAL GAMBLING
Australian Gambling Statistics, 1993–94 to 2018–19, 36th edition
481

TABLE NT 47NORTHERN TERRITORY
REAL GAMBLING TURNOVER
1993-94 651.033 161.381 - 812.4141994-95 733.613 183.892 101.419 1,018.9241995-96 1,092.781 259.893 111.559 1,464.2331996-97 1,065.318 281.876 144.815 1,492.0091997-98 1,234.259 272.415 263.145 1,769.8191998-99 1,399.135 298.494 317.021 2,014.6511999-00 1,688.488 301.306 393.737 2,383.5312000-01 2,001.044 426.805 526.420 2,954.2692001-02 2,125.054 934.298 775.458 3,834.8102002-03 2,353.001 1,374.962 893.134 4,621.0972003-04 2,280.830 1,723.922 908.422 4,913.1752004-05 2,422.347 2,299.236 924.813 5,646.3962005-06 2,574.791 2,557.238 1,008.851 6,140.8802006-07 2,391.797 3,770.195 1,178.024 7,340.0162007-08 2,496.632 4,028.157 1,405.483 7,930.2722008-09 2,522.671 4,541.564 1,437.087 8,501.3232009-10 2,291.975 4,909.030 1,534.274 8,735.2792010-11 2,087.887 4,909.633 1,721.362 8,718.8832011-12 2,086.669 4,976.751 1,719.739 8,783.1592012-13 2,050.731 5,656.915 2,479.751 10,187.3972013-14 2,107.477 6,386.491 2,984.454 11,478.4222014-15 2,250.560 6,815.835 3,583.819 12,650.2142015-16 2,249.523 7,676.215 5,845.975 15,771.7142016-17 2,219.431 11,021.704 5,758.157 18,999.2922017-18 2,425.959 12,888.665 6,719.186 22,033.8102018-19 2,383.500 14,573.508 7,536.435 24,493.443
Notes: These data should be read in conjunction with the explanatory notes.
Figure(s) may be incomplete for any period due to some unavailable turnover figures that are used to derive these numbers.
Value ($ million)
GAMING RACING SPORTSBETTING TOTAL GAMBLING
Australian Gambling Statistics, 1993–94 to 2018–19, 36th edition
482

TABLE NT 48NORTHERN TERRITORY
PER CAPITA GAMBLING TURNOVER
1993-94 2,983.93 739.67 - 3,723.601994-95 3,379.56 847.14 467.21 4,693.911995-96 5,087.61 1,209.97 519.38 6,816.951996-97 4,873.40 1,289.47 662.47 6,825.341997-98 5,505.47 1,215.12 1,173.77 7,894.361998-99 6,189.81 1,320.55 1,402.51 8,912.871999-00 7,492.35 1,336.99 1,747.14 10,576.482000-01 9,256.41 1,974.31 2,435.11 13,665.832001-02 10,001.23 4,397.13 3,649.57 18,047.932002-03 11,373.46 6,646.01 4,317.05 22,336.522003-04 11,249.73 8,502.90 4,480.61 24,233.242004-05 12,059.84 11,446.92 4,604.25 28,111.012005-06 12,964.16 12,875.78 5,079.60 30,919.552006-07 12,110.33 19,089.53 5,964.66 37,164.512007-08 12,657.52 20,422.10 7,125.57 40,205.192008-09 12,728.85 22,915.75 7,251.23 42,895.832009-10 11,513.33 24,659.64 7,707.15 43,880.132010-11 10,638.87 25,017.13 8,771.23 44,427.242011-12 10,682.72 25,478.52 8,804.22 44,965.462012-13 10,435.69 28,786.71 12,618.87 51,841.282013-14 10,791.96 32,703.92 15,282.78 58,778.652014-15 11,613.14 35,170.47 18,492.91 65,276.522015-16 11,688.99 39,887.19 30,376.89 81,953.062016-17 11,665.56 57,931.21 30,265.47 99,862.242017-18 12,941.22 68,754.29 35,843.35 117,538.862018-19 12,942.34 79,133.75 40,922.63 132,998.72
Notes: These data should be read in conjunction with the explanatory notes.
Figure(s) may be incomplete for any period due to some unavailable turnover figures that are used to derive these numbers.
Value ($)
GAMING RACING SPORTSBETTING TOTAL GAMBLING
Australian Gambling Statistics, 1993–94 to 2018–19, 36th edition
483

TABLE NT 49NORTHERN TERRITORY
REAL PER CAPITA GAMBLING TURNOVER
1993-94 5,545.05 1,374.53 - 6,919.581994-95 6,082.14 1,524.59 840.84 8,447.561995-96 8,782.08 2,088.61 896.54 11,767.241996-97 8,299.32 2,195.95 1,128.18 11,623.451997-98 9,375.73 2,069.33 1,998.92 13,443.981998-99 10,416.78 2,222.34 2,360.27 14,999.391999-00 12,318.12 2,198.14 2,872.45 17,388.712000-01 14,349.96 3,060.72 3,775.08 21,185.762001-02 15,074.51 6,627.64 5,500.87 27,203.022002-03 16,637.33 9,721.92 6,315.07 32,674.322003-04 16,065.01 12,142.44 6,398.46 34,605.912004-05 16,821.86 15,966.92 6,422.31 39,211.082005-06 17,526.20 17,406.72 6,867.09 41,800.002006-07 15,900.90 25,064.62 7,831.62 48,797.132007-08 16,082.66 25,948.35 9,053.76 51,084.772008-09 15,684.25 28,236.36 8,934.83 52,855.442009-10 13,857.29 29,680.02 9,276.23 52,813.532010-11 12,424.72 29,216.53 10,243.58 51,884.832011-12 12,188.98 29,071.00 10,045.62 51,305.592012-13 11,639.42 32,107.17 14,074.42 57,821.012013-14 11,727.26 35,538.26 16,607.29 63,872.802014-15 12,406.92 37,574.44 19,756.94 69,738.302015-16 12,314.99 42,023.34 32,003.72 86,342.052016-17 12,078.41 59,981.41 31,336.57 103,396.382017-18 13,148.65 69,856.32 36,417.86 119,422.832018-19 12,942.34 79,133.75 40,922.63 132,998.72
Notes: These data should be read in conjunction with the explanatory notes.
Figure(s) may be incomplete for any period due to some unavailable turnover figures that are used to derive these numbers.
Value ($)
GAMING RACING SPORTSBETTING TOTAL GAMBLING
Australian Gambling Statistics, 1993–94 to 2018–19, 36th edition
484

TABLE NT 50NORTHERN TERRITORY
TOTAL GAMBLING EXPENDITURE
1993-94 47.573 12.838 - 60.4111994-95 52.335 14.355 2.666 69.3561995-96 79.360 15.677 2.676 97.7131996-97 75.220 18.495 6.644 100.3591997-98 82.276 18.403 10.450 111.1291998-99 93.358 20.353 8.559 122.2701999-00 108.560 22.465 16.689 147.7142000-01 126.047 24.818 19.890 170.7552001-02 134.851 43.979 38.003 216.8332002-03 146.751 63.529 40.115 250.3952003-04 153.787 50.832 62.720 267.3392004-05 164.754 69.684 37.951 272.3892005-06 186.145 91.437 41.730 319.3122006-07 191.716 149.483 50.046 391.2452007-08 209.588 166.488 67.900 443.9762008-09 219.929 218.055 62.445 500.4292009-10 206.576 252.509 83.984 543.0692010-11 190.464 298.922 80.867 570.2522011-12 200.845 379.620 112.383 692.8482012-13 209.457 452.913 158.494 820.8642013-14 223.395 513.137 203.113 939.6442014-15 243.798 651.899 285.700 1,181.3962015-16 246.795 823.759 380.556 1,451.1102016-17 245.990 1,148.141 460.880 1,855.0122017-18 258.346 1,393.406 551.244 2,202.9962018-19 259.580 1,512.229 551.062 2,322.871
Notes: These data should be read in conjunction with the explanatory notes.
Figure(s) may be incomplete for any period due to some unavailable expenditure figures that are used to derive these numbers.
Value ($ million)
GAMING RACING SPORTSBETTING TOTAL GAMBLING
Australian Gambling Statistics, 1993–94 to 2018–19, 36th edition
485
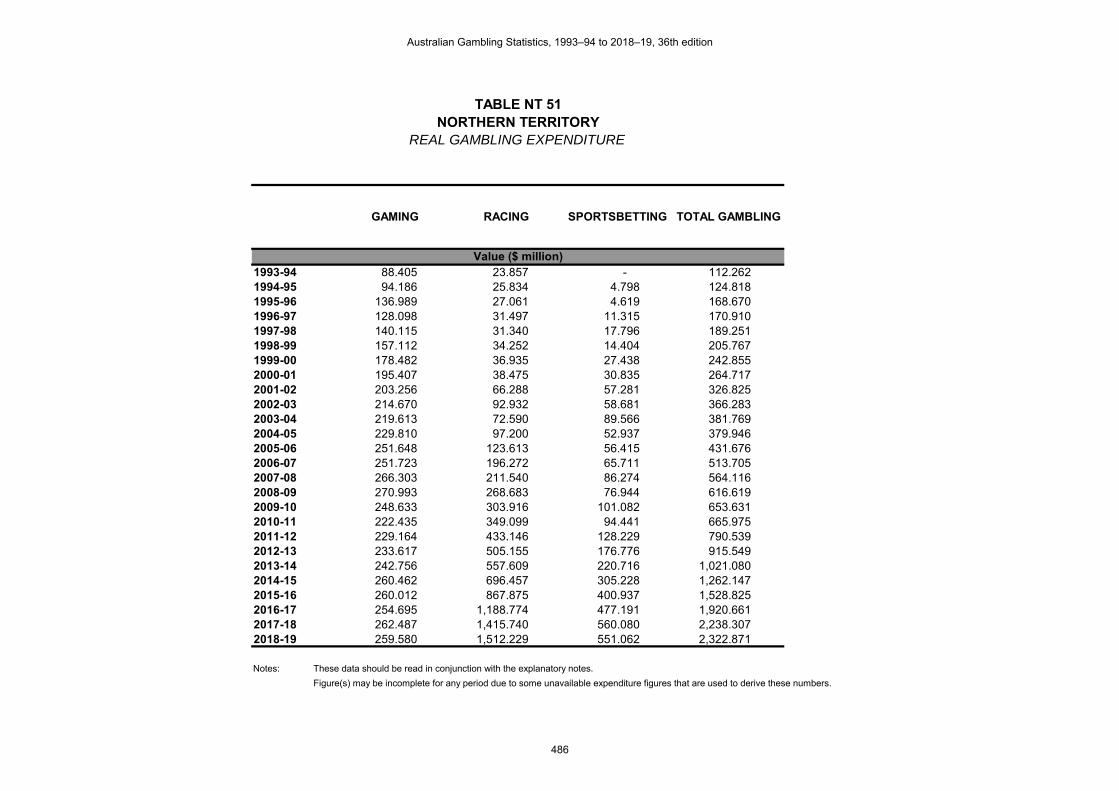
TABLE NT 51NORTHERN TERRITORY
REAL GAMBLING EXPENDITURE
1993-94 88.405 23.857 - 112.2621994-95 94.186 25.834 4.798 124.8181995-96 136.989 27.061 4.619 168.6701996-97 128.098 31.497 11.315 170.9101997-98 140.115 31.340 17.796 189.2511998-99 157.112 34.252 14.404 205.7671999-00 178.482 36.935 27.438 242.8552000-01 195.407 38.475 30.835 264.7172001-02 203.256 66.288 57.281 326.8252002-03 214.670 92.932 58.681 366.2832003-04 219.613 72.590 89.566 381.7692004-05 229.810 97.200 52.937 379.9462005-06 251.648 123.613 56.415 431.6762006-07 251.723 196.272 65.711 513.7052007-08 266.303 211.540 86.274 564.1162008-09 270.993 268.683 76.944 616.6192009-10 248.633 303.916 101.082 653.6312010-11 222.435 349.099 94.441 665.9752011-12 229.164 433.146 128.229 790.5392012-13 233.617 505.155 176.776 915.5492013-14 242.756 557.609 220.716 1,021.0802014-15 260.462 696.457 305.228 1,262.1472015-16 260.012 867.875 400.937 1,528.8252016-17 254.695 1,188.774 477.191 1,920.6612017-18 262.487 1,415.740 560.080 2,238.3072018-19 259.580 1,512.229 551.062 2,322.871
Notes: These data should be read in conjunction with the explanatory notes.
Figure(s) may be incomplete for any period due to some unavailable expenditure figures that are used to derive these numbers.
Value ($ million)
GAMING RACING SPORTSBETTING TOTAL GAMBLING
Australian Gambling Statistics, 1993–94 to 2018–19, 36th edition
486

TABLE NT 52NORTHERN TERRITORY
PER CAPITA GAMBLING EXPENDITURE
1993-94 405.19 109.35 - 514.541994-95 433.89 119.01 22.10 575.001995-96 637.77 125.99 21.51 785.271996-97 586.00 144.08 51.76 781.841997-98 624.99 139.79 79.38 844.161998-99 695.07 151.53 63.72 910.321999-00 791.98 163.89 121.75 1,077.622000-01 903.91 177.98 142.64 1,224.522001-02 956.59 311.97 269.58 1,538.152002-03 1,037.63 449.19 283.64 1,770.462003-04 1,083.20 358.03 441.77 1,883.002004-05 1,144.13 483.92 263.55 1,891.592005-06 1,267.06 622.40 284.05 2,173.502006-07 1,274.54 993.78 332.71 2,601.032007-08 1,350.11 1,072.47 437.39 2,859.982008-09 1,367.37 1,355.72 388.24 3,111.332009-10 1,248.96 1,526.67 507.77 3,283.402010-11 1,133.42 1,778.84 481.23 3,393.492011-12 1,173.21 2,217.50 656.47 4,047.172012-13 1,188.82 2,570.62 899.57 4,659.012013-14 1,243.10 2,855.40 1,130.24 5,228.742014-15 1,344.01 3,593.80 1,575.01 6,512.822015-16 1,351.08 4,509.66 2,083.35 7,944.092016-17 1,338.71 6,248.32 2,508.17 10,095.192017-18 1,400.23 7,552.23 2,987.73 11,940.202018-19 1,409.51 8,211.36 2,992.25 12,613.13
Notes: These data should be read in conjunction with the explanatory notes.
Figure(s) may be incomplete for any period due to some unavailable expenditure figures that are used to derive these numbers.
Value ($)
GAMING RACING SPORTSBETTING TOTAL GAMBLING
Australian Gambling Statistics, 1993–94 to 2018–19, 36th edition
487
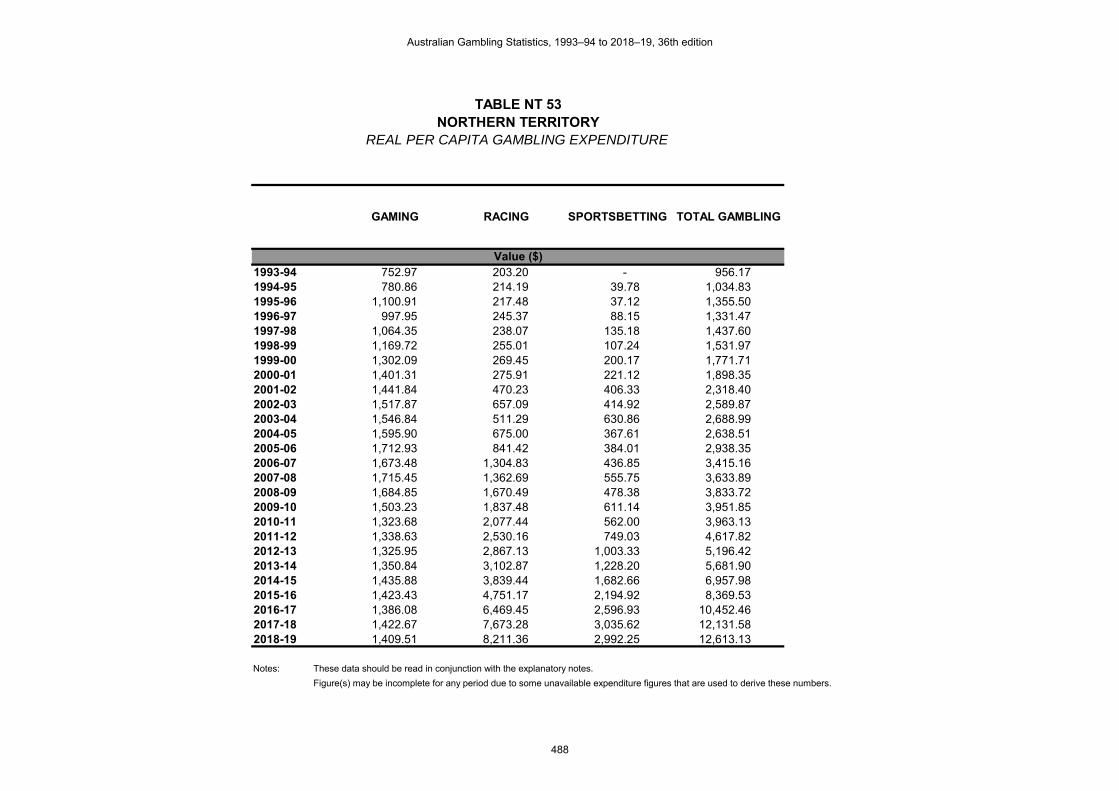
TABLE NT 53NORTHERN TERRITORY
REAL PER CAPITA GAMBLING EXPENDITURE
1993-94 752.97 203.20 - 956.171994-95 780.86 214.19 39.78 1,034.831995-96 1,100.91 217.48 37.12 1,355.501996-97 997.95 245.37 88.15 1,331.471997-98 1,064.35 238.07 135.18 1,437.601998-99 1,169.72 255.01 107.24 1,531.971999-00 1,302.09 269.45 200.17 1,771.712000-01 1,401.31 275.91 221.12 1,898.352001-02 1,441.84 470.23 406.33 2,318.402002-03 1,517.87 657.09 414.92 2,589.872003-04 1,546.84 511.29 630.86 2,688.992004-05 1,595.90 675.00 367.61 2,638.512005-06 1,712.93 841.42 384.01 2,938.352006-07 1,673.48 1,304.83 436.85 3,415.162007-08 1,715.45 1,362.69 555.75 3,633.892008-09 1,684.85 1,670.49 478.38 3,833.722009-10 1,503.23 1,837.48 611.14 3,951.852010-11 1,323.68 2,077.44 562.00 3,963.132011-12 1,338.63 2,530.16 749.03 4,617.822012-13 1,325.95 2,867.13 1,003.33 5,196.422013-14 1,350.84 3,102.87 1,228.20 5,681.902014-15 1,435.88 3,839.44 1,682.66 6,957.982015-16 1,423.43 4,751.17 2,194.92 8,369.532016-17 1,386.08 6,469.45 2,596.93 10,452.462017-18 1,422.67 7,673.28 3,035.62 12,131.582018-19 1,409.51 8,211.36 2,992.25 12,613.13
Notes: These data should be read in conjunction with the explanatory notes.
Figure(s) may be incomplete for any period due to some unavailable expenditure figures that are used to derive these numbers.
Value ($)
GAMING RACING SPORTSBETTING TOTAL GAMBLING
Australian Gambling Statistics, 1993–94 to 2018–19, 36th edition
488

TABLE NT 54NORTHERN TERRITORY
GAMBLING EXPENDITUREAS A % OF HDI
1993-94 1.790 0.483 - 2.2731994-95 1.720 0.472 0.088 2.2801995-96 2.404 0.475 0.081 2.9601996-97 2.148 0.528 0.190 2.8661997-98 2.307 0.516 0.293 3.1151998-99 2.398 0.523 0.220 3.1411999-00 2.501 0.518 0.385 3.4042000-01 2.608 0.513 0.411 3.5322001-02 2.534 0.826 0.714 4.0742002-03 2.770 1.199 0.757 4.7272003-04 2.738 0.905 1.117 4.7592004-05 2.579 1.091 0.594 4.2642005-06 2.597 1.275 0.582 4.4542006-07 2.480 1.933 0.647 5.0602007-08 2.465 1.958 0.799 5.2222008-09 2.297 2.278 0.652 5.2282009-10 1.968 2.405 0.800 5.1732010-11 1.709 2.683 0.726 5.1182011-12 1.678 3.172 0.939 5.7902012-13 1.635 3.536 1.238 6.4092013-14 1.605 3.687 1.459 6.7512014-15 1.627 4.350 1.906 7.8832015-16 1.591 5.311 2.453 9.3552016-17 1.550 7.236 2.905 11.6922017-18 1.608 8.674 3.431 13.7132018-19 1.659 9.666 3.522 14.847
Notes: These data should be read in conjunction with the explanatory notes.
Figure(s) may be incomplete for any period due to some unavailable expenditure figures that are used to derive these numbers.
RACING SPORTSBETTING TOTAL GAMBLING
Percentage (%)
GAMING
Australian Gambling Statistics, 1993–94 to 2018–19, 36th edition
489

TABLE NT 55NORTHERN TERRITORY
GAMBLING EXPENDITUREAS A % OF TOTAL GAMBLING EXPENDITURE
1993-94 78.75 21.25 -1994-95 75.46 20.70 3.841995-96 81.22 16.04 2.741996-97 74.95 18.43 6.621997-98 74.04 16.56 9.401998-99 76.35 16.65 7.001999-00 73.49 15.21 11.302000-01 73.82 14.53 11.652001-02 62.19 20.28 17.532002-03 58.61 25.37 16.022003-04 57.53 19.01 23.462004-05 60.48 25.58 13.932005-06 58.30 28.64 13.072006-07 49.00 38.21 12.792007-08 47.21 37.50 15.292008-09 43.95 43.57 12.482009-10 38.04 46.50 15.462010-11 33.40 52.42 14.182011-12 28.99 54.79 16.222012-13 25.52 55.18 19.312013-14 23.77 54.61 21.622014-15 20.64 55.18 24.182015-16 17.01 56.77 26.232016-17 13.26 61.89 24.852017-18 11.73 63.25 25.022018-19 11.17 65.10 23.72
Notes: These data should be read in conjunction with the explanatory notes.
Figure(s) may be incomplete for any period due to some unavailable expenditure figures that are used to derive these numbers.
Percentage (%)
GAMING RACING SPORTSBETTING
Australian Gambling Statistics, 1993–94 to 2018–19, 36th edition
490

TABLE NT 56NORTHERN TERRITORY
GOVERNMENT REVENUE FROM GAMBLING
1993-94 11.221 2.284 - 13.5051994-95 12.783 2.729 0.507 16.0191995-96 16.474 3.480 0.289 20.2431996-97 20.921 3.526 0.362 24.8091997-98 24.198 3.482 0.592 28.2721998-99 26.178 4.365 0.696 31.2391999-00 29.618 6.714 0.867 37.1992000-01 23.269 6.907 0.568 30.7442001-02 25.720 6.590 0.881 33.1912002-03 26.647 7.930 1.107 35.6842003-04 28.873 8.539 0.938 38.3502004-05 34.303 10.397 0.876 45.5762005-06 42.870 11.519 0.783 55.1722006-07 46.792 15.733 0.774 63.2992007-08 51.169 19.292 0.853 71.3142008-09 51.324 21.153 0.671 73.1482009-10 44.528 15.871 0.193 60.5912010-11 40.794 9.190 - 49.9852011-12 43.732 9.405 - 53.1372012-13 46.746 6.469 - 53.2152013-14 51.306 6.734 - 58.0402014-15 58.440 10.004 - 68.4442015-16 76.837 7.134 - 83.9712016-17 75.614 6.952 - 82.5662017-18 86.254 8.085 - 94.3392018-19 88.651 7.659 - 96.310
Notes: These data should be read in conjunction with the explanatory notes.
Figure(s) may be incomplete for any period due to some unavailable revenue figures that are used to derive these numbers.
Data for the gambling revenue received by states and territories from 1 July 2000 onwards are not comparable with that of
preceding years because of the impact of changes brought about by the introduction of the GST.
Value ($ million)
GAMING RACING SPORTSBETTING TOTAL GAMBLING
Australian Gambling Statistics, 1993–94 to 2018–19, 36th edition
491

TABLE NT 57NORTHERN TERRITORY
REAL GOVERNMENT REVENUE FROM GAMBLING
1993-94 20.852 4.244 - 25.0961994-95 23.005 4.911 0.912 28.8291995-96 28.437 6.007 0.499 34.9431996-97 35.628 6.005 0.616 42.2491997-98 41.209 5.930 1.008 48.1471998-99 44.055 7.346 1.171 52.5721999-00 48.695 11.038 1.425 61.1592000-01 36.073 10.708 0.881 47.6622001-02 38.766 9.933 1.328 50.0272002-03 38.980 11.600 1.619 52.1992003-04 41.232 12.194 1.339 54.7652004-05 47.848 14.502 1.222 63.5722005-06 57.955 15.572 1.059 74.5862006-07 61.438 20.657 1.016 83.1122007-08 65.015 24.512 1.084 90.6122008-09 63.241 26.064 0.827 90.1322009-10 53.593 19.102 0.232 72.9272010-11 47.642 10.733 - 58.3752011-12 49.898 10.731 - 60.6292012-13 52.138 7.215 - 59.3532013-14 55.753 7.317 - 63.0702014-15 62.435 10.687 - 73.1222015-16 80.952 7.516 - 88.4682016-17 78.290 7.198 - 85.4882017-18 87.637 8.215 - 95.8512018-19 88.651 7.659 - 96.310
Notes: These data should be read in conjunction with the explanatory notes.
Figure(s) may be incomplete for any period due to some unavailable revenue figures that are used to derive these numbers.
Data for the gambling revenue received by states and territories from 1 July 2000 onwards are not comparable with that of
preceding years because of the impact of changes brought about by the introduction of the GST.
Value ($ million)
GAMING RACING SPORTSBETTING TOTAL GAMBLING
Australian Gambling Statistics, 1993–94 to 2018–19, 36th edition
492
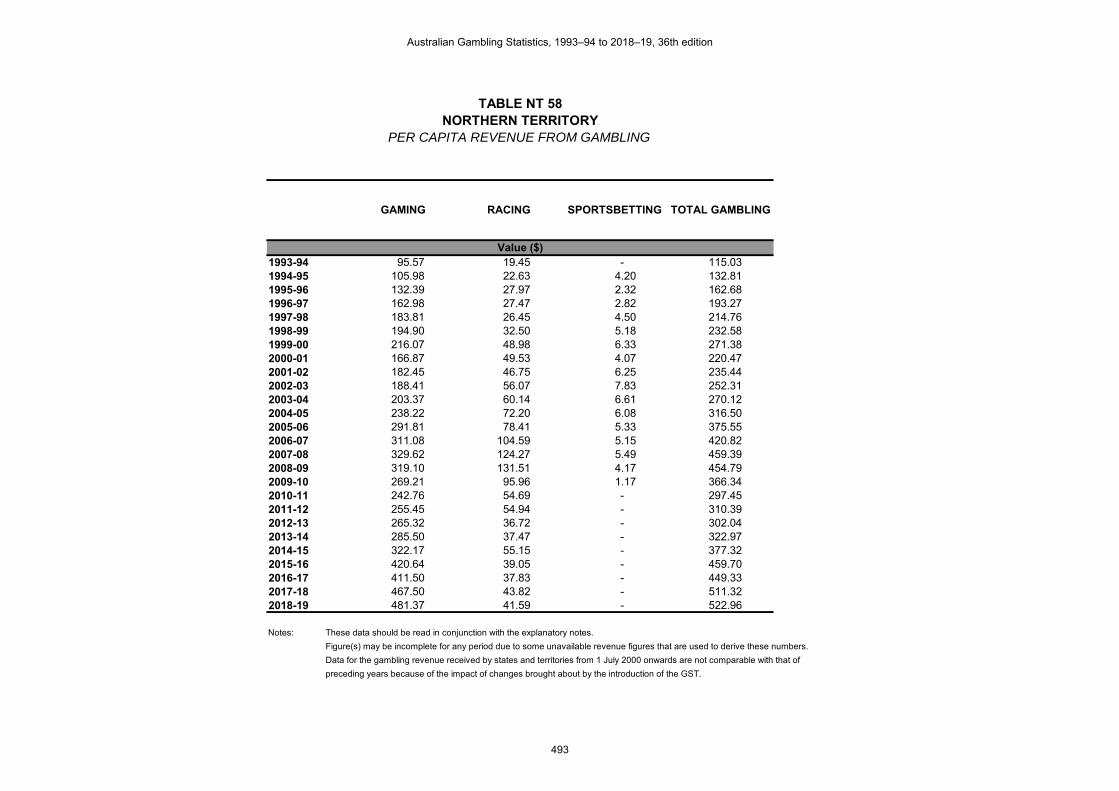
TABLE NT 58NORTHERN TERRITORY
PER CAPITA REVENUE FROM GAMBLING
1993-94 95.57 19.45 - 115.031994-95 105.98 22.63 4.20 132.811995-96 132.39 27.97 2.32 162.681996-97 162.98 27.47 2.82 193.271997-98 183.81 26.45 4.50 214.761998-99 194.90 32.50 5.18 232.581999-00 216.07 48.98 6.33 271.382000-01 166.87 49.53 4.07 220.472001-02 182.45 46.75 6.25 235.442002-03 188.41 56.07 7.83 252.312003-04 203.37 60.14 6.61 270.122004-05 238.22 72.20 6.08 316.502005-06 291.81 78.41 5.33 375.552006-07 311.08 104.59 5.15 420.822007-08 329.62 124.27 5.49 459.392008-09 319.10 131.51 4.17 454.792009-10 269.21 95.96 1.17 366.342010-11 242.76 54.69 - 297.452011-12 255.45 54.94 - 310.392012-13 265.32 36.72 - 302.042013-14 285.50 37.47 - 322.972014-15 322.17 55.15 - 377.322015-16 420.64 39.05 - 459.702016-17 411.50 37.83 - 449.332017-18 467.50 43.82 - 511.322018-19 481.37 41.59 - 522.96
Notes: These data should be read in conjunction with the explanatory notes.
Figure(s) may be incomplete for any period due to some unavailable revenue figures that are used to derive these numbers.
Data for the gambling revenue received by states and territories from 1 July 2000 onwards are not comparable with that of
preceding years because of the impact of changes brought about by the introduction of the GST.
Value ($)
GAMING RACING SPORTSBETTING TOTAL GAMBLING
Australian Gambling Statistics, 1993–94 to 2018–19, 36th edition
493

TABLE NT 59NORTHERN TERRITORY
REAL PER CAPITA REVENUE FROM GAMBLING
1993-94 177.60 36.15 - 213.751994-95 190.73 40.72 7.56 239.011995-96 228.53 48.28 4.01 280.821996-97 277.56 46.78 4.80 329.141997-98 313.03 45.04 7.66 365.731998-99 327.99 54.69 8.72 391.411999-00 355.25 80.53 10.40 446.172000-01 258.69 76.79 6.31 341.792001-02 275.00 70.46 9.42 354.882002-03 275.61 82.02 11.45 369.082003-04 290.41 85.89 9.43 385.742004-05 332.28 100.71 8.49 441.472005-06 394.49 106.00 7.21 507.702006-07 408.45 137.33 6.76 552.542007-08 418.81 157.90 6.98 583.702008-09 393.19 162.05 5.14 560.382009-10 324.02 115.49 1.40 440.922010-11 283.51 63.87 - 347.382011-12 291.47 62.68 - 354.152012-13 295.92 40.95 - 336.872013-14 310.24 40.72 - 350.962014-15 344.19 58.92 - 403.112015-16 443.17 41.14 - 484.322016-17 426.06 39.17 - 465.232017-18 474.99 44.52 - 519.512018-19 481.37 41.59 - 522.96
Notes: These data should be read in conjunction with the explanatory notes.
Figure(s) may be incomplete for any period due to some unavailable revenue figures that are used to derive these numbers.
Data for the gambling revenue received by states and territories from 1 July 2000 onwards are not comparable with that of
preceding years because of the impact of changes brought about by the introduction of the GST.
Value ($)
GAMING RACING SPORTSBETTING TOTAL GAMBLING
Australian Gambling Statistics, 1993–94 to 2018–19, 36th edition
494

TABLE NT 60NORTHERN TERRITORY
GOVERNMENT REVENUE FROM GAMBLINGAS A % OF TOTAL GAMBLING REVENUE
1993-94 83.09 16.91 -1994-95 79.80 17.04 3.161995-96 81.38 17.19 1.431996-97 84.33 14.21 1.461997-98 85.59 12.32 2.091998-99 83.80 13.97 2.231999-00 79.62 18.05 2.332000-01 75.69 22.47 1.852001-02 77.49 19.86 2.652002-03 74.67 22.22 3.102003-04 75.29 22.27 2.452004-05 75.27 22.81 1.922005-06 77.70 20.88 1.422006-07 73.92 24.86 1.222007-08 71.75 27.05 1.202008-09 70.16 28.92 0.922009-10 73.49 26.19 0.322010-11 81.61 18.39 -2011-12 82.30 17.70 -2012-13 87.84 12.16 -2013-14 88.40 11.60 -2014-15 85.38 14.62 -2015-16 91.50 8.50 -2016-17 91.58 8.42 -2017-18 91.43 8.57 -2018-19 92.05 7.95 -
Notes: These data should be read in conjunction with the explanatory notes.
Figure(s) may be incomplete for any period due to some unavailable revenue figures that are used to derive these numbers.
Data for the gambling revenue received by states and territories from 1 July 2000 onwards are not comparable with that of
preceding years because of the impact of changes brought about by the introduction of the GST.
Percentage (%)
GAMING RACING SPORTSBETTING
Australian Gambling Statistics, 1993–94 to 2018–19, 36th edition
495

TABLE NT 61NORTHERN TERRITORY
GAMING MACHINES OPERATING AS AT 30 JUNE
2001-02 635 633 238 1,506 2002-03 690 650 278 1,618 2003-04 720 661 291 1,672 2004-05 864 687 298 1,849 2005-06 812 706 344 1,862 2006-07 833 730 352 1,915 2007-08 871 744 422 2,037 2008-09 886 749 424 2,059 2009-10 1,070 758 428 2,256 2010-11 1,047 758 428 2,233 2011-12 1,041 753 428 2,222 2012-13 1,047 753 428 2,228 2013-14 1,062 753 428 2,243 2014-15 964 753 428 2,145 2015-16 922 772 494 2,188 2016-17 916 818 584 2,318 2017-18 882 841 651 2,374 2018-19 983 717 624 2,324
Notes: These data should be read in conjunction with the explanatory notes.
NUMBER
CASINOS CLUBS HOTELS TOTAL MACHINES
Australian Gambling Statistics, 1993–94 to 2018–19, 36th edition
496

Australian Gambling Statistics36th editionProduct tables 2018–19
Released April 2021
Prepared by Queensland Government Statistician's Office, Queensland Treasury.
ISSN: 1833-6337
The cooperation of all Australian state and territory governments is gratefully acknowledged.
Queensland Government Statistician's Office
www.qgso.qld.gov.au
Data should be read in conjunction with the Explanatory notes.
Refer to the Glossary section for a full description of terms.
Disclaimer
No warranty is given as to the correctness or completeness of the information in this publication.
Licence
© The State of Queensland (Queensland Treasury) 2021
To view a copy of this licence, visit http://creativecommons.org/licenses/by/4.0/
While great care has been taken in the preparation of this publication and each Australian state and territory has been asked to verify its own data in detail, it is nevertheless necessary to caution users concerning the complete accuracy of all data.
The State of Queensland and each Australian state and territory expressly disclaim all and any liability (including all liability from or attributable to any negligent or wrongful act or omission) to any persons whatsoever in respect of anything done or omitted to be done by any such person in reliance, whether in whole or in part, upon any of the material in this publication.
This document is licensed under a Creative Commons Attribution 4.0 International licence. You are free to copy, communicate and adapt the work, as long as you attribute the authors.
To attribute this work, cite Queensland Government Statistician's Office, Queensland Treasury, Australian Gambling Statistics, Product tables , 36th edition, 2021.

Product Table Number Table Name
Page
Number
On-Course Totalisator On Tot 1
On-Course Totalisator Turnover
6
On Tot 2 Real On-Course Totalisator Turnover 7
On Tot 3 Per Capita On-Course Totalisator Turnover 8
On Tot 4 Real Per Capita On-Course Totalisator Turnover 9
On Tot 5 On-Course Totalisator Expenditure 10
On Tot 6 Real On-Course Totalisator Expenditure 11
On Tot 7 Per Capita On-Course Totalisator Expenditure 12
On Tot 8 Real Per Capita On-Course Totalisator Expenditure 13
On Tot 9 On-Course Totalisator Expenditure as a Percentage of Household Disposable Income 14
On Tot 10 Government Revenue from On-Course Totalisator 15
On Tot 11 Real Government Revenue from On-Course Totalisator 16
On Tot 12 Per Capita Government Revenue from On-Course Totalisator 17
On Tot 13 Real Per Capita Government Revenue from On-Course Totalisator 18
On Tot 14 On-Course Totalisator Revenue as Percentage of Total State Gambling Revenue 19
TAB TAB 1 TAB Turnover 20
TAB 2 Real TAB Turnover 21
TAB 3 Per Capita TAB Turnover 22
TAB 4 Real Per Capita TAB Turnover 23
TAB 5 TAB Expenditure 24
TAB 6 Real TAB Expenditure 25
TAB 7 Per Capita TAB Expenditure 26
TAB 8 Real Per Capita TAB Expenditure 27
TAB 9 TAB Expenditure as a Percentage of Household Disposable Income 28
TAB 10 Government Revenue from TAB 29
TAB 11 Real Government Revenue from TAB 30
TAB 12 Per Capita Government Revenue from TAB 31
TAB 13 Real Per Capita Government Revenue from TAB 32
TAB 14 TAB Revenue as Percentage of Total State Gambling Revenue 33
On-Course Bookmaker On Book 1 On-Course Bookmaker Turnover 34
On Book 2 Real On-Course Bookmaker Turnover 35
On Book 3 Per Capita On-Course Bookmaker Turnover 36
On Book 4 Real Per Capita On-Course Bookmaker Turnover 37
On Book 5 On-Course Bookmaker Expenditure 38
On Book 6 Real On-Course Bookmaker Expenditure 39
On Book 7 Per Capita On-Course Bookmaker Expenditure 40
On Book 8 Real Per Capita On-Course Bookmaker Expenditure 41
On Book 9 On-Course Bookmaker Expenditure as a Percentage of Household Disposable Income 42
Off-Course Bookmaker Off Book 1 Off-Course Bookmaker Turnover 43
Off Book 2 Real Off-Course Bookmaker Turnover 44
Off Book 3 Per Capita Off-Course Bookmaker Turnover 45
Off Book 4 Real Per Capita Off-Course Bookmaker Turnover 46
Off Book 5 Off-Course Bookmaker Expenditure 47
Off Book 6 Real Off-Course Bookmaker Expenditure 48
Off Book 7 Per Capita Off-Course Bookmaker Expenditure 49
Off Book 8 Real Per Capita Off-Course Bookmaker Expenditure 50
Off Book 9 Off-Course Bookmaker Expenditure as a Percentage of Household Disposable Income 51
Bookmakers Book 10 Government Revenue from Bookmakers 52
Book 11 Real Government Revenue from Bookmakers 53
Book 12 Per Capita Government Revenue from Bookmakers 54
Book 13 Real Per Capita Government Revenue from Bookmakers 55
Book 14 Bookmakers Revenue as Percentage of Total State Gambling Revenue
56
Australian Gambling Statistics, 1993–94 to 2018–2019, 36th edition
1
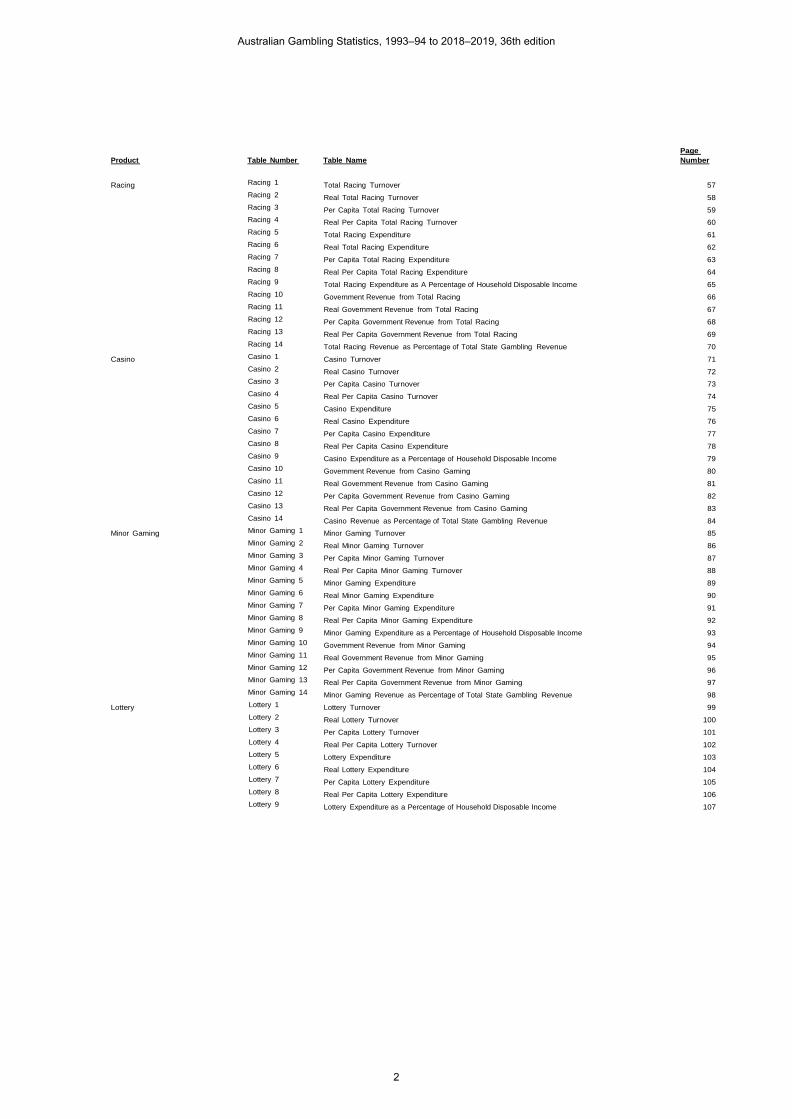
Product Table Number Table Name
Page
Number
Racing Racing 1
Total Racing Turnover
57
Racing 2 Real Total Racing Turnover 58
Racing 3 Per Capita Total Racing Turnover 59
Racing 4 Real Per Capita Total Racing Turnover 60
Racing 5 Total Racing Expenditure 61
Racing 6 Real Total Racing Expenditure 62
Racing 7 Per Capita Total Racing Expenditure 63
Racing 8 Real Per Capita Total Racing Expenditure 64
Racing 9 Total Racing Expenditure as A Percentage of Household Disposable Income 65
Racing 10 Government Revenue from Total Racing 66
Racing 11 Real Government Revenue from Total Racing 67
Racing 12 Per Capita Government Revenue from Total Racing 68
Racing 13 Real Per Capita Government Revenue from Total Racing 69
Racing 14 Total Racing Revenue as Percentage of Total State Gambling Revenue 70
Casino Casino 1 Casino Turnover 71
Casino 2 Real Casino Turnover 72
Casino 3 Per Capita Casino Turnover 73
Casino 4 Real Per Capita Casino Turnover 74
Casino 5 Casino Expenditure 75
Casino 6 Real Casino Expenditure 76
Casino 7 Per Capita Casino Expenditure 77
Casino 8 Real Per Capita Casino Expenditure 78
Casino 9 Casino Expenditure as a Percentage of Household Disposable Income 79
Casino 10 Government Revenue from Casino Gaming 80
Casino 11 Real Government Revenue from Casino Gaming 81
Casino 12 Per Capita Government Revenue from Casino Gaming 82
Casino 13 Real Per Capita Government Revenue from Casino Gaming 83
Casino 14 Casino Revenue as Percentage of Total State Gambling Revenue 84
Minor Gaming Minor Gaming 1 Minor Gaming Turnover 85
Minor Gaming 2 Real Minor Gaming Turnover 86
Minor Gaming 3 Per Capita Minor Gaming Turnover 87
Minor Gaming 4 Real Per Capita Minor Gaming Turnover 88
Minor Gaming 5 Minor Gaming Expenditure 89
Minor Gaming 6 Real Minor Gaming Expenditure 90
Minor Gaming 7 Per Capita Minor Gaming Expenditure 91
Minor Gaming 8 Real Per Capita Minor Gaming Expenditure 92
Minor Gaming 9 Minor Gaming Expenditure as a Percentage of Household Disposable Income 93
Minor Gaming 10 Government Revenue from Minor Gaming 94
Minor Gaming 11 Real Government Revenue from Minor Gaming 95
Minor Gaming 12 Per Capita Government Revenue from Minor Gaming 96
Minor Gaming 13 Real Per Capita Government Revenue from Minor Gaming 97
Minor Gaming 14 Minor Gaming Revenue as Percentage of Total State Gambling Revenue 98
Lottery Lottery 1 Lottery Turnover 99
Lottery 2 Real Lottery Turnover 100
Lottery 3 Per Capita Lottery Turnover 101
Lottery 4 Real Per Capita Lottery Turnover 102
Lottery 5 Lottery Expenditure 103
Lottery 6 Real Lottery Expenditure 104
Lottery 7 Per Capita Lottery Expenditure 105
Lottery 8 Real Per Capita Lottery Expenditure 106
Lottery 9 Lottery Expenditure as a Percentage of Household Disposable Income 107
Australian Gambling Statistics, 1993–94 to 2018–2019, 36th edition
2

Product Table Number Table Name
Page
Number
Lotto Lotto 1
Lotto-Tattslotto Turnover
108
Lotto 2 Real Lotto-Tattslotto Turnover 109
Lotto 3 Per Capita Lotto-Tattslotto Turnover 110
Lotto 4 Real Per Capita Lotto-Tattslotto Turnover 111
Lotto 5 Lotto-Tattslotto Expenditure 112
Lotto 6 Real Lotto-Tattslotto Expenditure 113
Lotto 7 Per Capita Lotto-Tattslotto Expenditure 114
Lotto 8 Real Per Capita Lotto-Tattslotto Expenditure 115
Lotto 9 Lotto-Tattslotto Expenditure as a Percentage of Household Disposable Income 116
Instant Lotto Instant Lotto 1 Instant Lottery Turnover 117
Instant Lotto 2 Real Instant Lottery Turnover 118
Instant Lotto 3 Per Capita Instant Lottery Turnover 119
Instant Lotto 4 Real Per Capita Instant Lottery Turnover 120
Instant Lotto 5 Instant Lottery Expenditure 121
Instant Lotto 6 Real Instant Lottery Expenditure 122
Instant Lotto 7 Per Capita Instant Lottery Expenditure 123
Instant Lotto 8 Real Per Capita Instant Lottery Expenditure 124
Instant Lotto 9 Instant Lottery Expenditure as a Percentage of Household Disposable Income 125
Pools Pools 1 Pools Turnover 126
Pools 2 Real Pools Turnover 127
Pools 3 Per Capita Pools Turnover 128
Pools 4 Real Per Capita Pools Turnover 129
Pools 5 Pools Expenditure 130
Pools 6 Real Pools Expenditure 131
Pools 7 Per Capita Pools Expenditure 132
Pools 8 Real Per Capita Pools Expenditure 133
Pools 9 Pools Expenditure as a Percentage of Household Disposable Income 134
Keno Keno 1 Keno Turnover 135
Keno 2 Real Keno Turnover 136
Keno 3 Per Capita Keno Turnover 137
Keno 4 Real Per Capita Keno Turnover 138
Keno 5 Keno Expenditure 139
Keno 6 Real Keno Expenditure 140
Keno 7 Per Capita Keno Expenditure 141
Keno 8 Real Per Capita Keno Expenditure 142
Keno 9 Keno Expenditure as a Percentage of Household Disposable Income 143
Gaming Machines Gaming Machines 1 Gaming Machines Turnover 144
Gaming Machines 2 Real Gaming Machines Turnover 145
Gaming Machines 3 Per Capita Gaming Machines Turnover 146
Gaming Machines 4 Real Per Capita Gaming Machines Turnover 147
Gaming Machines 5 Gaming Machines Expenditure 148
Gaming Machines 6 Real Gaming Machines Expenditure 149
Gaming Machines 7 Per Capita Gaming Machines Expenditure 150
Gaming Machines 8 Real Per Capita Gaming Machines Expenditure 151
Gaming Machines 9 Gaming Machines Expenditure as a Percentage of Household Disposable Income 152
Gaming Gaming 1 Total Gaming Turnover 153
Gaming 2 Real Total Gaming Turnover 154
Gaming 3 Per Capita Total Gaming Turnover 155
Gaming 4 Real Per Capita Total Gaming Turnover 156
Gaming 5 Total Gaming Expenditure 157
Gaming 6 Real Total Gaming Expenditure 158
Gaming 7 Per Capita Total Gaming Expenditure 159
Gaming 8 Real Per Capita Total Gaming Expenditure 160
Gaming 9 Total Gaming Expenditure as a Percentage of Household Disposable Income 161
Gaming 10 Government Revenue from Total Gaming 162
Gaming 11 Real Government Revenue from Total Gaming 163
Gaming 12 Per Capita Government Revenue from Total Gaming 164
Gaming 13 Real Per Capita Government Revenue from Total Gaming 165
Gaming 14 Total Gaming Revenue as Percentage of Total State Gambling Revenue 166
Australian Gambling Statistics, 1993–94 to 2018–2019, 36th edition
3

Product Table Number Table Name
Page
Number
TAB Fixed Odds TAB FO 1
TAB Fixed Odds Turnover
167
TAB FO 2 Real TAB Fixed Odds Turnover 168
TAB FO 3 Per Capita TAB Fixed Odds Turnover 169
TAB FO 4 Real Per Capita TAB Fixed Odds Turnover 170
TAB FO 5 TAB Fixed Odds Expenditure 171
TAB FO 6 Real TAB Fixed Odds Expenditure 172
TAB FO 7 Per Capita TAB Fixed Odds Expenditure 173
TAB FO 8 Real Per Capita TAB Fixed Odds Expenditure 174
TAB FO 9 TAB Fixed Odds Expenditure as a Percentage of Household Disposable Income 175
TAB FO 10 Government Revenue from TAB Fixed Odds 176
TAB FO 11 Real Government Revenue from TAB Fixed Odds 177
TAB FO 12 Per Capita Government Revenue from TAB Fixed Odds 178
TAB FO 13 Real Per Capita Government Revenue from TAB Fixed Odds 179
TAB FO 14 TAB Fixed Odds Revenue as Percentage of Total State Gambling Revenue 180
TAB Tote Odds TAB TO 1 TAB Tote Odds Turnover 181
TAB TO 2 Real TAB Tote Odds Turnover 182
TAB TO 3 Per Capita TAB Tote Odds Turnover 183
TAB TO 4 Real Per Capita TAB Tote Odds Turnover 184
TAB TO 5 TAB Tote Odds Expenditure 185
TAB TO 6 Real TAB Tote Odds Expenditure 186
TAB TO 7 Per Capita TAB Tote Odds Expenditure 187
TAB TO 8 Real Per Capita TAB Tote Odds Expenditure 188
TAB TO 9 TAB Tote Odds Expenditure as a Percentage of Household Disposable Income 189
TAB TO 10 Government Revenue from TAB Tote Odds 190
TAB TO 11 Real Government Revenue from TAB Tote Odds 191
TAB TO 12 Per Capita Government Revenue from TAB Tote Odds 192
TAB TO 13 Real Per Capita Government Revenue from TAB Tote Odds 193
TAB TO 14 TAB Tote Odds Revenue as Percentage of Total State Gambling Revenue 194
Bookmaker and Other Fixed Odds Bookmaker FO 1 Bookmaker and Other Fixed Odds Turnover 195
Bookmaker FO 2 Real Bookmaker and Other Fixed Odds Turnover 196
Bookmaker FO 3 Per Capita Bookmaker and Other Fixed Odds Turnover 197
Bookmaker FO 4 Real Per Capita Bookmaker and Other Fixed Odds Turnover 198
Bookmaker FO 5 Bookmaker and Other Fixed Odds Expenditure 199
Bookmaker FO 6 Real Bookmaker and Other Fixed Odds Expenditure 200
Bookmaker FO 7 Per Capita Bookmaker and Other Fixed Odds Expenditure 201
Bookmaker FO 8 Real Per Capita Bookmaker and Other Fixed Odds Expenditure 202
Bookmaker FO 9 Bookmaker and Other Fixed Odds Expenditure as a Percentage of Household Disposable Income 203
Bookmaker FO 10 Government Revenue from Bookmaker and Other Fixed Odds 204
Bookmaker FO 11 Real Government Revenue from Bookmaker and Other Fixed Odds 205
Bookmaker FO 12 Per Capita Government Revenue from Bookmaker and Other Fixed Odds 206
Bookmaker FO 13 Real Per Capita Government Revenue from Bookmaker and Other Fixed Odds 207
Bookmaker FO 14 Bookmaker and Other Fixed Odds Revenue as Percentage of Total State Gambling Revenue 208
Bookmaker and Other Pool Betting Bookmaker PB 1 Bookmaker and Other Pool Betting Turnover 209
Bookmaker PB 2 Real Bookmaker and Other Pool Betting Turnover 210
Bookmaker PB 3 Per Capita Bookmaker and Other Pool Betting Turnover 211
Bookmaker PB 4 Real Per Capita Bookmaker and Other Pool Betting Turnover 212
Bookmaker PB 5 Bookmaker and Other Pool Betting Expenditure 213
Bookmaker PB 6 Real Bookmaker and Other Pool Betting Expenditure 214
Bookmaker PB 7 Per Capita Bookmaker and Other Pool Betting Expenditure 215
Bookmaker PB 8 Real Per Capita Bookmaker and Other Pool Betting Expenditure 216
Bookmaker PB 9 Bookmaker and Other Pool Betting Expenditure as a Percentage of Household Disposable Income 217
Bookmaker PB 10 Government Revenue from Bookmaker and Other Pool Betting 218
Bookmaker PB 11 Real Government Revenue from Bookmaker and Other Pool Betting 219
Bookmaker PB 12 Per Capita Government Revenue from Bookmaker and Other Pool Betting 220
Bookmaker PB 13 Real Per Capita Government Revenue from Bookmaker and Other Pool Betting 221
Bookmaker PB 14 Bookmaker and Other Pool Betting Revenue as Percentage of Total State Gambling Revenue 222
Australian Gambling Statistics, 1993–94 to 2018–2019, 36th edition
4

Product Table Number Table Name
Page
Number
Sportsbetting Sportsbetting 1
Total Sportsbetting Turnover
223
Sportsbetting 2 Real Total Sportsbetting Turnover 224
Sportsbetting 3 Per Capita Total Sportsbetting Turnover 225
Sportsbetting 4 Real Per Capita Total Sportsbetting Turnover 226
Sportsbetting 5 Total Sportsbetting Expenditure 227
Sportsbetting 6 Real Total Sportsbetting Expenditure 228
Sportsbetting 7 Per Capita Total Sportsbetting Expenditure 229
Sportsbetting 8 Real Per Capita Total Sportsbetting Expenditure 230
Sportsbetting 9 Total Sportsbetting Expenditure as a Percentage of Household Disposable Income 231
Sportsbetting 10 Government Revenue from Total Sportsbetting 232
Sportsbetting 11 Real Government Revenue from Total Sportsbetting 233
Sportsbetting 12 Per Capita Government Revenue from Total Sportsbetting 234
Sportsbetting 13 Real Per Capita Government Revenue from Total Sportsbetting 235
Sportsbetting 14 Total Sportsbetting Revenue as Percentage of Total State Gambling Revenue 236
All Gambling All Gambling 1 Total Gambling Turnover 237
All Gambling 2 Real Total Gambling Turnover 238
All Gambling 3 Per Capita Total Gambling Turnover 239
All Gambling 4 Real Per Capita Total Gambling Turnover 240
All Gambling 5 Total Gambling Expenditure 241
All Gambling 6 Real Total Gambling Expenditure 242
All Gambling 7 Per Capita Total Gambling Expenditure 243
All Gambling 8 Real Per Capita Total Gambling Expenditure 244
All Gambling 9 Total Gambling Expenditure as a Percentage of Household Disposable Income 245
All Gambling 10 Government Revenue from Total Gambling 246
All Gambling 11 Real Government Revenue from Total Gambling 247
All Gambling 12 Per Capita Government Revenue from Total Gambling 248
All Gambling 13 Real Per Capita Government Revenue from Total Gambling 249
All Gambling 14 Total Australian Gambling Expenditure 250
All Gambling 15 Total Real Australian Gambling Expenditure 251
All Gambling 16 Total Australian Per Capita Gambling Expenditure 252
All Gambling 17 Total Real Australian Per Capita Gambling Expenditure 253
All Gambling 18 Total Australian Gambling Expenditure as a Percentage of Household Disposable Income 254
All Gambling 19 Total Government Revenue from Gambling 255
All Gambling 20 Real Total Government Revenue from Gambling 256
All Gambling 21 Per Capita Total Government Revenue from Gambling 257
All Gambling 22 Real Per Capita Total Government 258
All Gambling 23 Racing Revenue Components 259
All Gambling 24 Real Racing Revenue Components 260
All Gambling 25 Per Capita Racing Revenue Components 261
All Gambling 26 Real Per Capita Racing Revenue Components 262
All Gambling 27 Sportsbetting Revenue Components 263
All Gambling 28 Real Sportsbetting Revenue Components 264
All Gambling 29 Per Capita Sportsbetting Revenue Components 265
All Gambling 30 Real Per Capita Sportsbetting Revenue Components 266
All Gambling 31 Total Gaming Machines Operating as at 30 June
267
Australian Gambling Statistics, 1993–94 to 2018–2019, 36th edition
5

TABLE ON TOT 1ON-COURSE TOTALISATOR TURNOVER
1993-94 7.365 419.978 6.172 156.915 60.692 13.276 275.660 59.463 999.5211994-95 5.836 406.165 7.628 164.393 57.053 14.244 247.954 61.350 964.6231995-96 6.878 405.414 10.693 157.600 53.029 14.089 235.067 67.177 949.9471996-97 5.356 388.900 13.700 147.600 53.912 13.532 223.353 65.690 912.0431997-98 4.918 394.923 12.232 129.600 51.063 12.626 215.486 70.420 891.2681998-99 7.244 325.700 16.563 114.700 48.635 11.491 206.632 69.366 800.3311999-00 4.409 299.200 16.163 - (1) 48.742 10.849 208.272 64.934 652.5692000-01 7.071 275.800 13.663 - 48.378 10.987 200.710 65.249 621.8582001-02 8.017 - (2) 17.193 - 43.920 10.445 199.080 67.136 345.7912002-03 7.049 - (2) 18.100 - 44.227 9.701 206.709 66.567 352.3532003-04 5.940 282.633 17.982 - 40.362 10.296 200.711 66.707 624.6312004-05 3.200 264.610 12.543 - 45.592 11.291 207.263 69.699 614.1982005-06 5.013 285.165 15.020 - 37.400 11.564 195.304 75.283 624.7492006-07 4.037 306.822 13.896 - 36.512 11.586 242.604 83.976 699.4332007-08 3.549 248.259 11.387 - 32.024 11.660 269.592 84.685 661.1562008-09 4.656 314.868 15.303 - 31.614 10.818 339.284 85.330 801.8732009-10 4.465 218.232 18.515 - 29.949 10.580 457.657 72.286 811.6842010-11 3.705 182.814 17.151 - 27.600 10.331 E 438.957 77.660 758.2182011-12 3.651 261.539 19.178 - 29.864 9.268 E 410.167 82.761 816.4282012-13 3.494 148.379 15.484 - 21.960 6.661 452.630 70.825 719.4332013-14 2.926 82.026 13.336 - - (3) 7.632 326.140 56.066 488.126
2014-15 3.355 81.663 12.341 - - 7.798 282.655 42.321 430.133
2015-16 2.430 59.003 8.000 - - 6.536 177.858 32.064 285.8912016-17 1.954 48.289 5.200 - 11.663 R 5.903 R 151.258 27.226 251.493 R
2017-18 1.495 43.924 4.216 E - 10.347 R 5.483 128.424 24.339 218.227 R
2018-19 1.104 36.764 3.267 - 9.064 4.733 71.274 (4) 20.342 146.547
Notes: These data should be read in conjunction with the explanatory notes and other turnover tables in this publication.
Figure(s) may be incomplete for any period due to some unavailable turnover figures that are used to derive these numbers.
(1) Turnover is under $1 million for small on-course clubs running their own tote, from this period on.
(2) Figure is included in TAB turnover (discrete data were not available).
(3) Data not available as a result of the agreement made pursuant to Section 14 of the Authorised Betting Operations Act 2000 .
(4) Point of consumption tax (POCT) introduced and applied from 1 Jan 2019. This figure only contains data from July 2018 to December 2018, pre-POCT.
E = Estimated data
R = Revised data
AUSTRALIA
Value ($ million)
ACT NSW NT QLD SA TAS VIC WA
Australian Gambling Statistics, 1993–94 to 2018–2019, 36th edition
6

TABLE ON TOT 2REAL ON-COURSE TOTALISATOR TURNOVER
1993-94 13.686 780.448 11.469 291.596 112.784 24.671 512.261 110.500 1,857.4161994-95 10.503 730.969 13.728 295.856 102.677 25.635 446.239 110.411 1,736.0171995-96 11.873 699.814 18.458 272.045 91.537 24.320 405.766 115.959 1,639.7721996-97 9.121 662.291 23.331 251.361 91.811 23.045 380.367 111.869 1,553.1961997-98 8.375 672.548 20.831 220.707 86.960 21.502 366.969 119.924 1,517.8161998-99 12.191 548.118 27.874 193.028 81.847 19.338 347.739 116.735 1,346.8701999-00 7.249 491.912 26.573 - (1) 80.136 17.836 342.418 106.757 1,072.8832000-01 10.962 427.565 21.181 - 74.999 17.033 311.155 101.154 964.0492001-02 12.084 - (2) 25.914 - 66.199 15.743 300.066 101.192 521.1992002-03 10.311 - (2) 26.477 - 64.696 14.191 302.378 97.376 515.4292003-04 8.483 403.610 25.679 - 57.638 14.703 286.622 95.260 891.9952004-05 4.464 369.095 17.496 - 63.595 15.749 289.104 97.221 856.7242005-06 6.777 385.513 20.305 - 50.561 15.633 264.031 101.775 844.5962006-07 5.301 402.858 18.245 - 47.940 15.212 318.540 110.261 918.3582007-08 4.509 315.438 14.468 - 40.690 14.815 342.544 107.601 840.0662008-09 5.737 387.975 18.856 - 38.954 13.330 418.059 105.142 988.0532009-10 5.374 262.661 22.285 - 36.046 12.734 550.829 87.002 976.9322010-11 4.327 213.501 20.030 - 32.233 12.065 E 512.641 90.696 885.4942011-12 4.166 298.416 21.882 - 34.075 10.575 E 468.001 94.430 931.5442012-13 3.897 165.494 17.270 - 24.493 7.430 504.840 78.994 802.4182013-14 3.180 89.135 14.492 - - (3) 8.293 354.406 60.925 530.430
2014-15 3.584 87.245 13.185 - - 8.331 301.975 45.214 459.534
2015-16 2.560 62.163 8.428 - - 6.886 187.383 33.781 301.2022016-17 2.023 49.998 5.384 - 12.076 R 6.112 R 156.611 28.190 260.393 R
2017-18 1.519 44.628 4.284 E - 10.512 R 5.571 130.482 24.729 221.725 R
2018-19 1.104 36.764 3.267 - 9.064 4.733 71.274 (4) 20.342 146.547
Notes: These data should be read in conjunction with the explanatory notes and other turnover tables in this publication.
Figure(s) may be incomplete for any period due to some unavailable turnover figures that are used to derive these numbers.
(1) Turnover is under $1 million for small on-course clubs running their own tote, from this period on.
(2) Figure is included in TAB turnover (discrete data were not available).
(3) Data not available as a result of the agreement made pursuant to Section 14 of the Authorised Betting Operations Act 2000 .
(4) Point of consumption tax (POCT) introduced and applied from 1 Jan 2019. This figure only contains data from July 2018 to December 2018, pre-POCT.
E = Estimated data
R = Revised data
AUSTRALIA
Value ($ million)
ACT NSW NT QLD SA TAS VIC WA
Australian Gambling Statistics, 1993–94 to 2018–2019, 36th edition
7

TABLE ON TOT 3PER CAPITA ON-COURSE TOTALISATOR TURNOVER
1993-94 33.71 93.73 52.57 68.46 55.07 38.53 82.57 48.26 76.141994-95 26.32 89.67 63.24 69.96 51.56 41.13 73.83 48.81 72.581995-96 30.51 88.40 85.93 65.53 47.77 40.51 69.37 52.32 70.501996-97 23.48 83.69 106.73 60.15 48.31 38.79 65.23 50.11 66.771997-98 21.39 83.96 92.92 51.92 45.45 36.12 62.29 52.70 64.441998-99 31.17 68.41 123.31 45.21 42.98 32.82 59.08 51.00 57.141999-00 18.72 62.03 117.91 - (1) 42.77 30.89 58.81 46.95 45.972000-01 29.54 56.38 97.98 - 42.16 31.16 55.89 46.39 43.182001-02 32.94 - (2) 121.96 - 37.99 29.48 54.65 46.94 23.662002-03 28.54 - (2) 127.98 - 37.92 27.11 55.95 45.78 23.762003-04 23.76 56.04 126.66 - 34.31 28.36 53.57 45.09 41.522004-05 12.66 52.06 87.10 - 38.40 30.74 54.53 46.24 40.262005-06 19.55 55.61 102.24 - 31.18 31.20 50.56 48.94 40.332006-07 15.44 59.10 92.38 - 30.07 30.96 61.64 53.22 44.352007-08 13.28 47.00 73.35 - 26.02 30.79 67.05 52.01 41.042008-09 17.07 58.52 95.14 - 25.33 28.17 82.39 50.66 48.642009-10 16.02 39.90 111.94 - 23.66 27.19 108.74 41.68 48.242010-11 13.01 32.98 102.07 - 21.55 26.27 E 102.53 43.58 44.322011-12 12.56 46.60 112.02 - 23.09 23.42 E 94.07 45.03 46.912012-13 11.78 26.07 87.88 - 16.80 16.77 101.61 37.44 40.582013-14 9.72 14.20 74.21 - - (3) 19.13 71.64 29.08 27.07
2014-15 10.98 13.92 68.03 - - 19.43 60.76 21.72 23.48
2015-16 7.82 9.90 43.80 - - 16.19 37.36 16.34 15.372016-17 6.16 7.96 28.30 - 8.62 R 14.48 R 30.99 13.79 13.29 R
2017-18 4.62 7.12 22.85 E - 7.59 R 13.28 25.68 12.24 11.33 R
2018-19 3.35 5.86 17.74 - 6.58 11.30 13.93 (4) 10.13 7.48
Notes: These data should be read in conjunction with the explanatory notes and other turnover tables in this publication.
Figure(s) may be incomplete for any period due to some unavailable turnover figures that are used to derive these numbers.
(1) Turnover is under $1 million for small on-course clubs running their own tote, from this period on.
(2) Figure is included in TAB turnover (discrete data were not available).
(3) Data not available as a result of the agreement made pursuant to Section 14 of the Authorised Betting Operations Act 2000 .
(4) Point of consumption tax (POCT) introduced and applied from 1 Jan 2019. This figure only contains data from July 2018 to December 2018, pre-POCT.
E = Estimated data
R = Revised data
Value ($)
TAS VIC WA AUSTRALIAACT NSW NT QLD SA
Australian Gambling Statistics, 1993–94 to 2018–2019, 36th edition
8

TABLE ON TOT 4REAL PER CAPITA ON-COURSE TOTALISATOR TURNOVER
1993-94 62.64 174.19 97.69 127.22 102.34 71.59 153.44 89.69 141.501994-95 47.37 161.38 113.81 125.91 92.80 74.02 132.88 87.84 130.611995-96 52.67 152.59 148.34 113.12 82.45 69.93 119.74 90.31 121.701996-97 39.98 142.52 181.76 102.44 82.28 66.05 111.09 85.33 113.711997-98 36.42 142.98 158.24 88.42 77.40 61.52 106.09 89.74 109.731998-99 52.46 115.12 207.52 76.08 72.33 55.23 99.42 85.82 96.161999-00 30.78 101.98 193.86 - (1) 70.32 50.78 96.68 77.19 75.582000-01 45.79 87.40 151.90 - 65.36 48.30 86.64 71.91 66.942001-02 49.65 - (2) 183.83 - 57.25 44.43 82.37 70.75 35.662002-03 41.76 - (2) 187.21 - 55.47 39.65 81.84 66.97 34.752003-04 33.94 80.02 180.87 - 48.99 40.51 76.50 64.39 59.302004-05 17.66 72.61 121.50 - 53.57 42.88 76.07 64.50 56.152005-06 26.43 75.18 138.22 - 42.15 42.18 68.36 66.16 54.532006-07 20.27 77.60 121.30 - 39.48 40.66 80.94 69.88 58.242007-08 16.88 59.72 93.20 - 33.07 39.13 85.19 66.08 52.142008-09 21.04 72.10 117.23 - 31.21 34.72 101.52 62.42 59.942009-10 19.28 48.02 134.73 - 28.47 32.72 130.88 50.16 58.062010-11 15.20 38.52 119.20 - 25.17 30.68 E 119.74 50.89 51.762011-12 14.33 53.17 127.82 - 26.34 26.73 E 107.33 51.38 53.522012-13 13.14 29.08 98.02 - 18.74 18.71 113.33 41.76 45.262013-14 10.57 15.43 80.64 - - (3) 20.78 77.85 31.60 29.41
2014-15 11.73 14.87 72.68 - - 20.76 64.91 23.21 25.09
2015-16 8.23 10.43 46.14 - - 17.06 39.36 17.22 16.192016-17 6.38 8.25 29.30 - 8.93 R 15.00 R 32.09 14.28 13.76 R
2017-18 4.69 7.23 23.22 E - 7.71 R 13.49 26.10 12.43 11.51 R
2018-19 3.35 5.86 17.74 - 6.58 11.30 13.93 (4) 10.13 7.48
Notes: These data should be read in conjunction with the explanatory notes and other turnover tables in this publication.
Figure(s) may be incomplete for any period due to some unavailable turnover figures that are used to derive these numbers.
(1) Turnover is under $1 million for small on-course clubs running their own tote, from this period on.
(2) Figure is included in TAB turnover (discrete data were not available).
(3) Data not available as a result of the agreement made pursuant to Section 14 of the Authorised Betting Operations Act 2000 .
(4) Point of consumption tax (POCT) introduced and applied from 1 Jan 2019. This figure only contains data from July 2018 to December 2018, pre-POCT.
E = Estimated data
R = Revised data
AUSTRALIA
Value ($)
ACT NSW NT QLD SA TAS VIC WA
Australian Gambling Statistics, 1993–94 to 2018–2019, 36th edition
9

TABLE ON TOT 5ON-COURSE TOTALISATOR EXPENDITURE
1993-94 1.143 61.863 0.975 32.304 9.459 1.914 41.377 10.363 159.3981994-95 0.875 64.986 1.198 27.800 8.860 1.726 38.160 10.669 154.2741995-96 1.031 62.249 1.282 26.600 8.297 1.847 37.611 11.667 150.5841996-97 0.803 60.200 2.100 24.900 8.435 1.362 35.736 11.400 144.9361997-98 1.469 59.896 1.946 21.900 7.989 1.758 34.477 12.112 141.5471998-99 1.169 52.112 2.484 19.400 6.210 1.542 33.061 11.931 127.9091999-00 0.694 47.872 2.660 - (1) 6.215 1.412 33.324 11.117 103.2942000-01 1.103 44.128 2.186 - 6.266 1.418 33.233 11.197 99.5312001-02 1.023 - (2) 2.750 - - U 1.168 32.934 11.534 49.4092002-03 0.945 - (2) 2.896 - - U 1.413 34.148 11.416 50.8182003-04 0.267 45.221 2.809 - - U 0.893 33.243 11.440 93.8732004-05 0.176 44.801 1.982 - - U 1.019 34.319 11.988 94.2852005-06 0.276 48.046 2.373 - - U 1.924 32.170 12.948 97.7372006-07 0.222 51.636 2.196 - - U 1.887 39.008 14.401 109.3502007-08 0.568 40.059 (3) 1.822 - - U 1.830 46.563 14.524 105.3662008-09 0.541 50.569 2.448 - - U 1.595 57.283 14.634 127.0702009-10 0.245 35.651 2.928 - - U 1.354 78.731 12.397 131.3062010-11 0.203 30.091 2.744 - - U 1.634 74.131 13.319 122.1222011-12 0.201 45.079 3.068 - - U 1.431 70.540 14.935 135.2542012-13 0.192 25.285 2.433 - - U 1.018 80.210 12.146 121.2842013-14 0.161 14.234 2.244 - - U 0.909 57.534 9.615 84.697
2014-15 0.185 14.345 1.914 - - U 0.933 51.005 7.258 75.640
2015-16 0.451 10.036 1.200 - - U 0.865 32.038 5.499 50.0892016-17 0.350 8.344 0.900 - 1.979 R 0.683 R 27.104 4.669 44.029 R
2017-18 0.269 7.638 0.696 E - 1.771 R 0.752 22.729 4.174 38.029 R
2018-19 0.202 6.415 0.531 - 1.544 0.679 12.471 (4) 3.489 25.330
Notes: These data should be read in conjunction with the explanatory notes and other expenditure tables in this publication.
Figure(s) may be incomplete for any period due to some unavailable expenditure figures that are used to derive these numbers.
(1) Expenditure is under $1 million for small on-course clubs running their own tote, from this period on.
(2) Figure is included in TAB expenditure (discrete data were not available).
(3) Figure represents actual expenditure, from this period on.
(4) Point of consumption tax (POCT) introduced and applied from 1 Jan 2019. This figure only contains data from July 2018 to December 2018, pre-POCT.
U = Unavailable data
E = Estimated data
R = Revised data
Value ($ million)
TAS VIC WA AUSTRALIAACT NSW NT QLD SA
Australian Gambling Statistics, 1993–94 to 2018–2019, 36th edition
10

TABLE ON TOT 6REAL ON-COURSE TOTALISATOR EXPENDITURE
1993-94 2.125 114.960 1.812 60.030 17.579 3.557 76.890 19.258 296.2101994-95 1.575 116.954 2.156 50.031 15.945 3.106 68.676 19.201 277.6451995-96 1.780 107.452 2.213 45.916 14.322 3.188 64.923 20.139 259.9341996-97 1.367 102.520 3.576 42.404 14.365 2.319 60.858 19.414 246.8241997-98 2.502 102.002 3.314 37.295 13.605 2.994 58.714 20.627 241.0521998-99 1.967 87.699 4.180 32.648 10.451 2.595 55.638 20.079 215.2571999-00 1.141 78.706 4.373 - (1) 10.218 2.321 54.788 18.277 169.8252000-01 1.710 68.410 3.389 - 9.714 2.198 51.520 17.358 154.3002001-02 1.542 - (2) 4.145 - - U 1.760 49.640 17.385 74.4722002-03 1.382 - (2) 4.236 - - U 2.067 49.952 16.700 74.3382003-04 0.381 64.577 4.011 - - U 1.275 47.472 16.337 134.0542004-05 0.245 62.491 2.765 - - U 1.421 47.870 16.722 131.5152005-06 0.373 64.953 3.208 - - U 2.601 43.490 17.504 132.1302006-07 0.291 67.798 2.883 - - U 2.478 51.218 18.909 143.5772007-08 0.722 50.899 (3) 2.315 - - U 2.325 59.163 18.454 133.8782008-09 0.667 62.310 3.017 - - U 1.965 70.583 18.032 156.5742009-10 0.295 42.909 3.524 - - U 1.630 94.760 14.921 158.0392010-11 0.237 35.142 3.205 - - U 1.908 86.575 15.555 142.6212011-12 0.229 51.435 3.501 - - U 1.633 80.486 17.041 154.3252012-13 0.214 28.202 2.714 - - U 1.135 89.462 13.547 135.2742013-14 0.175 15.468 2.439 - - U 0.988 62.520 10.448 92.038
2014-15 0.198 15.326 2.045 - - U 0.997 54.491 7.754 80.810
2015-16 0.475 10.573 1.264 - - U 0.911 33.754 5.793 52.7722016-17 0.362 8.639 0.932 - 2.049 R 0.707 R 28.063 4.834 45.587 R
2017-18 0.273 7.760 0.707 E - 1.799 R 0.764 23.093 4.241 38.639 R
2018-19 0.202 6.415 0.531 - 1.544 0.679 12.471 (4) 3.489 25.330
Notes: These data should be read in conjunction with the explanatory notes and other expenditure tables in this publication.
Figure(s) may be incomplete for any period due to some unavailable expenditure figures that are used to derive these numbers.
(1) Expenditure is under $1 million for small on-course clubs running their own tote, from this period on.
(2) Figure is included in TAB expenditure (discrete data were not available).
(3) Figure represents actual expenditure, from this period on.
(4) Point of consumption tax (POCT) introduced and applied from 1 Jan 2019. This figure only contains data from July 2018 to December 2018, pre-POCT.
U = Unavailable data
E = Estimated data
R = Revised data
Value ($ million)
TAS VIC WA AUSTRALIAACT NSW NT QLD SA
Australian Gambling Statistics, 1993–94 to 2018–2019, 36th edition
11

TABLE ON TOT 7PER CAPITA ON-COURSE TOTALISATOR EXPENDITURE
1993-94 5.23 13.81 8.30 14.09 8.58 5.55 12.39 8.41 12.141994-95 3.95 14.35 9.93 11.83 8.01 4.98 11.36 8.49 11.611995-96 4.57 13.57 10.30 11.06 7.47 5.31 11.10 9.09 11.181996-97 3.52 12.95 16.36 10.15 7.56 3.90 10.44 8.70 10.611997-98 6.39 12.73 14.78 8.77 7.11 5.03 9.97 9.06 10.231998-99 5.03 10.95 18.49 7.65 5.49 4.40 9.45 8.77 9.131999-00 2.95 9.92 19.41 - (1) 5.45 4.02 9.41 8.04 7.282000-01 4.61 9.02 15.68 - 5.46 4.02 9.25 7.96 6.912001-02 4.20 - (2) 19.51 - - U 3.30 9.04 8.06 3.382002-03 3.83 - (2) 20.48 - - U 3.95 9.24 7.85 3.432003-04 1.07 8.97 19.79 - - U 2.46 8.87 7.73 6.242004-05 0.70 8.81 13.76 - - U 2.77 9.03 7.95 6.182005-06 1.08 9.37 16.15 - - U 5.19 8.33 8.42 6.312006-07 0.85 9.95 14.60 - - U 5.04 9.91 9.13 6.932007-08 2.13 7.58 (3) 11.74 - - U 4.83 11.58 8.92 6.542008-09 1.98 9.40 15.22 - - U 4.15 13.91 8.69 7.712009-10 0.88 6.52 17.70 - - U 3.48 18.71 7.15 7.802010-11 0.71 5.43 16.33 - - U 4.16 17.32 7.47 7.142011-12 0.69 8.03 17.92 - - U 3.62 16.18 8.13 7.772012-13 0.65 4.44 13.81 - - U 2.56 18.01 6.42 6.842013-14 0.53 2.46 12.49 - - U 2.28 12.64 4.99 4.70
2014-15 0.61 2.45 10.55 - - U 2.32 10.96 3.73 4.13
2015-16 1.45 1.68 6.57 - - U 2.14 6.73 2.80 2.692016-17 1.10 1.38 4.90 - 1.46 R 1.68 R 5.55 2.37 2.33 R
2017-18 0.83 1.24 3.77 E - 1.30 R 1.82 4.55 2.10 1.97 R
2018-19 0.61 1.02 2.88 - 1.12 1.62 2.44 (4) 1.74 1.29
Notes: These data should be read in conjunction with the explanatory notes and other expenditure tables in this publication.
Figure(s) may be incomplete for any period due to some unavailable expenditure figures that are used to derive these numbers.
(1) Expenditure is under $1 million for small on-course clubs running their own tote, from this period on.
(2) Figure is included in TAB expenditure (discrete data were not available).
(3) Figure represents actual expenditure, from this period on.
(4) Point of consumption tax (POCT) introduced and applied from 1 Jan 2019. This figure only contains data from July 2018 to December 2018, pre-POCT.
U = Unavailable data
E = Estimated data
R = Revised data
Value ($)
TAS VIC WA AUSTRALIAACT NSW NT QLD SA
Australian Gambling Statistics, 1993–94 to 2018–2019, 36th edition
12

TABLE ON TOT 8REAL PER CAPITA ON-COURSE TOTALISATOR EXPENDITURE
1993-94 9.72 25.66 15.43 26.19 15.95 10.32 23.03 15.63 22.571994-95 7.10 25.82 17.87 21.29 14.41 8.97 20.45 15.28 20.891995-96 7.90 23.43 17.78 19.09 12.90 9.17 19.16 15.69 19.291996-97 5.99 22.06 27.86 17.28 12.87 6.65 17.77 14.81 18.071997-98 10.88 21.68 25.17 14.94 12.11 8.57 16.97 15.43 17.431998-99 8.47 18.42 31.12 12.87 9.24 7.41 15.91 14.76 15.371999-00 4.85 16.32 31.90 - (1) 8.97 6.61 15.47 13.21 11.962000-01 7.14 13.98 24.30 - 8.47 6.23 14.35 12.34 10.712001-02 6.34 - (2) 29.40 - - U 4.97 13.63 12.15 5.102002-03 5.60 - (2) 29.95 - - U 5.78 13.52 11.49 5.012003-04 1.53 12.80 28.25 - - U 3.51 12.67 11.04 8.912004-05 0.97 12.29 19.20 - - U 3.87 12.60 11.09 8.622005-06 1.46 12.67 21.84 - - U 7.02 11.26 11.38 8.532006-07 1.11 13.06 19.17 - - U 6.62 13.01 11.98 9.102007-08 2.70 9.64 (3) 14.91 - - U 6.14 14.71 11.33 8.312008-09 2.44 11.58 18.76 - - U 5.12 17.14 10.70 9.502009-10 1.06 7.84 21.31 - - U 4.19 22.52 8.60 9.392010-11 0.83 6.34 19.07 - - U 4.85 20.22 8.73 8.342011-12 0.79 9.16 20.45 - - U 4.13 18.46 9.27 8.872012-13 0.72 4.96 15.40 - - U 2.86 20.08 7.16 7.632013-14 0.58 2.68 13.57 - - U 2.48 13.73 5.42 5.10
2014-15 0.65 2.61 11.27 - - U 2.48 11.71 3.98 4.41
2015-16 1.53 1.77 6.92 - - U 2.26 7.09 2.95 2.842016-17 1.14 1.42 5.07 - 1.52 R 1.74 R 5.75 2.45 2.41 R
2017-18 0.84 1.26 3.83 E - 1.32 R 1.85 4.62 2.13 2.01 R
2018-19 0.61 1.02 2.88 - 1.12 1.62 2.44 (4) 1.74 1.29
Notes: These data should be read in conjunction with the explanatory notes and other expenditure tables in this publication.
Figure(s) may be incomplete for any period due to some unavailable expenditure figures that are used to derive these numbers.
(1) Expenditure is under $1 million for small on-course clubs running their own tote, from this period on.
(2) Figure is included in TAB expenditure (discrete data were not available).
(3) Figure represents actual expenditure, from this period on.
(4) Point of consumption tax (POCT) introduced and applied from 1 Jan 2019. This figure only contains data from July 2018 to December 2018, pre-POCT.
U = Unavailable data
E = Estimated data
R = Revised data
Value ($)
TAS VIC WA AUSTRALIAACT NSW NT QLD SA
Australian Gambling Statistics, 1993–94 to 2018–2019, 36th edition
13

TABLE ON TOT 9ON-COURSE TOTALISATOR EXPENDITURE AS A % OF HOUSEHOLD DISPOSABLE INCOME
(ALL STATES AND TERRITORIES)
1993-94 0.015 0.054 0.037 0.063 0.039 0.028 0.054 0.037 0.0511994-95 0.011 0.054 0.039 0.051 0.035 0.024 0.048 0.035 0.0471995-96 0.013 0.048 0.039 0.046 0.031 0.024 0.045 0.037 0.0431996-97 0.009 0.044 0.060 0.040 0.031 0.018 0.041 0.034 0.0391997-98 0.017 0.042 0.055 0.034 0.028 0.022 0.037 0.035 0.0371998-99 0.013 0.035 0.064 0.029 0.022 0.019 0.034 0.032 0.0321999-00 0.007 0.030 0.061 - (1) 0.020 0.017 0.033 0.028 0.0242000-01 0.009 0.026 0.045 - 0.019 0.016 0.030 0.027 0.0212001-02 0.009 - (2) 0.052 - - U 0.012 0.027 0.024 0.0102002-03 0.007 - (2) 0.055 - - U 0.014 0.027 0.023 0.0102003-04 0.002 0.023 0.050 - - U 0.008 0.025 0.021 0.0172004-05 0.001 0.021 0.031 - - U 0.008 0.024 0.021 0.0162005-06 0.002 0.022 0.033 - - U 0.014 0.022 0.021 0.0162006-07 0.001 0.022 0.028 - - U 0.013 0.024 0.021 0.0162007-08 0.003 0.016 (3) 0.021 - - U 0.011 0.026 0.018 0.0142008-09 0.002 0.019 0.026 - - U 0.009 0.030 0.016 0.0152009-10 0.001 0.013 0.028 - - U 0.007 0.040 0.013 0.0152010-11 0.001 0.010 0.025 - - U 0.009 0.035 0.013 0.0132011-12 0.001 0.014 0.026 - - U 0.007 0.032 0.013 0.0142012-13 0.001 0.008 0.019 - - U 0.005 0.035 0.010 0.0122013-14 0.000 0.004 0.016 - - U 0.005 0.023 0.007 0.008
2014-15 0.001 0.004 0.013 - - U 0.004 0.020 0.005 0.007
2015-16 0.001 0.003 0.008 - - U 0.004 0.013 0.004 0.0042016-17 0.001 0.002 0.006 - 0.002 R 0.003 R 0.010 0.003 0.004 R
2017-18 0.001 0.002 0.004 E - 0.002 R 0.003 0.008 0.003 0.003 R
2018-19 0.001 0.002 0.003 - 0.002 0.003 0.004 (4) 0.002 0.002
Notes: These data should be read in conjunction with the explanatory notes and other expenditure tables in this publication.
Figure(s) may be incomplete for any period due to some unavailable expenditure figures that are used to derive these numbers.
(1) Expenditure is under $1 million for small on-course clubs running their own tote, from this period on.
(2) Figure is included in TAB expenditure (discrete data were not available).
(3) Figure represents actual expenditure, from this period on.
(4) Point of consumption tax (POCT) introduced and applied from 1 Jan 2019. This figure only contains data from July 2018 to December 2018, pre-POCT.
U = Unavailable data
E = Estimated data
R = Revised data
Percentage (%)
TAS VIC WA AUSTRALIAACT NSW NT QLD SA
Australian Gambling Statistics, 1993–94 to 2018–2019, 36th edition
14

TABLE ON TOT 10GOVERNMENT REVENUE FROM ON-COURSE TOTALISATOR
1993-94 0.425 62.948 - 5.203 1.870 0.333 37.415 2.870 111.0641994-95 0.360 61.608 - 5.394 1.795 0.355 26.855 3.077 99.4441995-96 0.395 57.707 - 5.118 1.646 0.325 9.987 3.354 78.5321996-97 - (1) 54.773 - 5.100 1.673 0.317 8.414 - (2) 70.2771997-98 - 46.506 - 4.200 1.310 0.298 8.957 - 61.2711998-99 - 23.465 - 3.700 1.220 0.229 9.561 - 38.1751999-00 - 22.229 - - (1) 1.222 0.307 9.737 - 33.4952000-01 - 8.639 - - 1.304 - (3) 6.389 - 16.3322001-02 - - (1) 0.825 - - U - 6.357 - 7.1822002-03 - - 0.868 - 1.210 - 6.607 - 8.6852003-04 - - 0.843 - 1.060 - 6.413 - 8.3162004-05 - - 0.595 - 1.203 - 6.689 - 8.4872005-06 - - 0.712 - - (4) - 6.401 - 7.1132006-07 - - 0.659 - - - 7.454 - 8.1132007-08 - - 0.729 - - - 8.898 - 9.6272008-09 - - 0.979 - - - 10.946 - 11.9252009-10 - - 0.948 - - - 15.046 - 15.9942010-11 - - 0.878 - - - 14.166 - 15.0442011-12 - - 0.982 - - - 13.480 - 14.4622012-13 - - 0.556 - - - 6.963 - 7.5192013-14 - - 0.482 - - - 4.373 - 4.8542014-15 - - 0.765 - - - 3.876 - 4.6412015-16 - - 0.157 - - - 2.435 - 2.5922016-17 - - 0.094 - - - 2.060 - 2.1542017-18 - - 0.033 E - - - 1.727 - 1.7602018-19 - - 0.017 - - - 0.948 (5) - 0.965
Notes: These data should be read in conjunction with the explanatory notes and other revenue tables in this publication.
Figure(s) may be incomplete for any period due to some unavailable revenue figures that are used to derive these numbers.
Data for the gambling revenue received by states and territories from 1 July 2000 onwards are not comparable with that of preceding years because of the impact
of changes brought about by the introduction of the GST.
(1) On-course totalisator revenue included in TAB revenue, from this period on.
(2) Government no longer collects revenue from bookmakers and on-course totalisator.
(3) Tote ceased to pay tax from 1 August 2000 on totalisator turnover following its corporatisation.
(4) On-course totalisator tax abolished 1 July 2006.
(5) Point of consumption tax (POCT) introduced and applied from 1 Jan 2019. This figure only contains data from July 2018 to December 2018, pre-POCT.
U = Unavailable data
E = Estimated data
Value ($ million)
TAS VIC WA AUSTRALIAACT NSW NT QLD SA
Australian Gambling Statistics, 1993–94 to 2018–2019, 36th edition
15

TABLE ON TOT 11REAL GOVERNMENT REVENUE FROM ON-COURSE TOTALISATOR
1993-94 0.790 116.977 - 9.669 3.475 0.619 69.529 5.333 206.3911994-95 0.648 110.875 - 9.707 3.230 0.639 48.331 5.538 178.9681995-96 0.682 99.612 - 8.835 2.841 0.561 17.239 5.790 135.5601996-97 - (1) 93.278 - 8.685 2.849 0.540 14.329 - (2) 119.6811997-98 - 79.199 - 7.153 2.231 0.507 15.254 - 104.3441998-99 - 39.489 - 6.227 2.053 0.385 16.090 - 64.2441999-00 - 36.547 - - (1) 2.009 0.505 16.009 - 55.0692000-01 - 13.393 - - 2.022 - (3) 9.905 - 25.3192001-02 - - (1) 1.243 - - U - 9.582 - 10.8252002-03 - - 1.270 - 1.770 - 9.665 - 12.7052003-04 - - 1.204 - 1.514 - 9.158 - 11.8762004-05 - - 0.830 - 1.678 - 9.330 - 11.8382005-06 - - 0.963 - - (4) - 8.653 - 9.6162006-07 - - 0.865 - - - 9.787 - 10.6522007-08 - - 0.926 - - - 11.306 - 12.2322008-09 - - 1.206 - - - 13.487 - 14.6942009-10 - - 1.141 - - - 18.109 - 19.2502010-11 - - 1.026 - - - 16.544 - 17.5692011-12 - - 1.120 - - - 15.381 - 16.5012012-13 - - 0.620 - - - 7.766 - 8.3872013-14 - - 0.524 - - - 4.752 - 5.2752014-15 - - 0.818 - - - 4.141 - 4.9592015-16 - - 0.166 - - - 2.565 - 2.7312016-17 - - 0.098 - - - 2.133 - 2.2312017-18 - - 0.034 E - - - 1.755 - 1.7892018-19 - - 0.017 - - - 0.948 (5) - 0.965
Notes: These data should be read in conjunction with the explanatory notes and other revenue tables in this publication.
Figure(s) may be incomplete for any period due to some unavailable revenue figures that are used to derive these numbers.
Data for the gambling revenue received by states and territories from 1 July 2000 onwards are not comparable with that of preceding years because of the impact
of changes brought about by the introduction of the GST.
(1) On-course totalisator revenue included in TAB revenue, from this period on.
(2) Government no longer collects revenue from bookmakers and on-course totalisator.
(3) Tote ceased to pay tax from 1 August 2000 on totalisator turnover following its corporatisation.
(4) On-course totalisator tax abolished 1 July 2006.
(5) Point of consumption tax (POCT) introduced and applied from 1 Jan 2019. This figure only contains data from July 2018 to December 2018, pre-POCT.
U = Unavailable data
E = Estimated data
Value ($ million)
TAS VIC WA AUSTRALIAACT NSW NT QLD SA
Australian Gambling Statistics, 1993–94 to 2018–2019, 36th edition
16

TABLE ON TOT 12PER CAPITA GOVERNMENT REVENUE FROM ON-COURSE TOTALISATOR
1993-94 1.95 14.05 - 2.27 1.70 0.97 11.21 2.33 8.461994-95 1.62 13.60 - 2.30 1.62 1.03 8.00 2.45 7.481995-96 1.75 12.58 - 2.13 1.48 0.93 2.95 2.61 5.831996-97 - (1) 11.79 - 2.08 1.50 0.91 2.46 - (2) 5.151997-98 - 9.89 - 1.68 1.17 0.85 2.59 - 4.431998-99 - 4.93 - 1.46 1.08 0.65 2.73 - 2.731999-00 - 4.61 - - (1) 1.07 0.87 2.75 - 2.362000-01 - 1.77 - - 1.14 - (3) 1.78 - 1.132001-02 - - (1) 5.85 - - U - 1.74 - 0.492002-03 - - 6.14 - 1.04 - 1.79 - 0.592003-04 - - 5.94 - 0.90 - 1.71 - 0.552004-05 - - 4.13 - 1.01 - 1.76 - 0.562005-06 - - 4.85 - - (4) - 1.66 - 0.462006-07 - - 4.38 - - - 1.89 - 0.512007-08 - - 4.70 - - - 2.21 - 0.602008-09 - - 6.09 - - - 2.66 - 0.722009-10 - - 5.73 - - - 3.57 - 0.952010-11 - - 5.23 - - - 3.31 - 0.882011-12 - - 5.74 - - - 3.09 - 0.832012-13 - - 3.16 - - - 1.56 - 0.422013-14 - - 2.68 - - - 0.96 - 0.272014-15 - - 4.22 - - - 0.83 - 0.252015-16 - - 0.86 - - - 0.51 - 0.142016-17 - - 0.51 - - - 0.42 - 0.112017-18 - - 0.18 E - - - 0.35 - 0.092018-19 - - 0.09 - - - 0.19 (5) - 0.05
Notes: These data should be read in conjunction with the explanatory notes and other revenue tables in this publication.
Figure(s) may be incomplete for any period due to some unavailable revenue figures that are used to derive these numbers.
Data for the gambling revenue received by states and territories from 1 July 2000 onwards are not comparable with that of preceding years because of the impact
of changes brought about by the introduction of the GST.
(1) On-course totalisator revenue included in TAB revenue, from this period on.
(2) Government no longer collects revenue from bookmakers and on-course totalisator.
(3) Tote ceased to pay tax from 1 August 2000 on totalisator turnover following its corporatisation.
(4) On-course totalisator tax abolished 1 July 2006.
(5) Point of consumption tax (POCT) introduced and applied from 1 Jan 2019. This figure only contains data from July 2018 to December 2018, pre-POCT.
U = Unavailable data
E = Estimated data
Value ($)
TAS VIC WA AUSTRALIAACT NSW NT QLD SA
Australian Gambling Statistics, 1993–94 to 2018–2019, 36th edition
17

TABLE ON TOT 13REAL PER CAPITA GOVERNMENT REVENUE FROM ON-COURSE TOTALISATOR
1993-94 3.61 26.11 - 4.22 3.15 1.80 20.83 4.33 15.721994-95 2.92 24.48 - 4.13 2.92 1.84 14.39 4.41 13.461995-96 3.02 21.72 - 3.67 2.56 1.61 5.09 4.51 10.061996-97 - (1) 20.07 - 3.54 2.55 1.55 4.18 - (2) 8.761997-98 - 16.84 - 2.87 1.99 1.45 4.41 - 7.541998-99 - 8.29 - 2.45 1.81 1.10 4.60 - 4.591999-00 - 7.58 - - (1) 1.76 1.44 4.52 - 3.882000-01 - 2.74 - - 1.76 - (3) 2.76 - 1.762001-02 - - (1) 8.82 - - U - 2.63 - 0.742002-03 - - 8.98 - 1.52 - 2.62 - 0.862003-04 - - 8.48 - 1.29 - 2.44 - 0.792004-05 - - 5.76 - 1.41 - 2.45 - 0.782005-06 - - 6.55 - - (4) - 2.24 - 0.622006-07 - - 5.75 - - - 2.49 - 0.682007-08 - - 5.97 - - - 2.81 - 0.762008-09 - - 7.50 - - - 3.28 - 0.892009-10 - - 6.90 - - - 4.30 - 1.142010-11 - - 6.10 - - - 3.86 - 1.032011-12 - - 6.54 - - - 3.53 - 0.952012-13 - - 3.52 - - - 1.74 - 0.472013-14 - - 2.91 - - - 1.04 - 0.292014-15 - - 4.51 - - - 0.89 - 0.272015-16 - - 0.91 - - - 0.54 - 0.152016-17 - - 0.53 - - - 0.44 - 0.122017-18 - - 0.18 E - - - 0.35 - 0.092018-19 - - 0.09 - - - 0.19 (5) - 0.05
Notes: These data should be read in conjunction with the explanatory notes and other revenue tables in this publication.
Figure(s) may be incomplete for any period due to some unavailable revenue figures that are used to derive these numbers.
Data for the gambling revenue received by states and territories from 1 July 2000 onwards are not comparable with that of preceding years because of the impact
of changes brought about by the introduction of the GST.
(1) On-course totalisator revenue included in TAB revenue, from this period on.
(2) Government no longer collects revenue from bookmakers and on-course totalisator.
(3) Tote ceased to pay tax from 1 August 2000 on totalisator turnover following its corporatisation.
(4) On-course totalisator tax abolished 1 July 2006.
(5) Point of consumption tax (POCT) introduced and applied from 1 Jan 2019. This figure only contains data from July 2018 to December 2018, pre-POCT.
U = Unavailable data
E = Estimated data
Value ($)
TAS VIC WA AUSTRALIAACT NSW NT QLD SA
Australian Gambling Statistics, 1993–94 to 2018–2019, 36th edition
18

TABLE ON TOT 14ON-COURSE TOTALISATOR REVENUE
AS A % OF TOTAL STATE GAMBLING REVENUE
1993-94 0.90 6.24 - 1.55 1.44 0.74 5.02 1.541994-95 0.70 5.70 - 1.40 0.99 0.71 2.97 1.491995-96 0.75 4.86 - 1.23 0.73 0.62 0.95 1.461996-97 - (1) 4.43 - 1.15 0.67 0.52 0.73 - (2)
1997-98 - 3.45 - 0.83 0.46 0.47 0.69 -1998-99 - 1.67 - 0.63 0.39 0.34 0.68 -1999-00 - 1.44 - - (1) 0.36 0.42 0.64 -2000-01 - 0.73 - - 0.44 - (3) 0.50 -2001-02 - - (1) 2.49 - - U - 0.46 -2002-03 - - 2.43 - 0.34 - 0.50 -2003-04 - - 2.20 - 0.27 - 0.48 -2004-05 - - 1.31 - 0.30 - 0.49 -2005-06 - - 1.29 - - (4) - 0.44 -2006-07 - - 1.04 - - - 0.50 -2007-08 - - 1.02 - - - 0.57 -2008-09 - - 1.34 - - - 0.67 -2009-10 - - 1.56 - - - 0.93 -2010-11 - - 1.76 - - - 0.87 -2011-12 - - 1.85 - - - 0.79 -2012-13 - - 1.05 - - - 0.45 -2013-14 - - 0.83 - - - 0.29 -2014-15 - - 1.12 - - - 0.24 -2015-16 - - 0.19 - - - 0.14 -2016-17 - - 0.11 - - - 0.13 -2017-18 - - 0.03 E - - - 0.10 -2018-19 - - 0.02 - - - 0.05 (5) -
Notes: These data should be read in conjunction with the explanatory notes and other revenue tables in this publication.
Figure(s) may be incomplete for any period due to some unavailable revenue figures that are used to derive these numbers.
Data for the gambling revenue received by states and territories from 1 July 2000 onwards are not comparable with that of preceding years because of the impact
of changes brought about by the introduction of the GST.
(1) On-course totalisator revenue included in TAB revenue, from this period on.
(2) Government no longer collects revenue from bookmakers and on-course totalisator.
(3) Tote ceased to pay tax from 1 August 2000 on totalisator turnover following its corporatisation.
(4) On-course totalisator tax abolished 1 July 2006.
(5) Point of consumption tax (POCT) introduced and applied from 1 Jan 2019. This figure only contains data from July 2018 to December 2018, pre-POCT.
U = Unavailable data
E = Estimated data
Percentage (%)
ACT NSW NT QLD SA TAS VIC WA
Australian Gambling Statistics, 1993–94 to 2018–2019, 36th edition
19

TABLE TAB 1TAB TURNOVER
1993-94 87.199 3,329.177 60.634 1,249.199 526.852 221.512 2,323.920 583.869 8,382.3621994-95 83.465 3,467.924 69.235 1,281.074 513.283 267.060 2,259.918 619.472 8,561.4311995-96 102.631 3,574.283 72.000 1,295.100 496.392 253.145 2,274.362 658.249 8,726.1621996-97 112.880 3,625.400 87.900 1,329.000 522.926 226.116 2,285.145 676.719 8,866.0861997-98 113.027 3,554.474 74.095 1,344.900 590.304 204.833 2,371.919 733.455 8,987.0071998-99 115.128 3,672.300 70.240 1,418.100 617.823 206.855 2,537.683 779.194 9,417.3231999-00 110.915 3,772.700 67.819 1,526.065 616.363 195.108 2,576.276 813.080 9,678.3262000-01 129.171 3,912.400 70.796 1,551.565 (1) 630.254 208.395 2,687.640 846.171 10,036.3922001-02 126.538 4,485.000 (2) 76.987 1,590.191 622.050 229.493 2,818.234 886.898 10,835.3912002-03 128.905 4,642.100 (2) 86.119 1,686.593 631.043 261.980 2,940.641 961.381 11,338.7622003-04 151.210 4,343.950 91.337 1,808.578 663.895 273.879 3,074.044 1,030.888 11,437.7812004-05 157.582 4,448.803 101.914 1,915.544 683.780 286.660 3,242.283 1,168.319 12,004.8852005-06 168.134 4,285.428 106.722 1,931.923 657.715 302.550 3,269.919 1,267.357 11,989.7482006-07 158.325 4,322.166 128.750 2,065.409 700.604 366.891 3,476.624 1,418.427 12,637.1962007-08 159.633 4,175.968 135.071 2,066.364 671.135 466.290 3,381.992 1,443.191 12,499.6442008-09 170.022 4,470.149 148.758 2,230.662 717.910 631.156 3,501.875 1,513.450 13,383.9822009-10 160.006 4,673.163 134.762 2,214.088 739.724 712.341 3,330.166 1,435.045 13,399.2952010-11 155.800 4,676.901 118.570 2,239.010 777.362 933.736 E 3,229.290 1,572.348 13,703.0172011-12 152.800 4,922.237 118.183 2,248.818 749.566 915.285 E 3,116.064 1,754.816 13,977.7692012-13 145.638 5,215.581 106.039 2,202.268 654.681 198.217 2,990.484 1,811.016 13,323.9242013-14 136.415 5,327.549 99.514 2,153.231 648.967 282.909 2,791.871 1,731.250 13,171.7072014-15 132.578 5,408.595 65.466 2,068.511 660.621 326.044 2,712.408 1,576.779 12,951.0022015-16 105.005 5,554.138 76.200 2,172.839 668.275 381.671 2,542.446 1,472.862 12,973.4362016-17 96.247 5,599.373 63.200 2,023.651 627.062 369.543 2,364.475 1,828.527 R 12,972.078 R
2017-18 87.449 5,742.505 59.149 1,992.090 612.348 367.459 2,247.446 1,873.469 R 12,981.915 R
2018-19 85.533 5,733.270 (4) 48.403 1,839.399 558.620 298.840 1,161.695 (3) 1,817.246 11,543.007
Notes: These data should be read in conjunction with the explanatory notes and other turnover tables in this publication.
Figure(s) may be incomplete for any period due to some unavailable turnover figures that are used to derive these numbers.
(1) Includes both on and off-course betting, from this period on.
(2) TAB turnover includes on and off-course totalisator (racing and FootyTAB), fixed odds racing and sports betting.
(3) Point of consumption tax (POCT) introduced and applied from 1 Jan 2019. This figure only contains data from July 2018 to December 2018, pre-POCT.
(4) Figure from totalisator racing, fixed odds racing and computer simulated racing events.
E = Estimated data
R = Revised data
AUSTRALIA
Value ($ million)
ACT NSW NT QLD SA TAS VIC WA
Australian Gambling Statistics, 1993–94 to 2018–2019, 36th edition
20

TABLE TAB 2REAL TAB TURNOVER
1993-94 162.042 6,186.630 112.677 2,321.394 979.052 411.637 4,318.555 1,085.007 15,576.9951994-95 150.211 6,241.169 124.601 2,305.529 923.747 480.624 4,067.139 1,114.854 15,407.8751995-96 177.159 6,169.829 124.284 2,235.566 856.858 436.972 3,925.941 1,136.251 15,062.8611996-97 192.233 6,174.002 149.692 2,263.267 890.535 385.072 3,891.568 1,152.442 15,098.8121997-98 192.483 6,053.216 126.183 2,290.345 1,005.279 348.828 4,039.343 1,249.063 15,304.7391998-99 193.748 6,180.080 118.206 2,386.508 1,039.729 348.114 4,270.644 1,311.298 15,848.3271999-00 182.354 6,202.667 111.501 2,508.992 1,013.358 320.775 4,235.635 1,336.779 15,912.0602000-01 200.250 6,065.283 109.753 2,405.347 (1) 977.065 323.069 4,166.572 1,311.795 15,559.1352001-02 190.726 6,760.086 (2) 116.040 2,396.840 937.595 345.907 4,247.827 1,336.791 16,331.8112002-03 188.565 6,790.559 (2) 125.977 2,467.183 923.103 383.230 4,301.630 1,406.328 16,586.5742003-04 215.933 6,203.313 130.432 2,582.713 948.065 391.109 4,389.843 1,472.144 16,333.5522004-05 219.806 6,205.482 142.156 2,671.926 953.781 399.852 4,522.549 1,629.648 16,745.2002005-06 227.300 5,793.452 144.277 2,611.758 889.162 409.016 4,420.590 1,713.335 16,208.8892006-07 207.881 5,675.019 169.049 2,711.889 919.895 481.729 4,564.819 1,862.400 16,592.6822007-08 202.830 5,305.991 171.621 2,625.524 852.745 592.469 4,297.164 1,833.720 15,882.0642008-09 209.498 5,508.035 183.297 2,748.580 884.595 777.699 4,314.945 1,864.845 16,491.4942009-10 192.581 5,624.556 162.198 2,664.846 890.322 857.364 4,008.143 1,727.201 16,127.2112010-11 181.953 5,461.969 138.473 2,614.852 907.851 1,090.474 E 3,771.361 1,836.284 16,003.2162011-12 174.345 5,616.272 134.846 2,565.901 855.255 1,044.340 E 3,555.429 2,002.245 15,948.6342012-13 162.437 5,817.183 118.270 2,456.293 730.197 221.081 3,335.427 2,019.911 14,860.7992013-14 148.238 5,789.270 108.139 2,339.844 705.211 307.428 3,033.834 1,881.292 14,313.2552014-15 141.640 5,778.284 69.941 2,209.898 705.776 348.330 2,897.807 1,684.555 13,836.2302015-16 110.629 5,851.590 80.281 2,289.205 704.064 402.111 2,678.607 1,551.741 13,668.2282016-17 99.653 5,797.536 65.437 2,095.269 649.254 382.621 2,448.154 1,893.239 R 13,431.163 R
2017-18 88.851 5,834.549 60.097 2,024.020 622.163 373.349 2,283.469 1,903.498 R 13,189.996 R
2018-19 85.533 5,733.270 (4) 48.403 1,839.399 558.620 298.840 1,161.695 (3) 1,817.246 11,543.007
Notes: These data should be read in conjunction with the explanatory notes and other turnover tables in this publication.
Figure(s) may be incomplete for any period due to some unavailable turnover figures that are used to derive these numbers.
(1) Includes both on and off-course betting, from this period on.
(2) TAB turnover includes on and off-course totalisator (racing and FootyTAB), fixed odds racing and sports betting.
(3) Point of consumption tax (POCT) introduced and applied from 1 Jan 2019. This figure only contains data from July 2018 to December 2018, pre-POCT.
(4) Figure from totalisator racing, fixed odds racing and computer simulated racing events.
E = Estimated data
R = Revised data
AUSTRALIA
Value ($ million)
ACT NSW NT QLD SA TAS VIC WA
Australian Gambling Statistics, 1993–94 to 2018–2019, 36th edition
21

TABLE TAB 3PER CAPITA TAB TURNOVER
1993-94 399.08 743.03 516.44 545.01 478.05 642.80 696.09 473.91 638.571994-95 376.46 765.63 574.00 545.21 463.89 771.11 672.94 492.86 644.141995-96 455.30 779.35 578.62 538.51 447.12 727.95 671.17 512.66 647.651996-97 494.78 780.17 684.78 541.64 468.63 648.13 667.37 516.19 649.101997-98 491.51 755.66 562.84 538.81 525.41 586.05 685.70 548.84 649.731998-99 495.46 771.29 522.95 558.95 546.00 590.82 725.51 572.84 672.351999-00 471.04 782.13 494.76 591.23 540.89 555.46 727.41 587.86 681.822000-01 539.61 799.79 507.69 589.80 (1) 549.25 590.93 748.35 601.55 696.912001-02 519.90 905.21 (2) 546.12 590.85 538.00 647.72 773.58 620.05 741.342002-03 521.99 927.82 (2) 608.92 610.08 541.05 731.99 795.94 661.22 764.562003-04 604.96 861.28 643.33 636.74 564.30 754.52 820.51 696.80 760.342004-05 623.43 875.24 707.74 657.47 575.97 780.53 853.08 775.12 786.832005-06 655.74 835.74 726.44 647.06 548.28 816.35 846.59 823.80 774.052006-07 605.43 832.57 855.94 674.41 576.97 980.56 883.39 898.91 801.362007-08 597.44 790.67 870.09 656.75 545.39 1,231.42 841.10 886.28 775.862008-09 623.47 830.75 924.88 689.76 575.20 1,643.76 850.39 898.49 811.892009-10 574.07 854.36 814.77 668.81 584.32 1,830.60 791.28 827.39 796.402010-11 547.22 843.74 705.59 663.72 607.06 2,374.64 E 754.28 882.25 800.932011-12 525.52 876.96 690.35 653.53 579.45 2,313.34 E 714.62 954.82 803.052012-13 491.21 916.45 601.85 626.98 500.91 499.07 671.32 957.42 751.532013-14 453.28 922.11 553.76 602.27 491.72 708.94 613.30 898.06 730.362014-15 433.93 922.00 360.90 570.19 495.98 812.45 583.08 809.41 707.072015-16 337.70 932.19 417.16 590.48 497.80 945.36 534.01 750.74 697.362016-17 303.54 923.50 343.94 540.89 463.66 906.77 484.47 926.37 R 685.51 R
2017-18 270.04 930.61 320.59 522.79 449.04 889.90 449.48 941.80 R 674.06 R
2018-19 259.66 914.56 (4) 262.83 473.94 405.83 713.37 226.98 (3) 905.21 589.28
Notes: These data should be read in conjunction with the explanatory notes and other turnover tables in this publication.
Figure(s) may be incomplete for any period due to some unavailable turnover figures that are used to derive these numbers.
(1) Includes both on and off-course betting, from this period on.
(2) TAB turnover includes on and off-course totalisator (racing and FootyTAB), fixed odds racing and sports betting.
(3) Point of consumption tax (POCT) introduced and applied from 1 Jan 2019. This figure only contains data from July 2018 to December 2018, pre-POCT.
(4) Figure from totalisator racing, fixed odds racing and computer simulated racing events.
E = Estimated data
R = Revised data
AUSTRALIA
Value ($)
ACT NSW NT QLD SA TAS VIC WA
Australian Gambling Statistics, 1993–94 to 2018–2019, 36th edition
22

TABLE TAB 4REAL PER CAPITA TAB TURNOVER
1993-94 741.62 1,380.77 959.70 1,012.79 888.37 1,194.52 1,293.55 880.68 1,186.671994-95 677.51 1,377.89 1,033.03 981.21 834.86 1,387.76 1,211.09 886.99 1,159.241995-96 785.92 1,345.29 998.81 929.56 771.80 1,256.56 1,158.55 884.94 1,117.951996-97 842.60 1,328.61 1,166.17 922.40 798.07 1,103.75 1,136.53 879.06 1,105.421997-98 837.03 1,286.87 958.51 917.58 894.76 998.03 1,167.74 934.67 1,106.481998-99 833.80 1,298.00 880.06 940.64 918.86 994.28 1,220.96 964.02 1,131.501999-00 774.43 1,285.90 813.44 972.03 889.27 913.23 1,195.93 966.50 1,120.982000-01 836.53 1,239.89 787.06 914.34 (1) 851.49 916.11 1,160.14 932.57 1,080.402001-02 783.63 1,364.40 (2) 823.15 890.57 810.91 976.29 1,165.99 934.58 1,117.392002-03 763.57 1,357.23 (2) 890.74 892.43 791.46 1,070.77 1,164.32 967.24 1,118.412003-04 863.90 1,229.94 918.70 909.29 805.84 1,077.48 1,171.71 995.06 1,085.802004-05 869.60 1,220.84 987.20 917.09 803.41 1,088.74 1,189.94 1,081.19 1,097.532005-06 886.49 1,129.83 982.07 874.75 741.22 1,103.62 1,144.50 1,113.69 1,046.442006-07 794.93 1,093.16 1,123.86 885.50 757.56 1,287.47 1,159.90 1,180.27 1,052.192007-08 759.10 1,004.62 1,105.54 834.47 692.98 1,564.64 1,068.71 1,126.11 985.812008-09 768.23 1,023.63 1,139.62 849.91 708.75 2,025.41 1,047.84 1,107.10 1,000.402009-10 690.94 1,028.30 980.65 804.96 703.28 2,203.28 952.37 995.84 958.542010-11 639.08 985.37 824.03 775.13 708.96 2,773.25 E 880.90 1,030.35 935.372011-12 599.62 1,000.61 787.69 745.68 661.15 2,639.52 E 815.38 1,089.45 916.282012-13 547.87 1,022.16 671.27 699.30 558.69 556.63 748.75 1,067.86 838.222013-14 492.57 1,002.03 601.75 654.47 534.33 770.38 666.45 975.89 793.662014-15 463.59 985.02 385.57 609.17 529.88 867.98 622.94 864.73 755.402015-16 355.79 982.11 439.50 622.11 524.46 995.99 562.61 790.95 734.712016-17 314.28 956.18 356.11 560.03 480.07 938.86 501.62 959.16 R 709.77 R
2017-18 274.37 945.52 325.72 531.17 456.24 904.16 456.68 956.90 R 684.87 R
2018-19 259.66 914.56 (4) 262.83 473.94 405.83 713.37 226.98 (3) 905.21 589.28
Notes: These data should be read in conjunction with the explanatory notes and other turnover tables in this publication.
Figure(s) may be incomplete for any period due to some unavailable turnover figures that are used to derive these numbers.
(1) Includes both on and off-course betting, from this period on.
(2) TAB turnover includes on and off-course totalisator (racing and FootyTAB), fixed odds racing and sports betting.
(3) Point of consumption tax (POCT) introduced and applied from 1 Jan 2019. This figure only contains data from July 2018 to December 2018, pre-POCT.
(4) Figure from totalisator racing, fixed odds racing and computer simulated racing events.
E = Estimated data
R = Revised data
AUSTRALIA
Value ($)
ACT NSW NT QLD SA TAS VIC WA
Australian Gambling Statistics, 1993–94 to 2018–2019, 36th edition
23

TABLE TAB 5TAB EXPENDITURE
1993-94 13.538 490.388 10.878 205.184 82.115 31.571 348.820 105.277 1,287.7711994-95 12.520 554.868 12.054 213.600 79.710 32.784 346.696 107.635 1,359.8671995-96 15.394 549.652 12.988 218.800 77.350 32.524 363.898 114.210 1,384.8161996-97 16.932 576.400 13.900 224.100 81.514 30.897 365.623 117.357 1,426.7231997-98 16.223 533.852 11.757 227.300 91.655 29.273 379.507 126.177 1,415.7441998-99 18.575 587.568 11.540 239.700 96.429 27.454 406.029 133.780 1,521.0751999-00 17.480 603.632 11.166 240.033 96.549 26.306 412.204 139.867 1,547.2372000-01 21.253 625.984 11.327 244.997 (1) 96.452 26.904 452.706 145.172 1,624.7952001-02 20.080 717.600 (2) 12.317 252.572 95.200 (3) 25.662 472.229 152.407 1,748.0672002-03 20.456 742.736 (2) 13.779 266.673 99.853 23.830 492.267 164.914 1,824.5082003-04 23.794 680.873 14.432 287.020 104.620 23.721 515.036 177.307 1,826.8032004-05 24.307 745.007 16.102 304.181 110.804 25.874 543.223 201.156 1,970.6542005-06 26.000 718.421 16.862 308.844 104.035 50.389 548.863 218.375 1,991.7892006-07 26.835 726.365 20.343 328.634 110.232 59.750 582.841 240.313 2,095.3132007-08 26.330 705.068 (4) 21.611 328.820 95.669 73.290 581.023 249.212 2,081.0232008-09 26.858 748.647 23.801 355.849 113.820 93.029 597.036 257.622 2,216.6622009-10 26.432 787.725 21.562 349.614 133.428 91.892 575.274 238.394 2,224.3212010-11 24.654 808.376 18.971 348.011 126.856 99.289 560.076 258.854 2,245.0872011-12 24.345 858.342 18.909 355.894 128.581 96.360 541.433 285.867 2,309.7312012-13 23.740 925.310 15.306 357.290 98.400 38.213 533.155 300.835 2,292.2492013-14 22.668 944.798 16.458 345.594 113.101 40.746 513.599 290.777 2,287.7422014-15 22.089 954.133 11.071 339.189 111.011 42.357 491.730 272.869 2,244.4492015-16 19.244 963.185 13.300 332.026 109.527 44.554 462.110 257.744 2,201.6902016-17 17.230 936.934 11.500 323.661 106.867 40.002 431.670 314.057 R 2,181.921 R
2017-18 15.731 960.602 (5) 10.904 320.311 104.410 41.929 411.732 316.138 R 2,181.757 R
2018-19 16.654 944.965 9.014 310.794 99.028 39.315 213.643 (6) 306.107 1,939.521
Notes: These data should be read in conjunction with the explanatory notes and other expenditure tables in this publication.
Figure(s) may be incomplete for any period due to some unavailable expenditure figures that are used to derive these numbers.
(1) Includes both on and off-course betting, from this period on.
(2) Figure is inclusive of both TAB and on-course totalisator expenditure (discrete data were not available).
(3) Calculated by applying the same ratio of expenditure to turnover for TAB racing in 2000–01 (15.3%) and applying it to the turnover figure for the current year.
(4) Figure represents actual expenditure, from this period on.
(5) Figure from totalisator racing, fixed odds racing and computer simulated racing events.
(6) Point of consumption tax (POCT) introduced and applied from 1 Jan 2019. This figure only contains data from July 2018 to December 2018, pre-POCT.
R = Revised data
AUSTRALIA
Value ($ million)
ACT NSW NT QLD SA TAS VIC WA
Australian Gambling Statistics, 1993–94 to 2018–2019, 36th edition
24
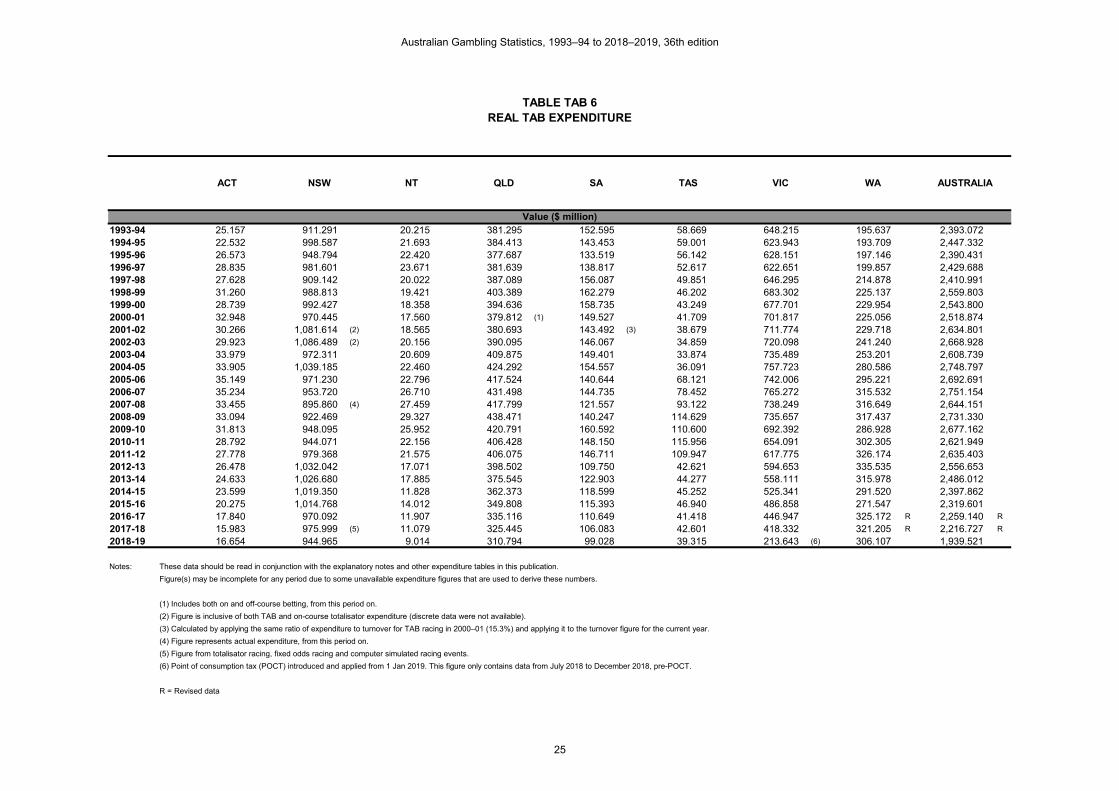
TABLE TAB 6REAL TAB EXPENDITURE
1993-94 25.157 911.291 20.215 381.295 152.595 58.669 648.215 195.637 2,393.0721994-95 22.532 998.587 21.693 384.413 143.453 59.001 623.943 193.709 2,447.3321995-96 26.573 948.794 22.420 377.687 133.519 56.142 628.151 197.146 2,390.4311996-97 28.835 981.601 23.671 381.639 138.817 52.617 622.651 199.857 2,429.6881997-98 27.628 909.142 20.022 387.089 156.087 49.851 646.295 214.878 2,410.9911998-99 31.260 988.813 19.421 403.389 162.279 46.202 683.302 225.137 2,559.8031999-00 28.739 992.427 18.358 394.636 158.735 43.249 677.701 229.954 2,543.8002000-01 32.948 970.445 17.560 379.812 (1) 149.527 41.709 701.817 225.056 2,518.8742001-02 30.266 1,081.614 (2) 18.565 380.693 143.492 (3) 38.679 711.774 229.718 2,634.8012002-03 29.923 1,086.489 (2) 20.156 390.095 146.067 34.859 720.098 241.240 2,668.9282003-04 33.979 972.311 20.609 409.875 149.401 33.874 735.489 253.201 2,608.7392004-05 33.905 1,039.185 22.460 424.292 154.557 36.091 757.723 280.586 2,748.7972005-06 35.149 971.230 22.796 417.524 140.644 68.121 742.006 295.221 2,692.6912006-07 35.234 953.720 26.710 431.498 144.735 78.452 765.272 315.532 2,751.1542007-08 33.455 895.860 (4) 27.459 417.799 121.557 93.122 738.249 316.649 2,644.1512008-09 33.094 922.469 29.327 438.471 140.247 114.629 735.657 317.437 2,731.3302009-10 31.813 948.095 25.952 420.791 160.592 110.600 692.392 286.928 2,677.1622010-11 28.792 944.071 22.156 406.428 148.150 115.956 654.091 302.305 2,621.9492011-12 27.778 979.368 21.575 406.075 146.711 109.947 617.775 326.174 2,635.4032012-13 26.478 1,032.042 17.071 398.502 109.750 42.621 594.653 335.535 2,556.6532013-14 24.633 1,026.680 17.885 375.545 122.903 44.277 558.111 315.978 2,486.0122014-15 23.599 1,019.350 11.828 362.373 118.599 45.252 525.341 291.520 2,397.8622015-16 20.275 1,014.768 14.012 349.808 115.393 46.940 486.858 271.547 2,319.6012016-17 17.840 970.092 11.907 335.116 110.649 41.418 446.947 325.172 R 2,259.140 R
2017-18 15.983 975.999 (5) 11.079 325.445 106.083 42.601 418.332 321.205 R 2,216.727 R
2018-19 16.654 944.965 9.014 310.794 99.028 39.315 213.643 (6) 306.107 1,939.521
Notes: These data should be read in conjunction with the explanatory notes and other expenditure tables in this publication.
Figure(s) may be incomplete for any period due to some unavailable expenditure figures that are used to derive these numbers.
(1) Includes both on and off-course betting, from this period on.
(2) Figure is inclusive of both TAB and on-course totalisator expenditure (discrete data were not available).
(3) Calculated by applying the same ratio of expenditure to turnover for TAB racing in 2000–01 (15.3%) and applying it to the turnover figure for the current year.
(4) Figure represents actual expenditure, from this period on.
(5) Figure from totalisator racing, fixed odds racing and computer simulated racing events.
(6) Point of consumption tax (POCT) introduced and applied from 1 Jan 2019. This figure only contains data from July 2018 to December 2018, pre-POCT.
R = Revised data
AUSTRALIA
Value ($ million)
ACT NSW NT QLD SA TAS VIC WA
Australian Gambling Statistics, 1993–94 to 2018–2019, 36th edition
25

TABLE TAB 7PER CAPITA TAB EXPENDITURE
1993-94 61.96 109.45 92.65 89.52 74.51 91.62 104.48 85.45 98.101994-95 56.47 122.50 99.94 90.91 72.04 94.66 103.24 85.64 102.311995-96 68.29 119.85 104.38 90.98 69.67 93.53 107.39 88.95 102.781996-97 74.22 124.04 108.29 91.33 73.05 88.56 106.78 89.52 104.451997-98 70.55 113.49 89.31 91.06 81.58 83.75 109.71 94.42 102.351998-99 79.94 123.41 85.92 94.48 85.22 78.41 116.08 98.35 108.601999-00 74.23 125.14 81.46 92.99 84.73 74.89 116.39 101.12 109.002000-01 88.78 127.97 81.23 93.13 (1) 84.06 76.29 126.05 103.20 112.822001-02 82.50 144.83 (2) 87.37 93.85 82.34 (3) 72.43 129.62 106.55 119.602002-03 82.83 148.45 (2) 97.43 96.46 85.61 66.58 133.24 113.42 123.022003-04 95.19 135.00 101.65 101.05 88.93 65.35 137.47 119.85 121.442004-05 96.16 146.57 111.82 104.40 93.33 70.45 142.93 133.46 129.162005-06 101.40 140.11 114.78 103.44 86.72 135.96 142.10 141.95 128.592006-07 102.62 139.92 135.24 107.31 90.78 159.69 148.10 152.29 132.872007-08 98.54 133.50 (4) 139.21 104.51 77.74 193.55 144.50 153.04 129.172008-09 98.49 139.13 147.98 110.04 91.19 242.28 144.98 152.94 134.472009-10 94.83 144.01 130.36 105.61 105.40 236.15 136.69 137.45 132.202010-11 86.59 145.84 112.89 103.16 99.06 252.51 130.82 145.24 131.222011-12 83.73 152.92 110.46 103.43 99.40 243.54 124.17 155.54 132.702012-13 80.07 162.59 86.87 101.72 75.29 96.21 119.69 159.04 129.292013-14 75.32 163.53 91.58 96.66 85.70 102.11 112.82 150.84 126.852014-15 72.30 162.65 61.03 93.50 83.34 105.55 105.71 140.07 122.542015-16 61.89 161.66 72.81 90.23 81.59 110.36 97.06 131.38 118.352016-17 54.34 154.53 62.58 86.51 79.02 98.16 88.45 159.11 R 115.30 R
2017-18 48.58 155.67 (5) 59.10 84.06 76.56 101.54 82.34 158.92 R 113.28 R
2018-19 50.56 150.74 48.95 80.08 71.94 93.85 41.74 (6) 152.48 99.01
Notes: These data should be read in conjunction with the explanatory notes and other expenditure tables in this publication.
Figure(s) may be incomplete for any period due to some unavailable expenditure figures that are used to derive these numbers.
(1) Includes both on and off-course betting, from this period on.
(2) Figure is inclusive of both TAB and on-course totalisator expenditure (discrete data were not available).
(3) Calculated by applying the same ratio of expenditure to turnover for TAB racing in 2000–01 (15.3%) and applying it to the turnover figure for the current year.
(4) Figure represents actual expenditure, from this period on.
(5) Figure from totalisator racing, fixed odds racing and computer simulated racing events.
(6) Point of consumption tax (POCT) introduced and applied from 1 Jan 2019. This figure only contains data from July 2018 to December 2018, pre-POCT.
R = Revised data
AUSTRALIA
Value ($)
ACT NSW NT QLD SA TAS VIC WA
Australian Gambling Statistics, 1993–94 to 2018–2019, 36th edition
26

TABLE TAB 8REAL PER CAPITA TAB EXPENDITURE
1993-94 115.14 203.39 172.17 166.35 138.46 170.25 194.16 158.79 182.311994-95 101.63 220.46 179.85 163.60 129.65 170.36 185.79 154.12 184.131995-96 117.88 206.88 180.17 157.04 120.27 161.44 185.37 153.54 177.421996-97 126.39 211.24 184.41 155.54 124.40 150.82 181.84 152.45 177.881997-98 120.14 193.28 152.09 155.08 138.93 142.63 186.84 160.79 174.311998-99 134.53 207.68 144.59 159.00 143.41 131.96 195.35 165.51 182.761999-00 122.05 205.74 133.93 152.89 139.30 123.13 191.35 166.26 179.212000-01 137.64 198.38 125.93 144.38 (1) 130.31 118.27 195.41 159.99 174.912001-02 124.35 218.30 (2) 131.69 141.45 124.10 (3) 109.17 195.38 160.60 180.272002-03 121.17 217.16 (2) 142.52 141.11 125.24 97.40 194.91 165.92 179.962003-04 135.94 192.78 145.16 144.30 126.99 93.32 196.31 171.14 173.422004-05 134.14 204.44 155.97 145.63 130.19 98.27 199.37 186.15 180.162005-06 137.09 189.41 155.17 139.84 117.24 183.81 192.11 191.90 173.842006-07 134.74 183.71 177.57 140.90 119.19 209.67 194.45 199.96 174.462007-08 125.21 169.62 (4) 176.88 132.79 98.78 245.93 183.60 194.46 164.122008-09 121.36 171.43 182.34 135.58 112.37 298.53 178.65 188.45 165.692009-10 114.14 173.33 156.90 127.11 126.85 284.22 164.52 165.43 159.122010-11 101.13 170.32 131.85 120.48 115.69 294.89 152.78 169.63 153.252011-12 95.53 174.49 126.03 118.01 113.41 277.88 141.68 177.48 151.412012-13 89.31 181.34 96.89 113.45 83.97 107.31 133.49 177.39 144.212013-14 81.85 177.70 99.52 105.04 93.12 110.95 122.60 163.91 137.852014-15 77.24 173.77 65.21 99.89 89.04 112.76 112.93 149.65 130.912015-16 65.20 170.32 76.71 95.06 85.96 116.27 102.26 138.41 124.692016-17 56.26 160.00 64.80 89.57 81.82 101.63 91.58 164.74 R 119.38 R
2017-18 49.36 158.17 (5) 60.05 85.41 77.79 103.17 83.66 161.47 R 115.10 R
2018-19 50.56 150.74 48.95 80.08 71.94 93.85 41.74 (6) 152.48 99.01
Notes: These data should be read in conjunction with the explanatory notes and other expenditure tables in this publication.
Figure(s) may be incomplete for any period due to some unavailable expenditure figures that are used to derive these numbers.
(1) Includes both on and off-course betting, from this period on.
(2) Figure is inclusive of both TAB and on-course totalisator expenditure (discrete data were not available).
(3) Calculated by applying the same ratio of expenditure to turnover for TAB racing in 2000–01 (15.3%) and applying it to the turnover figure for the current year.
(4) Figure represents actual expenditure, from this period on.
(5) Figure from totalisator racing, fixed odds racing and computer simulated racing events.
(6) Point of consumption tax (POCT) introduced and applied from 1 Jan 2019. This figure only contains data from July 2018 to December 2018, pre-POCT.
R = Revised data
AUSTRALIA
Value ($)
ACT NSW NT QLD SA TAS VIC WA
Australian Gambling Statistics, 1993–94 to 2018–2019, 36th edition
27

TABLE TAB 9TAB EXPENDITURE AS A % OF HOUSEHOLD DISPOSABLE INCOME
(ALL STATES AND TERRITORIES)
1993-94 0.181 0.427 0.409 0.400 0.335 0.457 0.457 0.376 0.4131994-95 0.160 0.459 0.396 0.390 0.314 0.452 0.434 0.357 0.4131995-96 0.189 0.426 0.393 0.375 0.288 0.427 0.431 0.360 0.3961996-97 0.199 0.420 0.397 0.356 0.295 0.397 0.415 0.351 0.3871997-98 0.188 0.375 0.330 0.348 0.318 0.370 0.410 0.362 0.3691998-99 0.204 0.397 0.296 0.354 0.335 0.342 0.417 0.362 0.3801999-00 0.173 0.383 0.257 0.336 0.317 0.312 0.404 0.358 0.3652000-01 0.181 0.362 0.234 0.312 (1) 0.290 0.307 0.406 0.348 0.3512001-02 0.167 0.406 (2) 0.231 0.289 0.259 (3) 0.261 0.391 0.321 0.3522002-03 0.151 0.410 (2) 0.260 0.300 0.265 0.233 0.392 0.334 0.3572003-04 0.165 0.350 0.257 0.289 0.258 0.210 0.388 0.330 0.3312004-05 0.158 0.356 0.252 0.275 0.261 0.210 0.384 0.349 0.3312005-06 0.159 0.330 0.235 0.255 0.236 0.374 0.368 0.358 0.3162006-07 0.148 0.311 0.263 0.240 0.229 0.409 0.362 0.342 0.3042007-08 0.130 0.280 (4) 0.254 0.218 0.182 0.458 0.329 0.304 0.2742008-09 0.120 0.274 0.249 0.211 0.193 0.524 0.311 0.280 0.2662009-10 0.109 0.277 0.205 0.202 0.219 0.502 0.290 0.248 0.2572010-11 0.091 0.263 0.170 0.189 0.195 0.527 0.264 0.244 0.2412011-12 0.082 0.264 0.158 0.184 0.193 0.504 0.246 0.244 0.2352012-13 0.074 0.277 0.120 0.185 0.145 0.203 0.232 0.241 0.2262013-14 0.069 0.266 0.118 0.174 0.163 0.210 0.209 0.221 0.2142014-15 0.066 0.257 0.074 0.163 0.146 0.201 0.197 0.198 0.2022015-16 0.056 0.252 0.086 0.155 0.139 0.202 0.183 0.185 0.1932016-17 0.048 0.238 0.072 0.148 0.132 0.177 0.164 0.231 R 0.187 R
2017-18 0.043 0.238 (5) 0.068 0.141 0.125 0.180 0.150 0.228 R 0.181 R
2018-19 0.044 0.227 0.058 0.132 0.117 0.162 0.076 (6) 0.219 0.157
Notes: These data should be read in conjunction with the explanatory notes and other expenditure tables in this publication.
Figure(s) may be incomplete for any period due to some unavailable expenditure figures that are used to derive these numbers.
(1) Includes both on and off-course betting, from this period on.
(2) Figure is inclusive of both TAB and on-course totalisator expenditure (discrete data were not available).
(3) Calculated by applying the same ratio of expenditure to turnover for TAB racing in 2000–01 (15.3%) and applying it to the turnover figure for the current year.
(4) Figure represents actual expenditure, from this period on.
(5) Figure from totalisator racing, fixed odds racing and computer simulated racing events.
(6) Point of consumption tax (POCT) introduced and applied from 1 Jan 2019. This figure only contains data from July 2018 to December 2018, pre-POCT.
R = Revised data
Percentage (%)
TAS VIC WA AUSTRALIAACT NSW NT QLD SA
Australian Gambling Statistics, 1993–94 to 2018–2019, 36th edition
28

TABLE TAB 10GOVERNMENT REVENUE FROM TAB
1993-94 5.032 250.556 1.990 65.915 23.546 9.551 137.855 35.032 529.4771994-95 4.785 262.946 2.340 68.429 20.361 11.520 105.517 37.169 513.0671995-96 5.901 271.564 2.432 69.757 20.012 10.943 103.100 38.924 522.6331996-97 3.624 (1) 276.692 2.547 72.000 20.530 9.996 105.148 33.824 524.3611997-98 5.580 231.161 2.390 73.100 22.488 8.840 110.449 36.670 490.6781998-99 4.380 160.538 3.054 75.700 22.117 7.783 118.699 38.960 431.2311999-00 4.182 162.964 5.223 48.007 22.204 5.940 121.957 40.654 411.1312000-01 1.718 122.523 5.440 26.549 (2) 13.920 0.709 (3) 86.614 42.297 299.7702001-02 1.405 136.302 (1) 3.695 26.904 - U - 91.149 44.345 303.8002002-03 1.553 (4) 141.775 4.134 28.416 5.971 - 95.246 48.069 325.1642003-04 5.351 147.423 4.330 30.580 6.277 - 99.941 51.544 345.4462004-05 7.159 153.164 4.831 32.384 6.648 - 105.887 52.574 362.6472005-06 6.000 146.099 5.059 33.692 6.606 - 107.169 57.031 361.6562006-07 6.800 147.862 6.103 35.851 7.251 - 111.381 60.782 376.0302007-08 8.551 141.843 8.664 35.871 6.870 - 111.033 29.681 342.5132008-09 5.689 152.183 9.520 38.820 7.512 - 114.094 31.150 358.9682009-10 8.555 157.195 8.848 38.140 6.641 - 109.935 29.721 359.0352010-11 1.217 151.605 6.071 37.965 1.522 - 107.030 32.310 337.7202011-12 1.349 148.651 6.051 38.825 0.771 - 103.468 35.747 334.8622012-13 3.979 145.519 3.499 38.977 0.890 - 47.514 37.707 278.0852013-14 4.161 141.935 3.534 37.701 - (5) - 38.281 36.756 262.3682014-15 - U 144.347 4.428 11.795 - - 37.371 34.141 232.0822015-16 - U 119.396 1.743 10.805 - - 35.120 32.249 199.3132016-17 - U 96.323 1.206 10.020 - - 32.807 39.453 R 179.809 R
2017-18 - U 96.947 0.521 9.545 16.245 (6) - 31.292 40.627 R 195.176 R
2018-19 - U 83.782 (7)(8) 0.315 - U 16.954 - 16.237 (9) 40.362 (10) 157.650
Notes: These data should be read in conjunction with the explanatory notes and other revenue tables in this publication.
Figure(s) may be incomplete for any period due to some unavailable revenue figures that are used to derive these numbers.
Data for the gambling revenue received by states and territories from 1 July 2000 onwards are not comparable with that of preceding years because of the impact
of changes brought about by the introduction of the GST.
(1) Government revenue from TAB includes on-course totalisators, from this period on.
(2) Includes both on and off-course betting, from this period on.
(3) Tote ceased to pay tax from 1 August 2000 on totalisator turnover following its corporatisation.
(4) Government revenue from TAB is in the form of an annual licence fee.
(5) Duty on TAB racing abolished 1 July 2013.
(6) Point of consumption tax (POCT) commenced 1 July 2017. This amount represents 11 months of 2017-18, as taxation payments are made in arrears. Revenue from SA TAB only, not interstate TABs.
(7) The NSW Government implemented the POCT on 1 January 2019, through the Betting Tax Amendment (point of consumption) Bill 2018. The Bill provides for a tax of 10% of wagering
operator's revenue derived from NSW customers. POCT does not distinguish between racing and sports betting, and the revenue for the 2018-19 FY is $41m.
(8) Does not include offsets afforded to TAB due to POCT as per Section 11 of the Betting Tax Act 2001 . This is due to the design of the offsets not distinguishing between racing and sportsbetting.
(9) POCT introduced and applied from 1 Jan 2019. This figure only contains data from July 2018 to December 2018, pre-POCT.
(10) Includes all government revenue collected between 1 July 2018 to 30 June 2019, but excludes POCT revenue, which was introduced on 1 January 2019.
U = Unavailable data
R = Revised data
Value ($ million)
TAS VIC WA AUSTRALIAACT NSW NT QLD SA
Australian Gambling Statistics, 1993–94 to 2018–2019, 36th edition
29

TABLE TAB 11REAL GOVERNMENT REVENUE FROM TAB
1993-94 9.351 465.610 3.698 122.490 43.756 17.749 256.177 65.100 983.9301994-95 8.611 473.220 4.211 123.151 36.643 20.732 189.897 66.892 923.3591995-96 10.186 468.766 4.198 120.413 34.544 18.890 177.968 67.190 902.1551996-97 6.172 (1) 471.202 4.338 122.615 34.962 17.023 179.065 57.602 892.9791997-98 9.503 393.664 4.070 124.488 38.297 15.054 188.093 62.448 835.6171998-99 7.371 270.168 5.140 127.395 37.220 13.098 199.757 65.565 725.7151999-00 6.876 267.928 8.587 78.928 36.505 9.766 200.509 66.839 675.9372000-01 2.663 189.944 8.433 41.158 (2) 21.580 1.099 (3) 134.275 65.572 464.7252001-02 2.118 205.443 (1) 5.569 40.551 - U - 137.386 66.840 457.9072002-03 2.272 (4) 207.391 6.047 41.568 8.735 - 139.328 70.316 475.6572003-04 7.641 210.525 6.183 43.669 8.964 - 142.719 73.607 493.3092004-05 9.986 213.643 6.739 45.171 9.273 - 147.698 73.334 505.8442005-06 8.111 197.511 6.839 45.548 8.931 - 144.881 77.100 488.9212006-07 8.928 194.143 8.013 47.073 9.521 - 146.244 79.807 493.7292007-08 10.865 180.226 11.008 45.578 8.729 - 141.079 37.713 435.1982008-09 7.010 187.517 11.730 47.833 9.256 - 140.585 38.382 442.3132009-10 10.297 189.198 10.649 45.905 7.993 - 132.316 35.772 432.1292010-11 1.421 177.054 7.090 44.338 1.777 - 124.996 37.734 394.4102011-12 1.539 169.611 6.904 44.299 0.880 - 118.057 40.787 382.0772012-13 4.438 162.304 3.903 43.473 0.993 - 52.995 42.056 310.1622013-14 4.522 154.236 3.840 40.968 - (5) - 41.599 39.942 285.1072014-15 - U 154.213 4.730 12.601 - - 39.925 36.475 247.9452015-16 - U 125.790 1.836 11.384 - - 37.001 33.976 209.9872016-17 - U 99.732 1.248 10.375 - - 33.968 40.849 R 186.172 R
2017-18 - U 98.501 0.529 9.698 16.505 (6) - 31.793 41.278 R 198.305 R
2018-19 - U 83.782 (7)(8) 0.315 - U 16.954 - 16.237 (9) 40.362 (10) 157.650
Notes: These data should be read in conjunction with the explanatory notes and other revenue tables in this publication.
Figure(s) may be incomplete for any period due to some unavailable revenue figures that are used to derive these numbers.
Data for the gambling revenue received by states and territories from 1 July 2000 onwards are not comparable with that of preceding years because of the impact
of changes brought about by the introduction of the GST.
(1) Government revenue from TAB includes on-course totalisators, from this period on.
(2) Includes both on and off-course betting, from this period on.
(3) Tote ceased to pay tax from 1 August 2000 on totalisator turnover following its corporatisation.
(4) Government revenue from TAB is in the form of an annual licence fee.
(5) Duty on TAB racing abolished 1 July 2013.
(6) Point of consumption tax (POCT) commenced 1 July 2017. This amount represents 11 months of 2017-18, as taxation payments are made in arrears. Revenue from SA TAB only, not interstate TABs.
(7) The NSW Government implemented the POCT on 1 January 2019, through the Betting Tax Amendment (point of consumption) Bill 2018. The Bill provides for a tax of 10% of wagering
operator's revenue derived from NSW customers. POCT does not distinguish between racing and sports betting, and the revenue for the 2018-19 FY is $41m.
(8) Does not include offsets afforded to TAB due to POCT as per Section 11 of the Betting Tax Act 2001 . This is due to the design of the offsets not distinguishing between racing and sportsbetting.
(9) POCT introduced and applied from 1 Jan 2019. This figure only contains data from July 2018 to December 2018, pre-POCT.
(10) Includes all government revenue collected between 1 July 2018 to 30 June 2019, but excludes POCT revenue, which was introduced on 1 January 2019.
U = Unavailable data
R = Revised data
AUSTRALIA
Value ($ million)
ACT NSW NT QLD SA TAS VIC WA
Australian Gambling Statistics, 1993–94 to 2018–2019, 36th edition
30

TABLE TAB 12PER CAPITA GOVERNMENT REVENUE FROM TAB
1993-94 23.03 55.92 16.95 28.76 21.37 27.72 41.29 28.43 40.341994-95 21.58 58.05 19.40 29.12 18.40 33.26 31.42 29.57 38.601995-96 26.18 59.21 19.54 29.01 18.03 31.47 30.43 30.32 38.791996-97 15.88 (1) 59.54 19.84 29.34 18.40 28.65 30.71 25.80 38.391997-98 24.26 49.14 18.16 29.29 20.02 25.29 31.93 27.44 35.471998-99 18.85 33.72 22.74 29.84 19.55 22.23 33.94 28.64 30.791999-00 17.76 33.78 38.10 18.60 19.49 16.91 34.43 29.39 28.962000-01 7.18 25.05 39.01 10.09 (2) 12.13 2.01 (3) 24.12 30.07 20.822001-02 5.77 27.51 (1) 26.21 10.00 - U - 25.02 31.00 20.792002-03 6.29 (4) 28.34 29.23 10.28 5.12 - 25.78 33.06 21.932003-04 21.41 29.23 30.50 10.77 5.34 - 26.68 34.84 22.962004-05 28.32 30.13 33.55 11.12 5.60 - 27.86 34.88 23.772005-06 23.40 28.49 34.44 11.28 5.51 - 27.75 37.07 23.352006-07 26.00 28.48 40.57 11.71 5.97 - 28.30 38.52 23.852007-08 32.00 26.86 55.81 11.40 5.58 - 27.61 18.23 21.262008-09 20.86 28.28 59.19 12.00 6.02 - 27.71 18.49 21.782009-10 30.69 28.74 53.50 11.52 5.25 - 26.12 17.14 21.342010-11 4.27 27.35 36.13 11.25 1.19 - 25.00 18.13 19.742011-12 4.64 26.48 35.35 11.28 0.60 - 23.73 19.45 19.242012-13 13.42 25.57 19.86 11.10 0.68 - 10.67 19.93 15.692013-14 13.83 24.57 19.66 10.55 - (5) - 8.41 19.07 14.552014-15 - U 24.61 24.41 3.25 - - 8.03 17.53 12.672015-16 - U 20.04 9.54 2.94 - - 7.38 16.44 10.712016-17 - U 15.89 6.56 2.68 - - 6.72 19.99 R 9.50 R
2017-18 - U 15.71 2.82 2.50 11.91 (6) - 6.26 20.42 R 10.13 R
2018-19 - U 13.36 (7)(8) 1.71 - U 12.32 - 3.17 (9) 20.11 (10) 8.05
Notes: These data should be read in conjunction with the explanatory notes and other revenue tables in this publication.
Figure(s) may be incomplete for any period due to some unavailable revenue figures that are used to derive these numbers.
Data for the gambling revenue received by states and territories from 1 July 2000 onwards are not comparable with that of preceding years because of the impact
of changes brought about by the introduction of the GST.
(1) Government revenue from TAB includes on-course totalisators, from this period on.
(2) Includes both on and off-course betting, from this period on.
(3) Tote ceased to pay tax from 1 August 2000 on totalisator turnover following its corporatisation.
(4) Government revenue from TAB is in the form of an annual licence fee.
(5) Duty on TAB racing abolished 1 July 2013.
(6) Point of consumption tax (POCT) commenced 1 July 2017. This amount represents 11 months of 2017-18, as taxation payments are made in arrears. Revenue from SA TAB only, not interstate TABs.
(7) The NSW Government implemented the POCT on 1 January 2019, through the Betting Tax Amendment (point of consumption) Bill 2018. The Bill provides for a tax of 10% of wagering
operator's revenue derived from NSW customers. POCT does not distinguish between racing and sports betting, and the revenue for the 2018-19 FY is $41m.
(8) Does not include offsets afforded to TAB due to POCT as per Section 11 of the Betting Tax Act 2001 . This is due to the design of the offsets not distinguishing between racing and sportsbetting.
(9) POCT introduced and applied from 1 Jan 2019. This figure only contains data from July 2018 to December 2018, pre-POCT.
(10) Includes all government revenue collected between 1 July 2018 to 30 June 2019, but excludes POCT revenue, which was introduced on 1 January 2019.
U = Unavailable data
R = Revised data
Value ($)
TAS VIC WA AUSTRALIAACT NSW NT QLD SA
Australian Gambling Statistics, 1993–94 to 2018–2019, 36th edition
31

TABLE TAB 13REAL PER CAPITA GOVERNMENT REVENUE FROM TAB
1993-94 42.80 103.92 31.50 53.44 39.70 51.50 76.73 52.84 74.961994-95 38.84 104.48 34.91 52.41 33.12 59.86 56.55 53.22 69.471995-96 45.19 102.21 33.74 50.07 31.12 54.32 52.52 52.33 66.961996-97 27.05 (1) 101.40 33.79 49.97 31.33 48.79 52.30 43.94 65.381997-98 41.32 83.69 30.92 49.87 34.09 43.07 54.38 46.73 60.411998-99 31.72 56.74 38.26 50.21 32.89 37.41 57.11 48.20 51.811999-00 29.20 55.55 62.65 30.58 32.04 27.80 56.61 48.32 47.622000-01 11.13 38.83 60.48 15.65 (2) 18.81 3.12 (3) 37.39 46.62 32.272001-02 8.70 41.46 (1) 39.51 15.07 - U - 37.71 46.73 31.332002-03 9.20 (4) 41.45 42.76 15.04 7.49 - 37.71 48.36 32.072003-04 30.57 41.74 43.55 15.37 7.62 - 38.09 49.75 32.792004-05 39.51 42.03 46.80 15.50 7.81 - 38.86 48.65 33.152005-06 31.64 38.52 46.55 15.26 7.44 - 37.51 50.12 31.562006-07 34.14 37.40 53.27 15.37 7.84 - 37.16 50.58 31.312007-08 40.66 34.12 70.91 14.49 7.09 - 35.09 23.16 27.012008-09 25.71 34.85 72.93 14.79 7.42 - 34.14 22.79 26.832009-10 36.94 34.59 64.39 13.87 6.31 - 31.44 20.62 25.682010-11 4.99 31.94 42.19 13.14 1.39 - 29.20 21.17 23.052011-12 5.29 30.22 40.33 12.87 0.68 - 27.07 22.19 21.952012-13 14.97 28.52 22.15 12.38 0.76 - 11.90 22.23 17.492013-14 15.02 26.70 21.37 11.46 - (5) - 9.14 20.72 15.812014-15 - U 26.29 26.08 3.47 - - 8.58 18.72 13.542015-16 - U 21.11 10.05 3.09 - - 7.77 17.32 11.292016-17 - U 16.45 6.79 2.77 - - 6.96 20.70 R 9.84 R
2017-18 - U 15.96 2.87 2.54 12.10 (6) - 6.36 20.75 R 10.30 R
2018-19 - U 13.36 (7)(8) 1.71 - U 12.32 - 3.17 (9) 20.11 (10) 8.05
Notes: These data should be read in conjunction with the explanatory notes and other revenue tables in this publication.
Figure(s) may be incomplete for any period due to some unavailable revenue figures that are used to derive these numbers.
Data for the gambling revenue received by states and territories from 1 July 2000 onwards are not comparable with that of preceding years because of the impact
of changes brought about by the introduction of the GST.
(1) Government revenue from TAB includes on-course totalisators, from this period on.
(2) Includes both on and off-course betting, from this period on.
(3) Tote ceased to pay tax from 1 August 2000 on totalisator turnover following its corporatisation.
(4) Government revenue from TAB is in the form of an annual licence fee.
(5) Duty on TAB racing abolished 1 July 2013.
(6) Point of consumption tax (POCT) commenced 1 July 2017. This amount represents 11 months of 2017-18, as taxation payments are made in arrears. Revenue from SA TAB only, not interstate TABs.
(7) The NSW Government implemented the POCT on 1 January 2019, through the Betting Tax Amendment (point of consumption) Bill 2018. The Bill provides for a tax of 10% of wagering
operator's revenue derived from NSW customers. POCT does not distinguish between racing and sports betting, and the revenue for the 2018-19 FY is $41m.
(8) Does not include offsets afforded to TAB due to POCT as per Section 11 of the Betting Tax Act 2001 . This is due to the design of the offsets not distinguishing between racing and sportsbetting.
(9) POCT introduced and applied from 1 Jan 2019. This figure only contains data from July 2018 to December 2018, pre-POCT.
(10) Includes all government revenue collected between 1 July 2018 to 30 June 2019, but excludes POCT revenue, which was introduced on 1 January 2019.
U = Unavailable data
R = Revised data
AUSTRALIA
Value ($)
ACT NSW NT QLD SA TAS VIC WA
Australian Gambling Statistics, 1993–94 to 2018–2019, 36th edition
32

TABLE TAB 14TAB REVENUE
AS A % OF TOTAL STATE GAMBLING REVENUE
1993-94 10.61 24.82 14.74 19.64 18.08 21.20 18.51 18.841994-95 9.25 24.32 14.61 17.76 11.26 23.04 11.66 18.041995-96 11.13 22.85 12.01 16.74 8.90 21.00 9.81 16.981996-97 7.82 (1) 22.37 10.27 16.18 8.27 16.47 9.09 16.491997-98 11.09 17.14 8.45 14.37 7.94 14.05 8.52 16.911998-99 8.04 11.42 9.78 12.89 6.99 11.57 8.43 18.641999-00 6.74 10.56 14.04 7.82 6.51 8.08 8.02 19.432000-01 3.60 10.28 17.69 5.21 (2) 4.66 1.24 (3) 6.79 19.302001-02 3.12 11.37 (1) 11.13 4.78 - U - 6.65 19.842002-03 3.24 (4) 11.24 11.59 4.49 1.70 - 7.18 20.842003-04 9.53 11.21 11.29 4.25 1.60 - 7.55 20.692004-05 12.80 10.72 10.60 4.05 1.63 - 7.73 19.712005-06 11.29 9.60 9.17 4.01 1.62 - 7.44 20.132006-07 12.56 8.93 9.64 4.39 1.69 - 7.49 18.662007-08 14.30 9.15 12.15 4.08 1.66 - 7.08 9.262008-09 10.04 9.16 13.01 4.19 1.80 - 6.99 8.712009-10 14.27 11.07 14.60 4.13 1.63 - 6.83 8.272010-11 2.31 8.67 12.15 4.01 0.37 - 6.57 8.902011-12 2.53 8.30 11.39 3.87 0.18 - 6.05 8.932012-13 7.00 7.83 6.58 3.75 0.21 - 3.05 8.942013-14 7.58 7.51 6.09 3.61 - (5) - 2.53 8.312014-15 - U 6.96 6.47 1.09 - - 2.31 7.832015-16 - U 5.43 2.08 0.95 - - 2.09 8.292016-17 - U 4.32 1.46 0.88 - - 2.01 10.71 R
2017-18 - U 4.16 0.55 0.80 4.13 (6) - 1.84 11.20 R
2018-19 - U 3.36 (7)(8) 0.33 - U 4.14 - 0.91 (9) 10.52 (10)
Notes: These data should be read in conjunction with the explanatory notes and other revenue tables in this publication.
Figure(s) may be incomplete for any period due to some unavailable revenue figures that are used to derive these numbers.
Data for the gambling revenue received by states and territories from 1 July 2000 onwards are not comparable with that of preceding years because of the impact
of changes brought about by the introduction of the GST.
(1) Government revenue from TAB includes on-course totalisators, from this period on.
(2) Includes both on and off-course betting, from this period on.
(3) Tote ceased to pay tax from 1 August 2000 on totalisator turnover following its corporatisation.
(4) Government revenue from TAB is in the form of an annual licence fee.
(5) Duty on TAB racing abolished 1 July 2013.
(6) Point of consumption tax (POCT) commenced 1 July 2017. This amount represents 11 months of 2017-18, as taxation payments are made in arrears. Revenue from SA TAB only, not interstate TABs.
(7) The NSW Government implemented the POCT on 1 January 2019, through the Betting Tax Amendment (point of consumption) Bill 2018. The Bill provides for a tax of 10% of wagering
operator's revenue derived from NSW customers. POCT does not distinguish between racing and sports betting, and the revenue for the 2018-19 FY is $41m.
(8) Does not include offsets afforded to TAB due to POCT as per Section 11 of the Betting Tax Act 2001 . This is due to the design of the offsets not distinguishing between racing and sportsbetting.
(9) POCT introduced and applied from 1 Jan 2019. This figure only contains data from July 2018 to December 2018, pre-POCT.
(10) Includes all government revenue collected between 1 July 2018 to 30 June 2019, but excludes POCT revenue, which was introduced on 1 January 2019.
U = Unavailable data
R = Revised data
Percentage (%)
TAS VIC WAACT NSW NT QLD SA
Australian Gambling Statistics, 1993–94 to 2018–2019, 36th edition
33

TABLE ON BOOK 1ON-COURSE BOOKMAKER TURNOVER
1993-94 35.646 780.074 20.037 359.460 142.933 27.732 344.242 154.338 1,864.4621994-95 33.935 833.762 25.317 347.402 129.345 20.218 453.987 176.471 2,020.4371995-96 31.062 691.531 67.867 306.100 87.293 15.365 441.608 198.217 1,839.0431996-97 22.452 610.200 63.919 265.400 78.838 16.894 365.090 178.937 1,601.7301997-98 22.527 610.658 73.636 256.800 74.567 14.891 384.155 182.708 1,619.9421998-99 21.100 558.778 90.567 228.200 68.044 11.603 301.782 188.411 1,468.4851999-00 18.716 489.000 99.284 199.600 73.528 10.301 249.908 170.037 1,310.3742000-01 15.670 483.625 190.851 - (2) 98.320 11.376 339.281 147.977 1,287.1002001-02 13.233 475.660 525.683 - 139.969 6.674 418.574 110.755 1,690.5482002-03 10.955 605.140 835.720 - 100.340 4.460 490.192 107.683 2,154.4902003-04 8.760 670.321 1,097.880 - 97.207 4.424 531.963 110.655 2,521.2102004-05 13.890 629.900 1,533.900 - 149.642 4.316 558.122 114.717 3,004.4872005-06 13.272 583.406 1,769.852 - 87.556 5.193 259.548 101.344 2,820.1712006-07 9.734 599.344 2,728.782 - 84.672 4.212 232.850 91.993 3,751.5872007-08 10.440 523.830 3,023.818 - 72.430 4.514 229.860 95.399 3,960.2912008-09 10.107 563.219 3,521.731 - 59.621 4.600 315.100 92.317 4,566.6952009-10 10.778 473.378 3,925.390 - 30.312 3.863 295.830 37.099 4,776.6502010-11 7.871 433.246 (3) 4,068.233 - 25.663 2.890 291.030 64.620 4,893.5532011-12 4.804 497.307 4,224.384 - 17.688 2.220 280.340 52.098 5,078.8412012-13 3.717 193.947 (4) 4,950.365 - 12.810 (5) 1.740 - U 41.880 5,204.4592013-14 2.644 703.683 5,764.289 - 5.439 1.378 - U 33.090 6,510.5232014-15 1.383 461.599 6,301.958 - 10.947 1.269 - U 29.495 6,806.6512015-16 1.523 646.992 7,201.813 - 10.463 0.905 - U 24.341 7,886.0372016-17 1.555 561.876 10,576.576 - 10.095 0.851 - U 19.908 11,170.8612017-18 1.037 551.642 (6) 12,621.973 - 8.702 0.685 - U 17.501 13,201.5402018-19 0.799 720.061 14,521.838 - 8.068 0.560 - U 12.960 15,264.286
Notes: These data should be read in conjunction with the explanatory notes and other turnover tables in this publication.
Figure(s) may be incomplete for any period due to some unavailable turnover figures that are used to derive these numbers.
(1) Includes figures from corporate bookmakers and registered on-course bookmakers.
(2) Figure is included in TAB turnover, from this period on.
(3) Figure includes on course and all racing offices, from this period on.
(4) 2012-13 figure incomplete due to resource restrictions.
(5) Total turnover on course bets, from this period on.
(6) Turnover provided by NSW bookmakers operating from approved offices and premises.
U = Unavailable data
AUSTRALIA
Value ($ million)
ACT NSW NT (1) QLD SA TAS VIC WA
Australian Gambling Statistics, 1993–94 to 2018–2019, 36th edition
34

TABLE ON BOOK 2REAL ON-COURSE BOOKMAKER TURNOVER
1993-94 66.241 1,449.616 37.235 667.987 265.613 51.535 639.707 286.807 3,464.7411994-95 61.072 1,500.509 45.563 625.214 232.780 36.386 817.033 317.592 3,636.1491995-96 53.618 1,193.702 117.150 528.381 150.683 26.523 762.292 342.157 3,174.5061996-97 38.235 1,039.161 108.853 451.972 134.260 28.770 621.743 304.727 2,727.7221997-98 38.363 1,039.941 125.401 437.327 126.986 25.359 654.210 311.149 2,758.7371998-99 35.509 940.362 152.414 384.036 114.511 19.527 507.866 317.075 2,471.3001999-00 30.771 803.961 163.232 328.161 120.887 16.936 410.872 279.557 2,154.3762000-01 24.293 749.750 295.871 - (2) 152.423 17.636 525.978 229.405 1,995.3552001-02 19.946 716.946 792.344 - 210.970 10.059 630.902 166.937 2,548.1052002-03 16.025 885.211 1,222.508 - 146.779 6.524 717.063 157.521 3,151.6322003-04 12.510 957.242 1,567.811 - 138.815 6.318 759.662 158.019 3,600.3762004-05 19.375 878.626 2,139.584 - 208.730 6.020 778.505 160.015 4,190.8552005-06 17.942 788.704 2,392.656 - 118.367 7.020 350.882 137.007 3,812.5772006-07 12.781 786.941 3,582.900 - 111.175 5.530 305.733 120.787 4,925.8472007-08 13.265 665.579 3,842.067 - 92.030 5.735 292.060 121.214 5,031.9512008-09 12.454 693.988 4,339.412 - 73.464 5.668 388.260 113.751 5,626.9972009-10 12.972 569.751 4,724.547 - 36.483 4.649 356.057 44.652 5,749.1122010-11 9.192 505.971 (3) 4,751.130 - 29.971 3.375 339.883 75.467 5,714.9892011-12 5.481 567.427 4,820.023 - 20.182 2.533 319.868 59.444 5,794.9582012-13 4.146 216.318 (4) 5,521.375 - 14.288 (5) 1.941 - U 46.711 5,804.7782013-14 2.873 764.669 6,263.861 - 5.910 1.497 - U 35.958 7,074.7682014-15 1.478 493.150 6,732.709 - 11.695 1.356 - U 31.511 7,271.8992015-16 1.605 681.642 7,587.506 - 11.023 0.953 - U 25.645 8,308.3732016-17 1.610 581.761 10,950.883 - 10.452 0.881 - U 20.613 11,566.2002017-18 1.054 560.484 (6) 12,824.284 - 8.841 0.696 - U 17.782 13,413.1412018-19 0.799 720.061 14,521.838 - 8.068 0.560 - U 12.960 15,264.286
Notes: These data should be read in conjunction with the explanatory notes and other turnover tables in this publication.
Figure(s) may be incomplete for any period due to some unavailable turnover figures that are used to derive these numbers.
(1) Includes figures from corporate bookmakers and registered on-course bookmakers.
(2) Figure is included in TAB turnover, from this period on.
(3) Figure includes on course and all racing offices, from this period on.
(4) 2012-13 figure incomplete due to resource restrictions.
(5) Total turnover on course bets, from this period on.
(6) Turnover provided by NSW bookmakers operating from approved offices and premises.
U = Unavailable data
AUSTRALIA
Value ($ million)
ACT NSW NT (1) QLD SA TAS VIC WA
Australian Gambling Statistics, 1993–94 to 2018–2019, 36th edition
35

TABLE ON BOOK 3PER CAPITA ON-COURSE BOOKMAKER TURNOVER
1993-94 163.14 174.10 170.66 156.83 129.69 80.47 103.11 125.27 142.041994-95 153.06 184.07 209.89 147.85 116.90 58.38 135.19 140.40 152.011995-96 137.80 150.78 545.41 127.28 78.63 44.18 130.32 154.38 136.491996-97 98.41 131.31 497.96 108.16 70.65 48.42 106.62 136.49 117.271997-98 97.96 129.82 559.36 102.88 66.37 42.60 111.06 136.72 117.121998-99 90.80 117.36 674.29 89.95 60.13 33.14 86.28 138.51 104.841999-00 79.48 101.38 724.31 77.33 64.52 29.33 70.56 122.94 92.312000-01 65.46 98.86 1,368.64 - (2) 85.68 32.26 94.47 105.20 89.372001-02 54.37 96.00 3,729.04 - 121.06 18.84 114.89 77.43 115.662002-03 44.36 120.95 5,909.11 - 86.03 12.46 132.68 74.06 145.272003-04 35.05 132.91 7,732.91 - 82.62 12.19 141.99 74.79 167.602004-05 54.95 123.92 10,652.08 - 126.05 11.75 146.85 76.11 196.922005-06 51.76 113.78 12,047.10 - 72.99 14.01 67.20 65.88 182.072006-07 37.22 115.45 18,141.21 - 69.73 11.26 59.17 58.30 237.902007-08 39.07 99.18 19,478.66 - 58.86 11.92 57.17 58.59 245.822008-09 37.06 104.67 21,895.73 - 47.77 11.98 76.52 54.81 277.022009-10 38.67 86.54 23,732.93 - 23.94 9.93 70.29 21.39 283.912010-11 27.65 78.16 (3) 24,209.48 - 20.04 7.35 67.98 36.26 286.022011-12 16.52 88.60 24,676.15 - 13.67 5.61 64.29 28.35 291.792012-13 12.54 34.08 (4) 28,096.98 - 9.80 (5) 4.38 - U 22.14 293.562013-14 8.79 121.80 32,075.95 - 4.12 3.45 - U 17.16 361.002014-15 4.53 78.69 34,741.53 - 8.22 3.16 - U 15.14 371.622015-16 4.90 108.59 39,426.24 - 7.79 2.24 - U 12.41 423.902016-17 4.90 92.67 57,558.97 - 7.46 2.09 - U 10.09 590.322017-18 3.20 89.40 (6) 68,410.85 - 6.38 1.66 - U 8.80 685.472018-19 2.43 114.86 78,853.18 - 5.86 1.34 - U 6.46 779.26
Notes: These data should be read in conjunction with the explanatory notes and other turnover tables in this publication.
Figure(s) may be incomplete for any period due to some unavailable turnover figures that are used to derive these numbers.
(1) Includes figures from corporate bookmakers and registered on-course bookmakers.
(2) Figure is included in TAB turnover, from this period on.
(3) Figure includes on course and all racing offices, from this period on.
(4) 2012-13 figure incomplete due to resource restrictions.
(5) Total turnover on course bets, from this period on.
(6) Turnover provided by NSW bookmakers operating from approved offices and premises.
U = Unavailable data
AUSTRALIA
Value ($)
ACT NSW NT (1) QLD SA TAS VIC WA
Australian Gambling Statistics, 1993–94 to 2018–2019, 36th edition
36

TABLE ON BOOK 4REAL PER CAPITA ON-COURSE BOOKMAKER TURNOVER
1993-94 303.17 323.54 317.14 291.43 241.01 149.55 191.61 232.80 263.951994-95 275.46 331.27 377.74 266.08 210.38 105.06 243.29 252.68 273.571995-96 237.87 260.28 941.47 219.70 135.73 76.27 224.95 266.48 235.611996-97 167.59 223.62 848.02 184.20 120.32 82.47 181.58 232.44 199.701997-98 166.82 221.08 952.58 175.21 113.03 72.55 189.13 232.83 199.451998-99 152.81 197.50 1,134.75 151.37 101.20 55.77 145.20 233.10 176.441999-00 130.68 166.67 1,190.84 127.14 106.08 48.22 116.01 202.12 151.772000-01 101.48 153.27 2,121.76 - (2) 132.83 50.01 146.45 163.09 138.552001-02 81.95 144.70 5,620.66 - 182.46 28.39 173.18 116.71 174.342002-03 64.89 176.93 8,643.97 - 125.85 18.23 194.09 108.34 212.512003-04 50.05 189.79 11,042.87 - 117.99 17.40 202.76 106.81 239.342004-05 76.65 172.86 14,858.22 - 175.82 16.39 204.83 106.16 274.682005-06 69.98 153.81 16,286.43 - 98.67 18.94 90.84 89.06 246.142006-07 48.87 151.59 23,819.47 - 91.56 14.78 77.69 76.55 312.362007-08 49.65 126.02 24,749.61 - 74.79 15.15 72.64 74.44 312.342008-09 45.67 128.97 26,979.51 - 58.86 14.76 94.28 67.53 341.342009-10 46.54 104.16 28,564.63 - 28.82 11.95 84.60 25.74 341.702010-11 32.29 91.28 (3) 28,273.30 - 23.40 8.58 79.39 42.35 334.042011-12 18.85 101.09 28,155.49 - 15.60 6.40 73.36 32.34 332.932012-13 13.98 38.01 (4) 31,337.88 - 10.93 (5) 4.89 - U 24.69 327.422013-14 9.55 132.35 34,855.87 - 4.48 3.75 - U 18.65 392.292014-15 4.84 84.07 37,116.19 - 8.78 3.38 - U 16.18 397.022015-16 5.16 114.40 41,537.71 - 8.21 2.36 - U 13.07 446.602016-17 5.08 95.95 59,595.99 - 7.73 2.16 - U 10.44 611.212017-18 3.25 90.83 (6) 69,507.37 - 6.48 1.69 - U 8.94 696.452018-19 2.43 114.86 78,853.18 - 5.86 1.34 - U 6.46 779.26
Notes: These data should be read in conjunction with the explanatory notes and other turnover tables in this publication.
Figure(s) may be incomplete for any period due to some unavailable turnover figures that are used to derive these numbers.
(1) Includes figures from corporate bookmakers and registered on-course bookmakers.
(2) Figure is included in TAB turnover, from this period on.
(3) Figure includes on course and all racing offices, from this period on.
(4) 2012-13 figure incomplete due to resource restrictions.
(5) Total turnover on course bets, from this period on.
(6) Turnover provided by NSW bookmakers operating from approved offices and premises.
U = Unavailable data
AUSTRALIA
Value ($)
ACT NSW NT (1) QLD SA TAS VIC WA
Australian Gambling Statistics, 1993–94 to 2018–2019, 36th edition
37

TABLE ON BOOK 5ON-COURSE BOOKMAKER EXPENDITURE
1993-94 1.960 42.904 0.985 19.770 5.960 1.525 18.925 8.498 100.5271994-95 1.866 45.857 1.103 18.950 7.117 1.112 24.952 9.716 110.6741995-96 1.708 38.034 1.407 16.899 4.073 0.845 26.496 10.911 100.3741996-97 1.235 33.561 2.495 14.740 4.314 0.929 21.905 8.948 88.1271997-98 1.239 33.586 4.700 14.100 3.737 0.819 17.338 9.135 84.6541998-99 1.161 30.733 6.329 12.600 3.947 0.676 15.693 9.421 80.5601999-00 1.130 26.895 8.639 10.900 3.701 0.567 12.955 8.502 73.2892000-01 0.780 26.599 11.305 - (2) 7.235 0.626 17.575 7.399 71.5192001-02 0.728 (3) 26.161 28.912 - 3.828 0.367 21.682 (4) 5.538 87.2162002-03 0.553 33.283 (3) 46.854 - 2.047 0.252 25.392 5.384 113.7652003-04 0.481 36.853 33.591 - 2.323 0.243 27.556 5.533 106.5802004-05 0.764 34.645 51.600 - 3.542 0.237 28.911 7.019 126.7182005-06 0.730 32.087 72.202 - 1.903 0.286 13.445 5.070 125.7232006-07 0.535 32.963 126.944 - 1.401 0.232 12.062 4.600 178.7372007-08 0.574 28.811 143.055 - 1.353 0.248 11.907 4.770 190.7182008-09 0.565 30.977 191.805 - 1.791 0.253 16.322 4.616 246.3292009-10 0.592 26.036 228.019 - 1.064 0.212 15.323 1.855 273.1012010-11 0.433 23.828 277.207 - 0.878 0.159 15.075 3.231 320.8112011-12 0.264 27.337 357.642 - 1.078 0.122 14.521 2.605 403.5692012-13 0.204 10.667 435.174 - 0.706 (5) 0.096 - U 2.094 448.9412013-14 0.145 38.702 494.434 - -0.024 0.076 - U 1.654 534.9872014-15 0.076 25.388 638.914 - 0.958 0.069 - U 1.475 666.8802015-16 0.083 35.585 (6) 809.259 - 0.728 0.049 - U 1.217 846.9212016-17 0.085 30.903 (7) 1,135.741 - 0.285 R 0.047 - U 0.995 1,168.056 R
2017-18 0.057 30.340 1,381.806 - 0.415 R 0.038 - U 0.875 1,413.531 R
2018-19 0.044 39.603 1,502.684 - 0.390 0.031 - U 0.648 1,543.400
Notes: These data should be read in conjunction with the explanatory notes and other expenditure tables in this publication.
Figure(s) may be incomplete for any period due to some unavailable expenditure figures that are used to derive these numbers.
(1) Includes figures from corporate bookmakers and registered on-course bookmakers.
(2) Figure is included in TAB expenditure, from this period on.
(3) Bookmakers' on-course expenditure is calculated by applying an expenditure to turnover ratio of 5.5%, from this period on.
(4) Expenditure estimated at 5.18% of turnover, from this period on.
(5) Represents profit from all on-course bets, from this period on.
(6) Data only available from 01/07/2015-31/01/2016.
(7) Expenditure was estimated at 5.5% of gross turnover provided by NSW bookmakers operating from approved offices and premises only, from this period on.
U = Unavailable data
R = Revised data
AUSTRALIA
Value ($ million)
ACT NSW NT (1) QLD SA TAS (3) VIC WA
Australian Gambling Statistics, 1993–94 to 2018–2019, 36th edition
38

TABLE ON BOOK 6REAL ON-COURSE BOOKMAKER EXPENDITURE
1993-94 3.642 79.729 1.830 36.739 11.076 2.834 35.168 15.792 186.8111994-95 3.358 82.528 1.985 34.104 12.808 2.001 44.907 17.486 199.1771995-96 2.948 65.654 2.429 29.171 7.031 1.459 45.737 18.834 173.2621996-97 2.103 57.154 4.249 25.102 7.347 1.582 37.304 15.238 150.0791997-98 2.110 57.196 8.004 24.012 6.364 1.395 29.526 15.557 144.1651998-99 1.954 51.720 10.651 21.204 6.642 1.138 26.410 15.855 135.5741999-00 1.858 44.218 14.203 17.921 6.085 0.932 21.299 13.978 120.4942000-01 1.209 41.236 17.526 - (2) 11.216 0.970 27.246 11.470 110.8742001-02 1.097 (3) 39.432 43.578 - 5.770 0.553 32.681 (4) 8.347 131.4582002-03 0.809 48.687 (3) 68.539 - 2.994 0.369 37.144 7.876 166.4182003-04 0.687 52.627 47.969 - 3.317 0.347 39.351 7.901 152.2002004-05 1.066 48.325 71.975 - 4.941 0.331 40.327 9.791 176.7552005-06 0.987 43.378 97.610 - 2.573 0.387 18.176 6.854 169.9642006-07 0.702 43.281 166.678 - 1.840 0.305 15.837 6.040 234.6822007-08 0.729 36.607 181.766 - 1.719 0.315 15.129 6.061 242.3262008-09 0.696 38.169 236.339 - 2.207 0.312 20.112 5.688 303.5222009-10 0.713 31.337 274.440 - 1.281 0.255 18.443 2.233 328.7002010-11 0.506 27.828 323.739 - 1.025 0.186 17.606 3.773 374.6622011-12 0.301 31.192 408.070 - 1.230 0.139 16.568 2.972 460.4732012-13 0.228 11.897 485.370 - 0.787 (5) 0.107 - U 2.336 500.7252013-14 0.158 42.056 537.285 - -0.026 0.083 - U 1.797 581.3532014-15 0.081 27.123 682.585 - 1.023 0.074 - U 1.576 712.4622015-16 0.087 37.491 (6) 852.599 - 0.767 0.052 - U 1.282 892.2782016-17 0.088 31.997 (7) 1,175.936 - 0.295 R 0.049 - U 1.030 1,209.394 R
2017-18 0.058 30.826 1,403.954 - 0.422 R 0.039 - U 0.889 1,436.188 R
2018-19 0.044 39.603 1,502.684 - 0.390 0.031 - U 0.648 1,543.400
Notes: These data should be read in conjunction with the explanatory notes and other expenditure tables in this publication.
Figure(s) may be incomplete for any period due to some unavailable expenditure figures that are used to derive these numbers.
(1) Includes figures from corporate bookmakers and registered on-course bookmakers.
(2) Figure is included in TAB expenditure, from this period on.
(3) Bookmakers' on-course expenditure is calculated by applying an expenditure to turnover ratio of 5.5%, from this period on.
(4) Expenditure estimated at 5.18% of turnover, from this period on.
(5) Represents profit from all on-course bets, from this period on.
(6) Data only available from 01/07/2015-31/01/2016.
(7) Expenditure was estimated at 5.5% of gross turnover provided by NSW bookmakers operating from approved offices and premises only, from this period on.
U = Unavailable data
R = Revised data
AUSTRALIA
Value ($ million)
ACT NSW NT (1) QLD SA TAS (3) VIC WA
Australian Gambling Statistics, 1993–94 to 2018–2019, 36th edition
39

TABLE ON BOOK 7PER CAPITA ON-COURSE BOOKMAKER EXPENDITURE
1993-94 8.97 9.58 8.39 8.63 5.41 4.43 5.67 6.90 7.661994-95 8.42 10.12 9.14 8.06 6.43 3.21 7.43 7.73 8.331995-96 7.58 8.29 11.31 7.03 3.67 2.43 7.82 8.50 7.451996-97 5.41 7.22 19.44 6.01 3.87 2.66 6.40 6.83 6.451997-98 5.39 7.14 35.70 5.65 3.33 2.34 5.01 6.84 6.121998-99 5.00 6.45 47.12 4.97 3.49 1.93 4.49 6.93 5.751999-00 4.80 5.58 63.02 4.22 3.25 1.61 3.66 6.15 5.162000-01 3.26 5.44 81.07 - (2) 6.31 1.78 4.89 5.26 4.972001-02 2.99 (3) 5.28 205.09 - 3.31 1.04 5.95 (4) 3.87 5.972002-03 2.24 6.65 (3) 331.29 - 1.76 0.70 6.87 3.70 7.672003-04 1.92 7.31 236.60 - 1.97 0.67 7.36 3.74 7.092004-05 3.02 6.82 358.33 - 2.98 0.65 7.61 4.66 8.312005-06 2.85 6.26 491.47 - 1.59 0.77 3.48 3.30 8.122006-07 2.05 6.35 843.94 - 1.15 0.62 3.06 2.92 11.332007-08 2.15 5.46 921.52 - 1.10 0.65 2.96 2.93 11.842008-09 2.07 5.76 1,192.51 - 1.43 0.66 3.96 2.74 14.942009-10 2.12 4.76 1,378.60 - 0.84 0.54 3.64 1.07 16.232010-11 1.52 4.30 1,649.62 - 0.69 0.40 3.52 1.81 18.752011-12 0.91 4.87 2,089.12 - 0.83 0.31 3.33 1.42 23.192012-13 0.69 1.87 2,469.93 - 0.54 (5) 0.24 - U 1.11 25.322013-14 0.48 6.70 2,751.33 - -0.02 0.19 - U 0.86 29.662014-15 0.25 4.33 3,522.21 - 0.72 0.17 - U 0.76 36.412015-16 0.27 5.97 (6) 4,430.28 - 0.54 0.12 - U 0.62 45.522016-17 0.27 5.10 (7) 6,180.84 - 0.21 R 0.12 - U 0.50 61.73 R
2017-18 0.18 4.92 7,489.36 - 0.30 R 0.09 - U 0.44 73.40 R
2018-19 0.13 6.32 8,159.53 - 0.28 0.07 - U 0.32 78.79
Notes: These data should be read in conjunction with the explanatory notes and other expenditure tables in this publication.
Figure(s) may be incomplete for any period due to some unavailable expenditure figures that are used to derive these numbers.
(1) Includes figures from corporate bookmakers and registered on-course bookmakers.
(2) Figure is included in TAB expenditure, from this period on.
(3) Bookmakers' on-course expenditure is calculated by applying an expenditure to turnover ratio of 5.5%, from this period on.
(4) Expenditure estimated at 5.18% of turnover, from this period on.
(5) Represents profit from all on-course bets, from this period on.
(6) Data only available from 01/07/2015-31/01/2016.
(7) Expenditure was estimated at 5.5% of gross turnover provided by NSW bookmakers operating from approved offices and premises only, from this period on.
U = Unavailable data
R = Revised data
Value ($)
TAS (3) VIC WA AUSTRALIAACT NSW NT (1) QLD SA
Australian Gambling Statistics, 1993–94 to 2018–2019, 36th edition
40

TABLE ON BOOK 8REAL PER CAPITA ON-COURSE BOOKMAKER EXPENDITURE
1993-94 16.67 17.79 15.59 16.03 10.05 8.23 10.53 12.82 14.231994-95 15.15 18.22 16.46 14.51 11.58 5.78 13.37 13.91 14.991995-96 13.08 14.32 19.52 12.13 6.33 4.19 13.50 14.67 12.861996-97 9.22 12.30 33.10 10.23 6.58 4.53 10.89 11.62 10.991997-98 9.18 12.16 60.80 9.62 5.66 3.99 8.54 11.64 10.421998-99 8.41 10.86 79.30 8.36 5.87 3.25 7.55 11.66 9.681999-00 7.89 9.17 103.62 6.94 5.34 2.65 6.01 10.11 8.492000-01 5.05 8.43 125.68 - (2) 9.77 2.75 7.59 8.15 7.702001-02 4.51 (3) 7.96 309.13 - 4.99 1.56 8.97 (4) 5.84 8.992002-03 3.28 9.73 (3) 484.62 - 2.57 1.03 10.05 5.42 11.222003-04 2.75 10.43 337.87 - 2.82 0.96 10.50 5.34 10.122004-05 4.22 9.51 499.83 - 4.16 0.90 10.61 6.50 11.582005-06 3.85 8.46 664.41 - 2.14 1.04 4.71 4.46 10.972006-07 2.69 8.34 1,108.09 - 1.51 0.81 4.02 3.83 14.882007-08 2.73 6.93 1,170.89 - 1.40 0.83 3.76 3.72 15.042008-09 2.55 7.09 1,469.39 - 1.77 0.81 4.88 3.38 18.412009-10 2.56 5.73 1,659.27 - 1.01 0.66 4.38 1.29 19.542010-11 1.78 5.02 1,926.52 - 0.80 0.47 4.11 2.12 21.902011-12 1.04 5.56 2,383.68 - 0.95 0.35 3.80 1.62 26.462012-13 0.77 2.09 2,754.83 - 0.60 (5) 0.27 - U 1.23 28.242013-14 0.52 7.28 2,989.78 - -0.02 0.21 - U 0.93 32.242014-15 0.27 4.62 3,762.96 - 0.77 0.18 - U 0.81 38.902015-16 0.28 6.29 (6) 4,667.54 - 0.57 0.13 - U 0.65 47.962016-17 0.28 5.28 (7) 6,399.58 - 0.22 R 0.12 - U 0.52 63.91 R
2017-18 0.18 5.00 7,609.41 - 0.31 R 0.09 - U 0.45 74.57 R
2018-19 0.13 6.32 8,159.53 - 0.28 0.07 - U 0.32 78.79
Notes: These data should be read in conjunction with the explanatory notes and other expenditure tables in this publication.
Figure(s) may be incomplete for any period due to some unavailable expenditure figures that are used to derive these numbers.
(1) Includes figures from corporate bookmakers and registered on-course bookmakers.
(2) Figure is included in TAB expenditure, from this period on.
(3) Bookmakers' on-course expenditure is calculated by applying an expenditure to turnover ratio of 5.5%, from this period on.
(4) Expenditure estimated at 5.18% of turnover, from this period on.
(5) Represents profit from all on-course bets, from this period on.
(6) Data only available from 01/07/2015-31/01/2016.
(7) Expenditure was estimated at 5.5% of gross turnover provided by NSW bookmakers operating from approved offices and premises only, from this period on.
U = Unavailable data
R = Revised data
AUSTRALIA
Value ($)
ACT NSW NT (1) QLD SA TAS (3) VIC WA
Australian Gambling Statistics, 1993–94 to 2018–2019, 36th edition
41

TABLE ON BOOK 9ON-COURSE BOOKMAKER EXPENDITURE AS A % OF HOUSEHOLD DISPOSABLE INCOME
(ALL STATES AND TERRITORIES)
1993-94 0.026 0.037 0.037 0.039 0.024 0.022 0.025 0.030 0.0321994-95 0.024 0.038 0.036 0.035 0.028 0.015 0.031 0.032 0.0341995-96 0.021 0.029 0.043 0.029 0.015 0.011 0.031 0.034 0.0291996-97 0.014 0.024 0.071 0.023 0.016 0.012 0.025 0.027 0.0241997-98 0.014 0.024 0.132 0.022 0.013 0.010 0.019 0.026 0.0221998-99 0.013 0.021 0.163 0.019 0.014 0.008 0.016 0.026 0.0201999-00 0.011 0.017 0.199 0.015 0.012 0.007 0.013 0.022 0.0172000-01 0.007 0.015 0.234 - (2) 0.022 0.007 0.016 0.018 0.0152001-02 0.006 (3) 0.015 0.543 - 0.010 0.004 0.018 (4) 0.012 0.0182002-03 0.004 0.018 (3) 0.885 - 0.005 0.002 0.020 0.011 0.0222003-04 0.003 0.019 0.598 - 0.006 0.002 0.021 0.010 0.0192004-05 0.005 0.017 0.808 - 0.008 0.002 0.020 0.012 0.0212005-06 0.004 0.015 1.007 - 0.004 0.002 0.009 0.008 0.0202006-07 0.003 0.014 1.642 - 0.003 0.002 0.007 0.007 0.0262007-08 0.003 0.011 1.683 - 0.003 0.002 0.007 0.006 0.0252008-09 0.003 0.011 2.004 - 0.003 0.001 0.008 0.005 0.0302009-10 0.002 0.009 2.172 - 0.002 0.001 0.008 0.002 0.0322010-11 0.002 0.008 2.488 - 0.001 0.001 0.007 0.003 0.0342011-12 0.001 0.008 2.989 - 0.002 0.001 0.007 0.002 0.0412012-13 0.001 0.003 3.398 - 0.001 (5) 0.001 - U 0.002 0.0442013-14 0.000 0.011 3.552 - -0.000 0.000 - U 0.001 0.0502014-15 0.000 0.007 4.263 - 0.001 0.000 - U 0.001 0.0602015-16 0.000 0.009 (6) 5.217 - 0.001 0.000 - U 0.001 0.0742016-17 0.000 0.008 (7) 7.158 - 0.000 R 0.000 - U 0.001 0.100 R
2017-18 0.000 0.008 8.601 - 0.000 R 0.000 - U 0.001 0.118 R
2018-19 0.000 0.010 9.605 - 0.000 0.000 - U 0.000 0.125
Notes: These data should be read in conjunction with the explanatory notes and other expenditure tables in this publication.
Figure(s) may be incomplete for any period due to some unavailable expenditure figures that are used to derive these numbers.
(1) Includes figures from corporate bookmakers and registered on-course bookmakers.
(2) Figure is included in TAB expenditure, from this period on.
(3) Bookmakers' on-course expenditure is calculated by applying an expenditure to turnover ratio of 5.5%, from this period on.
(4) Expenditure estimated at 5.18% of turnover, from this period on.
(5) Represents profit from all on-course bets, from this period on.
(6) Data only available from 01/07/2015-31/01/2016.
(7) Expenditure was estimated at 5.5% of gross turnover provided by NSW bookmakers operating from approved offices and premises only, from this period on.
U = Unavailable data
R = Revised data
Percentage (%)
TAS (3) VIC WA AUSTRALIAACT NSW NT (1) QLD SA
Australian Gambling Statistics, 1993–94 to 2018–2019, 36th edition
42

TABLE OFF BOOK 1OFF-COURSE BOOKMAKER TURNOVER
1993-94 - - - - 5.060 - - - 5.0601994-95 - - - - 4.630 - - - 4.6301995-96 - - - - 3.508 - - - 3.5081996-97 - - - - 3.044 - - - 3.0441997-98 - - - - 1.768 - - - 1.7681998-99 - - - - 1.654 - - - 1.6541999-00 - - - - 1.122 - - - 1.1222000-01 - - - - 0.725 - - - 0.7252001-02 - - - - 0.663 - - - 0.6632002-03 - - - - 0.598 - - - 0.5982003-04 - - - - 0.350 - - - 0.3502004-05 - - - - 0.019 - - - 0.0192005-06 - - - - 0.021 - 304.390 - 304.4112006-07 - - - - 0.050 - 295.620 - 295.6702007-08 - - - - 0.056 - 228.390 - 228.4462008-09 - - - - 0.059 - 313.730 - 313.7892009-10 - - - - 26.427 - 158.670 - 185.0972010-11 - 0.007 (2) - - 19.562 - 169.500 - 189.0692011-12 - 8.072 - - 10.681 - 215.450 - 234.2032012-13 - 3.986 - - 10.199 - - U - 14.1852013-14 - 0.504 - - 5.269 - - U - 5.7732014-15 - 0.562 - - 4.379 - - U - 4.9412015-16 - 0.178 (3) - - 3.703 - - U - 3.8812016-17 - - (4) - - 5.708 - - U - 5.7082017-18 - - - - 5.159 - - U - 5.1592018-19 - - - - 11.369 - - U - 11.369
Notes: These data should be read in conjunction with the explanatory notes and other turnover tables in this publication.
Figure(s) may be incomplete for any period due to some unavailable turnover figures that are used to derive these numbers.
(1) Off-course bookmaker racing turnover is included in on-course bookmaker racing turnover.
(2) Figure includes racing premises and sports premises betting (bets taken 24/7 away from a racecourse), commencing Dec 2010.
(3) Data only available from 01/07/2015 to 31/01/2016.
(4) No data available after 31/01/2016.
U = Unavailable data
NA = Not applicable
Value ($ million)
TAS(NA)
VICWA (NA)
AUSTRALIAACT (NA)
NSWNT(1)
QLD (U)
SA
Australian Gambling Statistics, 1993–94 to 2018–2019, 36th edition
43

TABLE OFF BOOK 2REAL OFF-COURSE BOOKMAKER TURNOVER
1993-94 - - - - 9.403 - - - 9.4031994-95 - - - - 8.333 - - - 8.3331995-96 - - - - 6.055 - - - 6.0551996-97 - - - - 5.184 - - - 5.1841997-98 - - - - 3.011 - - - 3.0111998-99 - - - - 2.784 - - - 2.7841999-00 - - - - 1.845 - - - 1.8452000-01 - - - - 1.124 - - - 1.1242001-02 - - - - 0.999 - - - 0.9992002-03 - - - - 0.875 - - - 0.8752003-04 - - - - 0.500 - - - 0.5002004-05 - - - - 0.027 - - - 0.0272005-06 - - - - 0.028 - 411.504 - 411.5322006-07 - - - - 0.066 - 388.150 - 388.2162007-08 - - - - 0.071 - 290.193 - 290.2642008-09 - - - - 0.073 - 386.572 - 386.6452009-10 - - - - 31.807 - 190.973 - 222.7802010-11 - 0.008 (2) - - 22.846 - 197.952 - 220.8062011-12 - 9.210 - - 12.187 - 245.828 - 267.2262012-13 - 4.446 - - 11.375 - - U - 15.8212013-14 - 0.548 - - 5.726 - - U - 6.2732014-15 - 0.600 - - 4.678 - - U - 5.2792015-16 - 0.188 (3) - - 3.901 - - U - 4.0892016-17 - - (4) - - 5.910 - - U - 5.9102017-18 - - - - 5.242 - - U - 5.2422018-19 - - - - 11.369 - - U - 11.369
Notes: These data should be read in conjunction with the explanatory notes and other turnover tables in this publication.
Figure(s) may be incomplete for any period due to some unavailable turnover figures that are used to derive these numbers.
(1) Off-course bookmaker racing turnover is included in on-course bookmaker racing turnover.
(2) Figure includes racing premises and sports premises betting (bets taken 24/7 away from a racecourse), commencing Dec 2010.
(3) Data only available from 01/07/2015 to 31/01/2016.
(4) No data available after 31/01/2016.
U = Unavailable data
NA = Not applicable
Value ($ million)
TAS(NA)
VICWA (NA)
AUSTRALIAACT (NA)
NSWNT(1)
QLD (U)
SA
Australian Gambling Statistics, 1993–94 to 2018–2019, 36th edition
44

TABLE OFF BOOK 3PER CAPITA OFF-COURSE BOOKMAKER TURNOVER
1993-94 - - - - 4.59 - - - 0.391994-95 - - - - 4.18 - - - 0.351995-96 - - - - 3.16 - - - 0.261996-97 - - - - 2.73 - - - 0.221997-98 - - - - 1.57 - - - 0.131998-99 - - - - 1.46 - - - 0.121999-00 - - - - 0.98 - - - 0.082000-01 - - - - 0.63 - - - 0.052001-02 - - - - 0.57 - - - 0.052002-03 - - - - 0.51 - - - 0.042003-04 - - - - 0.30 - - - 0.022004-05 - - - - 0.02 - - - 0.002005-06 - - - - 0.02 - 78.81 - 19.652006-07 - - - - 0.04 - 75.12 - 18.752007-08 - - - - 0.05 - 56.80 - 14.182008-09 - - - - 0.05 - 76.19 - 19.032009-10 - - - - 20.88 - 37.70 - 11.002010-11 - 0.00 (2) - - 15.28 - 39.59 - 11.052011-12 - 1.44 - - 8.26 - 49.41 - 13.462012-13 - 0.70 - - 7.80 - - U - 0.802013-14 - 0.09 - - 3.99 - - U - 0.322014-15 - 0.10 - - 3.29 - - U - 0.272015-16 - 0.03 (3) - - 2.76 - - U - 0.212016-17 - - (4) - - 4.22 - - U - 0.302017-18 - - - - 3.78 - - U - 0.272018-19 - - - - 8.26 - - U - 0.58
Notes: These data should be read in conjunction with the explanatory notes and other turnover tables in this publication.
Figure(s) may be incomplete for any period due to some unavailable turnover figures that are used to derive these numbers.
(1) Off-course bookmaker racing turnover is included in on-course bookmaker racing turnover.
(2) Figure includes racing premises and sports premises betting (bets taken 24/7 away from a racecourse), commencing Dec 2010.
(3) Data only available from 01/07/2015 to 31/01/2016.
(4) No data available after 31/01/2016.
U = Unavailable data
NA = Not applicable
Value ($)
TAS(NA)
VICWA (NA)
AUSTRALIAACT (NA)
NSWNT(1)
QLD (U)
SA
Australian Gambling Statistics, 1993–94 to 2018–2019, 36th edition
45

TABLE OFF BOOK 4REAL PER CAPITA OFF-COURSE BOOKMAKER TURNOVER
1993-94 - - - - 8.53 - - - 0.721994-95 - - - - 7.53 - - - 0.631995-96 - - - - 5.45 - - - 0.451996-97 - - - - 4.65 - - - 0.381997-98 - - - - 2.68 - - - 0.221998-99 - - - - 2.46 - - - 0.201999-00 - - - - 1.62 - - - 0.132000-01 - - - - 0.98 - - - 0.082001-02 - - - - 0.86 - - - 0.072002-03 - - - - 0.75 - - - 0.062003-04 - - - - 0.42 - - - 0.032004-05 - - - - 0.02 - - - 0.002005-06 - - - - 0.02 - 106.54 - 26.572006-07 - - - - 0.05 - 98.63 - 24.622007-08 - - - - 0.06 - 72.17 - 18.022008-09 - - - - 0.06 - 93.88 - 23.452009-10 - - - - 25.13 - 45.38 - 13.242010-11 - 0.00 (2) - - 17.84 - 46.24 - 12.912011-12 - 1.64 - - 9.42 - 56.38 - 15.352012-13 - 0.78 - - 8.70 - - U - 0.892013-14 - 0.09 - - 4.34 - - U - 0.352014-15 - 0.10 - - 3.51 - - U - 0.292015-16 - 0.03 (3) - - 2.91 - - U - 0.222016-17 - - (4) - - 4.37 - - U - 0.312017-18 - - - - 3.84 - - U - 0.272018-19 - - - - 8.26 - - U - 0.58
Notes: These data should be read in conjunction with the explanatory notes and other turnover tables in this publication.
Figure(s) may be incomplete for any period due to some unavailable turnover figures that are used to derive these numbers.
(1) Off-course bookmaker racing turnover is included in on-course bookmaker racing turnover.
(2) Figure includes racing premises and sports premises betting (bets taken 24/7 away from a racecourse), commencing Dec 2010.
(3) Data only available from 01/07/2015 to 31/01/2016.
(4) No data available after 31/01/2016.
U = Unavailable data
NA = Not applicable
Value ($)
TAS(NA)
VICWA (NA)
AUSTRALIAACT (NA)
NSWNT(1)
QLD (U)
SA
Australian Gambling Statistics, 1993–94 to 2018–2019, 36th edition
46

TABLE OFF BOOK 5OFF-COURSE BOOKMAKER EXPENDITURE
1993-94 - - - - 0.396 - - - 0.3961994-95 - - - - 0.273 - - - 0.2731995-96 - - - - 0.279 - - - 0.2791996-97 - - - - 0.239 - - - 0.2391997-98 - - - - 0.150 - - - 0.1501998-99 - - - - 0.151 - - - 0.1511999-00 - - - - 0.090 - - - 0.0902000-01 - - - - 0.070 - - - 0.0702001-02 - - - - 0.065 - - - 0.0652002-03 - - - - 0.073 - - - 0.0732003-04 - - - - 0.035 - - - 0.0352004-05 - - - - 0.005 - - - 0.0052005-06 - - - - 0.004 - 15.767 (2) - 15.7712006-07 - - - - 0.021 - 15.313 - 15.3342007-08 - - - - 0.018 - 11.831 - 11.8492008-09 - - - - 0.025 - 16.251 - 16.2762009-10 - - - - 0.880 - 8.219 - 9.0992010-11 - - - - 0.167 - 8.780 - 8.9472011-12 - - - - 0.308 - 11.160 - 11.4682012-13 - - - - 0.543 (3) - - U - 0.5432013-14 - 0.027 (4) - - 0.046 - - U - 0.0732014-15 - 0.031 - - 0.383 - - U - 0.4142015-16 - 0.010 (5) - - 0.258 - - U - 0.2682016-17 - - - - 0.172 R - - U - 0.172 R
2017-18 - - - - 0.246 R - - U - 0.246 R
2018-19 - - - - 0.939 - - U - 0.939
Notes: These data should be read in conjunction with the explanatory notes and other expenditure tables in this publication.
Figure(s) may be incomplete for any period due to some unavailable expenditure figures that are used to derive these numbers.
(1) Off-course bookmaker racing expenditure is included in on-course bookmaker racing expenditure.
(2) Expenditure estimated at 5.18% of turnover, from this period on.
(3) Profit from phone bets is estimated based on the proportion of bets taken (turnover) between on course and off course. Profit data are collected as a whole and not split into off and on-course.
(4) Bookmaker betting expenditure is estimated at 5.5% of turnover.
(5) No data available after 31/01/2016.
U = Unavailable data
NA = Not applicable
R = Revised data
Value ($ million)
TAS(NA)
VICWA (NA)
AUSTRALIAACT (NA)
NSWNT(1)
QLD(U)
SA
Australian Gambling Statistics, 1993–94 to 2018–2019, 36th edition
47

TABLE OFF BOOK 6REAL OFF-COURSE BOOKMAKER EXPENDITURE
1993-94 - - - - 0.735 - - - 0.7351994-95 - - - - 0.491 - - - 0.4911995-96 - - - - 0.482 - - - 0.4821996-97 - - - - 0.407 - - - 0.4071997-98 - - - - 0.255 - - - 0.2551998-99 - - - - 0.254 - - - 0.2541999-00 - - - - 0.148 - - - 0.1482000-01 - - - - 0.109 - - - 0.1092001-02 - - - - 0.098 - - - 0.0982002-03 - - - - 0.107 - - - 0.1072003-04 - - - - 0.050 - - - 0.0502004-05 - - - - 0.007 - - - 0.0072005-06 - - - - 0.005 - 21.316 (2) - 21.3212006-07 - - - - 0.028 - 20.106 - 20.1342007-08 - - - - 0.023 - 15.032 - 15.0552008-09 - - - - 0.031 - 20.024 - 20.0552009-10 - - - - 1.059 - 9.892 - 10.9512010-11 - - - - 0.195 - 10.254 - 10.4492011-12 - - - - 0.351 - 12.734 - 13.0852012-13 - - - - 0.606 (3) - - U - 0.6062013-14 - 0.029 (4) - - 0.050 - - U - 0.0792014-15 - 0.033 - - 0.409 - - U - 0.4422015-16 - 0.011 (5) - - 0.272 - - U - 0.2822016-17 - - - - 0.178 R - - U - 0.178 R
2017-18 - - - - 0.250 R - - U - 0.250 R
2018-19 - - - - 0.939 - - U - 0.939
Notes: These data should be read in conjunction with the explanatory notes and other expenditure tables in this publication.
Figure(s) may be incomplete for any period due to some unavailable expenditure figures that are used to derive these numbers.
(1) Off-course bookmaker racing expenditure is included in on-course bookmaker racing expenditure.
(2) Expenditure estimated at 5.18% of turnover, from this period on.
(3) Profit from phone bets is estimated based on the proportion of bets taken (turnover) between on course and off course. Profit data are collected as a whole and not split into off and on-course.
(4) Bookmaker betting expenditure is estimated at 5.5% of turnover.
(5) No data available after 31/01/2016.
U = Unavailable data
NA = Not applicable
R = Revised data
Value ($ million)
TAS(NA)
VICWA (NA)
AUSTRALIAACT (NA)
NSWNT(1)
QLD(U)
SA
Australian Gambling Statistics, 1993–94 to 2018–2019, 36th edition
48

TABLE OFF BOOK 7PER CAPITA OFF-COURSE BOOKMAKER EXPENDITURE
1993-94 - - - - 0.36 - - - 0.031994-95 - - - - 0.25 - - - 0.021995-96 - - - - 0.25 - - - 0.021996-97 - - - - 0.21 - - - 0.021997-98 - - - - 0.13 - - - 0.011998-99 - - - - 0.13 - - - 0.011999-00 - - - - 0.08 - - - 0.012000-01 - - - - 0.06 - - - 0.002001-02 - - - - 0.06 - - - 0.002002-03 - - - - 0.06 - - - 0.002003-04 - - - - 0.03 - - - 0.002004-05 - - - - 0.00 - - - 0.002005-06 - - - - 0.00 - 4.08 (2) - 1.022006-07 - - - - 0.02 - 3.89 - 0.972007-08 - - - - 0.01 - 2.94 - 0.742008-09 - - - - 0.02 - 3.95 - 0.992009-10 - - - - 0.70 - 1.95 - 0.542010-11 - - - - 0.13 - 2.05 - 0.522011-12 - - - - 0.24 - 2.56 - 0.662012-13 - - - - 0.42 (3) - - U - 0.032013-14 - 0.00 (4) - - 0.03 - - U - 0.002014-15 - 0.01 - - 0.29 - - U - 0.022015-16 - 0.00 (5) - - 0.19 - - U - 0.012016-17 - - - - 0.13 R - - U - 0.01 R
2017-18 - - - - 0.18 R - - U - 0.01 R
2018-19 - - - - 0.68 - - U - 0.05
Notes: These data should be read in conjunction with the explanatory notes and other expenditure tables in this publication.
Figure(s) may be incomplete for any period due to some unavailable expenditure figures that are used to derive these numbers.
(1) Off-course bookmaker racing expenditure is included in on-course bookmaker racing expenditure.
(2) Expenditure estimated at 5.18% of turnover, from this period on.
(3) Profit from phone bets is estimated based on the proportion of bets taken (turnover) between on course and off course. Profit data are collected as a whole and not split into off and on-course.
(4) Bookmaker betting expenditure is estimated at 5.5% of turnover.
(5) No data available after 31/01/2016.
U = Unavailable data
NA = Not applicable
R = Revised data
Value ($)
TAS(NA)
VICWA (NA)
AUSTRALIAACT (NA)
NSWNT(1)
QLD(U)
SA
Australian Gambling Statistics, 1993–94 to 2018–2019, 36th edition
49

TABLE OFF BOOK 8REAL PER CAPITA OFF-COURSE BOOKMAKER EXPENDITURE
1993-94 - - - - 0.67 - - - 0.061994-95 - - - - 0.44 - - - 0.041995-96 - - - - 0.43 - - - 0.041996-97 - - - - 0.36 - - - 0.031997-98 - - - - 0.23 - - - 0.021998-99 - - - - 0.22 - - - 0.021999-00 - - - - 0.13 - - - 0.012000-01 - - - - 0.09 - - - 0.012001-02 - - - - 0.08 - - - 0.012002-03 - - - - 0.09 - - - 0.012003-04 - - - - 0.04 - - - 0.002004-05 - - - - 0.01 - - - 0.002005-06 - - - - 0.00 - 5.52 (2) - 1.382006-07 - - - - 0.02 - 5.11 - 1.282007-08 - - - - 0.02 - 3.74 - 0.932008-09 - - - - 0.02 - 4.86 - 1.222009-10 - - - - 0.84 - 2.35 - 0.652010-11 - - - - 0.15 - 2.40 - 0.612011-12 - - - - 0.27 - 2.92 - 0.752012-13 - - - - 0.46 (3) - - U - 0.032013-14 - 0.01 (4) - - 0.04 - - U - 0.002014-15 - 0.01 - - 0.31 - - U - 0.022015-16 - 0.00 (5) - - 0.20 - - U - 0.022016-17 - - - - 0.13 R - - U - 0.01 R
2017-18 - - - - 0.18 R - - U - 0.01 R
2018-19 - - - - 0.68 - - U - 0.05
Notes: These data should be read in conjunction with the explanatory notes and other expenditure tables in this publication.
Figure(s) may be incomplete for any period due to some unavailable expenditure figures that are used to derive these numbers.
(1) Off-course bookmaker racing expenditure is included in on-course bookmaker racing expenditure.
(2) Expenditure estimated at 5.18% of turnover, from this period on.
(3) Profit from phone bets is estimated based on the proportion of bets taken (turnover) between on course and off course. Profit data are collected as a whole and not split into off and on-course.
(4) Bookmaker betting expenditure is estimated at 5.5% of turnover.
(5) No data available after 31/01/2016.
U = Unavailable data
NA = Not applicable
R = Revised data
Value ($)
TAS(NA)
VICWA (NA)
AUSTRALIAACT (NA)
NSWNT(1)
QLD(U)
SA
Australian Gambling Statistics, 1993–94 to 2018–2019, 36th edition
50

TABLE OFF BOOK 9OFF-COURSE BOOKMAKER EXPENDITURE AS A % OF HOUSEHOLD DISPOSABLE INCOME
(ALL STATES AND TERRITORIES)
1993-94 - - - - 0.002 - - - 0.0001994-95 - - - - 0.001 - - - 0.0001995-96 - - - - 0.001 - - - 0.0001996-97 - - - - 0.001 - - - 0.0001997-98 - - - - 0.001 - - - 0.0001998-99 - - - - 0.001 - - - 0.0001999-00 - - - - 0.000 - - - 0.0002000-01 - - - - 0.000 - - - 0.0002001-02 - - - - 0.000 - - - 0.0002002-03 - - - - 0.000 - - - 0.0002003-04 - - - - 0.000 - - - 0.0002004-05 - - - - 0.000 - - - 0.0002005-06 - - - - 0.000 - 0.011 (2) - 0.0032006-07 - - - - 0.000 - 0.010 - 0.0022007-08 - - - - 0.000 - 0.007 - 0.0022008-09 - - - - 0.000 - 0.008 - 0.0022009-10 - - - - 0.001 - 0.004 - 0.0012010-11 - - - - 0.000 - 0.004 - 0.0012011-12 - - - - 0.000 - 0.005 - 0.0012012-13 - - - - 0.001 (3) - - U - 0.0002013-14 - 0.000 (4) - - 0.000 - - U - 0.0002014-15 - 0.000 - - 0.001 - - U - 0.0002015-16 - 0.000 (5) - - 0.000 - - U - 0.0002016-17 - - - - 0.000 R - - U - 0.000 R
2017-18 - - - - 0.000 R - - U - 0.000 R
2018-19 - - - - 0.001 - - U - 0.000
Notes: These data should be read in conjunction with the explanatory notes and other expenditure tables in this publication.
Figure(s) may be incomplete for any period due to some unavailable expenditure figures that are used to derive these numbers.
(1) Off-course bookmaker racing expenditure is included in on-course bookmaker racing expenditure.
(2) Expenditure estimated at 5.18% of turnover, from this period on.
(3) Profit from phone bets is estimated based on the proportion of bets taken (turnover) between on course and off course. Profit data are collected as a whole and not split into off- and on- course.
(4) Bookmaker betting expenditure is estimated at 5.5% of turnover.
(5) No data available after 31/01/2016.
U = Unavailable data
NA = Not applicable
R = Revised data
Percentage (%)
TAS(NA)
VICWA (NA)
AUSTRALIAACT (NA)
NSWNT(1)
QLD(U)
SA
Australian Gambling Statistics, 1993–94 to 2018–2019, 36th edition
51
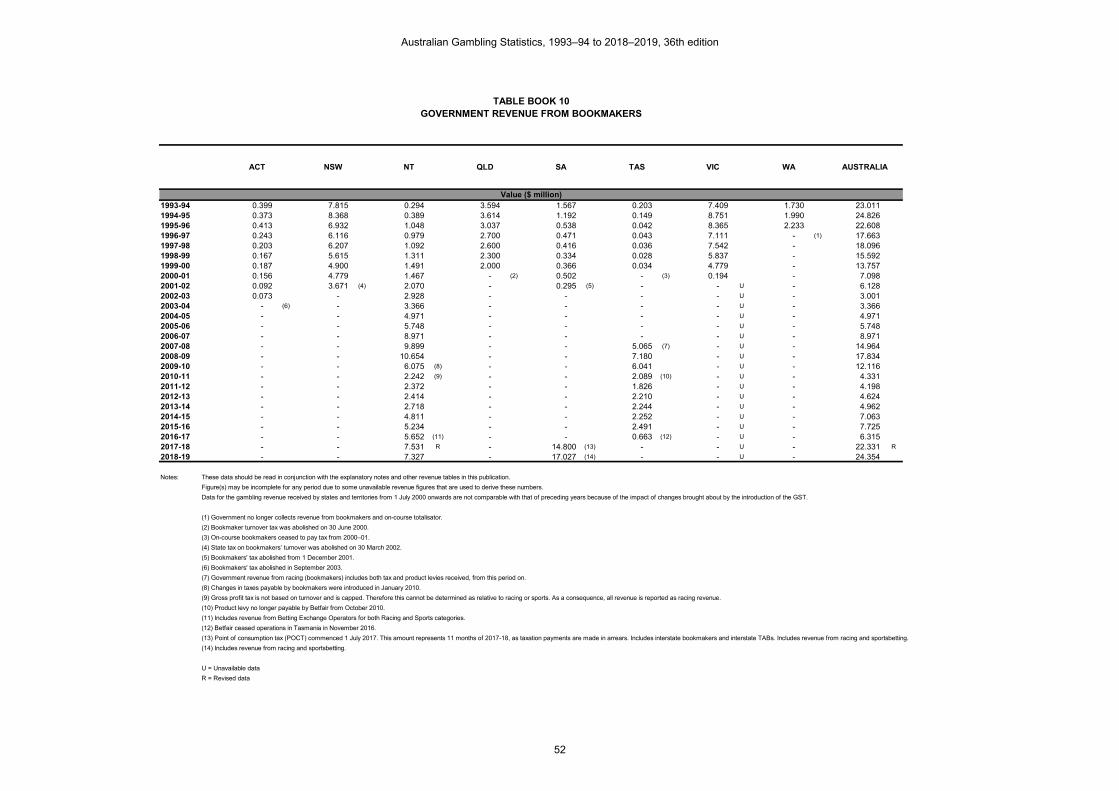
TABLE BOOK 10GOVERNMENT REVENUE FROM BOOKMAKERS
1993-94 0.399 7.815 0.294 3.594 1.567 0.203 7.409 1.730 23.0111994-95 0.373 8.368 0.389 3.614 1.192 0.149 8.751 1.990 24.8261995-96 0.413 6.932 1.048 3.037 0.538 0.042 8.365 2.233 22.6081996-97 0.243 6.116 0.979 2.700 0.471 0.043 7.111 - (1) 17.6631997-98 0.203 6.207 1.092 2.600 0.416 0.036 7.542 - 18.0961998-99 0.167 5.615 1.311 2.300 0.334 0.028 5.837 - 15.5921999-00 0.187 4.900 1.491 2.000 0.366 0.034 4.779 - 13.7572000-01 0.156 4.779 1.467 - (2) 0.502 - (3) 0.194 - 7.0982001-02 0.092 3.671 (4) 2.070 - 0.295 (5) - - U - 6.1282002-03 0.073 - 2.928 - - - - U - 3.0012003-04 - (6) - 3.366 - - - - U - 3.3662004-05 - - 4.971 - - - - U - 4.9712005-06 - - 5.748 - - - - U - 5.7482006-07 - - 8.971 - - - - U - 8.9712007-08 - - 9.899 - - 5.065 (7) - U - 14.9642008-09 - - 10.654 - - 7.180 - U - 17.8342009-10 - - 6.075 (8) - - 6.041 - U - 12.1162010-11 - - 2.242 (9) - - 2.089 (10) - U - 4.3312011-12 - - 2.372 - - 1.826 - U - 4.1982012-13 - - 2.414 - - 2.210 - U - 4.6242013-14 - - 2.718 - - 2.244 - U - 4.9622014-15 - - 4.811 - - 2.252 - U - 7.0632015-16 - - 5.234 - - 2.491 - U - 7.7252016-17 - - 5.652 (11) - - 0.663 (12) - U - 6.3152017-18 - - 7.531 R - 14.800 (13) - - U - 22.331 R
2018-19 - - 7.327 - 17.027 (14) - - U - 24.354
Notes: These data should be read in conjunction with the explanatory notes and other revenue tables in this publication.
Figure(s) may be incomplete for any period due to some unavailable revenue figures that are used to derive these numbers.
Data for the gambling revenue received by states and territories from 1 July 2000 onwards are not comparable with that of preceding years because of the impact of changes brought about by the introduction of the GST.
(1) Government no longer collects revenue from bookmakers and on-course totalisator.
(2) Bookmaker turnover tax was abolished on 30 June 2000.
(3) On-course bookmakers ceased to pay tax from 2000–01.
(4) State tax on bookmakers’ turnover was abolished on 30 March 2002.
(5) Bookmakers' tax abolished from 1 December 2001.
(6) Bookmakers' tax abolished in September 2003.
(7) Government revenue from racing (bookmakers) includes both tax and product levies received, from this period on.
(8) Changes in taxes payable by bookmakers were introduced in January 2010.
(9) Gross profit tax is not based on turnover and is capped. Therefore this cannot be determined as relative to racing or sports. As a consequence, all revenue is reported as racing revenue.
(10) Product levy no longer payable by Betfair from October 2010.
(11) Includes revenue from Betting Exchange Operators for both Racing and Sports categories.
(12) Betfair ceased operations in Tasmania in November 2016.
(13) Point of consumption tax (POCT) commenced 1 July 2017. This amount represents 11 months of 2017-18, as taxation payments are made in arrears. Includes interstate bookmakers and interstate TABs. Includes revenue from racing and sportsbetting.
(14) Includes revenue from racing and sportsbetting.
U = Unavailable data
R = Revised data
Value ($ million)
TAS VIC WA AUSTRALIAACT NSW NT QLD SA
Australian Gambling Statistics, 1993–94 to 2018–2019, 36th edition
52

TABLE BOOK 11REAL GOVERNMENT REVENUE FROM BOOKMAKERS
1993-94 0.741 14.523 0.546 6.679 2.912 0.377 13.768 3.215 42.7611994-95 0.671 15.060 0.700 6.504 2.145 0.268 15.749 3.581 44.6791995-96 0.713 11.966 1.809 5.242 0.929 0.072 14.439 3.855 39.0251996-97 0.414 10.415 1.667 4.598 0.802 0.073 12.110 - (1) 30.0801997-98 0.346 10.570 1.860 4.428 0.708 0.061 12.844 - 30.8171998-99 0.281 9.449 2.206 3.871 0.562 0.047 9.823 - 26.2401999-00 0.307 8.056 2.451 3.288 0.602 0.056 7.857 - 22.6182000-01 0.242 7.409 2.274 - (2) 0.778 - (3) 0.301 - 11.0042001-02 0.139 5.533 (4) 3.120 - 0.445 (5) - - U - 9.2372002-03 0.107 - 4.283 - - - - U - 4.3902003-04 - (6) - 4.807 - - - - U - 4.8072004-05 - - 6.934 - - - - U - 6.9342005-06 - - 7.770 - - - - U - 7.7702006-07 - - 11.779 - - - - U - 11.7792007-08 - - 12.578 - - 6.436 (7) - U - 19.0132008-09 - - 13.128 - - 8.847 - U - 21.9752009-10 - - 7.312 (8) - - 7.271 - U - 14.5832010-11 - - 2.618 (9) - - 2.440 (10) - U - 5.0572011-12 - - 2.706 - - 2.083 - U - 4.7902012-13 - - 2.692 - - 2.465 - U - 5.1572013-14 - - 2.954 - - 2.438 - U - 5.3922014-15 - - 5.139 - - 2.406 - U - 7.5452015-16 - - 5.514 - - 2.624 - U - 8.1382016-17 - - 5.852 (11) - - 0.686 (12) - U - 6.5382017-18 - - 7.652 R - 15.037 (13) - - U - 22.689 R
2018-19 - - 7.327 - 17.027 (14) - - U - 24.354
Notes: These data should be read in conjunction with the explanatory notes and other revenue tables in this publication.
Figure(s) may be incomplete for any period due to some unavailable revenue figures that are used to derive these numbers.
Data for the gambling revenue received by states and territories from 1 July 2000 onwards are not comparable with that of preceding years because of the impact of changes brought about by the introduction of the GST.
(1) Government no longer collects revenue from bookmakers and on-course totalisator.
(2) Bookmaker turnover tax was abolished on 30 June 2000.
(3) On-course bookmakers ceased to pay tax from 2000–01.
(4) State tax on bookmakers’ turnover was abolished on 30 March 2002.
(5) Bookmakers' tax abolished from 1 December 2001.
(6) Bookmakers' tax abolished in September 2003.
(7) Government revenue from racing (bookmakers) includes both tax and product levies received, from this period on.
(8) Changes in taxes payable by bookmakers were introduced in January 2010.
(9) Gross profit tax is not based on turnover and is capped. Therefore this cannot be determined as relative to racing or sports. As a consequence, all revenue is reported as racing revenue.
(10) Product levy no longer payable by Betfair from October 2010.
(11) Includes revenue from Betting Exchange Operators for both Racing and Sports categories.
(12) Betfair ceased operations in Tasmania in November 2016.
(13) Point of consumption tax (POCT) commenced 1 July 2017. This amount represents 11 months of 2017-18, as taxation payments are made in arrears. Includes interstate bookmakers and interstate TABs. Includes revenue from racing and sportsbetting.
(14) Includes revenue from racing and sportsbetting.
U = Unavailable data
R = Revised data
Value ($ million)
TAS VIC WA AUSTRALIAACT NSW NT QLD SA
Australian Gambling Statistics, 1993–94 to 2018–2019, 36th edition
53
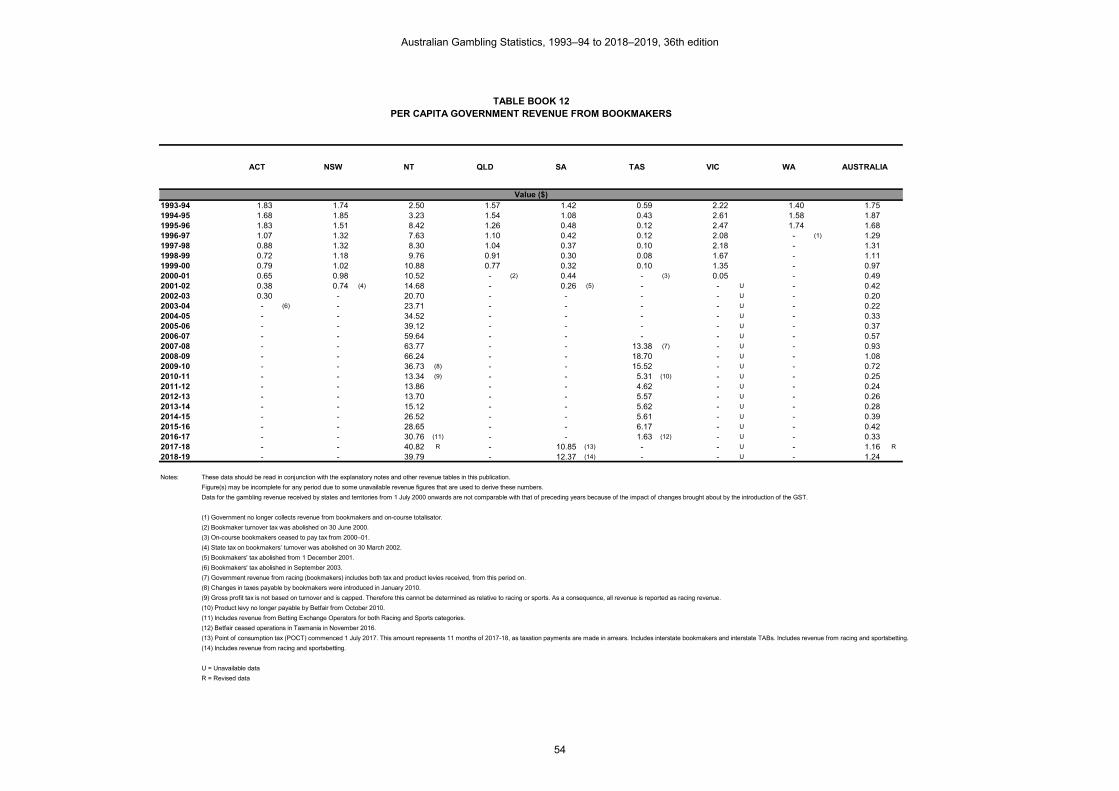
TABLE BOOK 12PER CAPITA GOVERNMENT REVENUE FROM BOOKMAKERS
1993-94 1.83 1.74 2.50 1.57 1.42 0.59 2.22 1.40 1.751994-95 1.68 1.85 3.23 1.54 1.08 0.43 2.61 1.58 1.871995-96 1.83 1.51 8.42 1.26 0.48 0.12 2.47 1.74 1.681996-97 1.07 1.32 7.63 1.10 0.42 0.12 2.08 - (1) 1.291997-98 0.88 1.32 8.30 1.04 0.37 0.10 2.18 - 1.311998-99 0.72 1.18 9.76 0.91 0.30 0.08 1.67 - 1.111999-00 0.79 1.02 10.88 0.77 0.32 0.10 1.35 - 0.972000-01 0.65 0.98 10.52 - (2) 0.44 - (3) 0.05 - 0.492001-02 0.38 0.74 (4) 14.68 - 0.26 (5) - - U - 0.422002-03 0.30 - 20.70 - - - - U - 0.202003-04 - (6) - 23.71 - - - - U - 0.222004-05 - - 34.52 - - - - U - 0.332005-06 - - 39.12 - - - - U - 0.372006-07 - - 59.64 - - - - U - 0.572007-08 - - 63.77 - - 13.38 (7) - U - 0.932008-09 - - 66.24 - - 18.70 - U - 1.082009-10 - - 36.73 (8) - - 15.52 - U - 0.722010-11 - - 13.34 (9) - - 5.31 (10) - U - 0.252011-12 - - 13.86 - - 4.62 - U - 0.242012-13 - - 13.70 - - 5.57 - U - 0.262013-14 - - 15.12 - - 5.62 - U - 0.282014-15 - - 26.52 - - 5.61 - U - 0.392015-16 - - 28.65 - - 6.17 - U - 0.422016-17 - - 30.76 (11) - - 1.63 (12) - U - 0.332017-18 - - 40.82 R - 10.85 (13) - - U - 1.16 R
2018-19 - - 39.79 - 12.37 (14) - - U - 1.24
Notes: These data should be read in conjunction with the explanatory notes and other revenue tables in this publication.
Figure(s) may be incomplete for any period due to some unavailable revenue figures that are used to derive these numbers.
Data for the gambling revenue received by states and territories from 1 July 2000 onwards are not comparable with that of preceding years because of the impact of changes brought about by the introduction of the GST.
(1) Government no longer collects revenue from bookmakers and on-course totalisator.
(2) Bookmaker turnover tax was abolished on 30 June 2000.
(3) On-course bookmakers ceased to pay tax from 2000–01.
(4) State tax on bookmakers’ turnover was abolished on 30 March 2002.
(5) Bookmakers' tax abolished from 1 December 2001.
(6) Bookmakers' tax abolished in September 2003.
(7) Government revenue from racing (bookmakers) includes both tax and product levies received, from this period on.
(8) Changes in taxes payable by bookmakers were introduced in January 2010.
(9) Gross profit tax is not based on turnover and is capped. Therefore this cannot be determined as relative to racing or sports. As a consequence, all revenue is reported as racing revenue.
(10) Product levy no longer payable by Betfair from October 2010.
(11) Includes revenue from Betting Exchange Operators for both Racing and Sports categories.
(12) Betfair ceased operations in Tasmania in November 2016.
(13) Point of consumption tax (POCT) commenced 1 July 2017. This amount represents 11 months of 2017-18, as taxation payments are made in arrears. Includes interstate bookmakers and interstate TABs. Includes revenue from racing and sportsbetting.
(14) Includes revenue from racing and sportsbetting.
U = Unavailable data
R = Revised data
Value ($)
TAS VIC WA AUSTRALIAACT NSW NT QLD SA
Australian Gambling Statistics, 1993–94 to 2018–2019, 36th edition
54

TABLE BOOK 13REAL PER CAPITA GOVERNMENT REVENUE FROM BOOKMAKERS
1993-94 3.39 3.24 4.65 2.91 2.64 1.09 4.12 2.61 3.261994-95 3.03 3.32 5.80 2.77 1.94 0.77 4.69 2.85 3.361995-96 3.16 2.61 14.54 2.18 0.84 0.21 4.26 3.00 2.901996-97 1.81 2.24 12.99 1.87 0.72 0.21 3.54 - (1) 2.201997-98 1.50 2.25 14.13 1.77 0.63 0.18 3.71 - 2.231998-99 1.21 1.98 16.43 1.53 0.50 0.13 2.81 - 1.871999-00 1.31 1.67 17.88 1.27 0.53 0.16 2.22 - 1.592000-01 1.01 1.51 16.31 - (2) 0.68 - (3) 0.08 - 0.762001-02 0.57 1.12 (4) 22.13 - 0.38 (5) - - U - 0.632002-03 0.43 - 30.28 - - - - U - 0.302003-04 - (6) - 33.86 - - - - U - 0.322004-05 - - 48.15 - - - - U - 0.452005-06 - - 52.89 - - - - U - 0.502006-07 - - 78.31 - - - - U - 0.752007-08 - - 81.02 - - 17.00 (7) - U - 1.182008-09 - - 81.62 - - 23.04 - U - 1.332009-10 - - 44.21 (8) - - 18.68 - U - 0.872010-11 - - 15.58 (9) - - 6.20 (10) - U - 0.302011-12 - - 15.81 - - 5.27 - U - 0.282012-13 - - 15.28 - - 6.21 - U - 0.292013-14 - - 16.44 - - 6.11 - U - 0.302014-15 - - 28.33 - - 6.00 - U - 0.412015-16 - - 30.19 - - 6.50 - U - 0.442016-17 - - 31.85 (11) - - 1.68 (12) - U - 0.352017-18 - - 41.47 R - 11.03 (13) - - U - 1.18 R
2018-19 - - 39.79 - 12.37 (14) - - U - 1.24
Notes: These data should be read in conjunction with the explanatory notes and other revenue tables in this publication.
Figure(s) may be incomplete for any period due to some unavailable revenue figures that are used to derive these numbers.
Data for the gambling revenue received by states and territories from 1 July 2000 onwards are not comparable with that of preceding years because of the impact of changes brought about by the introduction of the GST.
(1) Government no longer collects revenue from bookmakers and on-course totalisator.
(2) Bookmaker turnover tax was abolished on 30 June 2000.
(3) On-course bookmakers ceased to pay tax from 2000–01.
(4) State tax on bookmakers’ turnover was abolished on 30 March 2002.
(5) Bookmakers' tax abolished from 1 December 2001.
(6) Bookmakers' tax abolished in September 2003.
(7) Government revenue from racing (bookmakers) includes both tax and product levies received, from this period on.
(8) Changes in taxes payable by bookmakers were introduced in January 2010.
(9) Gross profit tax is not based on turnover and is capped. Therefore this cannot be determined as relative to racing or sports. As a consequence, all revenue is reported as racing revenue.
(10) Product levy no longer payable by Betfair from October 2010.
(11) Includes revenue from Betting Exchange Operators for both Racing and Sports categories.
(12) Betfair ceased operations in Tasmania in November 2016.
(13) Point of consumption tax (POCT) commenced 1 July 2017. This amount represents 11 months of 2017-18, as taxation payments are made in arrears. Includes interstate bookmakers and interstate TABs. Includes revenue from racing and sportsbetting.
(14) Includes revenue from racing and sportsbetting.
U = Unavailable data
R = Revised data
Value ($)
TAS VIC WA AUSTRALIAACT NSW NT QLD SA
Australian Gambling Statistics, 1993–94 to 2018–2019, 36th edition
55

TABLE BOOK 14BOOKMAKERS REVENUE
AS A % OF TOTAL STATE GAMBLING REVENUE
1993-94 0.84 0.77 2.18 1.07 1.20 0.45 1.00 0.931994-95 0.72 0.77 2.43 0.94 0.66 0.30 0.97 0.971995-96 0.78 0.58 5.18 0.73 0.24 0.08 0.80 0.971996-97 0.52 0.49 3.95 0.61 0.19 0.07 0.61 - (1)
1997-98 0.40 0.46 3.86 0.51 0.15 0.06 0.58 -1998-99 0.31 0.40 4.20 0.39 0.11 0.04 0.41 -1999-00 0.30 0.32 4.01 0.33 0.11 0.05 0.31 -2000-01 0.33 0.40 4.77 - (2) 0.17 - (3) 0.02 -2001-02 0.20 0.31 (4) 6.24 - 0.10 (5) - - U -2002-03 0.15 - 8.21 - - - - U -2003-04 - (6) - 8.78 - - - - U -2004-05 - - 10.91 - - - - U -2005-06 - - 10.42 - - - - U -2006-07 - - 14.17 - - - - U -2007-08 - - 13.88 - - 5.89 (7) - U -2008-09 - - 14.56 - - 8.03 - U -2009-10 - - 10.03 (8) - - 6.76 - U -2010-11 - - 4.48 (9) - - 2.50 (10) - U -2011-12 - - 4.46 - - 2.19 - U -2012-13 - - 4.54 - - 2.70 - U -2013-14 - - 4.68 - - 2.73 - U -2014-15 - - 7.03 - - 2.71 - U -2015-16 - - 6.23 - - 2.94 - U -2016-17 - - 6.85 (11) - - 0.84 (12) - U -2017-18 - - 7.98 R - 3.76 (13) - - U -2018-19 - - 7.61 - 4.16 (14) - - U -
Notes: These data should be read in conjunction with the explanatory notes and other revenue tables in this publication.
Figure(s) may be incomplete for any period due to some unavailable revenue figures that are used to derive these numbers.
Data for the gambling revenue received by states and territories from 1 July 2000 onwards are not comparable with that of preceding years because of the impact of changes brought about by the introduction of the GST.
(1) Government no longer collects revenue from bookmakers and on-course totalisator.
(2) Bookmaker turnover tax was abolished on 30 June 2000.
(3) On-course bookmakers ceased to pay tax from 2000–01.
(4) State tax on bookmakers’ turnover was abolished on 30 March 2002.
(5) Bookmakers' tax abolished from 1 December 2001.
(6) Bookmakers' tax abolished in September 2003.
(7) Government revenue from racing (bookmakers) includes both tax and product levies received, from this period on.
(8) Changes in taxes payable by bookmakers were introduced in January 2010.
(9) Gross profit tax is not based on turnover and is capped. Therefore this cannot be determined as relative to racing or sports. As a consequence, all revenue is reported as racing revenue.
(10) Product levy no longer payable by Betfair from October 2010.
(11) Includes revenue from Betting Exchange Operators for both Racing and Sports categories.
(12) Betfair ceased operations in Tasmania in November 2016.
(13) Point of consumption tax (POCT) commenced 1 July 2017. This amount represents 11 months of 2017-18, as taxation payments are made in arrears. Includes interstate bookmakers and interstate TABs. Includes revenue from racing and sportsbetting.
(14) Includes revenue from racing and sportsbetting.
U = Unavailable data
R = Revised data
Percentage (%)
ACT NSW NT QLD SA TAS VIC WA
Australian Gambling Statistics, 1993–94 to 2018–2019, 36th edition
56

TABLE RACING 1TOTAL RACING TURNOVER
1993-94 130.210 4,529.229 86.843 1,765.574 735.537 262.520 2,943.822 797.670 11,251.4051994-95 123.236 4,707.851 102.180 1,792.869 704.311 301.522 2,961.859 857.293 11,551.1211995-96 140.571 4,671.228 150.560 1,758.800 640.222 282.599 2,951.037 923.643 11,518.6601996-97 140.688 4,624.500 165.519 1,742.000 658.720 256.542 2,873.588 921.346 11,382.9031997-98 140.472 4,560.055 159.963 1,731.300 717.702 232.350 2,971.560 986.583 11,499.9851998-99 143.472 4,556.778 177.370 1,761.000 736.156 229.949 3,046.097 1,036.971 11,687.7931999-00 134.040 4,560.900 183.266 1,725.665 739.755 216.258 3,034.456 1,048.051 11,642.3912000-01 151.912 4,671.825 275.310 1,551.565 777.677 230.758 3,227.631 1,059.397 11,946.0752001-02 147.788 4,960.660 619.863 1,590.191 806.602 246.612 3,435.888 1,064.789 12,872.3932002-03 146.909 5,247.240 939.939 1,686.593 776.208 276.141 3,637.542 1,135.631 13,846.2032003-04 165.910 5,296.904 1,207.199 1,808.578 801.814 288.599 3,806.718 1,208.250 14,583.9722004-05 174.672 5,343.313 1,648.357 1,915.544 879.033 302.267 4,007.668 1,352.735 15,623.5892005-06 186.419 5,153.999 1,891.594 1,931.923 782.692 319.307 4,029.161 1,443.984 15,739.0792006-07 172.096 5,228.332 2,871.428 2,065.409 821.838 382.689 4,247.698 1,594.396 17,383.8862007-08 173.622 4,948.057 3,170.276 2,066.364 775.645 482.464 4,109.834 1,623.275 17,349.5372008-09 184.785 5,348.236 3,685.792 2,230.662 809.204 646.574 4,469.989 1,691.097 19,066.3392009-10 175.249 5,364.773 4,078.668 2,214.088 826.412 726.784 4,242.323 1,544.430 19,172.7272010-11 167.376 5,292.968 4,203.954 2,239.010 850.187 946.957 4,128.777 1,714.628 19,543.8572011-12 161.255 5,689.155 4,361.745 2,248.818 807.799 926.773 4,022.021 1,889.675 20,107.2412012-13 152.849 5,561.893 5,071.888 2,202.268 699.650 206.619 3,443.114 1,923.721 19,262.0012013-14 141.985 6,113.762 5,877.139 2,153.231 659.675 291.919 3,118.012 1,820.406 20,176.129
2014-15 137.316 5,952.419 6,379.765 2,068.511 675.947 335.111 2,995.063 1,648.595 20,192.727
2015-16 108.958 6,260.311 7,286.013 2,172.839 682.441 389.112 2,720.304 1,529.267 21,149.2452016-17 99.756 6,209.538 10,644.976 2,023.651 654.528 376.297 2,515.733 1,875.661 24,400.1402017-18 89.981 6,338.071 12,685.338 1,992.090 636.556 373.627 2,375.870 1,915.309 26,406.8422018-19 87.436 6,490.095 14,573.508 1,839.399 587.121 304.132 1,232.969 1,850.548 26,965.209
Notes: These data should be read in conjunction with the explanatory notes and other turnover tables in this publication.
Figure(s) may be incomplete for any period due to some unavailable turnover figures that are used to derive these numbers.
AUSTRALIA
Value ($ million)
ACT NSW NT QLD SA TAS VIC WA
Australian Gambling Statistics, 1993–94 to 2018–2019, 36th edition
57

TABLE RACING 2REAL TOTAL RACING TURNOVER
1993-94 241.970 8,416.694 161.381 3,280.977 1,366.853 487.843 5,470.523 1,482.315 20,908.5561994-95 221.786 8,472.647 183.892 3,226.599 1,267.538 542.644 5,330.412 1,542.857 20,788.3741995-96 242.650 8,063.345 259.893 3,035.992 1,105.134 487.815 5,093.999 1,594.367 19,883.1941996-97 239.590 7,875.454 281.876 2,966.600 1,121.790 436.887 4,893.677 1,569.038 19,384.9141997-98 239.222 7,765.706 272.415 2,948.378 1,222.236 395.689 5,060.522 1,680.136 19,584.3031998-99 241.448 7,668.560 298.494 2,963.571 1,238.870 386.979 5,126.249 1,745.109 19,669.2801999-00 220.374 7,498.540 301.306 2,837.152 1,216.225 355.547 4,988.925 1,723.092 19,141.1642000-01 235.505 7,242.598 426.805 2,405.347 1,205.611 357.738 5,003.705 1,642.353 18,519.6622001-02 222.756 7,477.032 934.298 2,396.840 1,215.763 371.710 5,178.796 1,604.920 19,402.1142002-03 214.901 7,675.770 1,374.962 2,467.183 1,135.453 403.945 5,321.071 1,661.224 20,254.5102003-04 236.925 7,564.165 1,723.922 2,582.713 1,145.018 412.129 5,436.127 1,725.423 20,826.4232004-05 243.644 7,453.203 2,299.236 2,671.926 1,226.133 421.622 5,590.158 1,886.883 21,792.8062005-06 252.019 6,967.669 2,557.238 2,611.758 1,058.118 431.670 5,447.006 1,952.116 21,277.5942006-07 225.963 6,864.818 3,770.195 2,711.889 1,079.076 502.472 5,577.242 2,093.447 22,825.1022007-08 220.604 6,287.008 4,028.157 2,625.524 985.536 613.019 5,221.961 2,062.535 22,044.3442008-09 227.689 6,589.997 4,541.564 2,748.580 997.086 796.696 5,507.837 2,083.739 23,493.1892009-10 210.927 6,456.968 4,909.030 2,664.846 994.658 874.747 5,106.002 1,858.855 23,076.0352010-11 195.472 6,181.450 4,909.633 2,614.852 992.900 1,105.914 4,821.837 2,002.447 22,824.5052011-12 183.992 6,491.326 4,976.751 2,565.901 921.699 1,057.448 4,589.126 2,156.119 22,942.3622012-13 170.480 6,203.441 5,656.915 2,456.293 780.353 230.452 3,840.267 2,145.616 21,483.8162013-14 154.290 6,643.621 6,386.491 2,339.844 716.847 317.219 3,388.239 1,978.175 21,924.726
2014-15 146.702 6,359.279 6,815.835 2,209.898 722.149 358.017 3,199.782 1,761.280 21,572.942
2015-16 114.793 6,595.582 7,676.215 2,289.205 718.989 409.951 2,865.990 1,611.167 22,281.8922016-17 103.286 6,429.295 11,021.704 2,095.269 677.692 389.614 2,604.765 1,942.041 25,263.6662017-18 91.423 6,439.661 12,888.665 2,024.020 646.759 379.616 2,413.952 1,946.009 26,830.1042018-19 87.436 6,490.095 14,573.508 1,839.399 587.121 304.132 1,232.969 1,850.548 26,965.209
Notes: These data should be read in conjunction with the explanatory notes and other turnover tables in this publication.
Figure(s) may be incomplete for any period due to some unavailable turnover figures that are used to derive these numbers.
AUSTRALIA
Value ($ million)
ACT NSW NT QLD SA TAS VIC WA
Australian Gambling Statistics, 1993–94 to 2018–2019, 36th edition
58

TABLE RACING 3PER CAPITA TOTAL RACING TURNOVER
1993-94 595.93 1,010.86 739.67 770.30 667.41 761.80 881.77 647.45 857.141994-95 555.85 1,039.37 847.14 763.02 636.54 870.62 881.96 682.07 869.071995-96 623.61 1,018.53 1,209.97 731.32 576.67 812.64 870.86 719.36 854.901996-97 616.67 995.17 1,289.47 709.96 590.32 735.34 839.23 702.78 833.371997-98 610.85 969.44 1,215.12 693.61 638.80 664.77 859.05 738.26 831.411998-99 617.44 957.06 1,320.55 694.10 650.58 656.78 870.87 762.34 834.451999-00 569.24 945.54 1,336.99 668.56 649.17 615.68 856.77 757.75 820.192000-01 634.60 955.03 1,974.31 589.80 677.73 654.35 898.70 753.14 829.522001-02 607.21 1,001.22 4,397.13 590.85 697.61 696.04 943.12 744.41 880.702002-03 594.89 1,048.77 6,646.01 610.08 665.51 771.56 984.57 781.06 933.632003-04 663.77 1,050.22 8,502.90 636.74 681.53 795.07 1,016.07 816.68 969.492004-05 691.04 1,051.22 11,446.92 657.47 740.44 823.03 1,054.47 897.47 1,024.012005-06 727.05 1,005.13 12,875.78 647.06 652.46 861.57 1,043.16 938.61 1,016.112006-07 658.09 1,007.12 19,089.53 674.41 676.81 1,022.78 1,079.32 1,010.43 1,102.372007-08 649.79 936.85 20,422.10 656.75 630.32 1,274.13 1,022.12 996.88 1,076.892008-09 677.61 993.94 22,915.75 689.76 648.34 1,683.91 1,085.49 1,003.96 1,156.592009-10 628.75 980.80 24,659.64 668.81 652.80 1,867.71 1,008.02 890.46 1,139.552010-11 587.88 954.88 25,017.13 663.72 663.93 2,408.26 964.38 962.09 1,142.322011-12 554.60 1,013.59 25,478.52 653.53 624.46 2,342.37 922.39 1,028.20 1,155.202012-13 515.53 977.30 28,786.71 626.98 535.32 520.22 772.93 1,017.01 1,086.472013-14 471.79 1,058.19 32,703.92 602.27 499.83 731.52 684.94 944.31 1,118.75
2014-15 449.44 1,014.70 35,170.47 570.19 507.49 835.04 643.84 846.27 1,102.45
2015-16 350.42 1,050.71 39,887.19 590.48 508.36 963.79 571.37 779.49 1,136.842016-17 314.60 1,024.13 57,931.21 540.89 483.97 923.35 515.47 950.25 1,289.422017-18 277.86 1,027.12 68,754.29 522.79 466.79 904.83 475.16 962.83 1,371.132018-19 265.44 1,035.29 79,133.75 473.94 426.54 726.01 240.91 921.79 1,376.60
Notes: These data should be read in conjunction with the explanatory notes and other turnover tables in this publication.
Figure(s) may be incomplete for any period due to some unavailable turnover figures that are used to derive these numbers.
AUSTRALIA
Value ($)
ACT NSW NT QLD SA TAS VIC WA
Australian Gambling Statistics, 1993–94 to 2018–2019, 36th edition
59

TABLE RACING 4REAL PER CAPITA TOTAL RACING TURNOVER
1993-94 1,107.42 1,878.50 1,374.53 1,431.44 1,240.25 1,415.66 1,638.60 1,203.17 1,592.831994-95 1,000.35 1,870.55 1,524.59 1,373.20 1,145.57 1,566.84 1,587.25 1,227.51 1,564.051995-96 1,076.46 1,758.16 2,088.61 1,262.38 995.43 1,402.76 1,503.25 1,241.74 1,475.711996-97 1,050.17 1,694.75 2,195.95 1,209.05 1,005.31 1,252.27 1,429.19 1,196.83 1,419.211997-98 1,040.27 1,650.94 2,069.33 1,181.21 1,087.86 1,132.10 1,462.95 1,257.24 1,415.881998-99 1,039.08 1,610.62 2,222.34 1,168.09 1,094.85 1,105.28 1,465.57 1,282.94 1,404.291999-00 935.89 1,554.55 2,198.14 1,099.17 1,067.29 1,012.23 1,408.62 1,245.81 1,348.472000-01 983.81 1,480.56 3,060.72 914.34 1,050.67 1,014.42 1,393.23 1,167.57 1,285.972001-02 915.22 1,509.10 6,627.64 890.57 1,051.49 1,049.12 1,421.53 1,122.03 1,327.452002-03 870.22 1,534.16 9,721.92 892.43 973.53 1,128.65 1,440.25 1,142.55 1,365.732003-04 947.89 1,499.76 12,142.44 909.29 973.25 1,135.39 1,450.98 1,166.25 1,384.472004-05 963.91 1,466.31 15,966.92 917.09 1,032.82 1,148.01 1,470.84 1,251.86 1,428.362005-06 982.90 1,358.83 17,406.72 874.75 882.06 1,164.75 1,410.24 1,268.91 1,373.672006-07 864.07 1,322.35 25,064.62 885.50 888.65 1,342.91 1,417.15 1,326.69 1,447.412007-08 825.63 1,190.37 25,948.35 834.47 800.89 1,618.92 1,298.71 1,266.63 1,368.302008-09 834.94 1,224.71 28,236.36 849.91 798.87 2,074.89 1,337.52 1,237.05 1,425.132009-10 756.76 1,180.48 29,680.02 804.96 785.70 2,247.95 1,213.23 1,071.75 1,371.552010-11 686.56 1,115.17 29,216.53 775.13 775.37 2,812.52 1,126.27 1,123.58 1,334.072011-12 632.80 1,156.51 29,071.00 745.68 712.51 2,672.64 1,052.45 1,173.18 1,318.092012-13 575.00 1,090.03 32,107.17 699.30 597.07 580.22 862.08 1,134.31 1,211.792013-14 512.68 1,149.90 35,538.26 654.47 543.15 794.92 744.30 1,026.15 1,215.70
2014-15 480.16 1,084.06 37,574.44 609.17 542.17 892.12 687.85 904.12 1,177.80
2015-16 369.18 1,106.98 42,023.34 622.11 535.58 1,015.41 601.97 821.24 1,197.722016-17 325.74 1,060.38 59,981.41 560.03 501.10 956.02 533.71 983.88 1,335.052017-18 282.31 1,043.58 69,856.32 531.17 474.27 919.34 482.78 978.27 1,393.102018-19 265.44 1,035.29 79,133.75 473.94 426.54 726.01 240.91 921.79 1,376.60
Notes: These data should be read in conjunction with the explanatory notes and other turnover tables in this publication.
Figure(s) may be incomplete for any period due to some unavailable turnover figures that are used to derive these numbers.
AUSTRALIA
Value ($)
ACT NSW NT QLD SA TAS VIC WA
Australian Gambling Statistics, 1993–94 to 2018–2019, 36th edition
60

TABLE RACING 5TOTAL RACING EXPENDITURE
1993-94 16.641 595.155 12.838 257.258 97.930 35.010 409.122 124.138 1,548.0921994-95 15.261 665.711 14.355 260.350 95.960 35.622 409.808 128.020 1,625.0881995-96 18.133 649.935 15.677 262.299 89.999 35.216 428.005 136.788 1,636.0521996-97 18.970 670.161 18.495 263.740 94.502 33.188 423.264 137.705 1,660.0251997-98 18.931 627.334 18.403 263.300 103.531 31.850 431.322 147.424 1,642.0951998-99 20.905 670.413 20.353 271.700 106.737 29.672 454.783 155.132 1,729.6951999-00 19.304 678.399 22.465 250.933 106.555 28.285 458.483 159.486 1,723.9102000-01 23.136 696.711 24.818 244.997 110.023 28.948 503.514 163.768 1,795.9152001-02 21.831 743.761 43.979 252.572 99.093 27.197 526.845 169.479 1,884.7572002-03 21.954 776.019 63.529 266.673 101.973 25.495 551.807 181.714 1,989.1642003-04 24.542 762.947 50.832 287.020 106.978 24.857 575.835 194.280 2,027.2912004-05 25.247 824.453 69.684 304.181 114.351 27.130 606.453 220.163 2,191.6622005-06 27.006 798.554 91.437 308.844 105.942 52.599 610.245 236.393 2,231.0202006-07 27.592 810.964 149.483 328.634 111.654 61.869 649.224 259.314 2,398.7342007-08 27.472 773.938 166.488 328.820 97.040 75.368 651.323 268.506 2,388.9552008-09 27.964 830.193 218.055 355.849 115.636 94.877 686.892 276.872 2,606.3382009-10 27.269 849.412 252.509 349.614 135.372 93.458 677.547 252.646 2,637.8272010-11 25.290 862.295 298.922 348.011 127.901 101.082 658.062 275.404 2,696.9672011-12 24.810 930.758 379.620 355.894 129.967 97.913 637.654 303.407 2,860.0232012-13 24.136 961.262 452.913 357.290 99.649 39.327 613.365 315.075 2,863.0172013-14 22.974 997.761 513.137 345.594 113.123 41.731 571.133 302.046 2,907.499
2014-15 22.350 993.897 651.899 339.189 112.352 43.359 542.735 281.602 2,987.383
2015-16 19.778 1,008.816 823.759 332.026 110.513 45.468 494.148 264.460 3,098.9682016-17 17.665 976.181 1,148.141 323.661 109.303 40.732 458.774 319.721 3,394.1792017-18 16.057 998.580 1,393.406 320.311 106.842 42.719 434.462 321.187 3,633.5632018-19 16.900 990.983 1,512.229 310.794 101.901 40.025 226.114 310.244 3,509.190
Notes: These data should be read in conjunction with the explanatory notes and other expenditure tables in this publication.
Figure(s) may be incomplete for any period due to some unavailable expenditure figures that are used to derive these numbers.
AUSTRALIA
Value ($ million)
ACT NSW NT QLD SA TAS VIC WA
Australian Gambling Statistics, 1993–94 to 2018–2019, 36th edition
61

TABLE RACING 6REAL TOTAL RACING EXPENDITURE
1993-94 30.924 1,105.979 23.857 478.064 181.985 65.060 760.273 230.686 2,876.8281994-95 27.465 1,198.070 25.834 468.548 172.698 64.108 737.526 230.396 2,924.6451995-96 31.301 1,121.900 27.061 452.774 155.354 60.789 738.810 236.120 2,824.1091996-97 32.306 1,141.274 31.497 449.145 160.935 56.519 720.812 234.510 2,826.9981997-98 32.239 1,068.340 31.340 448.396 176.312 54.240 734.535 251.061 2,796.4631998-99 35.181 1,128.232 34.252 457.241 179.627 49.935 765.350 261.070 2,910.8881999-00 31.738 1,115.351 36.935 412.557 175.186 46.503 753.788 262.210 2,834.2672000-01 35.867 1,080.091 38.475 379.812 170.566 44.877 780.584 253.885 2,784.1562001-02 32.905 1,121.045 66.288 380.693 149.359 40.993 794.095 255.450 2,840.8292002-03 32.115 1,135.177 92.932 390.095 149.168 37.295 807.195 265.815 2,909.7902003-04 35.047 1,089.515 72.590 409.875 152.768 35.497 822.313 277.439 2,895.0432004-05 35.216 1,150.001 97.200 424.292 159.504 37.843 845.920 307.098 3,057.0742005-06 36.509 1,079.562 123.613 417.524 143.223 71.108 824.988 319.579 3,016.1062006-07 36.228 1,064.799 196.272 431.498 146.602 81.234 852.433 340.480 3,149.5462007-08 34.906 983.367 211.540 417.799 123.299 95.763 827.572 341.164 3,035.4102008-09 34.457 1,022.948 268.683 438.471 142.485 116.906 846.376 341.157 3,211.4812009-10 32.821 1,022.341 303.916 420.791 162.932 112.485 815.487 304.081 3,174.8532010-11 29.535 1,007.041 349.099 406.428 149.371 118.050 768.525 321.634 3,149.6822011-12 28.308 1,061.995 433.146 406.075 148.292 111.719 727.563 346.187 3,263.2862012-13 26.920 1,072.141 505.155 398.502 111.143 43.863 684.115 351.418 3,193.2582013-14 24.965 1,084.234 557.609 375.545 122.927 45.348 620.631 328.223 3,159.482
2014-15 23.878 1,061.832 696.457 362.373 120.031 46.323 579.832 300.850 3,191.576
2015-16 20.837 1,062.843 867.875 349.808 116.432 47.903 520.612 278.623 3,264.9332016-17 18.290 1,010.728 1,188.774 335.116 113.172 42.174 475.010 331.036 3,514.3002017-18 16.314 1,014.586 1,415.740 325.445 108.554 43.404 441.425 326.335 3,691.8042018-19 16.900 990.983 1,512.229 310.794 101.901 40.025 226.114 310.244 3,509.190
Notes: These data should be read in conjunction with the explanatory notes and other expenditure tables in this publication.
Figure(s) may be incomplete for any period due to some unavailable expenditure figures that are used to derive these numbers.
AUSTRALIA
Value ($ million)
ACT NSW NT QLD SA TAS VIC WA
Australian Gambling Statistics, 1993–94 to 2018–2019, 36th edition
62

TABLE RACING 7PER CAPITA TOTAL RACING EXPENDITURE
1993-94 76.16 132.83 109.35 112.24 88.86 101.60 122.55 100.76 117.931994-95 68.83 146.97 119.01 110.80 86.73 102.86 122.03 101.85 122.271995-96 80.44 141.71 125.99 109.07 81.07 101.27 126.31 106.53 121.431996-97 83.15 144.21 144.08 107.49 84.69 95.13 123.61 105.04 121.531997-98 82.32 133.37 139.79 105.49 92.15 91.13 124.69 110.32 118.721998-99 89.97 140.81 151.53 107.09 94.33 84.75 130.02 114.05 123.491999-00 81.98 140.64 163.89 97.22 93.51 80.53 129.45 115.31 121.452000-01 96.65 142.42 177.98 93.13 95.88 82.09 140.20 116.42 124.712001-02 89.70 150.11 311.97 93.85 85.70 76.76 144.61 118.49 128.952002-03 88.90 155.10 449.19 96.46 87.43 71.23 149.36 124.98 134.132003-04 98.19 151.27 358.03 101.05 90.93 68.48 153.70 131.32 134.772004-05 99.88 162.20 483.92 104.40 96.32 73.87 159.57 146.07 143.652005-06 105.33 155.73 622.40 103.44 88.31 141.92 157.99 153.66 144.032006-07 105.51 156.21 993.78 107.31 91.95 165.35 164.96 164.34 152.112007-08 102.82 146.54 1,072.47 104.51 78.86 199.04 161.98 164.89 148.282008-09 102.54 154.29 1,355.72 110.04 92.65 247.09 166.80 164.37 158.102009-10 97.83 155.29 1,526.67 105.61 106.93 240.17 160.99 145.67 156.782010-11 88.83 155.56 1,778.84 103.16 99.88 257.07 153.71 154.53 157.642011-12 85.33 165.83 2,217.50 103.43 100.47 247.47 146.24 165.09 164.312012-13 81.41 168.91 2,570.62 101.72 76.24 99.02 137.69 166.57 161.492013-14 76.34 172.70 2,855.40 96.66 85.71 104.57 125.46 156.68 161.22
2014-15 73.15 169.43 3,593.80 93.50 84.35 108.04 116.67 144.55 163.10
2015-16 63.61 169.32 4,509.66 90.23 82.32 112.62 103.79 134.80 166.582016-17 55.71 161.00 6,248.32 86.51 80.82 99.95 94.00 161.98 179.362017-18 49.58 161.83 7,552.23 84.06 78.35 103.46 86.89 161.46 188.672018-19 51.31 158.08 8,211.36 80.08 74.03 95.55 44.18 154.54 179.15
Notes: These data should be read in conjunction with the explanatory notes and other expenditure tables in this publication.
Figure(s) may be incomplete for any period due to some unavailable expenditure figures that are used to derive these numbers.
AUSTRALIA
Value ($)
ACT NSW NT QLD SA TAS VIC WA
Australian Gambling Statistics, 1993–94 to 2018–2019, 36th edition
63

TABLE RACING 8REAL PER CAPITA TOTAL RACING EXPENDITURE
1993-94 141.53 246.84 203.20 208.57 165.13 188.80 227.73 187.24 219.161994-95 123.88 264.50 214.19 199.41 156.08 185.11 219.62 183.30 220.041995-96 138.86 244.62 217.48 188.27 139.93 174.81 218.02 183.90 209.601996-97 141.60 245.60 245.37 183.05 144.22 162.00 210.51 178.88 206.971997-98 140.19 227.12 238.07 179.64 156.93 155.19 212.35 187.87 202.181998-99 151.40 236.96 255.01 180.22 158.74 142.62 218.81 191.93 207.821999-00 134.78 231.23 269.45 159.83 153.73 132.39 212.83 189.58 199.672000-01 149.83 220.80 275.91 144.38 148.64 127.26 217.35 180.49 193.332001-02 135.20 226.26 470.23 141.45 129.18 115.70 217.97 178.59 194.362002-03 130.05 226.89 657.09 141.11 127.90 104.20 218.48 182.82 196.202003-04 140.21 216.02 511.29 144.30 129.85 97.79 219.49 187.53 192.452004-05 139.32 226.25 675.00 145.63 134.36 103.04 222.57 203.74 200.372005-06 142.39 210.54 841.42 139.84 119.39 191.87 213.59 207.73 194.722006-07 138.54 205.11 1,304.83 140.90 120.73 217.11 216.60 215.77 199.722007-08 130.64 186.19 1,362.69 132.79 100.20 252.90 205.82 209.51 188.412008-09 126.35 190.11 1,670.49 135.58 114.16 304.46 205.53 202.53 194.812009-10 117.75 186.91 1,837.48 127.11 128.70 289.07 193.77 175.32 188.702010-11 103.74 181.68 2,077.44 120.48 116.65 300.22 179.51 180.47 184.102011-12 97.36 189.21 2,530.16 118.01 114.64 282.36 166.86 188.37 187.482012-13 90.80 188.39 2,867.13 113.45 85.04 110.44 153.57 185.78 180.122013-14 82.95 187.66 3,102.87 105.04 93.14 113.64 136.34 170.26 175.19
2014-15 78.15 181.01 3,839.44 99.89 90.12 115.43 124.65 154.44 174.25
2015-16 67.01 178.38 4,751.17 95.06 86.73 118.65 109.35 142.02 175.502016-17 57.68 166.70 6,469.45 89.57 83.68 103.48 97.33 167.71 185.712017-18 50.38 164.42 7,673.28 85.41 79.60 105.11 88.28 164.05 191.692018-19 51.31 158.08 8,211.36 80.08 74.03 95.55 44.18 154.54 179.15
Notes: These data should be read in conjunction with the explanatory notes and other expenditure tables in this publication.
Figure(s) may be incomplete for any period due to some unavailable expenditure figures that are used to derive these numbers.
AUSTRALIA
Value ($)
ACT NSW NT QLD SA TAS VIC WA
Australian Gambling Statistics, 1993–94 to 2018–2019, 36th edition
64
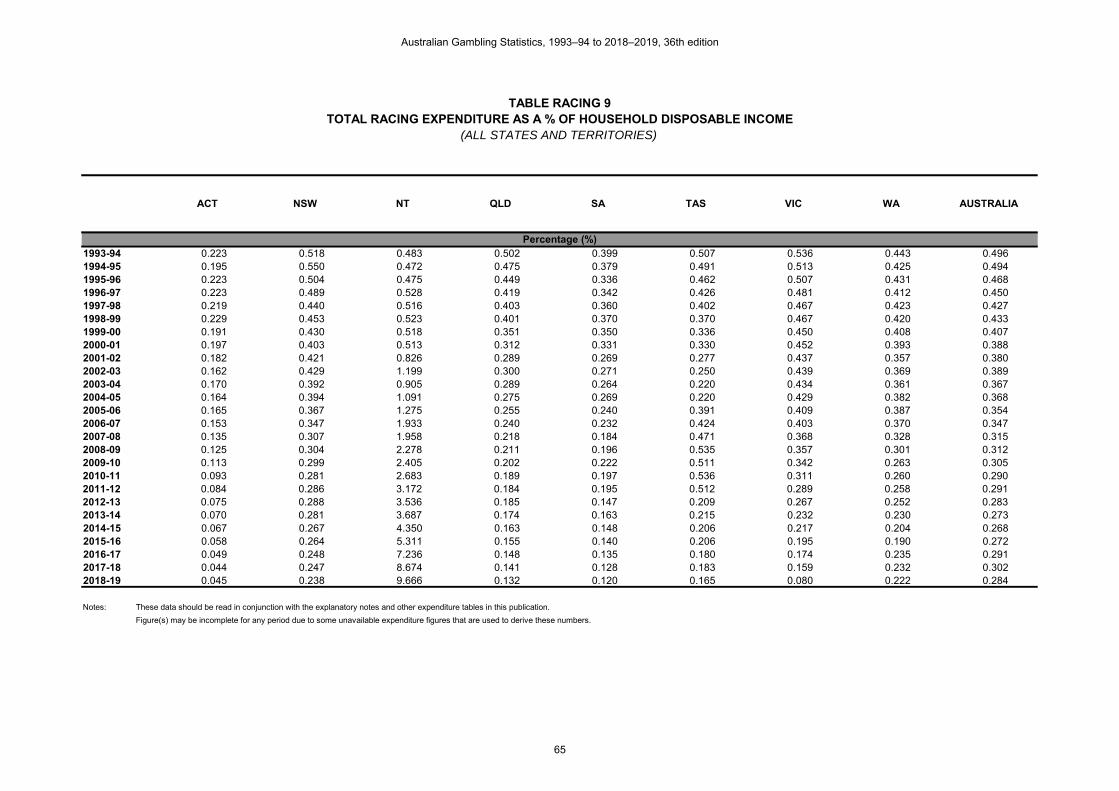
TABLE RACING 9TOTAL RACING EXPENDITURE AS A % OF HOUSEHOLD DISPOSABLE INCOME
(ALL STATES AND TERRITORIES)
1993-94 0.223 0.518 0.483 0.502 0.399 0.507 0.536 0.443 0.4961994-95 0.195 0.550 0.472 0.475 0.379 0.491 0.513 0.425 0.4941995-96 0.223 0.504 0.475 0.449 0.336 0.462 0.507 0.431 0.4681996-97 0.223 0.489 0.528 0.419 0.342 0.426 0.481 0.412 0.4501997-98 0.219 0.440 0.516 0.403 0.360 0.402 0.467 0.423 0.4271998-99 0.229 0.453 0.523 0.401 0.370 0.370 0.467 0.420 0.4331999-00 0.191 0.430 0.518 0.351 0.350 0.336 0.450 0.408 0.4072000-01 0.197 0.403 0.513 0.312 0.331 0.330 0.452 0.393 0.3882001-02 0.182 0.421 0.826 0.289 0.269 0.277 0.437 0.357 0.3802002-03 0.162 0.429 1.199 0.300 0.271 0.250 0.439 0.369 0.3892003-04 0.170 0.392 0.905 0.289 0.264 0.220 0.434 0.361 0.3672004-05 0.164 0.394 1.091 0.275 0.269 0.220 0.429 0.382 0.3682005-06 0.165 0.367 1.275 0.255 0.240 0.391 0.409 0.387 0.3542006-07 0.153 0.347 1.933 0.240 0.232 0.424 0.403 0.370 0.3472007-08 0.135 0.307 1.958 0.218 0.184 0.471 0.368 0.328 0.3152008-09 0.125 0.304 2.278 0.211 0.196 0.535 0.357 0.301 0.3122009-10 0.113 0.299 2.405 0.202 0.222 0.511 0.342 0.263 0.3052010-11 0.093 0.281 2.683 0.189 0.197 0.536 0.311 0.260 0.2902011-12 0.084 0.286 3.172 0.184 0.195 0.512 0.289 0.258 0.2912012-13 0.075 0.288 3.536 0.185 0.147 0.209 0.267 0.252 0.2832013-14 0.070 0.281 3.687 0.174 0.163 0.215 0.232 0.230 0.273
2014-15 0.067 0.267 4.350 0.163 0.148 0.206 0.217 0.204 0.268
2015-16 0.058 0.264 5.311 0.155 0.140 0.206 0.195 0.190 0.2722016-17 0.049 0.248 7.236 0.148 0.135 0.180 0.174 0.235 0.2912017-18 0.044 0.247 8.674 0.141 0.128 0.183 0.159 0.232 0.3022018-19 0.045 0.238 9.666 0.132 0.120 0.165 0.080 0.222 0.284
Notes: These data should be read in conjunction with the explanatory notes and other expenditure tables in this publication.
Figure(s) may be incomplete for any period due to some unavailable expenditure figures that are used to derive these numbers.
Percentage (%)
TAS VIC WA AUSTRALIAACT NSW NT QLD SA
Australian Gambling Statistics, 1993–94 to 2018–2019, 36th edition
65

TABLE RACING 10GOVERNMENT REVENUE FROM TOTAL RACING
1993-94 5.856 321.319 2.284 74.712 26.983 10.087 182.679 39.632 663.5521994-95 5.518 332.922 2.729 77.437 23.348 12.024 141.123 42.236 637.3371995-96 6.709 336.203 3.480 77.912 22.196 11.310 121.452 44.511 623.7731996-97 3.867 337.581 3.526 79.800 22.674 10.356 120.673 33.824 612.3011997-98 5.783 283.874 3.482 79.900 24.214 9.174 126.948 36.670 570.0451998-99 4.547 189.618 4.365 81.700 23.671 8.040 134.097 38.960 484.9981999-00 4.369 190.093 6.714 50.007 23.792 6.281 136.473 40.654 458.3832000-01 1.874 135.941 6.907 26.549 15.726 0.709 93.197 42.297 323.2002001-02 1.497 139.973 6.590 26.904 0.295 - 97.506 44.345 317.1102002-03 1.626 141.775 7.930 28.416 7.181 - 101.853 48.069 336.8502003-04 5.351 147.423 8.539 30.580 7.337 - 106.354 51.544 357.1282004-05 7.159 153.164 10.397 32.384 7.851 - 112.576 52.574 376.1052005-06 6.000 146.099 11.519 33.692 6.606 - 113.570 57.031 374.5172006-07 6.800 147.862 15.733 35.851 7.251 - 118.835 60.782 393.1142007-08 8.551 141.843 19.292 35.871 6.870 5.065 119.931 29.681 367.1042008-09 5.689 152.183 21.153 38.820 7.512 7.180 125.040 31.150 388.7272009-10 8.555 157.195 15.871 38.140 6.641 6.041 124.980 29.721 387.1442010-11 1.217 151.605 9.190 37.965 1.522 2.089 121.196 32.310 357.0942011-12 1.349 148.651 9.405 38.825 0.771 1.826 116.948 35.747 353.5222012-13 3.979 145.519 6.469 38.977 0.890 2.210 54.477 37.707 290.2292013-14 4.161 141.935 6.734 37.701 - 2.244 42.654 36.756 272.1842014-15 - 144.347 10.004 11.795 - 2.252 41.247 34.141 243.7862015-16 - 119.396 7.134 10.805 - 2.491 37.555 32.249 209.6302016-17 - 96.323 6.952 10.020 - 0.663 34.867 39.453 188.2782017-18 - 96.947 8.085 9.545 31.045 - 33.019 40.627 219.2682018-19 - 83.782 7.659 - 33.981 - 17.185 40.362 182.969
Notes: These data should be read in conjunction with the explanatory notes and other revenue tables in this publication.
Figure(s) may be incomplete for any period due to some unavailable revenue figures that are used to derive these numbers.
Data for the gambling revenue received by states and territories from 1 July 2000 onwards are not comparable with that of preceding years because of the
impact of changes brought about by the introduction of the GST.
Value ($ million)
TAS VIC WA AUSTRALIAACT NSW NT QLD SA
Australian Gambling Statistics, 1993–94 to 2018–2019, 36th edition
66

TABLE RACING 11REAL GOVERNMENT REVENUE FROM TOTAL RACING
1993-94 10.882 597.109 4.244 138.838 50.143 18.745 339.474 73.648 1,233.0831994-95 9.931 599.155 4.911 139.362 42.019 21.639 253.977 76.011 1,147.0061995-96 11.581 580.344 6.007 134.490 38.314 19.523 209.647 76.834 1,076.7401996-97 6.585 574.895 6.005 135.898 38.613 17.636 205.504 57.602 1,042.7391997-98 9.848 483.433 5.930 136.069 41.236 15.623 216.191 62.448 970.7781998-99 7.652 319.106 7.346 137.492 39.836 13.530 225.671 65.565 816.1991999-00 7.183 312.530 11.038 82.216 39.116 10.327 224.374 66.839 753.6252000-01 2.905 210.745 10.708 41.158 24.380 1.099 144.481 65.572 501.0482001-02 2.256 210.976 9.933 40.551 0.445 - 146.967 66.840 477.9692002-03 2.379 207.391 11.600 41.568 10.505 - 148.993 70.316 492.7512003-04 7.641 210.525 12.194 43.669 10.477 - 151.877 73.607 509.9912004-05 9.986 213.643 14.502 45.171 10.951 - 157.028 73.334 524.6162005-06 8.111 197.511 15.572 45.548 8.931 - 153.535 77.100 506.3082006-07 8.928 194.143 20.657 47.073 9.521 - 156.031 79.807 516.1602007-08 10.865 180.226 24.512 45.578 8.729 6.436 152.384 37.713 466.4432008-09 7.010 187.517 26.064 47.833 9.256 8.847 154.072 38.382 478.9822009-10 10.297 189.198 19.102 45.905 7.993 7.271 150.425 35.772 465.9622010-11 1.421 177.054 10.733 44.338 1.777 2.440 141.540 37.734 417.0372011-12 1.539 169.611 10.731 44.299 0.880 2.083 133.438 40.787 403.3682012-13 4.438 162.304 7.215 43.473 0.993 2.465 60.761 42.056 323.7062013-14 4.522 154.236 7.317 40.968 - 2.438 46.350 39.942 295.7742014-15 - 154.213 10.687 12.601 - 2.406 44.066 36.475 260.4492015-16 - 125.790 7.516 11.384 - 2.624 39.566 33.976 220.8562016-17 - 99.732 7.198 10.375 - 0.686 36.101 40.849 194.9412017-18 - 98.501 8.215 9.698 31.543 - 33.548 41.278 222.7822018-19 - 83.782 7.659 - 33.981 - 17.185 40.362 182.969
Notes: These data should be read in conjunction with the explanatory notes and other revenue tables in this publication.
Figure(s) may be incomplete for any period due to some unavailable revenue figures that are used to derive these numbers.
Data for the gambling revenue received by states and territories from 1 July 2000 onwards are not comparable with that of preceding years because of the
impact of changes brought about by the introduction of the GST.
AUSTRALIA
Value ($ million)
ACT NSW NT QLD SA TAS VIC WA
Australian Gambling Statistics, 1993–94 to 2018–2019, 36th edition
67

TABLE RACING 12PER CAPITA GOVERNMENT REVENUE FROM TOTAL RACING
1993-94 26.80 71.71 19.45 32.60 24.48 29.27 54.72 32.17 50.551994-95 24.89 73.50 22.63 32.96 21.10 34.72 42.02 33.60 47.951995-96 29.76 73.31 27.97 32.40 19.99 32.52 35.84 34.67 46.301996-97 16.95 72.65 27.47 32.52 20.32 29.68 35.24 25.80 44.831997-98 25.15 60.35 26.45 32.01 21.55 26.25 36.70 27.44 41.211998-99 19.57 39.83 32.50 32.20 20.92 22.96 38.34 28.64 34.631999-00 18.55 39.41 48.98 19.37 20.88 17.88 38.53 29.39 32.292000-01 7.83 27.79 49.53 10.09 13.70 2.01 25.95 30.07 22.442001-02 6.15 28.25 46.75 10.00 0.26 - 26.76 31.00 21.702002-03 6.58 28.34 56.07 10.28 6.16 - 27.57 33.06 22.712003-04 21.41 29.23 60.14 10.77 6.24 - 28.39 34.84 23.742004-05 28.32 30.13 72.20 11.12 6.61 - 29.62 34.88 24.652005-06 23.40 28.49 78.41 11.28 5.51 - 29.40 37.07 24.182006-07 26.00 28.48 104.59 11.71 5.97 - 30.20 38.52 24.932007-08 32.00 26.86 124.27 11.40 5.58 13.38 29.83 18.23 22.792008-09 20.86 28.28 131.51 12.00 6.02 18.70 30.36 18.49 23.582009-10 30.69 28.74 95.96 11.52 5.25 15.52 29.70 17.14 23.012010-11 4.27 27.35 54.69 11.25 1.19 5.31 28.31 18.13 20.872011-12 4.64 26.48 54.94 11.28 0.60 4.62 26.82 19.45 20.312012-13 13.42 25.57 36.72 11.10 0.68 5.57 12.23 19.93 16.372013-14 13.83 24.57 37.47 10.55 - 5.62 9.37 19.07 15.092014-15 - 24.61 55.15 3.25 - 5.61 8.87 17.53 13.312015-16 - 20.04 39.05 2.94 - 6.17 7.89 16.44 11.272016-17 - 15.89 37.83 2.68 - 1.63 7.14 19.99 9.952017-18 - 15.71 43.82 2.50 22.77 - 6.60 20.42 11.392018-19 - 13.36 41.59 - 24.69 - 3.36 20.11 9.34
Notes: These data should be read in conjunction with the explanatory notes and other revenue tables in this publication.
Figure(s) may be incomplete for any period due to some unavailable revenue figures that are used to derive these numbers.
Data for the gambling revenue received by states and territories from 1 July 2000 onwards are not comparable with that of preceding years because of the
impact of changes brought about by the introduction of the GST.
AUSTRALIA
Value ($)
ACT NSW NT QLD SA TAS VIC WA
Australian Gambling Statistics, 1993–94 to 2018–2019, 36th edition
68

TABLE RACING 13REAL PER CAPITA GOVERNMENT REVENUE FROM TOTAL RACING
1993-94 49.80 133.27 36.15 60.57 45.50 54.39 101.68 59.78 93.941994-95 44.79 132.28 40.72 59.31 37.98 62.48 75.63 60.48 86.301995-96 51.38 126.54 48.28 55.92 34.51 56.14 61.87 59.84 79.911996-97 28.87 123.71 46.78 55.39 34.60 50.55 60.02 43.94 76.341997-98 42.83 102.77 45.04 54.51 36.70 44.70 62.50 46.73 70.181998-99 32.93 67.02 54.69 54.19 35.20 38.65 64.52 48.20 58.271999-00 30.51 64.79 80.53 31.85 34.33 29.40 63.35 48.32 53.092000-01 12.14 43.08 76.79 15.65 21.25 3.12 40.23 46.62 34.792001-02 9.27 42.58 70.46 15.07 0.38 - 40.34 46.73 32.702002-03 9.63 41.45 82.02 15.04 9.01 - 40.33 48.36 33.232003-04 30.57 41.74 85.89 15.37 8.91 - 40.54 49.75 33.902004-05 39.51 42.03 100.71 15.50 9.22 - 41.32 48.65 34.382005-06 31.64 38.52 106.00 15.26 7.44 - 39.75 50.12 32.692006-07 34.14 37.40 137.33 15.37 7.84 - 39.65 50.58 32.732007-08 40.66 34.12 157.90 14.49 7.09 17.00 37.90 23.16 28.952008-09 25.71 34.85 162.05 14.79 7.42 23.04 37.41 22.79 29.062009-10 36.94 34.59 115.49 13.87 6.31 18.68 35.74 20.62 27.692010-11 4.99 31.94 63.87 13.14 1.39 6.20 33.06 21.17 24.382011-12 5.29 30.22 62.68 12.87 0.68 5.27 30.60 22.19 23.172012-13 14.97 28.52 40.95 12.38 0.76 6.21 13.64 22.23 18.262013-14 15.02 26.70 40.72 11.46 - 6.11 10.18 20.72 16.402014-15 - 26.29 58.92 3.47 - 6.00 9.47 18.72 14.222015-16 - 21.11 41.14 3.09 - 6.50 8.31 17.32 11.872016-17 - 16.45 39.17 2.77 - 1.68 7.40 20.70 10.302017-18 - 15.96 44.52 2.54 23.13 - 6.71 20.75 11.572018-19 - 13.36 41.59 - 24.69 - 3.36 20.11 9.34
Notes: These data should be read in conjunction with the explanatory notes and other revenue tables in this publication.
Figure(s) may be incomplete for any period due to some unavailable revenue figures that are used to derive these numbers.
Data for the gambling revenue received by states and territories from 1 July 2000 onwards are not comparable with that of preceding years because of the
impact of changes brought about by the introduction of the GST.
AUSTRALIA
Value ($)
ACT NSW NT QLD SA TAS VIC WA
Australian Gambling Statistics, 1993–94 to 2018–2019, 36th edition
69

TABLE RACING 14TOTAL RACING REVENUE
AS A % OF TOTAL STATE GAMBLING REVENUE
1993-94 12.35 31.83 16.91 22.26 20.72 22.39 24.53 21.311994-95 10.67 30.80 17.04 20.10 12.91 24.04 15.59 20.501995-96 12.66 28.29 17.19 18.70 9.87 21.71 11.55 19.411996-97 8.34 27.30 14.21 17.93 9.14 17.07 10.43 16.491997-98 11.49 21.05 12.32 15.71 8.55 14.58 9.79 16.911998-99 8.35 13.49 13.97 13.91 7.48 11.95 9.52 18.641999-00 7.04 12.32 18.05 8.15 6.98 8.54 8.98 19.432000-01 3.93 11.41 22.47 5.21 5.27 1.24 7.30 19.302001-02 3.32 11.68 19.86 4.78 0.10 - 7.12 19.842002-03 3.39 11.24 22.22 4.49 2.04 - 7.68 20.842003-04 9.53 11.21 22.27 4.25 1.87 - 8.03 20.692004-05 12.80 10.72 22.81 4.05 1.93 - 8.22 19.712005-06 11.29 9.60 20.88 4.01 1.62 - 7.88 20.132006-07 12.56 8.93 24.86 4.39 1.69 - 7.99 18.662007-08 14.30 9.15 27.05 4.08 1.66 5.89 7.65 9.262008-09 10.04 9.16 28.92 4.19 1.80 8.03 7.66 8.712009-10 14.27 11.07 26.19 4.13 1.63 6.76 7.76 8.272010-11 2.31 8.67 18.39 4.01 0.37 2.50 7.44 8.902011-12 2.53 8.30 17.70 3.87 0.18 2.19 6.84 8.932012-13 7.00 7.83 12.16 3.75 0.21 2.70 3.50 8.942013-14 7.58 7.51 11.60 3.61 - 2.73 2.82 8.312014-15 - 6.96 14.62 1.09 - 2.71 2.56 7.832015-16 - 5.43 8.50 0.95 - 2.94 2.23 8.292016-17 - 4.32 8.42 0.88 - 0.84 2.13 10.712017-18 - 4.16 8.57 0.80 7.89 - 1.94 11.202018-19 - 3.36 7.95 - 8.29 - 0.97 10.52
Notes: These data should be read in conjunction with the explanatory notes and other revenue tables in this publication.
Figure(s) may be incomplete for any period due to some unavailable revenue figures that are used to derive these numbers.
Data for the gambling revenue received by states and territories from 1 July 2000 onwards are not comparable with that of preceding years because of the
impact of changes brought about by the introduction of the GST.
Percentage (%)
TAS VIC WAACT NSW NT QLD SA
Australian Gambling Statistics, 1993–94 to 2018–2019, 36th edition
70

TABLE CASINO 1CASINO TURNOVER
1993-94 178.400 - 277.905 1,111.571 457.433 803.839 - 1,662.219 4,491.3671994-95 191.208 - 329.126 1,691.913 319.687 861.792 2,926.130 1,993.248 8,313.1041995-96 141.454 1,650.000 521.407 2,479.747 344.235 891.906 3,991.848 2,045.548 12,066.1451996-97 85.990 2,134.547 409.490 2,880.000 265.600 946.682 6,534.036 1,787.300 15,043.6451997-98 83.478 2,635.039 454.527 4,478.000 282.396 949.784 13,048.195 1,708.705 23,640.1241998-99 99.387 2,832.880 531.938 5,139.000 296.865 991.041 9,098.222 1,360.761 20,350.0941999-00 89.900 2,872.447 603.630 5,834.000 305.449 915.023 10,651.658 1,374.095 22,646.2012000-01 92.992 3,124.022 694.474 5,837.000 339.380 972.085 10,283.089 1,338.402 22,681.4442001-02 90.231 3,153.550 722.667 5,640.517 377.132 910.872 8,384.000 1,388.857 20,667.8262002-03 91.353 - U 763.226 5,675.618 (1) 396.716 926.473 8,211.718 1,204.476 17,269.5802003-04 90.127 - U 809.200 5,921.080 476.620 972.428 7,656.865 1,358.912 17,285.2322004-05 86.066 - U 929.900 5,725.715 441.800 1,018.482 7,869.770 1,475.654 17,547.3872005-06 88.753 - U 973.524 5,512.349 479.324 971.277 7,974.568 1,645.321 17,645.1162006-07 82.549 - U 1,018.839 5,303.247 528.460 - U 8,176.040 2,157.178 17,266.3132007-08 85.307 - U 1,100.954 (2) 5,604.050 485.541 - U 8,875.224 2,312.312 18,463.3882008-09 98.059 - U 1,176.082 6,041.125 532.037 - U 9,071.130 2,548.195 19,466.6282009-10 100.262 - U 1,135.563 5,867.520 535.194 - U 9,647.859 2,554.741 19,841.1382010-11 94.525 - U 1,093.187 5,995.546 511.609 - U 10,461.842 2,571.322 20,728.0312011-12 92.306 - U 1,112.940 6,209.103 533.699 - U 10,971.437 2,982.873 21,902.3582012-13 84.970 - U 1,099.131 6,050.237 537.642 - U 11,393.489 2,951.508 22,116.9772013-14 86.020 - U 1,089.095 5,920.062 299.913 (3) - U 11,635.430 3,443.577 22,474.0972014-15 88.333 - U 1,081.232 6,824.447 - (4) - U 13,491.567 3,672.959 25,158.5382015-16 113.554 - U 1,038.930 7,131.292 - - U 14,570.456 4,309.088 27,163.3202016-17 155.075 - U 998.937 7,533.593 - - U 11,833.561 3,501.490 (5) 24,022.6562017-18 142.007 - U 1,100.323 7,720.032 - - U 13,008.558 3,263.388 25,234.3082018-19 125.355 - U 1,055.710 8,145.991 - - U 13,633.681 3,276.193 26,236.930
Notes: These data should be read in conjunction with the explanatory notes and other turnover tables in this publication.
Figure(s) may be incomplete for any period or jurisdiction due to some unavailable turnover figures that are used to derive these numbers.
(1) Casino turnover includes actual turnover for keno and gaming machines and handle for table games, from this period on.
(2) Excludes community keno, from this period on.
(3) July 2013 - December 2013.
(4) Turnover data no longer provided to SA Government.
(5) Figure includes Hong Kong Dollars program.
U = Unavailable data
AUSTRALIA
Value ($ million)
ACT NSW NT QLD SA TAS VIC WA
Australian Gambling Statistics, 1993–94 to 2018–2019, 36th edition
71

TABLE CASINO 2REAL CASINO TURNOVER
1993-94 331.522 - 516.433 2,065.638 850.051 1,493.779 - 3,088.912 8,346.3341994-95 344.114 - 592.323 3,044.910 575.336 1,550.954 5,266.111 3,587.218 14,960.9641995-96 244.174 2,848.185 900.038 4,280.471 594.209 1,539.584 6,890.618 3,530.969 20,828.2471996-97 146.440 3,635.102 697.355 4,904.597 452.313 1,612.185 11,127.366 3,043.745 25,619.1031997-98 142.162 4,487.432 774.053 7,625.967 480.916 1,617.468 22,220.881 2,909.899 40,258.7781998-99 167.257 4,767.427 895.194 8,648.376 499.591 1,667.814 15,311.315 2,290.012 34,246.9861999-00 147.804 4,722.567 992.423 9,591.634 502.186 1,504.382 17,512.308 2,259.139 37,232.4432000-01 144.163 4,843.083 1,076.623 9,048.936 526.131 1,506.996 15,941.582 2,074.887 35,162.4012001-02 136.002 4,753.237 1,089.251 8,501.757 568.438 1,372.926 12,636.914 2,093.376 31,151.9022002-03 133.633 - U 1,116.463 8,302.410 (1) 580.324 1,355.264 12,012.270 1,761.932 25,262.2962003-04 128.705 - U 1,155.566 8,455.510 680.630 1,388.661 10,934.272 1,940.574 24,683.9172004-05 120.050 - U 1,297.085 7,986.602 616.252 1,420.645 10,977.271 2,058.339 24,476.2452005-06 119.985 - U 1,316.103 7,452.121 647.996 1,313.065 10,780.784 2,224.302 23,854.3582006-07 108.387 - U 1,337.739 6,963.182 693.870 - U 10,735.169 2,832.382 22,670.7292007-08 108.391 - U 1,398.874 (2) 7,120.513 616.929 - U 11,276.871 2,938.027 23,459.6062008-09 120.826 - U 1,449.146 7,443.762 655.566 - U 11,177.278 3,139.839 23,986.4172009-10 120.674 - U 1,366.748 7,062.068 644.152 - U 11,612.032 3,074.852 23,880.5262010-11 110.392 - U 1,276.690 7,001.963 597.488 - U 12,217.975 3,002.946 24,207.4552011-12 105.321 - U 1,269.864 7,084.587 608.951 - U 12,518.410 3,403.458 24,990.5902012-13 94.771 - U 1,225.912 6,748.114 599.657 - U 12,707.694 3,291.956 24,668.1042013-14 93.475 - U 1,183.484 6,433.134 325.905 (3) - U 12,643.834 3,742.020 24,421.8522014-15 94.371 - U 1,155.136 7,290.912 - (4) - U 14,413.743 3,924.013 26,878.1752015-16 119.635 - U 1,094.570 7,513.208 - - U 15,350.776 4,539.861 28,618.0502016-17 160.563 - U 1,034.289 7,800.208 - - U 12,252.353 3,625.408 (5) 24,872.8222017-18 144.283 - U 1,117.960 7,843.772 - - U 13,217.065 3,315.695 25,638.7762018-19 125.355 - U 1,055.710 8,145.991 - - U 13,633.681 3,276.193 26,236.930
Notes: These data should be read in conjunction with the explanatory notes and other turnover tables in this publication.
Figure(s) may be incomplete for any period or jurisdiction due to some unavailable turnover figures that are used to derive these numbers.
(1) Casino turnover includes actual turnover for keno and gaming machines and handle for table games, from this period on.
(2) Excludes community keno, from this period on.
(3) July 2013 - December 2013.
(4) Turnover data no longer provided to SA Government.
(5) Figure includes Hong Kong Dollars program.
U = Unavailable data
AUSTRALIA
Value ($ million)
ACT NSW NT QLD SA TAS VIC WA
Australian Gambling Statistics, 1993–94 to 2018–2019, 36th edition
72

TABLE CASINO 3PER CAPITA CASINO TURNOVER
1993-94 816.48 - 2,367.00 484.96 415.06 2,332.65 - 1,349.19 342.161994-95 862.43 - 2,728.68 720.06 288.93 2,488.35 871.32 1,585.84 625.451995-96 627.53 359.77 4,190.26 1,031.09 310.06 2,564.77 1,178.00 1,593.13 895.541996-97 376.91 459.34 3,190.12 1,173.75 238.02 2,713.52 1,908.25 1,363.31 1,101.381997-98 363.01 560.19 3,452.70 1,794.02 251.35 2,717.42 3,772.11 1,278.62 1,709.101998-99 427.72 594.99 3,960.36 2,025.54 262.35 2,830.59 2,601.14 1,000.38 1,452.901999-00 381.79 595.50 4,403.70 2,260.21 268.05 2,605.03 3,007.48 993.48 1,595.392000-01 388.47 638.62 4,980.24 2,218.82 295.76 2,756.49 2,863.23 951.49 1,574.962001-02 370.73 636.49 5,126.39 2,095.79 326.17 2,570.86 2,301.33 970.98 1,414.052002-03 369.92 - U 5,396.53 2,052.99 (1) 340.14 2,588.63 2,222.65 828.41 1,164.462003-04 360.58 - U 5,699.59 2,084.62 405.12 2,678.99 2,043.73 918.52 1,149.062004-05 340.50 - U 6,457.64 1,965.24 372.14 2,773.18 2,070.63 979.02 1,150.102005-06 346.15 - U 6,626.63 1,846.24 399.57 2,620.74 2,064.63 1,069.49 1,139.162006-07 315.66 - U 6,773.34 1,731.65 435.20 - U 2,077.49 1,367.08 1,094.912007-08 319.27 - U 7,092.07 (2) 1,781.14 394.57 - U 2,207.28 1,420.02 1,146.032008-09 359.58 - U 7,312.08 1,868.03 426.27 - U 2,202.83 1,512.79 1,180.872009-10 359.72 - U 6,865.62 1,772.39 422.76 - U 2,292.42 1,472.97 1,179.282010-11 332.00 - U 6,505.40 1,777.29 399.52 - U 2,443.63 1,442.78 1,211.532011-12 317.46 - U 6,501.08 1,804.44 412.57 - U 2,516.14 1,623.03 1,258.332012-13 286.59 - U 6,238.38 1,722.50 411.36 - U 2,557.67 1,560.36 1,247.512013-14 285.83 - U 6,060.38 1,655.87 227.24 (3) - U 2,555.99 1,786.31 1,246.172014-15 289.12 - U 5,960.63 1,881.18 - (4) - U 2,900.25 1,885.44 1,373.562015-16 365.20 - U 5,687.61 1,937.97 - - U 3,060.37 2,196.41 1,460.112016-17 489.06 - U 5,436.33 2,013.61 - - U 2,424.67 1,773.93 (5) 1,269.472017-18 438.51 - U 5,963.73 2,025.99 - - U 2,601.64 1,640.52 1,310.252018-19 380.55 - U 5,732.48 2,098.89 - - U 2,663.86 1,631.94 1,339.43
Notes: These data should be read in conjunction with the explanatory notes and other turnover tables in this publication.
Figure(s) may be incomplete for any period or jurisdiction due to some unavailable turnover figures that are used to derive these numbers.
(1) Casino turnover includes actual turnover for keno and gaming machines and handle for table games, from this period on.
(2) Excludes community keno, from this period on.
(3) July 2013 - December 2013.
(4) Turnover data no longer provided to SA Government.
(5) Figure includes Hong Kong Dollars program.
U = Unavailable data
AUSTRALIA
Value ($)
ACT NSW NT QLD SA TAS VIC WA
Australian Gambling Statistics, 1993–94 to 2018–2019, 36th edition
73

TABLE CASINO 4REAL PER CAPITA CASINO TURNOVER
1993-94 1,517.27 - 4,398.61 901.21 771.32 4,334.77 - 2,507.21 635.831994-95 1,552.10 - 4,910.75 1,295.88 519.97 4,478.25 1,568.11 2,854.01 1,125.621995-96 1,083.22 621.03 7,233.12 1,779.83 535.23 4,427.24 2,033.44 2,750.02 1,545.851996-97 641.88 782.25 5,432.72 1,998.88 405.35 4,621.08 3,249.73 2,321.70 1,875.631997-98 618.20 954.00 5,879.89 3,055.20 428.04 4,627.72 6,423.85 2,177.47 2,910.581998-99 719.80 1,001.30 6,664.86 3,408.77 441.51 4,763.58 4,377.44 1,683.53 2,445.071999-00 627.70 979.05 7,240.08 3,715.99 440.69 4,282.91 4,944.58 1,633.37 2,622.982000-01 602.23 990.04 7,720.72 3,439.77 458.51 4,273.31 4,438.78 1,475.06 2,441.622001-02 558.78 959.35 7,726.83 3,158.91 491.63 3,874.96 3,468.72 1,463.52 2,131.352002-03 541.13 - U 7,894.16 3,003.15 (1) 497.56 3,786.70 3,251.34 1,211.82 1,703.402003-04 514.92 - U 8,139.22 2,976.91 578.52 3,825.69 2,918.52 1,311.68 1,640.902004-05 474.95 - U 9,007.54 2,741.24 519.09 3,868.21 2,888.26 1,365.61 1,604.242005-06 467.95 - U 8,958.51 2,495.93 540.18 3,542.97 2,791.16 1,445.83 1,540.032006-07 414.47 - U 8,893.42 2,273.66 571.42 - U 2,727.76 1,794.98 1,437.622007-08 405.66 - U 9,011.19 (2) 2,263.12 501.34 - U 2,804.57 1,804.28 1,456.152008-09 443.07 - U 9,009.81 2,301.75 525.25 - U 2,714.29 1,864.03 1,455.052009-10 432.95 - U 8,263.36 2,133.22 508.83 - U 2,759.13 1,772.85 1,419.362010-11 387.73 - U 7,597.40 2,075.62 466.59 - U 2,853.82 1,684.97 1,414.902011-12 362.23 - U 7,417.74 2,058.87 470.74 - U 2,870.91 1,851.87 1,435.762012-13 319.65 - U 6,957.96 1,921.18 458.81 - U 2,852.69 1,740.35 1,391.402013-14 310.60 - U 6,585.61 1,799.38 246.94 (3) - U 2,777.51 1,941.12 1,354.172014-15 308.88 - U 6,368.05 2,009.77 - (4) - U 3,098.49 2,014.31 1,467.442015-16 384.76 - U 5,992.21 2,041.76 - - U 3,224.27 2,314.03 1,538.312016-17 506.37 - U 5,628.72 2,084.87 - - U 2,510.48 1,836.71 (5) 1,314.402017-18 445.54 - U 6,059.32 2,058.46 - - U 2,643.34 1,666.81 1,331.252018-19 380.55 - U 5,732.48 2,098.89 - - U 2,663.86 1,631.94 1,339.43
Notes: These data should be read in conjunction with the explanatory notes and other turnover tables in this publication.
Figure(s) may be incomplete for any period or jurisdiction due to some unavailable turnover figures that are used to derive these numbers.
(1) Casino turnover includes actual turnover for keno and gaming machines and handle for table games, from this period on.
(2) Excludes community keno, from this period on.
(3) July 2013 - December 2013.
(4) Turnover data no longer provided to SA Government.
(5) Figure includes Hong Kong Dollars program.
U = Unavailable data
AUSTRALIA
Value ($)
ACT NSW NT QLD SA TAS VIC WA
Australian Gambling Statistics, 1993–94 to 2018–2019, 36th edition
74

TABLE CASINO 5CASINO EXPENDITURE
1993-94 34.629 - 33.505 230.095 116.204 54.746 - 354.156 823.3351994-95 39.580 - 36.851 253.787 83.559 58.871 357.847 395.038 1,225.5331995-96 29.281 279.400 58.398 388.675 76.544 62.386 490.900 429.565 1,815.1491996-97 17.800 361.450 45.863 450.351 70.709 74.231 578.966 375.300 1,974.6701997-98 17.280 446.200 47.414 468.347 76.008 75.642 742.292 358.828 2,232.0111998-99 16.285 479.700 54.280 476.800 76.648 82.167 721.852 285.760 2,193.4921999-00 17.700 486.400 62.385 530.700 75.831 77.070 823.869 288.560 2,362.5152000-01 18.394 529.000 69.111 543.001 80.737 76.267 945.746 281.064 2,543.3202001-02 16.221 534.000 69.554 541.137 91.761 87.811 911.198 291.660 2,543.3422002-03 18.411 541.000 72.978 530.047 100.182 88.382 951.747 252.940 2,555.6872003-04 19.146 551.000 80.894 592.123 107.923 96.386 963.759 285.371 2,696.6022004-05 19.058 543.900 87.100 549.425 105.656 102.036 921.560 309.887 2,638.6222005-06 18.913 638.000 98.535 578.400 125.198 99.770 1,027.127 345.517 2,931.4602006-07 18.171 687.093 105.245 525.803 131.563 101.927 1,062.475 453.008 3,085.2852007-08 17.703 704.287 107.306 (1) 560.346 124.415 109.280 1,101.370 486.216 3,210.9232008-09 18.836 747.799 114.730 579.785 134.509 113.914 1,218.258 535.121 3,462.9522009-10 19.785 734.881 109.662 550.179 140.356 108.565 1,320.069 536.496 3,519.9932010-11 19.140 902.001 101.244 568.710 139.319 110.709 1,349.467 503.343 3,693.9332011-12 18.449 953.716 104.895 588.375 147.256 106.140 1,528.040 634.221 4,081.0922012-13 17.086 1,057.507 102.740 570.542 143.688 92.532 1,536.120 599.171 4,119.3862013-14 17.378 1,140.491 102.325 556.996 149.777 90.590 1,556.771 774.421 4,388.7492014-15 16.840 1,417.992 105.351 690.337 152.229 92.594 1,864.388 834.534 5,174.2652015-16 21.360 1,508.123 101.877 701.870 178.246 89.804 1,851.694 741.891 5,194.8652016-17 34.480 1,543.554 97.125 715.859 135.565 84.340 1,556.268 622.849 (2) 4,790.0412017-18 24.777 1,574.819 96.384 805.852 180.402 81.161 1,773.563 563.624 5,100.5832018-19 25.676 1,404.761 92.405 917.073 123.985 81.079 1,679.079 533.412 4,857.470
Notes: These data should be read in conjunction with the explanatory notes and other expenditure tables in this publication.
Figure(s) may be incomplete for any period or jurisdiction due to some unavailable expenditure figures that are used to derive these numbers.
(1) Excludes community keno, from this period on.
(2) Figure includes Hong Kong Dollars program.
AUSTRALIA
Value ($ million)
ACT NSW NT QLD SA TAS VIC WA
Australian Gambling Statistics, 1993–94 to 2018–2019, 36th edition
75

TABLE CASINO 6REAL CASINO EXPENDITURE
1993-94 64.351 - 62.263 427.587 215.943 101.735 - 658.130 1,530.0081994-95 71.232 - 66.320 456.737 150.380 105.949 644.012 710.944 2,205.5731995-96 50.544 482.293 100.804 670.920 132.128 107.689 847.378 741.503 3,133.2601996-97 30.313 615.544 78.104 766.941 120.416 126.414 985.970 639.130 3,362.8331997-98 29.428 759.872 80.745 797.588 129.440 128.817 1,264.112 611.079 3,801.0811998-99 27.406 807.283 91.347 802.402 128.990 138.278 1,214.798 480.903 3,691.4081999-00 29.100 799.686 102.567 872.520 124.673 126.710 1,354.517 474.419 3,884.1932000-01 28.516 820.094 107.141 841.799 125.164 118.235 1,466.163 435.726 3,942.8372001-02 24.449 804.880 104.836 815.637 138.308 132.354 1,373.417 439.609 3,833.4922002-03 26.932 791.386 106.754 775.364 146.548 129.287 1,392.235 370.006 3,738.5112003-04 27.341 786.847 115.519 845.572 154.118 137.643 1,376.282 407.520 3,850.8422004-05 26.583 758.667 121.493 766.374 147.376 142.326 1,285.452 432.251 3,680.5232005-06 25.568 862.509 133.209 781.936 169.255 134.879 1,388.569 467.103 3,963.0282006-07 23.859 902.155 138.187 690.381 172.743 133.831 1,395.033 594.801 4,050.9902007-08 22.493 894.868 136.343 (1) 711.976 158.082 138.851 1,399.402 617.787 4,079.8022008-09 23.209 921.424 141.368 714.400 165.739 140.363 1,501.115 659.366 4,266.9852009-10 23.813 884.493 131.988 662.188 168.931 130.667 1,588.817 645.719 4,236.6172010-11 22.353 1,053.412 118.239 664.174 162.705 129.293 1,575.990 587.835 4,313.9992011-12 21.050 1,088.190 119.685 671.336 168.019 121.106 1,743.494 723.646 4,656.5262012-13 19.057 1,179.487 114.591 636.352 160.262 103.205 1,713.307 668.284 4,594.5452013-14 18.884 1,239.334 111.193 605.269 162.758 98.441 1,691.691 841.537 4,769.1072014-15 17.991 1,514.915 112.552 737.523 162.634 98.922 1,991.823 891.576 5,527.9362015-16 22.504 1,588.890 107.333 739.459 187.792 94.614 1,950.861 781.623 5,473.0762016-17 35.700 1,598.181 100.562 741.193 140.363 87.325 1,611.345 644.892 (2) 4,959.5612017-18 25.174 1,600.061 97.929 818.769 183.294 82.462 1,801.991 572.658 5,182.3372018-19 25.676 1,404.761 92.405 917.073 123.985 81.079 1,679.079 533.412 4,857.470
Notes: These data should be read in conjunction with the explanatory notes and other expenditure tables in this publication.
Figure(s) may be incomplete for any period or jurisdiction due to some unavailable expenditure figures that are used to derive these numbers.
(1) Excludes community keno, from this period on.
(2) Figure includes Hong Kong Dollars program.
AUSTRALIA
Value ($ million)
ACT NSW NT QLD SA TAS VIC WA
Australian Gambling Statistics, 1993–94 to 2018–2019, 36th edition
76

TABLE CASINO 7PER CAPITA CASINO EXPENDITURE
1993-94 158.49 - 285.37 100.39 105.44 158.87 - 287.46 62.721994-95 178.52 - 305.52 108.01 75.52 169.99 106.56 314.29 92.211995-96 129.90 60.92 469.31 161.61 68.95 179.40 144.87 334.56 134.721996-97 78.02 77.78 357.29 183.54 63.37 212.77 169.09 286.27 144.571997-98 75.14 94.86 360.17 187.63 67.65 216.42 214.59 268.51 161.371998-99 70.08 100.75 404.12 187.93 67.74 234.68 206.37 210.08 156.611999-00 75.17 100.84 455.12 205.60 66.55 219.42 232.62 208.63 166.442000-01 76.84 108.14 495.61 206.41 70.36 216.27 263.33 199.81 176.602001-02 66.65 107.78 493.40 201.06 79.36 247.84 250.12 203.91 174.012002-03 74.55 108.13 516.00 191.73 85.89 246.95 257.61 173.97 172.332003-04 76.60 109.25 569.78 208.47 91.73 265.54 257.24 192.89 179.262004-05 75.40 107.00 604.86 188.58 89.00 277.83 242.47 205.59 172.942005-06 73.76 124.42 670.71 193.72 104.37 269.20 265.92 224.59 189.252006-07 69.49 132.35 699.68 171.69 108.35 272.41 269.97 287.09 195.652007-08 66.25 133.35 691.24 (1) 178.10 101.11 288.60 273.91 298.59 199.302008-09 69.07 138.97 713.31 179.28 107.77 296.67 295.84 317.69 210.072009-10 70.98 134.35 663.02 166.19 110.87 278.99 313.66 309.32 209.212010-11 67.23 162.73 602.49 168.59 108.80 281.55 315.20 282.43 215.912011-12 63.45 169.92 612.73 170.99 113.83 268.26 350.43 345.09 234.472012-13 57.63 185.82 583.13 162.43 109.94 232.97 344.84 316.76 232.352013-14 57.74 197.40 569.40 155.79 113.48 227.01 341.98 401.72 243.352014-15 55.12 241.72 580.78 190.29 114.29 230.73 400.78 428.39 282.492015-16 68.70 253.12 557.72 190.74 132.78 222.44 388.93 378.15 279.242016-17 108.74 254.58 528.57 191.34 100.24 206.95 318.88 315.55 (2) 253.132017-18 76.51 255.21 522.40 211.48 132.29 196.55 354.70 283.34 264.842018-19 77.95 224.09 501.76 236.29 90.07 193.55 328.07 265.70 247.98
Notes: These data should be read in conjunction with the explanatory notes and other expenditure tables in this publication.
Figure(s) may be incomplete for any period or jurisdiction due to some unavailable expenditure figures that are used to derive these numbers.
(1) Excludes community keno, from this period on.
(2) Figure includes Hong Kong Dollars program.
AUSTRALIA
Value ($)
ACT NSW NT QLD SA TAS VIC WA
Australian Gambling Statistics, 1993–94 to 2018–2019, 36th edition
77

TABLE CASINO 8REAL PER CAPITA CASINO EXPENDITURE
1993-94 294.52 - 530.31 186.55 195.94 295.22 - 534.19 116.561994-95 321.28 - 549.84 194.38 135.91 305.92 191.77 565.63 165.941995-96 224.23 105.16 810.11 278.97 119.01 309.67 250.06 577.50 232.551996-97 132.87 132.46 608.47 312.57 107.91 362.35 287.95 487.51 246.201997-98 127.97 161.54 613.36 319.54 115.21 368.56 365.44 457.27 274.811998-99 117.94 169.55 680.10 316.27 113.99 394.95 347.31 353.54 263.551999-00 123.58 165.79 748.26 338.03 109.41 360.74 382.45 343.01 273.642000-01 119.12 167.65 768.33 319.99 109.08 335.27 408.24 309.76 273.782001-02 100.45 162.45 743.68 303.06 119.62 373.56 376.99 307.34 262.282002-03 109.06 158.17 754.82 280.47 125.65 361.24 376.83 254.48 252.082003-04 109.39 156.01 813.66 297.70 131.00 379.20 367.35 275.45 255.992004-05 105.17 149.26 843.70 263.04 124.14 387.53 338.22 286.78 241.232005-06 99.72 168.21 906.73 261.89 141.09 363.93 359.50 303.62 255.852006-07 91.23 173.78 918.68 225.43 142.26 357.68 354.47 376.95 256.892007-08 84.18 169.43 878.29 (1) 226.29 128.46 366.69 348.03 379.39 253.232008-09 85.11 171.24 878.93 220.91 132.79 365.56 364.53 391.45 258.842009-10 85.44 161.71 798.00 200.03 133.44 335.79 377.52 372.30 251.812010-11 78.51 190.04 703.62 196.88 127.06 328.81 368.11 329.84 252.152011-12 72.40 193.87 699.12 195.10 129.89 306.09 399.84 393.75 267.532012-13 64.28 207.25 650.39 181.17 122.62 259.85 384.61 353.30 259.152013-14 62.75 214.51 618.75 169.30 123.32 246.68 371.62 436.54 264.442014-15 58.89 258.25 620.48 203.30 122.10 246.50 428.18 457.67 301.802015-16 72.37 266.67 587.59 200.95 139.89 234.35 409.76 398.40 294.202016-17 112.59 263.59 547.27 198.11 103.79 214.28 330.16 326.72 (2) 262.092017-18 77.74 259.30 530.77 214.87 134.41 199.70 360.39 287.88 269.082018-19 77.95 224.09 501.76 236.29 90.07 193.55 328.07 265.70 247.98
Notes: These data should be read in conjunction with the explanatory notes and other expenditure tables in this publication.
Figure(s) may be incomplete for any period or jurisdiction due to some unavailable expenditure figures that are used to derive these numbers.
(1) Excludes community keno, from this period on.
(2) Figure includes Hong Kong Dollars program.
AUSTRALIA
Value ($)
ACT NSW NT QLD SA TAS VIC WA
Australian Gambling Statistics, 1993–94 to 2018–2019, 36th edition
78

TABLE CASINO 9CASINO EXPENDITURE AS A % OF HOUSEHOLD DISPOSABLE INCOME
(ALL STATES AND TERRITORIES)
1993-94 0.464 - 1.261 0.449 0.474 0.793 - 1.265 0.2641994-95 0.507 - 1.211 0.463 0.330 0.812 0.448 1.311 0.3721995-96 0.360 0.217 1.769 0.665 0.285 0.819 0.582 1.352 0.5191996-97 0.209 0.264 1.310 0.715 0.256 0.954 0.658 1.124 0.5351997-98 0.200 0.313 1.329 0.717 0.264 0.956 0.803 1.029 0.5811998-99 0.179 0.324 1.394 0.704 0.266 1.024 0.741 0.774 0.5481999-00 0.175 0.309 1.437 0.743 0.249 0.915 0.808 0.739 0.5582000-01 0.156 0.306 1.430 0.691 0.243 0.870 0.848 0.674 0.5492001-02 0.135 0.302 1.307 0.619 0.250 0.895 0.755 0.614 0.5122002-03 0.136 0.299 1.378 0.596 0.266 0.866 0.757 0.513 0.5002003-04 0.133 0.283 1.440 0.597 0.266 0.853 0.726 0.530 0.4882004-05 0.123 0.260 1.363 0.497 0.249 0.826 0.651 0.538 0.4432005-06 0.116 0.293 1.374 0.477 0.283 0.741 0.688 0.566 0.4652006-07 0.101 0.294 1.361 0.384 0.273 0.698 0.660 0.646 0.4472007-08 0.087 0.279 1.262 (1) 0.372 0.236 0.682 0.623 0.593 0.4232008-09 0.084 0.274 1.198 0.344 0.228 0.642 0.634 0.582 0.4152009-10 0.082 0.259 1.045 0.317 0.231 0.593 0.665 0.558 0.4072010-11 0.071 0.294 0.909 0.308 0.215 0.587 0.637 0.475 0.3972011-12 0.062 0.293 0.877 0.304 0.221 0.556 0.693 0.540 0.4152012-13 0.053 0.317 0.802 0.295 0.212 0.492 0.668 0.480 0.4072013-14 0.053 0.321 0.735 0.280 0.216 0.467 0.634 0.590 0.4112014-15 0.050 0.381 0.703 0.332 0.201 0.439 0.747 0.604 0.4652015-16 0.062 0.395 0.657 0.328 0.227 0.407 0.732 0.533 0.4562016-17 0.096 0.393 0.612 0.327 0.167 0.373 0.590 0.457 (2) 0.4102017-18 0.068 0.389 0.600 0.356 0.217 0.348 0.648 0.406 0.4242018-19 0.068 0.337 0.591 0.390 0.146 0.333 0.594 0.382 0.393
Notes: These data should be read in conjunction with the explanatory notes and other expenditure tables in this publication.
Figure(s) may be incomplete for any period or jurisdiction due to some unavailable expenditure figures that are used to derive these numbers.
(1) Excludes community keno, from this period on.
(2) Figure includes Hong Kong Dollars program.
Percentage (%)
TAS VIC WA AUSTRALIAACT NSW NT QLD SA
Australian Gambling Statistics, 1993–94 to 2018–2019, 36th edition
79
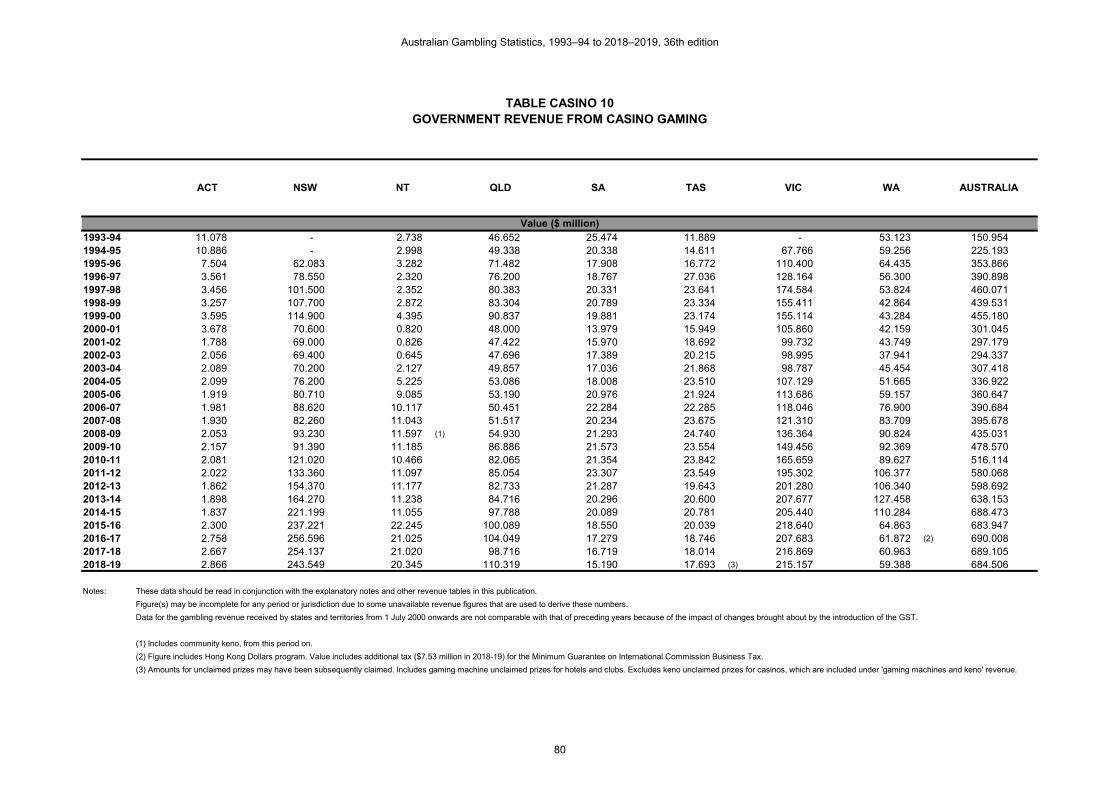
TABLE CASINO 10GOVERNMENT REVENUE FROM CASINO GAMING
1993-94 11.078 - 2.738 46.652 25.474 11.889 - 53.123 150.9541994-95 10.886 - 2.998 49.338 20.338 14.611 67.766 59.256 225.1931995-96 7.504 62.083 3.282 71.482 17.908 16.772 110.400 64.435 353.8661996-97 3.561 78.550 2.320 76.200 18.767 27.036 128.164 56.300 390.8981997-98 3.456 101.500 2.352 80.383 20.331 23.641 174.584 53.824 460.0711998-99 3.257 107.700 2.872 83.304 20.789 23.334 155.411 42.864 439.5311999-00 3.595 114.900 4.395 90.837 19.881 23.174 155.114 43.284 455.1802000-01 3.678 70.600 0.820 48.000 13.979 15.949 105.860 42.159 301.0452001-02 1.788 69.000 0.826 47.422 15.970 18.692 99.732 43.749 297.1792002-03 2.056 69.400 0.645 47.696 17.389 20.215 98.995 37.941 294.3372003-04 2.089 70.200 2.127 49.857 17.036 21.868 98.787 45.454 307.4182004-05 2.099 76.200 5.225 53.086 18.008 23.510 107.129 51.665 336.9222005-06 1.919 80.710 9.085 53.190 20.976 21.924 113.686 59.157 360.6472006-07 1.981 88.620 10.117 50.451 22.284 22.285 118.046 76.900 390.6842007-08 1.930 82.260 11.043 51.517 20.234 23.675 121.310 83.709 395.6782008-09 2.053 93.230 11.597 (1) 54.930 21.293 24.740 136.364 90.824 435.0312009-10 2.157 91.390 11.185 86.886 21.573 23.554 149.456 92.369 478.5702010-11 2.081 121.020 10.466 82.065 21.354 23.842 165.659 89.627 516.1142011-12 2.022 133.360 11.097 85.054 23.307 23.549 195.302 106.377 580.0682012-13 1.862 154.370 11.177 82.733 21.287 19.643 201.280 106.340 598.6922013-14 1.898 164.270 11.238 84.716 20.296 20.600 207.677 127.458 638.153
2014-15 1.837 221.199 11.055 97.788 20.089 20.781 205.440 110.284 688.473
2015-16 2.300 237.221 22.245 100.089 18.550 20.039 218.640 64.863 683.9472016-17 2.758 256.596 21.025 104.049 17.279 18.746 207.683 61.872 (2) 690.0082017-18 2.667 254.137 21.020 98.716 16.719 18.014 216.869 60.963 689.1052018-19 2.866 243.549 20.345 110.319 15.190 17.693 (3) 215.157 59.388 684.506
Notes: These data should be read in conjunction with the explanatory notes and other revenue tables in this publication.
Figure(s) may be incomplete for any period or jurisdiction due to some unavailable revenue figures that are used to derive these numbers.
Data for the gambling revenue received by states and territories from 1 July 2000 onwards are not comparable with that of preceding years because of the impact of changes brought about by the introduction of the GST.
(1) Includes community keno, from this period on.
(2) Figure includes Hong Kong Dollars program. Value includes additional tax ($7.53 million in 2018-19) for the Minimum Guarantee on International Commission Business Tax.
(3) Amounts for unclaimed prizes may have been subsequently claimed. Includes gaming machine unclaimed prizes for hotels and clubs. Excludes keno unclaimed prizes for casinos, which are included under 'gaming machines and keno' revenue.
AUSTRALIA
Value ($ million)
ACT NSW NT QLD SA TAS VIC WA
Australian Gambling Statistics, 1993–94 to 2018–2019, 36th edition
80

TABLE CASINO 11REAL GOVERNMENT REVENUE FROM CASINO GAMING
1993-94 20.586 - 5.088 86.694 47.338 22.093 - 98.719 280.5191994-95 19.591 - 5.395 88.793 36.602 26.295 121.957 106.642 405.2761995-96 12.953 107.166 5.665 123.390 30.912 28.951 190.569 111.226 610.8341996-97 6.064 133.769 3.951 129.767 31.960 46.042 218.261 95.878 665.6931997-98 5.886 172.853 4.005 136.891 34.623 40.260 297.314 91.661 783.4941998-99 5.481 181.247 4.833 140.192 34.986 39.269 261.540 72.135 739.6831999-00 5.911 188.906 7.226 149.344 32.686 38.100 255.022 71.163 748.3572000-01 5.702 109.449 1.271 74.413 21.671 24.725 164.112 65.358 466.7022001-02 2.695 104.001 1.245 71.478 24.071 28.174 150.323 65.941 447.9282002-03 3.008 101.520 0.944 69.771 25.437 29.571 144.812 55.501 430.5622003-04 2.983 100.248 3.037 71.198 24.328 31.228 141.071 64.910 439.0042004-05 2.928 106.289 7.288 74.048 25.119 32.793 149.431 72.066 469.9612005-06 2.594 109.112 12.281 71.908 28.357 29.639 153.692 79.974 487.5572006-07 2.601 116.358 13.284 66.242 29.259 29.260 154.995 100.970 512.9692007-08 2.452 104.520 14.031 65.458 25.709 30.081 154.137 106.361 502.7492008-09 2.530 114.876 14.290 (1) 67.684 26.237 30.484 168.025 111.912 536.0372009-10 2.596 109.996 13.462 104.575 25.965 28.349 179.883 111.174 576.0002010-11 2.430 141.335 12.223 95.840 24.938 27.844 193.467 104.672 602.7492011-12 2.307 152.164 12.662 97.047 26.593 26.869 222.840 121.376 661.8582012-13 2.077 172.176 12.467 92.276 23.742 21.909 224.497 118.606 667.7502013-14 2.062 178.507 12.212 92.058 22.055 22.385 225.676 138.504 693.459
2014-15 1.963 236.318 11.811 104.472 21.462 22.201 219.482 117.822 735.532
2015-16 2.423 249.925 23.436 105.450 19.543 21.112 230.349 68.337 720.5762016-17 2.856 265.677 21.769 107.731 17.891 19.409 215.033 64.062 (2) 714.4272017-18 2.710 258.210 21.357 100.298 16.987 18.303 220.345 61.940 700.1502018-19 2.866 243.549 20.345 110.319 15.190 17.693 (3) 215.157 59.388 684.506
Notes: These data should be read in conjunction with the explanatory notes and other revenue tables in this publication.
Figure(s) may be incomplete for any period or jurisdiction due to some unavailable revenue figures that are used to derive these numbers.
Data for the gambling revenue received by states and territories from 1 July 2000 onwards are not comparable with that of preceding years because of the impact of changes brought about by the introduction of the GST.
(1) Includes community keno, from this period on.
(2) Figure includes Hong Kong Dollars program. Value includes additional tax ($7.53 million in 2018-19) for the Minimum Guarantee on International Commission Business Tax.
(3) Amounts for unclaimed prizes may have been subsequently claimed. Includes gaming machine unclaimed prizes for hotels and clubs. Excludes keno unclaimed prizes for casinos, which are included under 'gaming machines and keno' revenue.
AUSTRALIA
Value ($ million)
ACT NSW NT QLD SA TAS VIC WA
Australian Gambling Statistics, 1993–94 to 2018–2019, 36th edition
81

TABLE CASINO 12PER CAPITA GOVERNMENT REVENUE FROM CASINO GAMING
1993-94 50.70 - 23.32 20.35 23.11 34.50 - 43.12 11.501994-95 49.10 - 24.86 21.00 18.38 42.19 20.18 47.14 16.941995-96 33.29 13.54 26.38 29.72 16.13 48.23 32.58 50.18 26.261996-97 15.61 16.90 18.07 31.06 16.82 77.49 37.43 42.94 28.621997-98 15.03 21.58 17.87 32.20 18.10 67.64 50.47 40.28 33.261998-99 14.02 22.62 21.38 32.83 18.37 66.65 44.43 31.51 31.381999-00 15.27 23.82 32.06 35.19 17.45 65.97 43.80 31.29 32.072000-01 15.36 14.43 5.88 18.25 12.18 45.23 29.48 29.97 20.902001-02 7.35 13.93 5.86 17.62 13.81 52.76 27.38 30.59 20.332002-03 8.33 13.87 4.56 17.25 14.91 56.48 26.79 26.09 19.852003-04 8.36 13.92 14.98 17.55 14.48 60.25 26.37 30.72 20.442004-05 8.30 14.99 36.28 18.22 15.17 64.01 28.19 34.28 22.082005-06 7.48 15.74 61.84 17.81 17.49 59.16 29.43 38.45 23.282006-07 7.58 17.07 67.26 16.47 18.35 59.56 29.99 48.73 24.772007-08 7.22 15.57 71.14 16.37 16.44 62.52 30.17 51.41 24.562008-09 7.53 17.33 72.10 (1) 16.99 17.06 64.43 33.11 53.92 26.392009-10 7.74 16.71 67.62 26.25 17.04 60.53 35.51 53.26 28.442010-11 7.31 21.83 62.28 24.33 16.68 60.63 38.69 50.29 30.172011-12 6.95 23.76 64.82 24.72 18.02 59.52 44.79 57.88 33.332012-13 6.28 27.12 63.44 23.55 16.29 49.46 45.18 56.22 33.772013-14 6.31 28.43 62.53 23.70 15.38 51.62 45.62 66.12 35.38
2014-15 6.01 37.71 60.95 26.96 15.08 51.78 44.16 56.61 37.59
2015-16 7.40 39.81 121.78 27.20 13.82 49.63 45.92 33.06 36.762016-17 8.70 42.32 114.42 27.81 12.78 46.00 42.55 31.35 (2) 36.462017-18 8.24 41.18 113.93 25.91 12.26 43.63 43.37 30.65 35.782018-19 8.70 38.85 110.47 28.42 11.04 42.23 (3) 42.04 29.58 34.94
Notes: These data should be read in conjunction with the explanatory notes and other revenue tables in this publication.
Figure(s) may be incomplete for any period or jurisdiction due to some unavailable revenue figures that are used to derive these numbers.
Data for the gambling revenue received by states and territories from 1 July 2000 onwards are not comparable with that of preceding years because of the impact of changes brought about by the introduction of the GST.
(1) Includes community keno, from this period on.
(2) Figure includes Hong Kong Dollars program. Value includes additional tax ($7.53 million in 2018-19) for the Minimum Guarantee on International Commission Business Tax.
(3) Amounts for unclaimed prizes may have been subsequently claimed. Includes gaming machine unclaimed prizes for hotels and clubs. Excludes keno unclaimed prizes for casinos, which are included under 'gaming machines and keno' revenue.
AUSTRALIA
Value ($)
ACT NSW NT QLD SA TAS VIC WA
Australian Gambling Statistics, 1993–94 to 2018–2019, 36th edition
82

TABLE CASINO 13REAL PER CAPITA GOVERNMENT REVENUE FROM CASINO GAMING
1993-94 94.22 - 43.34 37.82 42.95 64.11 - 80.13 21.371994-95 88.37 - 44.73 37.79 33.08 75.93 36.32 84.85 30.491995-96 57.46 23.37 45.53 51.31 27.84 83.25 56.24 86.63 45.341996-97 26.58 28.79 30.78 52.89 28.64 131.97 63.74 73.13 48.741997-98 25.59 36.75 30.43 54.84 30.82 115.19 85.95 68.59 56.641998-99 23.59 38.07 35.98 55.26 30.92 112.16 74.77 53.03 52.811999-00 25.10 39.16 52.71 57.86 28.68 108.47 72.01 51.45 52.722000-01 23.82 22.37 9.12 28.29 18.89 70.11 45.70 46.46 32.412001-02 11.07 20.99 8.83 26.56 20.82 79.52 41.26 46.10 30.652002-03 12.18 20.29 6.67 25.24 21.81 82.62 39.20 38.17 29.032003-04 11.93 19.88 21.39 25.07 20.68 86.03 37.65 43.87 29.182004-05 11.58 20.91 50.61 25.42 21.16 89.29 39.32 47.81 30.802005-06 10.12 21.28 83.60 24.08 23.64 79.97 39.79 51.98 31.482006-07 9.95 22.41 88.31 21.63 24.10 78.20 39.38 63.99 32.532007-08 9.18 19.79 90.39 20.80 20.89 79.44 38.33 65.32 31.212008-09 9.28 21.35 88.84 (1) 20.93 21.02 79.39 40.80 66.44 32.522009-10 9.31 20.11 81.39 31.59 20.51 72.85 42.74 64.10 34.242010-11 8.54 25.50 72.74 28.41 19.47 70.81 45.19 58.73 35.232011-12 7.93 27.11 73.96 28.20 20.56 67.91 51.10 66.04 38.032012-13 7.00 30.25 70.76 26.27 18.17 55.16 50.40 62.70 37.662013-14 6.85 30.90 67.95 25.75 16.71 56.09 49.57 71.85 38.45
2014-15 6.42 40.28 65.11 28.80 16.11 55.32 47.18 60.48 40.16
2015-16 7.79 41.95 128.30 28.66 14.56 52.29 48.38 34.83 38.732016-17 9.01 43.82 118.47 28.79 13.23 47.63 44.06 32.46 (2) 37.752017-18 8.37 41.84 115.75 26.32 12.46 44.32 44.07 31.14 36.352018-19 8.70 38.85 110.47 28.42 11.04 42.23 (3) 42.04 29.58 34.94
Notes: These data should be read in conjunction with the explanatory notes and other revenue tables in this publication.
Figure(s) may be incomplete for any period or jurisdiction due to some unavailable revenue figures that are used to derive these numbers.
Data for the gambling revenue received by states and territories from 1 July 2000 onwards are not comparable with that of preceding years because of the impact of changes brought about by the introduction of the GST.
(1) Includes community keno, from this period on.
(2) Figure includes Hong Kong Dollars program. Value includes additional tax ($7.53 million in 2018-19) for the Minimum Guarantee on International Commission Business Tax.
(3) Amounts for unclaimed prizes may have been subsequently claimed. Includes gaming machine unclaimed prizes for hotels and clubs. Excludes keno unclaimed prizes for casinos, which are included under 'gaming machines and keno' revenue.
Value ($)
TAS VIC WA AUSTRALIAACT NSW NT QLD SA
Australian Gambling Statistics, 1993–94 to 2018–2019, 36th edition
83

TABLE CASINO 14CASINO REVENUE
AS A % OF TOTAL STATE GAMBLING REVENUE
1993-94 23.37 - 20.27 13.90 19.56 26.39 - 28.571994-95 21.04 - 18.72 12.80 11.25 29.22 7.49 28.761995-96 14.16 5.22 16.21 17.16 7.96 32.19 10.50 28.101996-97 7.68 6.35 9.35 17.12 7.56 44.56 11.07 27.451997-98 6.87 7.53 8.32 15.81 7.18 37.56 13.47 24.821998-99 5.98 7.66 9.19 14.18 6.57 34.68 11.04 20.511999-00 5.79 7.45 11.81 14.80 5.83 31.51 10.20 20.692000-01 7.70 5.93 2.67 9.42 4.68 27.88 8.29 19.242001-02 3.97 5.76 2.49 8.42 5.23 29.15 7.28 19.572002-03 4.28 5.50 1.81 7.54 4.95 28.79 7.47 16.452003-04 3.72 5.34 5.55 6.93 4.35 28.70 7.46 18.252004-05 3.75 5.33 11.46 6.63 4.43 29.98 7.83 19.372005-06 3.61 5.30 16.47 6.32 5.16 29.20 7.89 20.882006-07 3.66 5.35 15.98 6.17 5.19 27.37 7.94 23.612007-08 3.23 5.30 15.49 5.85 4.89 27.52 7.74 26.122008-09 3.62 5.61 15.85 (1) 5.93 5.11 27.66 8.36 25.402009-10 3.60 6.44 18.46 9.42 5.28 26.37 9.28 25.702010-11 3.95 6.92 20.94 8.66 5.22 28.58 10.17 24.692011-12 3.79 7.44 20.88 8.47 5.57 28.22 11.42 26.562012-13 3.28 8.31 21.00 7.95 5.04 23.96 12.92 25.212013-14 3.46 8.70 19.36 8.10 5.32 25.08 13.74 28.832014-15 3.69 10.67 16.15 9.03 5.27 24.99 12.73 25.292015-16 4.56 10.78 26.49 8.78 4.87 23.63 13.01 16.682016-17 5.55 11.50 25.46 9.14 4.83 23.81 12.69 16.80 (2)
2017-18 5.45 10.91 22.28 8.31 4.25 23.33 12.73 16.802018-19 5.55 9.76 21.12 8.70 3.71 21.18 (3) 12.10 15.47
Notes: These data should be read in conjunction with the explanatory notes and other revenue tables in this publication.
Figure(s) may be incomplete for any period or jurisdiction due to some unavailable revenue figures that are used to derive these numbers.
Data for the gambling revenue received by states and territories from 1 July 2000 onwards are not comparable with that of preceding years because of the impact of changes brought about by the introduction of the GST.
(1) Includes community keno, from this period on.
(2) Figure includes Hong Kong Dollars program. Value includes additional tax ($7.53 million in 2018-19) for the Minimum Guarantee on International Commission Business Tax.
(3) Amounts for unclaimed prizes may have been subsequently claimed. Includes gaming machine unclaimed prizes for hotels and clubs. Excludes keno unclaimed prizes for casinos, which are included under 'gaming machines and keno' revenue.
Percentage (%)
TAS VIC WAACT NSW NT QLD SA
Australian Gambling Statistics, 1993–94 to 2018–2019, 36th edition
84

TABLE MINOR GAMING 1MINOR GAMING TURNOVER
1993-94 - - - 183.027 100.983 23.257 201.624 54.238 563.1291994-95 - - - 184.914 47.070 26.351 202.118 56.032 516.4851995-96 - - - 201.412 43.918 24.268 171.218 65.245 506.0611996-97 - - - 191.400 49.000 24.480 - U 64.520 329.4001997-98 - - - 235.303 57.300 20.729 - U 60.026 373.3581998-99 - - - 233.650 57.489 19.078 - U 60.726 370.9431999-00 - - - 129.000 35.951 17.340 - U 56.540 238.8312000-01 - - - - (2) 14.124 12.465 - U 53.843 80.4322001-02 - - - - 19.371 (3) 13.301 - U 50.129 82.8012002-03 - - - - 15.454 12.185 - U 50.683 78.3222003-04 - - - - 17.984 - (4) - U 51.509 69.4932004-05 - - - - 24.200 - - U 51.561 75.7612005-06 - - - - 23.026 - - U 49.290 72.3162006-07 - - - - 26.497 - - U 49.246 75.7432007-08 - - - - 19.058 - - U 51.884 70.9422008-09 - - - - - (5) - - U 54.010 54.0102009-10 - - - - - - - U 46.337 46.3372010-11 - - - - - - - U 56.699 56.6992011-12 - - - - - - - U 56.541 56.5412012-13 - - - - - - - U 58.521 58.5212013-14 - - - - - - - U 62.335 62.3352014-15 - - - - - - - U 53.699 53.6992015-16 - - - - - - - U 73.886 73.8862016-17 - - - - - - - U 79.887 79.8872017-18 - - - - - - - U 80.490 80.4902018-19 - - - - - - - U 74.216 74.216
Notes: These data should be read in conjunction with the explanatory notes and other turnover tables in this publication.
Figure(s) may be incomplete for any period or jurisdiction due to some unavailable turnover figures that are used to derive these numbers.
(1) NSW does not collect information relating to minor gaming.
(2) Reliable figures are no longer available since the introduction of the Charitable and Non-Profit Gaming Act 1999 .
(3) Turnover and expenditure figures do not include bingo and instant tickets as these data are no longer collected.
(4) Information on minor gaming turnover are no longer collected.
(5) From 1 Sept 2008, a licence is no longer required for lotteries where the total prize value does not exceed $5,000.
U = Unavailable data
NA = Not applicable
Value ($ million)
TAS VIC WA AUSTRALIAACT (NA) NSW (1) NT (NA) QLD SA
Australian Gambling Statistics, 1993–94 to 2018–2019, 36th edition
85

TABLE MINOR GAMING 2REAL MINOR GAMING TURNOVER
1993-94 - - - 340.120 187.657 43.219 374.679 100.791 1,046.4661994-95 - - - 332.787 84.711 47.423 363.749 100.840 929.5101995-96 - - - 347.672 75.810 41.891 295.552 112.624 873.5491996-97 - - - 325.951 83.446 41.690 - U 109.877 560.9641997-98 - - - 400.717 97.581 35.301 - U 102.223 635.8231998-99 - - - 393.207 96.748 32.106 - U 102.195 624.2571999-00 - - - 212.088 59.107 28.509 - U 92.957 392.6602000-01 - - - - (2) 21.896 19.324 - U 83.471 124.6912001-02 - - - - 29.197 (3) 20.048 - U 75.558 124.8032002-03 - - - - 22.606 17.824 - U 74.140 114.5712003-04 - - - - 25.682 - (4) - U 73.557 99.2382004-05 - - - - 33.756 - - U 71.921 105.6762005-06 - - - - 31.129 - - U 66.635 97.7642006-07 - - - - 34.791 - - U 64.660 99.4512007-08 - - - - 24.215 - - U 65.924 90.1392008-09 - - - - - (5) - - U 66.550 66.5502009-10 - - - - - - - U 55.771 55.7712010-11 - - - - - - - U 66.217 66.2172011-12 - - - - - - - U 64.513 64.5132012-13 - - - - - - - U 65.271 65.2712013-14 - - - - - - - U 67.737 67.7372014-15 - - - - - - - U 57.369 57.3692015-16 - - - - - - - U 77.843 77.8432016-17 - - - - - - - U 82.714 82.7142017-18 - - - - - - - U 81.780 81.7802018-19 - - - - - - - U 74.216 74.216
Notes: These data should be read in conjunction with the explanatory notes and other turnover tables in this publication.
Figure(s) may be incomplete for any period or jurisdiction due to some unavailable turnover figures that are used to derive these numbers.
(1) NSW does not collect information relating to minor gaming.
(2) Reliable figures are no longer available since the introduction of the Charitable and Non-Profit Gaming Act 1999 .
(3) Turnover and expenditure figures do not include bingo and instant tickets as these data are no longer collected.
(4) Information on minor gaming turnover are no longer collected.
(5) From 1 Sept 2008, a licence is no longer required for lotteries where the total prize value does not exceed $5,000.
U = Unavailable data
NA = Not applicable
Value ($ million)
TAS VIC WA AUSTRALIAACT (NA) NSW (1) NT (NA) QLD SA
Australian Gambling Statistics, 1993–94 to 2018–2019, 36th edition
86

TABLE MINOR GAMING 3PER CAPITA MINOR GAMING TURNOVER
1993-94 - - - 79.85 91.63 67.49 60.39 44.02 42.901994-95 - - - 78.70 42.54 76.09 60.19 44.58 38.861995-96 - - - 83.75 39.56 69.79 50.53 50.81 37.561996-97 - - - 78.01 43.91 70.17 - U 49.21 24.121997-98 - - - 94.27 51.00 59.31 - U 44.92 26.991998-99 - - - 92.09 50.81 54.49 - U 44.64 26.481999-00 - - - 49.98 31.55 49.37 - U 40.88 16.832000-01 - - - - (2) 12.31 35.35 - U 38.28 5.592001-02 - - - - 16.75 (3) 37.54 - U 35.05 5.672002-03 - - - - 13.25 34.05 - U 34.86 5.282003-04 - - - - 15.29 - (4) - U 34.82 4.622004-05 - - - - 20.38 - - U 34.21 4.972005-06 - - - - 19.19 - - U 32.04 4.672006-07 - - - - 21.82 - - U 31.21 4.802007-08 - - - - 15.49 - - U 31.86 4.402008-09 - - - - - (5) - - U 32.06 3.282009-10 - - - - - - - U 26.72 2.752010-11 - - - - - - - U 31.81 3.312011-12 - - - - - - - U 30.76 3.252012-13 - - - - - - - U 30.94 3.302013-14 - - - - - - - U 32.34 3.462014-15 - - - - - - - U 27.57 2.932015-16 - - - - - - - U 37.66 3.972016-17 - - - - - - - U 40.47 4.222017-18 - - - - - - - U 40.46 4.182018-19 - - - - - - - U 36.97 3.79
Notes: These data should be read in conjunction with the explanatory notes and other turnover tables in this publication.
Figure(s) may be incomplete for any period or jurisdiction due to some unavailable turnover figures that are used to derive these numbers.
(1) NSW does not collect information relating to minor gaming.
(2) Reliable figures are no longer available since the introduction of the Charitable and Non-Profit Gaming Act 1999 .
(3) Turnover and expenditure figures do not include bingo and instant tickets as these data are no longer collected.
(4) Information on minor gaming turnover are no longer collected.
(5) From 1 Sept 2008, a licence is no longer required for lotteries where the total prize value does not exceed $5,000.
U = Unavailable data
NA = Not applicable
Value ($)
TAS VIC WA AUSTRALIAACT (NA) NSW (1) NT (NA) QLD SA
Australian Gambling Statistics, 1993–94 to 2018–2019, 36th edition
87

TABLE MINOR GAMING 4REAL PER CAPITA MINOR GAMING TURNOVER
1993-94 - - - 148.39 170.28 125.42 112.23 81.81 79.721994-95 - - - 141.63 76.56 136.93 108.31 80.23 69.931995-96 - - - 144.56 68.28 120.46 87.22 87.71 64.831996-97 - - - 132.84 74.78 119.50 - U 83.81 41.071997-98 - - - 160.54 86.85 101.00 - U 76.49 45.971998-99 - - - 154.98 85.50 91.70 - U 75.13 44.571999-00 - - - 82.17 51.87 81.16 - U 67.21 27.662000-01 - - - - (2) 19.08 54.80 - U 59.34 8.662001-02 - - - - 25.25 (3) 56.58 - U 52.82 8.542002-03 - - - - 19.38 49.80 - U 50.99 7.732003-04 - - - - 21.83 - (4) - U 49.72 6.602004-05 - - - - 28.43 - - U 47.72 6.932005-06 - - - - 25.95 - - U 43.31 6.312006-07 - - - - 28.65 - - U 40.98 6.312007-08 - - - - 19.68 - - U 40.48 5.592008-09 - - - - - (5) - - U 39.51 4.042009-10 - - - - - - - U 32.16 3.312010-11 - - - - - - - U 37.15 3.872011-12 - - - - - - - U 35.10 3.712012-13 - - - - - - - U 34.51 3.682013-14 - - - - - - - U 35.14 3.762014-15 - - - - - - - U 29.45 3.132015-16 - - - - - - - U 39.68 4.182016-17 - - - - - - - U 41.90 4.372017-18 - - - - - - - U 41.11 4.252018-19 - - - - - - - U 36.97 3.79
Notes: These data should be read in conjunction with the explanatory notes and other turnover tables in this publication.
Figure(s) may be incomplete for any period or jurisdiction due to some unavailable turnover figures that are used to derive these numbers.
(1) NSW does not collect information relating to minor gaming.
(2) Reliable figures are no longer available since the introduction of the Charitable and Non-Profit Gaming Act 1999 .
(3) Turnover and expenditure figures do not include bingo and instant tickets as these data are no longer collected.
(4) Information on minor gaming turnover are no longer collected.
(5) From 1 Sept 2008, a licence is no longer required for lotteries where the total prize value does not exceed $5,000.
U = Unavailable data
NA = Not applicable
Value ($)
TAS VIC WA AUSTRALIAACT (NA) NSW (1) NT (NA) QLD SA
Australian Gambling Statistics, 1993–94 to 2018–2019, 36th edition
88

TABLE MINOR GAMING 5MINOR GAMING EXPENDITURE
1993-94 - - - 100.665 - 9.016 113.721 23.322 246.7241994-95 - - - 101.703 - 13.703 113.336 24.094 252.8351995-96 - - - 110.777 - 12.619 51.365 28.055 202.8161996-97 - - - 105.270 - 12.730 - U 27.744 145.7431997-98 - - - 129.417 - 10.779 - U 25.811 166.0071998-99 - - - 128.508 - 9.921 - U 26.112 164.5411999-00 - - - - (2) - 9.017 - U 24.312 33.3292000-01 - - - - - 6.482 - U 23.152 29.6342001-02 - - - - - 6.709 - U 21.555 28.2642002-03 - - - - - 5.873 - U 21.793 27.6662003-04 - - - - - - (3) - U 22.149 22.1492004-05 - - - - - - - U 22.171 22.1712005-06 - - - - - - - U 21.195 21.1952006-07 - - - - - - - U 21.176 21.1762007-08 - - - - - - - U 22.310 22.3102008-09 - - - - - - - U 23.224 23.2242009-10 - - - - - - - U 19.925 19.9252010-11 - - - - - - - U 24.806 24.8062011-12 - - - - - - - U 24.312 24.3122012-13 - - - - - - - U 25.164 25.1642013-14 - - - - - - - U 26.804 26.8042014-15 - - - - - - - U 23.090 23.0902015-16 - - - - - - - U 31.770 31.7702016-17 - - - - - - - U 34.350 34.3502017-18 - - - - - - - U 34.610 34.6102018-19 - - - - - - - U 31.913 31.913
Notes: These data should be read in conjunction with the explanatory notes and other expenditure tables in this publication.
Figure(s) may be incomplete for any period or jurisdiction due to some unavailable expenditure figures that are used to derive these numbers.
(1) NSW does not collect information relating to minor gaming.
(2) Reliable figures are no longer available since the introduction of the Charitable and Non-Profit Gaming Act 1999 .
(3) Data on minor gaming turnover are no longer collected, and therefore an estimate of expenditure can no longer be made.
NA = Not applicable
U = Unavailable data
Value ($ million)
TAS VIC WA AUSTRALIAACT (NA) NSW (1) NT (NA) QLD SA (NA)
Australian Gambling Statistics, 1993–94 to 2018–2019, 36th edition
89

TABLE MINOR GAMING 6REAL MINOR GAMING EXPENDITURE
1993-94 - - - 187.066 - 16.754 211.328 43.340 458.4891994-95 - - - 183.033 - 24.660 203.969 43.361 455.0231995-96 - - - 191.220 - 21.783 88.665 48.428 350.0961996-97 - - - 179.273 - 21.679 - U 47.247 248.1991997-98 - - - 220.395 - 18.356 - U 43.956 282.7071998-99 - - - 216.265 - 16.696 - U 43.944 276.9051999-00 - - - - (2) - 14.824 - U 39.971 54.7962000-01 - - - - - 10.049 - U 35.892 45.9402001-02 - - - - - 10.112 - U 32.489 42.6012002-03 - - - - - 8.591 - U 31.879 40.4702003-04 - - - - - - (3) - U 31.630 31.6302004-05 - - - - - - - U 30.926 30.9262005-06 - - - - - - - U 28.653 28.6532006-07 - - - - - - - U 27.804 27.8042007-08 - - - - - - - U 28.347 28.3472008-09 - - - - - - - U 28.616 28.6162009-10 - - - - - - - U 23.981 23.9812010-11 - - - - - - - U 28.970 28.9702011-12 - - - - - - - U 27.740 27.7402012-13 - - - - - - - U 28.067 28.0672013-14 - - - - - - - U 29.127 29.1272014-15 - - - - - - - U 24.668 24.6682015-16 - - - - - - - U 33.471 33.4712016-17 - - - - - - - U 35.566 35.5662017-18 - - - - - - - U 35.165 35.1652018-19 - - - - - - - U 31.913 31.913
Notes: These data should be read in conjunction with the explanatory notes and other expenditure tables in this publication.
Figure(s) may be incomplete for any period or jurisdiction due to some unavailable expenditure figures that are used to derive these numbers.
(1) NSW does not collect information relating to minor gaming.
(2) Reliable figures are no longer available since the introduction of the Charitable and Non-Profit Gaming Act 1999 .
(3) Data on minor gaming turnover are no longer collected, and therefore an estimate of expenditure can no longer be made.
NA = Not applicable
U = Unavailable data
Value ($ million)
TAS VIC WA AUSTRALIAACT (NA) NSW (1) NT (NA) QLD SA (NA)
Australian Gambling Statistics, 1993–94 to 2018–2019, 36th edition
90

TABLE MINOR GAMING 7PER CAPITA MINOR GAMING EXPENDITURE
1993-94 - - - 43.92 - 26.16 34.06 18.93 18.801994-95 - - - 43.28 - 39.56 33.75 19.17 19.021995-96 - - - 46.06 - 36.29 15.16 21.85 15.051996-97 - - - 42.90 - 36.49 - U 21.16 10.671997-98 - - - 51.85 - 30.84 - U 19.31 12.001998-99 - - - 50.65 - 28.34 - U 19.20 11.751999-00 - - - - (2) - 25.67 - U 17.58 2.352000-01 - - - - - 18.38 - U 16.46 2.062001-02 - - - - - 18.94 - U 15.07 1.932002-03 - - - - - 16.41 - U 14.99 1.872003-04 - - - - - - (3) - U 14.97 1.472004-05 - - - - - - - U 14.71 1.452005-06 - - - - - - - U 13.78 1.372006-07 - - - - - - - U 13.42 1.342007-08 - - - - - - - U 13.70 1.382008-09 - - - - - - - U 13.79 1.412009-10 - - - - - - - U 11.49 1.182010-11 - - - - - - - U 13.92 1.452011-12 - - - - - - - U 13.23 1.402012-13 - - - - - - - U 13.30 1.422013-14 - - - - - - - U 13.90 1.492014-15 - - - - - - - U 11.85 1.262015-16 - - - - - - - U 16.19 1.712016-17 - - - - - - - U 17.40 1.822017-18 - - - - - - - U 17.40 1.802018-19 - - - - - - - U 15.90 1.63
Notes: These data should be read in conjunction with the explanatory notes and other expenditure tables in this publication.
Figure(s) may be incomplete for any period or jurisdiction due to some unavailable expenditure figures that are used to derive these numbers.
(1) NSW does not collect information relating to minor gaming.
(2) Reliable figures are no longer available since the introduction of the Charitable and Non-Profit Gaming Act 1999 .
(3) Data on minor gaming turnover are no longer collected, and therefore an estimate of expenditure can no longer be made.
NA = Not applicable
U = Unavailable data
Value ($)
TAS VIC WA AUSTRALIAACT (NA) NSW (1) NT (NA) QLD SA (NA)
Australian Gambling Statistics, 1993–94 to 2018–2019, 36th edition
91

TABLE MINOR GAMING 8REAL PER CAPITA MINOR GAMING EXPENDITURE
1993-94 - - - 81.61 - 48.62 63.30 35.18 34.931994-95 - - - 77.90 - 71.20 60.74 34.50 34.231995-96 - - - 79.51 - 62.64 26.17 37.72 25.981996-97 - - - 73.06 - 62.14 - U 36.04 18.171997-98 - - - 88.30 - 52.52 - U 32.89 20.441998-99 - - - 85.24 - 47.69 - U 32.31 19.771999-00 - - - - (2) - 42.20 - U 28.90 3.862000-01 - - - - - 28.49 - U 25.52 3.192001-02 - - - - - 28.54 - U 22.71 2.912002-03 - - - - - 24.00 - U 21.93 2.732003-04 - - - - - - (3) - U 21.38 2.102004-05 - - - - - - - U 20.52 2.032005-06 - - - - - - - U 18.63 1.852006-07 - - - - - - - U 17.62 1.762007-08 - - - - - - - U 17.41 1.762008-09 - - - - - - - U 16.99 1.742009-10 - - - - - - - U 13.83 1.432010-11 - - - - - - - U 16.26 1.692011-12 - - - - - - - U 15.09 1.592012-13 - - - - - - - U 14.84 1.582013-14 - - - - - - - U 15.11 1.622014-15 - - - - - - - U 12.66 1.352015-16 - - - - - - - U 17.06 1.802016-17 - - - - - - - U 18.02 1.882017-18 - - - - - - - U 17.68 1.832018-19 - - - - - - - U 15.90 1.63
Notes: These data should be read in conjunction with the explanatory notes and other expenditure tables in this publication.
Figure(s) may be incomplete for any period or jurisdiction due to some unavailable expenditure figures that are used to derive these numbers.
(1) NSW does not collect information relating to minor gaming.
(2) Reliable figures are no longer available since the introduction of the Charitable and Non-Profit Gaming Act 1999 .
(3) Data on minor gaming turnover are no longer collected, and therefore an estimate of expenditure can no longer be made.
NA = Not applicable
U = Unavailable data
Value ($)
TAS VIC WA AUSTRALIAACT (NA) NSW (1) NT (NA) QLD SA (NA)
Australian Gambling Statistics, 1993–94 to 2018–2019, 36th edition
92

TABLE MINOR GAMING 9MINOR GAMING EXPENDITURE AS A % OF HOUSEHOLD DISPOSABLE INCOME
(ALL STATES AND TERRITORIES)
1993-94 - - - 0.196 - 0.131 0.149 0.083 0.0791994-95 - - - 0.185 - 0.189 0.142 0.080 0.0771995-96 - - - 0.190 - 0.166 0.061 0.088 0.0581996-97 - - - 0.167 - 0.164 - U 0.083 0.0391997-98 - - - 0.198 - 0.136 - U 0.074 0.0431998-99 - - - 0.190 - 0.124 - U 0.071 0.0411999-00 - - - - (2) - 0.107 - U 0.062 0.0082000-01 - - - - - 0.074 - U 0.056 0.0062001-02 - - - - - 0.068 - U 0.045 0.0062002-03 - - - - - 0.058 - U 0.044 0.0052003-04 - - - - - - (3) - U 0.041 0.0042004-05 - - - - - - - U 0.038 0.0042005-06 - - - - - - - U 0.035 0.0032006-07 - - - - - - - U 0.030 0.0032007-08 - - - - - - - U 0.027 0.0032008-09 - - - - - - - U 0.025 0.0032009-10 - - - - - - - U 0.021 0.0022010-11 - - - - - - - U 0.023 0.0032011-12 - - - - - - - U 0.021 0.0022012-13 - - - - - - - U 0.020 0.0022013-14 - - - - - - - U 0.020 0.0032014-15 - - - - - - - U 0.017 0.0022015-16 - - - - - - - U 0.023 0.0032016-17 - - - - - - - U 0.025 0.0032017-18 - - - - - - - U 0.025 0.0032018-19 - - - - - - - U 0.023 0.003
Notes: These data should be read in conjunction with the explanatory notes and other expenditure tables in this publication.
Figure(s) may be incomplete for any period or jurisdiction due to some unavailable expenditure figures that are used to derive these numbers.
(1) NSW does not collect information relating to minor gaming.
(2) Reliable figures are no longer available since the introduction of the Charitable and Non-Profit Gaming Act 1999 .
(3) Data on minor gaming turnover are no longer collected, and therefore an estimate of expenditure can no longer be made.
NA = Not applicable
U = Unavailable data
Percentage (%)
TAS VIC WA AUSTRALIAACT (NA) NSW (1) NT (NA) QLD SA (NA)
Australian Gambling Statistics, 1993–94 to 2018–2019, 36th edition
93

TABLE MINOR GAMING 10GOVERNMENT REVENUE FROM MINOR GAMING
1993-94 0.501 - - 3.492 - 1.046 8.407 0.524 13.9701994-95 0.566 - - 3.536 - 1.179 7.030 0.528 12.8391995-96 0.635 - - 3.851 - 0.998 6.874 0.464 12.8221996-97 0.690 - - 3.569 - 0.992 4.141 0.510 9.9021997-98 0.863 - - 2.875 - 0.847 1.058 0.500 6.1431998-99 0.910 - - 2.965 - 0.742 0.334 0.515 5.4661999-00 1.996 - - 0.382 - 0.649 0.372 0.496 3.8952000-01 1.445 - - 0.043 - 0.405 0.390 0.505 2.7882001-02 1.387 - - - (2) - 0.245 0.361 0.482 2.4752002-03 1.477 - - - - 0.273 0.406 0.481 2.6372003-04 1.681 - - - - 0.283 0.391 0.479 2.8342004-05 1.644 - - - - 0.053 0.415 0.471 2.5832005-06 - - - - - 0.021 1.138 0.472 1.6312006-07 - - - - - - (3) 1.185 0.532 1.7172007-08 - - - - - - 1.305 0.581 1.8862008-09 - - - - - - 1.295 0.638 1.9332009-10 - - - - - - 1.184 0.618 1.8022010-11 - - - - - - - U 0.686 0.6862011-12 - - - - - - - U 0.694 0.6942012-13 - - - - - - - U 0.633 0.6332013-14 - - - - - - - U 0.691 0.6912014-15 - - - - - - - U 0.654 0.6542015-16 - - - - - - - U 0.769 0.7692016-17 - - - - - - - U 0.768 0.7682017-18 - - - - - - - U 0.759 0.7592018-19 - - - - - - - U 0.837 0.837
Notes: These data should be read in conjunction with the explanatory notes and other revenue tables in this publication.
Figure(s) may be incomplete for any period or jurisdiction due to some unavailable revenue figures that are used to derive these numbers.
Data for the gambling revenue received by states and territories from 1 July 2000 onwards are not comparable with that of preceding years because of the
impact of changes brought about by the introduction of the GST.
(1) NSW does not collect information relating to Minor Gaming.
(2) Reliable figures are no longer available since the introduction of the Charitable and Non-Profit Gaming Act 1999 .
(3) Minor gaming revenue was incorrectly reported in previous years. No tax is received for minor gaming activities, only income is from application fees.
NA = Not applicable
U = Unavailable data
Value ($ million)
TAS VIC WA AUSTRALIAACT NSW (1) NT (NA) QLD SA (NA)
Australian Gambling Statistics, 1993–94 to 2018–2019, 36th edition
94

TABLE MINOR GAMING 11REAL GOVERNMENT REVENUE FROM MINOR GAMING
1993-94 0.931 - - 6.489 - 1.944 15.623 0.974 25.9611994-95 1.019 - - 6.364 - 2.122 12.652 0.950 23.1061995-96 1.096 - - 6.647 - 1.723 11.866 0.801 22.1331996-97 1.175 - - 6.078 - 1.689 7.052 0.869 16.8631997-98 1.470 - - 4.896 - 1.442 1.802 0.851 10.4611998-99 1.531 - - 4.990 - 1.249 0.562 0.867 9.1991999-00 3.282 - - 0.628 - 1.067 0.612 0.815 6.4042000-01 2.240 - - 0.067 - 0.628 0.605 0.783 4.3222001-02 2.091 - - - (2) - 0.369 0.544 0.727 3.7302002-03 2.161 - - - - 0.399 0.594 0.704 3.8572003-04 2.401 - - - - 0.404 0.558 0.684 4.0472004-05 2.293 - - - - 0.074 0.579 0.657 3.6032005-06 - - - - - 0.028 1.538 0.638 2.2052006-07 - - - - - - (3) 1.556 0.699 2.2542007-08 - - - - - - 1.658 0.738 2.3962008-09 - - - - - - 1.596 0.786 2.3822009-10 - - - - - - 1.425 0.744 2.1692010-11 - - - - - - - U 0.801 0.8012011-12 - - - - - - - U 0.792 0.7922012-13 - - - - - - - U 0.706 0.7062013-14 - - - - - - - U 0.751 0.7512014-15 - - - - - - - U 0.699 0.6992015-16 - - - - - - - U 0.810 0.8102016-17 - - - - - - - U 0.795 0.7952017-18 - - - - - - - U 0.771 0.7712018-19 - - - - - - - U 0.837 0.837
Notes: These data should be read in conjunction with the explanatory notes and other revenue tables in this publication.
Figure(s) may be incomplete for any period or jurisdiction due to some unavailable revenue figures that are used to derive these numbers.
Data for the gambling revenue received by states and territories from 1 July 2000 onwards are not comparable with that of preceding years because of the
impact of changes brought about by the introduction of the GST.
(1) NSW does not collect information relating to Minor Gaming.
(2) Reliable figures are no longer available since the introduction of the Charitable and Non-Profit Gaming Act 1999 .
(3) Minor gaming revenue was incorrectly reported in previous years. No tax is received for minor gaming activities, only income is from application fees.
NA = Not applicable
U = Unavailable data
Value ($ million)
TAS VIC WA AUSTRALIAACT NSW (1) NT (NA) QLD SA (NA)
Australian Gambling Statistics, 1993–94 to 2018–2019, 36th edition
95
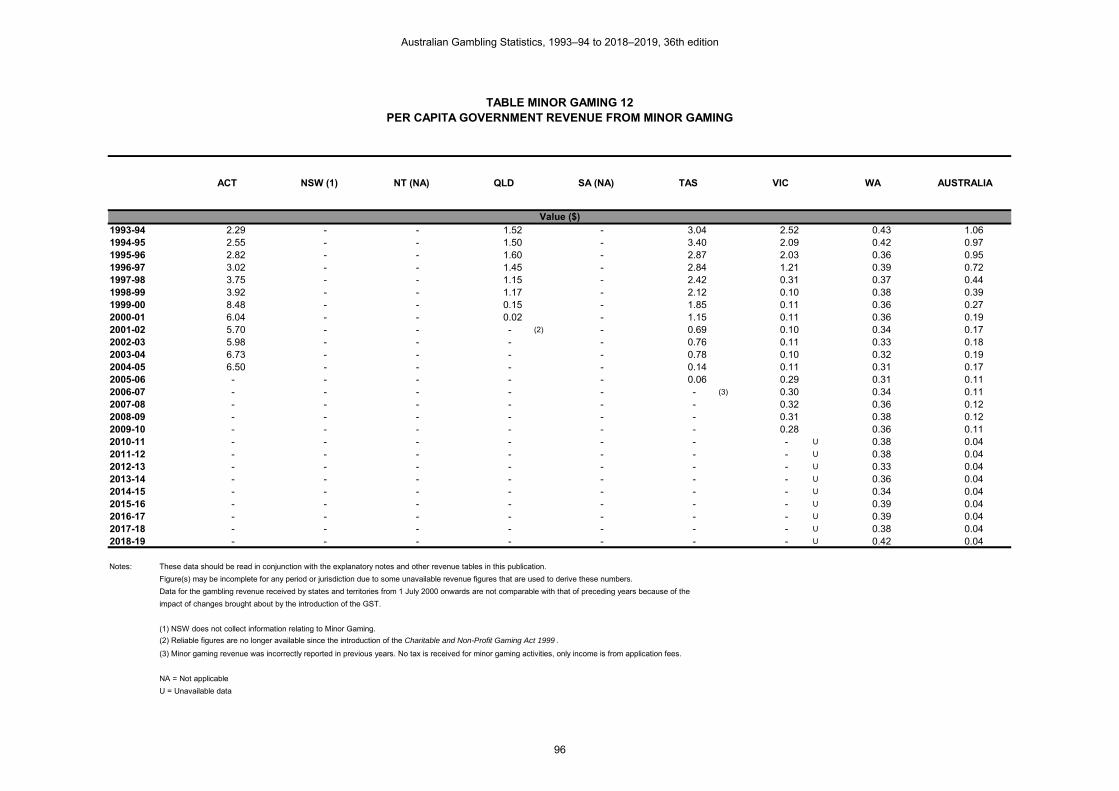
TABLE MINOR GAMING 12PER CAPITA GOVERNMENT REVENUE FROM MINOR GAMING
1993-94 2.29 - - 1.52 - 3.04 2.52 0.43 1.061994-95 2.55 - - 1.50 - 3.40 2.09 0.42 0.971995-96 2.82 - - 1.60 - 2.87 2.03 0.36 0.951996-97 3.02 - - 1.45 - 2.84 1.21 0.39 0.721997-98 3.75 - - 1.15 - 2.42 0.31 0.37 0.441998-99 3.92 - - 1.17 - 2.12 0.10 0.38 0.391999-00 8.48 - - 0.15 - 1.85 0.11 0.36 0.272000-01 6.04 - - 0.02 - 1.15 0.11 0.36 0.192001-02 5.70 - - - (2) - 0.69 0.10 0.34 0.172002-03 5.98 - - - - 0.76 0.11 0.33 0.182003-04 6.73 - - - - 0.78 0.10 0.32 0.192004-05 6.50 - - - - 0.14 0.11 0.31 0.172005-06 - - - - - 0.06 0.29 0.31 0.112006-07 - - - - - - (3) 0.30 0.34 0.112007-08 - - - - - - 0.32 0.36 0.122008-09 - - - - - - 0.31 0.38 0.122009-10 - - - - - - 0.28 0.36 0.112010-11 - - - - - - - U 0.38 0.042011-12 - - - - - - - U 0.38 0.042012-13 - - - - - - - U 0.33 0.042013-14 - - - - - - - U 0.36 0.042014-15 - - - - - - - U 0.34 0.042015-16 - - - - - - - U 0.39 0.042016-17 - - - - - - - U 0.39 0.042017-18 - - - - - - - U 0.38 0.042018-19 - - - - - - - U 0.42 0.04
Notes: These data should be read in conjunction with the explanatory notes and other revenue tables in this publication.
Figure(s) may be incomplete for any period or jurisdiction due to some unavailable revenue figures that are used to derive these numbers.
Data for the gambling revenue received by states and territories from 1 July 2000 onwards are not comparable with that of preceding years because of the
impact of changes brought about by the introduction of the GST.
(1) NSW does not collect information relating to Minor Gaming.
(2) Reliable figures are no longer available since the introduction of the Charitable and Non-Profit Gaming Act 1999 .
(3) Minor gaming revenue was incorrectly reported in previous years. No tax is received for minor gaming activities, only income is from application fees.
NA = Not applicable
U = Unavailable data
Value ($)
TAS VIC WA AUSTRALIAACT NSW (1) NT (NA) QLD SA (NA)
Australian Gambling Statistics, 1993–94 to 2018–2019, 36th edition
96

TABLE MINOR GAMING 13REAL PER CAPITA GOVERNMENT REVENUE FROM MINOR GAMING
1993-94 4.26 - - 2.83 - 5.64 4.68 0.79 1.981994-95 4.59 - - 2.71 - 6.13 3.77 0.76 1.741995-96 4.86 - - 2.76 - 4.95 3.50 0.62 1.641996-97 5.15 - - 2.48 - 4.84 2.06 0.66 1.231997-98 6.39 - - 1.96 - 4.13 0.52 0.64 0.761998-99 6.59 - - 1.97 - 3.57 0.16 0.64 0.661999-00 13.94 - - 0.24 - 3.04 0.17 0.59 0.452000-01 9.36 - - 0.03 - 1.78 0.17 0.56 0.302001-02 8.59 - - - (2) - 1.04 0.15 0.51 0.262002-03 8.75 - - - - 1.12 0.16 0.48 0.262003-04 9.60 - - - - 1.11 0.15 0.46 0.272004-05 9.07 - - - - 0.20 0.15 0.44 0.242005-06 - - - - - 0.08 0.40 0.41 0.142006-07 - - - - - - (3) 0.40 0.44 0.142007-08 - - - - - - 0.41 0.45 0.152008-09 - - - - - - 0.39 0.47 0.142009-10 - - - - - - 0.34 0.43 0.132010-11 - - - - - - - U 0.45 0.052011-12 - - - - - - - U 0.43 0.052012-13 - - - - - - - U 0.37 0.042013-14 - - - - - - - U 0.39 0.042014-15 - - - - - - - U 0.36 0.042015-16 - - - - - - - U 0.41 0.042016-17 - - - - - - - U 0.40 0.042017-18 - - - - - - - U 0.39 0.042018-19 - - - - - - - U 0.42 0.04
Notes: These data should be read in conjunction with the explanatory notes and other revenue tables in this publication.
Figure(s) may be incomplete for any period or jurisdiction due to some unavailable revenue figures that are used to derive these numbers.
Data for the gambling revenue received by states and territories from 1 July 2000 onwards are not comparable with that of preceding years because of the
impact of changes brought about by the introduction of the GST.
(1) NSW does not collect information relating to Minor Gaming.
(2) Reliable figures are no longer available since the introduction of the Charitable and Non-Profit Gaming Act 1999 .
(3) Minor gaming revenue was incorrectly reported in previous years. No tax is received for minor gaming activities, only income is from application fees.
NA = Not applicable
U = Unavailable data
Value ($)
TAS VIC WA AUSTRALIAACT NSW (1) NT (NA) QLD SA (NA)
Australian Gambling Statistics, 1993–94 to 2018–2019, 36th edition
97

TABLE MINOR GAMING 14MINOR GAMING REVENUE
AS A % OF TOTAL STATE GAMBLING REVENUE
1993-94 1.06 - - 1.04 - 2.32 1.13 0.281994-95 1.09 - - 0.92 - 2.36 0.78 0.261995-96 1.20 - - 0.92 - 1.92 0.65 0.201996-97 1.49 - - 0.80 - 1.63 0.36 0.251997-98 1.71 - - 0.57 - 1.35 0.08 0.231998-99 1.67 - - 0.50 - 1.10 0.02 0.251999-00 3.22 - - 0.06 - 0.88 0.02 0.242000-01 3.03 - - 0.01 - 0.71 0.03 0.232001-02 3.08 - - - (2) - 0.38 0.03 0.222002-03 3.08 - - - - 0.39 0.03 0.212003-04 2.99 - - - - 0.37 0.03 0.192004-05 2.94 - - - - 0.07 0.03 0.182005-06 - - - - - 0.03 0.08 0.172006-07 - - - - - - (3) 0.08 0.162007-08 - - - - - - 0.08 0.182008-09 - - - - - - 0.08 0.182009-10 - - - - - - 0.07 0.172010-11 - - - - - - - U 0.192011-12 - - - - - - - U 0.172012-13 - - - - - - - U 0.152013-14 - - - - - - - U 0.162014-15 - - - - - - - U 0.152015-16 - - - - - - - U 0.202016-17 - - - - - - - U 0.212017-18 - - - - - - - U 0.212018-19 - - - - - - - U 0.22
Notes: These data should be read in conjunction with the explanatory notes and other revenue tables in this publication.
Figure(s) may be incomplete for any period or jurisdiction due to some unavailable revenue figures that are used to derive these numbers.
Data for the gambling revenue received by states and territories from 1 July 2000 onwards are not comparable with that of preceding years because of the
impact of changes brought about by the introduction of the GST.
(1) NSW does not collect information relating to Minor Gaming.
(2) Reliable figures are no longer available since the introduction of the Charitable and Non-Profit Gaming Act 1999 .
(3) Minor gaming revenue was incorrectly reported in previous years. No tax is received for minor gaming activities, only income is from application fees.
NA = Not applicable
U = Unavailable data
Percentage (%)
ACT NSW (1) NT (NA) QLD SA (NA) TAS VIC WA
Australian Gambling Statistics, 1993–94 to 2018–2019, 36th edition
98
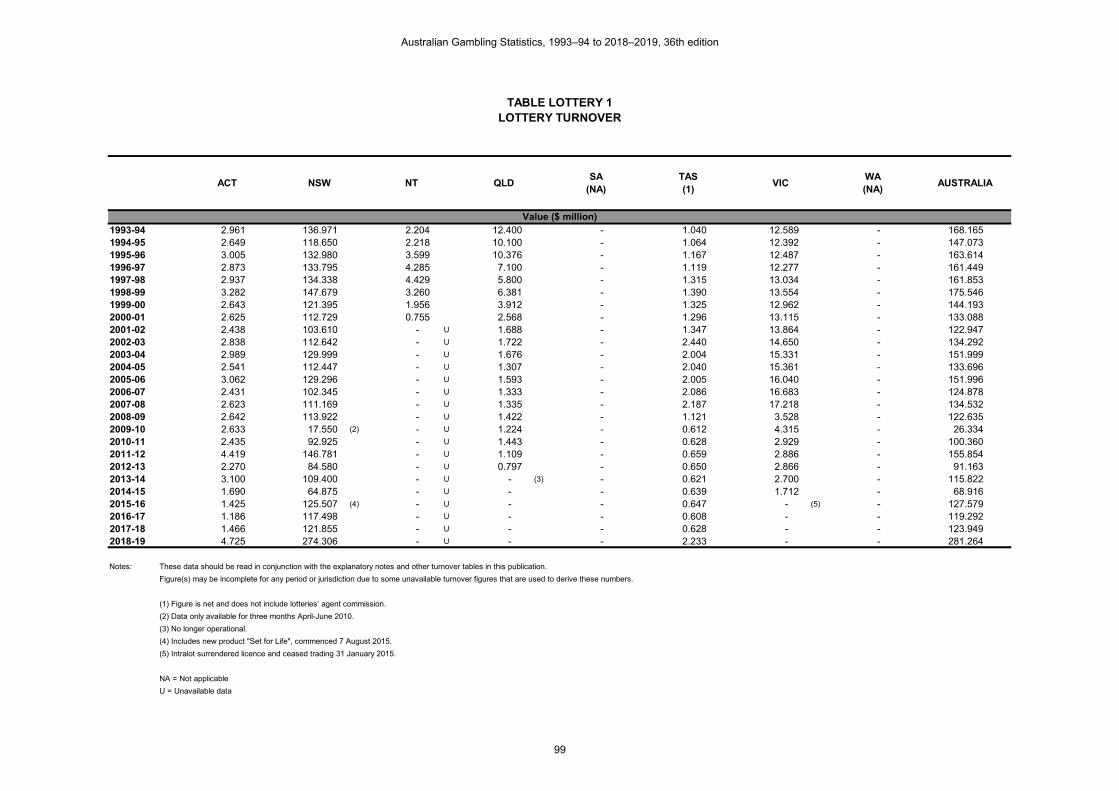
TABLE LOTTERY 1LOTTERY TURNOVER
1993-94 2.961 136.971 2.204 12.400 - 1.040 12.589 - 168.1651994-95 2.649 118.650 2.218 10.100 - 1.064 12.392 - 147.0731995-96 3.005 132.980 3.599 10.376 - 1.167 12.487 - 163.6141996-97 2.873 133.795 4.285 7.100 - 1.119 12.277 - 161.4491997-98 2.937 134.338 4.429 5.800 - 1.315 13.034 - 161.8531998-99 3.282 147.679 3.260 6.381 - 1.390 13.554 - 175.5461999-00 2.643 121.395 1.956 3.912 - 1.325 12.962 - 144.1932000-01 2.625 112.729 0.755 2.568 - 1.296 13.115 - 133.0882001-02 2.438 103.610 - U 1.688 - 1.347 13.864 - 122.9472002-03 2.838 112.642 - U 1.722 - 2.440 14.650 - 134.2922003-04 2.989 129.999 - U 1.676 - 2.004 15.331 - 151.9992004-05 2.541 112.447 - U 1.307 - 2.040 15.361 - 133.6962005-06 3.062 129.296 - U 1.593 - 2.005 16.040 - 151.9962006-07 2.431 102.345 - U 1.333 - 2.086 16.683 - 124.8782007-08 2.623 111.169 - U 1.335 - 2.187 17.218 - 134.5322008-09 2.642 113.922 - U 1.422 - 1.121 3.528 - 122.6352009-10 2.633 17.550 (2) - U 1.224 - 0.612 4.315 - 26.3342010-11 2.435 92.925 - U 1.443 - 0.628 2.929 - 100.3602011-12 4.419 146.781 - U 1.109 - 0.659 2.886 - 155.8542012-13 2.270 84.580 - U 0.797 - 0.650 2.866 - 91.1632013-14 3.100 109.400 - U - (3) - 0.621 2.700 - 115.8222014-15 1.690 64.875 - U - - 0.639 1.712 - 68.9162015-16 1.425 125.507 (4) - U - - 0.647 - (5) - 127.5792016-17 1.186 117.498 - U - - 0.608 - - 119.2922017-18 1.466 121.855 - U - - 0.628 - - 123.9492018-19 4.725 274.306 - U - - 2.233 - - 281.264
Notes: These data should be read in conjunction with the explanatory notes and other turnover tables in this publication.
Figure(s) may be incomplete for any period or jurisdiction due to some unavailable turnover figures that are used to derive these numbers.
(1) Figure is net and does not include lotteries’ agent commission.
(2) Data only available for three months April-June 2010.
(3) No longer operational.
(4) Includes new product "Set for Life", commenced 7 August 2015.
(5) Intralot surrendered licence and ceased trading 31 January 2015.
NA = Not applicable
U = Unavailable data
Value ($ million)
TAS (1)
VICWA(NA)
AUSTRALIAACT NSW NT QLDSA
(NA)
Australian Gambling Statistics, 1993–94 to 2018–2019, 36th edition
99

TABLE LOTTERY 2REAL LOTTERY TURNOVER
1993-94 5.502 254.534 4.096 23.043 - 1.933 23.394 - 312.5021994-95 4.767 213.533 3.992 18.177 - 1.915 22.302 - 264.6851995-96 5.187 229.546 6.212 17.911 - 2.014 21.555 - 282.4261996-97 4.893 227.851 7.297 12.091 - 1.906 20.908 - 274.9451997-98 5.002 228.776 7.543 9.877 - 2.239 22.197 - 275.6331998-99 5.523 248.528 5.486 10.739 - 2.339 22.810 - 295.4251999-00 4.345 199.585 3.216 6.432 - 2.179 21.311 - 237.0672000-01 4.069 174.761 1.170 3.981 - 2.009 20.332 - 206.3232001-02 3.675 156.168 - U 2.544 - 2.030 20.897 - 185.3142002-03 4.151 164.775 - U 2.519 - 3.569 21.430 - 196.4452003-04 4.268 185.643 - U 2.393 - 2.862 21.893 - 217.0602004-05 3.544 156.848 - U 1.823 - 2.846 21.427 - 186.4882005-06 4.140 174.795 - U 2.154 - 2.711 21.684 - 205.4832006-07 3.192 134.379 - U 1.750 - 2.739 21.905 - 163.9652007-08 3.333 141.251 - U 1.696 - 2.779 21.877 - 170.9372008-09 3.255 140.373 - U 1.752 - 1.381 4.347 - 151.1092009-10 3.169 21.123 (2) - U 1.473 - 0.737 5.193 - 31.6952010-11 2.844 108.523 - U 1.685 - 0.733 3.421 - 117.2072011-12 5.042 167.477 - U 1.265 - 0.752 3.293 - 177.8292012-13 2.532 94.336 - U 0.889 - 0.725 3.197 - 101.6782013-14 3.369 118.882 - U - (3) - 0.675 2.934 - 125.8602014-15 1.806 69.309 - U - - 0.682 1.829 - 73.6262015-16 1.501 132.229 (4) - U - - 0.681 - (5) - 134.4112016-17 1.228 121.656 - U - - 0.629 - - 123.5142017-18 1.489 123.808 - U - - 0.638 - - 125.9352018-19 4.725 274.306 - U - - 2.233 - - 281.264
Notes: These data should be read in conjunction with the explanatory notes and other turnover tables in this publication.
Figure(s) may be incomplete for any period or jurisdiction due to some unavailable turnover figures that are used to derive these numbers.
(1) Figure is net and does not include lotteries’ agent commission.
(2) Data only available for three months April-June 2010.
(3) No longer operational.
(4) Includes new product "Set for Life", commenced 7 August 2015.
(5) Intralot surrendered licence and ceased trading 31 January 2015.
NA = Not applicable
U = Unavailable data
Value ($ million)
TAS (1)
VICWA(NA)
AUSTRALIAACT NSW NT QLDSA
(NA)
Australian Gambling Statistics, 1993–94 to 2018–2019, 36th edition
100

TABLE LOTTERY 3PER CAPITA LOTTERY TURNOVER
1993-94 13.55 30.57 18.77 5.41 - 3.02 3.77 - 12.811994-95 11.95 26.19 18.39 4.30 - 3.07 3.69 - 11.071995-96 13.33 29.00 28.92 4.31 - 3.36 3.68 - 12.141996-97 12.59 28.79 33.38 2.89 - 3.21 3.59 - 11.821997-98 12.77 28.56 33.64 2.32 - 3.76 3.77 - 11.701998-99 14.12 31.02 24.27 2.52 - 3.97 3.88 - 12.531999-00 11.22 25.17 14.27 1.52 - 3.77 3.66 - 10.162000-01 10.97 23.04 5.41 0.98 - 3.68 3.65 - 9.242001-02 10.02 20.91 - U 0.63 - 3.80 3.81 - 8.412002-03 11.49 22.51 - U 0.62 - 6.82 3.97 - 9.062003-04 11.96 25.78 - U 0.59 - 5.52 4.09 - 10.102004-05 10.05 22.12 - U 0.45 - 5.55 4.04 - 8.762005-06 11.94 25.22 - U 0.53 - 5.41 4.15 - 9.812006-07 9.30 19.71 - U 0.44 - 5.58 4.24 - 7.922007-08 9.82 21.05 - U 0.42 - 5.78 4.28 - 8.352008-09 9.69 21.17 - U 0.44 - 2.92 0.86 - 7.442009-10 9.45 3.21 (2) - U 0.37 - 1.57 1.03 - 1.572010-11 8.55 16.76 - U 0.43 - 1.60 0.68 - 5.872011-12 15.20 26.15 - U 0.32 - 1.67 0.66 - 8.952012-13 7.66 14.86 - U 0.23 - 1.64 0.64 - 5.142013-14 10.30 18.94 - U - (3) - 1.56 0.59 - 6.422014-15 5.53 11.06 - U - - 1.59 0.37 - 3.762015-16 4.58 21.06 (4) - U - - 1.60 - (5) - 6.862016-17 3.74 19.38 - U - - 1.49 - - 6.302017-18 4.53 19.75 - U - - 1.52 - - 6.442018-19 14.34 43.76 - U - - 5.33 - - 14.36
Notes: These data should be read in conjunction with the explanatory notes and other turnover tables in this publication.
Figure(s) may be incomplete for any period or jurisdiction due to some unavailable turnover figures that are used to derive these numbers.
(1) Figure is net and does not include lotteries’ agent commission.
(2) Data only available for three months April-June 2010.
(3) No longer operational.
(4) Includes new product "Set for Life", commenced 7 August 2015.
(5) Intralot surrendered licence and ceased trading 31 January 2015.
NA = Not applicable
U = Unavailable data
Value ($)
TAS (1)
VICWA(NA)
AUSTRALIAACT NSW NT QLDSA
(NA)
Australian Gambling Statistics, 1993–94 to 2018–2019, 36th edition
101

TABLE LOTTERY 4REAL PER CAPITA LOTTERY TURNOVER
1993-94 25.18 56.81 34.88 10.05 - 5.61 7.01 - 23.811994-95 21.50 47.14 33.09 7.74 - 5.53 6.64 - 19.911995-96 23.01 50.05 49.93 7.45 - 5.79 6.36 - 20.961996-97 21.45 49.03 56.85 4.93 - 5.46 6.11 - 20.131997-98 21.75 48.64 57.29 3.96 - 6.41 6.42 - 19.931998-99 23.77 52.20 40.85 4.23 - 6.68 6.52 - 21.091999-00 18.45 41.38 23.46 2.49 - 6.20 6.02 - 16.702000-01 17.00 35.73 8.39 1.51 - 5.70 5.66 - 14.332001-02 15.10 31.52 - U 0.95 - 5.73 5.74 - 12.682002-03 16.81 32.93 - U 0.91 - 9.97 5.80 - 13.252003-04 17.08 36.81 - U 0.84 - 7.88 5.84 - 14.432004-05 14.02 30.86 - U 0.63 - 7.75 5.64 - 12.222005-06 16.14 34.09 - U 0.72 - 7.31 5.61 - 13.272006-07 12.21 25.89 - U 0.57 - 7.32 5.57 - 10.402007-08 12.47 26.74 - U 0.54 - 7.34 5.44 - 10.612008-09 11.94 26.09 - U 0.54 - 3.60 1.06 - 9.172009-10 11.37 3.86 (2) - U 0.45 - 1.89 1.23 - 1.882010-11 9.99 19.58 - U 0.50 - 1.87 0.80 - 6.852011-12 17.34 29.84 - U 0.37 - 1.90 0.76 - 10.222012-13 8.54 16.58 - U 0.25 - 1.83 0.72 - 5.742013-14 11.19 20.58 - U - (3) - 1.69 0.64 - 6.982014-15 5.91 11.82 - U - - 1.70 0.39 - 4.022015-16 4.83 22.19 (4) - U - - 1.69 - (5) - 7.232016-17 3.87 20.06 - U - - 1.54 - - 6.532017-18 4.60 20.06 - U - - 1.54 - - 6.542018-19 14.34 43.76 - U - - 5.33 - - 14.36
Notes: These data should be read in conjunction with the explanatory notes and other turnover tables in this publication.
Figure(s) may be incomplete for any period or jurisdiction due to some unavailable turnover figures that are used to derive these numbers.
(1) Figure is net and does not include lotteries’ agent commission.
(2) Data only available for three months April-June 2010.
(3) No longer operational.
(4) Includes new product "Set for Life", commenced 7 August 2015.
(5) Intralot surrendered licence and ceased trading 31 January 2015.
NA = Not applicable
U = Unavailable data
Value ($)
TAS (1)
VICWA(NA)
AUSTRALIAACT NSW NT QLDSA
(NA)
Australian Gambling Statistics, 1993–94 to 2018–2019, 36th edition
102

TABLE LOTTERY 5LOTTERY EXPENDITURE
1993-94 1.066 47.527 0.806 4.588 - 0.416 5.036 - 59.4391994-95 0.954 41.091 0.887 3.737 - 0.426 4.957 - 52.0511995-96 1.082 46.076 1.440 3.632 - 0.467 4.995 - 57.6911996-97 1.005 46.358 1.714 2.485 - 0.315 4.911 - 56.7881997-98 1.028 46.554 1.772 2.030 - 0.345 5.214 - 56.9431998-99 1.148 51.167 1.304 2.419 - 0.364 5.422 - 61.8241999-00 0.925 42.067 0.782 1.320 - 0.347 5.185 - 50.6262000-01 0.919 43.481 0.302 1.015 - 0.340 5.246 - 51.3032001-02 0.853 39.938 - U 0.700 - 0.353 (1) 5.546 (1) - 47.3902002-03 0.993 43.938 - U 0.610 - 0.639 5.860 - 52.0402003-04 1.046 50.297 - U 0.563 - 0.525 6.132 - 58.5632004-05 0.890 43.542 - U 0.442 - 0.534 6.144 - 51.5522005-06 1.072 50.299 - U 0.605 - 0.802 6.416 - 59.1942006-07 0.851 39.662 - U 0.468 - 0.834 6.673 - 48.4882007-08 0.918 42.850 - U 0.470 - 0.875 6.887 - 52.0002008-09 0.925 44.150 - U 0.557 - 0.448 1.411 - 47.4912009-10 0.922 6.049 (2) - U 0.482 - 0.245 1.726 - 9.4242010-11 0.852 31.790 - U 0.578 - 0.251 1.172 - 34.6432011-12 1.547 51.682 - U 0.367 - 0.264 1.155 - 55.0152012-13 0.795 29.941 - U 0.303 - 0.260 1.146 - 32.4452013-14 1.085 38.728 - U - (3) - 0.249 1.080 - 41.1422014-15 0.592 23.359 - U - - 0.255 0.685 - 24.8912015-16 0.479 47.016 (4) - U - - 0.259 - (5) - 47.7542016-17 0.473 44.031 - U - - 0.243 - - 44.7472017-18 0.513 45.656 - U - - 0.251 - - 46.4202018-19 1.654 103.142 - U - - 0.858 - - 105.654
Notes: These data should be read in conjunction with the explanatory notes and other expenditure tables in this publication.
Figure(s) may be incomplete for any period or jurisdiction due to some unavailable expenditure figures that are used to derive these numbers.
(1) Expenditure estimated at 40.0% of turnover (subscriptions), from this period on.
(2) Data only available for three months April–June 2010.
(3) No longer operational.
(4) Includes new product "Set for Life", commenced 7 August 2015.
(5) Intralot surrendered licence and ceased trading 31 January 2015.
NA = Not applicable
U = Unavailable data
Value ($ million)
TAS VICWA(NA)
AUSTRALIAACT NSW NT QLDSA
(NA)
Australian Gambling Statistics, 1993–94 to 2018–2019, 36th edition
103

TABLE LOTTERY 6REAL LOTTERY EXPENDITURE
1993-94 1.981 88.320 1.498 8.526 - 0.773 9.358 - 110.4551994-95 1.716 73.951 1.597 6.725 - 0.766 8.921 - 93.6761995-96 1.867 79.535 2.485 6.269 - 0.806 8.622 - 99.5851996-97 1.712 78.947 2.919 4.232 - 0.536 8.363 - 96.7091997-98 1.751 79.281 3.018 3.457 - 0.588 8.879 - 96.9731998-99 1.932 86.108 2.194 4.071 - 0.613 9.125 - 104.0431999-00 1.521 69.162 1.286 2.170 - 0.571 8.525 - 83.2342000-01 1.425 67.407 0.468 1.574 - 0.526 8.133 - 79.5332001-02 1.286 60.197 - U 1.055 - 0.532 (1) 8.359 (1) - 71.4292002-03 1.453 64.273 - U 0.892 - 0.935 8.572 - 76.1252003-04 1.494 71.826 - U 0.804 - 0.750 8.757 - 83.6302004-05 1.241 60.735 - U 0.617 - 0.745 8.570 - 71.9082005-06 1.449 67.999 - U 0.818 - 1.084 8.674 - 80.0242006-07 1.117 52.076 - U 0.614 - 1.095 8.762 - 63.6652007-08 1.166 54.445 - U 0.597 - 1.112 8.751 - 66.0712008-09 1.140 54.401 - U 0.686 - 0.552 1.739 - 58.5182009-10 1.110 7.280 (2) - U 0.580 - 0.295 2.077 - 11.3422010-11 0.995 37.126 - U 0.675 - 0.293 1.369 - 40.4582011-12 1.765 58.969 - U 0.419 - 0.301 1.318 - 62.7722012-13 0.887 33.395 - U 0.338 (3) - 0.290 1.278 - 36.1872013-14 1.179 42.084 - U - - 0.271 1.174 - 44.7072014-15 0.632 24.956 - U - - 0.273 0.732 - 26.5932015-16 0.505 49.534 (4) - U - - 0.273 - (5) - 50.3112016-17 0.490 45.589 - U - - 0.252 - - 46.3312017-18 0.521 46.388 - U - - 0.255 - - 47.1642018-19 1.654 103.142 - U - - 0.858 - - 105.654
Notes: These data should be read in conjunction with the explanatory notes and other expenditure tables in this publication.
Figure(s) may be incomplete for any period or jurisdiction due to some unavailable expenditure figures that are used to derive these numbers.
(1) Expenditure estimated at 40.0% of turnover (subscriptions), from this period on.
(2) Data only available for three months April–June 2010.
(3) No longer operational.
(4) Includes new product "Set for Life", commenced 7 August 2015.
(5) Intralot surrendered licence and ceased trading 31 January 2015.
NA = Not applicable
U = Unavailable data
Value ($ million)
TAS VICWA(NA)
AUSTRALIAACT NSW NT QLDSA
(NA)
Australian Gambling Statistics, 1993–94 to 2018–2019, 36th edition
104

TABLE LOTTERY 7PER CAPITA LOTTERY EXPENDITURE
1993-94 4.88 10.61 6.86 2.00 - 1.21 1.51 - 4.531994-95 4.30 9.07 7.36 1.59 - 1.23 1.48 - 3.921995-96 4.80 10.05 11.57 1.51 - 1.34 1.47 - 4.281996-97 4.41 9.98 13.35 1.01 - 0.90 1.43 - 4.161997-98 4.47 9.90 13.46 0.81 - 0.99 1.51 - 4.121998-99 4.94 10.75 9.71 0.95 - 1.04 1.55 - 4.411999-00 3.93 8.72 5.70 0.51 - 0.99 1.46 - 3.572000-01 3.84 8.89 2.17 0.39 - 0.96 1.46 - 3.562001-02 3.50 8.06 - U 0.26 - 1.00 (1) 1.52 (1) - 3.242002-03 4.02 8.78 - U 0.22 - 1.79 1.59 - 3.512003-04 4.18 9.97 - U 0.20 - 1.45 1.64 - 3.892004-05 3.52 8.57 - U 0.15 - 1.45 1.62 - 3.382005-06 4.18 9.81 - U 0.20 - 2.16 1.66 - 3.822006-07 3.25 7.64 - U 0.15 - 2.23 1.70 - 3.072007-08 3.44 8.11 - U 0.15 - 2.31 1.71 - 3.232008-09 3.39 8.20 - U 0.17 - 1.17 0.34 - 2.882009-10 3.31 1.11 (2) - U 0.15 - 0.63 0.41 - 0.562010-11 2.99 5.74 - U 0.17 - 0.64 0.27 - 2.022011-12 5.32 9.21 - U 0.11 - 0.67 0.26 - 3.162012-13 2.68 5.26 - U 0.09 (3) - 0.65 0.26 - 1.832013-14 3.61 6.70 - U - - 0.62 0.24 - 2.282014-15 1.94 3.98 - U - - 0.64 0.15 - 1.362015-16 1.54 7.89 (4) - U - - 0.64 - (5) - 2.572016-17 1.49 7.26 - U - - 0.60 - - 2.362017-18 1.58 7.40 - U - - 0.61 - - 2.412018-19 5.02 16.45 - U - - 2.05 - - 5.39
Notes: These data should be read in conjunction with the explanatory notes and other expenditure tables in this publication.
Figure(s) may be incomplete for any period or jurisdiction due to some unavailable expenditure figures that are used to derive these numbers.
(1) Expenditure estimated at 40.0% of turnover (subscriptions), from this period on.
(2) Data only available for three months April–June 2010.
(3) No longer operational.
(4) Includes new product "Set for Life", commenced 7 August 2015.
(5) Intralot surrendered licence and ceased trading 31 January 2015.
NA = Not applicable
U = Unavailable data
Value ($)
TAS VICWA(NA)
AUSTRALIAACT NSW NT QLDSA
(NA)
Australian Gambling Statistics, 1993–94 to 2018–2019, 36th edition
105

TABLE LOTTERY 8REAL PER CAPITA LOTTERY EXPENDITURE
1993-94 9.07 19.71 12.76 3.72 - 2.24 2.80 - 8.411994-95 7.74 16.33 13.24 2.86 - 2.21 2.66 - 7.051995-96 8.28 17.34 19.97 2.61 - 2.32 2.54 - 7.391996-97 7.50 16.99 22.74 1.72 - 1.54 2.44 - 7.081997-98 7.61 16.85 22.92 1.39 - 1.68 2.57 - 7.011998-99 8.31 18.09 16.34 1.60 - 1.75 2.61 - 7.431999-00 6.46 14.34 9.38 0.84 - 1.63 2.41 - 5.862000-01 5.95 13.78 3.36 0.60 - 1.49 2.26 - 5.522001-02 5.28 12.15 - U 0.39 - 1.50 (1) 2.29 (1) - 4.892002-03 5.88 12.85 - U 0.32 - 2.61 2.32 - 5.132003-04 5.98 14.24 - U 0.28 - 2.07 2.34 - 5.562004-05 4.91 11.95 - U 0.21 - 2.03 2.25 - 4.712005-06 5.65 13.26 - U 0.27 - 2.93 2.25 - 5.172006-07 4.27 10.03 - U 0.20 - 2.93 2.23 - 4.042007-08 4.37 10.31 - U 0.19 - 2.94 2.18 - 4.102008-09 4.18 10.11 - U 0.21 - 1.44 0.42 - 3.552009-10 3.98 1.33 (2) - U 0.18 - 0.76 0.49 - 0.672010-11 3.49 6.70 - U 0.20 - 0.75 0.32 - 2.362011-12 6.07 10.51 - U 0.12 - 0.76 0.30 - 3.612012-13 2.99 5.87 - U 0.10 (3) - 0.73 0.29 - 2.042013-14 3.92 7.28 - U - - 0.68 0.26 - 2.482014-15 2.07 4.25 - U - - 0.68 0.16 - 1.452015-16 1.62 8.31 (4) - U - - 0.68 - (5) - 2.702016-17 1.54 7.52 - U - - 0.62 - - 2.452017-18 1.61 7.52 - U - - 0.62 - - 2.452018-19 5.02 16.45 - U - - 2.05 - - 5.39
Notes: These data should be read in conjunction with the explanatory notes and other expenditure tables in this publication.
Figure(s) may be incomplete for any period or jurisdiction due to some unavailable expenditure figures that are used to derive these numbers.
(1) Expenditure estimated at 40.0% of turnover (subscriptions), from this period on.
(2) Data only available for three months April–June 2010.
(3) No longer operational.
(4) Includes new product "Set for Life", commenced 7 August 2015.
(5) Intralot surrendered licence and ceased trading 31 January 2015.
NA = Not applicable
U = Unavailable data
Value ($)
TAS VICWA(NA)
AUSTRALIAACT NSW NT QLDSA
(NA)
Australian Gambling Statistics, 1993–94 to 2018–2019, 36th edition
106

TABLE LOTTERY 9LOTTERY EXPENDITURE AS A % OF HOUSEHOLD DISPOSABLE INCOME
(ALL STATES AND TERRITORIES)
1993-94 0.014 0.041 0.030 0.009 - 0.006 0.007 - 0.0191994-95 0.012 0.034 0.029 0.007 - 0.006 0.006 - 0.0161995-96 0.013 0.036 0.044 0.006 - 0.006 0.006 - 0.0171996-97 0.012 0.034 0.049 0.004 - 0.004 0.006 - 0.0151997-98 0.012 0.033 0.050 0.003 - 0.004 0.006 - 0.0151998-99 0.013 0.035 0.033 0.004 - 0.005 0.006 - 0.0151999-00 0.009 0.027 0.018 0.002 - 0.004 0.005 - 0.0122000-01 0.008 0.025 0.006 0.001 - 0.004 0.005 - 0.0112001-02 0.007 0.023 - U 0.001 - 0.004 (1) 0.005 (1) - 0.0102002-03 0.007 0.024 - U 0.001 - 0.006 0.005 - 0.0102003-04 0.007 0.026 - U 0.001 - 0.005 0.005 - 0.0112004-05 0.006 0.021 - U 0.000 - 0.004 0.004 - 0.0092005-06 0.007 0.023 - U 0.000 - 0.006 0.004 - 0.0092006-07 0.005 0.017 - U 0.000 - 0.006 0.004 - 0.0072007-08 0.005 0.017 - U 0.000 - 0.005 0.004 - 0.0072008-09 0.004 0.016 - U 0.000 - 0.003 0.001 - 0.0062009-10 0.004 0.002 (2) - U 0.000 - 0.001 0.001 - 0.0012010-11 0.003 0.010 - U 0.000 - 0.001 0.001 - 0.0042011-12 0.005 0.016 - U 0.000 - 0.001 0.001 - 0.0062012-13 0.002 0.009 - U 0.000 (3) - 0.001 0.000 - 0.0032013-14 0.003 0.011 - U - - 0.001 0.000 - 0.0042014-15 0.002 0.006 - U - - 0.001 0.000 - 0.0022015-16 0.001 0.012 (4) - U - - 0.001 - (5) - 0.0042016-17 0.001 0.011 - U - - 0.001 - - 0.0042017-18 0.001 0.011 - U - - 0.001 - - 0.0042018-19 0.004 0.025 - U - - 0.004 - - 0.009
Notes: These data should be read in conjunction with the explanatory notes and other expenditure tables in this publication.
Figure(s) may be incomplete for any period or jurisdiction due to some unavailable expenditure figures that are used to derive these numbers.
(1) Expenditure estimated at 40.0% of turnover (subscriptions), from this period on.
(2) Data only available for three months April–June 2010.
(3) No longer operational.
(4) Includes new product "Set for Life", commenced 7 August 2015.
(5) Intralot surrendered licence and ceased trading 31 January 2015.
NA = Not applicable
U = Unavailable data
Percentage (%)
TAS VICWA(NA)
AUSTRALIAACT NSW NT QLDSA
(NA)
Australian Gambling Statistics, 1993–94 to 2018–2019, 36th edition
107

TABLE LOTTO 1LOTTO-TATTSLOTTO TURNOVER
1993-94 27.059 476.629 19.626 335.789 169.627 52.641 637.307 240.220 1,958.8981994-95 28.751 546.392 23.409 377.265 167.908 53.583 677.779 274.830 2,149.9171995-96 30.810 575.353 29.393 395.617 172.908 51.910 702.756 310.357 2,269.1041996-97 29.317 603.414 27.797 375.234 166.759 47.733 643.911 306.480 2,200.6451997-98 30.099 626.544 29.856 402.557 180.407 47.100 672.039 327.847 2,316.4491998-99 30.338 638.765 29.756 454.319 188.684 47.499 705.167 349.373 2,443.9011999-00 31.258 634.738 29.959 462.618 194.925 47.957 708.362 359.110 2,468.9272000-01 35.362 771.351 30.864 498.994 210.089 52.425 757.402 380.971 2,737.4582001-02 34.228 782.001 30.053 502.275 210.493 54.648 763.140 379.748 2,756.5862002-03 37.688 857.375 29.589 549.733 228.150 58.286 839.209 410.837 3,010.8672003-04 36.704 866.557 29.269 558.687 234.237 59.175 864.153 421.929 3,070.7112004-05 36.481 895.041 30.385 581.818 234.068 59.411 867.498 436.586 3,141.2882005-06 37.343 919.209 36.128 612.121 232.566 62.369 898.006 461.765 3,259.5072006-07 39.196 953.166 36.135 664.211 233.066 65.803 936.557 500.784 3,428.9182007-08 40.741 1,032.531 37.545 701.072 246.567 69.082 990.931 549.285 3,667.7542008-09 44.350 1,144.136 40.463 776.380 263.372 67.011 1,048.933 620.999 (2) 4,005.6442009-10 46.146 266.984 (3) 41.860 775.841 257.284 77.155 1,045.523 600.146 3,110.9392010-11 42.033 929.129 39.608 744.472 253.330 71.668 1,015.427 583.237 3,678.9042011-12 43.539 987.720 45.787 834.092 282.794 77.850 1,141.214 661.209 4,074.2052012-13 52.904 1,149.539 72.889 940.830 318.025 98.887 1,268.263 724.490 4,625.8272013-14 48.486 1,013.545 88.251 805.869 289.261 82.103 1,179.730 699.051 4,206.2972014-15 49.259 1,072.626 98.992 823.043 299.586 81.256 1,203.122 728.242 4,356.1252015-16 46.972 1,129.955 111.735 905.456 318.094 88.240 1,287.044 (4) 792.350 4,679.8462016-17 40.565 1,060.147 102.055 844.027 293.554 83.743 (5) 1,200.923 (6) 730.277 4,355.2912017-18 45.192 1,136.987 116.106 901.514 305.799 87.086 1,237.579 746.193 4,576.4562018-19 52.860 1,440.873 120.312 1,143.367 385.983 106.910 1,555.619 873.384 5,679.308
Notes: These data should be read in conjunction with the explanatory notes and other turnover tables in this publication.
Figure(s) may be incomplete for any period or jurisdiction due to some unavailable turnover figures that are used to derive these numbers.
(1) Turnover figure is net and it does not include agent commission.
(2) Data are for gross sales, from this period on.
(3) Data only available for three months April - June 2010.
(4) 'Set for Life' lottery product introduced in 2015–16.
(5) Under subscription.
(6) Net sales (exclude agent commission), from this period on.
AUSTRALIA
Value ($ million)
ACT NSW (1) NT QLD SA TAS VIC WA
Australian Gambling Statistics, 1993–94 to 2018–2019, 36th edition
108

TABLE LOTTO 2REAL LOTTO-TATTSLOTTO TURNOVER
1993-94 50.284 885.723 36.471 623.999 315.219 97.823 1,184.312 446.402 3,640.2321994-95 51.743 983.333 42.129 678.958 302.181 96.432 1,219.788 494.607 3,869.1721995-96 53.183 993.159 50.737 682.903 298.469 89.606 1,213.078 535.730 3,916.8651996-97 49.926 1,027.605 47.338 639.018 283.988 81.289 1,096.571 521.931 3,747.6661997-98 51.258 1,066.995 50.844 685.549 307.230 80.211 1,144.472 558.319 3,944.8781998-99 51.056 1,074.972 50.076 764.569 317.535 79.936 1,186.719 587.957 4,112.8191999-00 51.391 1,043.568 49.255 760.587 320.475 78.846 1,164.612 590.410 4,059.1442000-01 54.821 1,195.804 47.848 773.576 325.695 81.273 1,174.179 590.609 4,243.8042001-02 51.591 1,178.683 45.297 757.062 317.269 82.369 1,150.255 572.381 4,154.9062002-03 55.131 1,254.186 43.283 804.161 333.743 85.262 1,227.612 600.981 4,404.3582003-04 52.415 1,237.474 41.797 797.825 334.499 84.504 1,234.041 602.529 4,385.0832004-05 50.886 1,248.462 42.383 811.558 326.493 82.870 1,210.043 608.979 4,381.6742005-06 50.484 1,242.675 48.841 827.524 314.405 84.316 1,214.010 624.258 4,406.5142006-07 51.464 1,251.510 47.445 872.111 306.016 86.400 1,229.703 657.531 4,502.1812007-08 51.766 1,311.935 47.705 890.783 313.288 87.776 1,259.078 697.922 4,660.2532008-09 54.647 1,409.783 49.858 956.641 324.522 82.570 1,292.476 765.184 (2) 4,935.6812009-10 55.541 321.338 (3) 50.383 933.792 309.664 92.863 1,258.377 722.328 3,744.2852010-11 49.089 1,085.093 46.257 869.440 295.854 83.698 1,185.877 681.140 4,296.4482011-12 49.678 1,126.989 52.243 951.699 322.668 88.827 1,302.125 754.439 4,648.6682012-13 59.006 1,282.135 81.296 1,049.352 354.708 110.293 1,414.553 808.058 5,159.4022013-14 52.688 1,101.386 95.899 875.711 314.330 89.219 1,281.974 759.635 4,570.8432014-15 52.626 1,145.942 105.758 879.300 320.063 86.810 1,285.358 778.019 4,653.8752015-16 49.488 1,190.470 117.719 953.948 335.130 92.966 1,355.972 (4) 834.784 4,930.4752016-17 42.001 1,097.666 105.667 873.897 303.943 86.707 (5) 1,243.424 (6) 756.122 4,509.4262017-18 45.916 1,155.211 117.967 915.964 310.700 88.482 1,257.415 758.153 4,649.8102018-19 52.860 1,440.873 120.312 1,143.367 385.983 106.910 1,555.619 873.384 5,679.308
Notes: These data should be read in conjunction with the explanatory notes and other turnover tables in this publication.
Figure(s) may be incomplete for any period or jurisdiction due to some unavailable turnover figures that are used to derive these numbers.
(1) Turnover figure is net and it does not include agent commission.
(2) Data are for gross sales, from this period on.
(3) Data only available for three months April - June 2010.
(4) 'Set for Life' lottery product introduced in 2015–16.
(5) Under subscription.
(6) Net sales (exclude agent commission), from this period on.
AUSTRALIA
Value ($ million)
ACT NSW (1) NT QLD SA TAS VIC WA
Australian Gambling Statistics, 1993–94 to 2018–2019, 36th edition
109

TABLE LOTTO 3PER CAPITA LOTTO-TATTSLOTTO TURNOVER
1993-94 123.84 106.38 167.16 146.50 153.92 152.76 190.89 194.98 149.231994-95 129.68 120.63 194.08 160.56 151.75 154.72 201.82 218.66 161.751995-96 136.68 125.45 236.22 164.50 155.74 149.27 207.39 241.71 168.411996-97 128.50 129.85 216.55 152.93 149.44 136.82 188.05 233.78 161.111997-98 130.89 133.20 226.79 161.28 160.57 134.76 194.28 245.33 167.471998-99 130.56 134.16 221.54 179.07 166.75 135.67 201.60 256.85 174.481999-00 132.75 131.59 218.56 179.23 171.06 136.53 200.00 259.64 173.932000-01 147.72 157.68 221.33 189.68 183.09 148.66 210.89 270.84 190.082001-02 140.63 157.83 213.18 186.63 182.05 154.24 209.48 265.49 188.602002-03 152.61 171.36 209.21 198.85 195.61 162.86 227.15 282.56 203.022003-04 146.84 171.81 206.16 196.70 199.10 163.02 230.66 285.19 204.132004-05 144.33 176.09 211.01 199.70 197.16 161.77 228.25 289.65 205.892005-06 145.64 179.26 245.92 205.02 193.87 168.29 232.50 300.15 210.432006-07 149.88 183.61 240.23 216.88 191.94 175.87 237.97 317.36 217.442007-08 152.48 195.50 241.86 222.82 200.37 182.44 246.45 337.32 227.662008-09 162.63 212.63 251.57 240.07 211.02 174.52 254.72 368.67 (2) 242.992009-10 165.56 48.81 (3) 253.09 234.36 203.23 198.28 248.43 346.02 184.902010-11 147.63 167.62 235.70 220.69 197.83 182.26 237.18 327.26 215.032011-12 149.74 175.97 267.46 242.40 218.61 196.76 261.72 359.77 234.072012-13 178.44 201.99 413.70 267.85 243.33 248.97 284.71 383.01 260.922013-14 161.11 175.43 491.08 225.41 219.17 205.74 259.15 362.62 233.232014-15 161.23 182.85 545.72 226.87 224.92 202.47 258.63 373.83 237.832015-16 151.07 189.65 611.69 246.06 236.95 218.56 270.33 (4) 403.87 251.562016-17 127.93 174.85 555.40 225.60 217.06 205.49 (5) 246.07 (6) 369.97 230.152017-18 139.55 184.26 629.29 236.59 224.24 210.90 247.51 375.11 237.622018-19 160.47 229.85 653.29 294.60 280.41 255.21 303.95 435.05 289.94
Notes: These data should be read in conjunction with the explanatory notes and other turnover tables in this publication.
Figure(s) may be incomplete for any period or jurisdiction due to some unavailable turnover figures that are used to derive these numbers.
(1) Turnover figure is net and it does not include agent commission.
(2) Data are for gross sales, from this period on.
(3) Data only available for three months April - June 2010.
(4) 'Set for Life' lottery product introduced in 2015–16.
(5) Under subscription.
(6) Net sales (exclude agent commission), from this period on.
AUSTRALIA
Value ($)
ACT NSW (1) NT QLD SA TAS VIC WA
Australian Gambling Statistics, 1993–94 to 2018–2019, 36th edition
110

TABLE LOTTO 4REAL PER CAPITA LOTTO-TATTSLOTTO TURNOVER
1993-94 230.13 197.68 310.64 272.24 286.02 283.87 354.74 362.34 277.321994-95 233.38 217.10 349.28 288.96 273.10 278.44 363.22 393.51 291.101995-96 235.94 216.55 407.75 283.95 268.84 257.67 357.98 417.24 290.711996-97 218.84 221.13 368.78 260.43 254.50 233.00 320.25 398.12 274.371997-98 222.90 226.84 386.23 274.65 273.45 229.49 330.86 417.79 285.201998-99 219.72 225.78 372.82 301.36 280.62 228.31 339.28 432.24 293.641999-00 218.25 216.35 359.34 294.67 281.23 224.47 328.83 426.87 285.962000-01 229.01 244.45 343.13 294.06 283.84 230.46 326.94 419.87 294.682001-02 211.97 237.90 321.32 281.29 274.40 232.48 315.73 400.16 284.272002-03 223.25 250.67 306.04 290.88 286.15 238.23 332.28 413.34 296.982003-04 209.70 245.36 294.40 280.89 284.32 232.80 329.38 407.26 291.502004-05 201.32 245.62 294.33 278.55 275.02 225.64 318.38 404.03 287.192005-06 196.89 242.35 332.45 277.16 262.09 227.51 314.31 405.78 284.482006-07 196.80 241.07 315.42 284.77 252.01 230.91 312.46 416.70 285.502007-08 193.74 248.40 307.30 283.12 254.59 231.81 313.13 428.60 289.262008-09 200.39 262.00 309.98 295.81 260.01 215.04 313.86 454.27 (2) 299.412009-10 199.27 58.75 (3) 304.61 282.07 244.61 238.64 299.00 416.47 222.552010-11 172.41 195.76 275.27 257.73 231.04 212.86 276.99 382.19 251.122011-12 170.86 200.79 305.17 276.58 249.44 224.51 298.62 410.50 267.082012-13 199.02 225.29 461.42 298.75 271.40 277.69 317.55 427.19 291.022013-14 175.07 190.63 533.64 244.94 238.16 223.57 281.61 394.05 253.452014-15 172.25 195.35 583.02 242.38 240.30 216.31 276.31 399.38 254.082015-16 159.16 199.81 644.45 259.24 249.64 230.27 284.81 (4) 425.50 265.032016-17 132.46 181.04 575.05 233.58 224.74 212.76 (5) 254.77 (6) 383.07 238.302017-18 141.79 187.21 639.38 240.38 227.84 214.28 251.48 381.13 241.432018-19 160.47 229.85 653.29 294.60 280.41 255.21 303.95 435.05 289.94
Notes: These data should be read in conjunction with the explanatory notes and other turnover tables in this publication.
Figure(s) may be incomplete for any period or jurisdiction due to some unavailable turnover figures that are used to derive these numbers.
(1) Turnover figure is net and it does not include agent commission.
(2) Data are for gross sales, from this period on.
(3) Data only available for three months April - June 2010.
(4) 'Set for Life' lottery product introduced in 2015–16.
(5) Under subscription.
(6) Net sales (exclude agent commission), from this period on.
AUSTRALIA
Value ($)
ACT NSW (1) NT QLD SA TAS VIC WA
Australian Gambling Statistics, 1993–94 to 2018–2019, 36th edition
111

TABLE LOTTO 5LOTTO-TATTSLOTTO EXPENDITURE
1993-94 10.824 190.652 7.850 134.316 61.464 21.056 254.923 96.088 777.1731994-95 11.500 218.557 9.364 150.906 60.849 21.433 271.112 111.481 855.2021995-96 12.244 229.913 11.757 152.786 63.003 20.764 281.102 126.126 897.6961996-97 11.668 241.126 11.119 150.094 62.419 16.336 257.564 127.114 877.4401997-98 12.063 250.285 11.942 161.023 67.516 16.140 268.815 135.638 923.4221998-99 12.386 255.190 11.902 201.862 70.599 16.150 282.067 145.100 995.2561999-00 12.492 253.599 11.984 205.560 72.588 16.305 283.345 148.736 1,004.6092000-01 14.139 331.928 12.346 221.389 78.233 17.825 302.961 158.468 1,137.2892001-02 13.688 337.702 12.021 222.898 78.371 18.580 (1) 305.256 (1) 157.692 1,146.2082002-03 15.070 372.318 11.836 243.859 84.938 19.817 335.684 178.640 1,262.1622003-04 14.678 377.824 11.708 248.108 87.186 20.119 345.661 188.449 1,293.7332004-05 14.588 392.878 12.154 258.468 87.113 20.200 346.999 195.142 1,327.5422005-06 14.934 405.652 14.451 271.762 86.572 24.948 359.202 207.406 1,384.9272006-07 15.675 422.089 14.454 294.481 86.796 26.321 374.623 225.306 1,459.7452007-08 16.294 456.483 15.018 310.076 91.659 27.633 396.372 246.881 1,560.4162008-09 17.737 505.339 16.185 342.388 98.001 26.804 419.573 278.880 1,704.9072009-10 18.455 106.747 (2) 16.744 342.062 95.714 30.862 418.209 270.426 1,299.2192010-11 16.809 371.416 15.843 328.858 94.269 28.667 406.171 262.430 1,524.4632011-12 17.411 394.873 18.314 368.081 105.220 31.140 456.485 297.359 1,688.8832012-13 21.157 459.579 29.112 413.823 118.360 (3) 39.555 507.305 325.892 (4) 1,914.7832013-14 19.390 405.210 35.301 324.347 107.653 32.841 471.892 314.387 1,711.0202014-15 19.700 428.862 39.595 329.190 111.406 32.502 481.221 327.771 1,770.2482015-16 18.785 451.798 44.569 360.356 117.702 35.296 512.609 (5) 354.830 1,895.9452016-17 17.678 423.825 40.707 335.962 108.545 33.497 478.294 (6) 327.068 1,765.5772017-18 18.073 454.603 46.339 358.860 113.154 34.835 493.057 334.219 1,853.1392018-19 21.140 576.156 48.003 454.711 142.716 40.725 619.609 391.498 2,294.558
Notes: These data should be read in conjunction with the explanatory notes and other expenditure tables in this publication.
Figure(s) may be incomplete for any period or jurisdiction due to some unavailable expenditure figures that are used to derive these numbers.
(1) Expenditure estimated at 40.0% of turnover (subscriptions), from this period on.
(2) Data only available for three months April - June 2010.
(3) Figure represents sales less prizes and commission, from this period on.
(4) Data are for turnover minus prizes won by players, from this period on.
(5) Expenditure estimated at 40.0% of turnover, except for the 'Set for Life' lottery product estimated at 36.8% of turnover (introduced in 2015–16).
(6) Net sales (exclude agent commission), from this period on.
AUSTRALIA
Value ($ million)
ACT NSW NT QLD SA TAS VIC WA
Australian Gambling Statistics, 1993–94 to 2018–2019, 36th edition
112

TABLE LOTTO 6REAL LOTTO-TATTSLOTTO EXPENDITURE
1993-94 20.114 354.289 14.588 249.600 114.220 39.129 473.725 178.561 1,444.2251994-95 20.697 393.334 16.852 271.583 109.509 38.573 487.915 200.631 1,539.0931995-96 21.136 396.869 20.295 263.736 108.754 35.842 485.231 217.715 1,549.5781996-97 19.870 410.634 18.935 255.608 106.299 27.820 438.628 216.473 1,494.2681997-98 20.543 426.232 20.337 274.220 114.979 27.486 457.788 230.989 1,572.5741998-99 20.844 429.457 20.030 339.712 118.810 27.179 474.688 244.187 1,674.9071999-00 20.538 416.940 19.703 337.960 119.341 26.808 465.845 244.536 1,651.6712000-01 21.919 514.579 19.140 343.213 121.282 27.633 469.672 245.668 1,763.1062001-02 20.631 509.007 18.119 335.966 118.126 28.005 (1) 460.102 (1) 237.684 1,727.6402002-03 22.045 544.634 17.314 356.722 124.249 28.989 491.045 261.318 1,846.3162003-04 20.961 539.546 16.719 354.307 124.505 28.731 493.616 269.112 1,847.4962004-05 20.348 548.012 16.953 360.528 121.511 28.176 484.017 272.197 1,851.7432005-06 20.189 548.399 19.537 367.394 117.036 33.727 485.604 280.391 1,872.2772006-07 20.581 554.204 18.978 386.655 113.963 34.560 491.881 295.828 1,916.6502007-08 20.703 580.008 19.082 393.983 116.462 35.111 503.631 313.687 1,982.6662008-09 21.855 622.669 19.943 421.884 120.755 33.027 516.990 343.631 2,100.7552009-10 22.212 128.479 (2) 20.153 411.701 115.200 37.145 503.351 325.481 1,563.7232010-11 19.631 433.762 18.502 384.060 110.093 33.479 474.351 306.482 1,780.3612011-12 19.866 450.550 20.896 419.980 120.056 35.531 520.849 339.287 1,927.0162012-13 23.597 512.590 32.471 461.556 132.012 (3) 44.118 565.821 363.483 (4) 2,135.6482013-14 21.070 440.328 38.360 352.457 116.983 35.687 512.789 341.634 1,859.3092014-15 21.047 458.176 42.302 351.691 119.021 34.724 514.113 350.175 1,891.2482015-16 19.791 475.994 46.956 379.655 124.006 37.186 540.062 (5) 373.833 1,997.4822016-17 18.304 438.824 42.148 347.852 112.386 34.682 495.221 (6) 338.643 1,828.0612017-18 18.363 461.890 47.082 364.612 114.968 35.393 500.960 339.576 1,882.8422018-19 21.140 576.156 48.003 454.711 142.716 40.725 619.609 391.498 2,294.558
Notes: These data should be read in conjunction with the explanatory notes and other expenditure tables in this publication.
Figure(s) may be incomplete for any period or jurisdiction due to some unavailable expenditure figures that are used to derive these numbers.
(1) Expenditure estimated at 40.0% of turnover (subscriptions), from this period on.
(2) Data only available for three months April - June 2010.
(3) Figure represents sales less prizes and commission, from this period on.
(4) Data are for turnover minus prizes won by players, from this period on.
(5) Expenditure estimated at 40.0% of turnover, except for the 'Set for Life' lottery product estimated at 36.8% of turnover (introduced in 2015–16).
(6) Net sales (exclude agent commission), from this period on.
AUSTRALIA
Value ($ million)
ACT NSW NT QLD SA TAS VIC WA
Australian Gambling Statistics, 1993–94 to 2018–2019, 36th edition
113

TABLE LOTTO 7PER CAPITA LOTTO-TATTSLOTTO EXPENDITURE
1993-94 49.54 42.55 66.86 58.60 55.77 61.10 76.36 77.99 59.211994-95 51.87 48.25 77.63 64.22 54.99 61.89 80.73 88.69 64.341995-96 54.32 50.13 94.49 63.53 56.75 59.71 82.95 98.23 66.631996-97 51.14 51.89 86.62 61.17 55.94 46.82 75.22 96.96 64.241997-98 52.46 53.21 90.71 64.51 60.09 46.18 77.71 101.50 66.761998-99 53.30 53.60 88.61 79.56 62.39 46.13 80.64 106.67 71.061999-00 53.05 52.57 87.43 79.64 63.70 46.42 80.00 107.54 70.772000-01 59.06 67.85 88.54 84.16 68.18 50.54 84.36 112.66 78.972001-02 56.24 68.16 85.27 82.82 67.78 52.44 (1) 83.79 (1) 110.25 78.422002-03 61.02 74.42 83.69 88.21 72.82 55.37 90.86 122.86 85.112003-04 58.72 74.91 82.47 87.35 74.11 55.43 92.26 127.38 86.002004-05 57.71 77.29 84.40 88.71 73.38 55.00 91.30 129.47 87.012005-06 58.24 79.11 98.37 91.02 72.17 67.32 93.00 134.82 89.412006-07 59.94 81.31 96.09 96.16 71.48 70.35 95.19 142.78 92.572007-08 60.98 86.43 96.74 98.55 74.49 72.98 98.58 151.61 96.862008-09 65.04 93.91 100.63 105.87 78.52 69.81 101.89 165.56 103.422009-10 66.21 19.52 (2) 101.23 103.33 75.61 79.31 99.37 155.92 77.222010-11 59.04 67.01 94.28 97.48 73.62 72.90 94.87 147.25 89.102011-12 59.88 70.35 106.98 106.97 81.34 78.70 104.69 161.80 97.032012-13 71.36 80.75 165.23 117.82 90.56 (3) 99.59 113.88 172.29 (4) 108.002013-14 64.43 70.13 196.43 90.72 81.57 82.30 103.66 163.08 94.872014-15 64.48 73.11 218.28 90.74 83.64 80.99 103.45 168.25 96.652015-16 60.41 75.83 243.99 97.93 87.68 87.42 107.67 (5) 180.86 101.912016-17 55.75 69.90 221.53 89.80 80.26 82.19 98.00 (6) 165.70 93.302017-18 55.81 73.67 251.16 94.18 82.98 84.36 98.61 168.01 96.222018-19 64.18 91.91 260.65 117.16 103.68 97.22 121.06 195.01 117.14
Notes: These data should be read in conjunction with the explanatory notes and other expenditure tables in this publication.
Figure(s) may be incomplete for any period or jurisdiction due to some unavailable expenditure figures that are used to derive these numbers.
(1) Expenditure estimated at 40.0% of turnover (subscriptions), from this period on.
(2) Data only available for three months April - June 2010.
(3) Figure represents sales less prizes and commission, from this period on.
(4) Data are for turnover minus prizes won by players, from this period on.
(5) Expenditure estimated at 40.0% of turnover, except for the 'Set for Life' lottery product estimated at 36.8% of turnover (introduced in 2015–16).
(6) Net sales (exclude agent commission), from this period on.
AUSTRALIA
Value ($)
ACT NSW NT QLD SA TAS VIC WA
Australian Gambling Statistics, 1993–94 to 2018–2019, 36th edition
114

TABLE LOTTO 8REAL PER CAPITA LOTTO-TATTSLOTTO EXPENDITURE
1993-94 92.05 79.07 124.25 108.90 103.64 113.55 141.90 144.93 110.021994-95 93.35 86.84 139.71 115.58 98.97 111.38 145.29 159.62 115.801995-96 93.76 86.54 163.10 109.66 97.96 103.07 143.19 169.56 115.011996-97 87.10 88.37 147.51 104.17 95.26 79.74 128.10 165.12 109.401997-98 89.33 90.61 154.49 109.86 102.34 78.64 132.34 172.85 113.691998-99 89.70 90.20 149.12 133.90 105.00 77.63 135.71 179.52 119.581999-00 87.22 86.44 143.74 130.93 104.73 76.32 131.53 176.80 116.362000-01 91.57 105.19 137.25 130.47 105.70 78.36 130.78 174.65 122.432001-02 84.77 102.73 128.53 124.83 102.16 79.04 (1) 126.29 (1) 166.17 118.202002-03 89.27 108.86 122.42 129.03 106.53 81.00 132.91 179.73 124.492003-04 83.86 106.98 117.76 124.74 105.83 79.15 131.75 181.90 122.812004-05 80.50 107.81 117.73 123.74 102.35 76.72 127.35 180.59 121.372005-06 78.74 106.95 132.98 123.05 97.56 91.00 125.72 182.26 120.872006-07 78.70 106.75 126.17 126.25 93.85 92.36 124.98 187.48 121.542007-08 77.48 109.82 122.92 125.22 94.64 92.72 125.25 192.64 123.062008-09 80.14 115.72 123.99 130.45 96.75 86.02 125.55 204.00 127.432009-10 79.69 23.49 (2) 121.84 124.36 91.00 95.46 119.60 187.66 92.942010-11 68.95 78.25 110.11 113.85 85.97 85.14 110.80 171.97 104.062011-12 68.32 80.27 122.06 122.05 92.81 89.80 119.45 184.61 110.712012-13 79.59 90.07 184.29 131.40 101.01 (3) 111.08 127.02 192.16 (4) 120.462013-14 70.01 76.21 213.46 98.58 88.64 89.43 112.65 177.22 103.102014-15 68.89 78.10 233.20 96.94 89.36 86.53 110.52 179.76 103.252015-16 63.65 79.89 257.06 103.17 92.37 92.11 113.43 (5) 190.55 107.372016-17 57.72 72.37 229.37 92.98 83.10 85.10 101.47 (6) 171.56 96.602017-18 56.70 74.85 255.18 95.69 84.31 85.71 100.19 170.71 97.762018-19 64.18 91.91 260.65 117.16 103.68 97.22 121.06 195.01 117.14
Notes: These data should be read in conjunction with the explanatory notes and other expenditure tables in this publication.
Figure(s) may be incomplete for any period or jurisdiction due to some unavailable expenditure figures that are used to derive these numbers.
(1) Expenditure estimated at 40.0% of turnover (subscriptions), from this period on.
(2) Data only available for three months April - June 2010.
(3) Figure represents sales less prizes and commission, from this period on.
(4) Data are for turnover minus prizes won by players, from this period on.
(5) Expenditure estimated at 40.0% of turnover, except for the 'Set for Life' lottery product estimated at 36.8% of turnover (introduced in 2015–16).
(6) Net sales (exclude agent commission), from this period on.
AUSTRALIA
Value ($)
ACT NSW NT QLD SA TAS VIC WA
Australian Gambling Statistics, 1993–94 to 2018–2019, 36th edition
115
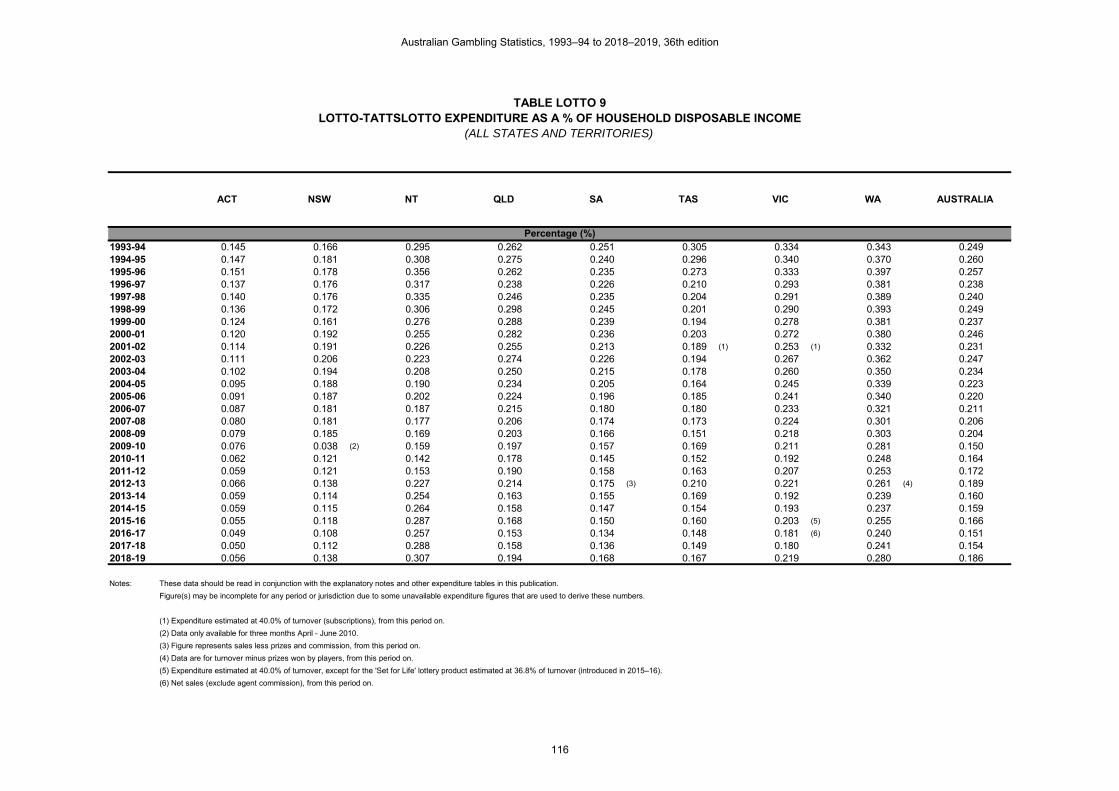
TABLE LOTTO 9LOTTO-TATTSLOTTO EXPENDITURE AS A % OF HOUSEHOLD DISPOSABLE INCOME
(ALL STATES AND TERRITORIES)
1993-94 0.145 0.166 0.295 0.262 0.251 0.305 0.334 0.343 0.2491994-95 0.147 0.181 0.308 0.275 0.240 0.296 0.340 0.370 0.2601995-96 0.151 0.178 0.356 0.262 0.235 0.273 0.333 0.397 0.2571996-97 0.137 0.176 0.317 0.238 0.226 0.210 0.293 0.381 0.2381997-98 0.140 0.176 0.335 0.246 0.235 0.204 0.291 0.389 0.2401998-99 0.136 0.172 0.306 0.298 0.245 0.201 0.290 0.393 0.2491999-00 0.124 0.161 0.276 0.288 0.239 0.194 0.278 0.381 0.2372000-01 0.120 0.192 0.255 0.282 0.236 0.203 0.272 0.380 0.2462001-02 0.114 0.191 0.226 0.255 0.213 0.189 (1) 0.253 (1) 0.332 0.2312002-03 0.111 0.206 0.223 0.274 0.226 0.194 0.267 0.362 0.2472003-04 0.102 0.194 0.208 0.250 0.215 0.178 0.260 0.350 0.2342004-05 0.095 0.188 0.190 0.234 0.205 0.164 0.245 0.339 0.2232005-06 0.091 0.187 0.202 0.224 0.196 0.185 0.241 0.340 0.2202006-07 0.087 0.181 0.187 0.215 0.180 0.180 0.233 0.321 0.2112007-08 0.080 0.181 0.177 0.206 0.174 0.173 0.224 0.301 0.2062008-09 0.079 0.185 0.169 0.203 0.166 0.151 0.218 0.303 0.2042009-10 0.076 0.038 (2) 0.159 0.197 0.157 0.169 0.211 0.281 0.1502010-11 0.062 0.121 0.142 0.178 0.145 0.152 0.192 0.248 0.1642011-12 0.059 0.121 0.153 0.190 0.158 0.163 0.207 0.253 0.1722012-13 0.066 0.138 0.227 0.214 0.175 (3) 0.210 0.221 0.261 (4) 0.1892013-14 0.059 0.114 0.254 0.163 0.155 0.169 0.192 0.239 0.1602014-15 0.059 0.115 0.264 0.158 0.147 0.154 0.193 0.237 0.1592015-16 0.055 0.118 0.287 0.168 0.150 0.160 0.203 (5) 0.255 0.1662016-17 0.049 0.108 0.257 0.153 0.134 0.148 0.181 (6) 0.240 0.1512017-18 0.050 0.112 0.288 0.158 0.136 0.149 0.180 0.241 0.1542018-19 0.056 0.138 0.307 0.194 0.168 0.167 0.219 0.280 0.186
Notes: These data should be read in conjunction with the explanatory notes and other expenditure tables in this publication.
Figure(s) may be incomplete for any period or jurisdiction due to some unavailable expenditure figures that are used to derive these numbers.
(1) Expenditure estimated at 40.0% of turnover (subscriptions), from this period on.
(2) Data only available for three months April - June 2010.
(3) Figure represents sales less prizes and commission, from this period on.
(4) Data are for turnover minus prizes won by players, from this period on.
(5) Expenditure estimated at 40.0% of turnover, except for the 'Set for Life' lottery product estimated at 36.8% of turnover (introduced in 2015–16).
(6) Net sales (exclude agent commission), from this period on.
Percentage (%)
TAS VIC WA AUSTRALIAACT NSW NT QLD SA
Australian Gambling Statistics, 1993–94 to 2018–2019, 36th edition
116

TABLE INSTANT LOTTO 1INSTANT LOTTERY TURNOVER
1993-94 6.975 179.576 4.676 220.353 38.374 13.995 102.715 69.510 636.1741994-95 6.380 177.557 4.008 215.393 29.697 12.357 83.761 71.037 600.1901995-96 5.714 170.568 3.365 192.308 26.298 10.485 72.425 78.656 559.8191996-97 5.177 166.073 2.812 205.271 25.359 8.968 60.443 75.170 549.2731997-98 5.465 171.288 3.490 236.684 25.833 9.023 59.174 74.145 585.1021998-99 5.585 169.193 3.530 247.465 28.860 8.806 59.536 79.969 602.9441999-00 6.452 181.542 3.792 252.629 30.866 9.037 64.036 84.063 632.4172000-01 6.105 177.684 3.751 215.470 37.099 8.455 57.453 72.623 578.6402001-02 6.085 189.937 3.310 220.941 37.920 8.479 55.899 73.569 596.1402002-03 6.049 185.906 3.380 217.467 39.864 8.226 59.417 78.635 598.9442003-04 5.982 179.301 3.671 224.850 39.812 8.308 61.965 81.773 605.6622004-05 5.957 180.507 3.659 226.902 40.343 8.113 57.457 81.977 604.9152005-06 5.575 162.914 3.853 221.818 38.383 8.305 57.206 83.430 581.4842006-07 5.402 148.841 3.665 231.304 37.139 8.100 57.951 97.253 589.6552007-08 6.534 152.146 3.210 232.424 39.929 8.276 54.011 103.869 600.3992008-09 5.145 161.426 3.460 234.122 38.886 8.986 43.536 102.377 597.9382009-10 5.781 30.966 (1) 3.996 226.588 40.189 11.486 39.373 99.552 457.9312010-11 4.540 135.485 4.178 215.196 39.113 (2) 10.893 42.568 98.812 550.7852011-12 5.907 140.688 4.265 217.765 40.737 11.927 51.458 100.041 572.7882012-13 5.603 121.756 3.745 196.027 38.506 10.386 43.465 94.956 (3) 514.4442013-14 5.323 120.716 4.190 191.237 35.667 10.687 39.724 96.896 504.4402014-15 5.380 125.220 4.761 194.644 32.382 11.685 40.512 96.769 511.3532015-16 5.491 123.990 4.425 189.644 32.416 11.741 49.142 96.158 513.0072016-17 4.622 118.230 4.097 183.124 33.129 11.596 (4) 57.992 (5) 96.096 508.8872017-18 4.970 112.862 3.990 181.693 33.305 11.531 61.017 107.002 516.3702018-19 4.702 104.291 3.685 169.306 32.001 11.104 59.275 111.867 496.232
Notes: These data should be read in conjunction with the explanatory notes and other turnover tables in this publication.
Figure(s) may be incomplete for any period or jurisdiction due to some unavailable turnover figures that are used to derive these numbers.
(1) Data only available for three months April - June 2010.
(2) Data provided are for gross sales, i.e. include agent commission, from this period on.
(3) Data are for gross sales, from this period on.
(4) Under subscription.
(5) Net sales (exclude agent commission), from this period on.
Value ($ million)
TAS VIC WA AUSTRALIAACT NSW NT QLD SA
Australian Gambling Statistics, 1993–94 to 2018–2019, 36th edition
117

TABLE INSTANT LOTTO 2REAL INSTANT LOTTERY TURNOVER
1993-94 12.962 333.707 8.689 409.483 71.311 26.007 190.876 129.171 1,182.2061994-95 11.482 319.547 7.213 387.639 53.445 22.239 150.743 127.844 1,080.1531995-96 9.863 294.430 5.809 331.957 45.395 18.099 125.018 135.774 966.3441996-97 8.816 282.820 4.789 349.573 43.186 15.272 102.934 128.013 935.4041997-98 9.307 291.701 5.943 403.069 43.993 15.366 100.772 126.268 996.4201998-99 9.399 284.733 5.941 416.457 48.568 14.820 100.193 134.579 1,014.6891999-00 10.608 298.472 6.234 415.345 50.747 14.857 105.281 138.207 1,039.7512000-01 9.464 275.458 5.815 334.037 57.514 13.108 89.068 112.585 897.0492001-02 9.172 286.285 4.989 333.017 57.156 12.780 84.255 110.888 898.5412002-03 8.849 271.947 4.944 318.115 58.314 12.033 86.916 115.029 876.1482003-04 8.543 256.048 5.242 321.094 56.853 11.864 88.488 116.775 864.9072004-05 8.309 251.783 5.104 316.498 56.273 11.317 80.145 114.347 843.7752005-06 7.537 220.243 5.209 299.875 51.890 11.227 77.337 112.789 786.1062006-07 7.093 195.429 4.812 303.703 48.764 10.635 76.090 127.694 774.2192007-08 8.302 193.317 4.079 295.318 50.734 10.515 68.626 131.976 762.8672008-09 6.340 198.906 4.263 288.481 47.915 11.072 53.644 126.147 736.7682009-10 6.958 37.270 (1) 4.809 272.718 48.371 13.824 47.389 119.819 551.1602010-11 5.302 158.228 4.880 251.319 45.679 (2) 12.722 49.713 115.399 643.2402011-12 6.740 160.525 4.867 248.470 46.481 13.609 58.714 114.147 653.5512012-13 6.249 135.800 4.177 218.638 42.948 11.584 48.479 105.909 (3) 573.7832013-14 5.784 131.178 4.553 207.811 38.758 11.613 43.167 105.294 548.1582014-15 5.748 133.779 5.087 207.948 34.595 12.484 43.281 103.383 546.3062015-16 5.785 130.630 4.662 199.800 34.152 12.369 51.774 101.308 540.4812016-17 4.786 122.414 4.242 189.605 34.301 12.006 (4) 60.044 (5) 99.497 526.8962017-18 5.050 114.671 4.054 184.605 33.839 11.715 61.995 108.717 524.6472018-19 4.702 104.291 3.685 169.306 32.001 11.104 59.275 111.867 496.232
Notes: These data should be read in conjunction with the explanatory notes and other turnover tables in this publication.
Figure(s) may be incomplete for any period or jurisdiction due to some unavailable turnover figures that are used to derive these numbers.
(1) Data only available for three months April - June 2010.
(2) Data provided are for gross sales, i.e. include agent commission, from this period on.
(3) Data are for gross sales, from this period on.
(4) Under subscription.
(5) Net sales (exclude agent commission), from this period on.
AUSTRALIA
Value ($ million)
ACT NSW NT QLD SA TAS VIC WA
Australian Gambling Statistics, 1993–94 to 2018–2019, 36th edition
118
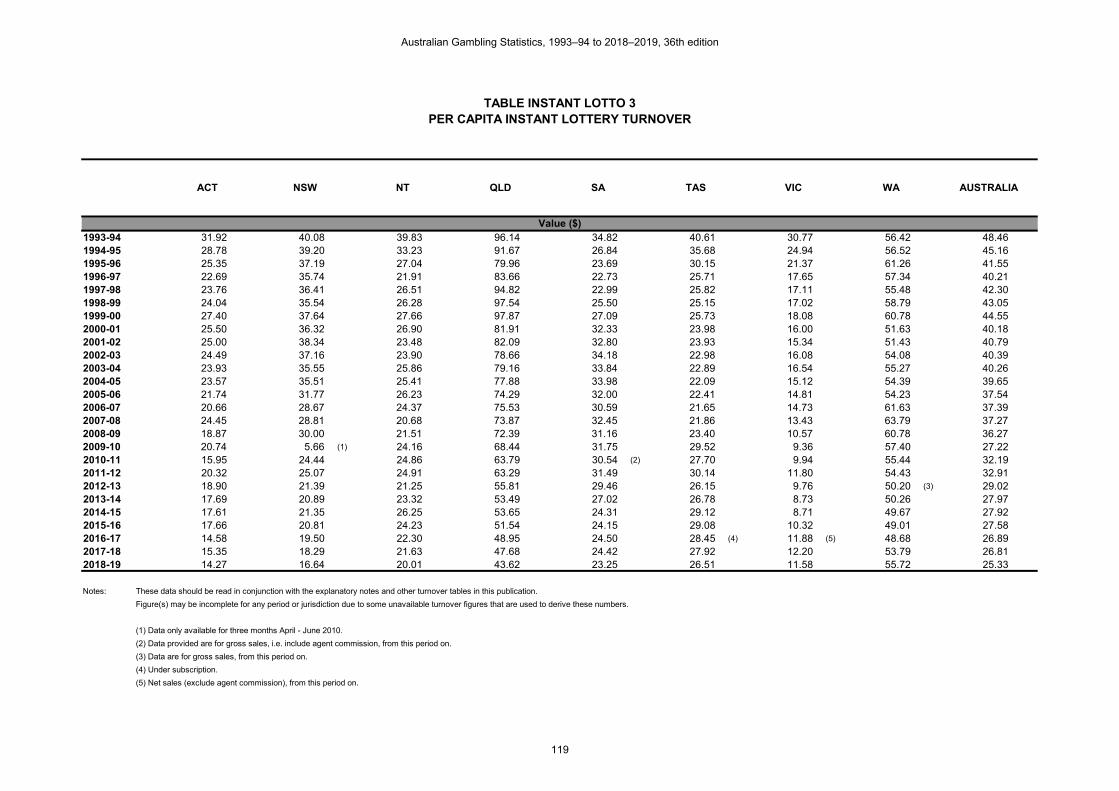
TABLE INSTANT LOTTO 3PER CAPITA INSTANT LOTTERY TURNOVER
1993-94 31.92 40.08 39.83 96.14 34.82 40.61 30.77 56.42 48.461994-95 28.78 39.20 33.23 91.67 26.84 35.68 24.94 56.52 45.161995-96 25.35 37.19 27.04 79.96 23.69 30.15 21.37 61.26 41.551996-97 22.69 35.74 21.91 83.66 22.73 25.71 17.65 57.34 40.211997-98 23.76 36.41 26.51 94.82 22.99 25.82 17.11 55.48 42.301998-99 24.04 35.54 26.28 97.54 25.50 25.15 17.02 58.79 43.051999-00 27.40 37.64 27.66 97.87 27.09 25.73 18.08 60.78 44.552000-01 25.50 36.32 26.90 81.91 32.33 23.98 16.00 51.63 40.182001-02 25.00 38.34 23.48 82.09 32.80 23.93 15.34 51.43 40.792002-03 24.49 37.16 23.90 78.66 34.18 22.98 16.08 54.08 40.392003-04 23.93 35.55 25.86 79.16 33.84 22.89 16.54 55.27 40.262004-05 23.57 35.51 25.41 77.88 33.98 22.09 15.12 54.39 39.652005-06 21.74 31.77 26.23 74.29 32.00 22.41 14.81 54.23 37.542006-07 20.66 28.67 24.37 75.53 30.59 21.65 14.73 61.63 37.392007-08 24.45 28.81 20.68 73.87 32.45 21.86 13.43 63.79 37.272008-09 18.87 30.00 21.51 72.39 31.16 23.40 10.57 60.78 36.272009-10 20.74 5.66 (1) 24.16 68.44 31.75 29.52 9.36 57.40 27.222010-11 15.95 24.44 24.86 63.79 30.54 (2) 27.70 9.94 55.44 32.192011-12 20.32 25.07 24.91 63.29 31.49 30.14 11.80 54.43 32.912012-13 18.90 21.39 21.25 55.81 29.46 26.15 9.76 50.20 (3) 29.022013-14 17.69 20.89 23.32 53.49 27.02 26.78 8.73 50.26 27.972014-15 17.61 21.35 26.25 53.65 24.31 29.12 8.71 49.67 27.922015-16 17.66 20.81 24.23 51.54 24.15 29.08 10.32 49.01 27.582016-17 14.58 19.50 22.30 48.95 24.50 28.45 (4) 11.88 (5) 48.68 26.892017-18 15.35 18.29 21.63 47.68 24.42 27.92 12.20 53.79 26.812018-19 14.27 16.64 20.01 43.62 23.25 26.51 11.58 55.72 25.33
Notes: These data should be read in conjunction with the explanatory notes and other turnover tables in this publication.
Figure(s) may be incomplete for any period or jurisdiction due to some unavailable turnover figures that are used to derive these numbers.
(1) Data only available for three months April - June 2010.
(2) Data provided are for gross sales, i.e. include agent commission, from this period on.
(3) Data are for gross sales, from this period on.
(4) Under subscription.
(5) Net sales (exclude agent commission), from this period on.
Value ($)
TAS VIC WA AUSTRALIAACT NSW NT QLD SA
Australian Gambling Statistics, 1993–94 to 2018–2019, 36th edition
119

TABLE INSTANT LOTTO 4REAL PER CAPITA INSTANT LOTTERY TURNOVER
1993-94 59.32 74.48 74.01 178.65 64.71 75.47 57.17 104.85 90.061994-95 51.79 70.55 59.80 164.97 48.30 64.21 44.89 101.71 81.271995-96 43.76 64.20 46.68 138.03 40.89 52.05 36.89 105.74 71.721996-97 38.64 60.86 37.31 142.47 38.70 43.78 30.06 97.65 68.481997-98 40.47 62.01 45.15 161.48 39.16 43.96 29.13 94.49 72.041998-99 40.45 59.80 44.23 164.15 42.92 42.33 28.64 98.94 72.441999-00 45.05 61.88 45.48 160.91 44.53 42.30 29.73 99.92 73.252000-01 39.54 56.31 41.70 126.98 50.12 37.17 24.80 80.04 62.292001-02 37.68 57.78 35.39 123.74 49.43 36.07 23.13 77.52 61.482002-03 35.83 54.35 34.96 115.07 50.00 33.62 23.53 79.11 59.082003-04 34.18 50.77 36.92 113.05 48.32 32.68 23.62 78.93 57.502004-05 32.87 49.53 35.44 108.63 47.40 30.81 21.09 75.86 55.302005-06 29.39 42.95 35.46 100.44 43.26 30.29 20.02 73.31 50.752006-07 27.12 37.64 31.99 99.17 40.16 28.42 19.33 80.92 49.102007-08 31.07 36.60 26.27 93.86 41.23 27.77 17.07 81.05 47.352008-09 23.25 36.97 26.50 89.20 38.39 28.84 13.03 74.89 44.692009-10 24.96 6.81 (1) 29.08 82.38 38.21 35.53 11.26 69.08 32.762010-11 18.62 28.55 29.04 74.50 35.67 (2) 32.35 11.61 64.75 37.602011-12 23.18 28.60 28.43 72.21 35.93 34.40 13.47 62.11 37.552012-13 21.08 23.86 23.71 62.25 32.86 29.17 10.88 55.99 (3) 32.362013-14 19.22 22.70 25.34 58.13 29.37 29.10 9.48 54.62 30.392014-15 18.81 22.81 28.04 57.32 25.97 31.11 9.30 53.07 29.832015-16 18.61 21.92 25.52 54.30 25.44 30.64 10.87 51.64 29.052016-17 15.09 20.19 23.09 50.68 25.36 29.46 (4) 12.30 (5) 50.41 27.842017-18 15.59 18.58 21.97 48.45 24.81 28.37 12.40 54.65 27.242018-19 14.27 16.64 20.01 43.62 23.25 26.51 11.58 55.72 25.33
Notes: These data should be read in conjunction with the explanatory notes and other turnover tables in this publication.
Figure(s) may be incomplete for any period or jurisdiction due to some unavailable turnover figures that are used to derive these numbers.
(1) Data only available for three months April - June 2010.
(2) Data provided are for gross sales, i.e. include agent commission, from this period on.
(3) Data are for gross sales, from this period on.
(4) Under subscription.
(5) Net sales (exclude agent commission), from this period on.
Value ($)
TAS VIC WA AUSTRALIAACT NSW NT QLD SA
Australian Gambling Statistics, 1993–94 to 2018–2019, 36th edition
120
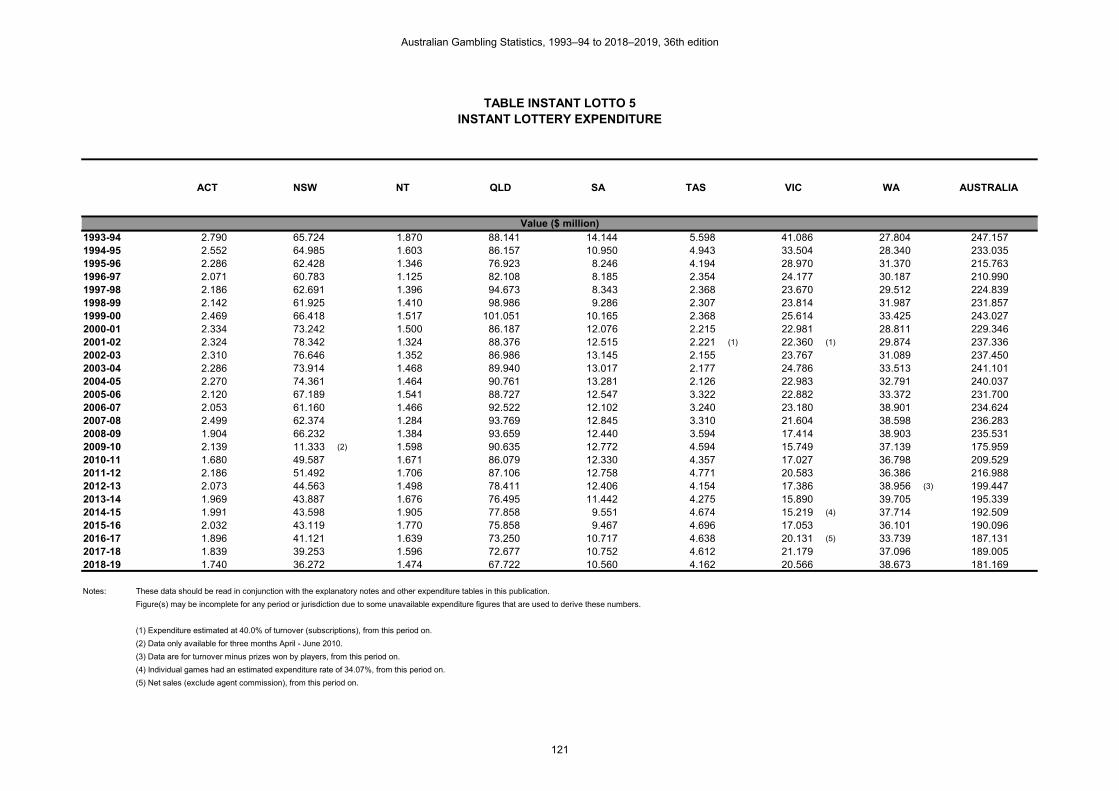
TABLE INSTANT LOTTO 5INSTANT LOTTERY EXPENDITURE
1993-94 2.790 65.724 1.870 88.141 14.144 5.598 41.086 27.804 247.1571994-95 2.552 64.985 1.603 86.157 10.950 4.943 33.504 28.340 233.0351995-96 2.286 62.428 1.346 76.923 8.246 4.194 28.970 31.370 215.7631996-97 2.071 60.783 1.125 82.108 8.185 2.354 24.177 30.187 210.9901997-98 2.186 62.691 1.396 94.673 8.343 2.368 23.670 29.512 224.8391998-99 2.142 61.925 1.410 98.986 9.286 2.307 23.814 31.987 231.8571999-00 2.469 66.418 1.517 101.051 10.165 2.368 25.614 33.425 243.0272000-01 2.334 73.242 1.500 86.187 12.076 2.215 22.981 28.811 229.3462001-02 2.324 78.342 1.324 88.376 12.515 2.221 (1) 22.360 (1) 29.874 237.3362002-03 2.310 76.646 1.352 86.986 13.145 2.155 23.767 31.089 237.4502003-04 2.286 73.914 1.468 89.940 13.017 2.177 24.786 33.513 241.1012004-05 2.270 74.361 1.464 90.761 13.281 2.126 22.983 32.791 240.0372005-06 2.120 67.189 1.541 88.727 12.547 3.322 22.882 33.372 231.7002006-07 2.053 61.160 1.466 92.522 12.102 3.240 23.180 38.901 234.6242007-08 2.499 62.374 1.284 93.769 12.845 3.310 21.604 38.598 236.2832008-09 1.904 66.232 1.384 93.659 12.440 3.594 17.414 38.903 235.5312009-10 2.139 11.333 (2) 1.598 90.635 12.772 4.594 15.749 37.139 175.9592010-11 1.680 49.587 1.671 86.079 12.330 4.357 17.027 36.798 209.5292011-12 2.186 51.492 1.706 87.106 12.758 4.771 20.583 36.386 216.9882012-13 2.073 44.563 1.498 78.411 12.406 4.154 17.386 38.956 (3) 199.4472013-14 1.969 43.887 1.676 76.495 11.442 4.275 15.890 39.705 195.3392014-15 1.991 43.598 1.905 77.858 9.551 4.674 15.219 (4) 37.714 192.5092015-16 2.032 43.119 1.770 75.858 9.467 4.696 17.053 36.101 190.0962016-17 1.896 41.121 1.639 73.250 10.717 4.638 20.131 (5) 33.739 187.1312017-18 1.839 39.253 1.596 72.677 10.752 4.612 21.179 37.096 189.0052018-19 1.740 36.272 1.474 67.722 10.560 4.162 20.566 38.673 181.169
Notes: These data should be read in conjunction with the explanatory notes and other expenditure tables in this publication.
Figure(s) may be incomplete for any period or jurisdiction due to some unavailable expenditure figures that are used to derive these numbers.
(1) Expenditure estimated at 40.0% of turnover (subscriptions), from this period on.
(2) Data only available for three months April - June 2010.
(3) Data are for turnover minus prizes won by players, from this period on.
(4) Individual games had an estimated expenditure rate of 34.07%, from this period on.
(5) Net sales (exclude agent commission), from this period on.
Value ($ million)
TAS VIC WA AUSTRALIAACT NSW NT QLD SA
Australian Gambling Statistics, 1993–94 to 2018–2019, 36th edition
121

TABLE INSTANT LOTTO 6REAL INSTANT LOTTERY EXPENDITURE
1993-94 5.185 122.135 3.476 163.793 26.283 10.403 76.350 51.668 459.2941994-95 4.593 116.953 2.885 155.056 19.707 8.895 60.297 51.003 419.3891995-96 3.945 107.761 2.323 132.783 14.234 7.240 50.007 54.150 372.4441996-97 3.527 103.513 1.916 139.829 13.939 4.009 41.173 51.408 359.3131997-98 3.723 106.762 2.377 161.227 14.208 4.033 40.310 50.258 382.8971998-99 3.605 104.213 2.373 166.583 15.627 3.882 40.076 53.831 390.1901999-00 4.059 109.197 2.494 166.137 16.712 3.893 42.112 54.954 399.5582000-01 3.618 113.545 2.325 133.613 18.721 3.434 35.627 44.665 355.5492001-02 3.503 118.082 1.996 133.206 18.863 3.348 (1) 33.702 (1) 45.028 357.7292002-03 3.379 112.119 1.978 127.245 19.229 3.152 34.767 45.478 347.3472003-04 3.264 105.552 2.096 128.437 18.589 3.109 35.395 47.858 344.3012004-05 3.166 103.724 2.042 126.599 18.525 2.965 32.058 45.739 334.8192005-06 2.866 90.833 2.084 119.950 16.962 4.491 30.934 45.115 313.2352006-07 2.696 80.303 1.925 121.482 15.890 4.254 30.435 51.077 308.0622007-08 3.175 79.252 1.631 119.144 16.321 4.206 27.450 49.043 300.2222008-09 2.346 81.610 1.706 115.405 15.328 4.428 21.457 47.936 290.2172009-10 2.574 13.640 (2) 1.923 109.087 15.372 5.529 18.956 44.700 211.7822010-11 1.962 57.911 1.951 100.528 14.400 5.088 19.885 42.975 244.7012011-12 2.494 58.752 1.947 99.388 14.557 5.444 23.485 41.516 247.5832012-13 2.312 49.703 1.671 87.455 13.837 4.633 19.391 43.449 (3) 222.4532013-14 2.140 47.691 1.821 83.125 12.433 4.646 17.267 43.146 212.2682014-15 2.127 46.578 2.035 83.180 10.203 4.993 16.259 (4) 40.292 205.6682015-16 2.141 45.428 1.865 79.921 9.974 4.947 17.966 38.034 200.2772016-17 1.963 42.576 1.697 75.842 11.096 4.802 20.843 (5) 34.933 193.7532017-18 1.868 39.882 1.622 73.842 10.924 4.686 21.519 37.691 192.0342018-19 1.740 36.272 1.474 67.722 10.560 4.162 20.566 38.673 181.169
Notes: These data should be read in conjunction with the explanatory notes and other expenditure tables in this publication.
Figure(s) may be incomplete for any period or jurisdiction due to some unavailable expenditure figures that are used to derive these numbers.
(1) Expenditure estimated at 40.0% of turnover (subscriptions), from this period on.
(2) Data only available for three months April - June 2010.
(3) Data are for turnover minus prizes won by players, from this period on.
(4) Individual games had an estimated expenditure rate of 34.07%, from this period on.
(5) Net sales (exclude agent commission), from this period on.
AUSTRALIA
Value ($ million)
ACT NSW NT QLD SA TAS VIC WA
Australian Gambling Statistics, 1993–94 to 2018–2019, 36th edition
122

TABLE INSTANT LOTTO 7PER CAPITA INSTANT LOTTERY EXPENDITURE
1993-94 12.77 14.67 15.93 38.45 12.83 16.24 12.31 22.57 18.831994-95 11.51 14.35 13.29 36.67 9.90 14.27 9.98 22.55 17.531995-96 10.14 13.61 10.82 31.98 7.43 12.06 8.55 24.43 16.011996-97 9.08 13.08 8.76 33.46 7.34 6.75 7.06 23.03 15.451997-98 9.51 13.33 10.60 37.93 7.43 6.78 6.84 22.08 16.261998-99 9.22 13.01 10.50 39.02 8.21 6.59 6.81 23.52 16.551999-00 10.49 13.77 11.07 39.15 8.92 6.74 7.23 24.17 17.122000-01 9.75 14.97 10.76 32.76 10.52 6.28 6.40 20.48 15.932001-02 9.55 15.81 9.39 32.84 10.82 6.27 (1) 6.14 (1) 20.89 16.242002-03 9.35 15.32 9.56 31.46 11.27 6.02 6.43 21.38 16.012003-04 9.15 14.66 10.34 31.66 11.06 6.00 6.62 22.65 16.032004-05 8.98 14.63 10.17 31.15 11.19 5.79 6.05 21.76 15.732005-06 8.27 13.10 10.49 29.72 10.46 8.96 5.92 21.69 14.962006-07 7.85 11.78 9.75 30.21 9.97 8.66 5.89 24.65 14.882007-08 9.35 11.81 8.27 29.80 10.44 8.74 5.37 23.70 14.672008-09 6.98 12.31 8.61 28.96 9.97 9.36 4.23 23.10 14.292009-10 7.67 2.07 (2) 9.66 27.38 10.09 11.81 3.74 21.41 10.462010-11 5.90 8.95 9.94 25.52 9.63 11.08 3.98 20.65 12.252011-12 7.52 9.17 9.97 25.31 9.86 12.06 4.72 19.80 12.472012-13 6.99 7.83 8.50 22.32 9.49 10.46 3.90 20.59 (3) 11.252013-14 6.54 7.60 9.33 21.40 8.67 10.71 3.49 20.60 10.832014-15 6.52 7.43 10.50 21.46 7.17 11.65 3.27 (4) 19.36 10.512015-16 6.54 7.24 9.69 20.61 7.05 11.63 3.58 18.40 10.222016-17 5.98 6.78 8.92 19.58 7.92 11.38 4.12 (5) 17.09 9.892017-18 5.68 6.36 8.65 19.07 7.88 11.17 4.24 18.65 9.812018-19 5.28 5.79 8.00 17.45 7.67 9.93 4.02 19.26 9.25
Notes: These data should be read in conjunction with the explanatory notes and other expenditure tables in this publication.
Figure(s) may be incomplete for any period or jurisdiction due to some unavailable expenditure figures that are used to derive these numbers.
(1) Expenditure estimated at 40.0% of turnover (subscriptions), from this period on.
(2) Data only available for three months April - June 2010.
(3) Data are for turnover minus prizes won by players, from this period on.
(4) Individual games had an estimated expenditure rate of 34.07%, from this period on.
(5) Net sales (exclude agent commission), from this period on.
Value ($)
TAS VIC WA AUSTRALIAACT NSW NT QLD SA
Australian Gambling Statistics, 1993–94 to 2018–2019, 36th edition
123

TABLE INSTANT LOTTO 8REAL PER CAPITA INSTANT LOTTERY EXPENDITURE
1993-94 23.73 27.26 29.60 71.46 23.85 30.19 22.87 41.94 34.991994-95 20.72 25.82 23.92 65.99 17.81 25.68 17.95 40.58 31.551995-96 17.50 23.50 18.67 55.21 12.82 20.82 14.76 42.17 27.641996-97 15.46 22.28 14.92 56.99 12.49 11.49 12.02 39.21 26.311997-98 16.19 22.70 18.06 64.59 12.65 11.54 11.65 37.61 27.681998-99 15.51 21.89 17.67 65.66 13.81 11.09 11.46 39.57 27.861999-00 17.24 22.64 18.20 64.36 14.67 11.08 11.89 39.73 28.152000-01 15.12 23.21 16.68 50.79 16.32 9.74 9.92 31.75 24.692001-02 14.39 23.83 14.16 49.49 16.31 9.45 (1) 9.25 (1) 31.48 24.482002-03 13.68 22.41 13.98 46.03 16.49 8.81 9.41 31.28 23.422003-04 13.06 20.93 14.77 45.22 15.80 8.56 9.45 32.35 22.892004-05 12.53 20.41 14.18 43.45 15.60 8.07 8.43 30.35 21.942005-06 11.18 17.71 14.18 40.17 14.14 12.12 8.01 29.33 20.222006-07 10.31 15.47 12.80 39.67 13.09 11.37 7.73 32.37 19.542007-08 11.88 15.01 10.51 37.87 13.26 11.11 6.83 30.12 18.632008-09 8.60 15.17 10.61 35.69 12.28 11.53 5.21 28.46 17.602009-10 9.24 2.49 (2) 11.63 32.95 12.14 14.21 4.50 25.77 12.592010-11 6.89 10.45 11.61 29.80 11.25 12.94 4.64 24.11 14.302011-12 8.58 10.47 11.37 28.88 11.25 13.76 5.39 22.59 14.222012-13 7.80 8.73 9.48 24.90 10.59 11.67 4.35 22.97 (3) 12.552013-14 7.11 8.25 10.13 23.25 9.42 11.64 3.79 22.38 11.772014-15 6.96 7.94 11.22 22.93 7.66 12.44 3.50 (4) 20.68 11.232015-16 6.89 7.62 10.21 21.72 7.43 12.25 3.77 19.39 10.772016-17 6.19 7.02 9.23 20.27 8.20 11.78 4.27 (5) 17.70 10.242017-18 5.77 6.46 8.79 19.38 8.01 11.35 4.30 18.95 9.972018-19 5.28 5.79 8.00 17.45 7.67 9.93 4.02 19.26 9.25
Notes: These data should be read in conjunction with the explanatory notes and other expenditure tables in this publication.
Figure(s) may be incomplete for any period or jurisdiction due to some unavailable expenditure figures that are used to derive these numbers.
(1) Expenditure estimated at 40.0% of turnover (subscriptions), from this period on.
(2) Data only available for three months April - June 2010.
(3) Data are for turnover minus prizes won by players, from this period on.
(4) Individual games had an estimated expenditure rate of 34.07%, from this period on.
(5) Net sales (exclude agent commission), from this period on.
Value ($)
TAS VIC WA AUSTRALIAACT NSW NT QLD SA
Australian Gambling Statistics, 1993–94 to 2018–2019, 36th edition
124

TABLE INSTANT LOTTO 9INSTANT LOTTERY EXPENDITURE AS A % OF HOUSEHOLD DISPOSABLE INCOME
(ALL STATES AND TERRITORIES)
1993-94 0.037 0.057 0.070 0.172 0.058 0.081 0.054 0.099 0.0791994-95 0.033 0.054 0.053 0.157 0.043 0.068 0.042 0.094 0.0711995-96 0.028 0.048 0.041 0.132 0.031 0.055 0.034 0.099 0.0621996-97 0.024 0.044 0.032 0.130 0.030 0.030 0.027 0.090 0.0571997-98 0.025 0.044 0.039 0.145 0.029 0.030 0.026 0.085 0.0591998-99 0.024 0.042 0.036 0.146 0.032 0.029 0.024 0.087 0.0581999-00 0.024 0.042 0.035 0.141 0.033 0.028 0.025 0.086 0.0572000-01 0.020 0.042 0.031 0.110 0.036 0.025 0.021 0.069 0.0502001-02 0.019 0.044 0.025 0.101 0.034 0.023 (1) 0.019 (1) 0.063 0.0482002-03 0.017 0.042 0.026 0.098 0.035 0.021 0.019 0.063 0.0462003-04 0.016 0.038 0.026 0.091 0.032 0.019 0.019 0.062 0.0442004-05 0.015 0.036 0.023 0.082 0.031 0.017 0.016 0.057 0.0402005-06 0.013 0.031 0.021 0.073 0.028 0.025 0.015 0.055 0.0372006-07 0.011 0.026 0.019 0.068 0.025 0.022 0.014 0.055 0.0342007-08 0.012 0.025 0.015 0.062 0.024 0.021 0.012 0.047 0.0312008-09 0.008 0.024 0.014 0.056 0.021 0.020 0.009 0.042 0.0282009-10 0.009 0.004 (2) 0.015 0.052 0.021 0.025 0.008 0.039 0.0202010-11 0.006 0.016 0.015 0.047 0.019 0.023 0.008 0.035 0.0222011-12 0.007 0.016 0.014 0.045 0.019 0.025 0.009 0.031 0.0222012-13 0.006 0.013 0.012 0.041 0.018 0.022 0.008 0.031 (3) 0.0202013-14 0.006 0.012 0.012 0.038 0.017 0.022 0.006 0.030 0.0182014-15 0.006 0.012 0.013 0.037 0.013 0.022 0.006 (4) 0.027 0.0172015-16 0.006 0.011 0.011 0.035 0.012 0.021 0.007 0.026 0.0172016-17 0.005 0.010 0.010 0.033 0.013 0.021 0.008 (5) 0.025 0.0162017-18 0.005 0.010 0.010 0.032 0.013 0.020 0.008 0.027 0.0162018-19 0.005 0.009 0.009 0.029 0.012 0.017 0.007 0.028 0.015
Notes: These data should be read in conjunction with the explanatory notes and other expenditure tables in this publication.
Figure(s) may be incomplete for any period or jurisdiction due to some unavailable expenditure figures that are used to derive these numbers.
(1) Expenditure estimated at 40.0% of turnover (subscriptions), from this period on.
(2) Data only available for three months April - June 2010.
(3) Data are for turnover minus prizes won by players, from this period on.
(4) Individual games had an estimated expenditure rate of 34.07%, from this period on.
(5) Net sales (exclude agent commission), from this period on.
Percentage (%)
TAS VIC WA AUSTRALIAACT NSW NT QLD SA
Australian Gambling Statistics, 1993–94 to 2018–2019, 36th edition
125

TABLE POOLS 1POOLS TURNOVER
1993-94 0.215 11.297 0.119 7.173 2.255 0.518 4.332 3.812 29.7211994-95 0.122 7.593 0.076 4.555 0.817 0.384 3.004 1.808 18.3591995-96 0.208 7.758 0.088 4.668 0.787 0.315 3.529 2.353 19.7061996-97 0.144 7.069 0.066 3.417 0.570 0.257 2.658 1.800 15.9811997-98 0.181 7.145 0.052 3.002 0.566 0.237 2.488 1.585 15.2561998-99 0.192 7.589 0.073 3.232 0.609 0.220 2.512 1.565 15.9921999-00 0.216 8.301 0.077 3.383 0.607 0.223 2.201 1.479 16.4872000-01 0.242 8.774 0.078 3.824 0.716 0.379 2.220 1.641 17.8742001-02 0.195 7.756 0.072 3.295 0.605 0.180 2.038 1.369 15.5102002-03 0.213 8.056 0.068 3.294 0.742 0.220 2.184 1.378 16.1552003-04 0.207 7.162 0.058 2.978 0.622 0.198 1.905 1.306 14.4362004-05 0.232 7.165 0.073 3.191 0.585 0.205 1.899 1.546 14.8962005-06 0.165 6.435 0.061 2.938 0.558 0.181 1.734 1.171 13.2432006-07 0.221 6.141 0.059 3.103 0.518 0.166 1.757 0.959 12.9242007-08 0.301 6.548 0.051 3.218 0.581 0.166 2.055 0.975 13.8952008-09 0.212 6.600 0.046 3.440 0.694 0.227 2.459 1.480 15.1582009-10 0.192 1.476 (1) 0.047 3.299 0.665 0.237 2.149 1.785 9.8492010-11 0.160 5.676 0.051 2.877 0.631 0.199 1.942 1.295 12.8312011-12 0.163 6.333 0.061 3.031 0.694 0.200 2.593 1.431 14.5062012-13 0.164 4.983 0.099 3.130 0.692 0.276 2.937 1.421 13.7022013-14 0.149 4.160 0.177 2.481 0.595 0.237 2.257 1.077 11.1332014-15 0.125 4.229 0.219 2.316 0.507 0.193 2.164 1.355 (2) 11.1082015-16 0.079 3.484 0.191 1.940 0.500 0.163 1.559 1.048 8.9632016-17 0.096 4.239 0.222 2.488 0.645 0.196 2.396 (3) 1.201 R 11.483 R
2017-18 0.112 5.132 0.256 2.891 0.719 0.226 3.037 1.368 13.7412018-19 - (4) - (4) - (4) - (4) - (4) 0.022 - (4) - (4) 0.022
Notes: These data should be read in conjunction with the explanatory notes and other turnover tables in this publication.
Figure(s) may be incomplete for any period or jurisdiction due to some unavailable turnover figures that are used to derive these numbers.
(1) NSW data only available for three months April - June 2010.
(2) Data are for gross sales, from this period on.
(3) Net sales (exclude agent commission), from this period on.
(4) Pools was withdrawn from the Australian Lottery Market on 23 June 2018.
R = Revised data
Value ($ million)
TAS VIC WA AUSTRALIAACT NSW NT QLD SA
Australian Gambling Statistics, 1993–94 to 2018–2019, 36th edition
126

TABLE POOLS 2REAL POOLS TURNOVER
1993-94 0.400 20.993 0.221 13.330 4.190 0.963 8.050 7.084 55.2311994-95 0.220 13.665 0.137 8.198 1.470 0.691 5.406 3.254 33.0401995-96 0.359 13.392 0.152 8.058 1.358 0.544 6.092 4.062 34.0161996-97 0.245 12.038 0.112 5.819 0.971 0.438 4.527 3.065 27.2151997-98 0.308 12.168 0.089 5.112 0.964 0.404 4.237 2.699 25.9811998-99 0.323 12.771 0.123 5.439 1.025 0.370 4.227 2.634 26.9131999-00 0.355 13.648 0.127 5.562 0.998 0.367 3.619 2.432 27.1062000-01 0.375 13.602 0.121 5.928 1.110 0.588 3.442 2.544 27.7102001-02 0.294 11.690 0.109 4.966 0.912 0.271 3.072 2.063 23.3782002-03 0.312 11.784 0.099 4.819 1.085 0.322 3.195 2.016 23.6322003-04 0.296 10.228 0.083 4.253 0.888 0.283 2.720 1.865 20.6152004-05 0.324 9.994 0.102 4.451 0.816 0.286 2.649 2.156 20.7782005-06 0.223 8.699 0.082 3.972 0.754 0.245 2.344 1.583 17.9032006-07 0.290 8.063 0.077 4.074 0.680 0.218 2.307 1.259 16.9692007-08 0.382 8.320 0.065 4.089 0.738 0.211 2.611 1.239 17.6552008-09 0.261 8.132 0.057 4.239 0.855 0.280 3.030 1.824 18.6782009-10 0.231 1.776 (1) 0.056 3.971 0.800 0.285 2.586 2.148 11.8542010-11 0.187 6.629 0.060 3.360 0.737 0.232 2.268 1.512 14.9852011-12 0.186 7.226 0.069 3.458 0.792 0.228 2.959 1.633 16.5512012-13 0.183 5.558 0.110 3.491 0.772 0.308 3.276 1.585 15.2822013-14 0.162 4.520 0.192 2.696 0.647 0.258 2.453 1.170 12.0982014-15 0.134 4.518 0.234 2.474 0.542 0.206 2.312 1.448 (2) 11.8672015-16 0.083 3.671 0.201 2.044 0.527 0.171 1.642 1.104 9.4432016-17 0.099 4.389 0.230 2.576 0.668 0.203 2.481 (3) 1.244 R 11.890 R
2017-18 0.114 5.214 0.260 2.938 0.731 0.230 3.085 1.390 13.9612018-19 - (4) - (4) - (4) - (4) - (4) 0.022 - (4) - (4) 0.022
Notes: These data should be read in conjunction with the explanatory notes and other turnover tables in this publication.
Figure(s) may be incomplete for any period or jurisdiction due to some unavailable turnover figures that are used to derive these numbers.
(1) NSW data only available for three months April - June 2010.
(2) Data are for gross sales, from this period on.
(3) Net sales (exclude agent commission), from this period on.
(4) Pools was withdrawn from the Australian Lottery Market on 23 June 2018.
R = Revised data
Value ($ million)
TAS VIC WA AUSTRALIAACT NSW NT QLD SA
Australian Gambling Statistics, 1993–94 to 2018–2019, 36th edition
127

TABLE POOLS 3PER CAPITA POOLS TURNOVER
1993-94 0.98 2.52 1.01 3.13 2.05 1.50 1.30 3.09 2.261994-95 0.55 1.68 0.63 1.94 0.74 1.11 0.89 1.44 1.381995-96 0.92 1.69 0.71 1.94 0.71 0.91 1.04 1.83 1.461996-97 0.63 1.52 0.51 1.39 0.51 0.74 0.78 1.37 1.171997-98 0.79 1.52 0.40 1.20 0.50 0.68 0.72 1.19 1.101998-99 0.83 1.59 0.54 1.27 0.54 0.63 0.72 1.15 1.141999-00 0.92 1.72 0.56 1.31 0.53 0.63 0.62 1.07 1.162000-01 1.01 1.79 0.56 1.45 0.62 1.07 0.62 1.17 1.242001-02 0.80 1.57 0.51 1.22 0.52 0.51 0.56 0.96 1.062002-03 0.86 1.61 0.48 1.19 0.64 0.61 0.59 0.95 1.092003-04 0.83 1.42 0.41 1.05 0.53 0.55 0.51 0.88 0.962004-05 0.92 1.41 0.51 1.10 0.49 0.56 0.50 1.03 0.982005-06 0.64 1.25 0.41 0.98 0.47 0.49 0.45 0.76 0.852006-07 0.85 1.18 0.39 1.01 0.43 0.44 0.45 0.61 0.822007-08 1.13 1.24 0.33 1.02 0.47 0.44 0.51 0.60 0.862008-09 0.78 1.23 0.29 1.06 0.56 0.59 0.60 0.88 0.922009-10 0.69 0.27 (1) 0.28 1.00 0.53 0.61 0.51 1.03 0.592010-11 0.56 1.02 0.30 0.85 0.49 0.51 0.45 0.73 0.752011-12 0.56 1.13 0.36 0.88 0.54 0.51 0.59 0.78 0.832012-13 0.55 0.88 0.56 0.89 0.53 0.69 0.66 0.75 0.772013-14 0.50 0.72 0.98 0.69 0.45 0.59 0.50 0.56 0.622014-15 0.41 0.72 1.21 0.64 0.38 0.48 0.47 0.70 (2) 0.612015-16 0.25 0.58 1.04 0.53 0.37 0.40 0.33 0.53 0.482016-17 0.30 0.70 1.21 0.66 0.48 0.48 0.49 (3) 0.61 R 0.61 R
2017-18 0.35 0.83 1.39 0.76 0.53 0.55 0.61 0.69 0.712018-19 - (4) - (4) - (4) - (4) - (4) 0.05 - (4) - (4) 0.00
Notes: These data should be read in conjunction with the explanatory notes and other turnover tables in this publication.
Figure(s) may be incomplete for any period or jurisdiction due to some unavailable turnover figures that are used to derive these numbers.
(1) NSW data only available for three months April - June 2010.
(2) Data are for gross sales, from this period on.
(3) Net sales (exclude agent commission), from this period on.
(4) Pools was withdrawn from the Australian Lottery Market on 23 June 2018.
R = Revised data
Value ($)
TAS VIC WA AUSTRALIAACT NSW NT QLD SA
Australian Gambling Statistics, 1993–94 to 2018–2019, 36th edition
128

TABLE POOLS 4REAL PER CAPITA POOLS TURNOVER
1993-94 1.83 4.69 1.88 5.82 3.80 2.79 2.41 5.75 4.211994-95 0.99 3.02 1.13 3.49 1.33 2.00 1.61 2.59 2.491995-96 1.59 2.92 1.22 3.35 1.22 1.56 1.80 3.16 2.521996-97 1.07 2.59 0.88 2.37 0.87 1.25 1.32 2.34 1.991997-98 1.34 2.59 0.67 2.05 0.86 1.15 1.22 2.02 1.881998-99 1.39 2.68 0.91 2.14 0.91 1.06 1.21 1.94 1.921999-00 1.51 2.83 0.92 2.15 0.88 1.04 1.02 1.76 1.912000-01 1.57 2.78 0.87 2.25 0.97 1.67 0.96 1.81 1.922001-02 1.21 2.36 0.77 1.85 0.79 0.77 0.84 1.44 1.602002-03 1.26 2.36 0.70 1.74 0.93 0.90 0.86 1.39 1.592003-04 1.18 2.03 0.58 1.50 0.75 0.78 0.73 1.26 1.372004-05 1.28 1.97 0.71 1.53 0.69 0.78 0.70 1.43 1.362005-06 0.87 1.70 0.56 1.33 0.63 0.66 0.61 1.03 1.162006-07 1.11 1.55 0.52 1.33 0.56 0.58 0.59 0.80 1.082007-08 1.43 1.58 0.42 1.30 0.60 0.56 0.65 0.76 1.102008-09 0.96 1.51 0.35 1.31 0.69 0.73 0.74 1.08 1.132009-10 0.83 0.32 (1) 0.34 1.20 0.63 0.73 0.61 1.24 0.702010-11 0.66 1.20 0.35 1.00 0.58 0.59 0.53 0.85 0.882011-12 0.64 1.29 0.41 1.01 0.61 0.58 0.68 0.89 0.952012-13 0.62 0.98 0.63 0.99 0.59 0.78 0.74 0.84 0.862013-14 0.54 0.78 1.07 0.75 0.49 0.65 0.54 0.61 0.672014-15 0.44 0.77 1.29 0.68 0.41 0.51 0.50 0.74 (2) 0.652015-16 0.27 0.62 1.10 0.56 0.39 0.42 0.34 0.56 0.512016-17 0.31 0.72 1.25 0.69 0.49 0.50 0.51 (3) 0.63 R 0.63 R
2017-18 0.35 0.85 1.41 0.77 0.54 0.56 0.62 0.70 0.722018-19 - (4) - (4) - (4) - (4) - (4) 0.05 - (4) - (4) 0.00
Notes: These data should be read in conjunction with the explanatory notes and other turnover tables in this publication.
Figure(s) may be incomplete for any period or jurisdiction due to some unavailable turnover figures that are used to derive these numbers.
(1) NSW data only available for three months April - June 2010.
(2) Data are for gross sales, from this period on.
(3) Net sales (exclude agent commission), from this period on.
(4) Pools was withdrawn from the Australian Lottery Market on 23 June 2018.
R = Revised data
Value ($)
TAS VIC WA AUSTRALIAACT NSW NT QLD SA
Australian Gambling Statistics, 1993–94 to 2018–2019, 36th edition
129

TABLE POOLS 5POOLS EXPENDITURE
1993-94 0.108 5.649 0.047 3.587 1.068 0.259 2.166 2.122 15.0041994-95 0.061 3.797 0.030 2.278 0.386 0.192 1.502 0.953 9.1981995-96 0.104 3.879 0.035 2.334 0.372 0.157 1.765 1.234 9.8801996-97 0.064 3.535 0.026 1.708 0.269 0.086 1.329 0.943 7.9601997-98 0.179 3.573 0.021 1.501 0.267 0.080 1.244 0.835 7.7001998-99 0.085 3.795 0.029 1.728 0.288 0.077 1.256 0.823 8.0811999-00 0.096 4.151 0.031 1.807 0.282 0.078 1.101 0.779 8.3252000-01 0.106 4.630 0.039 2.038 0.333 0.133 1.110 0.866 9.2552001-02 0.874 4.126 0.036 1.760 0.281 0.063 (1) 1.019 (1) 0.727 8.8862002-03 0.095 4.296 0.034 1.759 0.344 0.077 1.092 0.732 8.4292003-04 0.092 3.825 0.029 1.591 0.288 0.069 0.953 0.694 7.5412004-05 0.102 3.809 0.036 1.703 0.272 0.072 0.950 0.822 7.7662005-06 0.067 3.446 0.030 1.568 0.260 0.091 0.867 0.622 6.9512006-07 0.092 3.256 0.030 1.654 0.241 0.083 0.878 0.510 6.7442007-08 0.132 3.497 0.026 1.714 0.270 0.083 1.027 0.519 7.2682008-09 0.098 3.766 0.023 1.832 0.321 0.114 1.229 0.679 8.0622009-10 0.090 0.738 (2) 0.023 1.757 0.308 0.118 1.074 0.966 5.0742010-11 0.075 2.838 0.025 1.534 0.293 0.099 0.971 0.701 6.5362011-12 0.080 3.166 0.030 1.615 0.322 0.100 1.296 0.774 7.3832012-13 0.080 2.491 0.049 1.667 0.321 0.138 1.469 0.770 (3) 6.9852013-14 0.073 2.080 0.088 1.241 0.277 0.119 1.129 0.583 5.5902014-15 0.061 2.114 0.109 1.158 0.236 0.097 1.082 0.734 5.5902015-16 0.040 1.742 0.095 0.970 0.232 0.081 0.780 0.568 4.5082016-17 0.053 2.119 0.111 1.244 0.300 0.098 1.198 0.651 5.7742017-18 0.056 2.566 0.128 1.446 R 0.335 0.113 1.518 0.741 6.903 R
2018-19 - (4) - (4) - (4) - (4) - (4) 0.003 - (4) - (4) 0.003
Notes: These data should be read in conjunction with the explanatory notes and other expenditure tables in this publication.
Figure(s) may be incomplete for any period or jurisdiction due to some unavailable expenditure figures that are used to derive these numbers.
(1) Expenditure estimated at 50.0% of turnover (subscriptions), from this period on.
(2) Data only available for three months April-June 2010.
(3) Data are for turnover minus prizes won by players, from this period on.
(4) Pools was withdrawn from the Australian Lottery Market on 23 June 2018.
R = Revised data
Value ($ million)
TAS VIC WA AUSTRALIAACT NSW NT QLD SA
Australian Gambling Statistics, 1993–94 to 2018–2019, 36th edition
130

TABLE POOLS 6REAL POOLS EXPENDITURE
1993-94 0.200 10.497 0.087 6.665 1.984 0.481 4.025 3.944 27.8831994-95 0.110 6.833 0.053 4.099 0.694 0.346 2.703 1.715 16.5531995-96 0.180 6.696 0.061 4.029 0.642 0.271 3.047 2.130 17.0551996-97 0.109 6.020 0.045 2.909 0.458 0.146 2.263 1.606 13.5561997-98 0.305 6.085 0.036 2.556 0.455 0.136 2.119 1.422 13.1131998-99 0.143 6.387 0.049 2.908 0.485 0.130 2.114 1.385 13.6001999-00 0.158 6.825 0.051 2.971 0.464 0.128 1.810 1.281 13.6872000-01 0.164 7.178 0.060 3.159 0.516 0.206 1.721 1.343 14.3472001-02 1.317 6.219 0.054 2.653 0.424 0.095 (1) 1.536 (1) 1.096 13.3942002-03 0.139 6.284 0.050 2.573 0.503 0.113 1.597 1.071 12.3302003-04 0.131 5.462 0.041 2.272 0.411 0.099 1.361 0.991 10.7692004-05 0.142 5.313 0.050 2.375 0.379 0.100 1.325 1.147 10.8332005-06 0.091 4.659 0.041 2.120 0.351 0.123 1.172 0.841 9.3982006-07 0.121 4.275 0.039 2.172 0.316 0.109 1.153 0.670 8.8542007-08 0.168 4.443 0.033 2.178 0.343 0.105 1.305 0.659 9.2352008-09 0.121 4.640 0.028 2.257 0.396 0.140 1.514 0.837 9.9342009-10 0.108 0.888 (2) 0.028 2.115 0.371 0.142 1.293 1.163 6.1072010-11 0.088 3.314 0.029 1.791 0.342 0.116 1.134 0.819 7.6332011-12 0.091 3.612 0.034 1.843 0.367 0.114 1.479 0.883 8.4242012-13 0.089 2.778 0.055 1.859 0.358 0.154 1.638 0.859 (3) 7.7912013-14 0.079 2.260 0.096 1.349 0.301 0.129 1.226 0.634 6.0742014-15 0.065 2.258 0.117 1.237 0.252 0.103 1.156 0.784 5.9722015-16 0.042 1.835 0.100 1.022 0.244 0.086 0.821 0.598 4.7502016-17 0.055 2.194 0.115 1.288 0.311 0.102 1.240 0.674 5.9792017-18 0.057 2.607 0.130 1.469 R 0.340 0.115 1.543 0.753 7.014 R
2018-19 - (4) - (4) - (4) - (4) - (4) 0.003 - (4) - (4) 0.003
Notes: These data should be read in conjunction with the explanatory notes and other expenditure tables in this publication.
Figure(s) may be incomplete for any period or jurisdiction due to some unavailable expenditure figures that are used to derive these numbers.
(1) Expenditure estimated at 50.0% of turnover (subscriptions), from this period on.
(2) Data only available for three months April-June 2010.
(3) Data are for turnover minus prizes won by players, from this period on.
(4) Pools was withdrawn from the Australian Lottery Market on 23 June 2018.
R = Revised data
Value ($ million)
TAS VIC WA AUSTRALIAACT NSW NT QLD SA
Australian Gambling Statistics, 1993–94 to 2018–2019, 36th edition
131

TABLE POOLS 7PER CAPITA POOLS EXPENDITURE
1993-94 0.49 1.26 0.40 1.56 0.97 0.75 0.65 1.72 1.141994-95 0.28 0.84 0.25 0.97 0.35 0.55 0.45 0.76 0.691995-96 0.46 0.85 0.28 0.97 0.34 0.45 0.52 0.96 0.731996-97 0.28 0.76 0.21 0.70 0.24 0.25 0.39 0.72 0.581997-98 0.78 0.76 0.16 0.60 0.24 0.23 0.36 0.62 0.561998-99 0.37 0.80 0.22 0.68 0.25 0.22 0.36 0.61 0.581999-00 0.41 0.86 0.22 0.70 0.25 0.22 0.31 0.56 0.592000-01 0.44 0.95 0.28 0.77 0.29 0.38 0.31 0.62 0.642001-02 3.59 0.83 0.26 0.65 0.24 0.18 (1) 0.28 (1) 0.51 0.612002-03 0.38 0.86 0.24 0.64 0.29 0.22 0.30 0.50 0.572003-04 0.37 0.76 0.20 0.56 0.24 0.19 0.25 0.47 0.502004-05 0.40 0.75 0.25 0.58 0.23 0.20 0.25 0.55 0.512005-06 0.26 0.67 0.21 0.53 0.22 0.25 0.22 0.40 0.452006-07 0.35 0.63 0.20 0.54 0.20 0.22 0.22 0.32 0.432007-08 0.49 0.66 0.17 0.54 0.22 0.22 0.26 0.32 0.452008-09 0.36 0.70 0.14 0.57 0.26 0.30 0.30 0.40 0.492009-10 0.32 0.13 (2) 0.14 0.53 0.24 0.30 0.26 0.56 0.302010-11 0.26 0.51 0.15 0.45 0.23 0.25 0.23 0.39 0.382011-12 0.28 0.56 0.18 0.47 0.25 0.25 0.30 0.42 0.422012-13 0.27 0.44 0.28 0.47 0.25 0.35 0.33 0.41 (3) 0.392013-14 0.24 0.36 0.49 0.35 0.21 0.30 0.25 0.30 0.312014-15 0.20 0.36 0.60 0.32 0.18 0.24 0.23 0.38 0.312015-16 0.13 0.29 0.52 0.26 0.17 0.20 0.16 0.29 0.242016-17 0.17 0.35 0.60 0.33 0.22 0.24 0.25 0.33 0.312017-18 0.17 0.42 0.69 0.38 R 0.25 0.27 0.30 0.37 0.36 R
2018-19 - (4) - (4) - (4) - (4) - (4) 0.01 - (4) - (4) 0.00
Notes: These data should be read in conjunction with the explanatory notes and other expenditure tables in this publication.
Figure(s) may be incomplete for any period or jurisdiction due to some unavailable expenditure figures that are used to derive these numbers.
(1) Expenditure estimated at 50.0% of turnover (subscriptions), from this period on.
(2) Data only available for three months April-June 2010.
(3) Data are for turnover minus prizes won by players, from this period on.
(4) Pools was withdrawn from the Australian Lottery Market on 23 June 2018.
R = Revised data
Value ($)
TAS VIC WA AUSTRALIAACT NSW NT QLD SA
Australian Gambling Statistics, 1993–94 to 2018–2019, 36th edition
132

TABLE POOLS 8REAL PER CAPITA POOLS EXPENDITURE
1993-94 0.91 2.34 0.74 2.91 1.80 1.40 1.21 3.20 2.121994-95 0.50 1.51 0.44 1.74 0.63 1.00 0.80 1.36 1.251995-96 0.80 1.46 0.49 1.68 0.58 0.78 0.90 1.66 1.271996-97 0.48 1.30 0.35 1.19 0.41 0.42 0.66 1.22 0.991997-98 1.33 1.29 0.27 1.02 0.40 0.39 0.61 1.06 0.951998-99 0.62 1.34 0.37 1.15 0.43 0.37 0.60 1.02 0.971999-00 0.67 1.41 0.37 1.15 0.41 0.37 0.51 0.93 0.962000-01 0.69 1.47 0.43 1.20 0.45 0.58 0.48 0.95 1.002001-02 5.41 1.26 0.39 0.99 0.37 0.27 (1) 0.42 (1) 0.77 0.922002-03 0.56 1.26 0.35 0.93 0.43 0.31 0.43 0.74 0.832003-04 0.53 1.08 0.29 0.80 0.35 0.27 0.36 0.67 0.722004-05 0.56 1.05 0.35 0.82 0.32 0.27 0.35 0.76 0.712005-06 0.35 0.91 0.28 0.71 0.29 0.33 0.30 0.55 0.612006-07 0.46 0.82 0.26 0.71 0.26 0.29 0.29 0.42 0.562007-08 0.63 0.84 0.21 0.69 0.28 0.28 0.32 0.40 0.572008-09 0.44 0.86 0.18 0.70 0.32 0.37 0.37 0.50 0.602009-10 0.39 0.16 (2) 0.17 0.64 0.29 0.36 0.31 0.67 0.362010-11 0.31 0.60 0.17 0.53 0.27 0.29 0.26 0.46 0.452011-12 0.31 0.64 0.20 0.54 0.28 0.29 0.34 0.48 0.482012-13 0.30 0.49 0.31 0.53 0.27 0.39 0.37 0.45 (3) 0.442013-14 0.26 0.39 0.53 0.38 0.23 0.32 0.27 0.33 0.342014-15 0.21 0.39 0.64 0.34 0.19 0.26 0.25 0.40 0.332015-16 0.14 0.31 0.55 0.28 0.18 0.21 0.17 0.31 0.262016-17 0.17 0.36 0.63 0.34 0.23 0.25 0.25 0.34 0.322017-18 0.18 0.42 0.70 0.39 R 0.25 0.28 0.31 0.38 0.36 R
2018-19 - (4) - (4) - (4) - (4) - (4) 0.01 - (4) - (4) 0.00
Notes: These data should be read in conjunction with the explanatory notes and other expenditure tables in this publication.
Figure(s) may be incomplete for any period or jurisdiction due to some unavailable expenditure figures that are used to derive these numbers.
(1) Expenditure estimated at 50.0% of turnover (subscriptions), from this period on.
(2) Data only available for three months April-June 2010.
(3) Data are for turnover minus prizes won by players, from this period on.
(4) Pools was withdrawn from the Australian Lottery Market on 23 June 2018.
R = Revised data
Value ($)
TAS VIC WA AUSTRALIAACT NSW NT QLD SA
Australian Gambling Statistics, 1993–94 to 2018–2019, 36th edition
133

TABLE POOLS 9POOLS EXPENDITURE AS A % OF HOUSEHOLD DISPOSABLE INCOME
(ALL STATES AND TERRITORIES)
1993-94 0.001 0.005 0.002 0.007 0.004 0.004 0.003 0.008 0.0051994-95 0.001 0.003 0.001 0.004 0.002 0.003 0.002 0.003 0.0031995-96 0.001 0.003 0.001 0.004 0.001 0.002 0.002 0.004 0.0031996-97 0.001 0.003 0.001 0.003 0.001 0.001 0.002 0.003 0.0021997-98 0.002 0.003 0.001 0.002 0.001 0.001 0.001 0.002 0.0021998-99 0.001 0.003 0.001 0.003 0.001 0.001 0.001 0.002 0.0021999-00 0.001 0.003 0.001 0.003 0.001 0.001 0.001 0.002 0.0022000-01 0.001 0.003 0.001 0.003 0.001 0.002 0.001 0.002 0.0022001-02 0.007 0.002 0.001 0.002 0.001 0.001 (1) 0.001 (1) 0.002 0.0022002-03 0.001 0.002 0.001 0.002 0.001 0.001 0.001 0.001 0.0022003-04 0.001 0.002 0.001 0.002 0.001 0.001 0.001 0.001 0.0012004-05 0.001 0.002 0.001 0.002 0.001 0.001 0.001 0.001 0.0012005-06 0.000 0.002 0.000 0.001 0.001 0.001 0.001 0.001 0.0012006-07 0.001 0.001 0.000 0.001 0.001 0.001 0.001 0.001 0.0012007-08 0.001 0.001 0.000 0.001 0.001 0.001 0.001 0.001 0.0012008-09 0.000 0.001 0.000 0.001 0.001 0.001 0.001 0.001 0.0012009-10 0.000 0.000 (2) 0.000 0.001 0.001 0.001 0.001 0.001 0.0012010-11 0.000 0.001 0.000 0.001 0.000 0.001 0.000 0.001 0.0012011-12 0.000 0.001 0.000 0.001 0.000 0.001 0.001 0.001 0.0012012-13 0.000 0.001 0.000 0.001 0.000 0.001 0.001 0.001 (3) 0.0012013-14 0.000 0.001 0.001 0.001 0.000 0.001 0.000 0.000 0.0012014-15 0.000 0.001 0.001 0.001 0.000 0.000 0.000 0.001 0.0012015-16 0.000 0.000 0.001 0.000 0.000 0.000 0.000 0.000 0.0002016-17 0.000 0.001 0.001 0.001 0.000 0.000 0.000 0.000 0.0002017-18 0.000 0.001 0.001 0.001 R 0.000 0.000 0.001 0.001 0.001 R
2018-19 - (4) - (4) - (4) - (4) - (4) 0.000 - (4) - (4) 0.000
Notes: These data should be read in conjunction with the explanatory notes and other expenditure tables in this publication.
Figure(s) may be incomplete for any period or jurisdiction due to some unavailable expenditure figures that are used to derive these numbers.
(1) Expenditure estimated at 50.0% of turnover (subscriptions), from this period on.
(2) Data only available for three months April-June 2010.
(3) Data are for turnover minus prizes won by players, from this period on.
(4) Pools was withdrawn from the Australian Lottery Market on 23 June 2018.
R = Revised data
Percentage (%)
TAS VIC WA AUSTRALIAACT NSW NT QLD SA
Australian Gambling Statistics, 1993–94 to 2018–2019, 36th edition
134

TABLE KENO 1KENO TURNOVER
1993-94 - 249.585 - - 76.621 - 7.976 - 334.1821994-95 - 349.349 - - 70.425 13.658 39.917 - 473.3491995-96 - 352.120 - - 70.431 50.146 31.343 - 504.0401996-97 - 360.700 - - 71.961 56.731 29.704 - 519.0961997-98 - 384.400 - 152.595 71.818 64.030 28.505 - 701.3481998-99 - 358.500 - 200.916 69.308 66.860 28.675 - 724.2591999-00 - 365.800 - 198.679 68.620 62.516 27.246 - 722.8612000-01 - 340.800 - 219.445 61.689 64.512 28.481 - 714.9272001-02 2.206 - U - 237.243 64.838 64.636 28.547 - 397.4702002-03 2.307 336.000 - 254.750 67.155 65.794 25.509 - 751.5152003-04 2.124 339.600 - 277.522 70.425 69.103 27.968 - 786.7422004-05 2.637 348.033 - 314.652 73.821 78.782 27.262 - 845.1872005-06 2.594 338.266 - 335.229 76.581 82.144 26.933 - 861.7472006-07 3.497 347.787 - 332.896 78.523 - U 29.551 - 792.2542007-08 3.348 351.500 36.338 (1) 342.404 79.506 - U 27.150 - 840.2462008-09 3.465 443.602 38.229 370.192 90.753 - U 27.228 - 973.4692009-10 3.300 461.953 38.569 366.650 92.566 - U 24.022 - 987.0602010-11 3.700 509.402 37.291 401.963 95.866 - U 23.708 - 1,071.9302011-12 3.800 542.958 45.953 425.445 99.407 - U 29.114 (2) - 1,146.6772012-13 4.050 545.167 50.981 441.159 104.922 - U 58.292 - 1,204.5712013-14 4.158 538.545 51.610 443.544 103.336 - U 62.301 - 1,203.4942014-15 3.953 576.353 50.963 425.523 109.183 - U 69.349 - 1,235.3242015-16 5.219 617.885 48.022 400.006 112.907 - U 81.849 - 1,265.8882016-17 13.343 646.131 47.761 404.776 108.545 - U 97.518 - 1,318.0732017-18 49.578 631.596 47.801 383.037 118.790 - U 95.748 - 1,326.5502018-19 71.127 611.662 42.641 405.404 120.648 - U 91.156 - 1,342.639
Notes: These data should be read in conjunction with the explanatory notes and other turnover tables in this publication.
Figure(s) may be incomplete for any period or jurisdiction due to some unavailable turnover figures that are used to derive these numbers.
(1) Community keno was previously included in casino turnover.
(2) New keno licence commenced 14 April 2012, replacing previous club keno arrangements. New keno game rolled out into a much larger number of venues.
U = Unavailable data
NA = Not applicable
AUSTRALIA
Value ($ million)
ACT NSW NT QLD SA TAS VIC WA (NA)
Australian Gambling Statistics, 1993–94 to 2018–2019, 36th edition
135

TABLE KENO 2REAL KENO TURNOVER
1993-94 - 463.805 - - 142.385 - 14.822 - 621.0121994-95 - 628.718 - - 126.743 24.580 71.838 - 851.8791995-96 - 607.820 - - 121.576 86.561 54.103 - 870.0601996-97 - 614.267 - - 122.549 96.612 50.585 - 884.0131997-98 - 654.627 - 259.867 122.305 109.042 48.544 - 1,194.3851998-99 - 603.316 - 338.120 116.638 112.518 48.257 - 1,218.8491999-00 - 601.409 - 326.647 112.818 102.782 44.795 - 1,188.4502000-01 - 528.333 - 340.199 95.635 100.011 44.153 - 1,108.3312001-02 3.325 - U - 357.588 97.728 97.424 43.028 - 599.0932002-03 3.375 491.508 - 372.654 98.236 96.245 37.315 - 1,099.3322003-04 3.033 484.961 - 396.311 100.569 98.682 39.939 - 1,123.4952004-05 3.678 485.459 - 438.897 102.970 109.890 38.027 - 1,178.9222005-06 3.507 457.300 - 453.195 103.530 111.050 36.411 - 1,164.9922006-07 4.592 456.646 - 437.094 103.101 - U 38.801 - 1,040.2322007-08 4.254 446.616 46.172 (1) 435.059 101.020 - U 34.497 - 1,067.6182008-09 4.270 546.598 47.104 456.144 111.824 - U 33.550 - 1,199.4902009-10 3.972 556.000 46.421 441.295 111.411 - U 28.913 - 1,188.0122010-11 4.321 594.911 43.551 469.437 111.958 - U 27.688 - 1,251.8652011-12 4.336 619.515 52.433 485.433 113.423 - U 33.219 (2) - 1,308.3592012-13 4.517 608.050 56.862 492.045 117.024 - U 65.016 - 1,343.5152013-14 4.518 585.219 56.083 481.984 112.292 - U 67.700 - 1,307.7972014-15 4.223 615.748 54.446 454.608 116.646 - U 74.089 - 1,319.7612015-16 5.499 650.976 50.594 421.428 118.954 - U 86.232 - 1,333.6822016-17 13.815 668.998 49.451 419.101 112.386 - U 100.969 - 1,364.7202017-18 50.373 641.720 48.567 389.177 120.694 - U 97.283 - 1,347.8132018-19 71.127 611.662 42.641 405.404 120.648 - U 91.156 - 1,342.639
Notes: These data should be read in conjunction with the explanatory notes and other turnover tables in this publication.
Figure(s) may be incomplete for any period or jurisdiction due to some unavailable turnover figures that are used to derive these numbers.
(1) Community keno was previously included in casino turnover.
(2) New keno licence commenced 14 April 2012, replacing previous club keno arrangements. New keno game rolled out into a much larger number of venues.
U = Unavailable data
NA = Not applicable
AUSTRALIA
Value ($ million)
ACT NSW NT QLD SA TAS VIC WA (NA)
Australian Gambling Statistics, 1993–94 to 2018–2019, 36th edition
136

TABLE KENO 3PER CAPITA KENO TURNOVER
1993-94 - 55.70 - - 69.52 - 2.39 - 25.461994-95 - 77.13 - - 63.65 39.44 11.89 - 35.611995-96 - 76.78 - - 63.44 144.20 9.25 - 37.411996-97 - 77.62 - - 64.49 162.61 8.68 - 38.001997-98 - 81.72 - 61.13 63.92 183.20 8.24 - 50.711998-99 - 75.30 - 79.19 61.25 190.96 8.20 - 51.711999-00 - 75.84 - 76.97 60.22 177.98 7.69 - 50.922000-01 - 69.67 - 83.42 53.76 182.93 7.93 - 49.642001-02 9.06 - U - 88.15 56.08 182.43 7.84 - 27.192002-03 9.34 67.16 - 92.15 57.58 183.83 6.90 - 50.672003-04 8.50 67.33 - 97.71 59.86 190.38 7.47 - 52.302004-05 10.43 68.47 - 108.00 62.18 214.51 7.17 - 55.402005-06 10.12 65.97 - 112.28 63.84 221.64 6.97 - 55.632006-07 13.37 66.99 - 108.70 64.67 - U 7.51 - 50.242007-08 12.53 66.55 234.08 (1) 108.83 64.61 - U 6.75 - 52.152008-09 12.71 82.44 237.68 114.47 72.71 - U 6.61 - 59.052009-10 11.84 84.46 233.19 110.75 73.12 - U 5.71 - 58.672010-11 13.00 91.90 221.91 119.16 74.86 - U 5.54 - 62.652011-12 13.07 96.73 268.43 123.64 76.85 - U 6.68 (2) - 65.882012-13 13.66 95.79 289.36 125.60 80.28 - U 13.09 - 67.942013-14 13.82 93.21 287.19 124.06 78.30 - U 13.69 - 66.732014-15 12.94 98.25 280.95 117.30 81.97 - U 14.91 - 67.442015-16 16.78 103.70 262.90 108.70 84.11 - U 17.19 - 68.052016-17 42.08 106.57 259.92 108.19 80.26 - U 19.98 - 69.652017-18 153.09 102.35 259.08 100.52 87.11 - U 19.15 - 68.882018-19 215.93 97.57 231.54 104.46 87.65 - U 17.81 - 68.54
Notes: These data should be read in conjunction with the explanatory notes and other turnover tables in this publication.
Figure(s) may be incomplete for any period or jurisdiction due to some unavailable turnover figures that are used to derive these numbers.
(1) Community keno was previously included in casino turnover.
(2) New keno licence commenced 14 April 2012, replacing previous club keno arrangements. New keno game rolled out into a much larger number of venues.
U = Unavailable data
NA = Not applicable
AUSTRALIA
Value ($)
ACT NSW NT QLD SA TAS VIC WA (NA)
Australian Gambling Statistics, 1993–94 to 2018–2019, 36th edition
137

TABLE KENO 4REAL PER CAPITA KENO TURNOVER
1993-94 - 103.52 - - 129.20 - 4.44 - 47.311994-95 - 138.81 - - 114.55 70.97 21.39 - 64.091995-96 - 132.53 - - 109.51 248.91 15.97 - 64.571996-97 - 132.19 - - 109.82 276.92 14.77 - 64.721997-98 - 139.17 - 104.11 108.86 311.98 14.03 - 86.351998-99 - 126.71 - 133.27 103.08 321.37 13.80 - 87.021999-00 - 124.68 - 126.55 99.00 292.62 12.65 - 83.722000-01 - 108.00 - 129.32 83.34 283.60 12.29 - 76.962001-02 13.66 - U - 132.87 84.52 274.97 11.81 - 40.992002-03 13.67 98.24 - 134.80 84.23 268.91 10.10 - 74.132003-04 12.13 96.15 - 139.53 85.48 271.86 10.66 - 74.692004-05 14.55 95.51 - 150.64 86.74 299.21 10.01 - 77.272005-06 13.68 89.18 - 151.79 86.30 299.64 9.43 - 75.212006-07 17.56 87.96 - 142.72 84.91 - U 9.86 - 65.962007-08 15.92 84.56 297.43 (1) 138.28 82.09 - U 8.58 - 66.272008-09 15.66 101.58 292.86 141.05 89.59 - U 8.15 - 72.762009-10 14.25 101.65 280.66 133.30 88.01 - U 6.87 - 70.612010-11 15.18 107.33 259.17 139.16 87.43 - U 6.47 - 73.172011-12 14.91 110.37 306.28 141.07 87.68 - U 7.62 (2) - 75.172012-13 15.24 106.84 322.73 140.08 89.54 - U 14.60 - 75.782013-14 15.01 101.29 312.08 134.81 85.08 - U 14.87 - 72.522014-15 13.82 104.97 300.15 125.31 87.58 - U 15.93 - 72.052015-16 17.68 109.26 276.97 114.53 88.61 - U 18.11 - 71.692016-17 43.57 110.34 269.12 112.02 83.10 - U 20.69 - 72.122017-18 155.55 103.99 263.23 102.13 88.51 - U 19.46 - 69.982018-19 215.93 97.57 231.54 104.46 87.65 - U 17.81 - 68.54
Notes: These data should be read in conjunction with the explanatory notes and other turnover tables in this publication.
Figure(s) may be incomplete for any period or jurisdiction due to some unavailable turnover figures that are used to derive these numbers.
(1) Community keno was previously included in casino turnover.
(2) New keno licence commenced 14 April 2012, replacing previous club keno arrangements. New keno game rolled out into a much larger number of venues.
U = Unavailable data
NA = Not applicable
AUSTRALIA
Value ($)
ACT NSW NT QLD SA TAS VIC WA (NA)
Australian Gambling Statistics, 1993–94 to 2018–2019, 36th edition
138

TABLE KENO 5KENO EXPENDITURE
1993-94 - 62.396 - - 13.945 - 2.473 - 78.8141994-95 - 87.337 - - 12.817 2.317 12.374 - 114.8461995-96 - 88.030 - - 12.818 12.261 8.702 - 121.8111996-97 - 90.175 - - 13.097 15.719 7.159 - 126.1501997-98 - 96.100 - 38.591 13.071 16.266 7.084 - 171.1121998-99 - 89.625 - 52.406 12.614 16.477 7.197 - 178.3191999-00 - 91.450 - 54.160 15.611 15.176 6.783 - 183.1802000-01 - 85.200 - 53.565 12.631 18.312 6.856 - 176.5642001-02 0.713 - U - 65.186 12.460 17.576 6.598 - 102.5332002-03 0.628 36.300 - 67.019 10.454 15.960 6.087 - 136.4482003-04 0.578 84.007 - 68.471 11.276 16.929 6.689 - 187.9502004-05 0.717 86.212 - 79.914 15.185 19.958 6.561 - 208.5472005-06 0.706 83.918 - 86.012 13.516 20.352 6.342 - 210.8462006-07 0.951 80.294 - 79.343 13.092 20.780 7.269 - 201.7292007-08 0.911 88.665 (1) 10.119 (2) 86.249 13.588 22.363 6.548 - 228.4442008-09 0.943 105.416 8.180 96.438 16.702 25.792 6.587 - 260.0582009-10 0.909 112.634 8.967 89.151 19.324 25.024 5.841 - 261.8502010-11 1.016 123.607 9.131 100.424 17.626 27.601 5.787 - 285.1922011-12 1.048 134.199 13.227 107.561 16.415 27.654 7.048 (3) - 307.1522012-13 1.102 134.713 14.922 109.325 18.103 29.166 13.894 - 321.2252013-14 0.650 133.246 15.167 110.333 20.343 32.425 14.997 - 327.1602014-15 1.182 142.771 14.208 102.561 19.127 30.207 16.738 - 326.7942015-16 1.461 153.175 11.401 104.901 21.869 33.336 19.701 - 345.8442016-17 2.705 160.027 13.754 101.148 24.028 31.773 23.354 - 356.7902017-18 13.263 156.091 10.501 97.908 22.837 31.007 23.063 - 354.6702018-19 11.267 151.307 10.044 100.829 22.184 33.026 21.985 - 350.642
Notes: These data should be read in conjunction with the explanatory notes and other expenditure tables in this publication.
Figure(s) may be incomplete for any period or jurisdiction due to some unavailable expenditure figures that are used to derive these numbers.
(1) Represents actual keno expenditure, from this period on.
(2) Community keno was previously included in casino expenditure.
(3) New keno licence commenced 14 April 2012, replacing previous club keno arrangements. New keno game rolled out into a much larger number of venues.
U = Unavailable data
NA = Not applicable
AUSTRALIA
Value ($ million)
ACT NSW NT QLD SA TAS VIC WA (NA)
Australian Gambling Statistics, 1993–94 to 2018–2019, 36th edition
139
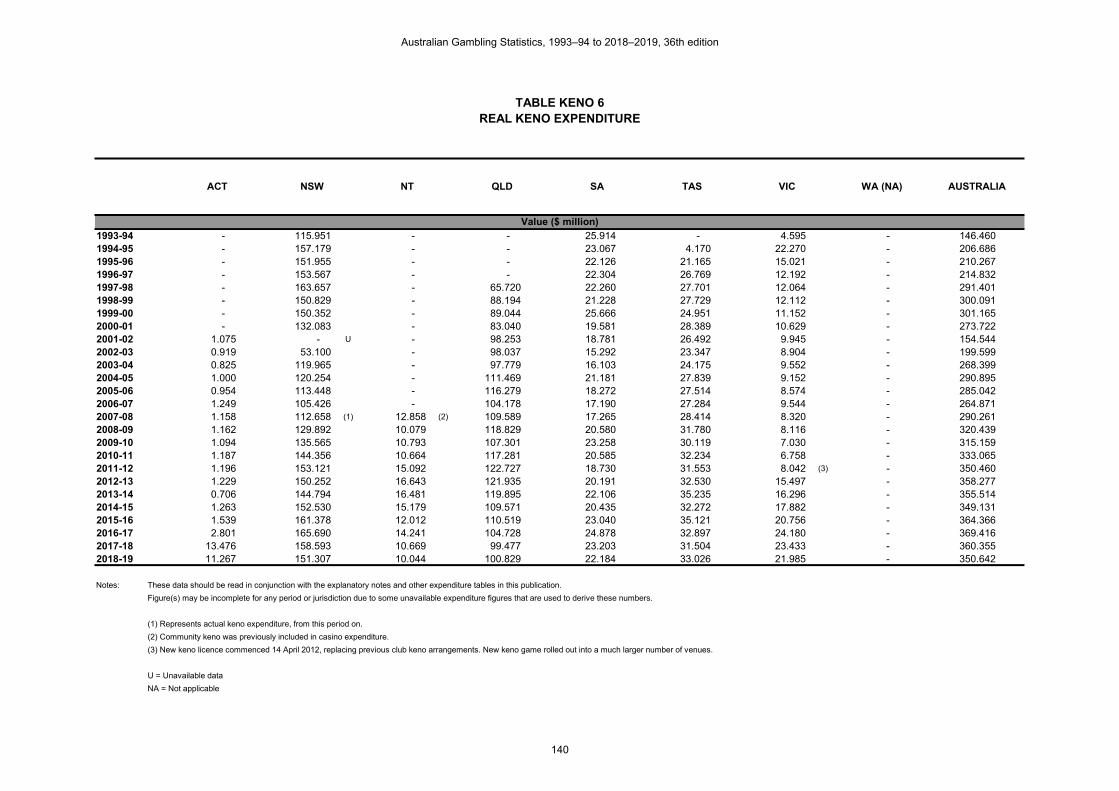
TABLE KENO 6REAL KENO EXPENDITURE
1993-94 - 115.951 - - 25.914 - 4.595 - 146.4601994-95 - 157.179 - - 23.067 4.170 22.270 - 206.6861995-96 - 151.955 - - 22.126 21.165 15.021 - 210.2671996-97 - 153.567 - - 22.304 26.769 12.192 - 214.8321997-98 - 163.657 - 65.720 22.260 27.701 12.064 - 291.4011998-99 - 150.829 - 88.194 21.228 27.729 12.112 - 300.0911999-00 - 150.352 - 89.044 25.666 24.951 11.152 - 301.1652000-01 - 132.083 - 83.040 19.581 28.389 10.629 - 273.7222001-02 1.075 - U - 98.253 18.781 26.492 9.945 - 154.5442002-03 0.919 53.100 - 98.037 15.292 23.347 8.904 - 199.5992003-04 0.825 119.965 - 97.779 16.103 24.175 9.552 - 268.3992004-05 1.000 120.254 - 111.469 21.181 27.839 9.152 - 290.8952005-06 0.954 113.448 - 116.279 18.272 27.514 8.574 - 285.0422006-07 1.249 105.426 - 104.178 17.190 27.284 9.544 - 264.8712007-08 1.158 112.658 (1) 12.858 (2) 109.589 17.265 28.414 8.320 - 290.2612008-09 1.162 129.892 10.079 118.829 20.580 31.780 8.116 - 320.4392009-10 1.094 135.565 10.793 107.301 23.258 30.119 7.030 - 315.1592010-11 1.187 144.356 10.664 117.281 20.585 32.234 6.758 - 333.0652011-12 1.196 153.121 15.092 122.727 18.730 31.553 8.042 (3) - 350.4602012-13 1.229 150.252 16.643 121.935 20.191 32.530 15.497 - 358.2772013-14 0.706 144.794 16.481 119.895 22.106 35.235 16.296 - 355.5142014-15 1.263 152.530 15.179 109.571 20.435 32.272 17.882 - 349.1312015-16 1.539 161.378 12.012 110.519 23.040 35.121 20.756 - 364.3662016-17 2.801 165.690 14.241 104.728 24.878 32.897 24.180 - 369.4162017-18 13.476 158.593 10.669 99.477 23.203 31.504 23.433 - 360.3552018-19 11.267 151.307 10.044 100.829 22.184 33.026 21.985 - 350.642
Notes: These data should be read in conjunction with the explanatory notes and other expenditure tables in this publication.
Figure(s) may be incomplete for any period or jurisdiction due to some unavailable expenditure figures that are used to derive these numbers.
(1) Represents actual keno expenditure, from this period on.
(2) Community keno was previously included in casino expenditure.
(3) New keno licence commenced 14 April 2012, replacing previous club keno arrangements. New keno game rolled out into a much larger number of venues.
U = Unavailable data
NA = Not applicable
AUSTRALIA
Value ($ million)
ACT NSW NT QLD SA TAS VIC WA (NA)
Australian Gambling Statistics, 1993–94 to 2018–2019, 36th edition
140

TABLE KENO 7PER CAPITA KENO EXPENDITURE
1993-94 - 13.93 - - 12.65 - 0.74 - 6.001994-95 - 19.28 - - 11.58 6.69 3.68 - 8.641995-96 - 19.19 - - 11.55 35.26 2.57 - 9.041996-97 - 19.41 - - 11.74 45.06 2.09 - 9.241997-98 - 20.43 - 15.46 11.63 46.54 2.05 - 12.371998-99 - 18.82 - 20.66 11.15 47.06 2.06 - 12.731999-00 - 18.96 - 20.98 13.70 43.21 1.92 - 12.902000-01 - 17.42 - 20.36 11.01 51.93 1.91 - 12.262001-02 2.93 - U - 24.22 10.78 49.61 1.81 - 7.022002-03 2.54 7.26 - 24.24 8.96 44.59 1.65 - 9.202003-04 2.31 16.66 - 24.11 9.58 46.64 1.79 - 12.492004-05 2.84 16.96 - 27.43 12.79 54.34 1.73 - 13.672005-06 2.75 16.37 - 28.81 11.27 54.91 1.64 - 13.612006-07 3.64 15.47 - 25.91 10.78 55.54 1.85 - 12.792007-08 3.41 16.79 (1) 65.19 (2) 27.41 11.04 59.06 1.63 - 14.182008-09 3.46 19.59 50.86 29.82 13.38 67.17 1.60 - 15.782009-10 3.26 20.59 54.22 26.93 15.26 64.31 1.39 - 15.562010-11 3.57 22.30 54.34 29.77 13.76 70.19 1.35 - 16.672011-12 3.60 23.91 77.26 31.26 12.69 69.89 1.62 (3) - 17.652012-13 3.72 23.67 84.69 31.12 13.85 73.43 3.12 - 18.122013-14 2.16 23.06 84.40 30.86 15.41 81.25 3.29 - 18.142014-15 3.87 24.34 78.33 28.27 14.36 75.27 3.60 - 17.842015-16 4.70 25.71 62.41 28.51 16.29 82.57 4.14 - 18.592016-17 8.53 26.39 74.85 27.04 17.77 77.96 4.79 - 18.852017-18 40.96 25.30 56.92 25.69 16.75 75.09 4.61 - 18.422018-19 34.20 24.14 54.54 25.98 16.12 78.84 4.30 - 17.90
Notes: These data should be read in conjunction with the explanatory notes and other expenditure tables in this publication.
Figure(s) may be incomplete for any period or jurisdiction due to some unavailable expenditure figures that are used to derive these numbers.
(1) Represents actual keno expenditure, from this period on.
(2) Community keno was previously included in casino expenditure.
(3) New keno licence commenced 14 April 2012, replacing previous club keno arrangements. New keno game rolled out into a much larger number of venues.
U = Unavailable data
NA = Not applicable
Value ($)
TAS VIC WA (NA) AUSTRALIAACT NSW NT QLD SA
Australian Gambling Statistics, 1993–94 to 2018–2019, 36th edition
141

TABLE KENO 8REAL PER CAPITA KENO EXPENDITURE
1993-94 - 25.88 - - 23.51 - 1.38 - 11.161994-95 - 34.70 - - 20.85 12.04 6.63 - 15.551995-96 - 33.13 - - 19.93 60.86 4.43 - 15.611996-97 - 33.05 - - 19.99 76.73 3.56 - 15.731997-98 - 34.79 - 26.33 19.81 79.25 3.49 - 21.071998-99 - 31.68 - 34.76 18.76 79.20 3.46 - 21.431999-00 - 31.17 - 34.50 22.52 71.03 3.15 - 21.222000-01 - 27.00 - 31.57 17.06 80.50 2.96 - 19.012001-02 4.42 - U - 36.51 16.24 74.77 2.73 - 10.572002-03 3.72 10.61 - 35.46 13.11 65.23 2.41 - 13.462003-04 3.30 23.79 - 34.42 13.69 66.60 2.55 - 17.842004-05 3.96 23.66 - 38.26 17.84 75.80 2.41 - 19.072005-06 3.72 22.12 - 38.95 15.23 74.24 2.22 - 18.402006-07 4.77 20.31 - 34.02 14.16 72.92 2.43 - 16.802007-08 4.33 21.33 (1) 82.82 (2) 34.83 14.03 75.04 2.07 - 18.022008-09 4.26 24.14 62.67 36.74 16.49 82.77 1.97 - 19.442009-10 3.93 24.78 65.25 32.41 18.37 77.40 1.67 - 18.732010-11 4.17 26.04 63.46 34.77 16.07 81.98 1.58 - 19.472011-12 4.11 27.28 88.16 35.67 14.48 79.75 1.84 (3) - 20.132012-13 4.15 26.40 94.46 34.71 15.45 81.90 3.48 - 20.212013-14 2.35 25.06 91.71 33.54 16.75 88.29 3.58 - 19.712014-15 4.13 26.00 83.68 30.20 15.34 80.42 3.84 - 19.062015-16 4.95 27.09 65.76 30.03 17.16 86.99 4.36 - 19.592016-17 8.83 27.33 77.50 27.99 18.40 80.72 4.95 - 19.522017-18 41.61 25.70 57.83 26.11 17.01 76.30 4.69 - 18.712018-19 34.20 24.14 54.54 25.98 16.12 78.84 4.30 - 17.90
Notes: These data should be read in conjunction with the explanatory notes and other expenditure tables in this publication.
Figure(s) may be incomplete for any period or jurisdiction due to some unavailable expenditure figures that are used to derive these numbers.
(1) Represents actual keno expenditure, from this period on.
(2) Community keno was previously included in casino expenditure.
(3) New keno licence commenced 14 April 2012, replacing previous club keno arrangements. New keno game rolled out into a much larger number of venues.
U = Unavailable data
NA = Not applicable
Value ($)
TAS VIC WA (NA) AUSTRALIAACT NSW NT QLD SA
Australian Gambling Statistics, 1993–94 to 2018–2019, 36th edition
142

TABLE KENO 9KENO EXPENDITURE AS A % OF HOUSEHOLD DISPOSABLE INCOME
(ALL STATES AND TERRITORIES)
1993-94 - 0.054 - - 0.057 - 0.003 - 0.0251994-95 - 0.072 - - 0.051 0.032 0.015 - 0.0351995-96 - 0.068 - - 0.048 0.161 0.010 - 0.0351996-97 - 0.066 - - 0.047 0.202 0.008 - 0.0341997-98 - 0.067 - 0.059 0.045 0.205 0.008 - 0.0451998-99 - 0.061 - 0.077 0.044 0.205 0.007 - 0.0451999-00 - 0.058 - 0.076 0.051 0.180 0.007 - 0.0432000-01 - 0.049 - 0.068 0.038 0.209 0.006 - 0.0382001-02 0.006 - U - 0.075 0.034 0.179 0.005 - 0.0212002-03 0.005 0.020 - 0.075 0.028 0.156 0.005 - 0.0272003-04 0.004 0.043 - 0.069 0.028 0.150 0.005 - 0.0342004-05 0.005 0.041 - 0.072 0.036 0.162 0.005 - 0.0352005-06 0.004 0.039 - 0.071 0.031 0.151 0.004 - 0.0332006-07 0.005 0.034 - 0.058 0.027 0.142 0.005 - 0.0292007-08 0.004 0.035 (1) 0.119 (2) 0.057 0.026 0.140 0.004 - 0.0302008-09 0.004 0.039 0.085 0.057 0.028 0.145 0.003 - 0.0312009-10 0.004 0.040 0.085 0.051 0.032 0.137 0.003 - 0.0302010-11 0.004 0.040 0.082 0.054 0.027 0.146 0.003 - 0.0312011-12 0.004 0.041 0.111 0.056 0.025 0.145 0.003 (3) - 0.0312012-13 0.003 0.040 0.117 0.057 0.027 0.155 0.006 - 0.0322013-14 0.002 0.038 0.109 0.056 0.029 0.167 0.006 - 0.0312014-15 0.004 0.038 0.095 0.049 0.025 0.143 0.007 - 0.0292015-16 0.004 0.040 0.074 0.049 0.028 0.151 0.008 - 0.0302016-17 0.008 0.041 0.087 0.046 0.030 0.140 0.009 - 0.0312017-18 0.036 0.039 0.065 0.043 0.027 0.133 0.008 - 0.0292018-19 0.030 0.036 0.064 0.043 0.026 0.136 0.008 - 0.028
Notes: These data should be read in conjunction with the explanatory notes and other expenditure tables in this publication.
Figure(s) may be incomplete for any period or jurisdiction due to some unavailable expenditure figures that are used to derive these numbers.
(1) Represents actual keno expenditure, from this period on.
(2) Community keno was previously included in casino expenditure.
(3) New keno licence commenced 14 April 2012, replacing previous club keno arrangements. New keno game rolled out into a much larger number of venues.
U = Unavailable data
NA = Not applicable
Percentage (%)
TAS VIC WA (NA) AUSTRALIAACT NSW NT QLD SA
Australian Gambling Statistics, 1993–94 to 2018–2019, 36th edition
143

TABLE GAMING MACHINES 1GAMING MACHINES TURNOVER
1993-94 767.000 18,880.838 45.807 2,336.000 - - 7,230.076 - 29,259.7211994-95 1,035.501 22,486.497 48.797 2,698.000 1,489.947 - 10,090.519 - 37,849.2611995-96 1,163.641 24,376.037 75.214 3,049.621 2,621.657 - 13,367.223 - 44,653.3931996-97 1,159.641 26,001.479 181.109 3,505.287 3,023.746 45.002 15,893.958 - 49,810.2221997-98 1,249.467 30,540.143 232.408 4,058.130 3,291.676 206.549 18,097.817 - 57,676.1901998-99 1,419.859 34,522.289 260.242 5,214.254 3,723.706 352.084 20,543.570 - 66,036.0041999-00 1,584.076 38,821.992 281.930 6,348.113 4,123.067 592.659 22,387.654 - 74,139.4912000-01 1,692.527 38,922.493 297.792 7,534.235 4,644.183 749.550 23,889.687 - 77,730.4672001-02 1,855.229 42,842.728 335.182 8,544.513 5,225.052 853.339 25,427.705 - 85,083.7482002-03 1,980.130 47,730.741 351.863 10,038.249 5,852.719 946.164 23,265.472 - 90,165.3382003-04 2,077.192 50,314.522 393.388 12,176.068 6,501.871 1,038.796 23,248.504 - 95,750.3412004-05 2,040.464 53,953.655 456.000 14,393.736 6,994.895 1,081.989 23,820.186 - 102,740.9252005-06 2,164.144 56,534.739 530.110 15,962.271 7,338.956 953.028 24,440.244 - 107,923.4922006-07 2,151.862 59,972.491 601.879 15,361.427 8,009.339 - U 25,231.010 - 111,328.0082007-08 2,111.078 55,003.556 698.437 17,141.617 7,814.242 - U 26,204.474 - 108,973.4032008-09 2,085.222 57,510.475 769.047 18,189.755 7,900.106 - U 27,664.238 - 114,118.8432009-10 2,078.209 58,485.414 684.254 17,720.509 7,747.294 - U 26,798.449 - 113,514.1292010-11 2,191.852 62,254.556 613.472 18,856.420 7,988.753 - U 27,555.690 - 119,460.7432011-12 2,214.846 65,246.704 619.801 19,895.643 7,996.290 - U 27,587.198 - 123,560.4822012-13 2,225.433 66,919.170 611.804 20,715.674 7,901.741 - U 25,838.813 - 124,212.6352013-14 2,176.372 69,371.053 706.072 21,501.850 7,995.860 - U 26,632.511 - 128,383.7182014-15 2,016.448 74,297.266 870.405 22,909.324 8,055.708 - U 27,546.894 - 135,696.0452015-16 2,047.705 79,056.858 931.862 24,186.179 8,000.393 - U 28,287.069 - 142,510.0662016-17 2,064.675 80,336.670 (1) 990.492 24,770.003 7,595.027 - U 28,467.049 - 144,223.9162017-18 2,003.683 83,174.002 1,119.211 26,082.118 7,576.140 - U 29,579.794 - 149,534.9482018-19 1,981.380 86,036.009 1,160.291 26,820.376 7,651.148 - U 29,916.099 - 153,565.303
Notes: These data should be read in conjunction with the explanatory notes and other turnover tables in this publication.
Figure(s) may be incomplete for any period or jurisdiction due to some unavailable turnover figures that are used to derive these numbers.
(1) Club and hotel gaming machine data are provided based on club and hotel financial years respectively. For clubs this runs from September to August; for hotels this runs from July to June.
NA = Not applicable
U = Unavailable data
AUSTRALIA
Value ($ million)
ACT NSW NT QLD SA TAS VIC WA (NA)
Australian Gambling Statistics, 1993–94 to 2018–2019, 36th edition
144
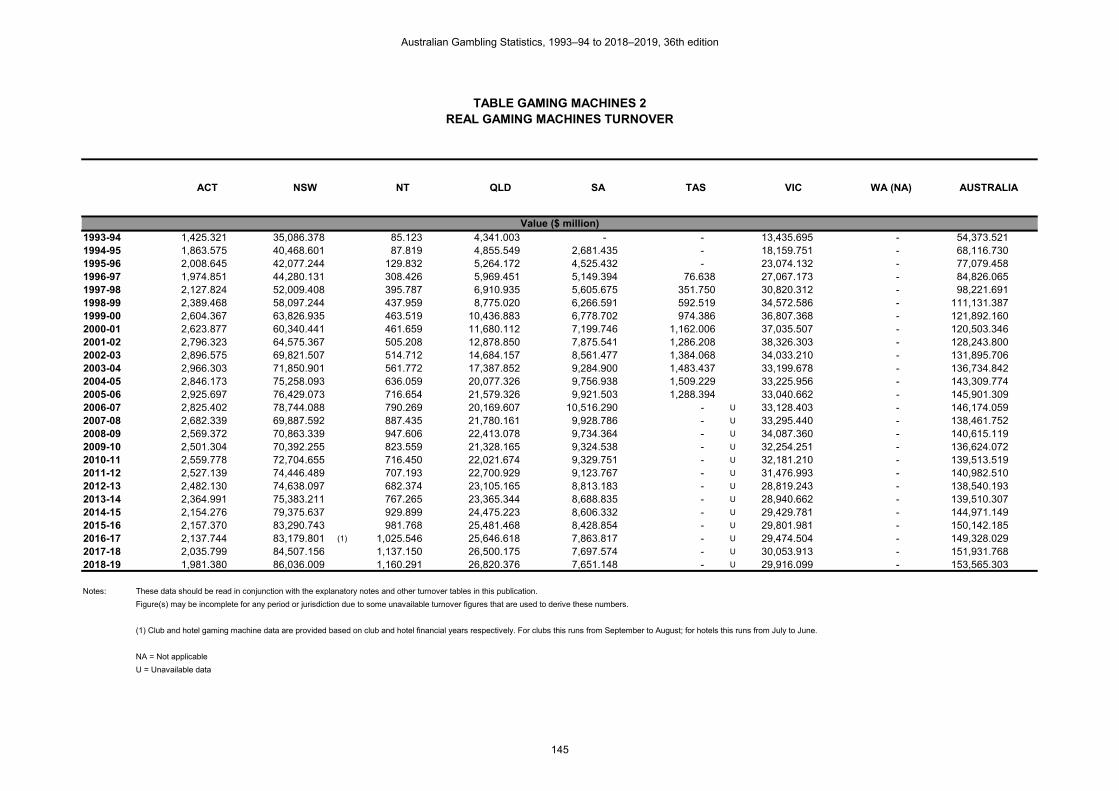
TABLE GAMING MACHINES 2REAL GAMING MACHINES TURNOVER
1993-94 1,425.321 35,086.378 85.123 4,341.003 - - 13,435.695 - 54,373.5211994-95 1,863.575 40,468.601 87.819 4,855.549 2,681.435 - 18,159.751 - 68,116.7301995-96 2,008.645 42,077.244 129.832 5,264.172 4,525.432 - 23,074.132 - 77,079.4581996-97 1,974.851 44,280.131 308.426 5,969.451 5,149.394 76.638 27,067.173 - 84,826.0651997-98 2,127.824 52,009.408 395.787 6,910.935 5,605.675 351.750 30,820.312 - 98,221.6911998-99 2,389.468 58,097.244 437.959 8,775.020 6,266.591 592.519 34,572.586 - 111,131.3871999-00 2,604.367 63,826.935 463.519 10,436.883 6,778.702 974.386 36,807.368 - 121,892.1602000-01 2,623.877 60,340.441 461.659 11,680.112 7,199.746 1,162.006 37,035.507 - 120,503.3462001-02 2,796.323 64,575.367 505.208 12,878.850 7,875.541 1,286.208 38,326.303 - 128,243.8002002-03 2,896.575 69,821.507 514.712 14,684.157 8,561.477 1,384.068 34,033.210 - 131,895.7062003-04 2,966.303 71,850.901 561.772 17,387.852 9,284.900 1,483.437 33,199.678 - 136,734.8422004-05 2,846.173 75,258.093 636.059 20,077.326 9,756.938 1,509.229 33,225.956 - 143,309.7742005-06 2,925.697 76,429.073 716.654 21,579.326 9,921.503 1,288.394 33,040.662 - 145,901.3092006-07 2,825.402 78,744.088 790.269 20,169.607 10,516.290 - U 33,128.403 - 146,174.0592007-08 2,682.339 69,887.592 887.435 21,780.161 9,928.786 - U 33,295.440 - 138,461.7522008-09 2,569.372 70,863.339 947.606 22,413.078 9,734.364 - U 34,087.360 - 140,615.1192009-10 2,501.304 70,392.255 823.559 21,328.165 9,324.538 - U 32,254.251 - 136,624.0722010-11 2,559.778 72,704.655 716.450 22,021.674 9,329.751 - U 32,181.210 - 139,513.5192011-12 2,527.139 74,446.489 707.193 22,700.929 9,123.767 - U 31,476.993 - 140,982.5102012-13 2,482.130 74,638.097 682.374 23,105.165 8,813.183 - U 28,819.243 - 138,540.1932013-14 2,364.991 75,383.211 767.265 23,365.344 8,688.835 - U 28,940.662 - 139,510.3072014-15 2,154.276 79,375.637 929.899 24,475.223 8,606.332 - U 29,429.781 - 144,971.1492015-16 2,157.370 83,290.743 981.768 25,481.468 8,428.854 - U 29,801.981 - 150,142.1852016-17 2,137.744 83,179.801 (1) 1,025.546 25,646.618 7,863.817 - U 29,474.504 - 149,328.0292017-18 2,035.799 84,507.156 1,137.150 26,500.175 7,697.574 - U 30,053.913 - 151,931.7682018-19 1,981.380 86,036.009 1,160.291 26,820.376 7,651.148 - U 29,916.099 - 153,565.303
Notes: These data should be read in conjunction with the explanatory notes and other turnover tables in this publication.
Figure(s) may be incomplete for any period or jurisdiction due to some unavailable turnover figures that are used to derive these numbers.
(1) Club and hotel gaming machine data are provided based on club and hotel financial years respectively. For clubs this runs from September to August; for hotels this runs from July to June.
NA = Not applicable
U = Unavailable data
AUSTRALIA
Value ($ million)
ACT NSW NT QLD SA TAS VIC WA (NA)
Australian Gambling Statistics, 1993–94 to 2018–2019, 36th edition
145

TABLE GAMING MACHINES 3PER CAPITA GAMING MACHINES TURNOVER
1993-94 3,510.32 4,213.96 390.15 1,019.16 - - 2,165.64 - 2,229.031994-95 4,670.54 4,964.45 404.56 1,148.24 1,346.58 - 3,004.69 - 2,847.661995-96 5,162.22 5,315.05 604.45 1,268.04 2,361.42 - 3,944.70 - 3,314.131996-97 5,082.96 5,595.37 1,410.92 1,428.59 2,709.77 128.99 4,641.80 - 3,646.711997-98 5,433.39 6,492.63 1,765.43 1,625.81 2,929.79 590.96 5,231.91 - 4,169.801998-99 6,110.43 7,250.68 1,937.54 2,055.20 3,290.82 1,005.62 5,873.31 - 4,714.661999-00 6,727.28 8,048.33 2,056.78 2,459.39 3,618.18 1,687.28 6,321.12 - 5,223.032000-01 7,070.45 7,956.68 2,135.54 2,863.99 4,047.32 2,125.46 6,651.85 - 5,397.482001-02 7,622.47 8,647.01 2,377.68 3,174.80 4,519.05 2,408.47 6,979.68 - 5,821.262002-03 8,018.33 9,539.95 2,487.91 3,631.04 5,018.06 2,643.65 6,297.23 - 6,079.712003-04 8,310.38 9,975.92 2,770.83 4,286.80 5,526.48 2,861.83 6,205.36 - 6,365.142004-05 8,072.51 10,614.62 3,166.67 4,940.36 5,892.06 2,946.10 6,267.38 - 6,733.922005-06 8,440.40 11,025.36 3,608.38 5,346.22 6,117.85 2,571.50 6,327.62 - 6,967.512006-07 8,228.65 11,552.32 4,001.35 5,015.90 6,595.93 - U 6,411.08 - 7,059.662007-08 7,900.84 10,414.25 4,499.15 5,448.14 6,350.20 - U 6,517.08 - 6,764.022008-09 7,646.55 10,687.95 4,781.41 5,624.62 6,329.63 - U 6,717.97 - 6,922.612009-10 7,456.14 10,692.45 4,137.00 5,352.80 6,119.74 - U 6,367.56 - 6,746.832010-11 7,698.47 11,231.06 3,650.69 5,589.69 6,238.56 - U 6,436.35 - 6,982.372011-12 7,617.42 11,624.49 3,620.48 5,781.92 6,181.46 - U 6,326.71 - 7,098.802012-13 7,506.01 11,758.63 3,472.44 5,897.73 6,045.82 - U 5,800.43 - 7,006.202013-14 7,231.72 12,006.96 3,929.01 6,014.18 6,058.38 - U 5,850.44 - 7,118.742014-15 6,599.92 12,665.35 4,798.38 6,315.04 6,048.05 - U 5,921.70 - 7,408.482015-16 6,585.56 13,268.68 5,101.47 6,572.75 5,959.55 - U 5,941.40 - 7,660.372016-17 6,511.42 13,249.86 (1) 5,390.38 6,620.64 5,615.89 - U 5,832.82 - 7,621.482017-18 6,187.29 13,478.84 6,066.10 6,844.81 5,555.64 - U 5,915.79 - 7,764.332018-19 6,015.09 13,724.34 6,300.35 6,910.51 5,558.49 - U 5,845.24 - 7,839.68
Notes: These data should be read in conjunction with the explanatory notes and other turnover tables in this publication.
Figure(s) may be incomplete for any period or jurisdiction due to some unavailable turnover figures that are used to derive these numbers.
(1) Club and hotel gaming machine data are provided based on club and hotel financial years respectively. For clubs this runs from September to August; for hotels this runs from July to June.
NA = Not applicable
U = Unavailable data
AUSTRALIA
Value ($)
ACT NSW NT QLD SA TAS VIC WA (NA)
Australian Gambling Statistics, 1993–94 to 2018–2019, 36th edition
146

TABLE GAMING MACHINES 4REAL PER CAPITA GAMING MACHINES TURNOVER
1993-94 6,523.25 7,830.82 725.02 1,893.92 - - 4,024.42 - 4,142.221994-95 8,405.50 8,934.45 728.08 2,066.47 2,423.42 - 5,407.49 - 5,124.891995-96 8,910.88 9,174.69 1,043.39 2,188.86 4,076.22 - 6,809.23 - 5,720.761996-97 8,656.20 9,528.84 2,402.78 2,432.87 4,614.70 219.67 7,904.92 - 6,210.291997-98 9,252.98 11,056.86 3,006.50 2,768.73 4,989.39 1,006.39 8,909.86 - 7,101.111998-99 10,283.19 12,202.10 3,260.67 3,458.68 5,538.09 1,692.34 9,884.15 - 7,934.261999-00 11,060.27 13,232.19 3,381.54 4,043.46 5,948.63 2,774.04 10,392.51 - 8,587.142000-01 10,961.11 12,335.01 3,310.66 4,439.96 6,274.44 3,295.04 10,312.17 - 8,367.552001-02 11,489.09 13,033.34 3,583.80 4,785.26 6,811.40 3,630.21 10,520.23 - 8,774.192002-03 11,729.37 13,955.23 3,639.37 5,311.56 7,340.52 3,867.18 9,211.72 - 8,893.532003-04 11,867.51 14,245.97 3,956.84 6,121.70 7,892.01 4,086.79 8,861.48 - 9,089.642004-05 11,260.07 14,805.97 4,417.07 6,891.14 8,218.63 4,109.41 8,742.16 - 9,392.912005-06 11,410.54 14,905.13 4,878.15 7,227.53 8,270.70 3,476.40 8,554.28 - 9,419.342006-07 10,804.25 15,168.23 5,253.79 6,585.90 8,660.48 - U 8,417.78 - 9,269.362007-08 10,038.82 13,232.36 5,716.63 6,922.41 8,068.58 - U 8,280.61 - 8,594.372008-09 9,421.94 13,169.50 5,891.57 6,930.55 7,799.26 - U 8,277.76 - 8,529.912009-10 8,974.11 12,869.29 4,979.24 6,442.56 7,365.64 - U 7,663.91 - 8,120.392010-11 8,990.75 13,116.32 4,263.49 6,527.98 7,285.77 - U 7,516.76 - 8,154.432011-12 8,691.48 13,263.54 4,130.97 6,597.17 7,053.05 - U 7,218.78 - 8,099.732012-13 8,371.80 13,114.96 3,872.98 6,578.02 6,743.19 - U 6,469.49 - 7,814.342013-14 7,858.47 13,047.57 4,269.52 6,535.40 6,583.44 - U 6,357.48 - 7,735.702014-15 7,051.04 13,531.05 5,126.36 6,746.69 6,461.45 - U 6,326.46 - 7,914.872015-16 6,938.25 13,979.28 5,374.68 6,924.75 6,278.72 - U 6,259.59 - 8,070.622016-17 6,741.86 13,718.77 (1) 5,581.14 6,854.94 5,814.63 - U 6,039.25 - 7,891.212017-18 6,286.46 13,694.88 6,163.33 6,954.52 5,644.69 - U 6,010.61 - 7,888.782018-19 6,015.09 13,724.34 6,300.35 6,910.51 5,558.49 - U 5,845.24 - 7,839.68
Notes: These data should be read in conjunction with the explanatory notes and other turnover tables in this publication.
Figure(s) may be incomplete for any period or jurisdiction due to some unavailable turnover figures that are used to derive these numbers.
(1) Club and hotel gaming machine data are provided based on club and hotel financial years respectively. For clubs this runs from September to August; for hotels this runs from July to June.
NA = Not applicable
U = Unavailable data
AUSTRALIA
Value ($)
ACT NSW NT QLD SA TAS VIC WA (NA)
Australian Gambling Statistics, 1993–94 to 2018–2019, 36th edition
147
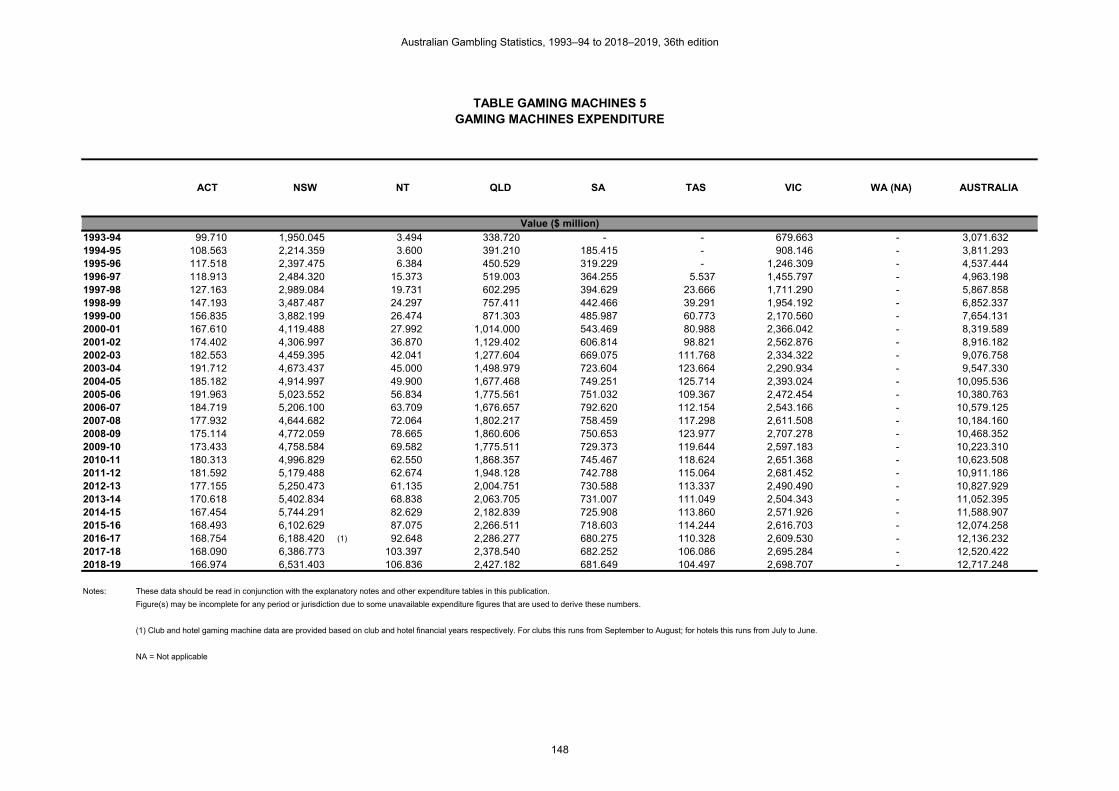
TABLE GAMING MACHINES 5GAMING MACHINES EXPENDITURE
1993-94 99.710 1,950.045 3.494 338.720 - - 679.663 - 3,071.6321994-95 108.563 2,214.359 3.600 391.210 185.415 - 908.146 - 3,811.2931995-96 117.518 2,397.475 6.384 450.529 319.229 - 1,246.309 - 4,537.4441996-97 118.913 2,484.320 15.373 519.003 364.255 5.537 1,455.797 - 4,963.1981997-98 127.163 2,989.084 19.731 602.295 394.629 23.666 1,711.290 - 5,867.8581998-99 147.193 3,487.487 24.297 757.411 442.466 39.291 1,954.192 - 6,852.3371999-00 156.835 3,882.199 26.474 871.303 485.987 60.773 2,170.560 - 7,654.1312000-01 167.610 4,119.488 27.992 1,014.000 543.469 80.988 2,366.042 - 8,319.5892001-02 174.402 4,306.997 36.870 1,129.402 606.814 98.821 2,562.876 - 8,916.1822002-03 182.553 4,459.395 42.041 1,277.604 669.075 111.768 2,334.322 - 9,076.7582003-04 191.712 4,673.437 45.000 1,498.979 723.604 123.664 2,290.934 - 9,547.3302004-05 185.182 4,914.997 49.900 1,677.468 749.251 125.714 2,393.024 - 10,095.5362005-06 191.963 5,023.552 56.834 1,775.561 751.032 109.367 2,472.454 - 10,380.7632006-07 184.719 5,206.100 63.709 1,676.657 792.620 112.154 2,543.166 - 10,579.1252007-08 177.932 4,644.682 72.064 1,802.217 758.459 117.298 2,611.508 - 10,184.1602008-09 175.114 4,772.059 78.665 1,860.606 750.653 123.977 2,707.278 - 10,468.3522009-10 173.433 4,758.584 69.582 1,775.511 729.373 119.644 2,597.183 - 10,223.3102010-11 180.313 4,996.829 62.550 1,868.357 745.467 118.624 2,651.368 - 10,623.5082011-12 181.592 5,179.488 62.674 1,948.128 742.788 115.064 2,681.452 - 10,911.1862012-13 177.155 5,250.473 61.135 2,004.751 730.588 113.337 2,490.490 - 10,827.9292013-14 170.618 5,402.834 68.838 2,063.705 731.007 111.049 2,504.343 - 11,052.3952014-15 167.454 5,744.291 82.629 2,182.839 725.908 113.860 2,571.926 - 11,588.9072015-16 168.493 6,102.629 87.075 2,266.511 718.603 114.244 2,616.703 - 12,074.2582016-17 168.754 6,188.420 (1) 92.648 2,286.277 680.275 110.328 2,609.530 - 12,136.2322017-18 168.090 6,386.773 103.397 2,378.540 682.252 106.086 2,695.284 - 12,520.4222018-19 166.974 6,531.403 106.836 2,427.182 681.649 104.497 2,698.707 - 12,717.248
Notes: These data should be read in conjunction with the explanatory notes and other expenditure tables in this publication.
Figure(s) may be incomplete for any period or jurisdiction due to some unavailable expenditure figures that are used to derive these numbers.
(1) Club and hotel gaming machine data are provided based on club and hotel financial years respectively. For clubs this runs from September to August; for hotels this runs from July to June.
NA = Not applicable
AUSTRALIA
Value ($ million)
ACT NSW NT QLD SA TAS VIC WA (NA)
Australian Gambling Statistics, 1993–94 to 2018–2019, 36th edition
148

TABLE GAMING MACHINES 6REAL GAMING MACHINES EXPENDITURE
1993-94 185.292 3,623.780 6.493 629.445 - - 1,263.023 - 5,708.0331994-95 195.379 3,985.148 6.479 704.055 333.689 - 1,634.376 - 6,859.1251995-96 202.856 4,138.455 11.021 777.691 551.044 - 2,151.344 - 7,832.4121996-97 202.507 4,230.760 26.180 883.854 620.321 9.429 2,479.201 - 8,452.2521997-98 216.557 5,090.365 33.602 1,025.699 672.047 40.303 2,914.301 - 9,992.8751998-99 247.710 5,869.060 40.889 1,274.640 744.622 66.122 3,288.692 - 11,531.7351999-00 257.851 6,382.693 43.526 1,432.502 799.007 99.916 3,568.601 - 12,584.0972000-01 259.841 6,386.326 43.395 1,571.976 842.525 125.553 3,668.008 - 12,897.6242001-02 262.870 6,491.788 55.573 1,702.309 914.630 148.949 3,862.935 - 13,439.0542002-03 267.042 6,523.294 61.498 1,868.905 978.737 163.497 3,414.694 - 13,277.6682003-04 273.771 6,673.832 64.262 2,140.595 1,033.332 176.597 3,271.534 - 13,633.9222004-05 258.304 6,855.760 69.604 2,339.842 1,045.104 175.354 3,337.947 - 14,081.9152005-06 259.514 6,791.319 76.833 2,400.373 1,015.317 147.853 3,342.500 - 14,033.7092006-07 242.537 6,835.627 83.650 2,201.456 1,040.713 147.259 3,339.186 - 13,890.4282007-08 226.081 5,901.539 91.564 2,289.900 963.699 149.039 3,318.186 - 12,940.0072008-09 215.772 5,880.042 96.930 2,292.604 924.941 152.762 3,335.858 - 12,898.9092009-10 208.742 5,727.367 83.748 2,136.981 877.863 144.002 3,125.935 - 12,304.6382010-11 210.580 5,835.601 73.049 2,181.981 870.602 138.536 3,096.429 - 12,406.7782011-12 207.196 5,909.796 71.511 2,222.814 847.521 131.288 3,059.537 - 12,449.6632012-13 197.589 5,856.099 68.187 2,235.993 814.859 126.410 2,777.761 - 12,076.8992013-14 185.405 5,871.080 74.804 2,242.559 794.361 120.673 2,721.386 - 12,010.2692014-15 178.900 6,136.925 88.277 2,332.041 775.525 121.642 2,747.722 - 12,381.0332015-16 177.517 6,429.455 91.738 2,387.894 757.088 120.362 2,756.840 - 12,720.8942016-17 174.726 6,407.429 (1) 95.927 2,367.189 704.350 114.232 2,701.882 - 12,565.7362017-18 170.784 6,489.143 105.054 2,416.664 693.187 107.786 2,738.485 - 12,721.1062018-19 166.974 6,531.403 106.836 2,427.182 681.649 104.497 2,698.707 - 12,717.248
Notes: These data should be read in conjunction with the explanatory notes and other expenditure tables in this publication.
Figure(s) may be incomplete for any period or jurisdiction due to some unavailable expenditure figures that are used to derive these numbers.
(1) Club and hotel gaming machine data are provided based on club and hotel financial years respectively. For clubs this runs from September to August; for hotels this runs from July to June.
NA = Not applicable
AUSTRALIA
Value ($ million)
ACT NSW NT QLD SA TAS VIC WA (NA)
Australian Gambling Statistics, 1993–94 to 2018–2019, 36th edition
149

TABLE GAMING MACHINES 7PER CAPITA GAMING MACHINES EXPENDITURE
1993-94 456.34 435.22 29.76 147.78 - - 203.58 - 234.001994-95 489.66 488.87 29.85 166.49 167.57 - 270.42 - 286.751995-96 521.34 522.76 51.31 187.33 287.54 - 367.79 - 336.761996-97 521.22 534.61 119.76 211.52 326.43 15.87 425.16 - 363.371997-98 552.98 635.46 149.88 241.30 351.24 67.71 494.72 - 424.231998-99 633.45 732.47 180.89 298.53 391.03 112.22 558.69 - 489.221999-00 666.05 804.83 193.14 337.56 426.48 173.02 612.85 - 539.222000-01 700.18 842.12 200.74 385.45 473.62 229.65 658.80 - 577.702001-02 716.56 869.29 261.55 419.64 524.82 278.91 703.49 - 610.032002-03 739.23 891.30 297.26 462.14 573.66 312.29 631.83 - 612.032003-04 767.00 926.61 316.96 527.74 615.05 340.69 611.48 - 634.672004-05 732.62 966.96 346.53 575.76 631.12 342.30 629.63 - 661.692005-06 748.68 979.69 386.86 594.69 626.07 295.10 640.12 - 670.182006-07 706.36 1,002.83 423.54 547.47 652.75 299.74 646.21 - 670.862007-08 665.92 879.41 464.22 572.80 616.36 309.77 649.48 - 632.132008-09 642.15 886.86 489.09 575.33 601.43 322.88 657.43 - 635.022009-10 622.24 869.98 420.69 536.33 576.15 307.46 617.12 - 607.632010-11 633.32 901.46 372.22 553.85 582.15 301.68 619.30 - 620.932011-12 624.54 922.79 366.10 566.15 574.21 290.82 614.95 - 626.872012-13 597.51 922.58 346.99 570.75 558.99 285.36 559.08 - 610.752013-14 566.94 935.14 383.06 577.23 553.88 278.28 550.14 - 612.842014-15 548.08 979.22 455.52 601.71 545.00 283.72 552.88 - 632.712015-16 541.89 1,024.25 476.69 615.94 535.29 282.97 549.61 - 649.032016-17 532.20 1,020.65 (1) 504.20 611.09 503.01 270.72 534.69 - 641.342017-18 519.06 1,035.01 560.41 624.21 500.30 256.91 539.04 - 650.102018-19 506.90 1,041.88 580.12 625.38 495.21 249.45 527.29 - 649.23
Notes: These data should be read in conjunction with the explanatory notes and other expenditure tables in this publication.
Figure(s) may be incomplete for any period or jurisdiction due to some unavailable expenditure figures that are used to derive these numbers.
(1) Club and hotel gaming machine data are provided based on club and hotel financial years respectively. For clubs this runs from September to August; for hotels this runs from July to June.
NA = Not applicable
AUSTRALIA
Value ($)
ACT NSW NT QLD SA TAS VIC WA (NA)
Australian Gambling Statistics, 1993–94 to 2018–2019, 36th edition
150

TABLE GAMING MACHINES 8REAL PER CAPITA GAMING MACHINES EXPENDITURE
1993-94 848.02 808.78 55.30 274.62 - - 378.32 - 434.841994-95 881.24 879.82 53.71 299.64 301.58 - 486.67 - 516.061995-96 899.92 902.37 88.57 323.37 496.35 - 634.87 - 581.311996-97 887.63 910.44 203.95 360.22 555.91 27.03 724.05 - 618.811997-98 941.71 1,082.18 255.25 410.93 598.16 115.31 842.50 - 722.451998-99 1,066.03 1,232.67 304.43 502.40 658.06 188.86 940.22 - 823.311999-00 1,095.05 1,323.22 317.54 554.98 701.17 284.46 1,007.59 - 886.532000-01 1,085.47 1,305.52 311.20 597.55 734.24 356.03 1,021.32 - 895.592001-02 1,080.04 1,310.25 394.22 632.51 791.05 420.40 1,060.34 - 919.472002-03 1,081.36 1,303.81 434.84 676.02 839.16 456.82 924.25 - 895.292003-04 1,095.30 1,323.23 452.63 753.63 878.31 486.51 873.22 - 906.332004-05 1,021.91 1,348.77 483.36 803.10 880.33 477.46 878.25 - 922.972005-06 1,012.13 1,324.44 522.99 803.95 846.38 398.94 865.38 - 906.012006-07 927.45 1,316.73 556.11 718.83 857.06 393.56 848.47 - 880.842007-08 846.12 1,117.38 589.83 727.80 783.14 393.60 825.24 - 803.192008-09 791.24 1,092.77 602.64 708.92 741.07 397.85 810.08 - 782.472009-10 748.92 1,047.09 506.34 645.51 693.44 370.06 742.75 - 731.342010-11 739.63 1,052.77 434.71 646.81 679.87 352.32 723.25 - 725.162011-12 712.60 1,052.90 417.72 645.98 655.17 331.82 701.66 - 715.262012-13 666.43 1,029.00 387.01 636.59 623.47 318.27 623.57 - 681.202013-14 616.07 1,016.19 416.26 627.26 601.88 302.40 597.82 - 665.962014-15 585.55 1,046.15 486.66 642.84 582.25 303.11 590.67 - 675.962015-16 570.91 1,079.10 502.22 648.93 563.96 298.13 579.05 - 683.792016-17 551.04 1,056.77 (1) 522.05 632.71 520.81 280.30 553.61 - 664.032017-18 527.37 1,051.60 569.39 634.21 508.32 261.03 547.68 - 660.522018-19 506.90 1,041.88 580.12 625.38 495.21 249.45 527.29 - 649.23
Notes: These data should be read in conjunction with the explanatory notes and other expenditure tables in this publication.
Figure(s) may be incomplete for any period or jurisdiction due to some unavailable expenditure figures that are used to derive these numbers.
(1) Club and hotel gaming machine data are provided based on club and hotel financial years respectively. For clubs this runs from September to August; for hotels this runs from July to June.
NA = Not applicable
AUSTRALIA
Value ($)
ACT NSW NT QLD SA TAS VIC WA (NA)
Australian Gambling Statistics, 1993–94 to 2018–2019, 36th edition
151

TABLE GAMING MACHINES 9GAMING MACHINES EXPENDITURE AS A % OF HOUSEHOLD DISPOSABLE INCOME
(ALL STATES AND TERRITORIES)
1993-94 1.336 1.696 0.131 0.661 - - 0.891 - 0.9841994-95 1.389 1.831 0.118 0.713 0.732 - 1.137 - 1.1581995-96 1.446 1.859 0.193 0.771 1.190 - 1.477 - 1.2991996-97 1.395 1.811 0.439 0.824 1.317 0.071 1.654 - 1.3451997-98 1.471 2.097 0.553 0.922 1.371 0.299 1.851 - 1.5281998-99 1.616 2.356 0.624 1.118 1.535 0.490 2.007 - 1.7131999-00 1.553 2.463 0.610 1.220 1.597 0.722 2.129 - 1.8082000-01 1.426 2.384 0.579 1.291 1.636 0.924 2.122 - 1.7962001-02 1.451 2.436 0.693 1.293 1.650 1.007 2.124 - 1.7972002-03 1.350 2.464 0.794 1.437 1.779 1.095 1.857 - 1.7742003-04 1.332 2.399 0.801 1.512 1.783 1.094 1.725 - 1.7282004-05 1.200 2.350 0.781 1.518 1.765 1.018 1.691 - 1.6952005-06 1.173 2.310 0.793 1.465 1.701 0.812 1.656 - 1.6472006-07 1.022 2.227 0.824 1.225 1.646 0.768 1.579 - 1.5322007-08 0.877 1.842 0.848 1.197 1.439 0.733 1.477 - 1.3422008-09 0.781 1.747 0.822 1.105 1.273 0.699 1.408 - 1.2542009-10 0.718 1.676 0.663 1.024 1.198 0.654 1.309 - 1.1812010-11 0.664 1.627 0.561 1.013 1.148 0.629 1.251 - 1.1412011-12 0.614 1.590 0.524 1.008 1.113 0.602 1.216 - 1.1092012-13 0.550 1.574 0.477 1.037 1.080 0.603 1.083 - 1.0692013-14 0.517 1.521 0.495 1.038 1.055 0.573 1.019 - 1.0362014-15 0.502 1.545 0.551 1.050 0.956 0.540 1.030 - 1.0412015-16 0.492 1.596 0.561 1.058 0.913 0.518 1.035 - 1.0602016-17 0.472 1.575 (1) 0.584 1.044 0.839 0.488 0.990 - 1.0402017-18 0.461 1.580 0.644 1.050 0.819 0.455 0.985 - 1.0412018-19 0.443 1.569 0.683 1.033 0.803 0.430 0.955 - 1.029
Notes: These data should be read in conjunction with the explanatory notes and other expenditure tables in this publication.
Figure(s) may be incomplete for any period or jurisdiction due to some unavailable expenditure figures that are used to derive these numbers.
(1) Club and hotel gaming machine data are provided based on club and hotel financial years respectively. For clubs this runs from September to August; for hotels this runs from July to June.
NA = Not applicable
Percentage (%)
TAS VIC WA (NA) AUSTRALIAACT NSW NT QLD SA
Australian Gambling Statistics, 1993–94 to 2018–2019, 36th edition
152
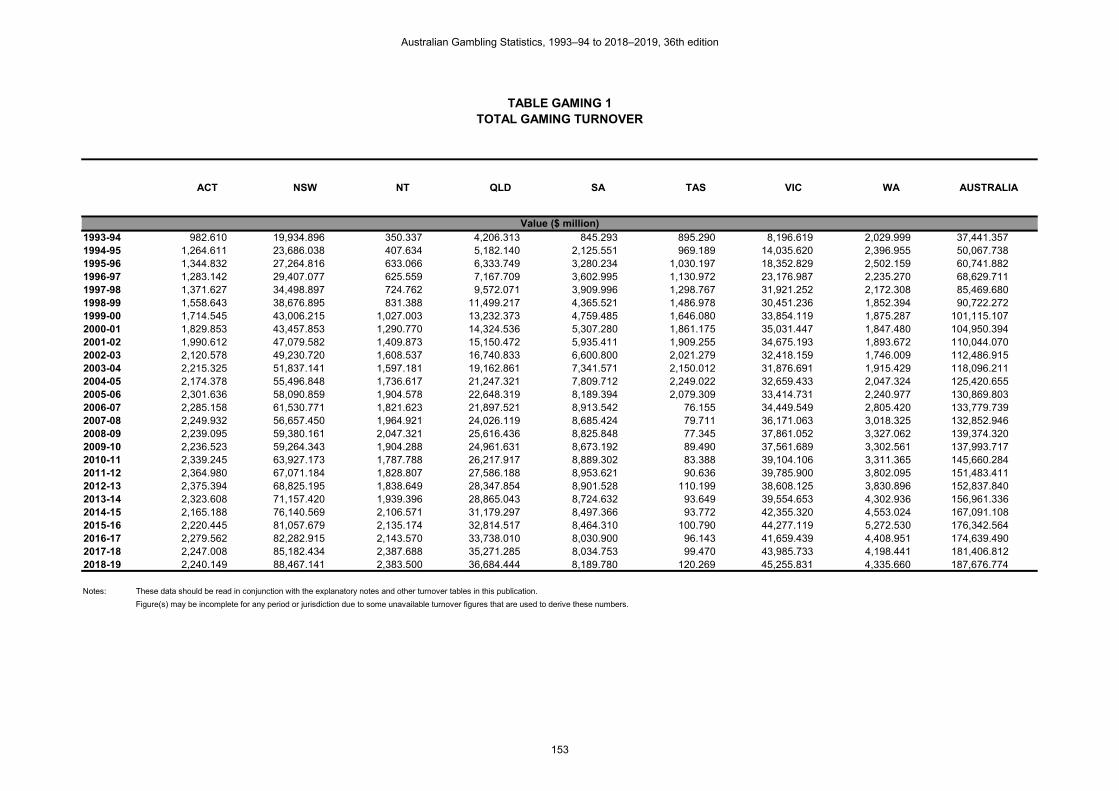
TABLE GAMING 1TOTAL GAMING TURNOVER
1993-94 982.610 19,934.896 350.337 4,206.313 845.293 895.290 8,196.619 2,029.999 37,441.3571994-95 1,264.611 23,686.038 407.634 5,182.140 2,125.551 969.189 14,035.620 2,396.955 50,067.7381995-96 1,344.832 27,264.816 633.066 6,333.749 3,280.234 1,030.197 18,352.829 2,502.159 60,741.8821996-97 1,283.142 29,407.077 625.559 7,167.709 3,602.995 1,130.972 23,176.987 2,235.270 68,629.7111997-98 1,371.627 34,498.897 724.762 9,572.071 3,909.996 1,298.767 31,921.252 2,172.308 85,469.6801998-99 1,558.643 38,676.895 831.388 11,499.217 4,365.521 1,486.978 30,451.236 1,852.394 90,722.2721999-00 1,714.545 43,006.215 1,027.003 13,232.373 4,759.485 1,646.080 33,854.119 1,875.287 101,115.1072000-01 1,829.853 43,457.853 1,290.770 14,324.536 5,307.280 1,861.175 35,031.447 1,847.480 104,950.3942001-02 1,990.612 47,079.582 1,409.873 15,150.472 5,935.411 1,909.255 34,675.193 1,893.672 110,044.0702002-03 2,120.578 49,230.720 1,608.537 16,740.833 6,600.800 2,021.279 32,418.159 1,746.009 112,486.9152003-04 2,215.325 51,837.141 1,597.181 19,162.861 7,341.571 2,150.012 31,876.691 1,915.429 118,096.2112004-05 2,174.378 55,496.848 1,736.617 21,247.321 7,809.712 2,249.022 32,659.433 2,047.324 125,420.6552005-06 2,301.636 58,090.859 1,904.578 22,648.319 8,189.394 2,079.309 33,414.731 2,240.977 130,869.8032006-07 2,285.158 61,530.771 1,821.623 21,897.521 8,913.542 76.155 34,449.549 2,805.420 133,779.7392007-08 2,249.932 56,657.450 1,964.921 24,026.119 8,685.424 79.711 36,171.063 3,018.325 132,852.9462008-09 2,239.095 59,380.161 2,047.321 25,616.436 8,825.848 77.345 37,861.052 3,327.062 139,374.3202009-10 2,236.523 59,264.343 1,904.288 24,961.631 8,673.192 89.490 37,561.689 3,302.561 137,993.7172010-11 2,339.245 63,927.173 1,787.788 26,217.917 8,889.302 83.388 39,104.106 3,311.365 145,660.2842011-12 2,364.980 67,071.184 1,828.807 27,586.188 8,953.621 90.636 39,785.900 3,802.095 151,483.4112012-13 2,375.394 68,825.195 1,838.649 28,347.854 8,901.528 110.199 38,608.125 3,830.896 152,837.8402013-14 2,323.608 71,157.420 1,939.396 28,865.043 8,724.632 93.649 39,554.653 4,302.936 156,961.3362014-15 2,165.188 76,140.569 2,106.571 31,179.297 8,497.366 93.772 42,355.320 4,553.024 167,091.1082015-16 2,220.445 81,057.679 2,135.174 32,814.517 8,464.310 100.790 44,277.119 5,272.530 176,342.5642016-17 2,279.562 82,282.915 2,143.570 33,738.010 8,030.900 96.143 41,659.439 4,408.951 174,639.4902017-18 2,247.008 85,182.434 2,387.688 35,271.285 8,034.753 99.470 43,985.733 4,198.441 181,406.8122018-19 2,240.149 88,467.141 2,383.500 36,684.444 8,189.780 120.269 45,255.831 4,335.660 187,676.774
Notes: These data should be read in conjunction with the explanatory notes and other turnover tables in this publication.
Figure(s) may be incomplete for any period or jurisdiction due to some unavailable turnover figures that are used to derive these numbers.
AUSTRALIA
Value ($ million)
ACT NSW NT QLD SA TAS VIC WA
Australian Gambling Statistics, 1993–94 to 2018–2019, 36th edition
153

TABLE GAMING 2REAL TOTAL GAMING TURNOVER
1993-94 1,825.990 37,045.141 651.033 7,816.617 1,570.813 1,663.723 15,231.828 3,772.360 69,577.5051994-95 2,275.900 42,627.396 733.613 9,326.217 3,825.321 1,744.234 25,259.688 4,313.763 90,106.1341995-96 2,321.412 47,063.775 1,092.781 10,933.143 5,662.250 1,778.298 31,680.148 4,319.158 104,850.9651996-97 2,185.172 50,079.813 1,065.318 12,206.501 6,135.847 1,926.029 39,470.063 3,806.631 116,875.3741997-98 2,335.860 58,751.107 1,234.259 16,301.094 6,658.665 2,211.781 54,361.416 3,699.408 145,553.5891998-99 2,623.026 65,088.992 1,399.135 19,351.927 7,346.695 2,502.422 51,246.107 3,117.377 152,675.6811999-00 2,818.870 70,706.183 1,688.488 21,755.241 7,825.032 2,706.307 55,659.294 3,083.145 166,242.5602000-01 2,836.769 67,371.481 2,001.044 22,206.923 8,227.726 2,885.327 54,308.262 2,864.096 162,701.6302001-02 3,000.381 70,961.431 2,125.054 22,835.784 8,946.240 2,877.754 52,264.723 2,854.267 165,865.6332002-03 3,102.025 72,015.707 2,353.001 24,488.834 9,655.786 2,956.768 47,421.948 2,554.098 164,548.1672003-04 3,163.562 74,025.254 2,280.830 27,365.237 10,484.020 3,070.292 45,521.032 2,735.300 168,645.5282004-05 3,032.965 77,410.640 2,422.347 29,637.156 10,893.498 3,137.083 45,555.517 2,855.742 174,944.9482005-06 3,111.572 78,532.785 2,574.791 30,618.166 11,071.207 2,811.009 45,173.232 3,029.567 176,922.3292006-07 3,000.420 80,790.115 2,391.797 28,751.521 11,703.511 99.992 45,232.377 3,683.526 175,653.2602007-08 2,858.767 71,989.032 2,496.632 30,527.619 11,035.711 101.281 45,959.001 3,835.088 168,803.1302008-09 2,758.971 73,167.131 2,522.671 31,564.097 10,875.046 95.303 46,651.685 4,099.544 171,734.4482009-10 2,691.849 71,329.763 2,291.975 30,043.482 10,438.937 107.709 45,208.742 3,974.918 166,087.3742010-11 2,731.913 74,658.039 2,087.887 30,618.877 10,381.467 97.386 45,668.152 3,867.213 170,110.9352011-12 2,698.442 76,528.221 2,086.669 31,475.841 10,216.082 103.416 45,395.712 4,338.190 172,842.5722012-13 2,649.389 76,763.976 2,050.731 31,617.694 9,928.293 122.910 43,061.457 4,272.778 170,467.2292013-14 2,524.987 77,324.396 2,107.477 31,366.680 9,480.767 101.765 42,982.723 4,675.857 170,564.6522014-15 2,313.183 81,344.934 2,250.560 33,310.466 9,078.178 100.182 45,250.393 4,864.233 178,512.1292015-16 2,339.361 85,398.718 2,249.523 34,571.896 8,917.616 106.188 46,648.377 5,554.900 185,786.5802016-17 2,360.236 85,194.924 2,219.431 34,932.005 8,315.115 99.546 43,133.775 4,564.985 180,820.0162017-18 2,283.024 86,547.780 2,425.959 35,836.631 8,163.538 101.065 44,690.758 4,265.736 184,314.4902018-19 2,240.149 88,467.141 2,383.500 36,684.444 8,189.780 120.269 45,255.831 4,335.660 187,676.774
Notes: These data should be read in conjunction with the explanatory notes and other turnover tables in this publication.
Figure(s) may be incomplete for any period or jurisdiction due to some unavailable turnover figures that are used to derive these numbers.
AUSTRALIA
Value ($ million)
ACT NSW NT QLD SA TAS VIC WA
Australian Gambling Statistics, 1993–94 to 2018–2019, 36th edition
154

TABLE GAMING 3PER CAPITA TOTAL GAMING TURNOVER
1993-94 4,497.10 4,449.21 2,983.93 1,835.16 767.00 2,598.03 2,455.15 1,647.71 2,852.311994-95 5,703.92 5,229.28 3,379.56 2,205.46 1,921.02 2,798.45 4,179.43 1,907.03 3,766.941995-96 5,966.03 5,944.93 5,087.61 2,633.60 2,954.62 2,962.44 5,415.97 1,948.75 4,508.201996-97 5,624.29 6,328.24 4,873.40 2,921.22 3,228.87 3,241.76 6,768.80 1,705.01 5,024.531997-98 5,964.61 7,334.24 5,505.47 3,834.86 3,480.13 3,715.89 9,228.13 1,625.53 6,179.181998-99 6,707.69 8,123.27 6,189.81 4,532.43 3,858.02 4,247.08 8,705.87 1,361.81 6,477.141999-00 7,281.36 8,915.77 7,492.35 5,126.49 4,176.67 4,686.32 9,558.66 1,355.84 7,123.422000-01 7,644.12 8,883.81 9,256.41 5,445.18 4,625.19 5,277.64 9,754.16 1,313.40 7,287.582001-02 8,178.71 9,502.14 10,001.23 5,629.31 5,133.42 5,388.70 9,518.03 1,323.90 7,529.002002-03 8,587.06 9,839.75 11,373.46 6,055.50 5,659.46 5,647.59 8,774.58 1,200.87 7,584.822003-04 8,863.02 10,277.81 11,249.73 6,746.63 6,240.21 5,923.17 8,508.35 1,294.68 7,850.612004-05 8,602.30 10,918.22 12,059.84 7,292.72 6,578.41 6,123.75 8,593.10 1,358.30 8,220.412005-06 8,976.63 11,328.83 12,964.16 7,585.56 6,826.79 5,610.47 8,651.12 1,456.67 8,448.912006-07 8,738.37 11,852.48 12,110.33 7,150.11 7,340.57 203.53 8,753.47 1,777.90 8,483.402007-08 8,420.51 10,727.39 12,657.52 7,636.25 7,058.16 210.51 8,995.78 1,853.60 8,246.232008-09 8,210.81 11,035.42 12,728.85 7,921.09 7,071.35 201.43 9,194.16 1,975.18 8,454.642009-10 8,024.13 10,834.85 11,513.33 7,540.11 6,851.13 229.97 8,925.01 1,904.14 8,201.802010-11 8,216.17 11,532.81 10,638.87 7,771.90 6,941.82 212.07 9,133.78 1,858.02 8,513.702011-12 8,133.77 11,949.54 10,682.72 8,016.89 6,921.52 229.08 9,124.31 2,068.78 8,703.032012-13 8,011.80 12,093.55 10,435.69 8,070.61 6,810.79 277.46 8,666.95 2,025.26 8,620.802013-14 7,720.96 12,316.15 10,791.96 8,073.70 6,610.56 234.67 8,689.09 2,232.09 8,703.342014-15 7,086.76 12,979.57 11,613.14 8,594.69 6,379.64 233.66 9,105.03 2,337.21 9,122.532015-16 7,141.11 13,604.49 11,688.99 8,917.55 6,305.13 249.65 9,299.94 2,687.49 9,478.972016-17 7,189.12 13,570.85 11,665.56 9,017.65 5,938.18 235.91 8,535.91 2,233.67 9,228.782017-18 6,938.67 13,804.32 12,941.22 9,256.35 5,891.94 240.89 8,796.90 2,110.57 9,419.222018-19 6,800.66 14,112.16 12,942.34 9,452.07 5,949.80 287.10 8,842.44 2,159.68 9,581.11
Notes: These data should be read in conjunction with the explanatory notes and other turnover tables in this publication.
Figure(s) may be incomplete for any period or jurisdiction due to some unavailable turnover figures that are used to derive these numbers.
AUSTRALIA
Value ($)
ACT NSW NT QLD SA TAS VIC WA
Australian Gambling Statistics, 1993–94 to 2018–2019, 36th edition
155
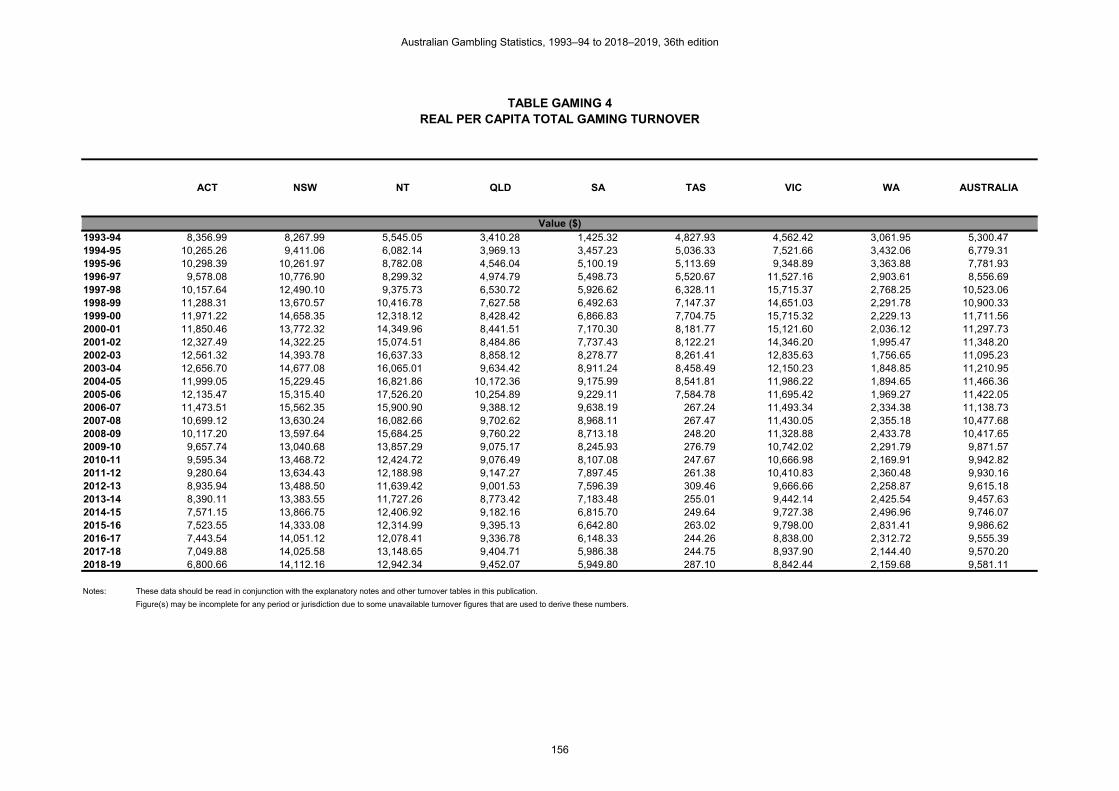
TABLE GAMING 4REAL PER CAPITA TOTAL GAMING TURNOVER
1993-94 8,356.99 8,267.99 5,545.05 3,410.28 1,425.32 4,827.93 4,562.42 3,061.95 5,300.471994-95 10,265.26 9,411.06 6,082.14 3,969.13 3,457.23 5,036.33 7,521.66 3,432.06 6,779.311995-96 10,298.39 10,261.97 8,782.08 4,546.04 5,100.19 5,113.69 9,348.89 3,363.88 7,781.931996-97 9,578.08 10,776.90 8,299.32 4,974.79 5,498.73 5,520.67 11,527.16 2,903.61 8,556.691997-98 10,157.64 12,490.10 9,375.73 6,530.72 5,926.62 6,328.11 15,715.37 2,768.25 10,523.061998-99 11,288.31 13,670.57 10,416.78 7,627.58 6,492.63 7,147.37 14,651.03 2,291.78 10,900.331999-00 11,971.22 14,658.35 12,318.12 8,428.42 6,866.83 7,704.75 15,715.32 2,229.13 11,711.562000-01 11,850.46 13,772.32 14,349.96 8,441.51 7,170.30 8,181.77 15,121.60 2,036.12 11,297.732001-02 12,327.49 14,322.25 15,074.51 8,484.86 7,737.43 8,122.21 14,346.20 1,995.47 11,348.202002-03 12,561.32 14,393.78 16,637.33 8,858.12 8,278.77 8,261.41 12,835.63 1,756.65 11,095.232003-04 12,656.70 14,677.08 16,065.01 9,634.42 8,911.24 8,458.49 12,150.23 1,848.85 11,210.952004-05 11,999.05 15,229.45 16,821.86 10,172.36 9,175.99 8,541.81 11,986.22 1,894.65 11,466.362005-06 12,135.47 15,315.40 17,526.20 10,254.89 9,229.11 7,584.78 11,695.42 1,969.27 11,422.052006-07 11,473.51 15,562.35 15,900.90 9,388.12 9,638.19 267.24 11,493.34 2,334.38 11,138.732007-08 10,699.12 13,630.24 16,082.66 9,702.62 8,968.11 267.47 11,430.05 2,355.18 10,477.682008-09 10,117.20 13,597.64 15,684.25 9,760.22 8,713.18 248.20 11,328.88 2,433.78 10,417.652009-10 9,657.74 13,040.68 13,857.29 9,075.17 8,245.93 276.79 10,742.02 2,291.79 9,871.572010-11 9,595.34 13,468.72 12,424.72 9,076.49 8,107.08 247.67 10,666.98 2,169.91 9,942.822011-12 9,280.64 13,634.43 12,188.98 9,147.27 7,897.45 261.38 10,410.83 2,360.48 9,930.162012-13 8,935.94 13,488.50 11,639.42 9,001.53 7,596.39 309.46 9,666.66 2,258.87 9,615.182013-14 8,390.11 13,383.55 11,727.26 8,773.42 7,183.48 255.01 9,442.14 2,425.54 9,457.632014-15 7,571.15 13,866.75 12,406.92 9,182.16 6,815.70 249.64 9,727.38 2,496.96 9,746.072015-16 7,523.55 14,333.08 12,314.99 9,395.13 6,642.80 263.02 9,798.00 2,831.41 9,986.622016-17 7,443.54 14,051.12 12,078.41 9,336.78 6,148.33 244.26 8,838.00 2,312.72 9,555.392017-18 7,049.88 14,025.58 13,148.65 9,404.71 5,986.38 244.75 8,937.90 2,144.40 9,570.202018-19 6,800.66 14,112.16 12,942.34 9,452.07 5,949.80 287.10 8,842.44 2,159.68 9,581.11
Notes: These data should be read in conjunction with the explanatory notes and other turnover tables in this publication.
Figure(s) may be incomplete for any period or jurisdiction due to some unavailable turnover figures that are used to derive these numbers.
AUSTRALIA
Value ($)
ACT NSW NT QLD SA TAS VIC WA
Australian Gambling Statistics, 1993–94 to 2018–2019, 36th edition
156

TABLE GAMING 5TOTAL GAMING EXPENDITURE
1993-94 149.126 2,321.992 47.573 900.111 206.824 91.091 1,099.067 503.492 5,319.2771994-95 163.210 2,630.126 52.335 989.777 353.976 101.884 1,702.778 559.906 6,553.9921995-96 162.515 3,107.201 79.360 1,185.656 480.212 112.848 2,114.108 616.350 7,858.2501996-97 151.521 3,287.747 75.220 1,311.019 518.934 127.308 2,329.903 561.288 8,362.9401997-98 159.899 3,894.487 82.276 1,497.877 559.834 145.286 2,759.609 550.624 9,649.8921998-99 179.239 4,428.889 93.358 1,720.120 611.901 166.754 2,995.800 489.782 10,685.8431999-00 190.517 4,826.284 108.560 1,765.901 660.464 181.134 3,316.457 495.812 11,545.1292000-01 203.502 5,186.969 126.047 1,921.195 727.479 202.576 3,650.942 492.361 12,511.0712001-02 209.075 5,301.105 134.851 2,049.459 802.202 232.263 3,814.853 501.508 13,045.3162002-03 220.060 5,533.893 146.751 2,207.884 878.138 244.704 3,658.559 485.194 13,375.1832003-04 229.538 5,814.304 153.787 2,499.775 943.294 259.869 3,638.914 530.176 14,069.6572004-05 222.807 6,059.699 164.754 2,658.181 970.758 270.640 3,698.221 560.813 14,605.8732005-06 229.775 6,272.056 186.145 2,802.635 989.125 258.652 3,895.290 608.112 15,241.7902006-07 222.512 6,499.654 191.716 2,670.928 1,036.414 265.339 4,018.264 738.901 15,643.7282007-08 216.389 6,002.838 209.588 2,854.842 1,001.236 280.842 4,145.316 794.524 15,505.5742008-09 215.557 6,244.761 219.929 2,975.265 1,012.626 294.643 4,371.750 876.807 16,211.3392009-10 215.733 5,730.966 206.576 2,849.777 997.847 289.052 4,359.852 864.952 15,514.7552010-11 219.885 6,478.068 190.464 2,954.540 1,009.304 290.308 4,431.963 828.078 16,402.6102011-12 222.313 6,768.616 200.845 3,101.233 1,024.759 285.133 4,696.059 993.052 17,292.0102012-13 219.448 6,979.267 209.457 3,178.822 1,023.466 279.142 4,567.810 989.953 17,447.3652013-14 211.163 7,166.476 223.395 3,133.117 1,020.499 271.548 4,566.101 1,155.900 17,748.198
2014-15 207.820 7,802.987 243.798 3,383.943 1,018.456 274.188 4,951.259 1,223.843 19,106.294
2015-16 212.650 8,307.602 246.795 3,510.466 1,046.119 277.716 5,018.540 1,165.160 19,785.0492016-17 226.039 8,403.097 245.990 3,513.740 959.430 264.918 4,688.775 1,018.657 19,320.6462017-18 226.611 8,659.761 258.346 3,715.282 1,009.732 258.066 5,007.665 970.290 20,105.7532018-19 228.451 8,803.041 259.580 3,967.518 981.094 264.349 5,039.946 995.496 20,539.475
Notes: These data should be read in conjunction with the explanatory notes and other expenditure tables in this publication.
Figure(s) may be incomplete for any period or jurisdiction due to some unavailable expenditure figures that are used to derive these numbers.
AUSTRALIA
Value ($ million)
ACT NSW NT QLD SA TAS VIC WA
Australian Gambling Statistics, 1993–94 to 2018–2019, 36th edition
157

TABLE GAMING 6REAL TOTAL GAMING EXPENDITURE
1993-94 277.122 4,314.972 88.405 1,672.682 384.343 169.276 2,042.403 935.643 9,884.8461994-95 293.727 4,733.398 94.186 1,781.287 637.045 183.359 3,064.463 1,007.654 11,795.1181995-96 280.529 5,363.565 136.989 2,046.647 828.929 194.796 3,649.315 1,063.927 13,564.6961996-97 258.038 5,598.984 128.098 2,232.646 883.737 216.803 3,967.791 955.864 14,241.9611997-98 272.306 6,632.253 140.115 2,550.862 953.389 247.420 4,699.573 937.704 16,433.6221998-99 301.640 7,453.337 157.112 2,894.774 1,029.763 280.629 5,041.604 824.250 17,983.1081999-00 313.228 7,934.856 178.482 2,903.304 1,085.864 297.801 5,452.561 815.161 18,981.2572000-01 315.483 8,041.211 195.407 2,978.374 1,127.790 314.047 5,659.952 763.293 19,395.5592001-02 315.132 7,990.173 203.256 3,089.079 1,209.131 350.082 5,749.996 755.906 19,662.7552002-03 321.908 8,095.092 214.670 3,229.738 1,284.558 357.958 5,351.815 709.752 19,565.4922003-04 327.788 8,303.030 219.613 3,569.766 1,347.057 371.102 5,196.497 757.110 20,091.9632004-05 310.786 8,452.465 229.810 3,707.805 1,354.077 377.506 5,158.521 782.259 20,373.2292005-06 310.632 8,479.166 251.648 3,788.870 1,337.194 349.671 5,266.026 822.104 20,605.3102006-07 292.159 8,534.068 251.723 3,506.938 1,360.815 348.391 5,275.995 970.180 20,540.2682007-08 274.944 7,627.214 266.303 3,627.366 1,272.172 356.838 5,267.044 1,009.523 19,701.4042008-09 265.605 7,694.679 270.993 3,666.066 1,247.739 363.054 5,386.789 1,080.386 19,975.3102009-10 259.653 6,897.713 248.633 3,429.953 1,200.995 347.899 5,247.459 1,041.045 18,673.3502010-11 256.795 7,565.482 222.435 3,450.491 1,178.727 339.039 5,175.916 967.080 19,155.9652011-12 253.659 7,722.991 229.164 3,538.507 1,169.250 325.337 5,358.203 1,133.072 19,730.1842012-13 244.761 7,784.305 233.617 3,545.490 1,141.520 311.340 5,094.693 1,104.141 19,459.8672013-14 229.464 7,787.570 242.756 3,404.654 1,108.942 295.082 4,961.830 1,256.078 19,286.375
2014-15 222.025 8,336.337 260.462 3,615.242 1,088.070 292.930 5,289.687 1,307.495 20,412.249
2015-16 224.038 8,752.515 260.012 3,698.469 1,102.144 292.589 5,287.307 1,227.560 20,844.6362016-17 234.039 8,700.484 254.695 3,638.092 993.384 274.293 4,854.712 1,054.707 20,004.4072017-18 230.243 8,798.564 262.487 3,774.833 1,025.916 262.202 5,087.931 985.842 20,428.0182018-19 228.451 8,803.041 259.580 3,967.518 981.094 264.349 5,039.946 995.496 20,539.475
Notes: These data should be read in conjunction with the explanatory notes and other expenditure tables in this publication.
Figure(s) may be incomplete for any period or jurisdiction due to some unavailable expenditure figures that are used to derive these numbers.
AUSTRALIA
Value ($ million)
ACT NSW NT QLD SA TAS VIC WA
Australian Gambling Statistics, 1993–94 to 2018–2019, 36th edition
158

TABLE GAMING 7PER CAPITA TOTAL GAMING EXPENDITURE
1993-94 682.50 518.24 405.19 392.71 187.67 264.34 329.21 408.67 405.231994-95 736.15 580.67 433.89 421.24 319.91 294.18 507.04 445.46 493.101995-96 720.96 677.51 637.77 493.00 432.54 324.51 623.88 480.03 583.231996-97 664.15 707.50 586.00 534.31 465.05 364.91 680.44 428.14 612.271997-98 695.33 827.94 624.99 600.10 498.29 415.68 797.78 412.03 697.661998-99 771.36 930.19 695.07 677.99 540.77 476.28 856.49 360.07 762.921999-00 809.09 1,000.55 791.98 684.15 579.59 515.68 936.40 358.47 813.342000-01 850.12 1,060.34 903.91 730.30 633.98 574.43 1,016.57 350.03 868.752001-02 859.01 1,069.93 956.59 761.50 693.81 655.54 1,047.14 350.61 892.532002-03 891.11 1,106.06 1,037.63 798.64 752.91 683.72 990.26 333.71 901.872003-04 918.33 1,152.81 1,083.20 880.09 801.78 715.93 971.28 358.36 935.302004-05 881.47 1,192.16 1,144.13 912.37 817.71 736.91 973.05 372.07 957.312005-06 896.15 1,223.17 1,267.06 938.68 824.55 697.91 1,008.50 395.28 984.002006-07 850.88 1,252.01 1,274.54 872.13 853.52 709.15 1,021.02 468.27 992.022007-08 809.85 1,136.56 1,350.11 907.36 813.65 741.67 1,030.94 487.93 962.442008-09 790.45 1,160.55 1,367.37 920.01 811.32 767.36 1,061.63 520.54 983.402009-10 774.00 1,047.75 1,248.96 860.83 788.22 742.82 1,035.94 498.70 922.142010-11 772.31 1,168.68 1,133.42 875.83 788.18 738.30 1,035.20 464.64 958.722011-12 764.59 1,205.91 1,173.21 901.26 792.18 720.66 1,076.97 540.34 993.462012-13 740.16 1,226.35 1,188.82 905.01 783.08 702.82 1,025.41 523.35 984.122013-14 701.66 1,240.40 1,243.10 876.35 773.22 680.47 1,003.05 599.61 984.12
2014-15 680.20 1,330.16 1,344.01 932.80 764.64 683.23 1,064.36 628.24 1,043.13
2015-16 683.90 1,394.32 1,351.08 953.99 779.26 687.88 1,054.09 593.90 1,063.512016-17 712.87 1,385.92 1,338.71 939.17 709.42 650.05 960.72 516.07 1,021.002017-18 699.77 1,403.37 1,400.23 975.01 740.44 624.97 1,001.50 487.77 1,043.952018-19 693.53 1,404.25 1,409.51 1,022.27 712.76 631.04 984.74 495.88 1,048.56
Notes: These data should be read in conjunction with the explanatory notes and other expenditure tables in this publication.
Figure(s) may be incomplete for any period or jurisdiction due to some unavailable expenditure figures that are used to derive these numbers.
AUSTRALIA
Value ($)
ACT NSW NT QLD SA TAS VIC WA
Australian Gambling Statistics, 1993–94 to 2018–2019, 36th edition
159

TABLE GAMING 8REAL PER CAPITA TOTAL GAMING EXPENDITURE
1993-94 1,268.30 963.05 752.97 729.77 348.74 491.22 611.77 759.44 753.041994-95 1,324.83 1,045.02 780.86 758.10 575.75 529.43 912.52 801.70 887.431995-96 1,244.50 1,169.49 1,100.91 851.00 746.65 560.16 1,076.92 828.62 1,006.761996-97 1,131.04 1,204.87 997.95 909.92 791.97 621.43 1,158.79 729.11 1,042.681997-98 1,184.14 1,409.97 1,064.35 1,021.95 848.57 707.89 1,358.60 701.68 1,188.101998-99 1,298.12 1,565.42 1,169.72 1,140.98 910.05 801.53 1,441.37 605.96 1,283.911999-00 1,330.22 1,645.00 1,302.09 1,124.80 952.90 847.83 1,539.52 589.37 1,337.202000-01 1,317.92 1,643.81 1,401.31 1,132.17 982.85 890.53 1,575.96 542.63 1,346.802001-02 1,294.76 1,612.67 1,441.84 1,147.78 1,045.75 988.07 1,578.32 528.47 1,345.292002-03 1,303.53 1,617.97 1,517.87 1,168.26 1,101.37 1,000.16 1,448.57 488.15 1,319.272003-04 1,311.41 1,646.25 1,546.84 1,256.80 1,144.98 1,022.37 1,387.02 511.75 1,335.642004-05 1,229.53 1,662.90 1,595.90 1,272.63 1,140.59 1,027.89 1,357.27 518.99 1,335.322005-06 1,211.50 1,653.60 1,712.93 1,269.00 1,114.70 943.49 1,363.38 534.38 1,330.272006-07 1,117.21 1,643.89 1,673.48 1,145.11 1,120.67 931.11 1,340.61 614.84 1,302.522007-08 1,029.00 1,444.12 1,715.45 1,152.89 1,033.82 942.37 1,309.92 619.96 1,222.872008-09 973.98 1,430.01 1,684.85 1,133.62 999.70 945.52 1,308.13 641.39 1,211.732009-10 931.58 1,261.06 1,503.23 1,036.08 948.69 894.04 1,246.85 600.23 1,109.872010-11 901.95 1,364.85 1,323.68 1,022.84 920.49 862.23 1,208.97 542.63 1,119.652011-12 872.40 1,375.94 1,338.63 1,028.33 903.88 822.27 1,228.82 616.52 1,133.542012-13 825.54 1,367.81 1,325.95 1,009.40 873.41 783.88 1,143.68 583.72 1,097.632013-14 762.47 1,347.90 1,350.84 952.30 840.23 739.45 1,089.98 651.57 1,069.41
2014-15 726.70 1,421.08 1,435.88 996.56 816.90 729.93 1,137.11 671.18 1,114.43
2015-16 720.52 1,469.00 1,423.43 1,005.08 821.00 724.72 1,110.54 625.71 1,120.472016-17 738.09 1,434.96 1,386.08 972.41 734.52 673.05 994.72 534.34 1,057.132017-18 710.98 1,425.86 1,422.67 990.64 752.31 634.99 1,017.56 495.59 1,060.692018-19 693.53 1,404.25 1,409.51 1,022.27 712.76 631.04 984.74 495.88 1,048.56
Notes: These data should be read in conjunction with the explanatory notes and other expenditure tables in this publication.
Figure(s) may be incomplete for any period or jurisdiction due to some unavailable expenditure figures that are used to derive these numbers.
AUSTRALIA
Value ($)
ACT NSW NT QLD SA TAS VIC WA
Australian Gambling Statistics, 1993–94 to 2018–2019, 36th edition
160

TABLE GAMING 9TOTAL GAMING EXPENDITURE AS A % OF HOUSEHOLD DISPOSABLE INCOME
(ALL STATES AND TERRITORIES)
1993-94 1.999 2.020 1.790 1.757 0.843 1.319 1.441 1.798 1.7051994-95 2.089 2.175 1.720 1.805 1.397 1.405 2.133 1.859 1.9911995-96 1.999 2.409 2.404 2.029 1.791 1.482 2.505 1.941 2.2491996-97 1.778 2.397 2.148 2.080 1.877 1.636 2.647 1.681 2.2661997-98 1.850 2.733 2.307 2.292 1.945 1.835 2.985 1.578 2.5121998-99 1.968 2.992 2.398 2.539 2.123 2.079 3.077 1.326 2.6721999-00 1.886 3.062 2.501 2.472 2.171 2.151 3.253 1.269 2.7272000-01 1.731 3.002 2.608 2.446 2.190 2.310 3.274 1.181 2.7012001-02 1.739 2.999 2.534 2.345 2.181 2.367 3.161 1.055 2.6292002-03 1.628 3.058 2.770 2.483 2.335 2.397 2.911 0.984 2.6152003-04 1.595 2.985 2.738 2.521 2.324 2.299 2.740 0.985 2.5472004-05 1.444 2.898 2.579 2.405 2.287 2.191 2.613 0.973 2.4532005-06 1.403 2.885 2.597 2.313 2.240 1.920 2.608 0.996 2.4192006-07 1.231 2.781 2.480 1.952 2.152 1.817 2.495 1.053 2.2662007-08 1.067 2.381 2.465 1.897 1.900 1.754 2.344 0.970 2.0432008-09 0.961 2.286 2.297 1.767 1.717 1.661 2.274 0.953 1.9432009-10 0.893 2.018 1.968 1.644 1.640 1.579 2.198 0.899 1.7922010-11 0.810 2.109 1.709 1.602 1.555 1.540 2.092 0.782 1.7612011-12 0.751 2.078 1.678 1.605 1.536 1.492 2.130 0.846 1.7572012-13 0.681 2.092 1.635 1.645 1.513 1.484 1.986 0.793 1.7222013-14 0.640 2.017 1.605 1.576 1.473 1.401 1.858 0.880 1.664
2014-15 0.623 2.099 1.627 1.628 1.341 1.301 1.983 0.886 1.717
2015-16 0.621 2.173 1.591 1.639 1.329 1.259 1.984 0.837 1.7372016-17 0.632 2.138 1.550 1.604 1.184 1.171 1.778 0.748 1.6552017-18 0.622 2.142 1.608 1.640 1.212 1.106 1.830 0.700 1.6722018-19 0.607 2.115 1.659 1.688 1.156 1.087 1.784 0.712 1.662
Notes: These data should be read in conjunction with the explanatory notes and other expenditure tables in this publication.
Figure(s) may be incomplete for any period or jurisdiction due to some unavailable expenditure figures that are used to derive these numbers.
Percentage (%)
TAS VIC WA AUSTRALIAACT NSW NT QLD SA
Australian Gambling Statistics, 1993–94 to 2018–2019, 36th edition
161

TABLE GAMING 10GOVERNMENT REVENUE FROM TOTAL GAMING
1993-94 41.553 688.155 11.221 260.975 103.259 34.960 561.926 146.332 1,848.3811994-95 46.211 746.147 12.783 307.894 157.351 37.981 763.028 163.737 2,235.1321995-96 46.257 850.325 16.474 338.748 202.611 40.762 929.020 184.684 2,608.8811996-97 42.383 897.390 20.921 365.169 225.398 50.285 1,035.732 171.178 2,808.4561997-98 44.412 1,063.121 24.198 428.423 258.939 53.740 1,168.242 180.039 3,221.1141998-99 49.744 1,212.944 26.178 505.368 292.437 59.228 1,272.355 169.849 3,588.1031999-00 56.891 1,348.906 29.618 563.439 316.875 67.227 1,381.926 168.391 3,933.2732000-01 44.939 1,053.353 23.269 482.974 282.678 56.489 1,182.044 176.737 3,302.4832001-02 42.355 1,056.556 25.720 536.032 305.054 64.104 1,270.538 178.953 3,479.3122002-03 44.911 1,115.749 26.647 603.855 344.206 70.195 1,222.062 182.347 3,609.9722003-04 49.944 1,163.566 28.873 688.630 383.837 76.153 1,215.663 197.188 3,803.8542004-05 48.039 1,270.804 34.303 767.386 398.722 78.385 1,253.827 213.740 4,065.2062005-06 46.467 1,371.313 42.870 806.388 399.701 75.041 1,323.627 225.836 4,291.2432006-07 46.813 1,502.241 46.792 780.072 422.225 81.408 1,364.039 264.161 4,507.7512007-08 50.774 1,402.756 51.169 842.753 406.925 80.348 1,444.046 289.804 4,568.5752008-09 50.725 1,500.449 51.324 886.553 409.170 81.501 1,501.656 325.250 4,806.6282009-10 51.077 1,252.484 44.528 882.712 401.207 82.605 1,476.156 327.790 4,518.5592010-11 51.097 1,585.535 40.794 907.558 407.140 80.961 1,497.301 329.066 4,899.4522011-12 51.955 1,631.054 43.732 962.955 416.935 81.214 1,579.280 364.048 5,131.1732012-13 52.842 1,700.775 46.746 999.548 421.402 79.453 1,494.758 381.473 5,176.9972013-14 50.719 1,734.597 51.306 1,005.540 381.156 79.473 1,459.935 399.440 5,162.166
2014-15 49.761 1,912.822 58.440 1,071.026 380.879 80.288 1,561.657 393.845 5,508.718
2015-16 50.387 2,068.611 76.837 1,128.640 380.365 81.846 1,630.899 347.060 5,764.6452016-17 49.722 2,124.285 75.614 1,127.584 357.272 77.996 1,586.839 327.960 5,727.2732017-18 48.895 2,221.083 86.254 1,178.396 360.901 77.198 1,654.852 321.392 5,948.9702018-19 51.683 2,402.131 88.651 1,268.602 374.505 83.536 1,752.099 341.875 6,363.082
Notes: These data should be read in conjunction with the explanatory notes and other revenue tables in this publication.
Figure(s) may be incomplete for any period or jurisdiction due to some unavailable revenue figures that are used to derive these numbers.
Data for the gambling revenue received by states and territories from 1 July 2000 onwards are not comparable with that of preceding years because of the impact
of changes brought about by the introduction of the GST.
AUSTRALIA
Value ($ million)
ACT NSW NT QLD SA TAS VIC WA
Australian Gambling Statistics, 1993–94 to 2018–2019, 36th edition
162

TABLE GAMING 11REAL GOVERNMENT REVENUE FROM TOTAL GAMING
1993-94 77.218 1,278.803 20.852 484.971 191.887 64.966 1,044.231 271.930 3,434.8581994-95 83.165 1,342.829 23.005 554.112 283.182 68.354 1,373.210 294.675 4,022.5331995-96 79.848 1,467.808 28.437 584.737 349.742 70.362 1,603.649 318.796 4,503.3791996-97 72.178 1,528.242 35.628 621.877 383.849 85.635 1,763.836 291.514 4,782.7591997-98 75.633 1,810.479 41.209 729.598 440.969 91.518 1,989.499 306.604 5,485.5091998-99 83.714 2,041.252 44.055 850.479 492.140 99.674 2,141.235 285.837 6,038.3861999-00 93.534 2,217.726 48.695 926.346 520.972 110.527 2,272.014 276.850 6,466.6632000-01 69.668 1,632.983 36.073 748.741 438.228 87.573 1,832.489 273.990 5,119.7462001-02 63.840 1,592.510 38.766 807.943 459.797 96.622 1,915.038 269.730 5,244.2462002-03 65.697 1,632.141 38.980 883.331 503.512 102.683 1,787.657 266.741 5,280.7412003-04 71.322 1,661.613 41.232 983.388 548.133 108.749 1,736.009 281.591 5,432.0372004-05 67.008 1,772.601 47.848 1,070.400 556.164 109.337 1,748.920 298.139 5,670.4162005-06 62.819 1,853.872 57.955 1,090.153 540.354 101.448 1,789.406 305.307 5,801.3132006-07 61.466 1,972.448 61.438 1,024.238 554.383 106.889 1,790.988 346.844 5,918.6932007-08 64.514 1,782.344 65.015 1,070.803 517.039 102.090 1,834.807 368.225 5,804.8372008-09 62.502 1,848.825 63.241 1,092.394 504.172 100.424 1,850.313 400.767 5,922.6382009-10 61.476 1,507.473 53.593 1,062.420 482.887 99.422 1,776.682 394.524 5,438.4772010-11 59.674 1,851.684 47.642 1,059.901 475.483 94.551 1,748.639 384.303 5,721.8782011-12 59.281 1,861.033 49.898 1,098.732 475.723 92.665 1,801.958 415.379 5,854.6682012-13 58.937 1,896.954 52.138 1,114.843 470.009 88.618 1,667.174 425.475 5,774.1482013-14 55.115 1,884.929 55.753 1,092.687 414.190 86.360 1,586.462 434.058 5,609.554
2014-15 53.162 2,043.567 62.435 1,144.233 406.913 85.776 1,668.399 420.765 5,885.251
2015-16 53.085 2,179.395 80.952 1,189.085 400.735 86.229 1,718.242 365.647 6,073.3712016-17 51.482 2,199.464 78.290 1,167.490 369.916 80.756 1,642.998 339.567 5,929.9622017-18 49.679 2,256.684 87.637 1,197.284 366.686 78.435 1,681.377 326.543 6,044.3232018-19 51.683 2,402.131 88.651 1,268.602 374.505 83.536 1,752.099 341.875 6,363.082
Notes: These data should be read in conjunction with the explanatory notes and other revenue tables in this publication.
Figure(s) may be incomplete for any period or jurisdiction due to some unavailable revenue figures that are used to derive these numbers.
Data for the gambling revenue received by states and territories from 1 July 2000 onwards are not comparable with that of preceding years because of the impact
of changes brought about by the introduction of the GST.
AUSTRALIA
Value ($ million)
ACT NSW NT QLD SA TAS VIC WA
Australian Gambling Statistics, 1993–94 to 2018–2019, 36th edition
163

TABLE GAMING 12PER CAPITA GOVERNMENT REVENUE FROM TOTAL GAMING
1993-94 190.18 153.59 95.57 113.86 93.69 101.45 168.31 118.77 140.811994-95 208.43 164.73 105.98 131.04 142.21 109.67 227.21 130.27 168.161995-96 205.21 185.41 132.39 140.85 182.50 117.22 274.16 143.84 193.631996-97 185.77 193.11 162.98 148.83 201.99 144.13 302.48 130.57 205.611997-98 193.13 226.01 183.81 171.64 230.47 153.76 337.73 134.72 232.881998-99 214.08 254.75 194.90 199.19 258.44 169.17 363.76 124.87 256.171999-00 241.61 279.65 216.07 218.29 278.07 191.39 390.18 121.75 277.092000-01 187.73 215.33 166.87 183.59 246.35 160.18 329.13 125.64 229.322001-02 174.02 213.25 182.45 199.17 263.84 180.93 348.75 125.11 238.052002-03 181.86 223.00 188.41 218.43 295.12 196.13 330.77 125.41 243.412003-04 199.81 230.70 203.37 242.44 326.26 209.80 324.48 133.28 252.872004-05 190.05 250.01 238.22 263.39 335.86 213.43 329.90 141.81 266.442005-06 181.23 267.43 291.81 270.08 333.20 202.48 342.69 146.80 277.042006-07 179.01 289.37 311.08 254.71 347.71 217.57 346.60 167.41 285.852007-08 190.02 265.59 329.62 267.85 330.69 212.19 359.14 177.97 283.572008-09 186.01 278.85 319.10 274.14 327.83 212.26 364.66 193.09 291.582009-10 183.25 228.98 269.21 266.64 316.92 212.28 350.75 188.99 268.572010-11 179.47 286.04 242.76 269.03 317.94 205.90 349.73 184.64 286.372011-12 178.69 290.59 255.45 279.85 322.31 205.26 362.18 198.08 294.802012-13 178.23 298.85 265.32 284.57 322.43 200.04 335.55 201.67 292.012013-14 168.53 300.23 285.50 281.25 288.80 199.15 320.71 207.20 286.24
2014-15 162.87 326.08 322.17 295.23 285.96 200.06 335.71 202.17 300.75
2015-16 162.05 347.19 420.64 306.72 283.34 202.72 342.55 176.90 309.872016-17 156.81 350.36 411.50 301.39 264.17 191.38 325.14 166.15 302.662017-18 150.99 359.94 467.50 309.25 264.65 186.95 330.96 161.57 308.892018-19 156.90 383.18 481.37 326.87 272.07 199.41 342.34 170.29 324.84
Notes: These data should be read in conjunction with the explanatory notes and other revenue tables in this publication.
Figure(s) may be incomplete for any period or jurisdiction due to some unavailable revenue figures that are used to derive these numbers.
Data for the gambling revenue received by states and territories from 1 July 2000 onwards are not comparable with that of preceding years because of the impact
of changes brought about by the introduction of the GST.
AUSTRALIA
Value ($)
ACT NSW NT QLD SA TAS VIC WA
Australian Gambling Statistics, 1993–94 to 2018–2019, 36th edition
164

TABLE GAMING 13REAL PER CAPITA GOVERNMENT REVENUE FROM TOTAL GAMING
1993-94 353.40 285.41 177.60 211.59 174.11 188.52 312.78 220.72 261.671994-95 375.11 296.46 190.73 235.82 255.93 197.37 408.91 234.45 302.641995-96 354.22 320.05 228.53 243.14 315.02 202.33 473.24 248.29 334.241996-97 316.37 328.87 277.56 253.45 343.99 245.46 515.13 222.36 350.161997-98 328.89 384.90 313.03 292.30 392.49 261.84 575.15 229.43 396.581998-99 360.27 428.72 327.99 335.22 434.93 284.69 612.17 210.14 431.111999-00 397.22 459.76 355.25 358.89 457.18 314.67 641.50 200.16 455.572000-01 291.03 333.82 258.69 284.62 381.91 248.33 510.24 194.78 355.512001-02 262.30 321.42 275.00 300.20 397.67 272.71 525.66 188.57 358.802002-03 266.03 326.22 275.61 319.52 431.71 286.90 483.86 183.46 356.072003-04 285.34 329.45 290.41 346.22 465.90 299.60 463.37 190.33 361.102004-05 265.10 348.73 332.28 367.39 468.48 297.71 460.16 197.80 371.652005-06 245.00 361.54 394.49 365.12 450.45 273.73 463.28 198.45 374.532006-07 235.04 379.95 408.45 334.44 456.55 285.67 455.08 219.81 375.322007-08 241.45 337.46 418.81 340.33 420.17 269.61 456.32 226.13 360.312008-09 229.20 343.59 393.19 337.79 403.95 261.54 449.33 237.92 359.282009-10 220.56 275.60 324.02 320.92 381.44 255.50 422.16 227.47 323.242010-11 209.59 334.05 283.51 314.19 371.31 240.46 408.44 215.63 334.442011-12 203.88 331.57 291.47 319.30 367.75 234.21 413.25 226.01 336.362012-13 198.78 333.32 295.92 317.39 359.62 223.12 374.26 224.93 325.692013-14 183.14 326.25 310.24 305.63 313.83 216.41 348.50 225.16 311.04
2014-15 174.00 348.36 344.19 315.41 305.50 213.74 358.65 215.99 321.31
2015-16 170.73 365.78 443.17 323.14 298.51 213.58 360.90 186.38 326.462016-17 162.36 362.76 426.06 312.05 273.52 198.16 336.65 172.03 313.372017-18 153.41 365.71 474.99 314.21 268.89 189.95 336.27 164.15 313.842018-19 156.90 383.18 481.37 326.87 272.07 199.41 342.34 170.29 324.84
Notes: These data should be read in conjunction with the explanatory notes and other revenue tables in this publication.
Figure(s) may be incomplete for any period or jurisdiction due to some unavailable revenue figures that are used to derive these numbers.
Data for the gambling revenue received by states and territories from 1 July 2000 onwards are not comparable with that of preceding years because of the impact
of changes brought about by the introduction of the GST.
AUSTRALIA
Value ($)
ACT NSW NT QLD SA TAS VIC WA
Australian Gambling Statistics, 1993–94 to 2018–2019, 36th edition
165

TABLE GAMING 14TOTAL GAMING REVENUE
AS A % OF TOTAL STATE GAMBLING REVENUE
1993-94 87.65 68.17 83.09 77.74 79.28 77.61 75.47 78.691994-95 89.33 69.02 79.80 79.90 87.01 75.95 84.30 79.461995-96 87.27 71.56 81.38 81.30 90.06 78.23 88.37 80.541996-97 91.41 72.57 84.33 82.07 90.82 82.87 89.50 83.451997-98 88.25 78.83 85.59 84.25 91.38 85.38 90.12 83.011998-99 91.30 86.31 83.80 86.04 92.47 88.03 90.37 81.281999-00 91.66 87.45 79.62 91.78 92.94 91.42 90.91 80.482000-01 94.13 88.40 75.69 94.74 94.69 98.76 92.61 80.642001-02 94.02 88.13 77.49 95.15 99.90 99.98 92.74 80.072002-03 93.59 88.45 74.67 95.44 97.93 99.96 92.18 79.052003-04 88.96 88.49 75.29 95.65 98.09 99.96 91.80 79.162004-05 85.87 88.96 75.27 95.87 98.04 99.96 91.59 80.142005-06 87.47 90.09 77.70 95.87 98.31 99.96 91.90 79.692006-07 86.49 90.68 73.92 95.45 98.26 99.97 91.76 81.092007-08 84.92 90.45 71.75 95.75 98.28 93.41 92.08 90.442008-09 89.52 90.36 70.16 95.66 98.12 91.13 92.04 90.962009-10 85.19 88.24 73.49 95.68 98.26 92.48 91.69 91.192010-11 96.96 90.69 81.61 95.78 99.51 97.06 91.92 90.642011-12 97.47 91.05 82.30 95.91 99.69 97.34 92.33 90.912012-13 92.99 91.53 87.84 96.06 99.79 96.91 95.98 90.422013-14 92.40 91.82 88.40 96.18 99.84 96.76 96.56 90.342014-15 99.99 92.29 85.38 98.89 99.85 96.56 96.74 90.312015-16 100.00 94.00 91.50 99.04 99.88 96.53 97.03 89.232016-17 100.00 95.22 91.58 99.10 99.86 99.07 96.99 89.042017-18 100.00 95.31 91.43 99.18 91.74 100.00 97.10 88.562018-19 100.00 96.26 92.05 100.00 91.41 100.00 98.54 89.08
Notes: These data should be read in conjunction with the explanatory notes and other revenue tables in this publication.
Figure(s) may be incomplete for any period or jurisdiction due to some unavailable revenue figures that are used to derive these numbers.
Data for the gambling revenue received by states and territories from 1 July 2000 onwards are not comparable with that of preceding years because of the impact
of changes brought about by the introduction of the GST.
Percentage (%)
TAS VIC WAACT NSW NT QLD SA
Australian Gambling Statistics, 1993–94 to 2018–2019, 36th edition
166

TABLE TAB FO 1TAB FIXED ODDS TURNOVER
1994-95 - - - - - - 12.823 - 12.8231995-96 - - - - - - 17.455 - 17.4551996-97 - - - - - - 19.848 - 19.8481997-98 - - - - - - 33.149 - 33.1491998-99 - 42.600 - - - - 37.900 - 80.5001999-00 - 81.500 - 8.544 - 1.002 45.954 0.927 137.9272000-01 - - U - 15.332 2.288 1.339 49.534 6.745 75.2382001-02 1.922 - (1) 0.906 23.252 - U 2.706 80.630 15.823 125.2392002-03 2.255 - (1) 1.168 26.909 10.803 3.027 78.837 20.231 143.2302003-04 3.560 255.433 1.546 43.167 14.104 3.766 78.926 30.531 431.0332004-05 3.905 318.100 2.212 44.468 17.494 4.470 113.166 34.577 538.3922005-06 5.789 396.349 3.819 66.566 27.931 5.827 147.233 54.258 707.7722006-07 6.243 434.771 - (2) 82.555 34.098 7.183 184.983 60.897 810.7302007-08 8.595 492.902 - 105.806 42.789 18.934 275.162 73.502 1,017.6902008-09 10.760 522.775 - 121.892 58.980 104.448 341.858 90.301 1,251.0142009-10 15.568 642.961 - 147.025 48.862 33.490 654.311 166.368 1,708.5852010-11 16.249 749.003 - 144.603 54.624 17.367 E 861.854 155.444 1,999.1442011-12 19.379 806.283 - 155.430 57.825 13.372 E 1,024.402 179.601 2,256.2922012-13 19.137 767.368 - 146.548 59.453 19.416 E 1,138.195 228.540 2,378.6572013-14 29.982 808.279 - 155.476 61.185 40.103 E 1,367.457 410.833 2,873.3152014-15 30.013 901.799 - 152.071 66.095 46.117 E 1,660.810 530.172 3,387.0772015-16 36.178 978.012 - 182.501 69.613 59.865 1,907.190 616.821 3,850.1802016-17 62.798 992.989 - 163.300 68.376 58.727 (3)R 2,202.010 163.267 R 3,711.466 R
2017-18 86.186 1,038.725 - 190.718 71.553 74.973 R 2,470.632 163.251 R 4,096.038 R
2018-19 104.966 1,078.275 - 172.048 71.977 54.427 1,392.343 (4) 163.351 3,037.386
Notes: These data should be read in conjunction with the explanatory notes and other turnover tables in this publication.
Figure(s) may be incomplete for any period or jurisdiction due to some unavailable turnover figures that are used to derive these numbers.
(1) Data included in TAB turnover table.
(2) TAB fixed odds are included with bookmaker fixed odds, from this period on.
(3) Since the merger of Tabcorp and the Tatts Group in December 2017, some figures may have been incorrectly classified.
(4) Point of consumption tax (POCT) introduced and applied from 1 Jan 2019. This figure only contains data from July 2018 to December 2018, pre-POCT.
E = Estimated data
U = Unavailable data
R = Revised data
AUSTRALIA
Value ($ million)
ACT NSW NT QLD SA TAS VIC WA
Australian Gambling Statistics, 1993–94 to 2018–2019, 36th edition
167

TABLE TAB FO 2REAL TAB FIXED ODDS TURNOVER
1994-95 - - - - - - 23.077 - 23.0771995-96 - - - - - - 30.130 - 30.1301996-97 - - - - - - 33.801 - 33.8011997-98 - - - - - - 56.452 - 56.4521998-99 - 71.691 - - - - 63.782 - 135.4731999-00 - 133.994 - 14.047 - 1.647 75.553 1.524 226.7652000-01 - - U - 23.769 3.547 2.076 76.791 10.457 116.6392001-02 2.897 - (1) 1.366 35.047 - U 4.079 121.531 23.849 188.7682002-03 3.299 - (1) 1.709 39.363 15.803 4.428 115.324 29.594 209.5202003-04 5.084 364.767 2.208 61.644 20.141 5.378 112.709 43.599 615.5302004-05 5.447 443.707 3.085 62.027 24.402 6.235 157.851 48.230 750.9842005-06 7.826 535.823 5.163 89.990 37.760 7.877 199.044 73.351 956.8342006-07 8.197 570.856 - (2) 108.395 44.771 9.431 242.883 79.958 1,064.4912007-08 10.921 626.282 - 134.437 54.368 24.058 349.621 93.392 1,293.0782008-09 13.258 644.154 - 150.193 72.674 128.699 421.231 111.267 1,541.4762009-10 18.737 773.859 - 176.957 58.810 40.308 787.520 200.238 2,056.4302010-11 18.977 874.731 - 168.876 63.793 20.282 E 1,006.526 181.537 2,334.7222011-12 22.111 919.969 - 177.346 65.978 15.257 E 1,168.843 204.925 2,574.4292012-13 21.344 855.882 - 163.452 66.311 21.655 E 1,269.482 254.901 2,653.0282013-14 32.580 878.330 - 168.951 66.488 43.579 E 1,485.970 446.439 3,122.3362014-15 32.064 963.439 - 162.465 70.613 49.269 E 1,774.330 566.410 3,618.5912015-16 38.116 1,030.389 - 192.275 73.341 63.071 2,009.329 649.855 4,056.3762016-17 65.020 1,028.131 - 169.079 70.796 60.805 (3)R 2,279.940 169.045 R 3,842.816 R
2017-18 87.567 1,055.374 - 193.775 72.700 76.174 R 2,510.232 165.868 R 4,161.691 R
2018-19 104.966 1,078.275 - 172.048 71.977 54.427 1,392.343 (4) 163.351 3,037.386
Notes: These data should be read in conjunction with the explanatory notes and other turnover tables in this publication.
Figure(s) may be incomplete for any period or jurisdiction due to some unavailable turnover figures that are used to derive these numbers.
(1) Data included in TAB turnover table.
(2) TAB fixed odds are included with bookmaker fixed odds, from this period on.
(3) Since the merger of Tabcorp and the Tatts Group in December 2017, some figures may have been incorrectly classified.
(4) Point of consumption tax (POCT) introduced and applied from 1 Jan 2019. This figure only contains data from July 2018 to December 2018, pre-POCT.
E = Estimated data
U = Unavailable data
R = Revised data
AUSTRALIA
Value ($ million)
ACT NSW NT QLD SA TAS VIC WA
Australian Gambling Statistics, 1993–94 to 2018–2019, 36th edition
168

TABLE TAB FO 3PER CAPITA TAB FIXED ODDS TURNOVER
1994-95 - - - - - - 3.82 - 0.961995-96 - - - - - - 5.15 - 1.301996-97 - - - - - - 5.80 - 1.451997-98 - - - - - - 9.58 - 2.401998-99 - 8.95 - - - - 10.84 - 5.751999-00 - 16.90 - 3.31 - 2.85 12.98 0.67 9.722000-01 - - U - 5.83 1.99 3.80 13.79 4.80 5.222001-02 7.90 - (1) 6.43 8.64 - U 7.64 22.13 11.06 8.572002-03 9.13 - (1) 8.26 9.73 9.26 8.46 21.34 13.91 9.662003-04 14.24 50.65 10.89 15.20 11.99 10.38 21.07 20.64 28.652004-05 15.45 62.58 15.36 15.26 14.74 12.17 29.78 22.94 35.292005-06 22.58 77.30 26.00 22.29 23.28 15.72 38.12 35.27 45.692006-07 23.87 83.75 - (2) 26.96 28.08 19.20 47.00 38.59 51.412007-08 32.17 93.32 - 33.63 34.77 50.00 68.43 45.14 63.172008-09 39.46 97.15 - 37.69 47.26 272.02 83.02 53.61 75.892009-10 55.85 117.55 - 44.41 38.60 86.06 155.47 95.92 101.552010-11 57.07 135.12 - 42.87 42.66 44.17 E 201.31 87.22 116.852011-12 66.65 143.65 - 45.17 44.70 33.80 E 234.93 97.72 129.632012-13 64.55 134.84 - 41.72 45.49 48.88 E 255.51 120.82 134.172013-14 99.63 139.90 - 43.49 46.36 100.49 E 300.39 213.11 159.322014-15 98.23 153.73 - 41.92 49.62 114.92 E 357.02 272.15 184.922015-16 116.35 164.15 - 49.60 51.86 148.28 400.59 314.40 206.962016-17 198.05 163.77 - 43.65 50.56 144.10 (3)R 451.19 82.71 R 196.13 R
2017-18 266.14 168.33 - 50.05 52.47 181.57 R 494.11 82.07 R 212.68 R
2018-19 318.66 172.00 - 44.33 52.29 129.92 272.05 (4) 81.37 155.06
Notes: These data should be read in conjunction with the explanatory notes and other turnover tables in this publication.
Figure(s) may be incomplete for any period or jurisdiction due to some unavailable turnover figures that are used to derive these numbers.
(1) Data included in TAB turnover table.
(2) TAB fixed odds are included with bookmaker fixed odds, from this period on.
(3) Since the merger of Tabcorp and the Tatts Group in December 2017, some figures may have been incorrectly classified.
(4) Point of consumption tax (POCT) introduced and applied from 1 Jan 2019. This figure only contains data from July 2018 to December 2018, pre-POCT.
E = Estimated data
U = Unavailable data
R = Revised data
AUSTRALIA
Value ($)
ACT NSW NT QLD SA TAS VIC WA
Australian Gambling Statistics, 1993–94 to 2018–2019, 36th edition
169

TABLE TAB FO 4REAL PER CAPITA TAB FIXED ODDS TURNOVER
1994-95 - - - - - - 6.87 - 1.741995-96 - - - - - - 8.89 - 2.241996-97 - - - - - - 9.87 - 2.471997-98 - - - - - - 16.32 - 4.081998-99 - 15.06 - - - - 18.23 - 9.671999-00 - 27.78 - 5.44 - 4.69 21.33 1.10 15.982000-01 - - U - 9.04 3.09 5.89 21.38 7.43 8.102001-02 11.90 - (1) 9.69 13.02 - U 11.51 33.36 16.67 12.922002-03 13.36 - (1) 12.08 14.24 13.55 12.37 31.21 20.35 14.132003-04 20.34 72.32 15.55 21.70 17.12 14.82 30.08 29.47 40.922004-05 21.55 87.29 21.43 21.29 20.55 16.98 41.53 32.00 49.222005-06 30.52 104.50 35.14 30.14 31.48 21.26 51.53 47.68 61.772006-07 31.35 109.96 - (2) 35.39 36.87 25.21 61.72 50.67 67.502007-08 40.87 118.58 - 42.73 44.18 63.53 86.95 57.35 80.262008-09 48.62 119.71 - 46.44 58.23 335.18 102.29 66.06 93.512009-10 67.23 141.48 - 53.45 46.45 103.59 187.12 115.45 122.232010-11 66.65 157.81 - 50.06 49.82 51.58 E 235.10 101.86 136.462011-12 76.05 163.90 - 51.54 51.00 38.56 E 268.06 111.50 147.912012-13 71.99 150.39 - 46.53 50.74 54.52 E 284.98 134.76 149.642013-14 108.26 152.02 - 47.26 50.38 109.20 E 326.43 231.58 173.132014-15 104.95 164.24 - 44.78 53.01 122.77 E 381.42 290.76 197.562015-16 122.58 172.94 - 52.25 54.63 156.22 422.04 331.24 218.042016-17 205.06 169.57 - 45.19 52.35 149.20 (3)R 467.15 85.64 R 203.07 R
2017-18 270.40 171.03 - 50.85 53.31 184.48 R 502.03 83.38 R 216.09 R
2018-19 318.66 172.00 - 44.33 52.29 129.92 272.05 (4) 81.37 155.06
Notes: These data should be read in conjunction with the explanatory notes and other turnover tables in this publication.
Figure(s) may be incomplete for any period or jurisdiction due to some unavailable turnover figures that are used to derive these numbers.
(1) Data included in TAB turnover table.
(2) TAB fixed odds are included with bookmaker fixed odds, from this period on.
(3) Since the merger of Tabcorp and the Tatts Group in December 2017, some figures may have been incorrectly classified.
(4) Point of consumption tax (POCT) introduced and applied from 1 Jan 2019. This figure only contains data from July 2018 to December 2018, pre-POCT.
E = Estimated data
U = Unavailable data
R = Revised data
AUSTRALIA
Value ($)
ACT NSW NT QLD SA TAS VIC WA
Australian Gambling Statistics, 1993–94 to 2018–2019, 36th edition
170
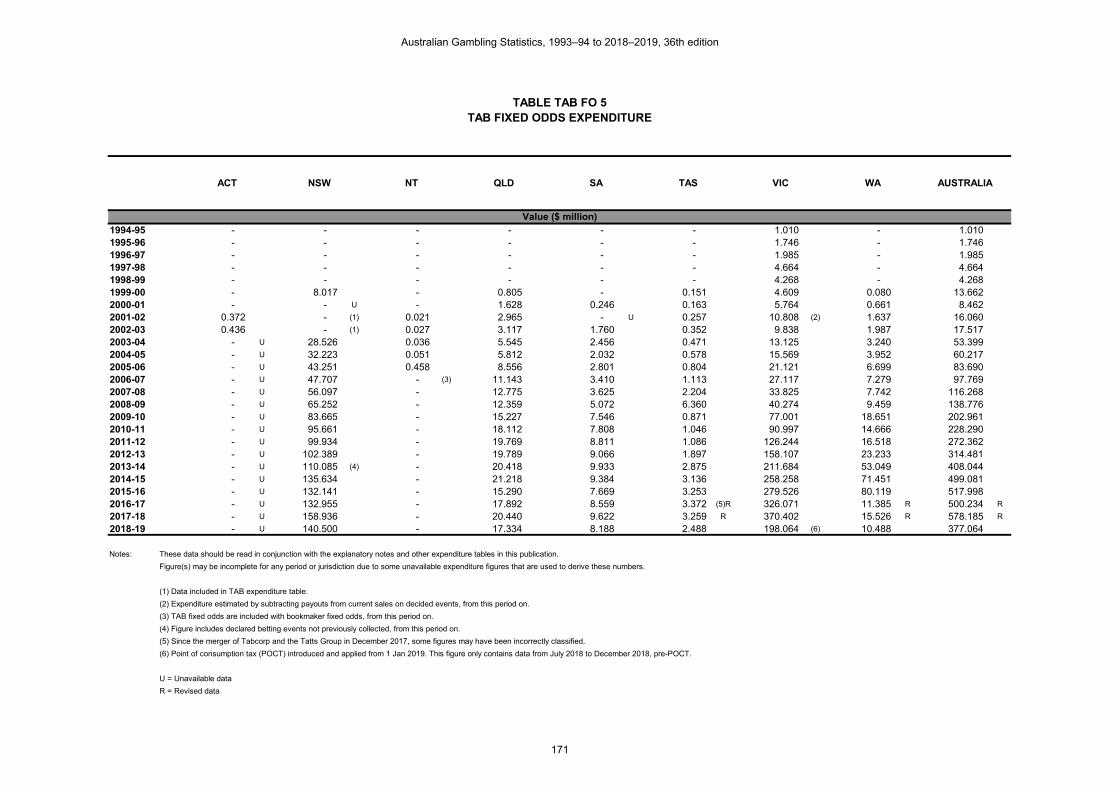
TABLE TAB FO 5TAB FIXED ODDS EXPENDITURE
1994-95 - - - - - - 1.010 - 1.0101995-96 - - - - - - 1.746 - 1.7461996-97 - - - - - - 1.985 - 1.9851997-98 - - - - - - 4.664 - 4.6641998-99 - - - - - - 4.268 - 4.2681999-00 - 8.017 - 0.805 - 0.151 4.609 0.080 13.6622000-01 - - U - 1.628 0.246 0.163 5.764 0.661 8.4622001-02 0.372 - (1) 0.021 2.965 - U 0.257 10.808 (2) 1.637 16.0602002-03 0.436 - (1) 0.027 3.117 1.760 0.352 9.838 1.987 17.5172003-04 - U 28.526 0.036 5.545 2.456 0.471 13.125 3.240 53.3992004-05 - U 32.223 0.051 5.812 2.032 0.578 15.569 3.952 60.2172005-06 - U 43.251 0.458 8.556 2.801 0.804 21.121 6.699 83.6902006-07 - U 47.707 - (3) 11.143 3.410 1.113 27.117 7.279 97.7692007-08 - U 56.097 - 12.775 3.625 2.204 33.825 7.742 116.2682008-09 - U 65.252 - 12.359 5.072 6.360 40.274 9.459 138.7762009-10 - U 83.665 - 15.227 7.546 0.871 77.001 18.651 202.9612010-11 - U 95.661 - 18.112 7.808 1.046 90.997 14.666 228.2902011-12 - U 99.934 - 19.769 8.811 1.086 126.244 16.518 272.3622012-13 - U 102.389 - 19.789 9.066 1.897 158.107 23.233 314.4812013-14 - U 110.085 (4) - 20.418 9.933 2.875 211.684 53.049 408.0442014-15 - U 135.634 - 21.218 9.384 3.136 258.258 71.451 499.0812015-16 - U 132.141 - 15.290 7.669 3.253 279.526 80.119 517.9982016-17 - U 132.955 - 17.892 8.559 3.372 (5)R 326.071 11.385 R 500.234 R
2017-18 - U 158.936 - 20.440 9.622 3.259 R 370.402 15.526 R 578.185 R
2018-19 - U 140.500 - 17.334 8.188 2.488 198.064 (6) 10.488 377.064
Notes: These data should be read in conjunction with the explanatory notes and other expenditure tables in this publication.
Figure(s) may be incomplete for any period or jurisdiction due to some unavailable expenditure figures that are used to derive these numbers.
(1) Data included in TAB expenditure table.
(2) Expenditure estimated by subtracting payouts from current sales on decided events, from this period on.
(3) TAB fixed odds are included with bookmaker fixed odds, from this period on.
(4) Figure includes declared betting events not previously collected, from this period on.
(5) Since the merger of Tabcorp and the Tatts Group in December 2017, some figures may have been incorrectly classified.
(6) Point of consumption tax (POCT) introduced and applied from 1 Jan 2019. This figure only contains data from July 2018 to December 2018, pre-POCT.
U = Unavailable data
R = Revised data
Value ($ million)
TAS VIC WA AUSTRALIAACT NSW NT QLD SA
Australian Gambling Statistics, 1993–94 to 2018–2019, 36th edition
171

TABLE TAB FO 6REAL TAB FIXED ODDS EXPENDITURE
1994-95 - - - - - - 1.818 - 1.8181995-96 - - - - - - 3.014 - 3.0141996-97 - - - - - - 3.380 - 3.3801997-98 - - - - - - 7.943 - 7.9431998-99 - - - - - - 7.183 - 7.1831999-00 - 13.181 - 1.323 - 0.248 7.578 0.132 22.4622000-01 - - U - 2.524 0.381 0.253 8.936 1.025 13.1182001-02 0.561 - (1) 0.032 4.469 - U 0.387 16.291 (2) 2.467 24.2072002-03 0.638 - (1) 0.039 4.560 2.575 0.515 14.391 2.907 25.6242003-04 - U 40.736 0.051 7.918 3.507 0.673 18.743 4.627 76.2562004-05 - U 44.947 0.071 8.107 2.834 0.806 21.717 5.513 83.9952005-06 - U 58.471 0.619 11.567 3.787 1.087 28.553 9.056 113.1402006-07 - U 62.639 - (3) 14.631 4.477 1.461 35.605 9.557 128.3712007-08 - U 71.277 - 16.231 4.606 2.800 42.978 9.837 147.7302008-09 - U 80.402 - 15.229 6.250 7.837 49.625 11.656 170.9982009-10 - U 100.698 - 18.327 9.082 1.048 92.677 22.448 244.2812010-11 - U 111.719 - 21.152 9.119 1.222 106.272 17.128 266.6112011-12 - U 114.025 - 22.556 10.053 1.239 144.044 18.847 310.7652012-13 - U 114.199 - 22.072 10.112 2.116 176.344 25.913 350.7552013-14 - U 119.626 (4) - 22.188 10.794 3.124 230.030 57.647 443.4082014-15 - U 144.905 - 22.668 10.025 3.350 275.910 76.335 533.1942015-16 - U 139.218 - 16.109 8.080 3.427 294.496 84.410 545.7392016-17 - U 137.660 - 18.525 8.862 3.491 (5)R 337.611 11.788 R 517.937 R
2017-18 - U 161.484 - 20.768 9.776 3.311 R 376.339 15.775 R 587.453 R
2018-19 - U 140.500 - 17.334 8.188 2.488 198.064 (6) 10.488 377.064
Notes: These data should be read in conjunction with the explanatory notes and other expenditure tables in this publication.
Figure(s) may be incomplete for any period or jurisdiction due to some unavailable expenditure figures that are used to derive these numbers.
(1) Data included in TAB expenditure table.
(2) Expenditure estimated by subtracting payouts from current sales on decided events, from this period on.
(3) TAB fixed odds are included with bookmaker fixed odds, from this period on.
(4) Figure includes declared betting events not previously collected, from this period on.
(5) Since the merger of Tabcorp and the Tatts Group in December 2017, some figures may have been incorrectly classified.
(6) Point of consumption tax (POCT) introduced and applied from 1 Jan 2019. This figure only contains data from July 2018 to December 2018, pre-POCT.
U = Unavailable data
R = Revised data
Value ($ million)
TAS VIC WA AUSTRALIAACT NSW NT QLD SA
Australian Gambling Statistics, 1993–94 to 2018–2019, 36th edition
172
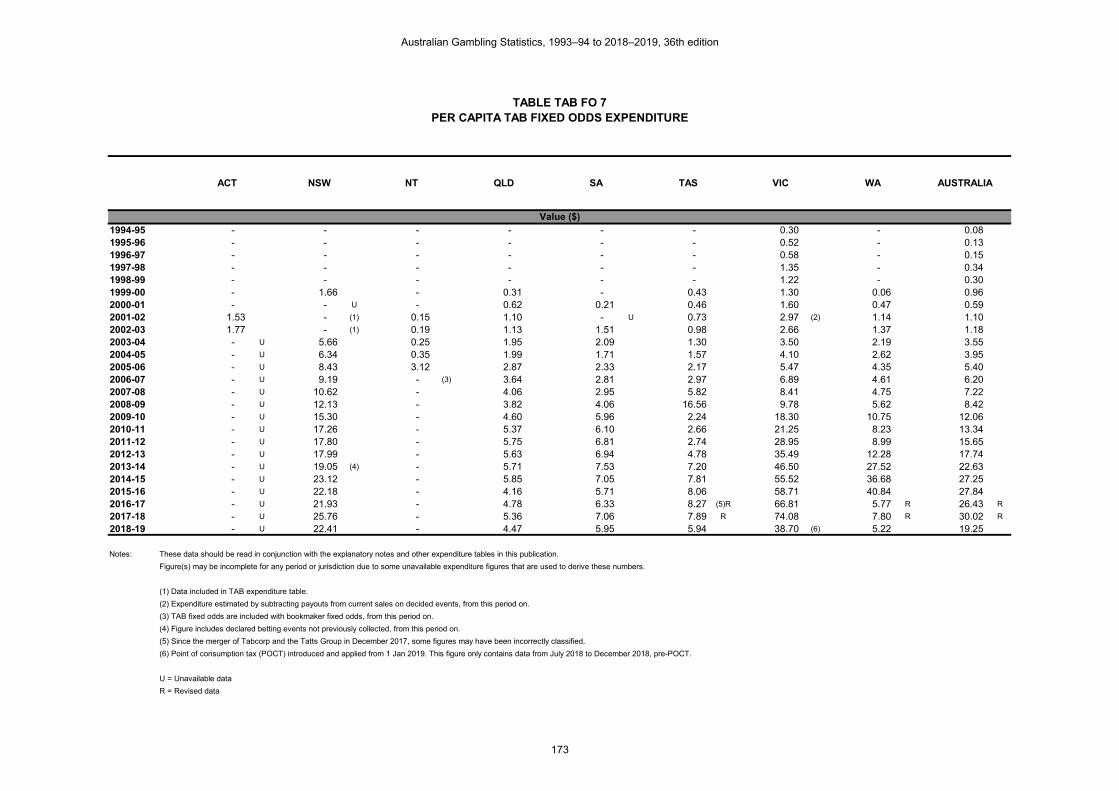
TABLE TAB FO 7PER CAPITA TAB FIXED ODDS EXPENDITURE
1994-95 - - - - - - 0.30 - 0.081995-96 - - - - - - 0.52 - 0.131996-97 - - - - - - 0.58 - 0.151997-98 - - - - - - 1.35 - 0.341998-99 - - - - - - 1.22 - 0.301999-00 - 1.66 - 0.31 - 0.43 1.30 0.06 0.962000-01 - - U - 0.62 0.21 0.46 1.60 0.47 0.592001-02 1.53 - (1) 0.15 1.10 - U 0.73 2.97 (2) 1.14 1.102002-03 1.77 - (1) 0.19 1.13 1.51 0.98 2.66 1.37 1.182003-04 - U 5.66 0.25 1.95 2.09 1.30 3.50 2.19 3.552004-05 - U 6.34 0.35 1.99 1.71 1.57 4.10 2.62 3.952005-06 - U 8.43 3.12 2.87 2.33 2.17 5.47 4.35 5.402006-07 - U 9.19 - (3) 3.64 2.81 2.97 6.89 4.61 6.202007-08 - U 10.62 - 4.06 2.95 5.82 8.41 4.75 7.222008-09 - U 12.13 - 3.82 4.06 16.56 9.78 5.62 8.422009-10 - U 15.30 - 4.60 5.96 2.24 18.30 10.75 12.062010-11 - U 17.26 - 5.37 6.10 2.66 21.25 8.23 13.342011-12 - U 17.80 - 5.75 6.81 2.74 28.95 8.99 15.652012-13 - U 17.99 - 5.63 6.94 4.78 35.49 12.28 17.742013-14 - U 19.05 (4) - 5.71 7.53 7.20 46.50 27.52 22.632014-15 - U 23.12 - 5.85 7.05 7.81 55.52 36.68 27.252015-16 - U 22.18 - 4.16 5.71 8.06 58.71 40.84 27.842016-17 - U 21.93 - 4.78 6.33 8.27 (5)R 66.81 5.77 R 26.43 R
2017-18 - U 25.76 - 5.36 7.06 7.89 R 74.08 7.80 R 30.02 R
2018-19 - U 22.41 - 4.47 5.95 5.94 38.70 (6) 5.22 19.25
Notes: These data should be read in conjunction with the explanatory notes and other expenditure tables in this publication.
Figure(s) may be incomplete for any period or jurisdiction due to some unavailable expenditure figures that are used to derive these numbers.
(1) Data included in TAB expenditure table.
(2) Expenditure estimated by subtracting payouts from current sales on decided events, from this period on.
(3) TAB fixed odds are included with bookmaker fixed odds, from this period on.
(4) Figure includes declared betting events not previously collected, from this period on.
(5) Since the merger of Tabcorp and the Tatts Group in December 2017, some figures may have been incorrectly classified.
(6) Point of consumption tax (POCT) introduced and applied from 1 Jan 2019. This figure only contains data from July 2018 to December 2018, pre-POCT.
U = Unavailable data
R = Revised data
Value ($)
TAS VIC WA AUSTRALIAACT NSW NT QLD SA
Australian Gambling Statistics, 1993–94 to 2018–2019, 36th edition
173

TABLE TAB FO 8REAL PER CAPITA TAB FIXED ODDS EXPENDITURE
1994-95 - - - - - - 0.54 - 0.141995-96 - - - - - - 0.89 - 0.221996-97 - - - - - - 0.99 - 0.251997-98 - - - - - - 2.30 - 0.571998-99 - - - - - - 2.05 - 0.511999-00 - 2.73 - 0.51 - 0.71 2.14 0.10 1.582000-01 - - U - 0.96 0.33 0.72 2.49 0.73 0.912001-02 2.30 - (1) 0.22 1.66 - U 1.09 4.47 (2) 1.73 1.662002-03 2.58 - (1) 0.28 1.65 2.21 1.44 3.90 2.00 1.732003-04 - U 8.08 0.36 2.79 2.98 1.85 5.00 3.13 5.072004-05 - U 8.84 0.49 2.78 2.39 2.20 5.71 3.66 5.512005-06 - U 11.40 4.21 3.87 3.16 2.93 7.39 5.89 7.302006-07 - U 12.07 - (3) 4.78 3.69 3.91 9.05 6.06 8.142007-08 - U 13.50 - 5.16 3.74 7.40 10.69 6.04 9.172008-09 - U 14.94 - 4.71 5.01 20.41 12.05 6.92 10.372009-10 - U 18.41 - 5.54 7.17 2.69 22.02 12.94 14.522010-11 - U 20.15 - 6.27 7.12 3.11 24.82 9.61 15.582011-12 - U 20.31 - 6.56 7.77 3.13 33.03 10.25 17.852012-13 - U 20.07 - 6.28 7.74 5.33 39.59 13.70 19.782013-14 - U 20.71 (4) - 6.21 8.18 7.83 50.53 29.90 24.592014-15 - U 24.70 - 6.25 7.53 8.35 59.31 39.18 29.112015-16 - U 23.37 - 4.38 6.02 8.49 61.86 43.02 29.342016-17 - U 22.70 - 4.95 6.55 8.57 (5)R 69.18 5.97 R 27.37 R
2017-18 - U 26.17 - 5.45 7.17 8.02 R 75.27 7.93 R 30.50 R
2018-19 - U 22.41 - 4.47 5.95 5.94 38.70 (6) 5.22 19.25
Notes: These data should be read in conjunction with the explanatory notes and other expenditure tables in this publication.
Figure(s) may be incomplete for any period or jurisdiction due to some unavailable expenditure figures that are used to derive these numbers.
(1) Data included in TAB expenditure table.
(2) Expenditure estimated by subtracting payouts from current sales on decided events, from this period on.
(3) TAB fixed odds are included with bookmaker fixed odds, from this period on.
(4) Figure includes declared betting events not previously collected, from this period on.
(5) Since the merger of Tabcorp and the Tatts Group in December 2017, some figures may have been incorrectly classified.
(6) Point of consumption tax (POCT) introduced and applied from 1 Jan 2019. This figure only contains data from July 2018 to December 2018, pre-POCT.
U = Unavailable data
R = Revised data
Value ($)
TAS VIC WA AUSTRALIAACT NSW NT QLD SA
Australian Gambling Statistics, 1993–94 to 2018–2019, 36th edition
174

TABLE TAB FO 9TAB FIXED ODDS EXPENDITURE AS A % OF HOUSEHOLD DISPOSABLE INCOME
(ALL STATES AND TERRITORIES)
1994-95 - - - - - - 0.001 - 0.0001995-96 - - - - - - 0.002 - 0.0001996-97 - - - - - - 0.002 - 0.0011997-98 - - - - - - 0.005 - 0.0011998-99 - - - - - - 0.004 - 0.0011999-00 - 0.005 - 0.001 - 0.002 0.005 0.000 0.0032000-01 - - U - 0.002 0.001 0.002 0.005 0.002 0.0022001-02 0.003 - (1) 0.000 0.003 - U 0.003 0.009 (2) 0.003 0.0032002-03 0.003 - (1) 0.001 0.004 0.005 0.003 0.008 0.004 0.0032003-04 - U 0.015 0.001 0.006 0.006 0.004 0.010 0.006 0.0102004-05 - U 0.015 0.001 0.005 0.005 0.005 0.011 0.007 0.0102005-06 - U 0.020 0.006 0.007 0.006 0.006 0.014 0.011 0.0132006-07 - U 0.020 - (3) 0.008 0.007 0.008 0.017 0.010 0.0142007-08 - U 0.022 - 0.008 0.007 0.014 0.019 0.009 0.0152008-09 - U 0.024 - 0.007 0.009 0.036 0.021 0.010 0.0172009-10 - U 0.029 - 0.009 0.012 0.005 0.039 0.019 0.0232010-11 - U 0.031 - 0.010 0.012 0.006 0.043 0.014 0.0252011-12 - U 0.031 - 0.010 0.013 0.006 0.057 0.014 0.0282012-13 - U 0.031 - 0.010 0.013 0.010 0.069 0.019 0.0312013-14 - U 0.031 (4) - 0.010 0.014 0.015 0.086 0.040 0.0382014-15 - U 0.036 - 0.010 0.012 0.015 0.103 0.052 0.0452015-16 - U 0.035 - 0.007 0.010 0.015 0.111 0.058 0.0452016-17 - U 0.034 - 0.008 0.011 0.015 (5)R 0.124 0.008 R 0.043 R
2017-18 - U 0.039 - 0.009 0.012 0.014 R 0.135 0.011 R 0.048 R
2018-19 - U 0.034 - 0.007 0.010 0.010 0.070 (6) 0.008 0.031
Notes: These data should be read in conjunction with the explanatory notes and other expenditure tables in this publication.
Figure(s) may be incomplete for any period or jurisdiction due to some unavailable expenditure figures that are used to derive these numbers.
(1) Data included in TAB expenditure table.
(2) Expenditure estimated by subtracting payouts from current sales on decided events, from this period on.
(3) TAB fixed odds are included with bookmaker fixed odds, from this period on.
(4) Figure includes declared betting events not previously collected, from this period on.
(5) Since the merger of Tabcorp and the Tatts Group in December 2017, some figures may have been incorrectly classified.
(6) Point of consumption tax (POCT) introduced and applied from 1 Jan 2019. This figure only contains data from July 2018 to December 2018, pre-POCT.
U = Unavailable data
R = Revised data
Percentage (%)
TAS VIC WA AUSTRALIAACT NSW NT QLD SA
Australian Gambling Statistics, 1993–94 to 2018–2019, 36th edition
175

TABLE TAB FO 10GOVERNMENT REVENUE FROM TAB FIXED ODDS
1994-95 - - - - - - 0.550 - 0.5501995-96 - - - - - - 0.280 - 0.2801996-97 - - - - - - 0.390 - 0.3901997-98 - - - - - - 0.644 - 0.6441998-99 - 0.900 - - - - 0.854 - 1.7541999-00 - 1.656 - 0.161 - 0.004 0.922 0.005 2.7482000-01 - 1.231 - 0.178 - - U 0.630 0.034 2.0732001-02 - 1.528 - 0.323 - U - U 1.182 0.096 3.1292002-03 - 3.180 - 0.340 0.106 - U 1.076 0.149 4.8512003-04 - 3.016 - 0.605 0.147 - U 1.432 0.222 5.4222004-05 - 3.573 - 0.605 0.122 - U 1.700 0.254 6.2542005-06 - 3.912 - 0.933 0.268 - U 2.291 0.379 7.7832006-07 - 5.882 - 1.216 0.247 - U 2.958 0.675 10.9782007-08 - 5.660 - 1.394 0.257 - U 3.690 0.814 11.8152008-09 - 7.173 - 1.348 0.347 - U 4.394 1.050 14.3122009-10 - 9.128 - 1.661 0.453 - U 8.401 1.834 21.4772010-11 - 10.437 - 1.976 0.467 - U 9.928 1.584 24.3922011-12 - 10.903 - 2.157 0.528 - U 13.773 0.577 27.9382012-13 - 11.171 - 1.984 - - U 7.906 2.626 23.6872013-14 - 12.010 - 2.227 0.596 - U 9.272 5.891 29.9962014-15 - 14.798 - 0.193 0.563 - U 11.312 8.070 34.9362015-16 - 12.157 - 0.140 0.439 - U 12.243 9.590 34.5692016-17 - 9.879 - 0.163 0.511 - U 14.282 0.816 R 25.651 R
2017-18 - 11.809 - 0.186 1.443 (1) - U 16.224 (2) 0.830 R 30.492 R
2018-19 - 9.273 (5)(6) - - U 1.228 - U 8.675 (3) 1.512 (4) 20.688
Notes: These data should be read in conjunction with the explanatory notes and other revenue tables in this publication.
Figure(s) may be incomplete for any period or jurisdiction due to some unavailable revenue figures that are used to derive these numbers.
Data for the gambling revenue received by states and territories from 1 July 2000 onwards are not comparable with that of preceding years because of the impact of changes brought
about by the introduction of the GST.
(1) Includes point of consumption tax (POCT) which commenced on 1 July 2017. Revenue from SA TAB only, not interstate TABs.
(2) Figures are from verified tax received.
(3) POCT introduced and applied from 1 Jan 2019. This figure only contains data from July 2018 to December 2018, pre-POCT.
(4) Includes all government revenue collected between 1 July 2018 to 30 June 2019, but excludes POCT revenue, which was introduced on 1 January 2019.
(5) The NSW Government implemented the POCT on 1 January 2019, through the Betting Tax Amendment (point of consumption) Bill 2018. The Bill provides for a tax of 10% of wagering
operator's revenue derived from NSW customers. POCT does not distinguish between racing and sports betting, and the revenue for the 2018-19 FY is $41m.
(6) Does not include offsets afforded to TAB due to POCT as per Section 11 of the Betting Tax Act 2001 . This is due to the design of the offsets not distinguishing between racing and sportsbetting.
U = Unavailable data
NA = Not applicable
R = Revised data
Value ($ million)
TAS VIC WA AUSTRALIAACT (NA)
NSWNT
(NA)QLD SA
Australian Gambling Statistics, 1993–94 to 2018–2019, 36th edition
176

TABLE TAB FO 11REAL GOVERNMENT REVENUE FROM TAB FIXED ODDS
1994-95 - - - - - - 0.990 - 0.9901995-96 - - - - - - 0.483 - 0.4831996-97 - - - - - - 0.664 - 0.6641997-98 - - - - - - 1.097 - 1.0971998-99 - 1.515 - - - - 1.437 - 2.9521999-00 - 2.723 - 0.265 - 0.007 1.516 0.008 4.5182000-01 - 1.908 - 0.276 - - U 0.977 0.053 3.2142001-02 - 2.303 - 0.487 - U - U 1.782 0.145 4.7162002-03 - 4.652 - 0.497 0.155 - U 1.574 0.218 7.0962003-04 - 4.307 - 0.864 0.210 - U 2.045 0.317 7.7432004-05 - 4.984 - 0.844 0.170 - U 2.371 0.354 8.7232005-06 - 5.289 - 1.261 0.362 - U 3.097 0.512 10.5222006-07 - 7.723 - 1.597 0.324 - U 3.884 0.886 14.4142007-08 - 7.192 - 1.771 0.327 - U 4.689 1.034 15.0122008-09 - 8.838 - 1.661 0.428 - U 5.414 1.294 17.6352009-10 - 10.986 - 1.999 0.545 - U 10.111 2.207 25.8492010-11 - 12.189 - 2.308 0.545 - U 11.595 1.850 28.4862011-12 - 12.440 - 2.461 0.602 - U 15.715 0.658 31.8772012-13 - 12.460 - 2.213 - - U 8.818 2.929 26.4192013-14 - 13.051 - 2.420 0.648 - U 10.075 6.402 32.5952014-15 - 15.809 - 0.206 0.601 - U 12.085 8.622 37.3242015-16 - 12.808 - 0.147 0.463 - U 12.899 10.104 36.4202016-17 - 10.229 - 0.168 0.529 - U 14.787 0.845 R 26.558 R
2017-18 - 11.998 - 0.189 1.466 (1) - U 16.484 (2) 0.843 R 30.980 R
2018-19 - 9.273 (5)(6) - - U 1.228 - U 8.675 (3) 1.512 (4) 20.688
Notes: These data should be read in conjunction with the explanatory notes and other revenue tables in this publication.
Figure(s) may be incomplete for any period or jurisdiction due to some unavailable revenue figures that are used to derive these numbers.
Data for the gambling revenue received by states and territories from 1 July 2000 onwards are not comparable with that of preceding years because of the impact of changes brought
about by the introduction of the GST.
(1) Includes point of consumption tax (POCT) which commenced on 1 July 2017. Revenue from SA TAB only, not interstate TABs.
(2) Figures are from verified tax received.
(3) POCT introduced and applied from 1 Jan 2019. This figure only contains data from July 2018 to December 2018, pre-POCT.
(4) Includes all government revenue collected between 1 July 2018 to 30 June 2019, but excludes POCT revenue, which was introduced on 1 January 2019.
(5) The NSW Government implemented the POCT on 1 January 2019, through the Betting Tax Amendment (point of consumption) Bill 2018. The Bill provides for a tax of 10% of wagering
operator's revenue derived from NSW customers. POCT does not distinguish between racing and sports betting, and the revenue for the 2018-19 FY is $41m.
(6) Does not include offsets afforded to TAB due to POCT as per Section 11 of the Betting Tax Act 2001 . This is due to the design of the offsets not distinguishing between racing and sportsbetting.
U = Unavailable data
NA = Not applicable
R = Revised data
Value ($ million)
TAS VIC WA AUSTRALIAACT(NA)
NSWNT
(NA)QLD SA
Australian Gambling Statistics, 1993–94 to 2018–2019, 36th edition
177

TABLE TAB FO 12PER CAPITA GOVERNMENT REVENUE FROM TAB FIXED ODDS
1994-95 - - - - - - 0.16 - 0.041995-96 - - - - - - 0.08 - 0.021996-97 - - - - - - 0.11 - 0.031997-98 - - - - - - 0.19 - 0.051998-99 - 0.19 - - - - 0.24 - 0.131999-00 - 0.34 - 0.06 - 0.01 0.26 0.00 0.192000-01 - 0.25 - 0.07 - - U 0.18 0.02 0.142001-02 - 0.31 - 0.12 - U - U 0.32 0.07 0.212002-03 - 0.64 - 0.12 0.09 - U 0.29 0.10 0.332003-04 - 0.60 - 0.21 0.12 - U 0.38 0.15 0.362004-05 - 0.70 - 0.21 0.10 - U 0.45 0.17 0.412005-06 - 0.76 - 0.31 0.22 - U 0.59 0.25 0.502006-07 - 1.13 - 0.40 0.20 - U 0.75 0.43 0.702007-08 - 1.07 - 0.44 0.21 - U 0.92 0.50 0.732008-09 - 1.33 - 0.42 0.28 - U 1.07 0.62 0.872009-10 - 1.67 - 0.50 0.36 - U 2.00 1.06 1.282010-11 - 1.88 - 0.59 0.36 - U 2.32 0.89 1.432011-12 - 1.94 - 0.63 0.41 - U 3.16 0.31 1.612012-13 - 1.96 - 0.56 - - U 1.77 1.39 1.342013-14 - 2.08 - 0.62 0.45 - U 2.04 3.06 1.662014-15 - 2.52 - 0.05 0.42 - U 2.43 4.14 1.912015-16 - 2.04 - 0.04 0.33 - U 2.57 4.89 1.862016-17 - 1.63 - 0.04 0.38 - U 2.93 0.41 R 1.36 R
2017-18 - 1.91 - 0.05 1.06 (1) - U 3.24 (2) 0.42 R 1.58 R
2018-19 - 1.48 (5)(6) - - U 0.89 - U 1.70 (3) 0.75 (4) 1.06
Notes: These data should be read in conjunction with the explanatory notes and other revenue tables in this publication.
Figure(s) may be incomplete for any period or jurisdiction due to some unavailable revenue figures that are used to derive these numbers.
Data for the gambling revenue received by states and territories from 1 July 2000 onwards are not comparable with that of preceding years because of the impact of changes brought
about by the introduction of the GST.
(1) Includes point of consumption tax (POCT) which commenced on 1 July 2017. Revenue from SA TAB only, not interstate TABs.
(2) Figures are from verified tax received.
(3) POCT introduced and applied from 1 Jan 2019. This figure only contains data from July 2018 to December 2018, pre-POCT.
(4) Includes all government revenue collected between 1 July 2018 to 30 June 2019, but excludes POCT revenue, which was introduced on 1 January 2019.
(5) The NSW Government implemented the POCT on 1 January 2019, through the Betting Tax Amendment (point of consumption) Bill 2018. The Bill provides for a tax of 10% of wagering
operator's revenue derived from NSW customers. POCT does not distinguish between racing and sports betting, and the revenue for the 2018-19 FY is $41m.
(6) Does not include offsets afforded to TAB due to POCT as per Section 11 of the Betting Tax Act 2001 . This is due to the design of the offsets not distinguishing between racing and sportsbetting.
U = Unavailable data
NA = Not applicable
R = Revised data
Value ($)
TAS VIC WA AUSTRALIAACT(NA)
NSWNT
(NA)QLD SA
Australian Gambling Statistics, 1993–94 to 2018–2019, 36th edition
178

TABLE TAB FO 13REAL PER CAPITA GOVERNMENT REVENUE FROM TAB FIXED ODDS
1994-95 - - - - - - 0.29 - 0.071995-96 - - - - - - 0.14 - 0.041996-97 - - - - - - 0.19 - 0.051997-98 - - - - - - 0.32 - 0.081998-99 - 0.32 - - - - 0.41 - 0.211999-00 - 0.56 - 0.10 - 0.02 0.43 0.01 0.322000-01 - 0.39 - 0.10 - - U 0.27 0.04 0.222001-02 - 0.46 - 0.18 - U - U 0.49 0.10 0.322002-03 - 0.93 - 0.18 0.13 - U 0.43 0.15 0.482003-04 - 0.85 - 0.30 0.18 - U 0.55 0.21 0.512004-05 - 0.98 - 0.29 0.14 - U 0.62 0.24 0.572005-06 - 1.03 - 0.42 0.30 - U 0.80 0.33 0.682006-07 - 1.49 - 0.52 0.27 - U 0.99 0.56 0.912007-08 - 1.36 - 0.56 0.27 - U 1.17 0.64 0.932008-09 - 1.64 - 0.51 0.34 - U 1.31 0.77 1.072009-10 - 2.01 - 0.60 0.43 - U 2.40 1.27 1.542010-11 - 2.20 - 0.68 0.43 - U 2.71 1.04 1.672011-12 - 2.22 - 0.72 0.47 - U 3.60 0.36 1.832012-13 - 2.19 - 0.63 - - U 1.98 1.55 1.492013-14 - 2.26 - 0.68 0.49 - U 2.21 3.32 1.812014-15 - 2.70 - 0.06 0.45 - U 2.60 4.43 2.042015-16 - 2.15 - 0.04 0.34 - U 2.71 5.15 1.962016-17 - 1.69 - 0.05 0.39 - U 3.03 0.43 R 1.40 R
2017-18 - 1.94 - 0.05 1.08 (1) - U 3.30 (2) 0.42 R 1.61 R
2018-19 - 1.48 (5)(6) - - U 0.89 - U 1.70 (3) 0.75 (4) 1.06
Notes: These data should be read in conjunction with the explanatory notes and other revenue tables in this publication.
Figure(s) may be incomplete for any period or jurisdiction due to some unavailable revenue figures that are used to derive these numbers.
Data for the gambling revenue received by states and territories from 1 July 2000 onwards are not comparable with that of preceding years because of the impact of changes brought
about by the introduction of the GST.
(1) Includes point of consumption tax (POCT) which commenced on 1 July 2017. Revenue from SA TAB only, not interstate TABs.
(2) Figures are from verified tax received.
(3) POCT introduced and applied from 1 Jan 2019. This figure only contains data from July 2018 to December 2018, pre-POCT.
(4) Includes all government revenue collected between 1 July 2018 to 30 June 2019, but excludes POCT revenue, which was introduced on 1 January 2019.
(5) The NSW Government implemented the POCT on 1 January 2019, through the Betting Tax Amendment (point of consumption) Bill 2018. The Bill provides for a tax of 10% of wagering
operator's revenue derived from NSW customers. POCT does not distinguish between racing and sports betting, and the revenue for the 2018-19 FY is $41m.
(6) Does not include offsets afforded to TAB due to POCT as per Section 11 of the Betting Tax Act 2001 . This is due to the design of the offsets not distinguishing between racing and sportsbetting.
U = Unavailable data
NA = Not applicable
R = Revised data
Value ($)
TAS VIC WA AUSTRALIAACT(NA)
NSWNT
(NA)QLD SA
Australian Gambling Statistics, 1993–94 to 2018–2019, 36th edition
179

TABLE TAB FO 14TAB FIXED ODDS REVENUE
AS A % OF TOTAL STATE GAMBLING REVENUE
1994-95 - - - - - - 0.06 -1995-96 - - - - - - 0.03 -1996-97 - - - - - - 0.03 -1997-98 - - - - - - 0.05 -1998-99 - 0.06 - - - - 0.06 -1999-00 - 0.11 - 0.03 - 0.01 0.06 0.002000-01 - 0.10 - 0.03 - - U 0.05 0.022001-02 - 0.13 - 0.06 - U - U 0.09 0.042002-03 - 0.25 - 0.05 0.03 - U 0.08 0.062003-04 - 0.23 - 0.08 0.04 - U 0.11 0.092004-05 - 0.25 - 0.08 0.03 - U 0.12 0.102005-06 - 0.26 - 0.11 0.07 - U 0.16 0.132006-07 - 0.36 - 0.15 0.06 - U 0.20 0.212007-08 - 0.36 - 0.16 0.06 - U 0.24 0.252008-09 - 0.43 - 0.15 0.08 - U 0.27 0.292009-10 - 0.64 - 0.18 0.11 - U 0.52 0.512010-11 - 0.60 - 0.21 0.11 - U 0.61 0.442011-12 - 0.61 - 0.21 0.13 - U 0.81 0.142012-13 - 0.60 - 0.19 - - U 0.51 0.622013-14 - 0.64 - 0.21 0.16 - U 0.61 1.332014-15 - 0.71 - 0.02 0.15 - U 0.70 1.852015-16 - 0.55 - 0.01 0.12 - U 0.73 2.472016-17 - 0.44 - 0.01 0.14 - U 0.87 0.22 R
2017-18 - 0.51 - 0.02 0.37 (1) - U 0.95 (2) 0.23 R
2018-19 - 0.37 (5)(6) - - U 0.30 - U 0.49 (3) 0.39 (4)
Notes: These data should be read in conjunction with the explanatory notes and other revenue tables in this publication.
Figure(s) may be incomplete for any period or jurisdiction due to some unavailable revenue figures that are used to derive these numbers.
Data for the gambling revenue received by states and territories from 1 July 2000 onwards are not comparable with that of preceding years because of the impact of changes brought
about by the introduction of the GST.
(1) Includes point of consumption tax (POCT) which commenced on 1 July 2017. Revenue from SA TAB only, not interstate TABs.
(2) Figures are from verified tax received.
(3) POCT introduced and applied from 1 Jan 2019. This figure only contains data from July 2018 to December 2018, pre-POCT.
(4) Includes all government revenue collected between 1 July 2018 to 30 June 2019, but excludes POCT revenue, which was introduced on 1 January 2019.
(5) The NSW Government implemented the POCT on 1 January 2019, through the Betting Tax Amendment (point of consumption) Bill 2018. The Bill provides for a tax of 10% of wagering
operator's revenue derived from NSW customers. POCT does not distinguish between racing and sports betting, and the revenue for the 2018-19 FY is $41m.
(6) Does not include offsets afforded to TAB due to POCT as per Section 11 of the Betting Tax Act 2001 . This is due to the design of the offsets not distinguishing between racing and sportsbetting.
U = Unavailable data
NA = Not applicable
R = Revised data
Percentage (%)
ACT(NA)
NSWNT
(NA)QLD SA TAS VIC WA
Australian Gambling Statistics, 1993–94 to 2018–2019, 36th edition
180

TABLE TAB TO 1TAB TOTE ODDS TURNOVER
1994-95 - 22.541 - - 2.123 0.063 6.795 1.205 32.7271995-96 - 19.568 - 2.800 2.269 0.144 9.104 1.423 35.3081996-97 - 16.306 - 3.100 1.995 0.177 7.537 1.731 30.8461997-98 - 15.728 - 2.500 2.767 0.197 9.010 1.972 32.1741998-99 - 11.956 - 3.300 2.477 0.198 9.381 2.877 30.1891999-00 - 20.738 - 4.478 3.306 0.230 12.142 3.159 44.0532000-01 - - U - 2.195 1.866 0.177 10.796 1.250 16.2842001-02 0.091 - U - 2.885 - U 0.182 12.363 1.626 17.1472002-03 - - U - 3.134 0.027 0.157 11.828 1.847 16.9932003-04 - 19.005 - 3.643 0.018 0.174 12.813 2.261 37.9142004-05 - 18.821 - 4.067 0.043 0.161 13.250 2.814 39.1562005-06 - 15.735 - 3.662 - 0.157 13.571 2.598 35.7232006-07 - 15.213 - 4.230 - 0.161 10.770 2.613 32.9872007-08 - 14.300 - 3.620 - 0.150 11.940 2.651 32.6612008-09 - 16.512 - 3.456 - 0.149 11.081 2.298 33.4962009-10 - 14.439 - 2.953 - 0.123 10.952 1.995 30.4622010-11 - 16.082 - 2.747 0.044 0.137 E 10.131 2.025 31.1662011-12 - 15.744 - 2.411 0.031 0.071 E 9.323 1.714 29.2942012-13 - 15.811 - 2.244 - 0.049 E 8.696 1.683 28.4832013-14 - 13.595 - 1.983 0.027 0.046 E 7.932 1.370 24.9532014-15 - 14.684 - 1.784 0.028 0.065 E 6.509 1.315 24.3852015-16 - 12.885 - 1.731 0.021 0.022 6.229 1.317 22.2052016-17 - 14.685 - 1.608 0.021 0.029 (1)R 6.217 1.641 24.202 R
2017-18 - 12.432 - 1.500 0.039 0.037 5.648 1.075 20.7302018-19 - 12.753 - 1.505 0.038 0.061 2.364 (2) 0.825 17.546
Notes: These data should be read in conjunction with the explanatory notes and other turnover tables in this publication.
Figure(s) may be incomplete for any period or jurisdiction due to some unavailable turnover figures that are used to derive these numbers.
(1) Since the merger of Tabcorp and the Tatts Group in December 2017, some figures may have been incorrectly classified.
(2) Point of consumption tax (POCT) introduced and applied from 1 Jan 2019. This figure only contains data from July 2018 to December 2018, pre-POCT.
E = Estimated data
U = Unavailable data
NA = Not applicable
R = Revised data
Value ($ million)
TAS VIC WA AUSTRALIAACT NSWNT
(NA)QLD SA
Australian Gambling Statistics, 1993–94 to 2018–2019, 36th edition
181

TABLE TAB TO 2REAL TAB TOTE ODDS TURNOVER
1994-95 - 40.567 - - 3.821 0.113 12.229 2.169 58.8981995-96 - 33.778 - 4.833 3.917 0.249 15.715 2.456 60.9481996-97 - 27.769 - 5.279 3.397 0.301 12.835 2.948 52.5301997-98 - 26.785 - 4.257 4.712 0.335 15.344 3.358 54.7921998-99 - 20.121 - 5.554 4.169 0.333 15.787 4.842 50.8051999-00 - 34.095 - 7.362 5.435 0.378 19.963 5.194 72.4272000-01 - - U - 3.403 2.893 0.274 16.737 1.938 25.2452001-02 0.137 - U - 4.348 - U 0.274 18.634 2.451 25.8452002-03 - - U - 4.584 0.039 0.230 17.302 2.702 24.8582003-04 - 27.140 - 5.202 0.026 0.248 18.297 3.229 54.1432004-05 - 26.253 - 5.673 0.060 0.225 18.482 3.925 54.6172005-06 - 21.272 - 4.951 - 0.212 18.347 3.512 48.2942006-07 - 19.975 - 5.554 - 0.211 14.141 3.431 43.3122007-08 - 18.170 - 4.600 - 0.191 15.171 3.368 41.5002008-09 - 20.346 - 4.258 - 0.184 13.654 2.832 41.2742009-10 - 17.379 - 3.554 - 0.148 13.181 2.401 36.6632010-11 - 18.782 - 3.208 0.051 0.160 E 11.832 2.365 36.3982011-12 - 17.964 - 2.751 0.035 0.081 E 10.638 1.956 33.4242012-13 - 17.635 - 2.503 - 0.055 E 9.699 1.877 31.7692013-14 - 14.773 - 2.155 0.029 0.050 E 8.620 1.489 27.1162014-15 - 15.688 - 1.906 0.030 0.069 E 6.954 1.405 26.0522015-16 - 13.575 - 1.824 0.022 0.023 6.563 1.388 23.3942016-17 - 15.205 - 1.665 0.022 0.030 (1)R 6.437 1.699 25.058 R
2017-18 - 12.631 - 1.524 0.039 0.038 5.738 1.092 21.0622018-19 - 12.753 - 1.505 0.038 0.061 2.364 (2) 0.825 17.546
Notes: These data should be read in conjunction with the explanatory notes and other turnover tables in this publication.
Figure(s) may be incomplete for any period or jurisdiction due to some unavailable turnover figures that are used to derive these numbers.
(1) Since the merger of Tabcorp and the Tatts Group in December 2017, some figures may have been incorrectly classified.
(2) Point of consumption tax (POCT) introduced and applied from 1 Jan 2019. This figure only contains data from July 2018 to December 2018, pre-POCT.
E = Estimated data
U = Unavailable data
NA = Not applicable
R = Revised data
Value ($ million)
TAS VIC WA AUSTRALIAACT NSWNT
(NA)QLD SA
Australian Gambling Statistics, 1993–94 to 2018–2019, 36th edition
182

TABLE TAB TO 3PER CAPITA TAB TOTE ODDS TURNOVER
1994-95 - 4.98 - - 1.92 0.18 2.02 0.96 2.461995-96 - 4.27 - 1.16 2.04 0.41 2.69 1.11 2.621996-97 - 3.51 - 1.26 1.79 0.51 2.20 1.32 2.261997-98 - 3.34 - 1.00 2.46 0.56 2.60 1.48 2.331998-99 - 2.51 - 1.30 2.19 0.57 2.68 2.12 2.161999-00 - 4.30 - 1.73 2.90 0.65 3.43 2.28 3.102000-01 - - U - 0.83 1.63 0.50 3.01 0.89 1.132001-02 0.37 - U - 1.07 - U 0.51 3.39 1.14 1.172002-03 - - U - 1.13 0.02 0.44 3.20 1.27 1.152003-04 - 3.77 - 1.28 0.02 0.48 3.42 1.53 2.522004-05 - 3.70 - 1.40 0.04 0.44 3.49 1.87 2.572005-06 - 3.07 - 1.23 - 0.42 3.51 1.69 2.312006-07 - 2.93 - 1.38 - 0.43 2.74 1.66 2.092007-08 - 2.71 - 1.15 - 0.40 2.97 1.63 2.032008-09 - 3.07 - 1.07 - 0.39 2.69 1.36 2.032009-10 - 2.64 - 0.89 - 0.32 2.60 1.15 1.812010-11 - 2.90 - 0.81 0.03 0.35 E 2.37 1.14 1.822011-12 - 2.80 - 0.70 0.02 0.18 E 2.14 0.93 1.682012-13 - 2.78 - 0.64 - 0.12 E 1.95 0.89 1.612013-14 - 2.35 - 0.55 0.02 0.12 E 1.74 0.71 1.382014-15 - 2.50 - 0.49 0.02 0.16 E 1.40 0.68 1.332015-16 - 2.16 - 0.47 0.02 0.05 1.31 0.67 1.192016-17 - 2.42 - 0.43 0.02 0.07 (1)R 1.27 0.83 1.28 R
2017-18 - 2.01 - 0.39 0.03 0.09 1.13 0.54 1.082018-19 - 2.03 - 0.39 0.03 0.15 0.46 (2) 0.41 0.90
Notes: These data should be read in conjunction with the explanatory notes and other turnover tables in this publication.
Figure(s) may be incomplete for any period or jurisdiction due to some unavailable turnover figures that are used to derive these numbers.
(1) Since the merger of Tabcorp and the Tatts Group in December 2017, some figures may have been incorrectly classified.
(2) Point of consumption tax (POCT) introduced and applied from 1 Jan 2019. This figure only contains data from July 2018 to December 2018, pre-POCT.
E = Estimated data
U = Unavailable data
NA = Not applicable
R = Revised data
Value ($)
TAS VIC WA AUSTRALIAACT NSWNT
(NA)QLD SA
Australian Gambling Statistics, 1993–94 to 2018–2019, 36th edition
183

TABLE TAB TO 4REAL PER CAPITA TAB TOTE ODDS TURNOVER
1994-95 - 8.96 - - 3.45 0.33 3.64 1.73 4.431995-96 - 7.37 - 2.01 3.53 0.71 4.64 1.91 4.521996-97 - 5.98 - 2.15 3.04 0.86 3.75 2.25 3.851997-98 - 5.69 - 1.71 4.19 0.96 4.44 2.51 3.961998-99 - 4.23 - 2.19 3.68 0.95 4.51 3.56 3.631999-00 - 7.07 - 2.85 4.77 1.08 5.64 3.76 5.102000-01 - - U - 1.29 2.52 0.78 4.66 1.38 1.752001-02 0.56 - U - 1.62 - U 0.77 5.11 1.71 1.772002-03 - - U - 1.66 0.03 0.64 4.68 1.86 1.682003-04 - 5.38 - 1.83 0.02 0.68 4.88 2.18 3.602004-05 - 5.16 - 1.95 0.05 0.61 4.86 2.60 3.582005-06 - 4.15 - 1.66 - 0.57 4.75 2.28 3.122006-07 - 3.85 - 1.81 - 0.56 3.59 2.17 2.752007-08 - 3.44 - 1.46 - 0.50 3.77 2.07 2.582008-09 - 3.78 - 1.32 - 0.48 3.32 1.68 2.502009-10 - 3.18 - 1.07 - 0.38 3.13 1.38 2.182010-11 - 3.39 - 0.95 0.04 0.41 E 2.76 1.33 2.132011-12 - 3.20 - 0.80 0.03 0.20 E 2.44 1.06 1.922012-13 - 3.10 - 0.71 - 0.14 E 2.18 0.99 1.792013-14 - 2.56 - 0.60 0.02 0.13 E 1.89 0.77 1.502014-15 - 2.67 - 0.53 0.02 0.17 E 1.49 0.72 1.422015-16 - 2.28 - 0.50 0.02 0.06 1.38 0.71 1.262016-17 - 2.51 - 0.44 0.02 0.07 (1)R 1.32 0.86 1.32 R
2017-18 - 2.05 - 0.40 0.03 0.09 1.15 0.55 1.092018-19 - 2.03 - 0.39 0.03 0.15 0.46 (2) 0.41 0.90
Notes: These data should be read in conjunction with the explanatory notes and other turnover tables in this publication.
Figure(s) may be incomplete for any period or jurisdiction due to some unavailable turnover figures that are used to derive these numbers.
(1) Since the merger of Tabcorp and the Tatts Group in December 2017, some figures may have been incorrectly classified.
(2) Point of consumption tax (POCT) introduced and applied from 1 Jan 2019. This figure only contains data from July 2018 to December 2018, pre-POCT.
E = Estimated data
U = Unavailable data
NA = Not applicable
R = Revised data
Value ($)
TAS VIC WA AUSTRALIAACT NSWNT
(NA)QLD SA
Australian Gambling Statistics, 1993–94 to 2018–2019, 36th edition
184

TABLE TAB TO 5TAB TOTE ODDS EXPENDITURE
1994-95 - 5.635 - - 0.425 0.026 1.046 0.301 7.4331995-96 - 4.892 - 0.700 0.454 0.029 1.457 0.356 7.8881996-97 - 4.077 - 0.800 0.399 0.029 1.206 0.433 6.9441997-98 - 3.932 - 0.600 0.553 0.032 1.442 0.493 7.0521998-99 - 2.989 - 0.800 0.495 0.036 1.501 0.613 6.4341999-00 - 4.496 - 1.401 0.661 0.039 1.943 0.673 9.2132000-01 - - U - 0.578 0.373 0.023 2.171 0.314 3.4592001-02 0.038 - U - 0.721 - U 0.020 2.483 0.409 3.6712002-03 - - U - 0.783 - U 0.027 2.328 (1) 0.464 3.6022003-04 - U 4.593 - 0.954 - U 0.015 2.782 0.568 8.9122004-05 - U 4.705 - 0.978 0.003 0.014 3.032 0.706 9.4382005-06 - U 3.934 - 0.915 - 0.014 3.111 0.652 8.6262006-07 - U 3.803 - 1.058 - 0.014 2.467 0.656 7.9982007-08 - U 3.575 - 0.905 - 0.022 2.750 0.666 7.9182008-09 - U 4.128 - 0.864 - 0.022 2.559 0.577 8.1502009-10 - U 3.344 - 0.738 - 0.046 2.129 0.501 6.7582010-11 - U 4.021 - 0.687 0.005 0.024 2.389 0.508 7.6342011-12 - U 3.936 - 0.603 0.013 0.012 2.194 0.433 7.1912012-13 - U 3.797 - 0.561 0.328 -0.041 (2) 1.974 0.423 7.0422013-14 - U 3.399 - 0.496 0.007 0.011 1.817 0.344 6.0742014-15 - U 3.616 - 0.446 0.016 0.016 1.488 0.330 5.9122015-16 - U 3.221 (3) - 0.433 0.005 0.005 1.419 0.331 5.4142016-17 - U 3.671 - 0.402 0.006 0.007 (4)R 1.420 0.442 5.948 R
2017-18 - U 3.108 - 0.375 0.010 0.009 1.297 0.270 5.0692018-19 - U 3.188 - 0.376 0.010 0.015 0.537 (5) 0.207 4.333
Notes: These data should be read in conjunction with the explanatory notes and other expenditure tables in this publication.
Figure(s) may be incomplete for any period or jurisdiction due to some unavailable expenditure figures that are used to derive these numbers.
(1) Expenditure for TAB tote odds was estimated using actual data. In preceding years a retention factor was used.
(2) Player expenditure in 2012-13 for sportsbetting totalisator was a negative amount due to a totalisator pool jackpotting, resulting in more dividends paid than turnover received.
(3) TAB Expenditure is calculated at 25.0% of Sportsbetting TAB Tote Odds Turnover, from this period on.
(4) Since the merger of Tabcorp and the Tatts Group in December 2017, some figures may have been incorrectly classified.
(5) Point of consumption tax (POCT) introduced and applied from 1 Jan 2019. This figure only contains data from July 2018 to December 2018, pre-POCT.
U = Unavailable data
NA = Not applicable
R = Revised data
Value ($ million)
TAS VIC WA AUSTRALIAACT NSWNT
(NA)QLD SA
Australian Gambling Statistics, 1993–94 to 2018–2019, 36th edition
185

TABLE TAB TO 6REAL TAB TOTE ODDS EXPENDITURE
1994-95 - 10.141 - - 0.765 0.047 1.882 0.542 13.3771995-96 - 8.444 - 1.208 0.784 0.050 2.515 0.615 13.6161996-97 - 6.943 - 1.362 0.679 0.049 2.054 0.737 11.8261997-98 - 6.696 - 1.022 0.942 0.054 2.456 0.840 12.0091998-99 - 5.030 - 1.346 0.833 0.061 2.526 1.032 10.8281999-00 - 7.392 - 2.303 1.087 0.064 3.194 1.106 15.1472000-01 - - U - 0.896 0.578 0.036 3.366 0.487 5.3622001-02 0.057 - U - 1.087 - U 0.030 3.743 0.616 5.5332002-03 - - U - 1.145 - U 0.039 3.405 (1) 0.679 5.2692003-04 - U 6.559 - 1.362 - U 0.021 3.973 0.811 12.7272004-05 - U 6.563 - 1.364 0.004 0.020 4.229 0.985 13.1652005-06 - U 5.318 - 1.237 - 0.019 4.206 0.881 11.6612006-07 - U 4.993 - 1.389 - 0.018 3.239 0.861 10.5012007-08 - U 4.542 - 1.150 - 0.028 3.494 0.846 10.0612008-09 - U 5.086 - 1.065 - 0.027 3.153 0.711 10.0422009-10 - U 4.025 - 0.888 - 0.055 2.562 0.603 8.1342010-11 - U 4.696 - 0.802 0.006 0.028 2.790 0.593 8.9152011-12 - U 4.491 - 0.688 0.015 0.014 2.503 0.494 8.2052012-13 - U 4.235 - 0.626 0.366 -0.046 (2) 2.202 0.472 7.8542013-14 - U 3.694 - 0.539 0.008 0.012 1.974 0.374 6.6002014-15 - U 3.863 - 0.476 0.017 0.017 1.590 0.353 6.3162015-16 - U 3.394 (3) - 0.456 0.005 0.005 1.495 0.349 5.7042016-17 - U 3.801 - 0.416 0.006 0.008 (4)R 1.470 0.458 6.159 R
2017-18 - U 3.158 - 0.381 0.010 0.009 1.318 0.274 5.1502018-19 - U 3.188 - 0.376 0.010 0.015 0.537 (5) 0.207 4.333
Notes: These data should be read in conjunction with the explanatory notes and other expenditure tables in this publication.
Figure(s) may be incomplete for any period or jurisdiction due to some unavailable expenditure figures that are used to derive these numbers.
(1) Expenditure for TAB tote odds was estimated using actual data. In preceding years a retention factor was used.
(2) Player expenditure in 2012-13 for sportsbetting totalisator was a negative amount due to a totalisator pool jackpotting, resulting in more dividends paid than turnover received.
(3) TAB Expenditure is calculated at 25.0% of Sportsbetting TAB Tote Odds Turnover, from this period on.
(4) Since the merger of Tabcorp and the Tatts Group in December 2017, some figures may have been incorrectly classified.
(5) Point of consumption tax (POCT) introduced and applied from 1 Jan 2019. This figure only contains data from July 2018 to December 2018, pre-POCT.
U = Unavailable data
NA = Not applicable
R = Revised data
Value ($ million)
TAS VIC WA AUSTRALIAACT NSWNT
(NA)QLD SA
Australian Gambling Statistics, 1993–94 to 2018–2019, 36th edition
186

TABLE TAB TO 7PER CAPITA TAB TOTE ODDS EXPENDITURE
1994-95 - 1.24 - - 0.38 0.08 0.31 0.24 0.561995-96 - 1.07 - 0.29 0.41 0.08 0.43 0.28 0.591996-97 - 0.88 - 0.33 0.36 0.08 0.35 0.33 0.511997-98 - 0.84 - 0.24 0.49 0.09 0.42 0.37 0.511998-99 - 0.63 - 0.32 0.44 0.10 0.43 0.45 0.461999-00 - 0.93 - 0.54 0.58 0.11 0.55 0.49 0.652000-01 - - U - 0.22 0.33 0.07 0.60 0.22 0.242001-02 0.16 - U - 0.27 - U 0.06 0.68 0.29 0.252002-03 - - U - 0.28 - U 0.08 0.63 (1) 0.32 0.242003-04 - U 0.91 - 0.34 - U 0.04 0.74 0.38 0.592004-05 - U 0.93 - 0.34 0.00 0.04 0.80 0.47 0.622005-06 - U 0.77 - 0.31 - 0.04 0.81 0.42 0.562006-07 - U 0.73 - 0.35 - 0.04 0.63 0.42 0.512007-08 - U 0.68 - 0.29 - 0.06 0.68 0.41 0.492008-09 - U 0.77 - 0.27 - 0.06 0.62 0.34 0.492009-10 - U 0.61 - 0.22 - 0.12 0.51 0.29 0.402010-11 - U 0.73 - 0.20 0.00 0.06 0.56 0.29 0.452011-12 - U 0.70 - 0.18 0.01 0.03 0.50 0.24 0.412012-13 - U 0.67 - 0.16 0.25 -0.10 (2) 0.44 0.22 0.402013-14 - U 0.59 - 0.14 0.01 0.03 0.40 0.18 0.342014-15 - U 0.62 - 0.12 0.01 0.04 0.32 0.17 0.322015-16 - U 0.54 (3) - 0.12 0.00 0.01 0.30 0.17 0.292016-17 - U 0.61 - 0.11 0.00 0.02 (4)R 0.29 0.22 0.31 R
2017-18 - U 0.50 - 0.10 0.01 0.02 0.26 0.14 0.262018-19 - U 0.51 - 0.10 0.01 0.04 0.10 (5) 0.10 0.22
Notes: These data should be read in conjunction with the explanatory notes and other expenditure tables in this publication.
Figure(s) may be incomplete for any period or jurisdiction due to some unavailable expenditure figures that are used to derive these numbers.
(1) Expenditure for TAB tote odds was estimated using actual data. In preceding years a retention factor was used.
(2) Player expenditure in 2012-13 for sportsbetting totalisator was a negative amount due to a totalisator pool jackpotting, resulting in more dividends paid than turnover received.
(3) TAB Expenditure is calculated at 25.0% of Sportsbetting TAB Tote Odds Turnover, from this period on.
(4) Since the merger of Tabcorp and the Tatts Group in December 2017, some figures may have been incorrectly classified.
(5) Point of consumption tax (POCT) introduced and applied from 1 Jan 2019. This figure only contains data from July 2018 to December 2018, pre-POCT.
U = Unavailable data
NA = Not applicable
R = Revised data
Value ($)
TAS VIC WA AUSTRALIAACT NSWNT
(NA)QLD SA
Australian Gambling Statistics, 1993–94 to 2018–2019, 36th edition
187
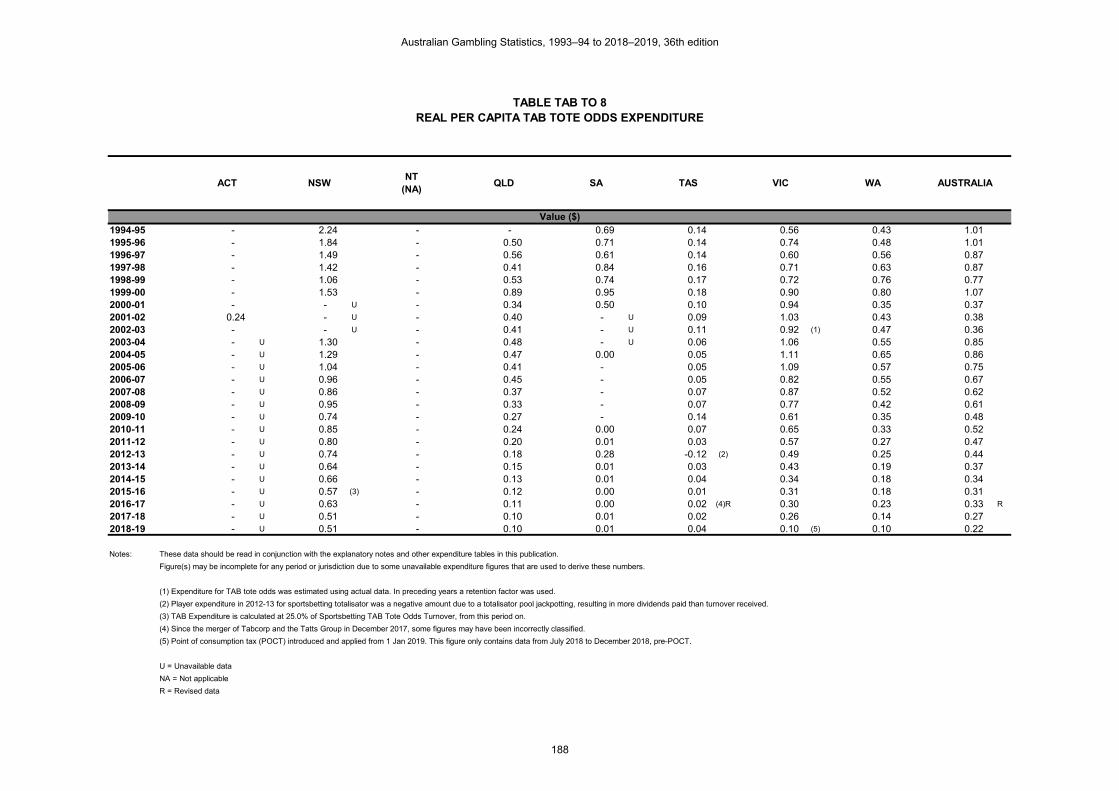
TABLE TAB TO 8REAL PER CAPITA TAB TOTE ODDS EXPENDITURE
1994-95 - 2.24 - - 0.69 0.14 0.56 0.43 1.011995-96 - 1.84 - 0.50 0.71 0.14 0.74 0.48 1.011996-97 - 1.49 - 0.56 0.61 0.14 0.60 0.56 0.871997-98 - 1.42 - 0.41 0.84 0.16 0.71 0.63 0.871998-99 - 1.06 - 0.53 0.74 0.17 0.72 0.76 0.771999-00 - 1.53 - 0.89 0.95 0.18 0.90 0.80 1.072000-01 - - U - 0.34 0.50 0.10 0.94 0.35 0.372001-02 0.24 - U - 0.40 - U 0.09 1.03 0.43 0.382002-03 - - U - 0.41 - U 0.11 0.92 (1) 0.47 0.362003-04 - U 1.30 - 0.48 - U 0.06 1.06 0.55 0.852004-05 - U 1.29 - 0.47 0.00 0.05 1.11 0.65 0.862005-06 - U 1.04 - 0.41 - 0.05 1.09 0.57 0.752006-07 - U 0.96 - 0.45 - 0.05 0.82 0.55 0.672007-08 - U 0.86 - 0.37 - 0.07 0.87 0.52 0.622008-09 - U 0.95 - 0.33 - 0.07 0.77 0.42 0.612009-10 - U 0.74 - 0.27 - 0.14 0.61 0.35 0.482010-11 - U 0.85 - 0.24 0.00 0.07 0.65 0.33 0.522011-12 - U 0.80 - 0.20 0.01 0.03 0.57 0.27 0.472012-13 - U 0.74 - 0.18 0.28 -0.12 (2) 0.49 0.25 0.442013-14 - U 0.64 - 0.15 0.01 0.03 0.43 0.19 0.372014-15 - U 0.66 - 0.13 0.01 0.04 0.34 0.18 0.342015-16 - U 0.57 (3) - 0.12 0.00 0.01 0.31 0.18 0.312016-17 - U 0.63 - 0.11 0.00 0.02 (4)R 0.30 0.23 0.33 R
2017-18 - U 0.51 - 0.10 0.01 0.02 0.26 0.14 0.272018-19 - U 0.51 - 0.10 0.01 0.04 0.10 (5) 0.10 0.22
Notes: These data should be read in conjunction with the explanatory notes and other expenditure tables in this publication.
Figure(s) may be incomplete for any period or jurisdiction due to some unavailable expenditure figures that are used to derive these numbers.
(1) Expenditure for TAB tote odds was estimated using actual data. In preceding years a retention factor was used.
(2) Player expenditure in 2012-13 for sportsbetting totalisator was a negative amount due to a totalisator pool jackpotting, resulting in more dividends paid than turnover received.
(3) TAB Expenditure is calculated at 25.0% of Sportsbetting TAB Tote Odds Turnover, from this period on.
(4) Since the merger of Tabcorp and the Tatts Group in December 2017, some figures may have been incorrectly classified.
(5) Point of consumption tax (POCT) introduced and applied from 1 Jan 2019. This figure only contains data from July 2018 to December 2018, pre-POCT.
U = Unavailable data
NA = Not applicable
R = Revised data
Value ($)
TAS VIC WA AUSTRALIAACT NSWNT
(NA)QLD SA
Australian Gambling Statistics, 1993–94 to 2018–2019, 36th edition
188
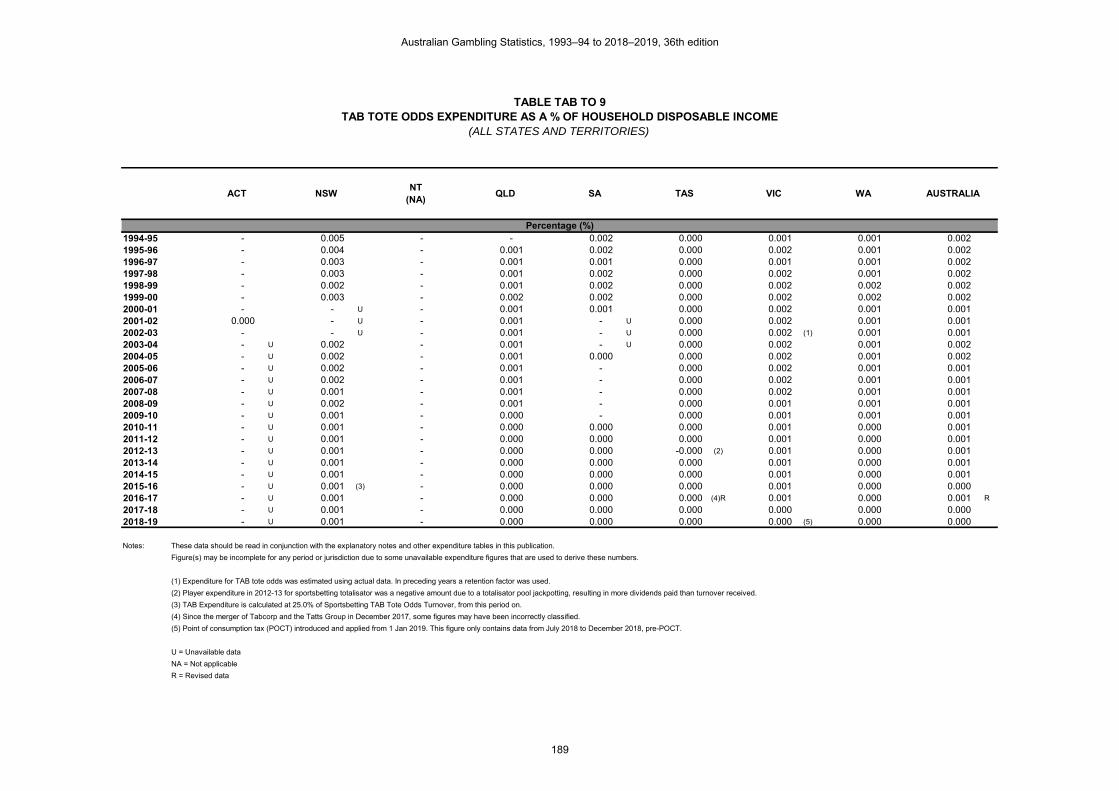
TABLE TAB TO 9TAB TOTE ODDS EXPENDITURE AS A % OF HOUSEHOLD DISPOSABLE INCOME
(ALL STATES AND TERRITORIES)
1994-95 - 0.005 - - 0.002 0.000 0.001 0.001 0.0021995-96 - 0.004 - 0.001 0.002 0.000 0.002 0.001 0.0021996-97 - 0.003 - 0.001 0.001 0.000 0.001 0.001 0.0021997-98 - 0.003 - 0.001 0.002 0.000 0.002 0.001 0.0021998-99 - 0.002 - 0.001 0.002 0.000 0.002 0.002 0.0021999-00 - 0.003 - 0.002 0.002 0.000 0.002 0.002 0.0022000-01 - - U - 0.001 0.001 0.000 0.002 0.001 0.0012001-02 0.000 - U - 0.001 - U 0.000 0.002 0.001 0.0012002-03 - - U - 0.001 - U 0.000 0.002 (1) 0.001 0.0012003-04 - U 0.002 - 0.001 - U 0.000 0.002 0.001 0.0022004-05 - U 0.002 - 0.001 0.000 0.000 0.002 0.001 0.0022005-06 - U 0.002 - 0.001 - 0.000 0.002 0.001 0.0012006-07 - U 0.002 - 0.001 - 0.000 0.002 0.001 0.0012007-08 - U 0.001 - 0.001 - 0.000 0.002 0.001 0.0012008-09 - U 0.002 - 0.001 - 0.000 0.001 0.001 0.0012009-10 - U 0.001 - 0.000 - 0.000 0.001 0.001 0.0012010-11 - U 0.001 - 0.000 0.000 0.000 0.001 0.000 0.0012011-12 - U 0.001 - 0.000 0.000 0.000 0.001 0.000 0.0012012-13 - U 0.001 - 0.000 0.000 -0.000 (2) 0.001 0.000 0.0012013-14 - U 0.001 - 0.000 0.000 0.000 0.001 0.000 0.0012014-15 - U 0.001 - 0.000 0.000 0.000 0.001 0.000 0.0012015-16 - U 0.001 (3) - 0.000 0.000 0.000 0.001 0.000 0.0002016-17 - U 0.001 - 0.000 0.000 0.000 (4)R 0.001 0.000 0.001 R
2017-18 - U 0.001 - 0.000 0.000 0.000 0.000 0.000 0.0002018-19 - U 0.001 - 0.000 0.000 0.000 0.000 (5) 0.000 0.000
Notes: These data should be read in conjunction with the explanatory notes and other expenditure tables in this publication.
Figure(s) may be incomplete for any period or jurisdiction due to some unavailable expenditure figures that are used to derive these numbers.
(1) Expenditure for TAB tote odds was estimated using actual data. In preceding years a retention factor was used.
(2) Player expenditure in 2012-13 for sportsbetting totalisator was a negative amount due to a totalisator pool jackpotting, resulting in more dividends paid than turnover received.
(3) TAB Expenditure is calculated at 25.0% of Sportsbetting TAB Tote Odds Turnover, from this period on.
(4) Since the merger of Tabcorp and the Tatts Group in December 2017, some figures may have been incorrectly classified.
(5) Point of consumption tax (POCT) introduced and applied from 1 Jan 2019. This figure only contains data from July 2018 to December 2018, pre-POCT.
U = Unavailable data
NA = Not applicable
R = Revised data
Percentage (%)
TAS VIC WA AUSTRALIAACT NSWNT
(NA)QLD SA
Australian Gambling Statistics, 1993–94 to 2018–2019, 36th edition
189

TABLE TAB TO 10GOVERNMENT REVENUE FROM TAB TOTE ODDS
1994-95 - 1.981 - - 0.141 0.003 0.383 0.072 2.5801995-96 - 1.697 - - 0.150 0.007 0.513 0.085 2.4521996-97 - 1.655 - - 0.104 0.008 0.425 0.087 2.2791997-98 - 1.139 - 0.200 0.162 0.009 0.508 0.099 2.1171998-99 - 1.312 - 0.300 0.103 0.009 0.532 0.144 2.4001999-00 - 1.268 - 0.280 0.222 0.009 0.689 0.158 2.6262000-01 - 0.643 - 0.063 0.104 - U 0.417 0.063 1.2902001-02 - 0.653 - 0.079 - U - U 0.479 0.081 1.2922002-03 - 0.718 (1) - 0.086 - U - U 0.450 0.092 1.3462003-04 - 0.905 - 0.104 - U - U 0.534 0.113 1.6562004-05 - 0.900 - 0.107 - (2) - U 0.579 0.141 1.7272005-06 - 0.757 - 0.100 - (2) - U 0.594 0.130 1.5812006-07 - 0.724 - 0.115 - (2) - U 0.471 0.131 1.4412007-08 - 0.665 - 0.099 - - U 0.526 0.133 1.4232008-09 - 0.775 - 0.094 - - U 0.489 0.115 1.4732009-10 - 0.639 - 0.081 - - U 0.407 0.100 1.2272010-11 - 0.769 - 0.075 0.001 - U 0.457 0.100 1.4022011-12 - 0.753 - 0.066 - - U 0.419 0.086 1.3242012-13 - 0.723 - 0.061 - - U 0.210 0.084 1.0782013-14 - 0.650 - 0.054 0.001 - U 0.138 0.069 0.9122014-15 - 0.702 - 0.022 0.001 - U 0.113 0.066 0.9042015-16 - 0.522 - 0.021 0.001 - U 0.108 0.066 0.7182016-17 - 0.496 - 0.020 0.001 - U 0.108 0.082 0.7072017-18 - 0.420 (3) - 0.018 0.001 - U 0.099 R 0.054 0.592 R
2018-19 - 0.396 (6)(7) - - U 0.001 - U 0.041 (4) 0.032 (5) 0.470
Notes: These data should be read in conjunction with the explanatory notes and other revenue tables in this publication.
Figure(s) may be incomplete for any period or jurisdiction due to some unavailable revenue figures that are used to derive these numbers.
Data for the gambling revenue received by states and territories from 1 July 2000 onwards are not comparable with that of preceding years because of the impact of changes brought
about by the introduction of the GST.
(1) Government revenue data for TAB tote odds are for NSW investments only.
(2) Under $1,000.
(3) Sportsbetting TAB Tote Odds revenue is only calculated off investments through the NSW Totalisator.
(4) Point of consumption tax (POCT) introduced and applied from 1 Jan 2019. This figure only contains data from July 2018 to December 2018, pre-POCT.
(5) Includes all government revenue collected between 1 July 2018 to 30 June 2019, but excludes POCT revenue, which was introduced on 1 January 2019.
(6) The NSW Government implemented the POCT on 1 January 2019, through the Betting Tax Amendment (point of consumption) Bill 2018. The Bill provides for a tax of 10% of wagering
operator's revenue derived from NSW customers. The POCT does not distinguish between racing and sports betting, and the revenue for the 2018-19 FY is $41m.
(7) Does not include offsets afforded to TAB due to POCT as per Section 11 of the Betting Tax Act 2001 . This is due to the design of the offsets not distinguishing between racing and sportsbetting.
U = Unavailable data
NA = Not applicable
R = Revised data
Value ($ million)
TAS VIC WA AUSTRALIAACT(NA)
NSWNT
(NA)QLD SA
Australian Gambling Statistics, 1993–94 to 2018–2019, 36th edition
190

TABLE TAB TO 11REAL GOVERNMENT REVENUE FROM TAB TOTE ODDS
1994-95 - 3.565 - - 0.254 0.005 0.689 0.130 4.6431995-96 - 2.929 - - 0.259 0.012 0.886 0.147 4.2331996-97 - 2.818 - - 0.177 0.014 0.724 0.148 3.8811997-98 - 1.940 - 0.341 0.276 0.015 0.865 0.169 3.6051998-99 - 2.208 - 0.505 0.173 0.015 0.895 0.242 4.0391999-00 - 2.085 - 0.460 0.365 0.016 1.133 0.260 4.3182000-01 - 0.997 - 0.098 0.161 - U 0.646 0.098 2.0002001-02 - 0.984 - 0.119 - U - U 0.722 0.122 1.9472002-03 - 1.050 (1) - 0.126 - U - U 0.658 0.135 1.9692003-04 - 1.292 - 0.149 - U - U 0.763 0.161 2.3652004-05 - 1.255 - 0.149 - (2) - U 0.808 0.197 2.4092005-06 - 1.023 - 0.135 - (2) - U 0.803 0.176 2.1372006-07 - 0.951 - 0.151 - (2) - U 0.618 0.172 1.8922007-08 - 0.845 - 0.125 - - U 0.668 0.169 1.8082008-09 - 0.955 - 0.116 - - U 0.603 0.142 1.8152009-10 - 0.769 - 0.097 - - U 0.490 0.120 1.4772010-11 - 0.898 - 0.088 0.001 - U 0.534 0.117 1.6372011-12 - 0.859 - 0.075 - - U 0.478 0.098 1.5112012-13 - 0.806 - 0.068 - - U 0.234 0.094 1.2022013-14 - 0.706 - 0.059 0.001 - U 0.150 0.075 0.9912014-15 - 0.750 - 0.024 0.001 - U 0.121 0.071 0.9662015-16 - 0.550 - 0.022 0.001 - U 0.114 0.070 0.7562016-17 - 0.514 - 0.020 0.001 - U 0.112 0.085 0.7322017-18 - 0.427 (3) - 0.019 0.001 - U 0.100 R 0.055 0.601 R
2018-19 - 0.396 (6)(7) - - U 0.001 - U 0.041 (4) 0.032 (5) 0.470
Notes: These data should be read in conjunction with the explanatory notes and other revenue tables in this publication.
Figure(s) may be incomplete for any period or jurisdiction due to some unavailable revenue figures that are used to derive these numbers.
Data for the gambling revenue received by states and territories from 1 July 2000 onwards are not comparable with that of preceding years because of the impact of changes brought
about by the introduction of the GST.
(1) Government revenue data for TAB tote odds are for NSW investments only.
(2) Under $1,000.
(3) Sportsbetting TAB Tote Odds revenue is only calculated off investments through the NSW Totalisator.
(4) Point of consumption tax (POCT) introduced and applied from 1 Jan 2019. This figure only contains data from July 2018 to December 2018, pre-POCT.
(5) Includes all government revenue collected between 1 July 2018 to 30 June 2019, but excludes POCT revenue, which was introduced on 1 January 2019.
(6) The NSW Government implemented the POCT on 1 January 2019, through the Betting Tax Amendment (point of consumption) Bill 2018. The Bill provides for a tax of 10% of wagering
operator's revenue derived from NSW customers. The POCT does not distinguish between racing and sports betting, and the revenue for the 2018-19 FY is $41m.
(7) Does not include offsets afforded to TAB due to POCT as per Section 11 of the Betting Tax Act 2001 . This is due to the design of the offsets not distinguishing between racing and sportsbetting.
U = Unavailable data
NA = Not applicable
R = Revised data
Value ($ million)
TAS VIC WA AUSTRALIAACT (NA)
NSWNT
(NA)QLD SA
Australian Gambling Statistics, 1993–94 to 2018–2019, 36th edition
191

TABLE TAB TO 12PER CAPITA GOVERNMENT REVENUE FROM TAB TOTE ODDS
1994-95 - 0.44 - - 0.13 0.01 0.11 0.06 0.191995-96 - 0.37 - - 0.14 0.02 0.15 0.07 0.181996-97 - 0.36 - - 0.09 0.02 0.12 0.07 0.171997-98 - 0.24 - 0.08 0.14 0.03 0.15 0.07 0.151998-99 - 0.28 - 0.12 0.09 0.03 0.15 0.11 0.171999-00 - 0.26 - 0.11 0.19 0.03 0.19 0.11 0.192000-01 - 0.13 - 0.02 0.09 - U 0.12 0.04 0.092001-02 - 0.13 - 0.03 - U - U 0.13 0.06 0.092002-03 - 0.14 (1) - 0.03 - U - U 0.12 0.06 0.092003-04 - 0.18 - 0.04 - U - U 0.14 0.08 0.112004-05 - 0.18 - 0.04 - (2) - U 0.15 0.09 0.112005-06 - 0.15 - 0.03 - (2) - U 0.15 0.08 0.102006-07 - 0.14 - 0.04 - (2) - U 0.12 0.08 0.092007-08 - 0.13 - 0.03 - - U 0.13 0.08 0.092008-09 - 0.14 - 0.03 - - U 0.12 0.07 0.092009-10 - 0.12 - 0.02 - - U 0.10 0.06 0.072010-11 - 0.14 - 0.02 0.00 - U 0.11 0.06 0.082011-12 - 0.13 - 0.02 - - U 0.10 0.05 0.082012-13 - 0.13 - 0.02 - - U 0.05 0.04 0.062013-14 - 0.11 - 0.02 0.00 - U 0.03 0.04 0.052014-15 - 0.12 - 0.01 0.00 - U 0.02 0.03 0.052015-16 - 0.09 - 0.01 0.00 - U 0.02 0.03 0.042016-17 - 0.08 - 0.01 0.00 - U 0.02 0.04 0.042017-18 - 0.07 (3) - 0.00 0.00 - U 0.02 R 0.03 0.03 R
2018-19 - 0.06 (6)(7) - - U 0.00 - U 0.01 (4) 0.02 (5) 0.02
Notes: These data should be read in conjunction with the explanatory notes and other revenue tables in this publication.
Figure(s) may be incomplete for any period or jurisdiction due to some unavailable revenue figures that are used to derive these numbers.
Data for the gambling revenue received by states and territories from 1 July 2000 onwards are not comparable with that of preceding years because of the impact of changes brought
about by the introduction of the GST.
(1) Government revenue data for TAB tote odds are for NSW investments only.
(2) Under $1,000.
(3) Sportsbetting TAB Tote Odds revenue is only calculated off investments through the NSW Totalisator.
(4) Point of consumption tax (POCT) introduced and applied from 1 Jan 2019. This figure only contains data from July 2018 to December 2018, pre-POCT.
(5) Includes all government revenue collected between 1 July 2018 to 30 June 2019, but excludes POCT revenue, which was introduced on 1 January 2019.
(6) The NSW Government implemented the POCT on 1 January 2019, through the Betting Tax Amendment (point of consumption) Bill 2018. The Bill provides for a tax of 10% of wagering
operator's revenue derived from NSW customers. The POCT does not distinguish between racing and sports betting, and the revenue for the 2018-19 FY is $41m.
(7) Does not include offsets afforded to TAB due to POCT as per Section 11 of the Betting Tax Act 2001 . This is due to the design of the offsets not distinguishing between racing and sportsbetting.
U = Unavailable data
NA = Not applicable
R = Revised data
Value ($)
TAS VIC WA AUSTRALIAACT(NA)
NSWNT
(NA)QLD SA
Australian Gambling Statistics, 1993–94 to 2018–2019, 36th edition
192

TABLE TAB TO 13REAL PER CAPITA GOVERNMENT REVENUE FROM TAB TOTE ODDS
1994-95 - 0.79 - - 0.23 0.02 0.21 0.10 0.351995-96 - 0.64 - - 0.23 0.03 0.26 0.11 0.311996-97 - 0.61 - - 0.16 0.04 0.21 0.11 0.281997-98 - 0.41 - 0.14 0.25 0.04 0.25 0.13 0.261998-99 - 0.46 - 0.20 0.15 0.04 0.26 0.18 0.291999-00 - 0.43 - 0.18 0.32 0.04 0.32 0.19 0.302000-01 - 0.20 - 0.04 0.14 - U 0.18 0.07 0.142001-02 - 0.20 - 0.04 - U - U 0.20 0.09 0.132002-03 - 0.21 (1) - 0.05 - U - U 0.18 0.09 0.132003-04 - 0.26 - 0.05 - U - U 0.20 0.11 0.162004-05 - 0.25 - 0.05 - (2) - U 0.21 0.13 0.162005-06 - 0.20 - 0.05 - (2) - U 0.21 0.11 0.142006-07 - 0.18 - 0.05 - (2) - U 0.16 0.11 0.122007-08 - 0.16 - 0.04 - - U 0.17 0.10 0.112008-09 - 0.18 - 0.04 - - U 0.15 0.08 0.112009-10 - 0.14 - 0.03 - - U 0.12 0.07 0.092010-11 - 0.16 - 0.03 0.00 - U 0.12 0.07 0.102011-12 - 0.15 - 0.02 - - U 0.11 0.05 0.092012-13 - 0.14 - 0.02 - - U 0.05 0.05 0.072013-14 - 0.12 - 0.02 0.00 - U 0.03 0.04 0.052014-15 - 0.13 - 0.01 0.00 - U 0.03 0.04 0.052015-16 - 0.09 - 0.01 0.00 - U 0.02 0.04 0.042016-17 - 0.08 - 0.01 0.00 - U 0.02 0.04 0.042017-18 - 0.07 (3) - 0.00 0.00 - U 0.02 R 0.03 0.03 R
2018-19 - 0.06 (6)(7) - - U 0.00 - U 0.01 (4) 0.02 (5) 0.02
Notes: These data should be read in conjunction with the explanatory notes and other revenue tables in this publication.
Figure(s) may be incomplete for any period or jurisdiction due to some unavailable revenue figures that are used to derive these numbers.
Data for the gambling revenue received by states and territories from 1 July 2000 onwards are not comparable with that of preceding years because of the impact of changes brought
about by the introduction of the GST.
(1) Government revenue data for TAB tote odds are for NSW investments only.
(2) Under $1,000.
(3) Sportsbetting TAB Tote Odds revenue is only calculated off investments through the NSW Totalisator.
(4) Point of consumption tax (POCT) introduced and applied from 1 Jan 2019. This figure only contains data from July 2018 to December 2018, pre-POCT.
(5) Includes all government revenue collected between 1 July 2018 to 30 June 2019, but excludes POCT revenue, which was introduced on 1 January 2019.
(6) The NSW Government implemented the POCT on 1 January 2019, through the Betting Tax Amendment (point of consumption) Bill 2018. The Bill provides for a tax of 10% of wagering
operator's revenue derived from NSW customers. The POCT does not distinguish between racing and sports betting, and the revenue for the 2018-19 FY is $41m.
(7) Does not include offsets afforded to TAB due to POCT as per Section 11 of the Betting Tax Act 2001 . This is due to the design of the offsets not distinguishing between racing and sportsbetting.
U = Unavailable data
NA = Not applicable
R = Revised data
Value ($)
TAS VIC WA AUSTRALIAACT(NA)
NSWNT
(NA)QLD SA
Australian Gambling Statistics, 1993–94 to 2018–2019, 36th edition
193

TABLE TAB TO 14TAB TOTE ODDS REVENUE
AS A % OF TOTAL STATE GAMBLING REVENUE
1994-95 - 0.18 - - 0.08 0.01 0.04 0.031995-96 - 0.14 - - 0.07 0.01 0.05 0.041996-97 - 0.13 - - 0.04 0.01 0.04 0.041997-98 - 0.08 - 0.04 0.06 0.01 0.04 0.051998-99 - 0.09 - 0.05 0.03 0.01 0.04 0.071999-00 - 0.08 - 0.05 0.07 0.01 0.05 0.082000-01 - 0.05 - 0.01 0.03 - U 0.03 0.032001-02 - 0.05 - 0.01 - U - U 0.03 0.042002-03 - 0.06 (1) - 0.01 - U - U 0.03 0.042003-04 - 0.07 - 0.01 - U - U 0.04 0.052004-05 - 0.06 - 0.01 - (2) - U 0.04 0.052005-06 - 0.05 - 0.01 - (2) - U 0.04 0.052006-07 - 0.04 - 0.01 - (2) - U 0.03 0.042007-08 - 0.04 - 0.01 - - U 0.03 0.042008-09 - 0.05 - 0.01 - - U 0.03 0.032009-10 - 0.05 - 0.01 - - U 0.03 0.032010-11 - 0.04 - 0.01 0.00 - U 0.03 0.032011-12 - 0.04 - 0.01 - - U 0.02 0.022012-13 - 0.04 - 0.01 - - U 0.01 0.022013-14 - 0.03 - 0.01 0.00 - U 0.01 0.022014-15 - 0.03 - 0.00 0.00 - U 0.01 0.022015-16 - 0.02 - 0.00 0.00 - U 0.01 0.022016-17 - 0.02 - 0.00 0.00 - U 0.01 0.022017-18 - 0.02 (3) - 0.00 0.00 - U 0.01 R 0.01 R
2018-19 - 0.02 (6)(7) - - U 0.00 - U 0.00 (4) 0.01 (5)
Notes: These data should be read in conjunction with the explanatory notes and other revenue tables in this publication.
Figure(s) may be incomplete for any period or jurisdiction due to some unavailable revenue figures that are used to derive these numbers.
Data for the gambling revenue received by states and territories from 1 July 2000 onwards are not comparable with that of preceding years because of the impact of changes brought
about by the introduction of the GST.
(1) Government revenue data for TAB tote odds are for NSW investments only.
(2) Under $1,000.
(3) Sportsbetting TAB Tote Odds revenue is only calculated off investments through the NSW Totalisator.
(4) Point of consumption tax (POCT) introduced and applied from 1 Jan 2019. This figure only contains data from July 2018 to December 2018, pre-POCT.
(5) Includes all government revenue collected between 1 July 2018 to 30 June 2019, but excludes POCT revenue, which was introduced on 1 January 2019.
(6) The NSW Government implemented the POCT on 1 January 2019, through the Betting Tax Amendment (point of consumption) Bill 2018. The Bill provides for a tax of 10% of wagering
operator's revenue derived from NSW customers. The POCT does not distinguish between racing and sports betting, and the revenue for the 2018-19 FY is $41m.
(7) Does not include offsets afforded to TAB due to POCT as per Section 11 of the Betting Tax Act 2001 . This is due to the design of the offsets not distinguishing between racing and sportsbetting.
U = Unavailable data
NA = Not applicable
R = Revised data
Percentage (%)
ACT(NA)
NSWNT
(NA)QLD SA TAS VIC WA
Australian Gambling Statistics, 1993–94 to 2018–2019, 36th edition
194

TABLE BOOKMAKER FO 1BOOKMAKER AND OTHER FIXED ODDS TURNOVER
1994-95 - - 56.354 - 1.099 0.017 3.349 2.044 62.8631995-96 14.712 - 64.628 1.200 1.413 5.224 1.735 1.848 90.7601996-97 67.352 - 85.036 1.300 1.865 5.517 1.259 3.233 165.5621997-98 78.730 38.964 154.520 0.100 2.312 3.248 1.312 6.903 286.0891998-99 95.863 51.120 188.379 0.027 2.580 1.056 5.113 8.180 352.3181999-00 163.268 59.209 239.486 0.050 2.280 0.540 9.660 9.523 484.0162000-01 325.247 53.457 339.566 - U 2.107 0.243 55.921 11.108 787.6492001-02 491.822 43.190 513.574 - U 7.439 0.000 (1) 99.149 8.133 1,163.3072002-03 625.848 50.792 609.388 - U 11.533 - 116.771 6.789 1,421.1212003-04 277.768 71.718 634.588 - U 8.540 - 117.193 8.019 1,117.8262004-05 260.558 63.390 660.800 - U 6.841 - 51.465 4.288 1,047.3422005-06 172.986 96.121 742.430 - U 7.453 - 91.932 2.573 1,113.4952006-07 101.545 130.555 897.198 (2) - U 6.167 - 108.406 7.347 1,251.2182007-08 121.008 169.735 1,106.156 - U 4.219 - 47.580 6.646 1,455.3442008-09 76.887 109.810 1,166.295 - U 3.092 - 93.450 8.851 1,458.3852009-10 88.248 102.272 (3) 1,274.752 - U 3.092 - 72.370 1.448 1,542.1822010-11 109.169 89.826 1,473.944 - U 1.653 - - U 0.082 1,674.6742011-12 - 84.751 1,507.221 - U 1.792 - - U 0.072 1,593.8362012-13 0.768 90.287 2,223.300 - U 1.281 (4) - - U - 2,315.6362013-14 2.039 155.009 (5) 2,746.430 - U 1.998 - - U 0.004 2,905.4802014-15 1.207 429.377 3,354.530 - U 0.423 - - U 0.101 3,785.6382015-16 - 302.168 5,548.809 - U 0.810 - - U 0.072 5,851.8592016-17 - 284.888 (6) 5,561.340 - U 0.650 - - U 0.030 5,846.9082017-18 - 284.572 (7) 6,613.187 - U 0.896 - - U 0.002 6,898.6572018-19 - 520.482 7,536.435 - U 0.900 - - U 0.004 8,057.821
Notes: These data should be read in conjunction with the explanatory notes and other turnover tables in this publication.
Figure(s) may be incomplete for any period or jurisdiction due to some unavailable turnover figures that are used to derive these numbers.
(1) No data from 2001-02 onwards.
(2) Bookmaker fixed odds include TAB fixed odds, from this period on.
(3) Bookmakers declared events betting, from this period on.
(4) Total turnover all bets on and off course, from this period on.
(5) Includes turnover on sportsbetting at all racing offices, from this period on.
(6) Figure incomplete due to data for one or more components being unavailable.
(7) Turnover provided by NSW bookmakers operating from approved offices and premises.
U = Unavailable data
AUSTRALIA
Value ($ million)
ACT NSW NT QLD SA TAS VIC WA
Australian Gambling Statistics, 1993–94 to 2018–2019, 36th edition
195

TABLE BOOKMAKER FO 2REAL BOOKMAKER AND OTHER FIXED ODDS TURNOVER
1994-95 - - 101.419 - 1.978 0.031 6.027 3.679 113.1341995-96 25.395 - 111.559 2.071 2.439 9.018 2.995 3.190 156.6671996-97 114.699 - 144.815 2.214 3.176 9.395 2.144 5.506 281.9501997-98 134.076 66.355 263.145 0.170 3.937 5.531 2.234 11.756 487.2051998-99 161.327 86.029 317.021 0.045 4.342 1.777 8.605 13.766 592.9131999-00 268.428 97.345 393.737 0.082 3.749 0.888 15.882 15.657 795.7672000-01 504.221 82.873 526.420 - U 3.266 0.377 86.693 17.220 1,221.0702001-02 741.306 65.099 774.092 - U 11.213 0.000 (1) 149.444 12.259 1,753.4132002-03 915.503 74.300 891.425 - U 16.871 - 170.815 9.931 2,078.8452003-04 396.662 102.416 906.214 - U 12.195 - 167.356 11.451 1,596.2952004-05 363.443 88.421 921.727 - U 9.542 - 71.787 5.981 1,460.9012005-06 233.859 129.946 1,003.688 - U 10.076 - 124.282 3.478 1,505.3292006-07 133.329 171.419 1,178.024 (2) - U 8.097 - 142.337 9.647 1,642.8542007-08 153.753 215.666 1,405.483 - U 5.361 - 60.455 8.444 1,849.1622008-09 94.739 135.306 1,437.087 - U 3.810 - 115.147 10.906 1,796.9952009-10 106.214 123.093 (3) 1,534.274 - U 3.721 - 87.104 1.743 1,856.1492010-11 127.494 104.904 1,721.362 - U 1.930 - - U 0.096 1,955.7872011-12 - 96.701 1,719.739 - U 2.045 - - U 0.082 1,818.5672012-13 0.857 100.701 2,479.751 - U 1.429 (4) - - U - 2,582.7382013-14 2.216 168.443 (5) 2,984.454 - U 2.171 - - U 0.004 3,157.2882014-15 1.290 458.726 3,583.819 - U 0.452 - - U 0.108 4,044.3942015-16 - 318.351 5,845.975 - U 0.853 - - U 0.076 6,165.2552016-17 - 294.970 (6) 5,758.157 - U 0.673 - - U 0.031 6,053.8312017-18 - 289.133 (7) 6,719.186 - U 0.910 - - U 0.002 7,009.2322018-19 - 520.482 7,536.435 - U 0.900 - - U 0.004 8,057.821
Notes: These data should be read in conjunction with the explanatory notes and other turnover tables in this publication.
Figure(s) may be incomplete for any period or jurisdiction due to some unavailable turnover figures that are used to derive these numbers.
(1) No data from 2001-02 onwards.
(2) Bookmaker fixed odds include TAB fixed odds, from this period on.
(3) Bookmakers declared events betting, from this period on.
(4) Total turnover all bets on and off course, from this period on.
(5) Includes turnover on sportsbetting at all racing offices, from this period on.
(6) Figure incomplete due to data for one or more components being unavailable.
(7) Turnover provided by NSW bookmakers operating from approved offices and premises.
U = Unavailable data
AUSTRALIA
Value ($ million)
ACT NSW NT QLD SA TAS VIC WA
Australian Gambling Statistics, 1993–94 to 2018–2019, 36th edition
196

TABLE BOOKMAKER FO 3PER CAPITA BOOKMAKER AND OTHER FIXED ODDS TURNOVER
1994-95 - - 467.21 - 0.99 0.05 1.00 1.63 4.731995-96 65.27 - 519.38 0.50 1.27 15.02 0.51 1.44 6.741996-97 295.22 - 662.47 0.53 1.67 15.81 0.37 2.47 12.121997-98 342.36 8.28 1,173.77 0.04 2.06 9.29 0.38 5.17 20.681998-99 412.55 10.74 1,402.51 0.01 2.28 3.02 1.46 6.01 25.151999-00 693.37 12.27 1,747.14 0.02 2.00 1.54 2.73 6.89 34.102000-01 1,358.70 10.93 2,435.11 - U 1.84 0.69 15.57 7.90 54.692001-02 2,020.72 8.72 3,643.14 - U 6.43 0.00 (1) 27.22 5.69 79.592002-03 2,534.31 10.15 4,308.79 - U 9.89 - 31.61 4.67 95.822003-04 1,111.29 14.22 4,469.72 - U 7.26 - 31.28 5.42 74.312004-05 1,030.82 12.47 4,588.89 - U 5.76 - 13.54 2.84 68.652005-06 674.66 18.75 5,053.60 - U 6.21 - 23.80 1.67 71.892006-07 388.30 25.15 5,964.66 (2) - U 5.08 - 27.55 4.66 79.342007-08 452.88 32.14 7,125.57 - U 3.43 - 11.83 4.08 90.332008-09 281.95 20.41 7,251.23 - U 2.48 - 22.69 5.25 88.472009-10 316.61 18.70 (3) 7,707.15 - U 2.44 - 17.20 0.83 91.662010-11 383.44 16.21 8,771.23 - U 1.29 - - U 0.05 97.882011-12 - 15.10 8,804.22 - U 1.39 - - U 0.04 91.572012-13 2.59 15.86 12,618.87 - U 0.98 (4) - - U - 130.612013-14 6.78 26.83 (5) 15,282.78 - U 1.51 - - U 0.00 161.112014-15 3.95 73.20 18,492.91 - U 0.32 - - U 0.05 206.682015-16 - 50.72 30,376.89 - U 0.60 - - U 0.04 314.562016-17 - 46.99 (6) 30,265.47 - U 0.48 - - U 0.02 308.982017-18 - 46.12 (7) 35,843.35 - U 0.66 - - U 0.00 358.202018-19 - 83.03 40,922.63 - U 0.65 - - U 0.00 411.36
Notes: These data should be read in conjunction with the explanatory notes and other turnover tables in this publication.
Figure(s) may be incomplete for any period or jurisdiction due to some unavailable turnover figures that are used to derive these numbers.
(1) No data from 2001-02 onwards.
(2) Bookmaker fixed odds include TAB fixed odds, from this period on.
(3) Bookmakers declared events betting, from this period on.
(4) Total turnover all bets on and off course, from this period on.
(5) Includes turnover on sportsbetting at all racing offices, from this period on.
(6) Figure incomplete due to data for one or more components being unavailable.
(7) Turnover provided by NSW bookmakers operating from approved offices and premises.
U = Unavailable data
AUSTRALIA
Value ($)
ACT NSW NT QLD SA TAS VIC WA
Australian Gambling Statistics, 1993–94 to 2018–2019, 36th edition
197

TABLE BOOKMAKER FO 4REAL PER CAPITA BOOKMAKER AND OTHER FIXED ODDS TURNOVER
1994-95 - - 840.84 - 1.79 0.09 1.79 2.93 8.511995-96 112.66 - 896.54 0.86 2.20 25.93 0.88 2.48 11.631996-97 502.75 - 1,128.18 0.90 2.85 26.93 0.63 4.20 20.641997-98 583.04 14.11 1,998.92 0.07 3.50 15.83 0.65 8.80 35.221998-99 694.28 18.07 2,360.27 0.02 3.84 5.08 2.46 10.12 42.331999-00 1,139.96 20.18 2,872.45 0.03 3.29 2.53 4.48 11.32 56.062000-01 2,106.36 16.94 3,775.08 - U 2.85 1.07 24.14 12.24 84.792001-02 3,045.76 13.14 5,491.19 - U 9.70 0.00 (1) 41.02 8.57 119.972002-03 3,707.23 14.85 6,302.99 - U 14.46 - 46.23 6.83 140.172003-04 1,586.96 20.31 6,382.91 - U 10.37 - 44.67 7.74 106.122004-05 1,437.86 17.40 6,400.88 - U 8.04 - 18.89 3.97 95.752005-06 912.08 25.34 6,831.94 - U 8.40 - 32.18 2.26 97.182006-07 509.85 33.02 7,831.62 (2) - U 6.67 - 36.17 6.11 104.182007-08 575.43 40.83 9,053.76 - U 4.36 - 15.04 5.19 114.782008-09 347.41 25.15 8,934.83 - U 3.05 - 27.96 6.47 109.012009-10 381.07 22.50 (3) 9,276.23 - U 2.94 - 20.70 1.00 110.322010-11 447.80 18.93 10,243.58 - U 1.51 - - U 0.05 114.312011-12 - 17.23 10,045.62 - U 1.58 - - U 0.04 104.482012-13 2.89 17.69 14,074.42 - U 1.09 (4) - - U - 145.682013-14 7.36 29.15 (5) 16,607.29 - U 1.65 - - U 0.00 175.072014-15 4.22 78.20 19,756.94 - U 0.34 - - U 0.06 220.812015-16 - 53.43 32,003.72 - U 0.64 - - U 0.04 331.402016-17 - 48.65 (6) 31,336.57 - U 0.50 - - U 0.02 319.912017-18 - 46.86 (7) 36,417.86 - U 0.67 - - U 0.00 363.942018-19 - 83.03 40,922.63 - U 0.65 - - U 0.00 411.36
Notes: These data should be read in conjunction with the explanatory notes and other turnover tables in this publication.
Figure(s) may be incomplete for any period or jurisdiction due to some unavailable turnover figures that are used to derive these numbers.
(1) No data from 2001-02 onwards.
(2) Bookmaker fixed odds include TAB fixed odds, from this period on.
(3) Bookmakers declared events betting, from this period on.
(4) Total turnover all bets on and off course, from this period on.
(5) Includes turnover on sportsbetting at all racing offices, from this period on.
(6) Figure incomplete due to data for one or more components being unavailable.
(7) Turnover provided by NSW bookmakers operating from approved offices and premises.
U = Unavailable data
AUSTRALIA
Value ($)
ACT NSW NT QLD SA TAS VIC WA
Australian Gambling Statistics, 1993–94 to 2018–2019, 36th edition
198

TABLE BOOKMAKER FO 5BOOKMAKER AND OTHER FIXED ODDS EXPENDITURE
1994-95 - - 2.666 - 0.083 - 0.201 0.102 3.0521995-96 - - 2.676 - 0.093 - 0.521 0.092 3.3821996-97 - - 6.644 - 0.130 - 0.378 0.162 7.3141997-98 - 1.948 10.450 - 0.220 - 0.060 0.345 13.0231998-99 - 2.556 8.559 - 0.213 - 0.444 0.409 12.1811999-00 - 3.256 16.689 - 0.106 - 1.108 0.476 21.6352000-01 - 2.940 19.890 - 0.052 - 6.470 0.560 29.9122001-02 - 2.376 37.982 - 0.081 - 10.664 0.407 51.5102002-03 - 2.794 40.088 - -0.171 - 13.282 0.339 56.3322003-04 - U 3.944 62.684 - 0.225 - 19.857 0.401 87.1112004-05 - U 3.486 37.900 - -0.058 - 4.935 0.214 46.4772005-06 - U 5.287 41.272 - 0.111 - 4.644 0.130 51.4442006-07 - U 7.181 50.046 (2) - 0.530 - 6.017 0.367 64.1412007-08 - U 9.335 67.900 - 0.552 - 3.024 0.332 81.1432008-09 - U 6.040 62.445 - 0.418 - 5.215 (3) 0.443 74.5612009-10 - U 5.625 83.984 - 0.067 - 4.038 (3) 0.072 93.7862010-11 - U 4.940 80.867 - 0.094 - - U 0.004 85.9052011-12 - U 4.661 112.383 - U 0.130 - - U 0.004 117.1772012-13 - U 4.965 158.494 - U 0.182 (4) - - U - 163.6412013-14 - U 8.525 203.113 - U 0.195 - - U - 211.8332014-15 - U 23.616 285.700 - U 0.280 - - U 0.005 309.6012015-16 - U 16.619 380.556 - U 0.043 - - U 0.004 397.2222016-17 - U 15.669 (5) 460.880 - U 0.054 - - U 0.001 476.6042017-18 - U 15.651 551.244 - U 0.060 - - U - 566.9552018-19 - U 28.626 551.062 - U 0.050 - - U 0.002 579.740
Notes: These data should be read in conjunction with the explanatory notes and other expenditure tables in this publication.
Figure(s) may be incomplete for any period or jurisdiction due to some unavailable expenditure figures that are used to derive these numbers.
(1) Bookmaker betting expenditure figures estimated at 5.5% of turnover.
(2) Bookmaker fixed odds include TAB fixed odds, from this period on.
(3) Expenditure estimated at 5.58% of turnover.
(4) Profit from all bets on and off course (Audit plus sports i.e. AAMI, Bay Sheffield etc.).
(5) Figure incomplete due to data for one or more components being unavailable.
U = Unavailable data
NA = Not applicable
Value ($ million)
TAS(NA)
VIC WA AUSTRALIAACT NSW (1) NT QLD SA
Australian Gambling Statistics, 1993–94 to 2018–2019, 36th edition
199

TABLE BOOKMAKER FO 6REAL BOOKMAKER AND OTHER FIXED ODDS EXPENDITURE
1994-95 - - 4.798 - 0.149 - 0.362 0.184 5.4931995-96 - - 4.619 - 0.161 - 0.899 0.159 5.8381996-97 - - 11.315 - 0.221 - 0.644 0.276 12.4561997-98 - 3.317 17.796 - 0.375 - 0.102 0.588 22.1781998-99 - 4.301 14.404 - 0.358 - 0.747 0.688 20.4991999-00 - 5.353 27.438 - 0.174 - 1.822 0.783 35.5702000-01 - 4.558 30.835 - 0.081 - 10.030 0.868 46.3722001-02 - 3.581 57.249 - 0.122 - 16.073 0.613 77.6392002-03 - 4.087 58.642 - -0.250 - 19.429 0.496 82.4042003-04 - U 5.632 89.515 - 0.321 - 28.356 0.573 124.3982004-05 - U 4.863 52.865 - -0.081 - 6.884 0.299 64.8292005-06 - U 7.147 55.796 - 0.150 - 6.278 0.176 69.5472006-07 - U 9.429 65.711 (2) - 0.696 - 7.900 0.482 84.2172007-08 - U 11.861 86.274 - 0.701 - 3.842 0.422 103.1002008-09 - U 7.442 76.944 - 0.515 - 6.425 (3) 0.546 91.8722009-10 - U 6.770 101.082 - 0.081 - 4.860 (3) 0.087 112.8802010-11 - U 5.769 94.441 - 0.110 - - U 0.005 100.3252011-12 - U 5.318 128.229 - U 0.148 - - U 0.004 133.6992012-13 - U 5.538 176.776 - U 0.203 (4) - - U - 182.5172013-14 - U 9.264 220.716 - U 0.212 - - U - 230.1922014-15 - U 25.230 305.228 - U 0.299 - - U 0.005 330.7622015-16 - U 17.509 400.937 - U 0.045 - - U 0.004 418.4952016-17 - U 16.224 (5) 477.191 - U 0.056 - - U 0.001 493.4712017-18 - U 15.902 560.080 - U 0.061 - - U - 576.0422018-19 - U 28.626 551.062 - U 0.050 - - U 0.002 579.740
Notes: These data should be read in conjunction with the explanatory notes and other expenditure tables in this publication.
Figure(s) may be incomplete for any period or jurisdiction due to some unavailable expenditure figures that are used to derive these numbers.
(1) Bookmaker betting expenditure figures estimated at 5.5% of turnover.
(2) Bookmaker fixed odds include TAB fixed odds, from this period on.
(3) Expenditure estimated at 5.58% of turnover.
(4) Profit from all bets on and off course (Audit plus sports i.e. AAMI, Bay Sheffield etc.).
(5) Figure incomplete due to data for one or more components being unavailable.
U = Unavailable data
NA = Not applicable
Value ($ million)
TAS(NA)
VIC WA AUSTRALIAACT NSW (1) NT QLD SA
Australian Gambling Statistics, 1993–94 to 2018–2019, 36th edition
200

TABLE BOOKMAKER FO 7PER CAPITA BOOKMAKER AND OTHER FIXED ODDS EXPENDITURE
1994-95 - - 22.10 - 0.08 - 0.06 0.08 0.231995-96 - - 21.51 - 0.08 - 0.15 0.07 0.251996-97 - - 51.76 - 0.12 - 0.11 0.12 0.541997-98 - 0.41 79.38 - 0.20 - 0.02 0.26 0.941998-99 - 0.54 63.72 - 0.19 - 0.13 0.30 0.871999-00 - 0.68 121.75 - 0.09 - 0.31 0.34 1.522000-01 - 0.60 142.64 - 0.05 - 1.80 0.40 2.082001-02 - 0.48 269.43 - 0.07 - 2.93 0.28 3.522002-03 - 0.56 283.45 - -0.15 - 3.60 0.23 3.802003-04 - U 0.78 441.51 - 0.19 - 5.30 0.27 5.792004-05 - U 0.69 263.19 - -0.05 - 1.30 0.14 3.052005-06 - U 1.03 280.93 - 0.09 - 1.20 0.08 3.322006-07 - U 1.38 332.71 (2) - 0.44 - 1.53 0.23 4.072007-08 - U 1.77 437.39 - 0.45 - 0.75 0.20 5.042008-09 - U 1.12 388.24 - 0.33 - 1.27 (3) 0.26 4.522009-10 - U 1.03 507.77 - 0.05 - 0.96 (3) 0.04 5.572010-11 - U 0.89 481.23 - 0.07 - - U 0.00 5.022011-12 - U 0.83 656.47 - U 0.10 - - U 0.00 6.732012-13 - U 0.87 899.57 - U 0.14 (4) - - U - 9.232013-14 - U 1.48 1,130.24 - U 0.15 - - U - 11.752014-15 - U 4.03 1,575.01 - U 0.21 - - U 0.00 16.902015-16 - U 2.79 2,083.35 - U 0.03 - - U 0.00 21.352016-17 - U 2.58 (5) 2,508.17 - U 0.04 - - U 0.00 25.192017-18 - U 2.54 2,987.73 - U 0.04 - - U - 29.442018-19 - U 4.57 2,992.25 - U 0.04 - - U 0.00 29.60
Notes: These data should be read in conjunction with the explanatory notes and other expenditure tables in this publication.
Figure(s) may be incomplete for any period or jurisdiction due to some unavailable expenditure figures that are used to derive these numbers.
(1) Bookmaker betting expenditure figures estimated at 5.5% of turnover.
(2) Bookmaker fixed odds include TAB fixed odds, from this period on.
(3) Expenditure estimated at 5.58% of turnover.
(4) Profit from all bets on and off course (Audit plus sports i.e. AAMI, Bay Sheffield etc.).
(5) Figure incomplete due to data for one or more components being unavailable.
U = Unavailable data
NA = Not applicable
Value ($)
TAS(NA)
VIC WA AUSTRALIAACT NSW (1) NT QLD SA
Australian Gambling Statistics, 1993–94 to 2018–2019, 36th edition
201

TABLE BOOKMAKER FO 8REAL PER CAPITA BOOKMAKER AND OTHER FIXED ODDS EXPENDITURE
1994-95 - - 39.78 - 0.14 - 0.11 0.15 0.411995-96 - - 37.12 - 0.14 - 0.27 0.12 0.431996-97 - - 88.15 - 0.20 - 0.19 0.21 0.911997-98 - 0.71 135.18 - 0.33 - 0.03 0.44 1.601998-99 - 0.90 107.24 - 0.32 - 0.21 0.51 1.461999-00 - 1.11 200.17 - 0.15 - 0.51 0.57 2.512000-01 - 0.93 221.12 - 0.07 - 2.79 0.62 3.222001-02 - 0.72 406.11 - 0.11 - 4.41 0.43 5.312002-03 - 0.82 414.64 - -0.21 - 5.26 0.34 5.562003-04 - U 1.12 630.50 - 0.27 - 7.57 0.39 8.272004-05 - U 0.96 367.12 - -0.07 - 1.81 0.20 4.252005-06 - U 1.39 379.79 - 0.13 - 1.63 0.11 4.492006-07 - U 1.82 436.85 (2) - 0.57 - 2.01 0.31 5.342007-08 - U 2.25 555.75 - 0.57 - 0.96 0.26 6.402008-09 - U 1.38 478.38 - 0.41 - 1.56 (3) 0.32 5.572009-10 - U 1.24 611.14 - 0.06 - 1.15 (3) 0.05 6.712010-11 - U 1.04 562.00 - 0.09 - - U 0.00 5.862011-12 - U 0.95 749.03 - U 0.11 - - U 0.00 7.682012-13 - U 0.97 1,003.33 - U 0.16 (4) - - U - 10.292013-14 - U 1.60 1,228.20 - U 0.16 - - U - 12.762014-15 - U 4.30 1,682.66 - U 0.22 - - U 0.00 18.062015-16 - U 2.94 2,194.92 - U 0.03 - - U 0.00 22.502016-17 - U 2.68 (5) 2,596.93 - U 0.04 - - U 0.00 26.082017-18 - U 2.58 3,035.62 - U 0.04 - - U - 29.912018-19 - U 4.57 2,992.25 - U 0.04 - - U 0.00 29.60
Notes: These data should be read in conjunction with the explanatory notes and other expenditure tables in this publication.
Figure(s) may be incomplete for any period or jurisdiction due to some unavailable expenditure figures that are used to derive these numbers.
(1) Bookmaker betting expenditure figures estimated at 5.5% of turnover.
(2) Bookmaker fixed odds include TAB fixed odds, from this period on.
(3) Expenditure estimated at 5.58% of turnover.
(4) Profit from all bets on and off course (Audit plus sports i.e. AAMI, Bay Sheffield etc.).
(5) Figure incomplete due to data for one or more components being unavailable.
U = Unavailable data
NA = Not applicable
Value ($)
TAS(NA)
VIC WA AUSTRALIAACT NSW (1) NT QLD SA
Australian Gambling Statistics, 1993–94 to 2018–2019, 36th edition
202

TABLE BOOKMAKER FO 9BOOKMAKER AND OTHER FIXED ODDS EXPENDITURE AS A % OF HOUSEHOLD DISPOSABLE INCOME
(ALL STATES AND TERRITORIES)
1994-95 - - 0.088 - 0.000 - 0.000 0.000 0.0011995-96 - - 0.081 - 0.000 - 0.001 0.000 0.0011996-97 - - 0.190 - 0.000 - 0.000 0.000 0.0021997-98 - 0.001 0.293 - 0.001 - 0.000 0.001 0.0031998-99 - 0.002 0.220 - 0.001 - 0.000 0.001 0.0031999-00 - 0.002 0.385 - 0.000 - 0.001 0.001 0.0052000-01 - 0.002 0.411 - 0.000 - 0.006 0.001 0.0062001-02 - 0.001 0.714 - 0.000 - 0.009 0.001 0.0102002-03 - 0.002 0.757 - -0.000 - 0.011 0.001 0.0112003-04 - U 0.002 1.116 - 0.001 - 0.015 0.001 0.0162004-05 - U 0.002 0.593 - -0.000 - 0.003 0.000 0.0082005-06 - U 0.002 0.576 - 0.000 - 0.003 0.000 0.0082006-07 - U 0.003 0.647 (2) - 0.001 - 0.004 0.001 0.0092007-08 - U 0.004 0.799 - 0.001 - 0.002 0.000 0.0112008-09 - U 0.002 0.652 - 0.001 - 0.003 (3) 0.000 0.0092009-10 - U 0.002 0.800 - 0.000 - 0.002 (3) 0.000 0.0112010-11 - U 0.002 0.726 - 0.000 - - U 0.000 0.0092011-12 - U 0.001 0.939 - U 0.000 - - U 0.000 0.0122012-13 - U 0.001 1.238 - U 0.000 (4) - - U - 0.0162013-14 - U 0.002 1.459 - U 0.000 - - U - 0.0202014-15 - U 0.006 1.906 - U 0.000 - - U 0.000 0.0282015-16 - U 0.004 2.453 - U 0.000 - - U 0.000 0.0352016-17 - U 0.004 (5) 2.905 - U 0.000 - - U 0.000 0.0412017-18 - U 0.004 3.431 - U 0.000 - - U - 0.0472018-19 - U 0.007 3.522 - U 0.000 - - U 0.000 0.047
Notes: These data should be read in conjunction with the explanatory notes and other expenditure tables in this publication.
Figure(s) may be incomplete for any period or jurisdiction due to some unavailable expenditure figures that are used to derive these numbers.
(1) Bookmaker betting expenditure figures estimated at 5.5% of turnover.
(2) Bookmaker fixed odds include TAB fixed odds, from this period on.
(3) Expenditure estimated at 5.58% of turnover.
(4) Profit from all bets on and off course (Audit plus sports i.e. AAMI, Bay Sheffield etc.).
(5) Figure incomplete due to data for one or more components being unavailable.
U = Unavailable data
NA = Not applicable
Percentage (%)
TAS(NA)
VIC WA AUSTRALIAACT NSW (1) NT QLD SA
Australian Gambling Statistics, 1993–94 to 2018–2019, 36th edition
203

TABLE BOOKMAKER FO 10GOVERNMENT REVENUE FROM BOOKMAKER AND OTHER FIXED ODDS
1994-95 - - 0.507 - 0.006 - 0.067 0.020 0.6001995-96 0.039 - 0.289 - 0.005 0.026 0.035 0.018 0.4121996-97 0.116 - 0.362 - 0.006 0.028 0.025 0.032 0.5691997-98 0.127 0.411 0.592 - 0.035 0.016 0.026 0.069 1.2761998-99 0.183 0.518 0.696 - 0.046 0.005 0.070 0.020 1.5381999-00 0.808 0.594 0.867 - 0.039 0.016 0.113 0.024 2.4612000-01 0.928 0.353 0.568 - 0.036 0.001 0.016 0.028 1.9302001-02 1.196 0.192 (1) 0.881 - 0.015 (2) - U - U 0.020 2.3042002-03 1.448 - (3) 1.107 - - - U - U 0.017 2.5722003-04 0.848 - 0.938 - - - U - U 0.020 1.8062004-05 0.743 - 0.876 - - - U - U 0.011 1.6302005-06 0.658 - 0.783 - - - U - U 0.006 1.4472006-07 0.512 - 0.774 - - - U - U 0.018 1.3042007-08 0.466 - 0.853 - - 0.591 (4) - U 0.017 1.9272008-09 0.247 - 0.671 - - 0.755 - U 0.022 1.6952009-10 0.324 - 0.193 (5) - - 0.678 - U 0.004 1.1992010-11 0.384 - - - - 0.364 - U 0.000 0.7482011-12 - - - - - 0.394 - U 0.000 0.3942012-13 0.003 - - - - 0.327 - U - 0.3302013-14 0.009 - - - - 0.417 - U - 0.4262014-15 0.004 - - - - 0.608 - U - 0.6122015-16 - - - - - 0.454 - U - 0.4542016-17 - - - - - 0.068 (6) - U - 0.0682017-18 - - - - - - - U - -2018-19 - - - - - - - U - -
Notes: These data should be read in conjunction with the explanatory notes and other revenue tables in this publication.
Figure(s) may be incomplete for any period or jurisdiction due to some unavailable revenue figures that are used to derive these numbers.
Data for the gambling revenue received by states and territories from 1 July 2000 onwards are not comparable with that of preceding years because of the impact of changes brought
about by the introduction of the GST.
(1) State tax on bookmaker's turnover was abolished on 30 March 2002.
(2) Bookmakers' tax abolished from 1 December 2001.
(3) Gross profit tax is not based on turnover and is also capped, therefore cannot be determined as relative to racing or sports.
As a consequence, all revenue is reported as racing revenue.
(4) Includes tax paid on Australian and overseas non-racing events, from this period on.
(5) Changes in taxes payable by bookmakers were introduced in January 2010.
(6) Betfair ceased operations in Tasmania in November 2016.
U = Unavailable data
Value ($ million)
TAS VIC WA AUSTRALIAACT NSW NT QLD (U) SA
Australian Gambling Statistics, 1993–94 to 2018–2019, 36th edition
204

TABLE BOOKMAKER FO 11REAL GOVERNMENT REVENUE FROM BOOKMAKER AND OTHER FIXED ODDS
1994-95 - - 0.912 - 0.011 - 0.121 0.036 1.0801995-96 0.067 - 0.499 - 0.009 0.045 0.060 0.031 0.7111996-97 0.198 - 0.616 - 0.010 0.048 0.043 0.054 0.9691997-98 0.216 0.700 1.008 - 0.060 0.027 0.044 0.118 2.1731998-99 0.308 0.872 1.171 - 0.077 0.008 0.118 0.034 2.5881999-00 1.328 0.977 1.425 - 0.064 0.027 0.186 0.039 4.0462000-01 1.439 0.547 0.881 - 0.056 0.002 0.025 0.043 2.9922001-02 1.803 0.289 (1) 1.328 - 0.023 (2) - U - U 0.030 3.4732002-03 2.118 - (3) 1.619 - - - U - U 0.025 3.7622003-04 1.211 - 1.339 - - - U - U 0.029 2.5792004-05 1.036 - 1.222 - - - U - U 0.015 2.2742005-06 0.890 - 1.059 - - - U - U 0.008 1.9572006-07 0.672 - 1.016 - - - U - U 0.024 1.7122007-08 0.592 - 1.084 - - 0.751 (4) - U 0.022 2.4482008-09 0.304 - 0.827 - - 0.930 - U 0.027 2.0892009-10 0.390 - 0.232 (5) - - 0.816 - U 0.005 1.4432010-11 0.448 - - - - 0.425 - U 0.000 0.8742011-12 - - - - - 0.450 - U 0.000 0.4502012-13 0.003 - - - - 0.365 - U - 0.3682013-14 0.010 - - - - 0.453 - U - 0.4632014-15 0.004 - - - - 0.650 - U - 0.6542015-16 - - - - - 0.478 - U - 0.4782016-17 - - - - - 0.071 (6) - U - 0.0712017-18 - - - - - - - U - -2018-19 - - - - - - - U - -
Notes: These data should be read in conjunction with the explanatory notes and other revenue tables in this publication.
Figure(s) may be incomplete for any period or jurisdiction due to some unavailable revenue figures that are used to derive these numbers.
Data for the gambling revenue received by states and territories from 1 July 2000 onwards are not comparable with that of preceding years because of the impact of changes brought
about by the introduction of the GST.
(1) State tax on bookmaker's turnover was abolished on 30 March 2002.
(2) Bookmakers' tax abolished from 1 December 2001.
(3) Gross profit tax is not based on turnover and is also capped, therefore cannot be determined as relative to racing or sports.
As a consequence, all revenue is reported as racing revenue.
(4) Includes tax paid on Australian and overseas non-racing events, from this period on.
(5) Changes in taxes payable by bookmakers were introduced in January 2010.
(6) Betfair ceased operations in Tasmania in November 2016.
U = Unavailable data
Value ($ million)
TAS VIC WA AUSTRALIAACT NSW NT QLD (U) SA
Australian Gambling Statistics, 1993–94 to 2018–2019, 36th edition
205

TABLE BOOKMAKER FO 12PER CAPITA GOVERNMENT REVENUE FROM BOOKMAKER AND OTHER FIXED ODDS
1994-95 - - 4.20 - 0.01 - 0.02 0.02 0.051995-96 0.17 - 2.32 - 0.00 0.07 0.01 0.01 0.031996-97 0.51 - 2.82 - 0.01 0.08 0.01 0.02 0.041997-98 0.55 0.09 4.50 - 0.03 0.05 0.01 0.05 0.091998-99 0.79 0.11 5.18 - 0.04 0.01 0.02 0.01 0.111999-00 3.43 0.12 6.33 - 0.03 0.05 0.03 0.02 0.172000-01 3.88 0.07 4.07 - 0.03 0.00 0.00 0.02 0.132001-02 4.91 0.04 (1) 6.25 - 0.01 (2) - U - U 0.01 0.162002-03 5.86 - (3) 7.83 - - - U - U 0.01 0.172003-04 3.39 - 6.61 - - - U - U 0.01 0.122004-05 2.94 - 6.08 - - - U - U 0.01 0.112005-06 2.57 - 5.33 - - - U - U 0.00 0.092006-07 1.96 - 5.15 - - - U - U 0.01 0.082007-08 1.74 - 5.49 - - 1.56 (4) - U 0.01 0.122008-09 0.91 - 4.17 - - 1.97 - U 0.01 0.102009-10 1.16 - 1.17 (5) - - 1.74 - U 0.00 0.072010-11 1.35 - - - - 0.93 - U 0.00 0.042011-12 - - - - - 1.00 - U 0.00 0.022012-13 0.01 - - - - 0.82 - U - 0.022013-14 0.03 - - - - 1.04 - U - 0.022014-15 0.01 - - - - 1.52 - U - 0.032015-16 - - - - - 1.12 - U - 0.022016-17 - - - - - 0.17 (6) - U - 0.002017-18 - - - - - - - U - -2018-19 - - - - - - - U - -
Notes: These data should be read in conjunction with the explanatory notes and other revenue tables in this publication.
Figure(s) may be incomplete for any period or jurisdiction due to some unavailable revenue figures that are used to derive these numbers.
Data for the gambling revenue received by states and territories from 1 July 2000 onwards are not comparable with that of preceding years because of the impact of changes brought
about by the introduction of the GST.
(1) State tax on bookmaker's turnover was abolished on 30 March 2002.
(2) Bookmakers' tax abolished from 1 December 2001.
(3) Gross profit tax is not based on turnover and is also capped, therefore cannot be determined as relative to racing or sports.
As a consequence, all revenue is reported as racing revenue.
(4) Includes tax paid on Australian and overseas non-racing events, from this period on.
(5) Changes in taxes payable by bookmakers were introduced in January 2010.
(6) Betfair ceased operations in Tasmania in November 2016.
U = Unavailable data
Value ($)
TAS VIC WA AUSTRALIAACT NSW NT QLD (U) SA
Australian Gambling Statistics, 1993–94 to 2018–2019, 36th edition
206

TABLE BOOKMAKER FO 13REAL PER CAPITA GOVERNMENT REVENUE FROM BOOKMAKER AND OTHER FIXED ODDS
1994-95 - - 7.56 - 0.01 - 0.04 0.03 0.081995-96 0.30 - 4.01 - 0.01 0.13 0.02 0.02 0.051996-97 0.87 - 4.80 - 0.01 0.14 0.01 0.04 0.071997-98 0.94 0.15 7.66 - 0.05 0.08 0.01 0.09 0.161998-99 1.33 0.18 8.72 - 0.07 0.02 0.03 0.02 0.181999-00 5.64 0.20 10.40 - 0.06 0.08 0.05 0.03 0.292000-01 6.01 0.11 6.31 - 0.05 0.01 0.01 0.03 0.212001-02 7.41 0.06 (1) 9.42 - 0.02 (2) - U - U 0.02 0.242002-03 8.58 - (3) 11.45 - - - U - U 0.02 0.252003-04 4.84 - 9.43 - - - U - U 0.02 0.172004-05 4.10 - 8.49 - - - U - U 0.01 0.152005-06 3.47 - 7.21 - - - U - U 0.01 0.132006-07 2.57 - 6.76 - - - U - U 0.01 0.112007-08 2.22 - 6.98 - - 1.98 (4) - U 0.01 0.152008-09 1.12 - 5.14 - - 2.42 - U 0.02 0.132009-10 1.40 - 1.40 (5) - - 2.10 - U 0.00 0.092010-11 1.58 - - - - 1.08 - U 0.00 0.052011-12 - - - - - 1.14 - U 0.00 0.032012-13 0.01 - - - - 0.92 - U - 0.022013-14 0.03 - - - - 1.13 - U - 0.032014-15 0.01 - - - - 1.62 - U - 0.042015-16 - - - - - 1.18 - U - 0.032016-17 - - - - - 0.17 (6) - U - 0.002017-18 - - - - - - - U - -2018-19 - - - - - - - U - -
Notes: These data should be read in conjunction with the explanatory notes and other revenue tables in this publication.
Figure(s) may be incomplete for any period or jurisdiction due to some unavailable revenue figures that are used to derive these numbers.
Data for the gambling revenue received by states and territories from 1 July 2000 onwards are not comparable with that of preceding years because of the impact of changes brought
about by the introduction of the GST.
(1) State tax on bookmaker's turnover was abolished on 30 March 2002.
(2) Bookmakers' tax abolished from 1 December 2001.
(3) Gross profit tax is not based on turnover and is also capped, therefore cannot be determined as relative to racing or sports.
As a consequence, all revenue is reported as racing revenue.
(4) Includes tax paid on Australian and overseas non-racing events, from this period on.
(5) Changes in taxes payable by bookmakers were introduced in January 2010.
(6) Betfair ceased operations in Tasmania in November 2016.
U = Unavailable data
Value ($)
TAS VIC WA AUSTRALIAACT NSW NT QLD (U) SA
Australian Gambling Statistics, 1993–94 to 2018–2019, 36th edition
207

TABLE BOOKMAKER FO 14BOOKMAKER AND OTHER FIXED ODDS REVENUE
AS A % OF TOTAL STATE GAMBLING REVENUE
1994-95 - - 3.16 - 0.00 - 0.01 0.011995-96 0.07 - 1.43 - 0.00 0.05 0.00 0.011996-97 0.25 - 1.46 - 0.00 0.05 0.00 0.021997-98 0.25 0.03 2.09 - 0.01 0.03 0.00 0.031998-99 0.34 0.04 2.23 - 0.01 0.01 0.00 0.011999-00 1.30 0.04 2.33 - 0.01 0.02 0.01 0.012000-01 1.94 0.03 1.85 - 0.01 0.00 0.00 0.012001-02 2.65 0.02 (1) 2.65 - 0.00 (2) - U - U 0.012002-03 3.02 - (3) 3.10 - - - U - U 0.012003-04 1.51 - 2.45 - - - U - U 0.012004-05 1.33 - 1.92 - - - U - U 0.002005-06 1.24 - 1.42 - - - U - U 0.002006-07 0.95 - 1.22 - - - U - U 0.012007-08 0.78 - 1.20 - - 0.69 (4) - U 0.012008-09 0.44 - 0.92 - - 0.84 - U 0.012009-10 0.54 - 0.32 (5) - - 0.76 - U 0.002010-11 0.73 - - - - 0.44 - U 0.002011-12 - - - - - 0.47 - U 0.002012-13 0.01 - - - - 0.40 - U -2013-14 0.02 - - - - 0.51 - U -2014-15 0.01 - - - - 0.73 - U -2015-16 - - - - - 0.54 - U -2016-17 - - - - - 0.09 (6) - U -2017-18 - - - - - - - U -2018-19 - - - - - - - U -
Notes: These data should be read in conjunction with the explanatory notes and other revenue tables in this publication.
Figure(s) may be incomplete for any period or jurisdiction due to some unavailable revenue figures that are used to derive these numbers.
Data for the gambling revenue received by states and territories from 1 July 2000 onwards are not comparable with that of preceding years because of the impact of changes brought
about by the introduction of the GST.
(1) State tax on bookmaker's turnover was abolished on 30 March 2002.
(2) Bookmakers' tax abolished from 1 December 2001.
(3) Gross profit tax is not based on turnover and is also capped, therefore cannot be determined as relative to racing or sports.
As a consequence, all revenue is reported as racing revenue.
(4) Includes tax paid on Australian and overseas non-racing events, from this period on.
(5) Changes in taxes payable by bookmakers were introduced in January 2010.
(6) Betfair ceased operations in Tasmania in November 2016.
U = Unavailable data
Percentage (%)
ACT NSW NT QLD (U) SA TAS VIC WA
Australian Gambling Statistics, 1993–94 to 2018–2019, 36th edition
208

TABLE BOOKMAKER PB 1BOOKMAKER AND OTHER POOL BETTING TURNOVER
1997-98 0.083 - - - - - - - 0.0831998-99 0.145 - - - - - - - 0.1451999-00 - U - - - - - - - -2000-01 - U - - - - 0.035 0.744 - 0.7792001-02 - U - - - - 4.446 1.568 - 6.0142002-03 - U - - - - 1.821 1.627 - 3.4482003-04 - U - - - - 0.198 1.858 - 2.0562004-05 - U - - - - 0.216 2.566 - 2.7822005-06 - U - - - - 0.231 2.589 - 2.8202006-07 - U - - - - 0.208 2.488 - 2.6962007-08 - U - - - - 0.109 (1) 1.035 (1) - 1.1442008-09 - U - - - - - - - -2009-10 - U - - - - - - - -2010-11 - U - - - - - - - -2011-12 - U - - - - - - - -2012-13 - U - - - - - - - -2013-14 - U - - - - - - - -2014-15 - U - - - - - - - -2015-16 - U - - - - - - - -2016-17 - U - - - - - - - - 2017-18 - U - - - - - - - - 2018-19 - U - - - - - - - -
Notes: These data should be read in conjunction with the explanatory notes and other turnover tables in this publication.
Figure(s) may be incomplete for any period or jurisdiction due to some unavailable turnover figures that are used to derive these numbers.
(1) Tipstar ceased operations in 2007.
U = Unavailable data
NA = Not applicable
Value ($ million)
TAS VIC WA (NA) AUSTRALIAACTNSW(NA)
NT(NA)
QLD(U)
SA(U)
Australian Gambling Statistics, 1993–94 to 2018–2019, 36th edition
209

TABLE BOOKMAKER PB 2REAL BOOKMAKER AND OTHER POOL BETTING TURNOVER
1997-98 0.141 - - - - - - - 0.1411998-99 0.244 - - - - - - - 0.2441999-00 - U - - - - - - - -2000-01 - U - - - - 0.054 1.153 - 1.2082001-02 - U - - - - 6.701 2.363 - 9.0652002-03 - U - - - - 2.664 2.380 - 5.0442003-04 - U - - - - 0.283 2.653 - 2.9362004-05 - U - - - - 0.301 3.579 - 3.8812005-06 - U - - - - 0.312 3.500 - 3.8122006-07 - U - - - - 0.273 3.267 - 3.5402007-08 - U - - - - 0.138 (1) 1.315 (1) - 1.4542008-09 - U - - - - - - - -2009-10 - U - - - - - - - -2010-11 - U - - - - - - - -2011-12 - U - - - - - - - -2012-13 - U - - - - - - - -2013-14 - U - - - - - - - -2014-15 - U - - - - - - - -2015-16 - U - - - - - - - -2016-17 - U - - - - - - - - 2017-18 - U - - - - - - - - 2018-19 - U - - - - - - - -
Notes: These data should be read in conjunction with the explanatory notes and other turnover tables in this publication.
Figure(s) may be incomplete for any period or jurisdiction due to some unavailable turnover figures that are used to derive these numbers.
(1) Tipstar ceased operations in 2007.
U = Unavailable data
NA = Not applicable
Value ($ million)
TAS VIC WA (NA) AUSTRALIAACTNSW(NA)
NT(NA)
QLD(U)
SA(U)
Australian Gambling Statistics, 1993–94 to 2018–2019, 36th edition
210

TABLE BOOKMAKER PB 3PER CAPITA BOOKMAKER AND OTHER POOL BETTING TURNOVER
1997-98 0.36 - - - - - - - 0.011998-99 0.62 - - - - - - - 0.011999-00 - U - - - - - - - -2000-01 - U - - - - 0.10 0.21 - 0.052001-02 - U - - - - 12.55 0.43 - 0.412002-03 - U - - - - 5.09 0.44 - 0.232003-04 - U - - - - 0.55 0.50 - 0.142004-05 - U - - - - 0.59 0.68 - 0.182005-06 - U - - - - 0.62 0.67 - 0.182006-07 - U - - - - 0.56 0.63 - 0.172007-08 - U - - - - 0.29 (1) 0.26 (1) - 0.072008-09 - U - - - - - - - -2009-10 - U - - - - - - - -2010-11 - U - - - - - - - -2011-12 - U - - - - - - - -2012-13 - U - - - - - - - -2013-14 - U - - - - - - - -2014-15 - U - - - - - - - -2015-16 - U - - - - - - - -2016-17 - U - - - - - - - - 2017-18 - U - - - - - - - - 2018-19 - U - - - - - - - -
Notes: These data should be read in conjunction with the explanatory notes and other turnover tables in this publication.
Figure(s) may be incomplete for any period or jurisdiction due to some unavailable turnover figures that are used to derive these numbers.
(1) Tipstar ceased operations in 2007.
U = Unavailable data
NA = Not applicable
Value ($)
TAS VIC WA (NA) AUSTRALIAACTNSW(NA)
NT(NA)
QLD(U)
SA(U)
Australian Gambling Statistics, 1993–94 to 2018–2019, 36th edition
211

TABLE BOOKMAKER PB 4REAL PER CAPITA BOOKMAKER AND OTHER POOL BETTING TURNOVER
1997-98 0.61 - - - - - - - 0.011998-99 1.05 - - - - - - - 0.021999-00 - U - - - - - - - -2000-01 - U - - - - 0.15 0.32 - 0.082001-02 - U - - - - 18.91 0.65 - 0.622002-03 - U - - - - 7.44 0.64 - 0.342003-04 - U - - - - 0.78 0.71 - 0.202004-05 - U - - - - 0.82 0.94 - 0.252005-06 - U - - - - 0.84 0.91 - 0.252006-07 - U - - - - 0.73 0.83 - 0.222007-08 - U - - - - 0.37 (1) 0.33 (1) - 0.092008-09 - U - - - - - - - -2009-10 - U - - - - - - - -2010-11 - U - - - - - - - -2011-12 - U - - - - - - - -2012-13 - U - - - - - - - -2013-14 - U - - - - - - - -2014-15 - U - - - - - - - -2015-16 - U - - - - - - - -2016-17 - U - - - - - - - - 2017-18 - U - - - - - - - - 2018-19 - U - - - - - - - -
Notes: These data should be read in conjunction with the explanatory notes and other turnover tables in this publication.
Figure(s) may be incomplete for any period or jurisdiction due to some unavailable turnover figures that are used to derive these numbers.
(1) Tipstar ceased operations in 2007.
U = Unavailable data
NA = Not applicable
Value ($)
TAS VIC WA (NA) AUSTRALIAACTNSW(NA)
NT(NA)
QLD(U)
SA(U)
Australian Gambling Statistics, 1993–94 to 2018–2019, 36th edition
212

TABLE BOOKMAKER PB 5BOOKMAKER AND OTHER POOL BETTING EXPENDITURE
2000-01 - - - - - 0.014 0.297 - 0.3112001-02 - - - - - 0.422 0.627 (1) - 1.0492002-03 - - - - - 0.173 (2) 0.387 - 0.5602003-04 - U - - - - 0.018 0.431 - 0.4492004-05 - U - - - - 0.054 0.501 - 0.5552005-06 - U - - - - 0.055 0.442 - 0.4972006-07 - U - - - - 0.051 0.417 - 0.4682007-08 - U - - - - 0.026 (3) 0.171 (3) - 0.1972008-09 - U - - - - - - - -2009-10 - U - - - - - - - -2010-11 - U - - - - - - - -2011-12 - U - - - - - - - -2012-13 - U - - - - - - - -2013-14 - U - - - - - - - - 2014-15 - U - - - - - - - - 2015-16 - U - - - - - - - - 2016-17 - U - - - - - - - - 2017-18 - U - - - - - - - - 2018-19 - U - - - - - - - -
Notes: These data should be read in conjunction with the explanatory notes and other expenditure tables in this publication.
Figure(s) may be incomplete for any period or jurisdiction due to some unavailable expenditure figures that are used to derive these numbers.
(1) Expenditure estimated by applying retention rates of 10% or 40% as applicable. Applies solely to the pool betting competition, Tipstar, and does not in any way relate to bookmakers.
(2) Expenditure estimated at 9.5 % of turnover.
(3) Tipstar ceased operations in 2007.
U = Unavailable data
NA = Not applicable
Value ($ million)
TAS VIC WA (NA) AUSTRALIAACTNSW(NA)
NT(NA)
QLD(U)
SA(U)
Australian Gambling Statistics, 1993–94 to 2018–2019, 36th edition
213

TABLE BOOKMAKER PB 6REAL BOOKMAKER AND OTHER POOL BETTING EXPENDITURE
2000-01 - - - - - 0.022 0.460 - 0.4822001-02 - - - - - 0.636 0.945 (1) - 1.5812002-03 - - - - - 0.253 (2) 0.566 - 0.8192003-04 - U - - - - 0.026 0.615 - 0.6412004-05 - U - - - - 0.075 0.699 - 0.7742005-06 - U - - - - 0.074 0.598 - 0.6722006-07 - U - - - - 0.067 0.548 - 0.6142007-08 - U - - - - 0.033 (3) 0.217 (3) - 0.2502008-09 - U - - - - - - - -2009-10 - U - - - - - - - -2010-11 - U - - - - - - - -2011-12 - U - - - - - - - -2012-13 - U - - - - - - - -2013-14 - U - - - - - - - - 2014-15 - U - - - - - - - - 2015-16 - U - - - - - - - - 2016-17 - U - - - - - - - - 2017-18 - U - - - - - - - - 2018-19 - U - - - - - - - -
Notes: These data should be read in conjunction with the explanatory notes and other expenditure tables in this publication.
Figure(s) may be incomplete for any period or jurisdiction due to some unavailable expenditure figures that are used to derive these numbers.
(1) Expenditure estimated by applying retention rates of 10% or 40% as applicable. Applies solely to the pool betting competition, Tipstar, and does not in any way relate to bookmakers.
(2) Expenditure estimated at 9.5 % of turnover.
(3) Tipstar ceased operations in 2007.
U = Unavailable data
NA = Not applicable
Value ($ million)
TAS VIC WA (NA) AUSTRALIAACTNSW(NA)
NT(NA)
QLD(U)
SA(U)
Australian Gambling Statistics, 1993–94 to 2018–2019, 36th edition
214

TABLE BOOKMAKER PB 7PER CAPITA BOOKMAKER AND OTHER POOL BETTING EXPENDITURE
2000-01 - - - - - 0.04 0.08 - 0.022001-02 - - - - - 1.19 0.17 (1) - 0.072002-03 - - - - - 0.48 (2) 0.10 - 0.042003-04 - U - - - - 0.05 0.12 - 0.032004-05 - U - - - - 0.15 0.13 - 0.042005-06 - U - - - - 0.15 0.11 - 0.032006-07 - U - - - - 0.14 0.11 - 0.032007-08 - U - - - - 0.07 (3) 0.04 (3) - 0.012008-09 - U - - - - - - - -2009-10 - U - - - - - - - -2010-11 - U - - - - - - - -2011-12 - U - - - - - - - -2012-13 - U - - - - - - - -2013-14 - U - - - - - - - - 2014-15 - U - - - - - - - - 2015-16 - U - - - - - - - - 2016-17 - U - - - - - - - - 2017-18 - U - - - - - - - - 2018-19 - U - - - - - - - -
Notes: These data should be read in conjunction with the explanatory notes and other expenditure tables in this publication.
Figure(s) may be incomplete for any period or jurisdiction due to some unavailable expenditure figures that are used to derive these numbers.
(1) Expenditure estimated by applying retention rates of 10% or 40% as applicable. Applies solely to the pool betting competition, Tipstar, and does not in any way relate to bookmakers.
(2) Expenditure estimated at 9.5 % of turnover.
(3) Tipstar ceased operations in 2007.
U = Unavailable data
NA = Not applicable
Value ($)
TAS VIC WA (NA) AUSTRALIAACTNSW(NA)
NT(NA)
QLD(U)
SA(U)
Australian Gambling Statistics, 1993–94 to 2018–2019, 36th edition
215

TABLE BOOKMAKER PB 8REAL PER CAPITA BOOKMAKER AND OTHER POOL BETTING EXPENDITURE
2000-01 - - - - - 0.06 0.13 - 0.032001-02 - - - - - 1.80 0.26 (1) - 0.112002-03 - - - - - 0.71 (2) 0.15 - 0.062003-04 - U - - - - 0.07 0.16 - 0.042004-05 - U - - - - 0.21 0.18 - 0.052005-06 - U - - - - 0.20 0.15 - 0.042006-07 - U - - - - 0.18 0.14 - 0.042007-08 - U - - - - 0.09 (3) 0.05 (3) - 0.022008-09 - U - - - - - - - -2009-10 - U - - - - - - - -2010-11 - U - - - - - - - -2011-12 - U - - - - - - - -2012-13 - U - - - - - - - -2013-14 - U - - - - - - - - 2014-15 - U - - - - - - - - 2015-16 - U - - - - - - - - 2016-17 - U - - - - - - - - 2017-18 - U - - - - - - - - 2018-19 - U - - - - - - - -
Notes: These data should be read in conjunction with the explanatory notes and other expenditure tables in this publication.
Figure(s) may be incomplete for any period or jurisdiction due to some unavailable expenditure figures that are used to derive these numbers.
(1) Expenditure estimated by applying retention rates of 10% or 40% as applicable. Applies solely to the pool betting competition, Tipstar, and does not in any way relate to bookmakers.
(2) Expenditure estimated at 9.5 % of turnover.
(3) Tipstar ceased operations in 2007.
U = Unavailable data
NA = Not applicable
Value ($)
TAS VIC WA (NA) AUSTRALIAACTNSW(NA)
NT(NA)
QLD(U)
SA(U)
Australian Gambling Statistics, 1993–94 to 2018–2019, 36th edition
216

TABLE BOOKMAKER PB 9BOOKMAKER AND OTHER POOL BETTING EXPENDITURE AS A % OF HOUSEHOLD DISPOSABLE INCOME
(ALL STATES AND TERRITORIES)
2000-01 - - - - - 0.000 0.000 - 0.0002001-02 - - - - - 0.004 0.001 (1) - 0.0002002-03 - - - - - 0.002 (2) 0.000 - 0.0002003-04 - U - - - - 0.000 0.000 - 0.0002004-05 - U - - - - 0.000 0.000 - 0.0002005-06 - U - - - - 0.000 0.000 - 0.0002006-07 - U - - - - 0.000 0.000 - 0.0002007-08 - U - - - - 0.000 (3) 0.000 (3) - 0.0002008-09 - U - - - - - - - -2009-10 - U - - - - - - - -2010-11 - U - - - - - - - -2011-12 - U - - - - - - - -2012-13 - U - - - - - - - -2013-14 - U - - - - - - - - 2014-15 - U - - - - - - - - 2015-16 - U - - - - - - - - 2016-17 - U - - - - - - - - 2017-18 - U - - - - - - - - 2018-19 - U - - - - - - - -
Notes: These data should be read in conjunction with the explanatory notes and other expenditure tables in this publication.
Figure(s) may be incomplete for any period or jurisdiction due to some unavailable expenditure figures that are used to derive these numbers.
(1) Expenditure estimated by applying retention rates of 10% or 40% as applicable. Applies solely to the pool betting competition, Tipstar, and does not in any way relate to bookmakers.
(2) Expenditure estimated at 9.5 % of turnover.
(3) Tipstar ceased operations in 2007.
U = Unavailable data
NA = Not applicable
Percentage (%)
TAS VIC WA (NA) AUSTRALIAACTNSW(NA)
NT(NA)
QLD(U)
SA(U)
Australian Gambling Statistics, 1993–94 to 2018–2019, 36th edition
217

TABLE BOOKMAKER PB 10GOVERNMENT REVENUE FROM BOOKMAKER AND OTHER POOL BETTING
1997-98 0.006 - - - - - - - 0.0061998-99 0.010 - - - - - - - 0.0101999-00 - U - - - - - - - -2000-01 - U - - - - - 0.026 - 0.0262001-02 - U - - - - 0.011 0.252 - 0.2632002-03 - U - - - - 0.030 0.249 - 0.2792003-04 - U - - - - 0.032 0.252 - 0.2842004-05 - U - - - - 0.030 0.293 - 0.3232005-06 - U - - - - 0.029 0.258 - 0.2872006-07 - U - - - - 0.027 0.243 - 0.2702007-08 - U - - - - 0.014 (1) 0.100 (1) - 0.1142008-09 - U - - - - - - - -2009-10 - U - - - - - - - -2010-11 - U - - - - - - - -2011-12 - U - - - - - - - -2012-13 - U - - - - - - - -2013-14 - U - - - - - - - -2014-15 - U - - - - - - - -2015-16 - U - - - - - - - -2016-17 - U - - - - - - - - 2017-18 - U - - - - - - - - 2018-19 - U - - - - - - - -
Notes: These data should be read in conjunction with the explanatory notes and other revenue tables in this publication.
Figure(s) may be incomplete for any period or jurisdiction due to some unavailable revenue figures that are used to derive these numbers.
Data for the gambling revenue received by states and territories from 1 July 2000 onwards are not comparable with that of preceding years because of the impact of changes brought
about by the introduction of the GST.
(1) Tipstar ceased operations in 2007.
U = Unavailable data
NA = Not applicable
Value ($ million)
TAS VIC WA (NA) AUSTRALIAACTNSW(NA)
NT(NA)
QLD(U)
SA(U)
Australian Gambling Statistics, 1993–94 to 2018–2019, 36th edition
218

TABLE BOOKMAKER PB 11REAL GOVERNMENT REVENUE FROM BOOKMAKER AND OTHER POOL BETTING
1997-98 0.010 - - - - - - - 0.0101998-99 0.017 - - - - - - - 0.0171999-00 - U - - - - - - - -2000-01 - U - - - - - 0.040 - 0.0402001-02 - U - - - - 0.017 0.380 - 0.3962002-03 - U - - - - 0.044 0.364 - 0.4082003-04 - U - - - - 0.046 0.360 - 0.4062004-05 - U - - - - 0.042 0.409 - 0.4512005-06 - U - - - - 0.039 0.349 - 0.3882006-07 - U - - - - 0.035 0.319 - 0.3552007-08 - U - - - - 0.018 (1) 0.127 (1) - 0.1452008-09 - U - - - - - - - -2009-10 - U - - - - - - - -2010-11 - U - - - - - - - -2011-12 - U - - - - - - - -2012-13 - U - - - - - - - -2013-14 - U - - - - - - - -2014-15 - U - - - - - - - -2015-16 - U - - - - - - - -2016-17 - U - - - - - - - - 2017-18 - U - - - - - - - - 2018-19 - U - - - - - - - -
Notes: These data should be read in conjunction with the explanatory notes and other revenue tables in this publication.
Figure(s) may be incomplete for any period or jurisdiction due to some unavailable revenue figures that are used to derive these numbers.
Data for the gambling revenue received by states and territories from 1 July 2000 onwards are not comparable with that of preceding years because of the impact of changes brought
about by the introduction of the GST.
(1) Tipstar ceased operations in 2007.
U = Unavailable data
NA = Not applicable
Value ($ million)
TAS VIC WA (NA) AUSTRALIAACTNSW(NA)
NT(NA)
QLD(U)
SA(U)
Australian Gambling Statistics, 1993–94 to 2018–2019, 36th edition
219

TABLE BOOKMAKER PB 12PER CAPITA GOVERNMENT REVENUE FROM BOOKMAKER AND OTHER POOL BETTING
1997-98 0.03 - - - - - - - 0.001998-99 0.04 - - - - - - - 0.001999-00 - U - - - - - - - -2000-01 - U - - - - - 0.01 - 0.002001-02 - U - - - - 0.03 0.07 - 0.022002-03 - U - - - - 0.08 0.07 - 0.022003-04 - U - - - - 0.09 0.07 - 0.022004-05 - U - - - - 0.08 0.08 - 0.022005-06 - U - - - - 0.08 0.07 - 0.022006-07 - U - - - - 0.07 0.06 - 0.022007-08 - U - - - - 0.04 (1) 0.02 (1) - 0.012008-09 - U - - - - - - - -2009-10 - U - - - - - - - -2010-11 - U - - - - - - - -2011-12 - U - - - - - - - -2012-13 - U - - - - - - - -2013-14 - U - - - - - - - -2014-15 - U - - - - - - - -2015-16 - U - - - - - - - -2016-17 - U - - - - - - - - 2017-18 - U - - - - - - - - 2018-19 - U - - - - - - - -
Notes: These data should be read in conjunction with the explanatory notes and other revenue tables in this publication.
Figure(s) may be incomplete for any period or jurisdiction due to some unavailable revenue figures that are used to derive these numbers.
Data for the gambling revenue received by states and territories from 1 July 2000 onwards are not comparable with that of preceding years because of the impact of changes brought
about by the introduction of the GST.
(1) Tipstar ceased operations in 2007.
U = Unavailable data
NA = Not applicable
Value ($)
TAS VIC WA (NA) AUSTRALIAACTNSW(NA)
NT(NA)
QLD(U)
SA(U)
Australian Gambling Statistics, 1993–94 to 2018–2019, 36th edition
220

TABLE BOOKMAKER PB 13REAL PER CAPITA GOVERNMENT REVENUE FROM BOOKMAKER AND OTHER POOL BETTING
1997-98 0.04 - - - - - - - 0.001998-99 0.07 - - - - - - - 0.001999-00 - U - - - - - - - -2000-01 - U - - - - - 0.01 - 0.002001-02 - U - - - - 0.05 0.10 - 0.032002-03 - U - - - - 0.12 0.10 - 0.032003-04 - U - - - - 0.13 0.10 - 0.032004-05 - U - - - - 0.11 0.11 - 0.032005-06 - U - - - - 0.11 0.09 - 0.032006-07 - U - - - - 0.09 0.08 - 0.022007-08 - U - - - - 0.05 (1) 0.03 (1) - 0.012008-09 - U - - - - - - - -2009-10 - U - - - - - - - -2010-11 - U - - - - - - - -2011-12 - U - - - - - - - -2012-13 - U - - - - - - - -2013-14 - U - - - - - - - -2014-15 - U - - - - - - - -2015-16 - U - - - - - - - -2016-17 - U - - - - - - - - 2017-18 - U - - - - - - - - 2018-19 - U - - - - - - - -
Notes: These data should be read in conjunction with the explanatory notes and other revenue tables in this publication.
Figure(s) may be incomplete for any period or jurisdiction due to some unavailable revenue figures that are used to derive these numbers.
Data for the gambling revenue received by states and territories from 1 July 2000 onwards are not comparable with that of preceding years because of the impact of changes brought
about by the introduction of the GST.
(1) Tipstar ceased operations in 2007.
U = Unavailable data
NA = Not applicable
Value ($)
TAS VIC WA (NA) AUSTRALIAACTNSW(NA)
NT(NA)
QLD(U)
SA(U)
Australian Gambling Statistics, 1993–94 to 2018–2019, 36th edition
221

TABLE BOOKMAKER PB 14BOOKMAKER AND OTHER POOL BETTING REVENUE
AS A % OF TOTAL STATE GAMBLING REVENUE
1997-98 0.01 - - - - - - -1998-99 0.02 - - - - - - -1999-00 - U - - - - - - -2000-01 - U - - - - - 0.00 -2001-02 - U - - - - 0.02 0.02 -2002-03 - U - - - - 0.04 0.02 -2003-04 - U - - - - 0.04 0.02 -2004-05 - U - - - - 0.04 0.02 -2005-06 - U - - - - 0.04 0.02 -2006-07 - U - - - - 0.03 0.02 -2007-08 - U - - - - 0.02 (1) 0.01 (1) -2008-09 - U - - - - - - -2009-10 - U - - - - - - -2010-11 - U - - - - - - -2011-12 - U - - - - - - -2012-13 - U - - - - - - -2013-14 - U - - - - - - -2014-15 - U - - - - - - -2015-16 - U - - - - - - - 2016-17 - U - - - - - - - 2017-18 - U - - - - - - - 2018-19 - U - - - - - - -
Notes: These data should be read in conjunction with the explanatory notes and other revenue tables in this publication.
Figure(s) may be incomplete for any period or jurisdiction due to some unavailable revenue figures that are used to derive these numbers.
Data for the gambling revenue received by states and territories from 1 July 2000 onwards are not comparable with that of preceding years because of the impact of changes brought
about by the introduction of the GST.
(1) Tipstar ceased operations in 2007.
U = Unavailable data
NA = Not applicable
Percentage (%)
ACTNSW(NA)
NT(NA)
QLD(U)
SA(U)
TAS VIC WA (NA)
Australian Gambling Statistics, 1993–94 to 2018–2019, 36th edition
222

TABLE SPORTSBETTING 1TOTAL SPORTSBETTING TURNOVER
1994-95 - 22.541 56.354 - 3.222 0.080 22.967 3.249 108.4131995-96 14.712 19.568 64.628 4.000 3.682 5.368 28.294 3.271 143.5231996-97 67.352 16.306 85.036 4.400 3.860 5.694 28.644 4.964 216.2561997-98 78.813 54.692 154.520 2.600 5.079 3.445 43.471 8.875 351.4951998-99 96.008 105.676 188.379 3.327 5.057 1.254 52.394 11.057 463.1521999-00 163.268 161.447 239.486 13.072 5.586 1.772 67.756 13.609 665.9962000-01 325.247 53.457 339.566 17.527 6.261 1.794 116.995 19.103 879.9502001-02 493.835 43.190 514.480 26.137 7.439 7.334 193.710 25.582 1,311.7072002-03 628.103 50.792 610.556 30.043 22.363 5.005 209.063 28.867 1,584.7922003-04 281.328 346.156 636.134 46.810 22.662 4.138 210.790 40.811 1,588.8292004-05 264.463 400.311 663.012 48.535 24.378 4.847 180.447 41.679 1,627.6722005-06 178.775 508.205 746.249 70.228 35.384 6.215 255.325 59.429 1,859.8102006-07 107.788 580.539 897.198 86.785 40.265 7.552 306.647 70.857 2,097.6312007-08 129.603 676.937 1,106.156 109.426 47.008 19.193 335.717 82.799 2,506.8392008-09 87.647 649.097 1,166.295 125.348 62.072 104.597 446.389 101.450 2,742.8952009-10 103.816 759.672 1,274.752 149.978 51.954 33.613 737.633 169.811 3,281.2292010-11 125.418 854.911 1,473.944 147.350 56.321 17.504 871.985 157.551 3,704.9842011-12 19.379 906.778 1,507.221 157.841 59.648 13.443 1,033.725 181.387 3,879.4222012-13 19.905 873.466 2,223.300 148.792 60.734 19.465 1,146.891 230.223 4,722.7762013-14 32.021 976.883 2,746.430 157.459 63.210 40.149 1,375.390 412.207 5,803.7492014-15 31.220 1,345.860 3,354.530 153.855 66.546 46.182 1,667.319 531.588 7,197.1002015-16 36.178 1,293.065 5,548.809 184.232 70.444 59.887 1,913.419 618.210 9,724.2442016-17 62.798 1,292.562 5,561.340 164.908 69.047 58.756 2,208.227 164.938 9,582.5762017-18 86.186 1,335.729 6,613.187 192.218 72.488 75.010 2,476.280 164.328 11,015.4252018-19 104.966 1,611.510 7,536.435 173.552 72.915 54.488 1,394.706 164.180 11,112.753
Notes: These data should be read in conjunction with the explanatory notes and other turnover tables in this publication.
Figure(s) may be incomplete for any period or jurisdiction due to some unavailable turnover figures that are used to derive these numbers.
Rounding discrepancies may have small effects on totals.
AUSTRALIA
Value ($ million)
ACT NSW NT QLD SA TAS VIC WA
Australian Gambling Statistics, 1993–94 to 2018–2019, 36th edition
223

TABLE SPORTSBETTING 2REAL TOTAL SPORTSBETTING TURNOVER
1994-95 - 40.567 101.419 - 5.799 0.144 41.333 5.847 195.1091995-96 25.395 33.778 111.559 6.905 6.356 9.266 48.840 5.646 247.7451996-97 114.699 27.769 144.815 7.493 6.574 9.697 48.780 8.454 368.2811997-98 134.217 93.140 263.145 4.428 8.649 5.867 74.030 15.114 598.5911998-99 161.571 177.841 317.021 5.599 8.510 2.110 88.173 18.608 779.4341999-00 268.428 265.434 393.737 21.492 9.184 2.913 111.397 22.374 1,094.9592000-01 504.221 82.873 526.420 27.172 9.706 2.781 181.374 29.615 1,364.1622001-02 744.340 65.099 775.458 39.395 11.213 11.055 291.972 38.559 1,977.0912002-03 918.802 74.300 893.134 43.948 32.713 7.321 305.822 42.227 2,318.2662003-04 401.746 494.323 908.422 66.846 32.362 5.909 301.016 58.280 2,268.9032004-05 368.890 558.380 924.813 67.700 34.004 6.761 251.699 58.137 2,270.3842005-06 241.685 687.040 1,008.851 94.941 47.835 8.402 345.173 80.342 2,514.2692006-07 141.526 762.250 1,178.024 113.949 52.868 9.916 402.629 93.035 2,754.1972007-08 164.674 860.117 1,405.483 139.037 59.728 24.387 426.562 105.205 3,185.1932008-09 107.997 799.805 1,437.087 154.451 76.484 128.882 550.032 125.005 3,379.7442009-10 124.952 914.331 1,534.274 180.511 62.531 40.456 887.805 204.382 3,949.2432010-11 146.471 998.417 1,721.362 172.084 65.775 20.442 1,018.357 183.998 4,326.9062011-12 22.111 1,034.634 1,719.739 180.097 68.058 15.338 1,179.480 206.963 4,426.4202012-13 22.201 974.218 2,479.751 165.955 67.739 21.710 1,279.181 256.779 5,267.5342013-14 34.796 1,061.546 2,984.454 171.105 68.688 43.629 1,494.590 447.932 6,306.7402014-15 33.354 1,437.852 3,583.819 164.371 71.095 49.339 1,781.284 567.923 7,689.0372015-16 38.116 1,362.315 5,845.975 194.099 74.217 63.094 2,015.892 651.318 10,245.0252016-17 65.020 1,338.306 5,758.157 170.744 71.491 60.836 2,286.377 170.776 9,921.7052017-18 87.567 1,357.139 6,719.186 195.299 73.650 76.212 2,515.971 166.962 11,191.9852018-19 104.966 1,611.510 7,536.435 173.552 72.915 54.488 1,394.706 164.180 11,112.753
Notes: These data should be read in conjunction with the explanatory notes and other turnover tables in this publication.
Figure(s) may be incomplete for any period or jurisdiction due to some unavailable turnover figures that are used to derive these numbers.
Rounding discrepancies may have small effects on totals.
AUSTRALIA
Value ($ million)
ACT NSW NT QLD SA TAS VIC WA
Australian Gambling Statistics, 1993–94 to 2018–2019, 36th edition
224

TABLE SPORTSBETTING 3PER CAPITA TOTAL SPORTSBETTING TURNOVER
1994-95 - 4.98 467.21 - 2.91 0.23 6.84 2.58 8.161995-96 65.27 4.27 519.38 1.66 3.32 15.44 8.35 2.55 10.651996-97 295.22 3.51 662.47 1.79 3.46 16.32 8.37 3.79 15.831997-98 342.72 11.63 1,173.77 1.04 4.52 9.86 12.57 6.64 25.411998-99 413.17 22.20 1,402.51 1.31 4.47 3.58 14.98 8.13 33.071999-00 693.37 33.47 1,747.14 5.06 4.90 5.04 19.13 9.84 46.922000-01 1,358.70 10.93 2,435.11 6.66 5.46 5.09 32.58 13.58 61.102001-02 2,028.99 8.72 3,649.57 9.71 6.43 20.70 53.17 17.88 89.742002-03 2,543.44 10.15 4,317.05 10.87 19.17 13.98 56.59 19.85 106.862003-04 1,125.53 68.63 4,480.61 16.48 19.26 11.40 56.26 27.59 105.622004-05 1,046.27 78.76 4,604.25 16.66 20.53 13.20 47.48 27.65 106.682005-06 697.24 99.11 5,079.60 23.52 29.50 16.77 66.10 38.63 120.072006-07 412.18 111.83 5,964.66 28.34 33.16 20.18 77.92 44.90 133.022007-08 485.05 128.17 7,125.57 34.78 38.20 50.69 83.49 50.85 155.602008-09 321.40 120.63 7,251.23 38.76 49.73 272.41 108.40 60.23 166.392009-10 372.47 138.89 7,707.15 45.30 41.04 86.38 175.27 97.91 195.022010-11 440.51 154.23 8,771.23 43.68 43.98 44.52 203.67 88.40 216.552011-12 66.65 161.55 8,804.22 45.87 46.11 33.98 237.07 98.70 222.882012-13 67.14 153.48 12,618.87 42.36 46.47 49.01 257.46 121.71 266.392013-14 106.40 169.08 15,282.78 44.04 47.89 100.61 302.14 213.83 321.812014-15 102.18 229.43 18,492.91 42.41 49.96 115.08 358.42 272.88 392.932015-16 116.35 217.02 30,376.89 50.07 52.47 148.33 401.89 315.11 522.712016-17 198.05 213.18 30,265.47 44.08 51.05 144.17 452.46 83.56 506.392017-18 266.14 216.46 35,843.35 50.44 53.16 181.66 495.24 82.61 571.962018-19 318.66 257.07 40,922.63 44.72 52.97 130.07 272.51 81.78 567.32
Notes: These data should be read in conjunction with the explanatory notes and other turnover tables in this publication.
Figure(s) may be incomplete for any period or jurisdiction due to some unavailable turnover figures that are used to derive these numbers.
Rounding discrepancies may have small effects on totals.
AUSTRALIA
Value ($)
ACT NSW NT QLD SA TAS VIC WA
Australian Gambling Statistics, 1993–94 to 2018–2019, 36th edition
225

TABLE SPORTSBETTING 4REAL PER CAPITA TOTAL SPORTSBETTING TURNOVER
1994-95 - 8.96 840.84 - 5.24 0.42 12.31 4.65 14.681995-96 112.66 7.37 896.54 2.87 5.72 26.65 14.41 4.40 18.391996-97 502.75 5.98 1,128.18 3.05 5.89 27.79 14.25 6.45 26.961997-98 583.65 19.80 1,998.92 1.77 7.70 16.79 21.40 11.31 43.281998-99 695.33 37.35 2,360.27 2.21 7.52 6.03 25.21 13.68 55.651999-00 1,139.96 55.03 2,872.45 8.33 8.06 8.29 31.45 16.18 77.142000-01 2,106.36 16.94 3,775.08 10.33 8.46 7.89 50.50 21.05 94.732001-02 3,058.23 13.14 5,500.87 14.64 9.70 31.20 80.14 26.96 135.272002-03 3,720.59 14.85 6,315.07 15.90 28.05 20.46 82.78 29.04 156.322003-04 1,607.30 98.01 6,398.46 23.53 27.51 16.28 80.35 39.39 150.832004-05 1,459.41 109.85 6,422.31 23.24 28.64 18.41 66.23 38.57 148.812005-06 942.60 133.99 6,867.09 31.80 39.88 22.67 89.37 52.22 162.322006-07 541.19 146.83 7,831.62 37.21 43.54 26.50 102.31 58.96 174.652007-08 616.30 162.85 9,053.76 44.19 48.54 64.40 106.09 64.61 197.712008-09 396.03 148.64 8,934.83 47.76 61.28 335.66 133.57 74.21 205.022009-10 448.30 167.16 9,276.23 54.53 49.39 103.97 210.95 117.84 234.732010-11 514.45 180.12 10,243.58 51.01 51.36 51.99 237.86 103.24 252.902011-12 76.05 184.33 10,045.62 52.34 52.61 38.77 270.50 112.61 254.312012-13 74.88 171.18 14,074.42 47.25 51.83 54.66 287.16 135.75 297.112013-14 115.62 183.74 16,607.29 47.86 52.04 109.33 328.32 232.36 349.702014-15 109.17 245.11 19,756.94 45.31 53.38 122.94 382.92 291.53 419.792015-16 122.58 228.65 32,003.72 52.75 55.28 156.28 423.42 331.99 550.702016-17 205.06 220.73 31,336.57 45.64 52.86 149.28 468.47 86.52 524.312017-18 270.40 219.93 36,417.86 51.25 54.01 184.57 503.18 83.93 581.122018-19 318.66 257.07 40,922.63 44.72 52.97 130.07 272.51 81.78 567.32
Notes: These data should be read in conjunction with the explanatory notes and other turnover tables in this publication.
Figure(s) may be incomplete for any period or jurisdiction due to some unavailable turnover figures that are used to derive these numbers.
Rounding discrepancies may have small effects on totals.
AUSTRALIA
Value ($)
ACT NSW NT QLD SA TAS VIC WA
Australian Gambling Statistics, 1993–94 to 2018–2019, 36th edition
226

TABLE SPORTSBETTING 5TOTAL SPORTSBETTING EXPENDITURE
1994-95 - U 5.635 2.666 - 0.508 0.026 2.257 0.403 11.4951995-96 - U 4.892 2.676 0.700 0.547 0.029 3.724 0.448 13.0161996-97 - U 4.077 6.644 0.800 0.529 0.029 3.569 0.595 16.2431997-98 - U 5.880 10.450 0.600 0.773 0.032 6.166 0.838 24.7391998-99 - U 5.545 8.559 0.800 0.708 0.036 6.213 1.022 22.8831999-00 - U 15.769 16.689 2.206 0.767 0.190 7.660 1.229 44.5102000-01 - U 2.940 19.890 2.206 0.671 0.200 14.702 1.535 42.1442001-02 0.410 2.376 38.003 3.686 0.081 0.699 24.582 2.453 72.2902002-03 0.436 2.794 40.115 3.900 1.589 0.552 25.835 2.790 78.0112003-04 - U 37.063 62.720 6.499 2.681 0.504 36.195 4.209 149.8712004-05 - U 40.414 37.951 6.790 1.977 0.646 24.037 4.872 116.6872005-06 - U 52.472 41.730 9.471 2.912 0.873 29.318 7.481 144.2572006-07 - U 58.691 50.046 12.201 3.940 1.178 36.018 8.302 170.3762007-08 - U 69.007 67.900 13.680 4.177 2.252 39.770 8.740 205.5262008-09 - U 75.420 62.445 13.223 5.490 6.382 48.048 10.479 221.4872009-10 - U 92.634 83.984 15.965 7.613 0.917 83.168 19.224 303.5052010-11 - U 104.622 80.867 18.799 7.907 1.070 93.386 15.178 321.8292011-12 - U 108.531 112.383 20.372 8.954 1.098 128.438 16.955 396.7302012-13 - U 111.151 158.494 20.350 9.576 1.856 160.081 23.656 485.1642013-14 - U 122.009 203.113 20.914 10.135 2.886 213.501 53.393 625.9512014-15 - U 162.866 285.700 21.664 9.680 3.152 259.746 71.786 814.5942015-16 - U 151.981 380.556 15.723 7.717 3.258 280.945 80.454 920.6342016-17 - U 152.295 460.880 18.294 8.619 3.379 327.491 11.828 982.7862017-18 - U 177.695 551.244 20.815 9.692 3.268 371.699 15.796 1,150.2092018-19 - U 172.314 551.062 17.711 8.248 2.504 198.602 10.697 961.137
Notes: These data should be read in conjunction with the explanatory notes and other expenditure tables in this publication.
Figure(s) may be incomplete for any period or jurisdiction due to some unavailable expenditure figures that are used to derive these numbers.
Rounding discrepancies may have small effects on totals.
U = Unavailable data
AUSTRALIA
Value ($ million)
ACT NSW NT QLD SA TAS VIC WA
Australian Gambling Statistics, 1993–94 to 2018–2019, 36th edition
227

TABLE SPORTSBETTING 6REAL TOTAL SPORTSBETTING EXPENDITURE
1994-95 - U 10.141 4.798 - 0.914 0.047 4.062 0.725 20.6871995-96 - U 8.444 4.619 1.208 0.944 0.050 6.428 0.773 22.4681996-97 - U 6.943 11.315 1.362 0.901 0.049 6.078 1.013 27.6621997-98 - U 10.014 17.796 1.022 1.316 0.054 10.501 1.427 42.1301998-99 - U 9.332 14.404 1.346 1.191 0.061 10.456 1.720 38.5101999-00 - U 25.926 27.438 3.627 1.261 0.312 12.594 2.021 73.1792000-01 - U 4.558 30.835 3.420 1.040 0.310 22.792 2.380 65.3352001-02 0.618 3.581 57.281 5.556 0.122 1.054 37.052 3.697 108.9602002-03 0.638 4.087 58.681 5.705 2.324 0.807 37.792 4.081 114.1162003-04 - U 52.927 89.566 9.281 3.829 0.720 51.688 6.011 214.0212004-05 - U 56.372 52.937 9.471 2.758 0.901 33.528 6.796 162.7632005-06 - U 70.937 56.415 12.804 3.937 1.180 39.635 10.114 195.0212006-07 - U 77.061 65.711 16.020 5.173 1.547 47.292 10.901 223.7042007-08 - U 87.680 86.274 17.381 5.307 2.861 50.532 11.105 261.1412008-09 - U 92.931 76.944 16.293 6.765 7.864 59.203 12.912 272.9122009-10 - U 111.493 101.082 19.215 9.163 1.104 100.100 23.138 365.2942010-11 - U 122.184 94.441 21.955 9.234 1.250 109.062 17.726 375.8512011-12 - U 123.834 128.229 23.244 10.217 1.253 146.548 19.345 452.6692012-13 - U 123.972 176.776 22.697 10.681 2.070 178.546 26.385 541.1262013-14 - U 132.583 220.716 22.727 11.013 3.136 232.004 58.020 680.2002014-15 - U 173.998 305.228 23.145 10.342 3.367 277.500 76.693 870.2732015-16 - U 160.120 400.937 16.565 8.130 3.432 295.991 84.763 969.9392016-17 - U 157.685 477.191 18.941 8.924 3.499 339.081 12.247 1,017.5672017-18 - U 180.543 560.080 21.148 9.847 3.320 377.657 16.049 1,168.6452018-19 - U 172.314 551.062 17.711 8.248 2.504 198.602 10.697 961.137
Notes: These data should be read in conjunction with the explanatory notes and other expenditure tables in this publication.
Figure(s) may be incomplete for any period or jurisdiction due to some unavailable expenditure figures that are used to derive these numbers.
Rounding discrepancies may have small effects on totals.
U = Unavailable data
AUSTRALIA
Value ($ million)
ACT NSW NT QLD SA TAS VIC WA
Australian Gambling Statistics, 1993–94 to 2018–2019, 36th edition
228

TABLE SPORTSBETTING 7PER CAPITA TOTAL SPORTSBETTING EXPENDITURE
1994-95 - U 1.24 22.10 - 0.46 0.08 0.67 0.32 0.861995-96 - U 1.07 21.51 0.29 0.49 0.08 1.10 0.35 0.971996-97 - U 0.88 51.76 0.33 0.47 0.08 1.04 0.45 1.191997-98 - U 1.25 79.38 0.24 0.69 0.09 1.78 0.63 1.791998-99 - U 1.16 63.72 0.32 0.63 0.10 1.78 0.75 1.631999-00 - U 3.27 121.75 0.85 0.67 0.54 2.16 0.89 3.142000-01 - U 0.60 142.64 0.84 0.58 0.57 4.09 1.09 2.932001-02 1.68 0.48 269.58 1.37 0.07 1.97 6.75 1.71 4.952002-03 1.77 0.56 283.64 1.41 1.36 1.54 6.99 1.92 5.262003-04 - U 7.35 441.77 2.29 2.28 1.39 9.66 2.84 9.962004-05 - U 7.95 263.55 2.33 1.67 1.76 6.32 3.23 7.652005-06 - U 10.23 284.05 3.17 2.43 2.36 7.59 4.86 9.312006-07 - U 11.31 332.71 3.98 3.24 3.15 9.15 5.26 10.802007-08 - U 13.07 437.39 4.35 3.39 5.95 9.89 5.37 12.762008-09 - U 14.02 388.24 4.09 4.40 16.62 11.67 6.22 13.442009-10 - U 16.94 507.77 4.82 6.01 2.36 19.76 11.08 18.042010-11 - U 18.87 481.23 5.57 6.17 2.72 21.81 8.52 18.812011-12 - U 19.34 656.47 5.92 6.92 2.78 29.46 9.23 22.792012-13 - U 19.53 899.57 5.79 7.33 4.67 35.94 12.51 27.372013-14 - U 21.12 1,130.24 5.85 7.68 7.23 46.90 27.70 34.712014-15 - U 27.76 1,575.01 5.97 7.27 7.85 55.84 36.85 44.472015-16 - U 25.51 2,083.35 4.27 5.75 8.07 59.01 41.01 49.492016-17 - U 25.12 2,508.17 4.89 6.37 8.29 67.10 5.99 51.942017-18 - U 28.80 2,987.73 5.46 7.11 7.91 74.34 7.94 59.722018-19 - U 27.49 2,992.25 4.56 5.99 5.98 38.80 5.33 49.07
Notes: These data should be read in conjunction with the explanatory notes and other expenditure tables in this publication.
Figure(s) may be incomplete for any period or jurisdiction due to some unavailable expenditure figures that are used to derive these numbers.
Rounding discrepancies may have small effects on totals.
U = Unavailable data
Value ($)
TAS VIC WA AUSTRALIAACT NSW NT QLD SA
Australian Gambling Statistics, 1993–94 to 2018–2019, 36th edition
229

TABLE SPORTSBETTING 8REAL PER CAPITA TOTAL SPORTSBETTING EXPENDITURE
1994-95 - U 2.24 39.78 - 0.83 0.14 1.21 0.58 1.561995-96 - U 1.84 37.12 0.50 0.85 0.14 1.90 0.60 1.671996-97 - U 1.49 88.15 0.56 0.81 0.14 1.78 0.77 2.031997-98 - U 2.13 135.18 0.41 1.17 0.16 3.04 1.07 3.051998-99 - U 1.96 107.24 0.53 1.05 0.17 2.99 1.26 2.751999-00 - U 5.37 200.17 1.41 1.11 0.89 3.56 1.46 5.162000-01 - U 0.93 221.12 1.30 0.91 0.88 6.35 1.69 4.542001-02 2.54 0.72 406.33 2.06 0.11 2.97 10.17 2.58 7.452002-03 2.58 0.82 414.92 2.06 1.99 2.26 10.23 2.81 7.692003-04 - U 10.49 630.86 3.27 3.25 1.98 13.80 4.06 14.232004-05 - U 11.09 367.61 3.25 2.32 2.45 8.82 4.51 10.672005-06 - U 13.83 384.01 4.29 3.28 3.18 10.26 6.57 12.592006-07 - U 14.84 436.85 5.23 4.26 4.13 12.02 6.91 14.192007-08 - U 16.60 555.75 5.52 4.31 7.56 12.57 6.82 16.212008-09 - U 17.27 478.38 5.04 5.42 20.48 14.38 7.67 16.562009-10 - U 20.38 611.14 5.80 7.24 2.84 23.78 13.34 21.712010-11 - U 22.04 562.00 6.51 7.21 3.18 25.47 9.95 21.972011-12 - U 22.06 749.03 6.76 7.90 3.17 33.61 10.53 26.012012-13 - U 21.78 1,003.33 6.46 8.17 5.21 40.08 13.95 30.522013-14 - U 22.95 1,228.20 6.36 8.34 7.86 50.97 30.10 37.722014-15 - U 29.66 1,682.66 6.38 7.76 8.39 59.65 39.37 47.512015-16 - U 26.87 2,194.92 4.50 6.06 8.50 62.17 43.20 52.142016-17 - U 26.01 2,596.93 5.06 6.60 8.59 69.48 6.20 53.772017-18 - U 29.26 3,035.62 5.55 7.22 8.04 75.53 8.07 60.682018-19 - U 27.49 2,992.25 4.56 5.99 5.98 38.80 5.33 49.07
Notes: These data should be read in conjunction with the explanatory notes and other expenditure tables in this publication.
Figure(s) may be incomplete for any period or jurisdiction due to some unavailable expenditure figures that are used to derive these numbers.
Rounding discrepancies may have small effects on totals.
U = Unavailable data
Value ($)
TAS VIC WA AUSTRALIAACT NSW NT QLD SA
Australian Gambling Statistics, 1993–94 to 2018–2019, 36th edition
230

TABLE SPORTSBETTING 9TOTAL SPORTSBETTING EXPENDITURE AS A % OF HOUSEHOLD DISPOSABLE INCOME
(ALL STATES AND TERRITORIES)
1994-95 - U 0.005 0.088 - 0.002 0.000 0.003 0.001 0.0031995-96 - U 0.004 0.081 0.001 0.002 0.000 0.004 0.001 0.0041996-97 - U 0.003 0.190 0.001 0.002 0.000 0.004 0.002 0.0041997-98 - U 0.004 0.293 0.001 0.003 0.000 0.007 0.002 0.0061998-99 - U 0.004 0.220 0.001 0.002 0.000 0.006 0.003 0.0061999-00 - U 0.010 0.385 0.003 0.003 0.002 0.008 0.003 0.0112000-01 - U 0.002 0.411 0.003 0.002 0.002 0.013 0.004 0.0092001-02 0.003 0.001 0.714 0.004 0.000 0.007 0.020 0.005 0.0152002-03 0.003 0.002 0.757 0.004 0.004 0.005 0.021 0.006 0.0152003-04 - U 0.019 1.117 0.007 0.007 0.004 0.027 0.008 0.0272004-05 - U 0.019 0.594 0.006 0.005 0.005 0.017 0.008 0.0202005-06 - U 0.024 0.582 0.008 0.007 0.006 0.020 0.012 0.0232006-07 - U 0.025 0.647 0.009 0.008 0.008 0.022 0.012 0.0252007-08 - U 0.027 0.799 0.009 0.008 0.014 0.022 0.011 0.0272008-09 - U 0.028 0.652 0.008 0.009 0.036 0.025 0.011 0.0272009-10 - U 0.033 0.800 0.009 0.013 0.005 0.042 0.020 0.0352010-11 - U 0.034 0.726 0.010 0.012 0.006 0.044 0.014 0.0352011-12 - U 0.033 0.939 0.011 0.013 0.006 0.058 0.014 0.0402012-13 - U 0.033 1.238 0.011 0.014 0.010 0.070 0.019 0.0482013-14 - U 0.034 1.459 0.011 0.015 0.015 0.087 0.041 0.0592014-15 - U 0.044 1.906 0.010 0.013 0.015 0.104 0.052 0.0732015-16 - U 0.040 2.453 0.007 0.010 0.015 0.111 0.058 0.0812016-17 - U 0.039 2.905 0.008 0.011 0.015 0.124 0.009 0.0842017-18 - U 0.044 3.431 0.009 0.012 0.014 0.136 0.011 0.0962018-19 - U 0.041 3.522 0.008 0.010 0.010 0.070 0.008 0.078
Notes: These data should be read in conjunction with the explanatory notes and other expenditure tables in this publication.
Figure(s) may be incomplete for any period or jurisdiction due to some unavailable expenditure figures that are used to derive these numbers.
Rounding discrepancies may have small effects on totals.
U = Unavailable data
Percentage (%)
TAS VIC WA AUSTRALIAACT NSW NT QLD SA
Australian Gambling Statistics, 1993–94 to 2018–2019, 36th edition
231

TABLE SPORTSBETTING 10GOVERNMENT REVENUE FROM TOTAL SPORTSBETTING
1994-95 - 1.981 0.507 - 0.147 0.003 1.000 0.092 3.7301995-96 0.039 1.697 0.289 - 0.155 0.033 0.828 0.103 3.1441996-97 0.116 1.655 0.362 - 0.110 0.036 0.840 0.119 3.2381997-98 0.133 1.550 0.592 0.200 0.197 0.025 1.178 0.168 4.0431998-99 0.193 2.730 0.696 0.300 0.149 0.014 1.456 0.164 5.7021999-00 0.808 3.518 0.867 0.441 0.261 0.030 1.724 0.187 7.8362000-01 0.928 2.227 0.568 0.241 0.140 0.001 1.089 0.125 5.3192001-02 1.196 2.373 0.881 0.402 0.015 0.011 1.913 0.197 6.9882002-03 1.448 3.898 1.107 0.426 0.106 0.030 1.775 0.258 9.0482003-04 0.848 3.921 0.938 0.709 0.147 0.032 2.218 0.355 9.1682004-05 0.743 4.473 0.876 0.712 0.122 0.030 2.572 0.406 9.9342005-06 0.658 4.669 0.783 1.033 0.268 0.029 3.143 0.515 11.0982006-07 0.512 6.606 0.774 1.331 0.247 0.027 3.672 0.824 13.9932007-08 0.466 6.325 0.853 1.492 0.257 0.605 4.316 0.964 15.2782008-09 0.247 7.948 0.671 1.442 0.347 0.755 4.883 1.187 17.4802009-10 0.324 9.767 0.193 1.742 0.453 0.678 8.808 1.938 23.9022010-11 0.384 11.206 - 2.051 0.468 0.364 10.385 1.684 26.5422011-12 - 11.656 - 2.223 0.528 0.394 14.192 0.663 29.6562012-13 0.003 11.894 - 2.045 - 0.327 8.116 2.710 25.0952013-14 0.009 12.660 - 2.281 0.597 0.417 9.410 5.960 31.3342014-15 0.004 15.500 - 0.215 0.564 0.608 11.425 8.136 36.4522015-16 - 12.679 - 0.161 0.440 0.454 12.351 9.656 35.7412016-17 - 10.375 - 0.182 0.512 0.068 14.390 0.898 26.4262017-18 - 12.229 - 0.204 1.444 - 16.322 0.884 31.0832018-19 - 9.669 - - 1.230 - 8.716 1.544 21.159
Notes: These data should be read in conjunction with the explanatory notes and other revenue tables in this publication.
Figure(s) may be incomplete for any period or jurisdiction due to some unavailable revenue figures that are used to derive these numbers.
Data for the gambling revenue received by states and territories from 1 July 2000 onwards are not comparable with that of preceding years because of the impact
of changes brought about by the introduction of the GST.
Value ($ million)
TAS VIC WA AUSTRALIAACT NSW NT QLD SA
Australian Gambling Statistics, 1993–94 to 2018–2019, 36th edition
232

TABLE SPORTSBETTING 11REAL GOVERNMENT REVENUE FROM TOTAL SPORTSBETTING
1994-95 - 3.565 0.912 - 0.265 0.005 1.800 0.166 6.7131995-96 0.067 2.929 0.499 - 0.268 0.057 1.429 0.178 5.4271996-97 0.198 2.818 0.616 - 0.187 0.061 1.431 0.203 5.5141997-98 0.226 2.640 1.008 0.341 0.335 0.043 2.006 0.286 6.8851998-99 0.325 4.594 1.171 0.505 0.251 0.024 2.450 0.276 9.5961999-00 1.328 5.784 1.425 0.725 0.429 0.049 2.834 0.307 12.8822000-01 1.439 3.452 0.881 0.374 0.217 0.002 1.688 0.194 8.2462001-02 1.803 3.577 1.328 0.606 0.023 0.017 2.883 0.297 10.5332002-03 2.118 5.702 1.619 0.623 0.155 0.044 2.597 0.377 13.2362003-04 1.211 5.599 1.339 1.012 0.210 0.046 3.167 0.507 13.0922004-05 1.036 6.239 1.222 0.993 0.170 0.042 3.588 0.566 13.8572005-06 0.890 6.312 1.059 1.397 0.362 0.039 4.249 0.696 15.0042006-07 0.672 8.674 1.016 1.748 0.324 0.035 4.821 1.082 18.3732007-08 0.592 8.037 1.084 1.896 0.327 0.769 5.484 1.225 19.4132008-09 0.304 9.793 0.827 1.777 0.428 0.930 6.017 1.463 21.5392009-10 0.390 11.755 0.232 2.097 0.545 0.816 10.601 2.333 28.7692010-11 0.448 13.087 - 2.395 0.547 0.425 12.128 1.967 30.9982011-12 - 13.299 - 2.536 0.602 0.450 16.193 0.757 33.8382012-13 0.003 13.266 - 2.281 - 0.365 9.052 3.023 27.9902013-14 0.010 13.757 - 2.479 0.649 0.453 10.225 6.477 34.0492014-15 0.004 16.559 - 0.230 0.603 0.650 12.206 8.692 38.9442015-16 - 13.358 - 0.170 0.464 0.478 13.012 10.173 37.6552016-17 - 10.742 - 0.189 0.530 0.071 14.899 0.930 27.3612017-18 - 12.425 - 0.207 1.467 - 16.584 0.898 31.5822018-19 - 9.669 - - 1.230 - 8.716 1.544 21.159
Notes: These data should be read in conjunction with the explanatory notes and other revenue tables in this publication.
Figure(s) may be incomplete for any period or jurisdiction due to some unavailable revenue figures that are used to derive these numbers.
Data for the gambling revenue received by states and territories from 1 July 2000 onwards are not comparable with that of preceding years because of the impact
of changes brought about by the introduction of the GST.
Value ($ million)
TAS VIC WA AUSTRALIAACT NSW NT QLD SA
Australian Gambling Statistics, 1993–94 to 2018–2019, 36th edition
233

TABLE SPORTSBETTING 12PER CAPITA GOVERNMENT REVENUE FROM TOTAL SPORTSBETTING
1994-95 - 0.44 4.20 - 0.13 0.01 0.30 0.07 0.281995-96 0.17 0.37 2.32 - 0.14 0.09 0.24 0.08 0.231996-97 0.51 0.36 2.82 - 0.10 0.10 0.25 0.09 0.241997-98 0.58 0.33 4.50 0.08 0.18 0.07 0.34 0.13 0.291998-99 0.83 0.57 5.18 0.12 0.13 0.04 0.42 0.12 0.411999-00 3.43 0.73 6.33 0.17 0.23 0.08 0.49 0.14 0.552000-01 3.88 0.46 4.07 0.09 0.12 0.00 0.30 0.09 0.372001-02 4.91 0.48 6.25 0.15 0.01 0.03 0.53 0.14 0.482002-03 5.86 0.78 7.83 0.15 0.09 0.08 0.48 0.18 0.612003-04 3.39 0.78 6.61 0.25 0.12 0.09 0.59 0.24 0.612004-05 2.94 0.88 6.08 0.24 0.10 0.08 0.68 0.27 0.652005-06 2.57 0.91 5.33 0.35 0.22 0.08 0.81 0.33 0.722006-07 1.96 1.27 5.15 0.43 0.20 0.07 0.93 0.52 0.892007-08 1.74 1.20 5.49 0.47 0.21 1.60 1.07 0.59 0.952008-09 0.91 1.48 4.17 0.45 0.28 1.97 1.19 0.70 1.062009-10 1.16 1.79 1.17 0.53 0.36 1.74 2.09 1.12 1.422010-11 1.35 2.02 - 0.61 0.37 0.93 2.43 0.95 1.552011-12 - 2.08 - 0.65 0.41 1.00 3.25 0.36 1.702012-13 0.01 2.09 - 0.58 - 0.82 1.82 1.43 1.422013-14 0.03 2.19 - 0.64 0.45 1.04 2.07 3.09 1.742014-15 0.01 2.64 - 0.06 0.42 1.52 2.46 4.18 1.992015-16 - 2.13 - 0.04 0.33 1.12 2.59 4.92 1.922016-17 - 1.71 - 0.05 0.38 0.17 2.95 0.45 1.402017-18 - 1.98 - 0.05 1.06 - 3.26 0.44 1.612018-19 - 1.54 - - 0.89 - 1.70 0.77 1.08
Notes: These data should be read in conjunction with the explanatory notes and other revenue tables in this publication.
Figure(s) may be incomplete for any period or jurisdiction due to some unavailable revenue figures that are used to derive these numbers.
Data for the gambling revenue received by states and territories from 1 July 2000 onwards are not comparable with that of preceding years because of the impact
of changes brought about by the introduction of the GST.
Value ($)
TAS VIC WA AUSTRALIAACT NSW NT QLD SA
Australian Gambling Statistics, 1993–94 to 2018–2019, 36th edition
234

TABLE SPORTSBETTING 13REAL PER CAPITA GOVERNMENT REVENUE FROM TOTAL SPORTSBETTING
1994-95 - 0.79 7.56 - 0.24 0.02 0.54 0.13 0.511995-96 0.30 0.64 4.01 - 0.24 0.16 0.42 0.14 0.401996-97 0.87 0.61 4.80 - 0.17 0.18 0.42 0.15 0.401997-98 0.98 0.56 7.66 0.14 0.30 0.12 0.58 0.21 0.501998-99 1.40 0.96 8.72 0.20 0.22 0.07 0.70 0.20 0.691999-00 5.64 1.20 10.40 0.28 0.38 0.14 0.80 0.22 0.912000-01 6.01 0.71 6.31 0.14 0.19 0.01 0.47 0.14 0.572001-02 7.41 0.72 9.42 0.23 0.02 0.05 0.79 0.21 0.722002-03 8.58 1.14 11.45 0.23 0.13 0.12 0.70 0.26 0.892003-04 4.84 1.11 9.43 0.36 0.18 0.13 0.85 0.34 0.872004-05 4.10 1.23 8.49 0.34 0.14 0.11 0.94 0.38 0.912005-06 3.47 1.23 7.21 0.47 0.30 0.11 1.10 0.45 0.972006-07 2.57 1.67 6.76 0.57 0.27 0.09 1.23 0.69 1.172007-08 2.22 1.52 6.98 0.60 0.27 2.03 1.36 0.75 1.202008-09 1.12 1.82 5.14 0.55 0.34 2.42 1.46 0.87 1.312009-10 1.40 2.15 1.40 0.63 0.43 2.10 2.52 1.34 1.712010-11 1.58 2.36 - 0.71 0.43 1.08 2.83 1.10 1.812011-12 - 2.37 - 0.74 0.47 1.14 3.71 0.41 1.942012-13 0.01 2.33 - 0.65 - 0.92 2.03 1.60 1.582013-14 0.03 2.38 - 0.69 0.49 1.13 2.25 3.36 1.892014-15 0.01 2.82 - 0.06 0.45 1.62 2.62 4.46 2.132015-16 - 2.24 - 0.05 0.35 1.18 2.73 5.19 2.022016-17 - 1.77 - 0.05 0.39 0.17 3.05 0.47 1.452017-18 - 2.01 - 0.05 1.08 - 3.32 0.45 1.642018-19 - 1.54 - - 0.89 - 1.70 0.77 1.08
Notes: These data should be read in conjunction with the explanatory notes and other revenue tables in this publication.
Figure(s) may be incomplete for any period or jurisdiction due to some unavailable revenue figures that are used to derive these numbers.
Data for the gambling revenue received by states and territories from 1 July 2000 onwards are not comparable with that of preceding years because of the impact
of changes brought about by the introduction of the GST.
Value ($)
TAS VIC WA AUSTRALIAACT NSW NT QLD SA
Australian Gambling Statistics, 1993–94 to 2018–2019, 36th edition
235

TABLE SPORTSBETTING 14TOTAL SPORTSBETTING REVENUE
AS A % OF TOTAL STATE GAMBLING REVENUE
1994-95 - 0.18 3.16 - 0.08 0.01 0.11 0.041995-96 0.07 0.14 1.43 - 0.07 0.06 0.08 0.041996-97 0.25 0.13 1.46 - 0.04 0.06 0.07 0.061997-98 0.26 0.11 2.09 0.04 0.07 0.04 0.09 0.081998-99 0.35 0.19 2.23 0.05 0.05 0.02 0.10 0.081999-00 1.30 0.23 2.33 0.07 0.08 0.04 0.11 0.092000-01 1.94 0.19 1.85 0.05 0.05 0.00 0.09 0.062001-02 2.65 0.20 2.65 0.07 0.00 0.02 0.14 0.092002-03 3.02 0.31 3.10 0.07 0.03 0.04 0.13 0.112003-04 1.51 0.30 2.45 0.10 0.04 0.04 0.17 0.142004-05 1.33 0.31 1.92 0.09 0.03 0.04 0.19 0.152005-06 1.24 0.31 1.42 0.12 0.07 0.04 0.22 0.182006-07 0.95 0.40 1.22 0.16 0.06 0.03 0.25 0.252007-08 0.78 0.41 1.20 0.17 0.06 0.70 0.28 0.302008-09 0.44 0.48 0.92 0.16 0.08 0.84 0.30 0.332009-10 0.54 0.69 0.32 0.19 0.11 0.76 0.55 0.542010-11 0.73 0.64 - 0.22 0.11 0.44 0.64 0.462011-12 - 0.65 - 0.22 0.13 0.47 0.83 0.172012-13 0.01 0.64 - 0.20 - 0.40 0.52 0.642013-14 0.02 0.67 - 0.22 0.16 0.51 0.62 1.352014-15 0.01 0.75 - 0.02 0.15 0.73 0.71 1.872015-16 - 0.58 - 0.01 0.12 0.54 0.73 2.482016-17 - 0.47 - 0.02 0.14 0.09 0.88 0.242017-18 - 0.52 - 0.02 0.37 - 0.96 0.242018-19 - 0.39 - - 0.30 - 0.49 0.40
Notes: These data should be read in conjunction with the explanatory notes and other revenue tables in this publication.
Figure(s) may be incomplete for any period or jurisdiction due to some unavailable revenue figures that are used to derive these numbers.
Data for the gambling revenue received by states and territories from 1 July 2000 onwards are not comparable with that of preceding years because of the impact
of changes brought about by the introduction of the GST.
Percentage (%)
ACT NSW NT QLD SA TAS VIC WA
Australian Gambling Statistics, 1993–94 to 2018–2019, 36th edition
236

TABLE ALL GAMBLING 1TOTAL GAMBLING TURNOVER
1993-94 1,112.820 24,464.125 437.180 5,971.887 1,580.830 1,157.810 11,140.441 2,827.669 48,692.7621994-95 1,387.847 28,416.430 566.168 6,975.009 2,833.084 1,270.791 17,020.446 3,257.497 61,727.2721995-96 1,500.115 31,955.612 848.254 8,096.549 3,924.138 1,318.164 21,332.160 3,429.073 72,404.0651996-97 1,491.182 34,047.883 876.114 8,914.109 4,265.575 1,393.208 26,079.219 3,161.580 80,228.8701997-98 1,590.912 39,113.644 1,039.245 11,305.971 4,632.777 1,534.562 34,936.283 3,167.766 97,321.1601998-99 1,798.123 43,339.349 1,197.137 13,263.544 5,106.734 1,718.181 33,549.727 2,900.422 102,873.2171999-00 2,011.853 47,728.562 1,449.755 14,971.110 5,504.826 1,864.109 36,956.331 2,936.947 113,423.4932000-01 2,307.012 48,183.135 1,905.646 15,893.628 6,091.218 2,093.727 38,376.073 2,925.980 117,776.4192001-02 2,632.235 52,083.432 2,544.216 16,766.800 6,749.452 2,163.201 38,304.791 2,984.043 124,228.1712002-03 2,895.590 54,528.752 3,159.032 18,457.469 7,399.371 2,302.425 36,264.764 2,910.507 127,917.9102003-04 2,662.563 57,480.201 3,440.514 21,018.249 8,166.047 2,442.749 35,894.199 3,164.490 134,269.0122004-05 2,613.513 61,240.472 4,047.986 23,211.400 8,713.123 2,556.136 36,847.548 3,441.738 142,671.9162005-06 2,666.830 63,753.063 4,542.421 24,650.470 9,007.470 2,404.831 37,699.217 3,744.390 148,468.6922006-07 2,565.042 67,339.642 5,590.249 24,049.715 9,775.645 466.396 39,003.894 4,470.673 153,261.2562007-08 2,553.157 62,282.444 6,241.353 26,201.909 9,508.077 581.368 40,616.614 4,724.399 152,709.3222008-09 2,511.527 65,377.494 6,899.408 27,972.446 9,697.124 828.516 42,777.430 5,119.609 161,183.5542009-10 2,515.588 65,388.788 7,257.708 27,325.697 9,551.558 849.887 42,541.645 5,016.802 160,447.6732010-11 2,632.039 70,075.052 7,465.687 28,604.277 9,795.810 1,047.849 44,104.868 5,183.544 168,909.1262011-12 2,545.614 73,667.117 7,697.773 29,992.847 9,821.068 1,030.852 44,841.646 5,873.157 175,470.0742012-13 2,548.148 75,260.554 9,133.837 30,698.914 9,661.912 336.283 43,198.130 5,984.840 176,822.6172013-14 2,497.614 78,248.065 10,562.965 31,175.733 9,447.517 425.717 44,048.055 6,535.549 182,941.2142014-15 2,333.724 83,438.848 11,840.867 33,401.663 9,239.859 475.065 47,017.702 6,733.207 194,480.9352015-16 2,365.581 88,611.055 14,969.996 35,171.588 9,217.195 549.789 48,910.842 7,420.007 207,216.0532016-17 2,442.116 89,785.015 18,349.886 35,926.569 8,754.475 531.196 46,383.399 6,449.550 208,622.2062017-18 2,423.175 92,856.234 21,686.213 37,455.592 8,743.797 548.107 48,837.882 6,278.078 218,829.0782018-19 2,432.551 96,568.746 24,493.443 38,697.396 8,849.816 478.890 47,883.506 6,350.388 225,754.736
Notes: These data should be read in conjunction with the explanatory notes and other turnover tables in this publication.
Figure(s) may be incomplete for any period or jurisdiction due to some unavailable turnover figures that are used to derive these numbers.
Figures from 1994–95 include sportsbetting turnover following a major revision conducted for the 2001–02 edition.
Data may be affected by revised turnover figures.
AUSTRALIA
Value ($ million)
ACT NSW NT QLD SA TAS VIC WA
Australian Gambling Statistics, 1993–94 to 2018–2019, 36th edition
237

TABLE ALL GAMBLING 2REAL TOTAL GAMBLING TURNOVER
1993-94 2,067.960 45,461.835 812.414 11,097.594 2,937.666 2,151.565 20,702.350 5,254.675 90,486.0601994-95 2,497.686 51,140.610 1,018.924 12,552.816 5,098.657 2,287.023 30,631.434 5,862.467 111,089.6171995-96 2,589.457 55,160.898 1,464.233 13,976.040 6,773.739 2,275.378 36,822.987 5,919.171 124,981.9041996-97 2,539.461 57,983.037 1,492.009 15,180.595 7,264.211 2,372.613 44,412.521 5,384.124 136,628.5691997-98 2,709.299 66,609.952 1,769.819 19,253.900 7,889.550 2,613.336 59,495.969 5,394.658 165,736.4831998-99 3,026.045 72,935.393 2,014.651 22,321.097 8,594.076 2,891.511 56,460.529 4,881.094 173,124.3951999-00 3,307.672 78,470.157 2,383.531 24,613.885 9,050.442 3,064.768 60,759.616 4,828.612 186,478.6822000-01 3,576.496 74,696.952 2,954.269 24,639.442 9,443.043 3,245.846 59,493.341 4,536.064 182,585.4542001-02 3,967.477 78,503.561 3,834.810 25,272.020 10,173.216 3,260.519 57,735.491 4,497.745 187,244.8392002-03 4,235.728 79,765.777 4,621.097 26,999.964 10,823.952 3,368.035 53,048.841 4,257.549 187,120.9432003-04 3,802.233 82,083.741 4,913.175 30,014.796 11,661.401 3,488.331 51,258.174 4,519.003 191,740.8542004-05 3,645.499 85,422.223 5,646.396 32,376.782 12,153.635 3,565.466 51,397.374 4,800.762 199,008.1372005-06 3,605.276 86,187.494 6,140.880 33,324.865 12,177.160 3,251.081 50,965.411 5,062.025 200,714.1912006-07 3,367.909 88,417.182 7,340.016 31,577.359 12,835.456 612.380 51,212.247 5,870.009 201,232.5592007-08 3,244.045 79,136.157 7,930.272 33,292.181 12,080.975 738.687 51,607.524 6,002.828 194,032.6682008-09 3,094.657 80,556.934 8,501.323 34,467.128 11,948.616 1,020.882 52,709.555 6,308.287 198,607.3812009-10 3,027.728 78,701.062 8,735.279 32,888.840 11,496.126 1,022.913 51,202.549 6,038.155 193,112.6522010-11 3,073.855 81,837.906 8,718.883 33,405.814 11,440.142 1,223.742 51,508.346 6,053.658 197,262.3462011-12 2,904.546 84,054.180 8,783.159 34,221.838 11,205.839 1,176.202 51,164.318 6,701.272 200,211.3542012-13 2,842.069 83,941.635 10,187.397 34,239.942 10,776.385 375.072 48,180.906 6,675.173 197,218.5792013-14 2,714.074 85,029.564 11,478.422 33,877.630 10,266.302 462.612 47,865.553 7,101.963 198,796.1192014-15 2,493.239 89,142.065 12,650.214 35,684.735 9,871.422 507.537 50,231.459 7,193.436 207,774.1082015-16 2,492.270 93,356.615 15,771.714 37,055.200 9,710.821 579.233 51,530.259 7,817.385 218,313.4972016-17 2,528.543 92,962.525 18,999.292 37,198.018 9,064.298 549.995 48,024.916 6,677.801 216,005.3882017-18 2,462.015 94,344.580 22,033.810 38,055.949 8,883.947 556.892 49,620.680 6,378.706 222,336.5792018-19 2,432.551 96,568.746 24,493.443 38,697.396 8,849.816 478.890 47,883.506 6,350.388 225,754.736
Notes: These data should be read in conjunction with the explanatory notes and other turnover tables in this publication.
Figure(s) may be incomplete for any period or jurisdiction due to some unavailable turnover figures that are used to derive these numbers.
Figures from 1994–95 include sportsbetting turnover following a major revision conducted for the 2001–02 edition.
Data may be affected by revised turnover figures.
AUSTRALIA
Value ($ million)
ACT NSW NT QLD SA TAS VIC WA
Australian Gambling Statistics, 1993–94 to 2018–2019, 36th edition
238

TABLE ALL GAMBLING 3PER CAPITA TOTAL GAMBLING TURNOVER
1993-94 5,093.03 5,460.07 3,723.60 2,605.45 1,434.41 3,359.83 3,336.92 2,295.16 3,709.451994-95 6,259.77 6,273.63 4,693.91 2,968.48 2,560.47 3,669.30 5,068.23 2,591.69 4,644.171995-96 6,654.90 6,967.73 6,816.95 3,366.57 3,534.61 3,790.52 6,295.17 2,670.66 5,373.761996-97 6,536.17 7,326.92 6,825.34 3,632.97 3,822.66 3,993.42 7,616.39 2,411.58 5,873.721997-98 6,918.18 8,315.31 7,894.36 4,529.52 4,123.45 4,390.52 10,099.75 2,370.43 7,036.011998-99 7,738.31 9,102.52 8,912.87 5,227.84 4,513.07 4,907.43 9,591.72 2,132.29 7,344.661999-00 8,543.97 9,894.78 10,576.48 5,800.11 4,830.74 5,307.04 10,434.57 2,123.43 7,990.532000-01 9,637.43 9,849.77 13,665.83 6,041.64 5,308.38 5,937.07 10,685.44 2,080.11 8,178.202001-02 10,814.91 10,512.07 18,047.93 6,229.87 5,837.47 6,105.44 10,514.33 2,086.20 8,499.452002-03 11,725.39 10,898.67 22,336.52 6,676.45 6,344.14 6,433.13 9,815.73 2,001.78 8,625.312003-04 10,652.32 11,396.67 24,233.24 7,399.85 6,941.00 6,729.64 9,580.68 2,138.95 8,925.722004-05 10,339.61 12,048.20 28,111.01 7,966.85 7,339.38 6,959.98 9,695.04 2,283.43 9,351.102005-06 10,400.93 12,433.07 30,919.55 8,256.14 7,508.75 6,488.81 9,760.38 2,433.91 9,585.092006-07 9,808.64 12,971.43 37,164.51 7,852.86 8,050.53 1,246.49 9,910.71 2,833.23 9,718.782007-08 9,555.35 11,792.42 40,205.19 8,327.78 7,726.69 1,535.33 10,101.39 2,901.32 9,478.732008-09 9,209.82 12,149.99 42,895.83 8,649.61 7,769.42 2,157.76 10,388.05 3,039.36 9,777.622009-10 9,025.36 11,954.54 43,880.13 8,254.22 7,544.97 2,184.07 10,108.29 2,892.51 9,536.372010-11 9,244.55 12,641.92 44,427.24 8,479.30 7,649.73 2,664.85 10,301.84 2,908.51 9,872.582011-12 8,755.02 13,124.69 44,965.46 8,716.29 7,592.09 2,605.42 10,283.77 3,195.68 10,081.112012-13 8,594.47 13,224.33 51,841.28 8,739.95 7,392.58 846.68 9,697.34 3,163.98 9,973.662013-14 8,299.15 13,543.42 58,778.65 8,720.01 7,158.29 1,066.80 9,676.17 3,390.23 10,143.902014-15 7,638.38 14,223.70 65,276.52 9,207.30 6,937.09 1,183.78 10,107.29 3,456.36 10,617.912015-16 7,607.87 14,872.23 81,953.06 9,558.10 6,865.96 1,361.78 10,273.21 3,782.09 11,138.522016-17 7,701.77 14,808.16 99,862.24 9,602.62 6,473.20 1,303.43 9,503.84 3,267.48 11,024.592017-18 7,482.66 15,047.90 117,538.86 9,829.58 6,411.89 1,327.38 9,767.30 3,156.02 11,362.302018-19 7,384.76 15,404.51 132,998.72 9,970.72 6,429.31 1,143.18 9,355.86 3,163.25 11,525.04
Notes: These data should be read in conjunction with the explanatory notes and other turnover tables in this publication.
Figure(s) may be incomplete for any period or jurisdiction due to some unavailable turnover figures that are used to derive these numbers.
Figures from 1994–95 include sportsbetting turnover following a major revision conducted for the 2001–02 edition.
Data may be affected by revised turnover figures.
AUSTRALIA
Value ($)
ACT NSW NT QLD SA TAS VIC WA
Australian Gambling Statistics, 1993–94 to 2018–2019, 36th edition
239

TABLE ALL GAMBLING 4REAL PER CAPITA TOTAL GAMBLING TURNOVER
1993-94 9,464.41 10,146.49 6,919.58 4,841.73 2,665.57 6,243.59 6,201.02 4,265.11 6,893.301994-95 11,265.61 11,290.56 8,447.56 5,342.34 4,608.05 6,603.59 9,121.22 4,664.22 8,358.041995-96 11,487.51 12,027.50 11,767.24 5,811.29 6,101.35 6,543.10 10,866.55 4,610.01 9,276.031996-97 11,131.00 12,477.63 11,623.45 6,186.89 6,509.93 6,800.73 12,970.60 4,106.89 10,002.861997-98 11,781.56 14,160.84 13,443.98 7,713.70 7,022.18 7,476.99 17,199.72 4,036.80 11,982.211998-99 13,022.72 15,318.54 14,999.39 8,797.88 7,595.00 8,258.68 16,141.81 3,588.40 12,360.271999-00 14,047.08 16,267.93 17,388.71 9,535.92 7,942.18 8,725.27 17,155.39 3,491.11 13,137.172000-01 14,940.63 15,269.82 21,185.76 9,366.18 8,229.43 9,204.08 16,565.34 3,224.74 12,678.432001-02 16,300.94 15,844.49 27,203.02 9,390.07 8,798.62 9,202.52 15,847.88 3,144.46 12,810.922002-03 17,152.14 15,942.79 32,674.32 9,766.44 9,280.34 9,410.52 14,358.66 2,928.25 12,617.282003-04 15,211.88 16,274.85 34,605.91 10,567.24 9,912.00 9,610.16 13,681.55 3,054.50 12,746.242004-05 14,422.37 16,805.62 39,211.08 11,112.68 10,237.45 9,708.24 13,523.28 3,185.07 13,043.532005-06 14,060.97 16,808.21 41,800.00 11,161.44 10,151.05 8,772.19 13,195.02 3,290.40 12,958.042006-07 12,878.77 17,031.53 48,797.13 10,310.83 10,570.38 1,636.65 13,012.80 3,720.04 12,760.802007-08 12,141.04 14,983.46 51,084.77 10,581.29 9,817.54 1,950.79 12,834.84 3,686.42 12,043.682008-09 11,348.17 14,970.99 52,855.44 10,657.89 9,573.34 2,658.75 12,799.97 3,745.05 12,047.802009-10 10,862.80 14,388.32 52,813.53 9,934.67 9,081.02 2,628.71 12,166.20 3,481.38 11,477.852010-11 10,796.35 14,764.01 51,884.83 9,902.64 8,933.82 3,112.17 12,031.11 3,396.74 11,529.792011-12 9,989.48 14,975.27 51,305.59 9,945.29 8,662.57 2,972.79 11,733.78 3,646.27 11,502.552012-13 9,585.81 14,749.72 57,821.01 9,748.08 8,245.29 944.35 10,815.90 3,528.94 11,124.092013-14 9,018.41 14,717.19 63,872.80 9,475.74 7,778.67 1,159.26 10,514.77 3,684.05 11,023.042014-15 8,160.48 15,195.92 69,738.30 9,836.63 7,411.25 1,264.69 10,798.15 3,692.61 11,343.672015-16 8,015.31 15,668.71 86,342.05 10,069.98 7,233.66 1,434.71 10,823.39 3,984.64 11,735.052016-17 7,974.34 15,332.23 103,396.38 9,942.45 6,702.29 1,349.56 9,840.18 3,383.12 11,414.762017-18 7,602.60 15,289.10 119,422.83 9,987.13 6,514.66 1,348.66 9,923.86 3,206.60 11,544.422018-19 7,384.76 15,404.51 132,998.72 9,970.72 6,429.31 1,143.18 9,355.86 3,163.25 11,525.04
Notes: These data should be read in conjunction with the explanatory notes and other turnover tables in this publication.
Figure(s) may be incomplete for any period or jurisdiction due to some unavailable turnover figures that are used to derive these numbers.
Figures from 1994–95 include sportsbetting turnover following a major revision conducted for the 2001–02 edition.
Data may be affected by revised turnover figures.
AUSTRALIA
Value ($)
ACT NSW NT QLD SA TAS VIC WA
Australian Gambling Statistics, 1993–94 to 2018–2019, 36th edition
240
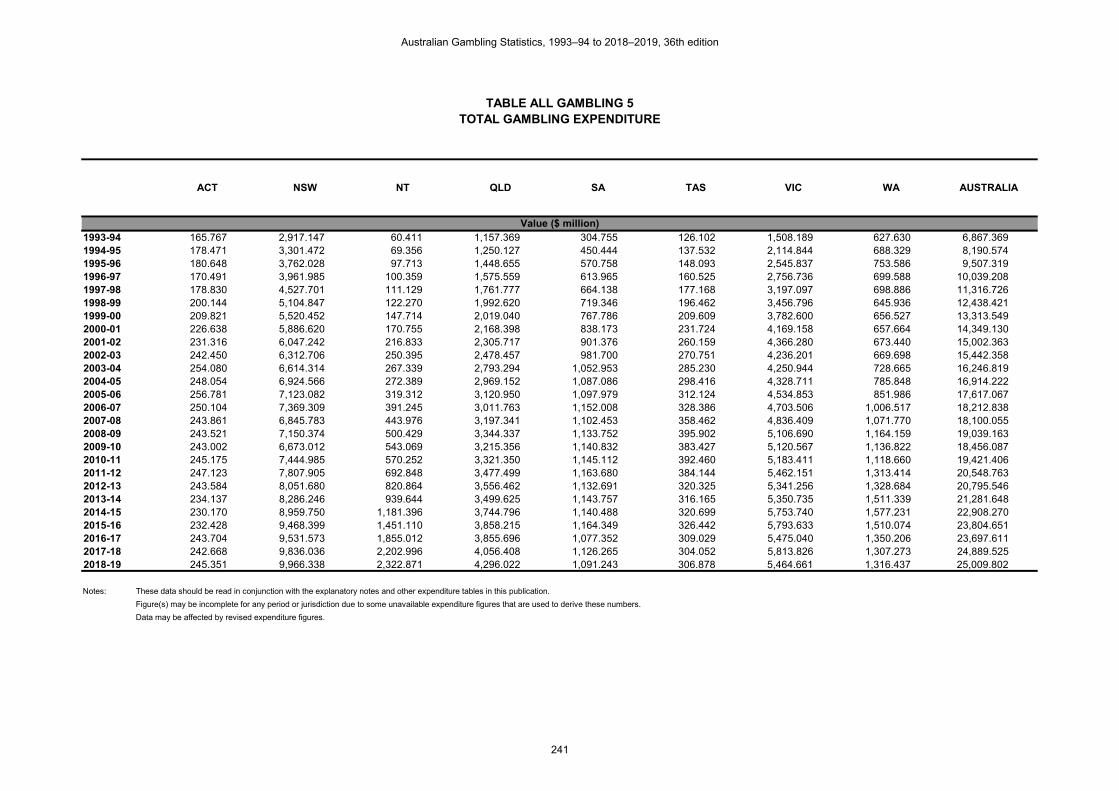
TABLE ALL GAMBLING 5TOTAL GAMBLING EXPENDITURE
1993-94 165.767 2,917.147 60.411 1,157.369 304.755 126.102 1,508.189 627.630 6,867.3691994-95 178.471 3,301.472 69.356 1,250.127 450.444 137.532 2,114.844 688.329 8,190.5741995-96 180.648 3,762.028 97.713 1,448.655 570.758 148.093 2,545.837 753.586 9,507.3191996-97 170.491 3,961.985 100.359 1,575.559 613.965 160.525 2,756.736 699.588 10,039.2081997-98 178.830 4,527.701 111.129 1,761.777 664.138 177.168 3,197.097 698.886 11,316.7261998-99 200.144 5,104.847 122.270 1,992.620 719.346 196.462 3,456.796 645.936 12,438.4211999-00 209.821 5,520.452 147.714 2,019.040 767.786 209.609 3,782.600 656.527 13,313.5492000-01 226.638 5,886.620 170.755 2,168.398 838.173 231.724 4,169.158 657.664 14,349.1302001-02 231.316 6,047.242 216.833 2,305.717 901.376 260.159 4,366.280 673.440 15,002.3632002-03 242.450 6,312.706 250.395 2,478.457 981.700 270.751 4,236.201 669.698 15,442.3582003-04 254.080 6,614.314 267.339 2,793.294 1,052.953 285.230 4,250.944 728.665 16,246.8192004-05 248.054 6,924.566 272.389 2,969.152 1,087.086 298.416 4,328.711 785.848 16,914.2222005-06 256.781 7,123.082 319.312 3,120.950 1,097.979 312.124 4,534.853 851.986 17,617.0672006-07 250.104 7,369.309 391.245 3,011.763 1,152.008 328.386 4,703.506 1,006.517 18,212.8382007-08 243.861 6,845.783 443.976 3,197.341 1,102.453 358.462 4,836.409 1,071.770 18,100.0552008-09 243.521 7,150.374 500.429 3,344.337 1,133.752 395.902 5,106.690 1,164.159 19,039.1632009-10 243.002 6,673.012 543.069 3,215.356 1,140.832 383.427 5,120.567 1,136.822 18,456.0872010-11 245.175 7,444.985 570.252 3,321.350 1,145.112 392.460 5,183.411 1,118.660 19,421.4062011-12 247.123 7,807.905 692.848 3,477.499 1,163.680 384.144 5,462.151 1,313.414 20,548.7632012-13 243.584 8,051.680 820.864 3,556.462 1,132.691 320.325 5,341.256 1,328.684 20,795.5462013-14 234.137 8,286.246 939.644 3,499.625 1,143.757 316.165 5,350.735 1,511.339 21,281.6482014-15 230.170 8,959.750 1,181.396 3,744.796 1,140.488 320.699 5,753.740 1,577.231 22,908.2702015-16 232.428 9,468.399 1,451.110 3,858.215 1,164.349 326.442 5,793.633 1,510.074 23,804.6512016-17 243.704 9,531.573 1,855.012 3,855.696 1,077.352 309.029 5,475.040 1,350.206 23,697.6112017-18 242.668 9,836.036 2,202.996 4,056.408 1,126.265 304.052 5,813.826 1,307.273 24,889.5252018-19 245.351 9,966.338 2,322.871 4,296.022 1,091.243 306.878 5,464.661 1,316.437 25,009.802
Notes: These data should be read in conjunction with the explanatory notes and other expenditure tables in this publication.
Figure(s) may be incomplete for any period or jurisdiction due to some unavailable expenditure figures that are used to derive these numbers.
Data may be affected by revised expenditure figures.
AUSTRALIA
Value ($ million)
ACT NSW NT QLD SA TAS VIC WA
Australian Gambling Statistics, 1993–94 to 2018–2019, 36th edition
241

TABLE ALL GAMBLING 6REAL TOTAL GAMBLING EXPENDITURE
1993-94 308.046 5,420.951 112.262 2,150.746 566.328 234.336 2,802.677 1,166.329 12,761.6741994-95 321.192 5,941.608 124.818 2,249.835 810.657 247.514 3,806.051 1,238.775 14,740.4501995-96 311.829 6,493.909 168.670 2,500.629 985.227 255.635 4,394.554 1,300.820 16,411.2721996-97 290.344 6,747.201 170.910 2,683.153 1,045.573 273.371 4,694.681 1,191.387 17,096.6211997-98 304.545 7,710.607 189.251 3,000.280 1,131.017 301.714 5,444.608 1,190.192 19,272.2151998-99 336.821 8,590.900 205.767 3,353.362 1,210.581 330.624 5,817.410 1,087.040 20,932.5051999-00 344.965 9,076.132 242.855 3,319.488 1,262.311 344.617 6,218.943 1,079.391 21,888.7022000-01 351.350 9,125.861 264.717 3,361.606 1,299.396 359.235 6,463.328 1,019.558 22,245.0502001-02 348.655 9,114.799 326.825 3,475.328 1,358.613 392.128 6,581.143 1,015.053 22,612.5442002-03 354.661 9,234.356 366.283 3,625.538 1,436.051 396.060 6,196.802 979.648 22,589.3982003-04 362.835 9,445.472 381.769 3,988.922 1,503.654 407.318 6,070.497 1,040.559 23,201.0272004-05 346.002 9,658.838 379.946 4,141.568 1,516.339 416.250 6,037.970 1,096.152 23,593.0652005-06 347.141 9,629.664 431.676 4,219.198 1,484.353 421.959 6,130.648 1,151.797 23,816.4372006-07 328.387 9,675.928 513.705 3,954.456 1,512.590 431.172 6,175.719 1,321.560 23,913.5192007-08 309.850 8,698.261 564.116 4,062.546 1,400.778 455.462 6,145.148 1,361.792 22,997.9552008-09 300.062 8,810.558 616.619 4,120.830 1,396.988 487.823 6,292.368 1,434.455 23,459.7032009-10 292.474 8,031.547 653.631 3,869.959 1,373.090 461.488 6,163.045 1,368.264 22,213.4972010-11 286.330 8,694.706 665.975 3,878.874 1,337.331 458.339 6,053.503 1,306.439 22,681.4982011-12 281.967 8,908.820 790.539 3,967.826 1,327.759 438.308 6,232.314 1,498.605 23,446.1392012-13 271.681 8,980.417 915.549 3,966.689 1,263.344 357.274 5,957.354 1,481.944 23,194.2512013-14 254.429 9,004.387 1,021.080 3,802.926 1,242.882 343.566 5,814.466 1,642.322 23,126.0572014-15 245.903 9,572.167 1,262.147 4,000.761 1,218.443 342.620 6,147.019 1,685.038 24,474.0982015-16 244.876 9,975.479 1,528.825 4,064.842 1,226.706 343.925 6,103.910 1,590.946 25,079.5072016-17 252.329 9,868.897 1,920.661 3,992.149 1,115.480 319.965 5,668.803 1,397.990 24,536.2742017-18 246.558 9,993.693 2,238.307 4,121.426 1,144.318 308.926 5,907.013 1,328.227 25,288.4672018-19 245.351 9,966.338 2,322.871 4,296.022 1,091.243 306.878 5,464.661 1,316.437 25,009.802
Notes: These data should be read in conjunction with the explanatory notes and other expenditure tables in this publication.
Figure(s) may be incomplete for any period or jurisdiction due to some unavailable expenditure figures that are used to derive these numbers.
Data may be affected by revised expenditure figures.
AUSTRALIA
Value ($ million)
ACT NSW NT QLD SA TAS VIC WA
Australian Gambling Statistics, 1993–94 to 2018–2019, 36th edition
242

TABLE ALL GAMBLING 7PER CAPITA TOTAL GAMBLING EXPENDITURE
1993-94 758.66 651.07 514.54 504.94 276.53 365.93 451.75 509.43 523.161994-95 804.98 728.88 575.00 532.04 407.10 397.11 629.74 547.64 616.231995-96 801.40 820.29 785.27 602.36 514.10 425.86 751.28 586.91 705.621996-97 747.30 852.60 781.84 642.12 550.21 460.12 805.10 533.63 734.991997-98 777.65 962.56 844.16 705.82 591.12 506.89 924.25 522.97 818.161998-99 861.33 1,072.17 910.32 785.39 635.72 561.13 988.28 474.87 888.041999-00 891.07 1,144.46 1,077.62 782.22 673.77 596.75 1,068.01 474.67 937.922000-01 946.77 1,203.36 1,224.52 824.27 730.45 657.09 1,160.86 467.54 996.382001-02 950.39 1,220.52 1,538.15 856.71 779.58 734.28 1,198.51 470.82 1,026.432002-03 981.78 1,261.72 1,770.46 896.51 841.70 756.50 1,146.61 460.60 1,041.252003-04 1,016.52 1,311.43 1,883.00 983.43 894.99 785.79 1,134.64 492.52 1,080.032004-05 981.35 1,362.31 1,891.59 1,019.10 915.69 812.54 1,138.94 521.37 1,108.602005-06 1,001.47 1,389.14 2,173.50 1,045.29 915.29 842.19 1,174.08 553.80 1,137.352006-07 956.39 1,419.53 2,601.03 983.42 948.71 877.65 1,195.14 637.87 1,154.932007-08 912.67 1,296.16 2,859.98 1,016.21 895.90 946.66 1,202.82 658.19 1,123.482008-09 893.00 1,328.85 3,111.33 1,034.13 908.37 1,031.07 1,240.11 691.13 1,154.942009-10 871.84 1,219.98 3,283.40 971.26 901.17 985.34 1,216.69 655.45 1,096.962010-11 861.13 1,343.12 3,393.49 984.56 894.24 998.09 1,210.72 627.69 1,135.162011-12 849.92 1,391.07 4,047.17 1,010.60 899.57 970.90 1,252.66 714.65 1,180.572012-13 821.57 1,414.79 4,659.01 1,012.52 866.65 806.51 1,199.03 702.43 1,172.972013-14 778.00 1,434.21 5,228.74 978.86 866.61 792.28 1,175.41 783.99 1,180.052014-15 753.36 1,527.36 6,512.82 1,032.27 856.25 799.13 1,236.87 809.64 1,250.702015-16 747.50 1,589.15 7,944.09 1,048.49 867.33 808.57 1,216.89 769.71 1,279.582016-17 768.58 1,572.03 10,095.19 1,030.57 796.61 758.29 1,121.82 684.04 1,252.292017-18 749.35 1,593.99 11,940.20 1,064.54 825.90 736.34 1,162.73 657.17 1,292.342018-19 744.84 1,589.82 12,613.13 1,106.91 792.78 732.56 1,067.73 655.74 1,276.78
Notes: These data should be read in conjunction with the explanatory notes and other expenditure tables in this publication.
Figure(s) may be incomplete for any period or jurisdiction due to some unavailable expenditure figures that are used to derive these numbers.
Data may be affected by revised expenditure figures.
AUSTRALIA
Value ($)
ACT NSW NT QLD SA TAS VIC WA
Australian Gambling Statistics, 1993–94 to 2018–2019, 36th edition
243

TABLE ALL GAMBLING 8REAL PER CAPITA TOTAL GAMBLING EXPENDITURE
1993-94 1,409.83 1,209.89 956.17 938.34 513.87 680.01 839.49 946.69 972.191994-95 1,448.71 1,311.76 1,034.83 957.50 732.65 714.68 1,133.34 985.58 1,109.031995-96 1,383.36 1,415.96 1,355.50 1,039.77 887.43 735.11 1,296.84 1,013.11 1,218.031996-97 1,272.64 1,451.96 1,331.47 1,093.53 937.01 783.58 1,371.07 908.76 1,251.681997-98 1,324.33 1,639.22 1,437.60 1,202.00 1,006.67 863.23 1,573.98 890.62 1,393.321998-99 1,449.52 1,804.34 1,531.97 1,321.73 1,069.85 944.32 1,663.17 799.15 1,494.481999-00 1,465.00 1,881.61 1,771.71 1,286.04 1,107.74 981.11 1,755.91 780.41 1,542.032000-01 1,467.75 1,865.54 1,898.35 1,277.85 1,132.40 1,018.66 1,799.65 724.82 1,544.662001-02 1,432.50 1,839.65 2,318.40 1,291.29 1,175.04 1,106.75 1,806.47 709.64 1,547.112002-03 1,436.16 1,845.67 2,589.87 1,311.43 1,231.26 1,106.62 1,677.28 673.78 1,523.172003-04 1,451.62 1,872.77 2,688.99 1,404.37 1,278.08 1,122.14 1,620.30 703.34 1,542.322004-05 1,368.86 1,900.24 2,638.51 1,421.51 1,277.27 1,133.39 1,588.66 727.24 1,546.352005-06 1,353.89 1,877.97 2,938.35 1,413.13 1,237.38 1,138.55 1,587.23 748.69 1,537.582006-07 1,255.74 1,863.84 3,415.16 1,291.23 1,245.66 1,152.35 1,569.22 837.52 1,516.432007-08 1,159.63 1,646.91 3,633.89 1,291.20 1,138.34 1,202.82 1,528.30 836.30 1,427.492008-09 1,100.33 1,637.39 3,833.72 1,274.24 1,119.28 1,270.47 1,528.04 851.59 1,423.102009-10 1,049.33 1,468.35 3,951.85 1,168.99 1,084.63 1,185.95 1,464.40 788.89 1,320.282010-11 1,005.68 1,568.57 3,963.13 1,149.83 1,044.35 1,165.63 1,413.95 733.05 1,325.712011-12 969.76 1,587.21 4,617.82 1,153.10 1,026.41 1,107.80 1,429.29 815.41 1,347.032012-13 916.33 1,577.98 5,196.42 1,129.31 966.62 899.53 1,337.34 783.45 1,308.272013-14 845.42 1,558.51 5,681.90 1,063.70 941.72 860.94 1,277.28 851.93 1,282.322014-15 804.85 1,631.75 6,957.98 1,102.82 914.78 853.75 1,321.41 864.98 1,336.192015-16 787.54 1,674.26 8,369.53 1,104.65 913.78 851.87 1,282.06 810.93 1,348.102016-17 795.78 1,627.67 10,452.46 1,067.04 824.80 785.12 1,161.52 708.25 1,296.612017-18 761.36 1,619.54 12,131.58 1,081.60 839.14 748.14 1,181.37 667.71 1,313.062018-19 744.84 1,589.82 12,613.13 1,106.91 792.78 732.56 1,067.73 655.74 1,276.78
Notes: These data should be read in conjunction with the explanatory notes and other expenditure tables in this publication.
Figure(s) may be incomplete for any period or jurisdiction due to some unavailable expenditure figures that are used to derive these numbers.
Data may be affected by revised expenditure figures.
AUSTRALIA
Value ($)
ACT NSW NT QLD SA TAS VIC WA
Australian Gambling Statistics, 1993–94 to 2018–2019, 36th edition
244

TABLE ALL GAMBLING 9TOTAL GAMBLING EXPENDITURE AS A % OF HOUSEHOLD DISPOSABLE INCOME
(ALL STATES AND TERRITORIES)
1993-94 2.222 2.537 2.273 2.259 1.242 1.827 1.978 2.241 2.2011994-95 2.284 2.730 2.280 2.280 1.777 1.897 2.649 2.285 2.4881995-96 2.222 2.917 2.960 2.480 2.129 1.945 3.016 2.373 2.7211996-97 2.001 2.889 2.866 2.500 2.220 2.063 3.132 2.095 2.7211997-98 2.069 3.177 3.115 2.696 2.307 2.238 3.458 2.003 2.9461998-99 2.197 3.448 3.141 2.941 2.496 2.449 3.550 1.749 3.1101999-00 2.078 3.502 3.404 2.827 2.523 2.489 3.710 1.681 3.1452000-01 1.928 3.407 3.532 2.760 2.523 2.643 3.739 1.578 3.0982001-02 1.924 3.421 4.074 2.639 2.451 2.651 3.618 1.417 3.0232002-03 1.793 3.488 4.727 2.788 2.610 2.653 3.370 1.358 3.0192003-04 1.765 3.396 4.759 2.817 2.595 2.523 3.200 1.354 2.9412004-05 1.607 3.311 4.264 2.686 2.561 2.416 3.059 1.364 2.8412005-06 1.568 3.276 4.454 2.575 2.486 2.317 3.037 1.395 2.7952006-07 1.384 3.153 5.060 2.201 2.392 2.249 2.921 1.434 2.6382007-08 1.202 2.715 5.222 2.124 2.092 2.239 2.735 1.308 2.3852008-09 1.086 2.617 5.228 1.986 1.923 2.231 2.656 1.266 2.2812009-10 1.005 2.350 5.173 1.855 1.875 2.095 2.581 1.182 2.1322010-11 0.903 2.424 5.118 1.801 1.764 2.081 2.446 1.056 2.0852011-12 0.835 2.397 5.790 1.799 1.744 2.010 2.477 1.119 2.0882012-13 0.756 2.414 6.409 1.840 1.675 1.703 2.322 1.065 2.0532013-14 0.709 2.333 6.751 1.761 1.651 1.631 2.177 1.151 1.9952014-15 0.690 2.410 7.883 1.801 1.502 1.522 2.305 1.142 2.0592015-16 0.678 2.477 9.355 1.801 1.480 1.480 2.291 1.085 2.0902016-17 0.681 2.426 11.692 1.760 1.329 1.366 2.076 0.992 2.0302017-18 0.666 2.433 13.713 1.790 1.352 1.303 2.125 0.943 2.0702018-19 0.652 2.394 14.847 1.828 1.286 1.262 1.935 0.942 2.023
Notes: These data should be read in conjunction with the explanatory notes and other expenditure tables in this publication.
Figure(s) may be incomplete for any period or jurisdiction due to some unavailable expenditure figures that are used to derive these numbers.
Data may be affected by revised expenditure figures.
Percentage (%)
TAS VIC WA AUSTRALIAACT NSW NT QLD SA
Australian Gambling Statistics, 1993–94 to 2018–2019, 36th edition
245

TABLE ALL GAMBLING 10GOVERNMENT REVENUE FROM TOTAL GAMBLING
1993-94 47.409 1,009.474 13.505 335.687 130.242 45.047 744.605 185.964 2,511.9331994-95 51.729 1,081.050 16.019 385.331 180.846 50.008 905.151 206.065 2,876.1991995-96 53.005 1,188.225 20.243 416.660 224.962 52.105 1,051.300 229.298 3,235.7981996-97 46.366 1,236.626 24.809 444.969 248.182 60.677 1,157.245 205.121 3,423.9951997-98 50.328 1,348.545 28.272 508.523 283.350 62.939 1,296.368 216.877 3,795.2021998-99 54.484 1,405.292 31.239 587.368 316.257 67.282 1,407.908 208.973 4,078.8031999-00 62.068 1,542.517 37.199 613.887 340.928 73.538 1,520.123 209.232 4,399.4922000-01 47.741 1,191.521 30.744 509.764 298.544 57.199 1,276.330 219.159 3,631.0022001-02 45.048 1,198.902 33.191 563.338 305.364 64.115 1,369.957 223.495 3,803.4102002-03 47.985 1,261.422 35.684 632.697 351.493 70.225 1,325.690 230.674 3,955.8702003-04 56.143 1,314.910 38.350 719.919 391.321 76.185 1,324.235 249.087 4,170.1502004-05 55.941 1,428.441 45.576 800.482 406.695 78.415 1,368.975 266.720 4,451.2452005-06 53.125 1,522.081 55.172 841.114 406.575 75.070 1,440.340 283.382 4,676.8582006-07 54.125 1,656.709 63.299 817.254 429.723 81.435 1,486.546 325.767 4,914.8582007-08 59.791 1,550.924 71.314 880.116 414.052 86.018 1,568.293 320.449 4,950.9572008-09 56.661 1,660.580 73.148 926.815 417.029 89.436 1,631.579 357.587 5,212.8352009-10 59.956 1,419.446 60.591 922.594 408.301 89.324 1,609.944 359.449 4,929.6062010-11 52.698 1,748.346 49.985 947.574 409.130 83.414 1,628.882 363.060 5,283.0892011-12 53.304 1,791.361 53.137 1,004.003 418.234 83.434 1,710.420 400.458 5,514.3512012-13 56.824 1,858.188 53.215 1,040.570 422.292 81.991 1,557.351 421.890 5,492.3212013-14 54.889 1,889.192 58.040 1,045.522 381.753 82.134 1,511.998 442.156 5,465.6842014-15 49.765 2,072.669 68.444 1,083.036 381.443 83.148 1,614.329 436.122 5,788.9562015-16 50.387 2,200.686 83.971 1,139.606 380.805 84.791 1,680.805 388.965 6,010.0162016-17 49.722 2,230.983 82.566 1,137.787 357.784 78.727 1,636.096 368.311 5,941.9772017-18 48.895 2,330.259 94.339 1,188.145 393.390 77.198 1,704.193 362.903 6,199.3222018-19 51.683 2,495.582 96.310 1,268.602 409.716 83.536 1,777.999 383.781 6,567.210
Notes: These data should be read in conjunction with the explanatory notes and other revenue tables in this publication.
Figure(s) may be incomplete for any period or jurisdiction due to some unavailable revenue figures that are used to derive these numbers.
Data for the gambling revenue received by states and territories from 1 July 2000 onwards are not comparable with that of preceding years because of the impact
of changes brought about by the introduction of the GST.
Data may be affected by revised revenue figures.
AUSTRALIA
Value ($ million)
ACT NSW NT QLD SA TAS VIC WA
Australian Gambling Statistics, 1993–94 to 2018–2019, 36th edition
246

TABLE ALL GAMBLING 11REAL GOVERNMENT REVENUE FROM TOTAL GAMBLING
1993-94 88.100 1,875.912 25.096 623.809 242.030 83.711 1,383.704 345.578 4,667.9411994-95 93.096 1,945.549 28.829 693.474 325.466 89.999 1,628.986 370.852 5,176.2511995-96 91.496 2,051.081 34.943 719.227 388.323 89.942 1,814.725 395.808 5,585.5451996-97 78.961 2,105.956 42.249 757.776 422.650 103.332 1,970.771 349.318 5,831.0121997-98 85.708 2,296.552 48.147 866.007 482.541 107.184 2,207.695 369.338 6,463.1721998-99 91.691 2,364.953 52.572 988.476 532.226 113.228 2,369.355 351.679 6,864.1801999-00 102.046 2,536.040 61.159 1,009.287 560.517 120.903 2,499.222 343.997 7,233.1702000-01 74.012 1,847.181 47.662 790.273 462.824 88.674 1,978.658 339.756 5,629.0402001-02 67.899 1,807.064 50.027 849.100 460.265 96.638 2,064.889 336.866 5,732.7482002-03 70.193 1,845.234 52.199 925.522 514.171 102.727 1,939.247 337.435 5,786.7282003-04 80.174 1,877.738 54.765 1,028.070 558.820 108.795 1,891.054 355.705 5,955.1202004-05 78.030 1,992.483 63.572 1,116.565 567.285 109.378 1,909.536 372.039 6,208.8882005-06 71.819 2,057.695 74.586 1,137.098 549.647 101.487 1,947.190 383.103 6,322.6252006-07 71.066 2,175.265 83.112 1,073.058 564.228 106.924 1,951.840 427.733 6,453.2262007-08 75.971 1,970.606 90.612 1,118.277 526.095 109.295 1,992.675 407.163 6,290.6932008-09 69.817 2,046.136 90.132 1,142.004 513.855 110.201 2,010.401 440.612 6,423.1592009-10 72.162 1,708.426 72.927 1,110.422 491.426 107.509 1,937.707 432.628 5,933.2072010-11 61.544 2,041.825 58.375 1,106.635 477.807 97.416 1,902.307 424.004 6,169.9122011-12 60.820 2,043.943 60.629 1,145.567 477.205 95.198 1,951.589 456.923 6,291.8742012-13 63.378 2,072.524 59.353 1,160.597 471.002 91.448 1,736.987 470.554 6,125.8432013-14 59.646 2,052.922 63.070 1,136.134 414.838 89.252 1,643.038 480.476 5,939.3772014-15 53.167 2,214.340 73.122 1,157.064 407.515 88.832 1,724.672 465.932 6,184.643
2015-16 53.085 2,318.544 88.468 1,200.638 401.199 89.332 1,770.820 409.796 6,331.8822016-17 51.482 2,309.938 85.488 1,178.054 370.446 81.514 1,693.998 381.346 6,152.2642017-18 49.679 2,367.610 95.851 1,207.189 399.695 78.435 1,731.509 368.720 6,298.6872018-19 51.683 2,495.582 96.310 1,268.602 409.716 83.536 1,777.999 383.781 6,567.210
Notes: These data should be read in conjunction with the explanatory notes and other revenue tables in this publication.
Figure(s) may be incomplete for any period or jurisdiction due to some unavailable revenue figures that are used to derive these numbers.
Data for the gambling revenue received by states and territories from 1 July 2000 onwards are not comparable with that of preceding years because of the impact
of changes brought about by the introduction of the GST.
Data may be affected by revised revenue figures.
AUSTRALIA
Value ($ million)
ACT NSW NT QLD SA TAS VIC WA
Australian Gambling Statistics, 1993–94 to 2018–2019, 36th edition
247

TABLE ALL GAMBLING 12PER CAPITA GOVERNMENT REVENUE FROM TOTAL GAMBLING
1993-94 216.98 225.30 115.03 146.46 118.18 130.72 223.03 150.94 191.361994-95 233.32 238.67 132.81 163.99 163.44 144.39 269.53 163.95 216.401995-96 235.14 259.09 162.68 173.25 202.63 149.83 310.24 178.58 240.161996-97 203.23 266.12 193.27 181.35 222.41 173.92 337.97 156.46 250.681997-98 218.85 286.69 214.76 203.73 252.20 180.07 374.77 162.29 274.381998-99 234.47 295.15 232.58 231.51 279.49 192.17 402.51 153.63 291.211999-00 263.59 319.78 271.38 237.83 299.18 209.36 429.20 151.28 309.942000-01 199.44 243.58 220.47 193.78 260.18 162.20 355.38 155.80 252.132001-02 185.09 241.98 235.44 209.31 264.10 180.96 376.04 156.25 260.222002-03 194.31 252.12 252.31 228.86 301.37 196.21 358.82 158.65 266.742003-04 224.62 260.71 270.12 253.46 332.62 209.89 353.46 168.36 277.222004-05 221.31 281.03 316.50 274.75 342.57 213.51 360.19 176.96 291.752005-06 207.19 296.83 375.55 281.71 338.93 202.56 372.91 184.20 301.942006-07 206.97 319.13 420.82 266.85 353.89 217.64 377.72 206.45 311.672007-08 223.77 293.65 459.39 279.73 336.48 227.16 390.04 196.79 307.312008-09 207.78 308.61 454.79 286.59 334.13 232.92 396.21 212.29 316.222009-10 215.11 259.51 366.34 278.69 322.53 229.55 382.54 207.25 293.002010-11 185.09 315.41 297.45 280.89 319.50 212.14 380.47 203.72 308.792011-12 183.33 319.15 310.39 291.78 323.31 210.88 392.26 217.90 316.812012-13 191.66 326.51 302.04 296.25 323.11 206.43 349.60 223.04 309.792013-14 182.39 326.99 322.97 292.44 289.25 205.82 332.15 229.36 303.072014-15 162.88 353.32 377.32 298.54 286.38 207.19 347.03 223.87 316.052015-16 162.05 369.36 459.70 309.70 283.66 210.02 353.04 198.26 323.062016-17 156.81 367.95 449.33 304.11 264.55 193.18 335.23 186.59 314.002017-18 150.99 377.63 511.32 311.81 288.48 186.95 340.83 182.43 321.892018-19 156.90 398.09 522.96 326.87 297.65 199.41 347.40 191.17 335.26
Notes: These data should be read in conjunction with the explanatory notes and other revenue tables in this publication.
Figure(s) may be incomplete for any period or jurisdiction due to some unavailable revenue figures that are used to derive these numbers.
Data for the gambling revenue received by states and territories from 1 July 2000 onwards are not comparable with that of preceding years because of the impact
of changes brought about by the introduction of the GST.
Data may be affected by revised revenue figures.
AUSTRALIA
Value ($)
ACT NSW NT QLD SA TAS VIC WA
Australian Gambling Statistics, 1993–94 to 2018–2019, 36th edition
248

TABLE ALL GAMBLING 13REAL PER CAPITA GOVERNMENT REVENUE FROM TOTAL GAMBLING
1993-94 403.21 418.68 213.75 272.16 219.61 242.92 414.46 280.50 355.611994-95 419.90 429.53 239.01 295.13 294.15 259.86 485.07 295.05 389.451995-96 405.90 447.23 280.82 299.06 349.78 258.64 535.53 308.27 414.551996-97 346.10 453.19 329.14 308.83 378.76 296.19 575.56 266.45 426.901997-98 372.71 488.23 365.73 346.95 429.49 306.66 638.22 276.37 467.271998-99 394.59 496.71 391.41 389.61 470.35 323.40 677.39 258.54 490.071999-00 433.37 525.76 446.17 391.02 491.88 344.21 705.65 248.71 509.572000-01 309.18 377.61 341.79 300.41 403.34 251.45 550.94 241.54 390.872001-02 278.97 364.72 354.88 315.49 398.07 272.75 566.79 235.51 392.222002-03 284.24 368.81 369.08 334.78 440.84 287.03 524.89 232.08 390.192003-04 320.76 372.30 385.74 361.95 474.99 299.72 504.75 240.43 395.872004-05 308.70 391.99 441.47 383.24 477.84 297.82 502.42 246.83 406.952005-06 280.10 401.29 507.70 380.85 458.19 273.84 504.13 249.02 408.192006-07 271.76 419.01 552.54 350.38 464.66 285.77 495.95 271.07 409.222007-08 284.32 373.11 583.70 355.42 427.53 288.63 495.58 250.04 390.472008-09 256.02 380.26 560.38 353.13 411.71 287.00 488.20 261.58 389.642009-10 258.90 312.34 440.92 335.42 388.19 276.28 460.42 249.44 352.652010-11 216.16 368.36 347.38 328.04 373.13 247.74 444.33 237.91 360.632011-12 209.18 364.15 354.15 332.92 368.90 240.61 447.57 248.62 361.482012-13 213.76 364.17 336.87 330.42 360.38 230.25 389.93 248.77 345.532013-14 198.19 355.33 350.96 317.78 314.32 223.66 360.93 249.24 329.332014-15 174.02 377.48 403.11 318.95 305.95 221.35 370.75 239.18 337.662015-16 170.73 389.14 484.32 326.28 298.86 221.27 371.94 208.88 340.362016-17 162.36 380.98 465.23 314.88 273.91 200.02 347.10 193.20 325.122017-18 153.41 383.69 519.51 316.81 293.10 189.95 346.29 185.36 327.052018-19 156.90 398.09 522.96 326.87 297.65 199.41 347.40 191.17 335.26
Notes: These data should be read in conjunction with the explanatory notes and other revenue tables in this publication.
Figure(s) may be incomplete for any period or jurisdiction due to some unavailable revenue figures that are used to derive these numbers.
Data for the gambling revenue received by states and territories from 1 July 2000 onwards are not comparable with that of preceding years because of the impact
of changes brought about by the introduction of the GST.
Data may be affected by revised revenue figures.
AUSTRALIA
Value ($)
ACT NSW NT QLD SA TAS VIC WA
Australian Gambling Statistics, 1993–94 to 2018–2019, 36th edition
249

TABLE ALL GAMBLING 14TOTAL AUSTRALIAN
GAMBLING EXPENDITURE
1993-94 5,319.277 1,548.092 - 6,867.3691994-95 6,553.992 1,625.088 11.495 8,190.5741995-96 7,858.250 1,636.052 13.016 9,507.3191996-97 8,362.940 1,660.025 16.243 10,039.2081997-98 9,649.892 1,642.095 24.739 11,316.7261998-99 10,685.843 1,729.695 22.883 12,438.4211999-00 11,545.129 1,723.910 44.510 13,313.5492000-01 12,511.071 1,795.915 42.144 14,349.1302001-02 13,045.316 1,884.757 72.290 15,002.3632002-03 13,375.183 1,989.164 78.011 15,442.3582003-04 14,069.657 2,027.291 149.871 16,246.8192004-05 14,605.873 2,191.662 116.687 16,914.2222005-06 15,241.790 2,231.020 144.257 17,617.0672006-07 15,643.728 2,398.734 170.376 18,212.8382007-08 15,505.574 2,388.955 205.526 18,100.0552008-09 16,211.339 2,606.338 221.487 19,039.1632009-10 15,514.755 2,637.827 303.505 18,456.0872010-11 16,402.610 2,696.967 321.829 19,421.4062011-12 17,292.010 2,860.023 396.730 20,548.7632012-13 17,447.365 2,863.017 485.164 20,795.5462013-14 17,748.198 2,907.499 625.951 21,281.6482014-15 19,106.294 2,987.383 814.594 22,908.2702015-16 19,785.049 3,098.968 920.634 23,804.6512016-17 19,320.646 3,394.179 982.786 23,697.6112017-18 20,105.753 3,633.563 1,150.209 24,889.5252018-19 20,539.475 3,509.190 961.137 25,009.802
Notes: These data should be read in conjunction with the explanatory notes and other expenditure tables in this publication.
Figure(s) may be incomplete for any period or jurisdiction due to some unavailable expenditure figures that are used to derive these numbers.
Data may be affected by revised expenditure figures.
Value ($ million)
GAMING RACING SPORTSBETTING TOTAL GAMBLING
Australian Gambling Statistics, 1993–94 to 2018–2019, 36th edition
250

TABLE ALL GAMBLING 15TOTAL REAL AUSTRALIANGAMBLING EXPENDITURE
1993-94 9,884.846 2,876.828 - 12,761.6741994-95 11,795.118 2,924.645 20.687 14,740.4501995-96 13,564.696 2,824.109 22.468 16,411.2721996-97 14,241.961 2,826.998 27.662 17,096.6211997-98 16,433.622 2,796.463 42.130 19,272.2151998-99 17,983.108 2,910.888 38.510 20,932.5051999-00 18,981.257 2,834.267 73.179 21,888.7022000-01 19,395.559 2,784.156 65.335 22,245.0502001-02 19,662.755 2,840.829 108.960 22,612.5442002-03 19,565.492 2,909.790 114.116 22,589.3982003-04 20,091.963 2,895.043 214.021 23,201.0272004-05 20,373.229 3,057.074 162.763 23,593.0652005-06 20,605.310 3,016.106 195.021 23,816.4372006-07 20,540.268 3,149.546 223.704 23,913.5192007-08 19,701.404 3,035.410 261.141 22,997.9552008-09 19,975.310 3,211.481 272.912 23,459.7032009-10 18,673.350 3,174.853 365.294 22,213.4972010-11 19,155.965 3,149.682 375.851 22,681.4982011-12 19,730.184 3,263.286 452.669 23,446.1392012-13 19,459.867 3,193.258 541.126 23,194.2512013-14 19,286.375 3,159.482 680.200 23,126.0572014-15 20,412.249 3,191.576 870.273 24,474.0982015-16 20,844.636 3,264.933 969.939 25,079.5072016-17 20,004.407 3,514.300 1,017.567 24,536.2742017-18 20,428.018 3,691.804 1,168.645 25,288.4672018-19 20,539.475 3,509.190 961.137 25,009.802
Notes: These data should be read in conjunction with the explanatory notes and other expenditure tables in this publication.
Figure(s) may be incomplete for any period or jurisdiction due to some unavailable expenditure figures that are used to derive these numbers.
Data may be affected by revised expenditure figures.
Value ($ million)
GAMING RACING SPORTSBETTING TOTAL GAMBLING
Australian Gambling Statistics, 1993–94 to 2018–2019, 36th edition
251

TABLE ALL GAMBLING 16TOTAL AUSTRALIAN PER CAPITA
GAMBLING EXPENDITURE
1993-94 405.23 117.93 - 523.161994-95 493.10 122.27 0.86 616.231995-96 583.23 121.43 0.97 705.621996-97 612.27 121.53 1.19 734.991997-98 697.66 118.72 1.79 818.161998-99 762.92 123.49 1.63 888.041999-00 813.34 121.45 3.14 937.922000-01 868.75 124.71 2.93 996.382001-02 892.53 128.95 4.95 1,026.432002-03 901.87 134.13 5.26 1,041.252003-04 935.30 134.77 9.96 1,080.032004-05 957.31 143.65 7.65 1,108.602005-06 984.00 144.03 9.31 1,137.352006-07 992.02 152.11 10.80 1,154.932007-08 962.44 148.28 12.76 1,123.482008-09 983.40 158.10 13.44 1,154.942009-10 922.14 156.78 18.04 1,096.962010-11 958.72 157.64 18.81 1,135.162011-12 993.46 164.31 22.79 1,180.572012-13 984.12 161.49 27.37 1,172.972013-14 984.12 161.22 34.71 1,180.052014-15 1,043.13 163.10 44.47 1,250.702015-16 1,063.51 166.58 49.49 1,279.582016-17 1,021.00 179.36 51.94 1,252.292017-18 1,043.95 188.67 59.72 1,292.342018-19 1,048.56 179.15 49.07 1,276.78
Notes: These data should be read in conjunction with the explanatory notes and other expenditure tables in this publication.
Figure(s) may be incomplete for any period or jurisdiction due to some unavailable expenditure figures that are used to derive these numbers.
Data may be affected by revised expenditure figures.
Value ($)
GAMING RACING SPORTSBETTING TOTAL GAMBLING
Australian Gambling Statistics, 1993–94 to 2018–2019, 36th edition
252
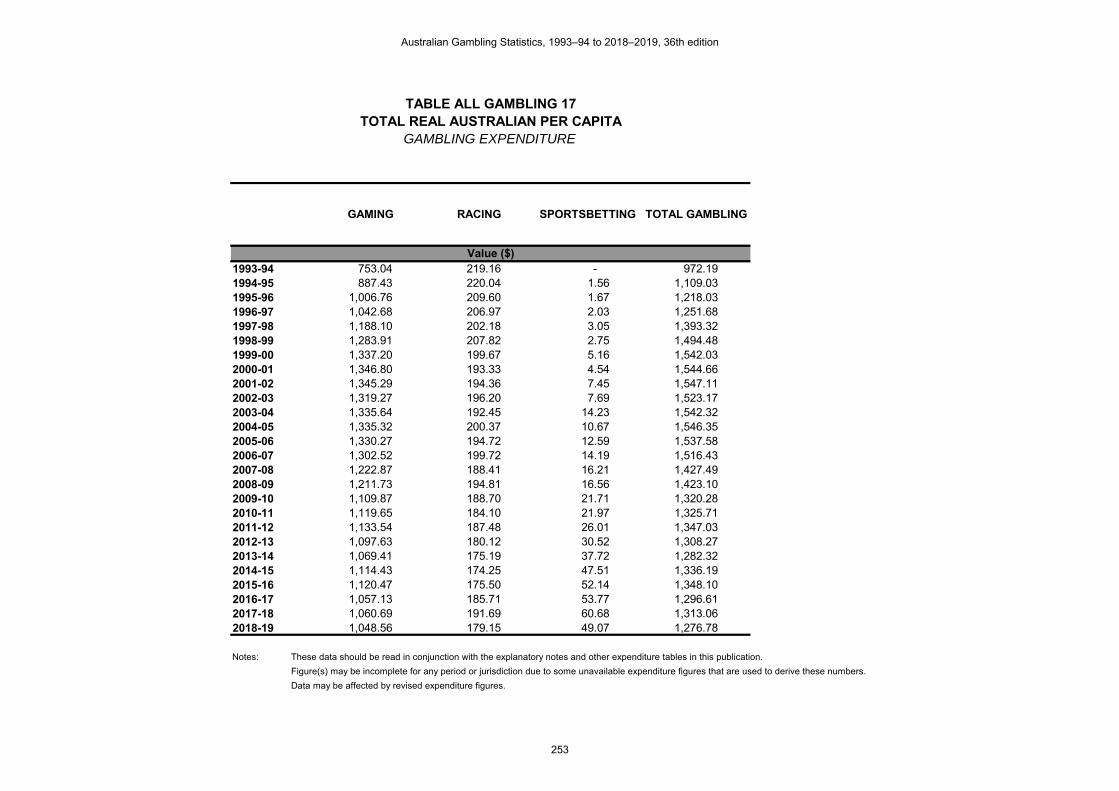
TABLE ALL GAMBLING 17TOTAL REAL AUSTRALIAN PER CAPITA
GAMBLING EXPENDITURE
1993-94 753.04 219.16 - 972.191994-95 887.43 220.04 1.56 1,109.031995-96 1,006.76 209.60 1.67 1,218.031996-97 1,042.68 206.97 2.03 1,251.681997-98 1,188.10 202.18 3.05 1,393.321998-99 1,283.91 207.82 2.75 1,494.481999-00 1,337.20 199.67 5.16 1,542.032000-01 1,346.80 193.33 4.54 1,544.662001-02 1,345.29 194.36 7.45 1,547.112002-03 1,319.27 196.20 7.69 1,523.172003-04 1,335.64 192.45 14.23 1,542.322004-05 1,335.32 200.37 10.67 1,546.352005-06 1,330.27 194.72 12.59 1,537.582006-07 1,302.52 199.72 14.19 1,516.432007-08 1,222.87 188.41 16.21 1,427.492008-09 1,211.73 194.81 16.56 1,423.102009-10 1,109.87 188.70 21.71 1,320.282010-11 1,119.65 184.10 21.97 1,325.712011-12 1,133.54 187.48 26.01 1,347.032012-13 1,097.63 180.12 30.52 1,308.272013-14 1,069.41 175.19 37.72 1,282.322014-15 1,114.43 174.25 47.51 1,336.192015-16 1,120.47 175.50 52.14 1,348.102016-17 1,057.13 185.71 53.77 1,296.612017-18 1,060.69 191.69 60.68 1,313.062018-19 1,048.56 179.15 49.07 1,276.78
Notes: These data should be read in conjunction with the explanatory notes and other expenditure tables in this publication.
Figure(s) may be incomplete for any period or jurisdiction due to some unavailable expenditure figures that are used to derive these numbers.
Data may be affected by revised expenditure figures.
Value ($)
GAMING RACING SPORTSBETTING TOTAL GAMBLING
Australian Gambling Statistics, 1993–94 to 2018–2019, 36th edition
253

TABLE ALL GAMBLING 18TOTAL AUSTRALIAN
GAMBLING EXPENDITUREAS A % OF HDI
1993-94 1.705 0.496 - 2.2011994-95 1.991 0.494 0.003 2.4881995-96 2.249 0.468 0.004 2.7211996-97 2.266 0.450 0.004 2.7211997-98 2.512 0.427 0.006 2.9461998-99 2.672 0.433 0.006 3.1101999-00 2.727 0.407 0.011 3.1452000-01 2.701 0.388 0.009 3.0982001-02 2.629 0.380 0.015 3.0232002-03 2.615 0.389 0.015 3.0192003-04 2.547 0.367 0.027 2.9412004-05 2.453 0.368 0.020 2.8412005-06 2.419 0.354 0.023 2.7952006-07 2.266 0.347 0.025 2.6382007-08 2.043 0.315 0.027 2.3852008-09 1.943 0.312 0.027 2.2812009-10 1.792 0.305 0.035 2.1322010-11 1.761 0.290 0.035 2.0852011-12 1.757 0.291 0.040 2.0882012-13 1.722 0.283 0.048 2.0532013-14 1.664 0.273 0.059 1.9952014-15 1.717 0.268 0.073 2.0592015-16 1.737 0.272 0.081 2.0902016-17 1.655 0.291 0.084 2.0302017-18 1.672 0.302 0.096 2.0702018-19 1.662 0.284 0.078 2.023
Notes: These data should be read in conjunction with the explanatory notes and other expenditure tables in this publication.
Figure(s) may be incomplete for any period or jurisdiction due to some unavailable expenditure figures that are used to derive these numbers.
Data may be affected by revised expenditure figures.
RACING SPORTSBETTING TOTAL GAMBLING
Percentage (%)
GAMING
Australian Gambling Statistics, 1993–94 to 2018–2019, 36th edition
254

TABLE ALL GAMBLING 19TOTAL GOVERNMENT
REVENUE FROM GAMBLING
1993-94 1,848.381 663.552 - 2,511.9331994-95 2,235.132 637.337 3.730 2,876.1991995-96 2,608.881 623.773 3.144 3,235.7981996-97 2,808.456 612.301 3.238 3,423.9951997-98 3,221.114 570.045 4.043 3,795.2021998-99 3,588.103 484.998 5.702 4,078.8031999-00 3,933.273 458.383 7.836 4,399.4922000-01 3,302.483 323.200 5.319 3,631.0022001-02 3,479.312 317.110 6.988 3,803.4102002-03 3,609.972 336.850 9.048 3,955.8702003-04 3,803.854 357.128 9.168 4,170.1502004-05 4,065.206 376.105 9.934 4,451.2452005-06 4,291.243 374.517 11.098 4,676.8582006-07 4,507.751 393.114 13.993 4,914.8582007-08 4,568.575 367.104 15.278 4,950.9572008-09 4,806.628 388.727 17.480 5,212.8352009-10 4,518.559 387.144 23.902 4,929.6062010-11 4,899.452 357.094 26.542 5,283.0892011-12 5,131.173 353.522 29.656 5,514.3512012-13 5,176.997 290.229 25.095 5,492.3212013-14 5,162.166 272.184 31.334 5,465.6842014-15 5,508.718 243.786 36.452 5,788.9562015-16 5,764.645 209.630 35.741 6,010.0162016-17 5,727.273 188.278 26.426 5,941.9772017-18 5,948.970 219.268 31.083 6,199.3222018-19 6,363.082 182.969 21.159 6,567.210
Notes: These data should be read in conjunction with the explanatory notes and other revenue tables in this publication.
Figure(s) may be incomplete for any period or jurisdiction due to some unavailable revenue figures that are used to derive these numbers.
Data for the gambling revenue received by states and territories from 1 July 2000 onwards are not comparable with that of preceding years
because of the impact of changes brought about by the introduction of GST.
Data may be affected by revised revenue figures.
Value ($ million)
GAMING RACING SPORTSBETTING TOTAL GAMBLING
Australian Gambling Statistics, 1993–94 to 2018–2019, 36th edition
255

TABLE ALL GAMBLING 20REAL TOTAL GOVERNMENTREVENUE FROM GAMBLING
1993-94 3,434.858 1,233.083 - 4,667.9411994-95 4,022.533 1,147.006 6.713 5,176.2511995-96 4,503.379 1,076.740 5.427 5,585.5451996-97 4,782.759 1,042.739 5.514 5,831.0121997-98 5,485.509 970.778 6.885 6,463.1721998-99 6,038.386 816.199 9.596 6,864.1801999-00 6,466.663 753.625 12.882 7,233.1702000-01 5,119.746 501.048 8.246 5,629.0402001-02 5,244.246 477.969 10.533 5,732.7482002-03 5,280.741 492.751 13.236 5,786.7282003-04 5,432.037 509.991 13.092 5,955.1202004-05 5,670.416 524.616 13.857 6,208.8882005-06 5,801.313 506.308 15.004 6,322.6252006-07 5,918.693 516.160 18.373 6,453.2262007-08 5,804.837 466.443 19.413 6,290.6932008-09 5,922.638 478.982 21.539 6,423.1592009-10 5,438.477 465.962 28.769 5,933.2072010-11 5,721.878 417.037 30.998 6,169.9122011-12 5,854.668 403.368 33.838 6,291.8742012-13 5,774.148 323.706 27.990 6,125.8432013-14 5,609.554 295.774 34.049 5,939.3772014-15 5,885.251 260.449 38.944 6,184.6432015-16 6,073.371 220.856 37.655 6,331.8822016-17 5,929.962 194.941 27.361 6,152.2642017-18 6,044.323 222.782 31.582 6,298.6872018-19 6,363.082 182.969 21.159 6,567.210
Notes: These data should be read in conjunction with the explanatory notes and other revenue tables in this publication.
Figure(s) may be incomplete for any period or jurisdiction due to some unavailable revenue figures that are used to derive these numbers.
Data for the gambling revenue received by states and territories from 1 July 2000 onwards are not comparable with that of preceding years
because of the impact of changes brought about by the introduction of GST.
Data may be affected by revised revenue figures.
Value ($ million)
GAMING RACING SPORTSBETTING TOTAL GAMBLING
Australian Gambling Statistics, 1993–94 to 2018–2019, 36th edition
256

TABLE ALL GAMBLING 21PER CAPITA TOTAL GOVERNMENT
REVENUE FROM GAMBLING
1993-94 140.81 50.55 - 191.361994-95 168.16 47.95 0.28 216.401995-96 193.63 46.30 0.23 240.161996-97 205.61 44.83 0.24 250.681997-98 232.88 41.21 0.29 274.381998-99 256.17 34.63 0.41 291.211999-00 277.09 32.29 0.55 309.942000-01 229.32 22.44 0.37 252.132001-02 238.05 21.70 0.48 260.222002-03 243.41 22.71 0.61 266.742003-04 252.87 23.74 0.61 277.222004-05 266.44 24.65 0.65 291.752005-06 277.04 24.18 0.72 301.942006-07 285.85 24.93 0.89 311.672007-08 283.57 22.79 0.95 307.312008-09 291.58 23.58 1.06 316.222009-10 268.57 23.01 1.42 293.002010-11 286.37 20.87 1.55 308.792011-12 294.80 20.31 1.70 316.812012-13 292.01 16.37 1.42 309.792013-14 286.24 15.09 1.74 303.072014-15 300.75 13.31 1.99 316.052015-16 309.87 11.27 1.92 323.062016-17 302.66 9.95 1.40 314.002017-18 308.89 11.39 1.61 321.892018-19 324.84 9.34 1.08 335.26
Notes: These data should be read in conjunction with the explanatory notes and other revenue tables in this publication.
Figure(s) may be incomplete for any period or jurisdiction due to some unavailable revenue figures that are used to derive these numbers.
Data for the gambling revenue received by states and territories from 1 July 2000 onwards are not comparable with that of preceding years
because of the impact of changes brought about by the introduction of GST.
Data may be affected by revised revenue figures.
Value ($)
GAMING RACING SPORTSBETTING TOTAL GAMBLING
Australian Gambling Statistics, 1993–94 to 2018–2019, 36th edition
257

TABLE ALL GAMBLING 22REAL PER CAPITA TOTAL GOVERNMENT
REVENUE FROM GAMBLING
1993-94 261.67 93.94 - 355.611994-95 302.64 86.30 0.51 389.451995-96 334.24 79.91 0.40 414.551996-97 350.16 76.34 0.40 426.901997-98 396.58 70.18 0.50 467.271998-99 431.11 58.27 0.69 490.071999-00 455.57 53.09 0.91 509.572000-01 355.51 34.79 0.57 390.872001-02 358.80 32.70 0.72 392.222002-03 356.07 33.23 0.89 390.192003-04 361.10 33.90 0.87 395.872004-05 371.65 34.38 0.91 406.952005-06 374.53 32.69 0.97 408.192006-07 375.32 32.73 1.17 409.222007-08 360.31 28.95 1.20 390.472008-09 359.28 29.06 1.31 389.642009-10 323.24 27.69 1.71 352.652010-11 334.44 24.38 1.81 360.632011-12 336.36 23.17 1.94 361.482012-13 325.69 18.26 1.58 345.532013-14 311.04 16.40 1.89 329.332014-15 321.31 14.22 2.13 337.662015-16 326.46 11.87 2.02 340.362016-17 313.37 10.30 1.45 325.122017-18 313.84 11.57 1.64 327.052018-19 324.84 9.34 1.08 335.26
Notes: These data should be read in conjunction with the explanatory notes and other revenue tables in this publication.
Figure(s) may be incomplete for any period or jurisdiction due to some unavailable revenue figures that are used to derive these numbers.
Data for the gambling revenue received by states and territories from 1 July 2000 onwards are not comparable with that of preceding years
because of the impact of changes brought about by the introduction of GST.
Data may be affected by revised revenue figures.
Value ($)
GAMING RACING SPORTSBETTING TOTAL GAMBLING
Australian Gambling Statistics, 1993–94 to 2018–2019, 36th edition
258

TABLE ALL GAMBLING 23RACING REVENUE COMPONENTS
1993-94 23.011 111.064 529.477 663.5521994-95 24.826 99.444 513.067 637.3371995-96 22.608 78.532 522.633 623.7731996-97 17.663 70.277 524.361 612.3011997-98 18.096 61.271 490.678 570.0451998-99 15.592 38.175 431.231 484.9981999-00 13.757 33.495 411.131 458.3832000-01 7.098 16.332 299.770 323.2002001-02 6.128 7.182 303.800 317.1102002-03 3.001 8.685 325.164 336.8502003-04 3.366 8.316 345.446 357.1282004-05 4.971 8.487 362.647 376.1052005-06 5.748 7.113 361.656 374.5172006-07 8.971 8.113 376.030 393.1142007-08 14.964 9.627 342.513 367.1042008-09 17.834 11.925 358.968 388.7272009-10 12.116 15.994 359.035 387.1442010-11 4.331 15.044 337.720 357.0942011-12 4.198 14.462 334.862 353.5222012-13 4.624 7.519 278.085 290.2292013-14 4.962 4.854 262.368 272.1842014-15 7.063 4.641 232.082 243.7862015-16 7.725 2.592 199.313 209.6302016-17 6.315 2.154 179.809 188.2782017-18 22.331 1.760 195.176 219.2682018-19 24.354 0.965 157.650 182.969
Notes: These data should be read in conjunction with the explanatory notes and other revenue tables in this publication.
Figure(s) may be incomplete for any period or jurisdiction due to some unavailable revenue figures that are used to derive these numbers.
Data for the gambling revenue received by states and territories from 1 July 2000 onwards are not comparable with that of preceding years
because of the impact of changes brought about by the introduction of GST.
Data may be affected by revised revenue figures.
Value ($ million)
BOOKMAKERSON-COURSE
TOTALISATORTAB TOTAL RACING
Australian Gambling Statistics, 1993–94 to 2018–2019, 36th edition
259

TABLE ALL GAMBLING 24REAL RACING REVENUE COMPONENTS
1993-94 42.761 206.391 983.930 1,233.0831994-95 44.679 178.968 923.359 1,147.0061995-96 39.025 135.560 902.155 1,076.7401996-97 30.080 119.681 892.979 1,042.7391997-98 30.817 104.344 835.617 970.7781998-99 26.240 64.244 725.715 816.1991999-00 22.618 55.069 675.937 753.6252000-01 11.004 25.319 464.725 501.0482001-02 9.237 10.825 457.907 477.9692002-03 4.390 12.705 475.657 492.7512003-04 4.807 11.876 493.309 509.9912004-05 6.934 11.838 505.844 524.6162005-06 7.770 9.616 488.921 506.3082006-07 11.779 10.652 493.729 516.1602007-08 19.013 12.232 435.198 466.4432008-09 21.975 14.694 442.313 478.9822009-10 14.583 19.250 432.129 465.9622010-11 5.057 17.569 394.410 417.0372011-12 4.790 16.501 382.077 403.3682012-13 5.157 8.387 310.162 323.7062013-14 5.392 5.275 285.107 295.7742014-15 7.545 4.959 247.945 260.4492015-16 8.138 2.731 209.987 220.8562016-17 6.538 2.231 186.172 194.9412017-18 22.689 1.789 198.305 222.7822018-19 24.354 0.965 157.650 182.969
Notes: These data should be read in conjunction with the explanatory notes and other revenue tables in this publication.
Figure(s) may be incomplete for any period or jurisdiction due to some unavailable revenue figures that are used to derive these numbers.
Data for the gambling revenue received by states and territories from 1 July 2000 onwards are not comparable with that of preceding years
because of the impact of changes brought about by the introduction of GST.
Data may be affected by revised revenue figures.
Value ($ million)
BOOKMAKERSON-COURSE
TOTALISATORTAB TOTAL RACING
Australian Gambling Statistics, 1993–94 to 2018–2019, 36th edition
260
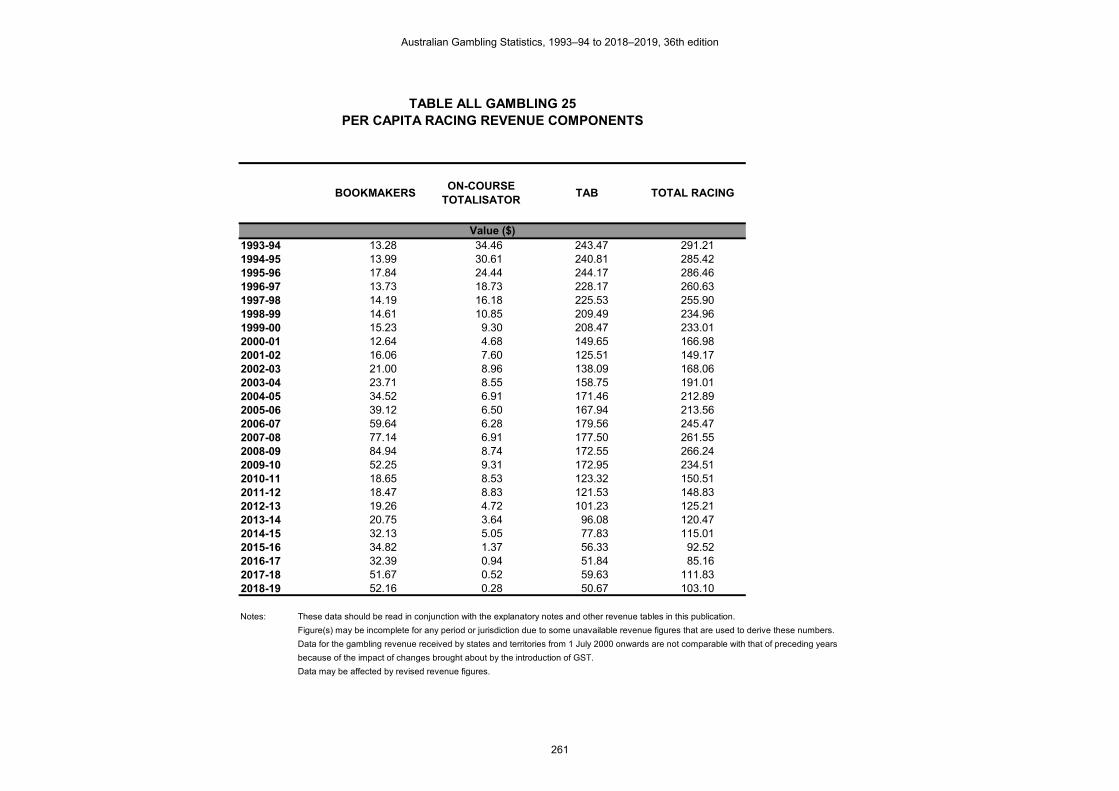
TABLE ALL GAMBLING 25PER CAPITA RACING REVENUE COMPONENTS
1993-94 13.28 34.46 243.47 291.211994-95 13.99 30.61 240.81 285.421995-96 17.84 24.44 244.17 286.461996-97 13.73 18.73 228.17 260.631997-98 14.19 16.18 225.53 255.901998-99 14.61 10.85 209.49 234.961999-00 15.23 9.30 208.47 233.012000-01 12.64 4.68 149.65 166.982001-02 16.06 7.60 125.51 149.172002-03 21.00 8.96 138.09 168.062003-04 23.71 8.55 158.75 191.012004-05 34.52 6.91 171.46 212.892005-06 39.12 6.50 167.94 213.562006-07 59.64 6.28 179.56 245.472007-08 77.14 6.91 177.50 261.552008-09 84.94 8.74 172.55 266.242009-10 52.25 9.31 172.95 234.512010-11 18.65 8.53 123.32 150.512011-12 18.47 8.83 121.53 148.832012-13 19.26 4.72 101.23 125.212013-14 20.75 3.64 96.08 120.472014-15 32.13 5.05 77.83 115.012015-16 34.82 1.37 56.33 92.522016-17 32.39 0.94 51.84 85.162017-18 51.67 0.52 59.63 111.832018-19 52.16 0.28 50.67 103.10
Notes: These data should be read in conjunction with the explanatory notes and other revenue tables in this publication.
Figure(s) may be incomplete for any period or jurisdiction due to some unavailable revenue figures that are used to derive these numbers.
Data for the gambling revenue received by states and territories from 1 July 2000 onwards are not comparable with that of preceding years
because of the impact of changes brought about by the introduction of GST.
Data may be affected by revised revenue figures.
Value ($)
BOOKMAKERSON-COURSE
TOTALISATORTAB TOTAL RACING
Australian Gambling Statistics, 1993–94 to 2018–2019, 36th edition
261

TABLE ALL GAMBLING 26REAL PER CAPITA RACING REVENUE COMPONENTS
1993-94 24.67 64.04 452.43 541.151994-95 25.18 55.09 433.39 513.661995-96 30.80 42.19 421.49 494.471996-97 23.38 31.90 388.57 443.851997-98 24.17 27.55 384.07 435.791998-99 24.59 18.26 352.56 395.411999-00 25.04 15.30 342.75 383.082000-01 19.60 7.26 232.01 258.862001-02 24.20 11.45 189.18 224.842002-03 30.72 13.11 202.01 245.842003-04 33.86 12.21 226.71 272.772004-05 48.15 9.63 239.16 296.952005-06 52.89 8.79 227.03 288.722006-07 78.31 8.24 235.76 322.312007-08 98.02 8.78 225.53 332.322008-09 104.66 10.78 212.62 328.052009-10 62.89 11.20 208.16 282.262010-11 21.78 9.97 144.02 175.772011-12 21.07 10.07 138.66 169.812012-13 21.49 5.26 112.91 139.662013-14 22.55 3.96 104.41 130.912014-15 34.33 5.40 83.15 122.872015-16 36.69 1.45 59.35 97.482016-17 33.53 0.97 53.67 88.172017-18 52.50 0.53 60.59 113.622018-19 52.16 0.28 50.67 103.10
Notes: These data should be read in conjunction with the explanatory notes and other revenue tables in this publication.
Figure(s) may be incomplete for any period or jurisdiction due to some unavailable revenue figures that are used to derive these numbers.
Data for the gambling revenue received by states and territories from 1 July 2000 onwards are not comparable with that of preceding years
because of the impact of changes brought about by the introduction of GST.
Data may be affected by revised revenue figures.
Value ($)
BOOKMAKERSON-COURSE
TOTALISATORTAB TOTAL RACING
Australian Gambling Statistics, 1993–94 to 2018–2019, 36th edition
262

TABLE ALL GAMBLING 27SPORTSBETTING REVENUE COMPONENTS
1994-95 0.600 - 0.550 2.580 3.7301995-96 0.412 - 0.280 2.452 3.1441996-97 0.569 - 0.390 2.279 3.2381997-98 1.276 0.006 0.644 2.117 4.0431998-99 1.538 0.010 1.754 2.400 5.7021999-00 2.461 - 2.748 2.626 7.8362000-01 1.930 0.026 2.073 1.290 5.3192001-02 2.304 0.263 3.129 1.292 6.9882002-03 2.572 0.279 4.851 1.346 9.0482003-04 1.806 0.284 5.422 1.656 9.1682004-05 1.630 0.323 6.254 1.727 9.9342005-06 1.447 0.287 7.783 1.581 11.0982006-07 1.304 0.270 10.978 1.441 13.9932007-08 1.927 0.114 11.815 1.423 15.2782008-09 1.695 - 14.312 1.473 17.4802009-10 1.199 - 21.477 1.227 23.9022010-11 0.748 - 24.392 1.402 26.5422011-12 0.394 - 27.938 1.324 29.6562012-13 0.330 - 23.687 1.078 25.0952013-14 0.426 - 29.996 0.912 31.3342014-15 0.612 - 34.936 0.904 36.4522015-16 0.454 - 34.569 0.718 35.7412016-17 0.068 - 25.651 0.707 26.4262017-18 - - 30.492 0.592 31.0832018-19 - - 20.688 0.470 21.159
Notes: These data should be read in conjunction with the explanatory notes and other revenue tables in this publication.
Figure(s) may be incomplete for any period or jurisdiction due to some unavailable revenue figures that are used to derive these numbers.
Data for the gambling revenue received by states and territories from 1 July 2000 onwards are not comparable with that of
preceding years because of the impact of changes brought about by the introduction of GST.
Data may be affected by revised government revenue figures.
Value ($ million)
BOOKMAKER (AND OTHER) FIXED ODDS
BOOKMAKER (AND OTHER)
POOL BETTINGTAB FIXED ODDS TAB TOTE ODDS
TOTAL SPORTSBETTING
Australian Gambling Statistics, 1993–94 to 2018–2019, 36th edition
263

TABLE ALL GAMBLING 28REAL SPORTSBETTING REVENUE COMPONENTS
1994-95 1.080 - 0.990 4.643 6.7131995-96 0.711 - 0.483 4.233 5.4271996-97 0.969 - 0.664 3.881 5.5141997-98 2.173 0.010 1.097 3.605 6.8851998-99 2.588 0.017 2.952 4.039 9.5961999-00 4.046 - 4.518 4.318 12.8822000-01 2.992 0.040 3.214 2.000 8.2462001-02 3.473 0.396 4.716 1.947 10.5332002-03 3.762 0.408 7.096 1.969 13.2362003-04 2.579 0.406 7.743 2.365 13.0922004-05 2.274 0.451 8.723 2.409 13.8572005-06 1.957 0.388 10.522 2.137 15.0042006-07 1.712 0.355 14.414 1.892 18.3732007-08 2.448 0.145 15.012 1.808 19.4132008-09 2.089 - 17.635 1.815 21.5392009-10 1.443 - 25.849 1.477 28.7692010-11 0.874 - 28.486 1.637 30.9982011-12 0.450 - 31.877 1.511 33.8382012-13 0.368 - 26.419 1.202 27.9902013-14 0.463 - 32.595 0.991 34.0492014-15 0.654 - 37.324 0.966 38.9442015-16 0.478 - 36.420 0.756 37.6552016-17 0.071 - 26.558 0.732 27.3612017-18 - - 30.980 0.601 31.5822018-19 - - 20.688 0.470 21.159
Notes: These data should be read in conjunction with the explanatory notes and other revenue tables in this publication.
Figure(s) may be incomplete for any period or jurisdiction due to some unavailable revenue figures that are used to derive these numbers.
Data for the gambling revenue received by states and territories from 1 July 2000 onwards are not comparable with that of
preceding years because of the impact of changes brought about by the introduction of GST.
Data may be affected by revised government revenue figures.
Value ($ million)
BOOKMAKER (AND OTHER) FIXED ODDS
BOOKMAKER (AND OTHER)
POOL BETTINGTAB FIXED ODDS TAB TOTE ODDS
TOTAL SPORTSBETTING
Australian Gambling Statistics, 1993–94 to 2018–2019, 36th edition
264

TABLE ALL GAMBLING 29PER CAPITA SPORTSBETTING REVENUE COMPONENTS
1994-95 4.24 - 0.16 0.74 5.151995-96 2.60 - 0.08 0.74 3.421996-97 3.45 - 0.11 0.66 4.221997-98 5.27 0.03 0.19 0.71 6.201998-99 6.17 0.04 0.43 0.77 7.411999-00 10.01 - 0.68 0.90 11.592000-01 8.08 0.01 0.52 0.41 9.012001-02 11.23 0.10 0.82 0.35 12.502002-03 13.70 0.15 1.24 0.36 15.462003-04 10.01 0.16 1.47 0.43 12.072004-05 9.03 0.16 1.63 0.46 11.282005-06 7.90 0.15 2.14 0.42 10.612006-07 7.11 0.13 2.91 0.38 10.542007-08 8.81 0.06 3.14 0.37 12.382008-09 7.06 - 3.72 0.36 11.142009-10 4.07 - 5.58 0.30 9.952010-11 2.27 - 6.04 0.32 8.642011-12 1.00 - 6.45 0.30 7.742012-13 0.83 - 5.69 0.24 6.762013-14 1.07 - 8.25 0.19 9.512014-15 1.53 - 9.57 0.18 11.292015-16 1.12 - 9.87 0.15 11.142016-17 0.17 - 5.39 0.15 5.712017-18 - - 6.68 0.12 6.802018-19 - - 4.82 0.09 4.91
Notes: These data should be read in conjunction with the explanatory notes and other revenue tables in this publication.
Figure(s) may be incomplete for any period or jurisdiction due to some unavailable revenue figures that are used to derive these numbers.
Data for the gambling revenue received by states and territories from 1 July 2000 onwards are not comparable with that of
preceding years because of the impact of changes brought about by the introduction of GST.
Data may be affected by revised government revenue figures.
Value ($)
BOOKMAKER (AND OTHER) FIXED ODDS
BOOKMAKER (AND OTHER)
POOL BETTINGTAB FIXED ODDS TAB TOTE ODDS
TOTAL SPORTSBETTING
Australian Gambling Statistics, 1993–94 to 2018–2019, 36th edition
265

TABLE ALL GAMBLING 30REAL PER CAPITA SPORTSBETTING REVENUE COMPONENTS
1994-95 7.64 - 0.29 1.34 9.271995-96 4.49 - 0.14 1.28 5.911996-97 5.87 - 0.19 1.13 7.191997-98 8.98 0.04 0.32 1.21 10.561998-99 10.38 0.07 0.73 1.29 12.471999-00 16.46 - 1.12 1.48 19.062000-01 12.53 0.01 0.80 0.63 13.972001-02 16.93 0.15 1.24 0.53 18.842002-03 20.04 0.22 1.82 0.53 22.612003-04 14.30 0.22 2.10 0.62 17.242004-05 12.60 0.22 2.27 0.64 15.732005-06 10.68 0.20 2.89 0.57 14.342006-07 9.34 0.18 3.82 0.50 13.842007-08 11.19 0.08 3.99 0.47 15.732008-09 8.70 - 4.58 0.44 13.722009-10 4.90 - 6.72 0.36 11.982010-11 2.66 - 7.06 0.38 10.092011-12 1.14 - 7.36 0.34 8.832012-13 0.93 - 6.35 0.26 7.542013-14 1.17 - 8.96 0.21 10.342014-15 1.63 - 10.23 0.20 12.062015-16 1.18 - 10.39 0.16 11.742016-17 0.17 - 5.58 0.16 5.912017-18 - - 6.79 0.12 6.912018-19 - - 4.82 0.09 4.91
Notes: These data should be read in conjunction with the explanatory notes and other revenue tables in this publication.
Figure(s) may be incomplete for any period or jurisdiction due to some unavailable revenue figures that are used to derive these numbers.
Data for the gambling revenue received by states and territories from 1 July 2000 onwards are not comparable with that of
preceding years because of the impact of changes brought about by the introduction of GST.
Data may be affected by revised government revenue figures.
Value ($)
BOOKMAKER (AND OTHER) FIXED ODDS
BOOKMAKER (AND OTHER)
POOL BETTINGTAB FIXED ODDS TAB TOTE ODDS
TOTAL SPORTSBETTING
Australian Gambling Statistics, 1993–94 to 2018–2019, 36th edition
266

TABLE ALL GAMBLING 31TOTAL GAMING MACHINES OPERATING AS AT 30 JUNE
2001-02 4,970 102,958 1,506 39,761 15,430 3,194 29,900 1,283 199,002 2002-03 5,020 100,969 1,618 40,920 15,740 3,409 29,760 1,286 198,722 2003-04 5,000 100,656 1,672 41,824 15,624 3,447 29,632 1,300 199,155 2004-05 5,144 100,233 1,849 43,590 15,001 3,566 29,624 1,500 200,507 2005-06 5,150 100,034 1,862 44,181 13,581 3,680 29,647 1,500 199,635 2006-07 5,179 98,872 1,915 44,978 13,560 3,665 29,779 1,750 199,698 2007-08 5,159 98,774 2,037 45,116 13,629 3,723 29,297 1,750 199,485 2008-09 5,157 97,067 2,059 45,378 13,720 3,698 29,272 1,750 198,101 2009-10 5,084 97,170 2,256 45,848 13,704 3,697 29,042 1,750 198,551 2010-11 5,024 95,992 2,233 45,757 13,711 3,704 29,058 2,000 197,479 2011-12 4,986 95,610 2,222 46,152 13,658 3,690 28,376 2,000 196,694 2012-13 4,974 95,559 2,228 46,657 13,587 3,526 28,568 2,100 197,199 2013-14 4,974 95,012 2,243 46,663 13,410 3,546 28,860 2,192 196,900 2014-15 5,022 94,864 2,145 46,697 13,294 3,495 28,892 2,252 196,661 2015-16 4,635 94,408 2,188 46,481 13,273 3,596 28,958 2,190 195,729 2016-17 4,552 94,303 2,318 46,601 13,108 3,596 28,993 2,402 195,873 2017-18 4,462 93,466 2,374 46,224 12,974 3,239 29,012 2,419 194,170 2018-19 3,873 92,788 2,324 45,711 12,964 3,566 29,076 2,466 192,768
Notes: These data should be read in conjunction with the explanatory notes.
NUMBER
ACT NSW NT QLD SA TAS VIC WA AUSTRALIA
Australian Gambling Statistics, 1993–94 to 2018–2019, 36th edition
267