Australian Food Statistics 2004 - Agriculture · australian food statistics 2004 iii foreword This...
177
DEPARTMENT OF AGRICULTURE, FISHERIES AND FORESTRY Australian Food Statistics 2004
Transcript of Australian Food Statistics 2004 - Agriculture · australian food statistics 2004 iii foreword This...
D E P A R T M E N T O F A G R I C U L T U R E , F I S H E R I E S A N D F O R E S T R Y
Australian FoodStatistics 2004
Australian FoodStatistics 2004
The food industry is Australia’s largestmanufacturing sector, producing a widerange of world class products for a varietyof markets.
Australian Food Statistics 2004 provides a statistical overview of the Australian foodindustry’s performance, from ‘the paddockto the plate’.
The Australian Government Department of Agriculture, Fisheries and Forestry haspolicy responsibility for the entire foodproduction and processing chain. TheDepartment is working with the industryfor improved international competitiveness,innovation and an export focus.
For further information or to providefeedback please contact:
Food Policy & Communications SectionAustralian Government Department ofAgriculture, Fisheries and Forestry
P 02 6272 4161
F 02 6272 4367
www.daff.gov.au/foodinfo
Australian Food Statistics 2004
Australian Food Statistics 2004
Australian Government Department of Agriculture, Fisheries and Forestry
© Commonwealth of Australia 2005
ISSN 1444-0458
This work is copyright. Apart from any use as permitted under the Copyright Act 1968, no part may be reproduced by any process without prior written permission from the Commonwealth, available from AusInfo. Requests and inquiries concerning reproduction and rights should be addressed to the Manager, Legislative Services, AusInfo, GPO Box 1920, Canberra ACT 2601.
iiiaustralian food statistics 2004
foreword
This latest edition of Australian Food Statistics — like its predecessors — will prove a valuable tool for the Australian food industry, policy mak-ers and researchers. Australia Food Statistics 2004 contains a comprehen-sive range of data on food production and trade throughout the supply chain — from the farm gate to retail outlets. It highlights many of the food indus-try’s key developments, identifi es growth opportunities and helps measure business performance.
The food industry has an important role in the Australian economy. It brings together signifi cant parts of primary industry, manufacturing, bio-technology, packaging, transport, marketing, retail and food service indus-tries to provide value for Australian and international consumers. And this ensures the Australian food industry is well placed to deliver nutritious, natural, convenient and innovative products.
The data in the 2004 edition reveal that the industry remains competi-tive, despite facing many challenges, such as drought and rising exchange rates. Importantly, the processed food and beverage industry continues to be a major contributor to the Australian economy, and has a signifi cant presence in rural and regional Australia.
Australia’s exports continue to diversify by product and market. The rela-tive value of wine, dairy products, oilseeds, live animals, fi sh and to a lesser extent, confectionery exports has greatly increased during the past decade. Japan and the United States remain our most important export markets, but other export destinations, such as the Republic of Korea, the United King-dom and New Zealand, are becoming increasingly important.
The Australian Government is vigorously pursuing free trade agree-ments to increase Australia’s access to export markets in the region. We expect our new free trade agreements with the United States and Thailand will signifi cantly benefi t Australia’s agricultural and food industries.
Australia Food Statistics 2004 includes two papers that examine trade developments in the Australian dairy industry. One focuses on the specialty cheese sector and the other looks at dairy ingredients. The speciality cheese sector is an excellent example of how small and innovative Australian com-panies can succeed in niche export markets.
Dairy ingredients typify how our food processing industry is responding to rising global demand for high quality, highly functional food.
WARREN TRUSS
Australian Government Ministerfor Agriculture, Fisheries and Forestry
iv australian food statistics 2004
acknowledgments and abbreviations
acknowledgmentsPeter Berry, Max Foster, John Hogan and Alastair Peat prepared the over-view and statistical appendix of this report, with valuable assistance pro-vided by Amy Crago, Michelle McGranahan and Chris Ambler of the Food Policy and Safety Section of the Australian Government Department of Agriculture, Fisheries and Forestry.
abbreviationskg kilogram 2.20462 poundst tonne 1000 kilogramskt kilotonne 1000 tonnesMt megatonne 1 000 000 tonnesA$ dollar (Australian)$m million dollars (Australian)$b billion dollars (Australian)US$ dollar (United States)US$m million dollars (United States)US$b billion dollars (United States)cif cost, insurance and freightEVAO estimated value of agricultural operationsfas free alongside shipfob free on boardGDP gross domestic productnec not elsewhere classifi edABARE Australian Bureau of Agricultural and Resource EconomicsABS Australian Bureau of StatisticsDAFF Department of Agriculture, Fisheries and ForestryFAO Food and Agriculture Organisation of the United NationsWTO World Trade OrganisationUNCTAD United Nations Conference on Trade and Development
Small discrepancies in totals are generally caused by rounding.0 is used to denote nil or a negligible amount.
vaustralian food statistics 2004
overview: Australian food industry 2003-04 1Australian farm and fi sheries production 2Australian food processing 3Australian food retailing 3Australian food trade 3Australian food imports 7World food trade 8Drivers of world food trade 9Food in Asia 11References 12
specialty cheese: a growing sector of the Australiancheese industry 13 Overview of the sector 13 Markets 15 Supply chain 17 Trade 18 Global industry and international competitors 19 Export market 19 International reputation 21 Sector leadership 21 Barriers to entry 21 Innovation 22 Marketing 22
Conclusion 23References 24
trading dairy ingredients: thinking outside the‘glass and a half’ 25 Australian dairy production 25 Export performance 26 Future export opportunities 26 Case study – function dairy protein ingredients 27 Whey products 27 Casein and caseinates 30 Future opportunities for caseins and whey – functionality 31 References 32
contents
vi australian food statistics 2004
statisticsAbout the data 35Information: selected Australian and world sources 37Statistical appendix tables 43
fi gures – overviewA Value chain for food in Australia, 2003-04 1B Value of Australian farm and fi sheries production 2C Trends in Australian food trade 3D Composition of Australian food exports 5E Value shares of Australian food exports, by country of destination 5F Value shares of Australian food exports, by country destination groupings 6G Value shares of Australian airfreight exports, by destination, 2003-04 7H Composition of Australian food imports 7I Value share of Australian food imports, by country of origin 8J World exports of minimally processed food, 2002 8K World exports of substantially processed food, 2002 9L Relationship between nutrient intake and annual income, selected countries 10M Relationship between meat consumption and income, selected countries 10N Relationship between cereal consumption and income, selected countries 11fi gures – specialty cheeseA Specialty cheese types 14B Specialist cheese production 15C Factors affecting speciality cheese manufacturers’ selling price 17
fi gures – trading dairy ingredientsA Utilisation of Australian milk, 2003-04 25B Australian consumption and exports 26C Exporters’ shares of world trade 2003 26D Value of Australian exports, by product 26E Australian whey production and exports 29F Australian casein production and exports 30
viiaustralian food statistics 2004
tables – overview1 Overview of the Australian food industry 22 Main food trading countries, by value of trade, 2002 8
tables – specialty cheese1 Specialty cheese segments and products 142 Product distribution through various channels 17
tables – trading dairy ingredients1 Global production and trade of whey 29
tables – statistics1 Agricultural food production1.1 Agricultural food production, by commodity 431.2 Value of agricultural food production, by commodity 451.3 Number of enterprises engaged in agricultural food production 471.4 Employment by agricultural industry 48
2 Supply and use — selected foods2.1 Supply and use of Australian wheat, canola and pulses 492.2 Supply and use of Australian coarse grains 502.3 Supply and use of Australian dairy products 512.4 Supply and use of Australian meats 522.5 Supply and use of selected Australian horticultural products 53
3 Australian food processing industry3.1 Summary statistics for the Australian processed food industry 55
4 Retail sector4.1 Retail food turnover, by state and category 564.2 Consumer prices index for food groups 584.3 Average retail prices of selected foods 594.4 Apparent consumption of selected foods Australia 60
5 Australian food exports5.1 Australian food exports, by level of transformation 625.2 Australian grain exports, by level of transformation 635.3 Australian meat and livestock exports, by level of transformation 645.4 Australian dairy exports, by level of transformation 655.5 Australian seafood exports, by level of transformation 665.6 Selected Australian fruit and nut exports, by level of transformation 68
viii australian food statistics 2004
5.7 Selected Australian vegetable exports, by level of transformation 695.8 Australian food exports, by level of transformation and state, 2003-04 705.9 Australian air freight exports of food, by level of transformation 715.10 Australian air freight exports of food, by level of transformation and state, 2003-04 725.11 Australian food exports to APEC member countries 735.12 Australian food exports to ASEAN member countries 745.13 Australian food exports to NAFTA member countries 755.14 Australian food exports to EU member countries 765.15 Australian total food exports, by selected destination 775.16 Australian food exports to selected countries 78
6 Australian food imports6.1 Australian food imports, by level of transformation 846.2 Australian food imports from APEC member countries 856.3 Australian food imports from ASEAN member countries 866.4 Australian food imports from NAFTA member countries 876.5 Australian food imports from EU member countries 886.6 Australian total food imports, by selected destination 896.7 Australian food imports from selected countries 90
7 World food exports7.1 Value of world trade in processed food, major exporting countries 967.2 Value of food exports, European Union 987.3 Value of food exports, NAFTA 1007.4 Value of food exports, APEC 1027.5 Value of food exports, ASEAN 1047.6 Value of food exports, United States 1067.7 Value of food exports, France 1087.8 Value of food exports, Netherlands 1107.9 Value of food exports, Germany 1127.10 Value of food exports, Belgium–Luxembourg 114
8 World food imports8.1 Value of food trade in processed food, by major importing countries 1168.2 Value of food trade in food, by level of transformation 1188.3 Value of food imports, European Union 1208.4 Value of food imports, NAFTA 1228.5 Value of food imports, APEC 1248.6 Value of food imports, ASEAN 126
ixaustralian food statistics 2004
8.7 Value of food imports, United States 1288.8 Value of food imports, Japan 1308.9 Value of food imports, Germany 1328.10 Value of food imports, United Kingdom 1348.11 Value of food imports, France 136
9 Food balance sheets9.1 Supply and consumption of alcoholic beverages, by selected countries 1389.2 Supply and consumption of cereals, by selected country 1409.3 Supply and consumption of starchy roots, by selected country 1429.4 Supply and consumption of sweeteners, by selected country 1449.5 Supply and consumption of pulses, by selected country 1469.6 Supply and consumption of vegetables, by selected country 1489.7 Supply and consumption of fruit, by selected country 1509.8 Supply and consumption of meat, by selected country 1529.9 Supply and consumption of eggs, by selected country 1549.10 Supply and consumption of seafood, by selected country 1569.11 Supply and consumption of milk, by selected country 1589.12 Supply and consumption of vegetable oils, by selected country 1609.13 Supply and consumption of animal fats, by selected country 162
10 Other10 Selected economic and demographic information — key countries 164

1australian food statistics 2004
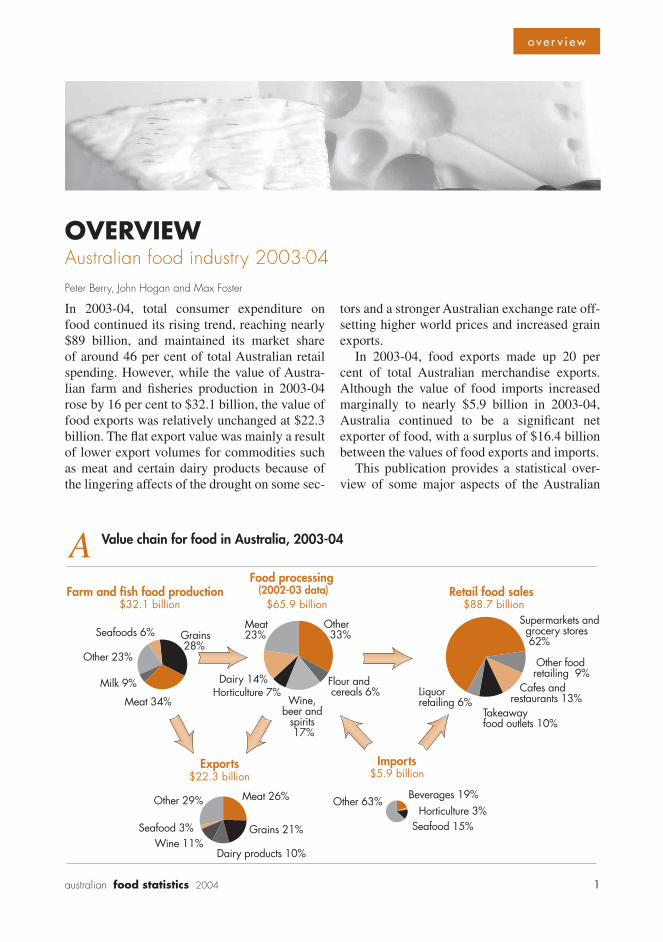
In 2003-04, total consumer expenditure on food continued its rising trend, reaching nearly $89 billion, and maintained its market share of around 46 per cent of total Australian retail spending. However, while the value of Austra-lian farm and fi sheries production in 2003-04 rose by 16 per cent to $32.1 billion, the value of food exports was relatively unchanged at $22.3 billion. The fl at export value was mainly a result of lower export volumes for commodities such as meat and certain dairy products because of the lingering affects of the drought on some sec-
tors and a stronger Australian exchange rate off-setting higher world prices and increased grain exports.
In 2003-04, food exports made up 20 per cent of total Australian merchandise exports. Although the value of food imports increased marginally to nearly $5.9 billion in 2003-04, Australia continued to be a signifi cant net exporter of food, with a surplus of $16.4 billion between the values of food exports and imports.
This publication provides a statistical over-view of some major aspects of the Australian
OVERVIEWAustralian food industry 2003-04Peter Berry, John Hogan and Max Foster
Value chain for food in Australia, 2003-04ARetail food salesFarm and fish food production
$88.7 billionSupermarkets and grocery stores 62%
Takeaway food outlets 10%
Cafes andrestaurants 13%
Other food retailing 9%
Liquor retailing 6%
Meat 26%
Grains 21%
Dairy products 10%Wine 11%
Seafood 3%
Other 29%
Exports$22.3 billion
Beverages 19%
Seafood 15%Horticulture 3%
Other 63%
Imports$5.9 billion
Grains 28%
Meat 34%
Milk 9%
Seafoods 6%
Other 23%
$32.1 billion
Meat 23%
Dairy 14%Horticulture 7%
Wine, beer and
spirits 17%
Flour and cereals 6%
Other 33%
Food processing (2002-03 data)
$65.9 billion
o v e r v i e w
2 australian food statistics 2004
food industry and its place in the domestic economy in 2003-04. The food industry encom-passes many sectors — from the producers of raw materials used in food (the farm and fi shing sectors) through export, import and processing sectors to domestic sales to consumers. The key components of the food supply chain in 2003-04 in value terms are shown in fi gure A and the main statistics are summarised in table 1.
Australian farm and fi sheries production
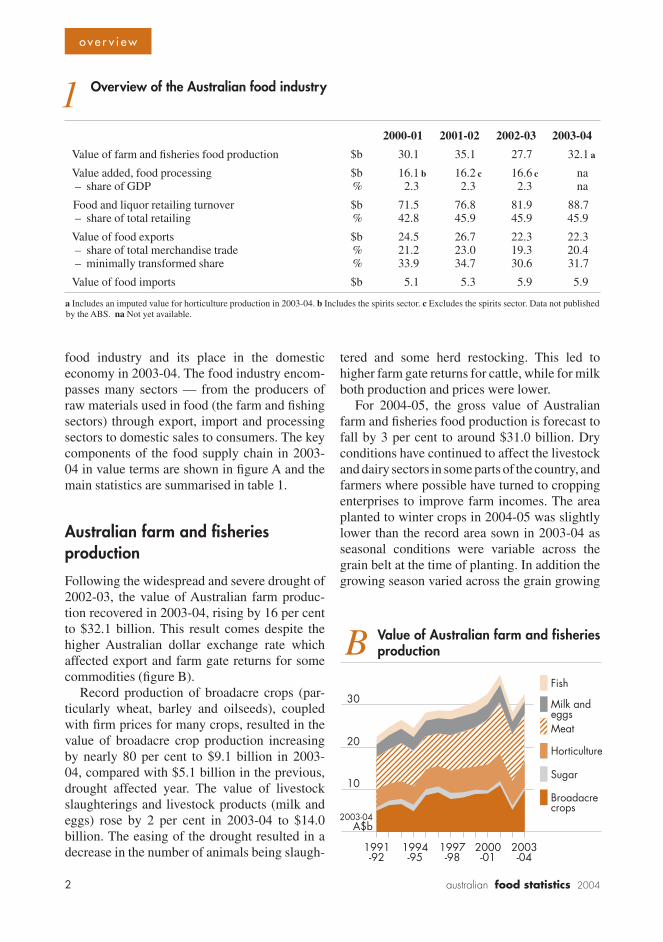
Following the widespread and severe drought of 2002-03, the value of Australian farm produc-tion recovered in 2003-04, rising by 16 per cent to $32.1 billion. This result comes despite the higher Australian dollar exchange rate which affected export and farm gate returns for some commodities (fi gure B).
Record production of broadacre crops (par-ticularly wheat, barley and oilseeds), coupled with fi rm prices for many crops, resulted in the value of broadacre crop production increasing by nearly 80 per cent to $9.1 billion in 2003-04, compared with $5.1 billion in the previous, drought affected year. The value of livestock slaughterings and livestock products (milk and eggs) rose by 2 per cent in 2003-04 to $14.0 billion. The easing of the drought resulted in a decrease in the number of animals being slaugh-
tered and some herd restocking. This led to higher farm gate returns for cattle, while for milk both production and prices were lower.
For 2004-05, the gross value of Australian farm and fi sheries food production is forecast to fall by 3 per cent to around $31.0 billion. Dry conditions have continued to affect the livestock and dairy sectors in some parts of the country, and farmers where possible have turned to cropping enterprises to improve farm incomes. The area planted to winter crops in 2004-05 was slightly lower than the record area sown in 2003-04 as seasonal conditions were variable across the grain belt at the time of planting. In addition the growing season varied across the grain growing
1 Overview of the Australian food industry
2000-01 2001-02 2002-03 2003-04
Value of farm and fi sheries food production $b 30.1 35.1 27.7 32.1 a
Value added, food processing $b 16.1 b 16.2 c 16.6 c na – share of GDP % 2.3 2.3 2.3 na
Food and liquor retailing turnover $b 71.5 76.8 81.9 88.7 – share of total retailing % 42.8 45.9 45.9 45.9
Value of food exports $b 24.5 26.7 22.3 22.3 – share of total merchandise trade % 21.2 23.0 19.3 20.4 – minimally transformed share % 33.9 34.7 30.6 31.7
Value of food imports $b 5.1 5.3 5.9 5.9
a Includes an imputed value for horticulture production in 2003-04. b Includes the spirits sector. c Excludes the spirits sector. Data not published by the ABS. na Not yet available.
o v e r v i e w
3australian food statistics 2004
belt with some cropping areas being affected by late season frost while other areas were affected by a hot, dry fi nish to the growing season. As a result, average yields are expected to be lower than those achieved in 2003-04 and hence total grain production is expected to be lower.
Australian food processingWhile data are not yet available for the Austra-lian food processing industry for 2003-04, the industry performed strongly in 2002-03, with total sales and service income estimated at $65.9 billion, nearly 3 per cent higher than the level achieved in 2001-02. In addition, industry value added by the food processing industry also rose by over 2 per cent to $16.6 billion in 2002-03. As a result of this increased growth in industry value added in 2002-03, the food and beverage sector remained the largest sector of Australia’s manufacturing industry in 2002-03, providing around 20 per cent of industry value added, and 21 per cent of total sales and services income.
Of the sectors within the food processing industry, the fruit and vegetable, oil and fat, fl our mill and cereal food, bakery products, sugar, confectionery, and beer and malt sectors all increased their sales income and industry value added in 2002-03 compared with 2001-02. The dairy products and wine sectors had lower sales income and industry value added in 2002-03 than in 2001-02. For the meat and seafood pro-cessing sectors, and the soft drink, cordial and syrup sector, although sales income was lower in 2002-03, their industry value added component was higher in 2002-03 than in 2001-02.
The meat processing sector’s share of total food and beverages industry value added in-creased by over 2 per cent to 21 per cent in 2002-03, while both the dairy processing and wine sectors’ shares fell by 2 per cent to 10 per cent and 8 per cent respectively.
Australian food retailingRetail turnover of food and liquor was esti-mated at $88.7 billion in 2003-04, an increase of over 8 per cent on 2002-03 levels. Part of this rise in turnover can be attributed to the drought,
which resulted in higher prices for many agri-cultural food commodities — particularly for fresh meats, fruit and vegetables, and eggs. These price rises were partially offset by lower prices for some foods such as bread, breakfast foods, coffee, ice cream and other dairy prod-ucts. Overall the increase in the food component of the consumer price index was 3.0 per cent in 2003-04, compared with 3.6 per cent in 2002-03. Food and liquor accounted for 46 per cent of total retail turnover in Australia in 2003-04 and has been constant at this level over the past eight years.
Supermarkets and grocery stores continue to be Australia’s most important food sales out-lets. However, their market share of food and beverage retailing by value declined slightly in 2003-04 from around 63 per cent in 2001-02 and 2002-03, to around 62 per cent. Both the liquor retailing and cafes and restaurant sectors increased their market shares of retailing value in 2003-04.
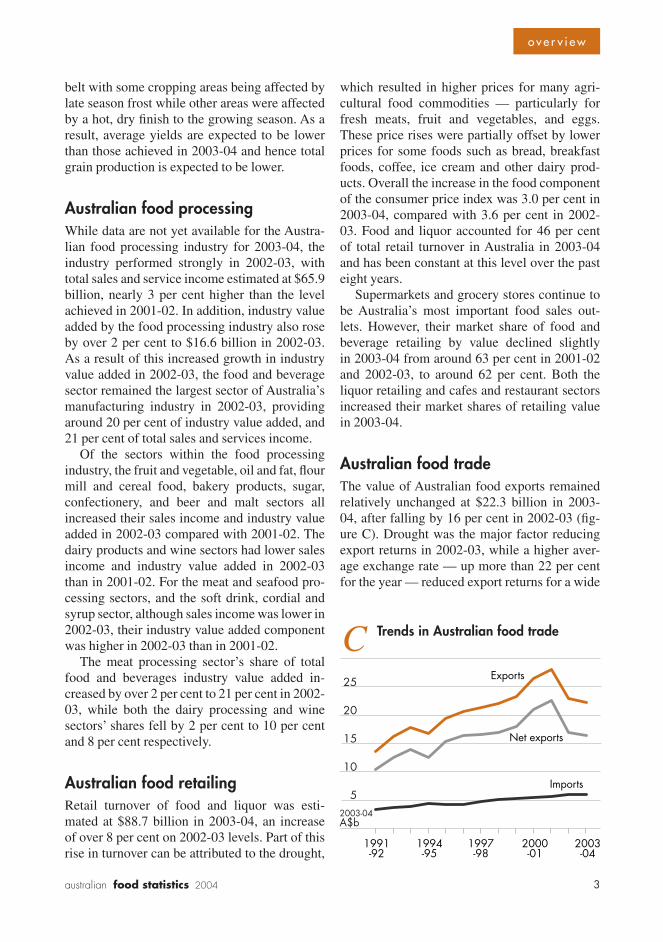
Australian food tradeThe value of Australian food exports remained relatively unchanged at $22.3 billion in 2003-04, after falling by 16 per cent in 2002-03 (fi g-ure C). Drought was the major factor reducing export returns in 2002-03, while a higher aver-age exchange rate — up more than 22 per cent for the year — reduced export returns for a wide
Trends in Australian food tradeC
2003-04
2000-01
1997-98
1994-95
1991-92
Net exports
Imports
Exports
5
10
15
20
25
2003-04 A$b
o v e r v i e w
4 australian food statistics 2004
range of Australian agricultural commodities in 2003-04. The SARS (severe acute respiratory syndrome) epidemic in the Asia Pacifi c region also contributed to the decline in Australian food exports in the second half of 2003, particularly affecting food exports intended for the Asian restaurant sector.
Substantially and elaborately transformed exports fell in 2003-04Food products within the substantially and elab-orately transformed categories were particularly affected by the higher exchange rate and the slowdown in Asian demand. The value of these exports fell by 2 per cent and 5 per cent respec-tively in 2003-04. Falls in export values within these categories were recorded in processed fruit and vegetables (down 4 per cent), dairy products (down 8 per cent), fl our mill and cereal foods (down 11 per cent), and processed seafood (down 12 per cent). Smaller falls were recorded for beverages and malt, and other foods.
… while minimally transformed exports roseIn contrast, the value of exports within the mini-mally transformed category rose by 3 per cent to $7 billion in 2003-04. Of these, the value of grains increased by 19 per cent to $4.6 billion and oilseeds increased by 37 per cent to $549 million, largely as a result of the strong post-drought increases in the production of these commodities. However, these gains were largely offset by falls in the export value of live animals (down 40 per cent to $598 million), fi sh or shell-fi sh products (down 12 per cent to $676 million) and vegetables, fruit and nuts (down 22 per cent to $568 million).
Beverage exportsIn the beverage and malt category, the value of exports declined by $5 million (0.2 per cent) to $2.87 billion mainly as a result of decreases in the export value of soft drink, cordial and syrup (down 21 per cent), beer and malt (down 13 per cent) and spirits (down 18 per cent). However, these falls were partially offset by continued growth in the value of wine exports, which were up 3 per cent to $2.49 billion in 2003-04. Since
the late 1980s, the wine industry has been a strong contributor to growth in the value of Aus-tralian beverage exports, with a trend growth rate of around 20 per cent since 1999-2000 in constant dollar terms.
The increase in the value of wine exports refl ects Australia’s growing reputation as a sup-plier of quality wine at reasonable prices. The United States became Australia’s largest cus-tomer in 2003-04, accounting for 35 per cent of the total value of wine exports, followed closely by the United Kingdom, which accounted for 34 per cent of the total value of exports. While the value of exports to the United Kingdom decreased by 3 per cent in 2003-04, growth in the value of exports to the United States was up 4 per cent, following strong growth in previous years. Australia’s other key markets were Can-ada and New Zealand, with some sales inroads also being made into the European Union. Col-lectively, these markets accounted for around 92 per cent of the value of Australian wine exports in 2003-04.
Overall growth in tradeFigure C shows the overall trend in the value of Australian food exports and imports in constant dollar terms over the thirteen years to 2003-04. Over the period from 1991-92 to 2001-02, exports grew at an average rate of 7.6 per cent in real terms, while food imports grew at a slower rate of 5.6 per cent a year over the same period.
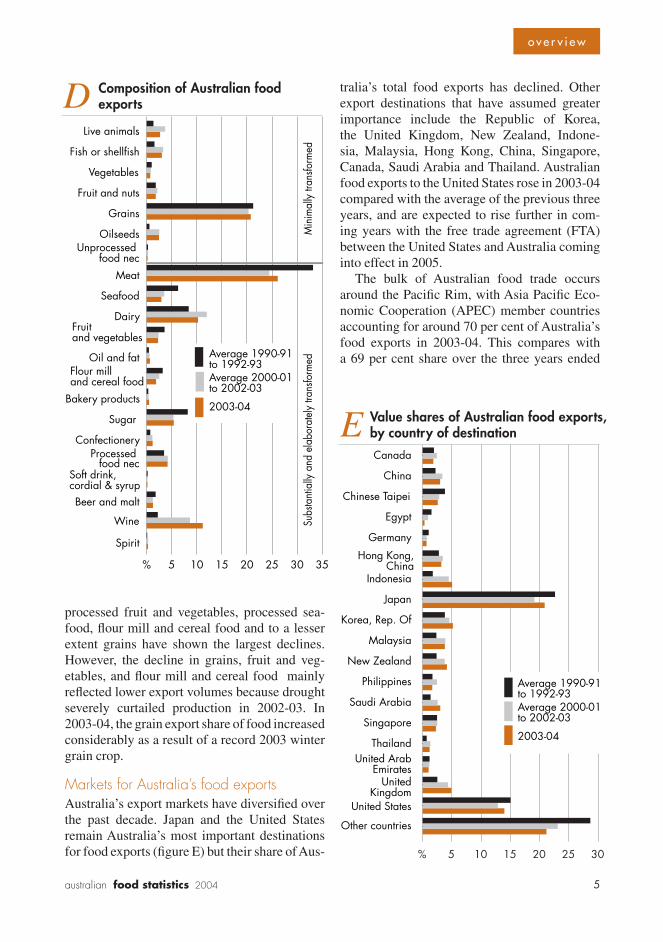
Australia’s main food exportsAustralia’s main exports continue to be meat, grains and dairy products, and more recently wine, which in 2003-04 had a greater value than total dairy product exports. However, there has been considerable diversifi cation in exports over the past decade.
Figure D shows the relative contribution of different food categories to the total value of exports for 2003-04, and the averages for the three years ended 1992-93 and the three years ended 2002-03. The relative value of wine, dairy products, oilseeds, live animals, fi sh or shellfi sh and to a lesser extent confectionery exports have increased most over the period since 1990-91, while the shares of total exports of meat, sugar,
o v e r v i e w
5australian food statistics 2004
processed fruit and vegetables, processed sea-food, fl our mill and cereal food and to a lesser extent grains have shown the largest declines. However, the decline in grains, fruit and veg-etables, and fl our mill and cereal food mainly refl ected lower export volumes because drought severely curtailed production in 2002-03. In 2003-04, the grain export share of food increased considerably as a result of a record 2003 winter grain crop.
Markets for Australia’s food exportsAustralia’s export markets have diversifi ed over the past decade. Japan and the United States remain Australia’s most important destinations for food exports (fi gure E) but their share of Aus-
tralia’s total food exports has declined. Other export destinations that have assumed greater importance include the Republic of Korea, the United Kingdom, New Zealand, Indone-sia, Malaysia, Hong Kong, China, Singapore, Canada, Saudi Arabia and Thailand. Australian food exports to the United States rose in 2003-04 compared with the average of the previous three years, and are expected to rise further in com-ing years with the free trade agreement (FTA) between the United States and Australia coming into effect in 2005.
The bulk of Australian food trade occurs around the Pacifi c Rim, with Asia Pacifi c Eco-nomic Cooperation (APEC) member countries accounting for around 70 per cent of Australia’s food exports in 2003-04. This compares with a 69 per cent share over the three years ended
Composition of Australian food exportsD
% 5 10 15 20 25 30 35
Spirit
Wine
Beer and malt
Soft drink, cordial & syrup
Processed food nec
Confectionery
Sugar
Bakery products
Flour mill and cereal food
Oil and fat
Fruit and vegetables
Dairy
Seafood
Meat
Unprocessed food nec
Oilseeds
Grains
Fruit and nuts
Vegetables
Fish or shellfish
Live animals
2003-04
Average 2000-01 to 2002-03
Average 1990-91 to 1992-93
Subs
tant
ially
and
ela
bora
tely
tran
sform
edM
inim
ally
tran
sform
ed
Value shares of Australian food exports, by country of destinationE
2003-04
Average 2000-01 to 2002-03
Average 1990-91 to 1992-93
Other countries
United States
UnitedKingdom
United ArabEmirates
Thailand
Singapore
Saudi Arabia
Philippines
New Zealand
Malaysia
Korea, Rep. Of
Japan
Indonesia
Hong Kong,China
Germany
Egypt
Chinese Taipei
China
Canada
% 5 10 15 20 25 30
o v e r v i e w
6 australian food statistics 2004
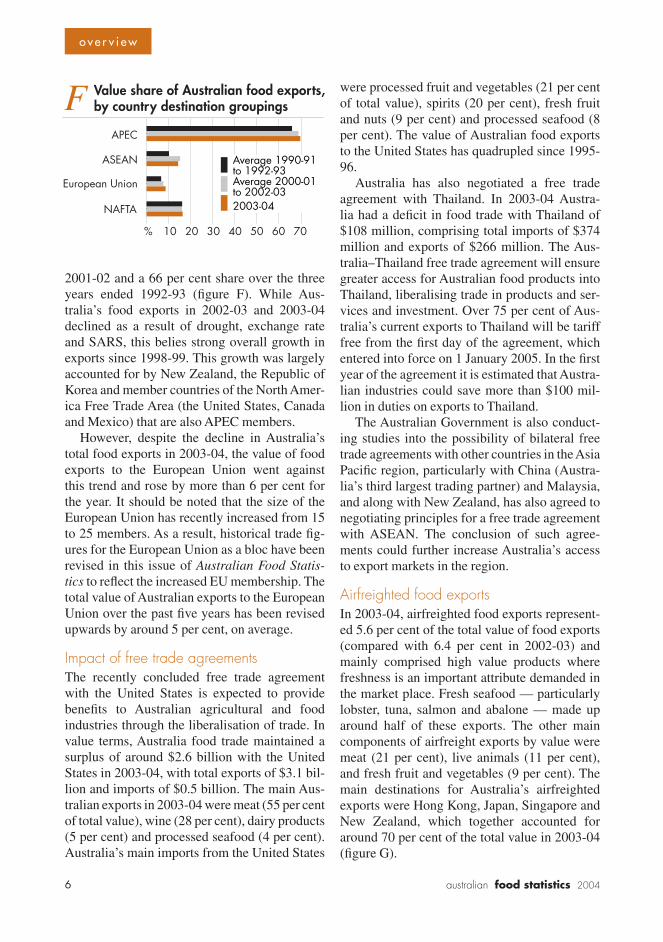
2001-02 and a 66 per cent share over the three years ended 1992-93 (fi gure F). While Aus-tralia’s food exports in 2002-03 and 2003-04 declined as a result of drought, exchange rate and SARS, this belies strong overall growth in exports since 1998-99. This growth was largely accounted for by New Zealand, the Republic of Korea and member countries of the North Amer-ica Free Trade Area (the United States, Canada and Mexico) that are also APEC members.
However, despite the decline in Australia’s total food exports in 2003-04, the value of food exports to the European Union went against this trend and rose by more than 6 per cent for the year. It should be noted that the size of the European Union has recently increased from 15 to 25 members. As a result, historical trade fi g-ures for the European Union as a bloc have been revised in this issue of Australian Food Statis-tics to refl ect the increased EU membership. The total value of Australian exports to the European Union over the past fi ve years has been revised upwards by around 5 per cent, on average.
Impact of free trade agreementsThe recently concluded free trade agreement with the United States is expected to provide benefi ts to Australian agricultural and food industries through the liberalisation of trade. In value terms, Australia food trade maintained a surplus of around $2.6 billion with the United States in 2003-04, with total exports of $3.1 bil-lion and imports of $0.5 billion. The main Aus-tralian exports in 2003-04 were meat (55 per cent of total value), wine (28 per cent), dairy products (5 per cent) and processed seafood (4 per cent). Australia’s main imports from the United States
were processed fruit and vegetables (21 per cent of total value), spirits (20 per cent), fresh fruit and nuts (9 per cent) and processed seafood (8 per cent). The value of Australian food exports to the United States has quadrupled since 1995-96.
Australia has also negotiated a free trade agreement with Thailand. In 2003-04 Austra-lia had a defi cit in food trade with Thailand of $108 million, comprising total imports of $374 million and exports of $266 million. The Aus-tralia–Thailand free trade agreement will ensure greater access for Australian food products into Thailand, liberalising trade in products and ser-vices and investment. Over 75 per cent of Aus-tralia’s current exports to Thailand will be tariff free from the fi rst day of the agreement, which entered into force on 1 January 2005. In the fi rst year of the agreement it is estimated that Austra-lian industries could save more than $100 mil-lion in duties on exports to Thailand.
The Australian Government is also conduct-ing studies into the possibility of bilateral free trade agreements with other countries in the Asia Pacifi c region, particularly with China (Austra-lia’s third largest trading partner) and Malaysia, and along with New Zealand, has also agreed to negotiating principles for a free trade agreement with ASEAN. The conclusion of such agree-ments could further increase Australia’s access to export markets in the region.
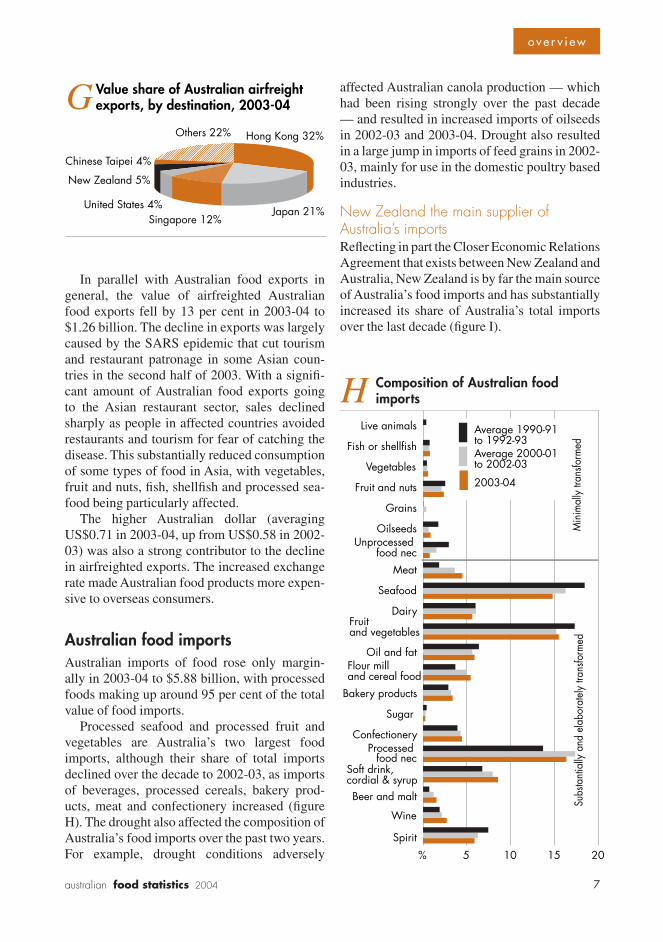
Airfreighted food exportsIn 2003-04, airfreighted food exports represent-ed 5.6 per cent of the total value of food exports (compared with 6.4 per cent in 2002-03) and mainly comprised high value products where freshness is an important attribute demanded in the market place. Fresh seafood — particularly lobster, tuna, salmon and abalone — made up around half of these exports. The other main components of airfreight exports by value were meat (21 per cent), live animals (11 per cent), and fresh fruit and vegetables (9 per cent). The main destinations for Australia’s airfreighted exports were Hong Kong, Japan, Singapore and New Zealand, which together accounted for around 70 per cent of the total value in 2003-04 (fi gure G).
Value share of Australian food exports, by country destination groupingsF
% 10 20 30 40 50 60 70
NAFTA
European Union
ASEAN
APEC
2003-04
Average 2000-01 to 2002-03
Average 1990-91 to 1992-93
o v e r v i e w
7australian food statistics 2004
In parallel with Australian food exports in general, the value of airfreighted Australian food exports fell by 13 per cent in 2003-04 to $1.26 billion. The decline in exports was largely caused by the SARS epidemic that cut tourism and restaurant patronage in some Asian coun-tries in the second half of 2003. With a signifi -cant amount of Australian food exports going to the Asian restaurant sector, sales declined sharply as people in affected countries avoided restaurants and tourism for fear of catching the disease. This substantially reduced consumption of some types of food in Asia, with vegetables, fruit and nuts, fi sh, shellfi sh and processed sea-food being particularly affected.
The higher Australian dollar (averaging US$0.71 in 2003-04, up from US$0.58 in 2002-03) was also a strong contributor to the decline in airfreighted exports. The increased exchange rate made Australian food products more expen-sive to overseas consumers.
Australian food importsAustralian imports of food rose only margin-ally in 2003-04 to $5.88 billion, with processed foods making up around 95 per cent of the total value of food imports.
Processed seafood and processed fruit and vegetables are Australia’s two largest food imports, although their share of total imports declined over the decade to 2002-03, as imports of beverages, processed cereals, bakery prod-ucts, meat and confectionery increased (fi gure H). The drought also affected the composition of Australia’s food imports over the past two years. For example, drought conditions adversely
affected Australian canola production — which had been rising strongly over the past decade — and resulted in increased imports of oilseeds in 2002-03 and 2003-04. Drought also resulted in a large jump in imports of feed grains in 2002-03, mainly for use in the domestic poultry based industries.
New Zealand the main supplier of Australia’s importsRefl ecting in part the Closer Economic Relations Agreement that exists between New Zealand and Australia, New Zealand is by far the main source of Australia’s food imports and has substantially increased its share of Australia’s total imports over the last decade (fi gure I).
Composition of Australian food importsH
Spirit
Wine
Beer and malt
Soft drink, cordial & syrup
Processed food nec
Confectionery
Sugar
Bakery products
Flour mill and cereal food
Oil and fat
Fruit and vegetables
Dairy
Seafood
Meat
Unprocessed food nec
Oilseeds
Grains
Fruit and nuts
Vegetables
Fish or shellfish
Live animals
2003-04
Average 2000-01 to 2002-03
Average 1990-91 to 1992-93
% 5 10 15 20
Subs
tant
ially
and
ela
bora
tely
tran
sform
edM
inim
ally
tran
sform
ed
Value share of Australian airfreight exports, by destination, 2003-04G
Hong Kong 32%
Japan 21%United States 4%
New Zealand 5%
Chinese Taipei 4%
Others 22%
Singapore 12%
o v e r v i e w
8 australian food statistics 2004
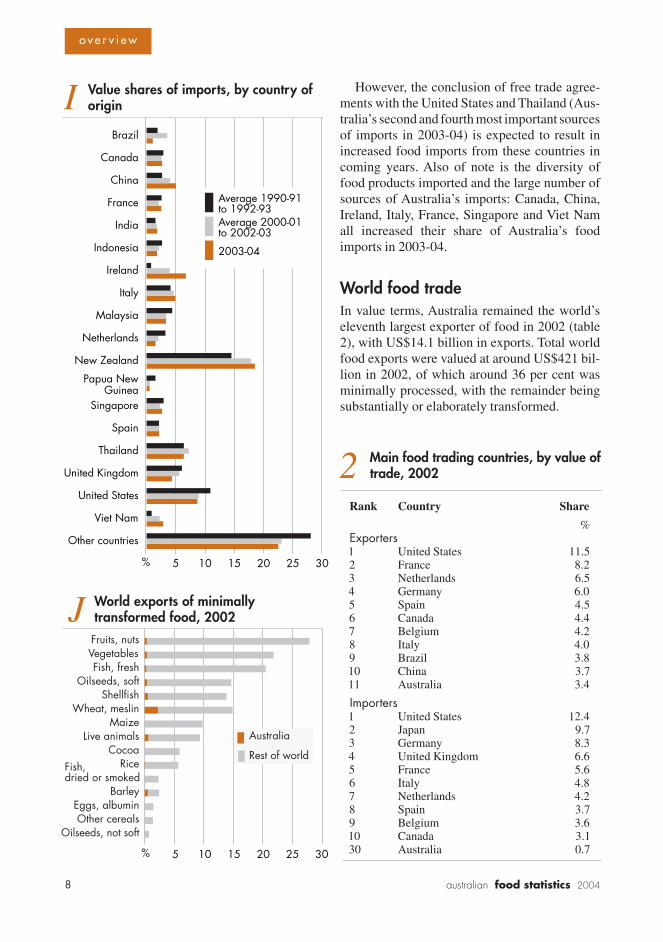
However, the conclusion of free trade agree-ments with the United States and Thailand (Aus-tralia’s second and fourth most important sources of imports in 2003-04) is expected to result in increased food imports from these countries in coming years. Also of note is the diversity of food products imported and the large number of sources of Australia’s imports: Canada, China, Ireland, Italy, France, Singapore and Viet Nam all increased their share of Australia’s food imports in 2003-04.
World food tradeIn value terms, Australia remained the world’s eleventh largest exporter of food in 2002 (table 2), with US$14.1 billion in exports. Total world food exports were valued at around US$421 bil-lion in 2002, of which around 36 per cent was minimally processed, with the remainder being substantially or elaborately transformed.
Value shares of imports, by country of originI
2003-04
Average 2000-01 to 2002-03
Average 1990-91 to 1992-93
%
Other countries
Viet Nam
United States
United Kingdom
Thailand
Spain
Singapore
Papua NewGuinea
New Zealand
Netherlands
Malaysia
Italy
Ireland
Indonesia
India
France
China
Canada
Brazil
5 10 15 20 25 30
World exports of minimally transformed food, 2002JFruits, nutsVegetablesFish, fresh
Oilseeds, softShellfish
Wheat, meslinMaize
Live animalsCocoa
RiceFish, dried or smoked
BarleyEggs, albuminOther cereals
Oilseeds, not soft
Rest of world
Australia
% 5 10 15 20 25 30
2 Main food trading countries, by value of trade, 2002
Rank Country Share
%Exporters1 United States 11.52 France 8.23 Netherlands 6.54 Germany 6.05 Spain 4.56 Canada 4.47 Belgium 4.28 Italy 4.09 Brazil 3.810 China 3.711 Australia 3.4
Importers1 United States 12.42 Japan 9.73 Germany 8.34 United Kingdom 6.65 France 5.66 Italy 4.87 Netherlands 4.28 Spain 3.79 Belgium 3.610 Canada 3.130 Australia 0.7
o v e r v i e w
9australian food statistics 2004
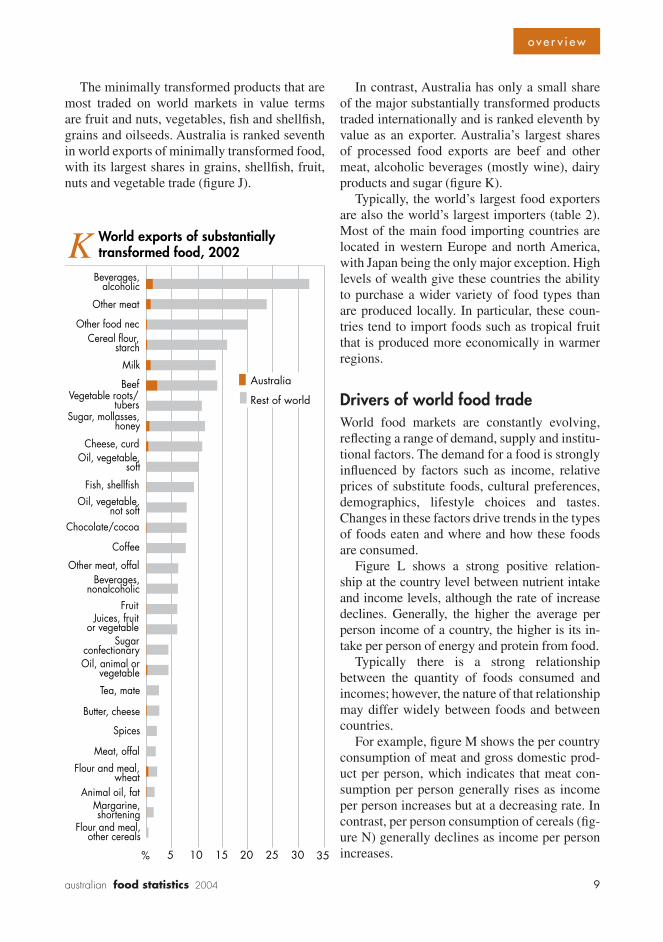
The minimally transformed products that are most traded on world markets in value terms are fruit and nuts, vegetables, fi sh and shellfi sh, grains and oilseeds. Australia is ranked seventh in world exports of minimally transformed food, with its largest shares in grains, shellfi sh, fruit, nuts and vegetable trade (fi gure J).
In contrast, Australia has only a small share of the major substantially transformed products traded internationally and is ranked eleventh by value as an exporter. Australia’s largest shares of processed food exports are beef and other meat, alcoholic beverages (mostly wine), dairy products and sugar (fi gure K).
Typically, the world’s largest food exporters are also the world’s largest importers (table 2). Most of the main food importing countries are located in western Europe and north America, with Japan being the only major exception. High levels of wealth give these countries the ability to purchase a wider variety of food types than are produced locally. In particular, these coun-tries tend to import foods such as tropical fruit that is produced more economically in warmer regions.
Drivers of world food tradeWorld food markets are constantly evolving, refl ecting a range of demand, supply and institu-tional factors. The demand for a food is strongly infl uenced by factors such as income, relative prices of substitute foods, cultural preferences, demographics, lifestyle choices and tastes. Changes in these factors drive trends in the types of foods eaten and where and how these foods are consumed.
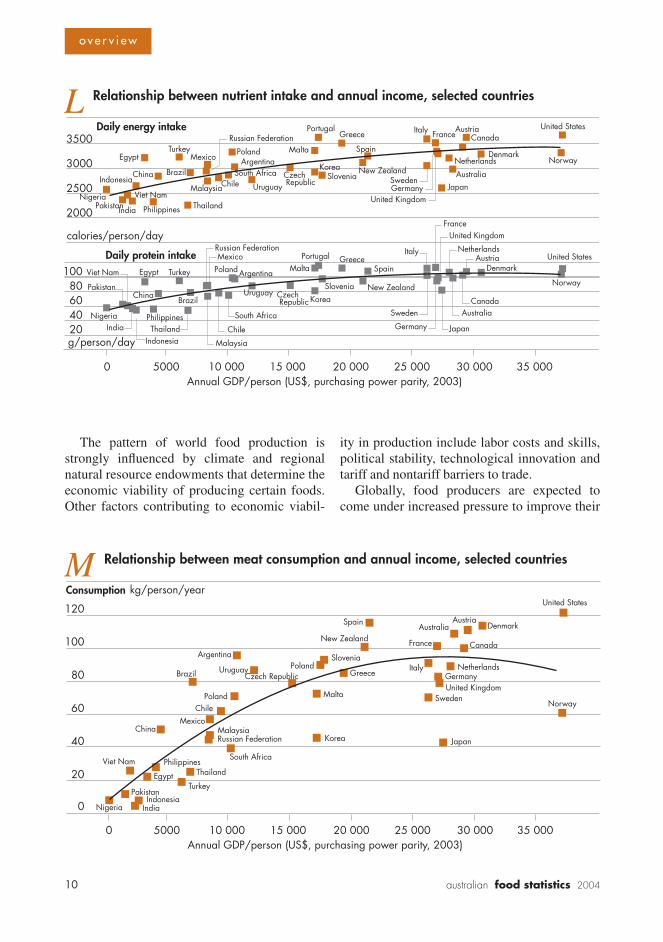
Figure L shows a strong positive relation-ship at the country level between nutrient intake and income levels, although the rate of increase declines. Generally, the higher the average per person income of a country, the higher is its in-take per person of energy and protein from food.
Typically there is a strong relationship between the quantity of foods consumed and incomes; however, the nature of that relationship may differ widely between foods and between countries.
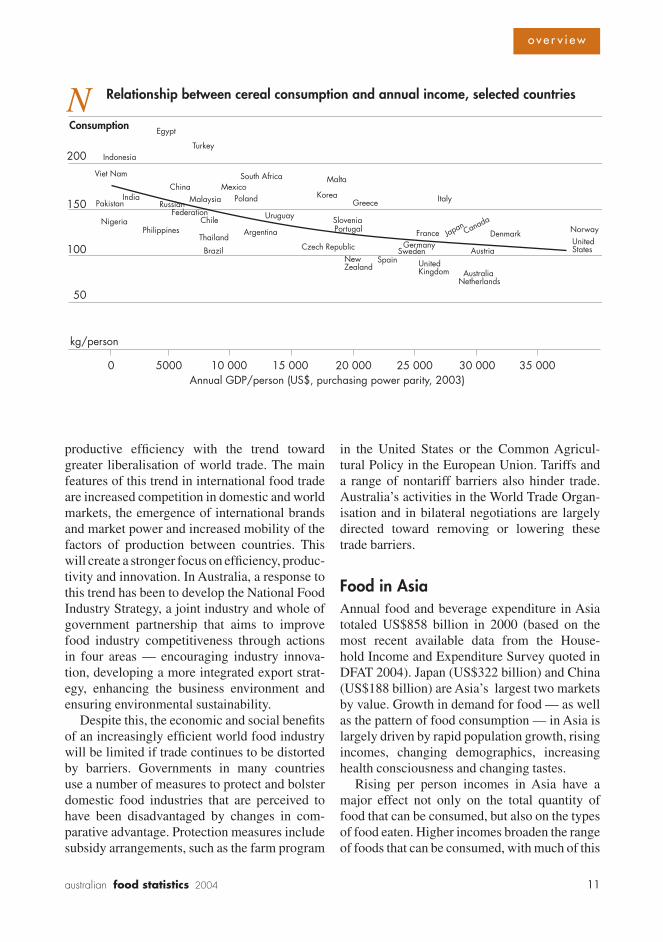
For example, fi gure M shows the per country consumption of meat and gross domestic prod-uct per person, which indicates that meat con-sumption per person generally rises as income per person increases but at a decreasing rate. In contrast, per person consumption of cereals (fi g-ure N) generally declines as income per person increases.
World exports of substantially transformed food, 2002K
Rest of world
Australia
% 5 10 15 20 25 30 35
Beverages,alcoholic
Other meat
Other food necCereal flour,
starch
Milk
BeefVegetable roots/
tubersSugar, mollasses,
honey
Cheese, curdOil, vegetable,
soft
Fish, shellfishOil, vegetable,
not softChocolate/cocoa
Coffee
Other meat, offalBeverages,
nonalcoholicFruit
Juices, fruitor vegetable
SugarconfectionaryOil, animal or
vegetable
Tea, mate
Butter, cheese
Spices
Meat, offalFlour and meal,
wheatAnimal oil, fat
Margarine,shortening
Flour and meal,other cereals
o v e r v i e w
10 australian food statistics 2004
The pattern of world food production is strongly infl uenced by climate and regional natural resource endowments that determine the economic viability of producing certain foods. Other factors contributing to economic viabil-
ity in production include labor costs and skills, political stability, technological innovation and tariff and nontariff barriers to trade.
Globally, food producers are expected to come under increased pressure to improve their
2000
2500
3000
3500Daily energy intake
20406080
100Daily protein intake
g/person/day
calories/person/day
L Relationship between nutrient intake and annual income, selected countries
United States
United States
Norway
Norway
Austria
Austria
Australia
CanadaFrance
France
50000 10 000 15 000 20 000Annual GDP/person (US$, purchasing power parity, 2003)
25 000 30 000 35 000
Australia
Denmark
Denmark
Czech Republic
Czech Republic
New Zealand
New Zealand
Spain
Spain
Sweden
Sweden
Japan
Canada
Japan
Germany
Germany
United Kingdom
United Kingdom
Malta
Malta
Turkey
Turkey
Brazil
Thailand
Thailand
Russian Federation
Russian Federation
Malaysia
Malaysia
Korea
Korea
Italy
Italy
Netherlands
Netherlands
Egypt
Egypt
Nigeria
Nigeria
India
India
Philippines
Philippines
Poland
Poland
Portugal
Portugal
Brazil
Argentina
South AfricaArgentina
South Africa
Mexico
Mexico
Chile
Chile
Uruguay
Uruguay
Slovenia
Slovenia
Greece
Greece
China
China
Viet Nam
Viet Nam
Indonesia
Indonesia
Pakistan
Pakistan
Consumption
20
0
40
60
80
100
120
kg/person/yearM Relationship between meat consumption and annual income, selected countries
United States
Norway
AustriaAustralia Denmark
CanadaFrance
50000 10 000 15 000 20 000Annual GDP/person (US$, purchasing power parity, 2003)
25 000 30 000 35 000
Czech Republic
New Zealand
Spain
Sweden
Japan
GermanyUnited Kingdom
Malta
Turkey
Thailand
Russian FederationMalaysia
Korea
Italy Netherlands
Egypt
Nigeria India
Philippines
Poland
PolandBrazil
Argentina
South Africa
MexicoChile
UruguaySlovenia
Greece
China
Viet Nam
IndonesiaPakistan
o v e r v i e w
11australian food statistics 2004
productive effi ciency with the trend toward greater liberalisation of world trade. The main features of this trend in international food trade are increased competition in domestic and world markets, the emergence of international brands and market power and increased mobility of the factors of production between countries. This will create a stronger focus on effi ciency, produc-tivity and innovation. In Australia, a response to this trend has been to develop the National Food Industry Strategy, a joint industry and whole of government partnership that aims to improve food industry competitiveness through actions in four areas — encouraging industry innova-tion, developing a more integrated export strat-egy, enhancing the business environment and ensuring environmental sustainability.
Despite this, the economic and social benefi ts of an increasingly effi cient world food industry will be limited if trade continues to be distorted by barriers. Governments in many countries use a number of measures to protect and bolster domestic food industries that are perceived to have been disadvantaged by changes in com-parative advantage. Protection measures include subsidy arrangements, such as the farm program
in the United States or the Common Agricul-tural Policy in the European Union. Tariffs and a range of nontariff barriers also hinder trade. Australia’s activities in the World Trade Organ-isation and in bilateral negotiations are largely directed toward removing or lowering these trade barriers.
Food in AsiaAnnual food and beverage expenditure in Asia totaled US$858 billion in 2000 (based on the most recent available data from the House-hold Income and Expenditure Survey quoted in DFAT 2004). Japan (US$322 billion) and China (US$188 billion) are Asia’s largest two markets by value. Growth in demand for food — as well as the pattern of food consumption — in Asia is largely driven by rapid population growth, rising incomes, changing demographics, increasing health consciousness and changing tastes.
Rising per person incomes in Asia have a major effect not only on the total quantity of food that can be consumed, but also on the types of food eaten. Higher incomes broaden the range of foods that can be consumed, with much of this
Consumption
50
100
150
200
kg/person
N Relationship between cereal consumption and annual income, selected countries
United States
Norway
Czech RepublicNew Zealand
SpainSweden
GermanyFrance
United Kingdom
JapanCanada
Malta
Turkey
GreeceKorea Italy
Australia
Austria
Netherlands
Egypt
Nigeria
PakistanIndia
PhilippinesThailand
Brazil
Argentina
South AfricaMexico
Chile Uruguay SloveniaPortugal
China
Viet Nam
Indonesia
Denmark
50000 10 000 15 000 20 000Annual GDP/person (US$, purchasing power parity, 2003)
25 000 30 000 35 000
Malaysia PolandRussian Federation
o v e r v i e w
12 australian food statistics 2004
consumption being of the more expensive foods — particularly livestock products like meat and dairy products as well as higher value fruit and vegetable products. Higher per person incomes also raise the opportunity cost of time spent on procuring and preparing food so that it becomes economical to consume more ready-to-eat foods such as takeaways, snacks and soft drinks. As a result, the pattern of Asian food consump-tion has changed dramatically over the past few decades, with the adoption of more western style diets that are characterised by increased protein and nutrient intake.
The pattern of food consumption is also strongly linked to urbanisation. Asian popula-tions have become increasingly urbanised over the past few decades, refl ecting greater employ-ment opportunities and higher incomes in the manufacturing and services sectors. In urban areas, higher incomes result in greater per per-son expenditure on food and beverages, although this represents a smaller percentage share of total household expenditure than it does for rural inhabitants. Urban areas also provide access to a wider range of foods. Together with higher incomes, this results in the consumption of greater amounts of food and beverages, of better quality and greater variety than usually exists in rural areas. Typically, much of the consumption in urban areas is of the more highly processed foods available from restaurants and fast food outlets, together with increased amounts of pre-prepared meals available from supermarkets.
Population demographics also have a strong impact on the pattern of food consumption. Asia is the world’s most populous region and main-tains the highest rates of population growth — a strong driver of food demand. However, this growth is slowing. Falling birth rates and rising life expectancies are particularly evident in the developed Asian economies such as Japan. The aging of the population in Asia has resulted in a changing pattern of food consumption, as older people tend to eat smaller quantities of food and favor foods that are of higher quality — particu-larly those with greater health and nutritional benefi ts. However, despite the aging of the popu-lation, for the next several decades Asia’s devel-oping economies will continue to be dominated by younger age groups, whose tastes tend toward greater amounts of highly processed foods such as takeaways, soft drinks and icecream. Across all age groups, the more highly processed and higher valued foods are expected to remain the major areas of growth in Asian food demand.
ReferenceDFAT (Australian Government Department of
Foreign Affairs and Trade) 2004, Agrifood Globalisation and Asia, vol. III: Asian Agri-food Demand Trends and Outlook to 2010, Canberra, July.
o v e r v i e w
13australian food statistics 2004
SPECIALTY CHEESEa growing sector of the Australian cheese industryRidge Partners, PO Box 13081, George Street, Brisbane, Qld 4003
The Australian specialty cheese sector has expe-rienced rapid growth over the past decade, with production more than doubling. Despite this growth, the domestic specialty cheese produc-tion sector and the domestic market remain rela-tively small, consuming relatively low amounts of specialty lines per person. The specialty sector is well established and plays an important role within the Australian dairy industry, serviced by a membership organisation, the Australian Spe-cialty Cheesemakers Association (ASCA), which represents about 70 per cent of an estimated 100 specialist manufacturers nationwide (D. Brown, ASCA, personal communication, 2004).
In this article the growing prominence of the specialty cheese market, both in Australia and worldwide, is examined. It provides an overview of the specialty cheese sector, details of sector dynamics and leadership, and a summary of domestic and international market performance. It also explores differing business models occur-ring within the industry.
Overview of the sectorDefi ning ‘specialty cheese’ is often an ambigu-ous and disputed issue. The term is commonly used to describe any cheese variety that is dif-ferentiated, or non-commodity, in style or pack-aging. However, some view specialty cheeses as consisting only of the cheese groups defi ned as fresh, stretched curd, blue and surface ripened. A third view includes a wider range of hard cooked and semihard cooked varieties within the defi nition.
The sector is dominated by cheeses made from cow’s milk (estimated at 97 per cent of spe-cialty lines by volume), with sheep and goat’s milk products making up the remainder. Spe-cialty cheeses are often produced in small fac-tory operations with labor intensive processes, carry the perception of a value added product, usually with ethnic origins and/or specialised manufacturing processes, or are distributed in unique packaging (D. Brown, ASCA, personal communication, 2004).
The range of Australian specialty cheese mak-ing operations is diverse — from a small number of groups that are divisions of large dairy con-
Key features of the Australian specialty cheese sector
• ASCA, with approximately 70 members, accounts for an estimated 70 per cent of all Australian specialist cheesemakers
• 27 000 tonnes of specialty cheese were produced by ASCA members in 2003-04
— over 7 per cent of total cheese production• 30 per cent of specialty cheeses sold in
Australian supermarkets are imported• Australian market for speciality cheeses in
2003-04 was valued at more than $300 million at wholesale
• About 4 per cent of Australian specialty cheeses are exported
• Cumulative annual volume growth of the sector has been 6–7 per cent over the past ten years
s p e c i a l t y c h e e s e
14 australian food statistics 2004
glomerates, right through to small farm produc-tion facilities consuming only part of the output of a small dairy herd. The sector now features many readily identifi able brands, including King Island, Jindi, Ashgrove Farm Cheese, Tarago River Cheese Company, Water Wheel, Yarra Valley Dairy, Margaret River, South Cape, Milawa, Lemnos, and Tasmanian Heritage.
Table 1 details the cheese styles included in the Australian Specialist Cheesemakers Associ-ation product class defi nition. The ASCA credits cheeses as ‘specialty’ if they are produced by ASCA members. These include dessert cheeses, salad cheeses, indulgence/premium cheeses and cooking items.
What may be termed ‘specialty’ in the Aus-tralian market includes many cheese styles that are traditional varieties produced as commodity lines in a number of European dairy regions.
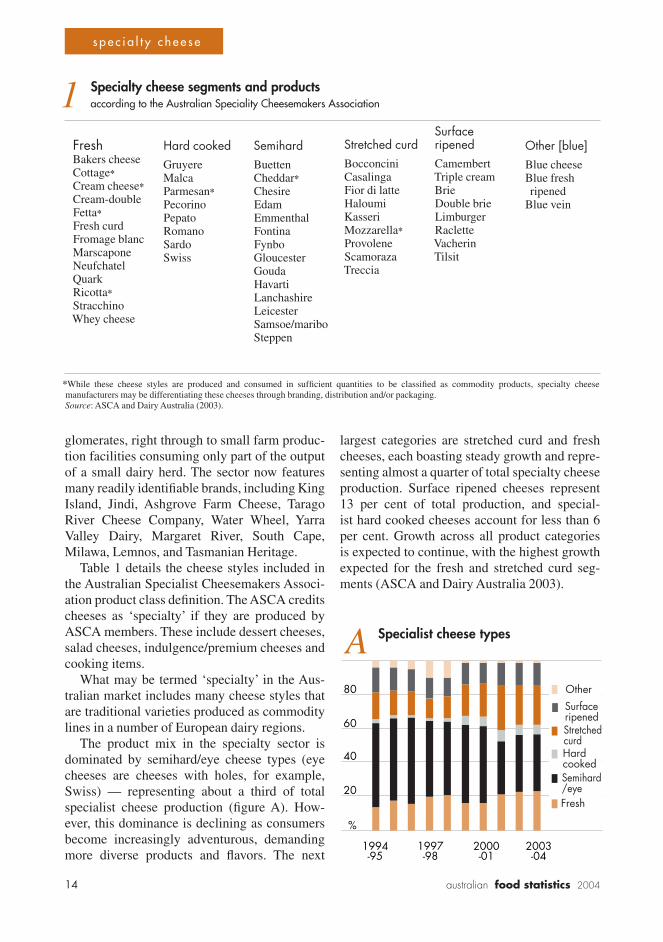
The product mix in the specialty sector is dominated by semihard/eye cheese types (eye cheeses are cheeses with holes, for example, Swiss) — representing about a third of total specialist cheese production (fi gure A). How-ever, this dominance is declining as consumers become increasingly adventurous, demanding more diverse products and fl avors. The next
largest categories are stretched curd and fresh cheeses, each boasting steady growth and repre-senting almost a quarter of total specialty cheese production. Surface ripened cheeses represent 13 per cent of total production, and special-ist hard cooked cheeses account for less than 6 per cent. Growth across all product categories is expected to continue, with the highest growth expected for the fresh and stretched curd seg-ments (ASCA and Dairy Australia 2003).
1 Specialty cheese segments and productsaccording to the Australian Speciality Cheesemakers Association
FreshBakers cheeseCottage*Cream cheese*Cream-doubleFetta*Fresh curdFromage blancMarscaponeNeufchatelQuarkRicotta*StracchinoWhey cheese
Hard cookedGruyereMalcaParmesan*PecorinoPepatoRomanoSardoSwiss
SemihardBuettenCheddar*ChesireEdamEmmenthalFontinaFynboGloucesterGoudaHavartiLanchashireLeicesterSamsoe/mariboSteppen
Stretched curdBocconciniCasalingaFior di latteHaloumiKasseriMozzarella*ProvoleneScamorazaTreccia
Surface ripenedCamembertTriple creamBrieDouble brieLimburgerRacletteVacherinTilsit
Other [blue]Blue cheeseBlue fresh ripenedBlue vein
*While these cheese styles are produced and consumed in suffi cient quantities to be classifi ed as commodity products, specialty cheese manufacturers may be differentiating these cheeses through branding, distribution and/or packaging.Source: ASCA and Dairy Australia (2003).
Specialist cheese typesA
2003-04
2000-01
1997-98
1994-95
80
60
40
20
%
OtherSurface ripenedStretched curdHard cookedSemihard /eyeFresh
s p e c i a l t y c h e e s e
15australian food statistics 2004
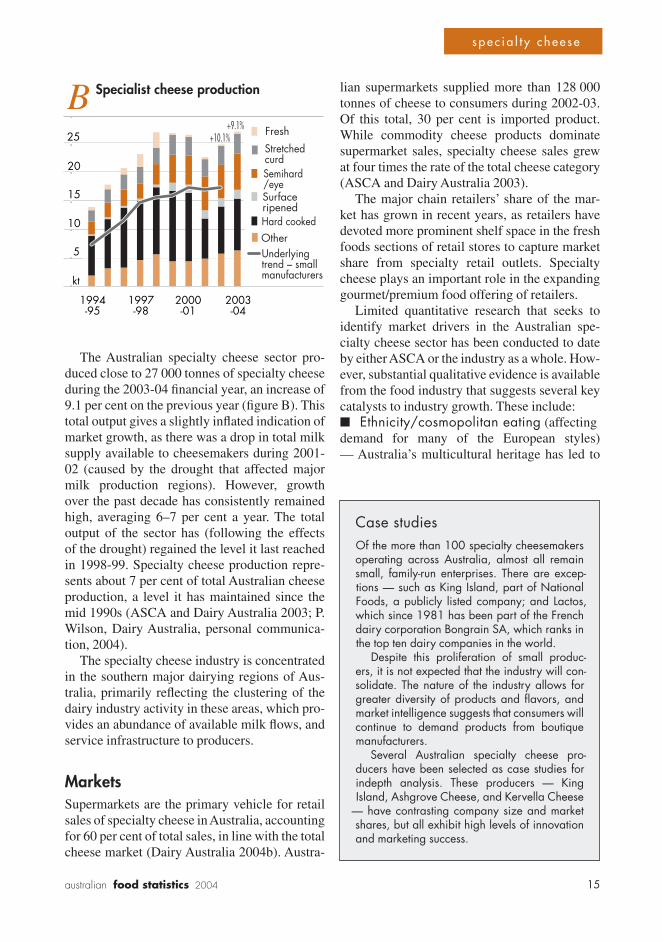
The Australian specialty cheese sector pro-duced close to 27 000 tonnes of specialty cheese during the 2003-04 fi nancial year, an increase of 9.1 per cent on the previous year (fi gure B). This total output gives a slightly infl ated indication of market growth, as there was a drop in total milk supply available to cheesemakers during 2001-02 (caused by the drought that affected major milk production regions). However, growth over the past decade has consistently remained high, averaging 6–7 per cent a year. The total output of the sector has (following the effects of the drought) regained the level it last reached in 1998-99. Specialty cheese production repre-sents about 7 per cent of total Australian cheese production, a level it has maintained since the mid 1990s (ASCA and Dairy Australia 2003; P. Wilson, Dairy Australia, personal communica-tion, 2004).
The specialty cheese industry is concentrated in the southern major dairying regions of Aus-tralia, primarily refl ecting the clustering of the dairy industry activity in these areas, which pro-vides an abundance of available milk fl ows, and service infrastructure to producers.
MarketsSupermarkets are the primary vehicle for retail sales of specialty cheese in Australia, accounting for 60 per cent of total sales, in line with the total cheese market (Dairy Australia 2004b). Austra-
lian supermarkets supplied more than 128 000 tonnes of cheese to consumers during 2002-03. Of this total, 30 per cent is imported product. While commodity cheese products dominate supermarket sales, specialty cheese sales grew at four times the rate of the total cheese category (ASCA and Dairy Australia 2003).
The major chain retailers’ share of the mar-ket has grown in recent years, as retailers have devoted more prominent shelf space in the fresh foods sections of retail stores to capture market share from specialty retail outlets. Specialty cheese plays an important role in the expanding gourmet/premium food offering of retailers.
Limited quantitative research that seeks to identify market drivers in the Australian spe-cialty cheese sector has been conducted to date by either ASCA or the industry as a whole. How-ever, substantial qualitative evidence is available from the food industry that suggests several key catalysts to industry growth. These include:■ Ethnicity/cosmopolitan eating (affecting demand for many of the European styles) — Australia’s multicultural heritage has led to
Specialist cheese productionB
2003-04
2000-01
1997-98
1994-95
Fresh
Stretched curdSemihard /eyeSurface ripenedHard cookedOtherUnderlying trend – small manufacturers
+9.1%+10.1%
20
5
kt
15
10
25
Case studiesOf the more than 100 specialty cheesemakers operating across Australia, almost all remain small, family-run enterprises. There are excep-tions — such as King Island, part of National Foods, a publicly listed company; and Lactos, which since 1981 has been part of the French dairy corporation Bongrain SA, which ranks in the top ten dairy companies in the world.
Despite this proliferation of small produc-ers, it is not expected that the industry will con-solidate. The nature of the industry allows for greater diversity of products and fl avors, and market intelligence suggests that consumers will continue to demand products from boutique manufacturers.
Several Australian specialty cheese pro-ducers have been selected as case studies for indepth analysis. These producers — King Island, Ashgrove Cheese, and Kervella Cheese
— have contrasting company size and market shares, but all exhibit high levels of innovation and marketing success.
s p e c i a l t y c h e e s e
16 australian food statistics 2004
the assimilation of ethnic, European cuisine into Australian diets. The increased worldliness of the Australian population (as more citizens experience international travel or are exposed to ethnic cuisine) is also believed to have had a positive impact on domestic consumption of European-style cheeses.■ Indulgence/experience (affecting products such as brie, camemberts, blue vein lines etc) — increasing living standards and disposable incomes in Australia are believed to have led to the increased consumption of indulgence lines such as brie and camembert.■ Diet (affecting products such as cottage, ricotta, fetta etc) — the push toward healthy eat-ing and low-fat diets beginning during the 1990s is believed to have increased the domestic mar-ket for low-fat cheeses such as cottage cheese and ricotta. The preference of natural health practitioners and health food stores for non-dairy products has seen an increased market for
goat’s milk cheeses, particularly low-fat goat’s milk fetta.
Specialty cheeses maintain signifi cant price premiums over commodity cheeses in Austra-lia for a variety of reasons. Australian specialty cheese products sold through supermarkets aver-aged a premium of $7.00 a kilogram over con-ventional volume lines of cheddar cheese items during the 2002-03 fi nancial year (commodity tasty cheddar retails in supermarkets at an aver-age of $7–8 a kilogram for larger pack sizes). This premium typically increases by at least $1 a kilogram in peak demand periods such as the Christmas season (ASCA and Dairy Australia 2003).
The prices of specialty cheese lines are deter-mined by several issues along the supply chain. However, differentiation in the specialty cheese category results in less substitution and higher brand loyalty — creating opportunities for higher retail prices and margins. In a survey conducted
King Island Dairy, Australia’s largest specialty cheese manufacturer has undergone signifi cant changes in recent years. National Foods acquired the King Island Group along with its premium cheese brands of King Island Dairy, South Cape, Clover Creek, Tilba and Timboon and other gour-met foods brand of Superior Gold in February 2002. National Foods is Australia’s only publicly listed dairy company, with an annual turnover in excess of A$1.3 billion. Leading National Foods brands include Pura, Farmers Union, Classic, Yo-plait, Fruche and Yogo.
King Island Dairy produces in excess of 2500 tonnes of specialty cheese a year, employs more than 300 staff, and is by far Australia’s most recog-nisable specialty cheese brand (National Foods Limited 2003a).
Following takeover by National Foods, King Island Dairy has been transformed into a business unit that is capable of achieving a satisfactory return on the investment that has been ploughed into the business by its owner. National Foods has restructured the operations, rebuilding their foun-
dations and focusing on getting ‘the basics right’. Specifi cally, King Island management has put resources into getting quality product into the right distribution channels at the right times. King Island’s focus on inventory management saw them imple-ment new sales and operating planning systems
— a move that resulted in a signifi cant improvement in cold chain management and decreases in wast-age (National Foods Limited 2003b).
The changes at King Island have had impressive quantifi able results — an increase in domestic mar-ket share from 18 per cent to 22–23 per cent of the total specialty cheese market. King Island is also Australia’s leading exporter of specialty cheeses
— exceeding $1 million a year. The United States, Japan, Singapore and Hong Kong have tradition-ally absorbed these exports; however, King Island imports have recently become available in China.
King Island won the Tasmanian Emerging Exporter award for 2002, following their presti-gious segment win at the New York Fancy Food Show in 2000 (National Foods Limited 2003b).
King Island Dairy
s p e c i a l t y c h e e s e
17australian food statistics 2004
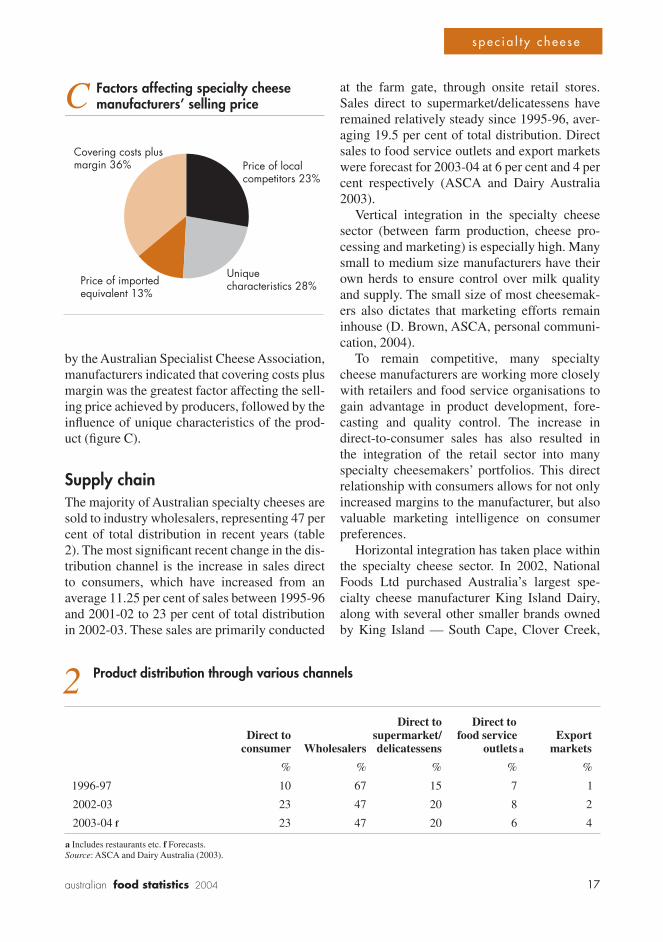
by the Australian Specialist Cheese Association, manufacturers indicated that covering costs plus margin was the greatest factor affecting the sell-ing price achieved by producers, followed by the infl uence of unique characteristics of the prod-uct (fi gure C).
Supply chainThe majority of Australian specialty cheeses are sold to industry wholesalers, representing 47 per cent of total distribution in recent years (table 2). The most signifi cant recent change in the dis-tribution channel is the increase in sales direct to consumers, which have increased from an average 11.25 per cent of sales between 1995-96 and 2001-02 to 23 per cent of total distribution in 2002-03. These sales are primarily conducted
at the farm gate, through onsite retail stores. Sales direct to supermarket/delicatessens have remained relatively steady since 1995-96, aver-aging 19.5 per cent of total distribution. Direct sales to food service outlets and export markets were forecast for 2003-04 at 6 per cent and 4 per cent respectively (ASCA and Dairy Australia 2003).
Vertical integration in the specialty cheese sector (between farm production, cheese pro-cessing and marketing) is especially high. Many small to medium size manufacturers have their own herds to ensure control over milk quality and supply. The small size of most cheesemak-ers also dictates that marketing efforts remain inhouse (D. Brown, ASCA, personal communi-cation, 2004).
To remain competitive, many specialty cheese manufacturers are working more closely with retailers and food service organisations to gain advantage in product development, fore-casting and quality control. The increase in direct-to-consumer sales has also resulted in the integration of the retail sector into many specialty cheesemakers’ portfolios. This direct relationship with consumers allows for not only increased margins to the manufacturer, but also valuable marketing intelligence on consumer preferences.
Horizontal integration has taken place within the specialty cheese sector. In 2002, National Foods Ltd purchased Australia’s largest spe-cialty cheese manufacturer King Island Dairy, along with several other smaller brands owned by King Island — South Cape, Clover Creek,
2 Product distribution through various channels
Direct to Direct to Direct to supermarket/ food service Export consumer Wholesalers delicatessens outlets a markets
% % % % %
1996-97 10 67 15 7 1
2002-03 23 47 20 8 2
2003-04 f 23 47 20 6 4
a Includes restaurants etc. f Forecasts.Source: ASCA and Dairy Australia (2003).
Factors affecting specialty cheese manufacturers’ selling priceC
Covering costs plus margin 36%
Price of imported equivalent 13%
Price of localcompetitors 23%
Unique characteristics 28%
s p e c i a l t y c h e e s e
18 australian food statistics 2004
Tilba and Timboon (National Foods Limited 2003a).
TradeInternational trade signifi cantly infl uences the Australian specialty cheese sector, with the do-mestic market exposed to signifi cant imports, as noted earlier. The majority of these imported products are sourced from Europe as the source of many of the traditional ‘name’ cheese styles, with a small amount from New Zealand.
A controversial issue in the sector remains the Australian regulation preventing the sale of cheese products made with raw milk. This applies to both domestically produced products, and any imports coming into the Australian mar-ket. This regulation was introduced as a health-safety measure; however, many foreign cheese
manufacturers ague that it is merely a disguised trade barrier.
Signifi cant media attention has also been dedicated to this issue, citing the desire of Aus-tralian specialty cheese manufacturers to use unpasteurised milk in their products. Countering media reports contend this desire has been vastly overstated, given that a survey of Australian Spe-cialist Cheesemakers Association members indi-cated only 5 per cent of manufacturers would be interested in making cheese from unpasteurised milk ((D. Brown, ASCA, personal communica-tion, 2004). However, not all specialty cheese manufacturers belong to ASCA, and some cite the strong lobbying of the organisation for the continued restrictions on unpasteurised milk as their reason for not joining (Newton 2004). In any case, this issue is one that creates a signifi -cant divide within the industry.
The successful Ashgrove Cheese emerged on the specialty cheese scene through necessity rather than desire. During the early 1990s, the Bennett family, Ashgrove owners, realised they needed to add value to their milk production to survive in a dairy industry moving toward deregulation.
Starting production in 1993, Ashgrove strategy was for import replacement, rather than direct com-petition with domestic brands. Ashgrove pursued this strategy by producing cheeses not manufac-tured in Australia at the time – English county styles such as Cheshire, Red Leicester, Double Gloucester and Lancashire. However, imports were still formi-dable competitors, especially those coming out of the European Union advantaged by generous subsidies (J. Bennett, Ashgrove Cheese, personal communication, 2004).
However, in 1997 the Uruguay Round of GATT talks dramatically changed Australian market dynamics for specialty cheeses. EU agricultural subsidies were cut by 30 per cent, and the result-ing price increase of imported cheeses, particularly from France, made Ashgrove’s products far more competitive. Jane Bennett of Ashgrove Cheese claims that as a result of the decreased subsidies, Ashgrove’s market doubled overnight. In the same year, Jane was also awarded ABC’s ‘Rural Woman
of the Year’. Bennett seized on this opportunity for publicity and leveraged her new-found exposure to build the Ashgrove brand (Development Tasma-nia 2003).
Ashgrove has also ventured into export markets, achieving market penetration in the United States, Singapore, Taiwan, Hong Kong, and now in Japan with a customised wasabi cheese. However, Ashgrove’s fi rst attempt at introducing the product to Japanese importers was unsuccessful – with importers disgusted and appalled by the wasabi cheese line. It wasn’t until the product found fame through a Japanese TV travel show that the wasabi cheese entered the Japanese market. Its popularity has since surpassed all expectations (Development Tasmania 2003).
Ashgrove has also included tourist destination to its business model. The cheesemakers operates a retail store at its Tasmanian factory, following an industrywide trend toward direct-to-consumer sales. Staff at Ashgrove (20 in total) provide free cheese education to tourists, investing in consumer confi dence and brand loyalty.
Ashgrove management credit much of their suc-cess to their investment in skill development, and the relationships they have developed with quality distributors.
Ashgrove Cheese
s p e c i a l t y c h e e s e
19australian food statistics 2004
Global industry and international competitorsAt the present time it remains very diffi cult to assess the total size of the global industry and market for specialty cheese. This is linked to the ambiguity of defi nition for the specialty cheese category, which is as much an issue in major cheese production centres overseas as it is in Australia. As well as the differing defi nitions used within the Australian industry, globally the defi nition is even more obscure — as what is a specialty cheese in one country may be a mass-produced, commodity product in another. For example, while camembert produced in Austra-lia is considered to be a specialty cheese (part of the 3200 tonnes of surface ripened cheese pro-duced in 2002-03), to French manufacturers it is a commodity line, with production reaching approximately 130 000 tonnes a year (Couve-laere and Jadji 2003).
While Australia’s specialty cheese industry has grown rapidly since the 1980s, it remains very small by world standards. European nations such as France, Greece, Switzerland, Italy and Denmark are seen as the more traditional pro-ducers of specialty cheeses.
French consumption of cheese is the largest in the world, averaging 24.5 kilograms per per-son each year, with total consumption exceeding 1.45 million tonnes a year. Production of goat’s cheese has increased signifi cantly in France during the past few years. In 2002, goat cheese production rose by 5.7 per cent, compared with only 0.6 per cent for the more established cow’s milk cheese (accounting for 93.3 per cent of total production), and 0.8 per cent for the smaller ewe’s milk cheese sector. In total, there are more than 400 varieties of cheese produced in France (Couvelaere and Jadji 2003).
France is universally considered by Austra-lian specialty cheese industry experts as Aus-tralia’s most signifi cant competitor in both the domestic and export markets. French exports of cheese total more than 500 000 tonnes a year – valued at more than €2 billion. Germany absorbs the largest proportion of this product (25.2 per cent), followed by Belgium (13.6 per cent), the United Kingdom (10.4 per cent), Italy (8.7 per
cent), Spain (7.7 per cent), the United States (4.6 per cent), and the Netherlands (4 per cent) (Couvelaere and Jadji 2003).
Export marketOnly about 4 per cent of Australian specialty cheese produce is exported. Like for many other food sectors and bulk commodity cheese prod-ucts, Japan stands out as a key export market for Australian specialty cheeses. The Japanese mar-ket for cheese has shown steady growth since the mid 1990s, and now absorbs approximately half of all Australian cheese exports, making that country the most valuable single market desti-nation for dairy products. Australia remains the leading exporter of cheese to Japan, responsible for 44 per cent of imported product by volume and 41 per cent by value (P. Wilson, personal communication, 2004).
Most of this cheese is used as an ingredient in food production; however, growth has occurred in Japanese consumption of cheese by itself. Much of this growth is attributed to the increase in popularity of wine in Japan, and the ability of distributors to cross-promote specialty cheeses simultaneously.
Cheese consumption in Japan is on an upward trend in both value and volume; however, con-sumption per person remains very low — approximately 2 kilograms a year (Japan Today 2003). This low fi gure suggests room for fur-ther growth in the market; however, Australian producers face high competition chiefl y from French exporters. Reports indicate that Japanese tastes favor milder cheeses and small, individual packaging (M. Freeman, Dairy Marketing Inter-national, personal communication, 2004).
Growth in the specialty cheese sector has also occurred in the United States. US reports indicate an expected growth in domestic retail sales of 22 per cent between 2000 and 2005, pushing the retail market value near US$2.9 billion (Cheese Reporter 2001). Reports from the United States suggest that per person con-sumption of specialty cheese has not yet reached its limit, and industry growth should continue to be strong for some time (Wisconsin Spe-cialty Cheese Institute 2002). Many Australian
s p e c i a l t y c h e e s e
20 australian food statistics 2004
cheesemakers are already taking advantage of the lucrative US market; however, the minimum quantity of product required by many retailers is beyond the manufacturing capabilities of most Australian companies.
The US–Australia Free Trade Agreement will allow some concessions for specialty cheese manufacturers into the US market. However, the quotas determining which manufacturers gain access are to be based on quantity rather than value, favoring larger cooperatives.
Dairy Marketing International (DMI), one of Australia’s largest export brokers of specialty cheeses, cites Japan, north America, and con-tinental Asia as the key markets for Australian specialty cheese exports — now and into the future. There is also potential in the Middle East-ern and south east Asian markets; however, the long shelf life and durable packaging demanded by these markets has so far reduced their attrac-tiveness for Australian exporters (D. Freeman, DMI, personal communication, 2004).
China, as the world’s largest growing econ-omy, also shows potential for specialty cheese consumption; however, the market remains very underdeveloped. While Chinese consum-ers have been introduced to cheese through major food service chains such as Pizza Hut and McDonald’s, this increased product awareness has so far only translated into commodity prod-uct sales.
However, as the market develops and affl uent Chinese consumers are increasingly exposed to western trends, it is expected that consumption of specialty cheeses will grow. This will almost entirely come from imported product, as China lacks availability of farming land to provide suffi cient dairy production to meet its potential domestic market demand. China’s entry into the World Trade Organisation will also result in import tariffs for cheese into the market drop-ping from their current rate of just under 30 per cent, to an expected 12–15 per cent by 2005 (Austrade 2004).
A truly boutique cheesemaker if there ever was one, Kervella produces less than one tonne of cheese a year. Cheesemaker and owner Gabrielle Kervella learnt her cheese making skills on a goat cheese farm in France during the early 1980s. She had long dreamed of setting up her own small farm; however, the vastly different conditions in Australia from what she was used to in France presented numerous hurdles. However, with the help of a lec-turer at the University of Western Australia experi-enced in goat farming, she commenced trading in 1984 (Hyde 2000).
Kervella’s big break came though a fresh food show in Perth, where a journalist, impressed by this unknown cheese, took some back to Sydney and shared it with a specialty cheese distributor. Despite Gabrielle’s reluctance to move so quickly into an interstate market, wholesales distributors have since become Kervella’s largest distribution channel (Hyde 2000).
Kervella now has ‘Demeter’ biodynamic certifi -cation and takes full advantage of the enterprise’s organic methods. Gabrielle believes that consum-
ers appreciate and seek out biodynamic certifi ca-tion and awards, and worked hard to gain certifi -cation for many years. As with many other primary industries, feed has been a major stumbling block, and Kervella has struggled to grow enough biodynamic feed for their herd (G. Kervella, Kervella Cheese, personal communciation, 2004).
In 2004 Kervella cheese boasted a resounding reputation. The Sydney Morning Herald has voted Kervella Rondolet the best overall cheese in Austra-lia for three of the past fi ve years.
Kervella has also experienced resounding success in the United States, where according to Gabrielle, customers often think that Kervella is the generic name for Australian goat cheese. This type of fi rst mover advantage is priceless in a vast mar-ket such as the United States. However, Gabrielle does feel her cheeses are restricted by regulation requiring her to only use pasteurised milk, and given the opportunity she would love to try her hand at cheese making with raw milk, like she was taught in France (Hyde 2000).
Kervella Cheese
s p e c i a l t y c h e e s e
21australian food statistics 2004
International reputation
Australia’s reputation as a cheese producer is mixed. While many sing the praises of domestic cheese manufacturers, and companies such as Jindi and King Island have recently won interna-tional awards (Dairy Australia 2004a; National Foods Limited 2003b), others are more sceptical about the skill level in the local industry and the quality of produce coming out of it (when com-pared with the strength of reputation enjoyed by European producers). The sector must deal with perceptions of a lack of diversity in training in the production of farmhouse cheeses, and a lack of respect among Australian producers from those in nations such as France or Greece, where cheese making has been at the centre of culture for hundreds of years (Newton 2004).
Australia’s export success in the commodity cheese market may have also negatively impacted on Australia’s reputation as a specialist cheese making nation. This has been particularly true in Japan, Australia’s largest importer of commod-ity cheeses. Industry intelligence suggests that Japanese importers and wholesalers have often associated Australian cheeses only with com-modity cheddars, and look to France and other European producers for specialty lines (M. Free-man, personal communication, 2004).
Despite this, Australia does benefi t from a strong basis for competitive advantage. Aus-tralia’s strong regulatory environment provides ‘clean and green’ assurances to sophisticated consumer markets, and the shorter distance to Asian markets increases product freshness and reduces distribution costs.
Sector leadershipSpecialty cheesemakers in Australia are repre-sented by the Australian Specialist Cheesemak-ers Association, founded in 1994. ASCA esti-mates that its membership includes 70 per cent of specialist cheesemakers in Australia; however, the exact number of specialist cheesemakers is diffi cult to determine because of the abundance of very small players operating within the indus-try. ASCA provides members with a combined voice to government and media, provides a
forum for members on business issues, and pro-motes awareness and appreciation of Australian specialty cheeses. Results from the survey of ASCA members identify the informational role of the organisation as the most important benefi t to members (ASCA and Dairy Australia 2003).
To date, ASCA has played no role in coordi-nating demand and supply within the sector, nor has this been explored by other agencies. The overall level of coordination among specialist cheesemakers is very low. ASCA does stage an annual show that, through awards to individual cheesemakers, allows some ad hoc insight into industry benchmarking.
Industry best performance and skill devel-opment is also channelled through the Gilbert Chandler Institute of Dairy Technology at the University of Melbourne. Services offered by the institute include a hotline for cheesemakers and courses to develop cheese making skills (D. Brown, ASCA, personal communication, 2004).
The relationship between ASCA and dairy industry service provider, Dairy Australia, is important. Dairy Australia primarily assists the specialty cheese sector through product promo-tion to consumers, and through their compilation and production of statistical data pertinent to the sector. ASCA also maintains a strong relation-ship with Australian Dairy Farmers Limited, the peak organisation that represents dairy farmers throughout Australia.
Barriers to entryWhile the continued growth of specialty cheese consumption in both domestic and international markets alludes to an attractive investment opportunity, the market realities for manufac-turers are signifi cantly more sobering. The most signifi cant barriers to entry are the high entry capital and the technical skills needed to begin and sustain cheese production. Due to Austra-lian food safety requirements, there appears to be a lack of small stepping stones into the indus-try (that is, manufacturing from home as is often done in other industries). Cheesemakers wishing to manufacture in Australia require upward of $300 000 to set up a factory, and an additional $100 000 or more of working capital (personal
s p e c i a l t y c h e e s e
22 australian food statistics 2004
interview with D. Brown, ASCA, 2004). Fur-thermore, the level of government fi nancial assistance available to Australian cheesemakers is not of the signifi cance of that provided to EU producers (S. Standen, Wool and Dairy Policy Unit, Department of Agriculture, Fisheries and Forestry, personal communication, 2004).
Major barriers to entry and constraints on industry expansion also include:• managing the peaks and troughs in milk pro-
duction,• insuffi cient total milk supply (particularly for
goats milk),• variations in milk composition,• the extent of competition in the relatively
small Australian market,• high costs of product logistics and storage,
and• the perishable nature of the product.
InnovationInvestment in technology and innovation is of high importance to the specialty cheese indus-try. Several initiatives and institutions across Australia are involved in research and develop-ment in cheese making, such as the Australian Cheese Technology Program, the CSIRO Dairy Research Laboratory, Australian Starter Culture Research Centre’s (ASCRC), and Food Science Australia.
Currently research is under way that is aimed at improving specialty cheese manufactur-ing processes. To date, a signifi cant portion of specialty cheeses are produced through manual manufacturing methods (hand made) or semi-automated manufacturing processes, increasing manufacturer reliance on cheese making skills and education of staff. And while this manufac-turing process creates product differentiation, it also creates a high level of risk to the manufac-turer associated with human error.
To combat this, public and private resources are being dedicated to research hoping to improve manufacturing processes for specialty cheeses. For example, Lemnos Foods is currently under-taking a $2.9 million project (co-funded by the Food Innovation Grant Scheme) aimed at devel-oping a fully automated manufacturing process
for specialty cheese to produce consistently high quality cheese at reduced cost and in less time. Lemnos anticipate that the manufacturing capacity of the new plant will reach 5 tonnes a day (NFIS 2004).
At the ASCRC research and development facility in Werribee, Victoria, high prior-ity is given to assisting cheesemakers through improvements in the selection, analysis and application of starter cultures for cheese produc-tion. The ASCRC is attempting improve mass production of lactic acid bacteria, which if suc-cessful will improve cheese fl avor and digest-ibility. The production of high quality lactic acid bacteria in Victoria will also cut costs to Australian specialty cheesemakers, who spend approximately $8 million a year importing cultures from Europe. It is anticipated that the reduction in cost may be as large as 30 per cent (VIIRD 2002).
The Rural Industries Research and Develop-ment Corporation (RIRDC) has also invested in the identifi cation and development of markets for goat’s milk cheese through its New Indus-tries Program (Stubbs and Abud 2002).
MarketingGiven the scope for differentiation in the spe-cialty cheese sector, marketing remains a key challenge for the industry. Manufacturers over-whelmingly see improving the education of the wholesaler, retailer and, most importantly, consumer to be of paramount importance in achieving growth in the category. This is in line with general ‘gourmet food’ marketing intelli-gence, which promotes stakeholder education and relationship building. Value adding (gener-ally through packaging and branding) is also of high importance, as manufacturers realise that in a non-commodity market, consumers regu-larly associate price with quality, and seek out prestige products (ASCA and Dairy Australia 2003).
Larger specialty cheese manufacturers have tended to promote their product through adver-tising in glossy food magazines, while the smaller cheesemakers have focused on building niche markets — often through combining a link
s p e c i a l t y c h e e s e
23australian food statistics 2004
to tourism into their business models (personal interview with D. Brown, 2004). As with com-petition in major dairy product lines, growth of the overall specialty cheese category is likely to be led into a new phase of growth by major brand owners, such as National Foods. This fol-lows their purchase of the King Island business which has secured signifi cant market positions within the domestic retail market, and is invest-ing in a broadening of its product portfolio to encompass gourmet food lines. This may ensure that more specialty cheese reaches the attention of the Australian consumer, allowing other pro-ducers an opportunity to take advantage of that greater awareness.
It is likely that this greater consumer aware-ness and exposure will benefi t the entire sector as consumers seek more knowledge and variety, and look to experience a wider range of specialty cheese styles and names. Coordinated marketing initiatives have also created success for some producers, linking boutique cheese brands and lines to wine/food trails in certain themed geo-graphic regions (for example, Margaret River region).
Future marketing prospects look promising in the specialty cheese sector. As consumers gener-ally become increasing worldly and adventurous with their food, the market for specialty cheese lines with rich fl avours and ethnic origins is expected to grow further. US reports also indi-cate that consumer are choosing quality over quantity – eating less, but eating fuller fl avored, specialty cheeses.
Consumer demographics have been found to play a signifi cant role in specialty cheese pur-chase. A US study published in 2001 found edu-cation and income to be important determinants of retail sales of specialty cheese (Food Process-ing Center 2001). Similarly, RIRDC (in their study of goat milk products) identifi ed affl uent to middle income areas as having the great-est availability of chevre, or French style goat cheese (Stubbs and Abud 2002). This type of market segmentation is not surprising, and typi-cal of gourmet, or high end food segments.
There have also been indications of a grow-ing consumer preference in overseas markets for cheese and other dairy products using organic
agriculture. Australia’s stringent regulatory envi-ronment has resulted in other agricultural sectors moving in this direction and taking advantage of Australia’s ‘clean and green’ image for competi-tive advantage. However, market intelligence suggests that, so far, international consumers have not sought out Australian specialty cheese lines for these qualities, nor has there been a sig-nifi cant demand for organic cheese within the Australian market (M. Freeman, personal com-munication, 2004).
If Australia continues to follow European trends in cuisine, it is anticipated that the market for goat and sheep cheeses will increase. How-ever, looking only to European consumption trends for Australian marketing intelligence can be dangerous. European consumer patterns are largely built on their historical culture — some-thing that cannot be easily replicated in another nation. Not withstanding this warning, local mar-ket intelligence also indicates strong growth for the goat cheese sector, and attributes much of the market success to consumer perceptions of goat’s milk as a healthier alternative to cow’s milk.
ConclusionThe specialty cheese sector is one of the suc-cess stories of the Australia food industry, adding scope for future diversity and value as consumer awareness and affl uence increases. The sector has enjoyed strong growth over the past decade and faces signifi cant opportunities and challenges in the future as it moves into another phase of development. While the sec-tor faces ‘hard yards’ in growing a signifi cant export presence, the premium and ethnic food markets in the Australian market provide scope for continued strong growth, once smoother sup-ply chain management is achieved between farm and consumer.
The sector has become a critical part of the premium fresh food category in the domestic retail market. Increased investment in market-ing by major corporate brand owners will, we believe, provide the sector with greater expo-sure and provide all producers and suppliers with benefi ts that fl ow from increased consumer awareness.
s p e c i a l t y c h e e s e
24 australian food statistics 2004
References
ASCA (Australian Specialist Cheesemakers Association) and Dairy Australia 2003, Spe-cialist Cheese 2003 Industry Survey: Survey Results and Specialist Cheese Supermarket Sales Information, Dairy Australia Limited, Melbourne.
Austrade 2004, China’s accession to the WTO, Canberra (viewed 16 August 2004 – www.austrade.gov.au/corporate/layout/0,,0_S1-1_1zg-2_2-3_PWB1349210-4_generic-5_-6_-7_,00.html).
Cheese Reporter 2001, ‘Retail specialty cheese sales to reach $2.9 billion by 2005’, Cheese Reporter, 3 August.
Couvelaere, J. and Jadji, K. 2003, The French Market for Cheese, London (viewed 16 August 2004 – www.tradepartners.gov.uk/fi les/french_cheese.pdf).
Dairy Australia 2004a, Specialty Cheese, Mel-bourne (viewed 2 August 2004 – (www.dairyaustralia.com.au/template_content.asp?Page=Content/Australia/Industry_Intel-ligence/Specialty_Cheese/index.htm).
—— 2004b, Supermarket sales – cheese, Mel-bourne (viewed 4 August 2004 – www.dairyaustralia.com.au/template_content.asp?Page=Content/Australia/Industry_Intel-ligence/Retail_Supermarket_Sales/Cheese/Index.htm&topicId=Industry_Intelligence).
Development Tasmania 2003, Export Active, Hobart (viewed 4 August 2004 – www.devel-opment.tas.gov.au/exportactive/april2003.html).
Food Processing Center, 2001, The Specialty Cheese Market, Institute of Agriculture and Natural Resources, University of Nebraska, Lincoln (viewed 4 August 2004 – www.farm-profi tability.org/cheese.pdf).
Hyde, K. 2000, Thirty Australian champions: shaping the future for rural Australia, Can-
berra (viewed 4 August 2004 – www.rirdc.gov.au/champions/KervellaGoatCheese.html).
Japan Today 2003, Say cheese: Japan’s mar-ket continues to expand, Tokyo (viewed 20 August 2004 – www.japantoday.com/e/?content=feature&id=561&page=5).
NFIS (National Food Industry Strategy) 2004, FIG case study – Lemnos Foods, Canberra (viewed 4 August 2004 – www.nfi s.com.au/index.php?option=content&task=view&id=144&Itemid=59).
National Foods Limited 2003a, History, (viewed 16 August 2004 – www.natfoods.com.au/about_nfl /history.stm).
—— 2003b, Investment News: A special bul-letin for National Foods Shareholders — March 2003, Corporate Affairs Department (viewed 4 August 2004 – www.natfoods.com.au/media/pdf/investment_news/Invest-mentNews_14_Mar_03.pdf).
Newton, J. 2004, The fi nal curd, (viewed 4 August 2004 – www.smh.com.au/ articles/2003/11/25/1069522575496.html?from=storyrhs&oneclick=true).
Stubbs, A. and Abud, G. 2002, Dairy Goat Manual, RIRDC Publication no. 02/025 RIRDC Project no. PTP-11A, Rural Indus-tries Research and Development Corpora-tion, Canberra.
VIIRD (Department of Innovation, Industry and Regional Development – Victoria) 2002, New Dairy Research and Development Facility at Werribee – 5/9/02 (viewed 18 August 2004 – www.biotechnology.vic.gov.au/news/article.asp?id=120).
Wisconsin Specialty Cheese Institute 2002, More Sophisticated Palates Driving Growth of Specialty Cheese; Market Not Saturated (viewed 4 August 2004 – www.wisspecial-cheese.org/articles.htm).
s p e c i a l t y c h e e s e
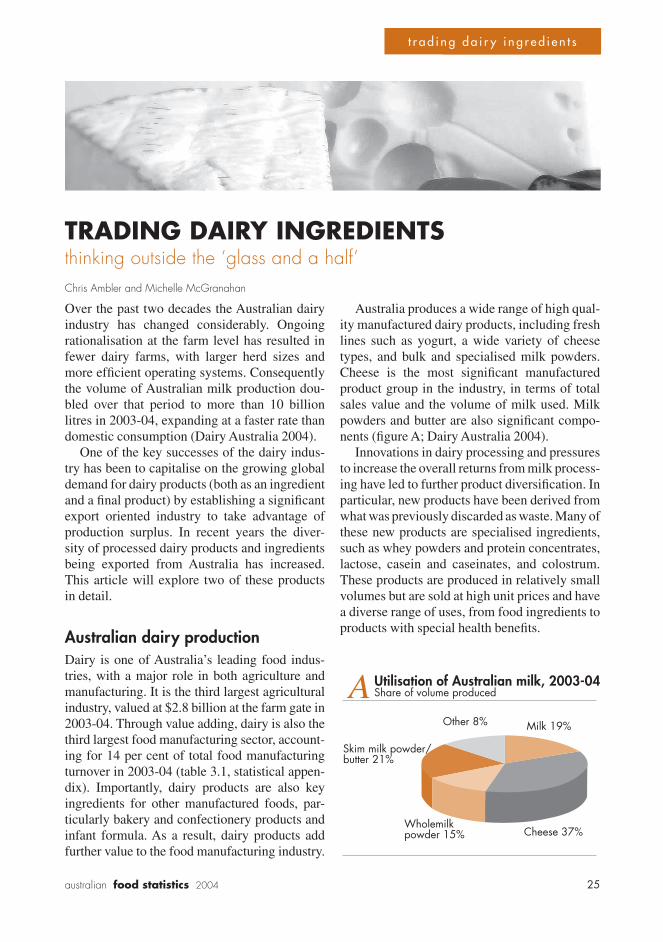
25australian food statistics 2004
s p e c i a l t y c h e e s e
TRADING DAIRY INGREDIENTSthinking outside the ‘glass and a half’Chris Ambler and Michelle McGranahan
Over the past two decades the Australian dairy industry has changed considerably. Ongoing rationalisation at the farm level has resulted in fewer dairy farms, with larger herd sizes and more effi cient operating systems. Consequently the volume of Australian milk production dou-bled over that period to more than 10 billion litres in 2003-04, expanding at a faster rate than domestic consumption (Dairy Australia 2004).
One of the key successes of the dairy indus-try has been to capitalise on the growing global demand for dairy products (both as an ingredient and a fi nal product) by establishing a signifi cant export oriented industry to take advantage of production surplus. In recent years the diver-sity of processed dairy products and ingredients being exported from Australia has increased. This article will explore two of these products in detail.
Australian dairy productionDairy is one of Australia’s leading food indus-tries, with a major role in both agriculture and manufacturing. It is the third largest agricultural industry, valued at $2.8 billion at the farm gate in 2003-04. Through value adding, dairy is also the third largest food manufacturing sector, account-ing for 14 per cent of total food manufacturing turnover in 2003-04 (table 3.1, statistical appen-dix). Importantly, dairy products are also key ingredients for other manufactured foods, par-ticularly bakery and confectionery products and infant formula. As a result, dairy products add further value to the food manufacturing industry.
Australia produces a wide range of high qual-ity manufactured dairy products, including fresh lines such as yogurt, a wide variety of cheese types, and bulk and specialised milk powders. Cheese is the most signifi cant manufactured product group in the industry, in terms of total sales value and the volume of milk used. Milk powders and butter are also signifi cant compo-nents (fi gure A; Dairy Australia 2004).
Innovations in dairy processing and pressures to increase the overall returns from milk process-ing have led to further product diversifi cation. In particular, new products have been derived from what was previously discarded as waste. Many of these new products are specialised ingredients, such as whey powders and protein concentrates, lactose, casein and caseinates, and colostrum. These products are produced in relatively small volumes but are sold at high unit prices and have a diverse range of uses, from food ingredients to products with special health benefi ts.
A Utilisation of Australian milk, 2003-04Share of volume produced
Skim milk powder/ butter 21%
Other 8% Milk 19%
Cheese 37%Wholemilk powder 15%
t r a d i n g d a i r y i n g r e d i e n t s
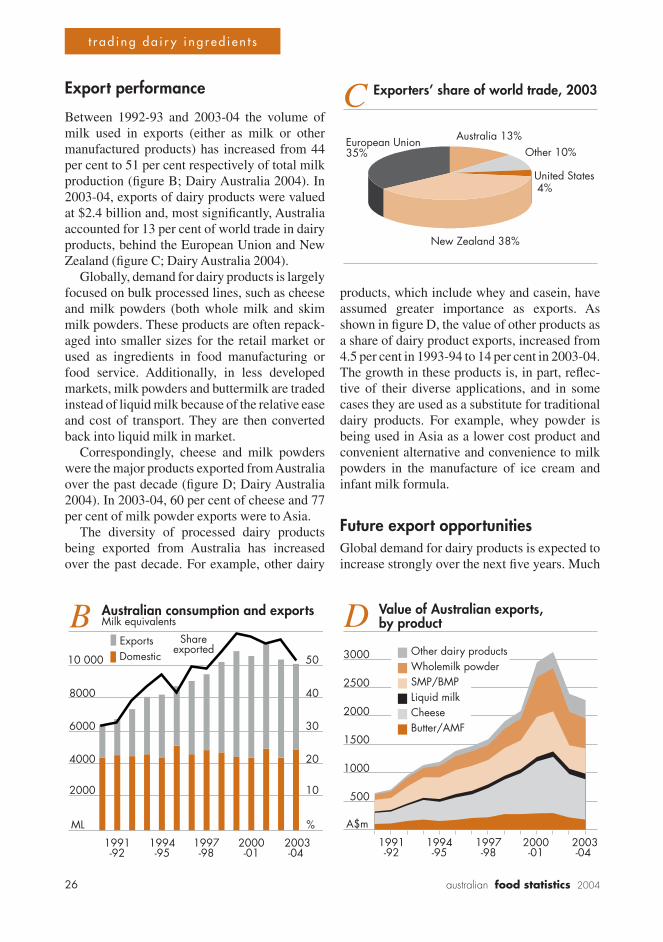
26 australian food statistics 2004
Export performance
Between 1992-93 and 2003-04 the volume of milk used in exports (either as milk or other manufactured products) has increased from 44 per cent to 51 per cent respectively of total milk production (fi gure B; Dairy Australia 2004). In 2003-04, exports of dairy products were valued at $2.4 billion and, most signifi cantly, Australia accounted for 13 per cent of world trade in dairy products, behind the European Union and New Zealand (fi gure C; Dairy Australia 2004).
Globally, demand for dairy products is largely focused on bulk processed lines, such as cheese and milk powders (both whole milk and skim milk powders. These products are often repack-aged into smaller sizes for the retail market or used as ingredients in food manufacturing or food service. Additionally, in less developed markets, milk powders and buttermilk are traded instead of liquid milk because of the relative ease and cost of transport. They are then converted back into liquid milk in market.
Correspondingly, cheese and milk powders were the major products exported from Australia over the past decade (fi gure D; Dairy Australia 2004). In 2003-04, 60 per cent of cheese and 77 per cent of milk powder exports were to Asia.
The diversity of processed dairy products being exported from Australia has increased over the past decade. For example, other dairy
products, which include whey and casein, have assumed greater importance as exports. As shown in fi gure D, the value of other products as a share of dairy product exports, increased from 4.5 per cent in 1993-94 to 14 per cent in 2003-04. The growth in these products is, in part, refl ec-tive of their diverse applications, and in some cases they are used as a substitute for traditional dairy products. For example, whey powder is being used in Asia as a lower cost product and convenient alternative and convenience to milk powders in the manufacture of ice cream and infant milk formula.
Future export opportunitiesGlobal demand for dairy products is expected to increase strongly over the next fi ve years. Much
C Exporters’ share of world trade, 2003
Australia 13%Other 10%
United States4%
New Zealand 38%
European Union35%
B Australian consumption and exportsMilk equivalents
2003-04
1991-92
1994-95
1997-98
2000-01
2000
4000
6000
8000
10 000
10
20
30
40
50DomesticExports Share
exported
%ML
D Value of Australian exports, by product
A$m
Other dairy productsWholemilk powderSMP/BMPLiquid milkCheeseButter/AMF
2003-04
2000-01
1994-95
1997-98
1991-92
500
1000
1500
2000
2500
3000
t r a d i n g d a i r y i n g r e d i e n t s
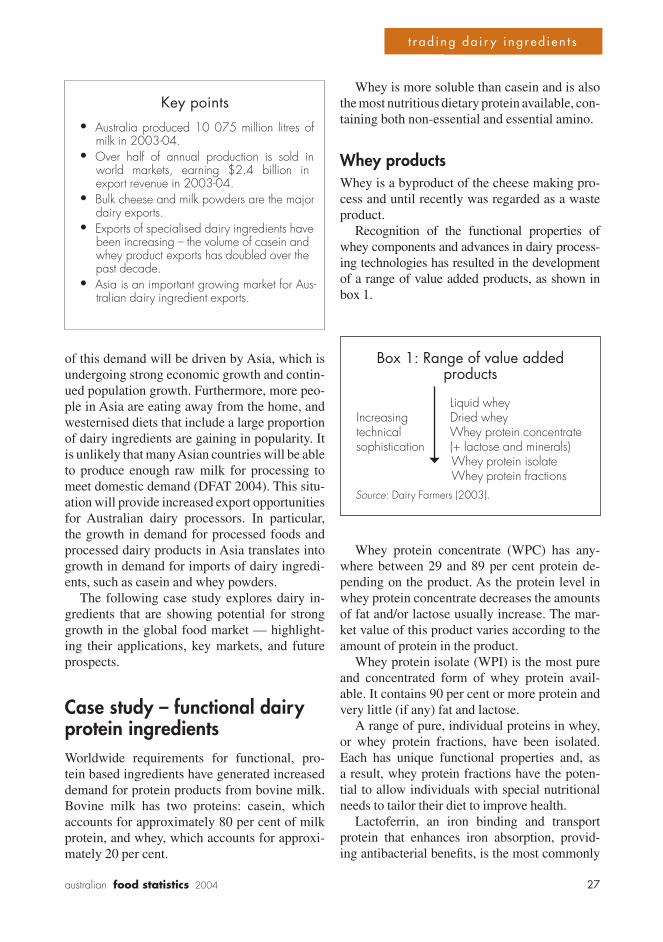
27australian food statistics 2004
s p e c i a l t y c h e e s e
of this demand will be driven by Asia, which is undergoing strong economic growth and contin-ued population growth. Furthermore, more peo-ple in Asia are eating away from the home, and westernised diets that include a large proportion of dairy ingredients are gaining in popularity. It is unlikely that many Asian countries will be able to produce enough raw milk for processing to meet domestic demand (DFAT 2004). This situ-ation will provide increased export opportunities for Australian dairy processors. In particular, the growth in demand for processed foods and processed dairy products in Asia translates into growth in demand for imports of dairy ingredi-ents, such as casein and whey powders.
The following case study explores dairy in-gredients that are showing potential for strong growth in the global food market — highlight-ing their applications, key markets, and future prospects.
Case study – functional dairy protein ingredientsWorldwide requirements for functional, pro-tein based ingredients have generated increased demand for protein products from bovine milk. Bovine milk has two proteins: casein, which accounts for approximately 80 per cent of milk protein, and whey, which accounts for approxi-mately 20 per cent.
Whey is more soluble than casein and is also the most nutritious dietary protein available, con-taining both non-essential and essential amino.
Whey productsWhey is a byproduct of the cheese making pro-cess and until recently was regarded as a waste product.
Recognition of the functional properties of whey components and advances in dairy process-ing technologies has resulted in the development of a range of value added products, as shown in box 1.
Whey protein concentrate (WPC) has any-where between 29 and 89 per cent protein de-pending on the product. As the protein level in whey protein concentrate decreases the amounts of fat and/or lactose usually increase. The mar-ket value of this product varies according to the amount of protein in the product.
Whey protein isolate (WPI) is the most pure and concentrated form of whey protein avail-able. It contains 90 per cent or more protein and very little (if any) fat and lactose.
A range of pure, individual proteins in whey, or whey protein fractions, have been isolated. Each has unique functional properties and, as a result, whey protein fractions have the poten-tial to allow individuals with special nutritional needs to tailor their diet to improve health.
Lactoferrin, an iron binding and transport protein that enhances iron absorption, provid-ing antibacterial benefi ts, is the most commonly
Key points• Australia produced 10 075 million litres of
milk in 2003-04.• Over half of annual production is sold in
world markets, earning $2.4 billion in export revenue in 2003-04.
• Bulk cheese and milk powders are the major dairy exports.
• Exports of specialised dairy ingredients have been increasing – the volume of casein and whey product exports has doubled over the past decade.
• Asia is an important growing market for Aus-tralian dairy ingredient exports.
Box 1: Range of value added products
Liquid wheyIncreasing Dried wheytechnical Whey protein concentratesophistication (+ lactose and minerals) Whey protein isolate Whey protein fractionsSource: Dairy Farmers (2003).
t r a d i n g d a i r y i n g r e d i e n t s
28 australian food statistics 2004
produced whey protein fraction in Australia for commercial sale. It comprises only two hun-dredths of a percent of milk volume and is used in minute quantities but is of high value (Food Australia 2004). Nonetheless, it has been gen-erating large interest in the functional foods market, largely because of its immune boosting properties. There have been six global confer-ences solely dedicated to lactoferrin since 1992 to try to determine its biological roles or func-tions, which is indicative of the extent of interest and its importance (Food Australia 2004).
Whey has a diverse range of applications, from speciality products to incorporation in everyday foods and non-food items. As a food ingredient, whey products are often used to improve the texture, mouth feel, appearance, taste and nutritional value of food products, resulting in improved consumer acceptance of the fi nished product. Whey products are often used in preference to other sources of protein ingredients because they are fl avor neutral and do not interfere with the normal fl avor of the product. Whey products are an excellent source of lactose, minerals, protein and vitamins and thus are also used as a cost effective alternative to replace milk solids (Do it with Dairy 2004).
Whey products are commonly used in the manufacture of infant formula, bakery prod-ucts, ice cream and frozen desserts, confection-ery, yogurt, milk, functional foods and drinks, processed meat, snack foods, seasonings, and dietetic products (meal replacements). A signifi -
cant market is in sports supplements for body builders and athletes. Whey products are also an important fl avor enhancer in reduced-calorie foods and reduced-fat food coatings (Johnson 2004). The benefi ts of using whey products in some of these foods are described in box 2.
Whey products are also incorporated in animal feed, calf milk replacer, carrier for herbicides, cosmetics, skin creams, oral care products, bath salts, detergent, and fi lms and coatings for food products (Dairy Australia 2004).
More recently, whey products have developed a niche market as a functional ingredient in heath products such as pharmaceuticals and nutritional supplements. As research on the functional prop-erties of whey products continues it is expected that the range of applications will increase.
Australian whey production and exportsAustralian production of whey products has doubled over the past decade (figure E). This has largely occurred as an expansion in cheese production has led to an increased supply of liquid whey and as a result of continual advances in processing technology, enabling an increasing variety of whey products to be made. The recent drought has been the main setback to continued growth in whey produc-tion, with more than an 8.4 per cent decline in milk available for processing between 2001-02 and 2002-03.
In 2003-04, 105 389 tonnes of whey products were produced by Australian dairy processors
Box 2: Benefi ts of incorporating whey products in processed foodsFood product Benefi ts
Baked goods Enhance crumb structure, retard staling, enhance bread fl avor, enhance crust browning, improve toasting qualities, enhance fl avor
Processed meats Improve fl avor, texture, emulsifi cation, water binding, cook yield functional performance
Snacks and seasonings Enhance fl avor and appearance, reduce fat and calorie content
Confectionery Enhance fl avor, color, texture, and nutritional quality, improve shelf life and appearance (smoothness and shininess)
Sources: Bouzas (2004); Burrington (2004); Johnson (2004); Keaton (2004).
t r a d i n g d a i r y i n g r e d i e n t s
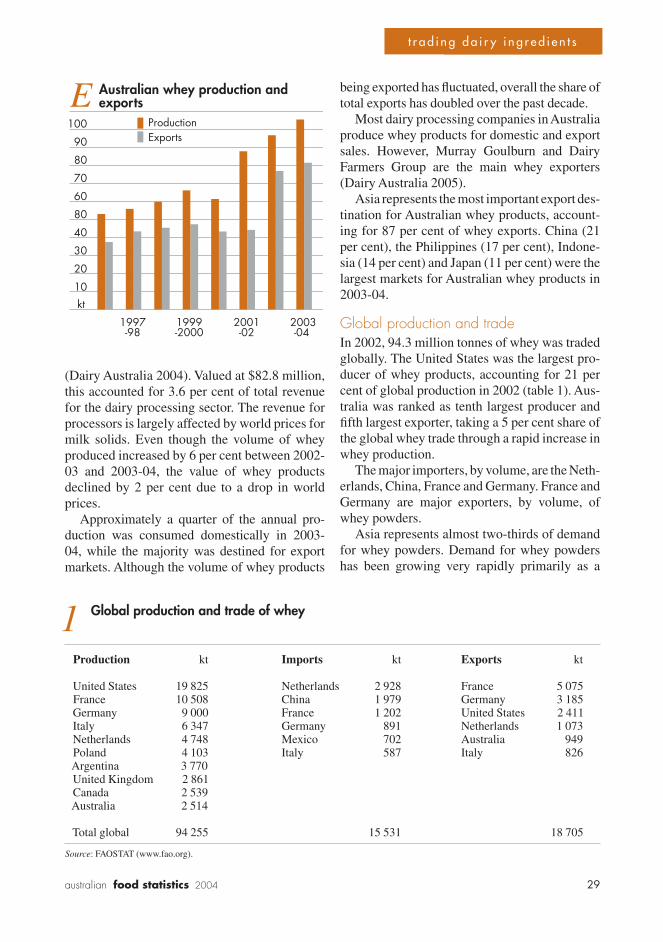
29australian food statistics 2004
s p e c i a l t y c h e e s e
(Dairy Australia 2004). Valued at $82.8 million, this accounted for 3.6 per cent of total revenue for the dairy processing sector. The revenue for processors is largely affected by world prices for milk solids. Even though the volume of whey produced increased by 6 per cent between 2002-03 and 2003-04, the value of whey products declined by 2 per cent due to a drop in world prices.
Approximately a quarter of the annual pro-duction was consumed domestically in 2003-04, while the majority was destined for export markets. Although the volume of whey products
being exported has fl uctuated, overall the share of total exports has doubled over the past decade.
Most dairy processing companies in Australia produce whey products for domestic and export sales. However, Murray Goulburn and Dairy Farmers Group are the main whey exporters (Dairy Australia 2005).
Asia represents the most important export des-tination for Australian whey products, account-ing for 87 per cent of whey exports. China (21 per cent), the Philippines (17 per cent), Indone-sia (14 per cent) and Japan (11 per cent) were the largest markets for Australian whey products in 2003-04.
Global production and tradeIn 2002, 94.3 million tonnes of whey was traded globally. The United States was the largest pro-ducer of whey products, accounting for 21 per cent of global production in 2002 (table 1). Aus-tralia was ranked as tenth largest producer and fi fth largest exporter, taking a 5 per cent share of the global whey trade through a rapid increase in whey production.
The major importers, by volume, are the Neth-erlands, China, France and Germany. France and Germany are major exporters, by volume, of whey powders.
Asia represents almost two-thirds of demand for whey powders. Demand for whey powders has been growing very rapidly primarily as a
2003-04
1999-2000
1997-98
2001-02
10
20
30
40
80
60
70
80
90
100
kt
E Australian whey production and exports
ProductionExports
1 Global production and trade of whey
Production kt Imports kt Exports kt
United States 19 825 Netherlands 2 928 France 5 075France 10 508 China 1 979 Germany 3 185Germany 9 000 France 1 202 United States 2 411Italy 6 347 Germany 891 Netherlands 1 073Netherlands 4 748 Mexico 702 Australia 949Poland 4 103 Italy 587 Italy 826Argentina 3 770United Kingdom 2 861Canada 2 539Australia 2 514
Total global 94 255 15 531 18 705
Source: FAOSTAT (www.fao.org).
t r a d i n g d a i r y i n g r e d i e n t s
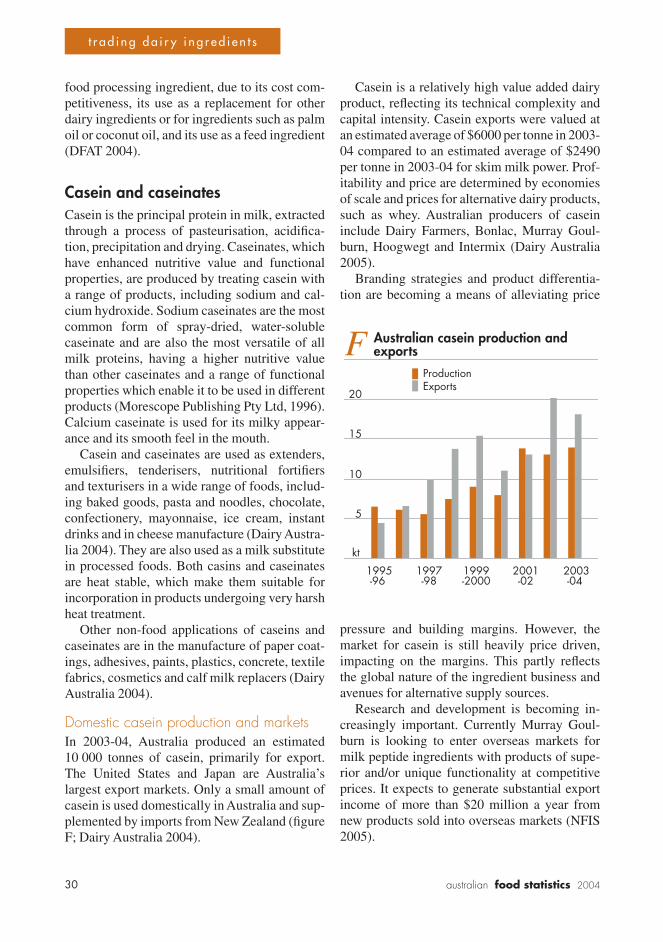
30 australian food statistics 2004
food processing ingredient, due to its cost com-petitiveness, its use as a replacement for other dairy ingredients or for ingredients such as palm oil or coconut oil, and its use as a feed ingredient (DFAT 2004).
Casein and caseinates Casein is the principal protein in milk, extracted through a process of pasteurisation, acidifi ca-tion, precipitation and drying. Caseinates, which have enhanced nutritive value and functional properties, are produced by treating casein with a range of products, including sodium and cal-cium hydroxide. Sodium caseinates are the most common form of spray-dried, water-soluble caseinate and are also the most versatile of all milk proteins, having a higher nutritive value than other caseinates and a range of functional properties which enable it to be used in different products (Morescope Publishing Pty Ltd, 1996). Calcium caseinate is used for its milky appear-ance and its smooth feel in the mouth.
Casein and caseinates are used as extenders, emulsifi ers, tenderisers, nutritional fortifi ers and texturisers in a wide range of foods, includ-ing baked goods, pasta and noodles, chocolate, confectionery, mayonnaise, ice cream, instant drinks and in cheese manufacture (Dairy Austra-lia 2004). They are also used as a milk substitute in processed foods. Both casins and caseinates are heat stable, which make them suitable for incorporation in products undergoing very harsh heat treatment.
Other non-food applications of caseins and caseinates are in the manufacture of paper coat-ings, adhesives, paints, plastics, concrete, textile fabrics, cosmetics and calf milk replacers (Dairy Australia 2004).
Domestic casein production and marketsIn 2003-04, Australia produced an estimated 10 000 tonnes of casein, primarily for export. The United States and Japan are Australia’s largest export markets. Only a small amount of casein is used domestically in Australia and sup-plemented by imports from New Zealand (fi gure F; Dairy Australia 2004).
Casein is a relatively high value added dairy product, refl ecting its technical complexity and capital intensity. Casein exports were valued at an estimated average of $6000 per tonne in 2003-04 compared to an estimated average of $2490 per tonne in 2003-04 for skim milk power. Prof-itability and price are determined by economies of scale and prices for alternative dairy products, such as whey. Australian producers of casein include Dairy Farmers, Bonlac, Murray Goul-burn, Hoogwegt and Intermix (Dairy Australia 2005).
Branding strategies and product differentia-tion are becoming a means of alleviating price
pressure and building margins. However, the market for casein is still heavily price driven, impacting on the margins. This partly refl ects the global nature of the ingredient business and avenues for alternative supply sources.
Research and development is becoming in-creasingly important. Currently Murray Goul-burn is looking to enter overseas markets for milk peptide ingredients with products of supe-rior and/or unique functionality at competitive prices. It expects to generate substantial export income of more than $20 million a year from new products sold into overseas markets (NFIS 2005).
2003-04
1999-2000
1997-98
1995-96
2001-02
5
10
15
20
kt
F Australian casein production and exports
ProductionExports
t r a d i n g d a i r y i n g r e d i e n t s
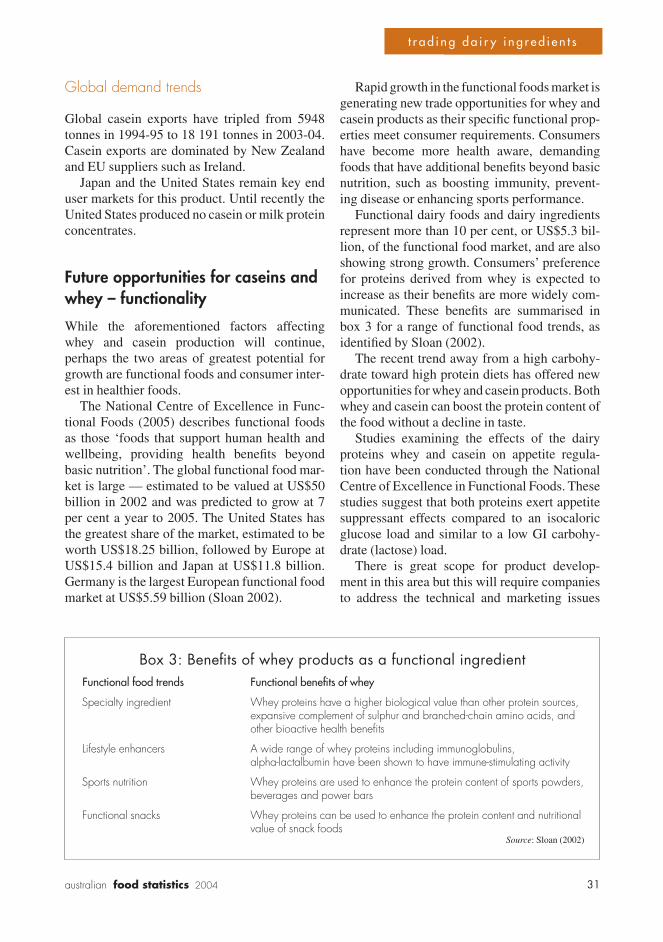
31australian food statistics 2004
s p e c i a l t y c h e e s e
Global demand trends
Global casein exports have tripled from 5948 tonnes in 1994-95 to 18 191 tonnes in 2003-04. Casein exports are dominated by New Zealand and EU suppliers such as Ireland.
Japan and the United States remain key end user markets for this product. Until recently the United States produced no casein or milk protein concentrates.
Future opportunities for caseins and whey – functionality
While the aforementioned factors affecting whey and casein production will continue, perhaps the two areas of greatest potential for growth are functional foods and consumer inter-est in healthier foods.
The National Centre of Excellence in Func-tional Foods (2005) describes functional foods as those ‘foods that support human health and wellbeing, providing health benefi ts beyond basic nutrition’. The global functional food mar-ket is large — estimated to be valued at US$50 billion in 2002 and was predicted to grow at 7 per cent a year to 2005. The United States has the greatest share of the market, estimated to be worth US$18.25 billion, followed by Europe at US$15.4 billion and Japan at US$11.8 billion. Germany is the largest European functional food market at US$5.59 billion (Sloan 2002).
Rapid growth in the functional foods market is generating new trade opportunities for whey and casein products as their specifi c functional prop-erties meet consumer requirements. Consumers have become more health aware, demanding foods that have additional benefi ts beyond basic nutrition, such as boosting immunity, prevent-ing disease or enhancing sports performance.
Functional dairy foods and dairy ingredients represent more than 10 per cent, or US$5.3 bil-lion, of the functional food market, and are also showing strong growth. Consumers’ preference for proteins derived from whey is expected to increase as their benefi ts are more widely com-municated. These benefi ts are summarised in box 3 for a range of functional food trends, as identifi ed by Sloan (2002).
The recent trend away from a high carbohy-drate toward high protein diets has offered new opportunities for whey and casein products. Both whey and casein can boost the protein content of the food without a decline in taste.
Studies examining the effects of the dairy proteins whey and casein on appetite regula-tion have been conducted through the National Centre of Excellence in Functional Foods. These studies suggest that both proteins exert appetite suppressant effects compared to an isocaloric glucose load and similar to a low GI carbohy-drate (lactose) load.
There is great scope for product develop-ment in this area but this will require companies to address the technical and marketing issues
Box 3: Benefi ts of whey products as a functional ingredientFunctional food trends Functional benefi ts of whey
Specialty ingredient Whey proteins have a higher biological value than other protein sources, expansive complement of sulphur and branched-chain amino acids, and other bioactive health benefi ts
Lifestyle enhancers A wide range of whey proteins including immunoglobulins, alpha-lactalbumin have been shown to have immune-stimulating activity
Sports nutrition Whey proteins are used to enhance the protein content of sports powders, beverages and power bars
Functional snacks Whey proteins can be used to enhance the protein content and nutritional value of snack foods
Source: Sloan (2002)
t r a d i n g d a i r y i n g r e d i e n t s
32 australian food statistics 2004
associated with commercialisation of any new product. These issues include development and scale-up of appropriate processes for production of the peptides, together with cost effectiveness, substantiation of activity and ease of incorpora-tion into a diverse range of food products.
As more is learned about the link between the human genome, diet and health, the need for specifi c proteins for individuals with dif-ferent health concerns is expected to increase. This new knowledge must be developed hand in hand with new inexpensive separation process technologies to manufacture these protein frac-tions. Furthermore, palatable foods such as high protein beverages must be developed to provide attractive routes for consumption (Etzel 2004).
ReferencesBouzas, J. 2004, Whey products and lactose in
confectionery applications. Viewed 9 Sep-tember 2004 (www.doitwithdairy.com).
Burrington, K. 2004, Whey products in baked goods. Viewed 9 September 2004 (www.doit-withdairy.com).
Dairy Australia 2004, Australian Dairy Industry In Focus 2004, Dairy Australia, Melbourne (www.dairy.com.au).
—— 2005, Exporters Directory, viewed 10 Jan-uary 2005 (www.dairy.com.au/export/index.html).
Dairy Farmers 2003, Presentation given at 2003 Australian Grand Dairy Awards.
DFAT (Department of Foreign Affairs and Trade) 2004, Agrifood Globalisation and Asia, vol.
III, Asian Agrifood Demand Trends and Out-look to 2010, Canberra, July.
Do it with Dairy 2004, Dry whey nutritional value. Viewed 9 September 2004 (www.doit-withdairy.com).
Etzel, M. 2004, Manufacture and use of dairy protein fractions 1, 2, Journal of Nutrition, vol. 134, pp. 996S–1000S.
FAO (Food and Agriculture Organisation of the United Nations) 2005, FAOSTAT, Rome (www.fao.org).
Food Australia 2004, ‘Fonterra opens a new plant for bioactives,’ Food Australia, vol. 56, no. 12, December, p. 568.
Johnson, B. 2004, US Whey products in snacks and seasonings. Viewed 9 September 2004 (www.doitwithdairy.com).
Keaton, J. 2004, Whey protein and lactose prod-ucts in processed meats. Viewed 9 September 2004 (www.doitwithdairy.com).
Morescope Publishing Pty Ltd 1996, Australian Dairy: The Comprehensive Reference to the Australian Dairy Industry, Victoria.
National Centre of Excellence in Functional Foods 2005. Viewed on 10 January 2005 (www.nceff.com.au).
NFIS (National Food Industry Strategy Limited) 2005. Viewed on 10 January 2005 (www.nfi s.com.au).
Sloan, A. 2002,6, ‘The top 10 functional food trends: the next generation’, Food Technol-ogy, vol. 56, no. 4, pp. 32–57.
t r a d i n g d a i r y i n g r e d i e n t s
Statistics

35australian food statistics 2004
ABOUT THE DATA
Australian commodity production and valueSince 1997-98, estimates of farm crop and live-stock production have been based on the Austra-lian Bureau of Statistics’ Agricultural Commod-ity Survey (ACS) that is conducted at 30 June each year. Approximately every fi fth year an Agricultural Census will be conducted in place of the ACS. The last Agricultural Census was conducted at 30 June 2001. Prior to 1997-98 this information was collected annually in the Agri-cultural Census.
Information covering commodities such as livestock slaughterings and dairy produce is obtained from separate collections and from organisations such as the Australian Dairy Cor-poration.
Gross values are derived by multiplying the production quantity data by price (or unit value) data. All crop price information is obtained from non-ABS sources such as marketing boards, marketing reports, wholesalers, brokers and auc-tioneers. Price information for livestock slaugh-terings is obtained from ABS collections.
Scope of ABS surveysEstimates from the Agricultural Commodity Surveys are based on production from farms having an estimated value of agricultural opera-tions (EVAO) of $5000 or more.
• The EVAO of a farm is calculated by apply-ing three year average weighted prices to livestock turnoff and livestock numbers on the farm and to area and production data for
crops. The aggregation of these commodity values is the EVAO.This is the same scope as that used for the
Agricultural Censuses from 1993-94 to 1996-97 and for the Agricultural Commodity Survey from 1997-98 to 1999-2000. Prior to 1993-94 the scope varied. Details are available from the ABS.
Australian tradeData on international merchandise trade move-ments to and from Australia are collected by the Australian Customs Service, as part of its responsibility to administer government policy on tariffs and barrier control.
Harmonised trade statisticsThe merchandise trade statistics are compiled by the ABS according to classifi cations that conform to an international standard, the Inter-national Harmonised Commodity Description and Coding System, with extra detail to meet Australian statistical needs.• All exports are classifi ed according to the
Australian Harmonised Export Classifi cation (AHECC).
• All imports are classifi ed according the Har-monised Tariff Item Statistical Code (HTISC), with extra detail to meet Australian Customs Service and statistical needs.
Confi dentialityRestrictions are placed on the release of trade statistics where the data relating to an individual
f o o d i n d u s t r y d a t a
36 australian food statistics 2004
or organisation is likely to enable the identifi ca-tion of the trade of that individual or organisation, and that entity has requested that the data be sup-pressed.
• The main confi dentiality restrictions that apply to food trade statistics are that no coun-try details are provided for exports of unpro-cessed sugar, bulk wheat and malting barley.
Trade valuesThe method of valuation for trade is:
• the value of exports is the free on board (fob) transactions value of the goods expressed in Australian dollars; and
• the value of imports is the Australian Cus-toms value — goods are valued at the point of containerisation (in most cases) or the port of shipment, or at the customs frontier of the exporting country, whichever comes fi rst.
World trade in foodThe data on world trade in food — both imports and exports — were obtained from the COM-TRADE database that is established and main-tained by the United Nations’ Statistics Divi-sion.
• More than 100 countries supply their updated trade statistics to this database, representing over 90 per cent of world trade.
• The data are recorded according to the Har-monised Commodity Description and Cod-ing System and Standard International Trade Classifi cation Revision 3.
World food balances
The data on country food balances were obtained from the FAOSTAT database of the Food and Agriculture Organisation of the United Nations (FAO).
• Details of how standardised food balance sheets are derived are provided in FAO (2000
– www.fao.org).The elements of an FAO food balance sheet
are:• production, imports and changes in stocks
that together defi ne the supply available to a country; and
• exports, livestock feed, seed use, industrial use, human consumption and losses during storage and transport that together add up to total utilisation.
FAO food balance sheets are standardised in order to reduce the amount of data for analytical purposes. Standardisation takes the form of:
• conversion of processed commodities back to their primary equivalents (so-called ‘vertical standardisation’); and
• aggregation of similar products — for exam-ple, chicken meat and turkey meat aggregated as poultry meat (so-called ‘horizontal stan-dardisation’).
To keep the amount of data contained in Austra-lian Food Statistics to manageable proportions, FAO food balance data reported are further sim-plifi ed in two ways:
• only data at the major food type level of aggregation (thirteen different categories in all) are reported (FAOSTAT has 87 different food types); and
f o o d i n d u s t r y d a t a
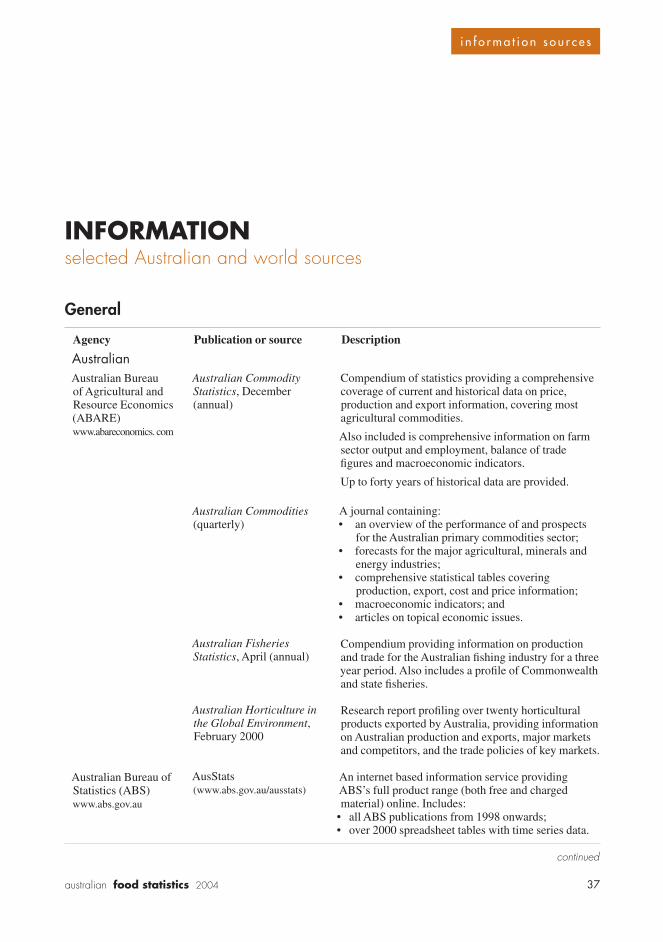
37australian food statistics 2004
INFORMATIONselected Australian and world sources
General
Agency Publication or source Description
AustralianAustralian Bureau of Agricultural and Resource Economics (ABARE)www.abareconomics. com
Australian Bureau of Statistics (ABS)www.abs.gov.au
Australian Commodity Statistics, December (annual)
Australian Commodities (quarterly)
Compendium of statistics providing a comprehensive coverage of current and historical data on price, production and export information, covering most agricultural commodities.
Also included is comprehensive information on farm sector output and employment, balance of trade fi gures and macroeconomic indicators.
Up to forty years of historical data are provided.
A journal containing:• an overview of the performance of and prospects
for the Australian primary commodities sector;• forecasts for the major agricultural, minerals and
energy industries;• comprehensive statistical tables covering
production, export, cost and price information;• macroeconomic indicators; and• articles on topical economic issues.
Compendium providing information on production and trade for the Australian fi shing industry for a three year period. Also includes a profi le of Commonwealth and state fi sheries.
Research report profi ling over twenty horticultural products exported by Australia, providing information on Australian production and exports, major markets and competitors, and the trade policies of key markets.
An internet based information service providing ABS’s full product range (both free and charged material) online. Includes:
• all ABS publications from 1998 onwards;• over 2000 spreadsheet tables with time series data.
continued
Australian Fisheries Statistics, April (annual)
Australian Horticulture in the Global Environment, February 2000
AusStats(www.abs.gov.au/ausstats)
i n f o r m a t i o n s o u r c e s
38 australian food statistics 2004
General continued
Agency Publication or source Description
Australian cont’d
Department ofAgriculture, Fisheries and Forestry (DAFF)www.daff.gov.au/foodinfo)
Horticulture Australia www.horticulture.com.au
Australian Pork Limitedwww.apl.au.com
WorldInternational Grains Councilwww.igc.org.uk
Food and Agriculture Organisation of the United Nationswww.fao.org
Central Intelligence Agency of the United States of Americawww.cia.gov
Food Info Australia
Australian Horticultural Statistics Handbook (annual)
PigStats
World Grain Statistics (annual)
FAOSTATBy subscription on CD-ROM or online (apps.fao.org). There is limited free use allowed of the online version.
World Fact Book (annual). Available in printed, CD-ROM, or online (free)(www.cia.gov/cia/publications/factbook/index.html)
Website providing online access to processed food and beverage industry statistics and Australian Government policy information.
Handbook highlighting production in Australia and competitor countries and exports from Australia to major markets for a range of horticultural commodities. Also includes statistics on per person consumption and main horticultural imports to Australia.
Compilation of pig industry statistics focusing on pig industry structure, farm performance and a range of information on trade and consumption.
Report containing 45 detailed tables on production, trade, consumption, stocks and prices for wheat (including durum and wheat fl our) and coarse grains. Additional tables deal with ocean freight rates. Most tables cover a ten year period.
An online and multilingual database currently containing over 1 million time series records for 210 countries and territories, covering international statistics for production, trade, food balance sheets, food aid shipments, fertiliser and pesticides, land use and irrigation, forest products, fi shery products, and population.
Compendium containing, for virtually every country in the world, information on their geography, people, government, economy, communications, transport, military and transnational issues.
i n f o r m a t i o n s o u r c e s
39australian food statistics 2004
Australian food processing industry
Agency Publication or source Description
Australian Bureauof Statistics www.abs.gov.au
Manufacturing Industry, cat. nos 8221.0, 8221.1, 8221.2, 8221.3, 8221.4, 8221.5, 8221.6 (quarterly)
Available on AusStats(www.abs.gov.au/ausstats)
Information on the Australian processed food industry, including data on employment, wages and salaries, turnover and industry gross production. The data are classifi ed by state and selected major commodities together with aggregate data for the past two years.
An internet based information service providing ABS full product range (both free and charged material) online.
Australian retail food industry
Agency Publication or source Description
Australian Bureau of Statisticswww.abs.gov.au
Retail World Pty Ltdwww.reatailworld.com.au
Retail Trade, cat. no. 8501.0 (quarterly)
Available on AusStats (www.abs.gov.au/ausstats)
Grocery Industry Marketing Guide (annual)
Information on the Australian retail food industry including data on retail turnover by subgroup, such as supermarkets and grocery stores, takeaway outlets, other food retailing, other retailing, hospitality services, such as cafes and restaurants, hotels and licensed clubs.
An internet based information service providing ABS full product range (both free and charged material) online.
Information on market shares, by product group suppliers and retail developments.
Australian retail food prices
Agency Publication or source Description
Australian Bureau of Statistics(www.abs.gov.au)
Consumer Price Index,cat. no. 6401.0 (quarterly)
Average Retail Prices of Selected Items, cat. no. 6403.0
Available on AusStats(www.abs.gov.au/ausstats)
Information on the Australian retail food prices and consumer price indexes, by industry, including data on retail prices by subgroup, such as dairy products, grain products, meat and seafood, fruit and vegetables, processed fruit for the past fi ve years. Information on consumer price indexes, including data by subgroups, such as food, clothing, housing, transport, health and personal care etc, and by food group, such as dairy and related products, cereal products, meat and seafoods, fruit and other food.
An internet based information service that provides ABS full product range (both free and charged material) online.
i n f o r m a t i o n s o u r c e s
40 australian food statistics 2004
Australian trade
Agency Publication or source Description
Australian Bureau of Statisticswww.abs.gov.au
Australian Department of Foreign Affairs and Trade (DFAT)www.dfat.gov.au
International Merchandise Trade, cat. no. 5422.0 (quarterly)
Available on AusStats(www.abs.gov.au/ausstats)
Composition of Trade Australia (published twice yearly in calendar year and fi nancial year format)
Extract available free online(www.dfat.gov.au/publications/ statistics.html)
Direction of Trade, Time Series (annual)
Information on the value of Australia’s merchandise exports and imports with major trading partners, including data classifi ed by state, broad economic category, industry of origin and selected major commodities, together with aggregate data on trade with major trading partners for the past fourteen years.
An internet based information service providing ABS’s full product range (both free and charged material) online.
A compendium of statistics on merchandise exports and imports, analysing the growth, direction and commodity breakdown of Australia’s trade over the past fi ve years. It also includes individual reports showing the composition of trade with over eighty of Australia’s trading partners.
Contains value and percentage shares of Australia’s exports to, and imports from, every one of our trading partners on a consistent basis over a twenty year period. It also includes total trade and trade balances with each of these countries.
i n f o r m a t i o n s o u r c e s
41australian food statistics 2004
World food trade
Agency Publication or source Description
International Trade Centre, an organisation operated jointly by the World Trade Organisation (WTO) and United Nations Conference on Trade and Development (UNCTAD)www.intracen.org
United Nations Statistics Divisionwww.un.org/Depts/unsd
Trade statistics(www.intracen.org/tradstat/ welcome.htm)
Also available on CD-ROM with time series data for the fi ve years 1996–2000. (Data are obtained from the Commodity Trade Statistics Data Base (COMTRADE) of the United Nations Statistics Division)
Infobases (www.intracen.org/tradstat/ welcome.htm)
International Trade Statistics Yearbook (annual)
International trade statistic (imports and exports) by:• section and product group, 1996–2003• country and product group, 1996–2003.
Has coverage of over 100 reporting countries and territories representing about 90 per cent of world trade.
The data are recorded according to the Harmonised Commodity Description and Coding System (HS 96 and HS 88) and Standard International Trade classifi cation (Rev. 3, Rev. 2 and Rev. 1).
Also includes information on product classifi cation and trade performances, by country.
As well as trade statistics, contains market briefs, information on trade contacts and information sources.
Volume I provides historical information on the external trade performance of individual countries in terms of current values and, if available, exchange rate, as well as quantum and unit value indexes. Information showing important commodities traded by an individual country (latest four years) and the country’s trade with its major trading partners and regions (latest fi ve years) are also shown. Summary tables for each country show imports by broad economic categories, exports by industrial origin and the percentage share of the country’s top ten trading partners and selected regions in relation to its total trade. This volume contains data for 168 countries or reporting customs areas.
Volume II contains selected commodity tables showing total world trade of those commodities analysed by regions and countries, as well as various specialised tables.
i n f o r m a t i o n s o u r c e s
42 australian food statistics 2004
World food consumption
Agency Publication or source Description
International Trade Centre, an organisation operated jointly by the World Trade Organisation (WTO) and United Nations Conference on Trade and Development (UNCTAD)www.intracen.org
United Nations Statistics Divisionwww.un.org/Depts/unsd
Trade statistics(www.intracen.org/tradstat/ mainproduct.htm)
Also available on CD-ROM with time series data for the fi ve years 1996–2000. (Data are obtained from the Commodity Trade Statistics Data Base (COMTRADE) of the United Nations Statistics Division.)
Infobases (www.intracen.org/tradstat/ welcome.htm)
International Trade Statistics Yearbook (annual)
International trade statistic (imports and exports) by:• section and product group, 1996–2000• country and product group, 1996–2000.
Has coverage of over 100 reporting countries and territories representing about 90 per cent of world trade.
The data are recorded according to the Harmonised Commodity Description and Coding System (HS 96 and HS 88) and Standard International Trade classifi cation (Rev. 3, Rev. 2 and Rev. 1).
Also includes information on product classifi cation and trade performances, by country.
As well as trade statistics, contains market briefs, information on trade contacts and information sources.
Volume I provides historical information on the external trade performance of individual countries in terms of current values and, if available, exchange rate, as well as quantum and unit value indexes. Information showing important commodities traded by an individual country (latest four years) and the country’s trade with its major trading partners and regions (latest fi ve years) are also shown. Summary tables for each country show imports by broad economic categories, exports by industrial origin and the percentage share of the country’s top ten trading partners and selected regions in relation to its total trade. This volume contains data for 168 countries or reporting customs areas.
Volume II contains selected commodity tables showing total world trade of those commodities analysed by regions and countries, as well as various specialised tables.
i n f o r m a t i o n s o u r c e s
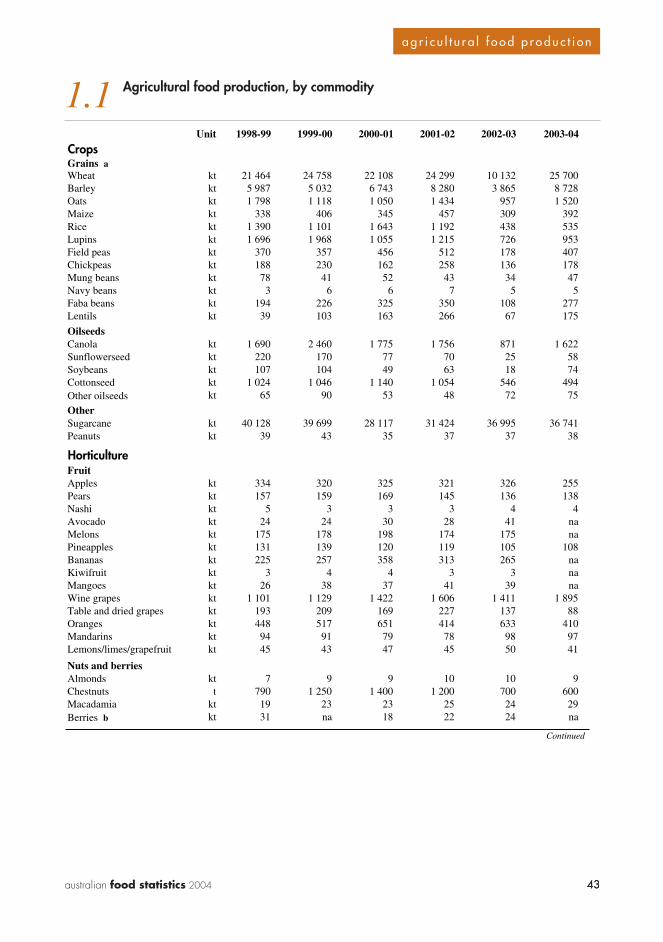
43australian food statistics 2004 43
a g r i c u l t u r a l f o o d p r o d u c t i o n
1.1 Agricultural food production, by commodity
Unit 1998-99 1999-00 2000-01 2001-02 2002-03 2003-04
CropsGrains a Wheat kt 21 464 24 758 22 108 24 299 10 132 25 700Barley kt 5 987 5 032 6 743 8 280 3 865 8 728Oats kt 1 798 1 118 1 050 1 434 957 1 520Maize kt 338 406 345 457 309 392Rice kt 1 390 1 101 1 643 1 192 438 535Lupins kt 1 696 1 968 1 055 1 215 726 953Field peas kt 370 357 456 512 178 407Chickpeas kt 188 230 162 258 136 178Mung beans kt 78 41 52 43 34 47Navy beans kt 3 6 6 7 5 5Faba beans kt 194 226 325 350 108 277Lentils kt 39 103 163 266 67 175
OilseedsCanola kt 1 690 2 460 1 775 1 756 871 1 622Sunflowerseed kt 220 170 77 70 25 58Soybeans kt 107 104 49 63 18 74Cottonseed kt 1 024 1 046 1 140 1 054 546 494Other oilseeds kt 65 90 53 48 72 75
OtherSugarcane kt 40 128 39 699 28 117 31 424 36 995 36 741Peanuts kt 39 43 35 37 37 38
HorticultureFruitApples kt 334 320 325 321 326 255Pears kt 157 159 169 145 136 138Nashi kt 5 3 3 3 4 4Avocado kt 24 24 30 28 41 naMelons kt 175 178 198 174 175 naPineapples kt 131 139 120 119 105 108Bananas kt 225 257 358 313 265 naKiwifruit kt 3 4 4 3 3 naMangoes kt 26 38 37 41 39 naWine grapes kt 1 101 1 129 1 422 1 606 1 411 1 895Table and dried grapes kt 193 209 169 227 137 88Oranges kt 448 517 651 414 633 410Mandarins kt 94 91 79 78 98 97Lemons/limes/grapefruit kt 45 43 47 45 50 41
Nuts and berriesAlmonds kt 7 9 9 10 10 9Chestnuts t 790 1 250 1 400 1 200 700 600Macadamia kt 19 23 23 25 24 29Berries b kt 31 na 18 22 24 na
Continued
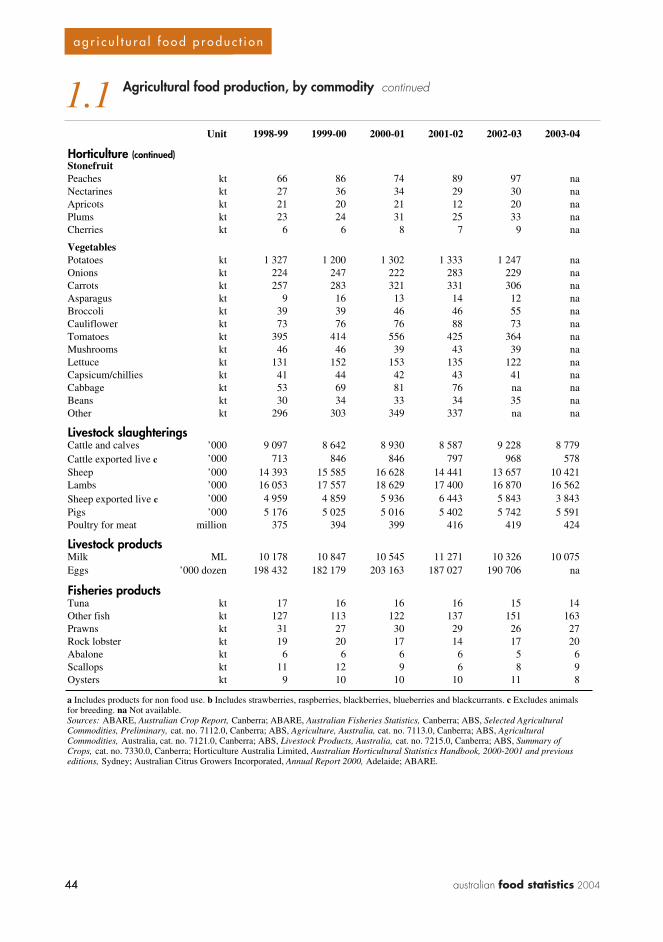
44 australian food statistics 2004
? ? ?
44
a g r i c u l t u r a l f o o d p r o d u c t i o n
1.1 Agricultural food production, by commodity continued
Unit 1998-99 1999-00 2000-01 2001-02 2002-03 2003-04
Horticulture (continued)StonefruitPeaches kt 66 86 74 89 97 naNectarines kt 27 36 34 29 30 naApricots kt 21 20 21 12 20 naPlums kt 23 24 31 25 33 naCherries kt 6 6 8 7 9 na
VegetablesPotatoes kt 1 327 1 200 1 302 1 333 1 247 naOnions kt 224 247 222 283 229 na Carrots kt 257 283 321 331 306 naAsparagus kt 9 16 13 14 12 naBroccoli kt 39 39 46 46 55 naCauliflower kt 73 76 76 88 73 naTomatoes kt 395 414 556 425 364 naMushrooms kt 46 46 39 43 39 naLettuce kt 131 152 153 135 122 naCapsicum/chillies kt 41 44 42 43 41 naCabbage kt 53 69 81 76 na naBeans kt 30 34 33 34 35 naOther kt 296 303 349 337 na na
Livestock slaughteringsCattle and calves ’000 9 097 8 642 8 930 8 587 9 228 8 779Cattle exported live c ’000 713 846 846 797 968 578Sheep ’000 14 393 15 585 16 628 14 441 13 657 10 421Lambs ’000 16 053 17 557 18 629 17 400 16 870 16 562Sheep exported live c ’000 4 959 4 859 5 936 6 443 5 843 3 843Pigs ’000 5 176 5 025 5 016 5 402 5 742 5 591Poultry for meat million 375 394 399 416 419 424
Livestock products Milk ML 10 178 10 847 10 545 11 271 10 326 10 075Eggs ’000 dozen 198 432 182 179 203 163 187 027 190 706 na
Fisheries productsTuna kt 17 16 16 16 15 14Other fish kt 127 113 122 137 151 163Prawns kt 31 27 30 29 26 27Rock lobster kt 19 20 17 14 17 20Abalone kt 6 6 6 6 5 6Scallops kt 11 12 9 6 8 9Oysters kt 9 10 10 10 11 8
a Includes products for non food use. b Includes strawberries, raspberries, blackberries, blueberries and blackcurrants. c Excludes animals for breeding. na Not available.Sources: ABARE, Australian Crop Report, Canberra; ABARE, Australian Fisheries Statistics, Canberra; ABS, Selected Agricultural Commodities, Preliminary, cat. no. 7112.0, Canberra; ABS, Agriculture, Australia, cat. no. 7113.0, Canberra; ABS, Agricultural Commodities, Australia, cat. no. 7121.0, Canberra; ABS, Livestock Products, Australia, cat. no. 7215.0, Canberra; ABS, Summary of Crops, cat. no. 7330.0, Canberra; Horticulture Australia Limited, Australian Horticultural Statistics Handbook, 2000-2001 and previous editions, Sydney; Australian Citrus Growers Incorporated, Annual Report 2000, Adelaide; ABARE.
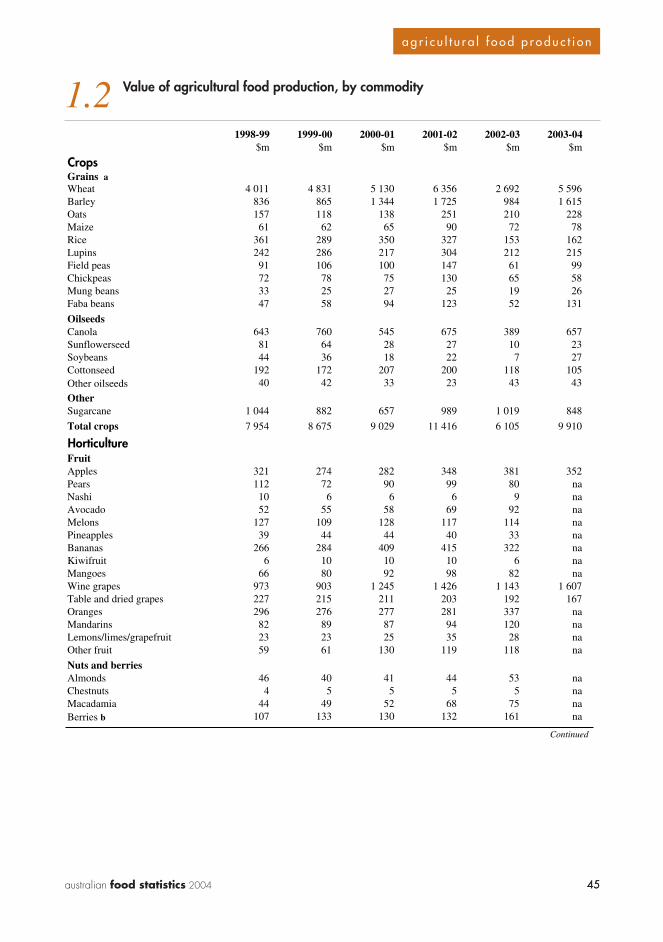
45australian food statistics 2004 45
a g r i c u l t u r a l f o o d p r o d u c t i o n
1.2 Value of agricultural food production, by commodity
1998-99 1999-00 2000-01 2001-02 2002-03 2003-04$m $m $m $m $m $m
CropsGrains aWheat 4 011 4 831 5 130 6 356 2 692 5 596Barley 836 865 1 344 1 725 984 1 615Oats 157 118 138 251 210 228Maize 61 62 65 90 72 78Rice 361 289 350 327 153 162Lupins 242 286 217 304 212 215Field peas 91 106 100 147 61 99Chickpeas 72 78 75 130 65 58Mung beans 33 25 27 25 19 26Faba beans 47 58 94 123 52 131
OilseedsCanola 643 760 545 675 389 657Sunflowerseed 81 64 28 27 10 23Soybeans 44 36 18 22 7 27Cottonseed 192 172 207 200 118 105Other oilseeds 40 42 33 23 43 43
OtherSugarcane 1 044 882 657 989 1 019 848
Total crops 7 954 8 675 9 029 11 416 6 105 9 910
HorticultureFruitApples 321 274 282 348 381 352Pears 112 72 90 99 80 naNashi 10 6 6 6 9 naAvocado 52 55 58 69 92 naMelons 127 109 128 117 114 naPineapples 39 44 44 40 33 naBananas 266 284 409 415 322 naKiwifruit 6 10 10 10 6 naMangoes 66 80 92 98 82 naWine grapes 973 903 1 245 1 426 1 143 1 607Table and dried grapes 227 215 211 203 192 167Oranges 296 276 277 281 337 naMandarins 82 89 87 94 120 naLemons/limes/grapefruit 23 23 25 35 28 naOther fruit 59 61 130 119 118 na
Nuts and berriesAlmonds 46 40 41 44 53 naChestnuts 4 5 5 5 5 na Macadamia 44 49 52 68 75 na
Berries b 107 133 130 132 161 na
Continued
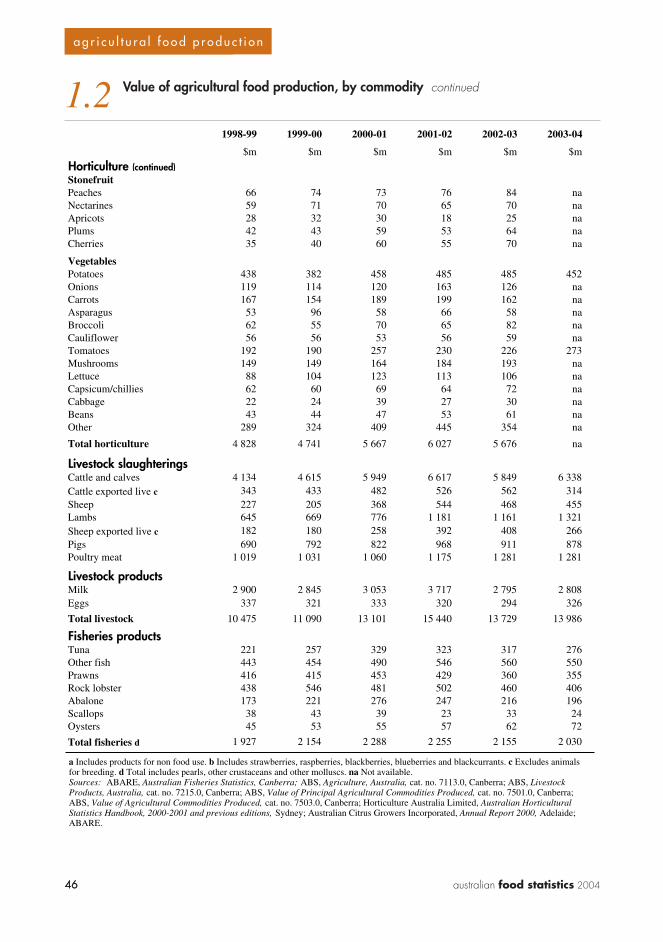
46 australian food statistics 2004
? ? ?
46
a g r i c u l t u r a l f o o d p r o d u c t i o n
1.2 Value of agricultural food production, by commodity continued
1998-99 1999-00 2000-01 2001-02 2002-03 2003-04
$m $m $m $m $m $m
Horticulture (continued)StonefruitPeaches 66 74 73 76 84 naNectarines 59 71 70 65 70 naApricots 28 32 30 18 25 naPlums 42 43 59 53 64 naCherries 35 40 60 55 70 na
VegetablesPotatoes 438 382 458 485 485 452Onions 119 114 120 163 126 naCarrots 167 154 189 199 162 naAsparagus 53 96 58 66 58 naBroccoli 62 55 70 65 82 naCauliflower 56 56 53 56 59 naTomatoes 192 190 257 230 226 273Mushrooms 149 149 164 184 193 naLettuce 88 104 123 113 106 naCapsicum/chillies 62 60 69 64 72 naCabbage 22 24 39 27 30 naBeans 43 44 47 53 61 naOther 289 324 409 445 354 na
Total horticulture 4 828 4 741 5 667 6 027 5 676 na
Livestock slaughteringsCattle and calves 4 134 4 615 5 949 6 617 5 849 6 338Cattle exported live c 343 433 482 526 562 314Sheep 227 205 368 544 468 455Lambs 645 669 776 1 181 1 161 1 321Sheep exported live c 182 180 258 392 408 266Pigs 690 792 822 968 911 878Poultry meat 1 019 1 031 1 060 1 175 1 281 1 281
Livestock products Milk 2 900 2 845 3 053 3 717 2 795 2 808Eggs 337 321 333 320 294 326
Total livestock 10 475 11 090 13 101 15 440 13 729 13 986
Fisheries productsTuna 221 257 329 323 317 276Other fish 443 454 490 546 560 550Prawns 416 415 453 429 360 355Rock lobster 438 546 481 502 460 406Abalone 173 221 276 247 216 196Scallops 38 43 39 23 33 24Oysters 45 53 55 57 62 72
Total fisheries d 1 927 2 154 2 288 2 255 2 155 2 030
a Includes products for non food use. b Includes strawberries, raspberries, blackberries, blueberries and blackcurrants. c Excludes animals for breeding. d Total includes pearls, other crustaceans and other molluscs. na Not available.Sources: ABARE, Australian Fisheries Statistics, Canberra; ABS, Agriculture, Australia, cat. no. 7113.0, Canberra; ABS, Livestock Products, Australia, cat. no. 7215.0, Canberra; ABS, Value of Principal Agricultural Commodities Produced, cat. no. 7501.0, Canberra; ABS, Value of Agricultural Commodities Produced, cat. no. 7503.0, Canberra; Horticulture Australia Limited, Australian Horticultural Statistics Handbook, 2000-2001 and previous editions, Sydney; Australian Citrus Growers Incorporated, Annual Report 2000, Adelaide; ABARE.
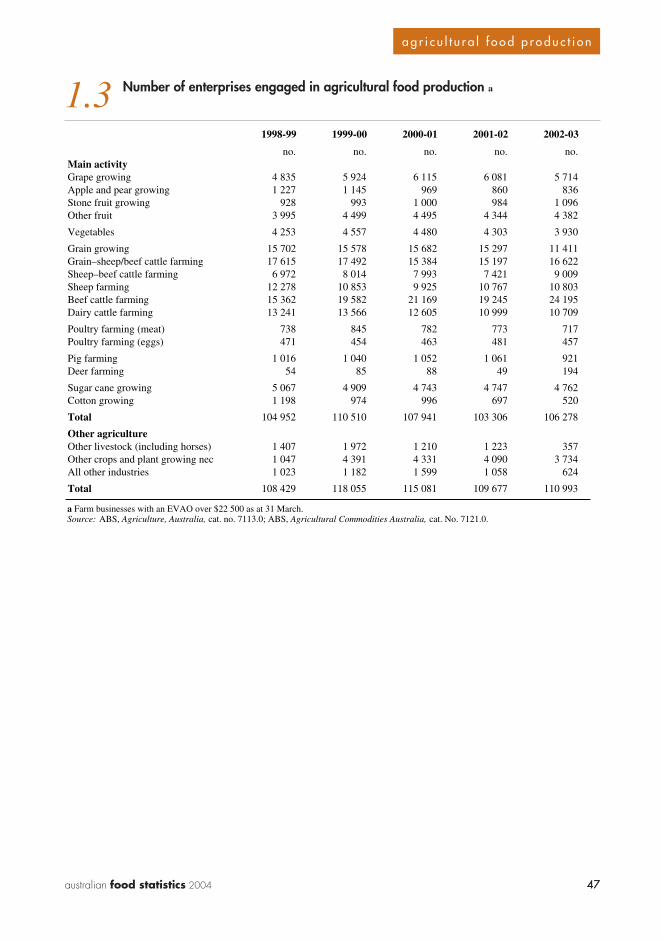
47australian food statistics 2004 47
a g r i c u l t u r a l f o o d p r o d u c t i o n
1.3 Number of enterprises engaged in agricultural food production a
1998-99 1999-00 2000-01 2001-02 2002-03
no. no. no. no. no.Main activityGrape growing 4 835 5 924 6 115 6 081 5 714Apple and pear growing 1 227 1 145 969 860 836Stone fruit growing 928 993 1 000 984 1 096Other fruit 3 995 4 499 4 495 4 344 4 382
Vegetables 4 253 4 557 4 480 4 303 3 930
Grain growing 15 702 15 578 15 682 15 297 11 411Grain–sheep/beef cattle farming 17 615 17 492 15 384 15 197 16 622Sheep–beef cattle farming 6 972 8 014 7 993 7 421 9 009Sheep farming 12 278 10 853 9 925 10 767 10 803Beef cattle farming 15 362 19 582 21 169 19 245 24 195Dairy cattle farming 13 241 13 566 12 605 10 999 10 709
Poultry farming (meat) 738 845 782 773 717Poultry farming (eggs) 471 454 463 481 457
Pig farming 1 016 1 040 1 052 1 061 921Deer farming 54 85 88 49 194
Sugar cane growing 5 067 4 909 4 743 4 747 4 762Cotton growing 1 198 974 996 697 520
Total 104 952 110 510 107 941 103 306 106 278
Other agricultureOther livestock (including horses) 1 407 1 972 1 210 1 223 357Other crops and plant growing nec 1 047 4 391 4 331 4 090 3 734All other industries 1 023 1 182 1 599 1 058 624
Total 108 429 118 055 115 081 109 677 110 993
a Farm businesses with an EVAO over $22 500 as at 31 March.Source: ABS, Agriculture, Australia, cat. no. 7113.0; ABS, Agricultural Commodities Australia, cat. No. 7121.0.
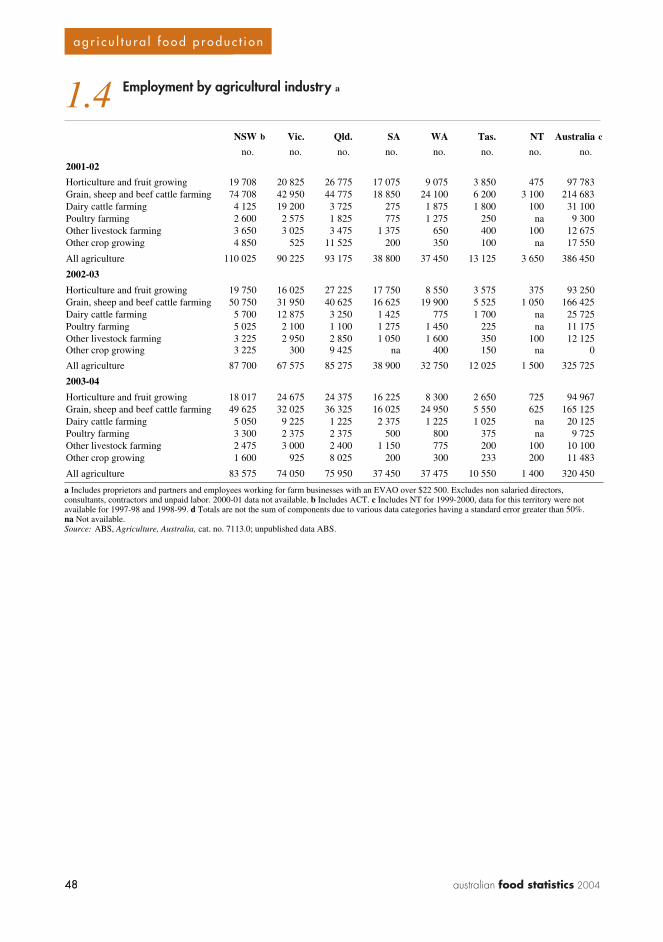
48 australian food statistics 2004
? ? ?
48
a g r i c u l t u r a l f o o d p r o d u c t i o n
1.4 Employment by agricultural industry a
NSW b Vic. Qld. SA WA Tas. NT Australia c
no. no. no. no. no. no. no. no.
2001-02
Horticulture and fruit growing 19 708 20 825 26 775 17 075 9 075 3 850 475 97 783Grain, sheep and beef cattle farming 74 708 42 950 44 775 18 850 24 100 6 200 3 100 214 683Dairy cattle farming 4 125 19 200 3 725 275 1 875 1 800 100 31 100Poultry farming 2 600 2 575 1 825 775 1 275 250 na 9 300Other livestock farming 3 650 3 025 3 475 1 375 650 400 100 12 675Other crop growing 4 850 525 11 525 200 350 100 na 17 550
All agriculture 110 025 90 225 93 175 38 800 37 450 13 125 3 650 386 450
2002-03
Horticulture and fruit growing 19 750 16 025 27 225 17 750 8 550 3 575 375 93 250Grain, sheep and beef cattle farming 50 750 31 950 40 625 16 625 19 900 5 525 1 050 166 425Dairy cattle farming 5 700 12 875 3 250 1 425 775 1 700 na 25 725Poultry farming 5 025 2 100 1 100 1 275 1 450 225 na 11 175Other livestock farming 3 225 2 950 2 850 1 050 1 600 350 100 12 125Other crop growing 3 225 300 9 425 na 400 150 na 0
All agriculture 87 700 67 575 85 275 38 900 32 750 12 025 1 500 325 725
2003-04
Horticulture and fruit growing 18 017 24 675 24 375 16 225 8 300 2 650 725 94 967Grain, sheep and beef cattle farming 49 625 32 025 36 325 16 025 24 950 5 550 625 165 125Dairy cattle farming 5 050 9 225 1 225 2 375 1 225 1 025 na 20 125Poultry farming 3 300 2 375 2 375 500 800 375 na 9 725Other livestock farming 2 475 3 000 2 400 1 150 775 200 100 10 100Other crop growing 1 600 925 8 025 200 300 233 200 11 483
All agriculture 83 575 74 050 75 950 37 450 37 475 10 550 1 400 320 450
a Includes proprietors and partners and employees working for farm businesses with an EVAO over $22 500. Excludes non salaried directors, consultants, contractors and unpaid labor. 2000-01 data not available. b Includes ACT. c Includes NT for 1999-2000, data for this territory were not available for 1997-98 and 1998-99. d Totals are not the sum of components due to various data categories having a standard error greater than 50%. na Not available.Source: ABS, Agriculture, Australia, cat. no. 7113.0; unpublished data ABS.
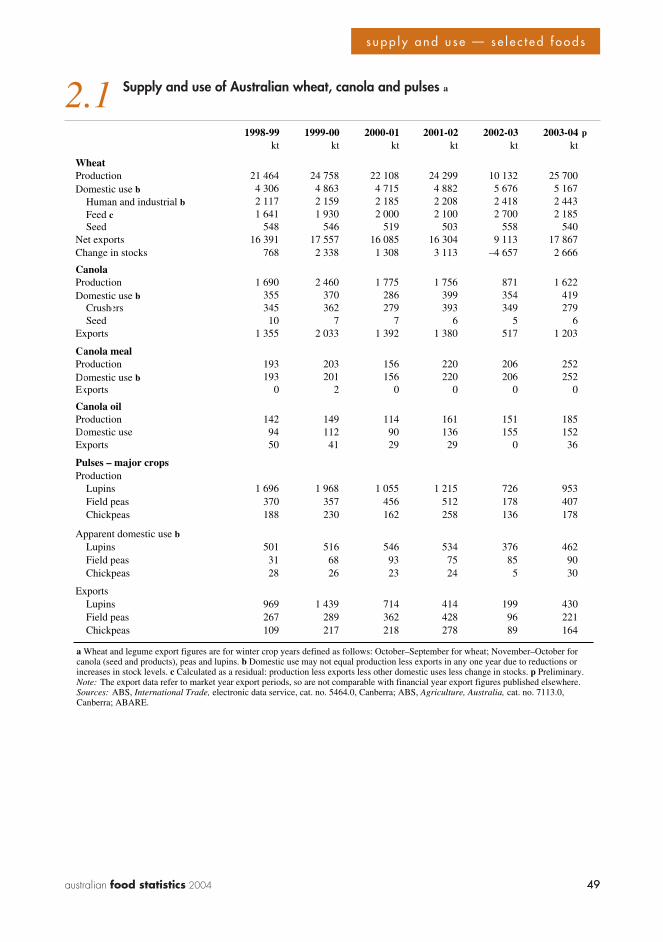
49australian food statistics 2004 49
s u p p l y a n d u s e — s e l e c t e d f o o d s
1998-99 1999-00 2000-01 2001-02 2002-03 2003-04 pkt kt kt kt kt kt
WheatProduction 21 464 24 758 22 108 24 299 10 132 25 700Domestic use b 4 306 4 863 4 715 4 882 5 676 5 167
Human and industrial b 2 117 2 159 2 185 2 208 2 418 2 443Feed c 1 641 1 930 2 000 2 100 2 700 2 185Seed 548 546 519 503 558 540
Net exports 16 391 17 557 16 085 16 304 9 113 17 867Change in stocks 768 2 338 1 308 3 113 –4 657 2 666
CanolaProduction 1 690 2 460 1 775 1 756 871 1 622Domestic use b 355 370 286 399 354 419
Crushers 345 362 279 393 349 279Seed 10 7 7 6 5 6
Exports 1 355 2 033 1 392 1 380 517 1 203
Canola mealProduction 193 203 156 220 206 252Domestic use b 193 201 156 220 206 252Exports 0 2 0 0 0 0
Canola oilProduction 142 149 114 161 151 185Domestic use 94 112 90 136 155 152Exports 50 41 29 29 0 36
Pulses – major cropsProduction
Lupins 1 696 1 968 1 055 1 215 726 953Field peas 370 357 456 512 178 407Chickpeas 188 230 162 258 136 178
Apparent domestic use bLupins 501 516 546 534 376 462Field peas 31 68 93 75 85 90Chickpeas 28 26 23 24 5 30
ExportsLupins 969 1 439 714 414 199 430Field peas 267 289 362 428 96 221Chickpeas 109 217 218 278 89 164
a Wheat and legume export figures are for winter crop years defined as follows: October–September for wheat; November–October for canola (seed and products), peas and lupins. b Domestic use may not equal production less exports in any one year due to reductions or increases in stock levels. c Calculated as a residual: production less exports less other domestic uses less change in stocks. p Preliminary. Note: The export data refer to market year export periods, so are not comparable with financial year export figures published elsewhere. Sources: ABS, International Trade, electronic data service, cat. no. 5464.0, Canberra; ABS, Agriculture, Australia, cat. no. 7113.0, Canberra; ABARE.
2.1 Supply and use of Australian wheat, canola and pulses a
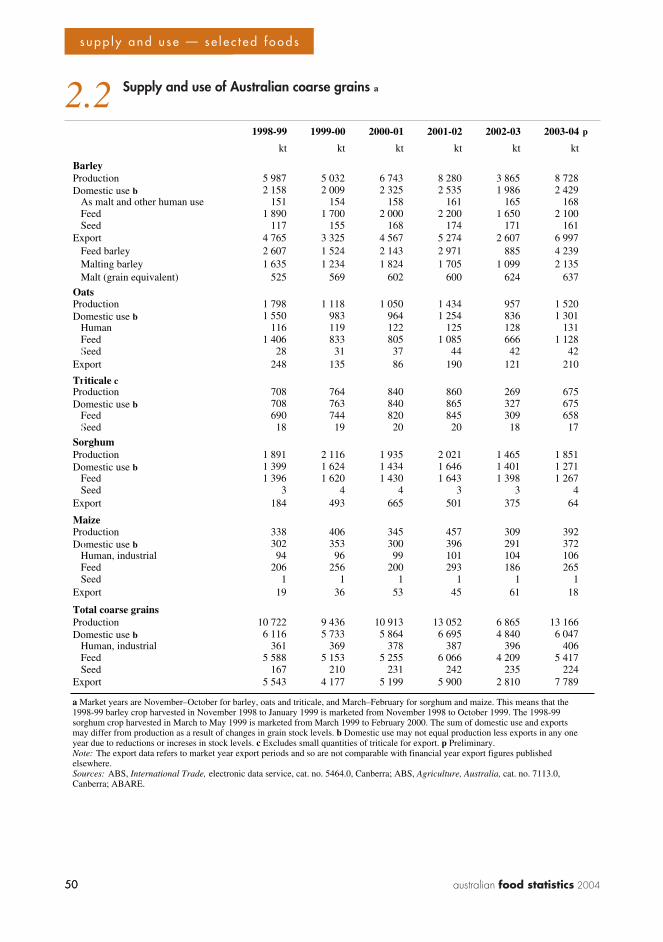
50 australian food statistics 2004
? ? ?
50
s u p p l y a n d u s e — s e l e c t e d f o o d s
2.2 Supply and use of Australian coarse grains a
1998-99 1999-00 2000-01 2001-02 2002-03 2003-04 p
kt kt kt kt kt kt
BarleyProduction 5 987 5 032 6 743 8 280 3 865 8 728Domestic use b 2 158 2 009 2 325 2 535 1 986 2 429 As malt and other human use 151 154 158 161 165 168 Feed 1 890 1 700 2 000 2 200 1 650 2 100 Seed 117 155 168 174 171 161Export 4 765 3 325 4 567 5 274 2 607 6 997 Feed barley 2 607 1 524 2 143 2 971 885 4 239 Malting barley 1 635 1 234 1 824 1 705 1 099 2 135 Malt (grain equivalent) 525 569 602 600 624 637
OatsProduction 1 798 1 118 1 050 1 434 957 1 520Domestic use b 1 550 983 964 1 254 836 1 301 Human 116 119 122 125 128 131 Feed 1 406 833 805 1 085 666 1 128 Seed 28 31 37 44 42 42Export 248 135 86 190 121 210
Triticale cProduction 708 764 840 860 269 675Domestic use b 708 763 840 865 327 675 Feed 690 744 820 845 309 658 Seed 18 19 20 20 18 17
SorghumProduction 1 891 2 116 1 935 2 021 1 465 1 851Domestic use b 1 399 1 624 1 434 1 646 1 401 1 271 Feed 1 396 1 620 1 430 1 643 1 398 1 267 Seed 3 4 4 3 3 4Export 184 493 665 501 375 64
MaizeProduction 338 406 345 457 309 392Domestic use b 302 353 300 396 291 372 Human, industrial 94 96 99 101 104 106 Feed 206 256 200 293 186 265 Seed 1 1 1 1 1 1Export 19 36 53 45 61 18
Total coarse grainsProduction 10 722 9 436 10 913 13 052 6 865 13 166Domestic use b 6 116 5 733 5 864 6 695 4 840 6 047 Human, industrial 361 369 378 387 396 406 Feed 5 588 5 153 5 255 6 066 4 209 5 417 Seed 167 210 231 242 235 224Export 5 543 4 177 5 199 5 900 2 810 7 789
a Market years are November–October for barley, oats and triticale, and March–February for sorghum and maize. This means that the 1998-99 barley crop harvested in November 1998 to January 1999 is marketed from November 1998 to October 1999. The 1998-99 sorghum crop harvested in March to May 1999 is marketed from March 1999 to February 2000. The sum of domestic use and exports may differ from production as a result of changes in grain stock levels. b Domestic use may not equal production less exports in any one year due to reductions or increses in stock levels. c Excludes small quantities of triticale for export. p Preliminary.Note: The export data refers to market year export periods and so are not comparable with financial year export figures published elsewhere.Sources: ABS, International Trade, electronic data service, cat. no. 5464.0, Canberra; ABS, Agriculture, Australia, cat. no. 7113.0, Canberra; ABARE.
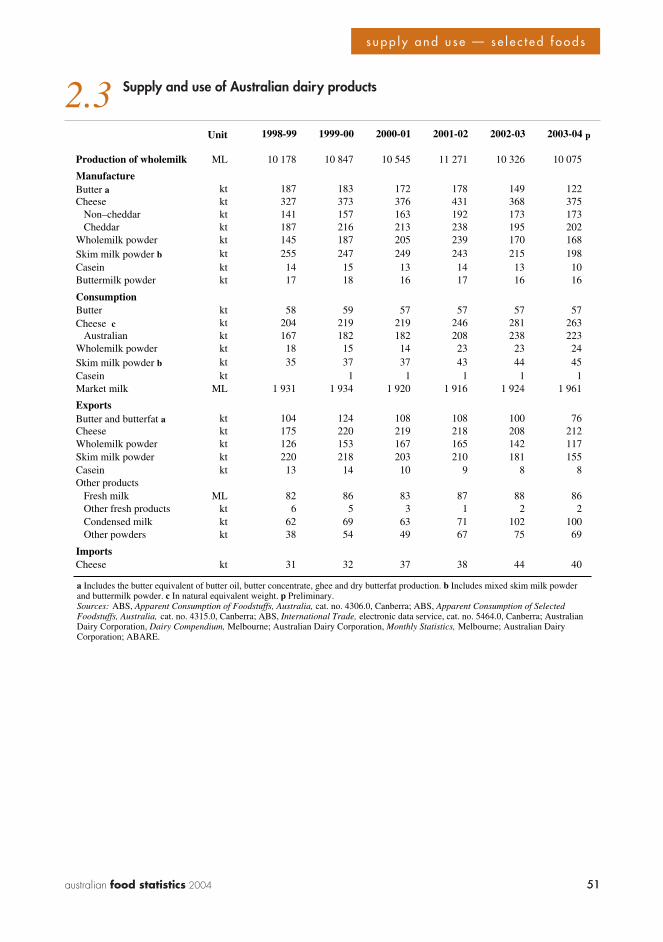
51australian food statistics 2004 51
s u p p l y a n d u s e — s e l e c t e d f o o d s
2.3 Supply and use of Australian dairy products
Unit 1998-99 1999-00 2000-01 2001-02 2002-03 2003-04 p
Production of wholemilk ML 10 178 10 847 10 545 11 271 10 326 10 075
ManufactureButter a kt 187 183 172 178 149 122Cheese kt 327 373 376 431 368 375 Non–cheddar kt 141 157 163 192 173 173 Cheddar kt 187 216 213 238 195 202Wholemilk powder kt 145 187 205 239 170 168Skim milk powder b kt 255 247 249 243 215 198Casein kt 14 15 13 14 13 10Buttermilk powder kt 17 18 16 17 16 16
ConsumptionButter kt 58 59 57 57 57 57Cheese c kt 204 219 219 246 281 263 Australian kt 167 182 182 208 238 223Wholemilk powder kt 18 15 14 23 23 24Skim milk powder b kt 35 37 37 43 44 45Casein kt 1 1 1 1 1Market milk ML 1 931 1 934 1 920 1 916 1 924 1 961
ExportsButter and butterfat a kt 104 124 108 108 100 76Cheese kt 175 220 219 218 208 212Wholemilk powder kt 126 153 167 165 142 117Skim milk powder kt 220 218 203 210 181 155Casein kt 13 14 10 9 8 8Other products Fresh milk ML 82 86 83 87 88 86 Other fresh products kt 6 5 3 1 2 2 Condensed milk kt 62 69 63 71 102 100 Other powders kt 38 54 49 67 75 69
ImportsCheese kt 31 32 37 38 44 40
a Includes the butter equivalent of butter oil, butter concentrate, ghee and dry butterfat production. b Includes mixed skim milk powder and buttermilk powder. c In natural equivalent weight. p Preliminary.Sources: ABS, Apparent Consumption of Foodstuffs, Australia, cat. no. 4306.0, Canberra; ABS, Apparent Consumption of Selected Foodstuffs, Australia, cat. no. 4315.0, Canberra; ABS, International Trade, electronic data service, cat. no. 5464.0, Canberra; Australian Dairy Corporation, Dairy Compendium, Melbourne; Australian Dairy Corporation, Monthly Statistics, Melbourne; Australian Dairy Corporation; ABARE.
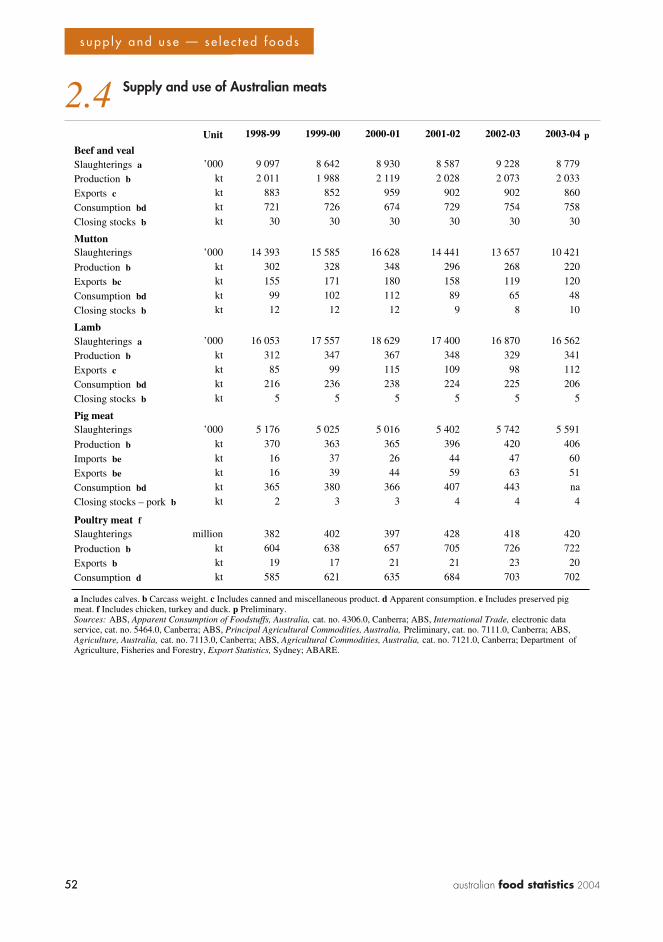
52 australian food statistics 2004
? ? ?
52
s u p p l y a n d u s e — s e l e c t e d f o o d s
2.4 Supply and use of Australian meats
Unit 1998-99 1999-00 2000-01 2001-02 2002-03 2003-04 p
Beef and vealSlaughterings a ’000 9 097 8 642 8 930 8 587 9 228 8 779
Production b kt 2 011 1 988 2 119 2 028 2 073 2 033
Exports c kt 883 852 959 902 902 860
Consumption bd kt 721 726 674 729 754 758
Closing stocks b kt 30 30 30 30 30 30
MuttonSlaughterings ’000 14 393 15 585 16 628 14 441 13 657 10 421
Production b kt 302 328 348 296 268 220
Exports bc kt 155 171 180 158 119 120
Consumption bd kt 99 102 112 89 65 48
Closing stocks b kt 12 12 12 9 8 10
LambSlaughterings a ’000 16 053 17 557 18 629 17 400 16 870 16 562
Production b kt 312 347 367 348 329 341
Exports c kt 85 99 115 109 98 112
Consumption bd kt 216 236 238 224 225 206
Closing stocks b kt 5 5 5 5 5 5
Pig meatSlaughterings ’000 5 176 5 025 5 016 5 402 5 742 5 591
Production b kt 370 363 365 396 420 406
Imports be kt 16 37 26 44 47 60
Exports be kt 16 39 44 59 63 51
Consumption bd kt 365 380 366 407 443 na
Closing stocks – pork b kt 2 3 3 4 4 4
Poultry meat fSlaughterings million 382 402 397 428 418 420
Production b kt 604 638 657 705 726 722
Exports b kt 19 17 21 21 23 20
Consumption d kt 585 621 635 684 703 702
a Includes calves. b Carcass weight. c Includes canned and miscellaneous product. d Apparent consumption. e Includes preserved pig meat. f Includes chicken, turkey and duck. p Preliminary.Sources: ABS, Apparent Consumption of Foodstuffs, Australia, cat. no. 4306.0, Canberra; ABS, International Trade, electronic data service, cat. no. 5464.0, Canberra; ABS, Principal Agricultural Commodities, Australia, Preliminary, cat. no. 7111.0, Canberra; ABS, Agriculture, Australia, cat. no. 7113.0, Canberra; ABS, Agricultural Commodities, Australia, cat. no. 7121.0, Canberra; Department of Agriculture, Fisheries and Forestry, Export Statistics, Sydney; ABARE.
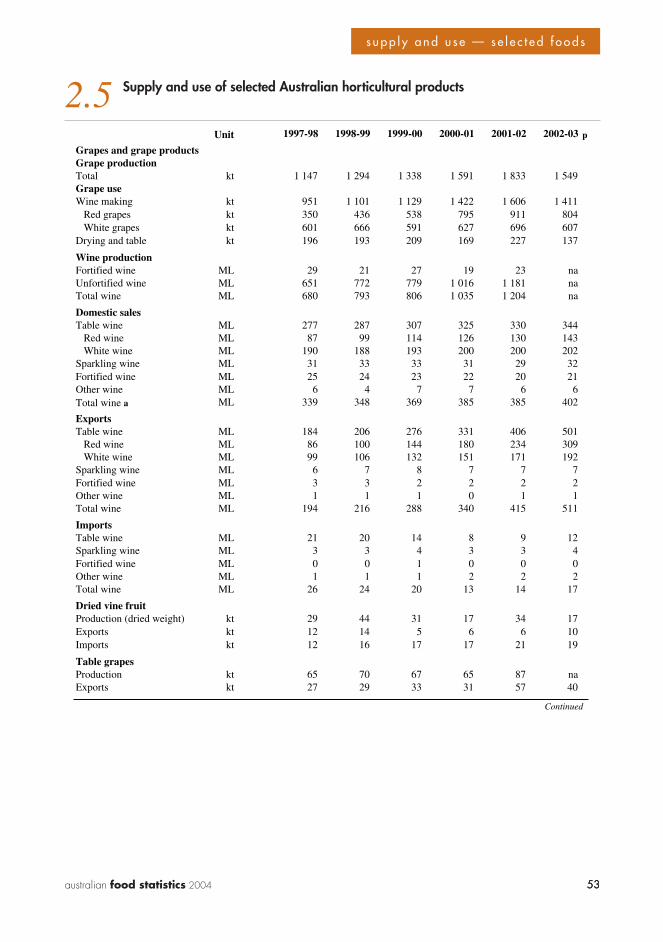
53australian food statistics 2004 53
s u p p l y a n d u s e — s e l e c t e d f o o d s
2.5 Supply and use of selected Australian horticultural products
Unit 1997-98 1998-99 1999-00 2000-01 2001-02 2002-03 p
Grapes and grape productsGrape productionTotal kt 1 147 1 294 1 338 1 591 1 833 1 549Grape useWine making kt 951 1 101 1 129 1 422 1 606 1 411
Red grapes kt 350 436 538 795 911 804White grapes kt 601 666 591 627 696 607
Drying and table kt 196 193 209 169 227 137
Wine productionFortified wine ML 29 21 27 19 23 naUnfortified wine ML 651 772 779 1 016 1 181 naTotal wine ML 680 793 806 1 035 1 204 na
Domestic salesTable wine ML 277 287 307 325 330 344
Red wine ML 87 99 114 126 130 143White wine ML 190 188 193 200 200 202
Sparkling wine ML 31 33 33 31 29 32Fortified wine ML 25 24 23 22 20 21Other wine ML 6 4 7 7 6 6Total wine a ML 339 348 369 385 385 402
ExportsTable wine ML 184 206 276 331 406 501
Red wine ML 86 100 144 180 234 309White wine ML 99 106 132 151 171 192
Sparkling wine ML 6 7 8 7 7 7Fortified wine ML 3 3 2 2 2 2Other wine ML 1 1 1 0 1 1Total wine ML 194 216 288 340 415 511
ImportsTable wine ML 21 20 14 8 9 12Sparkling wine ML 3 3 4 3 3 4Fortified wine ML 0 0 1 0 0 0Other wine ML 1 1 1 2 2 2Total wine ML 26 24 20 13 14 17
Dried vine fruitProduction (dried weight) kt 29 44 31 17 34 17Exports kt 12 14 5 6 6 10Imports kt 12 16 17 17 21 19
Table grapes Production kt 65 70 67 65 87 naExports kt 27 29 33 31 57 40
Continued
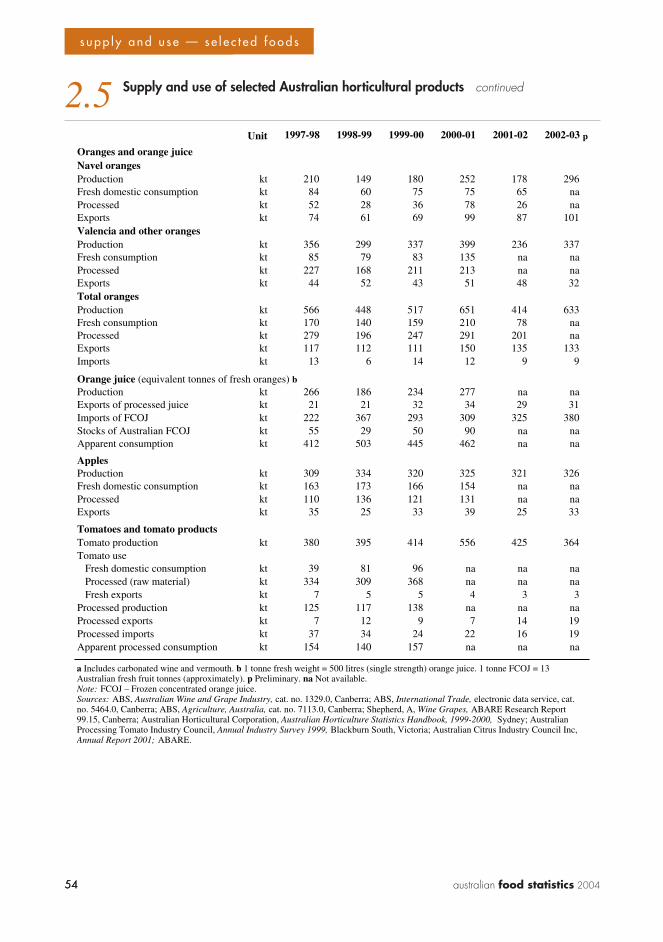
54 australian food statistics 2004
? ? ?
54
s u p p l y a n d u s e — s e l e c t e d f o o d s
2.5 Supply and use of selected Australian horticultural products continued
Unit 1997-98 1998-99 1999-00 2000-01 2001-02 2002-03 p
Oranges and orange juiceNavel orangesProduction kt 210 149 180 252 178 296Fresh domestic consumption kt 84 60 75 75 65 naProcessed kt 52 28 36 78 26 naExports kt 74 61 69 99 87 101Valencia and other orangesProduction kt 356 299 337 399 236 337Fresh consumption kt 85 79 83 135 na naProcessed kt 227 168 211 213 na naExports kt 44 52 43 51 48 32Total orangesProduction kt 566 448 517 651 414 633Fresh consumption kt 170 140 159 210 78 naProcessed kt 279 196 247 291 201 naExports kt 117 112 111 150 135 133Imports kt 13 6 14 12 9 9
Orange juice (equivalent tonnes of fresh oranges) bProduction kt 266 186 234 277 na naExports of processed juice kt 21 21 32 34 29 31Imports of FCOJ kt 222 367 293 309 325 380Stocks of Australian FCOJ kt 55 29 50 90 na naApparent consumption kt 412 503 445 462 na na
ApplesProduction kt 309 334 320 325 321 326Fresh domestic consumption kt 163 173 166 154 na naProcessed kt 110 136 121 131 na naExports kt 35 25 33 39 25 33
Tomatoes and tomato productsTomato production kt 380 395 414 556 425 364Tomato use
Fresh domestic consumption kt 39 81 96 na na naProcessed (raw material) kt 334 309 368 na na naFresh exports kt 7 5 5 4 3 3
Processed production kt 125 117 138 na na naProcessed exports kt 7 12 9 7 14 19Processed imports kt 37 34 24 22 16 19Apparent processed consumption kt 154 140 157 na na na
a Includes carbonated wine and vermouth. b 1 tonne fresh weight = 500 litres (single strength) orange juice. 1 tonne FCOJ = 13 Australian fresh fruit tonnes (approximately). p Preliminary. na Not available.Note: FCOJ – Frozen concentrated orange juice.Sources: ABS, Australian Wine and Grape Industry, cat. no. 1329.0, Canberra; ABS, International Trade, electronic data service, cat. no. 5464.0, Canberra; ABS, Agriculture, Australia, cat. no. 7113.0, Canberra; Shepherd, A, Wine Grapes, ABARE Research Report 99.15, Canberra; Australian Horticultural Corporation, Australian Horticulture Statistics Handbook, 1999-2000, Sydney; Australian Processing Tomato Industry Council, Annual Industry Survey 1999, Blackburn South, Victoria; Australian Citrus Industry Council Inc, Annual Report 2001; ABARE.
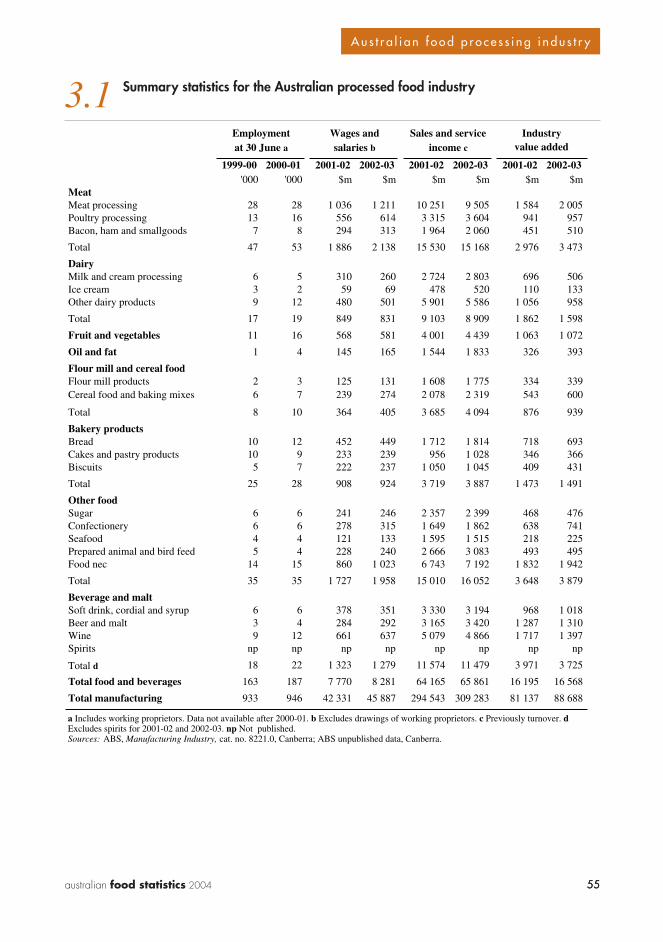
55australian food statistics 2004 55
A u s t r a l i a n f o o d p r o c e s s i n g i n d u s t r y
3.1 Summary statistics for the Australian processed food industry
1999-00 2000-01 2001-02 2002-03 2001-02 2002-03 2001-02 2002-03'000 '000 $m $m $m $m $m $m
MeatMeat processing 28 28 1 036 1 211 10 251 9 505 1 584 2 005Poultry processing 13 16 556 614 3 315 3 604 941 957Bacon, ham and smallgoods 7 8 294 313 1 964 2 060 451 510
Total 47 53 1 886 2 138 15 530 15 168 2 976 3 473
DairyMilk and cream processing 6 5 310 260 2 724 2 803 696 506Ice cream 3 2 59 69 478 520 110 133Other dairy products 9 12 480 501 5 901 5 586 1 056 958
Total 17 19 849 831 9 103 8 909 1 862 1 598
Fruit and vegetables 11 16 568 581 4 001 4 439 1 063 1 072
Oil and fat 1 4 145 165 1 544 1 833 326 393
Flour mill and cereal foodFlour mill products 2 3 125 131 1 608 1 775 334 339Cereal food and baking mixes 6 7 239 274 2 078 2 319 543 600
Total 8 10 364 405 3 685 4 094 876 939
Bakery productsBread 10 12 452 449 1 712 1 814 718 693Cakes and pastry products 10 9 233 239 956 1 028 346 366Biscuits 5 7 222 237 1 050 1 045 409 431
Total 25 28 908 924 3 719 3 887 1 473 1 491
Other foodSugar 6 6 241 246 2 357 2 399 468 476Confectionery 6 6 278 315 1 649 1 862 638 741Seafood 4 4 121 133 1 595 1 515 218 225Prepared animal and bird feed 5 4 228 240 2 666 3 083 493 495Food nec 14 15 860 1 023 6 743 7 192 1 832 1 942
Total 35 35 1 727 1 958 15 010 16 052 3 648 3 879
Beverage and maltSoft drink, cordial and syrup 6 6 378 351 3 330 3 194 968 1 018Beer and malt 3 4 284 292 3 165 3 420 1 287 1 310Wine 9 12 661 637 5 079 4 866 1 717 1 397Spirits np np np np np np np np
Total d 18 22 1 323 1 279 11 574 11 479 3 971 3 725
Total food and beverages 163 187 7 770 8 281 64 165 65 861 16 195 16 568
Total manufacturing 933 946 42 331 45 887 294 543 309 283 81 137 88 688
Sales and servicevalue added
IndustryEmploymentat 30 June a
Wages andsalaries b income c
a Includes working proprietors. Data not available after 2000-01. b Excludes drawings of working proprietors. c Previously turnover. d Excludes spirits for 2001-02 and 2002-03. np Not published.Sources: ABS, Manufacturing Industry, cat. no. 8221.0, Canberra; ABS unpublished data, Canberra.
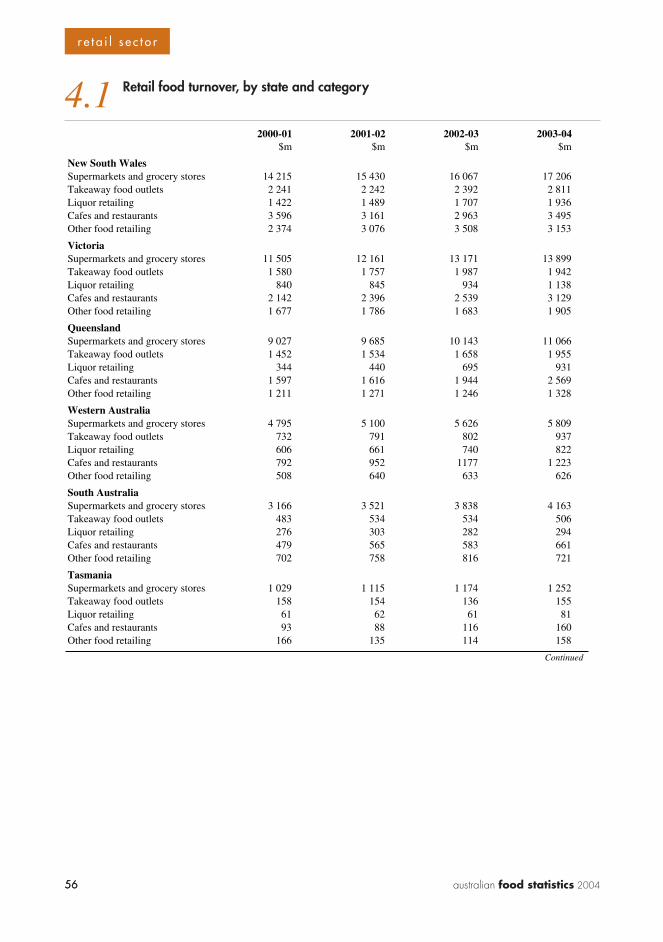
56 australian food statistics 200456
r e t a i l s e c t o r
4.1 Retail food turnover, by state and category
2000-01 2001-02 2002-03 2003-04 $m $m $m $m
New South WalesSupermarkets and grocery stores 14 215 15 430 16 067 17 206Takeaway food outlets 2 241 2 242 2 392 2 811Liquor retailing 1 422 1 489 1 707 1 936Cafes and restaurants 3 596 3 161 2 963 3 495Other food retailing 2 374 3 076 3 508 3 153
VictoriaSupermarkets and grocery stores 11 505 12 161 13 171 13 899Takeaway food outlets 1 580 1 757 1 987 1 942Liquor retailing 840 845 934 1 138Cafes and restaurants 2 142 2 396 2 539 3 129Other food retailing 1 677 1 786 1 683 1 905
QueenslandSupermarkets and grocery stores 9 027 9 685 10 143 11 066Takeaway food outlets 1 452 1 534 1 658 1 955Liquor retailing 344 440 695 931Cafes and restaurants 1 597 1 616 1 944 2 569Other food retailing 1 211 1 271 1 246 1 328
Western AustraliaSupermarkets and grocery stores 4 795 5 100 5 626 5 809Takeaway food outlets 732 791 802 937Liquor retailing 606 661 740 822Cafes and restaurants 792 952 1177 1 223Other food retailing 508 640 633 626
South AustraliaSupermarkets and grocery stores 3 166 3 521 3 838 4 163Takeaway food outlets 483 534 534 506Liquor retailing 276 303 282 294Cafes and restaurants 479 565 583 661Other food retailing 702 758 816 721
TasmaniaSupermarkets and grocery stores 1 029 1 115 1 174 1 252Takeaway food outlets 158 154 136 155Liquor retailing 61 62 61 81Cafes and restaurants 93 88 116 160Other food retailing 166 135 114 158
Continued
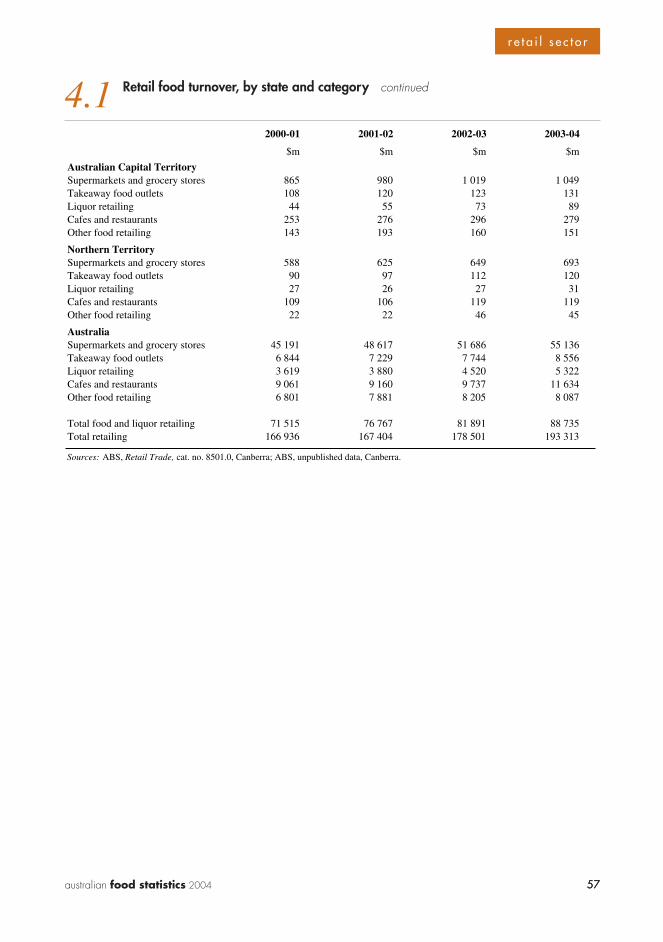
57australian food statistics 2004 57
r e t a i l s e c t o r
4.1 Retail food turnover, by state and category continued
2000-01 2001-02 2002-03 2003-04
$m $m $m $m
Australian Capital TerritorySupermarkets and grocery stores 865 980 1 019 1 049Takeaway food outlets 108 120 123 131Liquor retailing 44 55 73 89Cafes and restaurants 253 276 296 279Other food retailing 143 193 160 151
Northern TerritorySupermarkets and grocery stores 588 625 649 693Takeaway food outlets 90 97 112 120Liquor retailing 27 26 27 31Cafes and restaurants 109 106 119 119Other food retailing 22 22 46 45
AustraliaSupermarkets and grocery stores 45 191 48 617 51 686 55 136Takeaway food outlets 6 844 7 229 7 744 8 556Liquor retailing 3 619 3 880 4 520 5 322Cafes and restaurants 9 061 9 160 9 737 11 634Other food retailing 6 801 7 881 8 205 8 087
Total food and liquor retailing 71 515 76 767 81 891 88 735Total retailing 166 936 167 404 178 501 193 313
Sources: ABS, Retail Trade, cat. no. 8501.0, Canberra; ABS, unpublished data, Canberra.
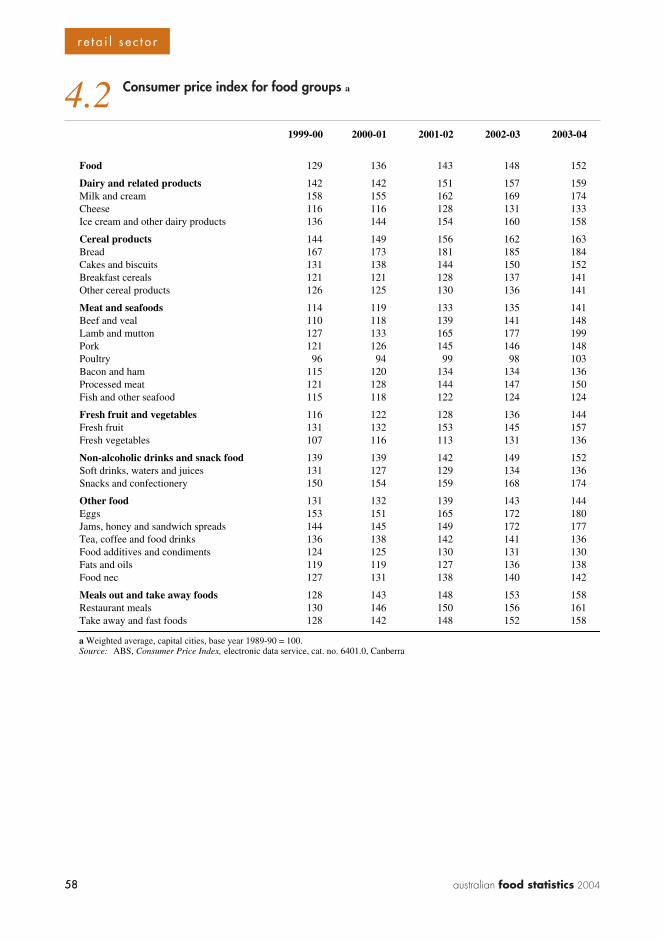
58 australian food statistics 200458
r e t a i l s e c t o r
4.2 Consumer price index for food groups a
1999-00 2000-01 2001-02 2002-03 2003-04
Food 129 136 143 148 152
Dairy and related products 142 142 151 157 159Milk and cream 158 155 162 169 174Cheese 116 116 128 131 133Ice cream and other dairy products 136 144 154 160 158
Cereal products 144 149 156 162 163Bread 167 173 181 185 184Cakes and biscuits 131 138 144 150 152Breakfast cereals 121 121 128 137 141Other cereal products 126 125 130 136 141
Meat and seafoods 114 119 133 135 141Beef and veal 110 118 139 141 148Lamb and mutton 127 133 165 177 199Pork 121 126 145 146 148Poultry 96 94 99 98 103Bacon and ham 115 120 134 134 136Processed meat 121 128 144 147 150Fish and other seafood 115 118 122 124 124
Fresh fruit and vegetables 116 122 128 136 144Fresh fruit 131 132 153 145 157Fresh vegetables 107 116 113 131 136
Non-alcoholic drinks and snack food 139 139 142 149 152Soft drinks, waters and juices 131 127 129 134 136Snacks and confectionery 150 154 159 168 174
Other food 131 132 139 143 144Eggs 153 151 165 172 180Jams, honey and sandwich spreads 144 145 149 172 177Tea, coffee and food drinks 136 138 142 141 136Food additives and condiments 124 125 130 131 130Fats and oils 119 119 127 136 138Food nec 127 131 138 140 142
Meals out and take away foods 128 143 148 153 158Restaurant meals 130 146 150 156 161Take away and fast foods 128 142 148 152 158
a Weighted average, capital cities, base year 1989-90 = 100. Source: ABS, Consumer Price Index, electronic data service, cat. no. 6401.0, Canberra
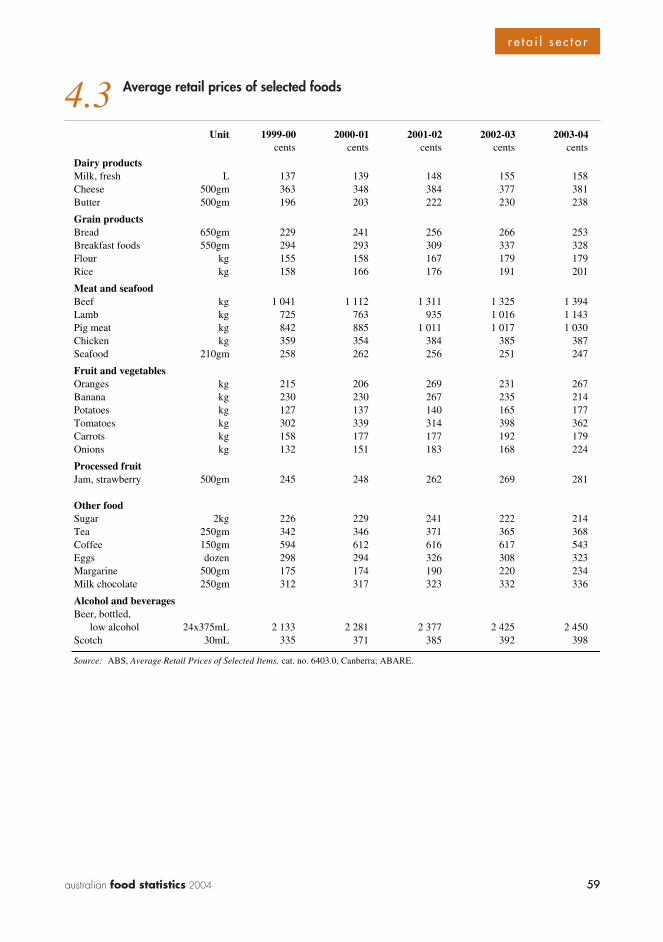
59australian food statistics 2004 59
r e t a i l s e c t o r
4.3 Average retail prices of selected foods
Unit 1999-00 2000-01 2001-02 2002-03 2003-04cents cents cents cents cents
Dairy productsMilk, fresh L 137 139 148 155 158Cheese 500gm 363 348 384 377 381Butter 500gm 196 203 222 230 238
Grain productsBread 650gm 229 241 256 266 253Breakfast foods 550gm 294 293 309 337 328Flour kg 155 158 167 179 179Rice kg 158 166 176 191 201
Meat and seafoodBeef kg 1 041 1 112 1 311 1 325 1 394Lamb kg 725 763 935 1 016 1 143Pig meat kg 842 885 1 011 1 017 1 030Chicken kg 359 354 384 385 387Seafood 210gm 258 262 256 251 247
Fruit and vegetablesOranges kg 215 206 269 231 267Banana kg 230 230 267 235 214Potatoes kg 127 137 140 165 177Tomatoes kg 302 339 314 398 362Carrots kg 158 177 177 192 179Onions kg 132 151 183 168 224
Processed fruitJam, strawberry 500gm 245 248 262 269 281
Other foodSugar 2kg 226 229 241 222 214Tea 250gm 342 346 371 365 368Coffee 150gm 594 612 616 617 543Eggs dozen 298 294 326 308 323Margarine 500gm 175 174 190 220 234Milk chocolate 250gm 312 317 323 332 336
Alcohol and beveragesBeer, bottled,
low alcohol 24x375mL 2 133 2 281 2 377 2 425 2 450Scotch 30mL 335 371 385 392 398
Source: ABS, Average Retail Prices of Selected Items, cat. no. 6403.0, Canberra; ABARE.
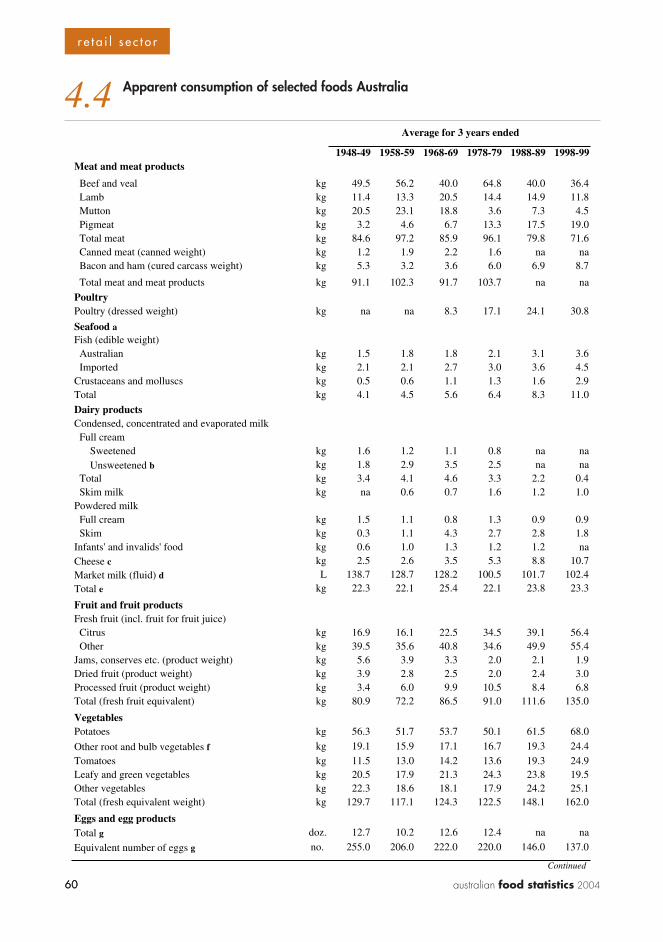
60 australian food statistics 200460
r e t a i l s e c t o r
4.4 Apparent consumption of selected foods Australia
1948-49 1958-59 1968-69 1978-79 1988-89 1998-99Meat and meat products
Beef and veal kg 49.5 56.2 40.0 64.8 40.0 36.4 Lamb kg 11.4 13.3 20.5 14.4 14.9 11.8 Mutton kg 20.5 23.1 18.8 3.6 7.3 4.5 Pigmeat kg 3.2 4.6 6.7 13.3 17.5 19.0 Total meat kg 84.6 97.2 85.9 96.1 79.8 71.6 Canned meat (canned weight) kg 1.2 1.9 2.2 1.6 na na Bacon and ham (cured carcass weight) kg 5.3 3.2 3.6 6.0 6.9 8.7
Total meat and meat products kg 91.1 102.3 91.7 103.7 na na
PoultryPoultry (dressed weight) kg na na 8.3 17.1 24.1 30.8
Seafood aFish (edible weight) Australian kg 1.5 1.8 1.8 2.1 3.1 3.6 Imported kg 2.1 2.1 2.7 3.0 3.6 4.5Crustaceans and molluscs kg 0.5 0.6 1.1 1.3 1.6 2.9Total kg 4.1 4.5 5.6 6.4 8.3 11.0
Dairy productsCondensed, concentrated and evaporated milk Full cream Sweetened kg 1.6 1.2 1.1 0.8 na na Unsweetened b kg 1.8 2.9 3.5 2.5 na na Total kg 3.4 4.1 4.6 3.3 2.2 0.4 Skim milk kg na 0.6 0.7 1.6 1.2 1.0Powdered milk Full cream kg 1.5 1.1 0.8 1.3 0.9 0.9 Skim kg 0.3 1.1 4.3 2.7 2.8 1.8Infants' and invalids' food kg 0.6 1.0 1.3 1.2 1.2 naCheese c kg 2.5 2.6 3.5 5.3 8.8 10.7Market milk (fluid) d L 138.7 128.7 128.2 100.5 101.7 102.4Total e kg 22.3 22.1 25.4 22.1 23.8 23.3
Fruit and fruit productsFresh fruit (incl. fruit for fruit juice) Citrus kg 16.9 16.1 22.5 34.5 39.1 56.4 Other kg 39.5 35.6 40.8 34.6 49.9 55.4Jams, conserves etc. (product weight) kg 5.6 3.9 3.3 2.0 2.1 1.9Dried fruit (product weight) kg 3.9 2.8 2.5 2.0 2.4 3.0Processed fruit (product weight) kg 3.4 6.0 9.9 10.5 8.4 6.8Total (fresh fruit equivalent) kg 80.9 72.2 86.5 91.0 111.6 135.0
VegetablesPotatoes kg 56.3 51.7 53.7 50.1 61.5 68.0
Other root and bulb vegetables f kg 19.1 15.9 17.1 16.7 19.3 24.4Tomatoes kg 11.5 13.0 14.2 13.6 19.3 24.9Leafy and green vegetables kg 20.5 17.9 21.3 24.3 23.8 19.5Other vegetables kg 22.3 18.6 18.1 17.9 24.2 25.1Total (fresh equivalent weight) kg 129.7 117.1 124.3 122.5 148.1 162.0
Eggs and egg productsTotal g doz. 12.7 10.2 12.6 12.4 na na
Equivalent number of eggs g no. 255.0 206.0 222.0 220.0 146.0 137.0
Continued
Average for 3 years ended
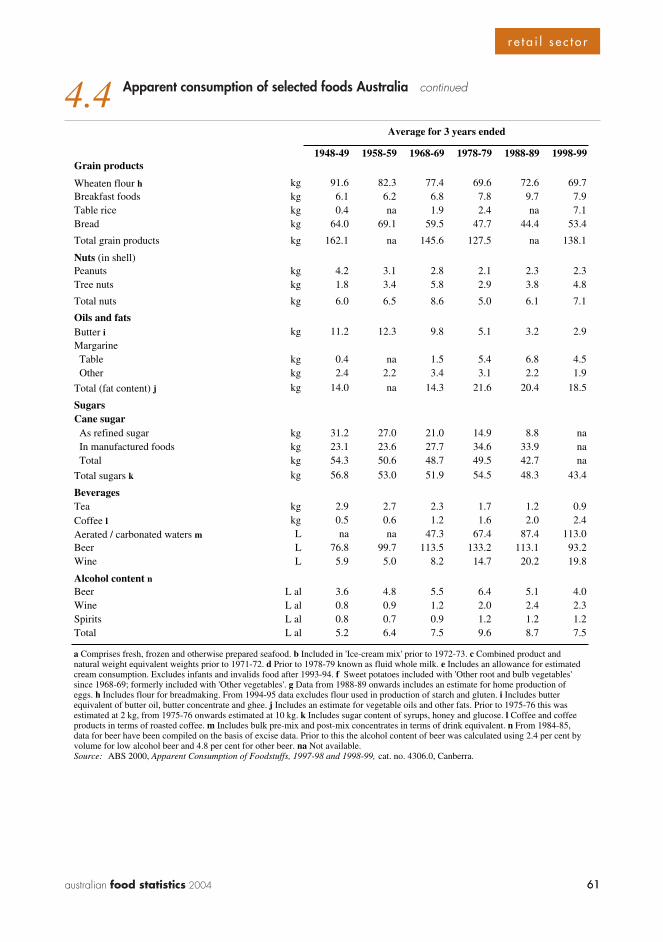
61australian food statistics 2004 61
r e t a i l s e c t o r
4.4 Apparent consumption of selected foods Australia continued
1948-49 1958-59 1968-69 1978-79 1988-89 1998-99Grain products
Wheaten flour h kg 91.6 82.3 77.4 69.6 72.6 69.7Breakfast foods kg 6.1 6.2 6.8 7.8 9.7 7.9Table rice kg 0.4 na 1.9 2.4 na 7.1Bread kg 64.0 69.1 59.5 47.7 44.4 53.4
Total grain products kg 162.1 na 145.6 127.5 na 138.1
Nuts (in shell)Peanuts kg 4.2 3.1 2.8 2.1 2.3 2.3Tree nuts kg 1.8 3.4 5.8 2.9 3.8 4.8
Total nuts kg 6.0 6.5 8.6 5.0 6.1 7.1
Oils and fatsButter i kg 11.2 12.3 9.8 5.1 3.2 2.9Margarine Table kg 0.4 na 1.5 5.4 6.8 4.5 Other kg 2.4 2.2 3.4 3.1 2.2 1.9
Total (fat content) j kg 14.0 na 14.3 21.6 20.4 18.5
SugarsCane sugar As refined sugar kg 31.2 27.0 21.0 14.9 8.8 na In manufactured foods kg 23.1 23.6 27.7 34.6 33.9 na Total kg 54.3 50.6 48.7 49.5 42.7 na
Total sugars k kg 56.8 53.0 51.9 54.5 48.3 43.4
BeveragesTea kg 2.9 2.7 2.3 1.7 1.2 0.9Coffee l kg 0.5 0.6 1.2 1.6 2.0 2.4Aerated / carbonated waters m L na na 47.3 67.4 87.4 113.0Beer L 76.8 99.7 113.5 133.2 113.1 93.2Wine L 5.9 5.0 8.2 14.7 20.2 19.8
Alcohol content nBeer L al 3.6 4.8 5.5 6.4 5.1 4.0Wine L al 0.8 0.9 1.2 2.0 2.4 2.3Spirits L al 0.8 0.7 0.9 1.2 1.2 1.2Total L al 5.2 6.4 7.5 9.6 8.7 7.5
Average for 3 years ended
a Comprises fresh, frozen and otherwise prepared seafood. b Included in 'Ice-cream mix' prior to 1972-73. c Combined product and natural weight equivalent weights prior to 1971-72. d Prior to 1978-79 known as fluid whole milk. e Includes an allowance for estimated cream consumption. Excludes infants and invalids food after 1993-94. f Sweet potatoes included with 'Other root and bulb vegetables' since 1968-69; formerly included with 'Other vegetables'. g Data from 1988-89 onwards includes an estimate for home production of eggs. h Includes flour for breadmaking. From 1994-95 data excludes flour used in production of starch and gluten. i Includes butter equivalent of butter oil, butter concentrate and ghee. j Includes an estimate for vegetable oils and other fats. Prior to 1975-76 this was estimated at 2 kg, from 1975-76 onwards estimated at 10 kg. k Includes sugar content of syrups, honey and glucose. l Coffee and coffee products in terms of roasted coffee. m Includes bulk pre-mix and post-mix concentrates in terms of drink equivalent. n From 1984-85, data for beer have been compiled on the basis of excise data. Prior to this the alcohol content of beer was calculated using 2.4 per cent by volume for low alcohol beer and 4.8 per cent for other beer. na Not available.Source: ABS 2000, Apparent Consumption of Foodstuffs, 1997-98 and 1998-99, cat. no. 4306.0, Canberra.
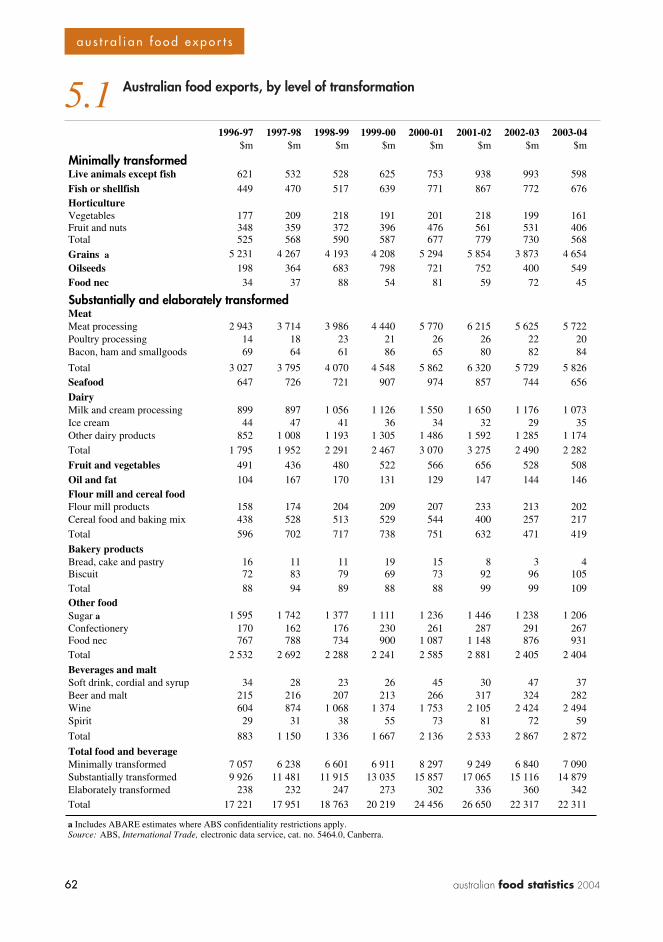
62 australian food statistics 2004
? ? ?
62
a u s t r a l i a n f o o d e x p o r t s
5.1 Australian food exports, by level of transformation
1996-97 1997-98 1998-99 1999-00 2000-01 2001-02 2002-03 2003-04$m $m $m $m $m $m $m $m
Minimally transformedLive animals except fish 621 532 528 625 753 938 993 598Fish or shellfish 449 470 517 639 771 867 772 676HorticultureVegetables 177 209 218 191 201 218 199 161Fruit and nuts 348 359 372 396 476 561 531 406Total 525 568 590 587 677 779 730 568
Grains a 5 231 4 267 4 193 4 208 5 294 5 854 3 873 4 654Oilseeds 198 364 683 798 721 752 400 549Food nec 34 37 88 54 81 59 72 45
Substantially and elaborately transformedMeatMeat processing 2 943 3 714 3 986 4 440 5 770 6 215 5 625 5 722Poultry processing 14 18 23 21 26 26 22 20Bacon, ham and smallgoods 69 64 61 86 65 80 82 84
Total 3 027 3 795 4 070 4 548 5 862 6 320 5 729 5 826Seafood 647 726 721 907 974 857 744 656
DairyMilk and cream processing 899 897 1 056 1 126 1 550 1 650 1 176 1 073Ice cream 44 47 41 36 34 32 29 35Other dairy products 852 1 008 1 193 1 305 1 486 1 592 1 285 1 174Total 1 795 1 952 2 291 2 467 3 070 3 275 2 490 2 282
Fruit and vegetables 491 436 480 522 566 656 528 508Oil and fat 104 167 170 131 129 147 144 146Flour mill and cereal foodFlour mill products 158 174 204 209 207 233 213 202Cereal food and baking mix 438 528 513 529 544 400 257 217Total 596 702 717 738 751 632 471 419
Bakery productsBread, cake and pastry 16 11 11 19 15 8 3 4Biscuit 72 83 79 69 73 92 96 105Total 88 94 89 88 88 99 99 109Other foodSugar a 1 595 1 742 1 377 1 111 1 236 1 446 1 238 1 206Confectionery 170 162 176 230 261 287 291 267Food nec 767 788 734 900 1 087 1 148 876 931Total 2 532 2 692 2 288 2 241 2 585 2 881 2 405 2 404
Beverages and maltSoft drink, cordial and syrup 34 28 23 26 45 30 47 37Beer and malt 215 216 207 213 266 317 324 282Wine 604 874 1 068 1 374 1 753 2 105 2 424 2 494Spirit 29 31 38 55 73 81 72 59
Total 883 1 150 1 336 1 667 2 136 2 533 2 867 2 872
Total food and beverageMinimally transformed 7 057 6 238 6 601 6 911 8 297 9 249 6 840 7 090Substantially transformed 9 926 11 481 11 915 13 035 15 857 17 065 15 116 14 879Elaborately transformed 238 232 247 273 302 336 360 342Total 17 221 17 951 18 763 20 219 24 456 26 650 22 317 22 311
a Includes ABARE estimates where ABS confidentiality restrictions apply.Source: ABS, International Trade, electronic data service, cat. no. 5464.0, Canberra.
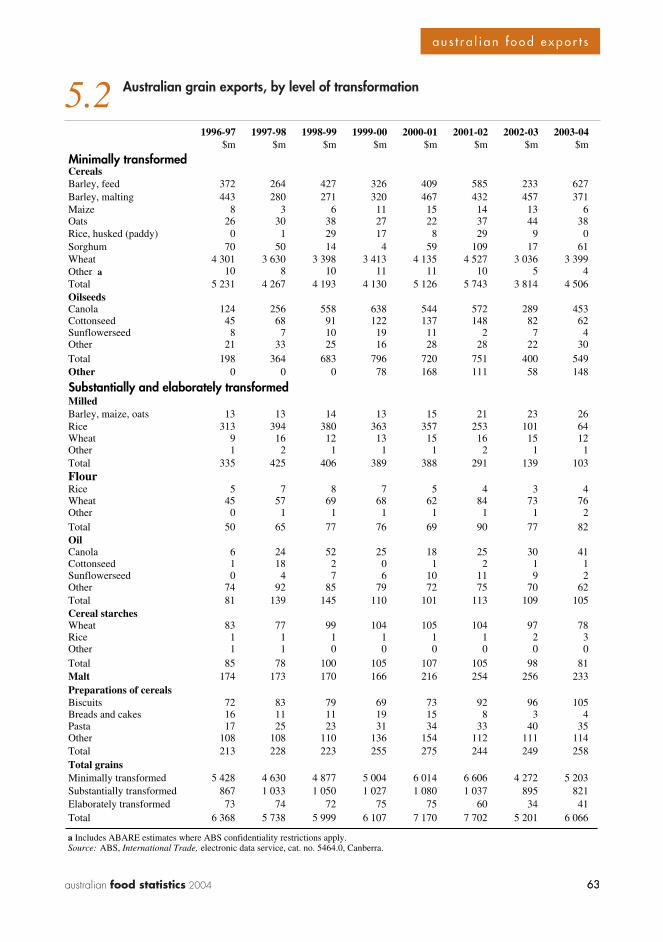
63australian food statistics 2004 63
a u s t r a l i a n f o o d e x p o r t s
5.2 Australian grain exports, by level of transformation
1996-97 1997-98 1998-99 1999-00 2000-01 2001-02 2002-03 2003-04$m $m $m $m $m $m $m $m
Minimally transformedCerealsBarley, feed 372 264 427 326 409 585 233 627Barley, malting 443 280 271 320 467 432 457 371Maize 8 3 6 11 15 14 13 6Oats 26 30 38 27 22 37 44 38Rice, husked (paddy) 0 1 29 17 8 29 9 0Sorghum 70 50 14 4 59 109 17 61Wheat 4 301 3 630 3 398 3 413 4 135 4 527 3 036 3 399Other a 10 8 10 11 11 10 5 4Total 5 231 4 267 4 193 4 130 5 126 5 743 3 814 4 506OilseedsCanola 124 256 558 638 544 572 289 453Cottonseed 45 68 91 122 137 148 82 62Sunflowerseed 8 7 10 19 11 2 7 4Other 21 33 25 16 28 28 22 30Total 198 364 683 796 720 751 400 549Other 0 0 0 78 168 111 58 148
Substantially and elaborately transformedMilledBarley, maize, oats 13 13 14 13 15 21 23 26Rice 313 394 380 363 357 253 101 64Wheat 9 16 12 13 15 16 15 12Other 1 2 1 1 1 2 1 1Total 335 425 406 389 388 291 139 103FlourRice 5 7 8 7 5 4 3 4Wheat 45 57 69 68 62 84 73 76Other 0 1 1 1 1 1 1 2Total 50 65 77 76 69 90 77 82OilCanola 6 24 52 25 18 25 30 41Cottonseed 1 18 2 0 1 2 1 1Sunflowerseed 0 4 7 6 10 11 9 2Other 74 92 85 79 72 75 70 62Total 81 139 145 110 101 113 109 105Cereal starchesWheat 83 77 99 104 105 104 97 78Rice 1 1 1 1 1 1 2 3Other 1 1 0 0 0 0 0 0Total 85 78 100 105 107 105 98 81Malt 174 173 170 166 216 254 256 233Preparations of cerealsBiscuits 72 83 79 69 73 92 96 105Breads and cakes 16 11 11 19 15 8 3 4Pasta 17 25 23 31 34 33 40 35Other 108 108 110 136 154 112 111 114Total 213 228 223 255 275 244 249 258Total grains Minimally transformed 5 428 4 630 4 877 5 004 6 014 6 606 4 272 5 203Substantially transformed 867 1 033 1 050 1 027 1 080 1 037 895 821Elaborately transformed 73 74 72 75 75 60 34 41Total 6 368 5 738 5 999 6 107 7 170 7 702 5 201 6 066
a Includes ABARE estimates where ABS confidentiality restrictions apply.Source: ABS, International Trade, electronic data service, cat. no. 5464.0, Canberra.
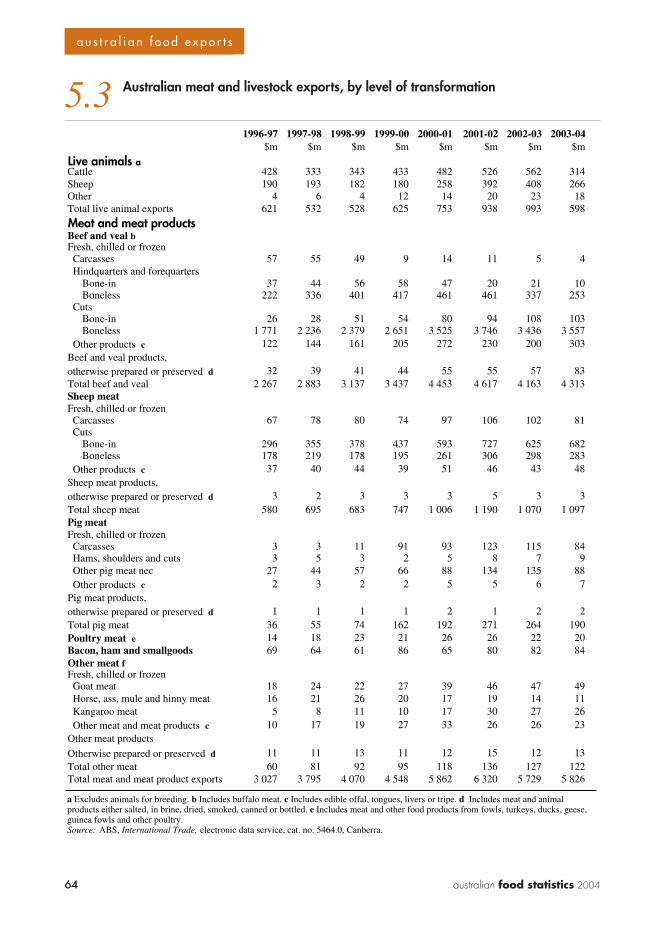
64 australian food statistics 2004
? ? ?
64
a u s t r a l i a n f o o d e x p o r t s
5.3 Australian meat and livestock exports, by level of transformation
1996-97 1997-98 1998-99 1999-00 2000-01 2001-02 2002-03 2003-04$m $m $m $m $m $m $m $m
Live animals aCattle 428 333 343 433 482 526 562 314Sheep 190 193 182 180 258 392 408 266Other 4 6 4 12 14 20 23 18Total live animal exports 621 532 528 625 753 938 993 598
Meat and meat productsBeef and veal bFresh, chilled or frozen Carcasses 57 55 49 9 14 11 5 4 Hindquarters and forequarters
Bone-in 37 44 56 58 47 20 21 10Boneless 222 336 401 417 461 461 337 253
CutsBone-in 26 28 51 54 80 94 108 103Boneless 1 771 2 236 2 379 2 651 3 525 3 746 3 436 3 557
Other products c 122 144 161 205 272 230 200 303Beef and veal products, otherwise prepared or preserved d 32 39 41 44 55 55 57 83Total beef and veal 2 267 2 883 3 137 3 437 4 453 4 617 4 163 4 313Sheep meatFresh, chilled or frozen Carcasses 67 78 80 74 97 106 102 81 Cuts
Bone-in 296 355 378 437 593 727 625 682Boneless 178 219 178 195 261 306 298 283
Other products c 37 40 44 39 51 46 43 48Sheep meat products, otherwise prepared or preserved d 3 2 3 3 3 5 3 3Total sheep meat 580 695 683 747 1 006 1 190 1 070 1 097Pig meatFresh, chilled or frozen Carcasses 3 3 11 91 93 123 115 84 Hams, shoulders and cuts 3 5 3 2 5 8 7 9 Other pig meat nec 27 44 57 66 88 134 135 88 Other products c 2 3 2 2 5 5 6 7Pig meat products, otherwise prepared or preserved d 1 1 1 1 2 1 2 2Total pig meat 36 55 74 162 192 271 264 190Poultry meat e 14 18 23 21 26 26 22 20Bacon, ham and smallgoods 69 64 61 86 65 80 82 84Other meat fFresh, chilled or frozen Goat meat 18 24 22 27 39 46 47 49 Horse, ass, mule and hinny meat 16 21 26 20 17 19 14 11 Kangaroo meat 5 8 11 10 17 30 27 26 Other meat and meat products c 10 17 19 27 33 26 26 23Other meat products
Otherwise prepared or preserved d 11 11 13 11 12 15 12 13Total other meat 60 81 92 95 118 136 127 122Total meat and meat product exports 3 027 3 795 4 070 4 548 5 862 6 320 5 729 5 826
a Excludes animals for breeding. b Includes buffalo meat. c Includes edible offal, tongues, livers or tripe. d Includes meat and animal products either salted, in brine, dried, smoked, canned or bottled. e Includes meat and other food products from fowls, turkeys, ducks, geese,guinea fowls and other poultry.Source: ABS, International Trade, electronic data service, cat. no. 5464.0, Canberra.
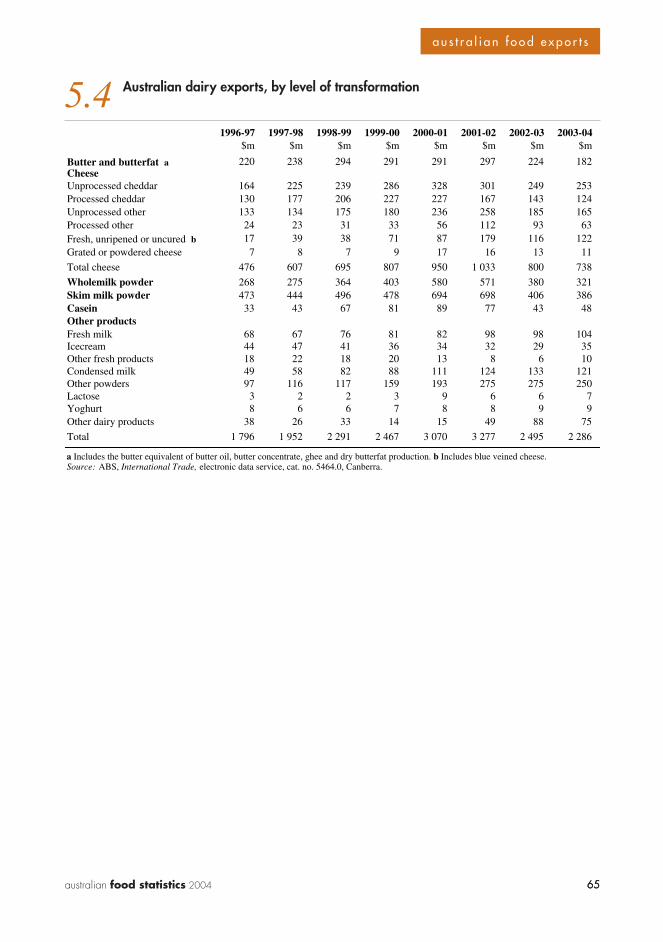
65australian food statistics 2004 65
a u s t r a l i a n f o o d e x p o r t s
5.4 Australian dairy exports, by level of transformation
1996-97 1997-98 1998-99 1999-00 2000-01 2001-02 2002-03 2003-04$m $m $m $m $m $m $m $m
Butter and butterfat a 220 238 294 291 291 297 224 182CheeseUnprocessed cheddar 164 225 239 286 328 301 249 253Processed cheddar 130 177 206 227 227 167 143 124Unprocessed other 133 134 175 180 236 258 185 165Processed other 24 23 31 33 56 112 93 63Fresh, unripened or uncured b 17 39 38 71 87 179 116 122Grated or powdered cheese 7 8 7 9 17 16 13 11
Total cheese 476 607 695 807 950 1 033 800 738
Wholemilk powder 268 275 364 403 580 571 380 321Skim milk powder 473 444 496 478 694 698 406 386Casein 33 43 67 81 89 77 43 48Other productsFresh milk 68 67 76 81 82 98 98 104Icecream 44 47 41 36 34 32 29 35Other fresh products 18 22 18 20 13 8 6 10Condensed milk 49 58 82 88 111 124 133 121Other powders 97 116 117 159 193 275 275 250Lactose 3 2 2 3 9 6 6 7Yoghurt 8 6 6 7 8 8 9 9Other dairy products 38 26 33 14 15 49 88 75
Total 1 796 1 952 2 291 2 467 3 070 3 277 2 495 2 286
a Includes the butter equivalent of butter oil, butter concentrate, ghee and dry butterfat production. b Includes blue veined cheese.Source: ABS, International Trade, electronic data service, cat. no. 5464.0, Canberra.
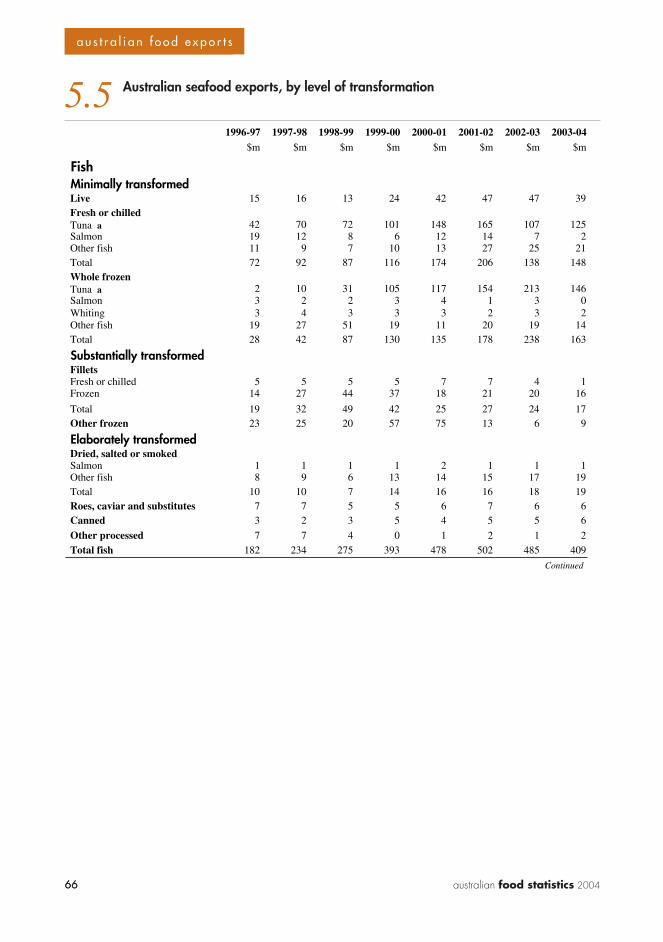
66 australian food statistics 2004
? ? ?
66
a u s t r a l i a n f o o d e x p o r t s
5.5 Australian seafood exports, by level of transformation
1996-97 1997-98 1998-99 1999-00 2000-01 2001-02 2002-03 2003-04$m $m $m $m $m $m $m $m
FishMinimally transformedLive 15 16 13 24 42 47 47 39Fresh or chilledTuna a 42 70 72 101 148 165 107 125Salmon 19 12 8 6 12 14 7 2Other fish 11 9 7 10 13 27 25 21Total 72 92 87 116 174 206 138 148Whole frozenTuna a 2 10 31 105 117 154 213 146Salmon 3 2 2 3 4 1 3 0Whiting 3 4 3 3 3 2 3 2Other fish 19 27 51 19 11 20 19 14Total 28 42 87 130 135 178 238 163
Substantially transformedFilletsFresh or chilled 5 5 5 5 7 7 4 1Frozen 14 27 44 37 18 21 20 16
Total 19 32 49 42 25 27 24 17Other frozen 23 25 20 57 75 13 6 9
Elaborately transformedDried, salted or smokedSalmon 1 1 1 1 2 1 1 1Other fish 8 9 6 13 14 15 17 19Total 10 10 7 14 16 16 18 19Roes, caviar and substitutes 7 7 5 5 6 7 6 6Canned 3 2 3 5 4 5 5 6
Other processed 7 7 4 0 1 2 1 2Total fish 182 234 275 393 478 502 485 409
Continued
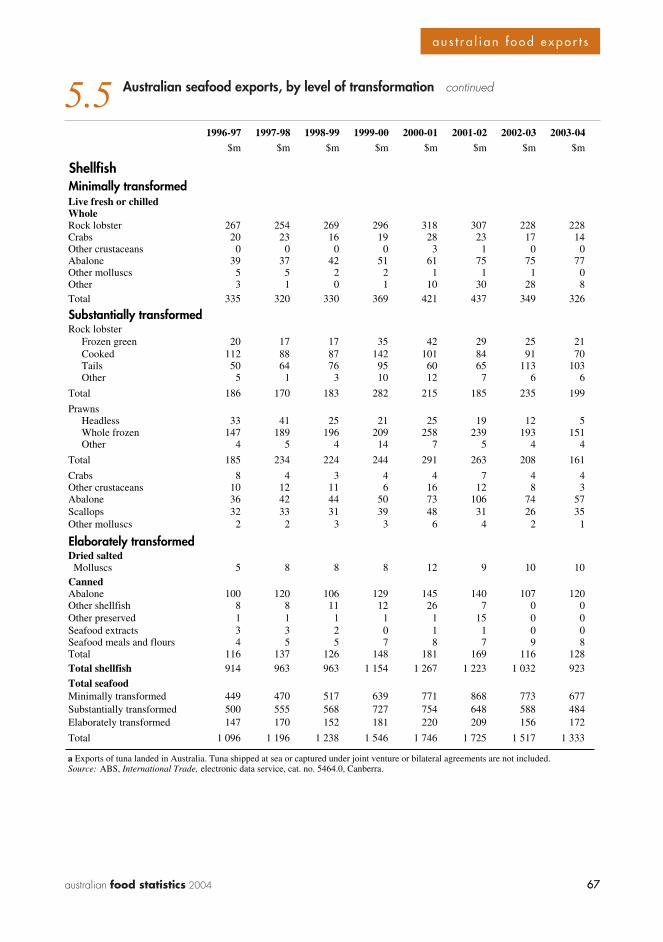
67australian food statistics 2004 67
a u s t r a l i a n f o o d e x p o r t s
5.5 Australian seafood exports, by level of transformation continued
1996-97 1997-98 1998-99 1999-00 2000-01 2001-02 2002-03 2003-04$m $m $m $m $m $m $m $m
ShellfishMinimally transformedLive fresh or chilledWholeRock lobster 267 254 269 296 318 307 228 228Crabs 20 23 16 19 28 23 17 14Other crustaceans 0 0 0 0 3 1 0 0Abalone 39 37 42 51 61 75 75 77Other molluscs 5 5 2 2 1 1 1 0Other 3 1 0 1 10 30 28 8Total 335 320 330 369 421 437 349 326
Substantially transformedRock lobster
Frozen green 20 17 17 35 42 29 25 21Cooked 112 88 87 142 101 84 91 70Tails 50 64 76 95 60 65 113 103Other 5 1 3 10 12 7 6 6
Total 186 170 183 282 215 185 235 199
PrawnsHeadless 33 41 25 21 25 19 12 5Whole frozen 147 189 196 209 258 239 193 151Other 4 5 4 14 7 5 4 4
Total 185 234 224 244 291 263 208 161
Crabs 8 4 3 4 4 7 4 4Other crustaceans 10 12 11 6 16 12 8 3Abalone 36 42 44 50 73 106 74 57Scallops 32 33 31 39 48 31 26 35Other molluscs 2 2 3 3 6 4 2 1
Elaborately transformedDried salted Molluscs 5 8 8 8 12 9 10 10CannedAbalone 100 120 106 129 145 140 107 120Other shellfish 8 8 11 12 26 7 0 0Other preserved 1 1 1 1 1 15 0 0Seafood extracts 3 3 2 0 1 1 0 0Seafood meals and flours 4 5 5 7 8 7 9 8Total 116 137 126 148 181 169 116 128Total shellfish 914 963 963 1 154 1 267 1 223 1 032 923
Total seafoodMinimally transformed 449 470 517 639 771 868 773 677Substantially transformed 500 555 568 727 754 648 588 484Elaborately transformed 147 170 152 181 220 209 156 172
Total 1 096 1 196 1 238 1 546 1 746 1 725 1 517 1 333
a Exports of tuna landed in Australia. Tuna shipped at sea or captured under joint venture or bilateral agreements are not included.Source: ABS, International Trade, electronic data service, cat. no. 5464.0, Canberra.
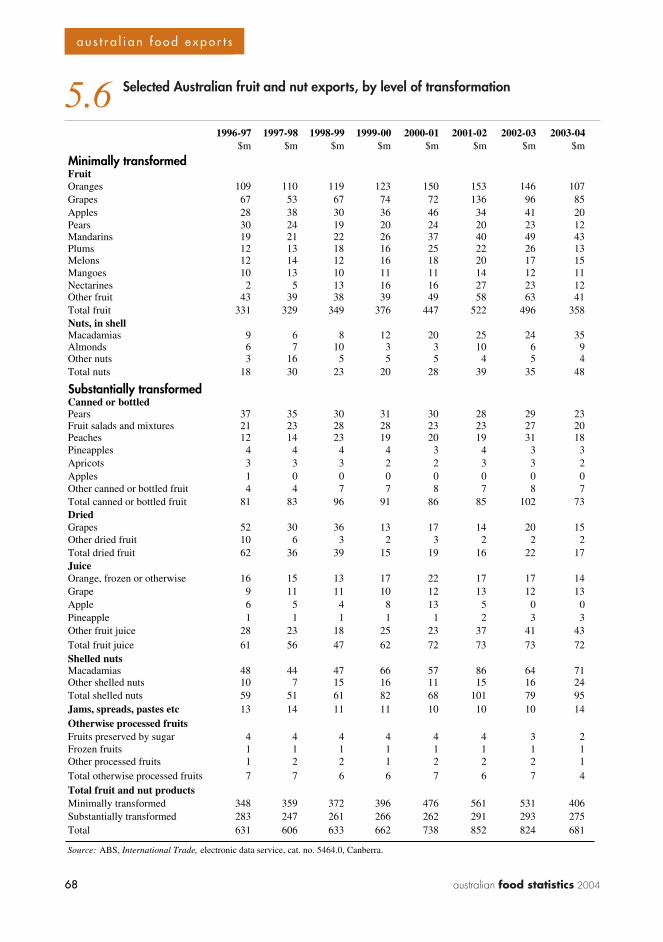
68 australian food statistics 2004
? ? ?
68
a u s t r a l i a n f o o d e x p o r t s
5.6 Selected Australian fruit and nut exports, by level of transformation
1996-97 1997-98 1998-99 1999-00 2000-01 2001-02 2002-03 2003-04$m $m $m $m $m $m $m $m
Minimally transformedFruitOranges 109 110 119 123 150 153 146 107Grapes 67 53 67 74 72 136 96 85Apples 28 38 30 36 46 34 41 20Pears 30 24 19 20 24 20 23 12Mandarins 19 21 22 26 37 40 49 43Plums 12 13 18 16 25 22 26 13Melons 12 14 12 16 18 20 17 15Mangoes 10 13 10 11 11 14 12 11Nectarines 2 5 13 16 16 27 23 12Other fruit 43 39 38 39 49 58 63 41Total fruit 331 329 349 376 447 522 496 358Nuts, in shellMacadamias 9 6 8 12 20 25 24 35Almonds 6 7 10 3 3 10 6 9Other nuts 3 16 5 5 5 4 5 4Total nuts 18 30 23 20 28 39 35 48
Substantially transformedCanned or bottledPears 37 35 30 31 30 28 29 23Fruit salads and mixtures 21 23 28 28 23 23 27 20Peaches 12 14 23 19 20 19 31 18Pineapples 4 4 4 4 3 4 3 3Apricots 3 3 3 2 2 3 3 2Apples 1 0 0 0 0 0 0 0Other canned or bottled fruit 4 4 7 7 8 7 8 7Total canned or bottled fruit 81 83 96 91 86 85 102 73DriedGrapes 52 30 36 13 17 14 20 15Other dried fruit 10 6 3 2 3 2 2 2Total dried fruit 62 36 39 15 19 16 22 17JuiceOrange, frozen or otherwise 16 15 13 17 22 17 17 14Grape 9 11 11 10 12 13 12 13Apple 6 5 4 8 13 5 0 0Pineapple 1 1 1 1 1 2 3 3Other fruit juice 28 23 18 25 23 37 41 43Total fruit juice 61 56 47 62 72 73 73 72Shelled nutsMacadamias 48 44 47 66 57 86 64 71Other shelled nuts 10 7 15 16 11 15 16 24Total shelled nuts 59 51 61 82 68 101 79 95Jams, spreads, pastes etc 13 14 11 11 10 10 10 14Otherwise processed fruitsFruits preserved by sugar 4 4 4 4 4 4 3 2Frozen fruits 1 1 1 1 1 1 1 1Other processed fruits 1 2 2 1 2 2 2 1Total otherwise processed fruits 7 7 6 6 7 6 7 4Total fruit and nut productsMinimally transformed 348 359 372 396 476 561 531 406Substantially transformed 283 247 261 266 262 291 293 275Total 631 606 633 662 738 852 824 681
Source: ABS, International Trade, electronic data service, cat. no. 5464.0, Canberra.
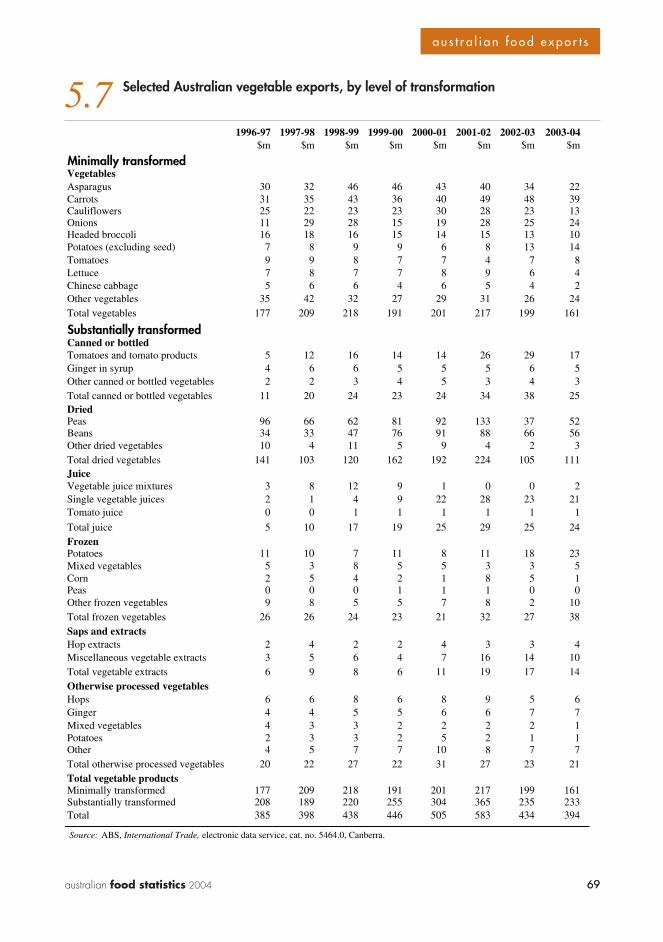
69australian food statistics 2004 69
a u s t r a l i a n f o o d e x p o r t s
5.7 Selected Australian vegetable exports, by level of transformation
1996-97 1997-98 1998-99 1999-00 2000-01 2001-02 2002-03 2003-04$m $m $m $m $m $m $m $m
Minimally transformedVegetablesAsparagus 30 32 46 46 43 40 34 22Carrots 31 35 43 36 40 49 48 39Cauliflowers 25 22 23 23 30 28 23 13Onions 11 29 28 15 19 28 25 24Headed broccoli 16 18 16 15 14 15 13 10Potatoes (excluding seed) 7 8 9 9 6 8 13 14Tomatoes 9 9 8 7 7 4 7 8Lettuce 7 8 7 7 8 9 6 4Chinese cabbage 5 6 6 4 6 5 4 2Other vegetables 35 42 32 27 29 31 26 24Total vegetables 177 209 218 191 201 217 199 161
Substantially transformedCanned or bottledTomatoes and tomato products 5 12 16 14 14 26 29 17Ginger in syrup 4 6 6 5 5 5 6 5Other canned or bottled vegetables 2 2 3 4 5 3 4 3Total canned or bottled vegetables 11 20 24 23 24 34 38 25DriedPeas 96 66 62 81 92 133 37 52Beans 34 33 47 76 91 88 66 56Other dried vegetables 10 4 11 5 9 4 2 3Total dried vegetables 141 103 120 162 192 224 105 111JuiceVegetable juice mixtures 3 8 12 9 1 0 0 2Single vegetable juices 2 1 4 9 22 28 23 21Tomato juice 0 0 1 1 1 1 1 1
Total juice 5 10 17 19 25 29 25 24FrozenPotatoes 11 10 7 11 8 11 18 23Mixed vegetables 5 3 8 5 5 3 3 5Corn 2 5 4 2 1 8 5 1Peas 0 0 0 1 1 1 0 0Other frozen vegetables 9 8 5 5 7 8 2 10Total frozen vegetables 26 26 24 23 21 32 27 38Saps and extractsHop extracts 2 4 2 2 4 3 3 4Miscellaneous vegetable extracts 3 5 6 4 7 16 14 10Total vegetable extracts 6 9 8 6 11 19 17 14Otherwise processed vegetablesHops 6 6 8 6 8 9 5 6Ginger 4 4 5 5 6 6 7 7Mixed vegetables 4 3 3 2 2 2 2 1Potatoes 2 3 3 2 5 2 1 1Other 4 5 7 7 10 8 7 7Total otherwise processed vegetables 20 22 27 22 31 27 23 21Total vegetable productsMinimally transformed 177 209 218 191 201 217 199 161Substantially transformed 208 189 220 255 304 365 235 233Total 385 398 438 446 505 583 434 394
Source: ABS, International Trade, electronic data service, cat. no. 5464.0, Canberra.
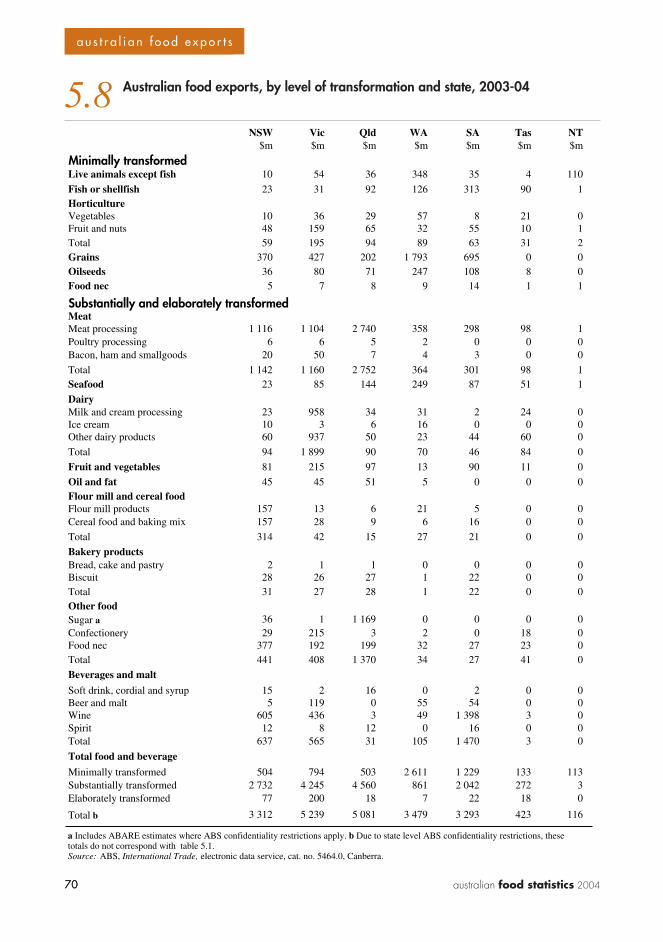
70 australian food statistics 2004
? ? ?
70
a u s t r a l i a n f o o d e x p o r t s
5.8 Australian food exports, by level of transformation and state, 2003-04
NSW Vic Qld WA SA Tas NT$m $m $m $m $m $m $m
Minimally transformedLive animals except fish 10 54 36 348 35 4 110
Fish or shellfish 23 31 92 126 313 90 1HorticultureVegetables 10 36 29 57 8 21 0Fruit and nuts 48 159 65 32 55 10 1Total 59 195 94 89 63 31 2Grains 370 427 202 1 793 695 0 0Oilseeds 36 80 71 247 108 8 0Food nec 5 7 8 9 14 1 1
Substantially and elaborately transformedMeatMeat processing 1 116 1 104 2 740 358 298 98 1Poultry processing 6 6 5 2 0 0 0Bacon, ham and smallgoods 20 50 7 4 3 0 0
Total 1 142 1 160 2 752 364 301 98 1Seafood 23 85 144 249 87 51 1
DairyMilk and cream processing 23 958 34 31 2 24 0Ice cream 10 3 6 16 0 0 0Other dairy products 60 937 50 23 44 60 0
Total 94 1 899 90 70 46 84 0
Fruit and vegetables 81 215 97 13 90 11 0
Oil and fat 45 45 51 5 0 0 0Flour mill and cereal foodFlour mill products 157 13 6 21 5 0 0Cereal food and baking mix 157 28 9 6 16 0 0
Total 314 42 15 27 21 0 0
Bakery productsBread, cake and pastry 2 1 1 0 0 0 0Biscuit 28 26 27 1 22 0 0Total 31 27 28 1 22 0 0Other foodSugar a 36 1 1 169 0 0 0 0Confectionery 29 215 3 2 0 18 0Food nec 377 192 199 32 27 23 0Total 441 408 1 370 34 27 41 0
Beverages and malt
Soft drink, cordial and syrup 15 2 16 0 2 0 0Beer and malt 5 119 0 55 54 0 0Wine 605 436 3 49 1 398 3 0Spirit 12 8 12 0 16 0 0Total 637 565 31 105 1 470 3 0
Total food and beverage
Minimally transformed 504 794 503 2 611 1 229 133 113Substantially transformed 2 732 4 245 4 560 861 2 042 272 3Elaborately transformed 77 200 18 7 22 18 0
Total b 3 312 5 239 5 081 3 479 3 293 423 116
a Includes ABARE estimates where ABS confidentiality restrictions apply. b Due to state level ABS confidentiality restrictions, these totals do not correspond with table 5.1.Source: ABS, International Trade, electronic data service, cat. no. 5464.0, Canberra.
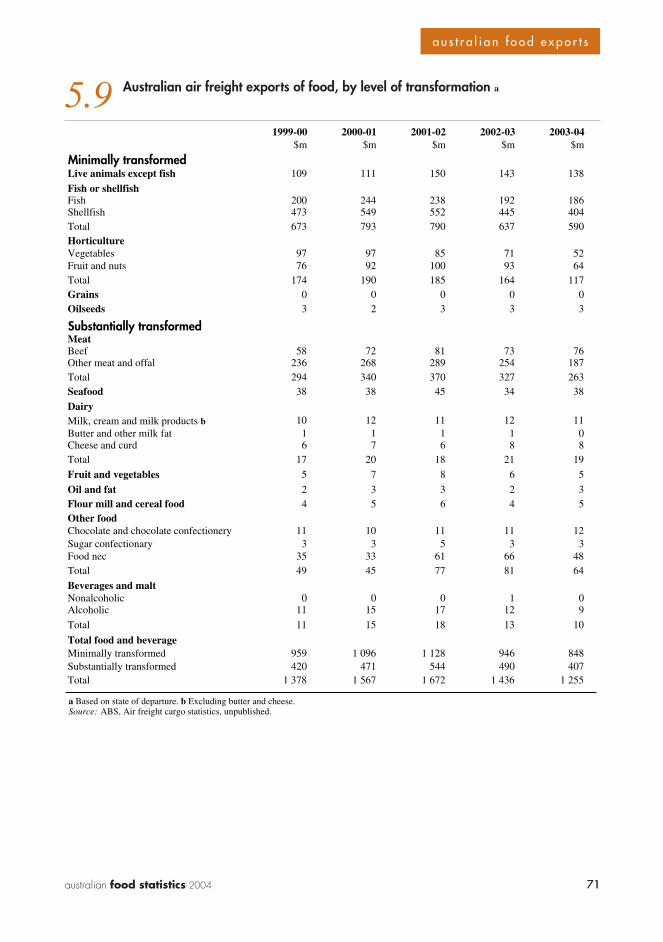
71australian food statistics 2004 71
a u s t r a l i a n f o o d e x p o r t s
5.9 Australian air freight exports of food, by level of transformation a
1999-00 2000-01 2001-02 2002-03 2003-04$m $m $m $m $m
Minimally transformedLive animals except fish 109 111 150 143 138
Fish or shellfishFish 200 244 238 192 186Shellfish 473 549 552 445 404Total 673 793 790 637 590HorticultureVegetables 97 97 85 71 52Fruit and nuts 76 92 100 93 64Total 174 190 185 164 117Grains 0 0 0 0 0Oilseeds 3 2 3 3 3
Substantially transformedMeatBeef 58 72 81 73 76Other meat and offal 236 268 289 254 187Total 294 340 370 327 263Seafood 38 38 45 34 38
DairyMilk, cream and milk products b 10 12 11 12 11Butter and other milk fat 1 1 1 1 0Cheese and curd 6 7 6 8 8Total 17 20 18 21 19
Fruit and vegetables 5 7 8 6 5
Oil and fat 2 3 3 2 3Flour mill and cereal food 4 5 6 4 5Other foodChocolate and chocolate confectionery 11 10 11 11 12Sugar confectionary 3 3 5 3 3Food nec 35 33 61 66 48Total 49 45 77 81 64
Beverages and maltNonalcoholic 0 0 0 1 0Alcoholic 11 15 17 12 9
Total 11 15 18 13 10
Total food and beverageMinimally transformed 959 1 096 1 128 946 848Substantially transformed 420 471 544 490 407Total 1 378 1 567 1 672 1 436 1 255
a Based on state of departure. b Excluding butter and cheese.Source: ABS, Air freight cargo statistics, unpublished.
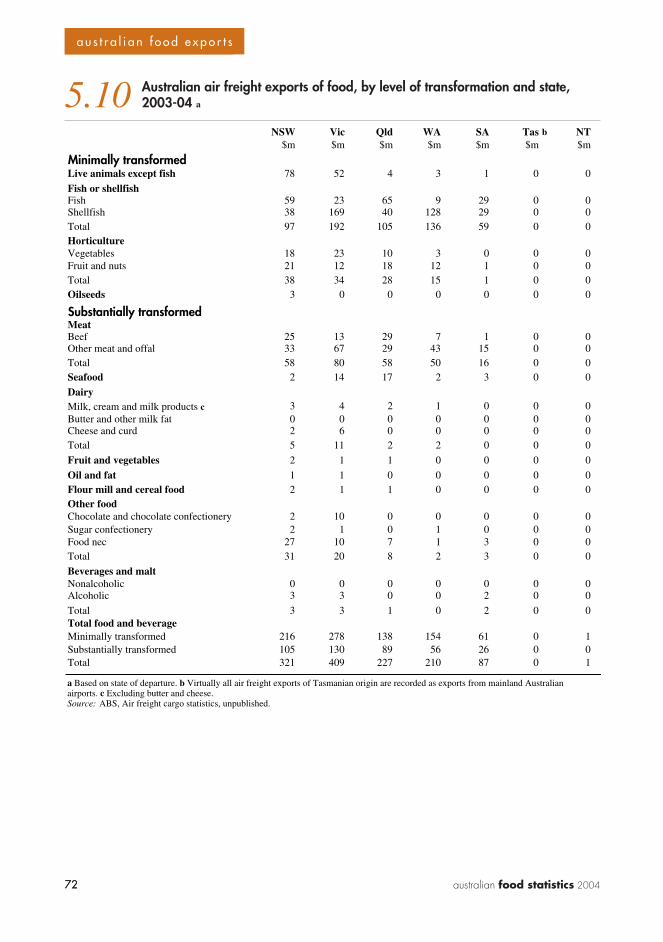
72 australian food statistics 2004
? ? ?
72
a u s t r a l i a n f o o d e x p o r t s
5.10 Australian air freight exports of food, by level of transformation and state, 2003-04 a
NSW Vic Qld WA SA Tas b NT$m $m $m $m $m $m $m
Minimally transformedLive animals except fish 78 52 4 3 1 0 0
Fish or shellfishFish 59 23 65 9 29 0 0Shellfish 38 169 40 128 29 0 0Total 97 192 105 136 59 0 0HorticultureVegetables 18 23 10 3 0 0 0Fruit and nuts 21 12 18 12 1 0 0Total 38 34 28 15 1 0 0Oilseeds 3 0 0 0 0 0 0
Substantially transformedMeatBeef 25 13 29 7 1 0 0Other meat and offal 33 67 29 43 15 0 0Total 58 80 58 50 16 0 0Seafood 2 14 17 2 3 0 0
DairyMilk, cream and milk products c 3 4 2 1 0 0 0Butter and other milk fat 0 0 0 0 0 0 0Cheese and curd 2 6 0 0 0 0 0Total 5 11 2 2 0 0 0
Fruit and vegetables 2 1 1 0 0 0 0
Oil and fat 1 1 0 0 0 0 0Flour mill and cereal food 2 1 1 0 0 0 0Other foodChocolate and chocolate confectionery 2 10 0 0 0 0 0Sugar confectionery 2 1 0 1 0 0 0Food nec 27 10 7 1 3 0 0Total 31 20 8 2 3 0 0
Beverages and maltNonalcoholic 0 0 0 0 0 0 0Alcoholic 3 3 0 0 2 0 0
Total 3 3 1 0 2 0 0Total food and beverageMinimally transformed 216 278 138 154 61 0 1Substantially transformed 105 130 89 56 26 0 0Total 321 409 227 210 87 0 1
a Based on state of departure. b Virtually all air freight exports of Tasmanian origin are recorded as exports from mainland Australian airports. c Excluding butter and cheese. Source: ABS, Air freight cargo statistics, unpublished.
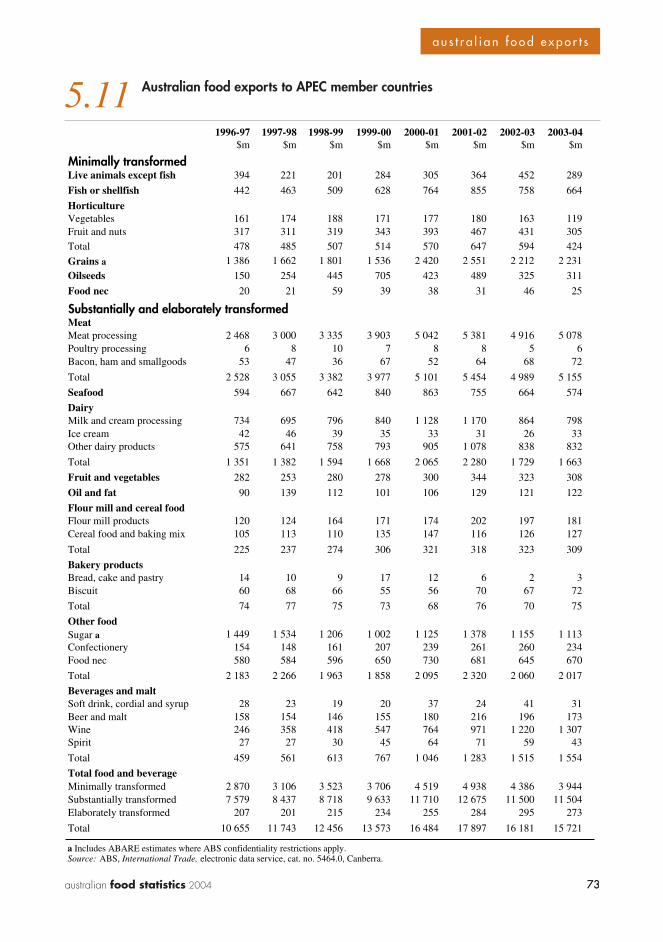
73australian food statistics 2004 73
a u s t r a l i a n f o o d e x p o r t s
5.11 Australian food exports to APEC member countries
1996-97 1997-98 1998-99 1999-00 2000-01 2001-02 2002-03 2003-04$m $m $m $m $m $m $m $m
Minimally transformedLive animals except fish 394 221 201 284 305 364 452 289
Fish or shellfish 442 463 509 628 764 855 758 664
HorticultureVegetables 161 174 188 171 177 180 163 119Fruit and nuts 317 311 319 343 393 467 431 305Total 478 485 507 514 570 647 594 424
Grains a 1 386 1 662 1 801 1 536 2 420 2 551 2 212 2 231
Oilseeds 150 254 445 705 423 489 325 311
Food nec 20 21 59 39 38 31 46 25
Substantially and elaborately transformedMeatMeat processing 2 468 3 000 3 335 3 903 5 042 5 381 4 916 5 078Poultry processing 6 8 10 7 8 8 5 6Bacon, ham and smallgoods 53 47 36 67 52 64 68 72
Total 2 528 3 055 3 382 3 977 5 101 5 454 4 989 5 155
Seafood 594 667 642 840 863 755 664 574
DairyMilk and cream processing 734 695 796 840 1 128 1 170 864 798Ice cream 42 46 39 35 33 31 26 33Other dairy products 575 641 758 793 905 1 078 838 832
Total 1 351 1 382 1 594 1 668 2 065 2 280 1 729 1 663
Fruit and vegetables 282 253 280 278 300 344 323 308
Oil and fat 90 139 112 101 106 129 121 122
Flour mill and cereal foodFlour mill products 120 124 164 171 174 202 197 181Cereal food and baking mix 105 113 110 135 147 116 126 127
Total 225 237 274 306 321 318 323 309
Bakery productsBread, cake and pastry 14 10 9 17 12 6 2 3Biscuit 60 68 66 55 56 70 67 72
Total 74 77 75 73 68 76 70 75
Other foodSugar a 1 449 1 534 1 206 1 002 1 125 1 378 1 155 1 113Confectionery 154 148 161 207 239 261 260 234Food nec 580 584 596 650 730 681 645 670
Total 2 183 2 266 1 963 1 858 2 095 2 320 2 060 2 017
Beverages and maltSoft drink, cordial and syrup 28 23 19 20 37 24 41 31Beer and malt 158 154 146 155 180 216 196 173Wine 246 358 418 547 764 971 1 220 1 307Spirit 27 27 30 45 64 71 59 43
Total 459 561 613 767 1 046 1 283 1 515 1 554
Total food and beverageMinimally transformed 2 870 3 106 3 523 3 706 4 519 4 938 4 386 3 944Substantially transformed 7 579 8 437 8 718 9 633 11 710 12 675 11 500 11 504Elaborately transformed 207 201 215 234 255 284 295 273
Total 10 655 11 743 12 456 13 573 16 484 17 897 16 181 15 721
a Includes ABARE estimates where ABS confidentiality restrictions apply.Source: ABS, International Trade, electronic data service, cat. no. 5464.0, Canberra.
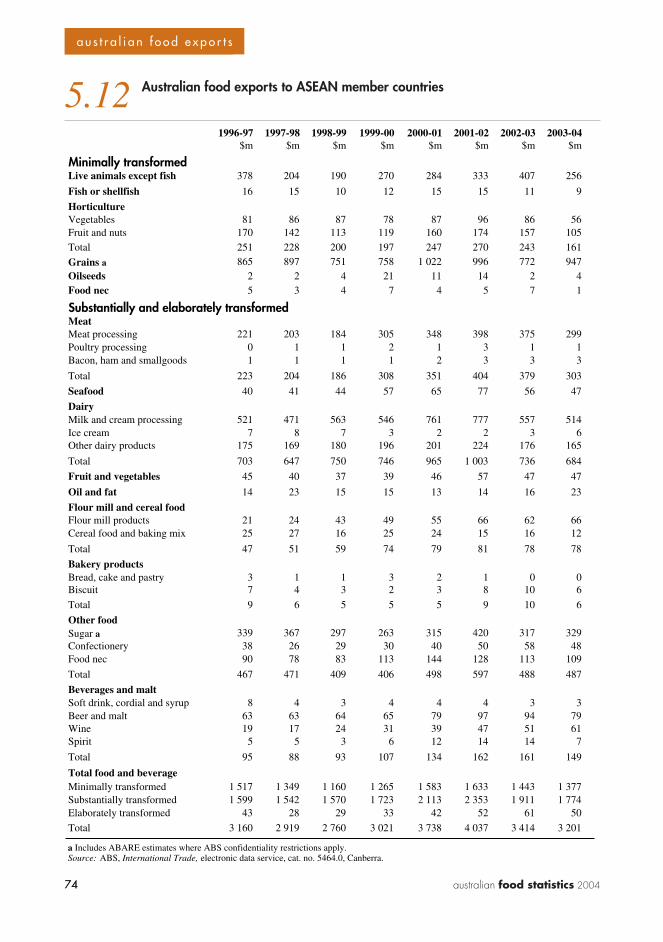
74 australian food statistics 2004
? ? ?
74
a u s t r a l i a n f o o d e x p o r t s
5.12 Australian food exports to ASEAN member countries
1996-97 1997-98 1998-99 1999-00 2000-01 2001-02 2002-03 2003-04$m $m $m $m $m $m $m $m
Minimally transformedLive animals except fish 378 204 190 270 284 333 407 256
Fish or shellfish 16 15 10 12 15 15 11 9
HorticultureVegetables 81 86 87 78 87 96 86 56Fruit and nuts 170 142 113 119 160 174 157 105Total 251 228 200 197 247 270 243 161
Grains a 865 897 751 758 1 022 996 772 947Oilseeds 2 2 4 21 11 14 2 4Food nec 5 3 4 7 4 5 7 1
Substantially and elaborately transformedMeatMeat processing 221 203 184 305 348 398 375 299Poultry processing 0 1 1 2 1 3 1 1Bacon, ham and smallgoods 1 1 1 1 2 3 3 3
Total 223 204 186 308 351 404 379 303
Seafood 40 41 44 57 65 77 56 47
DairyMilk and cream processing 521 471 563 546 761 777 557 514Ice cream 7 8 7 3 2 2 3 6Other dairy products 175 169 180 196 201 224 176 165
Total 703 647 750 746 965 1 003 736 684
Fruit and vegetables 45 40 37 39 46 57 47 47
Oil and fat 14 23 15 15 13 14 16 23
Flour mill and cereal foodFlour mill products 21 24 43 49 55 66 62 66Cereal food and baking mix 25 27 16 25 24 15 16 12
Total 47 51 59 74 79 81 78 78
Bakery productsBread, cake and pastry 3 1 1 3 2 1 0 0Biscuit 7 4 3 2 3 8 10 6
Total 9 6 5 5 5 9 10 6
Other foodSugar a 339 367 297 263 315 420 317 329Confectionery 38 26 29 30 40 50 58 48Food nec 90 78 83 113 144 128 113 109
Total 467 471 409 406 498 597 488 487
Beverages and maltSoft drink, cordial and syrup 8 4 3 4 4 4 3 3Beer and malt 63 63 64 65 79 97 94 79Wine 19 17 24 31 39 47 51 61Spirit 5 5 3 6 12 14 14 7
Total 95 88 93 107 134 162 161 149
Total food and beverageMinimally transformed 1 517 1 349 1 160 1 265 1 583 1 633 1 443 1 377Substantially transformed 1 599 1 542 1 570 1 723 2 113 2 353 1 911 1 774Elaborately transformed 43 28 29 33 42 52 61 50
Total 3 160 2 919 2 760 3 021 3 738 4 037 3 414 3 201
a Includes ABARE estimates where ABS confidentiality restrictions apply.Source: ABS, International Trade, electronic data service, cat. no. 5464.0, Canberra.
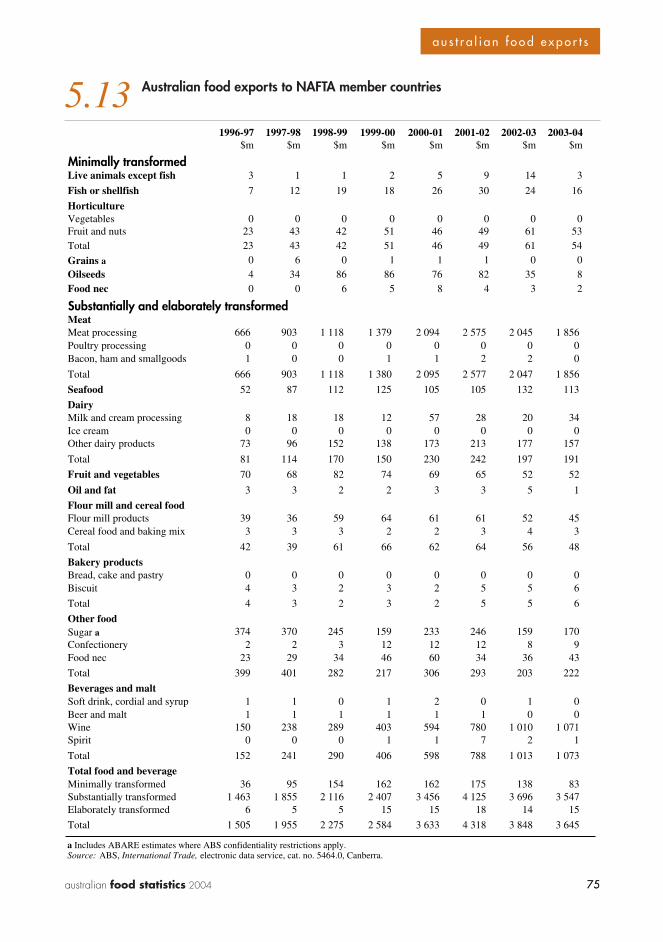
75australian food statistics 2004 75
a u s t r a l i a n f o o d e x p o r t s
5.13 Australian food exports to NAFTA member countries
1996-97 1997-98 1998-99 1999-00 2000-01 2001-02 2002-03 2003-04$m $m $m $m $m $m $m $m
Minimally transformedLive animals except fish 3 1 1 2 5 9 14 3
Fish or shellfish 7 12 19 18 26 30 24 16
HorticultureVegetables 0 0 0 0 0 0 0 0Fruit and nuts 23 43 42 51 46 49 61 53Total 23 43 42 51 46 49 61 54
Grains a 0 6 0 1 1 1 0 0Oilseeds 4 34 86 86 76 82 35 8Food nec 0 0 6 5 8 4 3 2
Substantially and elaborately transformedMeatMeat processing 666 903 1 118 1 379 2 094 2 575 2 045 1 856Poultry processing 0 0 0 0 0 0 0 0Bacon, ham and smallgoods 1 0 0 1 1 2 2 0
Total 666 903 1 118 1 380 2 095 2 577 2 047 1 856
Seafood 52 87 112 125 105 105 132 113
DairyMilk and cream processing 8 18 18 12 57 28 20 34Ice cream 0 0 0 0 0 0 0 0Other dairy products 73 96 152 138 173 213 177 157
Total 81 114 170 150 230 242 197 191
Fruit and vegetables 70 68 82 74 69 65 52 52
Oil and fat 3 3 2 2 3 3 5 1
Flour mill and cereal foodFlour mill products 39 36 59 64 61 61 52 45Cereal food and baking mix 3 3 3 2 2 3 4 3
Total 42 39 61 66 62 64 56 48
Bakery productsBread, cake and pastry 0 0 0 0 0 0 0 0Biscuit 4 3 2 3 2 5 5 6
Total 4 3 2 3 2 5 5 6
Other foodSugar a 374 370 245 159 233 246 159 170Confectionery 2 2 3 12 12 12 8 9Food nec 23 29 34 46 60 34 36 43
Total 399 401 282 217 306 293 203 222
Beverages and maltSoft drink, cordial and syrup 1 1 0 1 2 0 1 0Beer and malt 1 1 1 1 1 1 0 0Wine 150 238 289 403 594 780 1 010 1 071Spirit 0 0 0 1 1 7 2 1
Total 152 241 290 406 598 788 1 013 1 073
Total food and beverageMinimally transformed 36 95 154 162 162 175 138 83Substantially transformed 1 463 1 855 2 116 2 407 3 456 4 125 3 696 3 547Elaborately transformed 6 5 5 15 15 18 14 15
Total 1 505 1 955 2 275 2 584 3 633 4 318 3 848 3 645
a Includes ABARE estimates where ABS confidentiality restrictions apply.Source: ABS, International Trade, electronic data service, cat. no. 5464.0, Canberra.
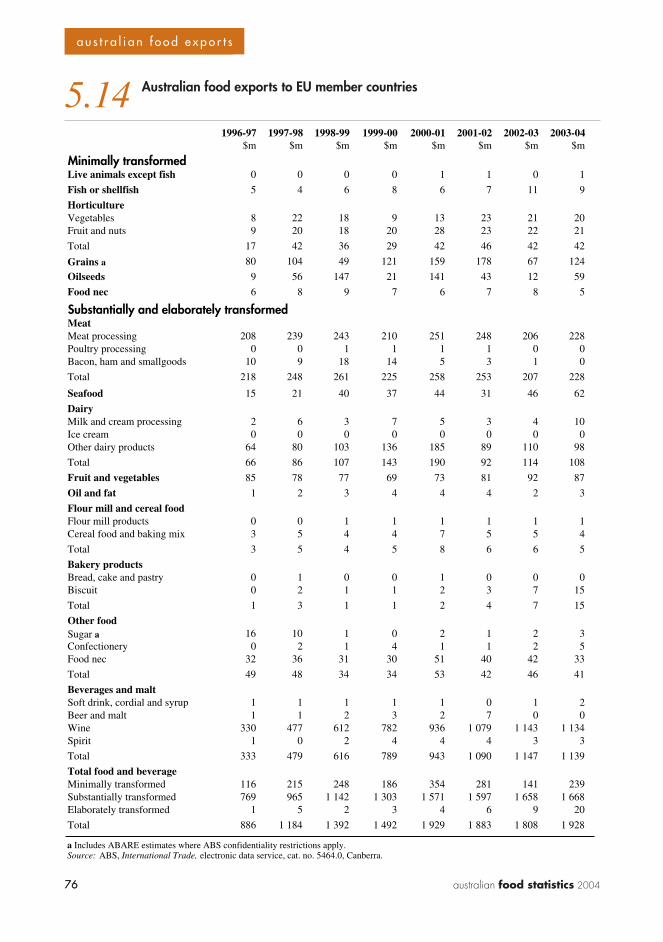
76 australian food statistics 2004
? ? ?
76
a u s t r a l i a n f o o d e x p o r t s
5.14 Australian food exports to EU member countries
1996-97 1997-98 1998-99 1999-00 2000-01 2001-02 2002-03 2003-04$m $m $m $m $m $m $m $m
Minimally transformedLive animals except fish 0 0 0 0 1 1 0 1
Fish or shellfish 5 4 6 8 6 7 11 9
HorticultureVegetables 8 22 18 9 13 23 21 20Fruit and nuts 9 20 18 20 28 23 22 21
Total 17 42 36 29 42 46 42 42
Grains a 80 104 49 121 159 178 67 124
Oilseeds 9 56 147 21 141 43 12 59
Food nec 6 8 9 7 6 7 8 5
Substantially and elaborately transformedMeatMeat processing 208 239 243 210 251 248 206 228Poultry processing 0 0 1 1 1 1 0 0Bacon, ham and smallgoods 10 9 18 14 5 3 1 0
Total 218 248 261 225 258 253 207 228
Seafood 15 21 40 37 44 31 46 62
DairyMilk and cream processing 2 6 3 7 5 3 4 10Ice cream 0 0 0 0 0 0 0 0Other dairy products 64 80 103 136 185 89 110 98
Total 66 86 107 143 190 92 114 108
Fruit and vegetables 85 78 77 69 73 81 92 87
Oil and fat 1 2 3 4 4 4 2 3
Flour mill and cereal foodFlour mill products 0 0 1 1 1 1 1 1Cereal food and baking mix 3 5 4 4 7 5 5 4
Total 3 5 4 5 8 6 6 5
Bakery productsBread, cake and pastry 0 1 0 0 1 0 0 0Biscuit 0 2 1 1 2 3 7 15
Total 1 3 1 1 2 4 7 15
Other foodSugar a 16 10 1 0 2 1 2 3Confectionery 0 2 1 4 1 1 2 5Food nec 32 36 31 30 51 40 42 33
Total 49 48 34 34 53 42 46 41
Beverages and maltSoft drink, cordial and syrup 1 1 1 1 1 0 1 2Beer and malt 1 1 2 3 2 7 0 0Wine 330 477 612 782 936 1 079 1 143 1 134Spirit 1 0 2 4 4 4 3 3
Total 333 479 616 789 943 1 090 1 147 1 139
Total food and beverageMinimally transformed 116 215 248 186 354 281 141 239Substantially transformed 769 965 1 142 1 303 1 571 1 597 1 658 1 668Elaborately transformed 1 5 2 3 4 6 9 20
Total 886 1 184 1 392 1 492 1 929 1 883 1 808 1 928
a Includes ABARE estimates where ABS confidentiality restrictions apply. Source: ABS, International Trade, electronic data service, cat. no. 5464.0, Canberra.

77australian food statistics 2004 77
a u s t r a l i a n f o o d e x p o r t s
5.15 Australian total food exports, by selected destination
1998-99 1999-00 2000-01 2001-02 2002-03 2003-04$m $m $m $m $m $m
Canada 447 400 550 644 595 411China 656 672 688 1 051 754 709Chinese Taipei 676 724 740 700 644 596Egypt 231 259 300 243 155 75Germany 181 142 239 123 116 152Hong Kong, China 613 704 885 897 760 714Indonesia 595 700 1 005 1 150 1 117 1 124Japan 3 816 4 164 4 807 4 757 4 426 4 685Korea, Rep. Of 830 852 1 012 1 143 1 193 1 172Malaysia 764 780 967 1 083 816 850New Zealand 655 701 830 928 1 009 928Philippines 610 635 696 636 485 369Saudi Arabia 411 275 547 796 570 790Singapore 411 518 582 662 597 509Thailand 272 277 337 349 289 270United Arab Emirates 284 262 325 297 233 237United Kingdom 724 796 971 1 113 1 103 1 099United States 1 672 2 054 2 890 3 451 3 088 3 116
Source: ABS, International Trade, electronic data service, cat. no. 5464.0, Canberra.
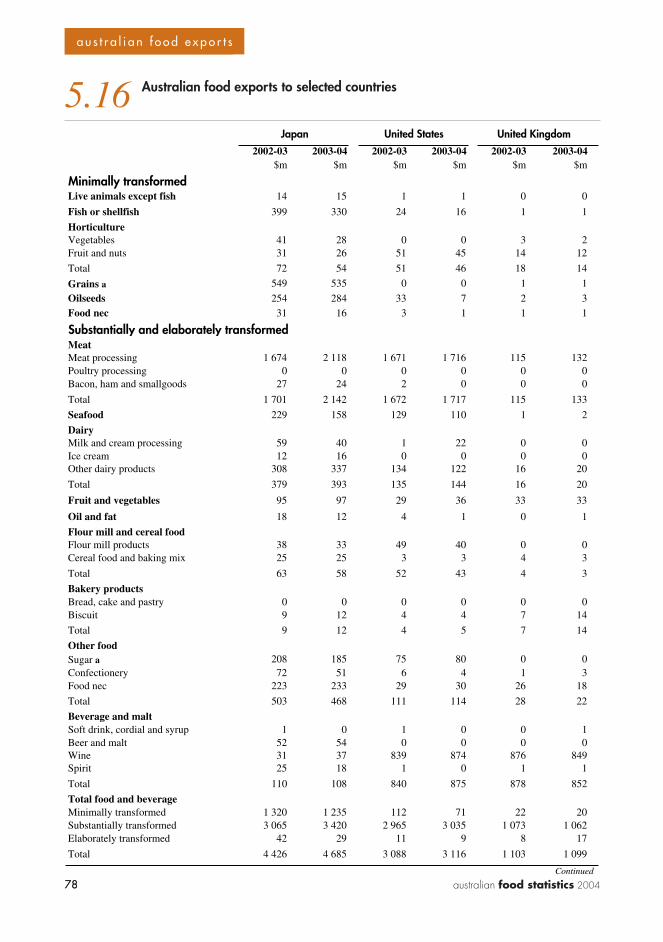
78 australian food statistics 2004
? ? ?
78
a u s t r a l i a n f o o d e x p o r t s
5.16 Australian food exports to selected countries
2002-03 2003-04 2002-03 2003-04 2002-03 2003-04$m $m $m $m $m $m
Minimally transformedLive animals except fish 14 15 1 1 0 0
Fish or shellfish 399 330 24 16 1 1
HorticultureVegetables 41 28 0 0 3 2Fruit and nuts 31 26 51 45 14 12
Total 72 54 51 46 18 14
Grains a 549 535 0 0 1 1
Oilseeds 254 284 33 7 2 3Food nec 31 16 3 1 1 1
Substantially and elaborately transformedMeatMeat processing 1 674 2 118 1 671 1 716 115 132Poultry processing 0 0 0 0 0 0Bacon, ham and smallgoods 27 24 2 0 0 0
Total 1 701 2 142 1 672 1 717 115 133
Seafood 229 158 129 110 1 2
DairyMilk and cream processing 59 40 1 22 0 0Ice cream 12 16 0 0 0 0Other dairy products 308 337 134 122 16 20
Total 379 393 135 144 16 20
Fruit and vegetables 95 97 29 36 33 33
Oil and fat 18 12 4 1 0 1
Flour mill and cereal foodFlour mill products 38 33 49 40 0 0Cereal food and baking mix 25 25 3 3 4 3
Total 63 58 52 43 4 3
Bakery productsBread, cake and pastry 0 0 0 0 0 0Biscuit 9 12 4 4 7 14
Total 9 12 4 5 7 14
Other foodSugar a 208 185 75 80 0 0
Confectionery 72 51 6 4 1 3Food nec 223 233 29 30 26 18
Total 503 468 111 114 28 22
Beverage and maltSoft drink, cordial and syrup 1 0 1 0 0 1Beer and malt 52 54 0 0 0 0Wine 31 37 839 874 876 849Spirit 25 18 1 0 1 1
Total 110 108 840 875 878 852
Total food and beverageMinimally transformed 1 320 1 235 112 71 22 20Substantially transformed 3 065 3 420 2 965 3 035 1 073 1 062Elaborately transformed 42 29 11 9 8 17
Total 4 426 4 685 3 088 3 116 1 103 1 099
Continued
Japan United States United Kingdom

79australian food statistics 2004 79
a u s t r a l i a n f o o d e x p o r t s
5.16 Australian food exports to selected countries continued
2002-03 2003-04 2002-03 2003-04 2002-03 2003-04$m $m $m $m $m $m
Minimally transformedLive animals except fish 1 1 1 1 0 0
Fish or shellfish 268 262 1 1 37 35
HorticultureVegetables 10 8 13 16 7 5Fruit and nuts 127 82 16 16 31 18Total 137 91 29 32 38 22
Grains a 9 1 104 79 61 54
Oilseeds 0 0 3 3 2 2Food nec 0 0 1 1 1 1
Substantially and elaborately transformedMeatMeat processing 34 41 88 63 216 199Poultry processing 3 4 0 0 0 0Bacon, ham and smallgoods 2 1 4 3 0 0
Total 38 46 91 66 216 200
Seafood 123 155 5 5 54 39
DairyMilk and cream processing 33 31 15 15 108 103Ice cream 1 0 10 9 0 0Other dairy products 29 27 16 14 28 29
Total 63 59 42 38 136 132
Fruit and vegetables 11 7 100 89 6 5
Oil and fat 29 25 38 34 1 1
Flour mill and cereal foodFlour mill products 9 5 24 21 7 5Cereal food and baking mix 6 5 62 74 6 2
Total 15 10 86 94 13 7
Bakery productsBread, cake and pastry 0 0 2 3 0 0Biscuit 3 2 39 45 0 0
Total 3 2 41 47 0 0
Other foodSugar a 2 0 68 60 45 48 Confectionery 12 14 71 72 12 12Food nec 31 23 177 168 16 28
Total 44 37 316 299 73 87
Beverage and maltSoft drink, cordial and syrup 1 1 34 25 1 0Beer and malt 1 1 2 1 0 2Wine 15 17 100 100 4 8Spirit 1 1 14 14 1 2
Total 17 20 150 139 6 12
Total food and beverageMinimally transformed 416 355 141 116 139 114Substantially transformed 320 342 750 689 493 470Elaborately transformed 24 17 118 123 12 12
Total 760 714 1 009 928 644 596
Continued
Hong Kong, China New Zealand Chinese Taipei
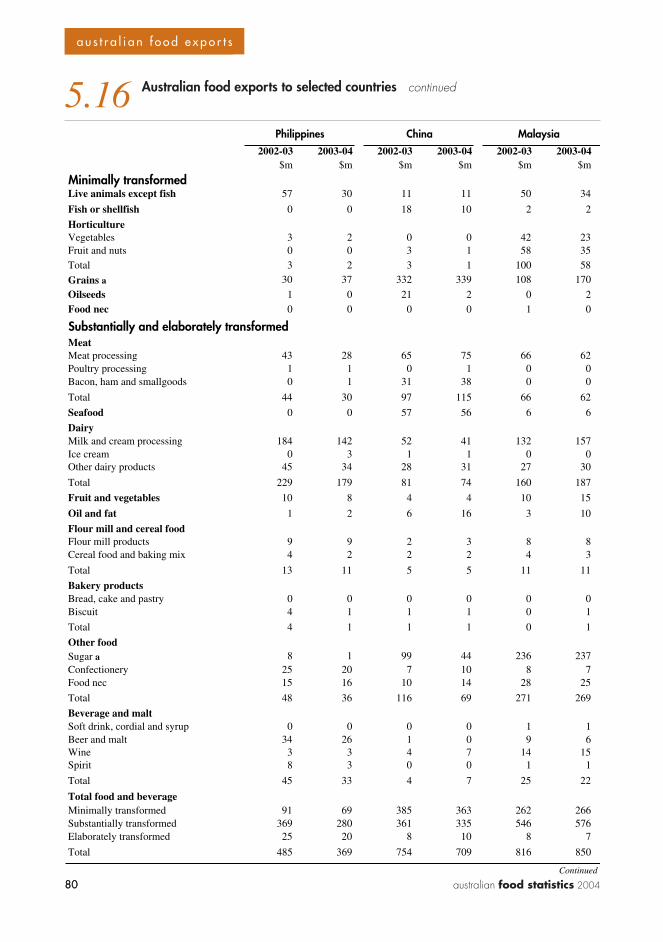
80 australian food statistics 2004
? ? ?
80
a u s t r a l i a n f o o d e x p o r t s
5.16 Australian food exports to selected countries continued
2002-03 2003-04 2002-03 2003-04 2002-03 2003-04$m $m $m $m $m $m
Minimally transformedLive animals except fish 57 30 11 11 50 34
Fish or shellfish 0 0 18 10 2 2
HorticultureVegetables 3 2 0 0 42 23Fruit and nuts 0 0 3 1 58 35Total 3 2 3 1 100 58
Grains a 30 37 332 339 108 170
Oilseeds 1 0 21 2 0 2Food nec 0 0 0 0 1 0
Substantially and elaborately transformedMeatMeat processing 43 28 65 75 66 62Poultry processing 1 1 0 1 0 0Bacon, ham and smallgoods 0 1 31 38 0 0
Total 44 30 97 115 66 62
Seafood 0 0 57 56 6 6
DairyMilk and cream processing 184 142 52 41 132 157Ice cream 0 3 1 1 0 0Other dairy products 45 34 28 31 27 30
Total 229 179 81 74 160 187
Fruit and vegetables 10 8 4 4 10 15
Oil and fat 1 2 6 16 3 10
Flour mill and cereal foodFlour mill products 9 9 2 3 8 8Cereal food and baking mix 4 2 2 2 4 3
Total 13 11 5 5 11 11
Bakery productsBread, cake and pastry 0 0 0 0 0 0Biscuit 4 1 1 1 0 1
Total 4 1 1 1 0 1
Other foodSugar a 8 1 99 44 236 237
Confectionery 25 20 7 10 8 7Food nec 15 16 10 14 28 25
Total 48 36 116 69 271 269
Beverage and maltSoft drink, cordial and syrup 0 0 0 0 1 1Beer and malt 34 26 1 0 9 6Wine 3 3 4 7 14 15Spirit 8 3 0 0 1 1
Total 45 33 4 7 25 22
Total food and beverageMinimally transformed 91 69 385 363 262 266Substantially transformed 369 280 361 335 546 576Elaborately transformed 25 20 8 10 8 7
Total 485 369 754 709 816 850
Continued
Philippines China Malaysia
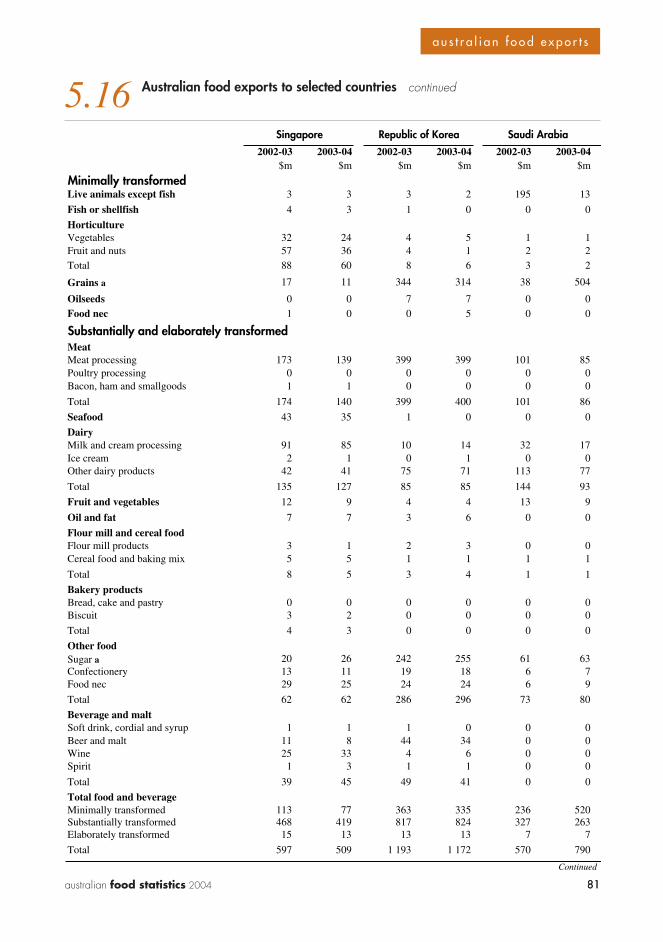
81australian food statistics 2004 81
a u s t r a l i a n f o o d e x p o r t s
5.16 Australian food exports to selected countries continued
2002-03 2003-04 2002-03 2003-04 2002-03 2003-04$m $m $m $m $m $m
Minimally transformedLive animals except fish 3 3 3 2 195 13
Fish or shellfish 4 3 1 0 0 0
HorticultureVegetables 32 24 4 5 1 1Fruit and nuts 57 36 4 1 2 2Total 88 60 8 6 3 2
Grains a 17 11 344 314 38 504
Oilseeds 0 0 7 7 0 0Food nec 1 0 0 5 0 0
Substantially and elaborately transformedMeatMeat processing 173 139 399 399 101 85Poultry processing 0 0 0 0 0 0Bacon, ham and smallgoods 1 1 0 0 0 0
Total 174 140 399 400 101 86
Seafood 43 35 1 0 0 0
DairyMilk and cream processing 91 85 10 14 32 17Ice cream 2 1 0 1 0 0Other dairy products 42 41 75 71 113 77
Total 135 127 85 85 144 93
Fruit and vegetables 12 9 4 4 13 9
Oil and fat 7 7 3 6 0 0
Flour mill and cereal foodFlour mill products 3 1 2 3 0 0Cereal food and baking mix 5 5 1 1 1 1
Total 8 5 3 4 1 1
Bakery productsBread, cake and pastry 0 0 0 0 0 0Biscuit 3 2 0 0 0 0
Total 4 3 0 0 0 0
Other foodSugar a 20 26 242 255 61 63 Confectionery 13 11 19 18 6 7Food nec 29 25 24 24 6 9
Total 62 62 286 296 73 80
Beverage and maltSoft drink, cordial and syrup 1 1 1 0 0 0Beer and malt 11 8 44 34 0 0Wine 25 33 4 6 0 0Spirit 1 3 1 1 0 0
Total 39 45 49 41 0 0
Total food and beverageMinimally transformed 113 77 363 335 236 520Substantially transformed 468 419 817 824 327 263Elaborately transformed 15 13 13 13 7 7
Total 597 509 1 193 1 172 570 790
Continued
Singapore Republic of Korea Saudi Arabia
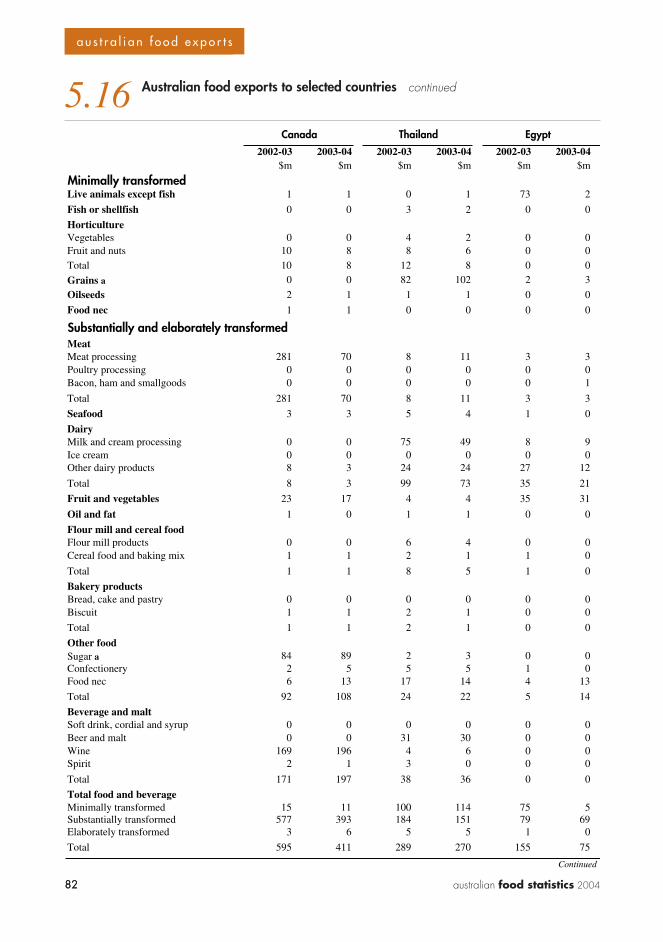
82 australian food statistics 2004
? ? ?
82
a u s t r a l i a n f o o d e x p o r t s
5.16 Australian food exports to selected countries continued
2002-03 2003-04 2002-03 2003-04 2002-03 2003-04$m $m $m $m $m $m
Minimally transformedLive animals except fish 1 1 0 1 73 2
Fish or shellfish 0 0 3 2 0 0
HorticultureVegetables 0 0 4 2 0 0Fruit and nuts 10 8 8 6 0 0Total 10 8 12 8 0 0
Grains a 0 0 82 102 2 3
Oilseeds 2 1 1 1 0 0
Food nec 1 1 0 0 0 0
Substantially and elaborately transformedMeatMeat processing 281 70 8 11 3 3Poultry processing 0 0 0 0 0 0Bacon, ham and smallgoods 0 0 0 0 0 1
Total 281 70 8 11 3 3
Seafood 3 3 5 4 1 0
DairyMilk and cream processing 0 0 75 49 8 9Ice cream 0 0 0 0 0 0Other dairy products 8 3 24 24 27 12
Total 8 3 99 73 35 21
Fruit and vegetables 23 17 4 4 35 31
Oil and fat 1 0 1 1 0 0
Flour mill and cereal foodFlour mill products 0 0 6 4 0 0Cereal food and baking mix 1 1 2 1 1 0
Total 1 1 8 5 1 0
Bakery productsBread, cake and pastry 0 0 0 0 0 0Biscuit 1 1 2 1 0 0
Total 1 1 2 1 0 0
Other foodSugar a 84 89 2 3 0 0 Confectionery 2 5 5 5 1 0Food nec 6 13 17 14 4 13
Total 92 108 24 22 5 14
Beverage and maltSoft drink, cordial and syrup 0 0 0 0 0 0Beer and malt 0 0 31 30 0 0Wine 169 196 4 6 0 0Spirit 2 1 3 0 0 0
Total 171 197 38 36 0 0
Total food and beverageMinimally transformed 15 11 100 114 75 5Substantially transformed 577 393 184 151 79 69Elaborately transformed 3 6 5 5 1 0
Total 595 411 289 270 155 75
Continued
Canada Thailand Egypt
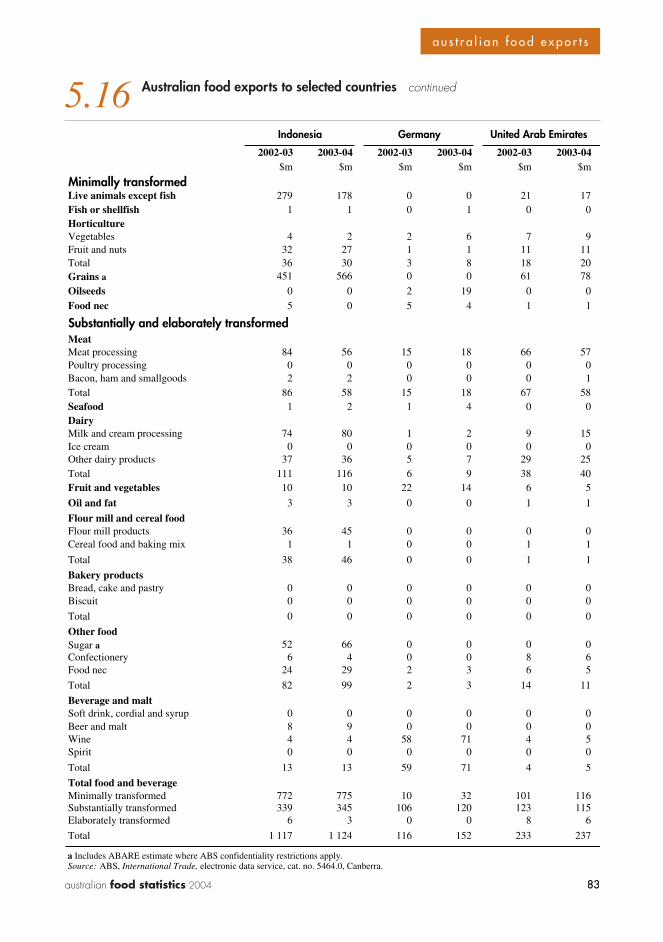
83australian food statistics 2004 83
a u s t r a l i a n f o o d e x p o r t s
5.16 Australian food exports to selected countries continued
2002-03 2003-04 2002-03 2003-04 2002-03 2003-04$m $m $m $m $m $m
Minimally transformedLive animals except fish 279 178 0 0 21 17Fish or shellfish 1 1 0 1 0 0HorticultureVegetables 4 2 2 6 7 9Fruit and nuts 32 27 1 1 11 11Total 36 30 3 8 18 20Grains a 451 566 0 0 61 78
Oilseeds 0 0 2 19 0 0Food nec 5 0 5 4 1 1
Substantially and elaborately transformedMeatMeat processing 84 56 15 18 66 57Poultry processing 0 0 0 0 0 0Bacon, ham and smallgoods 2 2 0 0 0 1Total 86 58 15 18 67 58Seafood 1 2 1 4 0 0DairyMilk and cream processing 74 80 1 2 9 15Ice cream 0 0 0 0 0 0Other dairy products 37 36 5 7 29 25Total 111 116 6 9 38 40Fruit and vegetables 10 10 22 14 6 5
Oil and fat 3 3 0 0 1 1
Flour mill and cereal foodFlour mill products 36 45 0 0 0 0Cereal food and baking mix 1 1 0 0 1 1
Total 38 46 0 0 1 1
Bakery productsBread, cake and pastry 0 0 0 0 0 0Biscuit 0 0 0 0 0 0
Total 0 0 0 0 0 0
Other foodSugar a 52 66 0 0 0 0Confectionery 6 4 0 0 8 6Food nec 24 29 2 3 6 5
Total 82 99 2 3 14 11
Beverage and maltSoft drink, cordial and syrup 0 0 0 0 0 0Beer and malt 8 9 0 0 0 0Wine 4 4 58 71 4 5Spirit 0 0 0 0 0 0
Total 13 13 59 71 4 5
Total food and beverageMinimally transformed 772 775 10 32 101 116Substantially transformed 339 345 106 120 123 115Elaborately transformed 6 3 0 0 8 6
Total 1 117 1 124 116 152 233 237
Indonesia Germany United Arab Emirates
a Includes ABARE estimate where ABS confidentiality restrictions apply.Source: ABS, International Trade, electronic data service, cat. no. 5464.0, Canberra.
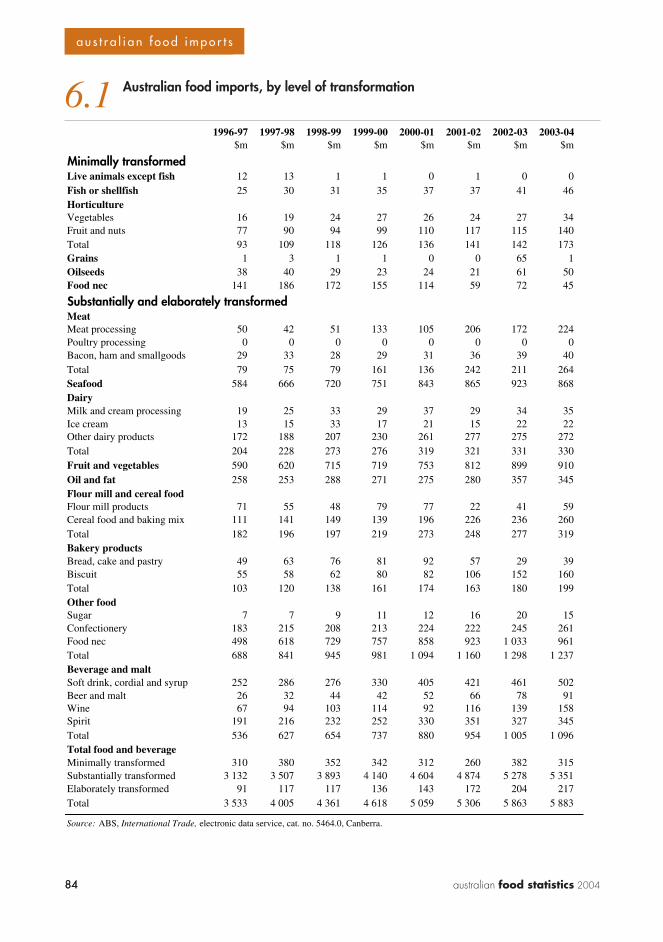
84 australian food statistics 2004
? ? ?
84
a u s t r a l i a n f o o d i m p o r t s
6.1 Australian food imports, by level of transformation
1996-97 1997-98 1998-99 1999-00 2000-01 2001-02 2002-03 2003-04$m $m $m $m $m $m $m $m
Minimally transformedLive animals except fish 12 13 1 1 0 1 0 0Fish or shellfish 25 30 31 35 37 37 41 46HorticultureVegetables 16 19 24 27 26 24 27 34Fruit and nuts 77 90 94 99 110 117 115 140Total 93 109 118 126 136 141 142 173Grains 1 3 1 1 0 0 65 1Oilseeds 38 40 29 23 24 21 61 50Food nec 141 186 172 155 114 59 72 45
Substantially and elaborately transformedMeatMeat processing 50 42 51 133 105 206 172 224Poultry processing 0 0 0 0 0 0 0 0Bacon, ham and smallgoods 29 33 28 29 31 36 39 40Total 79 75 79 161 136 242 211 264Seafood 584 666 720 751 843 865 923 868DairyMilk and cream processing 19 25 33 29 37 29 34 35Ice cream 13 15 33 17 21 15 22 22Other dairy products 172 188 207 230 261 277 275 272Total 204 228 273 276 319 321 331 330Fruit and vegetables 590 620 715 719 753 812 899 910Oil and fat 258 253 288 271 275 280 357 345Flour mill and cereal foodFlour mill products 71 55 48 79 77 22 41 59Cereal food and baking mix 111 141 149 139 196 226 236 260Total 182 196 197 219 273 248 277 319Bakery productsBread, cake and pastry 49 63 76 81 92 57 29 39Biscuit 55 58 62 80 82 106 152 160Total 103 120 138 161 174 163 180 199Other foodSugar 7 7 9 11 12 16 20 15Confectionery 183 215 208 213 224 222 245 261Food nec 498 618 729 757 858 923 1 033 961Total 688 841 945 981 1 094 1 160 1 298 1 237Beverage and maltSoft drink, cordial and syrup 252 286 276 330 405 421 461 502Beer and malt 26 32 44 42 52 66 78 91Wine 67 94 103 114 92 116 139 158Spirit 191 216 232 252 330 351 327 345Total 536 627 654 737 880 954 1 005 1 096Total food and beverageMinimally transformed 310 380 352 342 312 260 382 315Substantially transformed 3 132 3 507 3 893 4 140 4 604 4 874 5 278 5 351Elaborately transformed 91 117 117 136 143 172 204 217Total 3 533 4 005 4 361 4 618 5 059 5 306 5 863 5 883
Source: ABS, International Trade, electronic data service, cat. no. 5464.0, Canberra.
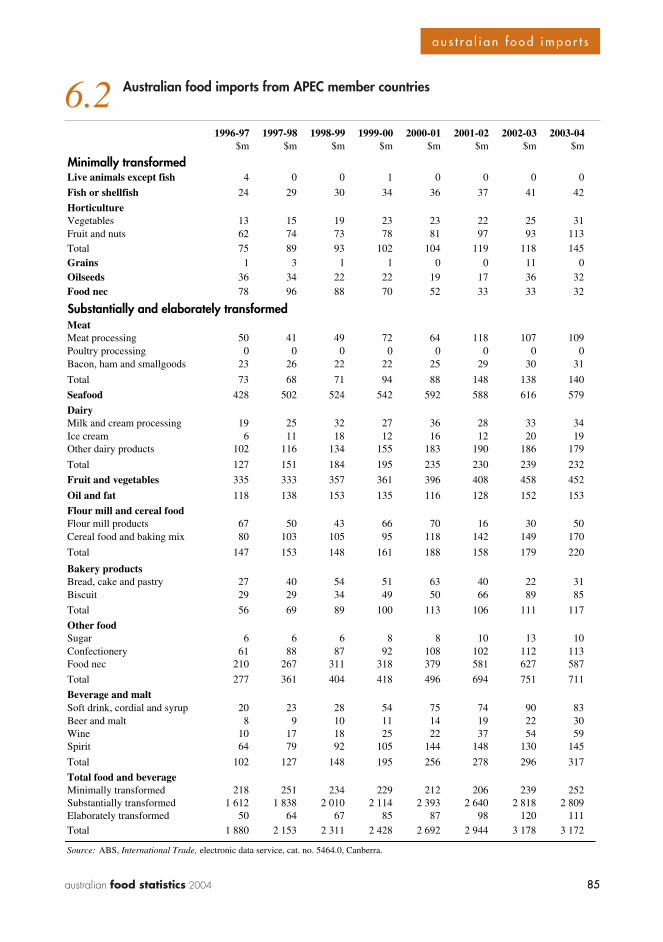
85australian food statistics 2004 85
a u s t r a l i a n f o o d i m p o r t s
6.2 Australian food imports from APEC member countries
1996-97 1997-98 1998-99 1999-00 2000-01 2001-02 2002-03 2003-04$m $m $m $m $m $m $m $m
Minimally transformedLive animals except fish 4 0 0 1 0 0 0 0
Fish or shellfish 24 29 30 34 36 37 41 42
HorticultureVegetables 13 15 19 23 23 22 25 31Fruit and nuts 62 74 73 78 81 97 93 113Total 75 89 93 102 104 119 118 145Grains 1 3 1 1 0 0 11 0Oilseeds 36 34 22 22 19 17 36 32Food nec 78 96 88 70 52 33 33 32
Substantially and elaborately transformedMeatMeat processing 50 41 49 72 64 118 107 109Poultry processing 0 0 0 0 0 0 0 0Bacon, ham and smallgoods 23 26 22 22 25 29 30 31
Total 73 68 71 94 88 148 138 140
Seafood 428 502 524 542 592 588 616 579
DairyMilk and cream processing 19 25 32 27 36 28 33 34Ice cream 6 11 18 12 16 12 20 19Other dairy products 102 116 134 155 183 190 186 179
Total 127 151 184 195 235 230 239 232
Fruit and vegetables 335 333 357 361 396 408 458 452
Oil and fat 118 138 153 135 116 128 152 153
Flour mill and cereal foodFlour mill products 67 50 43 66 70 16 30 50Cereal food and baking mix 80 103 105 95 118 142 149 170
Total 147 153 148 161 188 158 179 220
Bakery productsBread, cake and pastry 27 40 54 51 63 40 22 31Biscuit 29 29 34 49 50 66 89 85
Total 56 69 89 100 113 106 111 117
Other foodSugar 6 6 6 8 8 10 13 10Confectionery 61 88 87 92 108 102 112 113Food nec 210 267 311 318 379 581 627 587
Total 277 361 404 418 496 694 751 711
Beverage and maltSoft drink, cordial and syrup 20 23 28 54 75 74 90 83Beer and malt 8 9 10 11 14 19 22 30Wine 10 17 18 25 22 37 54 59Spirit 64 79 92 105 144 148 130 145
Total 102 127 148 195 256 278 296 317
Total food and beverageMinimally transformed 218 251 234 229 212 206 239 252Substantially transformed 1 612 1 838 2 010 2 114 2 393 2 640 2 818 2 809Elaborately transformed 50 64 67 85 87 98 120 111Total 1 880 2 153 2 311 2 428 2 692 2 944 3 178 3 172
Source: ABS, International Trade, electronic data service, cat. no. 5464.0, Canberra.
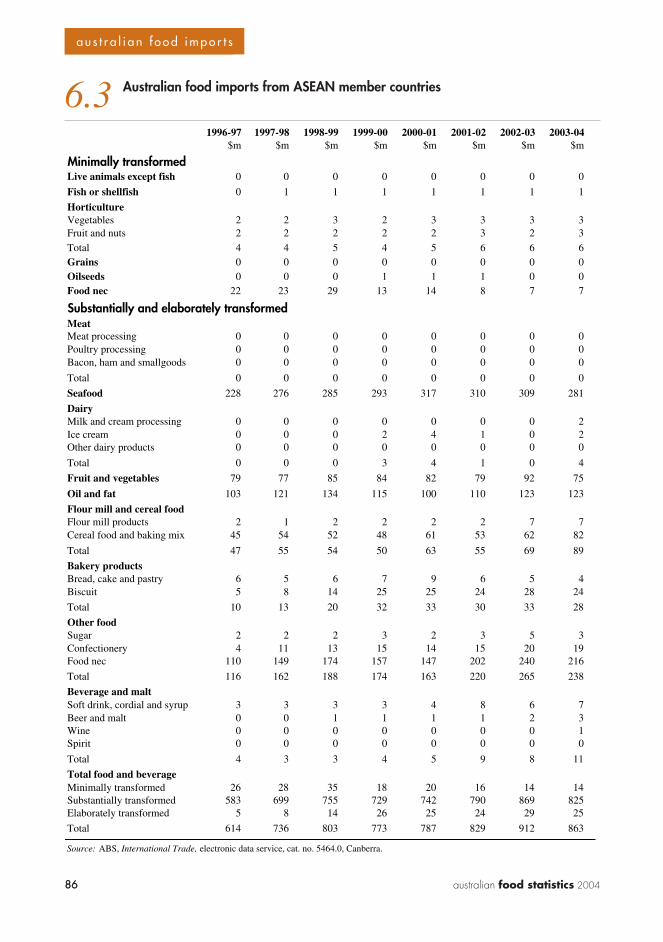
86 australian food statistics 2004
? ? ?
86
a u s t r a l i a n f o o d i m p o r t s
1996-97 1997-98 1998-99 1999-00 2000-01 2001-02 2002-03 2003-04$m $m $m $m $m $m $m $m
Minimally transformedLive animals except fish 0 0 0 0 0 0 0 0
Fish or shellfish 0 1 1 1 1 1 1 1
HorticultureVegetables 2 2 3 2 3 3 3 3Fruit and nuts 2 2 2 2 2 3 2 3Total 4 4 5 4 5 6 6 6Grains 0 0 0 0 0 0 0 0Oilseeds 0 0 0 1 1 1 0 0Food nec 22 23 29 13 14 8 7 7
Substantially and elaborately transformedMeatMeat processing 0 0 0 0 0 0 0 0Poultry processing 0 0 0 0 0 0 0 0Bacon, ham and smallgoods 0 0 0 0 0 0 0 0
Total 0 0 0 0 0 0 0 0
Seafood 228 276 285 293 317 310 309 281
DairyMilk and cream processing 0 0 0 0 0 0 0 2Ice cream 0 0 0 2 4 1 0 2Other dairy products 0 0 0 0 0 0 0 0
Total 0 0 0 3 4 1 0 4
Fruit and vegetables 79 77 85 84 82 79 92 75
Oil and fat 103 121 134 115 100 110 123 123
Flour mill and cereal foodFlour mill products 2 1 2 2 2 2 7 7Cereal food and baking mix 45 54 52 48 61 53 62 82
Total 47 55 54 50 63 55 69 89
Bakery productsBread, cake and pastry 6 5 6 7 9 6 5 4Biscuit 5 8 14 25 25 24 28 24
Total 10 13 20 32 33 30 33 28
Other foodSugar 2 2 2 3 2 3 5 3Confectionery 4 11 13 15 14 15 20 19Food nec 110 149 174 157 147 202 240 216
Total 116 162 188 174 163 220 265 238
Beverage and maltSoft drink, cordial and syrup 3 3 3 3 4 8 6 7Beer and malt 0 0 1 1 1 1 2 3Wine 0 0 0 0 0 0 0 1Spirit 0 0 0 0 0 0 0 0
Total 4 3 3 4 5 9 8 11
Total food and beverageMinimally transformed 26 28 35 18 20 16 14 14Substantially transformed 583 699 755 729 742 790 869 825Elaborately transformed 5 8 14 26 25 24 29 25
Total 614 736 803 773 787 829 912 863
Source: ABS, International Trade, electronic data service, cat. no. 5464.0, Canberra.
6.3 Australian food imports from ASEAN member countries
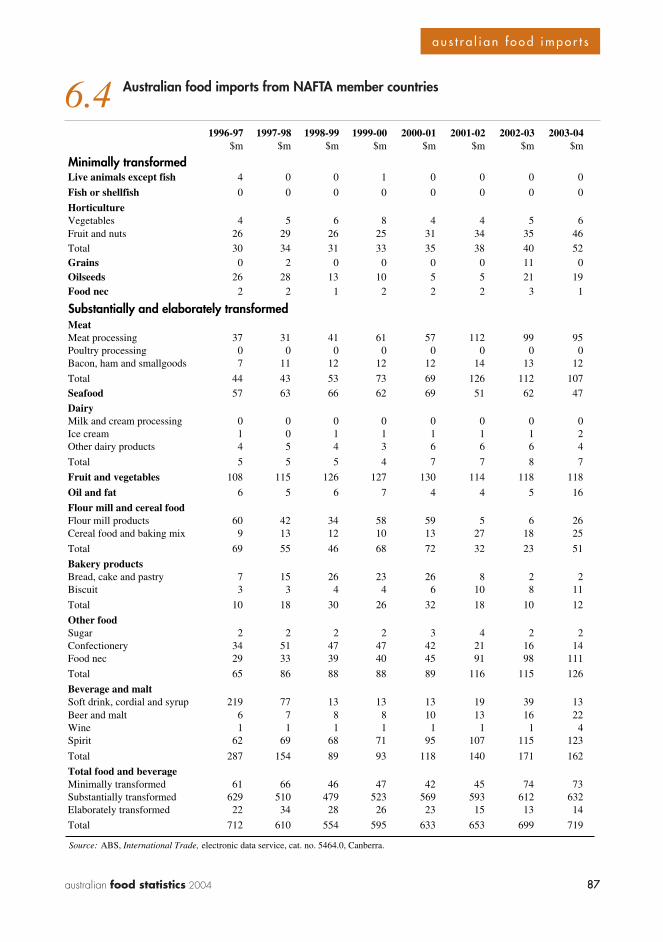
87australian food statistics 2004 87
a u s t r a l i a n f o o d i m p o r t s
6.4 Australian food imports from NAFTA member countries
1996-97 1997-98 1998-99 1999-00 2000-01 2001-02 2002-03 2003-04$m $m $m $m $m $m $m $m
Minimally transformedLive animals except fish 4 0 0 1 0 0 0 0
Fish or shellfish 0 0 0 0 0 0 0 0
HorticultureVegetables 4 5 6 8 4 4 5 6Fruit and nuts 26 29 26 25 31 34 35 46Total 30 34 31 33 35 38 40 52Grains 0 2 0 0 0 0 11 0Oilseeds 26 28 13 10 5 5 21 19Food nec 2 2 1 2 2 2 3 1
Substantially and elaborately transformedMeatMeat processing 37 31 41 61 57 112 99 95Poultry processing 0 0 0 0 0 0 0 0Bacon, ham and smallgoods 7 11 12 12 12 14 13 12
Total 44 43 53 73 69 126 112 107Seafood 57 63 66 62 69 51 62 47
DairyMilk and cream processing 0 0 0 0 0 0 0 0Ice cream 1 0 1 1 1 1 1 2Other dairy products 4 5 4 3 6 6 6 4
Total 5 5 5 4 7 7 8 7
Fruit and vegetables 108 115 126 127 130 114 118 118
Oil and fat 6 5 6 7 4 4 5 16
Flour mill and cereal foodFlour mill products 60 42 34 58 59 5 6 26Cereal food and baking mix 9 13 12 10 13 27 18 25
Total 69 55 46 68 72 32 23 51
Bakery productsBread, cake and pastry 7 15 26 23 26 8 2 2Biscuit 3 3 4 4 6 10 8 11
Total 10 18 30 26 32 18 10 12
Other foodSugar 2 2 2 2 3 4 2 2Confectionery 34 51 47 47 42 21 16 14Food nec 29 33 39 40 45 91 98 111
Total 65 86 88 88 89 116 115 126
Beverage and maltSoft drink, cordial and syrup 219 77 13 13 13 19 39 13Beer and malt 6 7 8 8 10 13 16 22Wine 1 1 1 1 1 1 1 4Spirit 62 69 68 71 95 107 115 123
Total 287 154 89 93 118 140 171 162
Total food and beverageMinimally transformed 61 66 46 47 42 45 74 73Substantially transformed 629 510 479 523 569 593 612 632Elaborately transformed 22 34 28 26 23 15 13 14
Total 712 610 554 595 633 653 699 719
Source: ABS, International Trade, electronic data service, cat. no. 5464.0, Canberra.
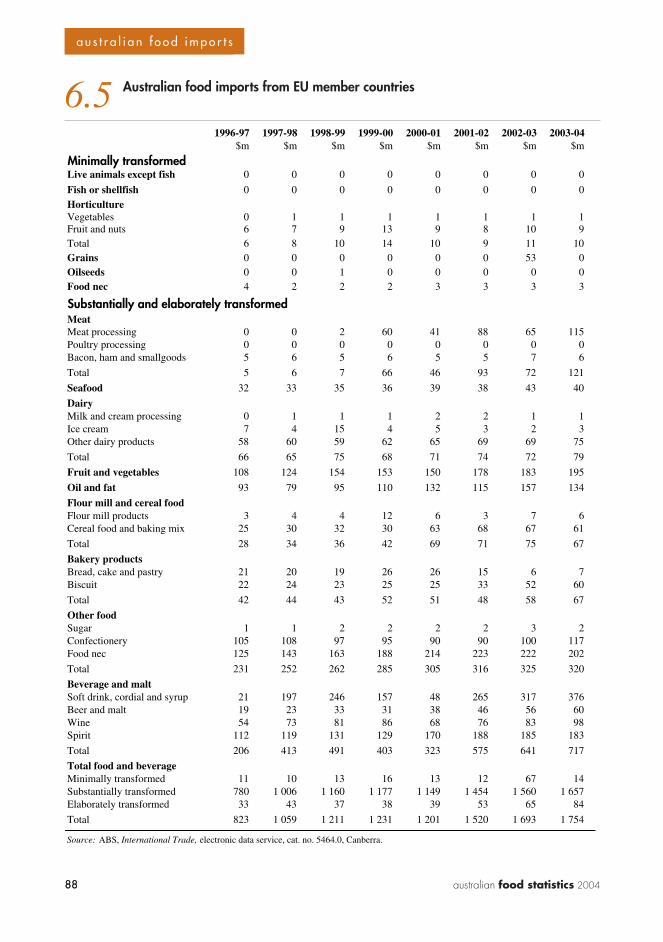
88 australian food statistics 2004
? ? ?
88
a u s t r a l i a n f o o d i m p o r t s
6.5 Australian food imports from EU member countries
1996-97 1997-98 1998-99 1999-00 2000-01 2001-02 2002-03 2003-04$m $m $m $m $m $m $m $m
Minimally transformedLive animals except fish 0 0 0 0 0 0 0 0
Fish or shellfish 0 0 0 0 0 0 0 0HorticultureVegetables 0 1 1 1 1 1 1 1Fruit and nuts 6 7 9 13 9 8 10 9Total 6 8 10 14 10 9 11 10Grains 0 0 0 0 0 0 53 0Oilseeds 0 0 1 0 0 0 0 0Food nec 4 2 2 2 3 3 3 3
Substantially and elaborately transformedMeatMeat processing 0 0 2 60 41 88 65 115Poultry processing 0 0 0 0 0 0 0 0Bacon, ham and smallgoods 5 6 5 6 5 5 7 6
Total 5 6 7 66 46 93 72 121
Seafood 32 33 35 36 39 38 43 40
DairyMilk and cream processing 0 1 1 1 2 2 1 1Ice cream 7 4 15 4 5 3 2 3Other dairy products 58 60 59 62 65 69 69 75
Total 66 65 75 68 71 74 72 79
Fruit and vegetables 108 124 154 153 150 178 183 195
Oil and fat 93 79 95 110 132 115 157 134
Flour mill and cereal foodFlour mill products 3 4 4 12 6 3 7 6Cereal food and baking mix 25 30 32 30 63 68 67 61
Total 28 34 36 42 69 71 75 67
Bakery productsBread, cake and pastry 21 20 19 26 26 15 6 7Biscuit 22 24 23 25 25 33 52 60
Total 42 44 43 52 51 48 58 67
Other foodSugar 1 1 2 2 2 2 3 2Confectionery 105 108 97 95 90 90 100 117Food nec 125 143 163 188 214 223 222 202
Total 231 252 262 285 305 316 325 320
Beverage and maltSoft drink, cordial and syrup 21 197 246 157 48 265 317 376Beer and malt 19 23 33 31 38 46 56 60Wine 54 73 81 86 68 76 83 98Spirit 112 119 131 129 170 188 185 183
Total 206 413 491 403 323 575 641 717
Total food and beverageMinimally transformed 11 10 13 16 13 12 67 14Substantially transformed 780 1 006 1 160 1 177 1 149 1 454 1 560 1 657Elaborately transformed 33 43 37 38 39 53 65 84
Total 823 1 059 1 211 1 231 1 201 1 520 1 693 1 754
Source: ABS, International Trade, electronic data service, cat. no. 5464.0, Canberra.
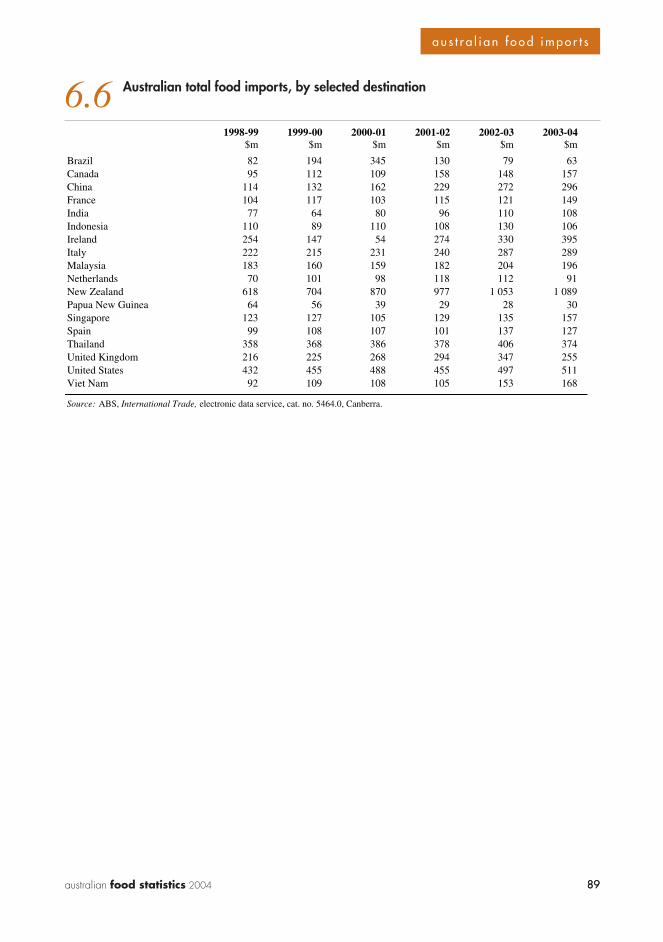
89australian food statistics 2004 89
a u s t r a l i a n f o o d i m p o r t s
6.6 Australian total food imports, by selected destination
1998-99 1999-00 2000-01 2001-02 2002-03 2003-04$m $m $m $m $m $m
Brazil 82 194 345 130 79 63Canada 95 112 109 158 148 157China 114 132 162 229 272 296France 104 117 103 115 121 149India 77 64 80 96 110 108Indonesia 110 89 110 108 130 106Ireland 254 147 54 274 330 395Italy 222 215 231 240 287 289Malaysia 183 160 159 182 204 196Netherlands 70 101 98 118 112 91New Zealand 618 704 870 977 1 053 1 089Papua New Guinea 64 56 39 29 28 30Singapore 123 127 105 129 135 157Spain 99 108 107 101 137 127Thailand 358 368 386 378 406 374United Kingdom 216 225 268 294 347 255United States 432 455 488 455 497 511Viet Nam 92 109 108 105 153 168
Source: ABS, International Trade, electronic data service, cat. no. 5464.0, Canberra.
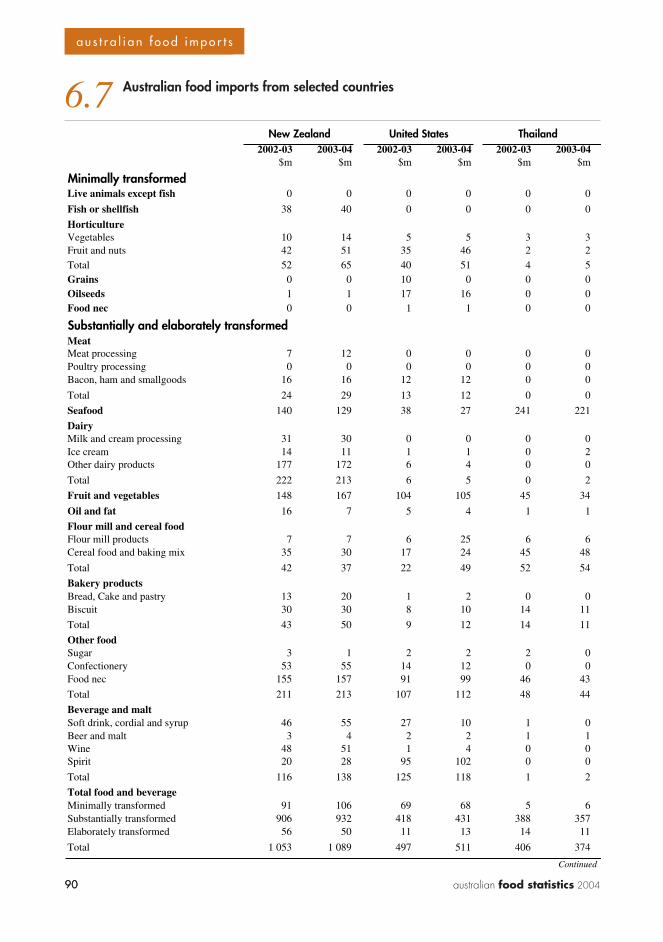
90 australian food statistics 2004
? ? ?
90
a u s t r a l i a n f o o d i m p o r t s
6.7 Australian food imports from selected countries
2002-03 2003-04 2002-03 2003-04 2002-03 2003-04$m $m $m $m $m $m
Minimally transformedLive animals except fish 0 0 0 0 0 0
Fish or shellfish 38 40 0 0 0 0
HorticultureVegetables 10 14 5 5 3 3Fruit and nuts 42 51 35 46 2 2Total 52 65 40 51 4 5Grains 0 0 10 0 0 0Oilseeds 1 1 17 16 0 0Food nec 0 0 1 1 0 0
Substantially and elaborately transformedMeatMeat processing 7 12 0 0 0 0Poultry processing 0 0 0 0 0 0Bacon, ham and smallgoods 16 16 12 12 0 0
Total 24 29 13 12 0 0
Seafood 140 129 38 27 241 221
DairyMilk and cream processing 31 30 0 0 0 0Ice cream 14 11 1 1 0 2Other dairy products 177 172 6 4 0 0
Total 222 213 6 5 0 2
Fruit and vegetables 148 167 104 105 45 34
Oil and fat 16 7 5 4 1 1
Flour mill and cereal foodFlour mill products 7 7 6 25 6 6Cereal food and baking mix 35 30 17 24 45 48
Total 42 37 22 49 52 54
Bakery productsBread, Cake and pastry 13 20 1 2 0 0Biscuit 30 30 8 10 14 11
Total 43 50 9 12 14 11
Other foodSugar 3 1 2 2 2 0Confectionery 53 55 14 12 0 0Food nec 155 157 91 99 46 43
Total 211 213 107 112 48 44
Beverage and maltSoft drink, cordial and syrup 46 55 27 10 1 0Beer and malt 3 4 2 2 1 1Wine 48 51 1 4 0 0Spirit 20 28 95 102 0 0
Total 116 138 125 118 1 2
Total food and beverageMinimally transformed 91 106 69 68 5 6Substantially transformed 906 932 418 431 388 357Elaborately transformed 56 50 11 13 14 11
Total 1 053 1 089 497 511 406 374
Continued
New Zealand United States Thailand

91australian food statistics 2004 91
a u s t r a l i a n f o o d i m p o r t s
6.7 Australian food imports from selected countries continued
2002-03 2003-04 2002-03 2003-04 2002-03 2003-04$m $m $m $m $m $m
Minimally transformedLive animals except fish 0 0 0 0 0 0
Fish or shellfish 0 0 0 0 0 0
HorticultureVegetables 0 0 0 0 0 0Fruit and nuts 0 0 6 5 0 0Total 0 0 6 5 0 0Grains 0 0 0 0 51 0Oilseeds 0 0 0 0 0 0Food nec 0 0 1 1 1 1
Substantially and elaborately transformedMeatMeat processing 0 0 0 0 0 0Poultry processing 0 0 0 0 0 0Bacon, ham and smallgoods 0 0 0 0 0 0
Total 0 0 0 0 0 0
Seafood 0 0 6 7 8 5
DairyMilk and cream processing 0 0 0 0 0 0Ice cream 0 0 0 0 0 0Other dairy products 0 0 18 23 2 2
Total 0 0 18 23 2 2
Fruit and vegetables 0 0 64 67 7 6
Oil and fat 0 0 51 50 1 1
Flour mill and cereal foodFlour mill products 0 0 0 0 0 0Cereal food and baking mix 30 21 27 24 4 6
Total 30 21 27 24 4 6
Bakery productsBread, cake and pastry 0 0 4 5 0 0Biscuit 0 0 3 3 18 19
Total 0 0 7 7 19 19
Other foodSugar 0 0 0 0 1 1Confectionery 0 0 15 18 20 19Food nec 3 1 46 46 71 63
Total 3 2 61 64 91 84
Beverage and maltSoft drink, cordial and syrup 282 332 13 14 1 2Beer and malt 0 0 2 2 18 12Wine 0 0 25 22 1 0Spirit 14 39 7 3 142 116
Total 296 371 46 41 162 131
Total food and beverageMinimally transformed 0 0 7 6 53 1Substantially transformed 329 394 276 278 269 229Elaborately transformed 0 0 4 6 24 25
Total 330 395 287 289 347 255
Continued
Ireland Italy United Kingdom

92 australian food statistics 2004
? ? ?
92
a u s t r a l i a n f o o d i m p o r t s
6.7 Australian food imports from selected countries continued
2002-03 2003-04 2002-03 2003-04 2002-03 2003-04$m $m $m $m $m $m
Minimally transformedLive animals except fish 0 0 0 0 0 0
Fish or shellfish 0 0 0 0 1 0
HorticultureVegetables 0 0 0 0 6 8Fruit and nuts 0 0 0 0 12 12Total 0 0 0 0 18 20Grains 0 0 0 0 0 0Oilseeds 0 0 0 0 14 12Food nec 1 1 0 0 4 4
Substantially and elaborately transformedMeatMeat processing 0 0 0 0 0 0Poultry processing 0 0 0 0 0 0Bacon, ham and smallgoods 0 0 0 0 1 1
Total 0 0 0 0 1 1
Seafood 29 26 7 7 44 69
DairyMilk and cream processing 0 0 0 2 0 0Ice cream 0 0 0 0 3 4Other dairy products 0 0 0 0 0 0
Total 0 0 0 2 4 4
Fruit and vegetables 3 2 8 9 81 77
Oil and fat 101 103 20 18 4 3
Flour mill and cereal foodFlour mill products 1 2 0 0 7 7Cereal food and baking mix 3 3 9 26 14 17
Total 4 5 9 26 22 23
Bakery productsBread, cake and pastry 1 1 3 3 0 3Biscuit 4 5 1 1 16 15
Total 5 7 5 4 16 18
Other foodSugar 1 2 0 0 2 3Confectionery 2 1 6 10 20 21Food nec 55 45 78 77 37 35
Total 58 48 85 87 60 60
Beverage and maltSoft drink, cordial and syrup 3 4 1 1 4 3Beer and malt 0 0 0 1 0 0Wine 0 0 0 1 0 0Spirit 0 0 0 0 0 1
Total 3 4 1 3 4 5
Total food and beverageMinimally transformed 1 1 1 0 38 36Substantially transformed 199 189 133 155 219 245Elaborately transformed 5 5 1 1 16 15
Total 204 196 135 157 272 296
Continued
Malaysia Singapore China
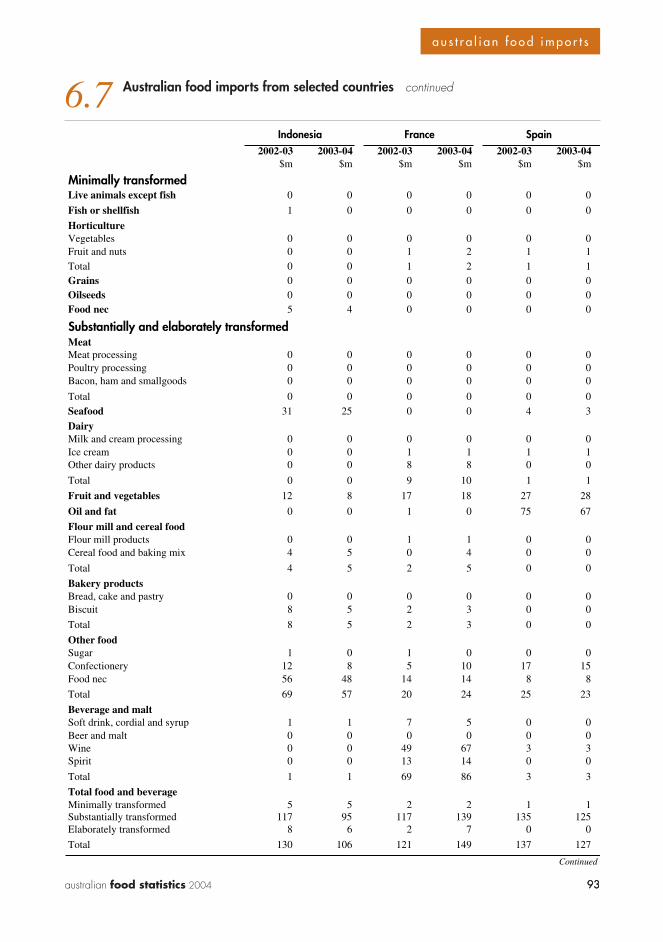
93australian food statistics 2004 93
a u s t r a l i a n f o o d i m p o r t s
6.7 Australian food imports from selected countries continued
2002-03 2003-04 2002-03 2003-04 2002-03 2003-04$m $m $m $m $m $m
Minimally transformedLive animals except fish 0 0 0 0 0 0
Fish or shellfish 1 0 0 0 0 0
HorticultureVegetables 0 0 0 0 0 0Fruit and nuts 0 0 1 2 1 1Total 0 0 1 2 1 1Grains 0 0 0 0 0 0Oilseeds 0 0 0 0 0 0Food nec 5 4 0 0 0 0
Substantially and elaborately transformedMeatMeat processing 0 0 0 0 0 0Poultry processing 0 0 0 0 0 0Bacon, ham and smallgoods 0 0 0 0 0 0
Total 0 0 0 0 0 0Seafood 31 25 0 0 4 3
DairyMilk and cream processing 0 0 0 0 0 0Ice cream 0 0 1 1 1 1Other dairy products 0 0 8 8 0 0
Total 0 0 9 10 1 1
Fruit and vegetables 12 8 17 18 27 28
Oil and fat 0 0 1 0 75 67
Flour mill and cereal foodFlour mill products 0 0 1 1 0 0Cereal food and baking mix 4 5 0 4 0 0
Total 4 5 2 5 0 0
Bakery productsBread, cake and pastry 0 0 0 0 0 0Biscuit 8 5 2 3 0 0
Total 8 5 2 3 0 0
Other foodSugar 1 0 1 0 0 0Confectionery 12 8 5 10 17 15Food nec 56 48 14 14 8 8
Total 69 57 20 24 25 23
Beverage and maltSoft drink, cordial and syrup 1 1 7 5 0 0Beer and malt 0 0 0 0 0 0Wine 0 0 49 67 3 3Spirit 0 0 13 14 0 0
Total 1 1 69 86 3 3
Total food and beverageMinimally transformed 5 5 2 2 1 1Substantially transformed 117 95 117 139 135 125Elaborately transformed 8 6 2 7 0 0
Total 130 106 121 149 137 127
Continued
Indonesia France Spain

94 australian food statistics 2004
? ? ?
94
a u s t r a l i a n f o o d i m p o r t s
6.7 Australian food imports from selected countries continued
2002-03 2003-04 2002-03 2003-04 2002-03 2003-04$m $m $m $m $m $m
Minimally transformedLive animals except fish 0 0 0 0 0 0
Fish or shellfish 0 0 0 0 0 0
HorticultureVegetables 0 0 0 0 0 0Fruit and nuts 0 0 0 0 0 0Total 0 0 0 0 0 0Grains 0 0 0 0 0 0Oilseeds 1 2 0 0 0 0Food nec 1 0 20 18 11 11
Substantially and elaborately transformedMeatMeat processing 99 95 0 0 0 0Poultry processing 0 0 0 0 0 0Bacon, ham and smallgoods 0 0 0 0 0 1
Total 99 95 0 0 0 1
Seafood 24 20 76 85 0 0
DairyMilk and cream processing 0 0 0 0 0 0Ice cream 1 1 0 0 0 0Other dairy products 0 0 0 0 0 0
Total 1 2 0 0 0 0
Fruit and vegetables 5 5 50 58 53 36
Oil and fat 1 12 0 0 1 5
Flour mill and cereal foodFlour mill products 0 1 0 0 0 0Cereal food and baking mix 1 1 1 1 1 1
Total 1 2 1 1 1 1
Bakery productsBread, cake and pastry 0 0 0 0 0 0Biscuit 0 0 1 1 1 1
Total 1 0 1 1 1 1
Other foodSugar 0 0 0 0 0 0Confectionery 2 1 0 0 2 3Food nec 6 11 4 3 10 6
Total 7 12 4 4 12 9
Beverage and maltSoft drink, cordial and syrup 3 3 0 0 0 0Beer and malt 0 0 0 0 0 0Wine 0 0 0 0 0 0Spirit 3 2 0 0 0 0
Total 5 5 0 0 0 0
Total food and beverageMinimally transformed 3 2 20 18 11 11Substantially transformed 144 154 131 148 67 51Elaborately transformed 1 1 1 1 1 1
Total 148 157 153 168 79 63
Continued
Canada Viet Nam Brazil
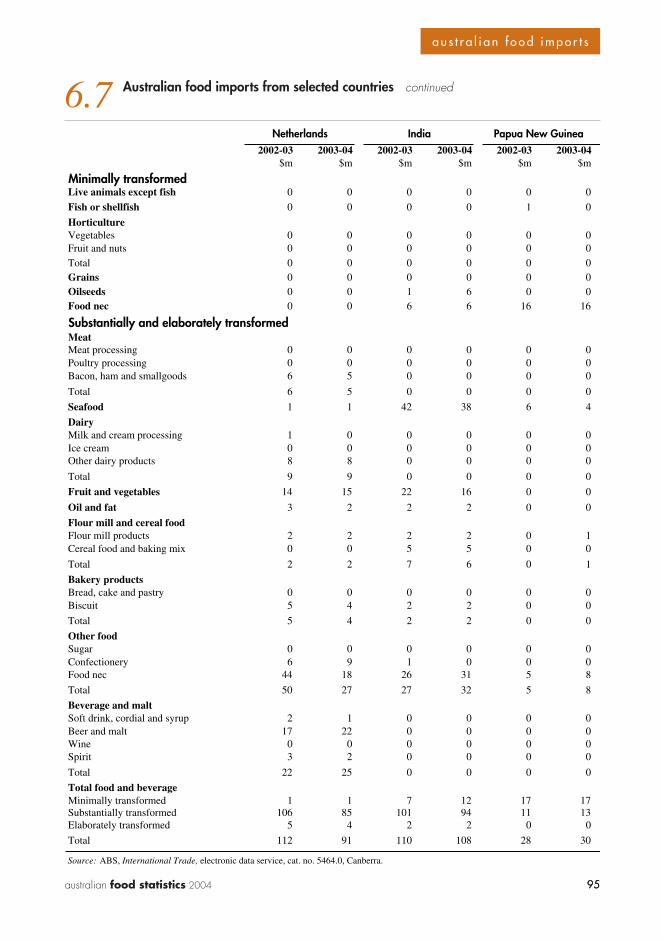
95australian food statistics 2004 95
a u s t r a l i a n f o o d i m p o r t s
6.7 Australian food imports from selected countries continued
2002-03 2003-04 2002-03 2003-04 2002-03 2003-04$m $m $m $m $m $m
Minimally transformedLive animals except fish 0 0 0 0 0 0
Fish or shellfish 0 0 0 0 1 0
HorticultureVegetables 0 0 0 0 0 0Fruit and nuts 0 0 0 0 0 0Total 0 0 0 0 0 0Grains 0 0 0 0 0 0Oilseeds 0 0 1 6 0 0Food nec 0 0 6 6 16 16
Substantially and elaborately transformedMeatMeat processing 0 0 0 0 0 0Poultry processing 0 0 0 0 0 0Bacon, ham and smallgoods 6 5 0 0 0 0
Total 6 5 0 0 0 0
Seafood 1 1 42 38 6 4
DairyMilk and cream processing 1 0 0 0 0 0Ice cream 0 0 0 0 0 0Other dairy products 8 8 0 0 0 0
Total 9 9 0 0 0 0
Fruit and vegetables 14 15 22 16 0 0
Oil and fat 3 2 2 2 0 0
Flour mill and cereal foodFlour mill products 2 2 2 2 0 1Cereal food and baking mix 0 0 5 5 0 0
Total 2 2 7 6 0 1
Bakery productsBread, cake and pastry 0 0 0 0 0 0Biscuit 5 4 2 2 0 0
Total 5 4 2 2 0 0
Other foodSugar 0 0 0 0 0 0Confectionery 6 9 1 0 0 0Food nec 44 18 26 31 5 8
Total 50 27 27 32 5 8
Beverage and maltSoft drink, cordial and syrup 2 1 0 0 0 0Beer and malt 17 22 0 0 0 0Wine 0 0 0 0 0 0Spirit 3 2 0 0 0 0
Total 22 25 0 0 0 0
Total food and beverageMinimally transformed 1 1 7 12 17 17Substantially transformed 106 85 101 94 11 13Elaborately transformed 5 4 2 2 0 0
Total 112 91 110 108 28 30
Netherlands India Papua New Guinea
Source: ABS, International Trade, electronic data service, cat. no. 5464.0, Canberra.
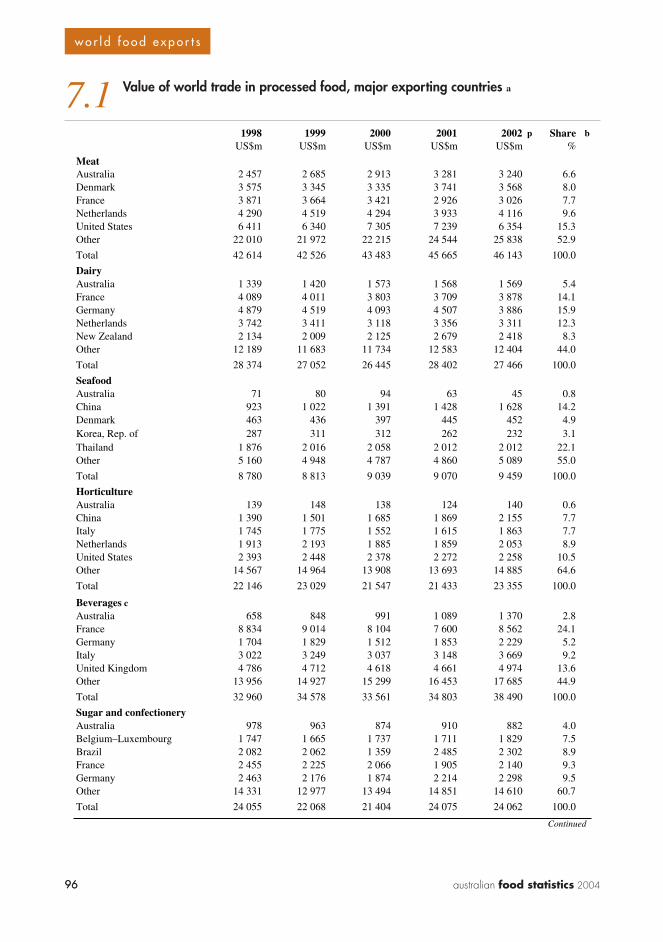
96 australian food statistics 200496
w o r l d f o o d e x p o r t s
1998 1999 2000 2001 2002 p Share bUS$m US$m US$m US$m US$m %
MeatAustralia 2 457 2 685 2 913 3 281 3 240 6.6Denmark 3 575 3 345 3 335 3 741 3 568 8.0France 3 871 3 664 3 421 2 926 3 026 7.7Netherlands 4 290 4 519 4 294 3 933 4 116 9.6United States 6 411 6 340 7 305 7 239 6 354 15.3Other 22 010 21 972 22 215 24 544 25 838 52.9
Total 42 614 42 526 43 483 45 665 46 143 100.0
DairyAustralia 1 339 1 420 1 573 1 568 1 569 5.4France 4 089 4 011 3 803 3 709 3 878 14.1Germany 4 879 4 519 4 093 4 507 3 886 15.9Netherlands 3 742 3 411 3 118 3 356 3 311 12.3New Zealand 2 134 2 009 2 125 2 679 2 418 8.3Other 12 189 11 683 11 734 12 583 12 404 44.0
Total 28 374 27 052 26 445 28 402 27 466 100.0
SeafoodAustralia 71 80 94 63 45 0.8China 923 1 022 1 391 1 428 1 628 14.2Denmark 463 436 397 445 452 4.9Korea, Rep. of 287 311 312 262 232 3.1Thailand 1 876 2 016 2 058 2 012 2 012 22.1Other 5 160 4 948 4 787 4 860 5 089 55.0
Total 8 780 8 813 9 039 9 070 9 459 100.0
HorticultureAustralia 139 148 138 124 140 0.6China 1 390 1 501 1 685 1 869 2 155 7.7Italy 1 745 1 775 1 552 1 615 1 863 7.7Netherlands 1 913 2 193 1 885 1 859 2 053 8.9United States 2 393 2 448 2 378 2 272 2 258 10.5Other 14 567 14 964 13 908 13 693 14 885 64.6
Total 22 146 23 029 21 547 21 433 23 355 100.0
Beverages cAustralia 658 848 991 1 089 1 370 2.8France 8 834 9 014 8 104 7 600 8 562 24.1Germany 1 704 1 829 1 512 1 853 2 229 5.2Italy 3 022 3 249 3 037 3 148 3 669 9.2United Kingdom 4 786 4 712 4 618 4 661 4 974 13.6Other 13 956 14 927 15 299 16 453 17 685 44.9
Total 32 960 34 578 33 561 34 803 38 490 100.0
Sugar and confectioneryAustralia 978 963 874 910 882 4.0Belgium–Luxembourg 1 747 1 665 1 737 1 711 1 829 7.5Brazil 2 082 2 062 1 359 2 485 2 302 8.9France 2 455 2 225 2 066 1 905 2 140 9.3Germany 2 463 2 176 1 874 2 214 2 298 9.5Other 14 331 12 977 13 494 14 851 14 610 60.7
Total 24 055 22 068 21 404 24 075 24 062 100.0
Continued
7.1 Value of world trade in processed food, major exporting countries a
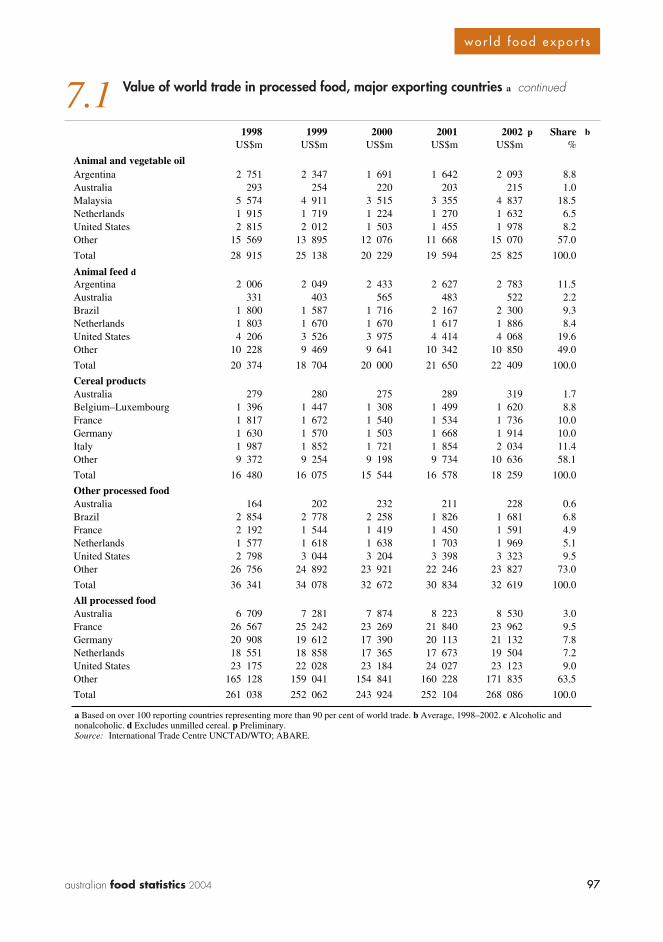
97australian food statistics 2004 97
w o r l d f o o d e x p o r t s
7.1 Value of world trade in processed food, major exporting countries a continued
1998 1999 2000 2001 2002 p Share bUS$m US$m US$m US$m US$m %
Animal and vegetable oilArgentina 2 751 2 347 1 691 1 642 2 093 8.8Australia 293 254 220 203 215 1.0Malaysia 5 574 4 911 3 515 3 355 4 837 18.5Netherlands 1 915 1 719 1 224 1 270 1 632 6.5United States 2 815 2 012 1 503 1 455 1 978 8.2Other 15 569 13 895 12 076 11 668 15 070 57.0
Total 28 915 25 138 20 229 19 594 25 825 100.0
Animal feed dArgentina 2 006 2 049 2 433 2 627 2 783 11.5Australia 331 403 565 483 522 2.2Brazil 1 800 1 587 1 716 2 167 2 300 9.3Netherlands 1 803 1 670 1 670 1 617 1 886 8.4United States 4 206 3 526 3 975 4 414 4 068 19.6Other 10 228 9 469 9 641 10 342 10 850 49.0
Total 20 374 18 704 20 000 21 650 22 409 100.0
Cereal productsAustralia 279 280 275 289 319 1.7Belgium–Luxembourg 1 396 1 447 1 308 1 499 1 620 8.8France 1 817 1 672 1 540 1 534 1 736 10.0Germany 1 630 1 570 1 503 1 668 1 914 10.0Italy 1 987 1 852 1 721 1 854 2 034 11.4Other 9 372 9 254 9 198 9 734 10 636 58.1
Total 16 480 16 075 15 544 16 578 18 259 100.0
Other processed foodAustralia 164 202 232 211 228 0.6Brazil 2 854 2 778 2 258 1 826 1 681 6.8France 2 192 1 544 1 419 1 450 1 591 4.9Netherlands 1 577 1 618 1 638 1 703 1 969 5.1United States 2 798 3 044 3 204 3 398 3 323 9.5Other 26 756 24 892 23 921 22 246 23 827 73.0
Total 36 341 34 078 32 672 30 834 32 619 100.0
All processed foodAustralia 6 709 7 281 7 874 8 223 8 530 3.0France 26 567 25 242 23 269 21 840 23 962 9.5Germany 20 908 19 612 17 390 20 113 21 132 7.8Netherlands 18 551 18 858 17 365 17 673 19 504 7.2United States 23 175 22 028 23 184 24 027 23 123 9.0Other 165 128 159 041 154 841 160 228 171 835 63.5
Total 261 038 252 062 243 924 252 104 268 086 100.0
a Based on over 100 reporting countries representing more than 90 per cent of world trade. b Average, 1998–2002. c Alcoholic and nonalcoholic. d Excludes unmilled cereal. p Preliminary.Source: International Trade Centre UNCTAD/WTO; ABARE.
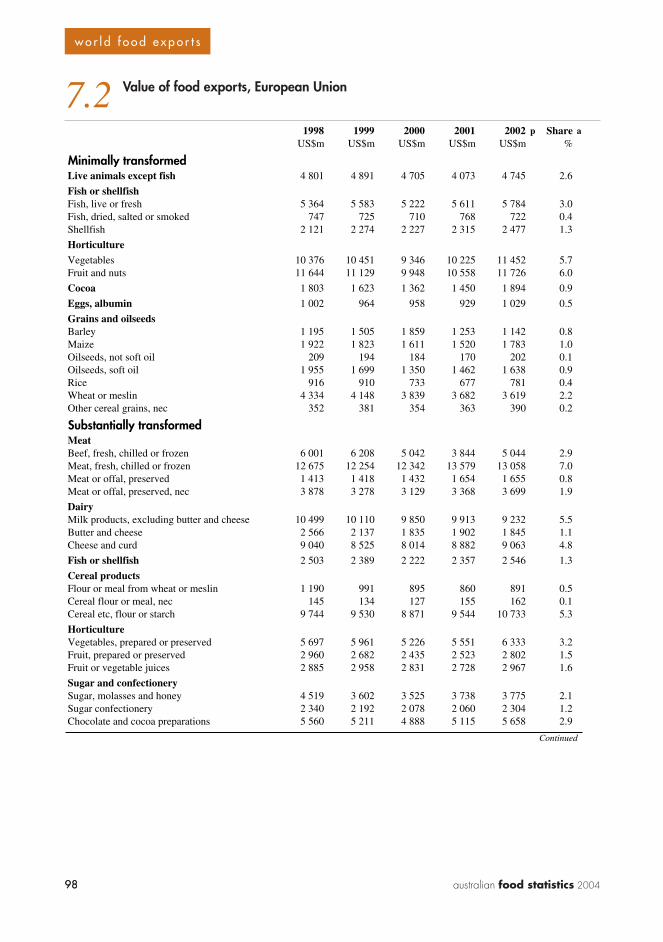
98 australian food statistics 200498
w o r l d f o o d e x p o r t s
7.2 Value of food exports, European Union
1998 1999 2000 2001 2002 p Share aUS$m US$m US$m US$m US$m %
Minimally transformedLive animals except fish 4 801 4 891 4 705 4 073 4 745 2.6
Fish or shellfishFish, live or fresh 5 364 5 583 5 222 5 611 5 784 3.0Fish, dried, salted or smoked 747 725 710 768 722 0.4Shellfish 2 121 2 274 2 227 2 315 2 477 1.3
Horticulture
Vegetables 10 376 10 451 9 346 10 225 11 452 5.7Fruit and nuts 11 644 11 129 9 948 10 558 11 726 6.0
Cocoa 1 803 1 623 1 362 1 450 1 894 0.9
Eggs, albumin 1 002 964 958 929 1 029 0.5
Grains and oilseedsBarley 1 195 1 505 1 859 1 253 1 142 0.8Maize 1 922 1 823 1 611 1 520 1 783 1.0Oilseeds, not soft oil 209 194 184 170 202 0.1Oilseeds, soft oil 1 955 1 699 1 350 1 462 1 638 0.9Rice 916 910 733 677 781 0.4Wheat or meslin 4 334 4 148 3 839 3 682 3 619 2.2Other cereal grains, nec 352 381 354 363 390 0.2
Substantially transformedMeatBeef, fresh, chilled or frozen 6 001 6 208 5 042 3 844 5 044 2.9Meat, fresh, chilled or frozen 12 675 12 254 12 342 13 579 13 058 7.0Meat or offal, preserved 1 413 1 418 1 432 1 654 1 655 0.8Meat or offal, preserved, nec 3 878 3 278 3 129 3 368 3 699 1.9
DairyMilk products, excluding butter and cheese 10 499 10 110 9 850 9 913 9 232 5.5Butter and cheese 2 566 2 137 1 835 1 902 1 845 1.1Cheese and curd 9 040 8 525 8 014 8 882 9 063 4.8
Fish or shellfish 2 503 2 389 2 222 2 357 2 546 1.3
Cereal productsFlour or meal from wheat or meslin 1 190 991 895 860 891 0.5Cereal flour or meal, nec 145 134 127 155 162 0.1Cereal etc, flour or starch 9 744 9 530 8 871 9 544 10 733 5.3
HorticultureVegetables, prepared or preserved 5 697 5 961 5 226 5 551 6 333 3.2Fruit, prepared or preserved 2 960 2 682 2 435 2 523 2 802 1.5Fruit or vegetable juices 2 885 2 958 2 831 2 728 2 967 1.6
Sugar and confectionerySugar, molasses and honey 4 519 3 602 3 525 3 738 3 775 2.1Sugar confectionery 2 340 2 192 2 078 2 060 2 304 1.2Chocolate and cocoa preparations 5 560 5 211 4 888 5 115 5 658 2.9
Continued

99australian food statistics 2004 99
w o r l d f o o d e x p o r t s
7.2 Value of food exports, European Union continued
1998 1999 2000 2001 2002 p Share aUS$m US$m US$m US$m US$m %
Animal and vegetable oilMargarine and shortening 1 155 876 685 717 887 0.5Animal oil or fat 705 569 536 555 662 0.3Vegetable oil or fat, fixed, soft 5 632 5 002 3 990 4 138 5 177 2.6Vegetable oils, fixed, not soft 859 852 619 638 749 0.4Animal or vegetable oils, processed 1 556 1 404 1 255 1 259 1 548 0.8
Other foodCoffee and coffee substitutes 2 995 2 589 2 487 2 340 2 418 1.4Tea and mate 604 500 444 489 537 0.3Spices 446 443 423 445 496 0.2Edible products, nec 9 777 9 321 9 010 9 756 10 974 5.4
BeverageBeverages, nonalcoholic, nec 2 749 3 326 3 340 3 820 4 336 1.9Alcoholic beverages 22 430 23 101 21 240 21 549 24 191 12.4
Animal feed b 8 077 7 394 6 986 7 417 8 068 4.2
Total 189 342 183 258 170 162 175 951 191 192 100.0
a Average, 1998–2002. b Excludes unmilled cereal. p Preliminary.Source: International Trade Centre, UNCTAD/WTO; ABARE.

100 australian food statistics 2004100
w o r l d f o o d e x p o r t s
7.3 Value of food exports, NAFTA
1998 1999 2000 2001 2002 p Share aUS$m US$m US$m US$m US$m %
Minimally transformedLive animals except fish 2 235 2 004 2 452 2 851 2 537 3.3
Fish or shellfishFish, live or fresh 2 274 2 659 2 713 3 063 3 073 3.8Fish, dried, salted or smoked 260 278 287 284 235 0.4Shellfish 1 968 2 335 2 578 2 377 2 579 3.3
HorticultureVegetables 4 537 4 575 4 933 5 164 5 021 6.7Fruit and nuts 4 132 3 957 4 266 4 325 4 491 5.8
Cocoa 106 127 97 124 135 0.2
Eggs, albumin 243 199 201 204 209 0.3
Grains and oilseedsBarley 276 258 364 369 195 0.4Maize 4 696 5 224 4 746 4 779 5 159 6.8Oilseeds, not soft oil 333 239 199 259 332 0.4Oilseeds, soft oil 6 814 6 108 6 764 6 864 6 908 9.2Rice 1 212 948 836 718 771 1.2Wheat or meslin 6 528 5 906 5 936 6 006 5 623 8.3Other cereal grains, nec 776 767 842 895 852 1.1
Substantially transformedMeatBeef, fresh, chilled or frozen 3 049 3 628 4 210 3 884 3 806 5.1Meat, fresh, chilled or frozen 4 442 4 251 5 042 5 676 4 784 6.7Meat or offal, preserved 155 153 206 202 221 0.3Meat or offal, preserved, nec 672 610 701 766 745 1.0
DairyMilk products, excluding butter and cheese 610 614 649 748 605 0.9Butter and cheese 41 26 19 38 30 0.0Cheese and curd 221 220 209 235 226 0.3
Fish or shellfish 620 732 760 775 765 1.0
Cereal productsFlour or meal from wheat or meslin 189 222 196 189 240 0.3Cereal flour or meal, nec 137 145 137 141 180 0.2Cereal etc, flour or starch 2 004 2 116 2 272 2 512 2 761 3.2
HorticultureVegetables, prepared or preserved 1 796 1 941 1 915 1 885 1 876 2.6Fruit, prepared or preserved 712 713 744 760 788 1.0Fruit or vegetable juices 857 906 877 778 802 1.2
Sugar and confectionerySugar, molasses and honey 891 694 634 703 795 1.0Sugar confectionery 660 653 757 774 755 1.0Chocolate and cocoa preparations 692 727 901 1 096 1 058 1.2
Continued

101australian food statistics 2004 101
w o r l d f o o d e x p o r t s
7.3 Value of food exports, NAFTA continued
1998 1999 2000 2001 2002 p Share aUS$m US$m US$m US$m US$m %
Animal and vegetable oilMargarine and shortening 95 104 97 111 114 0.1Animal oil or fat 801 617 472 458 615 0.8Vegetable oil or fat, fixed, soft 2 323 1 510 1 020 961 1 212 1.9Vegetable oils, fixed, not soft 93 118 113 121 141 0.2Animal or vegetable oils, processed 326 322 302 283 386 0.4
Other foodCoffee and coffee substitutes 1 181 1 098 1 144 704 636 1.3Tea and mate 64 86 111 117 114 0.1Spices 92 104 115 103 100 0.1Edible products, nec 3 119 3 442 3 606 4 013 4 022 5.0
BeverageBeverages, nonalcoholic, nec 672 737 696 698 847 1.0Alcoholic beverages 2 619 2 846 3 244 3 447 3 508 4.3
Animal feed b 4 925 4 147 4 622 5 096 4 747 6.5
Total 70 445 69 065 72 986 75 556 75 001 100.0
a Average, 1998–2002. b Excludes unmilled cereal. p Preliminary.Source: International Trade Centre, UNCTAD/WTO.
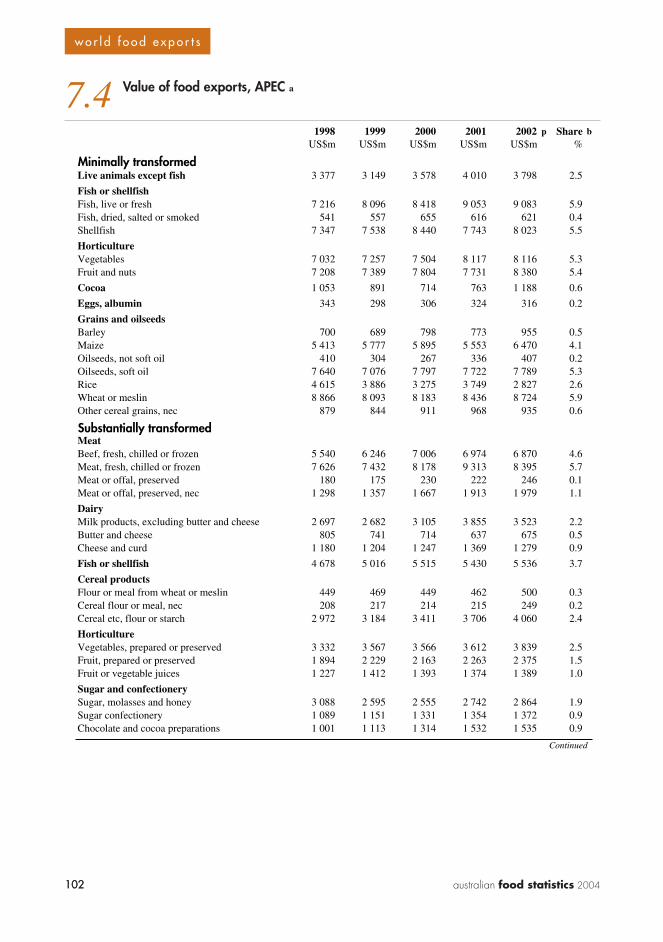
102 australian food statistics 2004102
w o r l d f o o d e x p o r t s
7.4 Value of food exports, APEC a
1998 1999 2000 2001 2002 p Share bUS$m US$m US$m US$m US$m %
Minimally transformedLive animals except fish 3 377 3 149 3 578 4 010 3 798 2.5
Fish or shellfishFish, live or fresh 7 216 8 096 8 418 9 053 9 083 5.9Fish, dried, salted or smoked 541 557 655 616 621 0.4Shellfish 7 347 7 538 8 440 7 743 8 023 5.5
HorticultureVegetables 7 032 7 257 7 504 8 117 8 116 5.3Fruit and nuts 7 208 7 389 7 804 7 731 8 380 5.4
Cocoa 1 053 891 714 763 1 188 0.6
Eggs, albumin 343 298 306 324 316 0.2
Grains and oilseedsBarley 700 689 798 773 955 0.5Maize 5 413 5 777 5 895 5 553 6 470 4.1Oilseeds, not soft oil 410 304 267 336 407 0.2Oilseeds, soft oil 7 640 7 076 7 797 7 722 7 789 5.3Rice 4 615 3 886 3 275 3 749 2 827 2.6Wheat or meslin 8 866 8 093 8 183 8 436 8 724 5.9Other cereal grains, nec 879 844 911 968 935 0.6
Substantially transformedMeatBeef, fresh, chilled or frozen 5 540 6 246 7 006 6 974 6 870 4.6Meat, fresh, chilled or frozen 7 626 7 432 8 178 9 313 8 395 5.7Meat or offal, preserved 180 175 230 222 246 0.1Meat or offal, preserved, nec 1 298 1 357 1 667 1 913 1 979 1.1
DairyMilk products, excluding butter and cheese 2 697 2 682 3 105 3 855 3 523 2.2Butter and cheese 805 741 714 637 675 0.5Cheese and curd 1 180 1 204 1 247 1 369 1 279 0.9
Fish or shellfish 4 678 5 016 5 515 5 430 5 536 3.7
Cereal productsFlour or meal from wheat or meslin 449 469 449 462 500 0.3Cereal flour or meal, nec 208 217 214 215 249 0.2Cereal etc, flour or starch 2 972 3 184 3 411 3 706 4 060 2.4
HorticultureVegetables, prepared or preserved 3 332 3 567 3 566 3 612 3 839 2.5Fruit, prepared or preserved 1 894 2 229 2 163 2 263 2 375 1.5Fruit or vegetable juices 1 227 1 412 1 393 1 374 1 389 1.0
Sugar and confectionerySugar, molasses and honey 3 088 2 595 2 555 2 742 2 864 1.9Sugar confectionery 1 089 1 151 1 331 1 354 1 372 0.9Chocolate and cocoa preparations 1 001 1 113 1 314 1 532 1 535 0.9
Continued
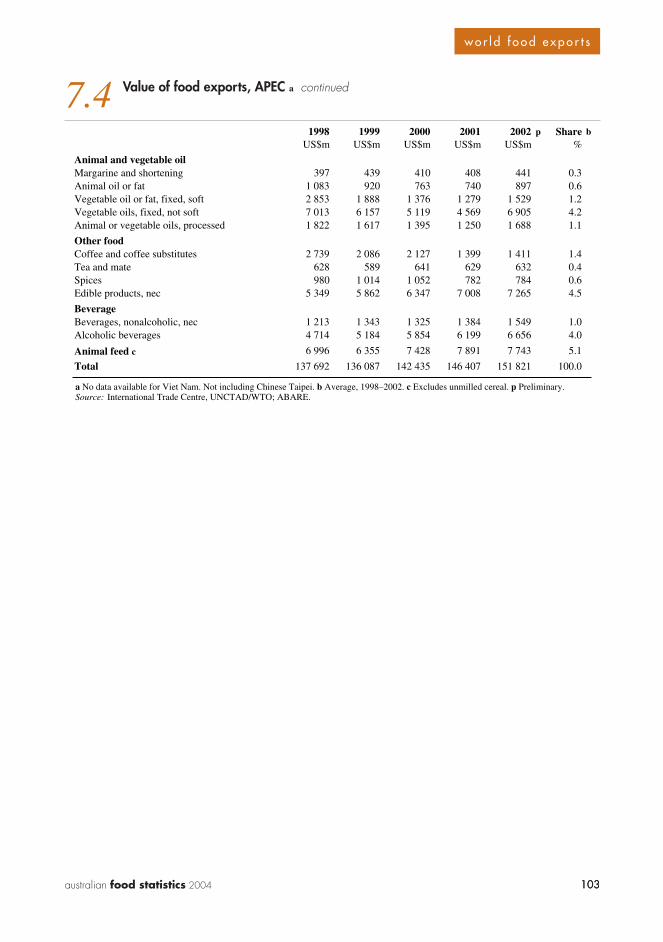
103australian food statistics 2004 103
w o r l d f o o d e x p o r t s
7.4 Value of food exports, APEC a continued
1998 1999 2000 2001 2002 p Share bUS$m US$m US$m US$m US$m %
Animal and vegetable oilMargarine and shortening 397 439 410 408 441 0.3Animal oil or fat 1 083 920 763 740 897 0.6Vegetable oil or fat, fixed, soft 2 853 1 888 1 376 1 279 1 529 1.2Vegetable oils, fixed, not soft 7 013 6 157 5 119 4 569 6 905 4.2Animal or vegetable oils, processed 1 822 1 617 1 395 1 250 1 688 1.1
Other foodCoffee and coffee substitutes 2 739 2 086 2 127 1 399 1 411 1.4Tea and mate 628 589 641 629 632 0.4Spices 980 1 014 1 052 782 784 0.6Edible products, nec 5 349 5 862 6 347 7 008 7 265 4.5
BeverageBeverages, nonalcoholic, nec 1 213 1 343 1 325 1 384 1 549 1.0Alcoholic beverages 4 714 5 184 5 854 6 199 6 656 4.0
Animal feed c 6 996 6 355 7 428 7 891 7 743 5.1
Total 137 692 136 087 142 435 146 407 151 821 100.0
a No data available for Viet Nam. Not including Chinese Taipei. b Average, 1998–2002. c Excludes unmilled cereal. p Preliminary.Source: International Trade Centre, UNCTAD/WTO; ABARE.
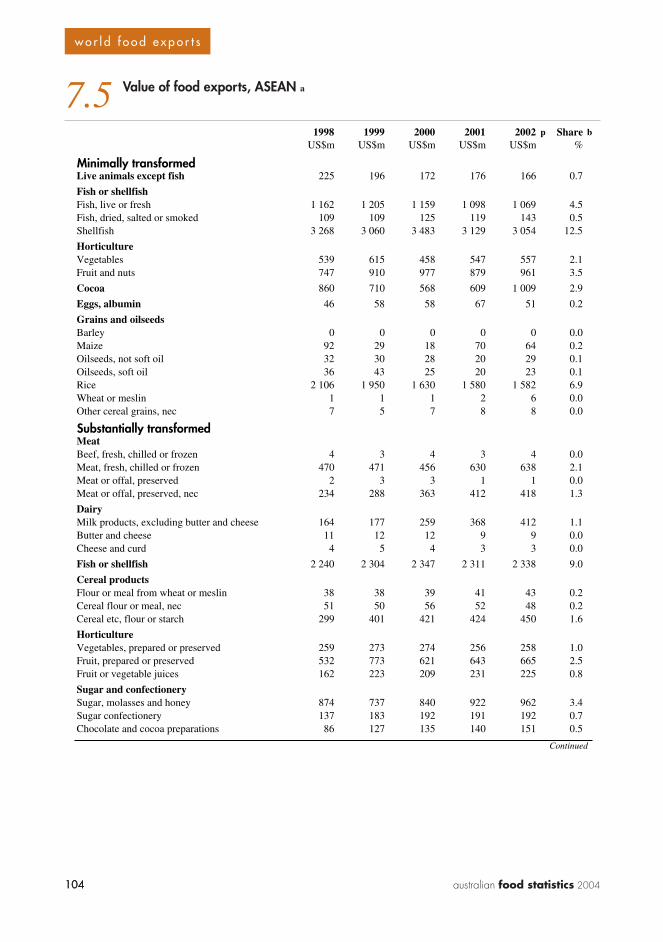
104 australian food statistics 2004104
w o r l d f o o d e x p o r t s
7.5 Value of food exports, ASEAN a
1998 1999 2000 2001 2002 p Share bUS$m US$m US$m US$m US$m %
Minimally transformedLive animals except fish 225 196 172 176 166 0.7
Fish or shellfishFish, live or fresh 1 162 1 205 1 159 1 098 1 069 4.5Fish, dried, salted or smoked 109 109 125 119 143 0.5Shellfish 3 268 3 060 3 483 3 129 3 054 12.5
HorticultureVegetables 539 615 458 547 557 2.1Fruit and nuts 747 910 977 879 961 3.5
Cocoa 860 710 568 609 1 009 2.9
Eggs, albumin 46 58 58 67 51 0.2
Grains and oilseedsBarley 0 0 0 0 0 0.0Maize 92 29 18 70 64 0.2Oilseeds, not soft oil 32 30 28 20 29 0.1Oilseeds, soft oil 36 43 25 20 23 0.1Rice 2 106 1 950 1 630 1 580 1 582 6.9Wheat or meslin 1 1 1 2 6 0.0Other cereal grains, nec 7 5 7 8 8 0.0
Substantially transformedMeatBeef, fresh, chilled or frozen 4 3 4 3 4 0.0Meat, fresh, chilled or frozen 470 471 456 630 638 2.1Meat or offal, preserved 2 3 3 1 1 0.0Meat or offal, preserved, nec 234 288 363 412 418 1.3
DairyMilk products, excluding butter and cheese 164 177 259 368 412 1.1Butter and cheese 11 12 12 9 9 0.0Cheese and curd 4 5 4 3 3 0.0
Fish or shellfish 2 240 2 304 2 347 2 311 2 338 9.0
Cereal productsFlour or meal from wheat or meslin 38 38 39 41 43 0.2Cereal flour or meal, nec 51 50 56 52 48 0.2Cereal etc, flour or starch 299 401 421 424 450 1.6
HorticultureVegetables, prepared or preserved 259 273 274 256 258 1.0Fruit, prepared or preserved 532 773 621 643 665 2.5Fruit or vegetable juices 162 223 209 231 225 0.8
Sugar and confectionerySugar, molasses and honey 874 737 840 922 962 3.4Sugar confectionery 137 183 192 191 192 0.7Chocolate and cocoa preparations 86 127 135 140 151 0.5
Continued

105australian food statistics 2004 105
w o r l d f o o d e x p o r t s
7.5 Value of food exports, ASEAN a continued
1998 1999 2000 2001 2002 p Share bUS$m US$m US$m US$m US$m %
Animal and vegetable oilMargarine and shortening 209 257 233 222 242 0.9Animal oil or fat 8 8 12 11 12 0.0Vegetable oil or fat, fixed, soft 217 212 163 154 164 0.7Vegetable oils, fixed, not soft 6 466 5 976 4 811 4 408 6 719 22.2Animal or vegetable oils, processed 1 366 1 163 963 846 1 189 4.3
Other foodCoffee and coffee substitutes 830 643 527 401 455 2.2Tea and mate 143 122 139 129 139 0.5Spices 706 731 735 424 416 2.4Edible products, nec 679 757 852 928 963 3.3
BeverageBeverages, nonalcoholic, nec 128 159 166 183 180 0.6Alcoholic beverages 417 461 475 443 474 1.8
Animal feed c 551 523 560 547 614 2.2
Total 26 518 25 999 24 577 23 659 27 104 100.0
a No data available for Laos, Myanmar and Viet Nam. b Average, 1998–2002. c Excludes unmilled cereal. p Preliminary.Source: International Trade Centre, UNCTAD/WTO; ABARE.
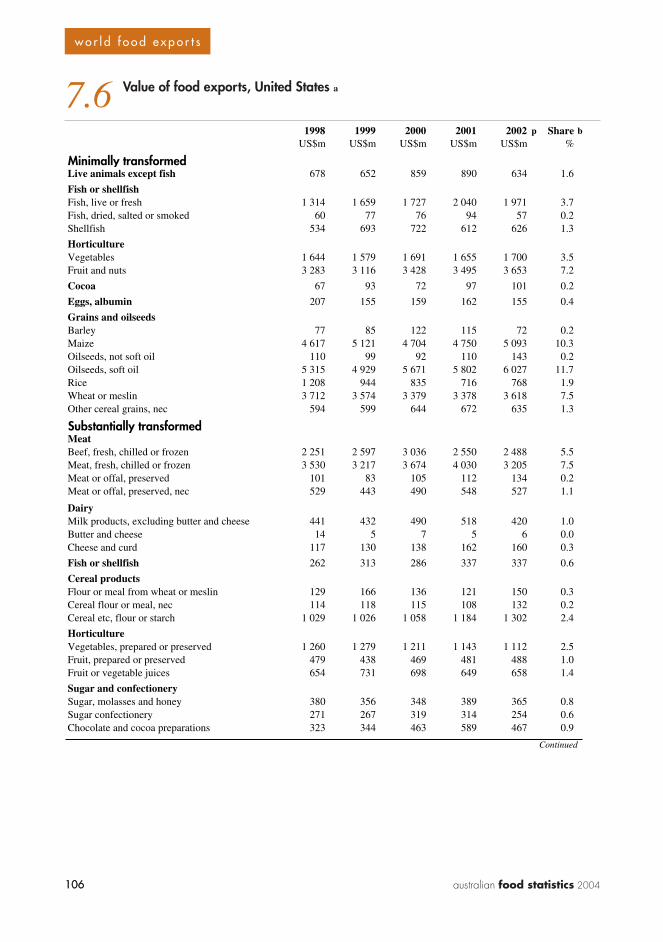
106 australian food statistics 2004106
w o r l d f o o d e x p o r t s
7.6 Value of food exports, United States a
1998 1999 2000 2001 2002 p Share bUS$m US$m US$m US$m US$m %
Minimally transformedLive animals except fish 678 652 859 890 634 1.6
Fish or shellfishFish, live or fresh 1 314 1 659 1 727 2 040 1 971 3.7Fish, dried, salted or smoked 60 77 76 94 57 0.2Shellfish 534 693 722 612 626 1.3
HorticultureVegetables 1 644 1 579 1 691 1 655 1 700 3.5Fruit and nuts 3 283 3 116 3 428 3 495 3 653 7.2
Cocoa 67 93 72 97 101 0.2
Eggs, albumin 207 155 159 162 155 0.4
Grains and oilseedsBarley 77 85 122 115 72 0.2Maize 4 617 5 121 4 704 4 750 5 093 10.3Oilseeds, not soft oil 110 99 92 110 143 0.2Oilseeds, soft oil 5 315 4 929 5 671 5 802 6 027 11.7Rice 1 208 944 835 716 768 1.9Wheat or meslin 3 712 3 574 3 379 3 378 3 618 7.5Other cereal grains, nec 594 599 644 672 635 1.3
Substantially transformedMeatBeef, fresh, chilled or frozen 2 251 2 597 3 036 2 550 2 488 5.5Meat, fresh, chilled or frozen 3 530 3 217 3 674 4 030 3 205 7.5Meat or offal, preserved 101 83 105 112 134 0.2Meat or offal, preserved, nec 529 443 490 548 527 1.1
DairyMilk products, excluding butter and cheese 441 432 490 518 420 1.0Butter and cheese 14 5 7 5 6 0.0Cheese and curd 117 130 138 162 160 0.3
Fish or shellfish 262 313 286 337 337 0.6
Cereal productsFlour or meal from wheat or meslin 129 166 136 121 150 0.3Cereal flour or meal, nec 114 118 115 108 132 0.2Cereal etc, flour or starch 1 029 1 026 1 058 1 184 1 302 2.4
HorticultureVegetables, prepared or preserved 1 260 1 279 1 211 1 143 1 112 2.5Fruit, prepared or preserved 479 438 469 481 488 1.0Fruit or vegetable juices 654 731 698 649 658 1.4
Sugar and confectionerySugar, molasses and honey 380 356 348 389 365 0.8Sugar confectionery 271 267 319 314 254 0.6Chocolate and cocoa preparations 323 344 463 589 467 0.9
Continued
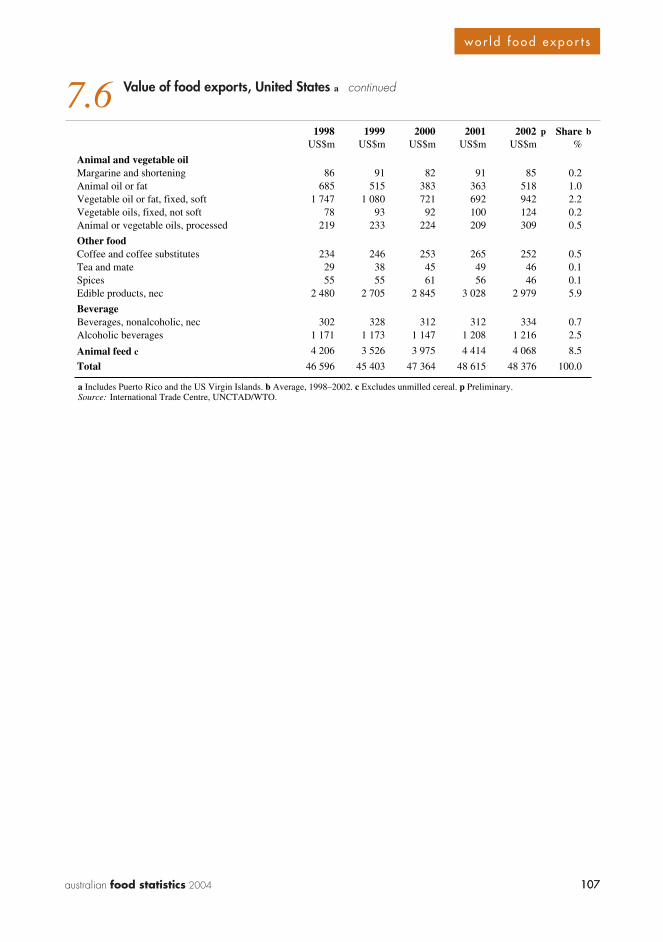
107australian food statistics 2004 107
w o r l d f o o d e x p o r t s
7.6 Value of food exports, United States a continued
1998 1999 2000 2001 2002 p Share bUS$m US$m US$m US$m US$m %
Animal and vegetable oilMargarine and shortening 86 91 82 91 85 0.2Animal oil or fat 685 515 383 363 518 1.0Vegetable oil or fat, fixed, soft 1 747 1 080 721 692 942 2.2Vegetable oils, fixed, not soft 78 93 92 100 124 0.2Animal or vegetable oils, processed 219 233 224 209 309 0.5
Other foodCoffee and coffee substitutes 234 246 253 265 252 0.5Tea and mate 29 38 45 49 46 0.1Spices 55 55 61 56 46 0.1Edible products, nec 2 480 2 705 2 845 3 028 2 979 5.9
BeverageBeverages, nonalcoholic, nec 302 328 312 312 334 0.7Alcoholic beverages 1 171 1 173 1 147 1 208 1 216 2.5
Animal feed c 4 206 3 526 3 975 4 414 4 068 8.5
Total 46 596 45 403 47 364 48 615 48 376 100.0
a Includes Puerto Rico and the US Virgin Islands. b Average, 1998–2002. c Excludes unmilled cereal. p Preliminary.Source: International Trade Centre, UNCTAD/WTO.

108 australian food statistics 2004108
w o r l d f o o d e x p o r t s
7.7 Value of food exports, France
1998 1999 2000 2001 2002 p Share aUS$m US$m US$m US$m US$m %
Minimally transformedLive animals except fish 1 741 1 622 1 453 1 099 1 538 4.4
Fish or shellfishFish, live or fresh 608 543 512 536 591 1.6Fish, dried, salted or smoked 41 44 53 53 48 0.1Shellfish 254 254 247 254 252 0.7
HorticultureVegetables 1 287 1 302 1 073 1 110 1 312 3.6Fruit and nuts 1 391 1 274 1 211 1 256 1 479 3.9
Cocoa 288 283 245 237 321 0.8
Eggs, albumin 141 153 149 137 161 0.4
Grains and oilseedsBarley 585 698 587 489 521 1.7Maize 1 408 1 395 1 225 1 047 1 261 3.7Oilseeds, not soft oil 18 14 13 9 13 0.0Oilseeds, soft oil 947 642 558 433 523 1.8Rice 47 57 44 55 56 0.2Wheat or meslin 1 975 2 256 2 102 1 791 1 646 5.7Other cereal grains, nec 65 57 46 43 47 0.2
Substantially transformedMeatBeef, fresh, chilled or frozen 1 040 1 042 772 388 623 2.3Meat, fresh, chilled or frozen 2 217 1 988 2 053 1 964 1 826 5.9Meat or offal, preserved 101 98 95 127 113 0.3Meat or offal, preserved, nec 514 536 501 448 465 1.4
DairyMilk products, excluding butter and cheese 1 869 1 868 1 800 1 759 1 831 5.4Butter and cheese 205 190 180 177 179 0.5Cheese and curd 2 015 1 952 1 823 1 774 1 867 5.5
Fish or shellfish 169 210 263 134 160 0.6
Cereal productsFlour or meal from wheat or meslin 304 230 221 168 208 0.7Cereal flour or meal, nec 49 44 41 47 55 0.1Cereal etc, flour or starch 1 465 1 397 1 278 1 319 1 473 4.1
HorticultureVegetables, prepared or preserved 668 630 582 629 658 1.9Fruit, prepared or preserved 268 267 249 225 238 0.7Fruit or vegetable juices 133 164 157 108 127 0.4
Sugar and confectionerySugar, molasses and honey 1 470 1 303 1 272 1 120 1 247 3.8Sugar confectionery 203 186 162 162 187 0.5Chocolate and cocoa preparations 782 736 632 622 707 2.0
Continued
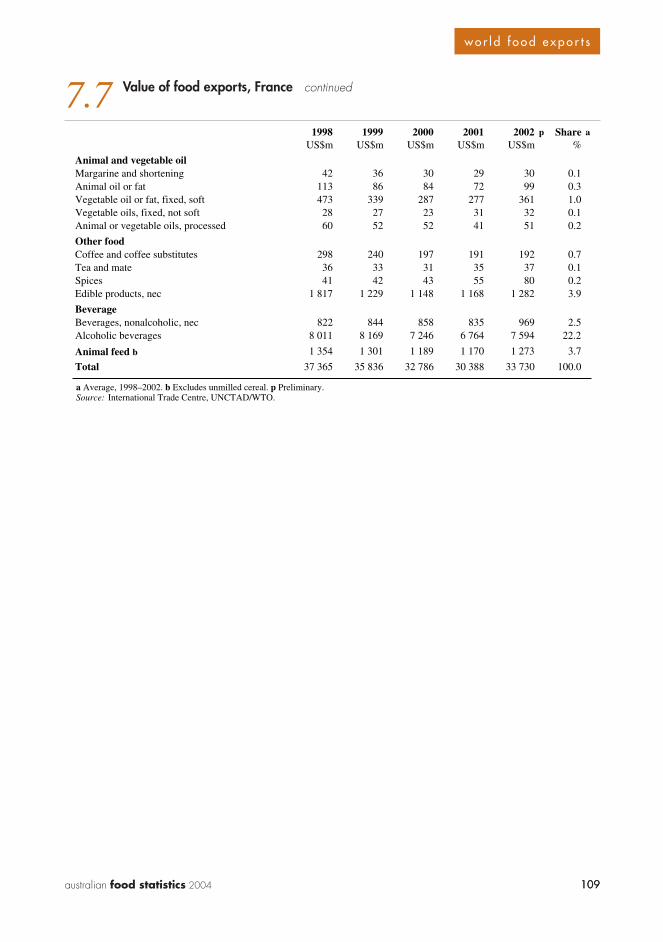
109australian food statistics 2004 109
w o r l d f o o d e x p o r t s
7.7 Value of food exports, France continued
1998 1999 2000 2001 2002 p Share aUS$m US$m US$m US$m US$m %
Animal and vegetable oilMargarine and shortening 42 36 30 29 30 0.1Animal oil or fat 113 86 84 72 99 0.3Vegetable oil or fat, fixed, soft 473 339 287 277 361 1.0Vegetable oils, fixed, not soft 28 27 23 31 32 0.1Animal or vegetable oils, processed 60 52 52 41 51 0.2
Other foodCoffee and coffee substitutes 298 240 197 191 192 0.7Tea and mate 36 33 31 35 37 0.1Spices 41 42 43 55 80 0.2Edible products, nec 1 817 1 229 1 148 1 168 1 282 3.9
BeverageBeverages, nonalcoholic, nec 822 844 858 835 969 2.5Alcoholic beverages 8 011 8 169 7 246 6 764 7 594 22.2
Animal feed b 1 354 1 301 1 189 1 170 1 273 3.7
Total 37 365 35 836 32 786 30 388 33 730 100.0
a Average, 1998–2002. b Excludes unmilled cereal. p Preliminary.Source: International Trade Centre, UNCTAD/WTO.
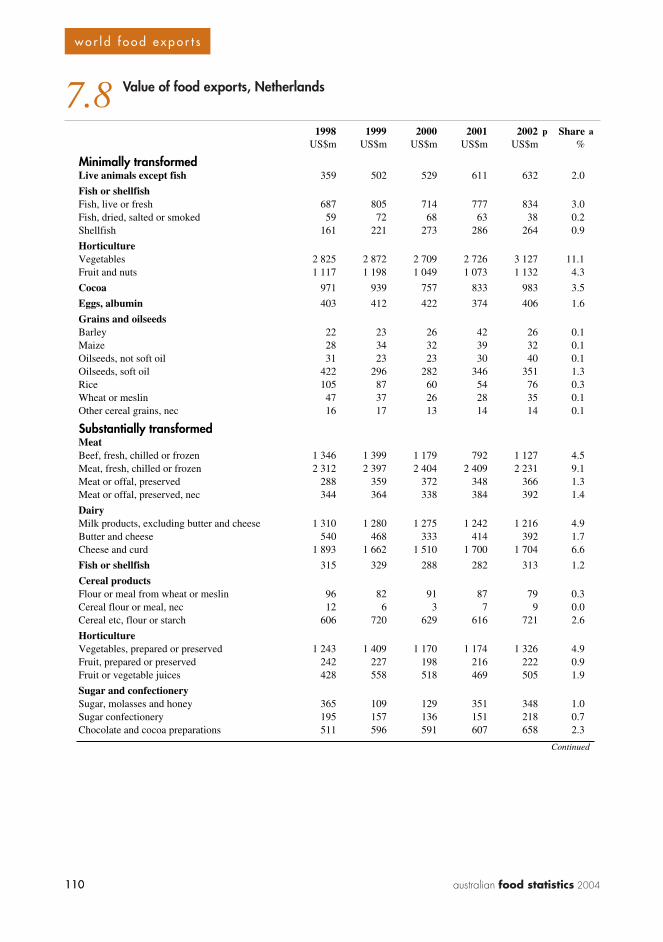
110 australian food statistics 2004110
w o r l d f o o d e x p o r t s
7.8 Value of food exports, Netherlands
1998 1999 2000 2001 2002 p Share aUS$m US$m US$m US$m US$m %
Minimally transformedLive animals except fish 359 502 529 611 632 2.0
Fish or shellfishFish, live or fresh 687 805 714 777 834 3.0Fish, dried, salted or smoked 59 72 68 63 38 0.2Shellfish 161 221 273 286 264 0.9
HorticultureVegetables 2 825 2 872 2 709 2 726 3 127 11.1Fruit and nuts 1 117 1 198 1 049 1 073 1 132 4.3
Cocoa 971 939 757 833 983 3.5
Eggs, albumin 403 412 422 374 406 1.6
Grains and oilseedsBarley 22 23 26 42 26 0.1Maize 28 34 32 39 32 0.1Oilseeds, not soft oil 31 23 23 30 40 0.1Oilseeds, soft oil 422 296 282 346 351 1.3Rice 105 87 60 54 76 0.3Wheat or meslin 47 37 26 28 35 0.1Other cereal grains, nec 16 17 13 14 14 0.1
Substantially transformedMeatBeef, fresh, chilled or frozen 1 346 1 399 1 179 792 1 127 4.5Meat, fresh, chilled or frozen 2 312 2 397 2 404 2 409 2 231 9.1Meat or offal, preserved 288 359 372 348 366 1.3Meat or offal, preserved, nec 344 364 338 384 392 1.4
DairyMilk products, excluding butter and cheese 1 310 1 280 1 275 1 242 1 216 4.9Butter and cheese 540 468 333 414 392 1.7Cheese and curd 1 893 1 662 1 510 1 700 1 704 6.6
Fish or shellfish 315 329 288 282 313 1.2
Cereal productsFlour or meal from wheat or meslin 96 82 91 87 79 0.3Cereal flour or meal, nec 12 6 3 7 9 0.0Cereal etc, flour or starch 606 720 629 616 721 2.6
HorticultureVegetables, prepared or preserved 1 243 1 409 1 170 1 174 1 326 4.9Fruit, prepared or preserved 242 227 198 216 222 0.9Fruit or vegetable juices 428 558 518 469 505 1.9
Sugar and confectionerySugar, molasses and honey 365 109 129 351 348 1.0Sugar confectionery 195 157 136 151 218 0.7Chocolate and cocoa preparations 511 596 591 607 658 2.3
Continued

111australian food statistics 2004 111
w o r l d f o o d e x p o r t s
7.8 Value of food exports, Netherlands continued
1998 1999 2000 2001 2002 p Share aUS$m US$m US$m US$m US$m %
Animal and vegetable oilMargarine and shortening 218 206 148 151 188 0.7Animal oil or fat 82 57 59 53 75 0.3Vegetable oil or fat, fixed, soft 755 643 418 479 634 2.3Vegetable oils, fixed, not soft 439 428 282 271 345 1.4Animal or vegetable oils, processed 421 386 318 317 390 1.4
Other foodCoffee and coffee substitutes 120 122 120 101 123 0.5Tea and mate 26 18 22 33 41 0.1Spices 114 129 116 99 89 0.4Edible products, nec 1 318 1 349 1 380 1 470 1 716 5.6
BeverageBeverages, nonalcoholic, nec 289 348 351 429 440 1.4Alcoholic beverages 922 1 381 1 318 1 405 1 750 5.3
Animal feed b 1 803 1 670 1 670 1 617 1 886 6.7
Total 25 803 26 398 24 350 24 967 27 493 100.0
a Average, 1998–2002. b Excludes unmilled cereal. p Preliminary.Source: International Trade Centre, UNCTAD/WTO.
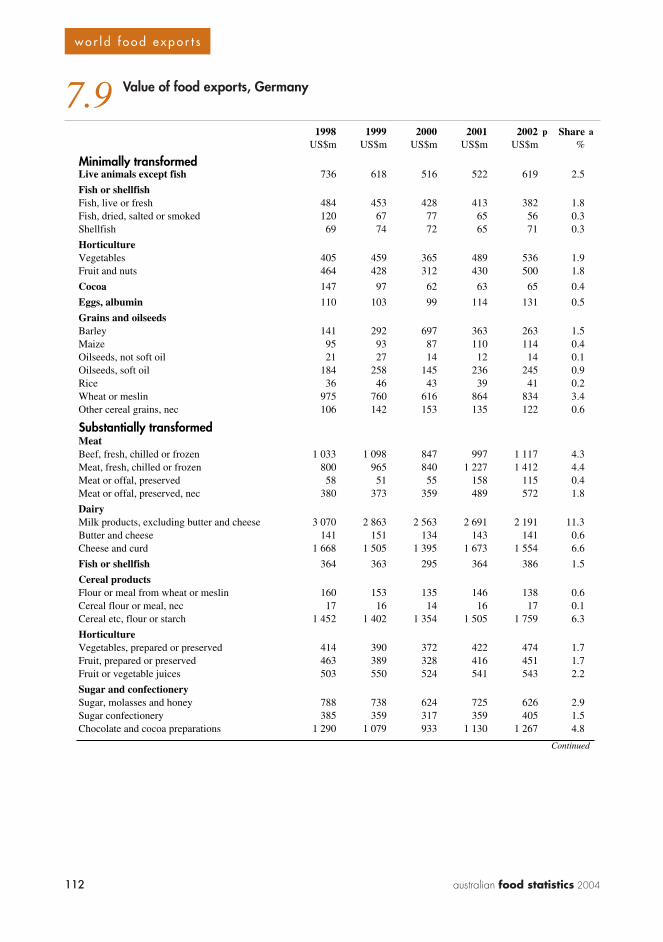
112 australian food statistics 2004112
w o r l d f o o d e x p o r t s
7.9 Value of food exports, Germany
1998 1999 2000 2001 2002 p Share aUS$m US$m US$m US$m US$m %
Minimally transformedLive animals except fish 736 618 516 522 619 2.5
Fish or shellfishFish, live or fresh 484 453 428 413 382 1.8Fish, dried, salted or smoked 120 67 77 65 56 0.3Shellfish 69 74 72 65 71 0.3
HorticultureVegetables 405 459 365 489 536 1.9Fruit and nuts 464 428 312 430 500 1.8
Cocoa 147 97 62 63 65 0.4
Eggs, albumin 110 103 99 114 131 0.5
Grains and oilseedsBarley 141 292 697 363 263 1.5Maize 95 93 87 110 114 0.4Oilseeds, not soft oil 21 27 14 12 14 0.1Oilseeds, soft oil 184 258 145 236 245 0.9Rice 36 46 43 39 41 0.2Wheat or meslin 975 760 616 864 834 3.4Other cereal grains, nec 106 142 153 135 122 0.6
Substantially transformedMeatBeef, fresh, chilled or frozen 1 033 1 098 847 997 1 117 4.3Meat, fresh, chilled or frozen 800 965 840 1 227 1 412 4.4Meat or offal, preserved 58 51 55 158 115 0.4Meat or offal, preserved, nec 380 373 359 489 572 1.8
DairyMilk products, excluding butter and cheese 3 070 2 863 2 563 2 691 2 191 11.3Butter and cheese 141 151 134 143 141 0.6Cheese and curd 1 668 1 505 1 395 1 673 1 554 6.6
Fish or shellfish 364 363 295 364 386 1.5
Cereal productsFlour or meal from wheat or meslin 160 153 135 146 138 0.6Cereal flour or meal, nec 17 16 14 16 17 0.1Cereal etc, flour or starch 1 452 1 402 1 354 1 505 1 759 6.3
HorticultureVegetables, prepared or preserved 414 390 372 422 474 1.7Fruit, prepared or preserved 463 389 328 416 451 1.7Fruit or vegetable juices 503 550 524 541 543 2.2
Sugar and confectionerySugar, molasses and honey 788 738 624 725 626 2.9Sugar confectionery 385 359 317 359 405 1.5Chocolate and cocoa preparations 1 290 1 079 933 1 130 1 267 4.8
Continued
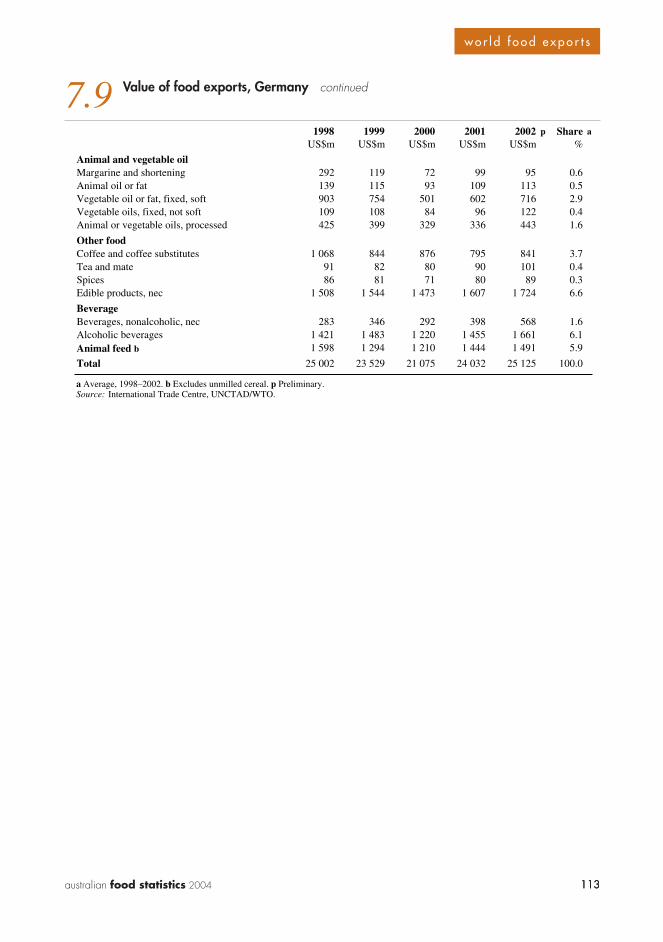
113australian food statistics 2004 113
w o r l d f o o d e x p o r t s
7.9 Value of food exports, Germany continued
1998 1999 2000 2001 2002 p Share aUS$m US$m US$m US$m US$m %
Animal and vegetable oilMargarine and shortening 292 119 72 99 95 0.6Animal oil or fat 139 115 93 109 113 0.5Vegetable oil or fat, fixed, soft 903 754 501 602 716 2.9Vegetable oils, fixed, not soft 109 108 84 96 122 0.4Animal or vegetable oils, processed 425 399 329 336 443 1.6
Other foodCoffee and coffee substitutes 1 068 844 876 795 841 3.7Tea and mate 91 82 80 90 101 0.4Spices 86 81 71 80 89 0.3Edible products, nec 1 508 1 544 1 473 1 607 1 724 6.6
BeverageBeverages, nonalcoholic, nec 283 346 292 398 568 1.6Alcoholic beverages 1 421 1 483 1 220 1 455 1 661 6.1Animal feed b 1 598 1 294 1 210 1 444 1 491 5.9
Total 25 002 23 529 21 075 24 032 25 125 100.0
a Average, 1998–2002. b Excludes unmilled cereal. p Preliminary.Source: International Trade Centre, UNCTAD/WTO.
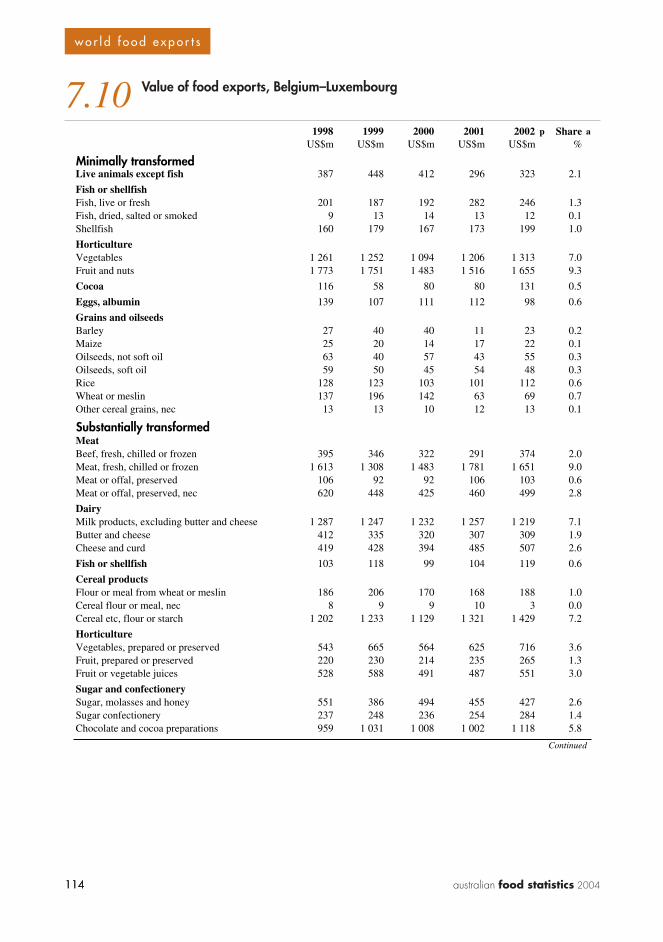
114 australian food statistics 2004114
w o r l d f o o d e x p o r t s
7.10 Value of food exports, Belgium–Luxembourg
1998 1999 2000 2001 2002 p Share aUS$m US$m US$m US$m US$m %
Minimally transformedLive animals except fish 387 448 412 296 323 2.1
Fish or shellfishFish, live or fresh 201 187 192 282 246 1.3Fish, dried, salted or smoked 9 13 14 13 12 0.1Shellfish 160 179 167 173 199 1.0
HorticultureVegetables 1 261 1 252 1 094 1 206 1 313 7.0Fruit and nuts 1 773 1 751 1 483 1 516 1 655 9.3
Cocoa 116 58 80 80 131 0.5
Eggs, albumin 139 107 111 112 98 0.6
Grains and oilseedsBarley 27 40 40 11 23 0.2Maize 25 20 14 17 22 0.1Oilseeds, not soft oil 63 40 57 43 55 0.3Oilseeds, soft oil 59 50 45 54 48 0.3Rice 128 123 103 101 112 0.6Wheat or meslin 137 196 142 63 69 0.7Other cereal grains, nec 13 13 10 12 13 0.1
Substantially transformedMeatBeef, fresh, chilled or frozen 395 346 322 291 374 2.0Meat, fresh, chilled or frozen 1 613 1 308 1 483 1 781 1 651 9.0Meat or offal, preserved 106 92 92 106 103 0.6Meat or offal, preserved, nec 620 448 425 460 499 2.8
DairyMilk products, excluding butter and cheese 1 287 1 247 1 232 1 257 1 219 7.1Butter and cheese 412 335 320 307 309 1.9Cheese and curd 419 428 394 485 507 2.6
Fish or shellfish 103 118 99 104 119 0.6
Cereal productsFlour or meal from wheat or meslin 186 206 170 168 188 1.0Cereal flour or meal, nec 8 9 9 10 3 0.0Cereal etc, flour or starch 1 202 1 233 1 129 1 321 1 429 7.2
HorticultureVegetables, prepared or preserved 543 665 564 625 716 3.6Fruit, prepared or preserved 220 230 214 235 265 1.3Fruit or vegetable juices 528 588 491 487 551 3.0
Sugar and confectionerySugar, molasses and honey 551 386 494 455 427 2.6Sugar confectionery 237 248 236 254 284 1.4Chocolate and cocoa preparations 959 1 031 1 008 1 002 1 118 5.8
Continued

115australian food statistics 2004 115
w o r l d f o o d e x p o r t s
7.10 Value of food exports, Belgium–Luxembourg continued
1998 1999 2000 2001 2002 p Share aUS$m US$m US$m US$m US$m %
Animal and vegetable oilMargarine and shortening 226 190 156 159 228 1.1Animal oil or fat 64 38 37 46 55 0.3Vegetable oil or fat, fixed, soft 480 481 355 377 408 2.4Vegetable oils, fixed, not soft 97 117 81 82 68 0.5Animal or vegetable oils, processed 136 128 187 210 222 1.0
Other foodCoffee and coffee substitutes 470 382 343 281 264 2.0Tea and mate 47 45 46 50 51 0.3Spices 21 22 19 18 19 0.1Edible products, nec 691 698 690 762 794 4.2
BeverageBeverages, nonalcoholic, nec 300 432 425 479 513 2.5Alcoholic beverages 532 648 635 597 611 3.5
Animal feed b 932 946 866 977 923 5.3
Total 17 886 17 523 16 483 17 367 18 242 100.0
a Average, 1998–2002. b Excludes unmilled cereal. p Preliminary.Source: International Trade Centre, UNCTAD/WTO.
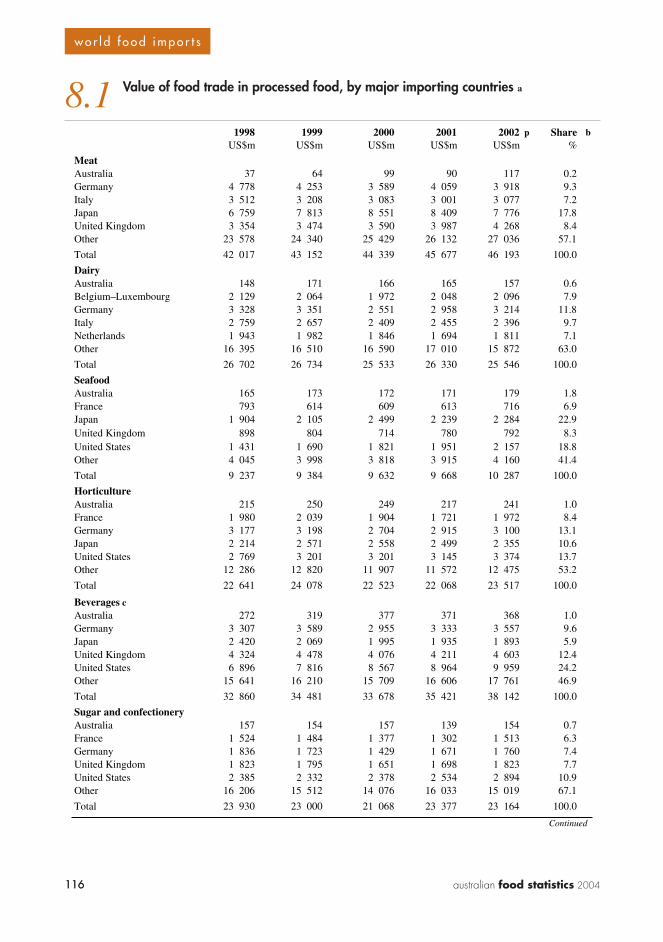
116 australian food statistics 2004116
w o r l d f o o d i m p o r t s
8.1 Value of food trade in processed food, by major importing countries a
1998 1999 2000 2001 2002 p Share bUS$m US$m US$m US$m US$m %
MeatAustralia 37 64 99 90 117 0.2Germany 4 778 4 253 3 589 4 059 3 918 9.3Italy 3 512 3 208 3 083 3 001 3 077 7.2Japan 6 759 7 813 8 551 8 409 7 776 17.8United Kingdom 3 354 3 474 3 590 3 987 4 268 8.4Other 23 578 24 340 25 429 26 132 27 036 57.1
Total 42 017 43 152 44 339 45 677 46 193 100.0
DairyAustralia 148 171 166 165 157 0.6Belgium–Luxembourg 2 129 2 064 1 972 2 048 2 096 7.9Germany 3 328 3 351 2 551 2 958 3 214 11.8Italy 2 759 2 657 2 409 2 455 2 396 9.7Netherlands 1 943 1 982 1 846 1 694 1 811 7.1Other 16 395 16 510 16 590 17 010 15 872 63.0
Total 26 702 26 734 25 533 26 330 25 546 100.0
SeafoodAustralia 165 173 172 171 179 1.8France 793 614 609 613 716 6.9Japan 1 904 2 105 2 499 2 239 2 284 22.9United Kingdom 898 804 714 780 792 8.3United States 1 431 1 690 1 821 1 951 2 157 18.8Other 4 045 3 998 3 818 3 915 4 160 41.4
Total 9 237 9 384 9 632 9 668 10 287 100.0
HorticultureAustralia 215 250 249 217 241 1.0France 1 980 2 039 1 904 1 721 1 972 8.4Germany 3 177 3 198 2 704 2 915 3 100 13.1Japan 2 214 2 571 2 558 2 499 2 355 10.6United States 2 769 3 201 3 201 3 145 3 374 13.7Other 12 286 12 820 11 907 11 572 12 475 53.2
Total 22 641 24 078 22 523 22 068 23 517 100.0
Beverages cAustralia 272 319 377 371 368 1.0Germany 3 307 3 589 2 955 3 333 3 557 9.6Japan 2 420 2 069 1 995 1 935 1 893 5.9United Kingdom 4 324 4 478 4 076 4 211 4 603 12.4United States 6 896 7 816 8 567 8 964 9 959 24.2Other 15 641 16 210 15 709 16 606 17 761 46.9
Total 32 860 34 481 33 678 35 421 38 142 100.0
Sugar and confectioneryAustralia 157 154 157 139 154 0.7France 1 524 1 484 1 377 1 302 1 513 6.3Germany 1 836 1 723 1 429 1 671 1 760 7.4United Kingdom 1 823 1 795 1 651 1 698 1 823 7.7United States 2 385 2 332 2 378 2 534 2 894 10.9Other 16 206 15 512 14 076 16 033 15 019 67.1
Total 23 930 23 000 21 068 23 377 23 164 100.0
Continued
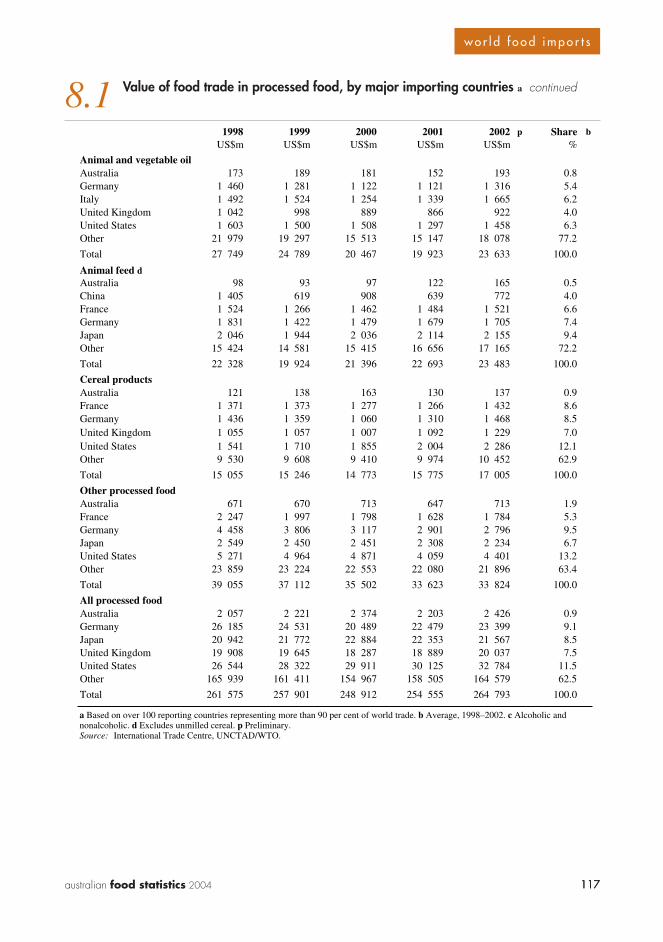
117australian food statistics 2004 117
w o r l d f o o d i m p o r t s
8.1 Value of food trade in processed food, by major importing countries a continued
1998 1999 2000 2001 2002 p Share bUS$m US$m US$m US$m US$m %
Animal and vegetable oilAustralia 173 189 181 152 193 0.8Germany 1 460 1 281 1 122 1 121 1 316 5.4Italy 1 492 1 524 1 254 1 339 1 665 6.2United Kingdom 1 042 998 889 866 922 4.0United States 1 603 1 500 1 508 1 297 1 458 6.3Other 21 979 19 297 15 513 15 147 18 078 77.2
Total 27 749 24 789 20 467 19 923 23 633 100.0
Animal feed dAustralia 98 93 97 122 165 0.5China 1 405 619 908 639 772 4.0France 1 524 1 266 1 462 1 484 1 521 6.6Germany 1 831 1 422 1 479 1 679 1 705 7.4Japan 2 046 1 944 2 036 2 114 2 155 9.4Other 15 424 14 581 15 415 16 656 17 165 72.2
Total 22 328 19 924 21 396 22 693 23 483 100.0
Cereal productsAustralia 121 138 163 130 137 0.9France 1 371 1 373 1 277 1 266 1 432 8.6Germany 1 436 1 359 1 060 1 310 1 468 8.5United Kingdom 1 055 1 057 1 007 1 092 1 229 7.0United States 1 541 1 710 1 855 2 004 2 286 12.1Other 9 530 9 608 9 410 9 974 10 452 62.9
Total 15 055 15 246 14 773 15 775 17 005 100.0
Other processed foodAustralia 671 670 713 647 713 1.9France 2 247 1 997 1 798 1 628 1 784 5.3Germany 4 458 3 806 3 117 2 901 2 796 9.5Japan 2 549 2 450 2 451 2 308 2 234 6.7United States 5 271 4 964 4 871 4 059 4 401 13.2Other 23 859 23 224 22 553 22 080 21 896 63.4
Total 39 055 37 112 35 502 33 623 33 824 100.0
All processed foodAustralia 2 057 2 221 2 374 2 203 2 426 0.9Germany 26 185 24 531 20 489 22 479 23 399 9.1Japan 20 942 21 772 22 884 22 353 21 567 8.5United Kingdom 19 908 19 645 18 287 18 889 20 037 7.5United States 26 544 28 322 29 911 30 125 32 784 11.5Other 165 939 161 411 154 967 158 505 164 579 62.5
Total 261 575 257 901 248 912 254 555 264 793 100.0
a Based on over 100 reporting countries representing more than 90 per cent of world trade. b Average, 1998–2002. c Alcoholic and nonalcoholic. d Excludes unmilled cereal. p Preliminary.Source: International Trade Centre, UNCTAD/WTO.
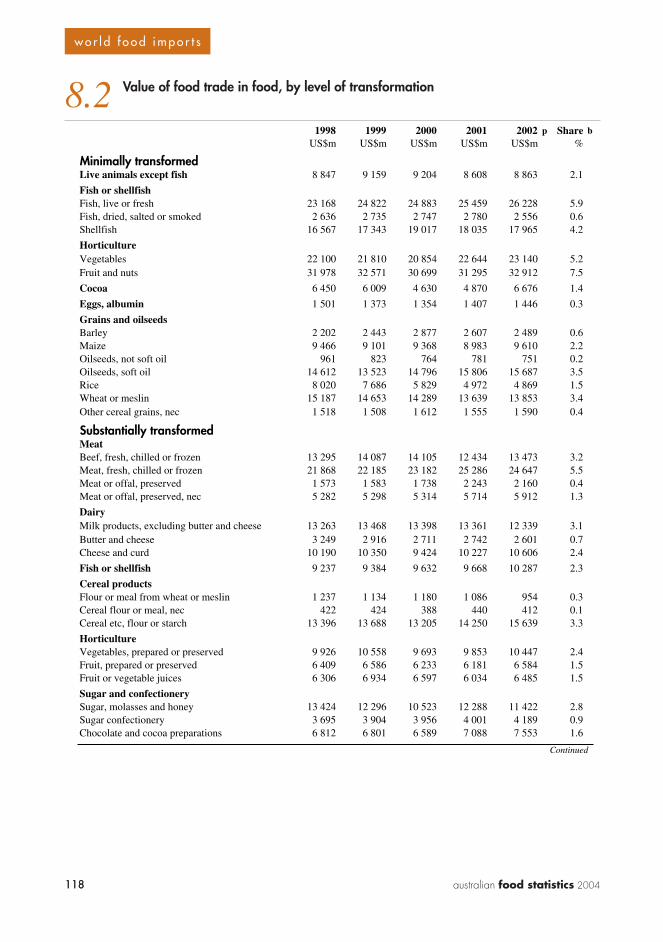
118 australian food statistics 2004118
w o r l d f o o d i m p o r t s
8.2 Value of food trade in food, by level of transformation
1998 1999 2000 2001 2002 p Share bUS$m US$m US$m US$m US$m %
Minimally transformedLive animals except fish 8 847 9 159 9 204 8 608 8 863 2.1
Fish or shellfishFish, live or fresh 23 168 24 822 24 883 25 459 26 228 5.9Fish, dried, salted or smoked 2 636 2 735 2 747 2 780 2 556 0.6Shellfish 16 567 17 343 19 017 18 035 17 965 4.2
HorticultureVegetables 22 100 21 810 20 854 22 644 23 140 5.2Fruit and nuts 31 978 32 571 30 699 31 295 32 912 7.5
Cocoa 6 450 6 009 4 630 4 870 6 676 1.4
Eggs, albumin 1 501 1 373 1 354 1 407 1 446 0.3
Grains and oilseedsBarley 2 202 2 443 2 877 2 607 2 489 0.6Maize 9 466 9 101 9 368 8 983 9 610 2.2Oilseeds, not soft oil 961 823 764 781 751 0.2Oilseeds, soft oil 14 612 13 523 14 796 15 806 15 687 3.5Rice 8 020 7 686 5 829 4 972 4 869 1.5Wheat or meslin 15 187 14 653 14 289 13 639 13 853 3.4Other cereal grains, nec 1 518 1 508 1 612 1 555 1 590 0.4
Substantially transformedMeatBeef, fresh, chilled or frozen 13 295 14 087 14 105 12 434 13 473 3.2Meat, fresh, chilled or frozen 21 868 22 185 23 182 25 286 24 647 5.5Meat or offal, preserved 1 573 1 583 1 738 2 243 2 160 0.4Meat or offal, preserved, nec 5 282 5 298 5 314 5 714 5 912 1.3
DairyMilk products, excluding butter and cheese 13 263 13 468 13 398 13 361 12 339 3.1Butter and cheese 3 249 2 916 2 711 2 742 2 601 0.7Cheese and curd 10 190 10 350 9 424 10 227 10 606 2.4
Fish or shellfish 9 237 9 384 9 632 9 668 10 287 2.3
Cereal productsFlour or meal from wheat or meslin 1 237 1 134 1 180 1 086 954 0.3Cereal flour or meal, nec 422 424 388 440 412 0.1Cereal etc, flour or starch 13 396 13 688 13 205 14 250 15 639 3.3
HorticultureVegetables, prepared or preserved 9 926 10 558 9 693 9 853 10 447 2.4Fruit, prepared or preserved 6 409 6 586 6 233 6 181 6 584 1.5Fruit or vegetable juices 6 306 6 934 6 597 6 034 6 485 1.5
Sugar and confectionerySugar, molasses and honey 13 424 12 296 10 523 12 288 11 422 2.8Sugar confectionery 3 695 3 904 3 956 4 001 4 189 0.9Chocolate and cocoa preparations 6 812 6 801 6 589 7 088 7 553 1.6
Continued
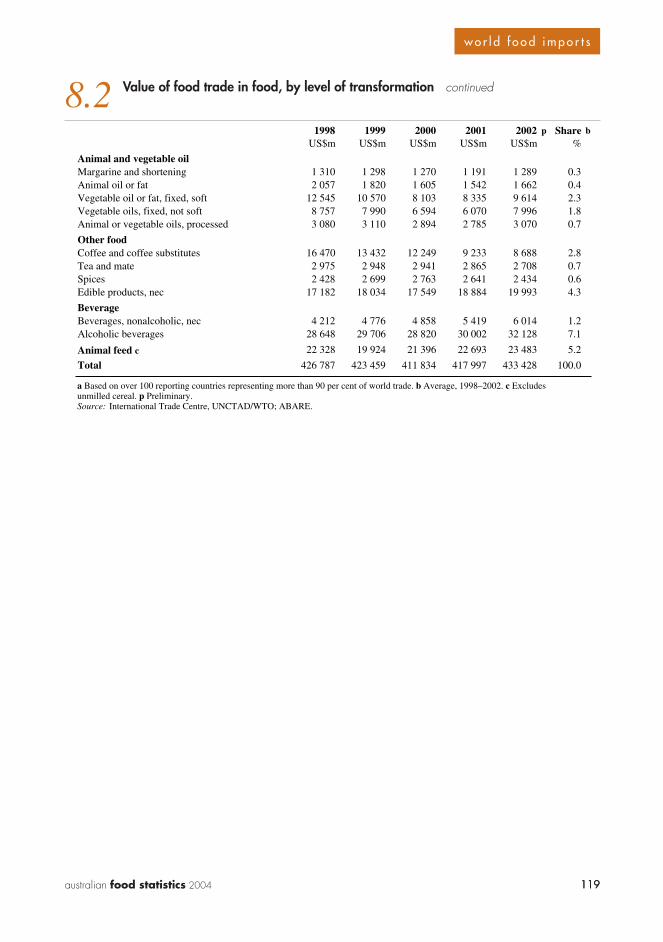
119australian food statistics 2004 119
w o r l d f o o d i m p o r t s
8.2 Value of food trade in food, by level of transformation continued
1998 1999 2000 2001 2002 p Share bUS$m US$m US$m US$m US$m %
Animal and vegetable oilMargarine and shortening 1 310 1 298 1 270 1 191 1 289 0.3Animal oil or fat 2 057 1 820 1 605 1 542 1 662 0.4Vegetable oil or fat, fixed, soft 12 545 10 570 8 103 8 335 9 614 2.3Vegetable oils, fixed, not soft 8 757 7 990 6 594 6 070 7 996 1.8Animal or vegetable oils, processed 3 080 3 110 2 894 2 785 3 070 0.7
Other foodCoffee and coffee substitutes 16 470 13 432 12 249 9 233 8 688 2.8Tea and mate 2 975 2 948 2 941 2 865 2 708 0.7Spices 2 428 2 699 2 763 2 641 2 434 0.6Edible products, nec 17 182 18 034 17 549 18 884 19 993 4.3
BeverageBeverages, nonalcoholic, nec 4 212 4 776 4 858 5 419 6 014 1.2Alcoholic beverages 28 648 29 706 28 820 30 002 32 128 7.1
Animal feed c 22 328 19 924 21 396 22 693 23 483 5.2
Total 426 787 423 459 411 834 417 997 433 428 100.0
a Based on over 100 reporting countries representing more than 90 per cent of world trade. b Average, 1998–2002. c Excludes unmilled cereal. p Preliminary.Source: International Trade Centre, UNCTAD/WTO; ABARE.
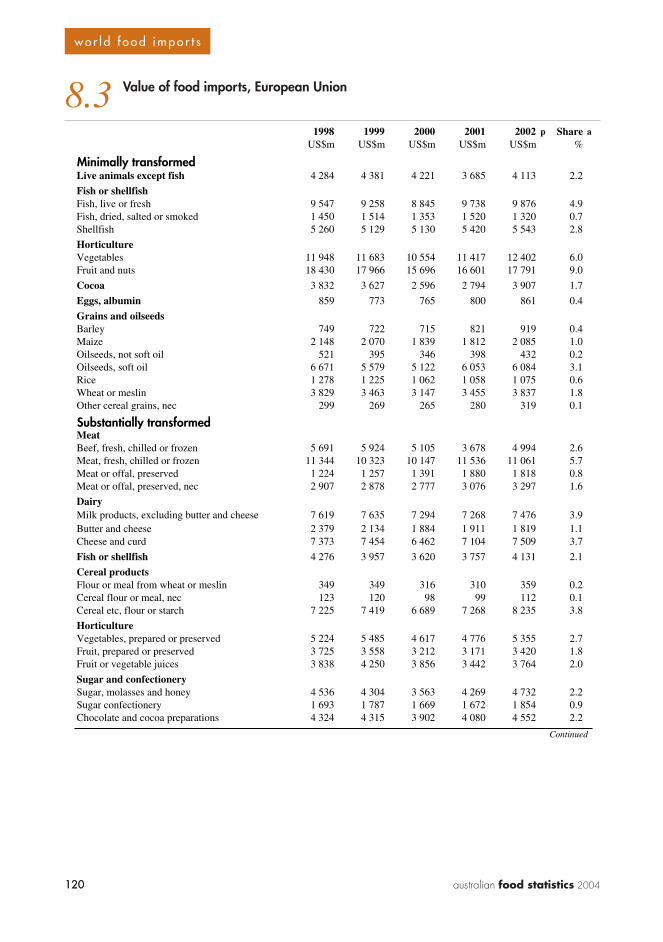
120 australian food statistics 2004120
w o r l d f o o d i m p o r t s
8.3 Value of food imports, European Union
1998 1999 2000 2001 2002 p Share aUS$m US$m US$m US$m US$m %
Minimally transformedLive animals except fish 4 284 4 381 4 221 3 685 4 113 2.2
Fish or shellfishFish, live or fresh 9 547 9 258 8 845 9 738 9 876 4.9Fish, dried, salted or smoked 1 450 1 514 1 353 1 520 1 320 0.7Shellfish 5 260 5 129 5 130 5 420 5 543 2.8
HorticultureVegetables 11 948 11 683 10 554 11 417 12 402 6.0Fruit and nuts 18 430 17 966 15 696 16 601 17 791 9.0
Cocoa 3 832 3 627 2 596 2 794 3 907 1.7
Eggs, albumin 859 773 765 800 861 0.4
Grains and oilseedsBarley 749 722 715 821 919 0.4Maize 2 148 2 070 1 839 1 812 2 085 1.0Oilseeds, not soft oil 521 395 346 398 432 0.2Oilseeds, soft oil 6 671 5 579 5 122 6 053 6 084 3.1Rice 1 278 1 225 1 062 1 058 1 075 0.6Wheat or meslin 3 829 3 463 3 147 3 455 3 837 1.8Other cereal grains, nec 299 269 265 280 319 0.1
Substantially transformedMeatBeef, fresh, chilled or frozen 5 691 5 924 5 105 3 678 4 994 2.6Meat, fresh, chilled or frozen 11 344 10 323 10 147 11 536 11 061 5.7Meat or offal, preserved 1 224 1 257 1 391 1 880 1 818 0.8Meat or offal, preserved, nec 2 907 2 878 2 777 3 076 3 297 1.6
DairyMilk products, excluding butter and cheese 7 619 7 635 7 294 7 268 7 476 3.9Butter and cheese 2 379 2 134 1 884 1 911 1 819 1.1Cheese and curd 7 373 7 454 6 462 7 104 7 509 3.7
Fish or shellfish 4 276 3 957 3 620 3 757 4 131 2.1
Cereal productsFlour or meal from wheat or meslin 349 349 316 310 359 0.2Cereal flour or meal, nec 123 120 98 99 112 0.1Cereal etc, flour or starch 7 225 7 419 6 689 7 268 8 235 3.8
HorticultureVegetables, prepared or preserved 5 224 5 485 4 617 4 776 5 355 2.7Fruit, prepared or preserved 3 725 3 558 3 212 3 171 3 420 1.8Fruit or vegetable juices 3 838 4 250 3 856 3 442 3 764 2.0
Sugar and confectionerySugar, molasses and honey 4 536 4 304 3 563 4 269 4 732 2.2Sugar confectionery 1 693 1 787 1 669 1 672 1 854 0.9Chocolate and cocoa preparations 4 324 4 315 3 902 4 080 4 552 2.2
Continued

121australian food statistics 2004 121
w o r l d f o o d i m p o r t s
8.3 Value of food imports, European Union continued
1998 1999 2000 2001 2002 p Share aUS$m US$m US$m US$m US$m %
Animal and vegetable oilMargarine and shortening 664 657 565 555 665 0.3Animal oil or fat 746 590 512 542 573 0.3Vegetable oil or fat, fixed, soft 4 094 3 909 2 922 3 292 4 141 1.9Vegetable oils, fixed, not soft 2 972 2 589 2 134 2 019 2 439 1.3Animal or vegetable oils, processed 1 683 1 550 1 368 1 388 1 579 0.8
Other foodCoffee and coffee substitutes 8 906 6 997 6 085 4 787 4 445 3.3Tea and mate 1 007 905 845 847 884 0.5Spices 873 883 855 781 798 0.4Edible products, nec 8 094 8 225 7 201 7 641 8 540 4.1
BeverageBeverages, nonalcoholic, nec 2 071 2 513 2 379 2 735 3 228 1.3Alcoholic beverages 14 480 15 117 13 371 14 012 15 300 7.5
Animal feed b 11 812 10 581 10 758 11 689 12 143 5.9
Total 202 356 195 721 177 253 185 441 199 788 100.0
a Average, 1998–2002. b Excludes unmilled cereal. p Preliminary.Source: International Trade Centre, UNCTAD/WTO. ABARE.
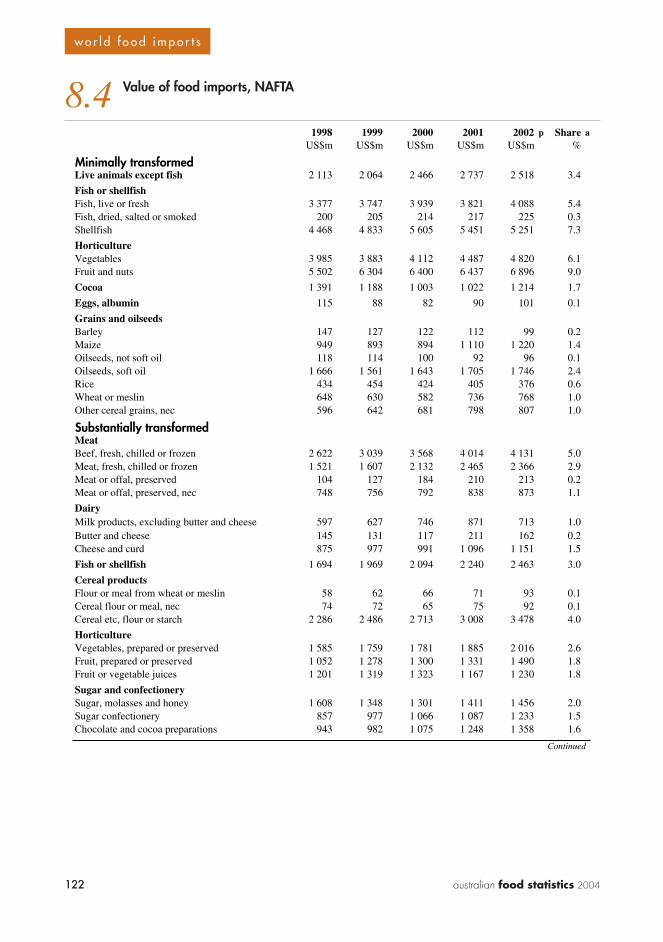
122 australian food statistics 2004122
w o r l d f o o d i m p o r t s
8.4 Value of food imports, NAFTA
1998 1999 2000 2001 2002 p Share aUS$m US$m US$m US$m US$m %
Minimally transformedLive animals except fish 2 113 2 064 2 466 2 737 2 518 3.4
Fish or shellfishFish, live or fresh 3 377 3 747 3 939 3 821 4 088 5.4Fish, dried, salted or smoked 200 205 214 217 225 0.3Shellfish 4 468 4 833 5 605 5 451 5 251 7.3
HorticultureVegetables 3 985 3 883 4 112 4 487 4 820 6.1Fruit and nuts 5 502 6 304 6 400 6 437 6 896 9.0
Cocoa 1 391 1 188 1 003 1 022 1 214 1.7
Eggs, albumin 115 88 82 90 101 0.1
Grains and oilseedsBarley 147 127 122 112 99 0.2Maize 949 893 894 1 110 1 220 1.4Oilseeds, not soft oil 118 114 100 92 96 0.1Oilseeds, soft oil 1 666 1 561 1 643 1 705 1 746 2.4Rice 434 454 424 405 376 0.6Wheat or meslin 648 630 582 736 768 1.0Other cereal grains, nec 596 642 681 798 807 1.0
Substantially transformedMeatBeef, fresh, chilled or frozen 2 622 3 039 3 568 4 014 4 131 5.0Meat, fresh, chilled or frozen 1 521 1 607 2 132 2 465 2 366 2.9Meat or offal, preserved 104 127 184 210 213 0.2Meat or offal, preserved, nec 748 756 792 838 873 1.1
DairyMilk products, excluding butter and cheese 597 627 746 871 713 1.0Butter and cheese 145 131 117 211 162 0.2Cheese and curd 875 977 991 1 096 1 151 1.5
Fish or shellfish 1 694 1 969 2 094 2 240 2 463 3.0
Cereal productsFlour or meal from wheat or meslin 58 62 66 71 93 0.1Cereal flour or meal, nec 74 72 65 75 92 0.1Cereal etc, flour or starch 2 286 2 486 2 713 3 008 3 478 4.0
HorticultureVegetables, prepared or preserved 1 585 1 759 1 781 1 885 2 016 2.6Fruit, prepared or preserved 1 052 1 278 1 300 1 331 1 490 1.8Fruit or vegetable juices 1 201 1 319 1 323 1 167 1 230 1.8
Sugar and confectionerySugar, molasses and honey 1 608 1 348 1 301 1 411 1 456 2.0Sugar confectionery 857 977 1 066 1 087 1 233 1.5Chocolate and cocoa preparations 943 982 1 075 1 248 1 358 1.6
Continued

123australian food statistics 2004 123
w o r l d f o o d i m p o r t s
8.4 Value of food imports, NAFTA continued
1998 1999 2000 2001 2002 p Share aUS$m US$m US$m US$m US$m %
Animal and vegetable oilMargarine and shortening 52 59 63 80 87 0.1Animal oil or fat 284 248 216 218 240 0.3Vegetable oil or fat, fixed, soft 1 172 1 052 1 073 953 1 161 1.5Vegetable oils, fixed, not soft 758 703 651 491 562 0.9Animal or vegetable oils, processed 282 270 290 269 305 0.4
Other foodCoffee and coffee substitutes 4 186 3 543 3 302 2 217 2 208 4.4Tea and mate 314 312 324 347 354 0.5Spices 595 638 668 640 663 0.9Edible products, nec 2 163 2 524 2 715 3 039 3 509 4.0
BeverageBeverages, nonalcoholic, nec 836 913 989 1 072 1 171 1.4Alcoholic beverages 7 211 8 203 8 955 9 417 10 390 12.6
Animal feed b 1 588 1 514 1 636 1 756 1 878 2.4
Total 63 120 66 230 70 461 72 945 77 269 100.0
a Average, 1998–2002. b Excludes unmilled cereal. p Preliminary.Source: International Trade Centre, UNCTAD/WTO.
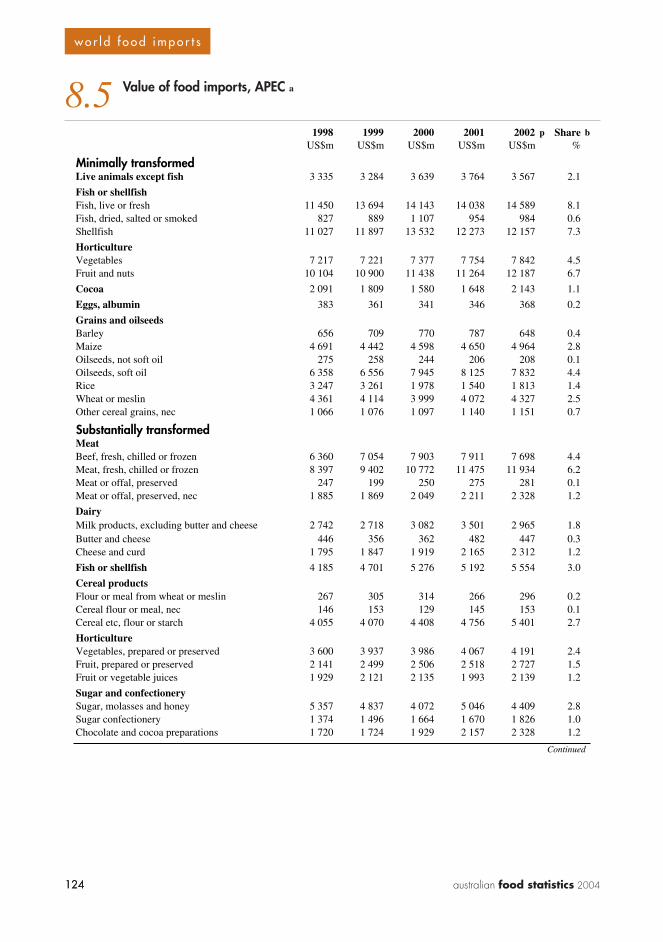
124 australian food statistics 2004124
w o r l d f o o d i m p o r t s
8.5 Value of food imports, APEC a
1998 1999 2000 2001 2002 p Share bUS$m US$m US$m US$m US$m %
Minimally transformedLive animals except fish 3 335 3 284 3 639 3 764 3 567 2.1
Fish or shellfishFish, live or fresh 11 450 13 694 14 143 14 038 14 589 8.1Fish, dried, salted or smoked 827 889 1 107 954 984 0.6Shellfish 11 027 11 897 13 532 12 273 12 157 7.3
HorticultureVegetables 7 217 7 221 7 377 7 754 7 842 4.5Fruit and nuts 10 104 10 900 11 438 11 264 12 187 6.7
Cocoa 2 091 1 809 1 580 1 648 2 143 1.1
Eggs, albumin 383 361 341 346 368 0.2
Grains and oilseedsBarley 656 709 770 787 648 0.4Maize 4 691 4 442 4 598 4 650 4 964 2.8Oilseeds, not soft oil 275 258 244 206 208 0.1Oilseeds, soft oil 6 358 6 556 7 945 8 125 7 832 4.4Rice 3 247 3 261 1 978 1 540 1 813 1.4Wheat or meslin 4 361 4 114 3 999 4 072 4 327 2.5Other cereal grains, nec 1 066 1 076 1 097 1 140 1 151 0.7
Substantially transformedMeatBeef, fresh, chilled or frozen 6 360 7 054 7 903 7 911 7 698 4.4Meat, fresh, chilled or frozen 8 397 9 402 10 772 11 475 11 934 6.2Meat or offal, preserved 247 199 250 275 281 0.1Meat or offal, preserved, nec 1 885 1 869 2 049 2 211 2 328 1.2
DairyMilk products, excluding butter and cheese 2 742 2 718 3 082 3 501 2 965 1.8Butter and cheese 446 356 362 482 447 0.3Cheese and curd 1 795 1 847 1 919 2 165 2 312 1.2
Fish or shellfish 4 185 4 701 5 276 5 192 5 554 3.0
Cereal productsFlour or meal from wheat or meslin 267 305 314 266 296 0.2Cereal flour or meal, nec 146 153 129 145 153 0.1Cereal etc, flour or starch 4 055 4 070 4 408 4 756 5 401 2.7
HorticultureVegetables, prepared or preserved 3 600 3 937 3 986 4 067 4 191 2.4Fruit, prepared or preserved 2 141 2 499 2 506 2 518 2 727 1.5Fruit or vegetable juices 1 929 2 121 2 135 1 993 2 139 1.2
Sugar and confectionerySugar, molasses and honey 5 357 4 837 4 072 5 046 4 409 2.8Sugar confectionery 1 374 1 496 1 664 1 670 1 826 1.0Chocolate and cocoa preparations 1 720 1 724 1 929 2 157 2 328 1.2
Continued
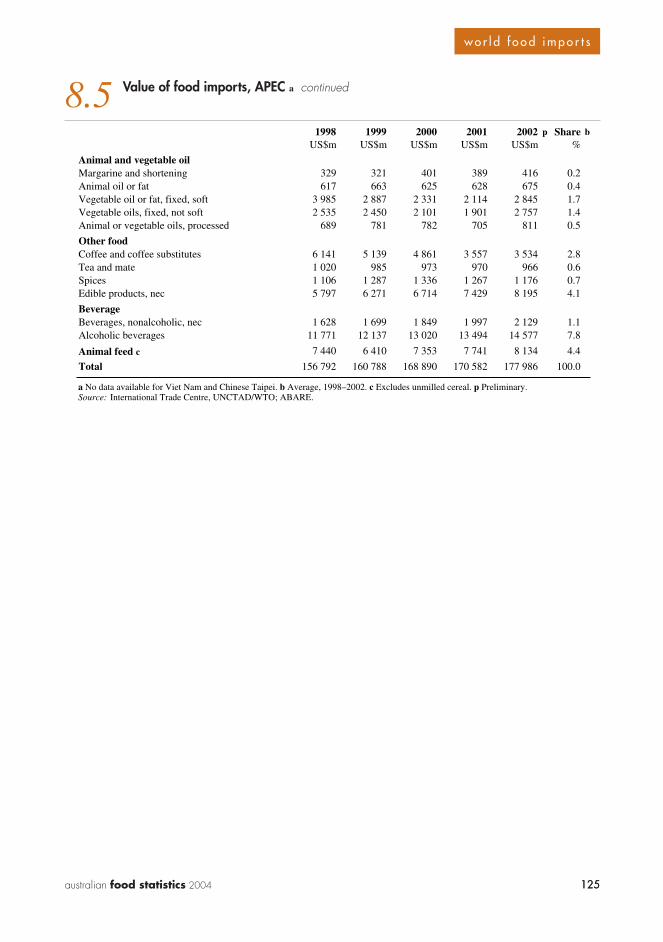
125australian food statistics 2004 125
w o r l d f o o d i m p o r t s
8.5 Value of food imports, APEC a continued
1998 1999 2000 2001 2002 p Share bUS$m US$m US$m US$m US$m %
Animal and vegetable oilMargarine and shortening 329 321 401 389 416 0.2Animal oil or fat 617 663 625 628 675 0.4Vegetable oil or fat, fixed, soft 3 985 2 887 2 331 2 114 2 845 1.7Vegetable oils, fixed, not soft 2 535 2 450 2 101 1 901 2 757 1.4Animal or vegetable oils, processed 689 781 782 705 811 0.5
Other foodCoffee and coffee substitutes 6 141 5 139 4 861 3 557 3 534 2.8Tea and mate 1 020 985 973 970 966 0.6Spices 1 106 1 287 1 336 1 267 1 176 0.7Edible products, nec 5 797 6 271 6 714 7 429 8 195 4.1
BeverageBeverages, nonalcoholic, nec 1 628 1 699 1 849 1 997 2 129 1.1Alcoholic beverages 11 771 12 137 13 020 13 494 14 577 7.8
Animal feed c 7 440 6 410 7 353 7 741 8 134 4.4
Total 156 792 160 788 168 890 170 582 177 986 100.0
a No data available for Viet Nam and Chinese Taipei. b Average, 1998–2002. c Excludes unmilled cereal. p Preliminary.Source: International Trade Centre, UNCTAD/WTO; ABARE.
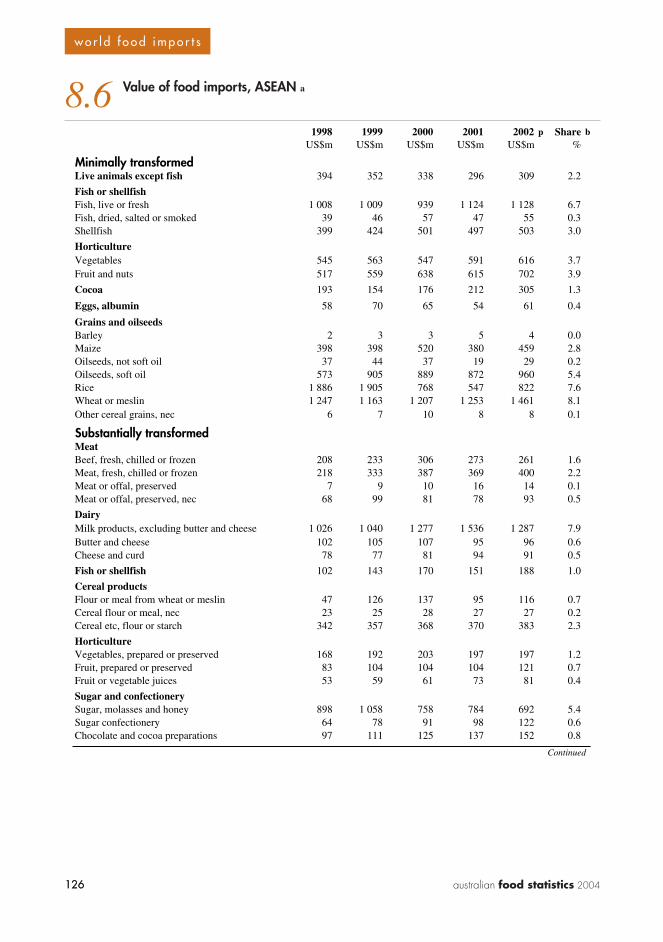
126 australian food statistics 2004126
w o r l d f o o d i m p o r t s
8.6 Value of food imports, ASEAN a
1998 1999 2000 2001 2002 p Share bUS$m US$m US$m US$m US$m %
Minimally transformedLive animals except fish 394 352 338 296 309 2.2
Fish or shellfishFish, live or fresh 1 008 1 009 939 1 124 1 128 6.7Fish, dried, salted or smoked 39 46 57 47 55 0.3Shellfish 399 424 501 497 503 3.0
HorticultureVegetables 545 563 547 591 616 3.7Fruit and nuts 517 559 638 615 702 3.9
Cocoa 193 154 176 212 305 1.3
Eggs, albumin 58 70 65 54 61 0.4
Grains and oilseedsBarley 2 3 3 5 4 0.0Maize 398 398 520 380 459 2.8Oilseeds, not soft oil 37 44 37 19 29 0.2Oilseeds, soft oil 573 905 889 872 960 5.4Rice 1 886 1 905 768 547 822 7.6Wheat or meslin 1 247 1 163 1 207 1 253 1 461 8.1Other cereal grains, nec 6 7 10 8 8 0.1
Substantially transformedMeatBeef, fresh, chilled or frozen 208 233 306 273 261 1.6Meat, fresh, chilled or frozen 218 333 387 369 400 2.2Meat or offal, preserved 7 9 10 16 14 0.1Meat or offal, preserved, nec 68 99 81 78 93 0.5
DairyMilk products, excluding butter and cheese 1 026 1 040 1 277 1 536 1 287 7.9Butter and cheese 102 105 107 95 96 0.6Cheese and curd 78 77 81 94 91 0.5
Fish or shellfish 102 143 170 151 188 1.0
Cereal productsFlour or meal from wheat or meslin 47 126 137 95 116 0.7Cereal flour or meal, nec 23 25 28 27 27 0.2Cereal etc, flour or starch 342 357 368 370 383 2.3
HorticultureVegetables, prepared or preserved 168 192 203 197 197 1.2Fruit, prepared or preserved 83 104 104 104 121 0.7Fruit or vegetable juices 53 59 61 73 81 0.4
Sugar and confectionerySugar, molasses and honey 898 1 058 758 784 692 5.4Sugar confectionery 64 78 91 98 122 0.6Chocolate and cocoa preparations 97 111 125 137 152 0.8
Continued
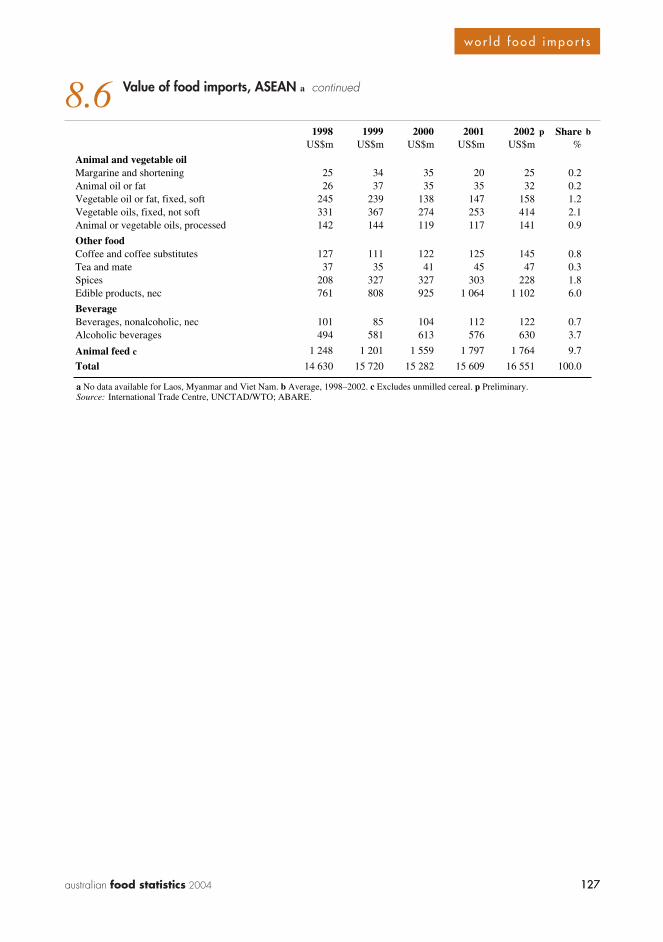
127australian food statistics 2004 127
w o r l d f o o d i m p o r t s
8.6 Value of food imports, ASEAN a continued
1998 1999 2000 2001 2002 p Share bUS$m US$m US$m US$m US$m %
Animal and vegetable oilMargarine and shortening 25 34 35 20 25 0.2Animal oil or fat 26 37 35 35 32 0.2Vegetable oil or fat, fixed, soft 245 239 138 147 158 1.2Vegetable oils, fixed, not soft 331 367 274 253 414 2.1Animal or vegetable oils, processed 142 144 119 117 141 0.9
Other foodCoffee and coffee substitutes 127 111 122 125 145 0.8Tea and mate 37 35 41 45 47 0.3Spices 208 327 327 303 228 1.8Edible products, nec 761 808 925 1 064 1 102 6.0
BeverageBeverages, nonalcoholic, nec 101 85 104 112 122 0.7Alcoholic beverages 494 581 613 576 630 3.7
Animal feed c 1 248 1 201 1 559 1 797 1 764 9.7
Total 14 630 15 720 15 282 15 609 16 551 100.0
a No data available for Laos, Myanmar and Viet Nam. b Average, 1998–2002. c Excludes unmilled cereal. p Preliminary.Source: International Trade Centre, UNCTAD/WTO; ABARE.
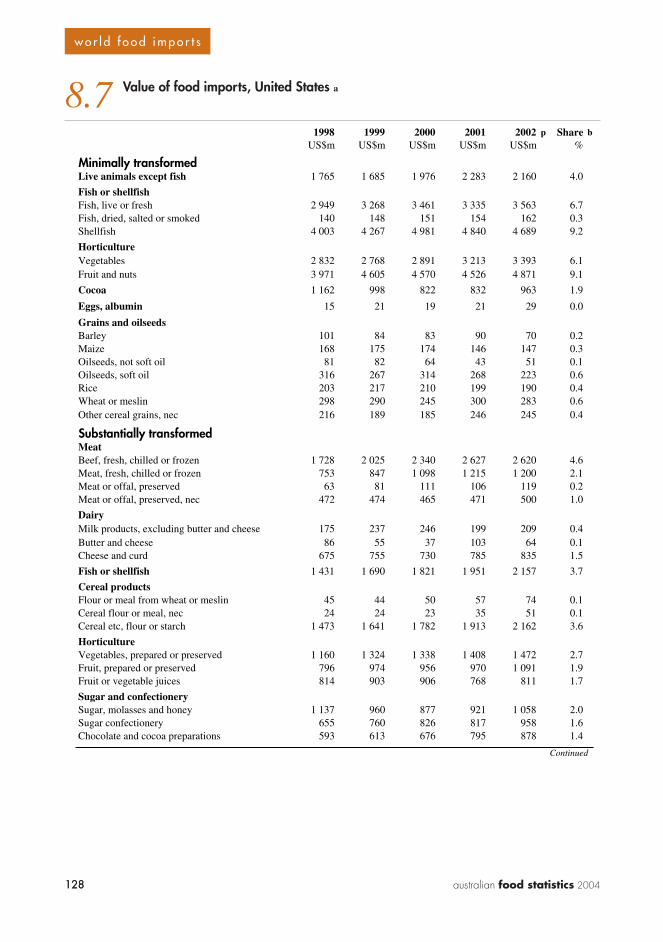
128 australian food statistics 2004128
w o r l d f o o d i m p o r t s
8.7 Value of food imports, United States a
1998 1999 2000 2001 2002 p Share bUS$m US$m US$m US$m US$m %
Minimally transformedLive animals except fish 1 765 1 685 1 976 2 283 2 160 4.0
Fish or shellfishFish, live or fresh 2 949 3 268 3 461 3 335 3 563 6.7Fish, dried, salted or smoked 140 148 151 154 162 0.3Shellfish 4 003 4 267 4 981 4 840 4 689 9.2
HorticultureVegetables 2 832 2 768 2 891 3 213 3 393 6.1Fruit and nuts 3 971 4 605 4 570 4 526 4 871 9.1
Cocoa 1 162 998 822 832 963 1.9
Eggs, albumin 15 21 19 21 29 0.0
Grains and oilseedsBarley 101 84 83 90 70 0.2Maize 168 175 174 146 147 0.3Oilseeds, not soft oil 81 82 64 43 51 0.1Oilseeds, soft oil 316 267 314 268 223 0.6Rice 203 217 210 199 190 0.4Wheat or meslin 298 290 245 300 283 0.6Other cereal grains, nec 216 189 185 246 245 0.4
Substantially transformedMeatBeef, fresh, chilled or frozen 1 728 2 025 2 340 2 627 2 620 4.6Meat, fresh, chilled or frozen 753 847 1 098 1 215 1 200 2.1Meat or offal, preserved 63 81 111 106 119 0.2Meat or offal, preserved, nec 472 474 465 471 500 1.0
DairyMilk products, excluding butter and cheese 175 237 246 199 209 0.4Butter and cheese 86 55 37 103 64 0.1Cheese and curd 675 755 730 785 835 1.5
Fish or shellfish 1 431 1 690 1 821 1 951 2 157 3.7
Cereal productsFlour or meal from wheat or meslin 45 44 50 57 74 0.1Cereal flour or meal, nec 24 24 23 35 51 0.1Cereal etc, flour or starch 1 473 1 641 1 782 1 913 2 162 3.6
HorticultureVegetables, prepared or preserved 1 160 1 324 1 338 1 408 1 472 2.7Fruit, prepared or preserved 796 974 956 970 1 091 1.9Fruit or vegetable juices 814 903 906 768 811 1.7
Sugar and confectionerySugar, molasses and honey 1 137 960 877 921 1 058 2.0Sugar confectionery 655 760 826 817 958 1.6Chocolate and cocoa preparations 593 613 676 795 878 1.4
Continued

129australian food statistics 2004 129
w o r l d f o o d i m p o r t s
8.7 Value of food imports, United States a continued
1998 1999 2000 2001 2002 p Share bUS$m US$m US$m US$m US$m %
Animal and vegetable oilMargarine and shortening 10 15 16 20 29 0.0Animal oil or fat 49 50 54 57 63 0.1Vegetable oil or fat, fixed, soft 767 718 740 685 772 1.5Vegetable oils, fixed, not soft 632 568 529 385 432 1.0Animal or vegetable oils, processed 145 149 170 150 163 0.3
Other foodCoffee and coffee substitutes 3 534 3 001 2 814 1 789 1 799 5.2Tea and mate 233 225 232 252 261 0.5Spices 478 523 548 515 541 1.1Edible products, nec 1 026 1 215 1 276 1 503 1 800 2.8
BeverageBeverages, nonalcoholic, nec 622 671 747 817 902 1.5Alcoholic beverages 6 274 7 145 7 820 8 147 9 057 15.6
Animal feed c 696 635 682 664 706 1.4
Total 44 764 47 385 50 056 50 620 53 823 100.0
a Includes Puerto Rico and the US Virgin Islands. b Average, 1998–2002. c Excludes unmilled cereal. p Preliminary.Source: International Trade Centre, UNCTAD/WTO.
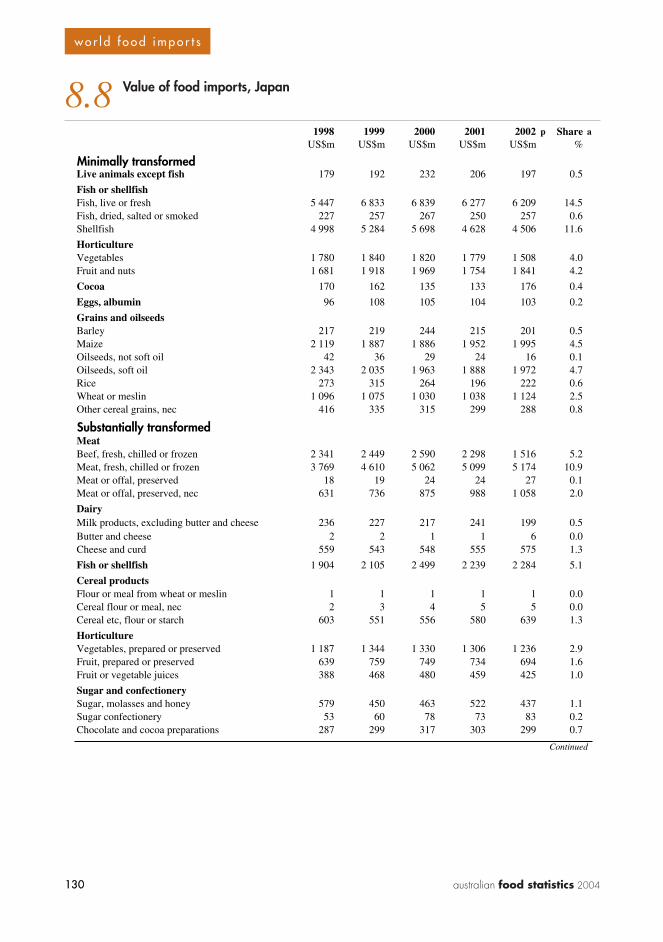
130 australian food statistics 2004130
w o r l d f o o d i m p o r t s
8.8 Value of food imports, Japan
1998 1999 2000 2001 2002 p Share aUS$m US$m US$m US$m US$m %
Minimally transformedLive animals except fish 179 192 232 206 197 0.5
Fish or shellfishFish, live or fresh 5 447 6 833 6 839 6 277 6 209 14.5Fish, dried, salted or smoked 227 257 267 250 257 0.6Shellfish 4 998 5 284 5 698 4 628 4 506 11.6
HorticultureVegetables 1 780 1 840 1 820 1 779 1 508 4.0Fruit and nuts 1 681 1 918 1 969 1 754 1 841 4.2
Cocoa 170 162 135 133 176 0.4
Eggs, albumin 96 108 105 104 103 0.2
Grains and oilseedsBarley 217 219 244 215 201 0.5Maize 2 119 1 887 1 886 1 952 1 995 4.5Oilseeds, not soft oil 42 36 29 24 16 0.1Oilseeds, soft oil 2 343 2 035 1 963 1 888 1 972 4.7Rice 273 315 264 196 222 0.6Wheat or meslin 1 096 1 075 1 030 1 038 1 124 2.5Other cereal grains, nec 416 335 315 299 288 0.8
Substantially transformedMeatBeef, fresh, chilled or frozen 2 341 2 449 2 590 2 298 1 516 5.2Meat, fresh, chilled or frozen 3 769 4 610 5 062 5 099 5 174 10.9Meat or offal, preserved 18 19 24 24 27 0.1Meat or offal, preserved, nec 631 736 875 988 1 058 2.0
DairyMilk products, excluding butter and cheese 236 227 217 241 199 0.5Butter and cheese 2 2 1 1 6 0.0Cheese and curd 559 543 548 555 575 1.3
Fish or shellfish 1 904 2 105 2 499 2 239 2 284 5.1
Cereal productsFlour or meal from wheat or meslin 1 1 1 1 1 0.0Cereal flour or meal, nec 2 3 4 5 5 0.0Cereal etc, flour or starch 603 551 556 580 639 1.3
HorticultureVegetables, prepared or preserved 1 187 1 344 1 330 1 306 1 236 2.9Fruit, prepared or preserved 639 759 749 734 694 1.6Fruit or vegetable juices 388 468 480 459 425 1.0
Sugar and confectionerySugar, molasses and honey 579 450 463 522 437 1.1Sugar confectionery 53 60 78 73 83 0.2Chocolate and cocoa preparations 287 299 317 303 299 0.7
Continued
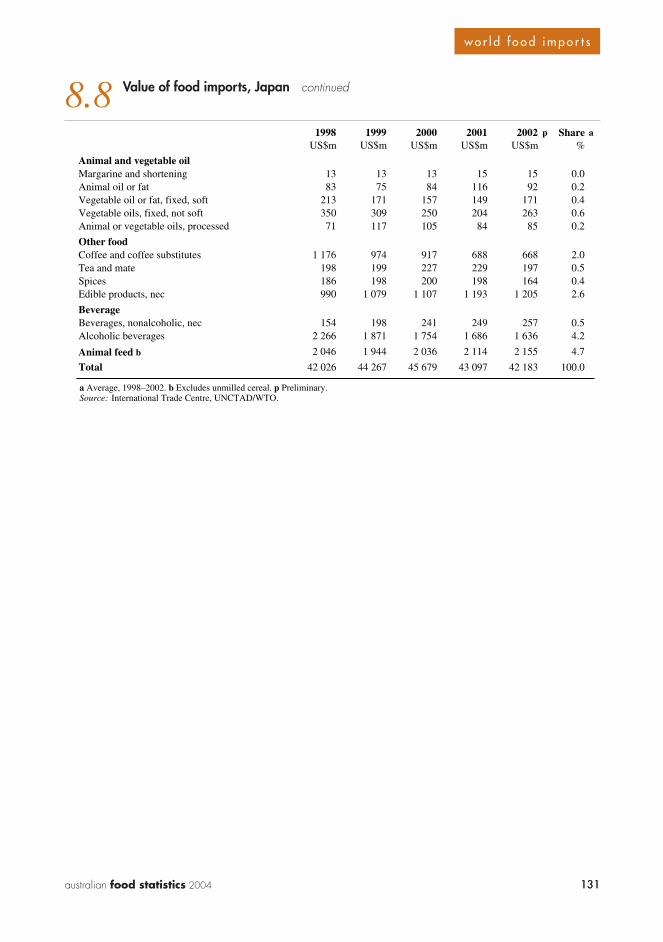
131australian food statistics 2004 131
w o r l d f o o d i m p o r t s
8.8 Value of food imports, Japan continued
1998 1999 2000 2001 2002 p Share aUS$m US$m US$m US$m US$m %
Animal and vegetable oilMargarine and shortening 13 13 13 15 15 0.0Animal oil or fat 83 75 84 116 92 0.2Vegetable oil or fat, fixed, soft 213 171 157 149 171 0.4Vegetable oils, fixed, not soft 350 309 250 204 263 0.6Animal or vegetable oils, processed 71 117 105 84 85 0.2
Other foodCoffee and coffee substitutes 1 176 974 917 688 668 2.0Tea and mate 198 199 227 229 197 0.5Spices 186 198 200 198 164 0.4Edible products, nec 990 1 079 1 107 1 193 1 205 2.6
BeverageBeverages, nonalcoholic, nec 154 198 241 249 257 0.5Alcoholic beverages 2 266 1 871 1 754 1 686 1 636 4.2
Animal feed b 2 046 1 944 2 036 2 114 2 155 4.7
Total 42 026 44 267 45 679 43 097 42 183 100.0
a Average, 1998–2002. b Excludes unmilled cereal. p Preliminary.Source: International Trade Centre, UNCTAD/WTO.
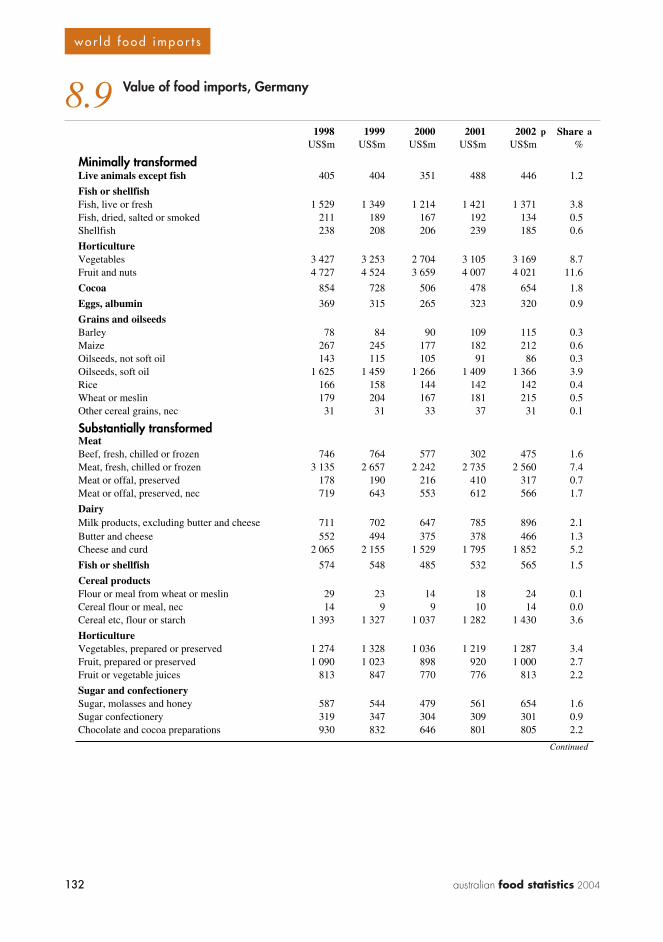
132 australian food statistics 2004132
w o r l d f o o d i m p o r t s
8.9 Value of food imports, Germany
1998 1999 2000 2001 2002 p Share aUS$m US$m US$m US$m US$m %
Minimally transformedLive animals except fish 405 404 351 488 446 1.2
Fish or shellfishFish, live or fresh 1 529 1 349 1 214 1 421 1 371 3.8Fish, dried, salted or smoked 211 189 167 192 134 0.5Shellfish 238 208 206 239 185 0.6
HorticultureVegetables 3 427 3 253 2 704 3 105 3 169 8.7Fruit and nuts 4 727 4 524 3 659 4 007 4 021 11.6
Cocoa 854 728 506 478 654 1.8
Eggs, albumin 369 315 265 323 320 0.9
Grains and oilseedsBarley 78 84 90 109 115 0.3Maize 267 245 177 182 212 0.6Oilseeds, not soft oil 143 115 105 91 86 0.3Oilseeds, soft oil 1 625 1 459 1 266 1 409 1 366 3.9Rice 166 158 144 142 142 0.4Wheat or meslin 179 204 167 181 215 0.5Other cereal grains, nec 31 31 33 37 31 0.1
Substantially transformedMeatBeef, fresh, chilled or frozen 746 764 577 302 475 1.6Meat, fresh, chilled or frozen 3 135 2 657 2 242 2 735 2 560 7.4Meat or offal, preserved 178 190 216 410 317 0.7Meat or offal, preserved, nec 719 643 553 612 566 1.7
DairyMilk products, excluding butter and cheese 711 702 647 785 896 2.1Butter and cheese 552 494 375 378 466 1.3Cheese and curd 2 065 2 155 1 529 1 795 1 852 5.2
Fish or shellfish 574 548 485 532 565 1.5
Cereal productsFlour or meal from wheat or meslin 29 23 14 18 24 0.1Cereal flour or meal, nec 14 9 9 10 14 0.0Cereal etc, flour or starch 1 393 1 327 1 037 1 282 1 430 3.6
HorticultureVegetables, prepared or preserved 1 274 1 328 1 036 1 219 1 287 3.4Fruit, prepared or preserved 1 090 1 023 898 920 1 000 2.7Fruit or vegetable juices 813 847 770 776 813 2.2
Sugar and confectionerySugar, molasses and honey 587 544 479 561 654 1.6Sugar confectionery 319 347 304 309 301 0.9Chocolate and cocoa preparations 930 832 646 801 805 2.2
Continued
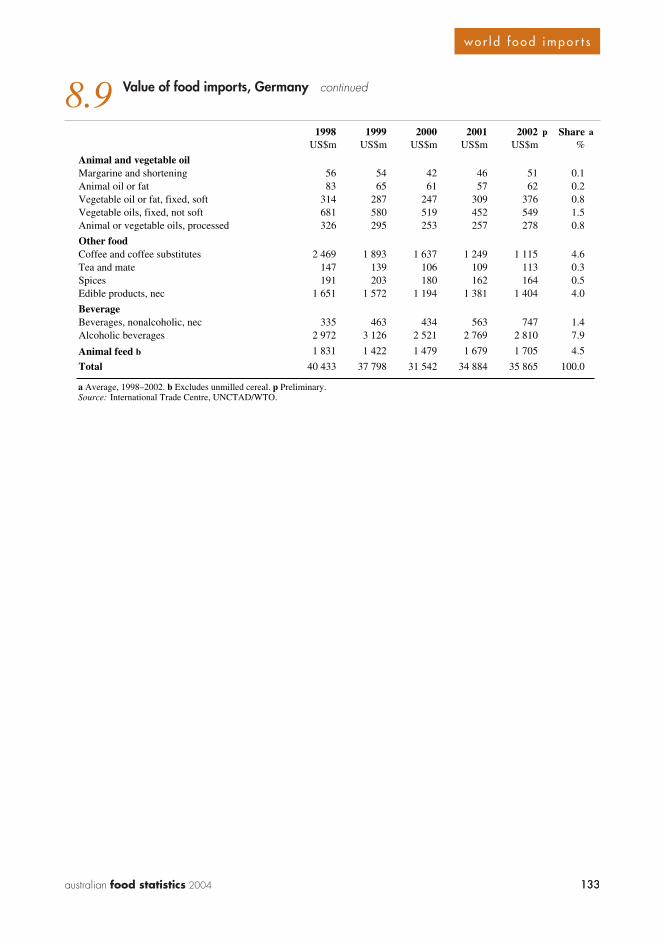
133australian food statistics 2004 133
w o r l d f o o d i m p o r t s
8.9 Value of food imports, Germany continued
1998 1999 2000 2001 2002 p Share aUS$m US$m US$m US$m US$m %
Animal and vegetable oilMargarine and shortening 56 54 42 46 51 0.1Animal oil or fat 83 65 61 57 62 0.2Vegetable oil or fat, fixed, soft 314 287 247 309 376 0.8Vegetable oils, fixed, not soft 681 580 519 452 549 1.5Animal or vegetable oils, processed 326 295 253 257 278 0.8
Other foodCoffee and coffee substitutes 2 469 1 893 1 637 1 249 1 115 4.6Tea and mate 147 139 106 109 113 0.3Spices 191 203 180 162 164 0.5Edible products, nec 1 651 1 572 1 194 1 381 1 404 4.0
BeverageBeverages, nonalcoholic, nec 335 463 434 563 747 1.4Alcoholic beverages 2 972 3 126 2 521 2 769 2 810 7.9
Animal feed b 1 831 1 422 1 479 1 679 1 705 4.5
Total 40 433 37 798 31 542 34 884 35 865 100.0
a Average, 1998–2002. b Excludes unmilled cereal. p Preliminary.Source: International Trade Centre, UNCTAD/WTO.

134 australian food statistics 2004134
w o r l d f o o d i m p o r t s
8.10 Value of food imports, United Kingdom
1998 1999 2000 2001 2002 p Share aUS$m US$m US$m US$m US$m %
Minimally transformedLive animals except fish 378 370 517 475 524 1.7
Fish or shellfishFish, live or fresh 927 957 951 958 1 005 3.5Fish, dried, salted or smoked 13 13 12 15 14 0.0Shellfish 311 303 342 331 341 1.2
HorticultureVegetables 2 020 1 978 1 881 2 091 2 281 7.5Fruit and nuts 2 911 2 707 2 463 2 495 2 778 9.7
Cocoa 488 476 232 291 412 1.4
Eggs, albumin 48 51 65 73 94 0.2
Grains and oilseedsBarley 34 24 11 16 15 0.1Maize 229 219 214 219 207 0.8Oilseeds, not soft oil 43 13 11 27 39 0.1Oilseeds, soft oil 492 313 329 415 392 1.4Rice 284 289 228 247 227 0.9Wheat or meslin 236 208 195 210 209 0.8Other cereal grains, nec 11 11 11 11 12 0.0
Substantially transformedMeatBeef, fresh, chilled or frozen 427 490 489 559 675 1.9Meat, fresh, chilled or frozen 1 522 1 540 1 569 1 632 1 684 5.8Meat or offal, preserved 625 648 705 889 930 2.8Meat or offal, preserved, nec 780 796 827 907 979 3.1
DairyMilk products, excluding butter and cheese 489 463 463 476 516 1.8Butter and cheese 351 367 355 354 198 1.2Cheese and curd 978 987 905 936 959 3.5
Fish or shellfish 898 804 714 780 792 2.9
Cereal productsFlour or meal from wheat or meslin 24 28 30 21 29 0.1Cereal flour or meal, nec 13 19 16 13 13 0.1Cereal etc, flour or starch 1 018 1 010 962 1 058 1 187 3.8
HorticultureVegetables, prepared or preserved 963 969 819 752 831 3.2Fruit, prepared or preserved 501 454 414 383 397 1.6Fruit or vegetable juices 441 436 377 367 425 1.5
Sugar and confectionerySugar, molasses and honey 1 071 970 836 883 902 3.4Sugar confectionery 211 220 231 248 277 0.9Chocolate and cocoa preparations 542 606 584 567 644 2.1
Continued
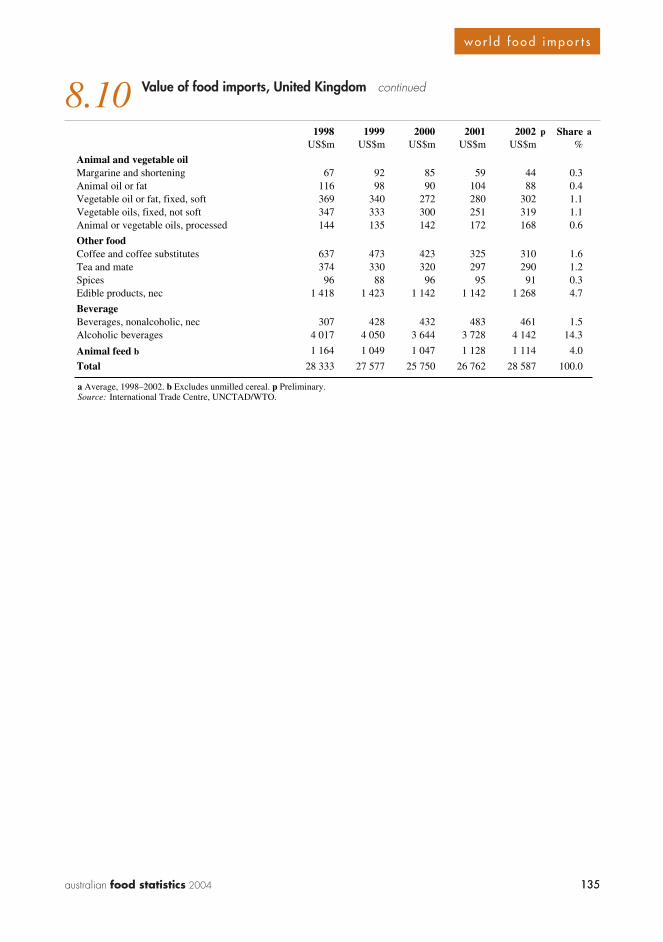
135australian food statistics 2004 135
w o r l d f o o d i m p o r t s
8.10 Value of food imports, United Kingdom continued
1998 1999 2000 2001 2002 p Share aUS$m US$m US$m US$m US$m %
Animal and vegetable oilMargarine and shortening 67 92 85 59 44 0.3Animal oil or fat 116 98 90 104 88 0.4Vegetable oil or fat, fixed, soft 369 340 272 280 302 1.1Vegetable oils, fixed, not soft 347 333 300 251 319 1.1Animal or vegetable oils, processed 144 135 142 172 168 0.6
Other foodCoffee and coffee substitutes 637 473 423 325 310 1.6Tea and mate 374 330 320 297 290 1.2Spices 96 88 96 95 91 0.3Edible products, nec 1 418 1 423 1 142 1 142 1 268 4.7
BeverageBeverages, nonalcoholic, nec 307 428 432 483 461 1.5Alcoholic beverages 4 017 4 050 3 644 3 728 4 142 14.3
Animal feed b 1 164 1 049 1 047 1 128 1 114 4.0
Total 28 333 27 577 25 750 26 762 28 587 100.0
a Average, 1998–2002. b Excludes unmilled cereal. p Preliminary.Source: International Trade Centre, UNCTAD/WTO.

136 australian food statistics 2004136
w o r l d f o o d i m p o r t s
8.11 Value of food imports, France
1998 1999 2000 2001 2002 p Share aUS$m US$m US$m US$m US$m %
Minimally transformedLive animals except fish 307 373 364 245 236 1.3
Fish or shellfishFish, live or fresh 1 484 1 489 1 339 1 330 1 373 5.8Fish, dried, salted or smoked 125 111 106 115 102 0.5Shellfish 1 014 985 926 934 952 4.0
HorticultureVegetables 1 451 1 432 1 368 1 403 1 596 6.0Fruit and nuts 2 393 2 220 2 040 2 096 2 247 9.1
Cocoa 542 554 398 410 642 2.1
Eggs, albumin 83 75 85 85 97 0.4
Grains and oilseedsBarley 3 4 12 7 3 0.0Maize 104 83 82 96 128 0.4Oilseeds, not soft oil 21 21 24 23 25 0.1Oilseeds, soft oil 342 282 180 283 292 1.1Rice 240 231 220 208 213 0.9Wheat or meslin 81 54 72 81 73 0.3Other cereal grains, nec 15 13 13 17 13 0.1
Substantially transformedMeatBeef, fresh, chilled or frozen 920 947 833 562 692 3.3Meat, fresh, chilled or frozen 1 760 1 637 1 641 1 632 1 550 6.8Meat or offal, preserved 202 180 184 206 211 0.8Meat or offal, preserved, nec 264 233 237 251 263 1.0
DairyMilk products, excluding butter and cheese 1 015 1 005 977 962 899 4.0Butter and cheese 482 395 399 362 342 1.6Cheese and curd 683 681 654 654 678 2.8
Fish or shellfish 793 614 609 613 716 2.8
Cereal productsFlour or meal from wheat or meslin 72 60 59 62 63 0.3Cereal flour or meal, nec 21 16 14 12 12 0.1Cereal etc, flour or starch 1 278 1 297 1 204 1 192 1 357 5.3
HorticultureVegetables, prepared or preserved 775 815 720 714 824 3.2Fruit, prepared or preserved 661 621 582 542 599 2.5Fruit or vegetable juices 544 603 602 465 548 2.3
Sugar and confectionerySugar, molasses and honey 396 434 395 382 468 1.7Sugar confectionery 202 185 174 156 183 0.7Chocolate and cocoa preparations 926 866 808 764 862 3.5
Continued

137australian food statistics 2004 137
w o r l d f o o d i m p o r t s
8.11 Value of food imports, France continued
1998 1999 2000 2001 2002 p Share aUS$m US$m US$m US$m US$m %
Animal and vegetable oilMargarine and shortening 128 117 99 107 162 0.5Animal oil or fat 82 54 47 53 51 0.2Vegetable oil or fat, fixed, soft 540 485 414 416 512 2.0Vegetable oils, fixed, not soft 253 228 210 229 253 1.0Animal or vegetable oils, processed 218 169 163 166 180 0.7
Other foodCoffee and coffee substitutes 1 149 888 764 593 587 3.3Tea and mate 85 88 84 83 97 0.4Spices 98 99 103 100 121 0.4Edible products, nec 915 923 847 852 979 3.8
BeverageBeverages, nonalcoholic, nec 307 308 302 335 396 1.4Alcoholic beverages 1 421 1 384 1 206 1 193 1 330 5.4
Animal feed b 1 524 1 266 1 462 1 484 1 521 6.0
Total 25 918 24 523 23 020 22 475 24 449 100.0
a Average, 1998–2002. b Excludes unmilled cereal. p Preliminary.Source: International Trade Centre, UNCTAD/WTO.
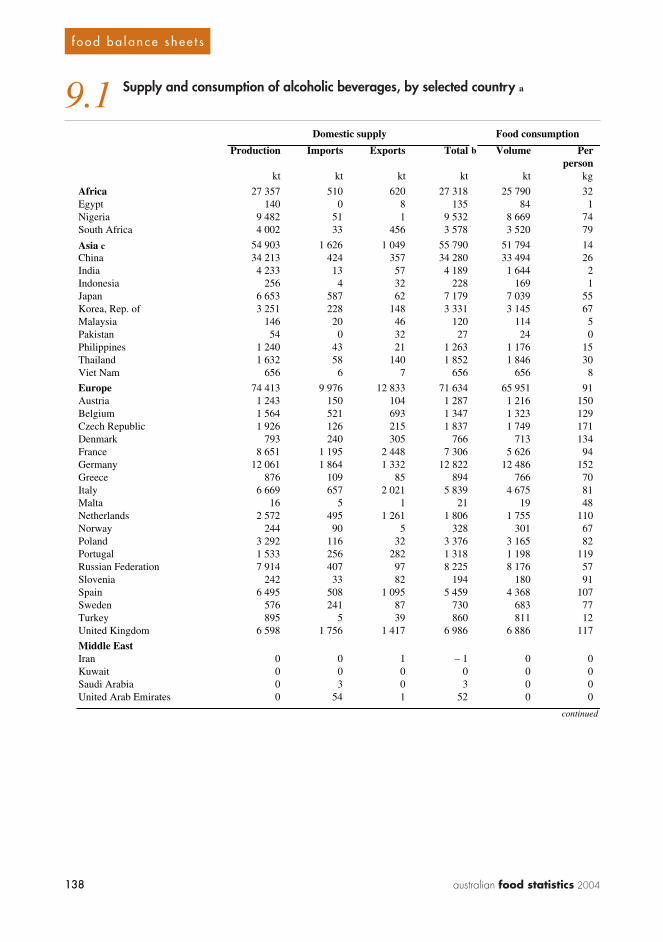
138 australian food statistics 2004138
f o o d b a l a n c e s h e e t s
9.1 Supply and consumption of alcoholic beverages, by selected country a
Domestic supply Food consumption
Production Imports Exports Total b Volume Perperson
kt kt kt kt kt kg
Africa 27 357 510 620 27 318 25 790 32Egypt 140 0 8 135 84 1Nigeria 9 482 51 1 9 532 8 669 74South Africa 4 002 33 456 3 578 3 520 79
Asia c 54 903 1 626 1 049 55 790 51 794 14China 34 213 424 357 34 280 33 494 26India 4 233 13 57 4 189 1 644 2Indonesia 256 4 32 228 169 1Japan 6 653 587 62 7 179 7 039 55Korea, Rep. of 3 251 228 148 3 331 3 145 67Malaysia 146 20 46 120 114 5Pakistan 54 0 32 27 24 0Philippines 1 240 43 21 1 263 1 176 15Thailand 1 632 58 140 1 852 1 846 30Viet Nam 656 6 7 656 656 8
Europe 74 413 9 976 12 833 71 634 65 951 91Austria 1 243 150 104 1 287 1 216 150Belgium 1 564 521 693 1 347 1 323 129Czech Republic 1 926 126 215 1 837 1 749 171Denmark 793 240 305 766 713 134France 8 651 1 195 2 448 7 306 5 626 94Germany 12 061 1 864 1 332 12 822 12 486 152Greece 876 109 85 894 766 70Italy 6 669 657 2 021 5 839 4 675 81Malta 16 5 1 21 19 48Netherlands 2 572 495 1 261 1 806 1 755 110Norway 244 90 5 328 301 67Poland 3 292 116 32 3 376 3 165 82Portugal 1 533 256 282 1 318 1 198 119Russian Federation 7 914 407 97 8 225 8 176 57Slovenia 242 33 82 194 180 91Spain 6 495 508 1 095 5 459 4 368 107Sweden 576 241 87 730 683 77Turkey 895 5 39 860 811 12United Kingdom 6 598 1 756 1 417 6 986 6 886 117
Middle EastIran 0 0 1 – 1 0 0Kuwait 0 0 0 0 0 0Saudi Arabia 0 3 0 3 0 0United Arab Emirates 0 54 1 52 0 0
continued

139australian food statistics 2004 139
f o o d b a l a n c e s h e e t s
9.1 Supply and consumption of alcoholic beverages, by selected country a continued
Domestic supply Food consumption
Production Imports Exports Total b Volume Perperson
kt kt kt kt kt kg
Central America 7 066 380 1 448 5 999 5 651 41
North America 35 039 4 647 1 629 38 058 32 320 101Canada 3 205 547 544 3 207 3 155 102Mexico 6 429 269 1 316 5 383 4 992 50United States 31 834 4 101 1 085 34 850 29 165 101
South America 27 083 385 1 126 26 470 15 267 43Argentina 2 630 22 181 2 482 2 424 65Brazil 19 125 96 411 18 809 7 725 44Chile 945 35 421 665 661 43Uruguay 175 16 5 185 182 54
Oceania 3 348 212 555 2 924 2 679 87Australia 2 821 127 503 2 367 2 190 113New Zealand 398 64 47 412 364 95
World 230 226 17 875 19 430 229 177 200 380 33
a Annual average, 2000–2002. Wine, beer from barley, and other fermented and alcoholic beverages. Includes nonfood alcohol. b Takes account of stock changes. c Not including Middle East countries.Source: Food and Agriculture Organisation, FAOSTAT nutrition data.

140 australian food statistics 2004140
f o o d b a l a n c e s h e e t s
9.2 Supply and consumption of cereals, by selected country a
Domestic supply Food consumption
Production Imports Exports Total b Volume Perperson
kt kt kt kt kt kg
Africa 109 181 48 207 2 871 157 073 115 885 143Egypt 17 659 9 812 507 26 887 16 203 234Nigeria 20 165 3 657 66 23 856 17 237 146South Africa 12 674 2 028 1 168 13 475 8 275 186
Asia c 816 807 116 280 43 378 890 839 622 093 167China 341 364 10 722 13 189 352 374 225 846 175India 188 695 66 5 882 183 939 159 763 155Indonesia 43 743 6 663 133 50 838 43 440 203Japan 8 605 27 674 613 35 257 14 657 115Korea, Rep. of 5 118 13 116 200 17 588 7 381 157Malaysia 1 474 4 972 296 6 221 3 596 153Pakistan 26 036 506 2 770 25 402 22 319 153Philippines 13 037 4 461 22 16 421 10 541 137Thailand 21 935 1 262 7 598 14 387 7 555 123Viet Nam 24 256 1 125 3 551 19 357 14 758 186
Europe 416 941 66 721 91 732 384 721 96 655 133Austria 4 687 864 1 167 4 479 924 114Belgium 2 504 6 721 3 885 4 516 1 097 107Czech Republic 6 860 278 882 6 400 1 134 111Denmark 9 222 1 203 2 347 7 987 663 124France 65 160 2 873 32 245 35 191 6 939 117Germany 46 116 4 989 14 081 38 143 8 724 106Greece 4 699 1 818 603 5 543 1 654 151Italy 20 302 9 584 4 764 24 523 9 276 161Malta 12 194 2 207 72 184Netherlands 1 654 7 030 2 011 6 642 1 236 77Norway 1 244 526 12 1 765 578 129Poland 25 393 1 564 303 26 956 5 958 154Portugal 1 425 3 240 225 4 449 1 335 133Russian Federation 77 297 3 695 6 159 72 658 22 002 152Slovenia 532 468 47 1 015 269 135Spain 21 137 9 237 2 158 26 272 4 013 98Sweden 5 508 466 1 575 4 584 909 103Turkey 30 762 2 191 1 825 31 049 15 226 220United Kingdom 22 032 4 169 4 831 21 120 6 124 104
Middle EastIran 15 140 8 689 72 23 746 13 910 207Kuwait 4 667 17 647 332 141Saudi Arabia 2 464 6 290 32 8 306 3 409 149United Arab Emirates 0 2 076 592 1 284 397 138
Continued
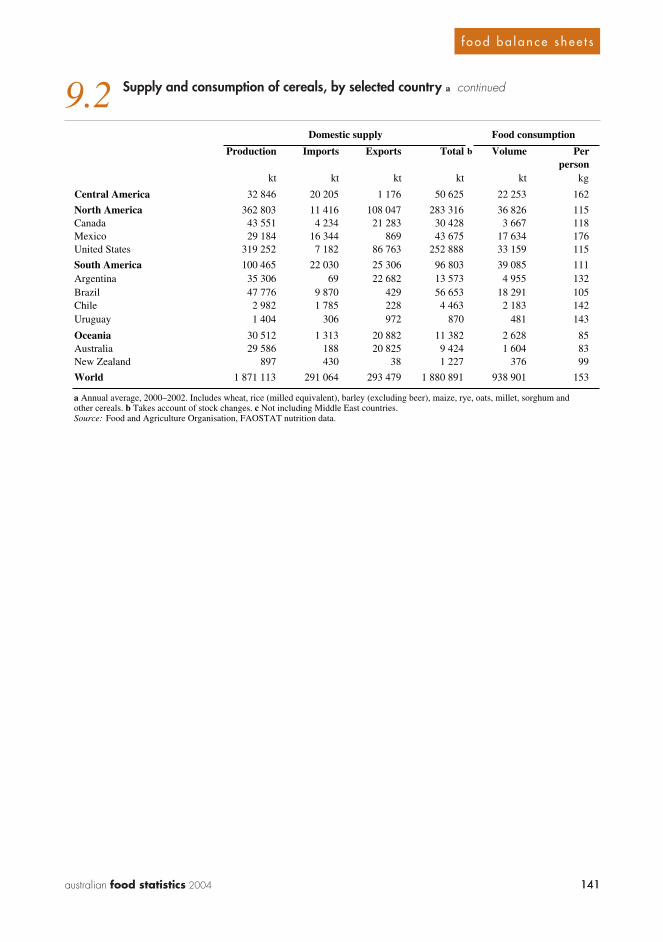
141australian food statistics 2004 141
f o o d b a l a n c e s h e e t s
9.2 Supply and consumption of cereals, by selected country a continued
Domestic supply Food consumption
Production Imports Exports Total b Volume Perperson
kt kt kt kt kt kg
Central America 32 846 20 205 1 176 50 625 22 253 162
North America 362 803 11 416 108 047 283 316 36 826 115Canada 43 551 4 234 21 283 30 428 3 667 118Mexico 29 184 16 344 869 43 675 17 634 176United States 319 252 7 182 86 763 252 888 33 159 115
South America 100 465 22 030 25 306 96 803 39 085 111Argentina 35 306 69 22 682 13 573 4 955 132Brazil 47 776 9 870 429 56 653 18 291 105Chile 2 982 1 785 228 4 463 2 183 142Uruguay 1 404 306 972 870 481 143
Oceania 30 512 1 313 20 882 11 382 2 628 85Australia 29 586 188 20 825 9 424 1 604 83New Zealand 897 430 38 1 227 376 99
World 1 871 113 291 064 293 479 1 880 891 938 901 153
a Annual average, 2000–2002. Includes wheat, rice (milled equivalent), barley (excluding beer), maize, rye, oats, millet, sorghum and other cereals. b Takes account of stock changes. c Not including Middle East countries.Source: Food and Agriculture Organisation, FAOSTAT nutrition data.

142 australian food statistics 2004142
f o o d b a l a n c e s h e e t s
9.3 Supply and consumption of starchy roots, by selected country a
Domestic supply Food consumption
Production Imports Exports Total b Volume Perperson
kt kt kt kt kt kg
Africa 172 932 774 396 173 598 106 256 131Egypt 2 199 55 214 2 064 1 592 23Nigeria 66 497 1 4 66 495 26 394 224South Africa 1 683 127 49 1 760 1 289 29
Asia c 298 994 12 873 16 240 293 230 170 007 46China 187 562 7 375 758 194 289 98 420 76India 31 541 7 43 31 506 25 081 24Indonesia 19 697 575 672 19 600 14 531 68Japan 4 514 1 345 6 5 853 4 342 34Korea, Rep. of 970 1 398 0 2 367 799 17Malaysia 462 604 30 1 036 522 22Pakistan 2 215 18 65 2 168 1 880 13Philippines 2 488 239 5 2 721 2 397 31Thailand 18 321 191 13 510 2 562 1 097 18Viet Nam 5 304 12 575 4 740 1 037 13
Europe 140 104 21 642 13 244 148 012 68 093 94Austria 691 115 43 764 505 62Belgium 2 798 3 481 2 319 2 287 940 92Czech Republic 1 237 98 55 1 307 818 80Denmark 1 564 179 125 1 719 425 80France 6 463 1 199 1 433 6 137 3 979 67Germany 12 368 1 327 3 398 9 429 6 152 75Greece 903 205 24 1 084 753 69Italy 2 064 1 124 314 2 854 2 303 40Malta 30 15 3 42 34 88Netherlands 7 502 5 110 4 121 8 491 1 498 94Norway 339 56 0 423 321 72Poland 19 712 106 541 20 031 5 093 132Portugal 1 257 966 30 2 193 1 301 130Russian Federation 33 938 423 20 34 341 17 516 121Slovenia 167 34 3 198 137 69Spain 3 087 4 067 260 7 025 3 304 81Sweden 940 298 35 1 148 473 53Turkey 5 190 219 93 5 316 4 187 60United Kingdom 6 503 1 606 282 8 150 6 813 115
Middle EastIran 3 633 25 78 3 580 3 035 45Kuwait 27 28 0 55 54 23Saudi Arabia 349 173 44 478 407 18United Arab Emirates 12 60 5 67 48 17
Continued

143australian food statistics 2004 143
f o o d b a l a n c e s h e e t s
9.3 Supply and consumption of starchy roots, by selected country a continued
Domestic supply Food consumption
Production Imports Exports Total b Volume Perperson
kt kt kt kt kt kg
Central America 2 491 468 323 2 646 2 138 16
North America 26 461 3 128 3 521 26 020 21 280 67Canada 4 495 434 1 640 3 308 2 568 83Mexico 1 738 324 28 2 034 1 659 17United States 21 966 2 695 1 882 22 712 18 712 65
South America 47 108 669 350 47 447 23 620 67Argentina 2 832 58 157 2 733 2 255 60Brazil 26 559 193 88 26 663 10 661 61Chile 1 175 32 7 1 200 831 54Uruguay 188 46 0 248 181 54
Oceania 3 489 187 151 3 542 2 944 96Australia 1 243 91 52 1 281 1 053 54New Zealand 517 55 82 504 306 80
World 694 246 39 886 34 274 697 257 396 301 65
a Annual average, 2000–2002. Includes cassava, potatoes, yams and other roots. b Takes account of stock changes. c Not including Middle East countries.Source: Food and Agriculture Organisation, FAOSTAT nutrition data.
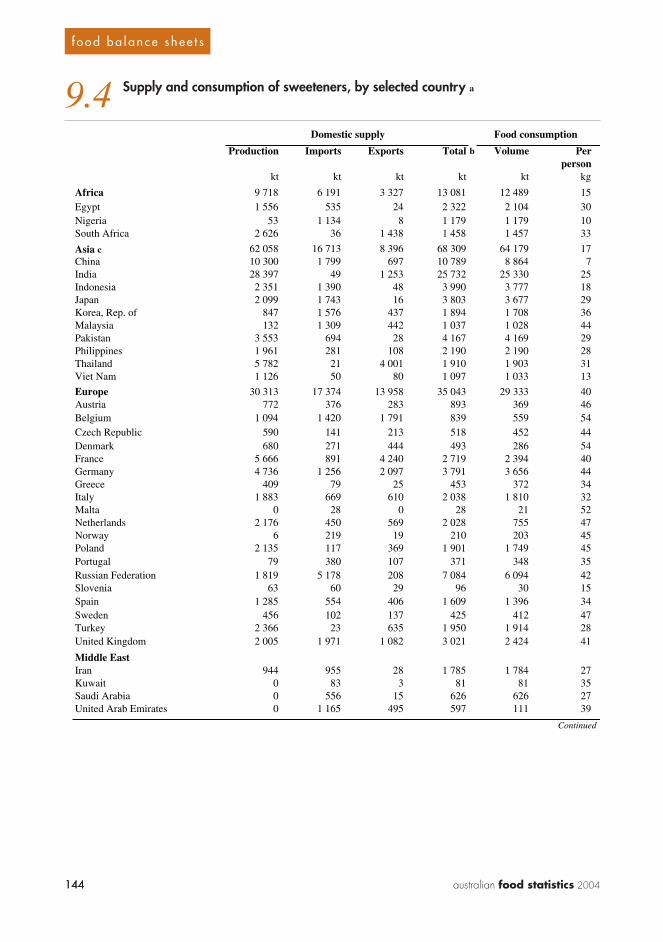
144 australian food statistics 2004144
f o o d b a l a n c e s h e e t s
9.4 Supply and consumption of sweeteners, by selected country a
Domestic supply Food consumption
Production Imports Exports Total b Volume Perperson
kt kt kt kt kt kg
Africa 9 718 6 191 3 327 13 081 12 489 15Egypt 1 556 535 24 2 322 2 104 30Nigeria 53 1 134 8 1 179 1 179 10South Africa 2 626 36 1 438 1 458 1 457 33
Asia c 62 058 16 713 8 396 68 309 64 179 17China 10 300 1 799 697 10 789 8 864 7India 28 397 49 1 253 25 732 25 330 25Indonesia 2 351 1 390 48 3 990 3 777 18Japan 2 099 1 743 16 3 803 3 677 29Korea, Rep. of 847 1 576 437 1 894 1 708 36Malaysia 132 1 309 442 1 037 1 028 44Pakistan 3 553 694 28 4 167 4 169 29Philippines 1 961 281 108 2 190 2 190 28Thailand 5 782 21 4 001 1 910 1 903 31Viet Nam 1 126 50 80 1 097 1 033 13
Europe 30 313 17 374 13 958 35 043 29 333 40Austria 772 376 283 893 369 46Belgium 1 094 1 420 1 791 839 559 54Czech Republic 590 141 213 518 452 44Denmark 680 271 444 493 286 54France 5 666 891 4 240 2 719 2 394 40Germany 4 736 1 256 2 097 3 791 3 656 44Greece 409 79 25 453 372 34Italy 1 883 669 610 2 038 1 810 32Malta 0 28 0 28 21 52Netherlands 2 176 450 569 2 028 755 47Norway 6 219 19 210 203 45Poland 2 135 117 369 1 901 1 749 45Portugal 79 380 107 371 348 35Russian Federation 1 819 5 178 208 7 084 6 094 42Slovenia 63 60 29 96 30 15Spain 1 285 554 406 1 609 1 396 34Sweden 456 102 137 425 412 47Turkey 2 366 23 635 1 950 1 914 28United Kingdom 2 005 1 971 1 082 3 021 2 424 41
Middle EastIran 944 955 28 1 785 1 784 27Kuwait 0 83 3 81 81 35Saudi Arabia 0 556 15 626 626 27United Arab Emirates 0 1 165 495 597 111 39
Continued
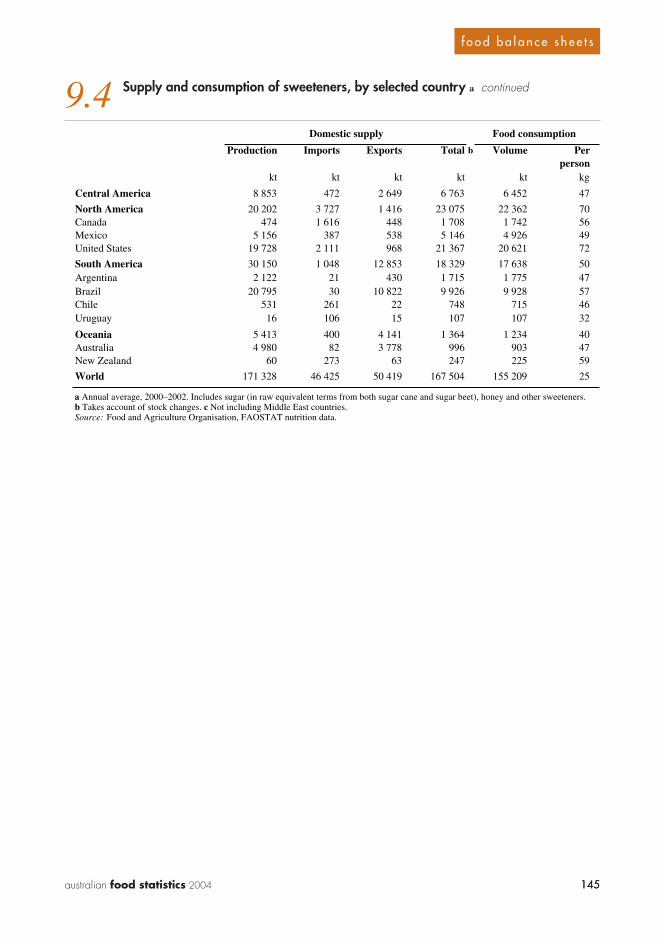
145australian food statistics 2004 145
f o o d b a l a n c e s h e e t s
9.4 Supply and consumption of sweeteners, by selected country a continued
Domestic supply Food consumption
Production Imports Exports Total b Volume Perperson
kt kt kt kt kt kg
Central America 8 853 472 2 649 6 763 6 452 47
North America 20 202 3 727 1 416 23 075 22 362 70Canada 474 1 616 448 1 708 1 742 56Mexico 5 156 387 538 5 146 4 926 49United States 19 728 2 111 968 21 367 20 621 72
South America 30 150 1 048 12 853 18 329 17 638 50Argentina 2 122 21 430 1 715 1 775 47Brazil 20 795 30 10 822 9 926 9 928 57Chile 531 261 22 748 715 46Uruguay 16 106 15 107 107 32
Oceania 5 413 400 4 141 1 364 1 234 40Australia 4 980 82 3 778 996 903 47New Zealand 60 273 63 247 225 59
World 171 328 46 425 50 419 167 504 155 209 25
a Annual average, 2000–2002. Includes sugar (in raw equivalent terms from both sugar cane and sugar beet), honey and other sweeteners. b Takes account of stock changes. c Not including Middle East countries. Source: Food and Agriculture Organisation, FAOSTAT nutrition data.
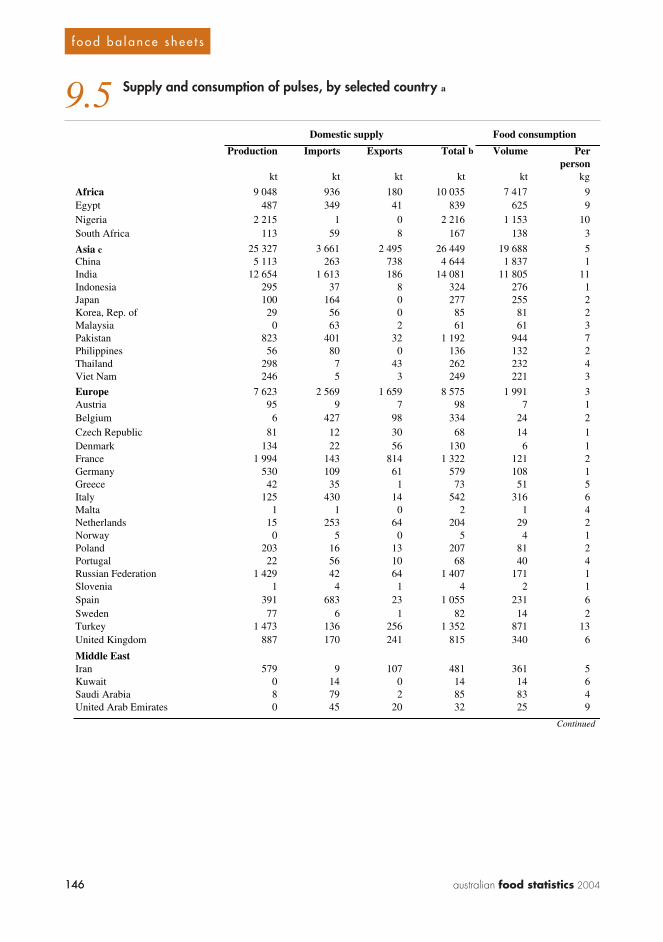
146 australian food statistics 2004146
f o o d b a l a n c e s h e e t s
9.5 Supply and consumption of pulses, by selected country a
Domestic supply Food consumption
Production Imports Exports Total b Volume Perperson
kt kt kt kt kt kg
Africa 9 048 936 180 10 035 7 417 9Egypt 487 349 41 839 625 9Nigeria 2 215 1 0 2 216 1 153 10South Africa 113 59 8 167 138 3
Asia c 25 327 3 661 2 495 26 449 19 688 5China 5 113 263 738 4 644 1 837 1India 12 654 1 613 186 14 081 11 805 11Indonesia 295 37 8 324 276 1Japan 100 164 0 277 255 2Korea, Rep. of 29 56 0 85 81 2Malaysia 0 63 2 61 61 3Pakistan 823 401 32 1 192 944 7Philippines 56 80 0 136 132 2Thailand 298 7 43 262 232 4Viet Nam 246 5 3 249 221 3
Europe 7 623 2 569 1 659 8 575 1 991 3Austria 95 9 7 98 7 1Belgium 6 427 98 334 24 2Czech Republic 81 12 30 68 14 1Denmark 134 22 56 130 6 1France 1 994 143 814 1 322 121 2Germany 530 109 61 579 108 1Greece 42 35 1 73 51 5Italy 125 430 14 542 316 6Malta 1 1 0 2 1 4Netherlands 15 253 64 204 29 2Norway 0 5 0 5 4 1Poland 203 16 13 207 81 2Portugal 22 56 10 68 40 4Russian Federation 1 429 42 64 1 407 171 1Slovenia 1 4 1 4 2 1Spain 391 683 23 1 055 231 6Sweden 77 6 1 82 14 2Turkey 1 473 136 256 1 352 871 13United Kingdom 887 170 241 815 340 6
Middle EastIran 579 9 107 481 361 5Kuwait 0 14 0 14 14 6Saudi Arabia 8 79 2 85 83 4United Arab Emirates 0 45 20 32 25 9
Continued

147australian food statistics 2004 147
f o o d b a l a n c e s h e e t s
9.5 Supply and consumption of pulses, by selected country a continued
Domestic supply Food consumption
Production Imports Exports Total b Volume Perperson
kt kt kt kt kt kg
Central America 2 020 230 232 2 006 1 750 13
North America 4 845 309 2 897 2 417 1 434 5Canada 3 359 80 2 328 1 190 266 9Mexico 1 539 154 187 1 489 1 282 13United States 1 486 229 569 1 227 1 169 4
South America 3 793 530 350 4 167 3 793 11Argentina 332 6 271 79 48 1Brazil 2 869 136 8 3 163 2 904 17Chile 92 23 24 92 62 4Uruguay 7 4 0 11 10 3
Oceania 1 993 28 2 496 645 47 2Australia 1 942 11 2 473 599 15 1New Zealand 44 9 22 31 19 5
World 54 885 8 455 10 316 54 727 36 519 6
a Annual average, 2000–2002. Includes beans, peas and other pulses. b Takes account of stock changes. c Not including Middle East countries.Source: Food and Agriculture Organisation, FAOSTAT nutrition data.
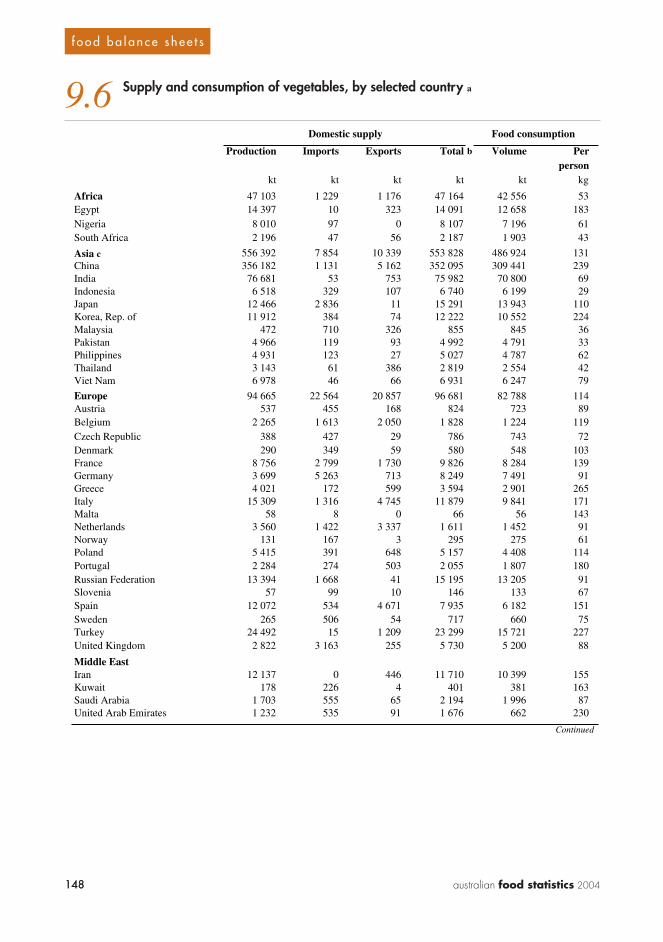
148 australian food statistics 2004148
f o o d b a l a n c e s h e e t s
9.6 Supply and consumption of vegetables, by selected country a
Domestic supply Food consumption
Production Imports Exports Total b Volume Perperson
kt kt kt kt kt kg
Africa 47 103 1 229 1 176 47 164 42 556 53Egypt 14 397 10 323 14 091 12 658 183Nigeria 8 010 97 0 8 107 7 196 61South Africa 2 196 47 56 2 187 1 903 43
Asia c 556 392 7 854 10 339 553 828 486 924 131China 356 182 1 131 5 162 352 095 309 441 239India 76 681 53 753 75 982 70 800 69Indonesia 6 518 329 107 6 740 6 199 29Japan 12 466 2 836 11 15 291 13 943 110Korea, Rep. of 11 912 384 74 12 222 10 552 224Malaysia 472 710 326 855 845 36Pakistan 4 966 119 93 4 992 4 791 33Philippines 4 931 123 27 5 027 4 787 62Thailand 3 143 61 386 2 819 2 554 42Viet Nam 6 978 46 66 6 931 6 247 79
Europe 94 665 22 564 20 857 96 681 82 788 114Austria 537 455 168 824 723 89Belgium 2 265 1 613 2 050 1 828 1 224 119Czech Republic 388 427 29 786 743 72Denmark 290 349 59 580 548 103France 8 756 2 799 1 730 9 826 8 284 139Germany 3 699 5 263 713 8 249 7 491 91Greece 4 021 172 599 3 594 2 901 265Italy 15 309 1 316 4 745 11 879 9 841 171Malta 58 8 0 66 56 143Netherlands 3 560 1 422 3 337 1 611 1 452 91Norway 131 167 3 295 275 61Poland 5 415 391 648 5 157 4 408 114Portugal 2 284 274 503 2 055 1 807 180Russian Federation 13 394 1 668 41 15 195 13 205 91Slovenia 57 99 10 146 133 67Spain 12 072 534 4 671 7 935 6 182 151Sweden 265 506 54 717 660 75Turkey 24 492 15 1 209 23 299 15 721 227United Kingdom 2 822 3 163 255 5 730 5 200 88
Middle EastIran 12 137 0 446 11 710 10 399 155Kuwait 178 226 4 401 381 163Saudi Arabia 1 703 555 65 2 194 1 996 87United Arab Emirates 1 232 535 91 1 676 662 230
Continued

149australian food statistics 2004 149
f o o d b a l a n c e s h e e t s
9.6 Supply and consumption of vegetables, by selected country a continued
Domestic supply Food consumption
Production Imports Exports Total b Volume Perperson
kt kt kt kt kt kg
Central America 11 335 718 4 234 7 820 7 159 52
North America 39 922 7 374 4 569 42 727 40 071 126Canada 2 339 2 304 632 4 012 3 798 122Mexico 9 339 373 3 463 6 250 5 713 57United States 37 583 5 070 3 938 38 715 36 273 126
South America 19 450 905 1 301 19 054 16 319 46Argentina 3 058 210 223 3 045 2 721 73Brazil 7 483 278 197 7 564 6 767 39Chile 2 656 13 639 2 030 1 548 100Uruguay 159 47 1 205 180 53
Oceania 3 435 359 689 3 105 2 921 95Australia 1 897 251 230 1 918 1 864 96New Zealand 997 73 456 613 536 141
World 776 005 41 182 43 236 774 192 682 112 111
a Annual average, 2000–2002. Does not include starchy roots. b Takes account of stock changes. c Not including Middle East countries.Source: Food and Agriculture Organisation, FAOSTAT nutrition data.

150 australian food statistics 2004150
f o o d b a l a n c e s h e e t s
9.7 Supply and consumption of fruit, by selected country a
Domestic supply Food consumption
Production Imports Exports Total b Volume Perperson
kt kt kt kt kt kg
Africa 60 757 920 4 122 57 602 43 186 53Egypt 7 243 104 251 7 106 6 379 92Nigeria 9 023 40 0 9 062 8 128 69South Africa 4 906 25 2 093 2 860 1 626 37
Asia c 201 341 12 706 13 703 200 231 173 304 47China 68 479 2 817 2 480 68 816 58 664 45India 45 103 286 341 45 048 38 830 38Indonesia 8 684 300 307 8 677 7 896 37Japan 3 905 3 922 32 7 795 6 827 54Korea, Rep. of 2 686 860 45 3 501 3 235 69Malaysia 1 172 545 318 1 399 1 223 52Pakistan 5 405 171 288 5 288 5 070 35Philippines 11 098 188 2 569 8 716 7 690 100Thailand 7 660 96 1 740 6 016 5 541 90Viet Nam 4 491 85 165 4 413 4 039 51
Europe 75 714 46 257 28 230 93 943 59 978 83Austria 1 060 1 186 644 1 605 1 050 130Belgium 610 4 104 3 853 889 741 72Czech Republic 489 584 213 860 723 71Denmark 36 861 192 622 596 112France 10 990 5 816 2 405 14 402 5 826 98Germany 5 235 9 150 2 827 11 543 9 760 119Greece 4 065 336 1 531 2 903 1 758 161Italy 17 425 2 301 4 171 15 605 8 029 140Malta 7 29 2 34 31 78Netherlands 606 4 254 2 684 2 128 2 073 130Norway 25 498 5 518 504 112Poland 2 893 1 250 1 461 2 714 2 002 52Portugal 1 876 625 126 2 386 1 286 128Russian Federation 3 367 3 165 64 6 511 5 888 41Slovenia 268 163 31 400 272 137Spain 15 499 1 162 5 775 11 011 4 696 115Sweden 35 1 006 74 967 916 103Turkey 10 859 145 2 341 8 663 7 162 103United Kingdom 312 5 591 270 5 633 5 470 93
Middle EastIran 12 607 151 885 11 877 10 557 157Kuwait 11 128 20 125 119 51Saudi Arabia 1 244 1 110 180 2 174 2 094 92United Arab Emirates 795 824 328 1 292 345 120
Continued
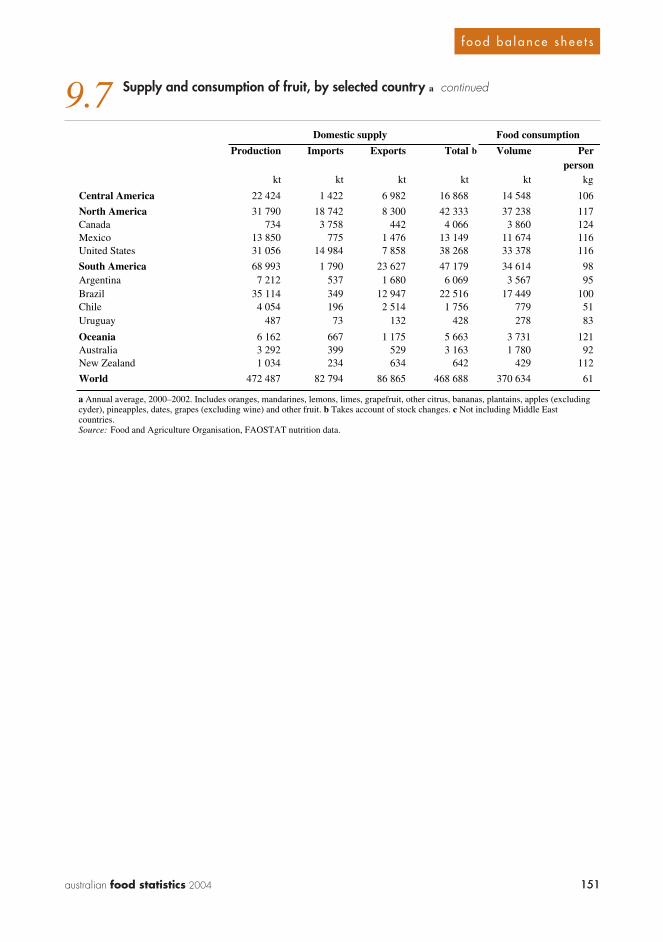
151australian food statistics 2004 151
f o o d b a l a n c e s h e e t s
9.7 Supply and consumption of fruit, by selected country a continued
Domestic supply Food consumption
Production Imports Exports Total b Volume Perperson
kt kt kt kt kt kg
Central America 22 424 1 422 6 982 16 868 14 548 106
North America 31 790 18 742 8 300 42 333 37 238 117Canada 734 3 758 442 4 066 3 860 124Mexico 13 850 775 1 476 13 149 11 674 116United States 31 056 14 984 7 858 38 268 33 378 116
South America 68 993 1 790 23 627 47 179 34 614 98Argentina 7 212 537 1 680 6 069 3 567 95Brazil 35 114 349 12 947 22 516 17 449 100Chile 4 054 196 2 514 1 756 779 51Uruguay 487 73 132 428 278 83
Oceania 6 162 667 1 175 5 663 3 731 121Australia 3 292 399 529 3 163 1 780 92New Zealand 1 034 234 634 642 429 112
World 472 487 82 794 86 865 468 688 370 634 61
a Annual average, 2000–2002. Includes oranges, mandarines, lemons, limes, grapefruit, other citrus, bananas, plantains, apples (excluding cyder), pineapples, dates, grapes (excluding wine) and other fruit. b Takes account of stock changes. c Not including Middle East countries.Source: Food and Agriculture Organisation, FAOSTAT nutrition data.
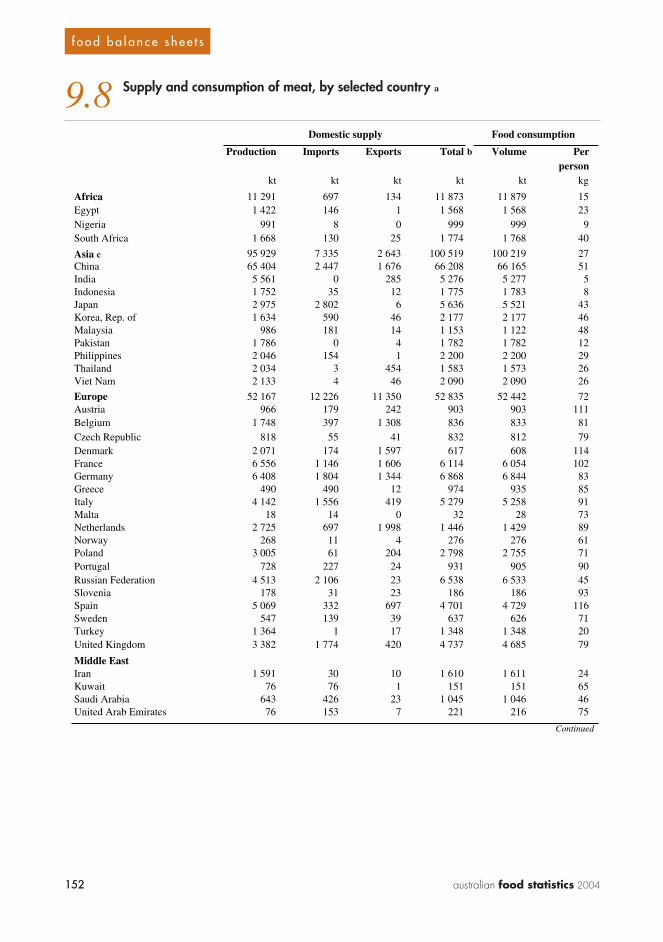
152 australian food statistics 2004152
f o o d b a l a n c e s h e e t s
9.8 Supply and consumption of meat, by selected country a
Domestic supply Food consumption
Production Imports Exports Total b Volume Perperson
kt kt kt kt kt kg
Africa 11 291 697 134 11 873 11 879 15Egypt 1 422 146 1 1 568 1 568 23Nigeria 991 8 0 999 999 9South Africa 1 668 130 25 1 774 1 768 40
Asia c 95 929 7 335 2 643 100 519 100 219 27China 65 404 2 447 1 676 66 208 66 165 51India 5 561 0 285 5 276 5 277 5Indonesia 1 752 35 12 1 775 1 783 8Japan 2 975 2 802 6 5 636 5 521 43Korea, Rep. of 1 634 590 46 2 177 2 177 46Malaysia 986 181 14 1 153 1 122 48Pakistan 1 786 0 4 1 782 1 782 12Philippines 2 046 154 1 2 200 2 200 29Thailand 2 034 3 454 1 583 1 573 26Viet Nam 2 133 4 46 2 090 2 090 26
Europe 52 167 12 226 11 350 52 835 52 442 72Austria 966 179 242 903 903 111Belgium 1 748 397 1 308 836 833 81Czech Republic 818 55 41 832 812 79Denmark 2 071 174 1 597 617 608 114France 6 556 1 146 1 606 6 114 6 054 102Germany 6 408 1 804 1 344 6 868 6 844 83Greece 490 490 12 974 935 85Italy 4 142 1 556 419 5 279 5 258 91Malta 18 14 0 32 28 73Netherlands 2 725 697 1 998 1 446 1 429 89Norway 268 11 4 276 276 61Poland 3 005 61 204 2 798 2 755 71Portugal 728 227 24 931 905 90Russian Federation 4 513 2 106 23 6 538 6 533 45Slovenia 178 31 23 186 186 93Spain 5 069 332 697 4 701 4 729 116Sweden 547 139 39 637 626 71Turkey 1 364 1 17 1 348 1 348 20United Kingdom 3 382 1 774 420 4 737 4 685 79
Middle EastIran 1 591 30 10 1 610 1 611 24Kuwait 76 76 1 151 151 65Saudi Arabia 643 426 23 1 045 1 046 46United Arab Emirates 76 153 7 221 216 75
Continued

153australian food statistics 2004 153
f o o d b a l a n c e s h e e t s
9.8 Supply and consumption of meat, by selected country a continued
Domestic supply Food consumption
Production Imports Exports Total b Volume Perperson
kt kt kt kt kt kg
Central America 5 637 1 316 161 6 794 6 791 49
North America 42 154 2 653 6 224 38 516 38 203 120Canada 4 140 566 1 422 3 272 3 111 100Mexico 4 639 1 213 89 5 767 5 767 57United States 38 014 2 087 4 802 35 244 35 092 122
South America 26 872 374 3 271 23 999 23 538 67Argentina 3 990 95 366 3 719 3 601 96Brazil 16 354 62 2 487 13 929 13 931 80Chile 934 112 95 951 960 62Uruguay 530 13 268 295 293 87
Oceania 5 527 193 2 555 3 166 2 992 97Australia 3 808 50 1 673 2 185 2 110 109New Zealand 1 312 44 879 477 386 101
World 240 411 25 131 26 342 238 868 237 185 39
a Annual average, 2000–2002. Includes beef and veal, mutton, goat meat, pigmeat, poultry meat and other meat and offal. b Takes account of stock changes. c Not including Middle East countries.Source: Food and Agriculture Organisation, FAOSTAT nutrition data.

154 australian food statistics 2004154
f o o d b a l a n c e s h e e t s
9.9 Supply and consumption of eggs, by selected country a
Domestic supply Food consumption
Production Imports Exports Total b Volume Perperson
kt kt kt kt kt kg
Africa 1 997 37 12 2 022 1 669 2Egypt 192 0 0 192 156 2Nigeria 430 0 0 430 379 3South Africa 339 0 7 333 265 6
Asia c 34 518 236 255 34 498 30 898 8China 23 866 90 75 23 882 21 678 17India 1 873 0 29 1 844 1 556 2Indonesia 848 2 3 847 695 3Japan 2 521 43 0 2 564 2 443 19Korea, Rep. of 538 3 0 541 478 10Malaysia 422 2 82 341 272 12Pakistan 360 0 1 359 305 2Philippines 535 3 0 539 488 6Thailand 804 2 7 799 607 10Viet Nam 204 0 2 202 187 2
Europe 9 763 807 866 9 715 8 956 12Austria 87 26 7 106 102 13Belgium 185 54 112 128 109 11Czech Republic 183 4 7 180 161 16Denmark 79 28 12 95 83 16France 1 019 94 91 1 022 930 16Germany 886 284 86 1 084 1 037 13Greece 110 4 1 113 101 9Italy 710 46 17 739 695 12Malta 6 1 0 7 5 13Netherlands 638 66 366 338 278 17Norway 48 1 2 47 43 10Poland 456 3 4 459 427 11Portugal 123 9 9 122 103 10Russian Federation 1 969 8 8 1 976 1 917 13Slovenia 23 2 1 24 21 10Spain 673 17 55 635 577 14Sweden 98 11 5 104 97 11Turkey 582 2 8 577 516 8United Kingdom 653 65 17 701 626 11
Middle EastIran 583 0 30 553 452 7Kuwait 22 6 1 28 24 10Saudi Arabia 128 6 7 127 87 4United Arab Emirates 16 22 1 38 35 12
Continued

155australian food statistics 2004 155
f o o d b a l a n c e s h e e t s
9.9 Supply and consumption of eggs, by selected country a continued
Domestic supply Food consumption
Production Imports Exports Total b Volume Perperson
kt kt kt kt kt kg
Central America 2 136 26 11 2 150 1 845 13
North America 5 456 51 121 5 385 4 553 14Canada 384 41 19 405 361 12Mexico 1 860 13 1 1 872 1 601 16United States 5 071 10 102 4 980 4 192 15
South America 2 917 18 22 2 913 2 300 7Argentina 320 3 1 322 274 7Brazil 1 593 0 9 1 585 1 237 7Chile 113 0 1 112 85 6Uruguay 34 0 0 34 28 8
Oceania 199 5 2 202 161 5Australia 141 1 1 142 111 6New Zealand 46 0 1 46 37 10
World 57 153 1 189 1 290 57 062 50 523 8
a Annual average, 2000–2002. b Takes account of stock changes. c Not including Middle East countries.Source: Food and Agriculture Organisation, FAOSTAT nutrition data.

156 australian food statistics 2004156
f o o d b a l a n c e s h e e t s
9.10 Supply and consumption of seafood, by selected country a
Domestic supply Food consumption
Production Imports Exports Total b Volume Perperson
kt kt kt kt kt kg
Africa 7 184 2 327 2 040 3 374 6 345 8Egypt 756 549 2 1 303 1 038 15Nigeria 473 413 3 882 869 7South Africa 722 121 242 601 322 7
Asia c 77 388 20 779 9 472 86 424 66 277 18China 43 288 8 735 4 118 47 913 33 201 26India 5 872 67 493 5 446 4 953 5Indonesia 4 958 581 598 4 943 4 440 21Japan 5 555 6 102 384 11 273 8 500 67Korea, Rep. of 2 190 1 353 690 2 853 2 570 55Malaysia 1 399 475 292 1 583 1 373 59Pakistan 624 0 132 493 334 2Philippines 2 348 788 196 2 940 2 283 30Thailand 3 533 1 199 1 565 3 167 1 904 31Viet Nam 1 993 69 470 1 592 1 442 18
Europe 17 528 20 713 16 467 20 685 14 987 21Austria 3 152 6 149 114 14Belgium na na na na na naCzech Republic 25 211 19 216 139 14Denmark 1 561 1 559 2 563 564 131 25France 869 2 028 784 2 113 1 854 31Germany 267 2 664 1 768 1 247 1 216 15Greece 193 500 110 584 252 23Italy 524 1 545 212 1 856 1 463 25Malta 2 32 3 31 18 46Netherlands 571 1 200 1 023 797 381 24Norway 3 198 931 2 565 1 582 241 54Poland 259 414 266 406 506 13Portugal 198 605 136 666 583 58Russian Federation 3 826 1 257 1 415 3 676 2 726 19Slovenia 3 30 4 30 15 7Spain 1 384 2 339 1 199 2 524 1 911 47Sweden 327 478 520 285 286 32Turkey 589 197 51 735 504 7United Kingdom 915 2 355 874 2 398 1 339 23
Middle EastIran 408 256 7 656 318 5Kuwait 6 15 1 22 19 8Saudi Arabia 57 140 3 194 169 7United Arab Emirates 118 23 10 134 70 24
Continued
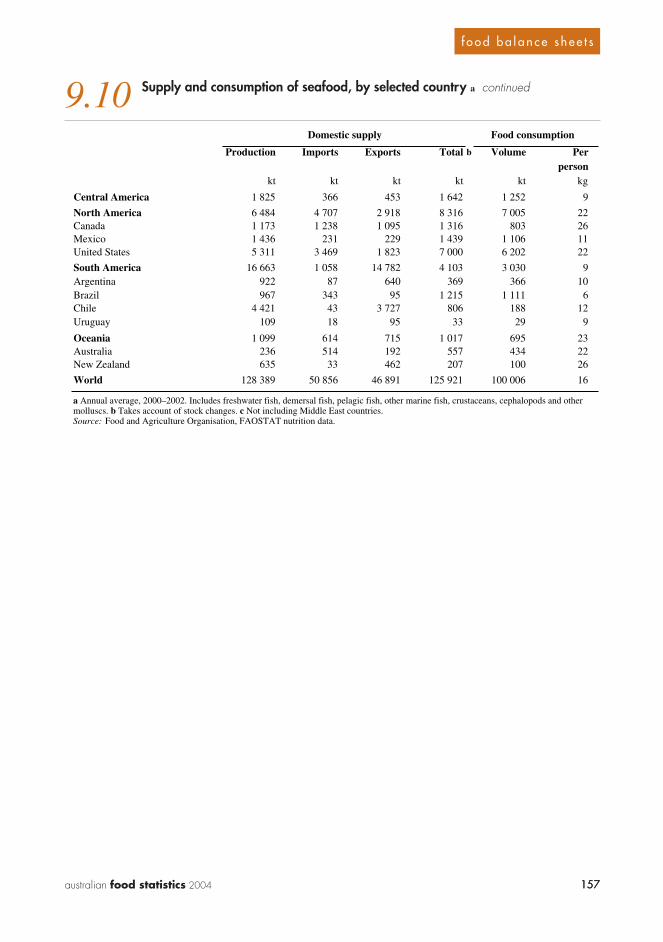
157australian food statistics 2004 157
f o o d b a l a n c e s h e e t s
9.10 Supply and consumption of seafood, by selected country a continued
Domestic supply Food consumption
Production Imports Exports Total b Volume Perperson
kt kt kt kt kt kg
Central America 1 825 366 453 1 642 1 252 9
North America 6 484 4 707 2 918 8 316 7 005 22Canada 1 173 1 238 1 095 1 316 803 26Mexico 1 436 231 229 1 439 1 106 11United States 5 311 3 469 1 823 7 000 6 202 22
South America 16 663 1 058 14 782 4 103 3 030 9Argentina 922 87 640 369 366 10Brazil 967 343 95 1 215 1 111 6Chile 4 421 43 3 727 806 188 12Uruguay 109 18 95 33 29 9
Oceania 1 099 614 715 1 017 695 23Australia 236 514 192 557 434 22New Zealand 635 33 462 207 100 26
World 128 389 50 856 46 891 125 921 100 006 16
a Annual average, 2000–2002. Includes freshwater fish, demersal fish, pelagic fish, other marine fish, crustaceans, cephalopods and other molluscs. b Takes account of stock changes. c Not including Middle East countries.Source: Food and Agriculture Organisation, FAOSTAT nutrition data.
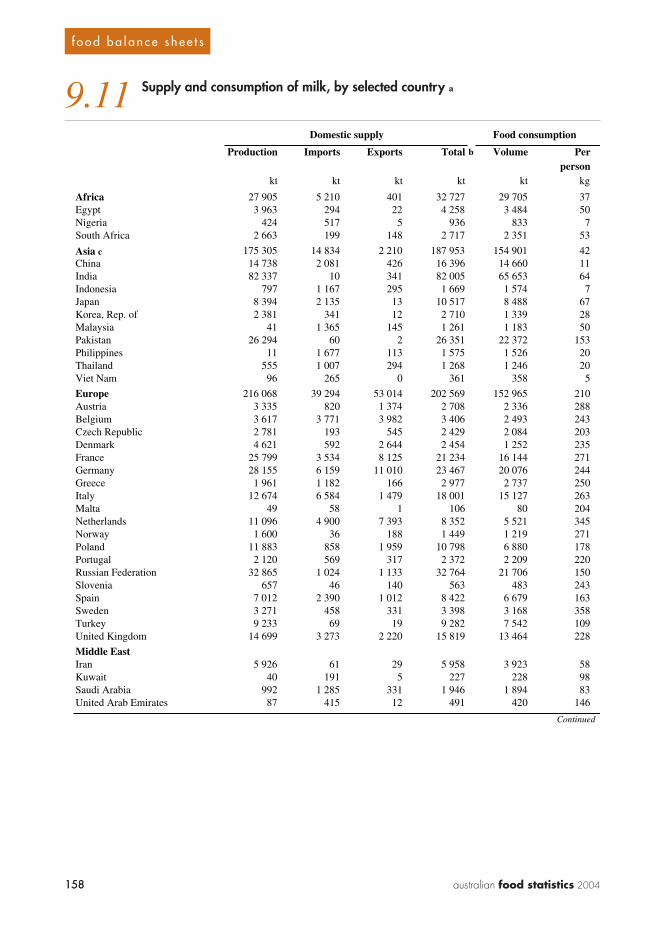
158 australian food statistics 2004158
f o o d b a l a n c e s h e e t s
9.11 Supply and consumption of milk, by selected country a
Domestic supply Food consumption
Production Imports Exports Total b Volume Perperson
kt kt kt kt kt kg
Africa 27 905 5 210 401 32 727 29 705 37Egypt 3 963 294 22 4 258 3 484 50Nigeria 424 517 5 936 833 7South Africa 2 663 199 148 2 717 2 351 53
Asia c 175 305 14 834 2 210 187 953 154 901 42China 14 738 2 081 426 16 396 14 660 11India 82 337 10 341 82 005 65 653 64Indonesia 797 1 167 295 1 669 1 574 7Japan 8 394 2 135 13 10 517 8 488 67Korea, Rep. of 2 381 341 12 2 710 1 339 28Malaysia 41 1 365 145 1 261 1 183 50Pakistan 26 294 60 2 26 351 22 372 153Philippines 11 1 677 113 1 575 1 526 20Thailand 555 1 007 294 1 268 1 246 20Viet Nam 96 265 0 361 358 5
Europe 216 068 39 294 53 014 202 569 152 965 210Austria 3 335 820 1 374 2 708 2 336 288Belgium 3 617 3 771 3 982 3 406 2 493 243Czech Republic 2 781 193 545 2 429 2 084 203Denmark 4 621 592 2 644 2 454 1 252 235France 25 799 3 534 8 125 21 234 16 144 271Germany 28 155 6 159 11 010 23 467 20 076 244Greece 1 961 1 182 166 2 977 2 737 250Italy 12 674 6 584 1 479 18 001 15 127 263Malta 49 58 1 106 80 204Netherlands 11 096 4 900 7 393 8 352 5 521 345Norway 1 600 36 188 1 449 1 219 271Poland 11 883 858 1 959 10 798 6 880 178Portugal 2 120 569 317 2 372 2 209 220Russian Federation 32 865 1 024 1 133 32 764 21 706 150Slovenia 657 46 140 563 483 243Spain 7 012 2 390 1 012 8 422 6 679 163Sweden 3 271 458 331 3 398 3 168 358Turkey 9 233 69 19 9 282 7 542 109United Kingdom 14 699 3 273 2 220 15 819 13 464 228
Middle EastIran 5 926 61 29 5 958 3 923 58Kuwait 40 191 5 227 228 98Saudi Arabia 992 1 285 331 1 946 1 894 83United Arab Emirates 87 415 12 491 420 146
Continued
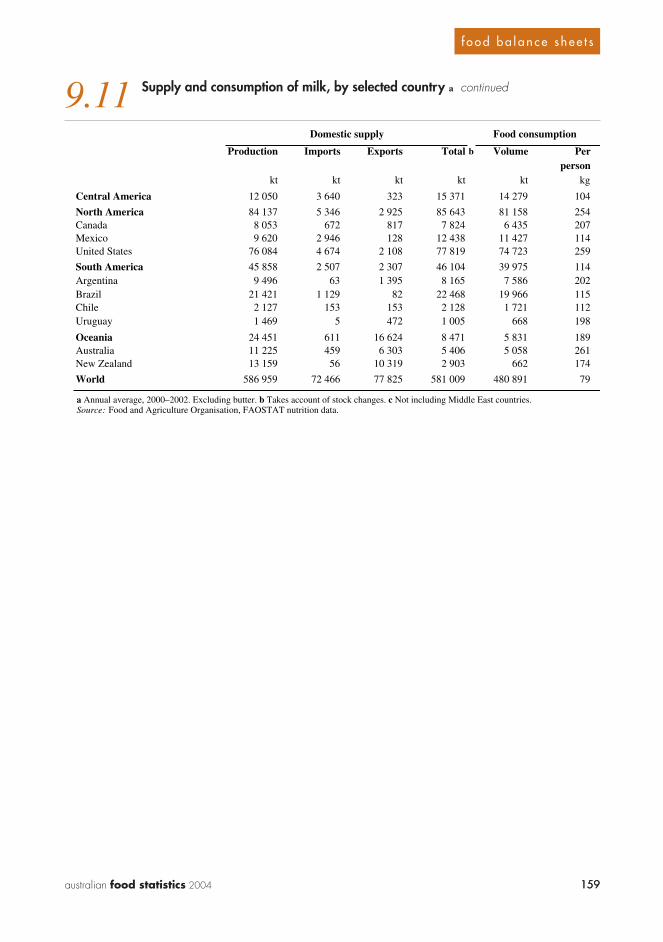
159australian food statistics 2004 159
f o o d b a l a n c e s h e e t s
9.11 Supply and consumption of milk, by selected country a continued
Domestic supply Food consumption
Production Imports Exports Total b Volume Perperson
kt kt kt kt kt kg
Central America 12 050 3 640 323 15 371 14 279 104
North America 84 137 5 346 2 925 85 643 81 158 254Canada 8 053 672 817 7 824 6 435 207Mexico 9 620 2 946 128 12 438 11 427 114United States 76 084 4 674 2 108 77 819 74 723 259
South America 45 858 2 507 2 307 46 104 39 975 114Argentina 9 496 63 1 395 8 165 7 586 202Brazil 21 421 1 129 82 22 468 19 966 115Chile 2 127 153 153 2 128 1 721 112Uruguay 1 469 5 472 1 005 668 198
Oceania 24 451 611 16 624 8 471 5 831 189Australia 11 225 459 6 303 5 406 5 058 261New Zealand 13 159 56 10 319 2 903 662 174
World 586 959 72 466 77 825 581 009 480 891 79
a Annual average, 2000–2002. Excluding butter. b Takes account of stock changes. c Not including Middle East countries.Source: Food and Agriculture Organisation, FAOSTAT nutrition data.
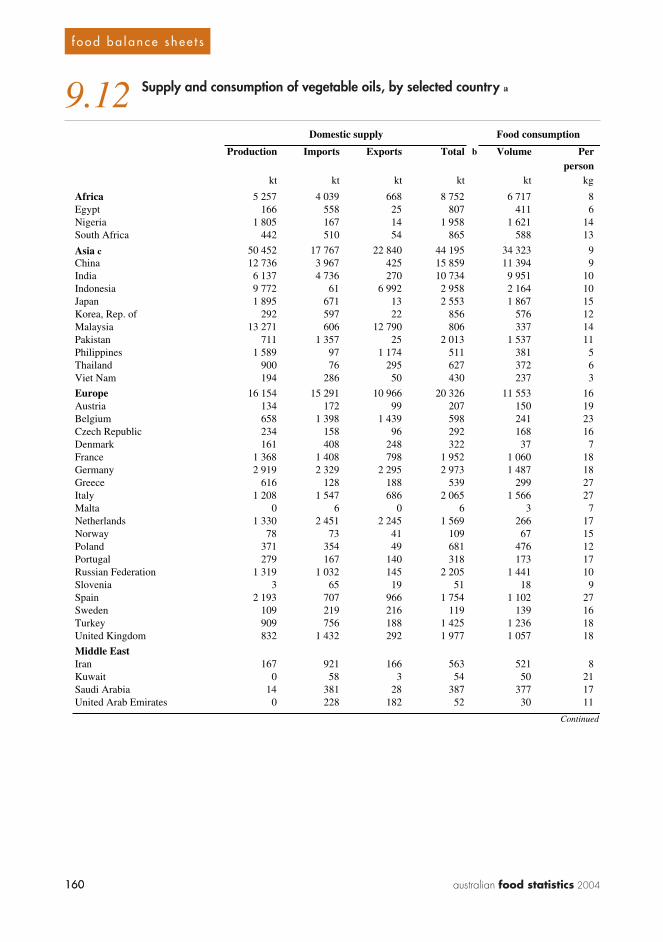
160 australian food statistics 2004160
f o o d b a l a n c e s h e e t s
9.12 Supply and consumption of vegetable oils, by selected country a
Domestic supply Food consumption
Production Imports Exports Total b Volume Perperson
kt kt kt kt kt kg
Africa 5 257 4 039 668 8 752 6 717 8Egypt 166 558 25 807 411 6Nigeria 1 805 167 14 1 958 1 621 14South Africa 442 510 54 865 588 13
Asia c 50 452 17 767 22 840 44 195 34 323 9China 12 736 3 967 425 15 859 11 394 9India 6 137 4 736 270 10 734 9 951 10Indonesia 9 772 61 6 992 2 958 2 164 10Japan 1 895 671 13 2 553 1 867 15Korea, Rep. of 292 597 22 856 576 12Malaysia 13 271 606 12 790 806 337 14Pakistan 711 1 357 25 2 013 1 537 11Philippines 1 589 97 1 174 511 381 5Thailand 900 76 295 627 372 6Viet Nam 194 286 50 430 237 3
Europe 16 154 15 291 10 966 20 326 11 553 16Austria 134 172 99 207 150 19Belgium 658 1 398 1 439 598 241 23Czech Republic 234 158 96 292 168 16Denmark 161 408 248 322 37 7France 1 368 1 408 798 1 952 1 060 18Germany 2 919 2 329 2 295 2 973 1 487 18Greece 616 128 188 539 299 27Italy 1 208 1 547 686 2 065 1 566 27Malta 0 6 0 6 3 7Netherlands 1 330 2 451 2 245 1 569 266 17Norway 78 73 41 109 67 15Poland 371 354 49 681 476 12Portugal 279 167 140 318 173 17Russian Federation 1 319 1 032 145 2 205 1 441 10Slovenia 3 65 19 51 18 9Spain 2 193 707 966 1 754 1 102 27Sweden 109 219 216 119 139 16Turkey 909 756 188 1 425 1 236 18United Kingdom 832 1 432 292 1 977 1 057 18
Middle EastIran 167 921 166 563 521 8Kuwait 0 58 3 54 50 21Saudi Arabia 14 381 28 387 377 17United Arab Emirates 0 228 182 52 30 11
Continued

161australian food statistics 2004 161
f o o d b a l a n c e s h e e t s
9.12 Supply and consumption of vegetable oils, by selected country a continued
Domestic supply Food consumption
Production Imports Exports Total b Volume Perperson
kt kt kt kt kt kg
Central America 1 334 1 108 282 2 141 1 237 9
North America 12 444 2 325 3 025 11 401 8 789 28Canada 1 537 376 720 1 173 749 24Mexico 898 784 51 1 602 924 9United States 10 907 1 948 2 305 10 228 8 040 28
South America 12 117 1 340 6 872 6 376 4 242 12Argentina 5 216 29 4 595 429 447 12Brazil 5 117 267 1 707 3 744 2 284 13Chile 35 191 16 195 164 11Uruguay 21 22 2 38 24 7
Oceania 732 383 577 571 467 15Australia 264 262 115 430 384 20New Zealand 2 86 14 77 33 9
World 98 569 42 615 45 244 94 190 67 669 11
a Annual average, 2000–2002. From soyabeans, groundnuts, sunflowerseed, rapeseed, mustardseed, cottonseed, palm kernels, palm, copra, sesameseed, olives, maize germ and other oil crops. b Takes account of stock changes. c Not including Middle East countries.Source: Food and Agriculture Organisation, FAOSTAT nutrition data.
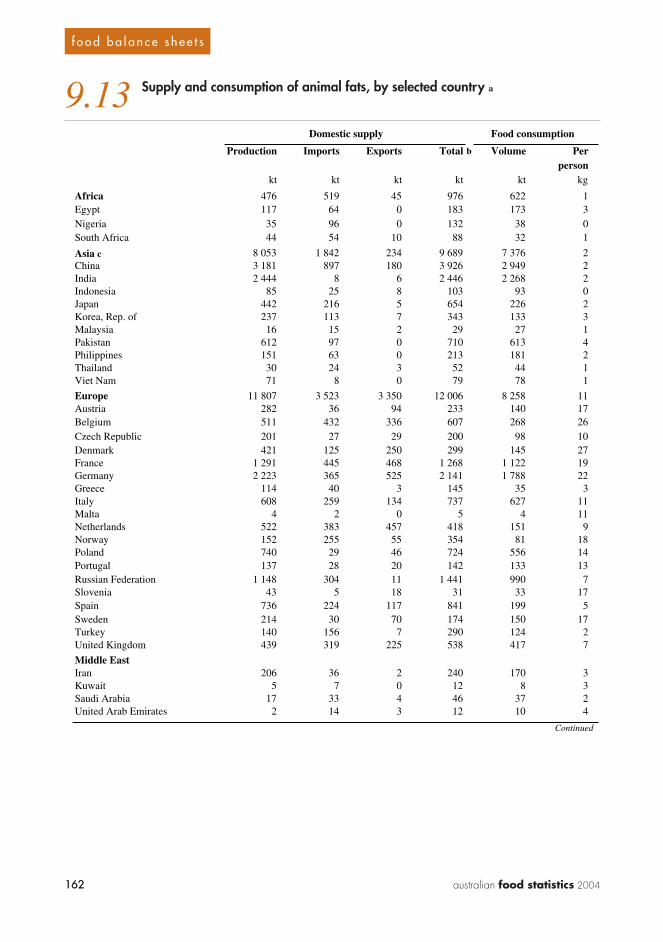
162 australian food statistics 2004162
f o o d b a l a n c e s h e e t s
9.13 Supply and consumption of animal fats, by selected country a
Domestic supply Food consumption
Production Imports Exports Total b Volume Perperson
kt kt kt kt kt kg
Africa 476 519 45 976 622 1Egypt 117 64 0 183 173 3Nigeria 35 96 0 132 38 0South Africa 44 54 10 88 32 1
Asia c 8 053 1 842 234 9 689 7 376 2China 3 181 897 180 3 926 2 949 2India 2 444 8 6 2 446 2 268 2Indonesia 85 25 8 103 93 0Japan 442 216 5 654 226 2Korea, Rep. of 237 113 7 343 133 3Malaysia 16 15 2 29 27 1Pakistan 612 97 0 710 613 4Philippines 151 63 0 213 181 2Thailand 30 24 3 52 44 1Viet Nam 71 8 0 79 78 1
Europe 11 807 3 523 3 350 12 006 8 258 11Austria 282 36 94 233 140 17Belgium 511 432 336 607 268 26Czech Republic 201 27 29 200 98 10Denmark 421 125 250 299 145 27France 1 291 445 468 1 268 1 122 19Germany 2 223 365 525 2 141 1 788 22Greece 114 40 3 145 35 3Italy 608 259 134 737 627 11Malta 4 2 0 5 4 11Netherlands 522 383 457 418 151 9Norway 152 255 55 354 81 18Poland 740 29 46 724 556 14Portugal 137 28 20 142 133 13Russian Federation 1 148 304 11 1 441 990 7Slovenia 43 5 18 31 33 17Spain 736 224 117 841 199 5Sweden 214 30 70 174 150 17Turkey 140 156 7 290 124 2United Kingdom 439 319 225 538 417 7
Middle EastIran 206 36 2 240 170 3Kuwait 5 7 0 12 8 3Saudi Arabia 17 33 4 46 37 2United Arab Emirates 2 14 3 12 10 4
Continued

163australian food statistics 2004 163
f o o d b a l a n c e s h e e t s
9.13 Supply and consumption of animal fats, by selected country a continued
Domestic supply Food consumption
Production Imports Exports Total b Volume Perperson
kt kt kt kt kt kg
Central America 346 785 27 1 107 417 3
North America 7 886 335 2 026 6 177 2 321 7Canada 1 052 161 370 844 534 17Mexico 255 566 5 816 328 3United States 6 834 174 1 657 5 333 1 787 6
South America 2 387 355 581 2 221 993 3Argentina 296 27 132 214 146 4Brazil 1 196 46 31 1 212 486 3Chile 191 147 15 305 45 3Uruguay 64 5 63 22 10 3
Oceania 1 330 59 1 112 297 195 6Australia 746 26 595 192 128 7New Zealand 575 17 515 81 49 13
World 32 335 7 545 7 376 32 649 20 248 3
a Annual average, 2000–2002. Includes butter, ghee, cream, raw animal fats, fish body oil and fish liver oil. b Takes account of stock changes. c Not including Middle East countries. Source: Food and Agriculture Organisation, FAOSTAT nutrition data.
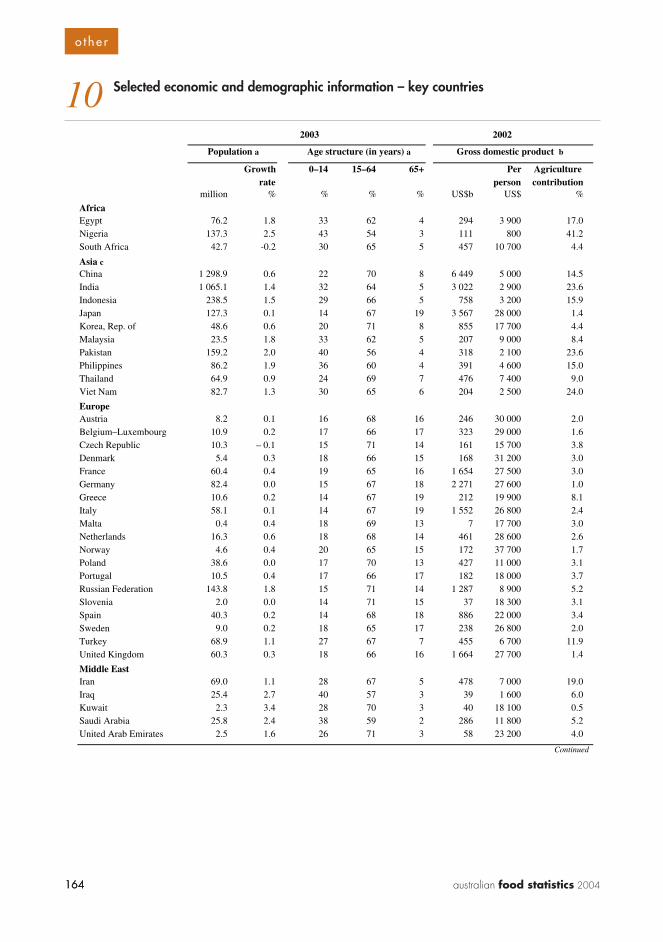
164 australian food statistics 2004164
o t h e r
10 Selected economic and demographic information – key countries
2003 2002
Population a Age structure (in years) a Gross domestic product b
Growth 0–14 15–64 65+ Per Agriculturerate person contribution
million % % % % US$b US$ %
AfricaEgypt 76.2 1.8 33 62 4 294 3 900 17.0Nigeria 137.3 2.5 43 54 3 111 800 41.2South Africa 42.7 -0.2 30 65 5 457 10 700 4.4
Asia cChina 1 298.9 0.6 22 70 8 6 449 5 000 14.5India 1 065.1 1.4 32 64 5 3 022 2 900 23.6Indonesia 238.5 1.5 29 66 5 758 3 200 15.9Japan 127.3 0.1 14 67 19 3 567 28 000 1.4Korea, Rep. of 48.6 0.6 20 71 8 855 17 700 4.4Malaysia 23.5 1.8 33 62 5 207 9 000 8.4Pakistan 159.2 2.0 40 56 4 318 2 100 23.6Philippines 86.2 1.9 36 60 4 391 4 600 15.0Thailand 64.9 0.9 24 69 7 476 7 400 9.0Viet Nam 82.7 1.3 30 65 6 204 2 500 24.0
EuropeAustria 8.2 0.1 16 68 16 246 30 000 2.0Belgium–Luxembourg 10.9 0.2 17 66 17 323 29 000 1.6Czech Republic 10.3 – 0.1 15 71 14 161 15 700 3.8Denmark 5.4 0.3 18 66 15 168 31 200 3.0France 60.4 0.4 19 65 16 1 654 27 500 3.0Germany 82.4 0.0 15 67 18 2 271 27 600 1.0Greece 10.6 0.2 14 67 19 212 19 900 8.1Italy 58.1 0.1 14 67 19 1 552 26 800 2.4Malta 0.4 0.4 18 69 13 7 17 700 3.0Netherlands 16.3 0.6 18 68 14 461 28 600 2.6Norway 4.6 0.4 20 65 15 172 37 700 1.7Poland 38.6 0.0 17 70 13 427 11 000 3.1Portugal 10.5 0.4 17 66 17 182 18 000 3.7Russian Federation 143.8 1.8 15 71 14 1 287 8 900 5.2Slovenia 2.0 0.0 14 71 15 37 18 300 3.1Spain 40.3 0.2 14 68 18 886 22 000 3.4Sweden 9.0 0.2 18 65 17 238 26 800 2.0Turkey 68.9 1.1 27 67 7 455 6 700 11.9United Kingdom 60.3 0.3 18 66 16 1 664 27 700 1.4
Middle EastIran 69.0 1.1 28 67 5 478 7 000 19.0Iraq 25.4 2.7 40 57 3 39 1 600 6.0Kuwait 2.3 3.4 28 70 3 40 18 100 0.5Saudi Arabia 25.8 2.4 38 59 2 286 11 800 5.2United Arab Emirates 2.5 1.6 26 71 3 58 23 200 4.0
Continued
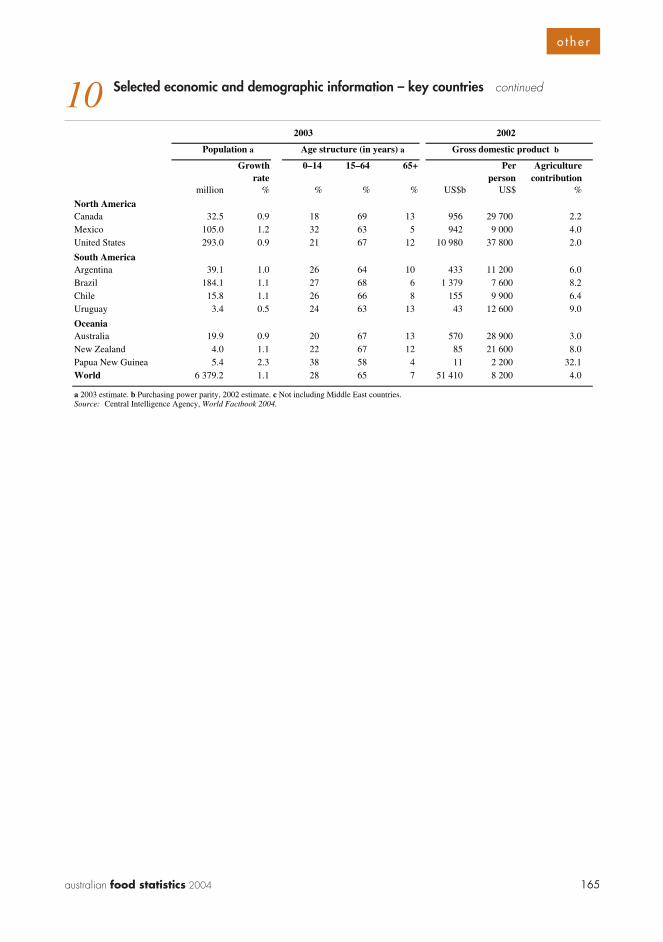
165australian food statistics 2004
o t h e r
10 Selected economic and demographic information – key countries continued
2003 2002
Population a Age structure (in years) a Gross domestic product b
Growth 0–14 15–64 65+ Per Agriculturerate person contribution
million % % % % US$b US$ %
North AmericaCanada 32.5 0.9 18 69 13 956 29 700 2.2Mexico 105.0 1.2 32 63 5 942 9 000 4.0United States 293.0 0.9 21 67 12 10 980 37 800 2.0
South AmericaArgentina 39.1 1.0 26 64 10 433 11 200 6.0Brazil 184.1 1.1 27 68 6 1 379 7 600 8.2Chile 15.8 1.1 26 66 8 155 9 900 6.4Uruguay 3.4 0.5 24 63 13 43 12 600 9.0
OceaniaAustralia 19.9 0.9 20 67 13 570 28 900 3.0New Zealand 4.0 1.1 22 67 12 85 21 600 8.0Papua New Guinea 5.4 2.3 38 58 4 11 2 200 32.1World 6 379.2 1.1 28 65 7 51 410 8 200 4.0
a 2003 estimate. b Purchasing power parity, 2002 estimate. c Not including Middle East countries. Source: Central Intelligence Agency, World Factbook 2004.
D E P A R T M E N T O F A G R I C U L T U R E , F I S H E R I E S A N D F O R E S T R Y
Australian FoodStatistics 2004
Australian FoodStatistics 2004
The food industry is Australia’s largestmanufacturing sector, producing a widerange of world class products for a varietyof markets.
Australian Food Statistics 2004 provides a statistical overview of the Australian foodindustry’s performance, from ‘the paddockto the plate’.
The Australian Government Department of Agriculture, Fisheries and Forestry haspolicy responsibility for the entire foodproduction and processing chain. TheDepartment is working with the industryfor improved international competitiveness,innovation and an export focus.
For further information or to providefeedback please contact:
Food Policy & Communications SectionAustralian Government Department ofAgriculture, Fisheries and Forestry
P 02 6272 4161
F 02 6272 4367
www.daff.gov.au/foodinfo
Australian Food Statistics 2004