Australian Facebook Performance Report · 7 Australian Facebook Performance Report March 2012...
34
Australian Facebook Performance Report [ March 2012
Transcript of Australian Facebook Performance Report · 7 Australian Facebook Performance Report March 2012...

Australian Facebook Performance Report
[ March 2012

2 [ The Authors
Australian Facebook Performance Report March 2012#fbreport // [email protected] // www.theonlinecircle.com[ The Authors
[ Alan Long is the General Manager of Online Circle’s Social Media Analysis and Insight business - Online 1984. He heads a team of analysts and developers to deliver clients with behavioural insights based on observed activity.
With an extensive media career Alan is one of the most respected authorities on Internet communication in Australia.
Formerly Research Director for Experian Hitwise Asia Pacific, he has spent more than 18 years working in the Digital Marketing arena as a publisher, strategist and senior analyst, for companies such as TextMedia, BMC Media and Sensis.
Working with some of the world’s major brands globally, he has developed a unique appreciation of the crucial role that expert analysis plays in maximising the effective online presence and enhancing the continuous brand dialogue with customers, stakeholders and the media.
@alanlong
[ Lucio Ribeiro is the Digital strategist at Online Circle. His elite marketing skills were honed early in his career. He was one of Brazil’s youngest and most celebrated advertising professionals during the 1990’s.
With more than 15 years marketing experience, Lucio Ribeiro has worked for many of the world’s most prestigious advertising agencies including: McCann-Erickson, Ammiratis Puris Lintas, Lowe, MRM and Ogilvy Brazil. His clientele has included prominent organisations such as GM, Unilever, Nestle, Cadbury, Kraft Foods, Mercedes-Benz, Australian Paper and Microsoft.
Lucio is very active in the social media industry. His credentials are highly regarded having won him many rankings and awards. In 2011 Lucio spoke at over 15 events in Australia, with a combined audience of over 300,000 people having listened to his ideas about Digital Marketing for large brands.
Lucio’s opinions and views are sought by Australian media outlets such as The Age, Herald Sun, Fox News, Anthill Magazine, MX newspaper and others. In 2012 he was a jury member for the 2012 AME Awards (part of New York festival).
Lucio has been based in Melbourne for the last 7 years.
@lucio_ribeiro

3 [ Table of Contents
Australian Facebook Performance Report March 2012#fbreport // [email protected] // www.theonlinecircle.com[ Table of Contents
Introduction 4 - 5
Automotive 6 -7
Banking & Financial 8 - 9
Energy & Utilities 10 - 11
Telecommunications 12 - 13
Pharmaceuticals 14 - 15
Travel - Airlines 16 - 17
Travel - Accommodation 18 - 19
Retail - Department Stores 20 - 21
Retail - Fashion 22 - 23
Retail - Grocery & Liquor 24 - 25
FMCG - Beverages 26 - 27
FMCG - Snackfoods 28 - 29
Facebook Tips for Champions 30 - 31
Methodology 32 - 33
About Us 34
4
Australian Facebook Performance Report March 2012#fbreport // [email protected] // www.theonlinecircle.com
Rank Industry Ave. Fans Fan Growth % GrowthNo. of Engagements
Engagement Rate
Jan-12 Mar-12
1 1 FMCG - Snackfoods 2,699,775 303,791 11.9% 91,700 3.4%
2 2 Retail - Fashion 2,553,288 140,814 5.7% 71,365 2.8%
3 3 FMCG - Beverages 1,986,256 146,644 7.6% 44,083 2.2%
4 4 Department Stores 978,079 69,605 7.5% 26,751 2.7%
5 5 Automotive 896,914 48,033 13.0% 36,346 4.1%
6 8 Retail - Grocery & Alcohol 711,761 53,018 7.7% 31,004 4.4%
7 6 Travel - Airlines 553,682 26,993 5.0% 12,194 2.2%
8 7 Telecommunications 444,053 36,935 8.7% 14,224 3.2%
9 10 Banking & Financial 278,737 15,243 5.7% 8,201 2.9%
10 9 Travel - Accommodation 258,950 49,492 20.9% 15,825 6.1%
11 11 Pharmaceutical 149,229 19,990 14.5% 7,833 5.2%
12 12 Energy & Utilities 44,542 1,516 3.5% 790 1.8%
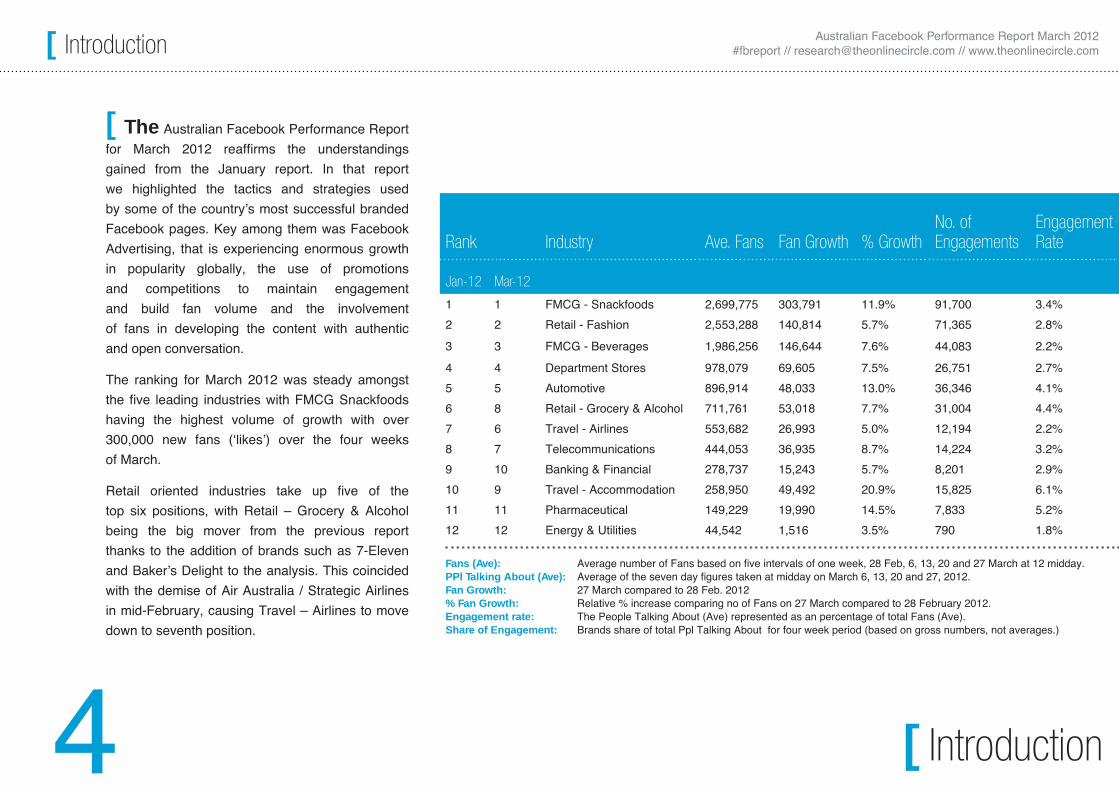
[ The Australian Facebook Performance Report for March 2012 reaffirms the understandings gained from the January report. In that report we highlighted the tactics and strategies used by some of the country’s most successful branded Facebook pages. Key among them was Facebook Advertising, that is experiencing enormous growth in popularity globally, the use of promotions and competitions to maintain engagement and build fan volume and the involvement of fans in developing the content with authentic and open conversation.
The ranking for March 2012 was steady amongst the five leading industries with FMCG Snackfoods having the highest volume of growth with over 300,000 new fans (‘likes’) over the four weeks of March.
Retail oriented industries take up five of the top six positions, with Retail – Grocery & Alcohol being the big mover from the previous report thanks to the addition of brands such as 7-Eleven and Baker’s Delight to the analysis. This coincided with the demise of Air Australia / Strategic Airlines in mid-February, causing Travel – Airlines to move down to seventh position.
Fans (Ave): Average number of Fans based on five intervals of one week, 28 Feb, 6, 13, 20 and 27 March at 12 midday.PPl Talking About (Ave): Average of the seven day figures taken at midday on March 6, 13, 20 and 27, 2012.Fan Growth: 27 March compared to 28 Feb. 2012% Fan Growth: Relative % increase comparing no of Fans on 27 March compared to 28 February 2012.Engagement rate: The People Talking About (Ave) represented as an percentage of total Fans (Ave).Share of Engagement: Brands share of total Ppl Talking About for four week period (based on gross numbers, not averages.)
Any Brands shaded grey fall below the level of statistical confidence (of engagement rate) and have not been included in
the industry average calculations.
[ Introduction
[ Introduction

5
Australian Facebook Performance Report March 2012#fbreport // [email protected] // www.theonlinecircle.com[ Introduction
The addition of CUA in the Banking & Financial Institutions industry supported its one position upwards move to the ninth most followed industry.
All industries grew their volume of fans (‘likes’) highlighting the Facebook users willingness to engage in mutually beneficial support of specific brands that relate to their lifestyle and how they view themselves.
The highest relative fan growth was experienced by some of the less followed industries Travel – Accommodation (+20.9%) and Pharmaceutical (+14.5%), while Automotive increased by 13.0% and the most followed industry, FMCG – Snackfoods, was able to increase their fanbase 11.9%.
No surprise that the two fastest growing industries also experienced the highest engagement rate, as growth was underpinned by promotional and marketing activities across a multitude of brands, Travel – Accommodation with 6.1% and Pharmaceutical with an engagement rate of 5.2%.
Retail – Grocery & Alcohol and Automotive also had standout engagement rates of 4.4% and 4.1% respectively in highly competitive industries
with strong promotional and marketing activity support driving the performance.
When reading this document be aware that some topline comparisons may lead to misunderstanding of the data or the correlation of the key metrics that make up the engagement rate. Brands with high level of fans tend to have a lower level of engagement as it is difficult to mobilise or activate large volumes of people every month, while those brands with smaller fan levels and that are growing quickly due to promotion etc will have artificially high engagement rates that may prove to be unsustainable.
Data for this report was collected on February 28, March 6, 13, 20 and 27. Please review the methodology at the rear of the report for a clear understanding of each metric.
If you’d like to be notified of future reports go to w w w . f a c e b o o k . c o m / f a c e b o o k - r e p o r t to register.
[ Introduction

6
Australian Facebook Performance Report March 2012#fbreport // [email protected] // www.theonlinecircle.com[ Automotive
[ Automotive
[ The month of March saw substantial increases across a number of metrics - including a substantial lift in engagement for Australia’s leading automotive brands on Facebook, to 4.1% from 2.6% in the January 2012 report.
The automotive industry stayed steady as the fifth ranked amongst the reviewed industries and experienced the seventh highest volume of fan growth, but the third highest in a relative sense.
Holden, Kia, Toyota, Jeep and Hyundai continue to hold down the top five positions, with Holden, Toyota and Jeep continuing to experience strong fan growth across the month while Kia and Hyundai have stalled dropping a few fans over the same period.
The big mover for the month was Mazda, responsible for the highest level of engagement (24.8% of the industry total) a high level of engagement (28.3%) being responsible for a major part of
the overall industries growth to 4.1% compared to 2.6% in the previous report (January 2012). This growth was generated via an emphasis on promotional elements throughout the month.
Jeep’s strong performance across all metrics was due to the launch of the new Wrangler and the Win A Compass promotion, while Holden’s leadership was underpinned by the completion of the Barina Beats competition.
Engagement for Australia’s leading automotive brands on Facebook has grown from 2.6% to 4.1%.

7
Australian Facebook Performance Report March 2012#fbreport // [email protected] // www.theonlinecircle.com
Fans (Ave): Average number of Fans based on five intervals of one week, 28 Feb, 6, 13, 20 and 27 March at 12 midday.PPl Talking About (Ave): Average of the seven day figures taken at midday on March 6, 13, 20 and 27, 2012.Fan Growth: 27 March compared to 28 Feb. 2012% Fan Growth: Relative % increase comparing no of Fans on 27 March compared to 28 February 2012.Engagement rate: The People Talking About (Ave) represented as an percentage of total Fans (Ave).Share of Engagement: Brands share of total Ppl Talking About for four week period (based on gross numbers, not averages.)
Any Brands shaded grey fall below the level of statistical confidence (of engagement rate)
and have not been included in the industry average calculations.
Rank Brand Ave. FansPeople Talking About
Fan Growth % Fan Growth Engagement Rate
Share of Engagement Activity
Mar-12 Jan-12 Mar-12 Jan-12 Mar-12 Jan-12
Industry 896,914 36,346 48,033 4.1% 2.6%
1 1 Holden 267,753 5,945 8,430 3.3% 2.7% 2.2% 0.9% 16.4%
2 2 Kia Australia 108,278 1,313 -20 0.0% 2.8% 1.2% 1.5% 3.6%
3 3 Toyota Australia 85,086 2,686 3,601 4.4% 5.4% 3.2% 3.4% 7.4%
4 4 Jeep Australia 74,043 5,593 6,870 10.2% 1.3% 7.6% 1.1% 15.4%
5 5 Hyundai Australia 48,707 386 -42 -0.1% 38.9% 0.8% 13.1% 1.1%
6 17 Mazda Australia 31,842 9,007 16,496 107.5% 12.7% 28.3% 7.0% 24.8%
7 8 Lexus Australia 29,873 1,186 1,747 6.2% 12.9% 4.0% 7.2% 3.3%
8 12 BMW Australia 28,988 2,143 2,740 10.4% 18.6% 7.4% 7.6% 5.9%
9 6 Official Toll Holden Racing Team 27,042 824 509 1.9% 2.1% 3.0% 1.2% 2.3%
10 7 Suzuki Australia 27,032 270 227 0.8% 2.8% 1.0% 1.2% 0.7%
11 9 Ford Australia 25,558 530 524 2.1% 4.5% 2.1% 2.2% 1.5%
12 10 HSV - Holden Special Vehicles 21,933 471 705 3.3% 3.9% 2.1% 1.5% 1.3%
13 13 Volkswagen Australia 20,577 780 1,198 6.2% 1.2% 3.8% 1.7% 2.1%
14 11 Nissan Australia 19,850 397 318 1.6% -0.1% 2.0% 1.1% 1.1%
15 14 Holden Motorsport 16,163 1,324 712 4.6% 2.2% 8.2% 2.8% 3.6%
16 16 MINI Australia 15,441 1,179 1,791 13.1% 7.8% 7.6% 3.2% 3.2%
17 15 Mitsubishi Motors Australia 14,318 338 282 2.0% 15.8% 2.4% 4.6% 0.9%
18 20 Holden Small Car Collection 13,453 329 283 2.1% 16.2% 2.4% 5.6% 0.9%
19 18 Harley-Davidson Australia 11,316 669 925 8.9% 6.4% 5.9% 3.9% 1.8%
20 19 Ford Performance Racing (FPR) 9,661 980 737 8.3% 2.7% 10.1% 1.9% 2.7%
[ Automotive
[ Automotive

8
Australian Facebook Performance Report March 2012#fbreport // [email protected] // www.theonlinecircle.com[ Banking & Financial
[ Banking & Financial
[ Banking & Financial moved up one position to be ranked ninth of the twelve industries reviewed, not a significant increase and with users less engaged than in the previous report (2.9% engagement rate vs. 5.2% Jan 2012).
Three institutions dominate the landscape with Commonwealth Bank, Bank of Melbourne and Citibank Australia responsible for 80% of all social interactions within this industry. These three brands heavily influence the outcomes of all the metrics reviewed.
The brands received the highest fan growth through the month, with Commonwealth Bank increasing their fan base by 7,581, Bank of Melbourne 5,027 and Citibank Australia increasing 1,120, combined they equate to 91.3% of the industry fan growth.
The Bank of Melbourne’s main activity included
their social good program called The Local Project giving 10 community initiatives a share in $100,000, while Citibank promoted their Financial Freedom competition to drive increase likes and engagement.
ANZ Bank continues to be conspicuous by their absence, but with the exception of the Commonwealth Bank, other major banks are not aggressively marketing and promoting their Facebook presence to build up fan volume for marketing, connection and engagement purposes.
Commonwealth Bank, Bank of Melbourne and Citibank Australia are responsible for 80% of all social interactions.

9
Australian Facebook Performance Report March 2012#fbreport // [email protected] // www.theonlinecircle.com
Fans (Ave): Average number of Fans based on five intervals of one week, 28 Feb, 6, 13, 20 and 27 March at 12 midday.PPl Talking About (Ave): Average of the seven day figures taken at midday on March 6, 13, 20 and 27, 2012.Fan Growth: 27 March compared to 28 Feb. 2012% Fan Growth: Relative % increase comparing no of Fans on 27 March compared to 28 February 2012.Engagement rate: The People Talking About (Ave) represented as an percentage of total Fans (Ave).Share of Engagement: Brands share of total Ppl Talking About for four week period (based on gross numbers, not averages.)
Any Brands shaded grey fall below the level of statistical confidence (of engagement rate)
and have not been included in the industry average calculations.
Rank Brand Ave. FansPeople Talking About
Fan Growth % Fan Growth Engagement Rate
Share of Engagement Activity
Mar-12 Jan-12 Mar-12 Jan-12 Mar-12 Jan-12
Industry 278,737 8,201 15,243 2.9% 5.2%
1 1 Commonwealth Bank 128,377 3,348 7,581 6.1% 10.7% 2.6% 5.5% 40.8%
2 - CUA 87,239 134 -495 -0.6% - 0.2% - 1.6%
3 4 Bank of Melbourne 15,779 2,097 5,027 40.0% 3.1% 13.3% 1.6% 25.6%
4 2 UBank – Backed by NAB 12,672 349 493 3.9% 8.4% 2.8% 3.6% 4.3%
5 3 NAB 11,573 423 541 4.8% 2.8% 3.7% 1.9% 5.2%
6 11 Citibank Australia 5,194 1,120 1,303 30.4% 51.6% 21.6% 78.7% 13.7%
7 5 Westpac Rescue Helicopter Service 3,810 88 125 3.3% 2.9% 2.3% 2.1% 1.1%
8 6 St.George Bank 3,414 114 106 3.2% 1.6% 3.3% 1.8% 1.4%
9 7 ING DIRECT Australia 2,327 46 32 1.4% 0.7% 2.0% 1.6% 0.6%
10 8 Westpac 2,325 262 321 14.9% 13.2% 11.3% 6.1% 3.2%
11 10 Queenslanders Credit Union 1,429 39 73 5.3% 29.4% 2.7% 13.1% 0.5%
12 9 Heritage 1,320 23 27 2.1% 1.2% 1.7% 1.2% 0.3%
13 12 ECU Australia 870 6 10 1.2% 1.2% 0.7% 1.3% 0.1%
14 - NSW Police Credit Union 659 60 43 6.8% 9.0% 0.7%
15 14 The Westpac Group Rally 619 37 23 3.8% 8.7% 6.0% 6.0% 0.5%
16 13 Queensland Country Credit Union 596 41 16 2.7% 4.6% 6.9% 4.3% 0.5%
17 15 PC and the Community 381 8 7 1.9% 11.1% 2.0% 6.1% 0.1%
18 16 SCU More Generous Banking 152 8 10 6.8% 4.9% 5.3% 4.6% 0.1%
The Community Mutual Group 382
Country First Credit Union 208
[ Banking & Financial
[ Banking & Financial
10
Australian Facebook Performance Report March 2012#fbreport // [email protected] // www.theonlinecircle.com[ Energy & Utilities
[ Energy & Utilities
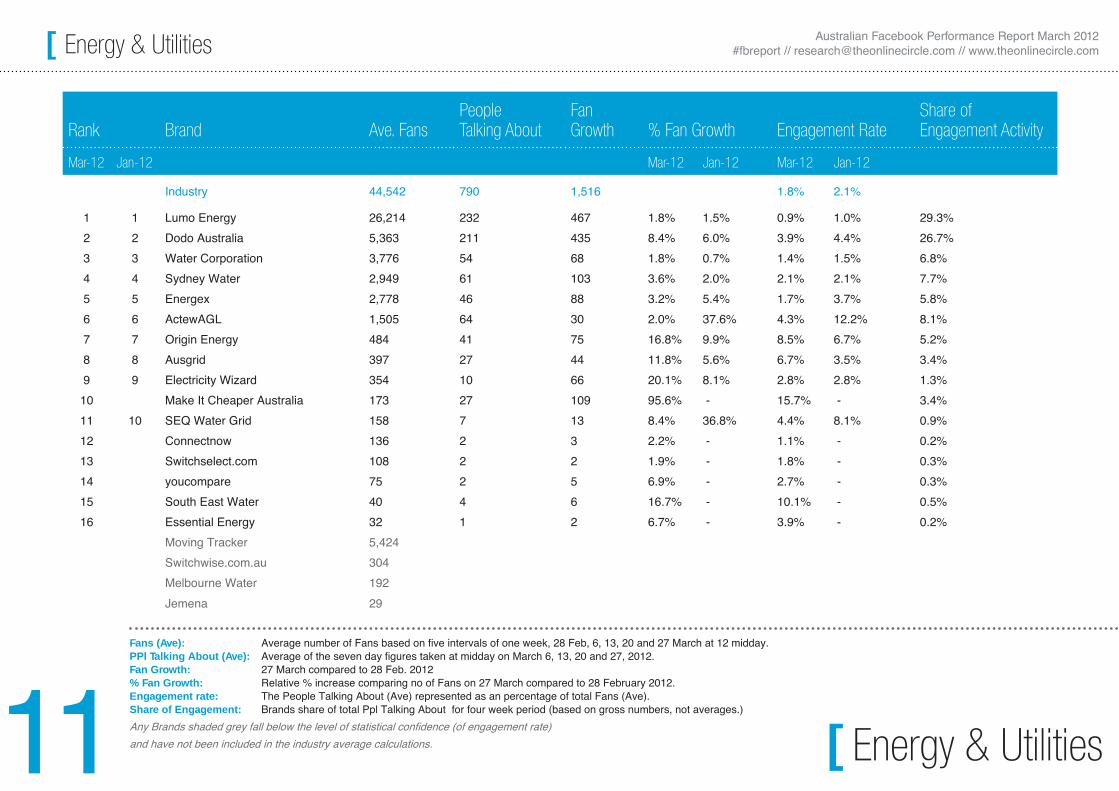
[ Lumo Energy dominates the landscape of the Energy & Utilities industry with over 50% of all fans (‘likes’) and almost 30% of the social engagement activities during the review period.
Energy and Utilities is by far the least engaged of the twelve industries we have reviewed in this report, with less than 1,000 activities occurring compared to the leading industry FMCG – Snackfood’s 91,700. Not only is there a low level of fans and activities but the engagement rate of 1.8% is the lowest of all industries and well below the 12 industry average of 3.1%.
Leading energy companies AGL and Energy Australia remain inactive on Facebook, maybe seeing the lack of traction that similar companies
are experiencing and deciding to focus marketing efforts in other areas. However, the current efforts are of limited substance, require commitment and the development of service functionality.
Energy and Utilities is one of the least engaged industries, with less than 1000 activities occurring compared to the leading industry FMCG Snackfood’s 91,700.
11
Australian Facebook Performance Report March 2012#fbreport // [email protected] // www.theonlinecircle.com
Fans (Ave): Average number of Fans based on five intervals of one week, 28 Feb, 6, 13, 20 and 27 March at 12 midday.PPl Talking About (Ave): Average of the seven day figures taken at midday on March 6, 13, 20 and 27, 2012.Fan Growth: 27 March compared to 28 Feb. 2012% Fan Growth: Relative % increase comparing no of Fans on 27 March compared to 28 February 2012.Engagement rate: The People Talking About (Ave) represented as an percentage of total Fans (Ave).Share of Engagement: Brands share of total Ppl Talking About for four week period (based on gross numbers, not averages.)
Any Brands shaded grey fall below the level of statistical confidence (of engagement rate)
and have not been included in the industry average calculations.
Rank Brand Ave. FansPeople Talking About
Fan Growth % Fan Growth Engagement Rate
Share of Engagement Activity
Mar-12 Jan-12 Mar-12 Jan-12 Mar-12 Jan-12
Industry 44,542 790 1,516 1.8% 2.1%
1 1 Lumo Energy 26,214 232 467 1.8% 1.5% 0.9% 1.0% 29.3%
2 2 Dodo Australia 5,363 211 435 8.4% 6.0% 3.9% 4.4% 26.7%
3 3 Water Corporation 3,776 54 68 1.8% 0.7% 1.4% 1.5% 6.8%
4 4 Sydney Water 2,949 61 103 3.6% 2.0% 2.1% 2.1% 7.7%
5 5 Energex 2,778 46 88 3.2% 5.4% 1.7% 3.7% 5.8%
6 6 ActewAGL 1,505 64 30 2.0% 37.6% 4.3% 12.2% 8.1%
7 7 Origin Energy 484 41 75 16.8% 9.9% 8.5% 6.7% 5.2%
8 8 Ausgrid 397 27 44 11.8% 5.6% 6.7% 3.5% 3.4%
9 9 Electricity Wizard 354 10 66 20.1% 8.1% 2.8% 2.8% 1.3%
10 Make It Cheaper Australia 173 27 109 95.6% - 15.7% - 3.4%
11 10 SEQ Water Grid 158 7 13 8.4% 36.8% 4.4% 8.1% 0.9%
12 Connectnow 136 2 3 2.2% - 1.1% - 0.2%
13 Switchselect.com 108 2 2 1.9% - 1.8% - 0.3%
14 youcompare 75 2 5 6.9% - 2.7% - 0.3%
15 South East Water 40 4 6 16.7% - 10.1% - 0.5%
16 Essential Energy 32 1 2 6.7% - 3.9% - 0.2%
Moving Tracker 5,424
Switchwise.com.au 304
Melbourne Water 192
Jemena 29
[ Energy & Utilities
[ Energy & Utilities
12
Australian Facebook Performance Report March 2012#fbreport // [email protected] // www.theonlinecircle.com[ Telecommunications
[ Telecommunications
[ Overall the Telecommunications industry performs in line with the average of the 12 industries included in this report. An engagement rate of 3.2% is just above the 3.1% average. Fan growth of 8.7% is predominantly driven by four companies – Vodafone (+9,550), Optus (+10,586), AUSTAR (+7,222) and Telstra (+5,251) equating to 88.3% of a total of 36,935.
Vodafone continues to lead the fan count in the Telecommunications industry with over 32% of the industries fan base, making it highly influential in the industry’s performance.
The engagement rate of 3.2% is a substantial increase on the previous report of 1.7% and driven by improvements from Optus, AUSTAR and Telstra. A key driver, as we saw in previous report, were promotions with the example of Optus Movie Match competition featuring as a Facebook application throughout the month.
The engagement activity in the Telecommunications
industry is centred on the leading four telecommunication companies (by fan count) Vodafone, Optus, AUSTAR and Telstra. Between them they account for 76.5% of all engagements a substantial increase on the 66.6% in the January report.
Fan growth for the Telecommunications industry is dominated by four companies, Vodafone, Optus, AUSTAR and Telstra.

13
Australian Facebook Performance Report March 2012#fbreport // [email protected] // www.theonlinecircle.com
Fans (Ave): Average number of Fans based on five intervals of one week, 28 Feb, 6, 13, 20 and 27 March at 12 midday.PPl Talking About (Ave): Average of the seven day figures taken at midday on March 6, 13, 20 and 27, 2012.Fan Growth: 27 March compared to 28 Feb. 2012% Fan Growth: Relative % increase comparing no of Fans on 27 March compared to 28 February 2012.Engagement rate: The People Talking About (Ave) represented as an percentage of total Fans (Ave).Share of Engagement: Brands share of total Ppl Talking About for four week period (based on gross numbers, not averages.)
Any Brands shaded grey fall below the level of statistical confidence (of engagement rate)
and have not been included in the industry average calculations.
Rank Brand Ave. FansPeople Talking About
Fan Growth % Fan Growth Engagement Rate
Share of Engagement Activity
Mar-12 Jan-12 Mar-12 Jan-12 Mar-12 Jan-12
Industry 444,053 14,224 36,935 3.2% 1.7%
1 1 Vodafone Australia 141,910 3,041 9,550 7.0% 2.3% 2.1% 0.9% 21.4%
2 2 Optus 73,254 3,321 10,586 15.5% 3.5% 4.5% 1.5% 23.3%
3 3 AUSTAR 68,209 2,088 7,222 11.2% 3.6% 3.1% 0.9% 14.7%
4 5 Telstra 43,828 2,426 5,251 12.8% 3.6% 5.5% 2.5% 17.1%
5 4 Boost Mobile 41,983 1,057 928 2.2% 2.2% 2.5% 3.8% 7.4%
6 6 iiNet 23,490 1,085 1,256 5.5% 0.7% 4.6% 1.1% 7.6%
7 7 Virgin Mobile Australia 18,050 333 536 3.0% 5.1% 1.8% 2.9% 2.3%
9 9 3 Mobile 10,795 133 259 2.4% 1.8% 1.2% 1.2% 0.9%
10 10 amaysim 6,861 327 674 10.5% 3.1% 4.8% 2.7% 2.3%
11 11 Dodo Australia 5,363 211 434 8.4% 6.0% 3.9% 4.4% 1.5%
12 12 Internode 4,549 77 65 1.4% 1.5% 1.7% 1.3% 0.5%
13 14 gotalk mobile 1,368 29 32 2.4% 2.1% 2.1% 1.3% 0.2%
14 - BigPond 1,175 16 25 2.2% - 1.3% - 0.1%
15 16 ClubTelco 1,166 52 83 7.4% 3.5% 4.4% 3.6% 0.4%
16 15 SpinTel 1,157 17 -3 -0.3% 1.0% 1.4% 18.8% 0.1%
17 17 Westnet 895 16 37 4.2% 2.7% 1.7% 1.4% 0.1%
8 Live Connected 11,678
13 iPrimus 2,613
18 TransACT 953
[ Telecommunications
[ Telecommunications

14
Australian Facebook Performance Report March 2012#fbreport // [email protected] // www.theonlinecircle.com[ Pharmaceutical
[ Pharmaceutical
[ Pharmaceutical companies while having a low fan count (second lowest) are developing strong engagement with the fans that they do have, generating an engagement rate of 5.2%, the second highest of the report.
Only fifteen brands sit above the confidence level in this report, with Panadol Australia continuing to be the leading brand (42,796 fans) and Blackmores and Proactiv Australia swapping 2nd and 3rd positions since the previous report.
Pharmaceuticals also generated the second highest relative fan growth during the report period increasing the fan base by 14.5%. Panadol was responsible for 58.4% of the growth and others to garner strong relative growth were Proactiv Australia, Swisse Vitamins, GNC LiveWell, Vital Greens and Body for Women.
Panadol fan growth was driven by marketing support and an increased engagement rate. The engagement rate increased from 3.6% to 9.6%
on the back of the Panadol Rapid promotion, and this was the main driver of the overall increase in the industry engagement rate.
Swisse Vitamins had the stand out engagement rate for the industry 11.8%, although from a much lower fanbase than Panadol. Promotions feature heavily with Trips to the Caribbean to watch cricket, to France to meet Mark Webber or to win a Young Talent Time performance, combined they drove Swisse’s growth and engagement.
Pharmaceutical companies rank low in fan count.

15
Australian Facebook Performance Report March 2012#fbreport // [email protected] // www.theonlinecircle.com
Fans (Ave): Average number of Fans based on five intervals of one week, 28 Feb, 6, 13, 20 and 27 March at 12 midday.PPl Talking About (Ave): Average of the seven day figures taken at midday on March 6, 13, 20 and 27, 2012.Fan Growth: 27 March compared to 28 Feb. 2012% Fan Growth: Relative % increase comparing no of Fans on 27 March compared to 28 February 2012.Engagement rate: The People Talking About (Ave) represented as an percentage of total Fans (Ave).Share of Engagement: Brands share of total Ppl Talking About for four week period (based on gross numbers, not averages.)
Any Brands shaded grey fall below the level of statistical confidence (of engagement rate)
and have not been included in the industry average calculations.
Rank Brand Ave. FansPeople Talking About
Fan Growth % Fan Growth Engagement Rate
Share of Engagement Activity
Mar-12 Jan-12 Mar-12 Jan-12 Mar-12 Jan-12
Industry 149,229 7,833 19,990 5.2% 2.5%
1 1 Panadol Australia 42,796 4,128 11,673 32.0% 11.4% 9.6% 3.6% 52.7%
2 3 Blackmores 27,142 627 1,373 5.2% 2.8% 2.3% 0.9% 8.0%
3 2 Proactiv Australia 20,763 610 2,211 11.2% 1.8% 2.9% 0.7% 7.8%
4 6 Macleans Mums 17,635 889 1,471 9.0% 0.2% 5.0% 1.0% 11.4%
5 4 Meladerm 10,197 168 524 5.3% 4.3% 1.6% 1.1% 2.1%
6 5 BodyScience 6,863 97 176 2.6% 5.3% 1.4% 3.3% 1.2%
7 7 Ansell Condoms 6,327 224 110 1.8% 3.3% 3.5% 2.7% 2.9%
8 8 Swisse Vitamins 4,552 535 962 25.1% 3.2% 11.8% 3.6% 6.8%
9 9 Gnc LiveWell Australia 4,185 207 831 21.9% 25.8% 4.9% 3.6% 2.6%
10 10 Official QV Skin Care 2,546 52 45 1.8% 1.2% 2.0% 13.2% 0.7%
11 11 Vital Greens Australia 2,249 105 370 17.2% 10.8% 4.7% 6.0% 1.3%
12 12 Body For Women 1,584 111 191 12.9% 7.0% 7.0% 4.4% 1.4%
13 13 BioCeuticals NutraCeuticals 1,294 51 48 3.8% 2.2% 4.0% 3.0% 0.7%
14 15 Aqium Gel 606 12 1 0.2% -0.2% 1.9% 1.5% 0.2%
15 - Sigma-Aldrich Australia 490 17 4 0.8% - 3.5% - 0.2%
Codral 7,191
Sensodyne Australia 6,388
No-Doz 3,073
14 Rescue Remedy Australia 1,151
Harmony 671
[ Pharmaceutical
[ Pharmaceutical

16
Australian Facebook Performance Report March 2012#fbreport // [email protected] // www.theonlinecircle.com[ Travel - Airlines
[ Travel - Airlines
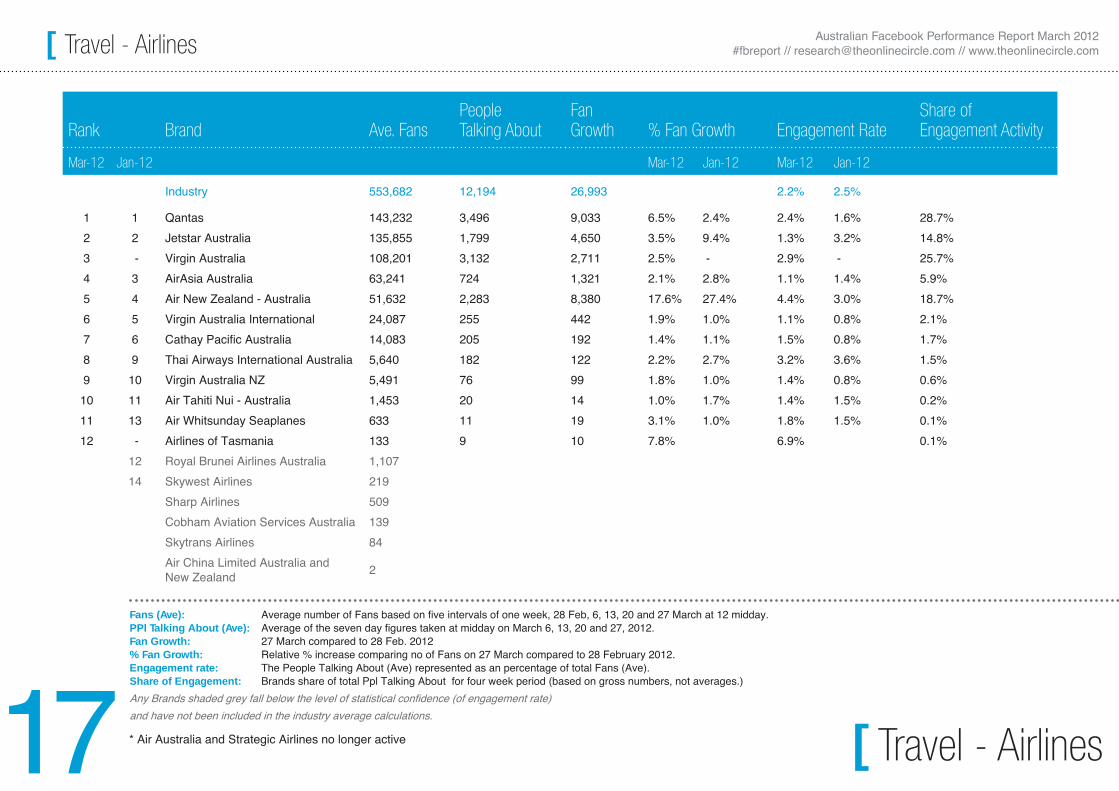
[ Australia has experienced a period of change in the Airline industry with Air Australia / Strategic Airlines going into receivership, but regardless of this the industry has had a gain in their Facebook fanbase (up 5.0%) to be the seventh most supported of the industries included in this report.
While Qantas outperformed most competitors across all metrics – fan growth, people talking about and engagement rate, it was Air New Zealand Australia that delivered the highest fan growth of the industry with a 17.6% increase over the report period, equating to an additional 8,380 fans.
Air New Zealand Australia also posted the highest engagement rate of the major airlines (4.4%) highlighting that they have maximised the value of the growth they are experiencing.
The growth of Air New Zealand Australia has been generated by the promotion ‘Dob in a sceptic’ that ran throughout March.
The engagement activity generated by Qantas, Virgin Australia and Air New Zealand account for 73.1% of all industry engagements, another 20.7% was shared amongst Jetstar and AirAsia.
Air New Zealand Australia clocked the most growth in the airline industry.
17
Australian Facebook Performance Report March 2012#fbreport // [email protected] // www.theonlinecircle.com
Fans (Ave): Average number of Fans based on five intervals of one week, 28 Feb, 6, 13, 20 and 27 March at 12 midday.PPl Talking About (Ave): Average of the seven day figures taken at midday on March 6, 13, 20 and 27, 2012.Fan Growth: 27 March compared to 28 Feb. 2012% Fan Growth: Relative % increase comparing no of Fans on 27 March compared to 28 February 2012.Engagement rate: The People Talking About (Ave) represented as an percentage of total Fans (Ave).Share of Engagement: Brands share of total Ppl Talking About for four week period (based on gross numbers, not averages.)
Any Brands shaded grey fall below the level of statistical confidence (of engagement rate)
and have not been included in the industry average calculations.
Rank Brand Ave. FansPeople Talking About
Fan Growth % Fan Growth Engagement Rate
Share of Engagement Activity
Mar-12 Jan-12 Mar-12 Jan-12 Mar-12 Jan-12
Industry 553,682 12,194 26,993 2.2% 2.5%
1 1 Qantas 143,232 3,496 9,033 6.5% 2.4% 2.4% 1.6% 28.7%
2 2 Jetstar Australia 135,855 1,799 4,650 3.5% 9.4% 1.3% 3.2% 14.8%
3 - Virgin Australia 108,201 3,132 2,711 2.5% - 2.9% - 25.7%
4 3 AirAsia Australia 63,241 724 1,321 2.1% 2.8% 1.1% 1.4% 5.9%
5 4 Air New Zealand - Australia 51,632 2,283 8,380 17.6% 27.4% 4.4% 3.0% 18.7%
6 5 Virgin Australia International 24,087 255 442 1.9% 1.0% 1.1% 0.8% 2.1%
7 6 Cathay Pacific Australia 14,083 205 192 1.4% 1.1% 1.5% 0.8% 1.7%
8 9 Thai Airways International Australia 5,640 182 122 2.2% 2.7% 3.2% 3.6% 1.5%
9 10 Virgin Australia NZ 5,491 76 99 1.8% 1.0% 1.4% 0.8% 0.6%
10 11 Air Tahiti Nui - Australia 1,453 20 14 1.0% 1.7% 1.4% 1.5% 0.2%
11 13 Air Whitsunday Seaplanes 633 11 19 3.1% 1.0% 1.8% 1.5% 0.1%
12 - Airlines of Tasmania 133 9 10 7.8% 6.9% 0.1%
12 Royal Brunei Airlines Australia 1,107
14 Skywest Airlines 219
Sharp Airlines 509
Cobham Aviation Services Australia 139
Skytrans Airlines 84
Air China Limited Australia and New Zealand
2
[ Travel - Airlines
[ Travel - Airlines* Air Australia and Strategic Airlines no longer active

18
Australian Facebook Performance Report March 2012#fbreport // [email protected] // www.theonlinecircle.com[ Travel - Accommodation
[ Travel - Accomodation
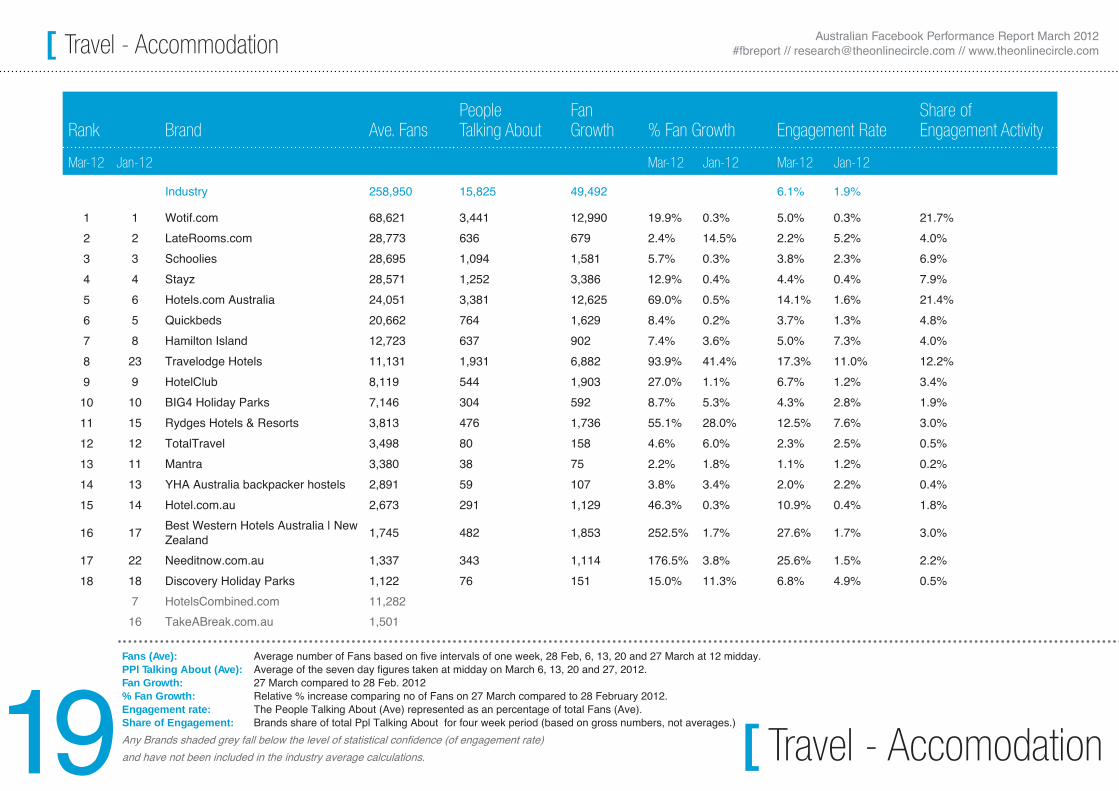
[ Accommodation led the entire market for fan growth through March adding 20.9% to their fanbase through active promotional and marketing activity. In the process the engagement rate for the industry tripled to 6.1%, from the previous reports 1.9%, to record the highest industry performance for the month.
There were some standout performances during the month, notably Hotels.com grew their fanbase a remarkable 69% (+12,625) during the report period and thanks to their Suite Deals promotion that ran throughout March their engagement rate was also high at 14.1% and the level of engagement activity accounted for just over one-in-five of the entire industry.
Travelodge Hotels were also aggressive during the month increasing their fanbase by 93.9%, after also increasing their fanbase by 41.4% in the previous report. An engagement t rate of 17.3%
was pushed by a promotion offering 10 two-night stays for two in any Travelodge in Australia or New Zealand.
Many other accommodation brands had strong growth through the month with HotelClub (+27.0%), Rydges Hotels & Resorts (+55.1%), Hotel.com.au (+46.3%), Best Western (+252.5%), NeedItNow (176.5%) and the market.
Regardless of the growth of these brands Wotif was able to grow their fanbase 19.9% (+12,990) with a strong engagement rate of 5.0% to remain at the head of the industry.
Travel Accommodation led the entire market for fan growth through March adding 20.9% to their fanbase.
19
Australian Facebook Performance Report March 2012#fbreport // [email protected] // www.theonlinecircle.com
Fans (Ave): Average number of Fans based on five intervals of one week, 28 Feb, 6, 13, 20 and 27 March at 12 midday.PPl Talking About (Ave): Average of the seven day figures taken at midday on March 6, 13, 20 and 27, 2012.Fan Growth: 27 March compared to 28 Feb. 2012% Fan Growth: Relative % increase comparing no of Fans on 27 March compared to 28 February 2012.Engagement rate: The People Talking About (Ave) represented as an percentage of total Fans (Ave).Share of Engagement: Brands share of total Ppl Talking About for four week period (based on gross numbers, not averages.)
Any Brands shaded grey fall below the level of statistical confidence (of engagement rate)
and have not been included in the industry average calculations.
Rank Brand Ave. FansPeople Talking About
Fan Growth % Fan Growth Engagement Rate
Share of Engagement Activity
Mar-12 Jan-12 Mar-12 Jan-12 Mar-12 Jan-12
Industry 258,950 15,825 49,492 6.1% 1.9%
1 1 Wotif.com 68,621 3,441 12,990 19.9% 0.3% 5.0% 0.3% 21.7%
2 2 LateRooms.com 28,773 636 679 2.4% 14.5% 2.2% 5.2% 4.0%
3 3 Schoolies 28,695 1,094 1,581 5.7% 0.3% 3.8% 2.3% 6.9%
4 4 Stayz 28,571 1,252 3,386 12.9% 0.4% 4.4% 0.4% 7.9%
5 6 Hotels.com Australia 24,051 3,381 12,625 69.0% 0.5% 14.1% 1.6% 21.4%
6 5 Quickbeds 20,662 764 1,629 8.4% 0.2% 3.7% 1.3% 4.8%
7 8 Hamilton Island 12,723 637 902 7.4% 3.6% 5.0% 7.3% 4.0%
8 23 Travelodge Hotels 11,131 1,931 6,882 93.9% 41.4% 17.3% 11.0% 12.2%
9 9 HotelClub 8,119 544 1,903 27.0% 1.1% 6.7% 1.2% 3.4%
10 10 BIG4 Holiday Parks 7,146 304 592 8.7% 5.3% 4.3% 2.8% 1.9%
11 15 Rydges Hotels & Resorts 3,813 476 1,736 55.1% 28.0% 12.5% 7.6% 3.0%
12 12 TotalTravel 3,498 80 158 4.6% 6.0% 2.3% 2.5% 0.5%
13 11 Mantra 3,380 38 75 2.2% 1.8% 1.1% 1.2% 0.2%
14 13 YHA Australia backpacker hostels 2,891 59 107 3.8% 3.4% 2.0% 2.2% 0.4%
15 14 Hotel.com.au 2,673 291 1,129 46.3% 0.3% 10.9% 0.4% 1.8%
16 17Best Western Hotels Australia | New Zealand
1,745 482 1,853 252.5% 1.7% 27.6% 1.7% 3.0%
17 22 Needitnow.com.au 1,337 343 1,114 176.5% 3.8% 25.6% 1.5% 2.2%
18 18 Discovery Holiday Parks 1,122 76 151 15.0% 11.3% 6.8% 4.9% 0.5%
7 HotelsCombined.com 11,282
16 TakeABreak.com.au 1,501
[ Travel - Accommodation
[ Travel - Accomodation

20
Australian Facebook Performance Report March 2012#fbreport // [email protected] // www.theonlinecircle.com[ Department Stores
[ Department Stores
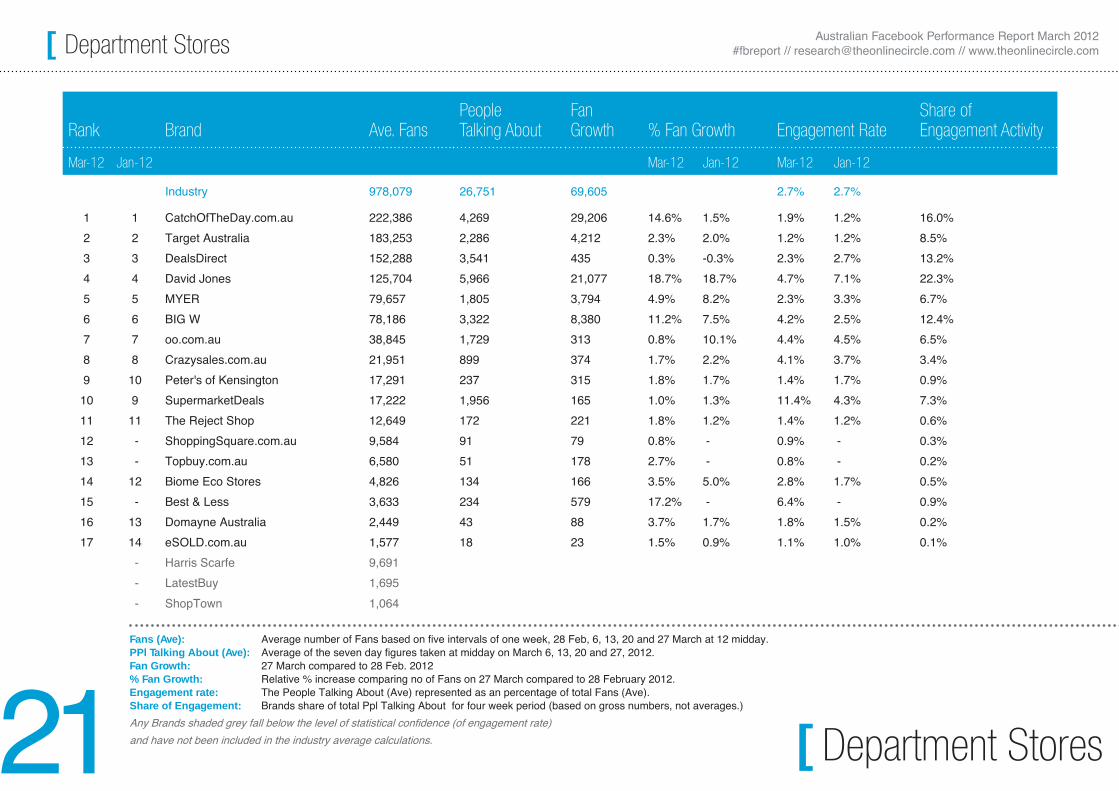
[ The activity in the Department stores industry is spread across more brands than many of the other industries in this report, indicating vigour from many brands in engaging and growing their fanbase. The leading five brands are responsible for 60% of all engagement activities.
Industry leader, Catch of the Day, experienced the largest increase in fan volume (+29,206) and substantial growth was generated by David Jones (+21,077) who is putting substantial effort into their social presence and marketing including Facebook promotions such as the Bridal Promotion and the Ultimate Easter Package. This activity supported an engagement rate of 4.7% (third highest behind Supermarket Deals -11.4% and Best & Less 6.4%) and accounted for an industry high 22.3% of all engagements.
Myer by comparison generated just under 5% fanbase growth (+3,794) and a slightly below industry average engagement rate of 2.3% (industry average 2.7%).
Big W with a fan base growth of 8,380 crept up on Myer’s overall fan level, and the time of writing this report Big W has surpassed Myer and is now the fifth most followed Australian Department Store on Facebook.
Department Stores leverage off brands that they stock, making this industry highly engaged.
21
Australian Facebook Performance Report March 2012#fbreport // [email protected] // www.theonlinecircle.com
Fans (Ave): Average number of Fans based on five intervals of one week, 28 Feb, 6, 13, 20 and 27 March at 12 midday.PPl Talking About (Ave): Average of the seven day figures taken at midday on March 6, 13, 20 and 27, 2012.Fan Growth: 27 March compared to 28 Feb. 2012% Fan Growth: Relative % increase comparing no of Fans on 27 March compared to 28 February 2012.Engagement rate: The People Talking About (Ave) represented as an percentage of total Fans (Ave).Share of Engagement: Brands share of total Ppl Talking About for four week period (based on gross numbers, not averages.)
Any Brands shaded grey fall below the level of statistical confidence (of engagement rate)
and have not been included in the industry average calculations.
Rank Brand Ave. FansPeople Talking About
Fan Growth % Fan Growth Engagement Rate
Share of Engagement Activity
Mar-12 Jan-12 Mar-12 Jan-12 Mar-12 Jan-12
Industry 978,079 26,751 69,605 2.7% 2.7%
1 1 CatchOfTheDay.com.au 222,386 4,269 29,206 14.6% 1.5% 1.9% 1.2% 16.0%
2 2 Target Australia 183,253 2,286 4,212 2.3% 2.0% 1.2% 1.2% 8.5%
3 3 DealsDirect 152,288 3,541 435 0.3% -0.3% 2.3% 2.7% 13.2%
4 4 David Jones 125,704 5,966 21,077 18.7% 18.7% 4.7% 7.1% 22.3%
5 5 MYER 79,657 1,805 3,794 4.9% 8.2% 2.3% 3.3% 6.7%
6 6 BIG W 78,186 3,322 8,380 11.2% 7.5% 4.2% 2.5% 12.4%
7 7 oo.com.au 38,845 1,729 313 0.8% 10.1% 4.4% 4.5% 6.5%
8 8 Crazysales.com.au 21,951 899 374 1.7% 2.2% 4.1% 3.7% 3.4%
9 10 Peter's of Kensington 17,291 237 315 1.8% 1.7% 1.4% 1.7% 0.9%
10 9 SupermarketDeals 17,222 1,956 165 1.0% 1.3% 11.4% 4.3% 7.3%
11 11 The Reject Shop 12,649 172 221 1.8% 1.2% 1.4% 1.2% 0.6%
12 - ShoppingSquare.com.au 9,584 91 79 0.8% - 0.9% - 0.3%
13 - Topbuy.com.au 6,580 51 178 2.7% - 0.8% - 0.2%
14 12 Biome Eco Stores 4,826 134 166 3.5% 5.0% 2.8% 1.7% 0.5%
15 - Best & Less 3,633 234 579 17.2% - 6.4% - 0.9%
16 13 Domayne Australia 2,449 43 88 3.7% 1.7% 1.8% 1.5% 0.2%
17 14 eSOLD.com.au 1,577 18 23 1.5% 0.9% 1.1% 1.0% 0.1%
- Harris Scarfe 9,691
- LatestBuy 1,695
- ShopTown 1,064
[ Department Stores
[ Department Stores

22
Australian Facebook Performance Report March 2012#fbreport // [email protected] // www.theonlinecircle.com[ Retail - Fashion
[ Retail - Fashion
[ The traditional brands continue to perform strongly in Fashion Retail, the second highest followed industry of those reviewed, but some non-traditional brands are starting to gain traction. A prime example is Melbourne based retailer MIISHKA who sells clothes exclusively on Facebook and operates a fashion blog highlighting great looks, classic pieces etc as a marketing channel. MIISHKA is growing at a fast rate, adding 17.8% to their fanbase in March and with an active community surrounding their product and point of view, they generated an engagement rate of 6.7%, well above the industry average (2.8%).
While Jay Jays and Supré have a strong position at the top of the table and continue to grow their fanbases, +8,802 and 9,205 respectively, other brands are also seeing substantial growth such as Sportsgirl (+20,532), Lorna Jan (+19,621) and Cotton On (+17,450).
Promotions such as Lorna Jane’s “The Year of You” and Sportsgirls’ “Brand Me” continue to provide
the impetus for growth and engagement levels. During March the engagement levels were well spread across the top 20 brands with Lorna Jane the only brand with over 10% of all engagement activities (27.6%).
One of the highest followed industries in this review, Retail-Fashion continues to perform strongly.

23
Australian Facebook Performance Report March 2012#fbreport // [email protected] // www.theonlinecircle.com
Fans (Ave): Average number of Fans based on five intervals of one week, 28 Feb, 6, 13, 20 and 27 March at 12 midday.PPl Talking About (Ave): Average of the seven day figures taken at midday on March 6, 13, 20 and 27, 2012.Fan Growth: 27 March compared to 28 Feb. 2012% Fan Growth: Relative % increase comparing no of Fans on 27 March compared to 28 February 2012.Engagement rate: The People Talking About (Ave) represented as an percentage of total Fans (Ave).Share of Engagement: Brands share of total Ppl Talking About for four week period (based on gross numbers, not averages.)
Any Brands shaded grey fall below the level of statistical confidence (of engagement rate)
and have not been included in the industry average calculations.
Rank Brand Ave. FansPeople Talking About
Fan Growth % Fan Growth Engagement Rate
Share of Engagement Activity
Mar-12 Jan-12 Mar-12 Jan-12 Mar-12 Jan-12
Industry 2,553,288 71,365 140,814 2.8% 2.2%
1 - Jay Jays 390,770 4,085 8,802 2.3% - 1.0% - 5.7%
2 1 SUPRÉ 381,391 7,083 9,205 2.4% 0.8% 1.9% 1.7% 9.9%
3 2 Cotton On 316,283 6,640 17,450 5.7% 6.1% 2.1% 1.6% 9.3%
4 3 Lorna Jane 303,516 19,710 19,621 6.7% 4.9% 6.5% 4.8% 27.6%
5 5 princess polly 135,483 4,667 9,851 7.5% 7.0% 3.4% 3.3% 6.5%
6 4 Bras N Things 122,500 1,889 1,198 1.0% 1.4% 1.5% 0.8% 2.6%
7 6 Sportsgirl 118,061 6,147 20,532 19.1% 9.3% 5.2% 2.1% 8.6%
8 7 City Beach 98,017 2,126 5,031 5.2% 4.7% 2.2% 1.8% 3.0%
9 10 Forever New 65,721 2,082 6,601 10.5% 6.9% 3.2% 2.9% 2.9%
10 8 Witchery 65,436 1,429 1,687 2.6% 2.3% 2.2% 2.1% 2.0%
11 16 Dotti 63,490 2,930 9,109 15.6% 16.4% 4.6% 3.7% 4.1%
12 9 Mimco 62,883 1,114 2,326 3.8% 1.5% 1.8% 1.3% 1.6%
13 13 General Pants Co. 62,365 2,305 7,806 13.3% 4.3% 3.7% 1.1% 3.2%
14 11 crossroads 58,182 1,020 2,418 4.3% 2.6% 1.8% 0.9% 1.4%
15 15 Country Road 55,751 1,279 3,722 6.9% 2.5% 2.3% 1.0% 1.8%
16 12 Pumpkin Patch AU 54,060 417 830 1.5% 0.9% 0.8% 0.7% 0.6%
17 14 Peter Alexander Sleepwear 53,927 1,074 1,430 2.7% 1.1% 2.0% 1.0% 1.5%
18 - MIISHKA 52,291 3,509 8,608 17.8% - 6.7% - 4.9%
19 19 StyleTread 46,834 1,026 2,799 6.2% 0.5% 2.2% 0.6% 1.4%
20 18 Jeanswest 46,327 835 1,788 3.9% 10.9% 1.8% 4.7% 1.2%
[ Retail - Fashion
[ Retail - Fashion
24
Australian Facebook Performance Report March 2012#fbreport // [email protected] // www.theonlinecircle.com[ Retail - Grocery & Alcohol
[ Retail - Grocery & Alcohol
[ 7-Eleven is the dominant brand in the Retail – Grocery & Alcohol industry accounting for 39.5% of all the engagement activities and continuing to grow with over 29,000 new fans accounting for 54.8% of all new fan growth during February.
Also experiencing substantial growth was Baker’s Delight (+6,353), Coles (+2,973) and Lite n’ Easy (+2,593) on the back of promotional activity such as ‘Flash your Stash’ (7-Eleven), Gift Card giveaways (Coles) and Autumn Menu giveaways (Lite n’Easy).
Also using the gift card giveaways to grow fanbase and engage the audience is Woolworths, maintaining their volume of fans lead over Coles. Coles though grew their fanbase more and was able to engage their audience to a larger degree than Woolworths with a 3.4% engagement rate versus Woolworths 2.5%.
Aside from 7-Eleven a number of brand pages delivered above industry average engagement rates, including getwinesdirect.com (8.5%), Wine Market Australia (5.3%), Queen Victoria Market (17.2%), Lite n’Easy (8.2%) and Lollyworld (8.8%). Be careful in comparing the engagement rates of those brand pages with high fan bases and those with smaller numbers of fans, as the ease of engaging a smaller audience does make the comparison questionable.
As an overall industry Retail – Grocery & Alcohol sits in the middle of the pack, with the addition of 7-Eleven to this report it has climbed from number eight to become the sixth ranked industry.
Featuring major brands such as Woolworths and Coles, this industry is slowly climbing the ranks.

25
Australian Facebook Performance Report March 2012#fbreport // [email protected] // www.theonlinecircle.com
Fans (Ave): Average number of Fans based on five intervals of one week, 28 Feb, 6, 13, 20 and 27 March at 12 midday.PPl Talking About (Ave): Average of the seven day figures taken at midday on March 6, 13, 20 and 27, 2012.Fan Growth: 27 March compared to 28 Feb. 2012% Fan Growth: Relative % increase comparing no of Fans on 27 March compared to 28 February 2012.Engagement rate: The People Talking About (Ave) represented as an percentage of total Fans (Ave).Share of Engagement: Brands share of total Ppl Talking About for four week period (based on gross numbers, not averages.)
Any Brands shaded grey fall below the level of statistical confidence (of engagement rate)
and have not been included in the industry average calculations.
Rank Brand Ave. FansPeople Talking About
Fan Growth % Fan Growth Engagement Rate
Share of Engagement Activity
Mar-12 Jan-12 Mar-12 Jan-12 Mar-12 Jan-12
Industry 711,761 31,004 53,018 4.4% 10.0%
1 - 7-Eleven Australia 200,075 12,232 29,034 15.5% 6.1% 39.5%
2 1 Woolworths the Fresh Food People 124,999 3,174 1,882 1.5% 74.1% 2.5% 25.9% 10.2%
3 2 Coles 107,390 3,701 2,973 2.8% 4.5% 3.4% 3.5% 11.9%
4 - Bakers Delight 75,743 2,460 6,353 8.7% 3.2% 7.9%
5 3 GroceryRun.com.au 53,143 1,832 3,111 6.0% 1.6% 3.4% 1.6% 5.9%
6 4 Planet Cake 27,164 1,137 1,138 4.3% 4.4% 4.2% 3.2% 3.7%
7 5 Coles Online 22,418 627 381 1.7% 0.6% 2.8% 2.4% 2.0%
8 9 Dan Murphy's 15,107 360 771 5.2% 7.9% 2.4% 2.1% 1.2%
9 6 getwinesdirect.com 14,863 1,270 961 6.7% 6.2% 8.5% 13.9% 4.1%
10 8 Wine Market Australia 14,474 766 1,195 8.6% 11.2% 5.3% 4.4% 2.5%
11 7 T2 Tea 13,366 514 850 6.6% 3.0% 3.8% 2.7% 1.7%
12 11 Lite n' Easy 10,154 831 2,593 27.3% 15.1% 8.2% 7.3% 2.7%
13 10 USAFoods 8,722 97 91 1.0% 1.1% 1.1% 0.9% 0.3%
14 12 Queen Victoria Market 8,563 1,476 1,150 14.4% 3.7% 17.2% 20.5% 4.8%
15 13 Roses Only Group 4,633 69 53 1.2% 1.2% 1.5% 1.0% 0.2%
16 14 Lollyworld 3,613 317 338 9.7% 1.0% 8.8% 1.2% 1.0%
17 15 Cracka Wines 2,719 56 11 0.4% 0.0% 2.1% 1.6% 0.2%
18 16 The Raspberry Butterfly 2,419 24 70 2.9% 3.3% 1.0% 1.5% 0.1%
19 - Ritchies Community Benefit Card 2,195 62 63 2.9% 2.8% 0.2%
- Hamper King 2,359
[ Retail - Grocery & Alcohol
[ Retail - Grocery & Alcohol

26
Australian Facebook Performance Report March 2012#fbreport // [email protected] // www.theonlinecircle.com[ FMCG - Beverages
[ FMCG - Beverages
[ FMCG Beverages is the third most followed industry reviewed in this report, with just short of two million followers, but has the second lowest engagement rate (2.2%) of the twelve industries, equal with Travel – Airlines and only performing higher that the Energy & Utilities industry.
The industry experienced strong growth of the fanbase during March, with only FMCG - Snackfoods growing by a larger number. The FMCG – Beverage industry grew by 146,644 fans with seven brands growing by more than 10,000 fans led by Coca-Cola Australia adding 31,130 fans and V Energy Drink, Slurpee, Pepsi, Coke Zero, Powerade and Solo the other strong growing brands.
Coca-Cola accounts for just over one in every four engagements with fans, with V Energy Drink and Slurpee adding another 23.8% for the top three brands to have major influence on the industry outcomes. The stand out engagement rate was Solo’s 10.6%, representing 3,051
engagements, less than a third of Coca-Cola’s 11,171 engagements (4.3% engagement rate) and this was over double the level of engagement reported in January 2012.
The top four most engaged brands received 58.3% of all engagement activity, down substantially on last reports 70.8%, indicating a broader spread of activity and wider engagement across the industry.
This industry boasts many likes, however it has very little engagement from it’s fan base.

27
Australian Facebook Performance Report March 2012#fbreport // [email protected] // www.theonlinecircle.com
Fans (Ave): Average number of Fans based on five intervals of one week, 28 Feb, 6, 13, 20 and 27 March at 12 midday.PPl Talking About (Ave): Average of the seven day figures taken at midday on March 6, 13, 20 and 27, 2012.Fan Growth: 27 March compared to 28 Feb. 2012% Fan Growth: Relative % increase comparing no of Fans on 27 March compared to 28 February 2012.Engagement rate: The People Talking About (Ave) represented as an percentage of total Fans (Ave).Share of Engagement: Brands share of total Ppl Talking About for four week period (based on gross numbers, not averages.)
Any Brands shaded grey fall below the level of statistical confidence (of engagement rate)
and have not been included in the industry average calculations.
Rank Brand Ave. FansPeople Talking About
Fan Growth % Fan Growth Engagement Rate
Share of Engagement Activity
Mar-12 Jan-12 Mar-12 Jan-12 Mar-12 Jan-12
Industry 1,986,256 44,083 146,644 2.2% 1.6%
1 1 Coca-Cola Australia 747,272 11,171 31,130 4.3% 3.8% 1.5% 0.8% 25.3%
2 2 V Energy Drink Australia 368,310 5,867 16,016 4.4% 6.0% 1.6% 1.7% 13.3%
3 3 Slurpee Australia 217,150 4,619 13,379 6.3% 7.6% 2.1% 2.5% 10.5%
4 4 Pepsi Australia 132,342 4,043 16,294 12.9% 6.6% 3.1% 1.3% 9.2%
5 5 Coca-Cola Zero Australia 92,866 2,466 10,548 11.9% 7.2% 2.7% 1.3% 5.6%
6 6 POWERADE Australia 82,136 2,565 11,404 14.7% 7.2% 3.1% 1.5% 5.8%
7 - ICE BREAK 78,192 3,093 5,652 7.5% - 4.0% - 7.0%
8 9 Fanta Australia 47,858 1,997 9,228 20.8% 11.1% 4.2% 1.3% 4.5%
9 7 Mount Franklin' Water 47,365 484 2,424 5.2% 1.8% 1.0% 1.0% 1.1%
10 8 Spring Valley 37,535 218 28 0.1% 8.1% 0.6% 2.4% 0.5%
11 11 Mountain Dew Australia 33,847 1,679 7,155 23.1% 38.3% 5.0% 6.8% 3.8%
12 - SOLO the Original Thirst Crusher 28,651 3,051 10,823 46.1% - 10.6% - 6.9%
13 10 Gatorade Australia 26,781 1,181 5,621 22.9% 23.9% 4.4% 4.5% 2.7%
14 12 Rockstar Energy Australia 22,867 1,426 6,579 32.9% 9.4% 6.2% 1.8% 3.2%
15 13 Breaka Flavoured Milk 22,753 203 346 1.3% 126.7% 0.9% 22.4% 0.5%
16 - Blue Mountains Natural Spring Water
330 21 17 5.4% 6.4% 0.0%
- Vaalia 13,155
- Cool Ridge 6,517
- Nutrient Water 5,076
[ FMCG - Beverages
[ FMCG - Beverages
28
Australian Facebook Performance Report March 2012#fbreport // [email protected] // www.theonlinecircle.com[ FMCG - Snackfoods
[ FMCG - Snackfoods
[ Snackfoods continues to be the most followed industry of the twelve, and the industry that experienced the highest level of growth adding 303,791 new fans during March, over double the FMCG – Beverages growth of 146,644.
While an engagement rate of 3.4% for the industry may be seen as mid range for such a large fan base the 91,700 engagements is an incredibly strong outcome and higher than the other industries with over one million fans, indicating a relatively highly engaged fanbase. The engagement is over double the previous reports 45,218 that represented a 2.0% engagement rate.
Over a third of the engagement activities were generated by the leading brand Pringles Australia, generating 35.8% of all activity with their 32,804 engagements followed by Nutella with 8,480, Ferrero Chocolates with 7,941 and M&M’s Australia with 6,890.
The same brands also experienced the highest fanbase growth led by Pringles 113,517 (five times larger than their growth in January), Nutella added 28,510 fans, M&M’s 27,208 and Ferrero Chocolates 26,631 fans, but strong growth was also seen by Cadbury Dairy Milk and Tic Tac.
The FMCG industry has experienced the highest level of growth over the last month.

29
Australian Facebook Performance Report March 2012#fbreport // [email protected] // www.theonlinecircle.com
Fans (Ave): Average number of Fans based on five intervals of one week, 28 Feb, 6, 13, 20 and 27 March at 12 midday.PPl Talking About (Ave): Average of the seven day figures taken at midday on March 6, 13, 20 and 27, 2012.Fan Growth: 27 March compared to 28 Feb. 2012% Fan Growth: Relative % increase comparing no of Fans on 27 March compared to 28 February 2012.Engagement rate: The People Talking About (Ave) represented as an percentage of total Fans (Ave).Share of Engagement: Brands share of total Ppl Talking About for four week period (based on gross numbers, not averages.)
Any Brands shaded grey fall below the level of statistical confidence (of engagement rate)
and have not been included in the industry average calculations.
Rank Brand Ave. FansPeople Talking About
Fan Growth % Fan Growth Engagement Rate
Share of Engagement Activity
Mar-12 Jan-12 Mar-12 Jan-12 Mar-12 Jan-12
Industry 2,699,775 91,700 303,791 3.4% 2.0%
1 1 Pringles Australia 721,316 32,804 113,517 17.2% 4.4% 4.5% 1.2% 35.8%
2 2 5 Gum Australia & NZ 414,734 3,722 11,414 2.8% 1.7% 0.9% 0.6% 4.1%
3 4 Cadbury Dairy Milk - Australia 174,999 5,893 17,421 10.4% 7.3% 3.4% 2.3% 6.4%
4 3 Chuck (Chupa Chops) 148,380 1,001 2,672 1.8% 0.5% 0.7% 0.3% 1.1%
5 5 Samboy Chips 129,052 881 2,689 2.1% 0.7% 0.7% 0.2% 1.0%
6 9 Ferrero Chocolates Australia 120,454 7,941 26,631 25.9% 11.5% 6.6% 3.2% 8.7%
7 10 Tic Tac Australia and New Zealand 119,217 4,277 14,257 12.7% 24.9% 3.6% 6.9% 4.7%
8 7 Streets Golden Gaytime 114,166 1,422 3,446 3.1% 6.4% 1.2% 1.6% 1.6%
9 11 Nutella Australia & NZ 110,131 8,480 28,510 29.6% 13.1% 7.7% 6.8% 9.2%
10 8 The Natural Confectionery Co. 103,525 681 1,797 1.7% 1.1% 0.7% 0.2% 0.7%
11 14 Streets Cornetto 98,778 3,322 10,240 11.0% 42.7% 3.4% 12.3% 3.6%
12 12 Lindt Australia 87,333 1,972 3,285 3.8% 2.0% 2.3% 1.4% 2.2%
13 15 M&M'S Australia 76,846 6,890 27,208 43.1% 22.7% 9.0% 8.7% 7.5%
14 13 Arnott's Tim Tam 67,938 726 1,974 3.0% 0.6% 1.1% 0.5% 0.8%
15 17 Kit Kat Australia & New Zealand 60,121 4,402 18,902 36.6% 11.9% 7.3% 2.2% 4.8%
16 16 Streets Paddle Pop 59,580 852 3,086 5.3% 3.0% 1.4% 0.9% 0.9%
17 Continental Cup-a-Soup 55,663 4,252 9,138 18.0% - 7.6% - 4.6%
18 18 Kinder Surprise Australia & NZ 37,543 2,184 7,604 22.5% 21.0% 5.8% 6.9% 2.4%
6 Cheezels 124,481
- CC's 40,454
[ FMCG - Snackfoods
[ FMCG - Snackfoods

30
Australian Facebook Performance Report March 2012#fbreport // [email protected] // www.theonlinecircle.com[ Facebook Tips for Champions
[ Facebook is constantly changing. Their nature is to work for constant improvement. However, regardless of the changes, Facebook is still about the same thing, connecting to your customers and consumers.
The principles are the same with or without Timeline. They are about maximising opportunities and minimising and preparing for risk.
It’s mandatory that you and anyone operating Facebook as a publishing channel have respect for the channel.
You wouldn’t hand over your PR or Direct Marketing strategy and execution to an amateur team so why would you give the planning of Facebook as a primary communications channel to an unprepared and or inexperienced team?
Facebook is not just a Marketing Communications channel but also an information source for journalists, politicians, lobby groups and other important audiences that might use your statements for or against you.
Below you can find my eight tips to help you and your brand with your Facebook efforts.
1 Have a Risk Plan in place
We’ve all heard of numerous businesses that have found themselves in trouble after
launching their Facebook page without a defined Risk Plan in place. A Risk Plan includes, but is not limited to, identifying the most probable threats to your organisation, analysing the related vulnerabilities to those threats, and understanding how you should react in the event the problems arise.
• What would you do if a user mentions your competitor?
• What would you do if a user expresses an opinion contrary to your company’s views?
• What are your community guidelines and escalation processes if something goes wrong or if you don’t know the answer?
2 Your Legal, Corporate Affairs and Customer Service colleagues are your allies
Many marketers see Corporate Affairs, the Legal department and Customer Service as a nuisance or a roadblock. However they know things marketers may not know. And this knowledge often comes from dealing with the customer in a way Marketers haven’t had to in the past but, with Social Media, will need to interact now and in the future.
Remember when something goes live on Facebook it is not just going live for your final customers, but is also for a much broader audience including members of lobby groups, politicians, media, staff - and the list goes on.
Involving your internal allies in your decision making and planning process is worthwhile. Reviewing your subjects and plans with them every three months will save you time and budget in a crisis along with creating internal champions for your cause.
3 Use Facebook insights
If you want to be successful on Facebook, use Facebook Insights.
With Insights, you can:
• Understand the performance of your Facebook Page, • Learn which content resonates with your audience, and • Optimise how you publish to your audience so that people will tell their friends about you.
By understanding and analysing trends within your fan growth, demographics, consumption of content and creation of content, you will be better equipped to improve your Facebook page.
Some of these metrics require some manual tracking and analysis, which is a downside. However, the metrics will help you make decisions about your engagement and content strategy that will allow more effective interactions with Facebook fans.
[ Facebook Tips for Champions

31
Australian Facebook Performance Report March 2012#fbreport // [email protected] // www.theonlinecircle.com[ Facebook Tips for Champions
Ask your Social Media staff, service provider or agency to provide you with an analysis of your Facebook data (and how they are using it) to ensure they are developing efficient and engaging content.
Remember (highlight this) Data overcomes opinion.
4 Activate your audience don’t just collect them
Companies have spent millions gathering fans on their Facebook
pages and being “Liked” all across the web. But what started as a volume play — call it Facebook marketing 1.0 — is shifting.
Your Facebook audience is a club, a tribe - not just a list. And you cannot satisfy the intellectual and sociological cravings of a club through one brief, cute status update each day.
Talk about things they won’t find else where. Create a strong, ongoing calendar of engagement programs where your company gives your Facebook fans the
opportunity to receive special coupons or insider info, tell you what they think about future product and TV ads, access unusual fan-only deals, and/or learn more about the group behind the brand.
Publish customised content and publish for your custom audiences. eg. You can take the same update and tailor it for different capital cities.
5 Share of attention not share of market
On Facebook, brands are competing for the same finite,
and somewhat rare, commodity – your user’s time and attention. The same users are inundated with other brands offers and updates from family and friends. Unless you have secured their share of attention your message will get lost.
Make sure you have emotional engagement and, as a consequence, an increase in your fan’s memory retention.
6 Facebook ads as support
An estimated 16% of fans are reached by organic messaging. Marry your content strategy to
your Facebook media buying allocating budget to your most important and specific messages.
7 Smart tactical execution
There’s a lot of folklore when it comes to execution on Facebook. 5 posts a week or 1 post a week?
Saturdays better than Mondays?
There are some home-run truths but, the best recommendation is to find what works best for your page.
Post Length: posts 80 characters or less in length usually have 30 to 40% higher engagement.
Message: the simpler, the better. Outright requests and soft sell (e.g. ”Win” rather than “Contest”) are effective.
When it comes to frequency this is where most administrators of pages can improve their efforts the most. You can utilise Facebook Insights to find unique users
[ Facebook Tips for Champions
by frequency. You can determine with accuracy how many times each person in your fan base viewed the content during a period of time.
8 One strategy not 100 tactics
One of the most common faults we see with poorly managed
Facebook pages – pages that inevitably have limited growth and little true engagement with their followers – is the spasmodic, simplistic, and/or ad hoc posts that are created.
These tactical posts are created independent of other strategic thought, have not considered the Facebook Insights mentioned earlier, and don’t fit a long term communications plan.
They are often created by immature (often young) workers who have yet to learn the importance of a structured, well considered, Communications Plan.
Develop a clear strategy for your Facebook page, review it regularly based on Facebook Insights and manage the page to this strategy with posts that fit rather than being tactical.

32
Australian Facebook Performance Report March 2012#fbreport // [email protected] // www.theonlinecircle.com[ Methodology
Report Period The Australian Facebook Performance Report covers the four weeks to March 27, 2012.
Data CollectionThe data for this report was captured at 12 midday on Tuesday February 28, March 6, 13, 20 and 27, 2012. The collection of data is automated through the Facebook API to ensure that times collected are close to simultaneous as possible.
Fans (Ave)The Fans (Ave) calculation is an average of the collected Fans (Likes) figures on each date. Industry averages have been calculated using only those above the statistical confidence level. Dates include March 6, 13, 20 and 27 - 2012.
Fan Growth Is the difference between a brand’s Fans (Likes on March 27 compared to the February 28 figure, presented as a whole number and as a percentage change.
People Talking About (Ave)The collected People Talking About figures relate to a seven day period ending on the collected date and time. The average taken from the four collected dates represents an average weekly People Talking About figure.
Industry averages have been calculated using only those above the statistical confidence level.
Engagement Rate The widely accepted metric called the “engagement rate” is the relationship between the People Talking About average and the Fans (Likes) average. The engagement equation is;
Share of EngagementThis is calculated using the sum of the each industries top twenty brand pages for each of week of the report “People Talking About’ figure and calculating each brand pages share of that sum.
Statistical ConfidenceIndustry averages have been calculated using only those organisations whose engagement rates meet a required level statistical confidence.
Specifically, 95% binomial confidence interval was calculated for each organisation’s engagement rate. Organisations whose engagement rate’s lower
[ Methodology
People Talking About
No. of Fans (Like this)= Engagement Rate %
Brand People Talking About
Industry Top 20 People Talking About
= Share of Engagement Activity %

33
Australian Facebook Performance Report March 2012#fbreport // [email protected] // www.theonlinecircle.com[ Methodology
confidence level was equal to or less than 0.5% was assumed to have zero level engagement rate.
Industry Fans, People Talking About & Engagement RatesThe Industry Fans total is the sum of each brand page’s fan count. Only those brand pages above statistical confidence levels have been included.
The Industry People Talking About total is the sum of each brand page’s Ppl Talking About (Ave). Only those brand pages above statistical confidence levels have been included.
The Industry Engagement Rate has been calculated using these two totals and the engagement equation detailed earlier.
Selection of BrandsThe brands displayed are not a complete list of those incorporated within the study, but are representative of those brands leading the way in each vertical. We expect and welcome suggestions for additional brands for inclusion in future reports.
Statistical CalculationsThe mathematical and statistical foundations of this report have been produced by Online Circle in consultation with 95th Percentile Pty Ltd. (John Ward).
[ Methodology

34
Australian Facebook Performance Report March 2012#fbreport // [email protected] // www.theonlinecircle.com[ About Us
At Online Circle, our model is unique. We’re social media specialists who live to create responsible strategy and execution. By responsible, we mean representing your brand in the right way online. Monitoring what is being said about your brand. Interacting consistently with the people who matter most, your customers. To put it simply – we’ve got your brands’ back online.
In a world where consumers control the conversation, analysing online brand perception to develop intelligent strategy comes first and foremost. Crafting the right balance between creative and accountable social media is key. It’s the only way to make positive, lasting relationships. And we should know. We look after some of Australia’s leading brands.
[ About Us