AUSTRALIAN CBD OFFICE - Knight...
12
RESEARCH AUSTRALIAN CBD OFFICE Top Sales Transactions - 2012 Calendar Year HIGHLIGHTS • Commercial sales activity across Australia’s major CBD office markets has been relatively subdued in 2012 when compared with the very active 2011 calendar year, when just over $6 billion of sales $10 million+ changed hands. Total investment activity fell to $3.82 billion in 2012 from 55 deals, compared to an average of 67 transacted over the three years prior to 2012. However, there is a significant number of large assets, predominately in Sydney, which are presently either under contract, in DD or under final negotiations. • After making up 36% of CBD transactions in 2011, offshore investors took a slight pause mid this year, mainly as a consequence of global uncertainty and the sudden change to the MIT tax regime in May. Sentiment has changed significantly over the past quarter, with overseas investors once again trawling the market for large, prime CBD assets, although there is recent evidence that they are prepared to look at more core plus, value-add opportunities also. We expect investment demand from offshore groups will continue to build in 2013. The 2012 year also saw domestic listed groups return to acquisition mode (made up 11% of deals in 2011 compared to 22% in 2012), with multiple purchases by Investa (IOF), Growthpoint, DEXUS and Commonwealth Property Office Fund (CPA). This will be the first of a number of domestic AREIT purchases across the major capital cities, as the lower cost of capital allows these investors to acquire properties that are income accretive for their shareholders. • Recent benchmark CBD office sales that have occurred have implied a degree of yield compression for “trophy” or newly constructed prime, passive assets, which has contributed to a widening spread between prime and secondary. This has presented opportunistic buying and we expect syndicates, wholesale investors and private investors to increasingly seek high yielding secondary CBD (and suburban) assets as they represent good relative value. The underlying drivers of the property market allude to minimal cap rate tightening in the near term, however, with the spread between real bonds and office yields being at historical highs, the cost of debt continuing to fall, office yields remaining above their longer term average and most importantly the re-emergence of a much broader depth of buyer type, we expect cap rates to have a firming bias over the next 12-18 months.
Transcript of AUSTRALIAN CBD OFFICE - Knight...

RESEARCH
AUSTRALIAN CBD OFFICE Top Sales Transactions - 2012 Calendar Year
HIGHLIGHTS • Commercial sales activity across Australia’s major CBD office markets has been relatively subdued in 2012
when compared with the very active 2011 calendar year, when just over $6 billion of sales $10 million+ changed hands. Total investment activity fell to $3.82 billion in 2012 from 55 deals, compared to an average of 67 transacted over the three years prior to 2012. However, there is a significant number of large assets, predominately in Sydney, which are presently either under contract, in DD or under final negotiations.
• After making up 36% of CBD transactions in 2011, offshore investors took a slight pause mid this year, mainly as a consequence of global uncertainty and the sudden change to the MIT tax regime in May. Sentiment has changed significantly over the past quarter, with overseas investors once again trawling the market for large, prime CBD assets, although there is recent evidence that they are prepared to look at more core plus, value-add opportunities also. We expect investment demand from offshore groups will continue to build in 2013. The 2012 year also saw domestic listed groups return to acquisition mode (made up 11% of deals in 2011 compared to 22% in 2012), with multiple purchases by Investa (IOF), Growthpoint, DEXUS and Commonwealth Property Office Fund (CPA). This will be the first of a number of domestic AREIT purchases across the major capital cities, as the lower cost of capital allows these investors to acquire properties that are income accretive for their shareholders.
• Recent benchmark CBD office sales that have occurred have implied a degree of yield compression for “trophy” or newly constructed prime, passive assets, which has contributed to a widening spread between prime and secondary. This has presented opportunistic buying and we expect syndicates, wholesale investors and private investors to increasingly seek high yielding secondary CBD (and suburban) assets as they represent good relative value. The underlying drivers of the property market allude to minimal cap rate tightening in the near term, however, with the spread between real bonds and office yields being at historical highs, the cost of debt continuing to fall, office yields remaining above their longer term average and most importantly the re-emergence of a much broader depth of buyer type, we expect cap rates to have a firming bias over the next 12-18 months.

DECEMBER 2012
AUSTRALIAN CBD OFFICE Top Sales Transactions - 2012 Calendar Year
2
# exercised pre-emptive right to acquire 25% interest, increasing ownership to 50% † Pre-emptive right to acquire 25% interest VP refers Vacant possession ~ purchased in conjunction
Year to date (YTD) sales in excess of $10 million in the Sydney CBD currently total $889 million, a figure well down on the $2.32 billion achieved last year. This slowdown in sales largely reflects the relatively limited offerings for prime core assets, which constituted the bulk of sales in 2011. However, it is noted that a significant number of large assets totalling almost $800 million, are presently either under contract, in due diligence or under final negotiations. These are expected to provide a substantial boost to the final sales volume for the 2012 calendar year.
Calendar year (CY) 2012 has seen a much broader depth of buyer type re-emerge with improved interest from local buyers seeking acquisition opportunities to increase total returns, particularly given the large spread between debt costs and property yields. In 2011, slightly more than half of all sales were purchased by offshore investors. In 2012, the buyer profile has been more evenly spread with AREITs, overseas investors and wholesale/syndicates accounting for 26%, 24% and 20% of sales respectively. There is also growing evidence of buyers beginning to look further up the risk curve at core plus assets, examples include the DEXUS acquisition at 50 Carrington Street.
Figure 1
Sydney CBD Transactions $10million+ $ million total transaction value
Source Knight Frank *(ex Aurora)
1. 126 Phillip Street Price: $176.25 million(25% interest)
Date: March 2012
NLA: 42,256m²
Yield: 6.35% core market (6.16% initial)
Rate/m² of NLA: $16,684/m²
Vendor: Investa Property Group
Purchaser: ICPF#/Investa Office Fund†
Comment: 37-level premium office tower completed in September 2005. The asset sold with nil vacancy and a 4.8 year WALE. Related party transaction of asset after pre-emptive rights exercised by ICPF and IOF.
2. 50 Martin Place & 9-19 Elizabeth Street ~ Price: circa $150.0 million
Date: March 2012
NLA: 23,367m²
Yield: VP Rate/m² of NLA: $6,419/m²
Vendor: CBA
Purchaser: Macquarie (owner occupy)
Comment: 12-storey, 1928 heritage building on Martin Place with ground floor retail banking facilities and adjacent C-grade, 11-storey office building on Elizabeth Street. Asset purchased with vacant possession for owner occupation.
3. 6-10 O’Connell Street Price: $105.1 million
Date: September 2012
NLA: 16,315m²
Yield: 8.4% core market (8.0% initial)
Rate/m² of NLA: $6,441/m²
Vendor: Colonial (PPS)
Purchaser: MGPA Asia Fund III
Comment: 29-level office building including two levels of basement parking for 120 cars, completed 1970. Relatively short WALE of 2.8 years, however reasonably typical for an asset with a smaller, multi-tenant profile.
4. 50 Carrington Street Price: $58.5 million
Date: July 2012
NLA: 11,293m²
Yield: 8.2% core market (5.2% initial) Rate/m² of NLA: $5,180/m²
Vendor: REST Purchaser: DEXUS (DXS)
Comment: 19-storey building with one retail level, 14-office levels and 20 basement car spaces. Relatively short 2.2 year WALE with one third of the building vacant. Asset circa 40% vacant, undergoing value add refurbishment.
Table 1
Major Office Assets Reportedly Under Contract, in Due Diligence or under Final Negotiations Address Map Ref Reported Purchaser Estimated Price ($m) 231 Elizabeth Street A CIMB Trust Capital Advisors ~200 9 Castlereagh Street B Charter Hall 170-180
10 Spring Street C U/D 75-85 9 Hunter Street D CorVal # 70-80 117 Clarence Street E U/D 55-65 175 Castlereagh Street F Centuria Capital 50-60 10 Barrack Street G U/D 45-55 2 Bulletin Place H U/D 45-50 107 Pitt Street I IOOF 20-30
Source: Knight Frank U/D refers undisclosed # under contract
SYDNEY CBD OFFICE MARKET
0
500
1,000
1,500
2,000
2,500
2007 2008 2009* 2010 2011 2012ytd
Total Sales Due Diligence/Under Contract

www.knightfrank.com.au
3
Sale Due Diligence/Final Negotiation
5. 7 Macquarie Place Price: $55.0 million (50% interest) Date: April 2012 NLA: 13,582m² Yield: 7.3% core market (6.5% initial) Rate/m² of NLA: $8,099/m² Vendor: Stockland Trust Purchaser: UniSuper (AMP) Comment: 14-storey building including 12 office floors with quality harbour views available from the mid-upper levels. Co-owner Stockland sold its 50% interest to UniSuper under pre-emptive rights.
6. 333 Kent Street Price: $47.75 million Date: February 2012 NLA: 8,938m² Yield: 8.4% core market (8.2% initial) Rate/m² of NLA: $5,342/m² Vendor: AMB Property Pty Ltd Purchaser: Maville Group Australia Pty Ltd Comment: 9-level B-grade asset completed in 1985. Asset was purchased off market. Located in the western corridor, the asset was sold fully leased to a single tenant (CQU) with a 5.2 year WALE.
7. 149 Castlereagh Street Price: $40.60 million Date: March 2012 NLA: 13,056m² Yield: VP (10.4% fully leased initial yield) Rate/m² of NLA: $3,110/m² Vendor: Ernst & Young (Receivers & Mgrs) Purchaser: Blackstone Comment: 13-storey building with two levels of retail space purchased with vacant possession and formerly owned by Allco. Constructed circa 1935, the asset was extended and fully retrofitted in 2009.
8. 56 Pirrama Rd, Pyrmont ^ Price: $31.80 million Date: April 2012 NLA: 4,347m² Yield: 8.7% core market (8.6% initial) Rate/m² of NLA: $7,316/m² Vendor: Charter Hall Purchaser: Abacus Comment: A low rise building constructed in 2001 on a redeveloped finger wharf over Pyrmont Bay. Sold fully leased to four tenants on a 6.2 year WALE.
9. 30 Windmill Street Price: $17.0 million Date: February 2012 NLA: 3,653m² Yield: 9.0% core market (10.7% initial) Rate/m² of NLA: $4,655/m² Vendor: PPB Advisory (Receivers & Managers) Purchaser: Private Investor Comment: Boutique building comprising a refurbished heritage wool bond store. Sold fully leased to a single tenant on a 1.7 year WALE, albeit a five year option remained.
10. 60 Clarence Street Price: $14.25 million Date: July 2012 NLA: 1,846m² Yield: 6.8% core market (6.7% initial) Rate/m² of NLA: $7,719/m² Vendor: Harbour & Co Purchaser: Private Investor Comment: An 8-level boutique building comprising seven upper commercial levels. Sold fully leased with all outstanding incentives paid out by the vendor.
SYDNEY CBD MAP
Source of Map: Knight Frank ^ Fringe sale
1
2
3
4
6
7
8
9
10
A
B
C
E
F
G
H
I
5
D

DECEMBER 2012
AUSTRALIAN CBD OFFICE Top Sales Transactions - 2012 Calendar Year
4
Despite the increasing level of interest to invest in the Melbourne CBD office market from both offshore and domestic groups, transactional activity continued to decline from the record highs of 2010 and from the preceding 12 months. Investment sales activity (above $10 million) in the 2012 CY to date within the Melbourne CBD totalled $804.56 million across 12 properties, down from the $1.4 billion that was transacted in the 2011 CY. While AREITs were the most prominent purchaser, accounting for 32% of all transactions over 2012, this was achieved through only two major transactions – 242 Exhibition Street and 40 Market Street. Offshore investors remained active in Melbourne, acquiring 29% of all purchases, buoyed by the attractive income returns when considered from a global perspective. Investors continue to focus on core assets with six buildings transacting above $50 million and prime quality assets accounting for 67% of volume transacted.
Figure 2
Melbourne CBD Transactions $10million+ $ million total transaction value
Source Knight Frank
With transaction volume restricted, yields have remained relatively stable over the year. While the yield gap between prime and secondary CBD office property has widened, assets that offer a value-add opportunity are attracting increasing levels of interest.
0
200
400
600
800
1,000
1,200
1,400
1,600
1,800
2,000
2007 2008 2009 2010 2011 2012ytd
1. 242 Exhibition Street Price: $217.50 million (50% interest)
Date: March 2012
NLA: 65,915m²
Yield: 6.91% core market (6.94% initial)
Rate/m² of NLA : $6,599/m²
Vendor: Investa Property Group
Purchaser: Investa Office Fund (IOF)
Comment: 47-level A-grade office tower with a small ground retail component. Located in the North Eastern core, with Telstra providing 96% of gross passing income. The 50% interest was a related party sale to the listed Investa Office Fund (IOF) and had a WALE of 8.0 years.
2. 150 Collins Street # Price: $181.60 million
Date: July 2012
NLA: 21,090m²
Yield: 6.74% initial
Rate/m² of NLA : $8,611/m²
# fund through
Vendor: Grocon/APN Property Group
Purchaser: GPT Wholesale Office Fund (GWOF)
Comment: A-grade office tower under construction, due to complete in August 2014. The project was 70% pre-committed by Westpac. GWOF’s purchase of the asset is a fund-through transaction with a WALE of circa 9.0 years (by income).
3. 477 Collins Street Price: $67.0 million
Date: February 2012
NLA: 11,987m²
Yield: 8.13% core market (7.50% initial)
Rate/m² of NLA: $5,590/m²
Vendor: Australian Unity Office Property Trust
Purchaser: Asia Pacific Property Fund (Aviva)
Comment: B-grade office tower sold with a WALE of 3.7 years. Aviva Investors is keen to increase their investment within the Asia Pacific, particularly in Australia, attracted by the relative higher yields.
4. 501 Swanston Street Price: $60.0 million
Date: May 2012
NLA: 15,883m²
Yield: 8.78% initial
Rate/m² of NLA: $3,778/m²
Vendor: PDG Corporation/Salvo Property Group
Purchaser: Vince Giuliano
Comment: The former Ansett Centre, an 18-storey office building completed 1980 and extensively refurbished in 2003. Purchased by former half owner of the joint venture vendor company with a WALE of 2.5 years.
5. 565 Bourke Street Price: $53.50 million Date: February 2012 NLA: 15,966m² Yield: 8.66% core market (8.36% initial) Rate/m² of NLA : $3,351/m²
Vendor: Eastern Holdings Purchaser: Shakespeare Property Group
Comment: Comprises a 5-storey historic office building constructed in 1901 and an adjoining 16-level office tower constructed in 1990. Tenants include Thomson Reuters and Lumo Energy. Sold with a WALE of 2.2 years.
6. 525 Flinders Street Price: $50.863 million Date: May 2012 NLA: 10,237m² Yield: 7.8% initial (7.3% core market) Rate/m² of NLA : $4,969/m²
Vendor: Uniting Church Aust Property Trust Purchaser: AFIAA
Comment: Northbank Place East Tower, an A-grade 11-level commercial office building, completed in 2009. The building is fully leased with TRU Energy occupying 43.6% of the NLA and sold with a WALE of 6.4 years.
MELBOURNE CBD MELBOURNE CBD OFFICE MELBOURNE CBD OFFICE MARKET
www.knightfrank.com.au
5
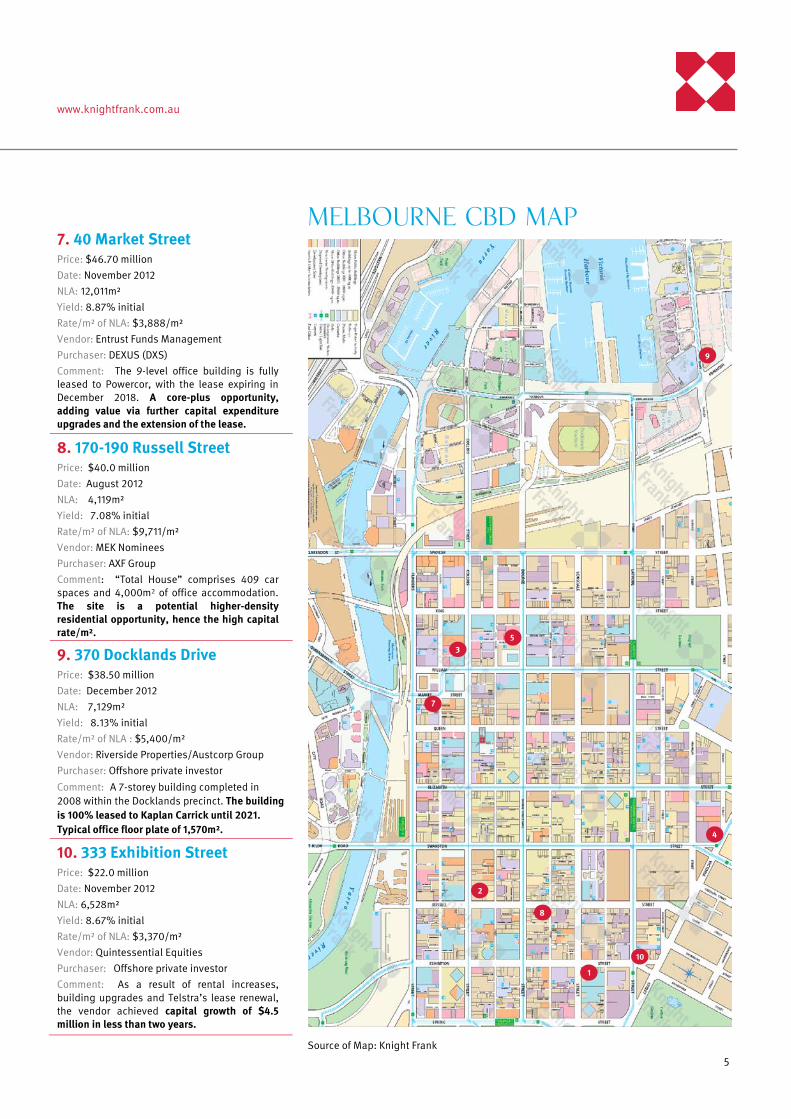
7. 40 Market Street Price: $46.70 million Date: November 2012 NLA: 12,011m² Yield: 8.87% initial Rate/m² of NLA: $3,888/m² Vendor: Entrust Funds Management Purchaser: DEXUS (DXS) Comment: The 9-level office building is fully leased to Powercor, with the lease expiring in December 2018. A core-plus opportunity, adding value via further capital expenditure upgrades and the extension of the lease.
8. 170-190 Russell Street Price: $40.0 million Date: August 2012 NLA: 4,119m² Yield: 7.08% initial Rate/m² of NLA: $9,711/m² Vendor: MEK Nominees Purchaser: AXF Group Comment: “Total House” comprises 409 car spaces and 4,000m2 of office accommodation. The site is a potential higher-density residential opportunity, hence the high capital rate/m².
9. 370 Docklands Drive Price: $38.50 million Date: December 2012 NLA: 7,129m² Yield: 8.13% initial Rate/m² of NLA : $5,400/m² Vendor: Riverside Properties/Austcorp Group Purchaser: Offshore private investor
Comment: A 7-storey building completed in 2008 within the Docklands precinct. The building is 100% leased to Kaplan Carrick until 2021. Typical office floor plate of 1,570m². 10. 333 Exhibition Street Price: $22.0 million Date: November 2012 NLA: 6,528m² Yield: 8.67% initial Rate/m² of NLA: $3,370/m² Vendor: Quintessential Equities Purchaser: Offshore private investor Comment: As a result of rental increases, building upgrades and Telstra’s lease renewal, the vendor achieved capital growth of $4.5 million in less than two years.
MELBOURNE CBD MAP
4
1
7
3
2
10
5
8
9
Source of Map: Knight Frank

DECEMBER 2012
AUSTRALIAN CBD OFFICE Top Sales Transactions - 2012 Calendar Year
6
Transaction activity has improved over the course of 2012, with AREITs once again purchasing major assets. In addition there has been competition from off-shore and wholesale purchasers. Transactions during the course of 2012 have totalled just over $1 billion, which is the strongest result since the standout year of 2007.
Figure 3
Brisbane CBD Transactions $10million+ $ million total transaction value
Source Knight Frank
While value-add was the catch-cry for much of the year, there were few secondary sales which fully fitted that bill, with most of the secondary sales featuring relatively long WALEs as buyers remained risk averse. In the prime market both 12 Creek Street ($241.6 million) and 10 Eagle Street ($195 million) were purchased by institutional investors with relatively short WALEs and some near term leasing risk. These buyers are looking to tap into the expected stronger market conditions from 2014 and rebase the rentals being achieved within these buildings. The other major transaction for 2012 was the $134.5 million purchase of 215 Adelaide Street by Pramerica for a German wholesale fund. This was Pramerica’s first foray into the Brisbane market and heralded greater purchasing activity from off-shore buyers with CIMB also purchasing in the CBD (150 Charlotte St) and Hines Global active in the Near City market.
0
500
1,000
1,500
2,000
2,500
2007 2008 2009 2010 2011 2012ytd
1. 12 Creek Street Price: $241.6 million
Date: October 2012
NLA: 32,227m²
Yield: 7.64% core market (7.92% initial)
Rate/m² of NLA: $7,497/m²
Vendor: APGF
Purchaser: DEXUS Property Group 50%, DWPF 50%
Comment: Well-located A-Grade building of 35-levels with an adjoining annex, constructed in 1984-floorplates of 1,000m² - 1,008m². Sold 95% leased to a variety of tenants with a WALE of 4.7 years.
2. 10 Eagle Street Price: $195.0 million
Date: June 2012
NLA: 28,098m²
Yield: 7.51% core market (7.45% initial)
Rate/m² of NLA : $6,945/m²
Vendor: Brookfield
Purchaser: Commonwealth Property Office Fund (CPA)
Comment: A-Grade building well located in the financial district. The 30-level office building was constructed in 1978. Average floorplates of 911m² - 954m². WALE of 4.2 years with some near term vacancy.
3. 215 Adelaide Street Price: $134.5 million
Date: February 2012
NLA: 29,780m²
Yield: 8.9% core market (8.10% initial)
Rate/m² of NLA : $4,516/m²
Vendor: GIC Real Estate
Purchaser: Pramerica (German Wholesale Fund)
Comment: B-Grade building of 28 office levels, parking for 141 cars and an adjoining low rise heritage listed retail arcade. Sold with a WALE of 4.4 years. The retail has the potential for value -add.
4. 40 Creek Street Price: $84.5 million
Date: September 2012
NLA: 12,353m²
Yield: 8.01% core market (8.28% initial)
Rate/m² of NLA : $6,840/m²
Vendor: Charter Hall Opportunity Fund No 5
Purchaser: Peter Gunn (private investor)
Comment: Well-located building which underwent a major refurbishment in 2009. Sold with a WALE of 5.8 years. The re-leasing campaign from 2009 took longer than expected, but the property was sold fully leased.
5. 160 Ann Street Price: $74.92 million
Date: September 2012
NLA: 16,060m²
Yield: 9.06% core market (9.43% initial)
Rate/m² of NLA : $4,665/m²
Vendor: Investa Enhanced Fund
Purchaser: CorVal (unlisted fund)
Comment: B-grade property over 22-levels and sold 5.1% vacant. Major tenants at the time of sale included CQU, Xstrata and Suncorp. WALE of 6.9 years. Purchased by CorVal on behalf of an un-named club of wholesale investors.
6. 150 Charlotte Street Price: $71 million (allocated)
Date: June 2012
NLA: 11,035m²
Yield: 8.45% core market (8.73% initial)
Rate/m² of NLA : $6,434/m²
Vendor: Walker Corporation
Purchaser: CIMB (Australian Office Fund 1)
Comment: A-Grade property constructed in 1988 and sold following a major refurbishment. Sold with a 5-year rental guarantee at $595/m² gross. Price is also reported as property ($56m) plus income guarantee ($15m).
BRISBANE CBD OFFICE MARKET
www.knightfrank.com.au
7
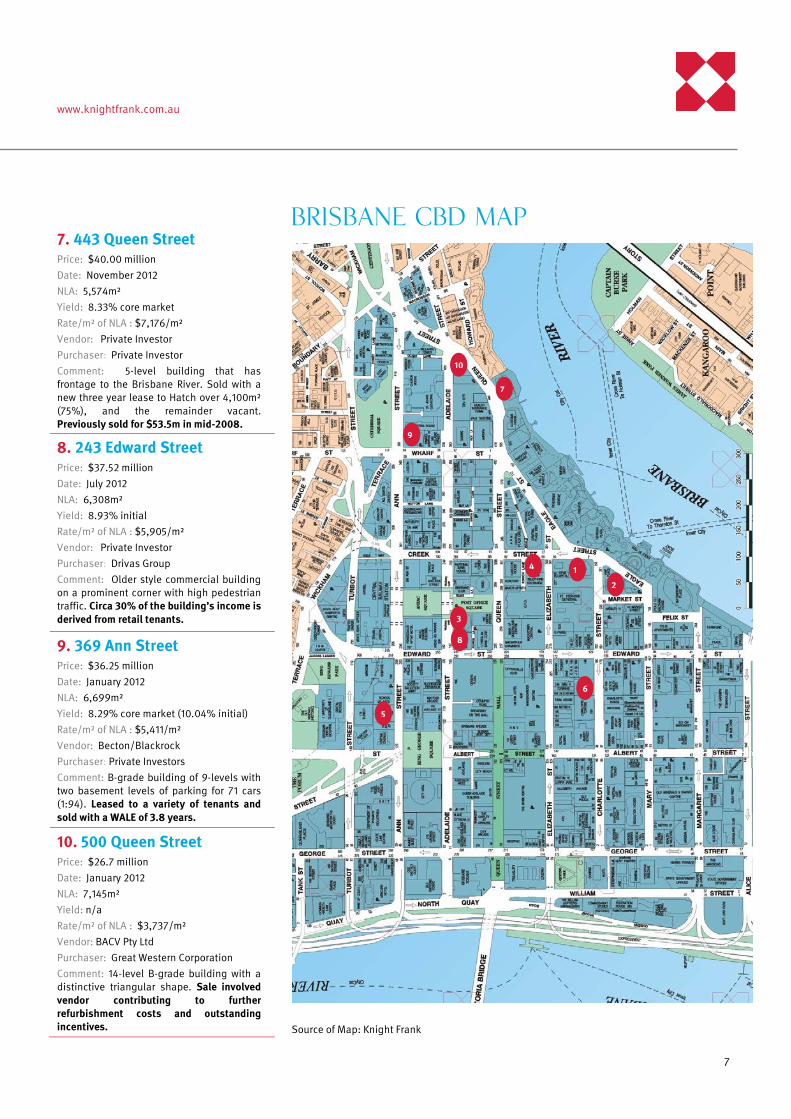
7. 443 Queen Street Price: $40.00 million Date: November 2012 NLA: 5,574m² Yield: 8.33% core market Rate/m² of NLA : $7,176/m² Vendor: Private Investor Purchaser: Private Investor Comment: 5-level building that has frontage to the Brisbane River. Sold with a new three year lease to Hatch over 4,100m² (75%), and the remainder vacant. Previously sold for $53.5m in mid-2008.
8. 243 Edward Street Price: $37.52 million Date: July 2012 NLA: 6,308m² Yield: 8.93% initial Rate/m² of NLA : $5,905/m² Vendor: Private Investor Purchaser: Drivas Group Comment: Older style commercial building on a prominent corner with high pedestrian traffic. Circa 30% of the building’s income is derived from retail tenants.
9. 369 Ann Street Price: $36.25 million Date: January 2012 NLA: 6,699m² Yield: 8.29% core market (10.04% initial) Rate/m² of NLA : $5,411/m² Vendor: Becton/Blackrock Purchaser: Private Investors Comment: B-grade building of 9-levels with two basement levels of parking for 71 cars (1:94). Leased to a variety of tenants and sold with a WALE of 3.8 years.
10. 500 Queen Street Price: $26.7 million Date: January 2012 NLA: 7,145m² Yield: n/a Rate/m² of NLA : $3,737/m² Vendor: BACV Pty Ltd Purchaser: Great Western Corporation Comment: 14-level B-grade building with a distinctive triangular shape. Sale involved vendor contributing to further refurbishment costs and outstanding incentives.
BRISBANE CBD MAP
Source of Map: Knight Frank
7
6
10
3
5
9
4 1
2
8

DECEMBER 2012
AUSTRALIAN CBD OFFICE Top Sales Transactions - 2012 Calendar Year
8
With transaction activity during the 2011 CY topping over $1.0 billion, the 2012 YTD has appeared subdued in comparison. However, the Perth CBD has recorded eight major transactions for the calendar year, totalling $573.83 million.
Figure 4 Perth CBD Transactions $10million+ $ million total transaction value
Source: Knight Frank Unlisted Funds/Syndicates have been the dominant purchasers during the year, purchasing $241.7 million worth of property over four buildings, continuing a trend from last year.
The Perth CBD has seen greater investment in the market by off-shore investors; 45 St Georges Terrace was purchased through Credit Suisse REF Global (Switzerland) by an overseas private investor in September for $55.25 million. Keppel REIT Asia has taken a 50% interest in the Old Treasury office tower development for $165.0 million. Demolition for this new building has commenced on site and is anticipated to complete by 2015.
Three major non-CBD sales have also transacted in West Perth for a consideration of almost $63.5 million during CY 2012. This includes 1110 Hay Street ($29.9 million, private investor), 22 Delhi Street ($20.0 million, unlisted syndicate), and 10 Ord Street ($13.585 million, private investor).
0
200
400
600
800
1,000
1,200
2007 2008 2009 2010 2011 2012ytd
1. 54-58 Barrack Street # Price: $165.0 million (50% interest)
Date: September 2012 (Completion 2015)
NLA: 30,800m²
Yield: 7.15% (pre agreed capitalisation rate)
Rate/m² NLA: $10,714/m²
# fund through
Vendor: Mirvac
Purchaser: Keppel REIT Asia
Comment: The sale of a 50% interest in the yet-to-be constructed building in the Old Treasury precinct. Constructed by Mirvac, the building has a 25 year pre-commitment to the State Government. The second fund through “capital partnership” deal that Keppel-REIT has entered into with Mirvac.
2. 1 Adelaide Terrace Price: $102.55 million
Date: June 2012
NLA: 19,825m²
Yield: 9.74% core market (9.86% initial)
Rate/m² NLA: $5,173/m²
Vendor: Fortius Funds Management
Purchaser: GDI Property Group
Comment: This distinctive property is located at the Gateway to the Perth CBD, and at the time of sale had a 3.6% vacancy and WALE of 4.9 years. This is the fourth property in the Perth CBD that the GDI group has purchased.
3. 225 St Georges Terrace Price: $96.0 million (50% interest)
Date: June 2012
NLA: 21,221m²
Yield: 9.00% core market (9.17% initial)
Rate/m² NLA: $9,048/m²
Vendor: Wyllie Group
Purchaser: Charter Hall (CPOF)
Comment: The sale of the 50% interest in this A-grade building brings full ownership to Charter Hall. The site is held on a 99-year leasehold from the Perth Diocese. The sale was conducted in an off-market transaction.
4. 66 St Georges Terrace Price: $82.375 million
Date: July 2012
NLA: 11,446m²
Yield: 8.71% core market (8.75% initial)
Rate/m² NLA: $7,197/m²
Vendor: AMP Capital Investors
Purchaser: Investa Office Fund (IOF)
Comment: AMP completed capital works on the building in the past 12 months, increasing its NABERS rating to 3 stars. With a relatively short WALE on area of 1.7 years, there is potential for growth in net face rents.
5. 45 St Georges Terrace Price: $55.25 million
Date: September 2012
NLA: 10,018m²
Yield: 9.00% core market (10.5% initial)
$/m²: $5,515/m²
Vendor: Stockland Trust
Purchaser: Credit Suisse (Private Investor)
Comment: The building was sold with a WALE of 2.0 years, with the major tenant having a lease expiry at the start of 2014. This sale continues Stockland’s long-term strategy of selling-down its office assets.
6. 218 St Georges Terrace Price: $29.5 million (Under Contract) Date: November 2012 NLA: 4,674m² Yield: 9.14% core market (9.62% initial) Rate/m² NLA: $6,311/m²
Vendor: Private Investor
Purchaser: Private Investor
Comment: Situated at the western end of the CBD, the major tenant is BHP. The building transacted with an initial passing yield of 9.62%, reflecting its shorter WALE of 1.8 years.
PERTH CBD OFFICE MARKET

www.knightfrank.com.au
9
7. 255 & 267 St Georges Tce Price: $26.7 million Date: July 2012 NLA: 4,131m² (255 StG - 625m²; 267 StG - 3,506m²) Yield: 10.07% core market (9.38% initial) Rate/m² NLA: $6,463/m² Vendor: Stockland Purchaser: Primewest
Comment: The property is situated at the western end of St Georges Terrace, with Primewest having purchased the neighbouring property (251 St Georges Tce) in 2011. Since the purchase Primewest has announced plans to build a 3,000m² building on part of the site.
8. 41 St Georges Terrace Price: $16.45 million Date: January 2012 NLA: 2,901m² Yield: 10.20% core market (10.00% initial) Rate/m² NLA: $5,671/m² Vendor: Private Investor Purchaser: Wakefield Properties Pty Ltd
Comment: The building sold in an off-market transaction by a motivated vendor. The price paid for the building was considered below market value. The building has since been strata titled.
9. 118 Bennett Street^ Price: $15.3 million (fringe CBD sale) Date: November 2012 NLA: 3,197m² Yield: 8.82% core market Rate/m² NLA: $4,785/m² Vendor: Australian Executor Trustees Ltd Purchaser: Private Investor
Comment: Situated at the eastern end and on the fringe of the Perth CBD, this C-grade building was sold with a WALE of 5.8 years. The site has surplus development potential under the current planning scheme.
PERTH CBD MAP
Source of Map: PCA
8 5
1
2
4
7
3 6
^ Sale 9 is a “fringe” sale located on the north-eastern fringe of the CBD.
9
DECEMBER 2012
AUSTRALIAN CBD OFFICE Top Sales Transactions - 2012 Calendar Year
10
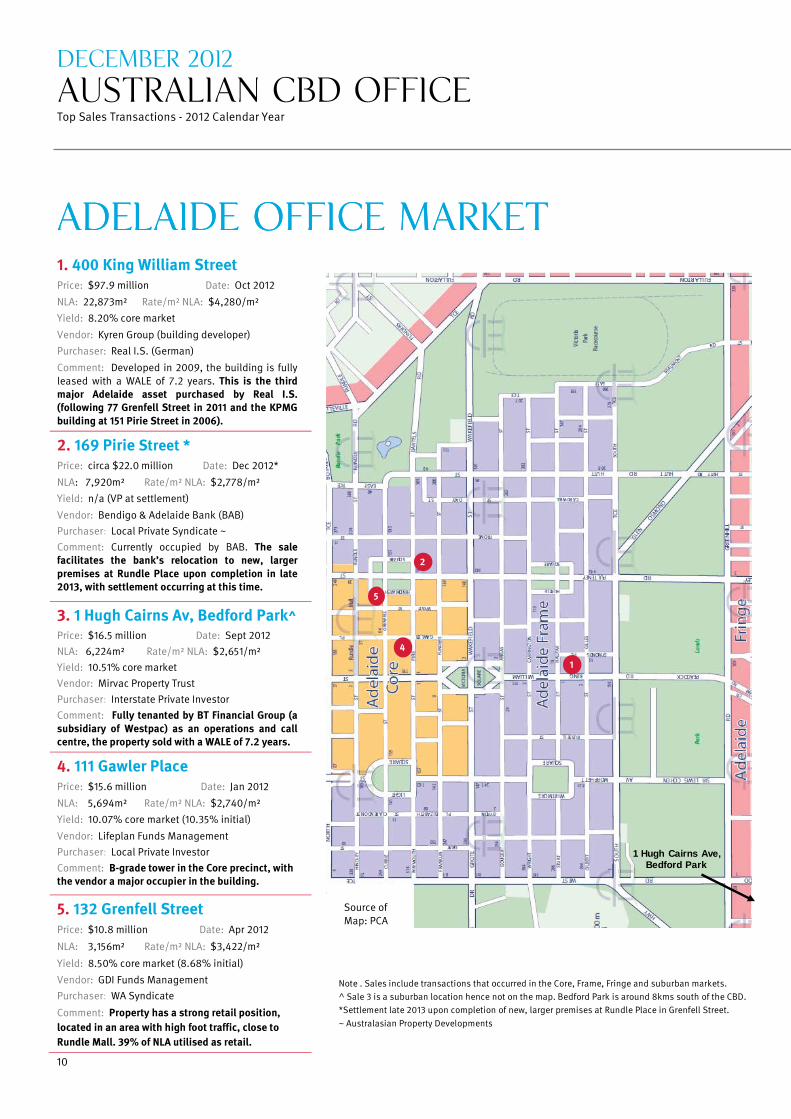
1. 400 King William Street Price: $97.9 million Date: Oct 2012
NLA: 22,873m² Rate/m² NLA: $4,280/m² Yield: 8.20% core market
Vendor: Kyren Group (building developer) Purchaser: Real I.S. (German)
Comment: Developed in 2009, the building is fully leased with a WALE of 7.2 years. This is the third major Adelaide asset purchased by Real I.S. (following 77 Grenfell Street in 2011 and the KPMG building at 151 Pirie Street in 2006). 2. 169 Pirie Street * Price: circa $22.0 million Date: Dec 2012*
NLA: 7,920m² Rate/m² NLA: $2,778/m² Yield: n/a (VP at settlement)
Vendor: Bendigo & Adelaide Bank (BAB) Purchaser: Local Private Syndicate ~ Comment: Currently occupied by BAB. The sale facilitates the bank’s relocation to new, larger premises at Rundle Place upon completion in late 2013, with settlement occurring at this time.
3. 1 Hugh Cairns Av, Bedford Park^ Price: $16.5 million Date: Sept 2012 NLA: 6,224m² Rate/m² NLA: $2,651/m² Yield: 10.51% core market Vendor: Mirvac Property Trust Purchaser: Interstate Private Investor Comment: Fully tenanted by BT Financial Group (a subsidiary of Westpac) as an operations and call centre, the property sold with a WALE of 7.2 years.
4. 111 Gawler Place Price: $15.6 million Date: Jan 2012
NLA: 5,694m² Rate/m² NLA: $2,740/m² Yield: 10.07% core market (10.35% initial)
Vendor: Lifeplan Funds Management Purchaser: Local Private Investor Comment: B-grade tower in the Core precinct, with the vendor a major occupier in the building.
5. 132 Grenfell Street Price: $10.8 million Date: Apr 2012
NLA: 3,156m² Rate/m² NLA: $3,422/m²
Yield: 8.50% core market (8.68% initial)
Vendor: GDI Funds Management Purchaser: WA Syndicate
Comment: Property has a strong retail position, located in an area with high foot traffic, close to Rundle Mall. 39% of NLA utilised as retail.
1
4
5
2
1 Hugh Cairns Ave, Bedford Park
ADELAIDE OFFICE MARKET
Source of Map: PCA
ADELAIDE OFFICE MARKET
Note . Sales include transactions that occurred in the Core, Frame, Fringe and suburban markets. ^ Sale 3 is a suburban location hence not on the map. Bedford Park is around 8kms south of the CBD. *Settlement late 2013 upon completion of new, larger premises at Rundle Place in Grenfell Street. ~ Australasian Property Developments

www.knightfrank.com.au
11
1. 50 Marcus Clarke Street, Civic Price: $225.888 million Date: Feb 2012
NLA: 40,861 m2
Yield: 7.36% core market
Rate/m² NLA: $5,528/m2
Vendor: Walker Corporation
Purchaser: CIMB Trust Capital
Comment: A purpose built, A-grade, 12-level office building constructed in 2011. Subject to a 15 year lease to Dept. Education, Employment and Workplace Relations (DEEWR) - WALE of 13.4 years.
2. 57 Athllon Drive, Greenway Price: $83.00 million (50% int) Date: Mar 2012
NLA: 40,244m2
Yield: 8.83% core market (8.69% initial)
Rate/m² NLA: $4,125/m2
Vendor: Allco (in receivership)
Purchaser: Frasers Commercial Trust
Comment: 50% sale of Caroline Chisholm Centre after the previous owner went into liquidation. Property was subject to an original 18 year lease with annual 3% reviews and the WALE is 13.4 years. Currently achieving a NABERS energy rating of 5 stars. Fraser now owns 100% of the asset.
3. 10-12 Mort Street, Civic Price: $55.80 million Date: June 2012
NLA: 15,295m2
Yield: 9.95% core market (10.31% initial)
Rate/m² NLA: $3,648/m2
Vendor: GPT
Purchaser: Growthpoint Properties
Comment: Two adjoining circa 1990’s 6-level office buildings, recently refurbished to 4.5 NABERS rating. DEEWR recently commenced a lease which expires March 2017 - the WALE was 4.7 years.
4. 2-6 Bowes Street, Phillip Price: $14.00 million Date: Apr 2012 NLA: 12,622m2 Yield: 12.27% core market (11.62% initial) Rate/m² NLA: $1,109/m2
Vendor: Australian Public Trustees Limited (in receivership - McGrath Nicol)
Purchaser: Quintessential Equities
Comment: Penrhyn House is a D-grade 6-level office building constructed circa 1986. WALE of 1.2 years with a current lease to Department of Human Services until late 2013.
Source of Map: ACT Planning and Land Authority (ACTMAPi)
CANBERRA OFFICE MARKET
burgh Ave
Marcu
s Cla No
rthb
ourn
e Av
e
Lond
on
Circuit
Ainslie Ave
Constitution Ave
Edin
Anza
c Par
ade
Com
mon
wea
lth A
ve
1 3
Com
mon
wea
lth A
ve
Kings Ave
Brisbane Ave
Canberra Ave
Melbou
rne A
ve
South West
2
4

12
RESEARCH
Americas USA Bermuda Brazil Canada Caribbean Chile
Australasia Australia New Zealand
Europe UK Belgium Czech Republic France Germany Hungary Ireland Italy Monaco Poland Portugal Romania Russia Spain The Netherlands Ukraine
Africa Botswana Kenya Malawi Nigeria South Africa Tanzania Uganda Zambia Zimbabwe
Asia Cambodia China Hong Kong India Indonesia Macau Malaysia Singapore South Korea Thailand Vietnam
The Gulf Bahrain Abu Dhabi, UAE
Knight Frank Research Matt Whitby National Director – Head of Research & Consulting +61 2 9036 6616 [email protected] Jennelle Wilson Director – Research QLD +61 7 3246 8830 [email protected] Richard Jenkins Director - Research VIC +61 3 9604 4713 [email protected] Nick Hoskins Assoc. Director – Research NSW +61 3 9036 6766 [email protected] Alison Smith Research Manager - WA +61 8 9225 2434 [email protected] Vanessa Rader Director – Consulting & Research Services +612 9036 6715 [email protected]
Capital Transactions - Asia Pacific SINGAPORE Marc Giuffrida Managing Director – Capital Trans AP +65 6228 7396 [email protected]
Knight Frank Key Contacts SYDNEY Stephen Ellis Executive Chairman +61 2 9036 6611 [email protected]
James Parry Managing Director - Capital Transactions +61 2 9036 6758 [email protected]
Richard Horne Managing Director - NSW +61 2 9036 6622 [email protected]
MELBOURNE Paul Henley Managing Director Commercial Sales +61 3 9604 4760 [email protected]
BRISBANE David Fowler Director – Capital Transactions +61 7 3246 8823 [email protected]
PERTH John Corbett Managing Director - WA +61 8 9225 2561 [email protected]
ADELAIDE Tony Ricketts Director Investment Sales +61 8 8233 5259 [email protected]
CANBERRA Daniel McGrath Assoc. Director Investment Sales +61 2 6230 7855 [email protected]
Knight Frank Research provides strategic advice, consultancy services and forecasting to a wide
range of clients worldwide including developers, investors, financial and corporate institutions.
All recognise the need for the provision of expert independent advice customised to their
specific needs.
Knight Frank Research reports are also available at www.knightfrank.com.au.
© Knight Frank 2012 This report is published for general information only. Although high standards have been used in the preparation of the information, analysis, views and projections presented in this report, no legal responsibility can be accepted by Knight Frank Research or Knight Frank for any loss or damage resultant from the contents of this document. As a general report, this material does not necessarily represent the view of Knight Frank in relation to particular properties or projects. Reproduction of this report in whole or in part is not permitted without prior consent of, and proper reference to Knight Frank Research.