AustraliaandNewZealand - · PDF fileAustralia and New Zealand are already experiencing...
34
11 Australia and New Zealand Coordinating Lead Authors: Kevin Hennessy (Australia), Blair Fitzharris (New Zealand) Lead Authors: Bryson C. Bates (Australia), Nick Harvey (Australia), Mark Howden (Australia), Lesley Hughes (Australia), Jim Salinger (New Zealand), Richard Warrick (New Zealand) Contributing Authors: Susanne Becken (New Zealand), Lynda Chambers (Australia), Tony Coleman (Australia), Matt Dunn (New Zealand), Donna Green (Australia), Roddy Henderson (New Zealand), Alistair Hobday (Australia), Ove Hoegh-Guldberg (Australia), Gavin Kenny (New Zealand), Darren King (New Zealand), Guy Penny (New Zealand), Rosalie Woodruff (Australia) Review Editors: Michael Coughlan (Australia), Henrik Moller (New Zealand) This chapter should be cited as: Hennessy, K., B. Fitzharris, B.C. Bates, N. Harvey, S.M. Howden, L. Hughes, J. Salinger and R. Warrick, 2007: Australia and New Zealand. Climate Change 2007: Impacts, Adaptation and Vulnerability. Contribution of Working Group II to the Fourth Assessment Report of the Intergovernmental Panel on Climate Change, M.L. Parry, O.F. Canziani, J.P. Palutikof, P.J. van der Linden and C.E. Hanson, Eds., Cambridge University Press, Cambridge, UK, 507-540.
Transcript of AustraliaandNewZealand - · PDF fileAustralia and New Zealand are already experiencing...

11Australia and New Zealand
Coordinating Lead Authors:Kevin Hennessy (Australia), Blair Fitzharris (New Zealand)
Lead Authors:Bryson C. Bates (Australia), Nick Harvey (Australia), Mark Howden (Australia), Lesley Hughes (Australia), Jim Salinger (New Zealand),
Richard Warrick (New Zealand)
Contributing Authors:Susanne Becken (New Zealand), Lynda Chambers (Australia), Tony Coleman (Australia), Matt Dunn (New Zealand), Donna Green
(Australia), Roddy Henderson (New Zealand), Alistair Hobday (Australia), Ove Hoegh-Guldberg (Australia), Gavin Kenny (New Zealand),
Darren King (New Zealand), Guy Penny (New Zealand), Rosalie Woodruff (Australia)
Review Editors:Michael Coughlan (Australia), Henrik Moller (New Zealand)
This chapter should be cited as:Hennessy, K., B. Fitzharris, B.C. Bates, N. Harvey, S.M. Howden, L. Hughes, J. Salinger and R. Warrick, 2007: Australia and New
Zealand. Climate Change 2007: Impacts, Adaptation and Vulnerability. Contribution of Working Group II to the Fourth Assessment Report
of the Intergovernmental Panel on Climate Change, M.L. Parry, O.F. Canziani, J.P. Palutikof, P.J. van der Linden and C.E. Hanson, Eds.,
Cambridge University Press, Cambridge, UK, 507-540.
Australia and New Zealand Chapter 11
508
Executive summary.....................................................509
11.1 Introduction ........................................................51011.1.1 Summary of knowledge from the Third
Assessment Report (TAR).........................................510
11.1.2 New findings of this Fourth AssessmentReport (AR4) ..........................................................510
11.2 Current sensitivity/vulnerability ...................51011.2.1 Climate variability and 20th-century trends .........510
11.2.2 Human systems: sensitivity/vulnerabilityto climate andweather.............................................511
11.2.3 Natural systems: sensitivity/vulnerabilityto climate andweather.............................................511
11.2.4 Sensitivity/vulnerability to other stresses.............511
Box 11.1 Examples of extreme weather events inAustralia and New Zealand ..................................511
11.2.5 Current adaptation ...............................................513
11.3 Assumptions about future trends ..................51411.3.1 Climate .................................................................514
11.3.2 Population, energy and agriculture ......................516
11.4 Key future impacts and vulnerabilities .......51611.4.1 Freshwater resources...........................................516
11.4.2 Natural ecosystems..............................................517
11.4.3 Agriculture ............................................................518
11.4.4 Forestry.................................................................520
11.4.5 Coasts...................................................................520
11.4.6 Fisheries................................................................521
11.4.7 Settlements, industry and societies .....................521
11.4.8 Indigenous people ................................................522
11.4.9 Tourism and recreation .........................................523
11.4.10 Energy ..................................................................523
11.4.11 Human health.......................................................524
11.4.12 Synthesis..............................................................524
11.5 Adaptation constraints and opportunities ...524
11.6 Case studies.........................................................526Box 11.2. Adaptation of water supplies in cities...............526
Box 11.3. Climate change and the Great Barrier Reef......527
Box 11.4. Climate change adaptation in coastal areas.....528
11.7 Conclusions: implications forsustainable development..................................528
11.8 Key uncertainties and research priorities ...52911.8.1 Assessing impacts of climate change
and vulnerability for critical systems ...........................529
11.8.2 Fostering the process of adaptationto climate change ....................................................530
11.8.3 Assessing risks and opportunities ofclimate change for different scenarios ........................531
11.8.4 Analysing global trade, immigration andsecurity for climate change outcomes........................531
References ......................................................................531
Table of Contents

Chapter 11 Australia and New Zealand
509
Executive summary
Literature published since the IPCC Third AssessmentReport confirms and extends its main findings (highconfidence).There is more extensive documentation of observed changes tonatural systems, major advances in understanding potentialfuture climate changes and impacts, more attention to the roleof planned adaptation in reducing vulnerability, andassessments of key risks and benefits [11.1].
Regional climate change has occurred (very high confidence).Since 1950, there has been 0.4 to 0.7°C warming, with moreheatwaves, fewer frosts, more rain in north-west Australia andsouth-west New Zealand, less rain in southern and easternAustralia and north-eastern New Zealand, an increase in theintensity of Australian droughts, and a rise in sea level of about70 mm [11.2.1].
Australia and New Zealand are already experiencingimpacts from recent climate change (high confidence).These are now evident in increasing stresses on water supplyand agriculture, changed natural ecosystems, reduced seasonalsnow cover, and glacier shrinkage [11.2.1, 11.2.3].
Some adaptation has already occurred in response toobserved climate change (high confidence).Examples come from sectors such as water, natural ecosystems,agriculture, horticulture and coasts [11.2.5]. However, ongoingvulnerability to extreme events is demonstrated by substantialeconomic losses caused by droughts, floods, fire, tropicalcyclones and hail [11.2.2].
The climate of the 21st century is virtually certain to bewarmer, with changes in extreme events.Heatwaves and fires are virtually certain to increase in intensityand frequency (high confidence). Floods, landslides, droughtsand storm surges are very likely to become more frequent andintense, and snow and frost are very likely to become lessfrequent (high confidence). Large areas of mainland Australiaand eastern New Zealand are likely to have less soil moisture,although western New Zealand is likely to receive more rain(medium confidence) [11.3.1].
Potential impacts of climate change are likely to besubstantial without further adaptation.
• As a result of reduced precipitation and increasedevaporation, water security problems are projected tointensify by 2030 in southern and eastern Australia and, inNew Zealand, in Northland and some eastern regions (highconfidence) [11.4.1].
• Ongoing coastal development and population growth, inareas such as Cairns and south-east Queensland (Australia)and Northland to Bay of Plenty (New Zealand), are
projected to exacerbate risks from sea-level rise andincreases in the severity and frequency of storms andcoastal flooding by 2050 (high confidence) [11.4.5,11.4.7].
• Significant loss of biodiversity is projected to occur by2020 in some ecologically rich sites, including the GreatBarrier Reef and Queensland Wet Tropics. Other sites atrisk include Kakadu wetlands, south-west Australia, sub-Antarctic islands and alpine areas of both countries (veryhigh confidence) [11.4.2].
• Risks to major infrastructure are likely to increase. By2030, design criteria for extreme events are very likely tobe exceeded more frequently. Risks include failure offloodplain protection and urban drainage/sewerage,increased storm and fire damage, and more heatwaves,causing more deaths and more blackouts (high confidence)[11.4.1, 11.4.5, 11.4.7, 11.4.10, 11.4.11].
• Production from agriculture and forestry is projected todecline by 2030 over much of southern and easternAustralia, and over parts of eastern New Zealand, due toincreased drought and fire. However, in New Zealand,initial benefits to agriculture and forestry are projected inwestern and southern areas and close to major rivers dueto a longer growing season, less frost and increased rainfall(high confidence) [11.4.3, 11.4.4].
Vulnerability is likely to increase in many sectors, but thisdepends on adaptive capacity.
• Most human systems have considerable adaptive capacity:The region has well-developed economies, extensivescientific and technical capabilities, disaster mitigationstrategies, and biosecurity measures. However, there arelikely to be considerable cost and institutional constraintsto the implementation of adaptation options (highconfidence) [11.5]. Some Indigenous communities havelow adaptive capacity (medium confidence) [11.4.8].Water security and coastal communities are the mostvulnerable sectors (high confidence) [11.7].
• Natural systems have limited adaptive capacity: Projectedrates of climate change are very likely to exceed rates ofevolutionary adaptation in many species (high confidence)[11.5]. Habitat loss and fragmentation are very likely tolimit species migration in response to shifting climaticzones (high confidence) [11.2.5, 11.5].
• Vulnerability is likely to rise due to an increase in extremeevents: Economic damage from extreme weather is verylikely to increase and provide major challenges foradaptation (high confidence) [11.5].
• Vulnerability is likely to be high by 2050 in a few identifiedhotspots: In Australia, these include the Great BarrierReef, eastern Queensland, the South-West, Murray-Darling Basin, the Alps and Kakadu wetlands; in NewZealand, these include the Bay of Plenty, Northland,eastern regions and the Southern Alps (mediumconfidence) [11.7].
Australia and New Zealand Chapter 11
510
11.1 Introduction
The region is defined here as the lands and territories ofAustralia and New Zealand. It includes their outlying tropical,mid-latitude and sub-Antarctic islands and the waters of theirExclusive Economic Zones. New Zealand’s population was 4.1million in 2006, growing by 1.6%/yr (Statistics New Zealand,2006). Australia’s population was 20.1 million in 2004, growingby 0.9%/yr (ABS, 2005a). Many of the social, cultural andeconomic aspects of the two countries are comparable. Bothcountries are relatively wealthy and have export-basedeconomies largely dependent on natural resources, agriculture,manufacturing, mining and tourism. Many of these areclimatically sensitive.
11.1.1 Summary of knowledge from theThird Assessment Report (TAR)
In the IPCC Third Assessment Report (TAR; Pittock andWratt, 2001), the following impacts were assessed as importantfor Australia and New Zealand.
• Water resources are likely to become increasingly stressedin some areas of both countries, with rising competition forwater supply.
• Warming is likely to threaten the survival of species insome natural ecosystems, notably in alpine regions, south-western Australia, coral reefs and freshwater wetlands.
• Regional reductions in rainfall in south-west and inlandAustralia and eastern New Zealand are likely to makeagricultural activities particularly vulnerable.
• Increasing coastal vulnerability to tropical cyclones, stormsurges and sea-level rise.
• Increased frequency of high-intensity rainfall, which islikely to increase flood damage.
• The spread of some disease vectors is very likely, therebyincreasing the potential for disease outbreaks, despiteexisting biosecurity and health services.
The overall conclusions of the TAR were that: (i) climate changeis likely to add to existing stresses to the conservation ofterrestrial and aquatic biodiversity and to achieving sustainableland use, and (ii) Australia has significant vulnerability toclimate change expected over the next 100 years, whereas NewZealand appears more resilient, except in a few eastern areas.
11.1.2 New findings of this Fourth AssessmentReport (AR4)
The scientific literature published since 2001 supports the TARfindings. Key differences from the TAR include (i) more extensivedocumentation of observed changes in natural systems consistentwith global warming, (ii) significant advances in understandingpotential future impacts on water, natural ecosystems, agriculture,coasts, Indigenous people and health, (iii) more attention to therole of adaptation, and (iv) identification of the most vulnerablesectors and hotspots. Vulnerability is given more attention – it isdependent on the exposure to climate change, the sensitivity ofsectors to this exposure, and their capacity to adapt.
11.2 Current sensitivity/vulnerability
11.2.1 Climate variability and 20th-century trends
In this section, climate change is taken to be due to bothnatural variability and human activities. The relative proportionsare unknown unless otherwise stated. The strongest regionaldriver of climate variability is the El Niño-Southern Oscillation(ENSO). In New Zealand, El Niño brings stronger and coolersouth-westerly airflow, with drier conditions in the north-east ofthe country and wetter conditions in the south-west (Gordon,1986; Mullan, 1995). The converse occurs during La Niña. InAustralia, El Niño tends to bring warmer and drier conditions toeastern and south-western regions, and the converse during LaNiña (Power et al., 1998). The positive phase of the Inter-decadal Pacific Oscillation (IPO) strengthens the ENSO-rainfalllinks in New Zealand and weakens links in Australia (Power etal., 1999; Salinger et al., 2004; Folland et al., 2005).
In New Zealand, mean air temperatures have increased by1.0°C over the period 1855 to 2004, and by 0.4°C since 1950(NIWA, 2005). Local sea surface temperatures have risen by0.7°C since 1871 (Folland et al., 2003). From 1951 to 1996, thenumber of cold nights and frosts declined by 10-20 days/yr(Salinger and Griffiths, 2001). From 1971 to 2004, tropicalcyclones in the south-west Pacific averaged nine/year, with notrend in frequency (Burgess, 2005) or intensity (Diamond,2006). The frequency and strength of extreme westerly windshave increased significantly in the south. Extreme easterly windshave decreased over land but have increased in the south(Salinger et al., 2005a). Relative sea-level rise has averaged 1.6± 0.2 mm/yr since 1900 (Hannah, 2004). Rainfall has increasedin the south-west and decreased in the north-east (Salinger andMullan, 1999) due to changes in circulation linked to the IPO,with extremes showing similar trends (Griffiths, 2007). Panevaporation has declined significantly at six out of nineteen sitessince the 1970s, with no significant change at the other thirteensites (Roderick and Farquhar, 2005). Snow accumulation in theSouthern Alps shows considerable interannual variability but notrend since 1930 (Owens and Fitzharris, 2004).
In Australia, from 1910 to 2004, the average maximumtemperature rose 0.6°C and the minimum temperature rose 1.2°C,mostly since 1950 (Nicholls and Collins, 2006). It is very likelythat increases in greenhouse gases have significantly contributedto the warming since 1950 (Karoly and Braganza, 2005a, b). From1957 to 2004, the Australian average shows an increase in hotdays (≥35°C) of 0.10 days/yr, an increase in hot nights (≥20°C) of0.18 nights/yr, a decrease in cold days (≤15°C) of 0.14 days/yrand a decrease in cold nights (≤5°C) of 0.15 nights/yr (Nichollsand Collins, 2006). Due to a shift in climate around 1950, thenorth-western two-thirds of Australia has seen an increase insummer monsoon rainfall, while southern and eastern Australiahave become drier (Smith, 2004b). While the causes of decreasedrainfall in the east are unknown, the decrease in the south-west isprobably due to a combination of increased greenhouse gasconcentrations, natural climate variability and land-use change,whilst the increased rainfall in the north-west may be due toincreased aerosols resulting from human activity, especially inAsia (Nicholls, 2006). Droughts have become hotter since about

Chapter 11 Australia and New Zealand
511
1973 because temperatures are higher for a given rainfalldeficiency (Nicholls, 2004). From 1950 to 2005, extreme dailyrainfall has increased in north-western and central Australia andover the western tablelands of New South Wales (NSW), but hasdecreased in the south-east, south-west and central east coast(Gallant et al., 2007). Trends in the frequency and intensity ofmost extreme temperature and rainfall events are rising faster thanthe means (Alexander et al., 2007). South-east Australian snowdepths at the start of October have declined 40% in the past 40years (Nicholls, 2005). Pan evaporation averaged over Australiafrom 1970 to 2005 showed large interannual variability but nosignificant trend (Roderick and Farquhar, 2004; Jovanovic et al.,2007; Kirono and Jones, 2007). There is no trend in the frequencyof tropical cyclones in the Australian region from 1981 to 2003,but there has been an increase in intense systems (very low centralpressure) (Kuleshov, 2003; Hennessy, 2004). Relative sea-levelrise around Australia averaged 1.2 mm/yr from 1920 to 2000(Church et al., 2004).
The offshore islands of Australia and New Zealand haverecorded significant warming. The Chatham Islands (44°S,177°W) have warmed 1°C over the past 100 years (Mullan etal., 2005b). Macquarie Island (55°S, 159°E) has warmed 0.3°Cfrom 1948 to 1998 (Tweedie and Bergstrom, 2000), along withincreases in wind speed, precipitation and evapotranspiration,and decreases in air moisture content and sunshine hours since1950 (Frenot et al., 2005). Campbell Island (53°S, 169°E) haswarmed by 0.6°C in summer and 0.4°C in winter since the late1960s. Heard Island (53°S, 73°E) shows rapid glacial retreat anda reduced area of annual snow cover from 1948 to 2001(Bergstrom, 2003).
11.2.2 Human systems: sensitivity/vulnerabilityto climate and weather
Extreme events have severe impacts in both countries (Box11.1). In Australia, around 87% of economic damage due tonatural disasters (storms, floods, cyclones, earthquakes, fires andlandslides) is caused by weather-related events (BTE, 2001).From 1967 to 1999, these costs averaged US$719 million/yr,mostly due to floods, severe storms and tropical cyclones. InNew Zealand, floods are the most costly natural disasters apart fromearthquakes and droughts, and total flood damage costs averagedabout US$85 million/yr from 1968 to 1998 (NZIER, 2004).
11.2.3 Natural systems: sensitivity/vulnerabilityto climate and weather
Some species and natural systems in Australia and NewZealand are already showing evidence of recent climate-associated change (Table 11.1). In many cases, the relativecontributions of other factors such as changes in fire regimesand land use are not well understood.
11.2.4 Sensitivity/vulnerability to other stresses
Human and natural systems are sensitive to a variety ofstresses independent of those produced by climate change.Growing populations and energy demands have placed stress on
energy supply infrastructure. In Australia, energy consumptionhas increased 2.5%/yr over the past 20 years (PB Associates,2007). Increases in water demand have placed stress on supplycapacity for irrigation, cities, industry and environmental flows.Increased water demand in New Zealand has been due toagricultural intensification (Woods and Howard-Williams, 2004)
Box 11.1. Examples of extreme weatherevents in Australia and New Zealand*
Droughts: In Australia, the droughts of 1982-1983, 1991-1995 and 2002-2003 cost US$2.3 billion, US$3.8 billionand US$7.6 billion, respectively (Adams et al., 2002; BoM,2006a). In New Zealand, the 1997-1998 and 1998-1999droughts had agricultural losses of US$800 million(MAF, 1999).
Sydney hailstorm, 14 April 1999: With the exception ofthe droughts listed above, this is the most expensivenatural disaster in Australian history, costing US$1.7 billion,of which US$1.3 billion was insured (Schuster et al., 2005).
Eastern Australian heatwave, 1 to 22 February 2004:About two-thirds of continental Australia recordedmaximum temperatures over 39°C. Temperatures reached48.5°C in western New South Wales. The Queenslandambulance service recorded a 53% increase inambulance call-outs (Steffen et al., 2006).
Canberra fire, 19 January 2003: Wildfires causedUS$261 million damage (Lavorel and Steffen, 2004; ICA,2007). About 500 houses were destroyed, four peoplewere killed and hundreds injured. Three of the city’s fourdams were contaminated for several months by sediment-laden runoff.
South-east Australian storm, 2 February 2005: Strongwinds and heavy rain led to insurance claims of almostUS$152 million (ICA, 2007). Transport was severelydisrupted and beaches were eroded.
Tropical cyclone Larry, 20 March 2006: Significantdamage or disruption to houses, businesses, industry,utilities, infrastructure (including road, rail and air transportsystems, schools, hospitals and communications), cropsand state forests, costing US$263 million. Fortunately, the1.75 m storm surge occurred at low tide (BoM, 2006b;Queensland Government, 2006).
New Zealand floods: The 10 April 1968 Wahine stormcost US$188 million, the 26 January 1984 Southlandfloods cost US$80 million, and the February 2004 NorthIsland floods cost US$78 million (Insurance Council ofNew Zealand, 2005).
* All costs are adjusted to 2002-2006 values.

Australia and New Zealand Chapter 11
512
and has seen the irrigated area of New Zealand increase byaround 55% each decade since the 1960s (LincolnEnvironmental, 2000). Per capita daily water consumption is180-300 litres in New Zealand and 270 litres for Australia (Robband Bright, 2004). In Australia, dryland salinity, alteration ofriver flows, over-allocation and inefficient use of waterresources, land clearing, intensification of agriculture, and
fragmentation of ecosystems still represent major stresses (SOE,2001; Cullen, 2002). From 1985 to 1996, Australian waterdemand increased by 65% (NLWRA, 2001). Invasive plant andanimal species pose significant environmental problems in bothcountries, particularly for agriculture and forestry (MfE, 2001;SOE, 2001); for example, Cryptostegia grandiflora (Kriticos etal., 2003a, b).
Taxa or system Observed change References
Australia
Rainforest and woodland ecotones Expansion of rainforest at the expense of eucalyptforest and grassland in Northern Territory, Queenslandand New South Wales, linked to changes in rainfalland fire regimes.
Bowman et al., 2001; Hughes, 2003
Sub-alpine vegetation Encroachment by snow gums into sub-alpinegrasslands at higher elevations.
Wearne and Morgan, 2001
Freshwater swamps and floodplains Saltwater intrusion into freshwater swamps sincethe 1950s in Northern Territory accelerating sincethe 1980s, possibly associated with sea level andprecipitation changes.
Winn et al., 2006
Coral reefs Eight mass bleaching events on the Great Barrier Reefsince 1979, triggered by unusually high sea surfacetemperatures; no serious events known prior to 1979(see Section 11.6). Most widespread events appear tohave occurred in 1998 and 2002, affecting up to 50% ofreefs within the Great Barrier Reef Marine Park.
Hoegh-Guldberg, 1999; Done et al., 2003;Berkelmans et al., 2004
Birds Earlier arrival of migratory birds; range shifts andexpansions for several species; high sea surfacetemperatures associated with reduced reproductionin wedge-tailed shearwaters.
Smithers et al., 2003; Chambers, 2005;Chambers et al., 2005; Beaumont et al., 2006
Mammals Increased penetration of feral mammals into alpineand high sub-alpine areas and prolonged winterpresence of macropods.
Green and Pickering, 2002
Insects Change in genetic constitution of Drosophila, equivalentto a 4° latitude shift (about 400 km).
Umina et al., 2005
New Zealand
Birds Earlier egg laying in the welcome swallow. Evans et al., 2003
Southern beech Seed production increase in Nothofagus (1973 to 2002)along elevational gradient related to warming duringflower development.
Richardson et al., 2005
Fish Westward shift of Chilean jack mackerel in the Pacificand subsequent invasion into New Zealand waters in themid-1980s associated with increasing El Niño frequency.
Taylor, 2002
Glaciers Ice volume decreased from about 100 km3 to 53 km3
over the past century. Loss of at least one-quarter ofglacier mass since 1950. Mass balance of Franz Josefglacier decreased 0.02 m/yr from 1894 to 2005.
Chinn, 2001; Clare et al., 2002;Anderson, 2004
Sub-Antarctic Islands
Birds Population increases in black-browed albatross andking penguin on Heard Island; population declines onCampbell Island of rockhopper penguins, grey-headedalbatross and black-browed albatross related to oceanwarming and changed fishing practices.
Waugh et al., 1999; Woehler et al., 2002;Weimerskirch et al., 2003
Vertebrates Population increases in fur seals on Heard Island andelephant seals on Campbell Island, linked to changesin food supply, warming and oceanic circulation;rats moving into upland herb-fields and breedingmore often on Macquarie Island.
Budd, 2000; Weimerskirch et al., 2003;Frenot et al., 2005
Plant communities Plant colonisation of areas exposed by glacial retreat onHeard Island; decline in area of sphagnum moss since1992 on Macquarie Island associated with drying trend.
Whinam and Copson, 2006
Table 11.1. Examples of observed changes in species and natural systems linked to changing climate in Australia, New Zealand and their sub-Antarctic islands.

Chapter 11 Australia and New Zealand
513
11.2.5 Current adaptation
Since vulnerability is influenced by adaptation, a summary ofcurrent adaptation is given here rather than in Section 11.5 (whichlooks at future adaptation). Adaptation refers to planned andautonomous (or spontaneous) adjustments in natural or humansystems in response to climatic stimuli. Adaptation can reduceharmful effects or exploit opportunities (see Chapter 17). Anexample of autonomous adaptation is the intensification of grazingin the rangelands of north-west Australia over the last 30 years, asgraziers have exploited more reliable and better pasture growthfollowing an increase in monsoon rainfall (Ash et al., 2006).However, there is currently insufficient information tocomprehensively quantify this capacity. While planned adaptationusually refers to specific measures or actions, it can also be viewedas a dynamic process that evolves over time, involving five majorpre-conditions for encouraging implementation (Figure 11.1).This section assesses how well Australia and New Zealand areengaged in the adaptation process.
Provision of knowledge, data and tools.Since the TAR, the New Zealand Foundation for Research,
Science and Technology has created a separate strategic fund forglobal change research (FRST, 2005). Operational research anddevelopment related to climate impacts on specific sectors havealso increased over the last 10 years (e.g., agricultural impacts,decision-support systems and extension activities for integrationwith farmers’ knowledge) (Kenny, 2002; MAF, 2006). One ofAustralia’s four National Research Priorities is “anenvironmentally sustainable Australia”, which includes“responding to climate change and variability” (DEST, 2004).The Australian Climate Change Science Programme and theNational Climate Change Adaptation Programme are part of thiseffort (Allen Consulting Group, 2005). All Australian state andterritory governments have greenhouse action plans that includedevelopment of knowledge, data and tools.
Risk assessmentsA wide range of regional and sectoral risk assessments has
been undertaken since 2001 (see Section 11.4). Both countries
occasionally produce national reports that synthesise theseassessments and provide a foundation for adaptation (MfE, 2001;Warrick et al., 2001; Howden et al., 2003a; Pittock, 2003).Regionally relevant guidelines are available for use in riskassessments (Wratt et al., 2004; AGO, 2006).
MainstreamingClimate change issues are gradually being ‘mainstreamed’
into policies, plans and strategies for development andmanagement. For example, in New Zealand, the Coastal PolicyStatement included consideration of sea-level rise (DoC, 1994),the Resource Management (Energy and Climate Change)Amendment Act 2004 made explicit provisions for the effectsof climate change, and the Civil Defence and EmergencyManagement Act 2002 requires regional and local governmentauthorities (LGAs) to plan for future natural hazards. NewZealand farmers, particularly in the east, implemented a range ofadaptation measures in response to droughts in the 1980s and1990s and as a result of the removal of almost all subsidies.Increasing numbers of farmers are focusing on building long-term resilience with a diversity of options (Kenny, 2005;Salinger et al., 2005b). In Australia, climate change is includedin several environmentally focused action plans, including theNational Agriculture and Climate Change Action Plan(NRMMC, 2006) and the National Biodiversity and ClimateChange Action Plan. A wide range of water adaptation strategieshas been implemented or proposed (Table 11.2), includingUS$1.5 billion for the National Water Fund from 2004 to 2009and US$1.7 billion for drought relief from 2001 to 2006.
Climate change is listed as a Key Threatening Process underthe Commonwealth Environment Protection and BiodiversityConservation Act 1999. Climate change has been integrated intoseveral state-based and regional strategies, such as theQueensland Coastal Management Plan, the Great Barrier ReefClimate Change Action Plan, the Victorian Sustainable WaterStrategy and South Australia’s Natural Resources ManagementPlan. The Wild Country (The Wilderness Society), GondwanaLinks (Western Australia) and Nature Links (South Australia)and Alps to Atherton (Victoria, NSW, Queensland) initiativespromote connectivity of landscapes and resilience of naturalsystems in recognition of the fact that some species will need tomigrate as climate zones shift. Guidelines prepared for thecoastal and ocean engineering profession for implementingcoastal management strategies include consideration of climatechange (Engineers Australia, 2004).
Evaluation and monitoringThe New Zealand Climate Committee monitors the present
state of knowledge of climate science, climate variability andcurrent and future climate impacts, and makes recommendationsabout research and monitoring needs, priorities and gapsregarding climate, its impacts and the application of climateinformation (RSNZ, 2002). In Australia, the AustralianGreenhouse Office (AGO) monitors and evaluates performanceagainst objectives in the National Greenhouse Strategy. TheAGO and state and territory governments commission researchto assess current climate change knowledge, gaps and prioritiesfor research on risk and vulnerability (Allen Consulting Group,Figure 11.1. Adaptation as a process (Warrick, 2000, 2006).

Australia and New Zealand Chapter 11
514
2005). The National Land and Water Resources Audit (NLWRA,2001) and State of the Environment Report (SOE, 2001) alsohave climate-change elements.
Awareness raising and capacity buildingIn New Zealand, efforts are underway for transferring scientific
information to LGAs and facilitating exchange of informationbetween LGAs. The New Zealand Climate Change Office hasheld a number of workshops for LGAs (MfE, 2002, 2004b),supported case studies of ‘best practice’adaptation by LGAs, andhas commissioned guidance documents for LGAs on integratingclimate change adaptation into their functions (MfE, 2004c). TheAGO, the Australian Bureau of Meteorology, the CommonwealthScientific and Industrial Research Organisation (CSIRO) andmost Australian state and territory governments have developedproducts and services for raising awareness about climate change.Government-supported capacity-building programmes, such asthe Australian National Landcare Programme, enhance resilienceto climate change via mechanisms such as whole-farm planning.
In general, the domestic focus of both countries has, untilrecently, been on mitigation, while adaptation has had a secondaryrole in terms of policy effort and government funding forimplementation (MfE, 2004b). However, since the TAR,recognition of the necessity for adaptation has grown and concretesteps have been taken to bolster the pre-conditions for adaptation,as discussed above. Initiatives such as the Australia-New ZealandBilateral Climate Change Partnership (AGO, 2003) explicitlyinclude adaptation. Overall, in comparison to most other countries,New Zealand and Australia have a relatively high and growinglevel of adaptive capacity, which has the potential to beimplemented systematically on a wide scale.
11.3 Assumptions about future trends
11.3.1 Climate
Regional climate change projections are provided in Chapter11 of the Working Group I Fourth Assessment Report(Christensen et al., 2007). For Australia and New Zealand, theseprojections are limited to averages over two very broad regions:northern Australia and southern Australia (including NewZealand). More detailed regional projections are required toassess local impacts and are described below. Developed overthe past five years, these are similar to those presented in theTAR, and include the full range of emissions scenarios from theIPCC Special Report on Emissions Scenarios (SRES:Nakićenović and Swart, 2000) (see Chapter 2.4.6). Some SRESscenarios have been suggested as surrogates for CO2concentration stabilisation scenarios: the SRES B1, B2 and A1Bemissions scenarios are similar to the CO2 stabilisationscenarios for 550 ppm by 2150, 650 ppm by 2200, and 750 ppmby 2250, respectively. Projected changes will be superimposedon continued natural variability including ENSO and the IPO.There is uncertainty about projected changes in ENSO asdiscussed in Chapter 10 of the Working Group I FourthAssessment Report (Meehl et al., 2007).
In New Zealand, a warming of 0.1 to 1.4°C is likely by the2030s and 0.2 to 4.0°C by the 2080s (Table 11.3). The mid-rangeprojection for the 2080s is a 60% increase in the annual meanwesterly component of wind speed (Wratt et al., 2004).Consequently, a tendency for increased precipitation is likelyexcept in the eastern North Island and the northern South Island.Due to the projected increased winter precipitation over the
Government Strategy Investment Source
Australia Drought aid payments to rural communities US$1.7 billion from 2001 to 2006 DAFF, 2006b
Australia National Water Initiative, supported by theAustralian Water Fund
US$1.5 billion from 2004 to 2009 DAFF, 2006a
Australia Murray-Darling Basin Water Agreement US$0.4 billion from 2004 to 2009 DPMC, 2004
Victoria Melbourne’s Eastern Treatment Plant to supplyrecycled water
US$225 million by 2012 Melbourne Water, 2006
Victoria New pipeline from Bendigo to Ballarat, waterrecycling, interconnections between dams,reducing channel seepage, conservation measures
US$153 million by 2015 Premier of Victoria, 2006
Victoria Wimmera Mallee pipeline replacingopen irrigation channels
US$376 million by 2010 Vic DSE, 2006
NSW NSW Water Savings Fund supports projects whichsave or recycle water in Sydney
US$98 million for Round 3,plus more than US$25 million to 68 otherprojects
DEUS, 2006
Queensland (Qld) Qld Water Plan 2005 to 2010 to improve water-useefficiency and quality, recycling, droughtpreparedness, new water pricing
Includes US$182 million for waterinfrastructure in south-east Qld, and US$302million to other infrastructure programmes
Queensland Government,2005
South Australia Water Proofing Adelaide project is a blueprint forthe management, conservation and developmentof Adelaide’s water resources to 2025
N/A Government of SouthAustralia, 2005
Western Australia(WA)
State Water Strategy (2003) and State Water Plan(proposed) WA Water Corporation doubled supplyfrom 1996 to 2006
US$500 million spent by WA WaterCorporation from 1996 to 2006, plus US$290million for the Perth desalination plant
Government of WesternAustralia, 2003, 2006;Water Corporation, 2006
Table 11.2. Examples of government adaptation strategies to cope with water shortages in Australia.

Chapter 11 Australia and New Zealand
Southern Alps, it is less clear whether snow will be reduced(MfE, 2004a), although snowlines are likely to be higher(Fitzharris, 2004). By 2100, there is likely to be a 5 to 20 daydecrease in frosts in the lower North Island, 10 to 30 fewer frostdays in the South Island, and a 5 to 70 day increase in thenumber of days with temperatures over 30°C (Mullan et al.,2001). The frequency of heavy rainfall is likely to increase,especially in western areas (MfE, 2004a).
In Australia, within 800 km of the coast, a mean warming of0.1 to 1.3°C is likely by the year 2020, relative to 1990, 0.3 to3.4°C by 2050, and 0.4 to 6.7°C by 2080 (Table 11.4). Intemperate areas, this translates to 1 to 32 more days/yr over 35°Cby 2020 and 3 to 84 more by 2050, with 1 to 16 fewer days/yrbelow 0°C by 2020 and 2 to 32 fewer by 2050 (Suppiah et al.,2007). A tendency for decreased annual rainfall is likely overmost of southern and sub-tropical Australia, with a tendency forincreases in Tasmania, central Northern Territory and northernNSW (Table 11.4). The 15-model average shows decreasingrainfall over the whole continent (Suppiah et al., 2007). Adecline in runoff in southern and eastern Australia is also likely(see Section 11.4.1).
The area of mainland Australia with at least one day of snowcover per year is likely to shrink by 10 to 40% by 2020 and by22 to 85% by 2050 (Hennessy et al., 2003). Increases in extremedaily rainfall are likely where average rainfall either increases ordecreases slightly. For example, the intensity of the 1-in-20 yeardaily rainfall event is likely to increase by up to 10% in parts ofSouth Australia by the year 2030 (McInnes et al., 2002), by 5 to70% by the year 2050 in Victoria (Whetton et al., 2002), by upto 25% in northern Queensland by 2050 (Walsh et al., 2001) andby up to 30% by 2040 in south-east Queensland (Abbs, 2004).In NSW, the intensity of the 1-in-40 year event increases by 5 to15% by 2070 (Hennessy et al., 2004). The frequency of severetropical cyclones (Categories 3, 4 and 5) on the east Australiancoast increases 22% for the IS92a scenario (IPCC, 1992) from2000 to 2050, with a 200 km southward shift in the cyclonegenesis region, leading to greater exposure in south-eastQueensland and north-east NSW (Leslie and Karoly, 2007). Fortripled pre-industrial CO2 conditions, there is a 56% increase inthe number of simulated tropical cyclones over north-easternAustralia with peak winds greater than 30 m/s (Walsh et al.,
2004). Decreases in hail frequency are simulated for Melbourneand Mt. Gambier (Niall and Walsh, 2005).
Potential evaporation (or evaporative demand) is likely toincrease (Jones, 2004a). Projected changes in rainfall andevaporation have been applied to water-balance models,indicating that reduced soil moisture and runoff are very likelyover most of Australia and eastern New Zealand (see Section11.4.1 and Meehl et al., 2007). Up to 20% more droughts(defined as the 1-in-10 year soil moisture deficit from 1974 to2003) are simulated over most of Australia by 2030 and up to80% more droughts by 2070 in south-western Australia(Mpelasoka et al., 2007). Projected increases in the PalmerDrought Severity Index for the SRES A2 scenario are indicatedover much of eastern Australia between 2000 and 2046 (Burkeet al., 2006). In New Zealand, severe droughts (the current 1-in-20 year soil moisture deficit) are likely to occur every 7 to 15years by the 2030s, and every 5 to 10 years by the 2080s, in theeast of both islands, and parts of Bay of Plenty and Northland(Mullan et al., 2005a). The drying of pastures in eastern NewZealand in spring is very likely to be advanced by one month,with an expansion of droughts into both spring and autumn.
An increase in fire danger in Australia is likely to beassociated with a reduced interval between fires, increased fireintensity, a decrease in fire extinguishments and faster firespread (Tapper, 2000; Williams et al., 2001; Cary, 2002). Insouth-east Australia, the frequency of very high and extreme firedanger days is likely to rise 4-25% by 2020 and 15-70% by 2050(Hennessy et al., 2006). By the 2080s, 10-50% more days withvery high and extreme fire danger are likely in eastern areas ofNew Zealand, the Bay of Plenty, Wellington and Nelson regions(Pearce et al., 2005), with increases of up to 60% in somewestern areas. In both Australia and New Zealand, the fireseason length is likely to be extended, with the window ofopportunity for controlled burning shifting toward winter.
Relative to the year 2000, the global-mean projection of sea-level rise by 2100 is 0.18 to 0.59 m, excluding uncertainties in
Temperature change (°C) 2030s 2080s
Western North Island +0.2 to 1.3 +0.3 to 4.0
Eastern North Island +0.2 to 1.4 +0.5 to 3.8
Northern South Island +0.1 to 1.4 +0.4 to 3.5
Western South Island +0.1 to 1.3 +0.2 to 3.5
Eastern South Island +0.1 to 1.4 +0.4 to 3.4
Rainfall change (%) 2030s 2080s
Western North Island -4 to +14 -6 to +26
Eastern North Island -19 to +7 -32 to +2
Northern South Island -7 to +3 -7 to +5
Western South Island -4 to +15 +1 to +40
Eastern South Island -12 to +13 -21 to +31
Table 11.3. Projected changes in New Zealand annual precipitation andmean temperature for the 2030s and 2080s, relative to 1990. The rangesare based on results from forty SRES emission scenarios and six climatemodels for various locations in each region (Wratt et al., 2004).
Temperature change (°C) 2020 2050 2080
0 to 400 km inland of coast +0.1 to 1.0 +0.3 to 2.7 +0.4 to 5.4
400 to 800 km inland +0.2 to 1.3 +0.5 to 3.4 +0.8 to 6.7
Central Australia +0.2 to 1.5 +0.5 to 4.0 +0.8 to 8.0
Rainfall change (%) 2020 2050 2080
Within 400 km of westernand southern coasts
-15 to 0 -40 to 0 -80 to 0
Sub-tropics (latitudes 20-28°S) except west coastand inland Queensland
-10 to +5 -27 to +13 -54 to +27
Northern NSW, Tasmaniaand central NorthernTerritory (NT)
-5 to +10 -13 to +27 -27 to +54
Central South Australia,southern NSW and northof latitude 20°S, exceptcentral NT
-5 to +5 -13 to +13 -27 to +27
Inland Queensland -10 to +10 -27 to +27 -54 to +54
Table 11.4. Projected changes in annual average rainfall and temperaturefor 2020, 2050 and 2080, relative to 1990, for Australia. The ranges arebased on results from forty SRES emission scenarios and fifteen climatemodels for various locations in each region (Suppiah et al., 2007).
515

Australia and New Zealand Chapter 11
516
carbon cycle feedbacks and the possibility of faster ice lossfrom Greenland and Antarctica (Meehl et al., 2007). Thesevalues would apply to Australia and New Zealand, but wouldbe further modified by as much as ±25% due to regionaldifferences in thermal expansion rates, oceanic circulationchanges (as derived from atmosphere-ocean generalcirculation model experiments; Gregory et al., 2001) and bylocal differences in relative sea-level changes due to verticalland movements. An increase in westerly winds is probablesouth of latitude 45°S, with a strengthening of the EastAustralian Current and southern mid-latitude oceancirculation (Cai et al., 2005).
11.3.2 Population, energy and agriculture
The Australian population is projected to grow from 20million in 2003 to 26.4 million in 2051, then stabilise (ABS,2003a). This is under medium assumptions, including a fallin the number of children per woman from 1.75 at present to1.6 from 2011 onward, net immigration of 100,000/yr, and a10% increase in life expectancy by 2051 (ABS, 2003a). Agreater concentration of the population is likely in Sydney,Melbourne, Perth, Brisbane and south-east Queensland. Theproportion of people aged 65 and over is likely to increasefrom 13% in 2003 to 27% in 2051 (ABS, 2003a). Populationgrowth is likely to intensify the urban heat island effect,exacerbating greenhouse-induced warming (Torok et al.,2001). Up to at least 2020, Australian energy consumption isprojected to grow 2.1%/yr on average (ABARE, 2004). Newenergy sources will be needed to meet peak energy demandsin Victoria, NSW, Queensland and South Australia between2007 and 2010 (NEMMCO, 2006). Agriculture is likely tocontribute about 3% of national gross domestic product(GDP).
In New Zealand, under medium assumptions, thepopulation is likely to grow from 4.1 million in 2004 to 5.05million in 2051 (Statistics New Zealand, 2005b). Theseassumptions include a net immigration of 10,000/yr, a drop infertility rate from 2.01 in 2004 to 1.85 from 2016 onward anda 10% increase in life expectancy by 2051. The proportionaged 65 and over is likely to grow from 12% in 2004 to 25%in 2051. Total energy demand is likely to grow at an averagerate of 2.4%/yr from 2005 to 2025 (Electricity Commission,2005). Agriculture is likely to continue contributing about 5%of GDP (MFAT, 2006).
11.4 Key future impacts and vulnerabilities
This section discusses potential impacts of climate change,mostly based on climate projections consistent with thosedescribed in Section 11.3. It does not take into accountadaptation; this is discussed in Section 11.5 and in more detailin Chapter 17. Conclusions are drawn from the available literature.Very little information is available on social and economic impacts.Further details on potential impacts can be found in varioussynthesis reports (MfE, 2001; Pittock, 2003).
11.4.1 Freshwater resources
11.4.1.1 Water securityThe impact of climate change on water security is a significant
cross-cutting issue. In Australia, many new risk assessments havebeen undertaken since the TAR (Table 11.5). The Murray-DarlingBasin is Australia’s largest river basin, accounting for about 70%of irrigated crops and pastures (MDBC, 2006). Annual streamflowin the Basin is likely to fall 10-25% by 2050 and 16-48% by 2100(Table 11.5). Little is known about future impacts on groundwaterin Australia.
In New Zealand, annual flow from larger rivers withheadwaters in the Southern Alps is likely to increase.Proportionately more runoff is very likely from South Island riversin winter, and less in summer (Woods and Howard-Williams,2004). This is very likely to provide more water for hydro-electricgeneration during the winter peak demand period, and reducedependence on hydro-storage lakes to transfer generation into thenext winter. However, industries dependent on irrigation are likelyto experience negative effects due to lower water availability inspring and summer, their time of peak demand. Increased droughtfrequency is very likely in eastern areas, with potential losses inagricultural production. The effects of climate change on floodand drought frequency are virtually certain to be modulated byphases of the ENSO and IPO (McKerchar and Henderson, 2003;see Section 11.2.1). The groundwater aquifer for Auckland Cityhas spare capacity to accommodate recharge under all scenarios
Year Impacts2030 • Change in annual runoff: -5 to +15% on the north-east
coast, ±15% on the east coast, a decline of up to 20% inthe south-east, ±10% in Tasmania, a decline of up to 25%in the Gulf of St Vincent (South Australia), and -25 to +10%in the south-west (Chiew and McMahon, 2002).
• Decline in annual runoff: 6-8% in most of eastern Australiaand 14% in south-west Australia in the period 2021 to 2050relative to 1961 to 1990 for the A2 scenario (Chiew et al., 2003).
• Burrendong dam (NSW): inflows change by +10% to 30%across all SRES scenarios, but the 90% confidence intervalis 0% to -15% (Jones and Page, 2001).
• Victoria: runoff in 29 catchments declines by 0-45% (Jonesand Durack, 2005).
2050 • Murray Darling Basin: for B1, streamflow drops 10-19%and salinity changes -6 to +16%; for A1, streamflow drops14-25% and salinity changes -8 to +19% (Beare andHeaney, 2002).
• Melbourne: a risk assessment using ten climate models(driven by the SRES B1, A1B and A1FI scenarios) indicatedthat average streamflow is likely to decline 7-35% (Howe etal., 2005); however, planned demand-side and supply-sideactions are likely to alleviate water shortages through to2020 (Howe et al., 2005).
2070 • Burrendong Dam (NSW): inflows change by +5 to -35%across all SRES scenarios, for the 90% confidence interval(Jones and Page, 2001).
2100 • Murray-Darling Basin: for B1, streamflow declines 16 to 30%,salinity changes -16 to +35%, agricultural costs US$0.6billion; for A1, streamflow declines 24 to 48%, salinitychanges -25 to +72%, agricultural costs US$0.9 billion(Beare and Heaney, 2002).
Table 11.5. Impacts on Australian water security. SRES scenarios arespecified where possible.

Chapter 11 Australia and New Zealand
517
examined (Namjou et al., 2005). Base flows in principal streamsand springs are very unlikely to be compromised unless many dryyears occur in succession.
11.4.1.2 Flood and waste water managementLittle quantitative information is available about potential
changes in flood risk in Australia. Sufficient capacity exists withinthe Melbourne sewerage and drainage systems to accommodatemoderate increases (up to 20%) in storm rainfall totals withminimal surcharging (Howe et al., 2005). For the Albert-LoganRivers system near the Gold Coast in Queensland, each 1%increase in rainfall intensity is likely to produce a 1.4% increasein peak runoff (Abbs et al., 2000). However, increases in runoffand flooding are partially offset by a reduction in average rainfall,which reduces soil wetness prior to storms. A high-resolutionatmospheric model of storm events coupled with a non-linearflood event model has been applied to flooding around the GoldCoast caused by tropical cyclone Wanda in 1974. If the same eventoccurred in 2050 with a 10 to 40 cm rise in mean sea level, thenumber of dwellings and people affected is likely to increase by3 to 18% (Abbs et al., 2000).
In New Zealand, rain events are likely to become moreintense, leading to greater storm runoff, but with lower riverlevels between events. This is likely to cause greater erosion ofland surfaces, more landslides (Glade, 1998; Dymond et al.,2006), redistribution of river sediments (Griffiths, 1990) and adecrease in the protection afforded by levees. Increased demandsfor enhancement of flood protection works are likely, asevidenced by the response to large floods in 2004 (MCDEM,2004; CAE, 2005). Flood risk to Westport has been assessedusing a regional atmospheric model, a rainfall-runoff model forthe Buller River, projected sea-level rise and a detailed inundationmodel. Assuming the current levee configuration, the proportionof the town inundated by a 1-in-50 year event is currently 4.3%,but rises to 13 to 30% by 2030, and 30 to 80% by 2080 (Gray etal., 2005). Peak flow increases 4% by 2030 and 40% by 2080. Incontrast, a flood risk study for Auckland using 2050 climatescenarios with 1 to 2°C global warming indicated only minorincreases in flood levels (Dayananda et al., 2005). Higher flowsand flood risk are likely in the Wairau catchment in North ShoreCity (URS, 2004).
11.4.1.3 Water qualityIn Australia, there is a 50% chance by 2020 of the average
salinity of the lower Murray River exceeding the 800 ECthreshold set for desirable drinking and irrigation water(MDBMC, 1999). There are no integrated assessments of theimpacts of climate change on runoff quantity and quality, saltinterception and revegetation policies, and water pricing andtrading policies. Eutrophication is a major water-quality problem(Davis, 1997; SOE, 2001). Toxic algal blooms are likely tobecome more frequent and to last longer due to climate change.They can pose a threat to human health, for both recreation andconsumptive water use, and can kill fish and livestock (Falconer,1997). Simple, resource-neutral, adaptive managementstrategies, such as flushing flows, can substantially reduce theiroccurrence and duration in nutrient-rich, thermally stratifiedwater bodies (Viney et al., 2003).
In New Zealand, lowland waterways in agricultural catchmentsare in a relatively poor state and these streams are under pressurefrom land-use intensification and increasing water abstractiondemands (Larned et al., 2004). There is no literature on impacts ofclimate change on water quality in New Zealand.
11.4.2 Natural ecosystems
The flora and fauna of Australia and New Zealand have ahigh degree of endemism (80 to 100% in many taxa). Manyspecies are at risk from rapid climate change because they arerestricted in geographical and climatic range. Most species arewell-adapted to short-term climate variability, but not to longer-term shifts in mean climate and increased frequency or intensityof extreme events. Many reserved areas are small and isolated,particularly in the New Zealand lowlands and in the agriculturalareas of Australia. Bioclimatic modelling studies generallyproject reductions and/or fragmentation of existing climaticranges. Climate change will also interact with other stressessuch as invasive species and habitat fragmentation. The mostvulnerable include the Wet Tropics and Kakadu wetlands, alpineareas, tropical and deep-sea coral reefs, south-east Tasman Sea,isolated habitats in the New Zealand lowlands, coastal andfreshwater wetlands and south-west Australian heathlands(Table 11.6). There is little research on the impacts of climatechange on New Zealand species or natural ecosystems, with theexception of the alpine zone and some forested areas.
Major changes are expected in all vegetation communities. Inthe Australian rangelands (75% of total continental land area),shifts in rainfall patterns are likely to favour establishment ofwoody vegetation and encroachment of unpalatable woodyshrubs. Interactions between CO2, water supply, grazingpractices and fire regimes are likely to be critical (Gifford andHowden, 2001; Hughes, 2003). In New Zealand, fragmentednative forests of drier lowland areas (Northland, Waikato,Manawatu) and in the east (from East Cape to Southland) arelikely to be most vulnerable to drying and changes in fireregimes (McGlone, 2001; MfE, 2001). In alpine zones of bothcountries, reductions in duration and depth of snow cover arelikely to alter distributions of communities, for examplefavouring an expansion of woody vegetation into herbfields(Pickering et al., 2004). More fires are likely in alpine peatlands(Whinam et al., 2003). Alpine vertebrates dependent on snowcover for hibernation are likely to be at risk of extinction(Pickering et al., 2004). In regions such as south-westernAustralia, many narrow-ranged endemic species will bevulnerable to extinction with relatively small amounts ofwarming (Hughes, 2003). Saltwater intrusion as a result of sea-level rise, decreases in river flows and increased droughtfrequency, are very likely to alter species composition offreshwater habitats, with consequent impacts on estuarine andcoastal fisheries (Bunn and Arthington, 2002; Hall and Burns,2002; Herron et al., 2002; Schallenberg et al., 2003). In marineecosystems, ocean acidification is likely to decreaseproductivity and diversity of plankton communities aroundAustralia, while warmer oceans are likely to lead to furthersouthward movement of fish and kelp communities(Poloczanska et al., 2007).

On the sub-Antarctic Islands, likely impacts includeincreased mortality of burrowing petrels, increased invasionsby disturbance-tolerant alien plants such as Poa annua,increased abundance of existing rats, mice and rabbits onislands, and reduced distribution of Sphagnummoss (Bergstromand Selkirk, 1999; Frenot et al., 2005).
11.4.3 Agriculture
11.4.3.1 CroppingSince the TAR, there has been further assessment of potential
impacts of climate and CO2 changes at local, regional andnational scales in both Australia and New Zealand. Overall,these emphasise the vulnerability of cropping and the potentialfor regional differences. Impacts of climate change on pests,
diseases and weeds, and their effects on crops, remain uncertain,since few experimental or modelling studies have beenperformed (Chakraborty et al., 2002).
In New Zealand, for C3 crops such as wheat, the CO2response is likely to more than compensate for a moderateincrease in temperature (Jamieson et al., 2000) (see Section 5.4).The net impact in irrigation areas depends on the availability ofwater (Miller and Veltman, 2004). For maize (a C4 crop),reduction in growth duration reduces crop water requirements,providing closer synchronisation of development with seasonalclimatic conditions (Sorensen et al., 2000).
In Australia, the potential impacts of climate change on wheatvary regionally, as shown by a study which used the full rangeof CO2 and climate change in the IPCC SRES scenarios(Howden and Jones, 2004), in conjunction with a crop modelrecently validated for its CO2 response for current wheatvarieties (Reyenga et al., 2001; Asseng et al., 2004). South-western Australian regions are likely to have significant yieldreductions by 2070 (increased yield very unlikely). In contrast,regions in north-eastern Australia are likely to have moderateincreases in yield (unlikely to have substantial yield reductions).Nationally, median crop yields dropped slightly. There is asubstantial risk to the industry as maximum potential increasesin crop value are limited (to about 10% or US$0.3 billion/yr)but maximum potential losses are large (about 50% or US$1.4billion/yr) (Figure 11.2). However, adaptation through changingplanting dates and varieties is likely to be highly effective: themedian benefit is projected to be US$158 million/yr but with arange of US$70 million to over US$350 million/yr (Howden andJones, 2004) (Figure 11.2).
Climate change is likely to change land use in southernAustralia, with cropping becoming non-viable at the drymargins if rainfall is reduced substantially, even though yieldincreases from elevated CO2 partly offset this effect (Sinclair etal., 2000; Luo et al., 2003). In contrast, cropping is likely toexpand into the wet margins if rainfall declines. In the north ofAustralia, climate change and CO2 increases are likely to enablecropping to persist (Howden et al., 2001a). Observed warmingtrends are already reducing frost risk and increasing yields(Howden et al., 2003b).
Grain quality is also likely to be affected. Firstly, elevated CO2reduces grain protein levels (Sinclair et al., 2000). Significantincreases in nitrogenous fertiliser application or increased use ofpasture legume rotations would be needed to maintain proteinlevels (Howden et al., 2003c). Secondly, there is increased risk ofdevelopment of undesirable heat-shock proteins in wheat grain inboth northern and southern cropping zones with temperatureincreases greater than 4°C (Howden et al., 1999d).
Land degradation is likely to be affected by climate change.Elevated atmospheric CO2 concentrations slightly reduce cropevapotranspiration. This increases the risk of water movingbelow the root zone of crops (deep drainage), potentiallyexacerbating three of Australia’s most severe land degradationproblems across agricultural zones: waterlogging, soilacidification and dryland salinity. In Western Australia, deepdrainage is simulated to increase 1 to 10% when CO2 is raisedto 550 ppm, but deep drainage decreases 8 to 29% for a 3°Cwarming (van Ittersum et al., 2003). Deep drainage is reduced by
Australia and New Zealand Chapter 11
518
Year Potential Impacts Source2020 Bleaching and damage to the Great Barrier
Reef equivalent to that in 1998 and 2002 inup to 50% of years.
Berkelmans etal., 2004; Crimpet al., 2004
60% of the Great Barrier Reefregularly bleached.
Jones, 2004b
Habitat lost for marine invertebratescurrently confined to cool waters(>10% of Victoria’s total).
O’Hara, 2002;Watters et al.,2003
63% decrease in golden bowerbird habitatin northern Australia.
Hilbert et al.,2004
50% decrease in montane tropicalrainforest area in northern Australia.
Hilbert et al.,2001
2030 58 to 81% of the Great Barrier Reefbleached every year.
Jones, 2004b
Hard coral reef communities widelyreplaced by algal communities.
Wooldridge etal., 2005
88% of Australian butterfly species’core habitat decreases.
Beaumont andHughes, 2002
97% of Wet Tropics endemic vertebrateshave reduced core habitat.
Williams et al.,2003
2050 97% of the Great Barrier Reef bleachedevery year.
Jones, 2004b
92% of butterfly species’ core habitatdecreases.
Beaumont andHughes, 2002
98% decrease in golden bowerbirdhabitat in northern Australia.
Hilbert et al.,2004
80% loss of freshwater wetlands inKakadu for a 30 cm sea-level rise.
Hare, 2003
2080 Catastrophic mortality of coralspecies annually.
Jones, 2004b
95% decrease in distribution of GreatBarrier Reef species.
Jones et al.,2004
65% loss of Great Barrier Reef speciesin the Cairns region.
Crimp et al.,2004
46% of Wet Tropics endemic vertebrateslose core habitat.
Williams et al.,2003
200 to 300 indigenous New Zealandalpine plant species may become extinct.
Halloy andMark, 2003
Reduced calcification for 70% of the areawhere deep sea corals occur, loss ofendemic species.
Poloczanska etal., 2007
Table 11.6. Examples of projected impacts on species and ecosystems,relative to 1990.

Chapter 11 Australia and New Zealand
519
Figure 11.2: Change in national gross value of wheat from historical baseline values (%) for 2070 as a result of increases in CO2 and changes intemperature and rainfall: (a) without adaptation and (b) with adaptations of changed planting dates and varieties (Howden and Jones, 2004).
up to 94% in low precipitation scenarios. However, the changesin deep drainage were not correlated with changes inproductivity or gross margin.
11.4.3.2 HorticultureAustralian temperate fruits and nuts are all likely to be
negatively affected by warmer conditions because they requirewinter chill or vernalisation. Crops reliant on irrigation are likelyto be threatened where irrigation water availability is reduced.Climate change is likely to make a major horticultural pest, theQueensland fruit fly Bactrocera tryoni, a significant threat tosouthern Australia. Warming scenarios of 0.5, 1.0 and 2.0°Csuggest expansion from its endemic range in the north and north-east across most of the non-arid areas of the continent, includingthe currently quarantined fruit fly-free zone (Sutherst et al.,2000). Apple, orange and pear growers in endemic Queenslandfruit fly areas are likely to have cost increases of 42 to 82%, and24 to 83% in the current fruit fly-free zone (Sutherst et al., 2000).
In New Zealand, warmer summer temperatures for Haywardkiwifruit are likely to increase vegetative growth at the expense offruit growth and quality (Richardson et al., 2004). Kiwifruitbudbreak is likely to occur later, reducing flower numbers andyield in northern zones (Hall et al., 2001). Production of currentkiwifruit varieties is likely to become uneconomic in Northland by2050 because of a lack of winter chilling, and be dependent ondormancy-breaking agents and varieties bred for warmer wintertemperatures in the Bay of Plenty (Kenny et al., 2000). In contrast,more areas in the South Island are likely to be suitable (MfE,2001). Apples, another major crop, are very likely to flower andreach maturity earlier, with increased fruit size, especially after2050 (Austin et al., 2000). New Zealand is likely to be moresusceptible to the establishment of new horticultural pests. Forexample, under the current climate, only small areas in the northare suitable for the oriental fruit fly, but by the 2080s it is likelyto expand to much of the North Island (Stephens et al., 2007).
Viticulture has expanded rapidly in both countries. Earlierripening and reductions in grape quality and value are likely by2030, e.g., in Australia, price per tonne drops 4 to 10% in theYarra Valley and 16 to 52% in the Riverina (Webb et al., 2006).In cooler Australian climates, warming is likely to allow
alternative varieties to be grown. With warming and a longergrowing season in New Zealand, red wine production isincreasingly likely to be practised in the south, with higher yields(Salinger et al., 1990). Higher CO2 levels increase vinevegetative growth, and subsequent shading is likely to reducefruitfulness. Distribution of vines is likely to change dependingupon suitability compared with high-yield pasture andsilviculture, and with future irrigation water availability and cost(Hood et al., 2002).
11.4.3.3 Pastoral and rangeland farmingIn western, southern and higher-altitude areas of New
Zealand, higher temperatures, a longer growing season, higherCO2 concentrations and less frost are very likely to increaseannual pasture production by 10 to 20% by 2030, although gainsmay decline thereafter (MfE, 2001). In eastern New Zealand andNorthland, pasture productivity is likely to decline by 2030 dueto increased drought frequency (see Section 11.3.1). Sub-tropicalpastoral species with lower feed quality such as Paspalum arelikely to spread southwards, reducing productivity (Clark et al.,2001), particularly in the Waikato district. The range andincidence of many pests and diseases are likely to increase.Drought and water security problems are likely to make irrigatedagriculture vulnerable, e.g., intensive dairying in Canterbury(Jenkins, 2006).
In Australia, a rise in CO2 concentration is likely to increasepasture growth, particularly in water-limited environments(Ghannoum et al., 2000; Stokes and Ash, 2006; see also Section5.4). However, if rainfall is reduced by 10%, this CO2 benefit islikely to be offset (Howden et al., 1999d; Crimp et al., 2002). A20% reduction in rainfall is likely to reduce pasture productivityby an average of 15% and liveweight gain in cattle by 12%,substantially increasing variability in stocking rates and reducingfarm income (Crimp et al., 2002). Elevated concentrations of CO2significantly decrease leaf nitrogen content and increase non-structural carbohydrate, but cause little change in digestibility(Lilley et al., 2001). In farming systems with high nitrogen forage(e.g., temperate pastures), these effects are likely to increaseenergy availability, nitrogen processing in the rumen andproductivity. In contrast, where nitrogen is deficient (e.g.,

Australia and New Zealand Chapter 11
520
rangelands), higher temperatures are likely to exacerbate existingproblems by decreasing non-structural carbohydrateconcentrations and digestibility, particularly in tropical C4 grasses(see Section 5.4.3). Doubled CO2 concentrations and warming arelikely to result in only limited changes in the distributions ofnative C3 and C4 grasses (Howden et al., 1999b).
Climatic changes are likely to increase major land-degradation problems such as erosion and salinisation (seeSection 11.4.3.1). They are also likely to increase the potentialdistribution and abundance of exotic weeds, e.g., Acacia niloticaand Cryptostegia grandiflora (Kriticos et al., 2003a, b) andnative woody species, e.g., A. aneura (Moore et al., 2001). Thisis likely to increase competition with pasture grasses, reducinglivestock productivity. However, the same CO2 and climatechanges are likely to provide increased opportunities for woodyweed control through increased burning opportunities (Howdenet al., 2001b). A warming of 2.5°C is likely to lead to a 15 to60% reduction in rabbit populations in some areas via the impacton biological control agents, e.g., myxomatosis and rabbithaemorrhagic disease virus (Scanlan et al., 2006).
Heat stress already affects livestock in many Australianregions, reducing production and reproductive performance andenhancing mortality (see Section 5.4.3). Increased thermal stresson animals is very likely (Howden et al., 1999a). In contrast,less cold-stress is likely to reduce lamb mortality in bothcountries. Impacts of the cattle tick (Boophilus microplus) onthe Australian beef industry are likely to increase and movesouthwards (White et al., 2003). If breakdown of quarantineoccurs, losses in live-weight gain from tick infestation areprojected to increase 30% in 2030 and 120% in 2100 (in theabsence of adaptation). The net present value of future ticklosses is estimated as 21% of farm cash income in Queensland,the state currently most severely affected.
11.4.4 Forestry
In Australia, the value of wood and wood products in 2001-2002 was US$5 billion/yr. About 164 million ha are classified asforest, with 1% as plantation forests and 7% available for timberproduction in state-managed, multiple-use native forests (BRS,2003). New Zealand’s indigenous forests cover 6.4 million ha,with 1.7 million ha of planted production exotic forests, the latterproviding substantial export income (MAF, 2001). Researchsince the TAR confirms that climate change is likely to haveboth positive and negative impacts on forestry in both countries.Productivity of exotic softwood and native hardwood plantationsis likely to be increased by CO2 fertilisation effects, althoughthe amount of increase will be limited by projected increases intemperature, reductions in rainfall and by feedbacks such asnutrient cycling (Howden et al., 1999c; Kirschbaum, 1999a, b).
Where trees are not water-limited, warming expands thegrowing season in southern Australia, but pest damage is likelyto negate some gains (see Section 5.4.5). Reduction in averagerunoff in some regions (see Section 11.4.1) and increased firerisk (see Section 11.3.1) are very likely to reduce productivity,whilst increased rainfall intensity is likely to exacerbate soilerosion problems and pollution of streams during forestryoperations (Howden et al., 1999c). In Pinus radiata and
Eucalyptus plantations, fertile sites are likely to have increasedproductivity for moderate warming, whereas infertile sites arelikely to have decreased production (Howden et al., 1999c).
In New Zealand, the growth rates for plantation forestry(mainly P. radiata) are likely to increase in response to elevatedCO2 and wetter conditions in the south and west. Studies of pineseedlings confirm that the growth and wood density of P. radiataare enhanced during the first two years of artificial CO2fertilisation (Atwell et al., 2003). Tree growth reductions arelikely for the east of the North Island due to projected rainfalldecreases and increased fire risk (see Section 11.3.1). However,uncertainties remain regarding increased water-use efficiencywith elevated CO2 (MfE, 2001), and whether warmer and drierconditions could increase the frequency of upper mid-crownyellowing and winter fungal diseases (MfE, 2001).
11.4.5 Coasts
Over 80% of the Australian population lives in the coastalzone, with significant recent non-metropolitan populationgrowth (Harvey and Caton, 2003). About 711,000 addresses(from the National Geo-coded Address File) are within 3 km ofthe coast and less than 6 m above sea level, with more than 60%located in Queensland and NSW (Chen and McAneney, 2006).These are potentially at risk from long-term sea-level rise andlarge storm surges.
Rises in sea level, together with changes to weather patterns,ocean currents, ocean temperature and storm surges are verylikely to create differences in regional exposure (Walsh, 2002;MfE, 2004a; Voice et al., 2006). In New Zealand, there are likelyto be more vigorous and regular swells on western coasts (MfE,2004a). In northern Australia, tropical cyclones are likely tobecome more intense (see Section 11.3). The area of Cairns atrisk of inundation by a 1-in-100 year storm surge is likely tomore than double by 2050 (McInnes et al., 2003). Major impactsare very likely for coral reefs, particularly the Great Barrier Reef(see Section 11.6).
Future effects on coastal erosion include climate-inducedchanges in coastal sediment supply and storminess. In PegasusBay (New Zealand), shoreline erosion of up to 50 m is likelybetween 1980 and 2030 near the Waipara River if southerlywaves are reduced by 50%, and up to 80 m near the WaimakaririRiver if river sand is reduced by 50% (Bell et al., 2001). In NewZealand, emphasis has been placed on providing information,guidelines and tools such as zoning and setbacks to localauthorities for risk-based planning and management of coastalhazards affected by climate change and variability (Bell et al.,2001; MfE, 2004a) (see Section 11.6). In Australia, linkagesbetween the IPO, ENSO and changes in coastal geomorphologyhave been demonstrated for the northern NSW coast (Goodwin,2005; Goodwin et al., 2006) and between historic beach erosionand ENSO for Narabeen Beach (NSW) (Ranasinghe et al., 2004).
Sea-level rise is virtually certain to cause greater coastalinundation, erosion, loss of wetlands and salt-water intrusioninto freshwater sources (MfE, 2004a), with impacts oninfrastructure, coastal resources and existing coastalmanagement programmes. Model simulations indicate that theloss of wetlands and mangroves in Spencer Gulf due to sea-level

Chapter 11 Australia and New Zealand
521
rise is influenced largely by elevation and exposure (Bryan etal., 2001). At Collaroy/Narrabeen beach (NSW), a sea-level riseof 0.2 m by 2050 combined with a 50-year storm event leads tocoastal recession exceeding 110 m and causing losses of US$184million (Hennecke et al., 2004). Investigations for metropolitancoasts reveal increased costs of protection for existingmanagement systems (Bell et al., 2001). Mid-range sea-levelrise projections for 2005 to 2025 are likely to increase the costof sand replenishment on the Adelaide metropolitan coast by atleast US$0.94 million/yr (DEH, 2005). Uncertainties inprojected impacts can be managed through a risk-basedapproach involving stochastic simulation (Cowell et al., 2006).Coasts are also likely to be affected by changes in pollution andsediment loads from changes in the intensity and seasonality ofriver flows, and future impacts of river regulation (Kennish,2002). In the next 50 to 100 years, 21% of the Tasmanian coastis at risk of erosion and significant recession from predicted sea-level rise (Sharples, 2004).
11.4.6 Fisheries
In Australia, the gross value of fisheries production is US$1.7billion annually, of which 68% is wild-catch and 32% isaquaculture. In New Zealand, the combined value of fisheriesproduction is US$0.8 billion, of which 80% is from thecommercial catch and 20% from the growing aquaculture sector(Seafood Industry Council, 2006), which continues to grow.Little research has been completed on impacts of climate changeon freshwater fisheries and aquaculture.
Marine fisheries around the world are threatened by over-exploitation. In Australia, of 74 stocks considered in 2005, 17were over-fished, 17 were not over-fished, and 40 were ofuncertain status (ABARE, 2005). In New Zealand, of 84 stocksof demersal fish where landings were greater than 500 tonnes/yr,5 were regarded as over-fished, 24 were assessed as not over-fished, and 55 were of uncertain status (Ministry of FisheriesScience Group, 2006). Climate change will be an additionalstress (Hobday and Matear, 2005). The key variables expectedto drive impacts on marine fisheries are changes in oceantemperature, currents, winds, nutrient supply, acidification andrainfall. Changes in four emergent biological properties arelikely as a result of climate change, the first of which is bestunderstood: (i) distribution and abundance of impacted species,(ii) phenology, (iii) community composition, and (iv)community structure and dynamics (including productivity).Few climate-change impact studies have been undertaken, sothis assessment mostly relies on extrapolation of observedrelationships between climate variability and fisheries. With sea-level rise, increasing marine intrusions are highly likely to affectcoastal fisheries and inshore sub-tidal breeding and nursery areas(Schallenberg et al., 2003). Overall, future climate-changeimpacts are likely to be greater for temperate endemics than fortropical species (Francis, 1994, 1996) and on coastal anddemersal fisheries relative to pelagic and deep-sea fisheries(Hobday and Matear, 2005).
Changes in sea surface temperature or currents are likely toaffect the distribution of several commercial pelagic (e.g., tuna)fisheries in the region (Lehodey et al., 1997; Lyne, 2000; Sims
et al., 2001; Hobday and Matear, 2005). In particular, circulationchanges may increase the availability of some species andreduce others, as has been demonstrated in Western Australia forthe Leeuwin Current. Different management regimes are likelyto be required: fishers will be faced with relocation or facereduced catches in situ. Recruitment is likely to be reduced incool-water species. For example, for New Zealand species suchas red cod, recruitment is correlated with cold autumn and winterconditions associated with El Niño events (Beentjes andRenwick, 2001; Annala et al., 2004). In contrast, for snapper,relatively high recruitment and faster growth rate of juvenilesand adults are correlated with warmer conditions during La Niñaevents (Francis, 1994; Maunder and Watters, 2003), withdecreases in larval recruitment during El Niño events (Zeldis etal., 2005). A similar pattern of recruitment exists for gemfish(Renwick et al., 1998). Regarding physiological changes,temperature has a major influence on the population genetics ofectotherms, selecting for changes in abundance of temperature-sensitive alleles and genotypes and their adaptive capacity. ForNew Zealand snapper, differences in allele frequencies at oneenzyme marker are found among year classes from warm andcold summers (Smith, 1979). If species cannot adapt to the paceof climate change, then major changes in distribution are likely,particularly for species at the edges of suitable habitats(Richardson and Schoeman, 2004; Hampe and Petit, 2005).
Projected changes in Southern Ocean circulation (see Section11.3.1) are likely to affect fisheries. Seasonal to interannualvariability of westerly winds and strong wind events areassociated with recruitment and catch rates in several species(Thresher et al., 1989, 1992; Thresher, 1994). A decline in winddue to a poleward shift in climate systems underlies recent stockdeclines off south-eastern Australia and western Tasmania, andthese are linked to changes in larval growth rates and recruitmentof juveniles in two fish species around Tasmania (Koslow andThresher, 1999; Thresher, 2002). Reductions in upwelling ofnutrients and extension of warm water along the east Australiancoast are likely to reduce krill and jack mackerel abundance,upon which many other species are reliant, including tuna, sealsand seabirds (CSIRO, 2002).
11.4.7 Settlements, industry and societies
Settlements, industry and societies are sensitive to extremeweather events, drought and sea-level rise (see Chapter 7). Manyplanning decisions for settlements and infrastructure need toaccount for new climatic conditions and higher sea-levels, butlittle research has been done on climate change impacts. Theplanning horizon for refurbishing major infrastructure is 10 to 30years, while major upgrades or replacements have an expectedlifetime of 50 to 100 years (PIA, 2004). Substantial infrastructureis at risk from projected climate change. About US$1,125 billionof Australia’s wealth is locked up in homes, commercialbuildings, ports and physical assets, which is equivalent to ninetimes the current national budget or twice the GDP (Coleman etal., 2004). In New Zealand, homes are valued at about US$280billion, which is equivalent to about triple the national GDP(QVL, 2006). The average life of a house is 80 years and somelast for 150 years or more (O’Connell and Hargreaves, 2004).

For infrastructure, design criteria for extreme events are verylikely to be exceeded more frequently. Increased damage islikely for buildings (e.g., concrete joints, steel, asphalt,protective cladding, sealants), transport structures (e.g., roads,railways, ports, airports, bridges, tunnels), energy services (seeSection 11.4.10), telecommunications (e.g., cables, towers,manholes), and water services (see Section 11.4.1) (PIA, 2004;BRANZ, 2007; Holper et al., 2007). In Victoria, waterinfrastructure is at significant risk for the B1 scenario by 2030,while power, telecommunications, transport and buildings areall at significant risk for the A1FI emission scenario by 2030(Holper et al., 2007).
Climate change is very likely to affect property values andinvestment through disclosure of increased hazards and risk,as well as affecting the price and availability of insurance. Inmany Australian jurisdictions, flood hazard liability is notmandatory, or is poorly quantified (Yeo, 2003). Governmentssometimes provide financial relief to the uninsured from largenatural disasters (Box 11.1) and such costs are likely to rise.Insurance costs are very likely to rise in areas with increasedrisk. Hail damage accounts for 50% of the 20 highest insurancepayouts in Australia (ICA, 2007), but there is limitedinformation about potential changes in hail frequency (seeSection 11.3).
Despite the economic significance of mining in Australia(5% of GDP and 35% of export earnings; ABS, 2005c), thereis little information regarding climate change impacts onmining. However, in northern Australia, projected increases inextreme events, such as floods and cyclones, have the potentialto increase erosion, slow down re-vegetation, shift cappingmaterials and expose tailings in the area that includes Rangerand Jabiluka mines. These impacts have not been adequatelyconsidered in long-term mine planning (Wasson et al., 1988;Parliament of Australia, 2003). The traditional owners, theMirrar, are concerned that these impacts may detrimentallyaffect land between Madjinbardi Billabong and the EastAlligator River and the lowlands on the floodplain margins thatlie downstream from these mine sites (Kyle, 2006).
There are major implications for amenities, cultural heritage,accessibility, and health of communities. These include costs,injury and trauma due to increased storm intensity and higherextreme temperatures, damage to items and landscapes ofcultural significance, degraded beaches due to sea-level riseand larger storm surges, and higher insurance premiums (PIA,2004). Increased demand for emergency services is likely. By2100, costs of road maintenance in Australia are estimated torise 31% for the SRES A2 scenario in a CSIRO climatesimulation (Austroads, 2004).
Climate change may contribute to destabilising unregulatedpopulation movements in the Asia-Pacific region, providing anadditional challenge to national security (Dupont and Pearman,2006; Preston et al., 2006). Population growth and a one-metrerise in sea-level are likely to affect 200-450 million people inthe Asia-Pacific region (Mimura, 2006). An increase inmigrations from the Asia-Pacific region to surrounding nationssuch as New Zealand and Australia is possible (Woodward etal., 2001). Displacement of Torres Strait Islanders to mainlandAustralia is also likely (Green, 2006b).
11.4.8 Indigenous people
Indigenous people comprise about 15% of the New Zealandpopulation (Statistics New Zealand, 2005a) and 2.4% of theAustralian population (including about 30% of the NorthernTerritory population) (ABS, 2002).
Changes in New Zealand’s climate over the next 50 to 100years are likely to challenge the Māori economy and influence thesocial and cultural landscapes of Māori people (Packman et al.,2001). Some Māori have significant investment in fishing,agriculture and forestry and the downstream activities ofprocessing and marketing (NZIER, 2003), as well as beingimportant stakeholders in New Zealand’s growing tourist industry(McIntosh, 2004) and in the energy sector. Economic performanceand opportunities in these primary industries are likely to beinfluenced by climate-induced changes to production rates,product quality, pest and disease prevalence, drought, fire-risk andbiodiversity, which, in turn, will affect the ability to raisedevelopment capital in these industries (MAF, 2001; Cottrell etal., 2004). While the majority of Māori live in urbanenvironments, they also occupy remote and rural areas where theeconomy and social and cultural systems are strongly tied tonatural environmental systems (e.g., traditional resource use,tourism), and where vital infrastructure and services arevulnerable to extreme weather events (e.g., flooding, landslides)(Harmsworth and Raynor, 2005). The capacity of the Māoripeople to plan and respond to threats of climate change to theirassets (i.e., buildings, farms, forests, native forest, coastalresources, businesses) varies greatly, and is likely to be limited byaccess to funds, information and human capital, especially inNorthland and on the East Coast, where there are large populationsof Māori (TPK, 2001) and increased risks of extreme weather arelikely (Mullan et al., 2001). Other pressures include the unclearrole of local authorities with regard to rules, regulations andstrategies for adaptation; multiple land-ownership and decision-making processes can be complex, often making it difficult toreach consensus and implement costly or non-traditionaladaptation measures; and the high spiritual and cultural valueplaced on traditional lands/resources that can restrict or rule outsome adaptation options such as relocation (NZIER, 2003). Manyrural Māori also rely on the use of public and private land andcoastal areas for hunting and fishing to supplement householdfood supplies, recreation, and the collection of firewood andcultural resources. The distribution and abundance of culturallyimportant flora and fauna is likely to be adversely influenced byclimate change, so the nature of such activities and the valuesassociated with these resources are likely to be adversely affected,including spiritual well-being and cultural affirmation (NIWA,2006). These challenges compound the sensitivity of the Māori toclimate change.
Indigenous communities in remote areas of Australia oftenhave inadequate infrastructure, health services and employment(Braaf, 1999; Ring and Brown, 2002; IGWG, 2004; Arthur andMorphy, 2005). Consequently, many of these communities showfeatures of social and economic disadvantage (Altman, 2000;ABS, 2005b). Existing social disadvantage reduces coping abilityand may restrict adaptive capacity (Woodward et al., 1998; Braaf,1999), affecting these communities’ resilience to climate hazards
Australia and New Zealand Chapter 11
522

Chapter 11 Australia and New Zealand
523
(Watson and McMichael, 2001; Ellemor, 2005). Many of thesecommunities strongly connect the health of their ‘country’ to theircultural, mental and physical well-being (Smith, 2004a; Jackson,2005). Direct biophysical impacts, such as increases intemperature, rainfall extremes or sea-level rise, are likely to havesignificant indirect impacts on the social and cultural cohesionof these communities. There is recent recognition of the untappedresource of Indigenous knowledge about past climate change(Rose, 1996; Lewis, 2002; Orlove, 2003) which could be used toinform adaptation options. However, the oral tradition ofrecording this knowledge has, until recently, largely hinderednon-Indigenous scientists from using this expertise to informtheir science (Webb, 1997; Hill, 2004). Climate-change impactsidentified for remote Indigenous communities include increasesin the number of days of extreme heat, which may affect diseasevectors, reproduction and survival of infectious pathogens, andheat stress (Green, 2006a; McMichael et al., 2006); extremerainfall events and flooding, causing infrastructure damage(Green and Preston, 2006); salt inundation of freshwater aquifersand changes in mangrove ecology (UNEP-WCMC, 2006);changing fire regimes; sea-level rise and coastal erosion (BessenConsulting Services, 2005; Green and Preston, 2006). King tides1
in 2005 and 2006 in the Torres Strait have highlighted the needto revisit short-term coastal protection and long-term relocationplans for up to 2,000 Australians living on the central coral caysand north-west islands (Mulrennan, 1992; Green, 2006b).
11.4.9 Tourism and recreation
Tourism contributes 4.5% of Australian GDP and represents11.2% of exports (Allen Consulting Group, 2005), and even morein New Zealand (about 5% of GDP and 16% of exports). The maintourism centres are the Gold Coast and tropical north Queenslandin Australia, and Queenstown and Rotorua in New Zealand. Mosttourism and recreation in Australia and New Zealand rely onresources of the natural environment. In Australia’s Wet Tropics,the value of ecosystem goods and services, including tourism, isabout US$132 to 148 million/yr (Curtis, 2004).
Few regional studies have assessed potential impacts ontourism, but elsewhere there is evidence that climate change hasdirect impacts (Agnew and Palutikof, 2001; Maddison, 2001).Some tourist destinations may benefit from drier and warmerconditions, e.g., for beach activities, viewing wildlife andgeothermal activity, trekking, camping, climbing, wine tasting andfishing. However, greater risks to tourism are likely from increasesin hazards such as flooding, storm surges, heatwaves, cyclones,fires and droughts (World Tourism Organisation, 2003; Scott etal., 2004; Becken, 2005; Hall and Higham, 2005; Becken andHay, 2007). These adversely affect transport, personal safety,communication, water availability and natural attractions such ascoral reefs, beaches, freshwater wetlands, snow, glaciers andforests. Changes in species distribution and ecosystems inNational Parks (see Section 11.4.2) are likely to alter their tourismappeal. Tropical Australian destinations are particularly vulnerableto climate impacts (Allen Consulting Group, 2005). Queenslandtourism is likely to be negatively affected by more intense tropical
cyclones and by degradation of the Great Barrier Reef (see Section11.6) and beaches (PIA, 2004).
Skiing attracts many tourists to New Zealand and south-easternAustralia. For the full range of SRES scenarios, by 2020 in south-east Australia, there are likely to be 5 to 40 fewer days of snowcover per year, a rise in the snowline of 30 to 165 m, and areduction in the total snow-covered area of 10 to 40% (Hennessyet al., 2003). By 2050, the duration of snow cover reduces by 15to 100 days, the maximum snow depth reduces by 10 to 99%, thesnowline rises 60 to 570 m and the total area of snow cover shrinksby 20 to 85%. Similarly, in New Zealand, changes in seasonalsnow cover are likely to have a significant impact on the skiindustry. The snow line is likely to rise by 120 to 270 m based onscenarios for the 2080s (Fitzharris, 2004). Tourist flows fromAustralia to New Zealand might grow as a result of the relativelypoorer snow conditions in Australia. Numerical modelling of theFranz Josef glacier reveals that temperature is the dominant controlon glacier length for New Zealand’s maritime glaciers (Andersonand Mackintosh, 2006). Noticeable shrinkage and retreat is verylikely for even small temperature increases (Anderson, 2004;Anderson et al., 2006), and is likely to reduce visitor flows throughtourism-dependent towns such as Fox and Franz Josef.
11.4.10 Energy
Energy consumption is projected to grow due to demographicand socio-economic factors (see Section 11.3.2). However, averageand peak energy demands are also linked to climatic conditions.Increases in peak energy demand due to increased air-conditioneruse are likely to exceed increases for base load. The risk of lineoutages and blackouts is likely to increase (PB Associates, 2007).More peak generating capacity is likely to be needed beyond thatfor underlying economic growth (Howden and Crimp, 2001). Fora 2°C warming, peak demand increases 4% in Brisbane and 10%inAdelaide, but decreases 1% in Melbourne and Sydney (Howdenand Crimp, 2001). About 10% of the existing asset levels may berequired to allow for climate-related increases in peak demand by2030 (PB Associates, 2007). However, annual total demand maybe less sensitive to warming; a likely reduction in winter heatingdemand counteracts the increasing summer demand, e.g., NewZealand electricity demand decreases by 3%/°C increase in meanwinter temperature (Salinger, 1990).
Climate change is likely to affect energy infrastructure inAustralia and New Zealand through impacts of severe weatherevents on wind power stations, electricity transmission anddistribution networks, oil and gas product storage and transportfacilities, and off-shore oil and gas production (see Chapter 7).There are also likely to be costs and damages that can be avoidedby adaptation and mitigation (see Section 18.4). An assessment ofpotential risks for Australia (PB Associates, 2007) found (i)increased peak and average temperatures are likely to reduceelectricity generation efficiency, transmission line capacity,transformer capacity and the life of switchgear and othercomponents; (ii) if climate changes gradually, both the generationutilities and the equipment manufacturers are likely to have enoughtime to adjust their standards and specifications; and (iii)
1 King tide: any high tide well above average height.

vulnerability to the above impacts is low, but there is mediumvulnerability to a decline in water supply for large-scale coal, hydroand gas turbine power generation.
In New Zealand, increased westerly wind speed is very likely toenhance wind generation and spill-over precipitation into majorSouth Island hydro catchments, and to increase winter rain in theWaikato catchment (Wratt et al., 2004). Warming is virtuallycertain to increase snow melt, the ratio of rainfall to snowfall, andriver flows in winter and early spring. This is very likely to assisthydroelectric generation at the time of highest energy demand forheating.
11.4.11 Human health
One of the most significant health impacts of climate change islikely to be an increase in heat-related deaths. Assuming noplanned adaptation, the number of deaths is likely to rise from1,115/yr at present in Adelaide, Melbourne, Perth, Sydney andBrisbane to 2,300 to 2,500/yr by 2020, and 4,300 to 6,300/yr by2050, for all SRES scenarios, including demographic change(McMichael et al., 2003). In Auckland and Christchurch, a total of14 heat-related deaths occur per year in people aged over 65, butthis is likely to rise to 28, 51 and 88 deaths for warmings of 1, 2and 3°C, respectively (McMichael et al., 2003). Demographicchange is likely to amplify these figures. By 2100, the Australianannual death rate in people aged over 65 is estimated to increasefrom a 1999 baseline of 82 per 100,000 to 131-246 per 100,000,for the SRES B2 and A2 scenarios and the 450 ppm stabilisationscenario (Woodruff et al., 2005). Australian temperate cities arelikely to experience higher heat-related deaths than tropical cities,and the winter peak in deaths is likely to be overtaken by heat-related deaths in nearly all cities by 2050 (McMichael et al.,2003). In New Zealand, the winter peak in deaths is likely todecline.
There are likely to be alterations in the geographical range andseasonality of some mosquito-borne infectious diseases. Fewer butheavier rainfall events are likely to affect mosquito breeding andincrease the variability in annual rates of Ross River disease,particularly in temperate and semi-arid areas (Woodruff et al.,2002, 2006). The risk of establishment of dengue fever is likely toincrease through changes in climate and population sensitivity inboth tropical and temperate latitudes (Sutherst, 2004). Dengue is asubstantial threat in Australia: the climate of the far north alreadysupports Aedes aegypti (the major mosquito vector of the denguevirus); and outbreaks of dengue have occurred with increasingfrequency and magnitude in far-northern Australia over the pastdecade. Projected climate changes in north-eastern Australia,combined with population growth, are likely to increase theaverage annual number of people living in areas suitable forsupporting the dengue vector (an additional 0.1 to 0.3 millionexposed in 2020, and 0.6 to 1.4 million in 2050) (McMichael etal., 2003). Malaria is unlikely to become established unless thereis a dramatic deterioration in the public health response(McMichael et al., 2003). In New Zealand, parts of the NorthIsland are likely to become suitable for breeding of the majordengue vector, while much of the country becomes receptive toother less-efficient vector species (De Wet et al., 2001; Woodwardet al., 2001). The risk of dengue in New Zealand is likely to remain
below the threshold for local transmission beyond 2050(McMichael et al., 2003).
Warmer temperatures and increased rainfall variability arelikely to increase the intensity and frequency of food-borne(D’Souza et al., 2004) and water-borne (Hall et al., 2002) diseasesin both countries. Indigenous people living in remote communitiesare likely to be at increased risk due to their particular livingconditions and poor access to services. The annual number ofdiarrhoeal hospital admissions among Aboriginal children livingin central Australia is likely to increase 10% by 2050, assuming nochange in current health standards (McMichael et al., 2003). Therelationship between drought, suicide and severe mental healthimpacts in rural communities (Nicholls et al., 2006) suggests thatparts of Australia are likely to experience increased mental healthrisks in future. Impacts on aeroallergens and photochemical smogin cities remain uncertain. High concentrations of bushfire smokeplay a role in increasing hospital presentations of asthma(Johnston et al., 2002), so projected increases in fire risk may leadto more asthma.
11.4.12 Synthesis
Climate change adds new dimensions to the challenges alreadyfacing communities, businesses, governments and individuals.Assessment of the information given in this section leads to theconclusion that climate change is likely to give rise to six key risksin specific sectors (Table 11.7): natural systems, water security,coastal communities, agriculture and forestry, major infrastructureand health. Some extreme events can trigger multiple andsimultaneous impacts across systems, e.g., heatwaves leading toheat-related deaths, fires, smoke pollution, respiratory illness,blackouts, and buckling of railways. There are also four keybenefits for particular sectors: (i) in New Zealand, initial benefitsto agriculture and forestry are projected in western and southernareas and close to major rivers due to a longer growing season,less frost and increased rainfall; (ii) reduced energy demand isvery likely in winter; (iii) tourism is likely to directly benefit fromdrier and warmer weather in some areas; and (iv) flows in NewZealand’s larger mountain-fed rivers are likely to increase,benefiting hydroelectricity generation and irrigation supply.Adaptation can alleviate or delay vulnerability in some sectors,as well as allowing benefits to accrue more rapidly (see Section11.5).
11.5 Adaptation constraintsand opportunities
Planned adaptation can greatly reduce vulnerability (seeexamples in Chapter 17). Since the TAR, Australia and NewZealand have taken notable steps in building adaptive capacity(see Section 11.2.5) by increasing support for research andknowledge, expanding assessments for decision makers of therisks of climate change, infusing climate change into policiesand plans, promoting awareness, and better dealing with climateissues. However, there remain formidable environmental,
Australia and New Zealand Chapter 11
524

Chapter 11 Australia and New Zealand
525
economic, informational, social, attitudinal and political barriersto the implementation of adaptation.
For many natural ecosystems, impacts have limitedreversibility. Planned adaptation opportunities for offsettingpotentially deleterious impacts are often limited due to fixedhabitat regions (e.g., the Wet Tropics and upland rainforests inAustralia and the alpine zone in both Australia and NewZealand). One adaptive strategy is to provide corridors tofacilitate migration of species under future warming. This willrequire changes in land tenure in many regions, with significanteconomic costs, although schemes to promote such connectivityare already under way in some Australian states (see Section11.2.5). Another strategy is translocation of species. This is avery expensive measure, but it may be considered desirable forsome iconic, charismatic or particularly vulnerable species.
For water, planned adaptation opportunities lie in theinclusion of risks due to climate change on both the demand andsupply side (Allen Consulting Group, 2005; Table 11.2). Inurban catchments, better use of storm and recycled water canaugment supply, although existing institutional arrangementsand technical systems for water distribution constrainimplementation. Moreover, there is community resistance to theuse of recycled water for human consumption (e.g., in such citiesas Toowoomba in Queensland and Goulburn in NSW).Desalination schemes are being considered in some Australiancapital cities. Installation of rainwater tanks is another adaptationresponse and is now actively pursued through incentive policiesand rebates. For rural activities, more flexible arrangements forallocation are required, via the expansion of water markets,where trading can increase water-use efficiency (Beare andHeaney, 2002). Existing attitudes toward water pricing anddifficulties with structural adjustment are significant barriers.
For agriculture, there are opportunities for planned adaptationvia improvements in crop varieties (Figure 11.2), rotations, farm
technology, farm practices and land-use mix. Cropping can beextended to historically wetter regions. Implementation willrequire new investment and significant managerial changes(Howden et al., 2003a). Farmers in eastern New Zealand areengaging in local discussion of risks posed by future climatechange and how to enhance adaptation options (Kenny, 2005).They stress the need for support and education for ‘bottom-up’adaptation (Kenny, 2007). Farming of marginal land at the drierfringe is likely to be increasingly challenging, especially in thoseregions of both countries with prospective declines in rainfall.
In coastal areas, there is solid progress in risk assessmentsand in fashioning policies and plans at the local and regionallevel in New Zealand. However, there remain significantchallenges to achieving concrete actions that reduce risks.Consistent implementation of adaptation measures (e.g., setbacklines, planned retreat, dune management (Dahm et al., 2005),building designs, prohibition of new structures and sitingrequirements that account for sea-level rise) has been difficult.Differences in political commitment, lack of strong and clearguidelines from government, and legal challenges by propertyowners are major constraints (MfE, 2003).
Considering all sectors, four broad barriers to adaptationare evident.
1. A lack of methods for integrated assessment of impacts andadaptation that can be applied on an area-wide basis. Whilesector-specific knowledge and tools have steadilyprogressed, the vulnerability of water resources, coasts,agriculture and ecosystems of local areas and regions areinterconnected and need to be assessed accordingly (seeSection 11.8).
2. Lack of well-developed evaluation tools for assessingplanned adaptation options, such as benefit-cost analysis,incorporating climate change and adapted for local andregional application.
System Impacts Identified hotspots
Naturalsystems
Damage to coral reefs, coasts, rainforests, wetlands and alpine areas. Increaseddisturbance, loss of biodiversity including possible extinctions, changed speciesranges and interactions, loss of ecosystem services (e.g., for tourism and water).Potentially catastrophic for some systems (e.g., reefs may be dominated bymacroalgae by 2050, extinctions of endemic vertebrates in Queensland WetTropics). Shrinking glaciers create slope instability.
Aus: Great Barrier Reef, Kakadu, eastQueensland, alpine zones, Murray-DarlingBasin (MDB) and south-western Aus;NZ: Southern Alps and their National Parks,eastern lowlands
Watersecurity
Reduction in water supply for irrigation, cities, industry and riverine environment inthose areas where streamflow declines, e.g., in the Murray-Darling Basin, annualmean flow may drop 10 to 25% by 2050 and 16 to 48% by 2100.
Southern and eastern Aus; Northland andparts of eastern lowlands of NZ
Coastalcommunities
Greater coastal inundation and erosion, especially in regions exposed to cyclonesand storm surges. Coastal development is exacerbating the climate risks.
Tropical and south-east Queensland (Aus)and from Bay of Plenty to Northland in NZ
Agricultureand forestry
Reduced crop, pastoral and rangeland production over much of southern andeastern Australia and parts of eastern New Zealand. Reduced grain and grapequality. A southward shift of pests and disease vectors. Increased fire risk for forests.
Southern and eastern Aus and eastern NZ
Majorinfrastructure
Design criteria for extreme climatic events, floods and storm surges very likely to beexceeded more frequently. Increased damage likely for buildings, transportstructures, telecommunications, energy services and water services.
Large cities, floodplains ofmajor rivers, coastal communities,north-eastern parts of both countries
Health By 2050, 3,200 to 5200 more heat-related deaths/yr, and 0.6 to 1.4 million morepeople exposed to dengue fever.
Large cities of both countries
Table 11.7. Six key risks in Australia (Aus) and New Zealand (NZ) (assuming no new adaptation). Underlying climate projections (see Section 11.3)include higher temperatures, sea-level rise, heavier rainfall, greater fire risk, less snow cover, reduced runoff over southern and eastern Australia and inthe smaller lowland rivers of eastern New Zealand, more intense tropical cyclones and larger storm surges.

Australia and New Zealand Chapter 11
526
3. Ongoing scepticism about climate change science,uncertainty in regional climate change projections, and alack of knowledge about how to promote adaptation. Thisis despite 87% of Australians being more concerned aboutclimate change impacts than terrorism (Lowy Institute,2006). Application of risk-based approaches to adaptation(e.g., upgrading urban storm-water infrastructure design;Shaw et al., 2005) demonstrate how developments can be‘climate-proofed’ (ADB, 2005). While a risk-basedmethod for planned adaptation has been published forAustralia (AGO, 2006), there are few examples of whereit has been applied.
4. Weak linkages between the various strata of government,from national to local, regarding adaptation policy, plansand requirements. Stronger guidance and support arerequired from state (in Australia) and central government
(in New Zealand) to underpin efforts to promoteadaptation locally. For example, the New Zealand CoastalPolicy Statement recommends that regional councilsshould take account of future sea-level rise. But there is alack of guidance as to how this should be accomplishedand little support for building capacity to undertake thenecessary actions. As a consequence, regional and localresponses have been limited, variable and inconsistent.
11.6 Case studies
The following case studies (Boxes 11.2 to 11.4) illustrate regionswhere climate change has already occurred, impacts are evidentand planned adaptation is being considered or implemented.
Box 11.2. Adaptation of water supplies in cities
In capital cities such as Perth, Brisbane, Sydney, Melbourne, Adelaide, Canberra and Auckland, concern about populationpressures and the impact of climate change is leading water planners to implement a range of adaptation options (Table 11.2).For example, the winter rainfall-dominated region of south-west Western Australia has experienced a substantial decline in Mayto July rainfall since the mid-20th century. The effects of the decline on natural runoff have been severe, as evidenced by a50% drop in annual inflows to reservoirs supplying the city of Perth (Figure 11.3). Similar pressures have been imposed ongroundwater resources and wetlands. This has been accompanied by a 20% increase in domestic usage in 20 years, and apopulation growth of 1.7%/yr (IOCI, 2002). Climate simulations indicate that at least some of the observed drying is due to theenhanced greenhouse effect (IOCI, 2002). To ensure water security, a US$350 million programme of investment in water sourcedevelopment was undertaken by the WA Water Corporation (WA Water Corporation, 2004) from 1993 to 2003. In 2004, thecontinuation of low streamflow led to the decision to construct a seawater desalination plant, which will provide 45 Gl of watereach year, at a cost of US$271 million. Energy requirements (24 MW) will be met by 48 wind turbines.
Figure 11.3. Annual inflow to Perth Water Supply System from 1911 to 2005. Horizontal lines show averages.Source: www.watercorporation.com.au/D/dams_streamflow.cfm. Courtesy of the Water Corporation of Western Australia.

Chapter 11 Australia and New Zealand
527
Box 11.3. Climate change and the Great Barrier Reef
The Great Barrier Reef (GBR) is the world’s largest continuous reef system (2,100 km long) and is a critical storehouse ofAustralian marine biodiversity and a breeding ground for seabirds and other marine vertebrates such as the humpback whale.Tourism associated with the GBR generated over US$4.48 billion in the 12-month period 2004/5 and provided employmentfor about 63,000 full-time equivalent persons (Access Economics, 2005). The two greatest threats from climate change to theGBR are (i) rising sea temperatures, which are almost certain to increase the frequency and intensity of mass coral bleachingevents, and (ii) ocean acidification, which is likely to reduce the calcifying ability of key organisms such as corals. Other factors,such as droughts and more intense storms, are likely to influence reefs through physical damage and extended flood plumes(Puotinen, 2006).
Sea temperatures on the GBR have warmed by about 0.4°C over the past century (Lough, 2000). Temperatures currentlytypical of the northern tip of the GBR are very likely to extend to its southern end by 2040 to 2050 (SRES scenarios A1, A2)and 2070 to 2090 (SRES scenarios B1, B2) (Done et al., 2003). Temperatures only 1°C above the long-term summer maximaalready cause mass coral bleaching (loss of symbiotic algae). Corals may recover but will die under high or prolongedtemperatures (2 to 3°C above long-term maxima for at least 4 weeks). The GBR has experienced eight mass bleaching eventssince 1979 (1980, 1982, 1987, 1992, 1994, 1998, 2002 and 2006); there are no records of events prior to 1979 (Hoegh-Guldberg, 1999). The most widespread and intense events occurred in the summers of 1998 and 2002, with about 42% and54% of reefs affected, respectively (Done et al., 2003; Berkelmans et al., 2004). Mortality was distributed patchily, with thegreatest effects on near-shore reefs, possibly exacerbated by osmotic stress caused by floodwaters in some areas (Berkelmansand Oliver, 1999). The 2002 event was followed by localised outbreaks of coral disease, with incidence of some disease-likesyndromes increasing by as much as 500% over the past decade at a few sites (Willis et al., 2004). While the impacts of coraldisease on the GBR are currently minor, experiences in other parts of the world suggest that disease has the potential to bea threat to GBR reefs. Effects from thermal stress are likely to be exacerbated under future scenarios by the gradual acidificationof the world’s oceans, which have absorbed about 30% excess CO2 released to the atmosphere (Orr et al., 2005; Raven etal., 2005). Calcification declines with decreasing carbonate ion concentrations, becoming zero at carbonate ion concentrationsof approximately 200 µmol/kg (Langdon et al., 2000; Langdon, 2002). These occur at atmospheric CO2 concentrations ofapproximately 500 ppm. Reduced growth due to acidic conditions is very likely to hinder reef recovery after bleaching eventsand will reduce the resilience of reefs to other stressors (e.g., sediment, eutrophication).
Even under a moderate warming scenario (A1T, 2°C by 2100), corals on the GBR are very likely to be exposed to regularsummer temperatures that exceed the thermal thresholds observed over the past 20 years (Done et al., 2003). Annual bleachingis projected under the A1FI scenario by 2030, and under A1T by 2050 (Done et al., 2003; Wooldridge et al., 2005). Given thatthe recovery time from a severe bleaching-induced mortality event is at least 10 years (and may exceed 50 years for fullrecovery), these models suggest that reefs are likely to be dominated by non-coral organisms such as macroalgae by 2050(Hoegh-Guldberg, 1999; Done et al., 2003). Substantial impacts on biodiversity, fishing and tourism are likely. Maintenance ofhard coral cover on the GBR will require corals to increase their upper thermal tolerance limits at the same pace as the changein sea temperatures driven by climate change, i.e. about 0.1-0.5°C/decade (Donner et al., 2005). There is currently little evidencethat corals have the capacity for such rapid genetic change; most of the evidence is to the contrary (Hoegh-Guldberg, 1999,2004). Given that recovery from mortality can be potentially enhanced by reducing local stresses (water quality, fishingpressure), management initiatives such as the Reef Water Quality Protection Plan and the Representative Areas Programme(which expanded totally protected areas on the GBR from 4.6% to over 33%) represent adaptation options to enhance theability of coral reefs to endure the rising pressure from rapid climate change.
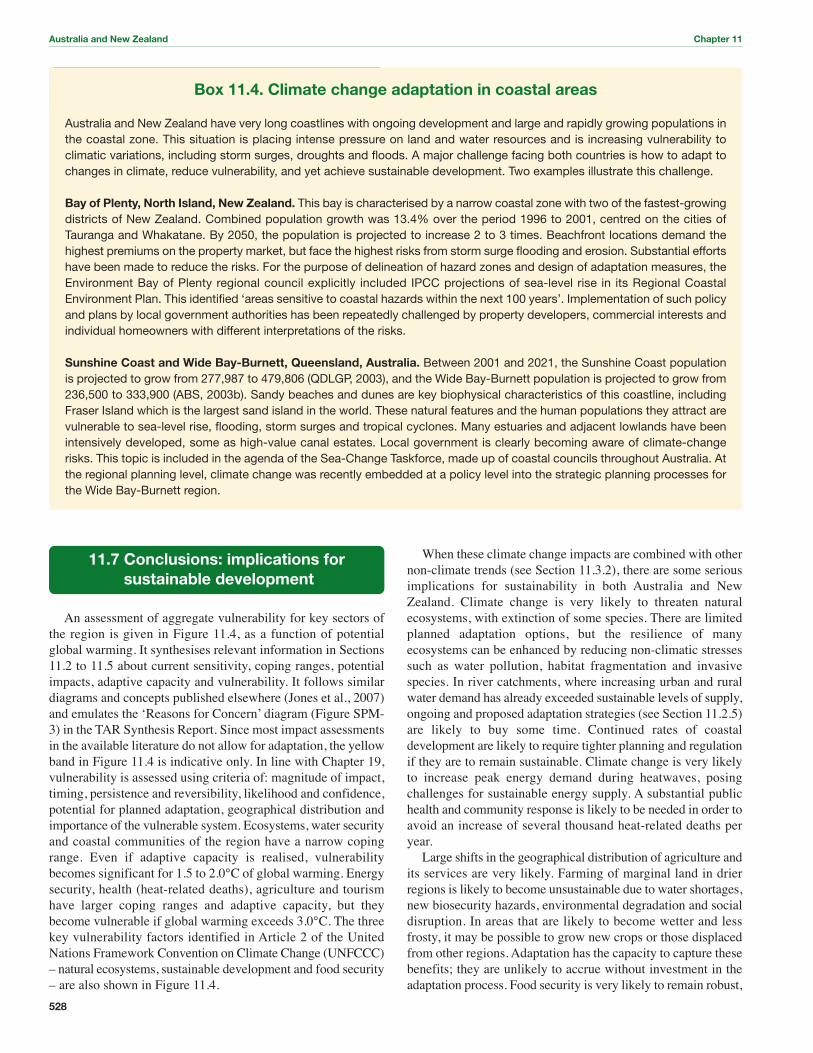
Australia and New Zealand Chapter 11
528
11.7 Conclusions: implications forsustainable development
An assessment of aggregate vulnerability for key sectors ofthe region is given in Figure 11.4, as a function of potentialglobal warming. It synthesises relevant information in Sections11.2 to 11.5 about current sensitivity, coping ranges, potentialimpacts, adaptive capacity and vulnerability. It follows similardiagrams and concepts published elsewhere (Jones et al., 2007)and emulates the ‘Reasons for Concern’ diagram (Figure SPM-3) in the TAR Synthesis Report. Since most impact assessmentsin the available literature do not allow for adaptation, the yellowband in Figure 11.4 is indicative only. In line with Chapter 19,vulnerability is assessed using criteria of: magnitude of impact,timing, persistence and reversibility, likelihood and confidence,potential for planned adaptation, geographical distribution andimportance of the vulnerable system. Ecosystems, water securityand coastal communities of the region have a narrow copingrange. Even if adaptive capacity is realised, vulnerabilitybecomes significant for 1.5 to 2.0°C of global warming. Energysecurity, health (heat-related deaths), agriculture and tourismhave larger coping ranges and adaptive capacity, but theybecome vulnerable if global warming exceeds 3.0°C. The threekey vulnerability factors identified in Article 2 of the UnitedNations Framework Convention on Climate Change (UNFCCC)– natural ecosystems, sustainable development and food security– are also shown in Figure 11.4.
When these climate change impacts are combined with othernon-climate trends (see Section 11.3.2), there are some seriousimplications for sustainability in both Australia and NewZealand. Climate change is very likely to threaten naturalecosystems, with extinction of some species. There are limitedplanned adaptation options, but the resilience of manyecosystems can be enhanced by reducing non-climatic stressessuch as water pollution, habitat fragmentation and invasivespecies. In river catchments, where increasing urban and ruralwater demand has already exceeded sustainable levels of supply,ongoing and proposed adaptation strategies (see Section 11.2.5)are likely to buy some time. Continued rates of coastaldevelopment are likely to require tighter planning and regulationif they are to remain sustainable. Climate change is very likelyto increase peak energy demand during heatwaves, posingchallenges for sustainable energy supply. A substantial publichealth and community response is likely to be needed in order toavoid an increase of several thousand heat-related deaths peryear.
Large shifts in the geographical distribution of agriculture andits services are very likely. Farming of marginal land in drierregions is likely to become unsustainable due to water shortages,new biosecurity hazards, environmental degradation and socialdisruption. In areas that are likely to become wetter and lessfrosty, it may be possible to grow new crops or those displacedfrom other regions. Adaptation has the capacity to capture thesebenefits; they are unlikely to accrue without investment in theadaptation process. Food security is very likely to remain robust,
Box 11.4. Climate change adaptation in coastal areas
Australia and New Zealand have very long coastlines with ongoing development and large and rapidly growing populations inthe coastal zone. This situation is placing intense pressure on land and water resources and is increasing vulnerability toclimatic variations, including storm surges, droughts and floods. A major challenge facing both countries is how to adapt tochanges in climate, reduce vulnerability, and yet achieve sustainable development. Two examples illustrate this challenge.
Bay of Plenty, North Island, New Zealand. This bay is characterised by a narrow coastal zone with two of the fastest-growingdistricts of New Zealand. Combined population growth was 13.4% over the period 1996 to 2001, centred on the cities ofTauranga and Whakatane. By 2050, the population is projected to increase 2 to 3 times. Beachfront locations demand thehighest premiums on the property market, but face the highest risks from storm surge flooding and erosion. Substantial effortshave been made to reduce the risks. For the purpose of delineation of hazard zones and design of adaptation measures, theEnvironment Bay of Plenty regional council explicitly included IPCC projections of sea-level rise in its Regional CoastalEnvironment Plan. This identified ‘areas sensitive to coastal hazards within the next 100 years’. Implementation of such policyand plans by local government authorities has been repeatedly challenged by property developers, commercial interests andindividual homeowners with different interpretations of the risks.
Sunshine Coast and Wide Bay-Burnett, Queensland, Australia. Between 2001 and 2021, the Sunshine Coast populationis projected to grow from 277,987 to 479,806 (QDLGP, 2003), and the Wide Bay-Burnett population is projected to grow from236,500 to 333,900 (ABS, 2003b). Sandy beaches and dunes are key biophysical characteristics of this coastline, includingFraser Island which is the largest sand island in the world. These natural features and the human populations they attract arevulnerable to sea-level rise, flooding, storm surges and tropical cyclones. Many estuaries and adjacent lowlands have beenintensively developed, some as high-value canal estates. Local government is clearly becoming aware of climate-changerisks. This topic is included in the agenda of the Sea-Change Taskforce, made up of coastal councils throughout Australia. Atthe regional planning level, climate change was recently embedded at a policy level into the strategic planning processes forthe Wide Bay-Burnett region.

Chapter 11 Australia and New Zealand
529
with both countries able to produce more food than they requirefor internal consumption, although imports of selected foodsmay be needed temporarily to cover shortages due to extremeevents. Climate changes are also likely to bring benefits in someareas for hydro-generation, winter heating requirements andtourism.
Figure 11.5 assesses key hotspots identified for the region,where vulnerability to climate change is likely to be high. Theirselection is based on the following criteria: large impacts, lowadaptive capacity, substantial population, economicallyimportant, substantial exposed infrastructure and subject to othermajor stresses (e.g., continued rapid population growth, ongoingdevelopment, ongoing land degradation, ongoing habitat loss,threats from rising sea level). Their development at current ratesand accustomed supply of ecosystem services are unlikely to besustainable with ongoing climate change, unless there isconsiderable planned adaptation.
For Australia and New Zealand, the magnitude of investmentin adaptation is overshadowed by that in mitigation. The latter isintended to slow global warming. However, there is unlikely tobe any noticeable climate effect from reducing greenhouse gasesuntil at least 2040 (see Chapter 18). In contrast, the benefits ofadaptation can be immediate, especially when they also addressclimate variability. Many adaptation options can be implementednow for Australia and New Zealand at personal, local andregional scales. Enhancing society’s response capacity throughthe pursuit of sustainable development pathways is one way ofpromoting both adaptation and mitigation (see Chapter 18).
11.8 Key uncertainties and researchpriorities
Assessment of impacts is hampered because of uncertaintyin climate change projections at the local level (e.g., in rainfall,rate of sea-level rise and extreme weather events). Researchpriorities for these are identified in the IPCC Working Group IFourth Assessment Report (IPCC, 2007). Other uncertaintiesstem from an incomplete knowledge of natural and humansystem dynamics, and limited knowledge of adaptive capacity,constraints and options (Allen Consulting Group, 2005). Moreneeds to be done to assess vulnerability within a risk-assessmentframework. Based on the information presented in this Chapter,the main research priorities are assessed to fall into four categories:
11.8.1 Assessing impacts of climate change andvulnerability for critical systems
• Water: Impacts and optimum adaptation strategies forprojected changes in drought and floods, and implicationsfor water security within an integrated catchment framework.This includes impacts on long-term groundwater levels,water quality, environmental flows and future requirementsfor hydroelectricity generation, irrigation and urban supply.
• Natural ecosystems: Identification of thresholds includingrates at which autonomous adaptation is possible;identification of the most vulnerable species (including key
Figure 11.4. Vulnerability to climate change aggregated for key sectors in the Australia and New Zealand region, allowing for current coping range andadaptive capacity. Right-hand panel is a schematic diagram assessing relative coping range, adaptive capacity and vulnerability. Left-hand panelshows global temperature change taken from the TAR Synthesis Report (Figure SPM-6). The coloured curves in the left panel represent temperaturechanges associated with stabilisation of CO2 concentrations at 450 ppm (WRE450), 550 ppm (WRE550), 650 ppm (WRE650), 750 ppm (WRE750) and1,000 ppm (WRE1000). Year of stabilisation is shown as black dots. It is assumed that emissions of non-CO2 greenhouse gases follow the SRES A1Bscenario until 2100 and are constant thereafter. The shaded area indicates the range of climate sensitivity across the five stabilisation cases.The narrow bars show uncertainty at the year 2300. Crosses indicate warming by 2100 for the SRES B1, A1B and A2 scenarios.

Australia and New Zealand Chapter 11
530
Figure 11.5. Key hotspots identified for Australia and New Zealand, assuming a medium emissions scenario for 2050.
indicator species), long-term monitoring; modelling ofpotential impacts on key ecosystems; interactions withstresses such as invasive species; improved bioclimaticmodelling; and management options to reduce vulnerability.
• Agriculture: Impacts and adaptation strategies for acomplete range of farming systems, including both costsand benefits for rural livelihoods. Analyses should addresschanges in the industry supply chain and regional land use,and the threat of new pests and diseases.
• Oceans and fisheries: Potential impacts of changes inclimate, ENSO and IPO on physical oceanography, marinelife and fish stocks in the waters that surround Australiaand New Zealand.
• Settlements, especially coastal communities:Comprehensive assessments of vulnerability and adaptationoptions so as to provide improved guidance for planningand hazard management. Investigation of local and regionalcosts of projected changes in extreme weather events andadaptation planning for scenarios of sea-level rise beyond2100.
• Climate extremes and infrastructure: Risks to building,transport, water, communication, energy and mining
infrastructure, and insurance protection from an increase inextreme weather events. A re-evaluation is required ofprobable maximum precipitation and design floods2 fordams, bridges, river protection, major urban infrastructureand risks of glacier outburst floods.
• Tourism: Improved understanding as to how direct andindirect impacts of climate change affect human behaviour withrespect to recreation patterns and holiday destination choice.
• Climate surprises: Impacts of abrupt climate change, fasterthan expected sea-level rise and sudden changes in oceancirculation. Little is known about potential impacts andvulnerability on the region beyond 2100.
11.8.2 Fostering the process of adaptationto climate change
Australia and New Zealand have few integrated regional andsectoral assessments of impacts, adaptation and socio-economicrisk. More are desirable, especially when set within the widercontext of other multiple stresses. Methods to incorporateadaptation into environmental impact assessments and otherregional planning and development schemes need to be
2 A hypothetical flood representing a specific likelihood of occurrence, e.g., the 100-year or 1% probability flood.

developed. More research is required as to how local communitiescan shape adaptation (Kenny, 2005) and of adaptation optionsfor Māori and Indigenous Australian communities, especiallyfor those on traditional lands. Priority should be given toreducing the vulnerability of ‘hotspot’ areas through:
• identification of mechanisms that governments might use toreduce vulnerability,
• better understanding of societal preparedness and of thelimitations and barriers to adaptation,
• better definition of costs and benefits of adaptation options,including benefits of impacts avoided, co-benefits, sideeffects, limits and better modelling,
• analyses of various options for social equity and fairness,the impacts of different discount rates, price incentives,delayed effects and inter-generational equity.
11.8.3 Assessing risks and opportunities ofclimate change for different scenarios
Impact scenarios underpin policy decisions about adaptationoptions and emission reduction targets. The following analyses arerequired for the full range of SRES and CO2 stabilisation scenarios:
• definition of the probabilities of exceeding criticalbiophysical and socio-economic thresholds and assessmentof consequent vulnerability or new opportunities,
• assessment of net costs and benefits for key economicsectors and for each country,
• better modelling of land-use change as climatic boundariesshift, and assessment of the implications for regionaldevelopment, social change, food security and sustainability.
11.8.4 Analysing global trade, immigration andsecurity for climate change outcomes
Impacts of climate change and adaptation elsewhere in theworld are very likely to change global interactions, andespecially trade in commodities. The implications are large forthe strongly export-based economies of Australia and NewZealand. Further studies are needed in order to assess theimpacts of climate change on the region’s competitiveness andexport mix. In the Asia-Pacific region, adverse effects on food,disease, water, energy and coastal settlements are likely (Dupontand Pearman, 2006), but implications for immigration andsecurity in Australia and New Zealand are poorly understood.
References
ABARE, 2004: Securing Australia’s Energy Future. Australian Bureau of Re-source Economics, Canberra, 104 pp.
ABARE, 2005: Australian Fisheries Statistics 2004.Australian Bureau of Agri-cultural and Resource Economics, Canberra, 65 pp. http://www.abareconomics.com/publications_html/fisheries/fisheries_04/fs04.pdf.
Abbs, D.J., 2004: A high-resolution modelling study of the effect of climate changeon the intensity of extreme rainfall events. Proc. Staying Afloat: FloodplainMan-agement Authorities of NSW 44th Annual Conference, Floodplain ManagementAuthorities of NSW, Coffs Harbour, New South Wales, 17-24.
Abbs, D.J., S. Maheepala, K.L. McInnes, G. Mitchell, B. Shipton and G. Trinidad,2000: Climate change, urban flooding and infrastructure. Proc. Hydro 2000: 3rdInternational Hydrology and Water Resources Symposium of the Institution ofEngineers, Australia: Perth, Western Australia, 686-691.
ABS, 2002: Population Distribution, Indigenous Australians, 2001. Report4705.0, Australian Bureau of Statistics, Canberra. http://abs.gov.au/Ausstats/[email protected]/lookupMF/14E7A4A075D53A6CCA2569450007E46.
ABS, 2003a: Population Projections Australia 2004-2101. Report 3222.0, Aus-tralian Bureau of Statistics, Canberra. http://www.abs.gov.au/Ausstats/[email protected]/0e5fa1cc95cd093c4a2568110007852b/0cd69ef8568dec8eca2568a900139392!OpenDocument.
ABS, 2003b: Queensland Government Population Projections. Report 3218.0,Australian Bureau of Statistics, Canberra. http://www.abs.gov.au/AUSSTATS/[email protected]/DetailsPage/3218.02004-05?OpenDocument.
ABS, 2005a: Australian Social Trends 2005.Report 4102.0, Australian Bureau ofStatistics, Canberra. http://www.abs.gov.au/AUSSTATS/[email protected]/Lookup/4102.0I-Note12002?OpenDocument.
ABS, 2005b: The Health and Welfare of Australia’s Aboriginal and Torres StraitIslander Peoples. Report 4704.0, Australian Bureau of Statistics, Canberra.http://www.abs.gov.au/ausstats/[email protected]/mf/4704.0.
ABS, 2005c: Year Book Australia. Industry Structure and Performance: 100 Yearsof Change in Australian Industry.Report 1301.0, Australian Bureau of Statistics,Canberra. http://www.abs.gov.au/Ausstats/[email protected]/Previousproducts/1301.0Feature%20Article212005?opendocument&tabname=Summary&prodno=1301.0&issue=2005&num=&view=.
Access Economics, 2005: Measuring the Economic and Financial Value of theGreat Barrier Reef Marine Park.Report by Access Economics for Great BarrierReef Marine Park Authority, June 2005, 61 pp. http://www.accesseconomics.com.au/publicationsreports/showreport.php?id=10&searchfor=Economic%20Consulting&searchby=area.
Adams, P.D., M. Horridge, J.R. Masden and G. Wittwer, 2002: Drought, regionsand the Australian economy between 2001-02 and 2004-05. Australian Bulletinof Labour, 28, 233-249.
ADB, 2005: Climate Proofing: A Risk-based Approach to Adaptation. PacificStudies Series. Asian Development Bank, Manila, 191 pp. http://www.adb.org/Documents/Reports/Climate-Proofing/default.asp.
Agnew, M.D. and J.P. Palutikof, 2001: Impacts of climate on the demand fortourism. Proceedings of the First International Workshop on Climate, Tourismand Recreation,A. Matzarakis and C.R.d. Freitas, Eds., International Society ofBiometeorology, Commission on Climate Tourism and Recreation, Porto Carras,Halkidiki, 1-10.
AGO, 2003: Australia–New Zealand Bilateral Climate Change Partnership.http://www.greenhouse.gov.au/international/partnerships/index.html#newzealand.
AGO, 2006: Vulnerability to Climate Change of Australia’s Coastal Zone: Analy-sis of gaps in methods, data and system thresholds..Australian Greenhouse Of-fice, Commonwealth Government, 120 pp. http://www.greenhouse.gov.au/impacts/publications/pubs/coastal-vulnerability.pdf.
Alexander, L., P. Hope, D. Collins, B. Trewin, A. Lynch and N. Nicholls, 2007:Trends in Australia’s climate means and extremes: a global context. Aust. Mete-orol. Mag., 56, 1-18.
Allen Consulting Group, 2005: Climate Change Risk and Vulnerability: Promot-ing an Efficient Adaptation Response in Australia. Report to the AustralianGreenhouse Office by the Allen Consulting Group, 159 pp. http://www.green-house.gov.au/impacts/publications/risk-vulnerability.html.
Altman, J., 2000: The economic status of Indigenous Australians. Discussion Paper#193, Centre for Aboriginal Economic Policy Research, Australian National Uni-versity, 18 pp. http://eprints.anu.edu.au/archive/00001001/.
Anderson, B., 2004: The response of Ko Roimate o Hine Hukatere Franz JosefGlacier to climate change. PhD thesis, University of Canterbury, Christchurch.
Anderson, B. and A. Mackintosh, 2006: Temperature change is the major driverof late-glacial and Holocene glacier fluctuations in New Zealand. Geology, 34,121-124.
Anderson, B., W. Lawson, I. Owens and B. Goodsell, 2006: Past and future massbalance of Ka Roimata o Hine Hukatere (Franz Josef Glacier). Int. J. Glaciol.,52, 597-607.
Annala, J.H., K.J. Sullivan, N.W.M. Smith, M.H. Griffiths, P.R. Todd, P.M. Maceand A.M. Connell, 2004: Report from the Fishery Assessment Plenary, May2004: stock assessment and yield estimates. Unpublished report held in NIWA
Chapter 11 Australia and New Zealand
531
library, Wellington, 690 pp.Arthur, B. and F. Morphy, 2005: Macquarie Atlas of Indigenous Australia: Cul-ture and Society through Space and Time. Macquarie University, Macquarie,New South Wales, 278 pp.
Ash, A., L. Hunt, C. Petty, R. Cowley, A. Fisher, N. MacDonald and C. Stokes,2006: Intensification of pastoral lands in northern Australia. Proceedings of the14th Biennial Conference of the Australian Rangeland Society, P. Erkelenz, Ed.,Renmark, Australia, 43.
Asseng, S., P.D. Jamieson, B. Kimball, P. Pinter, K. Sayre, J.W. Bowden and S.M.Howden, 2004: Simulated wheat growth affected by rising temperature, in-creased water deficit and elevated atmospheric CO2. Field Crop. Res., 85, 85-102.
Atwell, B.J., M.L. Henery and D. Whitehead, 2003: Sapwood development inPinus radiata trees grown for three years at ambient and elevated carbon diox-ide partial pressures. Tree Physiol., 23, 13-21.
Austin, P.T., A.J. Hall, W.P. Snelgar and M.J. Currie, 2000: Earlier maturity lim-its increasing apple fruit size under climate change scenarios. New Zealand In-stitute of Agricultural Science and the New Zealand Society for HorticulturalScience Annual Convention 2000, 77pp.
Austroads, 2004: Impact of Climate Change on Road Infrastructure.AP-R243/04,Austroads, Sydney, 124 pp. http://www.onlinepublications.austroads.com.au/script/Details.asp?DocN=AR0000048_0904.
Beare, S. and A. Heaney, 2002: Climate change and water resources in the Mur-ray Darling Basin, Australia, impacts and adaptation. Conference Paper 02.11,Australian Bureau of Agricultural and Resource Economics, 33 pp.http://www.abarepublications.com/product.asp?prodid=12389.
Beaumont, L. and L. Hughes, 2002: Potential changes in the distributions of lati-tudinally restricted Australian butterflies in response to climate change. Glob.Change Biol., 8, 954-971.
Beaumont, L.J., I.A.W. McAllan and L. Hughes, 2006: A matter of timing: changesin the first date of arrival and last date of departure of Australian migratory birds.Glob. Change Biol., 12, 1339-1354.
Becken, S., 2005: Harmonizing climate change adaptation and mitigation: the caseof tourist resorts in Fiji. Global Environ. Chang., 15, 381-393.
Becken, S. and J. Hay, 2007: Tourism and Climate Change: Risks and Opportu-nities. Climate Change, Economies and Society series, Channel View Publica-tions, Clevedon, 352 pp.
Beentjes, M.P. and J.A. Renwick, 2001: The relationship between red cod, Pseudo-phycis bachus, recruitment and environmental variables in New Zealand. Envi-ron. Biol. Fish., 61, 315-328.
Bell, R.G., T.M. Hume and D.M. Hicks, 2001: Planning for Climate Change Ef-fects on Coastal Margins.National Institute of Water and Atmospheric Researchand New Zealand Climate Change Programme, Hamilton. http://www.climatechange.govt.nz/resources/reports/effect-coastal-sep01/index.html.
Bergstrom, D., 2003: Impact of climate change on terrestrial Antarctic and sub-Antarctic biodiversity.Climate Change Impacts on Biodiversity in Australia, M.Howden, L. Hughes, M. Dunlop, I. Zethoven, D.W. Hilbert and C. Chilcott, Eds.,CSIRO Sustainable Ecosystems, Canberra, 55-57.
Bergstrom, D.M. and P.M. Selkirk, 1999: Bryophyte propagule banks in a feld-mark on sub-Antarctic Macquarie Island. Arct. Antarct. Alp. Res., 31, 202-208.http://www.environment.gov.au/biodiversity/publications/greenhouse/index.html.
Berkelmans, R. and J.K. Oliver, 1999: Large-scale bleaching of corals on the GreatBarrier Reef. Coral Reefs, 18, 55-60.
Berkelmans, R., G. De’ath, S. Kininmonth and W.J. Skirving, 2004: A compari-son of the 1998 and 2002 coral bleaching events of the Great Barrier Reef: spa-tial correlation, patterns and predictions. Coral Reefs, 23, 74-83.
Bessen Consulting Services, 2005: Land and Sea Management Strategy for Tor-res Strait. Bessen Consulting Services and Torres Strait NRM Reference Group(TSRA), 97 pp. http://www.tsra.gov.au/pdf/Torres%20Strait%20 Land%20&%20Sea%20Mgt%20Strategy%202006.pdf.
BoM, 2006a: Living with Drought. Australian Bureau of Meteorology.http://www.bom.gov.au/climate/drought/livedrought.shtml.
BoM, 2006b: Severe Tropical Cyclone Larry. Queensland Regional Office, Aus-tralian Bureau of Meteorology. http://www.bom.gov.au/weather/qld/cyclone/tc_larry/.
Bowman, D.M.J.S., A. Walsh and D.J. Milne, 2001: Forest expansion and grass-land contraction within a Eucalytpus savanna matrix between 1941 and 1994 atLitchfield National Park in the Australian monsoon tropics. Global Ecol. Bio-geogr., 10, 535-538.
Braaf, R., 1999: Improving impact assessment methods: climate change and thehealth of indigenous Australians. Global Environ. Chang., 9, 95-104.
BRANZ, 2007: An assessment of the need to adapt buildings for the unavoidableconsequences of climate change. Report EC0893, Building Research Australiaand New Zealand. http://www.greenhouse.gov.au. In press.
BRS, 2003: State of the Forest Report.Bureau of Rural Sciences, Australian Gov-ernment Printer, Canberra, 408 pp. http://www.affa.gov.au/stateoftheforests.
Bryan, B., N. Harvey, T. Belperio and B. Bourman, 2001: Distributed processmodeling for regional assessment of coastal vulnerability to sea-level rise. Env-iron. Model. Assess., 6, 57-65.
BTE, 2001: Economic costs of natural disasters in Australia. Report 103, Bureauof Transport Economics, Canberra. http://www.btre.gov.au/docs/reports/r103/r103.aspx.
Budd, G.M., 2000: Changes in Heard Island glaciers, king penguins and fur sealssince 1947. Papers and Proceedings of the Royal Society of Tasmania, 133, 47-60.
Bunn, S.E. and A.H. Arthington, 2002: Basic principles and ecological conse-quences of altered flow regimes for aquatic biodiversity. Environ. Manage., 30,492-507.
Burgess, S.M., 2005: 2004-05 Tropical cyclone summary. Island Climate Update,57, 6.
Burke, E.J., S.J. Brown and N. Christidis, 2006: Modelling the recent evolution ofglobal drought and projections for the 21st century with the Hadley Centre cli-mate model. J. Hydrometeorol., 7, 1113-1125.
CAE, 2005: Managing flood risk: the case for change. Report prepared for theFlood Risk Management Governance Group by the Centre for Advanced Engi-neering, University of Canterbury. http://www.caenz.com/ info/MFR/MFR.html.
Cai, W., G. Shi, T. Cowan, D. Bi and J. Ribbe, 2005: The response of the South-ern annular mode, the East Australian current, and the southern mid-latitudeocean circulation to global warming. Geophys. Res. Lett., 32, L23706,doi:10.1029/2005GL024701.
Cary, G.J., 2002: Importance of a changing climate for fire regimes in Australia.Flammable Australia: Fire Regimes and Biodiversity of a Continent, R.A. Brad-stock, J.E. Williams and A.M. Gill, Eds., Cambridge University Press, Mel-bourne, 26-49.
Chakraborty, S., G. Murray and N. White, 2002: Impact of Climate Change onImportant Plant Diseases in Australia. RIRDC Publication No. W02/010.http://www.rirdc.gov.au/reports/AFT/02-010sum.html.
Chambers, L.E., 2005: Migration dates at Eyre Bird Observatory: links with cli-mate change? Climate Res., 29, 157-165.
Chambers, L.E., L. Hughes and M.A. Weston, 2005: Climate change and its im-pact on Australia’s avifauna. Emu, 105, 1-20.
Chen, K. and J. McAneney, 2006: High-resolution estimates of Australia’s coastalpopulation with validations of global population, shoreline and elevationdatasets. Geophys. Res. Lett., 33, L16601. doi:10.1029/2006GL026981.
Chiew, F.H.S. and T.A. McMahon, 2002: Modelling the impacts of climate changeon Australian stream-flow. Hydrol. Process., 16, 1235-1245.
Chiew, F.H.S., T.I. Harrold, L. Siriwardenena, R.N. Jones and R. Srikanthan, 2003:Simulation of climate change impact on runoff using rainfall scenarios that con-sider daily patterns of change from GCMs.MODSIM 2003: International Con-gress onModelling and Simulation: Proceedings, D.A. Post, Ed., Modelling andSimulation Society of Australia and New Zealand, Canberra, 154-159.
Chinn, T.J., 2001: Distribution of the glacial water resources of New Zealand.Journal of Hydrolology (NZ), 40, 139–187.
Christensen, J.H., B. Hewitson, A. Busuioc, A. Chen, X. Gao, I. Held, R. Jones,R.K. Kolli, W.-T. Kwon, R. Laprise, V. Magaña Rueda, L. Mearns, C.G. Menén-dez, J. Räisänen, A. Rinke, A. Sarr and P. Whetton, 2007: Regional climate pro-jections. Climate Change 2007:The Physical Science Basis, Contribution of:Working Group I to the Fourth Assessment Report of the IntergovernmentalPanel on Climate Change. S. Solomon, D. Qin, M. Manning, Z. Chen, M. Mar-quis, K.B. Averyt, M. Tignor and H.L. Miller, Eds., Cambridge University Press,Cambridge, 847-940.
Church, J., J. Hunter, K. McInnes and N.J. White, 2004: Sea-level rise and the fre-quency of extreme event around the Australian coastline. Coast to Coast ’04:Australia’s National Coastal Conference, conference proceedings,Hobart, Tas-mania. 8 pp.
Clare, G.R., B.B. Fitzharris, T.J. Chinn and M.J. Salinger, 2002: Interannual vari-ation in end-of-summer snow-lines of the Southern Alps of New Zealand, in re-sponse to changes in Southern Hemisphere atmospheric circulation and sea
Australia and New Zealand Chapter 11
532

surface temperature patterns. Int. J. Climatol., 22, 107-120.Clark, H., N.D. Mitchell, P.C.D. Newton and B.D. Campbell, 2001: The sensitiv-
ity of New Zealand’s managed pastures to climate change. The Effects of ClimateChange and Variation in New Zealand: An Assessment using the CLIMPACTSSystem, R.A. Warrick, G.J. Kenny and J.J. Harman, Eds., International GlobalChange Institute (IGCI), University of Waikato, Hamilton, 65-77.
Coleman, T., O. Hoegh-Guldberg, D. Karoly, I. Lowe, T. McMichael, C.D.Mitchell, G.I. Pearman, P. Scaife and J. Reynolds, 2004: Climate Change: So-lutions for Australia. Australian Climate Group, 35 pp. http://www.wwf.org.au/publications/acg_solutions.pdf.
Cottrell, B., C. Insley, R. Meade and J. West, 2004: Report of the Climate ChangeMaori Issues Group. New Zealand Climate Change Office, Ministry for the En-vironment, Wellington. http://www.climatechange.govt.nz/resources/.
Cowell, P.J., B.G. Thom, R.A. Jones, C.H. Evert and D. Simanovic, 2006: Man-agement of uncertainty in predicting climate-change impacts on beaches. J.Coastal Res., 22, 232-245.
Crimp, S.J., N.R. Flood, J.O. Carter, J.P. Conroy and G.M. McKeon, 2002: Eval-uation of the Potential Impacts of Climate Change On Native Pasture Produc-tion – Implications for livestock carrying capacity: Final Report for theAustralian Greenhouse Office, 60pp.
Crimp, S., J. Balston, A. Ash, L. Anderson-Berry, T. Done, R. Greiner, D. Hilbert,M. Howden, R. Jones, C. Stokes, N. Stoeckl, B. Sutherst and P. Whetton, 2004:Climate Change in the Cairns and Great Barrier Reef Region: Scope and Focusfor an Integrated Assessment. Australian Greenhouse Office, 100 pp.http://www.greenhouse.gov.au/impacts/publications/pubs/gbr.pdf.
CSIRO, 2002: Climate change and Australia’s coastal communities. CSIRO At-mospheric Research, Aspendale, Victoria, 8 pp. http://www.cmar.csiro.au/e-print/open/CoastalBroch2002.pdf.
Cullen, P., 2002: Living with water: sustainability in a dry land. Adelaide Festivalof Arts, Getting it Right Symposium, 1-12 March, 2002. http://freshwater.can-berra.edu.au/Publications.nsf/0/3c1c61a1a89d5798ca256f0b001b7a30?OpenDocument.
Curtis, I.A., 2004: Valuing ecosystem goods and services: a new approach usinga surrogate market and the combination of a multiple criteria analysis and a Del-phi panel to assign weights to the attributes. Ecol. Econ., 50, 163-194.
DAFF, 2006a: National Water Initiative.Department of Agriculture, Forestry andFisheries, Australia. http://www.pmc.gov.au/water_reform/nwi.cfm.
DAFF, 2006b:Contours.Department of Agriculture, Forestry and Fisheries, 24 pp.http://www.daff.gov.au/__data/assets/pdf_file/0020/98201/contours-dec-06.pdf.
Dahm, J., G. Jenks and D. Bergin, 2005: Community-based dune management forthe mitigation of coastal hazards and climate change effects: a guide for local au-thorities. Report for the New Zealand Ministry for the Environment, 36 pp.http://www.envbop.govt.nz/media/pdf/Report_Coastalhazardsandclimate.pdf.
Davis, J.R., Ed., 1997:Managing Algal Blooms: Outcomes from CSIRO’s Multi-Divisional Blue-Green Algae Program. CSIRO Land and Water, Canberra,113 pp.
Dayananda, K.G., J. Pathirana, M.D. Davis, M.J. Salinger, A.B. Mullan, P. Kin-ley and G. Paterson, 2005: Flood risk under existing and future climate scenar-ios in Auckland City (New Zealand).WorldWater and Environmental ResourcesCongress 2005, American Society of Civil Engineers, Reston, Virginia, doi:10.1061/40792(173)477.
De Wet, N., W. Ye, S. Hales, R. Warrick, A. Woodward and P. Weinstein, 2001: Useof a computer model to identify potential hotspots for dengue fever in NewZealand. New Zeal. Med. J., 114, 420-422.
DEH, 2005: Adelaide’s Living Beaches: A Strategy for 2005-2025. South Aus-tralian Department for Environment and Heritage, Government of South Aus-tralia, 220 pp. http://www.environment.sa.gov.au/coasts/pdfs/alb_technical_report.pdf.
DEST, 2004: National Research Priorities. http://www.dest.gov.au/sectors/re-search_sector/policies_issues_reviews/key_issues/national_research_priorities/default.htm.
DEUS, 2006:NSWGovernment Water Savings Fund.Department of Energy, Util-ities and Sustainability, 17 pp. http://www.deus.nsw.gov.au/Publications/WaterSavingsFundR3Guide.pdf.
Diamond, H., 2006: Review of recent tropical cyclone research. Island ClimateUpdate, 72, 6.
DoC, 1994: New Zealand Coastal Policy Statement 1994. Department of Conser-vation, Wellington, 30 pp. http://www.doc.govt.nz/upload/documents/conservation/marine-and-coastal/coastal-management/nz-coastal-policy-statement.pdf.
Done, T., P. Whetton, R. Jones, R. Berkelmans, J. Lough, W. Skirving and S.Wooldridge, 2003:Global climate change and coral bleaching on the Great Bar-rier Reef. Final Report to the State of Queensland Greenhouse Taskforce throughthe Department of Natural Resources and Mining, Townsville, 49pp.http://www.longpaddock.qld.gov.au/ClimateChanges/pub/CoralBleaching.pdf.
Donner, S.D., W.J. Skirving, C.M. Little, M. Oppenheimer and O. Hoegh-Guld-berg, 2005: Global assessment of coral bleaching and required rates of adapta-tion under climate change. Glob. Change Biol., 11, 1-15.
DPMC, 2004: Water Reform. Department of Prime Minister and Cabinet, Aus-tralia. http://www.dpmc.gov.au/nwi/index.cfm.
D’Souza, R.M., N.G. Becker, G. Hall and K. Moodie, 2004: Does ambient tem-perature affect foodborne disease? Epidemiology, 15, 86-92.
Dupont, A. and G. Pearman, 2006: Heating up the planet: climate change and se-curity. Paper 12, Lowy Institute for International Policy. Longueville Media,143 pp.www.lowyinstitute.org/PublicationGet.asp?i=391.
Dymond, J.R., A.G. Ausseil, J.D. Shepherd and L. Buetttner, 2006: Validation ofa region-wide model of landslide susceptibility in the Manawatu-Wanganui re-gion of New Zealand. Geomorphology, 74, 70-79.
Electricity Commission, 2005: Initial statement of opportunities: Electricity Com-mission, Wellington, 158 pp. http://www.electricitycommission.govt.nz/opdev/transmis/soo/pdfssoo/SOOv2.pdf.
Ellemor, H., 2005: Reconsidering emergency management and Indigenous com-munities in Australia. Environmental Hazards, 6, 1-7.
Engineers Australia, 2004: Guidelines for Responding to the Effects of ClimateChange in Coastal and Ocean Engineering.National Committee on Coastal andOcean Engineering, 64 pp. http://www.engineersaustralia.org.au/.
Evans, K.L., C. Tyler, T.M. Blackburn and R.P. Duncan, 2003: Changes in thebreeding biology of the welcome swallow (Hirundo tahitica) in New Zealandsince colonisation. Emu, 103, 215-220.
Falconer, I.R., 1997: Blue-green algae in lakes and rivers: their harmful effects onhuman health. Australian Biologist, 10, 107-110.
Fitzharris, B.B., 2004: Possible impact of future climate change on seasonal snowof the Southern Alps of New Zealand. AGaianWorld: Essays in Honour of PeterHolland, G. Kearsley and B. Fitzharris, Eds., Department of Geography, Schoolof Social Science, University of Otago, Dunedin, 231-241.
Folland, C.K., M.J. Salinger, N. Jiang and N. Rayner, 2003: Trends and variationsin South Pacific island and ocean surface temperatures. J. Climate, 16, 2859-2874.
Folland, C.K., B. Dong, R.J. Allan, H. Meinke and B. Bhaskaran, 2005: The In-terdecadal Pacific Oscillation and its climatic impacts. AMS 16th Conference onClimate Variability and Change. http://ams.confex.com/ams/Annual2005/techprogram/paper_86167.htm.
Francis, M.P., 1994: Growth of juvenile snapper, Pagrus auratus (Sparidae).NewZeal. J. Mar. Fresh., 28, 201-218.
Francis, M.P., 1996: Geographic distribution of marine reef fishes in the NewZealand region. New Zeal. J. Mar. Fresh., 30, 35-55.
Frenot, Y., S.L. Chown, J. Whinam, P.M. Selkirk, P. Convey, M. Skotnicki and D.Bergstrom, 2005: Biological invasions in the Antarctic: extent, impacts and im-plications. Biol. Rev., 80, 45-72.
FRST, 2005: Target Outcomes and Themes for the Foundation’s Investment Port-folios. Foundation for Research Science and Technology, 39 pp.http://www.frst.govt.nz/research/downloads/ArchivedDocuments/20050500_Investment_Portfolio-Target_Outcomes_ and_Themes_May05.pdf.
Gallant, A., K. Hennessy and J. Risbey, 2007: A re-examination of trends in rain-fall indices for six Australian regions. Aust. Meteorol. Mag., accepted.
Ghannoum, O., S. von Caemmerer, L.H. Ziska and J.P. Conroy, 2000: The growthresponse of C4 plants to rising atmospheric CO2 partial pressure: a reassessment.Plant Cell Environ., 23, 931-942.
Gifford, R.M. and S.M. Howden, 2001: Vegetation thickening in an ecologicalperspective. significance to national greenhouse-gas inventories. Environ. Sci.Policy, 2-3, 59-72.
Glade, T., 1998: Establishing the frequency and magnitude of landslide-triggeringrainstorm events in New Zealand. Environ. Geol., 35, 160-174.
Goodwin, I.D., 2005: A mid-shelf, mean wave direction climatology for south-eastern Australia, and its relationship to the El Niño-Southern Oscillation since1878 AD. Int. J. Climatol., 25, 1715-1729.
Goodwin, I.D., M.A. Stables and J.M. Olley, 2006: Wave climate, sand budgetand shoreline alignment evolution of the Iluka–Woody Bay sand barrier, north-ern New South Wales, Australia, since 3000 yr BP.Mar. Geol., 226, 127-144.
Chapter 11 Australia and New Zealand
533

Gordon, N.D., 1986: The Southern Oscillation and New Zealand weather. Mon.Weather Rev., 114, 371-387.
Government of South Australia, 2005: Water Proofing Adelaide: A Thirst forChange 2005–2025. Government of SA, 64 pp. http://www.waterproofingade-laide.sa.gov.au/pdf/wpa_Strategy.pdf.
Government of Western Australia, 2003: Securing ourWater Future: A StateWaterStrategy for Western Australia. Government of WA, 64 pp. http://dows.lincdig-ital.com.au/files/State_Water_Strategy_complete_001.pdf.
Government of Western Australia, 2006: Draft State Water Plan. Government ofWA, 88 pp. http://dows.lincdigital.com.au/files/Draft%20State%20Water%20Plan.pdf.
Gray, W., R. Ibbitt, R. Turner, M. Duncan and M. Hollis, 2005: A methodology toassess the impacts of climate change on flood risk in New Zealand. NIWA ClientReport CHC2005-060, New Zealand Climate Change Office, Ministry for theEnvironment. NIWA, Christchurch, 36 pp. http://www.mfe.govt.nz/ publica-tions/climate/impact-climate-change-flood-risk-jul05/html/page8.html.
Green, D., 2006a: Climate Change and health: impacts on remote Indigenous com-munities in northern Australia. CSIRO Research Paper No. 12, Melbourne, 17pp. http://sharingknowledge.net.au/files/climateimpacts_health_report.pdf.
Green, D., 2006b: How might climate change impact island culture in the in theTorres Strait? CSIRO Research Paper No. 11, Melbourne, 20 pp.www.dar.csiro.au/sharingknowledge/files/climateimpacts_TSIculture_report.pdf
Green, D. and B. Preston, 2006: Climate change impacts on remote Indigenouscommunities in northern Australia. CSIRO Working Paper, Melbourne.http://sharingknowledge.net.au/regions.html
Green, K. and C.M. Pickering, 2002: A potential scenario for mammal and bird di-versity in the Snowy Mountains of Australia in relation to climate change.Moun-tain Biodiversity: A Global Assessment, C. Korner and E.M. Spehn, Eds.,Parthenon Press, London, 241-249.
Gregory, J.M., J.A. Church, G.J. Boer, K.W. Dixon, G.M. Flato, D.R. Jackett, J.A.Lowe, S.P. O’Farrell, E. Roeckner, G.L. Russell, R.J. Stouffer and M. Winton,2001: Comparison of results from several AOGCMs for global and regional sea-level change 1900-2100. Clim. Dynam., 18, 225-240.
Griffiths, G.A., 1990: Water resources. Climatic Change: Impacts on NewZealand. Ministry for the Environment, Wellington, 38-43.
Griffiths, G.M, 2007: Changes in New Zealand daily rainfall extremes 1930-2004.Weather Climate, 27, 47-66.
Hall, A.J., G.J. Kenny, P.T. Austin and H.G. McPherson, 2001: Changes in ki-wifruit phenology with climate. The Effects of Climate Change and Variation inNew Zealand: An Assessment using the CLIMPACTS System, R.A. Warrick, G.J.Kenny, and J.J. Harman, Eds., International Global Change Institute (IGCI),Hamilton, 33-46. http://www.waikato.ac.nz/igci/ climpacts/Linked%20docu-ments/Chapter_3.pdf.
Hall, C.J. and C.W. Burns, 2002: Mortality and growth responses ofDaphnia car-inata to increases in temperature and salinity. Freshwater Biol., 47, 451-458.
Hall, G.V., R.M. D’Souza and M.D. Kirk, 2002: Food-borne disease in the newmillennium: out of the frying pan and into the fire?Med. J. Australia, 177, 614-618.
Hall, M. and J. Higham, 2005: Tourism, Recreation and Climate Change: Aspectsof Tourism. Channel View Publications, Clevedon, 309 pp.
Halloy, S.R.P. and A.F. Mark, 2003: Climate change effects on alpine plant biodi-versity: a New Zealand perspective on quantifying the threat. Arct. Antarct. Alp.Res., 35, 248-254.
Hampe, A. and R.J. Petit, 2005: Conserving biodiversity under climate change:the rear edge matters. Ecol. Lett., 8, 461-467.
Hannah, J., 2004: An updated analysis of long-term sea-level change in NewZealand. Geophys. Res. Lett., 31, L03307. doi:10.1029/2003GL019166.
Hare, W., 2003: Assessment of Knowledge on Impacts of Climate Change: Con-tribution to the Specification of Article 2 of the UNFCCC.WGBU, Berlin, 106pp. http://www.wbgu.de/wbgu_sn2003_ex01.pdf.
Harmsworth, G.R. and B. Raynor, 2005: Cultural consideration in landslide riskperception. Landslide Hazard and Risk, T. Glade, M. Anderson and M. Crozier,Eds., John Wiley and Sons, Chichester, 219-249.
Harvey, N. and B. Caton, 2003: Coastal Management in Australia. Oxford Uni-versity Press, Melbourne, 342 pp.
Hennecke, W., C. Greve, P. Cowell and B. Thom, 2004: GIS-based coastal be-haviour modeling and simulation of potential land and property loss: implicationsof sea-level rise at Colloroy/Narrabeen beach, Sydney (Australia). Coast. Man-age., 32, 449-470.
Hennessy, K., C. Lucas, N. Nicholls, J. Bathols, R. Suppiah and J. Ricketts, 2006:Climate Change Impacts on Fire-Weather in South-East Australia.ConsultancyReport for the New South Wales Greenhouse Office, Victorian Department ofSustainability and Environment, Tasmanian Department of Primary Industries,Water and Environment, and the Australian Greenhouse Office. CSIRO Atmos-pheric Research and Australian Government Bureau of Meteorology, 78 pp.http://www.greenhouse.gov.au/impacts/publications/pubs/bushfire-report.pdf.
Hennessy, K.J., 2004: Climate change and Australian storms. Proceedings of theInternational Conference on Storms, Brisbane, 8.
Hennessy, K.J., P.H. Whetton, J. Bathols, M. Hutchinson and J. Sharples, 2003:The Impact of Climate Change on Snow Conditions in Australia. ConsultancyReport for the Victorian Dept of Sustainability and Environment, NSW NationalParks and Wildlife Service, Australian Greenhouse Office and the Australian SkiAreas Association., CSIRO Atmospheric Research, 47 pp.http://www.cmar.csiro.au/e-print/open/hennessy_2003a.pdf.
Hennessy, K.J., K.L. McInnes, D.J. Abbs, R.N. Jones, J.M. Bathols, R. Suppiah,J.R. Ricketts, A.S. Rafter, D. Collins and D. Jones, 2004: Climate Change inNew South Wales. Part 2, Projected Changes in Climate Extremes.ConsultancyReport for the New South Wales Greenhouse Office, CSIRO Atmospheric Re-search, 79 pp. http://www.cmar.csiro.au/e-print/ open/hennessy_2004c.pdf.
Herron, N., R. Davis and R. Jones, 2002: The effects of large-scale afforestationand climate change on water allocation in the Macquarie river catchment, NSW,Australia. Journal of Environmental Management Australia, 65, 369-381.
Hilbert, D.H., B. Ostendorf and M.S. Hopkins, 2001: Sensitivity of tropical foreststo climate change in the humid tropics of North Queensland. Austral Ecol., 26,590-603.
Hilbert, D.W., M. Bradford, T. Parker and D.A. Westcott, 2004: Golden bowerbird(Prionodura newtonia) habitat in past, present and future climates: predicted ex-tinction of a vertebrate in tropical highlands due to global warming. Biol. Con-serv., 116, 367-377. http://www.cababstractsplus.org/google/abstract.asp?AcNo=20043043667.
Hill, R., 2004: Yalanji Warranga Kaban: Yalanji People of the Rainforest FireManagement Book. Little Ramsay Press, Cairns, 110 pp.
Hobday, A. and R. Matear, Eds., 2005: Review of climate impacts on Australianfisheries and aquaculture: implications for the effects of climate change. Reportto the Australian Greenhouse Office, Canberra.
Hoegh-Guldberg, O., 1999: Climate change, coral bleaching and the future of theworld’s coral reefs.Mar. Freshwater Res., 50, 839-866.
Hoegh-Guldberg, O., 2004: Coral reefs in a century of rapid environmental change.Symbiosis, 37, 1-31.
Holper, P.N., S. Lucy, M. Nolan, C. Senese and K. Hennessy, 2007: Infrastructureand Climate Change Risk Assessment for Victoria. Consultancy Report to theVictorian Government prepared by CSIRO, Maunsell AECOM and Phillips Fox,84 pp. http://www.greenhouse.vic.gov.au/greenhouse/wcmn302.nsf/childdocs/-9440F41741A0AF31CA2571A80011CBB6?open.
Hood, A., H. Hossain, V. Sposito, L. Tiller, S. Cook, C. Jayawardana, S. Ryan, A.Skelton, P. Whetton, B. Cechet, K. Hennessy and C. Page, 2002: Options forVictorian Agriculture in a “New” Climate: A Pilot Study Linking ClimateChange Scenario Modelling and Land Suitability Modelling. Vol. 1: Conceptsand Analysis. Vol. Two: Modelling Outputs. Department of Natural Resourcesand Environment, Victoria, 83pp. http://www.dar.csiro.au/cgi-bin/abstract_srch.pl?_ abstract_available_2256.
Howden, M. and R.N. Jones, 2004: Risk assessment of climate change impacts onAustralia’s wheat industry.NewDirections for a Diverse Planet: Proceedings ofthe 4th International Crop Science Congress, Brisbane. http://www.cropscience.org.au/icsc2004/symposia/6/2/1848_howdensm.htm.
Howden, S.M. and S. Crimp, 2001: Effect of climate change on electricity de-mand in Australia. Proceedings of Integrating Models for Natural ResourceManagement across Disciplines, Issues and Scales (2). MODSIM 2001 Inter-national Congress on Modelling and Simulation, F. Ghassemi, P. Whetton, R.Little and M. Littleboy, Eds., Modelling and Simulation Society of Australia andNew Zealand, Canberra, 655-660.
Howden, S.M., W.B. Hall and D. Bruget, 1999a: Heat stress and beef cattle inAustralian rangelands: recent trends and climate change. People and Range-lands: Building the Future. Proceedings of the VI International Rangeland Con-gress, D. Eldridge and D. Freudenberger, Eds., Townsville, 43-45.
Howden, S.M., G.M. McKeon, J.O. Carter and A. Beswick, 1999b: Potentialglobal change impacts on C3-C4 grass distribution in eastern Australian range-lands. People and Rangelands: Building the Future. Proceedings of the VI In-
Australia and New Zealand Chapter 11
534

ternational Rangeland Congress, D. Eldridge and D. Freudenberger, Eds.,Townsville, 41-43.
Howden, S.M., P.J. Reyenga and J.T. Gorman, 1999c: Current evidence of globalchange and its impacts: Australian forests and other ecosystems. CSIRO Wildlifeand Ecology Working Paper 99/01, Canberra, 23 pp.
Howden, S.M., P.J. Reyenga and H. Meinke, 1999d: Global change impacts onAustralian wheat cropping. CSIRO Wildlife and Ecology Working Paper 99/04,Report to the Australian Greenhouse Office, Canberra, 121 pp.http://www.cse.csiro.au/publications/1999/globalchange-99-01.pdf.
Howden, S.M., G.M. McKeon, H. Meinke, M. Entel and N. Flood, 2001a: Im-pacts of climate change and climate variability on the competitiveness of wheatand beef cattle production in Emerald, northeast Australia. Environ. Int., 27, 155-160.
Howden, S.M., J.L. Moore, G.M. McKeon and J.O. Carter, 2001b: Global changeand the mulga woodlands of southwest Queensland: Greenhouse emissions, im-pacts and adaptation. Environ. Int., 27, 161-166.
Howden, S.M., A.J. Ash, E.W.R. Barlow, T. Booth, S. Charles, R. Cechet, S.Crimp, R.M. Gifford, K. Hennessy, R.N. Jones, M.U.F. Kirschbaum, G.M. McK-eon, H. Meinke, S. Park, R. Sutherst, L. Webb and P.J. Whetton, 2003a: AnOverview of the Adaptive Capacity of the Australian Agricultural Sector to Cli-mate Change: Options, Costs and Benefits.Report to the Australian GreenhouseOffice, Canberra, 157 pp.
Howden, S.M., H. Meinke, B. Power and G.M. McKeon, 2003b: Risk manage-ment of wheat in a non-stationary climate: frost in Central Queensland. Integra-tive modelling of biophysical, social and economic systems for resourcemanagement solutions. Proceedings of the International Congress on Model-ling and Simulation, D.A. Post, Ed., Townsville, 17-22.
Howden, S.M., P.J. Reyenga and H. Meinke, 2003c: Managing the quality of wheatgrain under global change. IntegrativeModelling of Biophysical, Social and Eco-nomic Systems for Resource Management Solutions: Proceedings of the Inter-national Congress on Modelling and Simulation, D.A. Post, Ed., Townsville,35-41.
Howe, C., R.N. Jones, S. Maheepala and B. Rhodes, 2005: Implications of Po-tential Climate Change for Melbourne’s Water Resources.CSIRO Urban Water,CSIRO Atmospheric Research, and Melbourne Water, Melbourne, 36 pp.http://www.melbournewater.com.au/content/library/news/whats_new/Climate_Change_Study.pdf
Hughes, L., 2003: Climate change and Australia: trends, projections and impacts.Austral Ecol., 28, 423-443.
ICA, 2007: Catastrophe Information. Insurance Council of Australia.http://www.insurancecouncil.com.au/Catastrophe-Information/default.aspx
IGWG, 2004: Environmental Health Needs of Indigenous Communities in West-ern Australia: The 2004 Survey and its Findings.Western Australia Departmentof Indigenous Affairs, 240 pp. http://www.dia.wa.gov.au/Publications/.
Insurance Council of New Zealand, 2005: Current Issues: The Cost of WeatherLosses: Claims History. NZ Insurance Council, Wellington. http://www.icnz.org.nz/current/wx.php.
IOCI, 2002: Climate Variability and Change in Southwest Western Australia. In-dian Ocean Climate Initiative, Perth, 36 pp. http://www.ioci.org.au/publica-tions/pdf/IOCI_CVCSW02.pdf.
IPCC, 1992: Climate Change 1992: The Supplementary Report to the IPCC Sci-entific Assessment. J.T. Houghton, B.A. Callander and S.K. Varney, Eds., Cam-bridge University Press, Cambridge, 200 pp.
IPCC, 2007: Climate Change 2007: The Physical Science Basis, Contribution of:Working Group I to the Fourth Assessment Report of the IntergovernmentalPanel on Climate Change. S. Solomon, D. Qin, M. Manning, Z. Chen, M. Mar-quis, K.B. Averyt, M. Tignor and H.L. Miller, Eds., Cambridge University Press,Cambridge, 18 pp.
Jackson, S., 2005: A burgeoning role for Aboriginal knowledge. ECOS CSIROPublication, June-July 2005, 11-12.
Jamieson, P.D., J. Berntsen, F. Ewert, B.A. Kimball, J.E. Olesen, P.J. Pinter Jr, J.R.Porter and M.A. Semenov, 2000: Modelling CO2 effects on wheat with varyingnitrogen supplies. Agr. Ecosyst. Environ., 82, 27-37.
Jenkins, B., 2006: Overview of Environment Canterbury water issues: managingdrought in a changing climate. Royal Society of New Zealand Drought Work-shop, 10 April 2006, Christchurch. http://www.rsnz.org/advisory/nz_climate/workshopApr2006/.
Johnston, F.H., A.M. Kavanagh, D.M. Bowman and R.K. Scott, 2002: Exposureto bushfire smoke and asthma: an ecological study.Med. J. Australia, 176, 535–
538.Jones, R. and P. Durack, 2005: Estimating the impacts of climate change on Vic-
toria’s runoff using a hydrological sensitivity model. Consultancy Report for theVictorian Department of Sustainability and Environment, Victoria, 50 pp.http://www.greenhouse.vic.gov.au/CSIRO%20Report%20-%20Runoff.pdf.
Jones, R.J., J. Bowyer, O. Hoegh-Guldberg and L.L. Blackall, 2004: Dynamics ofa temperature-related coral disease outbreak.Mar. Ecol.-Prog. Ser., 281, 63-77.
Jones, R.N., Ed., 2004a: Applying a climate scenario generator to water resourcepolicy issues. Final Report. CSIRO Atmospheric Research, Hassall and Asso-ciates, NSW Department of Infrastructure, Planning and Natural Resources,RIRDC Project No. CSM-5A, 48 pp.
Jones, R.N., 2004b: Managing climate change risks. The Benefits of Climate Poli-cies: Analytical and Framework Issues, J. Corfee Morlot and S. Agrawala, Eds.,OECD, 251-297. http://www.oecd.org/document/35/0,2340,en_ 2649_34361_34086819_1_1_1_1,00.html.
Jones, R.N. and C.M. Page, 2001: Assessing the risk of climate change on thewater resources of the Macquarie river catchment. Integrating Models for Nat-ural Resources Management across Disciplines, Issues and Scales. Part 2.MODSIM 2001 International Congress on Modelling and Simulation, P. Ghas-semi, P. Whetton, R. Little and M. Littleboy, Eds., Modelling and SimulationSociety of Australia and New Zealand, Canberra, 673-678. http://www.aiac-cproject.org/resources/ele_lib_docs/rjones.pdf.
Jones, R.N., P. Dettman, G. Park, M. Rogers and T. White, 2007: The relationshipbetween adaptation and mitigation in managing climate change risks: a regionalapproach.Mitigation Adaptation Strategies Global Change, 12, 685-712.
Jovanovic, B., D.A. Jones and D. Collins, 2007: A high-quality monthly pan evap-oration dataset for Australia. Climatic Change, accepted.
Karoly, D.J. and K. Braganza, 2005a: Attribution of recent temperature changes inthe Australian region. J. Climate, 18, 457-464.
Karoly, D.J. and K. Braganza, 2005b: A new approach to detection of anthro-pogenic temperature changes in the Australian region. Meteorol. Atmos. Phys.,89, 57-67.
Kennish, M.J., 2002: Environmental threats and environmental future of estuaries.Environ. Conserv., 29, 78-107.
Kenny, G., 2005: Adapting to Climate Change in Eastern New Zealand: A FarmerPerspective. Earthwise Consulting, Hastings, 148 pp. http://www.earthlim-ited.org.
Kenny, G., 2007: Adapting to Climate Change: A View from the Ground. Parlia-mentary Commissioner for the Environment, New Zealand, 23 pp., in press.
Kenny, G.J., 2002: Climate change and land management in Hawke’s Bay: a pilotstudy on adaptation. Ministry for the Environment, Wellington.http://www.maf.govt.nz/mafnet/publications/rmupdate/rm10/rm-update-june-2002-01.htm.
Kenny, G.J., R.A. Warrick, B.D. Campbell, G.C. Sims, M. Camilleri, P.D.Jamieson, N.D. Mitchell, H.G. McPherson and M.J. Salinger, 2000: Investigat-ing climate change impacts and thresholds: an application of the CLIMPACTSintegrated assessment model for New Zealand agriculture.Climatic Change, 46,91-113.
Kirono, D.G.C. and R.N. Jones, 2007: A bivariate test for detecting inhomo-geneities in pan evaporation time series. Aust. Meteorol. Mag., accepted.
Kirschbaum, M.U.F., 1999a: Forest growth and species distributions in a chang-ing climate. Tree Physiol., 20, 309-322.
Kirschbaum, M.U.F., 1999b: Modelling forest growth and carbon storage with in-creasing CO2 and temperature. Tellus B, 51, 871-888.
Koslow, A. and R.E. Thresher, 1999: Climate and fisheries on the south-east Aus-tralian continental shelf and slope. Final Report, FRDC Project Number 96/111.http://www.cvap.gov.au/newfsKoslow.html.
Kriticos, D.J., R.W. Sutherst, J.R. Brown, S.W. Adkins and G.F. Maywald, 2003a:Climate change and biotic invasions: a case history of a tropical woody vine.Biol. Invasions, 5, 147-165.
Kriticos, D.J., R.W. Sutherst, J.R. Brown, S.W. Adkins and G.F. Maywald, 2003b:Climate change and the potential distribution of an invasive alien plant: Acacianilotica spp. indica in Australia. J. Appl. Ecol., 40, 111-124.
Kuleshov, Y.A., 2003: Tropical Cyclone Climatology for the Southern Hemisphere.Part 1. Spatial and Temporal Profiles of Tropical Cyclones in the Southern Hemi-sphere. National Climate Centre, Australian Bureau of Meteorology, 1-22.
Kyle, G., 2006: Impacts of climate change on the Mirarr estates, Northern Terri-tory. Report #100406, Gundjeihmi Aboriginal Corporation report, 7 pp.
Langdon, C., 2002: Review of experimental evidence for effects of CO2 on calci-
Chapter 11 Australia and New Zealand
535

fication of reef builders. Proceedings of the 9th International Coral Reef Sym-posium, Ministry of Environment, Indonesian Institute of Science, InternationalSociety for Reef Studies, Bali 23–27 October, 1091-1098.
Langdon, C., T. Takahashi, F. Marubini, M. Atkinson, C. Sweeney, H. Aceves, H.Barnett, D. Chipman and J. Goddard, 2000: Effect of calcium carbonate satura-tion state on the calcification rate of an experimental coral reef. Global Bio-geochem. Cy., 14, 639-654.
Larned, S.T., M.R. Scarsbrook, T.H. Snelder, N.J. Norton and B.J.F. Biggs, 2004:Water quality in low-elevation streams and rivers of New Zealand: recent stateand trends in contrasting land-cover classes. New Zeal. J. Mar. Fresh., 38, 347-366.
Lavorel, S. and W. Steffen, 2004: Cascading impacts of land use through time: theCanberra bushfire disaster. Global Change and the Earth System: A PlanetUnder Pressure, W. Steffen, A. Sanderson, P.D. Tyson, J. Jäger, P.A. Matson, B.Moore III, F. Oldfield, K. Richardson, H.J. Schellnhuber, B.L. Turner II and R.J.Wasson, Eds., IGBP Global Change Series. Springer-Verlag, Berlin, 186-188.
Lehodey, P., M. Mertignac, J. Hampton, A. Lewis and J. Picaut, 1997: El NiñoSouthern Oscillation and tuna in the Western Pacific. Nature, 389, 715-718.
Leslie, L.M. and D.J. Karoly, 2007: Variability of tropical cyclones over the south-west Pacific Ocean using a high-resolution climate model. Meteorol. Atmos.Phys., doi:10.1007/s00703-006-0250-3.
Lewis, D., 2002: Slower Than the Eye Can See: Environmental Change in North-ern Australia’s Cattle Lands, A Case Study from the Victoria River District,Northern Territory. Tropical Savannas CRC, Darwin, Northern Territory.http://savanna.ntu.edu.au/publications/landscape_change.html.
Lilley, J.M., T.P. Bolger, M.B. Peoples and R.M. Gifford, 2001: Nutritive value andthe dynamics of Trifolium subterrraneum and Phalaris aquatica under warmer,high CO2 conditions. New Phytol., 150, 385-395.
Lincoln Environmental, 2000: Information on water allocation in New Zealand.Report No 4375/1, Prepared for Ministry for the Environment by Lincoln Ven-tures, Canterbury, 190 pp. http://www.mfe.govt.nz/publications/water/water-al-location-apr00.pdf.
Lough, J.M., 2000: 1997-98: Unprecedented thermal stress to coral reefs? Geo-phys. Res. Lett., 27, 3901-3904.
Lowy Institute, 2006: Public Opinion on Foreign Policy in the Asia-Pacific.Chicago Council on Global Affairs in partnership with Asia Society and in as-sociation with East Asia Institute and Lowy Institute for International Policy,91 pp. http://www.lowyinstitute.org/Publication.asp?pid=483.
Luo, Q., M.A.J. Williams, W. Bellotti and B. Bryan, 2003: Quantitative and visualassessments of climate change impacts on South Australian wheat production.Agr. Syst., 77, 173-186.
Lyne, V.D., 2000: Development, evaluation and application of remotely sensedocean colour data by Australian fisheries. Final Report for 1994/045, FisheriesResearch and Development Corporation, Canberra, 88 pp.http://www.frdc.com.au/.
Maddison, D., 2001: In search of warmer climates? The impact of climate changeon flows of British tourists. Climatic Change, 49, 193-208.
MAF, 1999: 1999 Post-election brief: the agriculture, horticultural and forestrysectors. http://www.maf.govt.nz/mafnet/publications/1999-post-election-brief/pstelbrf99-05.htm.
MAF, 2001: A national exotic forest description. Ministry of Agriculture andForestry, 63 pp. http://www.maf.govt.nz/statistics/primaryindustries /forestry/for-est-resources/national-exotic-forest-2001/nefd-2001.pdf.
MAF, 2006: How climate change is likely to affect agriculture and forestry in NewZealand. Ministry of Agriculture and Forestry. http://www.maf.govt.nz/mafnet/rural-nz/sustainable-resource-use/climate/index.htm.
Maunder, M.N. and B.M. Watters, 2003: A general framework for integrating en-vironmental time series into stock assessment models: model description, sim-ulation testing, and example. Fish. B.–NOAA, 101, 89-99.
MCDEM, 2004: Review of the February 2004 flood event. Review Team Report.Director of Civil Defence and Emergency Management, Wellington, 93 pp.http://www.civildefence.govt.nz/memwebsite.nsf/Files/FINAL_review_of_the_February_2004_floods/$file/FINAL_review_of_the_February_2004_floods.pdf.
McGlone, M.S., 2001: Linkages between climate change and biodiversity in NewZealand. Landcare Research Contract Report LC0102/014, Ministry for the En-vironment, Wellington, 36 pp. http://www.mfe.govt.nz/publications/climate/bio-diversity-sep01/biodiversity-sep01.pdf.
McInnes, K.L., R. Suppiah, P.H. Whetton, K.J. Hennessy and R.N. Jones, 2002:Climate change in South Australia. Report on assessment of climate change, im-
pacts and possible adaptation strategies relevant to South Australia, CSIRO At-mospheric Research, Aspendale, 61 pp. http://www.cmar.csiro.au /e-print /open/mcinnes_2003a.pdf.
McInnes, K.L., K.J.E. Walsh, G.D. Hubbert and T. Beer, 2003: Impact of sea-levelrise and storm surges on a coastal community. Nat. Hazards, 30, 187-207.
McIntosh, A.J., 2004: Tourists’ appreciation of Maori culture in New Zealand.Tourism Manage., 25, 1-15.
McKerchar, A.I. and R.D. Henderson, 2003: Shifts in flood and low-flow regimesin New Zealand due to inter-decadal climate variations. Hydrolog. Sci. J., 48,637-654.
McMichael, A., R. Woodruff, P. Whetton, K. Hennessy, N. Nicholls, S. Hales, A.Woodward and T. Kjellstrom, 2003: Human Health and Climate Change inOceania: A Risk Assessment 2002. Commonwealth Department of Health andAgeing, 126 pp. http://www.health.gov.au/internet/wcms/Publishing.nsf/Con-tent/health-pubhlth-publicat-document-metadata-env_climate.htm.
McMichael, A.J., R.E. Woodruff and S. Hales, 2006: Climate change and humanhealth: present and future risks. Lancet, 367, 859-869.
MDBC, 2006: Basin Statistics. Murray-Darling Basin Commission.http://www.mdbc.gov.au/about/basin_statistics.
MDBMC, 1999: The Salinity Audit of the Murray-Darling Basin. Murray-Dar-ling Basin Ministerial Council, 48 pp. http://www.mdbc.gov.au/salinity/salinity_audit_1999.
Meehl, G.A., T.F. Stocker, W.D. Collins, P. Friedlingstein, A.T. Gaye, J.M. Gre-gory, A. Kitoh, R. Knutti, J.M. Murphy, A. Noda, S.C.B. Raper, I.G. Watterson,A.J. Weaver and Z.-C. Zhao, 2007: Global climate projections.Climate Change2007: The Physical Science Basis, Contribution of: Working Group I to theFourth Assessment Report of the Intergovernmental Panel on Climate Change.S. Solomon, D. Qin, M. Manning, Z. Chen, M. Marquis, K.B. Averyt, M. Tignorand H.L. Miller, Eds., Cambridge University Press, Cambridge, 747-846.
Melbourne Water, 2006: Eastern Treatment plant: treating sewage from Mel-bourne’s south-eastern and eastern suburbs. http://www.melbournewater.com.au/content/sewerage/eastern_treatment_plant/eastern_treatment_plant.asp?bhcp=1.
MFAT, 2006: A joint study investigating the benefits of a closer economic part-nership (CEP) agreement between Thailand and New Zealand: overview of theThailand and New Zealand economies. http://www.mfat.govt.nz/foreign/tnd/ceps/nzthaicep/thainzeconomies.html.
MfE, 2001: Climate change impacts on New Zealand. Report prepared by the Min-istry for the Environment as part of the New Zealand Climate Change Pro-gramme, Ministry for the Environment, Wellington, 39 pp.http://www.climatechange.govt.nz/resources/reports/impacts-report/impacts-report-jun01.pd.
MfE, 2002: Adapting to the impacts of climate change: what role for local gov-ernment? Proceedings of a Workshop Organised by the Ministry for the Envi-ronment as Part of the New Zealand Climate Change Programme, 31 pp.http://www.lgnz.co.nz/library/files/store_001/impacts-of-climate-change.pdf.
MfE, 2003: Climate change case study. Local government adaptation to climatechange: Environment Bay of Plenty and coastal hazards: “Issues, barriers and so-lutions”. Prepared for the NZ Climate Change Office (Ministry for the Envi-ronment) by Lawrence Cross and Chapman and the International Global ChangeInstitute, in conjunction with Environment Bay of Plenty, Tauranga DistrictCouncil and Western Bay of Plenty District Council, 13 pp.http://www.mfe.govt.nz/publications/climate/ebop-coastal-hazards-jul03/ebop-coastal-hazards-jul03.pdf.
MfE, 2004a:Coastal Hazards and Climate Change: AGuidanceManual for LocalGovernment in New Zealand. Ministry for the Environment, 13 pp.http://www.mfe.govt.nz/publications/climate/ebop-coastal-hazards-jul03/ebop-coastal-hazards-jul03.pdf.
MfE, 2004b: Workshop summary report. International Workshop on AdaptationPractices and Strategies in Developed Countries, 11-13 October 2004, Welling-ton, A. Reisinger and H. Larsen, Eds., New Zealand Climate Change Office,NZCCO of the Ministry for the Environment. http://www.mfe.govt.nz/issues/climate/resources/workshops/preparing-climate-change/index.html.
MfE, 2004c: Preparing for Climate Change: A Guide for Local Government inNew Zealand.New Zealand Climate Change Office, Ministry for Environment,Wellington, 37 pp.. http://www.mfe.govt.nz/publications/climate/preparing-for-climate-change-jul04/index.html
Miller, M.G. and A. Veltman, 2004: Proposed Canterbury Natural Resources Planfor river and groundwater allocation policies and the implications for irrigation
Australia and New Zealand Chapter 11
536

dependent farming in Canterbury. Proceedings of the New Zealand GrasslandAssociation, 66, 11-23.
Mimura, N., 2006: State of the environment in Asia and Pacific coastal zones.Global Change and Integrated Coastal Management: The Asia Pacific Region,N. Harvey, Ed., Springer, 339 pp.
Ministry of Fisheries Science Group, 2006: Report from the Fishery AssessmentPlenary, May 2006: stock assessment and yield estimates. Report held in NIWALibrary, Wellington, 875 pp.
Moore, J.L., S.M. Howden, G.M. McKeon, J.O. Carter and J.C. Scanlan, 2001:The dynamics of grazed woodlands in southwest Queensland, Australia and theireffect on greenhouse gas emissions. Environ. Int., 27, 147-153.
Mpelasoka, F., K.J. Hennessy, R. Jones and J. Bathols, 2007: Comparison of suit-able drought indices for climate change impacts assessment over Australia to-wards resource management. Int. J. Climatol., accepted.
Mullan, A.B., 1995: On the linearity and stability of Southern Oscillation–climaterelationships for New Zealand. Int. J. Climatol., 15, 1356-1386.
Mullan, A.B., M.J. Salinger, C.S. Thompson and A.S. Porteous, 2001: The NewZealand climate: present and future. The Effects of Climate Change and Varia-tion in New Zealand: An Assessment using the CLIMPACTS System, R.A. War-rick, G.J. Kenny and J.J. Harman, Eds., International Global Change Institute(IGCI), University of Waikato, Hamilton, 11-31. http://www.waikato.ac.nz/igci/climpacts/Linked%20documents/Chapter_2.pdf.
Mullan, A.B., A. Porteous, D. Wratt and M. Hollis, 2005a: Changes in droughtrisk with climate change. NIWA Report WLG2005-23, 58 pp. http://www.cli-matechange.govt.nz/resources/reports/drought-risk-may05/drought-risk-climate-change-may05.pdf.
Mullan, A.B., J. Salinger, D. Ramsay and M. Wild, 2005b: Chatham Islands Cli-mate Change. NIWA Report WLG2005-35, 42 pp. http://www.climate-change.govt.nz/resources/reports/chatham-islands-climate-change-jun05/chatham-islands-climate-change-jun05.pdf.
Mulrennan, M., 1992: Coastal management: challenges and changes in the TorresStrait islands. Australian National University, North Australia Research Unit,Discussion Paper 5, 40 pp.
Nakićenović, N. and R. Swart, Eds., 2000: Special Report on Emissions Scenar-ios: A Special Report of Working Group III of the Intergovernmental Panel onClimate Change. Cambridge University Press, Cambridge, 599 pp.
Namjou, P., G. Strayton, A. Pattle, M.D. Davis, P. Kinley, P. Cowpertwait, M.J.Salinger, A.B. Mullan, G. Paterson and B. Sharman, 2005: The integrated catch-ment study of Auckland City (New Zealand): long-term groundwater behaviourand assessment. EWRI Conference, 13.
NEMMCO, 2006: 2006 Statement of Opportunities. National Electricity MarketManagement Company. http://www.nemmco.com.au/nemgeneral/040-0042.htm.
Niall, S. and K. Walsh, 2005: The impact of climate change on hailstorms in south-eastern Australia. Int. J. Climatol., 25, 1933-1952.
Nicholls, N., 2004: The changing nature of Australian droughts.Climatic Change,63, 323-336.
Nicholls, N., 2005: Climate variability, climate change and the Australian snowseason. Aust. Meteorol. Mag., 54, 177-185.
Nicholls, N., 2006: Detecting and attributing Australian climate change: a review.Aust. Meteorol. Mag., 55, 199-211.
Nicholls, N. and D. Collins, 2006: Observed change in Australia over the past cen-tury. Energy and Environment, 17, 1-12.
Nicholls, N., C.D. Butler and I. Hanigan, 2006: Inter-annual rainfall variationsand suicide in New South Wales, Australia, 1964-2001. Int. J. Biometeorol., 50,139-143.
NIWA, 2005: Past Climate Variations over New Zealand. National Institute ofWater and Atmospheric Research, Wellington. http://www.niwascience.co.nz/ncc/clivar/pastclimate#y140.
NIWA, 2006: Proceedings of the Second Maori Climate Forum, 24 May 2006,Hongoeka Marae, Plimmerton. http://www.niwascience.co.nz/ncc/maori/2006-05/.
NLWRA, 2001: AustralianWater Resources Assessment 2000.National Land andWater Resources Audit, Land and Water Australia. http://www.nlwra.gov.au/.
NRMMC, 2006: National Agriculture and Climate Change Action Plan 2006-2009. National resource management Ministerial Council, 20 pp.http://www.daffa.gov.au/__data/assets/pdf_file/33981/nat_ag_clim_chang_action_plan2006.pdf.
NZIER, 2003:Maori Economic Development: Te Ohanga Whakaketanga Maori.
New Zealand Institute of Economic Research, Wellington. http://www.nzier.org.nz/.
NZIER, 2004: Economic impacts on New Zealand of climate change-related ex-treme events: focus on freshwater floods. Report to Climate Change Office, NewZealand Institute of Economic Research, Wellington, 73 pp. http://www.climat-echange.govt.nz/resources/reports/economic-impacts-extreme-events-jul04/economic-impacts-extreme-events-jul04.pdf.
O’Connell, M. and R. Hargreaves, 2004: Climate change adaptation. guidance onadapting New Zealand’s built environment for the impacts of climate change.BRANZ Study Report No. 130, 44 pp. http://www.branz.co.nz/branzltd/publi-cations/pdfs/SR130.pdf.
O’Hara, T.D., 2002: Endemism, rarity and vulnerability of marine species alonga temperate coastline. Invertebr. Syst., 16, 671-679.
Orlove, B., 2003:HowPeople Name Seasons, S. Strauss and B. Orlove, Eds., BergPublishers, Oxford, 121-141.
Orr, J.C., V.J. Fabry, O. Aumont, L. Bopp, S.C. Doney, R.A. Feely, A. Gnanade-sikan, N. Gruber, A. Ishida, F. Joos, R.M. Key, K. Lindsay, E. Maier-Reimer,R.J. Matear, P. Monfray, A. Mouchet, R.G. Najjar, G.-K. Plattner, K.B. Rodgers,C.L. Sabine, J.L. Sarmiento, S. R, R.D. Slater, I.J. Totterdell, M.-F. Weirig, Y. Ya-manaka and A. Yool, 2005: Anthropogenic ocean acidification over the twenty-first century and its impact on calcifying organisms. Nature, 437, 681-686.
Owens, I.F. and B.B. Fitzharris, 2004: Seasonal snow and water. Waters of NewZealand, M.P. Mosley, C. Pearson and B. Sorrell, Eds., New Zealand Hydro-logical Society and New Zealand Limnological Society, 5.1-5.12.
Packman, D., D. Ponter and T. Tutua-Nathan, 2001: Maori issues. Climate ChangeWorking Paper, New Zealand Climate Change Office, Ministry for the Envi-ronment, Wellington, 18 pp. http://www.climatechange.govt.nz/resources/.
Parliament of Australia, 2003: Regulating the Ranger, Jabiluka, Beverly and Hon-eymoon Uranium Mines. Parliament of Australia, Committee Address: Envi-ronment, Communications, Information Technology and the Arts LegislationCommittee S1, Canberra, ACT. http://www.aph.gov.au/senate/ committee/ecita_ctte/completed_inquiries/2002-04/uranium/report/index.htm.
PB Associates, 2007: Assessment of the vulnerability of Australia’s energy infra-structure to the impacts of climate change. Issues Paper, 158292A-REP-002.doc,78 pp., in press.
Pearce, G., A.B. Mullan, M.J. Salinger, T.W. Opperman, D. Woods and J.R. Moore,2005: Impact of climate variability and change on long-term fire danger. Reportto the New Zealand Fire Service Commission, 75 pp. http://www.fire.org.nz/research/reports/reports/Report_50.pdf.
PIA, 2004: Sustainable regional and urban communities adapting to climatechange. Issues Paper, Planning Institute of Australia Queensland Division, Bris-bane, 88 pp. http://www.greenhouse.sa.gov.au/PDFs/issuespaperjune_21.pdf.
Pickering, C., R. Good and K. Green, 2004: Potential effects of global warmingon the biota of the Australian Alps. Report to the Australian Greenhouse Office,Canberra, 51 pp. http://www.greenhouse.gov.au/impacts/publications/ alps.html.
Pittock, B., 2003: Climate Change: An Australian Guide to the Science and Po-tential of Impacts. Department for the Environment and Heritage, AustralianGreenhouse Office, Canberra, ACT, 250 pp. http://www.greenhouse. gov.au/sci-ence/guide/index.html.
Pittock, B. and D. Wratt, 2001: Australia and New Zealand.Climate Change 2001:Impacts, Adaptation, and Vulnerability. Contribution of Working Group II to theThird Assessment Report of the Intergovernmental Panel on Climate Change,J.J. McCarthy, O.F. Canziani, N.A. Leary, D.J. Dokken and K.S. White, Eds.,Cambridge University Press, Cambridge, 591-639.
Poloczanska, E.S., R.C. Babcock, A. Butler, A.J. Hobday, O. Hoegh-Guldberg,T.J. Kunz, R. Matear, D. Milton, T.A. Okey and A.J. Richardson, 2007: Climatechange and Australian marine life. Oceanography and Marine Biology: An An-nual Review, Volume 45, R.N. Gibson, R.J.A. Atkinson and J.D.M. Gordon, Eds.,CRC Press, Cleveland, 544 pp.
Power, S., F. Tseitkin, S. Torok, B. Lavery, R. Dahni and B. McAvaney, 1998:Australian temperature, Australian rainfall and the Southern Oscillation, 1910-1992: coherent variability and recent changes. Aust. Meteorol. Mag., 47, 85-101.
Power, S., T. Casey, C. Folland, C. A. and V. Mehta, 1999: Inter-decadal modula-tion of the impact of ENSO on Australia. Clim. Dynam., 15, 319-324.
Premier of Victoria, 2006: Ballarat’s future water supplies secured by major Bracksgovernment action plan. Media release, 17 October 2006. http://www.premier.vic.gov.au/newsroom/news_item.asp?id=978.
Preston, B., R. Suppiah, I. Macadam and J. Bathols, 2006: Climate change in theAsia/Pacific region. Consultancy Report prepared for the Climate Change and
Chapter 11 Australia and New Zealand
537

Development Roundtable, CSIRO Marine and Atmospheric Research, As-pendale, 92 pp. http://www.csiro.au/csiro/content/file/pfkd.html.
Puotinen, M.L., 2006: Modelling the risk of cyclone wave damage to coral reefsusing GIS: a case study of the Great Barrier Reef, 1969-2003. Int. J. Geogr. Inf.Sci., 21, 97-120.
QDLGP, 2003:Queensland’s Future Population.Queensland Department of LocalGovernment and Planning (Medium Series). http://www.lgp.qld.gov.au/?id=1216.
Queensland Government, 2005:Queensland Water Plan 2005-2010. QueenslandGovernment, 27 pp. http://www.nrw.qld.gov.au/water/pdf/qld_water_plan_05_10.pdf.
Queensland Government, 2006: TC Larry Report, 28March 2006. http://www.dis-aster.qld.gov.au/news/view.asp?id=1323.
QVL, 2006: Residential Property:Price Movement. Quotable Value Limited.http://www.qv.co.nz/onlinereports/marketstatistics/.
Ranasinghe, R., R. McLoughlin, A.D. Short and G. Symonds, 2004: The SouthernOscillation Index, wave climate, and beach rotation.Mar. Geol., 204, 273-287.
Raven, J., K. Caldeira, H. Elderfield, O. Hoegh-Guldberg, P. Liss, U. Riebesell, J.Shepherd, C. Turley and A. Watson, 2005: Ocean acidification due to increasingcarbon dioxide. Report to the Royal Society, London, 68 pp. http://www.royal-soc.ac.uk/displaypagedoc.asp?id=13539.
Renwick, J.A., R.J. Hurst and J.W. Kidson, 1998: Climatic influences on the re-cruitment of southern gemfish (Rexea solandri, Gempylidae) in New Zealandwaters. Int. J. Climatol., 18, 1655-1667.
Reyenga, P.J., S.M. Howden, H. Meinke and W.B. Hall, 2001: Global change im-pacts on wheat production along an environmental gradient in South Australia.Environ. Int., 27, 195-200.
Richardson, A.C., K.B. Marsh, H.L. Boldingh, A.H. Pickering, S.M. Bulley, N.J.Frearson, A.R. Ferguson, S.E. Thornber, K.M. Bolitho and E.A. Macrae, 2004:High growing temperatures reduce fruit carbohydrate and vitamin C in fruit.Plant Cell Environ., 27, 423-435.
Richardson, A.J. and D.S. Schoeman, 2004: Climate impact on plankton ecosys-tems in the North-East Atlantic. Science, 305, 1609-1612.
Richardson, S.J., R.B. Allen, D. Whitehead, F.E. Carswell, W.A. Ruscoe and K.H.Platt, 2005: Climate and net carbon availability determine temporal patterns ofseed productivity by Nothofagus. Ecology, 86, 972-981.
Ring, T. and N. Brown, 2002: Indigenous health: chronically inadequate responsesto damning statistics.Med. J. Australia, 177, 629-631.
Robb, C. and J. Bright, 2004: Values and uses of water. Freshwaters of NewZealand, J.S. Harding, M.P. Mosley, C.P. Pearson and B.K. Sorrell, Eds., NewZealand Hydrological Society and New Zealand Limnological Society, CaxtonPress, Christchurch, 42.1-42.14.
Roderick, M.L. and G.D. Farquhar, 2004: Changes in Australian pan evaporationfrom 1970 to 2002. Int. J. Climatol., 24, 1077-1090.
Roderick, M.L. and G.D. Farquhar, 2005: Changes in New Zealand pan evapora-tion since the 1970s. Int. J. Climatol., 25, 2031-2039.
Rose, D., 1996: Nourishing Terrains: Australian Aboriginal Views of Landscapeand Wilderness. Australian Heritage Commission, Canberra, 95 pp.http://www.ahc.gov.au/publications/generalpubs/nourishing/index.html.
RSNZ, 2002: New Zealand Climate Committee: Terms of Reference. Royal Soci-ety of New Zealand, New Zealand Climate Committee. http://www.rsnz.org/advisory/nz_climate/terms.php/.
Salinger, M.J., 1990: Climate change and the electricity industry. New ZealandMeteorological Service Report, 59 pp.
Salinger, M.J. and A.B. Mullan, 1999: New Zealand climate: temperature and pre-cipitation variations and their links with atmospheric circulation 1930-1994. Int.J. Climatol., 19, 1049-1071.
Salinger, M.J. and G.M. Griffiths, 2001: Trends in New Zealand daily temperatureand rainfall extremes. Int. J. Climatol., 21, 1437-1452.
Salinger, M.J., W.M. Williams, J.M. Williams and R.J. Martin, 1990: Agriculturalresources. Climate Change: Impacts on New Zealand. Ministry for the Envi-ronment, Wellington, 108-132.
Salinger, M.J., W. Gray, B. Mullan and D. Wratt, 2004: Atmospheric circulationand precipitation. Freshwaters of New Zealand, J. Harding, P. Mosley, C. Pear-son and B. Sorrell, Eds., Caxton Press, Christchurch, 2.1-2.18.
Salinger, M.J., G.M. Griffiths and A. Gosai, 2005a: Extreme daily pressure dif-ferences and winds across New Zealand. Int. J. Climatol., 25, 1301-1330.
Salinger, M.J., M.V.K. Sivakumar and R. Motha, 2005b: Reducing vulnerabilityof agriculture and forestry to climate variability and change: workshop summary
and recommendations. Climatic Change, 70, 341-362.Scanlan, J.C., D.M. Berman and W.E. Grant, 2006: Population dynamics of the Eu-
ropean rabbit (Oryctolagus cuniculus) in north eastern Australia: simulated re-sponses to control. Ecol. Model., 196, 221-236.
Schallenberg, M., C.J. Hall and C.W. Burns, 2003: Consequences of climate-in-duced salinity increases on zooplankton abundance and diversity in coastal lakes.Mar. Ecol.-Prog. Ser., 251, 181-189.
Schuster, S.S., R.J. Blong, R.J. Leigh and K.J. McAneney, 2005: Characteristicsof the 14 April 1999 Sydney hailstorm based on ground observations, weatherradar, insurance data and emergency calls. Nat. Hazard. Earth Sys., 5, 613-620.
Scott, D., G. McBoyle and M. Schwartzentruber, 2004: Climate change and thedistribution of climatic resources for tourism in North America.Climate Res., 27,105-117.
Seafood Industry Council, 2006: New Zealand’s Seafood Business.http://www.seafood.co.nz/sc-business/.
Sharples, C., 2004: Indicative mapping of Tasmania’s coastal vulnerability to cli-mate change and sea-level rise. Explanatory Report, Tasmanian Department ofPrimary Industries, Water and Environment, Hobart, 126 pp.http://www.dpiw.tas.gov.au/inter.nsf/Publications/PMAS-6B59RQ?open.
Shaw, H., A. Reisinger, H. Larsen and C. Stumbles, 2005: Incorporating climatechange into stormwater design: why and how? Proceedings of the 4th South Pa-cific Conference on Stormwater and Aquatic Resource Protection, May 2005,Auckland, 18 pp. http://www.climatechange.govt.nz/resources/local-govt/stormwater-design-mar05/stormwater-design-mar05.pdf.
Sims, D.W., M.J. Genner, A.J. Southward and S.J. Hawkins, 2001: Timing of squidmigration reflects North Atlantic climate variability. P. Roy. Soc. Lond. B, 2607-2611.
Sinclair, T.R., P.J. Pinter Jr, B.A. Kimball, F.J. Adamsen, R.L. LaMorte, G.W. Wall,D.J. Hunsaker, N. Adam, T.J. Brooks, R.L. Garcia, T. Thompson, S. Leavitt andA. Matthias, 2000: Leaf nitrogen concentration of wheat subjected to elevated[CO2] and either water or N deficits. Agr. Ecosyst. Environ., 79, 53-60.
Smith, B.R., 2004a: Some natural resource management issues for Indigenouspeople in northern Australia. Arafura Timor Research Facility Forum, ANU In-stitute for Environment, The National Australia University.http://www.anu.edu.au/anuie/.
Smith, I.N., 2004b: Trends in Australian rainfall: are they unusual? Aust. Meteo-rol. Mag., 53, 163-173.
Smith, P.J., 1979: Esterase gene frequencies and temperature relationships in theNew Zealand snapper Chryophrys auratus.Mar. Biol., 53/4, 305-310.
Smithers, B.V., D.R. Peck, A.K. Krockenberger and B.C. Congdon, 2003: Ele-vated sea-surface temperature, reduced provisioning and reproductive failure ofwedge-tailed shearwaters (Puffinus pacificus) in the Southern Great Barrier Reef,Australia.Mar. Freshwater Res., 54, 973-977.
SOE, 2001: Australia State of the Environment 2001: Independent Report to theCommonwealth Minister for the Environment and Heritage.Australian State ofthe Environment Committee, CSIRO Publishing on behalf of the Department ofthe Environment and Heritage, 129 pp. http:/www.ea.gov.au/soe/2001.
Sorensen, I., P. Stone and B. Rogers, 2000: Effect of time of sowing on yield of ashort and a long-season maize hybrid. Agronomy New Zealand, 30, 63-66.
Statistics New Zealand, 2005a:Demographic Trends. Statistics New Zealand, NewZealand Government. http://www.stats.govt.nz/products-and-services/reference-reports/demographic-trends.htm.
Statistics New Zealand, 2005b: National Population Projections 2004-2051. Sta-tistics New Zealand, New Zealand Government. http://www.stats.govt.nz/datasets/population/population-projections.htm.
Statistics New Zealand, 2006: QuickStats About New Zealand‘s Population andDwellings 2006 Census. Statistics New Zealand, 11 pp. http://www.stats.govt.nz/NR/rdonlyres/CCA37BF2-2E49-44D4-82AB-35538608DEFD/0/2006censusquickstatsaboutnzspopanddwellings.pdf.
Steffen, W., G. Love and P.H. Whetton, 2006: Approaches to defining dangerousclimate change: an Australian perspective. Avoiding Dangerous Climate Change,H.J. Schellnhuber, W. Cramer, N. Nakićenović, T. Wigley and G. Yohe, Eds.,Cambridge University Press, Cambridge, 392 pp.
Stephens, A.E.A., D.J. Kriticos and A. Leriche, 2007: The current and future dis-tribution of the oriental fruit fly, Bactrocera dorsalis (Diptera: Tephritidae). B.Entomol. Res., in press.
Stokes, C. and A. Ash, 2006: Impacts of climate change on marginal tropical pro-duction systems. Agroecosystems in a Changing Climate, P. Newton, A. Carranand G. Edwards, Eds., Taylor and Francis, Florida, 181-188.
Australia and New Zealand Chapter 11
538
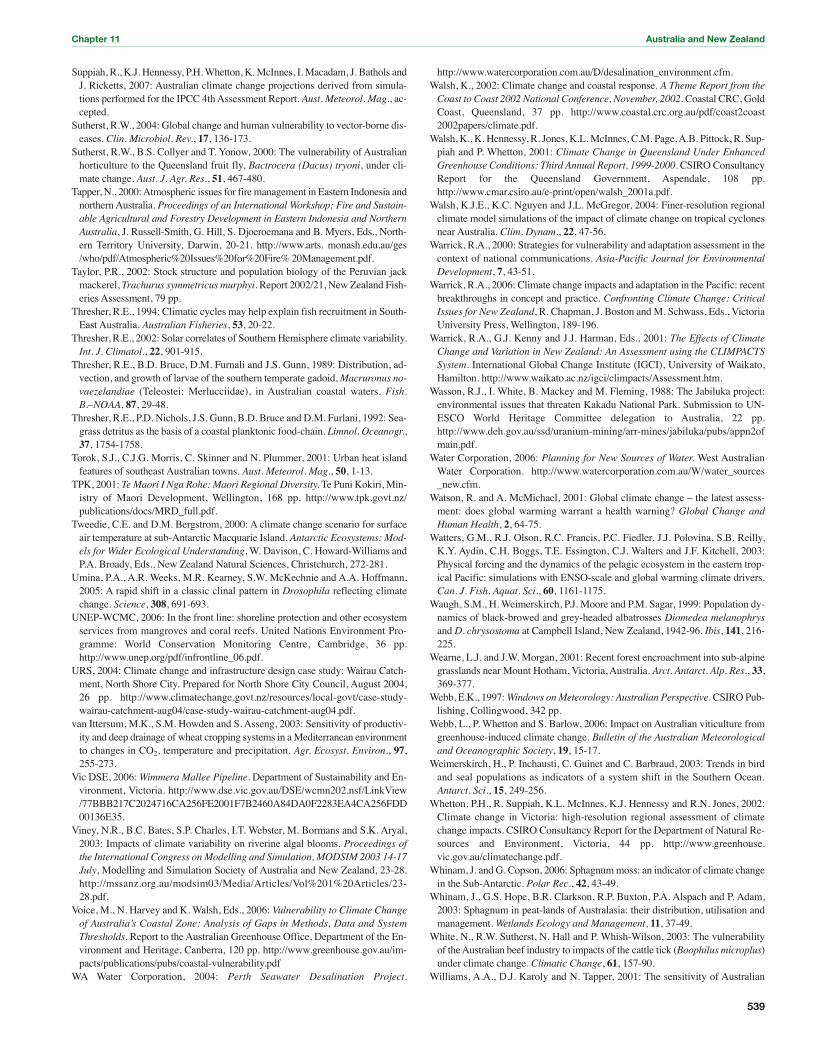
Suppiah, R., K.J. Hennessy, P.H. Whetton, K. McInnes, I. Macadam, J. Bathols andJ. Ricketts, 2007: Australian climate change projections derived from simula-tions performed for the IPCC 4th Assessment Report. Aust. Meteorol. Mag., ac-cepted.
Sutherst, R.W., 2004: Global change and human vulnerability to vector-borne dis-eases. Clin. Microbiol. Rev., 17, 136-173.
Sutherst, R.W., B.S. Collyer and T. Yonow, 2000: The vulnerability of Australianhorticulture to the Queensland fruit fly, Bactrocera (Dacus) tryoni, under cli-mate change. Aust. J. Agr. Res., 51, 467-480.
Tapper, N., 2000:Atmospheric issues for fire management in Eastern Indonesia andnorthern Australia. Proceedings of an International Workshop: Fire and Sustain-able Agricultural and Forestry Development in Eastern Indonesia and NorthernAustralia, J. Russell-Smith, G. Hill, S. Djoeroemana and B. Myers, Eds., North-ern Territory University, Darwin, 20-21. http://www.arts. monash.edu.au/ges/who/pdf/Atmospheric%20Issues%20for%20Fire% 20Management.pdf.
Taylor, P.R., 2002: Stock structure and population biology of the Peruvian jackmackerel, Trachurus symmetricus murphyi. Report 2002/21, New Zealand Fish-eries Assessment, 79 pp.
Thresher, R.E., 1994: Climatic cycles may help explain fish recruitment in South-East Australia. Australian Fisheries, 53, 20-22.
Thresher, R.E., 2002: Solar correlates of Southern Hemisphere climate variability.Int. J. Climatol., 22, 901-915.
Thresher, R.E., B.D. Bruce, D.M. Furnali and J.S. Gunn, 1989: Distribution, ad-vection, and growth of larvae of the southern temperate gadoid,Macruronus no-vaezelandiae (Teleostei: Merlucciidae), in Australian coastal waters. Fish.B.–NOAA, 87, 29-48.
Thresher, R.E., P.D. Nichols, J.S. Gunn, B.D. Bruce and D.M. Furlani, 1992: Sea-grass detritus as the basis of a coastal planktonic food-chain. Limnol. Oceanogr.,37, 1754-1758.
Torok, S.J., C.J.G. Morris, C. Skinner and N. Plummer, 2001: Urban heat islandfeatures of southeast Australian towns. Aust. Meteorol. Mag., 50, 1-13.
TPK, 2001: TeMaori I Nga Rohe: Maori Regional Diversity.Te Puni Kokiri, Min-istry of Maori Development, Wellington, 168 pp. http://www.tpk.govt.nz/publications/docs/MRD_full.pdf.
Tweedie, C.E. and D.M. Bergstrom, 2000: A climate change scenario for surfaceair temperature at sub-Antarctic Macquarie Island. Antarctic Ecosystems: Mod-els for Wider Ecological Understanding, W. Davison, C. Howard-Williams andP.A. Broady, Eds., New Zealand Natural Sciences, Christchurch, 272-281.
Umina, P.A., A.R. Weeks, M.R. Kearney, S.W. McKechnie and A.A. Hoffmann,2005: A rapid shift in a classic clinal pattern in Drosophila reflecting climatechange. Science, 308, 691-693.
UNEP-WCMC, 2006: In the front line: shoreline protection and other ecosystemservices from mangroves and coral reefs. United Nations Environment Pro-gramme: World Conservation Monitoring Centre, Cambridge, 36 pp.http://www.unep.org/pdf/infrontline_06.pdf.
URS, 2004: Climate change and infrastructure design case study: Wairau Catch-ment, North Shore City. Prepared for North Shore City Council, August 2004,26 pp. http://www.climatechange.govt.nz/resources/local-govt/case-study-wairau-catchment-aug04/case-study-wairau-catchment-aug04.pdf.
van Ittersum, M.K., S.M. Howden and S. Asseng, 2003: Sensitivity of productiv-ity and deep drainage of wheat cropping systems in a Mediterranean environmentto changes in CO2, temperature and precipitation. Agr. Ecosyst. Environ., 97,255-273.
Vic DSE, 2006:Wimmera Mallee Pipeline.Department of Sustainability and En-vironment, Victoria. http://www.dse.vic.gov.au/DSE/wcmn202.nsf/LinkView/77BBB217C2024716CA256FE2001F7B2460A84DA0F2283EA4CA256FDD00136E35.
Viney, N.R., B.C. Bates, S.P. Charles, I.T. Webster, M. Bormans and S.K. Aryal,2003: Impacts of climate variability on riverine algal blooms. Proceedings ofthe International Congress onModelling and Simulation, MODSIM 2003 14-17July, Modelling and Simulation Society of Australia and New Zealand, 23-28.http://mssanz.org.au/modsim03/Media/Articles/Vol%201%20Articles/23-28.pdf.
Voice, M., N. Harvey and K. Walsh, Eds., 2006: Vulnerability to Climate Changeof Australia’s Coastal Zone: Analysis of Gaps in Methods, Data and SystemThresholds. Report to the Australian Greenhouse Office, Department of the En-vironment and Heritage, Canberra, 120 pp. http://www.greenhouse.gov.au/im-pacts/publications/pubs/coastal-vulnerability.pdf
WA Water Corporation, 2004: Perth Seawater Desalination Project.
http://www.watercorporation.com.au/D/desalination_environment.cfm.Walsh, K., 2002: Climate change and coastal response. A Theme Report from theCoast to Coast 2002 National Conference, November, 2002.Coastal CRC, GoldCoast, Queensland, 37 pp. http://www.coastal.crc.org.au/pdf/coast2coast2002papers/climate.pdf.
Walsh, K., K. Hennessy, R. Jones, K.L. McInnes, C.M. Page, A.B. Pittock, R. Sup-piah and P. Whetton, 2001: Climate Change in Queensland Under EnhancedGreenhouse Conditions: Third Annual Report, 1999-2000.CSIRO ConsultancyReport for the Queensland Government, Aspendale, 108 pp.http://www.cmar.csiro.au/e-print/open/walsh_2001a.pdf.
Walsh, K.J.E., K.C. Nguyen and J.L. McGregor, 2004: Finer-resolution regionalclimate model simulations of the impact of climate change on tropical cyclonesnear Australia. Clim. Dynam., 22, 47-56.
Warrick, R.A., 2000: Strategies for vulnerability and adaptation assessment in thecontext of national communications. Asia-Pacific Journal for EnvironmentalDevelopment, 7, 43-51.
Warrick, R.A., 2006: Climate change impacts and adaptation in the Pacific: recentbreakthroughs in concept and practice. Confronting Climate Change: CriticalIssues for New Zealand, R. Chapman, J. Boston and M. Schwass, Eds., VictoriaUniversity Press, Wellington, 189-196.
Warrick, R.A., G.J. Kenny and J.J. Harman, Eds., 2001: The Effects of ClimateChange and Variation in New Zealand: An Assessment using the CLIMPACTSSystem. International Global Change Institute (IGCI), University of Waikato,Hamilton. http://www.waikato.ac.nz/igci/climpacts/Assessment.htm.
Wasson, R.J., I. White, B. Mackey and M. Fleming, 1988: The Jabiluka project:environmental issues that threaten Kakadu National Park. Submission to UN-ESCO World Heritage Committee delegation to Australia, 22 pp.http://www.deh.gov.au/ssd/uranium-mining/arr-mines/jabiluka/pubs/appn2ofmain.pdf.
Water Corporation, 2006: Planning for New Sources of Water. West AustralianWater Corporation. http://www.watercorporation.com.au/W/water_sources_new.cfm.
Watson, R. and A. McMichael, 2001: Global climate change – the latest assess-ment: does global warming warrant a health warning? Global Change andHuman Health, 2, 64-75.
Watters, G.M., R.J. Olson, R.C. Francis, P.C. Fiedler, J.J. Polovina, S.B. Reilly,K.Y. Aydin, C.H. Boggs, T.E. Essington, C.J. Walters and J.F. Kitchell, 2003:Physical forcing and the dynamics of the pelagic ecosystem in the eastern trop-ical Pacific: simulations with ENSO-scale and global warming climate drivers.Can. J. Fish. Aquat. Sci., 60, 1161-1175.
Waugh, S.M., H. Weimerskirch, P.J. Moore and P.M. Sagar, 1999: Population dy-namics of black-browed and grey-headed albatrosses Diomedea melanophrysandD. chrysostoma at Campbell Island, New Zealand, 1942-96. Ibis, 141, 216-225.
Wearne, L.J. and J.W. Morgan, 2001: Recent forest encroachment into sub-alpinegrasslands near Mount Hotham, Victoria, Australia. Arct. Antarct. Alp. Res., 33,369-377.
Webb, E.K., 1997:Windows onMeteorology: Australian Perspective.CSIRO Pub-lishing, Collingwood, 342 pp.
Webb, L., P. Whetton and S. Barlow, 2006: Impact on Australian viticulture fromgreenhouse-induced climate change. Bulletin of the Australian Meteorologicaland Oceanographic Society, 19, 15-17.
Weimerskirch, H., P. Inchausti, C. Guinet and C. Barbraud, 2003: Trends in birdand seal populations as indicators of a system shift in the Southern Ocean.Antarct. Sci., 15, 249-256.
Whetton, P.H., R. Suppiah, K.L. McInnes, K.J. Hennessy and R.N. Jones, 2002:Climate change in Victoria: high-resolution regional assessment of climatechange impacts. CSIRO Consultancy Report for the Department of Natural Re-sources and Environment, Victoria, 44 pp. http://www.greenhouse.vic.gov.au/climatechange.pdf.
Whinam, J. and G. Copson, 2006: Sphagnum moss: an indicator of climate changein the Sub-Antarctic. Polar Rec., 42, 43-49.
Whinam, J., G.S. Hope, B.R. Clarkson, R.P. Buxton, P.A. Alspach and P. Adam,2003: Sphagnum in peat-lands of Australasia: their distribution, utilisation andmanagement.Wetlands Ecology and Management, 11, 37-49.
White, N., R.W. Sutherst, N. Hall and P. Whish-Wilson, 2003: The vulnerabilityof the Australian beef industry to impacts of the cattle tick (Boophilus microplus)under climate change. Climatic Change, 61, 157-90.
Williams, A.A., D.J. Karoly and N. Tapper, 2001: The sensitivity of Australian
Chapter 11 Australia and New Zealand
539

Australia and New Zealand Chapter 11
540
fire danger to climate change. Climatic Change, 49, 171-191.Williams, S.E., E.E. Bolitho and S. Fox, 2003: Climate change in Australian trop-
ical forests: an impending environmental catastrophe. P. Roy. Soc. Lond. B, 270,1887-1892.
Willis, B.L., C.A. Page and E.A. Dinsdale, 2004: Coral disease on the Great Bar-rier Reef. Coral Health and Disease, E. Rosenberg and Y. Loya, Eds., Springer,Berlin, 69-104.
Winn, K.O., M.J. Saynor, M.J. Eliot and I. Eliot, 2006: Saltwater intrusion andmorphological change at the mouth of the East Alligator River, Northern Terri-tory. J. Coastal Res., 22, 137-149.
Woehler, E.J., H.J. Auman and M.J. Riddle, 2002: Long-term population increaseof black-browed albatrosses Thalassarche melanophrys at Heard Island,1947/1948–2000/2001. Polar Biol., 25, 921-927.
Woodruff, R.E., C.S. Guest, M.G. Garner, N. Becker, J. Lindesay, T. Carvan andK. Ebi, 2002: Predicting Ross River virus epidemics from regional weather data.Epidemiology, 13, 384-393.
Woodruff, R.E., S. Hales, C. Butler and A.J. McMichael, 2005: Climate ChangeHealth Impacts in Australia: Effects of Dramatic CO2 Emission Reductions.Aus-tralian Conservation Foundation and the Australian Medical Association, Can-berra, 44 pp. http://www.acfonline.org.au/uploads/res_AMA_ACF_Full_Report.pdf.
Woodruff, R.E., C.S. Guest, M.G. Garner, N. Becker and M. Lindsay, 2006: Earlywarning of Ross River virus epidemics: combining surveillance data on climateand mosquitoes. Epidemiology, 17, 569-575.
Woods, R.A. and C. Howard-Williams, 2004: Advances in freshwater sciences
and management. Freshwaters of New Zealand, J.S. Harding, M.P. Mosley, C.P.Pearson and B.K. Sorrell, Eds., New Zealand Hydrological Society and NewZealand Limnological Society, Caxton Press, Christchurch, 764 pp.
Woodward, A., S. Hales and P. Weinstein, 1998: Climate change and human healthin the Asia-Pacific region: who will be most vulnerable?Climate Res., 11, 31-38.
Woodward,A., S. Hales and N. de Wet, 2001:Climate Change: Potential Effects onHumanHealth in New Zealand.Ministry for the Environment, Wellington, 21 pp.http://www.mfe.govt.nz/publications/climate/effect-health-sep01/index. html.
Wooldridge, S., T. Done, R. Berkelmans, R. Jones and P. Marshall, 2005: Precur-sors for resilience in coral communities in a warming climate: a belief networkapproach.Mar. Ecol.-Prog. Ser., 295, 157-169.
World Tourism Organisation, 2003: Climate change and tourism. Proceedings ofthe First International Conference on Climate Change and Tourism, Djerba 9-11 April. World Tourism Organisation, Madrid, 55 pp. http://www.world-tourism.org/sustainable/climate/final-report.pdf.
Wratt, D.S., A.B. Mullan, M.J. Salinger, S. Allan, T. Morgan and G. Kenny, 2004:Climate Change Effects and Impacts Assessment: AGuidanceManual for LocalGovernment in New Zealand. New Zealand Climate Change Office, Ministryfor the Environment, Wellington, 140 pp. http://www.mfe.govt.nz/publica-tions/climate/effects-impacts-may04/effects-impacts-may04.pdf.
Yeo, S., 2003: Effects of disclosure of flood-liability on residential property val-ues. Australian Journal of Emergency Management, 18, 35-44.
Zeldis, J., J. Oldman, S. Ballara and L. Richards, 2005: Physical fluxes, pelagicecosystem structure, and larval fish survival in Hauraki Gulf, New Zealand.Can.J. Fish. Aquat. Sci., 62, 593-610.