
Unit 18 New Zealand. Map of the World Australia Australia New Zealand New Zealand.

Australia and New Zealand Banking Group Limited
ABN 11 005 357 522
Half Year
31 March 2012
Consolidated Financial Report and
Dividend Announcement
The Consolidated Financial Report and Dividend Announcement contains the information required by Appendix 4D of the Australian Securities Exchange Listing Rules. It should be read in conjunction with ANZ’s 2011 Annual Report, and is lodged with the Australian Securities Exchange under listing rule 4.2A.

RESULTS FOR ANNOUNCEMENT TO THE MARKET APPENDIX 4D
Name of Company: Australia and New Zealand Banking Group Limited ABN 11 005 357 522
Report for the half year ended 31 March 2012 Operating Results1 A$ million Operating income 2% to 8,817 Net statutory profit attributable to shareholders 10% to 2,919 Underlying profit2 6% to 2,973 Dividends Cents Franked per amount3
share per share Proposed interim dividend 66 100% Record date for determining entitlements to the proposed interim dividend 16 May 2012 Payment date for the proposed interim dividend 2 July 2012 Dividend Reinvestment Plan and Bonus Option Plan Australia and New Zealand Banking Group Limited (ANZ) has a Dividend Reinvestment Plan (DRP) and a Bonus Option Plan (BOP) that will operate in respect of the 2012 interim dividend. For the 2012 interim dividend, ANZ intends to provide shares under the DRP and BOP through the issue of new shares. The 'Acquisition Price' to be used in determining the number of shares to be provided under the DRP and BOP will be calculated by reference to the arithmetic average of the daily volume weighted average sale price of fully paid ANZ ordinary shares sold on the ASX during the seven trading days commencing on 18 May 2012 less a 1.5% discount, and then rounded to the nearest whole cent. Shares provided under the DRP and BOP will rank equally in all respects with existing fully paid ANZ ordinary shares. Election notices from shareholders wanting to commence, cease or vary their participation in the DRP or BOP for the 2012 interim dividend must be received by ANZ's Share Registrar by 5.00 pm (Australian Eastern Standard Time) on 16 May 2012. Subject to receiving effective contrary instructions from the shareholder, dividends payable to shareholders with a registered address in Great Britain (including the Channel Islands and the Isle of Man) or New Zealand will be converted to pounds sterling and New Zealand dollars respectively at an exchange rate calculated at 5.00 pm (Australian Eastern Standard Time) on 18 May 2012. There is no foreign conduit income attributed to the dividend.
1 Compared to previous corresponding period (six months ended 31 March 2011) 2 Reported profit is adjusted to exclude certain non-core items to arrive at underlying profit. The net adjustment was a gain of $54 million made up of several items.
Refer pages 80 to 83 of the ANZ Consolidated Financial Report and Dividend Announcement for the half year 31 March 2012 for further details. 3 30% tax rate

AUSTRALIA AND NEW ZEALAND BANKING GROUP LIMITED ABN 11 005 357 522
CONSOLIDATED FINANCIAL REPORT AND DIVIDEND ANNOUNCEMENT Half year ended 31 March 2012
CONTENTS PAGE
Section 1 – Media release 1
Section 2 – Financial highlights 7
Section 3 – Review of operating results 13
Section 4 – Segment review 45
Section 5 – Geographic region results 73
Section 6 – Profit reconciliation 79
Section 7 - Condensed consolidated financial statements 95
Section 8 - Supplementary information 127
Definitions 141
Alphabetical Index 144
This Consolidated Financial Report and Dividend Announcement has been prepared for Australia and New Zealand Banking Group Limited (the “Company”) together with its subsidiaries which are variously described as “ANZ”, “Group”, “ANZ Group”, “us”, “we” or “our”.
All amounts are in Australian dollars unless otherwise stated. The information on which the Condensed Consolidated Financial Statements are based has been reviewed by the Group’s auditors, KPMG. The Company has a formally constituted Audit Committee of the Board of Directors. The signing of these financial statements was approved by resolution of a Committee of the Board of Directors on 1 May 2012.
When used in this Results Announcement the words “estimate”, “project”, “intend”, “anticipate”, “believe”, “expect”, “should” and similar expressions, as they relate to ANZ and its management, are intended to identify forward-looking statements. Readers are cautioned not to place undue reliance on these forward-looking statements, which speak only as of the date hereof. ANZ does not undertake any obligation to publicly release the result of any revisions to these forward-looking statements to reflect events or circumstances after the date hereof or to reflect the occurrence of unanticipated events.

AUSTRALIA AND NEW ZEALAND BANKING GROUP LIMITED ABN 11 005 357 522
This page has been left blank intentionally
AUSTRALIA AND NEW ZEALAND BANKING GROUP LIMITED ABN 11 005 357 522
1
Media Release For Release: 2 May 2012
ANZ 2012 Half Year Result - super regional strategy delivers solid performance, higher dividend -
ANZ today announced a statutory profit after tax of $2.92 billion for the half year ended 31 March 2012. Adjusting for non-core items1 underlying profit of $2.97 billion increased 5% compared to the previous half (HOH) and 6% against the prior comparable period (PCP). The proposed interim dividend of 66 cents per share fully franked is 3% higher than 2011. ANZ has historically applied a lower payout ratio to the interim dividend.
Group Balance Sheet & Financial Highlights (all comparators Underlying and HOH)
• Profit before provisions (PBP) increased 4% driven by good results in Asia, Pacific, Europe and America (APEA) and in Institutional and New Zealand offset by subdued results in Australia impacted by continued margin pressure.
• Jaws were positive with income up 4% and costs up 3%.
• The Group net interest margin excluding Global Markets, declined 5 basis points (bps). Including Global Markets Group margins declined 6 bps. Margin improvement in New Zealand and stabilisation in APEA was offset by the impact of funding costs and deposit pricing pressure on theAustralia division (down 13 bps) and Institutional (down 6 bps).
• Lending grew 4% and deposits 5% on an FX adjusted basis.
• The Group has steadily improved the diversity of its funding base and has the smallest absolute structural funding requirement of its domestic peers. Customer funding comprises 60% of total funding. Around 80% of the FY12 wholesale term funding task is now complete.
• ANZ is strongly capitalised with Tier 1 capital at 11.3% and Common Equity Tier 1 of 8.9%.
• Return on Equity increased from 15.7% to 15.9%.
• Growth in individual provisions was largely offset by the release of corresponding collective provisions. Gross impaired assets declined 4%.
ANZ Chief Executive Officer Mike Smith said: “In an increasingly challenging environment, ANZ has produced a solid financial result in the first half that continues progress in executing our super regional strategy.
“In line with the key trends outlined at our February trading update, there were good results from outside Australia - in APEA and in New Zealand, and in the performance of Institutional with its international focus. Global Markets recovered strongly reflecting an improved trading environment, further growth in customer sales revenue and the benefits of the super regional strategy.
“In Australia, we made market share gains and customer satisfaction remained strong. Our financial performance however was subdued, significantly impacted by declining margins and the structural shift that’s occurred since the financial crisis with persistently lower demand for credit. These challenges are now an ongoing part of the Australian banking landscape and we are making progress with the decisions needed to reshape our largest business for the future.
“We continued to create opportunities across the Group based on greater diversification of revenue by customer, geography and by product. Having identified and systematically invested in capabilities, products and our presence in the region, a number of our APEA and Institutional businesses produced strong double-digit revenue growth in the half.
“These results and the other milestones we are delivering, reflect a clear and differentiated strategy. It is a strategy that is creating a strong foundation for current and future growth by responding to the more constrained environment for banking in Australia and in New Zealand, and to the significant opportunities that are available to us beyond a domestic-only focus.
1 Reported profit is adjusted to exclude certain non-core items to arrive at underlying profit. Underlying profit has been derived on a consistent basis to prior periods and full details of the adjustments are set out on pages 80 to 87 of the 2012 Half year Consolidated Financial Report and Dividend Announcement.

MEDIA RELEASE
2
“Our progress over the past four years is now allowing us to pick up the pace of execution through a focus on higher growth businesses and geographies.
“We are also accelerating changes in Australia, New Zealand and the Pacific to create simpler, more customer-focused businesses. This is being supported through stronger disciplines around the use of our operations and technology centres. This will increasingly provide us with a competitive advantage in cost and in customer service. We are also continuing to make targeted investments in new products, services and channels that respond to the changing needs of our customers.
“The bank is being managed in a way that reflects the very significant economic and political uncertainties that exist in the global economy. We have continued to minimise our reliance on short-term wholesale funding and our structural funding gap is lower than our domestic peers. This has allowed us to benefit from a more flexible and opportunistic approach to funding over the past year.
“The environment has changed permanently following the financial crisis - for banks and for all other parts of the economy including for our customers. In the near term we are managing in what could be described as a ‘work out’ phase in the global economy with the situation most acute in Europe and, to be realistic, this will continue to cause volatility in global markets for many years.
“We do recognise that adapting to this environment creates major challenges. Our recent decisions on interest rates for customers in Australia and on employment within the Group reflect the need to reshape our business. Clearly though, we need to work harder to find new ways of responding to customer and community concerns about banking and to the changes that have been brought upon the banking sector by this environment.
“We remain optimistic about Australia and New Zealand, and about the growth businesses we have created in Asia. While there is a great deal more that needs to be done at ANZ, we continued to make good progress in the first half,” Mr Smith said.
Divisional and Business Overview2
• Australia Division grew market share in all key segments. Deposit growth (up 6%) continued to be strong and lending grew 4% driven mainly by mortgages. Margin pressure from higher deposit pricing in Retail and Commercial, plus higher long-term funding costs together with persistent low demand for credit impacted profit which declined 7%. PBP decreased 5% with income down 2% and costs up 3%. Benefits from the productivity program will drive lower cost growth in the second half. Wealth profit was down 9% reflecting market conditions and negative investor sentiment due to volatile equity markets.
• APEA Division lending grew 12%, with growth in all businesses. Deposits increased 17% and the maturity profile of deposits continued to lengthen. The loan to deposit ratio sits at 58%. Profit increased 21% driven primarily by a 76% increase in Institutional business profit. Global Markets trading revenues recovered strongly and there was further growth in customer revenues (up 17%). Jaws were +5% for the period. Retail profit increased 34%. Commercial is developing well off a low base with revenue up 35%. Partnerships' profit was impacted by a reduction in the carrying value of one of the Partnership investments.
• Institutional lending volumes grew 7% (FX adjusted) with deposits up 5% (FX adjusted). Profit increased 23% with APEA delivering 63% of the growth. Income increased by 16% with customer revenues in the priority sectors of resources, agriculture and infrastructure up 3% (CAGR over past five halves 9%); Financial Institutions revenues grew 18% (equivalent CAGR 10%) and more than 870 new clients were acquired during the period. The Transaction Banking business grew profit 29% with Trade revenues up 22% globally and 45% in Asia. Global Markets income recovered (up 45%). Customer sales revenues increased 16%, with FX representing 51% of total markets sales revenues. Global Loans profit declined 8%.
• New Zealand Division’s solid performance across all business lines, strong cost management, lower provisions and a reduction in the corporate tax rate drove a profit increase of 11%. The business simplification program is progressing, delivering zero cost growth both HOH and PCP. Business momentum was maintained despite subdued economic conditions which saw lending flat but deposits up 4%. Retail profit increased 18%, Commercial rose 6% and Wealth increased 28%. Credit quality continued to improve as did margin, increasing to 2.65%.
2 All comparisons are HOH unless otherwise stated. APEA and Institutional numbers are FX adjusted. APEA is in USD with New Zealand in NZD.

MEDIA RELEASE
3
PERFORMANCE BY DIVISION3
AUSTRALIA
Overview
• Productivity initiatives, including further automation and simplification of the business and reduced staff numbers in administration and back office roles, is expected to drive a flat cost outcome in the second half of this financial year.
• ANZ has maintained its lead position relative to major peers in Main Financial Institution Customer Satisfaction (MFI).
• Share of household deposits has grown consistently over the past three years and grew at 12.7% in the year to end March, driving an increase in market share.
• Annual growth in housing lending was slightly better than system at 8.2%.
• Credit quality in the mortgage book continues to improve with 4.4% of the portfolio on a dynamic loan to value ratio above 90% today, compared to 6.6% in September 2008 despite softening in property values across the market. Mortgage delinquencies have continued to decline.
• Commercial grew market share (up 110 bps since June 2011, up 70 bps in the half)4 through growth in the share and size of customers, and stronger share of wallet. Customer numbers increased by just over 12,000 year-to-date across all segments – primarily in Small Business Banking (SBB) and also in Regional Commercial and Business Banking.
Divisional Results
• Lending increased 4% with customer deposits up 6%. Retail lending growth came mainly from Mortgages, up 5%, with deposits also increasing 5%. Commercial lending grew at system, up 3%, despite high levels of customer pay-down across the book. Business Bank lending was up 4%, Regional Commercial up 1% and SBB up 6%. Commercial deposits increased 3% with good growth in SBB and Regional Commercial.
• Income was heavily impacted by a 13 basis point reduction in margins which was driven by the competitive pricing of deposits in Retail and Commercial and higher wholesale funding costs. Together with cost growth of 3%, which reflected seasonal factors including October wage increases as part of ANZ’s Enterprise Bargaining Agreement and the funding of restructuring costs, this saw PBP down 5%. Profit decreased 7%.
• Retail and Commercial improved share of wallet and market share during the period. Margin pressure was the key driver of income declining 4% in Retail; expenses were up 2%. Commercial business income increased 1%, while costs grew 4%.
• Wealth profit was 9% lower reflecting subdued market conditions and negative investor sentiment due to volatile equity markets. Funds under Management grew 4%. Good growth in insurance income was somewhat offset by adverse claims and life lapse rate experience.
• Credit quality remains strong. The provision charge increased slightly with lower individual provisions offset by a lower collective provision release. The second half 2011 included higher releases of surplus flood provisions.
ASIA PACIFIC, EUROPE & AMERICA (all figures USD)
Overview
• Connectivity is increasingly a key competitive differentiator for ANZ. Over and above the 16% of Group revenue booked in APEA, 4% of Group income reported in Australia and New Zealand comes from APEA managed clients.
• In Asia, ‘active’ customers in the Institutional business grew 9% HOH.
• Retail is being shaped to target affluent and emerging-affluent customers. This has led to ongoing adjustments of the portfolio away from non-core segments and driven a product concentration in deposits and mortgages. Within the Wealth business, insurance and investment products are our core offerings.
3 All comparisons are 1st Half FY12 to 2nd Half FY11 (HOH) unless otherwise indicated 4 DBM Business Financial Services Monitor, Commercial Banking market share

MEDIA RELEASE
4
• In March, ANZ became the first Australian bank to receive a Retail Renminbi (RMB) license,
becoming the first Australian bank to be fully licensed to offer a range of RMB-related products and services to local citizens in China.
• The loan to deposit ratio is 58%. The quality of the deposit base continues to improve and assets are being managed to maintain flexibility during periods of market uncertainty.
• ANZ was ranked a Top 5 corporate bank in Asia in the 2012 Greenwich Associates Survey; four years ago ANZ ranked outside the top 20. ANZ was also awarded the International Financing Review Asia Awards for 2011 for Loan House of the Year and Loan of the Year.
Divisional Results
• Customer deposits grew 17% with lending up 12%. There was strong growth in both Retail up 16% and Institutional deposits up 17%.
• Profit grew 21% driven by Institutional profit growth of 76% which included strong contributions from Global Markets and Transaction Banking.
• PBP increased 19%. Jaws were strongly positive with income up 11% and expenses increasing 6%. We are capturing productivity improvements generated through headcount management coupled with disciplined investment spend. A focus on well-managed costs is allowing us to continue investment in long-term business infrastructure.
• Institutional revenues increased 29% with Global Markets income up 45% reflecting a recovery in Global Markets trading income (up 120%) while customer sales income increased 17%. In Transaction banking, Trade Finance revenues increased 37% and Cash Management income rose 14%.
• Retail profit increased 34%. Revenue increased 4%, supported by the strategic sale of a credit card portfolio, with expenses also up 4% driven largely by investments in customer systems. Momentum built during the second quarter as market conditions improved.
• Commercial is growing well off a small base with revenue up 35%; 84% of income came from cash, trade and markets products.
• Partnerships profit fell 29% largely due to an impairment charge relating to the carrying value of ANZ’s investment in Saigon Securities Incorporated in Vietnam.
• Margins were reasonably stable (up 3 bps including Global Markets, down 3 bps excluding Markets) with higher deposit and funding costs largely offset by asset repricing in the Institutional business.
• Provision charges decreased 30%. Recoveries continued to be made in Retail within the previously RBS-owned portfolios while all businesses have continued to improve the general quality of the loan portfolios.
INSTITUTIONAL (all figures FX adjusted)
Overview
• ANZ’s super regional focus is driving greater connectivity across the business and greater diversity of profit contribution by customer, product and geography. APEA revenues (up 28%) now represent 29% of total revenue (20% in 2010), with Australia 62% and New Zealand 9%.
• Client numbers grew in all regions with more than 870 new clients added during the half, up ~4% (Asia Pacific client base up ~6%, New Zealand up 2% and Australia up 1%).
Divisional Results
• Customer deposits grew 5%, including an 18% increase in APEA, which now represents 46% of the customer deposits. Lending increased 7%. APEA lending, which is weighted toward shorter dated trade lending, now comprises 34% of the loan portfolio.
• Profit increased 23% underpinned by earnings growth in Global Markets and Transaction Banking, in priority products like Foreign Exchange (FX), Capital Markets, Cash and Trade and customer segments including Resources, Agribusiness and Financial Institutions.
• Income increased 16% with customer revenues up 7%, while expenses increased 3% reflecting the benefits of productivity initiatives in 2011. Customer service is being improved through centralising, standardising and automating back office processes.

MEDIA RELEASE
5
• Transaction Banking profit increased 29% with Trade revenues up 22% and Cash Management
up 9%. Global loans profit declined 8% reflecting increased pricing competition impacting margins during the latter stages of the first half.
• The volatile market conditions of late FY11, which saw both Trading and Balance Sheet incomes decline significantly, eased during the half assisting a recovery in Global Markets profit. Customer sales revenues continued to grow at record levels, up 16% with FX revenues up 14%, FX sales now comprise 51% of Global Markets sales revenues. Customer sales income grew strongly in Australia and New Zealand up 15% and 19% respectively to represent around two thirds of Markets income in both geographies.
• Margins decreased 6 bps including Global Markets (10 bps excluding Global Markets) largely impacted by margin pressure in the Global Loans business with asset pricing tightening particularly later in the period.
• Weighted average credit ratings across the loan portfolio have continued to improve. The provision charge increased reflecting higher individual provision charges partly offset by collective provision releases. The individual provision charge also reflects the settlement of Primebroker Securities litigation during the half.
NEW ZEALAND (all figures in NZD)
Overview
• The business simplification program is progressing, delivering some early cost improvements (zero cost growth both HOH and PCP). The cost to income ratio for the business has declined by around 1.5% over the past year.
• Core system testing is progressing with migration to a single platform which is expected to assist productivity gains in 2013.
• The product portfolio continues to be simplified and to date products in the Retail business have been reduced from 140 to around 100.
• Customer satisfaction and staff engagement remain at high levels, reflecting the careful management of the change program.
Divisional Results
• Profit increased 11% assisted by a 14% reduction in the provision charge and a reduction in the corporate tax rate effective from 1 October 2011. PBP growth of 5% reflected strong cost control (expenses flat) and income growth of 3% largely coming from margin improvement.
• The subdued economic environment saw lending flat with customers in both Retail and Commercial continuing to deleverage. Deposit growth was good, up 4%, with Commercial deposits increasing 7%.
• Retail profit increased 18% driven by income growth of 3%, no expense growth and lower provisions (-30%).
• Commercial profit increased 6% with subdued income growth (up 1%), flat expenses and provisions down 8%. Deleveraging by customers continued across the commercial sector in particular among customers in the agricultural sector.
• Wealth profit grew 28% with good expense control (down 9%) and income growth of 5%, driven by improved claims experience and lapse rate improvements, partly offset by lower earnings from the property business which was divested in the second half of 2011.
• Margins improved 12 bps during the half driven by product mix benefits coupled with disciplined deposit pricing. It is expected though, that funding cost pressures and deposit price competition will begin to place pressure on margins in the second half.
• The provision charge decreased 14% reflecting continued improvement in credit quality.
BALANCE SHEET, CAPITAL AND FUNDING
ANZ’s approach to balance sheet management and efficiency, combined with the size of its domestic lending book has resulted in a structural funding task that is at the lower end of domestic peer banks. A smaller annual wholesale funding task relative to domestic peers allows us to take a more flexible approach to raising funding.

MEDIA RELEASE
6
The FY12 wholesale funding task is now ~80% completed with $15.3 billion of term debt issued, at an average tenor of just over five years, spread across a diverse range of instruments (senior, covered bonds and subordinated debt), currencies ($A, $US, €, Yen, CHF & NOK) and tenors (three to ten years). Domestic term debt issuance continued to increase and represents 44% of FY12 issuance, up from 27% in FY09.
ANZ’s super regional strategy is transitioning to a balance sheet that will, over time, increasingly resemble regional rather than domestic peers. This is driving an improving loan to deposit ratio for the Group.
The liquidity position of the Group remains strong which is reflected in the continued low reliance on offshore short-term wholesale debt and the strengthening of the liquid asset position which now stands at $98.5 billion. This figure significantly exceeds the Group's total offshore wholesale borrowings.
The Group has continued to strengthen its capital base and is well placed to transition to Basel III standards. As at 31 March 2012, the Common Equity Tier 1 ratio was 8.9% and the Tier 1 ratio was 11.3%. Under Basel III, ANZ's Common Equity Tier 1 ratio would be 9.8% on a fully harmonised basis and 7.8% under APRA Basel III.
CREDIT QUALITY
Credit quality has continued to stabilise. The total underlying provision charge was $565 million, up 3% HOH (down 14% PCP). Provisions remain in line with expectations, including movement between the individual and collective provision charges largely related to issues arising in prior periods (including legacy issues and natural disaster provisions).
Despite an increase in new impaired assets, gross impaired assets reduced by 4% reflecting the continued progress in working through legacy exposures. Growth in new impaired assets was primarily due to the inclusion of two Institutional customers.
ANZ has continued to take a prudent approach to provisioning and remains appropriately provided for at this point of the economic cycle. The Group’s coverage ratios reflect this, with the total provision coverage ratio at 1.88%5 and the collective provision ratio 1.20%5.
For media enquiries contact:
Paul Edwards Group GM, Corporate Communications Tel: +61-3-8654 9999 or +61-434-070101 Email: [email protected]
Stephen Ries Senior Manager, Media Relations Tel: +61-3-8654 3659 or +61-409-655551 Email: [email protected]
For investor and analyst enquiries contact:
Jill Craig Group GM, Investor Relations Tel: +61-3-8654 7749 or +61-412-047448 Email: [email protected]
Ben Heath Senior Manager, Investor Relations Tel: +61-3-8654 7793 or +61-435-655033 Email: [email protected]
5 Total provision coverage is the individual provision plus the collective provision as a percentage of credit risk weighted assets (CRWA). Collective Provision ratio is the collective provisions as a percentage of CRWA.

FINANCIAL HIGHLIGHTS
7
CONTENTS Section 2 – Financial highlights
Profit
Underlying profit
Pro forma excluding exchange rate movements
Key financial indicators
Earnings per share
Share dividends
Profitability ratios
Efficiency ratios
Credit impairment provisioning
Capital adequacy ratio
Balance sheet – Key items
Impaired assets
Net tangible assets
Other information
Divisional performance

FINANCIAL HIGHLIGHTS
8
Profit
Half Year Movement
Mar 12 $M
Sep 11 $M
Mar 11 $M
Mar 12 v. Sep 11
Mar 12 v. Mar 11
Net interest income
5,984 5,837 5,646 3% 6%
Other operating income
2,833 2,490 2,959 14% -4%
Operating income
8,817 8,327 8,605 6% 2%
Operating expenses
(4,133) (3,997) (4,026) 3% 3%
Profit before credit impairment and income tax
4,684 4,330 4,579 8% 2%
Provision for credit impairment
(538) (562) (675) -4% -20%
Profit before income tax
4,146 3,768 3,904 10% 6%
Income tax expense
(1,223) (1,074) (1,235) 14% -1%
Non-controlling interests
(4) (3) (5) 33% -20%
Profit attributable to shareholders of the Company
2,919 2,691 2,664 8% 10%
Non-IFRS information
The Group provides three additional measures of performance in the Results Announcement which are prepared on a basis other than in accordance with the accounting standards; namely underlying profit, pro forma information and economic profit. The guidance provided in Australian Securities and Investments Commission Regulatory Guide 230 has been followed when presenting this information. Throughout this document, figures and ratios that are calculated on an ‘underlying’ basis have been shaded to distinguish them from figures calculated on a statutory basis. Pro forma results (refer page 9) have also been provided and have been shaded in a lighter colour.
Underlying profit
Reported profit has been adjusted to exclude certain non-core items to arrive at underlying profit, and has been provided to assist readers to understand the result for the ongoing business activities of the Group. Underlying profit has been derived on a consistent basis to prior periods. Underlying profit is not subject to audit review. However, the adjustments made in arriving at underlying earnings are included in statutory profit, and are therefore subject to review within the context of the Group condensed financial statements audit review. The external auditor has informed the Audit Committee that the adjustments are based on the guidelines released by the Australian Institute of Company Directors (AICD) and the Financial Services Institute of Australasia (FINSIA), and are consistent with prior period adjustments. Refer pages 80 to 83 for further details regarding the definition of underlying profit and an explanation of adjustments.
Half Year Movement
Mar 12
$M Sep 11
$M Mar 11
$M Mar 12
v. Sep 11 Mar 12
v. Mar 11
Statutory profit attributable to shareholders of the Company 2,919 2,691 2,664 8% 10%
Adjustments between statutory profit and underlying profit 54 143 154 -62% -65%
Underlying profit 2,973 2,834 2,818 5% 6%
Half Year Movement
Mar 12
$M Sep 11
$M Mar 11
$M Mar 12
v. Sep 11 Mar 12
v. Mar 11 Net interest income 5,984 5,839 5,642 2% 6%
Other operating income 2,720 2,543 2,788 7% -2%
Operating income
8,704 8,382 8,430 4% 3%
Operating expenses (4,020) (3,897) (3,821) 3% 5%
Profit before credit impairment and income tax 4,684 4,485 4,609 4% 2%
Provision for credit impairment (565) (551) (660) 3% -14%
Profit before income tax 4,119 3,934 3,949 5% 4%
Income tax expense (1,142) (1,096) (1,126) 4% 1%
Non-controlling interests (4) (4) (5) 0% -20%
Underlying profit 2,973 2,834 2,818 5% 6%

FINANCIAL HIGHLIGHTS
9
Pro forma profit
The pro forma results (unaudited) have been adjusted for exchange rate movements which have impacted the current half year results. This analysis enables readers to understand the estimated growth rates of the ongoing business performance of the Group, adjusted for the financial impact of exchange rates.
Refer pages 28 for further details of exchange rate movements. Half Year Movement
Mar 12 $M
Sep 11 $M
Mar 11 $M
Mar 12 v. Sep 11
Mar 12 v. Mar 11
Underlying profit 2,973 2,834 2,818 5% 6%
Foreign exchange adjustments n/a (17) 5 n/a n/a
Pro forma profit 2,973 2,817 2,823 6% 5%
Half Year Movement
Mar 12 $M
Sep 11 $M
Mar 11 $M
Mar 12 v. Sep 11
Mar 12 v. Mar 11
Net interest income 5,984 5,849 5,647 2% 6%
Other operating income 2,720 2,510 2,773 8% -2%
Operating income 8,704 8,359 8,420 4% 3%
Operating expenses (4,020) (3,899) (3,802) 3% 6%
Profit before credit impairment and income tax 4,684 4,460 4,618 5% 1%
Provision for credit impairment (565) (552) (659) 2% -14%
Profit before income tax 4,119 3,908 3,959 5% 4%
Income tax expense (1,142) (1,087) (1,131) 5% 1%
Non-controlling interests (4) (4) (5) 0% -20%
Pro forma profit 2,973 2,817 2,823 6% 5%

FINANCIAL HIGHLIGHTS
10
Financial ratios - Profit and Loss
Earnings per ordinary share (cents) Half Year Movement
Reference
Page Mar 12
Sep 11
Mar 11
Mar 12
v. Sep 11 Mar 12
v. Mar 11
Basic 109 110.8 104.0 104.2 7% 6%
Diluted 109
106.2 99.3 101.2 7% 5%
Underlying1 29 112.2 108.8 109.6 3% 2%
Half Year
Ordinary share dividends (cents) Reference
Page
Mar 12 Sep 11 Mar 11
Interim - 100% franked (Mar 2011: 100% franked) 30 66 n/a 64
Final - 100% franked (Sep 2011: 100% franked) 30 n/a 76 n/a
Ordinary share dividend payout ratio2 30 60.8% 74.6% 62.5%
Underlying ordinary share dividend payout ratio1,2 30 59.7% 70.8% 59.1%
Preference share dividend ($M)
Dividend paid3 7 6 6
Profitability ratios
Return on:
Average ordinary shareholders' equity4 15.6% 14.9% 15.8%
Average ordinary shareholders' equity (underlying)1,4 15.9% 15.7% 16.7%
Average assets 0.97% 0.93% 0.97%
Average assets (underlying)1 0.98% 0.98% 1.02%
Total income 16.0% 15.0% 14.8%
Net interest margin 16 2.38% 2.44% 2.47%
Net interest margin (excluding Global Markets) 16 2.75% 2.80% 2.81%
Underlying profit per average FTE ($) 61,300 59,247 60,928
Efficiency ratios
Operating expenses to operating income 46.9% 48.0% 46.8%
Operating expenses to average assets 1.37% 1.38% 1.45%
Operating expenses to operating income (underlying)1 46.2% 46.5% 45.3%
Operating expenses to average assets (underlying)1 1.33% 1.35% 1.38%
Operating expenses to operating income (pro forma)5 46.2% 46.6% 45.2%
Credit impairment provisioning/(release)
Collective provision charge/(release) ($M) 24 (152) (58) 65
Individual provision charge ($M) 23 690 620 610
Total provision charge ($M) 23 538 562 675
Individual provision charge as a % of average net advances 0.34% 0.32% 0.32%
Total provision charge as a % of average net advances 0.27% 0.29% 0.35%
Underlying collective provision charge/(release) ($M) 24 (152) (58) 66
Underlying individual provision charge ($M) 23 717 609 594
Total underlying provision charge ($M) 23 565 551 660
Individual provision charge as a % of average net advances
0.36% 0.31% 0.32%
Total provision charge as a % of average net advances 0.28% 0.28% 0.35%
Credit risk on derivatives - credit intermediation trade related gain/(loss) ($M)
83 52 (51) 55
1. Adjusted to exclude certain non-core items to reflect results for the ongoing business activities of the Group. Refer pages 80 to 83 for an explanation of adjustments
2. Dividend payout ratio is calculated using the 31 March 2011 interim, 30 September 2011 final and the proposed 31 March 2012 interim dividends 3. Represents dividends paid on Euro Trust Securities issued on 13 December 2004 4. Average ordinary shareholders’ equity excludes non-controlling interests and preference shares 5. Adjusted for the impact of exchange rate movements. Refer pages 28 for further details

FINANCIAL HIGHLIGHTS
11
Financial ratios - Balance Sheet
As at Movement
Reference Page
Mar 12 Sep 11 Mar 11
Mar 12 v. Sep 11
Mar 12 v. Mar 11
Capital adequacy ratio (%)
Common Equity Tier 1 36 8.9% 8.5% 8.5%
Tier 1 36 11.3% 10.9% 10.5%
Tier 2 36 1.3% 1.2% 1.6%
Total capital ratio 36 12.6% 12.1% 12.1%
Credit risk weighted assets ($B) 41 250.2 248.8 233.2 1% 7%
Total risk weighted assets ($B) 41 284.8 280.0 264.2 2% 8%
Balance Sheet: Key Items
Net loans and advances including acceptances ($B) 412.6 397.3 379.4 4% 9%
Total assets ($B) 603.2 594.5 537.4 1% 12%
Customer deposits ($B) 308.3 296.8 267.3 4% 15%
Total equity ($B) 39.4 38.0 35.1 4% 12%
Impaired assets
Gross impaired assets ($M) 26 5,343 5,581 6,221 -4% -14%
Net impaired assets ($M) 26 3,629 3,884 4,504 -7% -19%
Net impaired assets as a % of net advances 0.88% 0.98% 1.19% -10% -26%
Net impaired assets as a % of shareholders' equity 9.2% 10.2% 12.8% -10% -28%
Individual provision ($M)
111
1,714 1,697 1,717 1% 0%
Individual provision as a % of gross impaired assets 32.1% 30.4% 27.6% 6% 16%
Collective provision ($M) 111
2,994 3,176 3,177 -6% -6%
Collective provision as a % of credit risk weighted assets 1.20% 1.28% 1.36% -6% -12%
Net Assets
Net tangible assets per ordinary share ($)1 11.74 11.44 10.61 3% 11%
Net tangible assets attributable to ordinary shareholders ($B)1 31.5 30.1 27.6 5% 14%
Other information
Full time equivalent staff (FTE) 48,348 49,099 48,620 -2% -1%
Assets per FTE ($M) 12.5 12.1 11.1 3% 13%
Share price
- high2 $23.68 $24.49 $25.96 -3% -9%
- low2 $18.60 $17.63 $22.05 6% -16%
- closing
$23.26 $19.52 $23.81 19% -2%
Market capitalisation of ordinary shares ($B)3 62.3 51.3 61.8 21% 1%
1. Equals shareholders’ equity less preference share capital, non-controlling interests, goodwill and other intangibles 2. For the half year 3. As at period end

FINANCIAL HIGHLIGHTS
12
Divisional performance
Half Year Movement
Profit after tax
Mar 12 $M
Sep 11 $M
Mar 11 $M
Mar 12 v. Sep 11
Mar 12 v. Mar 11
Australia 1,365 1,464 1,350 -7% 1%
Asia Pacific, Europe & America 419 352 388 19% 8%
Institutional 1,123 915 1,081 23% 4%
New Zealand 397 355 362 12% 10%
Group Centre (24) (93) (108) -74% -78%
Less: Institutional Asia Pacific, Europe & America (307) (176) (250) 74% 23%
Pro forma profit after tax 2,973 2,817 2,823 6% 5%
Foreign exchange adjustments n/a 17 (5) n/a n/a
Underlying profit after tax 2,973 2,834 2,818 5% 6%
Adjustments between statutory profit and underlying profit (54) (143) (154) -62% -65%
Profit attributable to shareholders of the Company
2,919 2,691 2,664 8% 10%
As at ($B) Movement
Net loans & advances including acceptances Mar 12 Sep 11 Mar 11 Mar 12
v. Sep 11 Mar 12
v. Mar 11
Australia 241.5 231.2 224.9 4% 7%
Asia Pacific, Europe & America 40.7 38.8 30.9 5% 32%
Institutional 95.8 91.5 84.3 5% 14%
New Zealand 68.2 68.2 65.1 0% 5%
Group Centre (0.8) (0.8) (0.8) 0% 0%
Less: Institutional Asia Pacific, Europe & America (32.8) (31.6) (25.0) 4% 31%
Net loans & advances including acceptances by division 412.6 397.3 379.4 4% 9%
Customer deposits Australia 135.9 128.5 121.1 6% 12%
Asia Pacific, Europe & America 70.8 64.8 52.8 9% 34%
Institutional 119.9 118.0 99.3 2% 21%
New Zealand 41.2 39.5 37.6 4% 10%
Group Centre1 (4.7) (4.0) (3.4) 18% 38%
Less: Institutional Asia Pacific, Europe & America (54.8) (50.0) (40.1) 10% 37%
Customer deposits by division 308.3 296.8 267.3 4% 15%
Adjusted for foreign exchange movements
Net loans & advances including acceptances
Australia 241.5 231.2 224.9 4% 7%
Asia Pacific, Europe & America 40.7 36.4 32.8 12% 24%
Institutional 95.8 89.5 86.1 7% 11%
New Zealand 68.2 68.3 69.5 0% -2%
Group Centre (0.8) (0.8) (0.8) 0% 0%
Less: Institutional Asia Pacific, Europe & America (32.8) (29.5) (26.5) 11% 24%
Net loans & advances including acceptances by division
412.6 395.1 386.0 4% 7%
Customer deposits
Australia
135.9 128.5 121.1 6% 12%
Asia Pacific, Europe & America 70.8 60.5 56.6 17% 25%
Institutional 119.9 114.5 102.8 5% 17%
New Zealand 41.2 39.6 40.1 4% 3%
Group Centre1 (4.7) (4.0) (3.3) 18% 42%
Less: Institutional Asia Pacific, Europe & America (54.8) (46.5) (43.0) 18% 27%
Customer deposits by division
308.3 292.6 274.3 5% 12%
1. Includes elimination of OnePath Australia investments in ANZ deposit products

REVIEW OF OPERATING RESULTS
13
CONTENTS Section 3 – Review of Operating Results
Review of Group results
Income and expenses
Credit risk
Income tax expense
Impact of exchange rate movements/revenue hedges
Earnings per share
Dividends
Economic Profit
Condensed balance sheet
Liquidity risk
Capital management
Deferred acquisition costs and deferred income
Software capitalisation

REVIEW OF OPERATING RESULTS
14
Review of Group results Profit
Half Year Movement
Mar 12 $M
Sep 11 $M
Mar 11 $M
Mar 12 v. Sep 11
Mar 12 v. Mar 11
Net interest income
5,984 5,837 5,646 3% 6%
Other operating income
2,833 2,490 2,959 14% -4%
Operating income
8,817 8,327 8,605 6% 2%
Operating expenses
(4,133) (3,997) (4,026) 3% 3%
Profit before credit impairment and income tax
4,684 4,330 4,579 8% 2%
Provision for credit impairment
(538) (562) (675) -4% -20%
Profit before income tax
4,146 3,768 3,904 10% 6%
Income tax expense
(1,223) (1,074) (1,235) 14% -1%
Non-controlling interests
(4) (3) (5) 33% -20%
Profit attributable to shareholders of the Company
2,919 2,691 2,664 8% 10%
Non-IFRS information
The Group provides three additional measures of performance in the Results Announcement which are prepared on a basis other than in accordance with the accounting standards; namely underlying profit, pro forma information and economic profit. The guidance provided in Australian Securities and Investments Commission Regulatory Guide 230 has been followed when presenting this information.
Underlying profit
Reported profit has been adjusted to exclude certain non-core items to arrive at underlying profit, and has been provided to assist readers to understand the result for the ongoing business activities of the Group. Underlying profit has been derived on a consistent basis to prior periods. Underlying profit is not subject to audit review. However, the adjustments made in arriving at underlying earnings are included in statutory profit, and are therefore subject to review within the context of the Group condensed financial statements audit review. The external auditor has informed the Audit Committee that the adjustments are based on the guidelines released by the Australian Institute of Company Directors (AICD) and the Financial Services Institute of Australasia (FINSIA), and are consistent with prior period adjustments. Refer pages 80 to 83 for further details regarding the definition of underlying profit and an explanation of adjustments.
Half Year Movement
Mar 12
$M Sep 11
$M Mar 11
$M Mar 12
v. Sep 11 Mar 12
v. Mar 11
Statutory profit attributable to shareholders of the Company 2,919 2,691 2,664 8% 10%
Adjustments between statutory profit and underlying profit 54 143 154 -62% -65%
Underlying profit 2,973 2,834 2,818 5% 6%
Refer pages 84 to 85 within Profit Reconciliation for a detailed reconciliation of statutory profit to underlying profit.
Half Year Movement
Mar 12 $M
Sep 11 $M
Mar 11 $M
Mar 12 v. Sep 11
Mar 12 v. Mar 11
Net interest income 5,984 5,839 5,642 2% 6%
Other operating income 2,720 2,543 2,788 7% -2%
Operating income 8,704 8,382 8,430 4% 3%
Operating expenses (4,020) (3,897) (3,821) 3% 5%
Profit before credit impairment and income tax 4,684 4,485 4,609 4% 2%
Provision for credit impairment (565) (551) (660) 3% -14%
Profit before income tax 4,119 3,934 3,949 5% 4%
Income tax expense (1,142) (1,096) (1,126) 4% 1%
Non-controlling interests (4) (4) (5) 0% -20%
Underlying profit 2,973 2,834 2,818 5% 6%

REVIEW OF OPERATING RESULTS
15
Pro forma profit
To enhance the understanding and comparability of financial information between reporting periods, ‘Pro forma’ information has been prepared. The pro forma results are based on underlying profit adjusted to exclude the impact of exchange rate movements.
Details of the impact of exchange rate movements are on pages 28.
Pro forma adjustments Half Year Movement
Mar 12 $M
Sep 11 $M
Mar 11 $M
Mar 12 v. Sep 11
Mar 12 v. Mar 11
Underlying profit 2,973 2,834 2,818 5% 6%
Foreign exchange adjustments n/a (17) 5 n/a n/a
Pro forma profit 2,973 2,817 2,823 6% 5%
Pro forma profit Half Year Movement
Mar 12 $M
Sep 11 $M
Mar 11 $M
Mar 12 v. Sep 11
Mar 12 v. Mar 11
Net interest income 5,984 5,849 5,647 2% 6%
Other operating income 2,720 2,510 2,773 8% -2%
Operating income 8,704 8,359 8,420 4% 3%
Operating expenses (4,020) (3,899) (3,802) 3% 6%
Profit before credit impairment and income tax 4,684 4,460 4,618 5% 1%
Provision for credit impairment (565) (552) (659) 2% -14%
Profit before income tax 4,119 3,908 3,959 5% 4%
Income tax expense (1,142) (1,087) (1,131) 5% 1%
Non-controlling interests (4) (4) (5) 0% -20%
Pro forma profit 2,973 2,817 2,823 6% 5%
March 2012 half year compared to September 2011 half year
Growth in the Group’s income was a result of a 4% increase in average interest earning assets (excluding Global Markets) and a 45% increase in the revenue in Global Markets following the difficult market conditions in the September 2011 half. This was partly offset by a reduction in net interest margin (excluding Global Markets) of 5 basis points reflecting increased competition for retail deposits in Australia together with higher funding costs.
Operating expenses increased 3% principally from 7% growth in APEA driven by targeted investments in frontline staff and systems. Institutional and Australia Division were more constrained at 3%. Costs in New Zealand were flat reflecting the productivity gains from simplifying the business.
The provision for credit impairment increased 2% as a result of increased individual provisions in Institutional, mainly due to lower recoveries and writebacks, and a 4% rise in Australia. There were improvements in the New Zealand and APEA portfolios. Release of certain economic cycle and concentration risk adjustments, where associated losses had crystallised into individual provisions. March 2012 half year compared to March 2011 half year
A 3% increase in operating income was driven by a 7% growth in average interest earning assets excluding Global Markets, partly offset by a 6 basis point reduction in margins (excluding Global Markets) and lower Wealth and Partnership income.
Operating expenses increased 6% with growth primarily in APEA, up 14% as a result of targeted investments in frontline staff and systems. Institutional increased 9% with increased investment in the APEA region, higher amortisation from the investment in technology and restructuring costs. Australia costs increased 3% with higher staff costs.
The decrease in provision for credit impairment was mainly due to the March 2011 half including provisions for the Queensland and Victorian floods.

REVIEW OF OPERATING RESULTS
16
Income and expenses Net interest income
Half Year Movement
Net interest income reconciliation Mar 12
$M Sep 11
$M Mar 11
$M Mar 12
v. Sep 11 Mar 12
v. Mar 11
Pro forma net interest income 5,984 5,849 5,647 2% 6%
Foreign exchange adjustments n/a (10) (5) n/a n/a
Underlying net interest income 5,984 5,839 5,642 2% 6%
Adjustments between statutory and underlying net interest income - (2) 4 -100% -100%
Net interest income 5,984 5,837 5,646 3% 6%
Group
Net interest income 5,984 5,837 5,646 3% 6%
Average interest earning assets 502,138 476,814 458,029 5% 10%
Net interest margin (%) 2.38 2.44 2.47 -2% -4%
Group (excluding Global Markets) Net interest income 5,642 5,517 5,353 2% 5%
Average interest earning assets 410,915 393,789 382,990 4% 7%
Net interest margin (%) 2.75 2.80 2.81 -2% -2%
March 2012 v September 2011
The major contributors to the growth in average interest earnings assets and average deposits and other borrowings include:
Average interest earning assets
Movement
+$10.9b 3% Australia geography
+$6.8b 4% Mortgages – growth in net advances reflecting continued, modest customer demand for variable rate lending
+$4.6b 5% Growth in corporate customer lending across Commercial, Transaction Banking, and Global Loans business
+$0.6b 30% Treasury – increase in reverse repo and interbank lending
-$1.1b -3% Markets – mainly lower trading securities
+$13.6b 20% Asia Pacific, Europe & America geography
+$4.1b 49% America – growth in deposits placed with Federal Reserve
+$3.9b 16% Singapore / Hong Kong – growth in trade and corporate loans, along with increased investment in Government Securities due to regulatory requirements
+$3.7b 32% Growth in lending and Government securities including UK / Europe and Japan
+$1.9b Others – including increased lending in Indonesia and India
-$0.1b 0% New Zealand geography – decline in Rural lending
+$1.0b 0% Foreign exchange rate movements
+$25.3b 5% Movement in total average interest earning assets (incl. exchange rate movement)
Average deposits and other borrowings
Movement
+$16.8b 7% Australia geography
+$10.5b 20% Treasury - higher Certificates of Deposit and Commercial Paper with a higher short term funding mix during half
+$3.5b 5% Banking Products - uplift from core customer demand deposits
+$2.8b 3% Others including Commercial Banking due to growth in customer deposits
+$7.3b 11% Asia Pacific, Europe & America geography
+$7.3b 11% Deposit raising strategies in UK / US combined with organic growth in Asia mainly in institutional businesses
+$0.5b 1% New Zealand geography – uplift in customer deposits in Business Banking
+$1.3b 0% Foreign exchange rate movements
+$25.9b 7% Movement in total average deposits and other borrowings (incl. exchange rate movement)

REVIEW OF OPERATING RESULTS
17
Income and expenses, cont’d
Net interest income, cont’d
March 2012 half year compared to September 2011 half year, cont’d
The main drivers of the movement in net interest margin include:
Movement
-5 bps Deposit costs – Effects of strong competition on retail deposits in Australia business
-2 bps
-1 bps
+1 bps
+2 bps
Funding costs – Increase in wholesale funding costs Funding & Asset mix – Mainly due to negative asset mix impacts with an increase in lower margin Institutional Trade Loans and greater growth in the lower spread APEA region Assets – Benefits from repricing actions on Institutional Trade Loans and NZ Businesses lending partly offset by continued margin compression in Housing Loans in Australia Other – Includes higher recovery from impaired assets and other minor impacts
-5 bps Movement in Group (Ex Markets)
-1 bps Global Markets – Lower earnings on trading and investment securities and balance sheet lending, combined with negative dilution impact
-6 bps Movement in Group NIM
March 2012 v March 2011
The major contributors to the growth in average interest earning assets and average deposits and other borrowings include
Average interest earning assets
Movement
+$18.6b 6% Australia geography
+$11.5b 7% Mortgages – growth in net advances reflecting continuing customer demand for variable rate lending
+$2.5b 5% Commercial – growth in customer lending
+$2.5b 5% Growth in customer lending in Global Loans business
+$1.2b 3% Markets – growth in trading securities
+$0.8b Others
+$26.1b 46% Asia Pacific, Europe & America geography
+$6.4b Large America – higher deposits placed with the Federal Reserve due to surplus liquidity
+$6.0b 49% Singapore – higher Trading & Investment securities due to regulatory requirements and increase in customer lending
+$4.1b 39% Taiwan / Hong Kong – growth in lending assets with institutional customers
+$3.8b 37% China / UK / Europe - growth in domestic lending and trading and investment securities
+$3.2b 90% Japan – growth in deposits placed with Reserve bank due to higher available liquidity
+$2.6b Others – including increased lending in Indonesia and India
-$0.4b -1% New Zealand geography – growth in trading securities offset by decline in Rural lending
-$0.2b 0% Foreign exchange rate movements
+$44.1b 10% Movement in total average interest earning assets (incl. exchange rate movement)
Average deposits and other borrowings
Movement
+$31.7b 15% Australia geography
+$14.3b 30% Treasury - shift in funding mix to Commercial Paper and Certificate of Deposits
+$7.8b 11% Banking products - uplift in customer deposits
+$9.6b 10% Others – growth in customer deposits mainly Commercial business, Mortgages (offset accounts), Private Banking and Transaction Banking
+$16.5b 30% Asia Pacific, Europe & America geography
+$11.6b 46% Customer deposit growth across Asia, mainly Singapore, Japan, China and Hong Kong
+$2.4b 37% America – growth in Certificates of Deposits and Term Deposits
+$1.0b 8% UK / Europe - increase in customer deposits and funding for collateral balances
+$1.5b Others
-$0.1b 0% New Zealand geography – growth in retail deposits offset by decline in commercial paper funding
-$0.5b 0% Foreign exchange rate movements
+$47.6b 15% Movement in total average deposits and other borrowings (incl. exchange rate movement)

REVIEW OF OPERATING RESULTS
18
Income and expenses, cont’d
Net interest income, cont’d
March 2012 v March 2011 The main drivers of the movement in net interest margin include:
Movement
-8 bps Deposit costs – Effects of strong competition on retail deposits in Australia business
-7 bps Funding costs – Increase in wholesale funding costs
+3 bps Funding & Asset mix – Benefit from lower reliance on wholesale funding, as customer deposit growth meets the ongoing funding demands. Partly offset by negative mix impact mainly from an increase in lower margin Housing Lending and Institutional Trade Loans
+4 bps Assets – Improved asset margins due to repricing in New Zealand and recovery of higher funding and deposit costs in Australia division
+2 bps Other – Includes higher recovery from impaired assets and other various minor impacts
-6 bps Movement in Group (Ex Markets)
-3 bps Global Markets – Lower earnings on balance sheet lending, higher derivatives funding costs and negative dilution impact
-9 bps Movement in Group NIM
REVIEW OF OPERATING RESULTS
19
Income and expenses, cont’d
Other operating income
Half Year Movement
Mar 12 $M
Sep 11 $M
Mar 11 $M
Mar 12 v. Sep 11
Mar 12 v. Mar 11
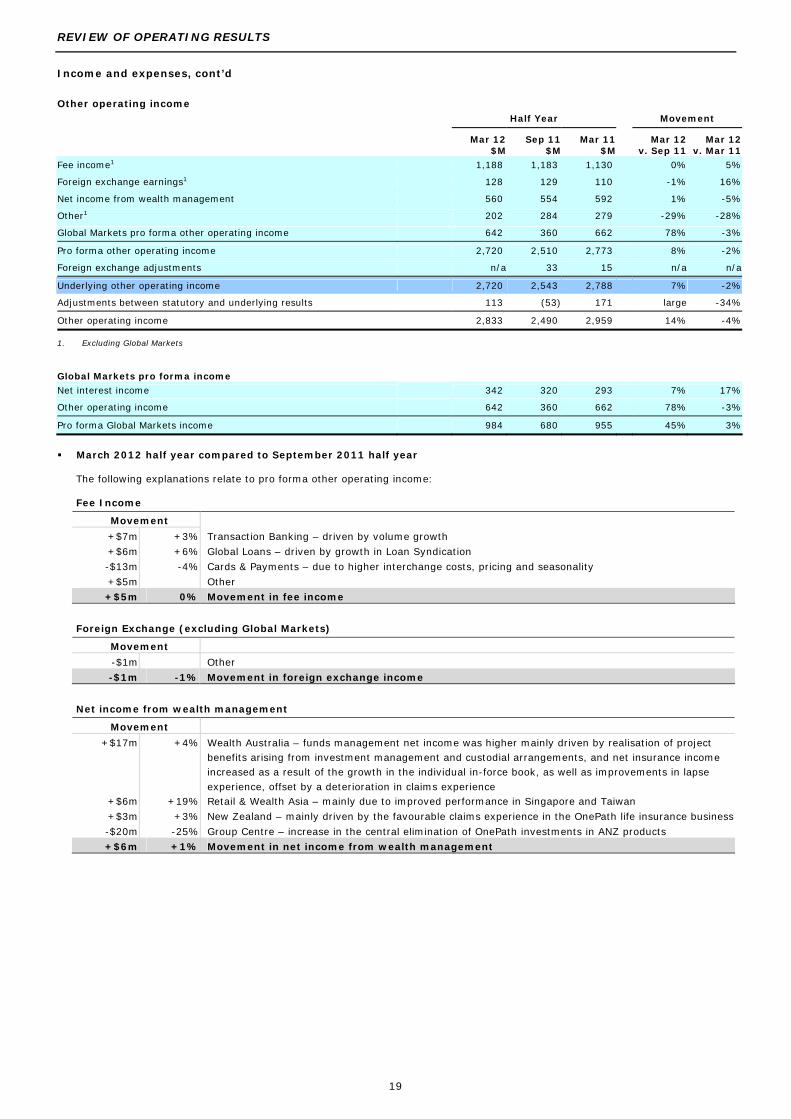
Fee income1 1,188 1,183 1,130 0% 5%
Foreign exchange earnings1 128 129 110 -1% 16%
Net income from wealth management 560 554 592 1% -5%
Other1 202 284 279 -29% -28%
Global Markets pro forma other operating income 642 360 662 78% -3%
Pro forma other operating income 2,720 2,510 2,773 8% -2%
Foreign exchange adjustments n/a 33 15 n/a n/a
Underlying other operating income 2,720 2,543 2,788 7% -2%
Adjustments between statutory and underlying results 113 (53) 171 large -34%
Other operating income 2,833 2,490 2,959 14% -4%
1. Excluding Global Markets
Global Markets pro forma income
Net interest income
342 320 293 7% 17%
Other operating income
642 360 662 78% -3%
Pro forma Global Markets income
984 680 955 45% 3%
March 2012 half year compared to September 2011 half year
The following explanations relate to pro forma other operating income:
Fee Income
Movement
+$7m +3% Transaction Banking – driven by volume growth
+$6m +6% Global Loans – driven by growth in Loan Syndication
-$13m -4% Cards & Payments – due to higher interchange costs, pricing and seasonality
+$5m Other
+$5m 0% Movement in fee income
Foreign Exchange (excluding Global Markets)
Movement
-$1m Other
-$1m -1% Movement in foreign exchange income
Net income from wealth management
Movement
+$17m +4% Wealth Australia – funds management net income was higher mainly driven by realisation of project benefits arising from investment management and custodial arrangements, and net insurance income increased as a result of the growth in the individual in-force book, as well as improvements in lapse experience, offset by a deterioration in claims experience
+$6m +19% Retail & Wealth Asia – mainly due to improved performance in Singapore and Taiwan
+$3m +3% New Zealand – mainly driven by the favourable claims experience in the OnePath life insurance business
-$20m -25% Group Centre – increase in the central elimination of OnePath investments in ANZ products
+$6m +1% Movement in net income from wealth management

REVIEW OF OPERATING RESULTS
20
Income and expenses, cont’d
Other operating income, cont’d March 2012 half year compared to September 2011 half year, cont’d
Other income
Movement
-$46m -24% Asia Partnerships - $31 million write-down of the investment in Saigon Securities Inc (SSI) and equity accounted earnings decreased $23 million mainly due to lower earnings from Shanghai Rural Commercial Bank (SRCB) as a result of a release of a credit provision in the second half of 2011, offset by a $10 million gain on disposal of Sacombank
-$21m -98% Global Services & Operations – $19 million profit on sale of 20 Martin Place in the second half of 2011
-$10m -12% Wealth Australia – driven by adverse investor sentiment and the uncertain economic environment which negatively impacted on E*Trade volumes and an unfavourable claims experience in the lenders’ mortgage insurance business
-$9m large Relationship Banking – due to mark-to-market movements on credit default swap bought protection
+$10m large Retail & Wealth Asia – due to a $10 million gain on the partial sale of the Taiwan credit card portfolio
-$6m Other
-$82m -29% Movement in other income
Total Global Markets income is affected by mix impacts between the categories within other operating income and net interest income. Total Global Markets income increased $304 million or 45%. Refer page 65 for further information.
March 2012 half year compared to March 2011 half year
The following explanations relate to pro forma other operating income:
Fee Income
Movement
+$34m +16% Transaction Banking – driven mainly by volume growth
+$5m +18% Pacific – driven mainly by volume growth in Retail
+$5m +5% Global Loans – driven by volume growth and higher Loan Syndication fees
+$5m +4% Deposits – driven by volume growth
+$9m Other
+$58m +5% Movement in fee income
Foreign Exchange (excluding Global Markets)
Movement
+$11m +18% Transaction Banking – driven by higher volumes
+$7m Other
+$18m +17% Movement in foreign exchange income
Net income from wealth management
Movement
-$33m -6% Wealth Australia – primarily due to deterioration in claims experience
+$9m +9% New Zealand – favourable revaluation of policyholder liabilities in the OnePath life insurance business
+$6m +22% Retail & Wealth Asia – mainly due to improved performance in Singapore and Taiwan
-$16m -19% Group Centre – increase in the central elimination of OnePath investments in ANZ products
+$2m Other
-$32m -5% Movement in net income from wealth management
Other income
Movement
-$40m -21% Asia Partnerships - $31 million write-down of the investment in SSI and equity accounted earnings decreased $54 million mainly due to lower earnings from SRCB largely as a result of a one-off gain of $48 million booked in the first half of 2011, offset by the $10 million gain on disposal of Sacombank and the $35 million impairment charge relating to the carrying value of Sacombank in the first half of 2011
-$13m -15% Wealth Australia – driven by adverse investor sentiment and subdued investment market returns impacting on E*Trade volumes, as well as a one-off impairment charge in the E*Trade business
-$9m -34% Retail & Wealth Asia – March 2012 included a $10 million gain on the partial sale of the Taiwan credit card portfolio compared to March 2011 which included a $19 million gain on the partial sale of the Taiwan credit card portfolio
-$4m large Relationship Banking - due to mark-to-market movements on credit default swap bought protection
-$3m large Other Retail Products – equity accounting loss
-$8m Other
-$77m -28% Movement in other income
Total Global Markets income is affected by mix impacts between the categories within other operating income and net interest income. Total Global Markets income increased $29 million or 3%. Refer page 65 for further information.

REVIEW OF OPERATING RESULTS
21
Income and expenses, cont’d
Expenses
Half Year Movement
Mar 12
$M Sep 11
$M Mar 11
$M Mar 12
v. Sep 11 Mar 12
v. Mar 11
Personnel expenses 2,489 2,357 2,344 6% 6%
Premises expenses 355 340 339 4% 5%
Computer expenses 551 524 492 5% 12%
Other expenses 625 678 627 -8% 0%
Pro forma operating expenses 4,020 3,899 3,802 3% 6%
Foreign exchange adjustments n/a (2) 19 n/a n/a
Underlying operating expenses 4,020 3,897 3,821 3% 5%
Adjustments between statutory and underlying results
113 100 205 n/a n/a
Total operating expenses
4,133 3,997 4,026 3% 3%
Total full time equivalent staff (FTE)
48,348 49,099 48,620 -2% -1%
March 2012 half year compared to September 2011 half year
The following explanations relate to the pro forma operating expenses:
Movement
+$55m 3% Australia
-$1m 0% New Zealand
+$55m 7% Asia Pacific, Europe & America
+$34m 3% Institutional
-$16m -8% Group Centre
+$6m 2% Less: Institutional Asia Pacific, Europe & America
+$121m 3% Movement in pro forma operating expenses
APEA costs were up 7%, compared with 11% revenue growth, reflecting continued but targeted investments in systems, expanding distribution and building front line capability across the region. Institutional cost growth of 3% was driven by higher amortisation and restructuring costs with tight control of discretionary costs. The Australia division cost growth of 3% was largely due to annual salary increases and increased restructuring costs, partly offset by a GST refund and productivity benefits, and there was tight control over discretionary costs. New Zealand costs were flat, reflecting productivity gains from simplifying the business offsetting inflationary increases. Group Centre costs were down 8% reflecting the impact of productivity initiatives.
− Personnel expenses increased $132 million (6%) as a result of annual salary increases, the continued build out of our APEA capability and restructuring costs in Australia division and Institutional which will drive benefits in future periods. Inflationary increases in New Zealand were offset by a 3% reduction in staff numbers.
− Premises expenses increased $15 million (4%) reflecting inflationary increases and Asian expansion.
− Computer expenses increased $27 million (5%) due to increased depreciation and amortisation partly offset by lower data communication costs, software purchases and software impairment.
− Other expenses reduced $53 million (-8%) mainly due to lower travel, consultancy, advertising fees and a GST refund.
REVIEW OF OPERATING RESULTS
22
Income and expenses, cont’d
Expenses, cont’d
March 2012 half year compared to March 2011 half year
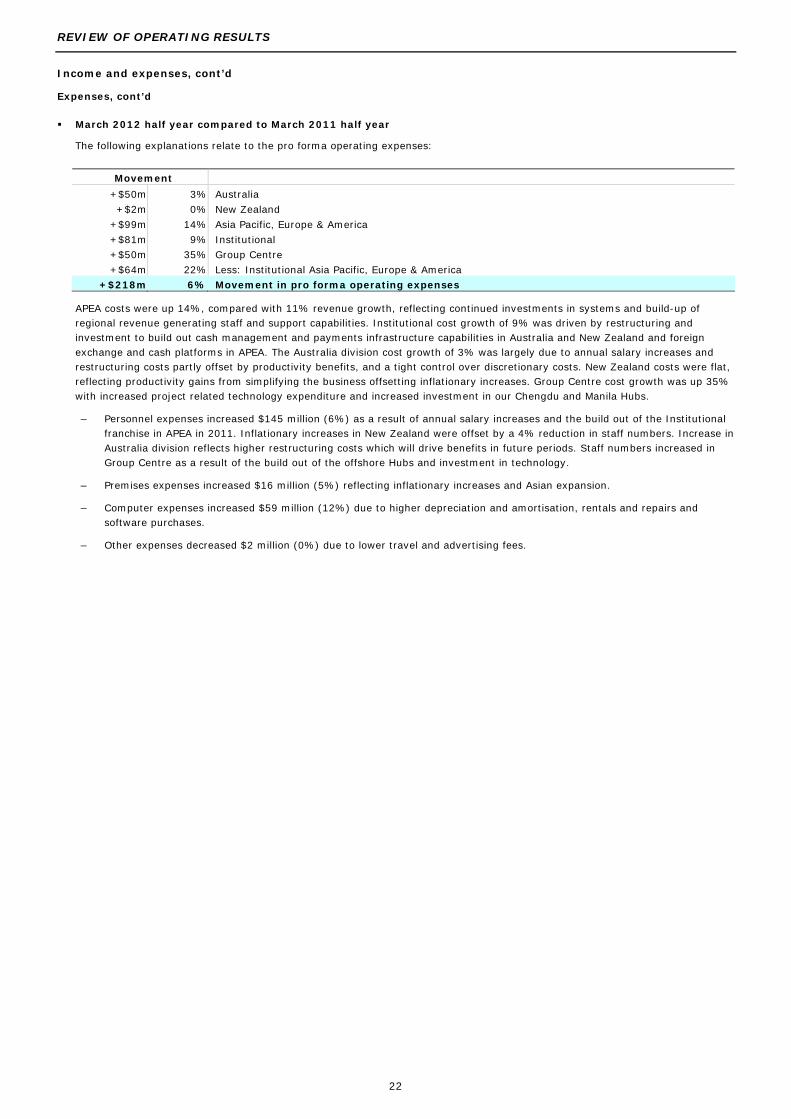
The following explanations relate to the pro forma operating expenses:
Movement
+$50m 3% Australia
+$2m 0% New Zealand
+$99m 14% Asia Pacific, Europe & America
+$81m 9% Institutional
+$50m 35% Group Centre
+$64m 22% Less: Institutional Asia Pacific, Europe & America
+$218m 6% Movement in pro forma operating expenses
APEA costs were up 14%, compared with 11% revenue growth, reflecting continued investments in systems and build-up of regional revenue generating staff and support capabilities. Institutional cost growth of 9% was driven by restructuring and investment to build out cash management and payments infrastructure capabilities in Australia and New Zealand and foreign exchange and cash platforms in APEA. The Australia division cost growth of 3% was largely due to annual salary increases and restructuring costs partly offset by productivity benefits, and a tight control over discretionary costs. New Zealand costs were flat, reflecting productivity gains from simplifying the business offsetting inflationary increases. Group Centre cost growth was up 35% with increased project related technology expenditure and increased investment in our Chengdu and Manila Hubs.
– Personnel expenses increased $145 million (6%) as a result of annual salary increases and the build out of the Institutional franchise in APEA in 2011. Inflationary increases in New Zealand were offset by a 4% reduction in staff numbers. Increase in Australia division reflects higher restructuring costs which will drive benefits in future periods. Staff numbers increased in Group Centre as a result of the build out of the offshore Hubs and investment in technology.
– Premises expenses increased $16 million (5%) reflecting inflationary increases and Asian expansion.
– Computer expenses increased $59 million (12%) due to higher depreciation and amortisation, rentals and repairs and software purchases.
– Other expenses decreased $2 million (0%) due to lower travel and advertising fees.

REVIEW OF OPERATING RESULTS
23
Credit risk (including credit risk on derivatives) Provision for credit impairment charge
Half Year Movement
Mar 12
$M Sep 11
$M Mar 11
$M Mar 12
v. Sep 11 Mar 12
v. Mar 11 Australia 307 296 414 4% -26%
Asia Pacific, Europe & America1 48 68 41 -29% 17%
Institutional1 185 112 154 65% 20%
New Zealand 79 92 75 -14% 5%
Group Centre - 40 1 -100% -100%
Less: Institutional Asia Pacific, Europe & America1 (54) (56) (26) -4% large
Pro forma provision for credit impairment charge 565 552 659 2% -14%
Foreign exchange adjustments n/a (1) 1 n/a n/a
Underlying provision for credit impairment charge 565 551 660 3% -14%
Adjustments between statutory and underlying results2 (27) 11 15 large large
Provision for credit impairment charge 538 562 675 -4% -20%
1. Includes impairment on AFS assets of $35 million (Sep 11 half: $21 million; Mar 11 half: $16 million) 2. Includes in March 2012 impaired derivatives of $32 million less $5 million charge in non continuing businesses
Individual provision charge Half Year Movement
Mar 12 $M
Sep 11 $M
Mar 11 $M
Mar 12 v. Sep 11
Mar 12 v. Mar 11
Australia 319 370 298 -14% 7%
Asia Pacific, Europe & America1 52 77 50 -32% 4%
Institutional1 286 76 147 large 95%
New Zealand 105 134 123 -22% -15%
Less: Institutional Asia Pacific, Europe & America1 (45) (47) (24) -4% 88%
Pro forma individual provision charge 717 610 594 18% 21%
Foreign exchange adjustments n/a (1) - n/a n/a
Total underlying individual provision charge 717 609 594 18% 21%
Adjustments between statutory and underlying results2 (27) 11 16 large large
Total individual provision charge 690 620 610 11% 13%
1. Includes impairment on AFS assets of $35 million (Sep 11 half: $21 million; Mar 11 half: $16 million) 2. Includes in March 2012 impaired derivatives of $32 million less $5 million charge in non continuing businesses
The pro forma individual provision charge increased $107 million over the half, due mainly to Institutional. The increase in Institutional of $210 million reflects provisions on existing problem accounts previously covered by collective provisions or credit valuation adjustments where litigation was resolved or which were transferred to impaired status, and significantly lower recoveries and writebacks than in the second half of 2011. This has been offset by decreases in Australia, New Zealand and APEA.

REVIEW OF OPERATING RESULTS
24
Credit risk (including credit risk on derivatives), cont’d Individual Provision Charge, cont’d
Half Year Movement
Underlying new and increased provisions Mar 12
$M Sep 11
$M Mar 11
$M Mar 12
v. Sep 11 Mar 12
v. Mar 11
Australia 490 502 438 -2% 12%
Asia Pacific, Europe & America 96 144 108 -33% -11%
Institutional 359 251 252 43% 42%
New Zealand 190 237 220 -20% -14%
Group Centre - 1 - -100% n/a
Less: Institutional Asia Pacific, Europe & America (53) (74) (39) -28% 36%
New and increased provisions for loans and advances 1,082 1,061 979 2% 11%
Underlying recoveries and writebacks
Australia (171) (132) (140) 30% 22%
Asia Pacific, Europe & America (44) (67) (56) -34% -21%
Institutional (73) (176) (104) -59% -30%
New Zealand (85) (103) (99) -17% -14%
Group Centre - - - n/a n/a
Less: Institutional Asia Pacific, Europe & America 8 26 14 -69% -43%
Recoveries and writebacks (365) (452) (385) -19% -5%
Collective provision charge
Half Year Movement
Collective provision charge by source Mar 12
$M Sep 11
$M Mar 11
$M Mar 12
v. Sep 11 Mar 12
v. Mar 11
Lending growth 74 74 56 0% 32%
Risk profile1 (174) (56) (35) large large
Portfolio mix (1) (4) (16) -75% -94%
Economic cycle and concentration risk adjustment1 (51) (72) 60 -29% large
Collective provision charge/(release) (152) (58) 65 large large
1. Risk profile release in March 2012 includes $60 million transferred to concentration risk adjustment
Pro forma collective provision charge/(release) by division
Australia (12) (74) 116 -84% large
Asia Pacific, Europe & America (4) (9) (9) -56% -56%
Institutional (101) 36 7 large large
New Zealand (26) (42) (48) -38% -46%
Group Centre - 40 1 -100% -100%
Less: Institutional Asia Pacific, Europe & America (9) (9) (2) 0% large
Pro forma collective provision charge/(release) (152) (58) 65 large large
Foreign exchange adjustments n/a - 1 n/a n/a
Underlying collective provision charge/(release) (152) (58) 66 large large
Non continuing businesses - - (1) n/a -100%
Collective provision charge/(release) (152) (58) 65 large large
The pro forma collective provision charge decreased by $94 million during the half due to a release of $152 million. Growth across the portfolio added a charge of $74 million, offsetting this was a $174 million release reflecting Institutional accounts where losses were crystallised as individual provisions and the associated collective provision released and an improved credit profile across most portfolios. A further $51 million was released from the economic cycle adjustment in Australia, New Zealand and APEA reflecting related individual provisions being crystallised and economic cycle adjustments no longer required.
REVIEW OF OPERATING RESULTS
25
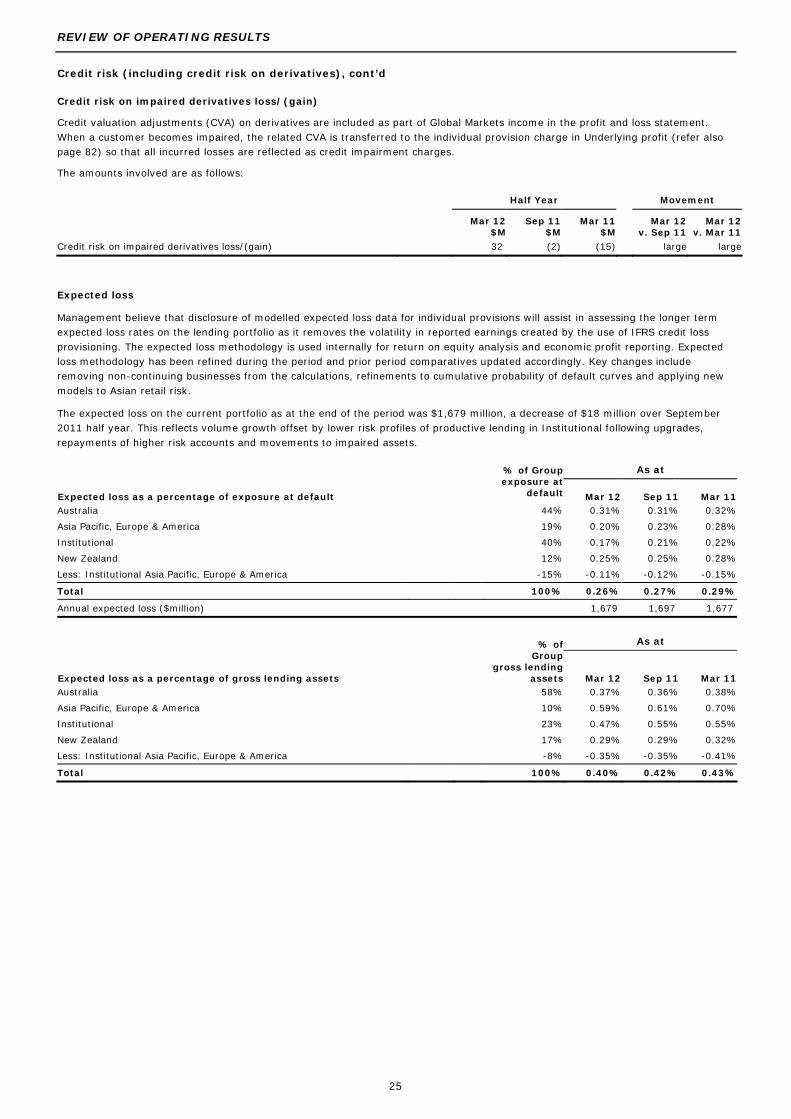
Credit risk (including credit risk on derivatives), cont’d Credit risk on impaired derivatives loss/(gain)
Credit valuation adjustments (CVA) on derivatives are included as part of Global Markets income in the profit and loss statement. When a customer becomes impaired, the related CVA is transferred to the individual provision charge in Underlying profit (refer also page 82) so that all incurred losses are reflected as credit impairment charges.
The amounts involved are as follows: Half Year Movement
Mar 12 $M
Sep 11 $M
Mar 11 $M
Mar 12 v. Sep 11
Mar 12 v. Mar 11
Credit risk on impaired derivatives loss/(gain) 32 (2) (15) large large
Expected loss
Management believe that disclosure of modelled expected loss data for individual provisions will assist in assessing the longer term expected loss rates on the lending portfolio as it removes the volatility in reported earnings created by the use of IFRS credit loss provisioning. The expected loss methodology is used internally for return on equity analysis and economic profit reporting. Expected loss methodology has been refined during the period and prior period comparatives updated accordingly. Key changes include removing non-continuing businesses from the calculations, refinements to cumulative probability of default curves and applying new models to Asian retail risk.
The expected loss on the current portfolio as at the end of the period was $1,679 million, a decrease of $18 million over September 2011 half year. This reflects volume growth offset by lower risk profiles of productive lending in Institutional following upgrades, repayments of higher risk accounts and movements to impaired assets. As at
Expected loss as a percentage of exposure at default
% of Groupexposure at
default Mar 12 Sep 11 Mar 11Australia 44% 0.31% 0.31% 0.32%
Asia Pacific, Europe & America 19% 0.20% 0.23% 0.28%
Institutional 40% 0.17% 0.21% 0.22%
New Zealand 12% 0.25% 0.25% 0.28%
Less: Institutional Asia Pacific, Europe & America -15% -0.11% -0.12% -0.15%
Total 100% 0.26% 0.27% 0.29%
Annual expected loss ($million) 1,679 1,697 1,677
As at
Expected loss as a percentage of gross lending assets
% of Group
gross lending assets Mar 12 Sep 11 Mar 11
Australia 58% 0.37% 0.36% 0.38%
Asia Pacific, Europe & America 10% 0.59% 0.61% 0.70%
Institutional 23% 0.47% 0.55% 0.55%
New Zealand 17% 0.29% 0.29% 0.32%
Less: Institutional Asia Pacific, Europe & America -8% -0.35% -0.35% -0.41%
Total 100% 0.40% 0.42% 0.43%

REVIEW OF OPERATING RESULTS
26
Credit risk (including credit risk on derivatives), cont’d Gross impaired assets
Gross impaired assets at $5,343 million represent a 4% decrease since 30 September 2011, largely reflecting the reduction in restructured items. Net impaired assets
Net impaired assets at $3,629 million represent a 7% decrease since 30 September 2011. The Group has an individual provision coverage ratio on impaired loans of 36%, reflecting a prevalence of well secured exposures within impaired loans. As at ($M) Movement
Gross impaired assets Mar 12 Sep 11 Mar 11 Mar 12
v. Sep 11 Mar 12
v. Mar 11
Impaired loans 4,664 4,650 5,203 0% -10%
Restructured items 340 700 704 -51% -52%
Non-performing commitments and contingencies 339 231 314 47% 8%
Gross impaired assets 5,343 5,581 6,221 -4% -14%
Individual provisions
Impaired loans (1,701) (1,687) (1,700) 1% 0%
Non-performing commitments and contingencies (13) (10) (17) 30% -24%
Net impaired assets 3,629 3,884 4,504 -7% -19%
Half Year Movement
New impaired assets Mar 12
$M Sep 11
$M Mar 11
$M Mar 12
v. Sep 11 Mar 12
v. Mar 11
Impaired loans 1,913 1,755 1,814 9% 5%
Restructured items 249 75 613 large -59%
Non-performing commitments and contingencies 194 12 10 large large
Total new impaired assets
2,356 1,842 2,437 28% -3%
Half Year Movement
New impaired assets by division Mar 12
$M Sep 11
$M Mar 11
$M Mar 12
v. Sep 11 Mar 12
v. Mar 11
Australia 763 857 797 -11% -4%
Asia Pacific, Europe & America 140 162 146 -14% -4%
Institutional 1,058 358 925 large 14%
New Zealand 451 511 657 -12% -31%
Less: Institutional Asia Pacific, Europe & America (77) (64) (89) 20% -13%
Underlying new impaired assets 2,335 1,824 2,436 28% -4%
Adjustments between statutory and underlying 21 18 1 17% large
Total new impaired assets 2,356 1,842 2,437 28% -3%
Growth in new impaired assets relates principally to Institutional and reflects the impairment of an infrastructure exposure and the restructure of a project finance loan.
REVIEW OF OPERATING RESULTS
27
Income tax expense
Half Year Movement
Mar 12
$M Sep 11
$M Mar 11
$M Mar 12
v. Sep 11 Mar 12
v. Mar 11
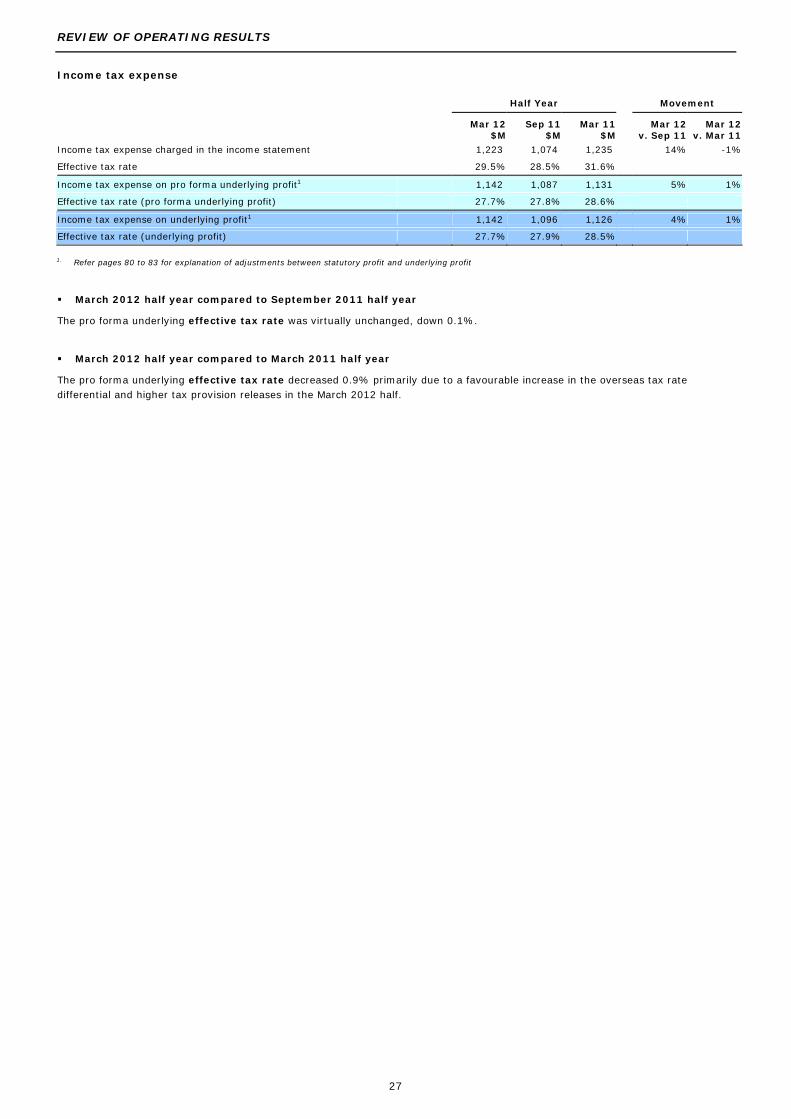
Income tax expense charged in the income statement 1,223 1,074 1,235 14% -1%
Effective tax rate 29.5% 28.5% 31.6%
Income tax expense on pro forma underlying profit1 1,142 1,087 1,131 5% 1%
Effective tax rate (pro forma underlying profit) 27.7% 27.8% 28.6%
Income tax expense on underlying profit1 1,142 1,096 1,126 4% 1%
Effective tax rate (underlying profit) 27.7% 27.9% 28.5%
1. Refer pages 80 to 83 for explanation of adjustments between statutory profit and underlying profit
March 2012 half year compared to September 2011 half year
The pro forma underlying effective tax rate was virtually unchanged, down 0.1%. March 2012 half year compared to March 2011 half year
The pro forma underlying effective tax rate decreased 0.9% primarily due to a favourable increase in the overseas tax rate differential and higher tax provision releases in the March 2012 half.

REVIEW OF OPERATING RESULTS
28
Impact of exchange rate movements/revenue hedges
The Group uses derivative instruments to economically hedge against the adverse impact on future offshore revenue streams from exchange rate movements.
Movements in average exchange rates, net of associated revenue hedges, resulted in a decrease of $17 million in the Group’s underlying profit after tax for the March 2012 half when compared to the September 2011 half (Mar 2011 half: increase $5 million). This included the impact on earnings (underlying basis) from associated revenue and cost hedges, which reduced by $47 million (before tax) over the September 2011 half (March 2011 half: an increase of $1 million). Hedge revenue is booked in the Group Centre.
Half Year Mar 2012
v. Half Year Sep 2011 Half Year Mar 2012
v. Half Year Mar 2011
FX
unadjusted % growth
FX adjusted % growth
FX Impact $M
FX unadjusted % growth
FX adjusted % growth
FX Impact $M
Net interest income 2% 2% 10 6% 6% 5
Other operating income 7% 8% (33) -2% -2% (15)
Operating income 4% 4% (23) 3% 3% (10)
Operating expenses 3% 3% (2) 5% 6% 19
Profit before credit impairment and income tax 4% 5% (25) 2% 1% 9
Provision for credit impairment 3% 2% (1) -14% -14% 1
Profit before income tax 5% 5% (26) 4% 4% 10
Income tax expense 4% 5% 9 1% 1% (5)
Non-controlling interests 0% 0% - -20% -20% -
Underlying profit 5% 6% (17) 6% 5% 5
Earnings related hedges
The Group has taken out economic hedges against New Zealand Dollar and US Dollar revenue and expense streams. New Zealand Dollar exposure is the most significant, covering the New Zealand geography (refer page 77) and the debt component of New Zealand Dollar intra-group funding of this business, which amounted to NZD1.766 billion at 31 March 2012. Most of our US dollar earnings are in APEA (refer page 76). Details of these hedges are set out below.
Half Year
NZD Economic hedges Mar 12
$M Sep 11
$M Mar 11
$M Net open NZD position (notional principal)1 794 788 302
Amount taken to income (pre tax) 2 5 (20) 17
Amount taken to income (pre tax underlying basis) 3 3 20 20
USD Economic hedges
Net open USD position (notional principal)1 1,060 1,068 1,022
Amount taken to income (pre tax) 2 103 (24) 48
Amount taken to income (pre tax underlying basis) 3 22 52 4
1. Value in AUD at original contract rate 2. Unrealised valuation movement plus realised revenue from closed out hedges 3. Realised revenue from closed out hedges In the March 2012 half year:
• NZD0.4 billion of economic hedges matured and a realised gain of $3 million (pre-tax) was booked to the income statement.
• NZD1 billion of economic hedges are in place at a forward rate of approximately NZD1.27/AUD partially hedging 2012 & 2013 earnings.
• USD0.4 billion of economic hedges matured and a realised gain of $22 million (pre-tax) was booked to the income statement.
• USD1 billion of economic hedges are in place at a forward rate of approximately USD0.95/AUD partially hedging 2012 & 2013 earnings.
• An unrealised gain of $83 million (pre-tax) on the outstanding NZD1 billion and USD1 billion of economic hedges was booked to the income statement and has been treated as an adjustment to statutory profit as these are hedges of future years’ NZD and USD revenues.

REVIEW OF OPERATING RESULTS
29
Earnings per share (cents)1
Half Year Movement
Mar 12
Sep 11
Mar 11
Mar 12
v. Sep 11 Mar 12
v. Mar 11 Basic 110.8 104.0 104.2 7% 6%
Diluted 106.2 99.3 101.2 7% 5%
Number of fully paid ordinary shares on issue (M) 2,679.5 2,629.0 2,596.4 2% 3%
Weighted average number of ordinary shares (M)
Statutory
2,627.4 2,581.5 2,550.1 2% 3%
Underlying2 2,644.1 2,598.8 2,566.7 2% 3%
Adjusted weighted average number of shares - diluted (M) 2,887.3 2,824.8 2,748.3 2% 5%
Underlying earnings per share
Profit attributable to shareholders of the Company ($M) 2,919 2,691 2,664 8% 10%
Adjustments between statutory profit and underlying profit ($M)
54 143 154 -62% -65%
Underlying profit ($M)
2,973 2,834 2,818 5% 6%
Preference share dividends ($M)3 (7) (6) (6) 17% 17%
Underlying profit less preference share dividends ($M)
2,966 2,828 2,812 5% 5%
Underlying earnings per share (cents)
112.2 108.8 109.6 3% 2%
1. Refer page 109 for full calculation 2. Includes Treasury shares held in OnePath Australia 3. The earnings per share calculation excludes the Euro Hybrid preference shares
March 2012 half year compared to September 2011 half year
Basic earnings per share (EPS) increased 7% (6.8 cents) on half year September 2011. Underlying EPS increased 3% (3.4 cents) on the September 2011 half. The increase in Underlying EPS on the September 2011 half year was due to an increase in profit after tax (PAT) of 5% (5.3 cents per share), offset 1.9 cents per share (-2% to EPS) by dilution from an increase in the weighted average number of shares. March 2012 half year compared to March 2011 half year
Basic earnings per share (EPS) increased 6% (6.6 cents) on half year March 2011. Underlying EPS increased 2% (2.6 cents). The increase in Underlying EPS on the March 2011 half was due to an increase in PAT of 5% (6.0 cents per share), offset 3.4 cents per share (-3% to EPS) by dilution from an increase in the weighted average number of shares.

REVIEW OF OPERATING RESULTS
30
Dividends Half Year Movement
Dividend per ordinary share (cents) Mar 12
$M Sep 11
$M Mar 11
$M Mar 12
v. Sep 11 Mar 12
v. Mar 11
Interim (fully franked) 66 n/a 64 n/a 3%
Final (fully franked) n/a 76 n/a n/a n/a
Ordinary share dividend payout ratio (%)1 60.8% 74.6% 62.5%
Ordinary share dividends used in payout ratio ($M)1 1,769 2,002 1,662 -12% 6%
Profit after tax ($M) 2,919 2,691 2,664 8% 10%
Less: Adjustments between statutory profit and underlying profit ($M)
(54) (143) (154) -62% -65%
Underlying profit ($M)
2,973 2,834 2,818 5% 6%
Less: Preference share dividends paid
(7) (6) (6) 17% 17%
Ordinary share dividend payout ratio (underlying basis)1 59.7% 70.8% 59.1%
1. Dividend payout ratio calculated using proposed 2012 interim dividend of $1,769 million, based on the forecast number of ordinary shares on issue at the dividend record rate. Dividend payout ratios for the Sep 2011 full year and Mar 2011 half year were calculated using actual dividend paid of $2,002 million and $1,662 million respectively. Dividend payout ratios are calculated by adjusting net profit for preference share dividends paid.
The Directors propose that an interim dividend of 66 cents be paid on 2 July 2012 on each eligible fully paid ANZ ordinary share. The proposed 2012 interim dividend will be fully franked for Australian tax purposes.
ANZ has a Dividend Reinvestment Plan (DRP) and a Bonus Option Plan (BOP) that will operate in respect of the 2012 interim dividend and ANZ intends to provide shares under the DRP and BOP through the issue of new shares. The “Acquisition Price” to be used in determining the number of shares to be provided under the DRP and BOP will be calculated in accordance with the DRP and BOP Terms and Conditions using a 1.5% discount. Refer Note 6 of the Notes to the Condensed Financial Statements for further details regarding the calculation of the “Acquisition Price” and the operation of the DRP and BOP. Economic profit
Half Year Movement
Mar 12
$M Sep 11
$M Mar 11
$M Mar 12
v. Sep 11 Mar 12
v. Mar 11 Profit attributable to shareholders of the company 2,919 2,691 2,664 8% 10%
Adjustments between statutory profit and underlying profit 54 143 154 -62% -65%
Underlying profit 2,973 2,834 2,818 5% 6%
Economic credit cost adjustment (229) (234) (141) -2% 62%
Imputation credits 549 521 575 5% -5%
Economic return 3,293 3,121 3,252 6% 1%
Cost of capital (2,064) (1,998) (1,857) 3% 11%
Economic profit 1,229 1,123 1,395 9% -12%
Economic profit is a risk adjusted profit measure used to evaluate business unit performance and is considered in determining the variable component of remuneration packages. This is used for internal management purpose and is not subject to audit.
Economic profit is calculated via a series of adjustments to underlying profit. The Economic credit cost adjustment replaces the actual credit loss charge with expected loss based on the average loss per annum on the portfolio over an economic cycle. The benefit of imputation credits is recognised, measured at 70% of Australian tax. The cost of capital is a major component of Economic profit. At an ANZ Group level, this is calculated using ordinary shareholders’ equity, multiplied by the cost of capital rate (currently 11%) plus the dividend on preference shares. At a business unit level, capital is allocated based on economic capital, whereby higher risk businesses attract higher levels of capital. This method is designed to help drive appropriate risk management and ensure business returns align with the relevant risk. Key risks covered include credit risk, operating risk, market risk and other risks.
Economic profit increased half on half driven by:
• improved underlying profit, principally in Global Markets and New Zealand businesses; and
• partly offset by higher cost of capital, reflecting growth in the business and increasing prudential requirements.

REVIEW OF OPERATING RESULTS
31
Condensed balance sheet
As at ($B) Movement
Mar 12 Sep 11 Mar 11 Mar 12
v. Sep 11 Mar 12
v. Mar 11
Assets
Liquid assets 35.8 24.9 19.3 44% 85%
Due from other financial institutions 10.0 8.8 7.5 14% 34%
Trading and available-for-sale assets 56.0 58.3 47.3 -4% 18%
Derivative financial instruments 36.9 54.1 29.6 -32% 24%
Net loans and advances including acceptances 412.6 397.3 379.4 4% 9%
Investments relating to insurance business 30.2 29.9 32.9 1% -8%
Other 21.7 21.2 21.4 2% 2%
Total assets 603.2 594.5 537.4 1% 12%
Liabilities
Due to other financial institutions 27.0 23.0 22.0 17% 22%
Customer deposits 308.3 296.8 267.3 4% 15%
Other deposits and other borrowings 74.8 71.9 64.5 4% 16%
Deposits and other borrowings 383.1 368.7 331.8 4% 15%
Derivative financial instruments 35.1 50.1 29.8 -30% 18%
Liability for acceptances 0.7 1.0 0.6 -30% 17%
Bonds and notes 61.1 56.6 58.5 8% 4%
Insurance policy liabilities/external unitholder liabilities 33.5 32.5 35.2 3% -5%
Other 23.3 24.6 24.4 -5% -5%
Total liabilities
563.8 556.5 502.3 1% 12%
Total equity
39.4 38.0 35.1 4% 12%
March 2012 half year compared to September 2011 half year
Major movements in the balance sheet categories include:
Assets Movement FX
impact
Liquid assets $10.9b 44% ($1.2b) Increase of central bank deposits in Japan ($3.2 billion) and America ($5.6 billion). Also driven by increase ($1.9 billion) in reverse repos partially offset (-$1 billion) by timing difference on settlement of debt instruments and derivatives.
Trading & available-for-sale assets
($2.3b) (4%) ($0.8b) Decrease in Trading Securities (-$3.2 billion) primarily in Institutional Australia, partially offset by an increase in available-for-sale assets ($0.8 billion).
Derivative financial instruments
($17.2b) (32%) Nil Decrease due to an appreciation of AUD against other currencies over the half year since the sharp decline prior to September 2011.
Net loans and advances including acceptances
$15.3b 4% ($2.2b) Growth due to above system growth in Australian housing lending of $8.6 billion (5%) and steady growth in non-housing lending of $4.3 billion (6%).
Liabilities
Deposits and other borrowings
$14.4b 4% ($4.6b) Growth in customer deposits in Retail ($3.9 billion), Commercial ($1.1 billion), Wealth ($1.6 billion), New Zealand ($1.6 billion) and APEA ($6.1 billion), were partially offset by reductions in term deposits in Transaction Banking and Markets (-$5 billion). In addition, Treasury deposits and commercial paper increased by $5.4 billion.
Derivative financial instruments
($15.0b) (30%) Nil Decrease due to an appreciation of AUD against other currencies over the half year since the sharp decline prior to September 2011.
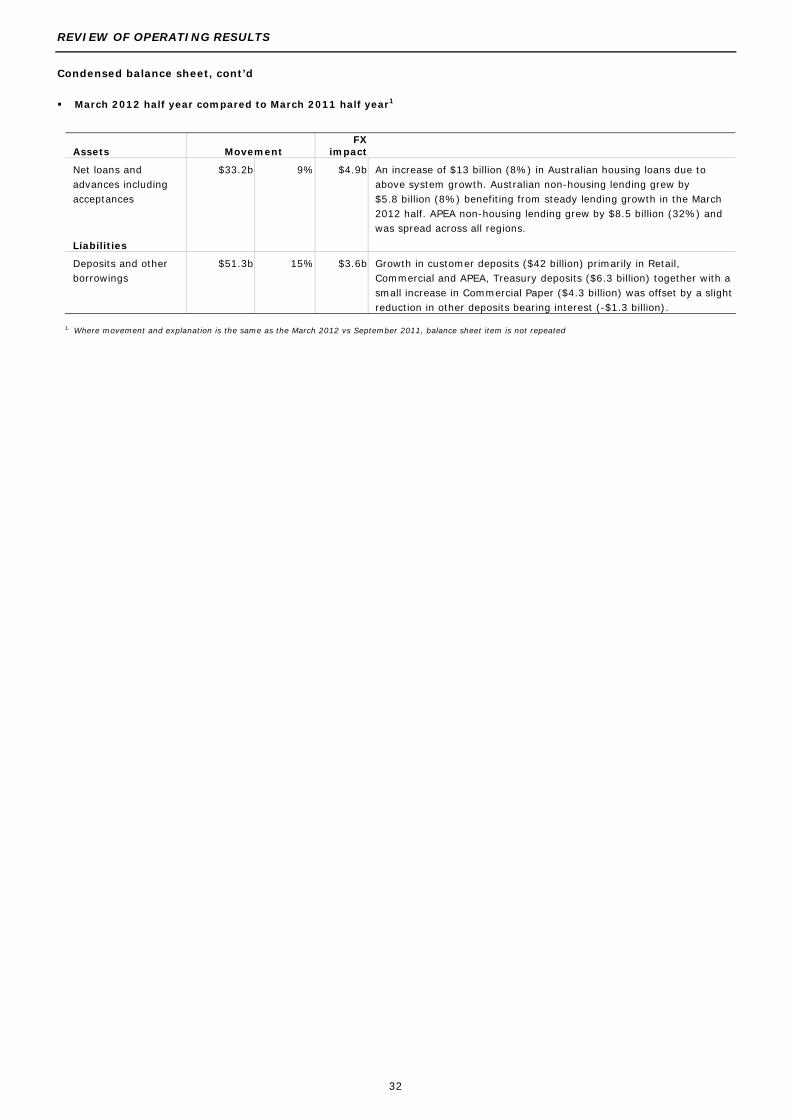
REVIEW OF OPERATING RESULTS
32
Condensed balance sheet, cont’d
March 2012 half year compared to March 2011 half year1
Assets Movement FX
impact
Net loans and advances including acceptances
$33.2b 9% $4.9b An increase of $13 billion (8%) in Australian housing loans due to above system growth. Australian non-housing lending grew by $5.8 billion (8%) benefiting from steady lending growth in the March 2012 half. APEA non-housing lending grew by $8.5 billion (32%) and was spread across all regions.
Liabilities
Deposits and other borrowings
$51.3b 15% $3.6b Growth in customer deposits ($42 billion) primarily in Retail, Commercial and APEA, Treasury deposits ($6.3 billion) together with a small increase in Commercial Paper ($4.3 billion) was offset by a slight reduction in other deposits bearing interest (-$1.3 billion).
1. Where movement and explanation is the same as the March 2012 vs September 2011, balance sheet item is not repeated

REVIEW OF OPERATING RESULTS
33
Liquidity risk
Liquidity risk is the risk that the Group is unable to meet its payment obligations as they fall due, including repaying depositors or maturing wholesale debt, or that the Group has insufficient capacity to fund increases in assets. The timing mismatch of cash flows and the related liquidity risk is inherent in all banking operations and is closely monitored by the Group. The Group maintains a portfolio of liquid assets to manage potential stresses in funding sources. The minimum level of liquidity portfolio assets to hold is based on a range of ANZ specific and general market liquidity stress scenarios such that potential cash flow obligations can be met over the short to medium term.
The Group’s approach to liquidity risk management incorporates the following key components:
• Scenario modelling of funding sources
The global financial crisis highlighted the importance of differentiating between stressed and normal market conditions in a name-specific crisis and the different behaviour that offshore and domestic wholesale funding markets can exhibit during market stress events. ANZ’s liquidity scenario modelling stresses site and total bank cash flow projections against multiple ‘survival horizons’ over which period the Group is required to remain cash flow positive. Scenarios modelled are either prudential requirements, i.e. a ‘going-concern’ scenario, or ‘name crisis’ scenario, or Board mandated scenarios including ‘Name-specific’ stresses and ‘Funding Market’ events. Under these scenarios, customer and wholesale balance sheet asset/liability flows are stressed.
• Liquidity portfolio
The Group holds a diversified portfolio of cash and high credit quality securities that may be sold or pledged to provide same day liquidity. This portfolio helps protect the Group’s liquidity position by providing cash in a severely stressed environment. All assets held in the prime portfolio are securities eligible for repurchase under agreements with the applicable central bank (i.e. ‘repo eligible’).
The liquidity portfolio is well diversified by counterparty, currency and tenor. Under the liquidity policy framework, securities purchased for ANZ’s liquidity portfolio must be of a similar or better credit quality to ANZ’s external long term or short term credit ratings and continue to be repo eligible.
Supplementing the prime liquid asset portfolio, the Group holds additional liquidity:
− central bank deposits with the US Federal Reserve, Bank of Japan and European Central Bank of $18.3 billion;
− secondary sources of liquidity including Australian Commonwealth and State Government securities and gold of $8.9 billion; and
− additional cash and other securities to satisfy local country regulatory liquidity requirements which are not included in the liquid assets below.
As at
Mar 12 Sep 11 Mar 11
Prime liquidity portfolio (Market Values)1 AUD $B AUD $B AUD $B
Australia 21.2 20.8 24.9
New Zealand 10.5 9.1 8.5
United States 1.4 1.4 1.2
United Kingdom 3.1 2.7 2.2
Asia 6.5 6.7 2.0
Total excluding internal Residential Mortgage Backed Securities 42.7 40.7 38.8
Internal Residential Mortgage Backed Securities (Australia) 24.6 26.8 24.6
Internal Residential Mortgage Backed Securities (New Zealand) 4.0 3.9 3.7
Total prime portfolio 71.3 71.4 67.1
Other Eligible Securities and deposits with Central Banks 27.2 19.9 5.7
Total liquidity portfolio 98.5 91.3 72.8
1. Market value is post the repo discount applied by the applicable central bank

REVIEW OF OPERATING RESULTS
34
Liquidity risk, cont’d Regulatory Change
Following the publication of earlier discussion papers relating to liquidity prudential requirements, Australian Prudential Regulation Authority (APRA) issued a Discussion Paper and a draft Prudential Standard addressing the Basel Committee on Banking Supervision's proposals for enhanced liquidity risk management. These proposals include enhancements to qualitative aspects of liquidity management including governance, the requirement for a clear Board approved liquidity risk tolerance statement that emphasises the importance of stress testing, funding strategies, internal pricing and contingency funding plans. Many of these aspects have been integrated into ANZ's liquidity management framework for some time and ANZ is well positioned to meet these enhancements. The changes to the quantitative requirements include the introduction of two new liquidity ratios to measure and enhance liquidity risk (the Liquidity Coverage Ratio (LCR) and the Net Stable Funding Ratio (NSFR)) and are more significant. A component of the liquidity required under the proposed standards will likely be met via the previously announced Committed Liquidity Facility from the Reserve Bank of Australia (RBA), however the size and availability of the facility is not yet agreed with APRA and the RBA. While ANZ has an existing stress scenario framework and structural liquidity risk metrics and limits in place, the requirements proposed are in general more challenging. These changes will impact the future composition and size of ANZ’s liquidity portfolio, the size and composition of the Bank’s funding base and consequently could affect future profitability. APRA is proposing to release further details on the requirements during the second half of 2012 and to implement the LCR ratio on 1 January 2015 and the NSFR ratio on 1 January 2018 in line with the Basel Committee's timetable for liquidity risk. Funding
ANZ manages its funding profile using a range of funding metrics and balance sheet disciplines. This approach is designed to ensure that an appropriate proportion of the Group’s assets are funded by stable funding sources including core customer deposits, longer dated wholesale funding (with a remaining term exceeding one year) and equity. This includes targeting a diversified funding base, avoiding undue concentrations by investor type, maturity, market source and currency. Diversification was further enhanced in March 2012 half with the introduction of a covered bond funding programme.
Customer deposits and other funding liabilities was $317.9 billion, representing 60% of total funding.
$16.2 billion of term wholesale debt was issued during first half 2012 ($15.3 billion of which will be greater than 1 year as at September 2012) including $8.0 billion of covered bonds. As at March 2012, term wholesale funding represented 13% of total funding, an increase from 12% as at September 2011.
• ANZ maintained access to all major global wholesale funding markets during the March 2012 half.
• Approximately 80% of ANZ’s 2012 term funding requirements were completed during the first half. Benchmark term debt issues were completed in AUD, USD, EUR, JPY, CHF and NZD.
• All short-term wholesale funding needs were comfortably met.
• The weighted average tenor of new term debt issuance increased to 4.9 years (4.7yrs in 2011).
• The weighted average cost of new term debt issuance increased significantly (up 41 bps) in the March 2012 half relative to September 2011 as a result of further global market disruption. Financial market conditions improved towards the end of the March 2012 half, however average portfolio costs remain substantially above pre-crisis levels and continue to increase as maturing term wholesale funding is replaced at higher spreads.
The following tables show the Group’s funding composition:
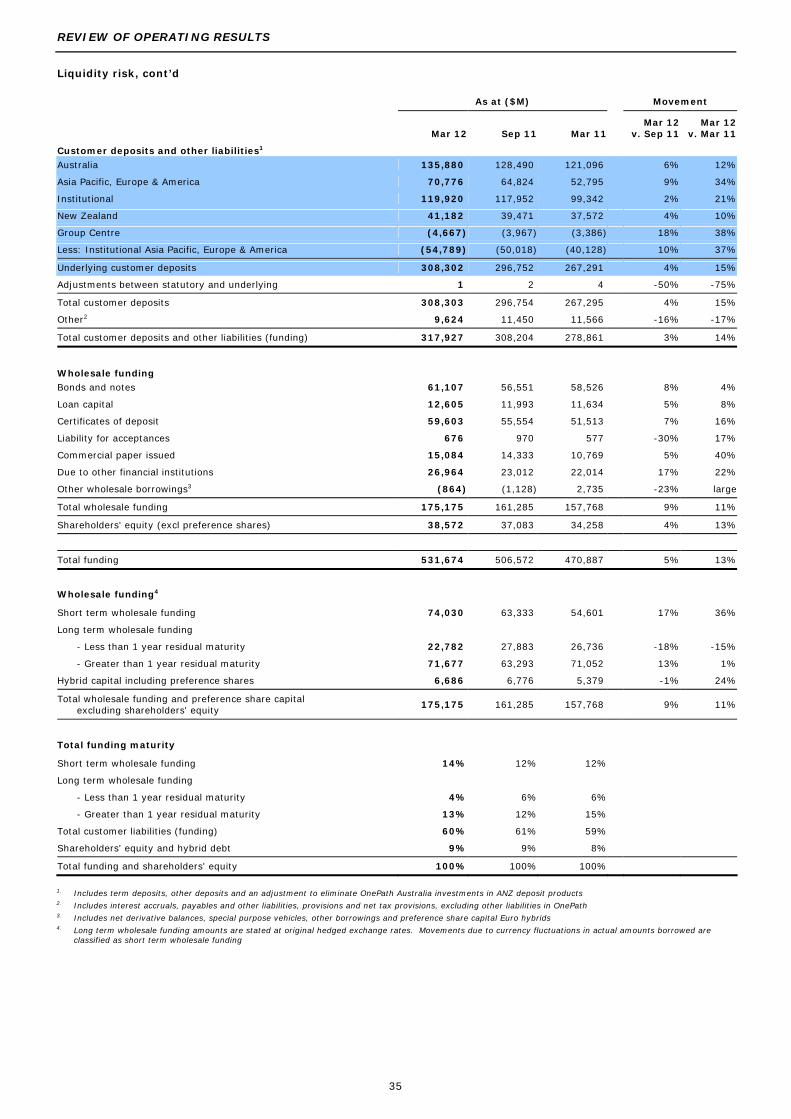
REVIEW OF OPERATING RESULTS
35
Liquidity risk, cont’d
As at ($M) Movement
Mar 12 Sep 11 Mar 11
Mar 12 v. Sep 11
Mar 12 v. Mar 11
Customer deposits and other liabilities1
Australia 135,880 128,490 121,096 6% 12%
Asia Pacific, Europe & America 70,776 64,824 52,795 9% 34%
Institutional 119,920 117,952 99,342 2% 21%
New Zealand 41,182 39,471 37,572 4% 10%
Group Centre (4,667) (3,967) (3,386) 18% 38%
Less: Institutional Asia Pacific, Europe & America (54,789) (50,018) (40,128) 10% 37%
Underlying customer deposits 308,302 296,752 267,291 4% 15%
Adjustments between statutory and underlying 1 2 4 -50% -75%
Total customer deposits 308,303 296,754 267,295 4% 15%
Other2 9,624 11,450 11,566 -16% -17%
Total customer deposits and other liabilities (funding) 317,927 308,204 278,861 3% 14%
Wholesale funding
Bonds and notes 61,107 56,551 58,526 8% 4%
Loan capital 12,605 11,993 11,634 5% 8%
Certificates of deposit 59,603 55,554 51,513 7% 16%
Liability for acceptances 676 970 577 -30% 17%
Commercial paper issued 15,084 14,333 10,769 5% 40%
Due to other financial institutions 26,964 23,012 22,014 17% 22%
Other wholesale borrowings3 (864) (1,128) 2,735 -23% large
Total wholesale funding 175,175 161,285 157,768 9% 11%
Shareholders' equity (excl preference shares) 38,572 37,083 34,258 4% 13%
Total funding 531,674 506,572 470,887 5% 13%
Wholesale funding4
Short term wholesale funding 74,030 63,333 54,601 17% 36%
Long term wholesale funding
- Less than 1 year residual maturity 22,782 27,883 26,736 -18% -15%
- Greater than 1 year residual maturity 71,677 63,293 71,052 13% 1%
Hybrid capital including preference shares 6,686 6,776 5,379 -1% 24%
Total wholesale funding and preference share capital excluding shareholders' equity
175,175 161,285 157,768 9% 11%
Total funding maturity
Short term wholesale funding 14% 12% 12%
Long term wholesale funding
- Less than 1 year residual maturity 4% 6% 6%
- Greater than 1 year residual maturity 13% 12% 15%
Total customer liabilities (funding) 60% 61% 59%
Shareholders' equity and hybrid debt 9% 9% 8%
Total funding and shareholders' equity 100% 100% 100%
1. Includes term deposits, other deposits and an adjustment to eliminate OnePath Australia investments in ANZ deposit products 2. Includes interest accruals, payables and other liabilities, provisions and net tax provisions, excluding other liabilities in OnePath 3. Includes net derivative balances, special purpose vehicles, other borrowings and preference share capital Euro hybrids 4. Long term wholesale funding amounts are stated at original hedged exchange rates. Movements due to currency fluctuations in actual amounts borrowed are
classified as short term wholesale funding

REVIEW OF OPERATING RESULTS
36
Capital Management
As at
Mar 12 Sep 11 Mar 11
Common Equity Tier 11 8.9% 8.5% 8.5%
Tier 12 11.3% 10.9% 10.5%
Tier 2 1.3% 1.2% 1.6%
Total capital 12.6% 12.1% 12.1%
Risk weighted assets $M 284,836 279,964 264,236
1. Common Equity Tier 1 is Tier 1 excluding hybrid Tier 1 capital instruments 2. ANZ has elected for ANZ Capital No. 1 Pty Ltd (a wholly owned subsidiary and guaranteed by ANZ) to purchase its GBP450 million stapled securities (UK Stapled
Securities) on 15 June 2012, and following purchase ANZ has agreed to buy-back and cancel the securities. Irrevocable notices to affect the purchase were issued on 27 April 2012 and as a result the securities will cease to constitute Tier 1 capital from 27 April 2012
Further details of the components of capital and the capital adequacy calculation are set out on pages 39 to 42
The Basel II Accord principles took effect from 1 January 2008. For calculation of minimum capital requirements under Pillar 1 (Capital Requirements) of the Basel II Accord, ANZ has been accredited by Australian Prudential Regulation Authority (APRA) to use Advanced Internal Ratings Based (AIRB) methodology for credit risk weighted assets and Advanced Measurement Approach (AMA) for the operational risk weighted asset equivalent. Common Equity Tier 1 Ratio
The Common Equity Tier 1 ratio at March 2012 of 8.9% represents an increase from September 2011 of 40 basis points and an increase from March 2011 of 43 basis points. The key contributors to the increase were:
Half Year
Mar 12 vs Sep 11 Sep 11 vs Mar 11
Common Equity Tier 1
Underlying profit after preference share dividends
+106bps ($3.0B) +107bps ($2.8B)
Ordinary share dividends net of reinvestment
-37bps ($1.0B) -46bps ($1.2B)
Risk weighted assets (excluding FX impact)
Portfolio growth and mix
-26bps -43bps
Risk migration and Expected Losses in excess of Eligible Provisions
+5bps +7bps
Portfolio data review +5bps +2bps
Non-credit risk -11bps 0bps
Capital retention in insurance businesses and associates -1bps -9bps
Non-underlying profit items -2bps -5bps
Capitalised software -6bps -9bps
Other items +7bps -1bps
Total Common Equity Tier 1 movement +40bps +3bps
Tier 1 (in addition to Common Equity Tier 1 above)
Hybrid Tier 1 capital 0bps +51bps
Additional Tier 1 usage attributable to risk weighted asset growth and other -7bps -11bps
Total Tier 1 movement +33bps +43bps

REVIEW OF OPERATING RESULTS
37
Capital management, cont’d Hybrid Tier 1 Capital
ANZ raises hybrid Tier 1 capital to further strengthen the Group’s capital base and supplement its Common Equity Tier 1 capital position, ensuring compliance with APRA’s prudential capital requirements and meeting Group operating targets for Tier 1. The total amount of qualifying hybrid Tier 1 capital is known as Residual Tier 1 capital which is limited to 25% of Tier 1 capital. Innovative Tier 1 capital, a sub category of Residual Tier 1 capital, is limited to 15% of Tier 1 capital. As at 31 March 2012, ANZ’s hybrid Tier 1 capital usage and instrument details were as follows: Instrument $M % of Net
Tier 1 capital Limit Amount in
issue currency Accounting
classification Interest
rate
UK Stapled Securities1 691 £450 million Debt Coupon: 6.54% ANZ Convertible Preference Shares (CPS1)
1,081
$1,081 million
Debt
90 day BBSW + 2.50% (gross pay equivalent)
ANZ Convertible Preference Shares (CPS2)
1,969
$1,969 million
Debt
90 day BBSW + 3.10% (gross pay equivalent)
ANZ Convertible Preference Shares (CPS3)
1,340
$1,340 million
Debt
180 day BBSW + 3.10% (gross pay equivalent)
Non-innovative instruments 5,081
Euro Trust Securities 871 €500 million Equity Euribor (3 month) + 0.66% US Trust Securities 721 USD750 million Debt Coupon: 5.36%
Innovative instruments 1,592 5.0% 15%
Residual Tier 1 capital 6,673 20.8% 25%
1. ANZ has elected for ANZ Capital No. 1 Pty Ltd (a wholly-owned subsidiary and guaranteed by ANZ) to purchase the UK Stapled Securities on 15 June 2012, and following purchase ANZ has agreed to buy-back and cancel the securities. Irrevocable notices to effect the purchase were issued on 27 April 2012 and as a result the securities will cease to constitute Tier 1 capital from 27 April 2012
Regulatory change
APRA released draft prudential capital standards on 30 March 2012 detailing the implementation of the majority of Basel 3 capital reforms in Australia. APRA is proposing to adopt the Basel 3 reforms with increased capital deductions from Common Equity Tier 1 capital, an increase in capitalisation rates including prescribed minimum capital buffers, tighter requirements around Additional Tier 1 and Tier 2 securities, and transitional arrangements for existing Tier 1 and Tier 2 securities that do not conform to the new regulations.
APRA views the Basel 3 reforms as a minimum and hence has not incorporated some of the concessions proposed in the Basel 3 rules and set higher requirements in other areas which will result in Australian bank Basel 3 reported capital ratios not being directly comparable with international peers.
The expected impact of the proposed changes on ANZ’s capital ratios is set out in the table on the following page.
In addition, APRA is proposing an accelerated implementation timetable for the Basel 3 capital reforms around minimum capital ratios and deductions effective 1 January 2013. Introduction of the prescribed minimum capital buffers will be effective 1 January 2016 and the Leverage Ratio from 1 January 2015.
APRA has yet to release draft capital standards on the Basel 3 reforms dealing with the improvements in capital disclosures, leverage ratio, counterparty credit risk, contingent capital, and measures to address systematic and inter-connected risks. These are expected later in 2012.

REVIEW OF OPERATING RESULTS
38
Capital management, cont’d
The following table reconciles the March 2012 APRA Basel II capital ratios to the pro forma APRA Basel III ratios, based on our current interpretation of APRA’s 30 March 2012 draft prudential standards. This is then fully aligned to the Basel Committee’s framework including the December 2010 consultation paper.
Common Equity Tier 1 Capital Tier 1 Capital Total Capital
APRA March 2012 Basel II 8.9% 11.3% 12.6%
Plus: Dividend not provided for (net of DRP) 0.4% 0.4% 0.4%
Less: Tier 2 capital deductions moved to Common Equity Tier 1
Investment in ADIs and overseas equivalents (0.4%) (0.4%) -
Investment in ANZ insurance subsidiaries including OnePath (0.4%) (0.4%) -
Expected losses in excess of eligible provisions1 (0.1%) (0.1%) 0.1%
Other (0.1%) (0.3%) (0.2%)
Less: 10% reduction of existing hybrid Tier 1 and Tier 2 securities2 - (0.2%) (0.4%)
Less: estimated increase in RWA3 (0.5%) (0.6%) (0.7%)
Pro forma ratio - APRA Basel III 7.8% 9.7% 11.8%
Plus: adjustments to fully align to Basel III
10% allowance for investments in insurance subsidiaries and ADIs including overseas equivalents
0.8% 0.7% 0.7%
Up to 5% allowance for deferred tax assets 0.2% 0.2% 0.2%
Other capital items 0.2% 0.3% 0.2%
Pro forma Basel III (fully aligned capital) 9.0% 10.9% 12.9%
Plus: additional APRA Basel II conservative RWA methodologies
Mortgage 20% LGD floor and others 0.5% 0.6% 0.7%
IRRBB RWA (APRA Pillar 1 approach) 0.3% 0.3% 0.4%
Pro forma Basel III fully aligned 9.8% 11.8% 14.0%
1. APRA alignment to Basel treatment of Expected Losses in excess of Eligible Provisions, gross of associated deferred tax asset 2. From 1 January 2013 transitional treatment for existing securities on issue will apply. The maximum that can be included in the respective capital base is 90% of
the volume of eligible transitional Tier 1 and Tier 2 securities on issue at 1 January 2013. The cap will reduce by 10 percentage points each year until 1 January 2022
3. Excludes potential impacts arising from APRA’s yet to be released Basel III liquidity reforms Level 3 Conglomerates (“Level 3”)
APRA has announced that it will proceed with implementing Level 3 Conglomerates prudential standards from April 2013. The standards will regulate a bancassurance group such as ANZ as a single economic entity with minimum capital requirements and maximum risk exposure levels. However, APRA has yet to release any detail beyond their March 2010 Discussion Paper, which did not identify a material impact for ANZ.
Life insurance And General Insurance Capital reforms (“LAGIC”)
APRA is currently undertaking a review of the prudential capital standards as they apply to life insurance and general insurance entities with the view to updating the risk setting prescribed for various business risks, and to more closely align the standards to the capital regulations applied to banking groups for capital targets and class of capital.
APRA released draft prudential standards on 9 December 2011 following industry submissions on the earlier discussion paper. To date, the proposed reforms will not have a material impact on the capital requirements for ANZ.

REVIEW OF OPERATING RESULTS
39
Capital management, cont’d
As at Movement
Qualifying Capital Mar 12
$M Sep 11
$M Mar 11
$M Mar 12
v. Sep 11 Mar 12
v. Mar 11
Tier 1
Shareholders' equity and non-controlling interests 39,443 37,954 35,129 4% 12%
Prudential adjustments to shareholders' equity Table 1 (3,170) (3,479) (2,637) -9% 20%
Fundamental Tier 1 capital 36,273 34,475 32,492 5% 12%
Deductions Table 2 (10,858) (10,611) (10,070) 2% 8%
Common Equity Tier 1 capital 25,415 23,864 22,422 6% 13%
Non-innovative Tier 1 capital instruments Table on 37 5,081 5,111 3,751 -1% 35%
Innovative Tier 1 capital instruments Table on 37 1,592 1,641 1,597 -3% 0%
Tier 1 capital 32,088 30,616 27,770 5% 16%
Tier 2
Upper Tier 2 capital Table 3 1,173 1,228 1,166 -4% 1%
Subordinated notes Table 4 5,757 5,017 6,176 15% -7%
Deductions Table 2 (3,217) (3,071) (3,055) 5% 5%
Tier 2 capital 3,713 3,174 4,287 17% -13%
Total qualifying capital 35,801 33,790 32,057 6% 12%
Capital adequacy ratios Common Equity Tier 1 8.9% 8.5% 8.5%
Tier 1 11.3% 10.9% 10.5%
Tier 2 1.3% 1.2% 1.6%
Total 12.6% 12.1% 12.1%
Risk weighted assets Table 5 284,836 279,964 264,236 2% 8%

REVIEW OF OPERATING RESULTS
40
Capital management, cont’d
As at ($M) Movement
Mar 12 $M
Sep 11 $M
Mar 11 $M
Mar 12 v. Sep 11
Mar 12 v. Mar 11
Table 1: Prudential adjustments to shareholders' equity
Treasury shares attributable to OnePath policy holders
337 358 359 -6% -6%
Reclassification of preference share capital
(871) (871) (871) 0% 0%
Accumulated retained profits and reserves of insurance, funds management and securitisation entities and associates
(1,444) (1,686) (1,274) -14% 13%
Deferred fee revenue including fees deferred as part of loan yields
425 414 398 3% 7%
Hedging reserve
(133) (169) (29) -21% large
Available-for-sale reserve
(246) (126) (57) 95% large
Dividend not provided for
(1,769) (1,999) (1,662) -12% 6%
Accrual for Dividend Reinvestment Plans
531 600 499 -12% 6%
Total
(3,170) (3,479) (2,637) -9% 20%
Table 2: Deductions from Tier 1 capital
Unamortised goodwill & other intangibles (excluding OnePath Australia and New Zealand)
(3,017) (3,027) (2,855) 0% 6%
Intangible component of investments in OnePath Australia and New Zealand1 (2,071) (2,071) (2,059) 0% 1%
Capitalised software
(1,660) (1,490) (1,263) 11% 31%
Capitalised expenses including loan and lease origination fees
(761) (688) (666) 11% 14%
Applicable deferred tax assets (excluding the component relating to the general reserve for impairment of financial assets)
(92) (136) (154) -32% -40%
Mark-to-market impact of own credit spread
(40) (128) (18) -69% large
Sub-total
(7,641) (7,540) (7,015) 1% 9%
Deductions taken 50% from Tier 1 and 50% from Tier 2 Gross 50% 50% 50%
Investment in ANZ insurance subsidiaries (599) (300) (200) (200) 50% 50%
Investment in funds management entities (54) (27) (29) (29) -7% -7%
Investment in OnePath Australia and New Zealand
(1,844) (922) (906) (901) 2% 2%
Investment in other Authorised Deposit Taking Institutions and overseas equivalents
(2,235) (1,118) (1,151) (1,162) -3% -4%
Expected losses in excess of eligible provisions (1,049) (524) (475) (473) 10% 11%
Other deductions (651) (326) (310) (290) 5% 12%
Sub-total (6,432) (3,217) (3,071) (3,055) 5% 5%
Total
(10,858) (10,611) (10,070) 2% 8%
Table 3: Upper Tier 2 capital
Perpetual subordinated notes
943 962 902 -2% 5%
General reserve for impairment of financial assets net of attributable deferred tax asset2
230 266 264 -14% -13%
Total
1,173 1,228 1,166 -4% 1%
Table 4: Subordinated notes3
For capital adequacy calculation purposes, subordinated note issues are reduced by 20% of the original amount over the last four years to maturity and are limited to 50% of Tier 1 capital.
1. Calculation based on prudential requirements 2. Under Basel II, this consists of the surplus of the general reserve for impairment of financial assets, net of tax and/or the provisions attributable to the
standardised portfolio 3. The fair value adjustment is excluded for prudential purposes as the prudential standard only permits inclusion of cash received and makes no allowance for
hedging
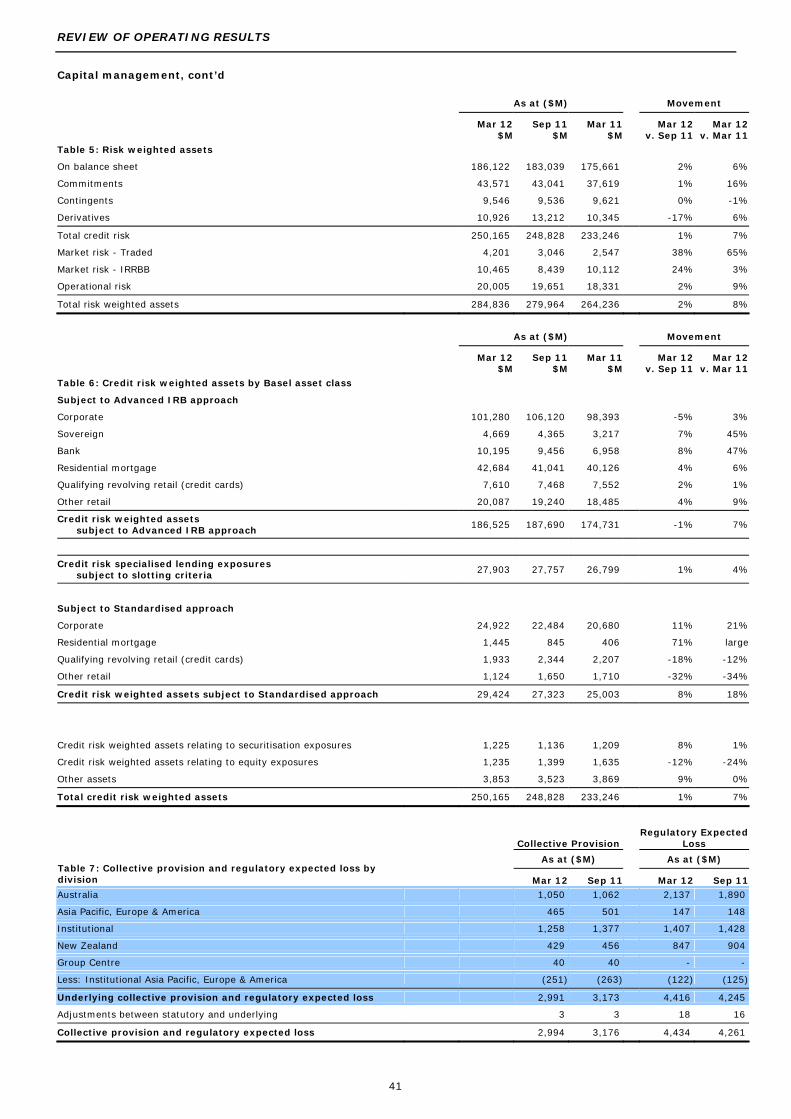
REVIEW OF OPERATING RESULTS
41
Capital management, cont’d As at ($M) Movement
Mar 12 $M
Sep 11 $M
Mar 11 $M
Mar 12 v. Sep 11
Mar 12 v. Mar 11
Table 5: Risk weighted assets
On balance sheet 186,122 183,039 175,661 2% 6%
Commitments 43,571 43,041 37,619 1% 16%
Contingents 9,546 9,536 9,621 0% -1%
Derivatives 10,926 13,212 10,345 -17% 6%
Total credit risk 250,165 248,828 233,246 1% 7%
Market risk - Traded 4,201 3,046 2,547 38% 65%
Market risk - IRRBB 10,465 8,439 10,112 24% 3%
Operational risk 20,005 19,651 18,331 2% 9%
Total risk weighted assets 284,836 279,964 264,236 2% 8%
As at ($M) Movement
Mar 12
$M Sep 11
$M Mar 11
$M Mar 12
v. Sep 11 Mar 12
v. Mar 11
Table 6: Credit risk weighted assets by Basel asset class
Subject to Advanced IRB approach
Corporate 101,280 106,120 98,393 -5% 3%
Sovereign 4,669 4,365 3,217 7% 45%
Bank 10,195 9,456 6,958 8% 47%
Residential mortgage 42,684 41,041 40,126 4% 6%
Qualifying revolving retail (credit cards) 7,610 7,468 7,552 2% 1%
Other retail 20,087 19,240 18,485 4% 9%
Credit risk weighted assets subject to Advanced IRB approach
186,525 187,690 174,731 -1% 7%
Credit risk specialised lending exposures subject to slotting criteria 27,903 27,757 26,799 1% 4%
Subject to Standardised approach
Corporate 24,922 22,484 20,680 11% 21%
Residential mortgage 1,445 845 406 71% large
Qualifying revolving retail (credit cards) 1,933 2,344 2,207 -18% -12%
Other retail 1,124 1,650 1,710 -32% -34%
Credit risk weighted assets subject to Standardised approach 29,424 27,323 25,003 8% 18%
Credit risk weighted assets relating to securitisation exposures 1,225 1,136 1,209 8% 1%
Credit risk weighted assets relating to equity exposures 1,235 1,399 1,635 -12% -24%
Other assets 3,853 3,523 3,869 9% 0%
Total credit risk weighted assets 250,165 248,828 233,246 1% 7%
Collective Provision Regulatory Expected
Loss
As at ($M) As at ($M) Table 7: Collective provision and regulatory expected loss by division Mar 12 Sep 11 Mar 12 Sep 11
Australia 1,050 1,062 2,137 1,890
Asia Pacific, Europe & America 465 501 147 148
Institutional 1,258 1,377 1,407 1,428
New Zealand 429 456 847 904
Group Centre 40 40 - -
Less: Institutional Asia Pacific, Europe & America (251) (263) (122) (125)
Underlying collective provision and regulatory expected loss 2,991 3,173 4,416 4,245
Adjustments between statutory and underlying 3 3 18 16
Collective provision and regulatory expected loss 2,994 3,176 4,434 4,261

REVIEW OF OPERATING RESULTS
42
Capital management, cont’d
As at ($M) Movement
Table 8: Expected loss in excess of eligible provisions Mar 12
$M Sep 11
$M Mar 11
$M Mar 12
v. Sep 11 Mar 12
v. Mar 11
Basel expected loss
Defaulted 2,130 1,975 2,018 8% 6%
Non-defaulted 2,304 2,286 2,285 1% 1%
4,434 4,261 4,303 4% 3%
Less: Qualifying collective provision after tax
Collective provision (2,994) (3,176) (3,177) -6% -6%
Non-qualifying collective provision 312 375 271 -17% 15%
Standardised collective provision 296 340 378 -13% -22%
Deferred tax asset 708 730 719 -3% -2%
(1,678) (1,731) (1,809) -3% -7%
Less: Qualifying individual provision after tax
Individual provision (1,714) (1,697) (1,717) 1% 0%
Standardised individual provision 300 477 429 -37% -30%
Collective provision on advanced defaulted (293) (359) (259) -18% 13%
(1,707) (1,579) (1,547) 8% 10%
Gross deduction 1,049 951 947 10% 11%
50/50 deduction (refer table 2) 524 475 473 10% 11%

REVIEW OF OPERATING RESULTS
43
Deferred acquisition costs and deferred income
The Group recognises deferred acquisition costs relating to the acquisition of interest earning assets as assets. The Group also recognised deferred income that is integral to the yield of an originated financial instrument, net of any direct incremental costs. This income is deferred and recognised as net interest income over the expected life of the financial instrument under AASB 139: ‘Financial Instruments: Recognition and Measurement’. Deferred acquisition costs relating to OnePath Australia are excluded from this analysis.
The balances of deferred acquisition costs and deferred income were: Deferred Acquisition Costs1 Deferred Income
Mar 12 Sep 11 Mar 11 Mar 12 Sep 11 Mar 11
$M $M $M $M $M $M
Australia 647 597 583 68 86 95
Asia Pacific, Europe & America 6 - - 93 86 57
Institutional - - - 312 284 261
New Zealand 44 32 32 30 28 27
Group Centre 64 59 51 - - -
Less: Institutional Asia Pacific, Europe & America - - - (78) (70) (42)
Total 761 688 666 425 414 398
1. Deferred acquisition costs largely include the amounts of brokerage capitalised and amortised in the Australia and New Zealand businesses. Deferred acquisition costs also include capitalised debt raising expenses
Deferred acquisition costs analysis: Half Year Mar 2012
Half Year Sep 2011
Amortisation
Charge Capitalised
Costs1 Amortisation
Charge Capitalised
Costs1
$M $M $M $M
Australia 173 223 160 174
Asia Pacific, Europe & America 1 7 - -
Institutional
- - - -
New Zealand
11 23 11 11
Group Centre
12 17 10 18
Less: Institutional Asia Pacific, Europe & America
- - - -
Total
197 270 181 203
1. Costs capitalised during the year exclude brokerage trailer commissions paid

REVIEW OF OPERATING RESULTS
44
Software capitalisation
At 31 March 2012, the Group’s intangibles included $1,743 million in relation to costs incurred in acquiring and developing software. Details are set out in the table below:
Half Year Movement
Mar 12
$M Sep 11
$M Mar 11
$M Mar 12
v. Sep 11 Mar 12
v. Mar 11 Balance at start of period 1,572 1,349 1,217 17% 29%
Software capitalised during the period 324 368 277 -12% 17%
Amortisation during the period (150) (127) (122) 18% 23%
Software impaired/written-off (1) (21) (23) -95% -96%
Foreign exchange differences (2) 3 - large n/a
Total software capitalisation 1,743 1,572 1,349 11% 29%
Less: OnePath software (different treatment for Capital calculation) (83) (82) (86) 1% -3%
Capitalised software as per deductions from Tier 1 capital
1,660 1,490 1,263 11% 31%
Capitalised cost analysis:
Half Year Movement
Mar 12
$M Sep 11
$M Mar 11
$M Mar 12
v. Sep 11 Mar 12
v. Mar 11
Australia 84 67 48 25% 75%
Asia Pacific, Europe & America 34 61 59 -44% -42%
Institutional 118 139 91 -15% 30%
New Zealand 13 20 16 -35% -19%
Group Centre 75 81 63 -7% 19%
Total 324 368 277 -12% 17%
Net book value by division:
Half Year Movement
Mar 12
$M Sep 11
$M Mar 11
$M Mar 12
v. Sep 11 Mar 12
v. Mar 11
Australia 413 390 399 6% 4%
Asia Pacific, Europe & America 300 283 229 6% 31%
Institutional 653 581 485 12% 35%
New Zealand 72 66 51 9% 41%
Group Centre 305 252 185 21% 65%
Total 1,743 1,572 1,349 11% 29%

SEGMENT REVIEW
45
CONTENTS Section 4 – Segment Review
Segment performance
Australia
Australia
Wealth
Asia Pacific, Europe & America
Institutional
New Zealand
Institutional Asia Pacific, Europe & America
Group Centre

SEGMENT REVIEW
46
Segment Performance
The Group operates on a divisional structure with Australia, Asia Pacific, Europe & America (APEA), Institutional and New Zealand being the major operating divisions. The Group manages Institutional APEA on a matrix structure. Accordingly, the divisional analysis on the following pages reflects this matrix reporting structure.
In February 2012 the Group announced that it had put in place a new senior management structure and other organisational changes designed to further support our super regional aspirations, give focus to areas of growth and opportunity, and to strengthen succession planning within the senior management team. As these changes are implemented it is anticipated that additional reportable segments will be created. The segment disclosures below are unchanged from that reported at 30 September 2011 in line with how the business was managed and reported to the Chief Operating Decision Maker (the Chief Executive Officer) during the reporting period.
March 2012 Half Year
AUD M Australia
Asia Pacific, Europe & America Institutional New Zealand
Group Centre
Less: Institutional Asia Pacific,
Europe & America Group
Net interest income 2,911 684 1,697 897 211 (416) 5,984
Other external operating income 1,160 714 1,072 240 (86) (380) 2,720
Operating income 4,071 1,398 2,769 1,137 125 (796) 8,704
Operating expenses (1,813) (820) (1,033) (512) (191) 349 (4,020)
Profit before credit impair't and income tax 2,258 578 1,736 625 (66) (447) 4,684
Provision for credit impairment (307) (48) (185) (79) - 54 (565)
Profit before income tax 1,951 530 1,551 546 (66) (393) 4,119
Income tax expense and non-controlling interests
(586) (111) (428) (149) 42 86 (1,146)
Pro forma profit 1,365 419 1,123 397 (24) (307) 2,973
Foreign exchange adjustments n/a n/a n/a n/a n/a n/a n/a
Underlying profit 1,365 419 1,123 397 (24) (307) 2,973
September 2011 Half Year
AUD M Australia
Asia Pacific, Europe & America Institutional New Zealand
Group Centre
Less: Institutional Asia Pacific,
Europe & America Group
Net interest income 2,974 588 1,604 870 134 (321) 5,849 Other external operating income 1,171 667 786 237 (53) (298) 2,510
Operating income 4,145 1,255 2,390 1,107 81 (619) 8,359 Operating expenses (1,758) (765) (999) (513) (207) 343 (3,899)
Profit before credit impair't and income tax 2,387 490 1,391 594 (126) (276) 4,460 Provision for credit impairment (296) (68) (112) (92) (40) 56 (552)
Profit before income tax 2,091 422 1,279 502 (166) (220) 3,908 Income tax expense and non-controlling interests
(627) (70) (364) (147) 73 44 (1,091)
Pro forma profit 1,464 352 915 355 (93) (176) 2,817 Foreign exchange adjustments - (14) (8) 2 29 8 17
Underlying profit 1,464 338 907 357 (64) (168) 2,834
March 2012 Half Year vs September 2011 Half Year
% Australia
Asia Pacific, Europe & America Institutional New Zealand
Group Centre
Less: Institutional Asia Pacific,
Europe & America Group
Net interest income -2% 16% 6% 3% 57% 30% 2% Other external operating income -1% 7% 36% 1% 62% 28% 8%
Operating income -2% 11% 16% 3% 54% 29% 4% Operating expenses 3% 7% 3% 0% -8% 2% 3%
Profit before credit impair't and income tax -5% 18% 25% 5% -48% 62% 5% Provision for credit impairment 4% -29% 65% -14% -100% -4% 2%
Profit before income tax -7% 26% 21% 9% -60% 79% 5% Income tax expense and non-controlling interests
-7% 59% 18% 1% -42% 95% 5%
Pro forma profit -7% 19% 23% 12% -74% 74% 6% Foreign exchange adjustments n/a n/a n/a n/a n/a n/a n/a
Underlying profit -7% 24% 24% 11% -63% 83% 5%

SEGMENT REVIEW
47
March 2012 Half Year
AUD M Australia
Asia Pacific, Europe & America Institutional New Zealand
Group Centre
Less: Institutional Asia Pacific,
Europe & America Group
Net interest income 2,911 684 1,697 897 211 (416) 5,984
Other external operating income 1,160 714 1,072 240 (86) (380) 2,720
Operating income 4,071 1,398 2,769 1,137 125 (796) 8,704
Operating expenses (1,813) (820) (1,033) (512) (191) 349 (4,020)
Profit before credit impair't and income tax 2,258 578 1,736 625 (66) (447) 4,684
Provision for credit impairment (307) (48) (185) (79) - 54 (565)
Profit before income tax 1,951 530 1,551 546 (66) (393) 4,119
Income tax expense and non-controlling interests (586) (111) (428) (149) 42 86 (1,146)
Pro forma profit 1,365 419 1,123 397 (24) (307) 2,973
Foreign exchange adjustments n/a n/a n/a n/a n/a n/a n/a
Underlying profit 1,365 419 1,123 397 (24) (307) 2,973
March 2011 Half Year
AUD M Australia
Asia Pacific, Europe & America Institutional New Zealand
Group Centre
Less: Institutional Asia Pacific,
Europe & America Group
Net interest income 2,900 555 1,563 865 62 (298) 5,647 Other external operating income 1,201 707 1,049 231 (68) (347) 2,773
Operating income 4,101 1,262 2,612 1,096 (6) (645) 8,420 Operating expenses (1,763) (721) (952) (510) (141) 285 (3,802)
Profit before credit impair't and income tax 2,338 541 1,660 586 (147) (360) 4,618 Provision for credit impairment (414) (41) (154) (75) (1) 26 (659)
Profit before income tax 1,924 500 1,506 511 (148) (334) 3,959 Income tax expense and non-controlling interests (574) (112) (425) (149) 40 84 (1,136)
Pro forma profit 1,350 388 1,081 362 (108) (250) 2,823 Foreign exchange adjustments - 2 - (5) (1) (1) (5)
Underlying profit 1,350 390 1,081 357 (109) (251) 2,818
March 2012 Half Year vs March 2011 Half Year
% Australia
Asia Pacific, Europe & America Institutional New Zealand
Group Centre
Less: Institutional Asia Pacific,
Europe & America Group
Net interest income 0% 23% 9% 4% large 40% 6% Other external operating income -3% 1% 2% 4% 26% 10% -2%
Operating income -1% 11% 6% 4% large 23% 3% Operating expenses 3% 14% 9% 0% 35% 22% 6%
Profit before credit impair't and income tax -3% 7% 5% 7% -55% 24% 1% Provision for credit impairment -26% 17% 20% 5% -100% large -14%
Profit before income tax 1% 6% 3% 7% -55% 18% 4% Income tax expense and non-controlling interests
2% -1% 1% 0% 5% 2% 1%
Pro forma profit 1% 8% 4% 10% -78% 23% 5% Foreign exchange adjustments n/a n/a n/a n/a n/a n/a n/a
Underlying profit 1% 7% 4% 11% -78% 22% 6%

SEGMENT REVIEW
Australia Philip Chronican
48
Australia division comprises Retail, Commercial and Wealth segments. Retail includes Retail Distribution and Retail Products. Commercial includes Esanda, Regional Commercial Banking, Business Banking and Small Business Banking. Wealth includes Private Wealth and ANZ Funds Management and Insurance.
Australia division results are not impacted by exchange rate movements and therefore are presented on an underlying basis.
Half Year Movement
Mar 12
$M Sep 11
$M Mar 11
$M Mar 12
v. Sep 11 Mar 12
v. Mar 11
Net interest income 2,911 2,974 2,900 -2% 0%
Other external operating income 1,160 1,171 1,201 -1% -3%
Operating income 4,071 4,145 4,101 -2% -1%
Operating expenses (1,813) (1,758) (1,763) 3% 3%
Profit before credit impairment and income tax 2,258 2,387 2,338 -5% -3%
Provision for credit impairment (307) (296) (414) 4% -26%
Profit before tax 1,951 2,091 1,924 -7% 1%
Income tax expense and non-controlling interests (586) (627) (574) -7% 2%
Underlying profit 1,365 1,464 1,350 -7% 1%
Consisting of:
Retail 656 730 692 -10% -5%
Commercial 530 538 442 -1% 20%
Wealth 179 196 218 -9% -18%
Other - - (2) n/a -100%
Underlying profit 1,365 1,464 1,350 -7% 1%
Balance Sheet
Net loans & advances including acceptances 241,514 231,155 224,930 4% 7%
Other external assets 42,473 41,176 43,822 3% -3%
External assets 283,987 272,331 268,752 4% 6%
Deposits and other borrowings 135,880 128,490 121,096 6% 12%
Other external liabilities 47,932 46,625 50,114 3% -4%
External liabilities 183,812 175,115 171,210 5% 7%
Risk weighted assets 88,030 84,295 83,242 4% 6%
Average net loans and advances including acceptances 235,904 227,715 221,769 4% 6%
Average deposits and other borrowings 132,608 124,553 117,022 6% 13%
Ratios
Return on average assets 0.98% 1.08% 1.02%
Net interest average margin 2.45% 2.58% 2.60%
Operating expenses to operating income 44.5% 42.4% 43.0%
Operating expenses to average assets 1.31% 1.29% 1.33%
Individual provision charge 319 370 298 -14% 7%
Individual provision charge as a % of average net advances 0.27% 0.32% 0.27%
Collective provision charge (credit) (12) (74) 116 -84% large
Collective provision charge (credit) as a % of average net advances (0.01%) (0.06%) 0.10%
Net impaired assets 704 660 616 7% 14%
Net impaired assets as a % of net advances 0.29% 0.29% 0.27%
Total full time equivalent staff (FTE) 17,669 17,932 17,793 -1% -1%

SEGMENT REVIEW
Australia Philip Chronican
49
March 2012 half year compared to September 2011 half year
Profit decreased 7%, with profit before credit impairment and income tax down 5%.
Net interest income decreased 2% driven by a 13 basis points decline in net interest margin, which was partially offset by growth in both average deposits of 6% and average net loans and advances including acceptances of 4%.
Net interest margin declined 13 basis points as a result of pricing pressures on Retail and Commercial deposits and higher wholesale funding costs, which more than offset any benefit from asset repricing late in the half.
Growth in average net loans and advances was driven by above system growth in Mortgages, Small Business Banking and Business Banking. Average deposit growth was very strong, as Retail deposits grew 5% with the majority of growth coming through savings products, primarily Progress and Online Saver, and Mortgage Offset accounts. Average growth of 5% in Commercial deposits was driven by the Small Business Banking and Regional Commercial Banking portfolios.
Other external operating income decreased 1% due to Retail as higher interchange costs resulted in a reduction to merchant services fees, in addition to seasonally lower first half annual fees in Commercial Cards and lower international conversion fees in Consumer Cards. These were largely offset by an uplift in Wealth due to growth in Insurance from improvements in lapse experience and Funds Management driven by realisation of project benefits arising from investment management and custodial arrangements.
Operating expenses were up 3% largely due to inflationary impacts, annual salary increases in October 2011 and higher average FTE levels, which were partly offset by lower discretionary spend. Restructuring costs of $43 million incurred in the half were largely offset by a GST refund of $22 million and the release of existing provisions.
Provision for credit impairment increased 4% in the half, reflecting higher collective provisions, partially offset by lower individual provisions. The increase in collective provision charge was driven by the release of surplus flood provisions in the September half rather than any significant deterioration in the March half. The individual provision charge decreased by 14%, partly reflecting improving farm incomes and write-backs associated with the flood provisioned accounts. March 2012 half year compared to March 2011 half year
Profit increased 1%, with profit before credit impairment and income tax down 3%.
Net interest income was flat due to strong growth in average deposits of 13% and an increase in average net loans and advances of 6%, which were offset by a 15 basis points decline in net interest margin.
Growth in average net loans and advances was driven by Mortgages with a 7% increase in average volumes despite slowing growth in the overall system and improved growth across Commercial mainly through the Business Banking and Small Business Banking lending portfolios. Average deposit growth was very strong, with solid contributions from each of the Retail, Commercial and Wealth deposit portfolios.
Net Interest margin declined 15 basis points over the period as a result of pricing pressures on Retail and Commercial deposits and higher wholesale funding costs. These items more than offset any benefit from asset repricing activity.
Other external operating income decreased 3% due to Wealth as Insurance income declined 17% from deterioration in claims experience and reduced E*Trade income as adverse investor sentiment and subdued market returns impacted volumes along with the occurrence of a one off impairment charge.
Operating expenses were up 3% largely due to inflationary impacts, annual salary increases in October 2011, higher average FTE levels and uplift in restructuring costs, which were partly offset by tighter control of discretionary spending and lower incentive costs.
Provision for credit impairment decreased 26% reflecting a lower collective provision charge partly offset by an increase in individual provision charge. The increase in individual provision charge was predominantly driven by Retail with a large provision raised for a merchant facility. The collective provision reduction reflects the raising of the flood provisions in March 2011 and release of surplus flood provisions not required in current half combined with slower volume growth.

SEGMENT REVIEW
Australia Philip Chronican
50
Business operating segments
Half Year Movement
Retail
Mar 12 $M
Sep 11 $M
Mar 11 $M
Mar 12 v. Sep 11
Mar 12 v. Mar 11
Net interest income 1,688 1,749 1,720 -3% -2%
Other external operating income 451 468 450 -4% 0%
Operating income 2,139 2,217 2,170 -4% -1%
Operating expenses (1,002) (980) (961) 2% 4%
Profit before credit impairment and income tax 1,137 1,237 1,209 -8% -6%
Provision for credit impairment (199) (195) (224) 2% -11%
Profit before tax 938 1,042 985 -10% -5%
Income tax expense and non-controlling interests (282) (312) (293) -10% -4%
Underlying profit 656 730 692 -10% -5%
Risk weighted assets 46,948 43,765 43,457 7% 8%
Commercial
Net interest income 1,183 1,174 1,131 1% 5%
Other external operating income 135 137 131 -1% 3%
Operating income 1,318 1,311 1,262 1% 4%
Operating expenses (451) (433) (439) 4% 3%
Profit before credit impairment and income tax 867 878 823 -1% 5%
Provision for credit impairment (110) (107) (192) 3% -43%
Profit before tax 757 771 631 -2% 20%
Income tax expense and non-controlling interests (227) (233) (189) -3% 20%
Underlying profit 530 538 442 -1% 20%
Risk weighted assets 38,475 37,878 36,722 2% 5%
Wealth
Net interest income 37 46 44 -20% -16%
Other external operating income 574 567 620 1% -7%
Operating income 611 613 664 0% -8%
Operating expenses (356) (340) (357) 5% 0%
Profit before credit impairment and income tax 255 273 307 -7% -17%
Provision for credit impairment 2 6 2 -67% 0%
Profit before tax 257 279 309 -8% -17%
Income tax expense and non-controlling interests (78) (83) (91) -6% -14%
Underlying profit 179 196 218 -9% -18%
Risk weighted assets 2,186 2,235 2,498 -2% -12%

SEGMENT REVIEW
Australia Philip Chronican
51
Half Year Movement
Individual provision charge Mar 12
$M Sep 11
$M Mar 11
$M Mar 12
v. Sep 11 Mar 12
v. Mar 11 Retail 208 204 169 2% 23%
Mortgages 22 23 5 -4% large
Consumer Cards and Unsecured Lending
148 165 147 -10% 1%
Deposits 7 9 7 -22% 0%
Other 31 7 10 large large
Commercial 112 168 129 -33% -13%
Esanda 32 38 42 -16% -24%
Regional Commercial Banking 32 70 50 -54% -36%
Business Banking 22 33 16 -33% 38%
Small Business Banking 26 27 21 -4% 24%
Wealth (1) (2) - -50% n/a
Underlying individual provision charge 319 370 298 -14% 7%
Half Year Movement
Collective provision charge Mar 12
$M Sep 11
$M Mar 11
$M Mar 12
v. Sep 11 Mar 12
v. Mar 11
Retail (9) (9) 55 0% large
Mortgages (2) 2 10 large large
Consumer Cards and Unsecured Lending
1 4 20 -75% -95%
Deposits 1 (1) - large n/a
Other (9) (14) 25 -36% large
Commercial (2) (61) 63 -97% large
Esanda 9 (12) (3) large large
Regional Commercial Banking 3 2 (9) 50% large
Business Banking 1 (41) 5 large -80%
Small Business Banking 9 - 4 n/a large
Other (24) (10) 66 large large
Wealth (1) (4) (2) -75% -50%
Underlying collective provision charge (12) (74) 116 -84% large

SEGMENT REVIEW
Australia Philip Chronican
52
As at ($M) Movement
Net loans & advances including acceptances Mar 12 Sep 11 Mar 11 Mar 12
v. Sep 11 Mar 12
v. Mar 11 Retail 189,430 180,711 175,878 5% 8%
Mortgages 178,527 169,924 165,177 5% 8%
Consumer Cards & Unsecured Lending 8,153 8,154 8,052 0% 1%
Other 2,750 2,633 2,649 4% 4%
Commercial 49,339 47,835 46,196 3% 7%
Esanda 14,957 14,481 14,319 3% 4%
Regional Commercial Banking 13,648 13,575 13,071 1% 4%
Business Banking 16,332 15,634 14,991 4% 9%
Small Business Banking 4,432 4,178 3,910 6% 13%
Other (30) (33) (95) -9% -68%
Wealth 2,745 2,609 2,856 5% -4%
Underlying net loans & advances including acceptances 241,514 231,155 224,930 4% 7%
As at ($M) Movement
Customer deposits Mar 12 Sep 11 Mar 11 Mar 12
v. Sep 11 Mar 12
v. Mar 11
Retail 91,912 87,275 82,611 5% 11%
Mortgages 12,221 11,279 10,754 8% 14%
Consumer Cards and Unsecured Lending 233 268 248 -13% -6%
Deposits 79,359 75,619 71,515 5% 11%
Other 99 109 94 -9% 5%
Commercial 40,847 39,694 37,199 3% 10%
Esanda 129 203 314 -36% -59%
Regional Commercial Banking 11,358 10,776 10,317 5% 10%
Business Banking 13,537 13,605 13,042 0% 4%
Small Business Banking 15,823 15,110 13,526 5% 17%
Wealth 3,121 1,521 1,286 large large
Underlying customer deposits 135,880 128,490 121,096 6% 12%

SEGMENT REVIEW
Wealth Philip Chronican
53
Half Year Movement
Mar 12
$M Sep 11
$M Mar 11
$M Mar 12
v. Sep 11 Mar 12
v. Mar 11
Net interest income 37 46 44 -20% -16%
Other operating income 75 85 88 -12% -15%
Net funds management and insurance income 499 482 532 4% -6%
Operating income 611 613 664 0% -8%
Operating expenses (356) (340) (357) 5% 0%
Profit before credit impairment and income tax 255 273 307 -7% -17%
Provision for credit impairment 2 6 2 -67% 0%
Profit before income tax 257 279 309 -8% -17%
Income tax expense and non-controlling interests (78) (83) (91) -6% -14%
Profit after tax 179 196 218 -9% -18%
ANZ Funds Management and Insurance1 165 184 198 -10% -17%
Private Wealth & Other Wealth2 13 7 20 86% -35%
Wholesale Legacy 1 5 - -80% n/a
Profit after tax 179 196 218 -9% -18%
1. ANZ Funds Management and Insurance includes OnePath Group, ANZ Financial Planning, ANZ General insurance, Lender's Mortgage Insurance and Online Investment Account
2. Private Wealth and Other Wealth includes ANZ Private, ANZ Trustees, E*Trade, Investment Lending and Super Concepts and Other Wealth (excluding Wholesale Legacy)
Half Year Movement
Net funds management and insurance income
Mar 12 $M
Sep 11 $M
Mar 11
$M Mar 12
v. Sep 11 Mar 12
v. Mar 11 Net funds management income 198 189 200 5% -1%
Net insurance income 167 155 201 8% -17%
Net advice income 81 73 71 11% 14%
Capital investment earnings3 53 65 60 -18% -12%
Total
499 482
532 4% -6%
3. Includes yield on shareholder assets, interest and inflation rate impacts on risk and annuity reserves, and mark-to-market movement on capital-guaranteed reserves
Half Year Movement
Net insurance income
Mar 12 $M
Sep 11 $M
Mar 11
$M Mar 12
v. Sep 11 Mar 12
v. Mar 11
Planned profit margin
Group & Individual 178 166 167 7% 7%
General Insurance 20 22 23 -9% -13%
Experience profit4 (31) (36) 11 -14% large
Assumption changes5 - 3 - -100% n/a
Total
167 155
201 8% -17%
4. Experience profit variations are gains or losses arising from actual experience differing from plan on Group, Individual and General Insurance business 5. Assumption changes are gains or losses arising from a change in valuation methods and best estimate assumptions
Half Year Movement
Operating expenses
Mar 12 $M
Sep 11 $M
Mar 11
$M Mar 12
v. Sep 11 Mar 12
v. Mar 11
ANZ Funds Management and Insurance
(286) (259)
(281) 10% 2%
Private Wealth & Other Wealth
(70) (81)
(76) -14% -8%
Total
(356) (340)
(357) 5% 0%

SEGMENT REVIEW
Wealth Philip Chronican
54
Half Year
Performance measures
Mar 12
% Sep 11
% Mar 11
% Cost to income6 58.4% 55.5% 53.8%
Funds Management expenses to average funds under management
0.58% 0.60% 0.55%
Insurance expenses to in-force premiums
10.3% 8.7% 10.8%
Retail insurance lapse rates
14.0% 13.3% 12.1%
6. Cost to income ratio is operating expenses / operating income
As at ($M) Movement
Funds under management
Mar 12 Sep 11 Mar 11 Mar 12
v. Sep 11 Mar 12
v. Mar 11 Funds under management - average 41,554 43,127 44,974 -4% -8%
Funds under management - end of period 42,574 40,798 45,456 4% -6%
Composed of: Australian equities 13,368 12,675 16,127 5% -17%
Global equities 6,366 5,993 7,124 6% -11%
Cash and fixed interest 17,551 17,110 16,357 3% 7%
Property and infrastructure 2,639 2,516 2,936 5% -10%
ANZ Trustees 2,650 2,504 2,912 6% -9%
Total 42,574 40,798 45,456 4% -6%
Mar 12 In- Out- Other Sep 11
Funds Management cashflows $M flows flows flows7 $M
OneAnswer 15,900 1,124 (1,465) 1,049 15,192
Other Personal Investment 4,904 139 (438) 315 4,888
Mezzanine 1,038 49 (138) 31 1,096
Employer Super 12,745 831 (727) 716 11,925
Oasis 5,337 280 (475) 339 5,193
ANZ Trustees 2,650 53 (23) 116 2,504
Total 42,574 2,476 (3,266) 2,566 40,798
7. Other flows includes investment income net of taxes, fees and charges and distributions
As at ($M) Movement
Insurance annual in-force premiums
Mar 12 Sep 11 Mar 11 Mar 12
v. Sep 11 Mar 12
v. Mar 11
Group 408 502 462 -19% -12%
Individual 782 749 704 4% 11%
General Insurance 408 388 376 5% 9%
Total 1,598 1,639 1,542 -3% 4%
Insurance in-force book movement
Mar 12
$M
New business
$M
Lapses
$M
Sep 11
$M
Group 408 8 (102) 502
Individual 782 92 (59) 749
General Insurance 408 90 (70) 388
Total 1,598 190 (231) 1,639
As at Movement
Aligned adviser numbers
Mar 12 Sep 11 Mar 11 Mar 12
v. Sep 11 Mar 12
v. Mar 11
Group & aligned financial planners8 2,028 2,063 2,131 -2% -5%
8. Includes corporate authorised representatives of dealer groups wholly or partially controlled by OnePath Australia, and ANZ Group financial planners

SEGMENT REVIEW
Wealth Philip Chronican
55
Embedded value and value of new business (OnePath only)9 $M Embedded value as at September 2011 3,342
Value of new business10 105
Expected return11 154
Experience deviations and assumption changes12 (167)
Sub-total embedded value before economic assumption changes and net transfer 3,434
Economic assumptions change13 16
Net transfer14 (131)
Embedded value as at March 2012
3,319
9. Embedded value represents the present value of future profits and releases of capital arising from the business in force at the valuation date and adjusted net assets. It is determined using best estimate assumptions with franking credits included at 70% of face value. Projected cash flows have been discounted using capital asset pricing model risk discount rates of 9.00-10.75%
10. Value of new business represents the present value of future profits less the cost of capital arising from the new business written over the period 11. Expected return represents expected increase in value over the period 12. Experience deviations and assumption changes arise from deviations from and changes to best estimate assumptions underlying the prior year embedded value.
The adverse movement is primarily due to higher ongoing management expense assumption for investment business, higher lapse assumption for group insurance and worse than expected lapse experience for retail insurance business
13. Risk discount rates have reduced by 0-25 basis points over the six month period, leading to a positive impact on Embedded Value 14. Net transfer represents net capital movements over the period including shares issued ($31 million), cash dividends declared ($131 million) and value of franking
credits transferred ($31 million)
OnePath only As at ($M)
Total capital resource by equity class Mar 12 Sep 11
Share capital 1,945 1,914
Reserves 19 11
Retained earnings 530 530
Outside equity interest 6 7
Total OnePath Australia shareholder equity 2,500 2,462
Unsecured loan 432 432
Total OnePath Australia capital resource 2,932 2,894
Total capital resource by asset class International fixed interest 116 125
Australian fixed interest 207 181
Cash 1,401 1,413
Total OnePath Australia shareholder funds
1,724 1,719
Other including intangibles15 1,208 1,175
Total OnePath Australia capital resource
2,932 2,894
15. Intangibles include goodwill, deferred acquisition cost and capitalised software

SEGMENT REVIEW
Wealth Philip Chronican
56
March 2012 half year compared to September 2011 half year
Wealth profit after tax was $17 million (9%) lower mainly due to increase in the operating expense base as a result of investments in growth initiatives as well as higher funding costs and a decline in trading volume in E*Trade partially offset by higher net insurance income and net funds management income.
Net interest income was lower due to higher funding costs in Private Wealth.
Other operating income was $10 million (12%) lower predominantly driven by adverse investor sentiment and the uncertain economic environment which negatively impacted on volumes and unfavourable claims experience in the lenders mortgage insurance business.
Funds management net income was 5% higher and is mainly driven by realisation of project benefits arising from investment management and custodial arrangements.
Net insurance income increased as a result of the growth in the individual in-force book as well as improvements in lapse experience in the business offset by a deterioration in claims experience.
Net advice income was marginally higher than prior half mainly due to growth in the distribution business driven by productivity benefits.
Operating expenses increased 5% from the prior half as a result of seasonality as well as continued investments in growth initiatives and inflationary cost growth. March 2012 half year compared to March 2011 half year
Wealth profit after tax was $39 million lower mainly due to a deterioration in claims experience in the insurance business as well as reduced trading volumes in E*Trade coupled with a one off impairment charge and higher funding costs.
Net interest income declined by $7 million (16%) mainly due to margin compression as a result of higher funding costs arising from the economic and financial crisis in Europe and the run off of the legacy loan book.
Other operating income declined by 15% which was predominantly driven by adverse investor sentiment and subdued investment market returns negatively impacting on volumes as well as a one off impairment charge.
Net funds management income was marginally lower and is in line with the decline in average funds under management offset by the realisation of project benefits arising from investment management and custodial arrangements.
Net insurance income decreased by $34 million (17%). This is a result of the deterioration in claims experience marginally offset by a small improvement in lapse experience.
Net advice income was $10 million (14%) higher reflecting growth in the distribution business arising from productivity benefits.
Operating expenses were flat as costs from growth initiatives were offset by lower discretionary spend.

SEGMENT REVIEW
Wealth Philip Chronican
57
This page has been left blank intentionally

SEGMENT REVIEW
Asia Pacific, Europe & America Alex Thursby
58
Asia Pacific, Europe & America (APEA) division includes: Retail, which provides retail and small business banking services and investment and insurance products and services for Asia Pacific customers; Asia Partnerships, which is a portfolio of strategic partnerships in Asia; and Institutional, which offers a full range of financial services to institutional customers.
APEA division results are reported in USD and therefore are presented on an underlying basis. AUD pro forma results are shown on page 93.
Half Year Movement
Mar 12 USD M
Sep 11 USD M
Mar 11 USD M
Mar 12 v. Sep 11
Mar 12 v. Mar 11
Net interest income 705 609 563 16% 25%
Other external operating income 737 686 712 7% 4%
Operating income 1,442 1,295 1,275 11% 13%
Operating expenses (846) (796) (733) 6% 15%
Profit before credit impairment and income tax 596 499 542 19% 10%
Provision for credit impairment (49) (70) (43) -30% 14%
Profit before income tax 547 429 499 28% 10%
Income tax expense and non-controlling interests (115) (71) (111) 62% 4%
Underlying profit 432 358 388 21% 11%
Consisting of:
Retail 67 50 57 34% 18%
Asia Partnerships 125 176 151 -29% -17%
Institutional 316 180 250 76% 26%
Relationship & Infrastructure (76) (48) (70) 58% 9%
Underlying profit 432 358 388 21% 11%
Balance Sheet
Net loans & advances including acceptances 42,356 37,736 31,976 12% 32%
Other external assets 58,174 48,002 34,938 21% 67%
External assets 100,530 85,738 66,914 17% 50%
Customer deposits 73,613 63,080 54,552 17% 35%
Other deposits and borrowings 7,937 7,273 5,343 9% 49%
Deposits and other borrowings
81,550 70,353 59,895 16% 36%
Other external liabilities 22,556 20,173 15,461 12% 46%
External liabilities 104,106 90,526 75,356 15% 38%
Risk weighted assets 65,732 55,695 49,128 18% 34%
Average net loans and advances including acceptances 40,078 36,173 29,313 11% 37%
Average deposits and other borrowings 74,728 67,075 56,944 11% 31%
Ratios
Return on average assets 0.85% 0.80% 1.04%
Net interest average margin 1.58% 1.55% 1.74%
Net interest average margin (excluding Global Markets) 2.60% 2.63% 2.98%
Operating expenses to operating income 58.7% 61.5% 57.5%
Operating expenses to average assets 1.66% 1.79% 1.96%
Individual provision charge 54 80 51 -33% 6%
Individual provision charge as a % of average net advances 0.27% 0.44% 0.35%
Collective provision charge (credit) (5) (10) (8) -50% -38%
Collective provision charge (credit) as a % of average net advances (0.03%) (0.06%) (0.05%)
Net impaired assets 313 276 283 13% 11%
Net impaired assets as a % of net advances 0.74% 0.73% 0.89%
Total full time equivalent staff (FTE) 10,726 10,701 10,719 0% 0%

SEGMENT REVIEW
Asia Pacific, Europe & America Alex Thursby
59
Commentary reflects USD results March 2012 half year compared to September 2011 half year
Profit increased 21%, driven by strong earnings growth in the Institutional business which increased 76% mainly due to strong performances in Global Markets and Transaction Banking. Global Markets benefited from a recovery in trading income and delivered solid growth in customer-driven revenue. The gain on sale of a credit card portfolio in Taiwan contributed to the higher Retail earnings. Asia Partnerships’ profit contribution was impacted by the impairment charge relating to the carrying value of our investment in Saigon Securities Incorporation (SSI) and lower earnings from Shanghai Rural Commercial Bank (SRCB) but partially offset by the gain on sale of the investment in Saigon Thuong Tin Commercial Joint-Stock Bank (Sacombank).
Key factors affecting the result were:
• Net interest income increased 16% compared with the September 2011 half year, driven by balance sheet growth and loan repricing in the Institutional business.
• Other external operating income grew 7%. Strong growth in fees and other income by Global Markets and the gain on sale of the credit card portfolio were partially offset by the SSI impairment charge and lower earnings from Asia Partnerships.
• Operating expenses increased 6%, reflecting continued but targeted investments in systems, expanding distribution and building front line capability across the region. Employee numbers were similar to the September 2011 half year.
• Provision charges for credit impairment decreased 30%. Individual provision charges were 33% lower due to higher recoveries in the March 2012 half year achieved mainly in the Retail businesses in Asia (in particular, Taiwan) and higher charges in the September 2011 half year arising from a small number of legacy Institutional positions. Collective provision charges were higher for the March 2012 half year due to the release in the September 2011 half year following the de-risking of the previously RBS-owned portfolios.
• Net loans and advances increased 12% and customer deposits 17% with the maturity profile of deposits lengthened.
• Net interest margin was maintained with increased deposit and funding costs largely offset by asset repricing. March 2012 half year compared to March 2011 half year
Profit increased 11% driven by continued growth in the Institutional business (in particular, Global Markets and Transaction Banking). Earnings from the Retail business for the March 2012 and 2011 half years included the gains on sale of the credit card portfolios in Taiwan.
Key factors affecting the result were:
• Net interest income was 25% higher with solid balance sheet growth across all business lines.
• Other external operating income increased 4%. Higher contributions from Global Markets and Transaction Banking were partially offset by lower earnings from Asia Partnerships.
• Operating expenses increased 15%, reflecting continued investments in systems and build-up of regional revenue generating staff and support capabilities. Employee numbers were similar to the March 2011 half year.
• Provision charges for credit impairment were 14% higher compared with the March 2011 half year. Individual provision charges were 6% higher with the charges arising from a small number of legacy Institutional positions, partially offset by higher recoveries in the Retail businesses in Asia (in particular, Taiwan). Higher collective provision charges for the March 2012 half year were driven by growth in loans and advances.
• Net loans and advances increased 32% and customer deposits 35% across all business lines.
• Net interest margin was lower, reflecting increased pricing competition and the product mix impact of de-risking the portfolio.

SEGMENT REVIEW
Asia Pacific, Europe & America Alex Thursby
60
Table reflects USD
Business operating segments
Half Year Movement
Retail
Mar 12 USD M
Sep 11 USD M
Mar 11 USD M
Mar 12 v. Sep 11
Mar 12 v. Mar 11
Net interest income 301 296 278 2% 8%
Other external operating income 188 176 175 7% 7%
Operating income 489 472 453 4% 8%
Operating expenses (397) (383) (359) 4% 11%
Profit before credit impairment and income tax 92 89 94 3% -2%
Provision for credit impairment 4 (21) (17) large large
Profit before income tax 96 68 77 41% 25%
Income tax expense and non-controlling interests (29) (18) (20) 61% 45%
Underlying profit 67 50 57 34% 18%
Risk weighted assets 13,169 11,601 10,252 14% 28%
Asia Partnerships
Net interest income (31) (30) (28) 3% 11%
Other external operating income 154 202 191 -24% -19%
Operating income 123 172 163 -28% -25%
Operating expenses (4) (6) (3) -33% 33%
Profit before credit impairment and income tax 119 166 160 -28% -26%
Provision for credit impairment - - - n/a n/a
Profit before income tax 119 166 160 -28% -26%
Income tax expense and non-controlling interests 6 10 (9) -40% large
Underlying profit 125 176 151 -29% -17%
Risk weighted assets n/a n/a n/a n/a n/a
Institutional
Net interest income 430 333 306 29% 41%
Other external operating income 393 304 346 29% 14%
Operating income 823 637 652 29% 26%
Operating expenses (361) (355) (293) 2% 23%
Profit before credit impairment and income tax 462 282 359 64% 29%
Provision for credit impairment (56) (57) (27) -2% large
Profit before income tax 406 225 332 80% 22%
Income tax expense and non-controlling interests (90) (45) (82) 100% 10%
Underlying profit 316 180 250 76% 26%
Risk weighted assets 51,742 42,167 38,203 23% 35%
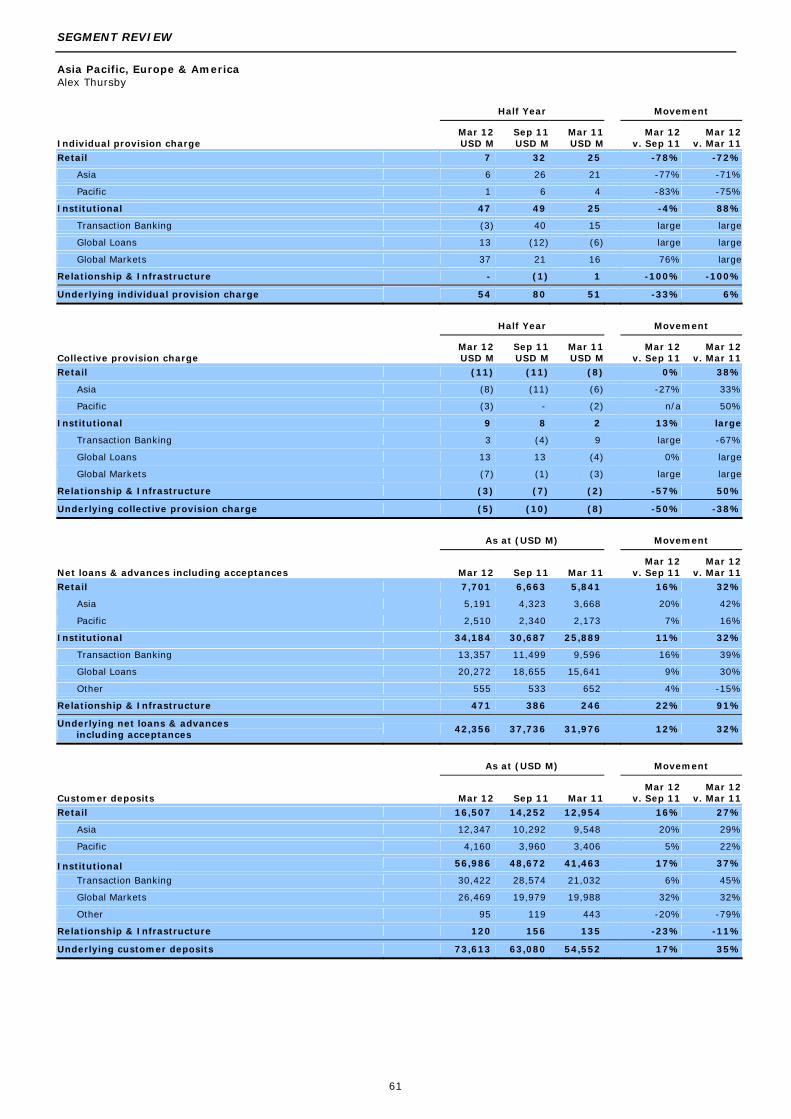
SEGMENT REVIEW
Asia Pacific, Europe & America Alex Thursby
61
Half Year Movement
Individual provision charge Mar 12 USD M
Sep 11 USD M
Mar 11 USD M
Mar 12 v. Sep 11
Mar 12 v. Mar 11
Retail 7 32 25 -78% -72%
Asia 6 26 21 -77% -71%
Pacific 1 6 4 -83% -75%
Institutional 47 49 25 -4% 88%
Transaction Banking (3) 40 15 large large
Global Loans 13 (12) (6) large large
Global Markets 37 21 16 76% large
Relationship & Infrastructure - (1) 1 -100% -100%
Underlying individual provision charge 54 80 51 -33% 6%
Half Year Movement
Collective provision charge Mar 12 USD M
Sep 11 USD M
Mar 11 USD M
Mar 12 v. Sep 11
Mar 12 v. Mar 11
Retail (11) (11) (8) 0% 38%
Asia (8) (11) (6) -27% 33%
Pacific (3) - (2) n/a 50%
Institutional 9 8 2 13% large
Transaction Banking 3 (4) 9 large -67%
Global Loans 13 13 (4) 0% large
Global Markets (7) (1) (3) large large
Relationship & Infrastructure (3) (7) (2) -57% 50%
Underlying collective provision charge (5) (10) (8) -50% -38%
As at (USD M) Movement
Net loans & advances including acceptances Mar 12 Sep 11 Mar 11 Mar 12
v. Sep 11 Mar 12
v. Mar 11
Retail 7,701 6,663 5,841 16% 32%
Asia 5,191 4,323 3,668 20% 42%
Pacific 2,510 2,340 2,173 7% 16%
Institutional 34,184 30,687 25,889 11% 32%
Transaction Banking 13,357 11,499 9,596 16% 39%
Global Loans 20,272 18,655 15,641 9% 30%
Other 555 533 652 4% -15%
Relationship & Infrastructure 471 386 246 22% 91%
Underlying net loans & advances including acceptances 42,356 37,736 31,976 12% 32%
As at (USD M) Movement
Customer deposits Mar 12 Sep 11 Mar 11 Mar 12
v. Sep 11 Mar 12
v. Mar 11
Retail 16,507 14,252 12,954 16% 27%
Asia 12,347 10,292 9,548 20% 29%
Pacific 4,160 3,960 3,406 5% 22%
Institutional 56,986 48,672 41,463 17% 37%
Transaction Banking 30,422 28,574 21,032 6% 45%
Global Markets 26,469 19,979 19,988 32% 32%
Other 95 119 443 -20% -79%
Relationship & Infrastructure 120 156 135 -23% -11%
Underlying customer deposits 73,613 63,080 54,552 17% 35%
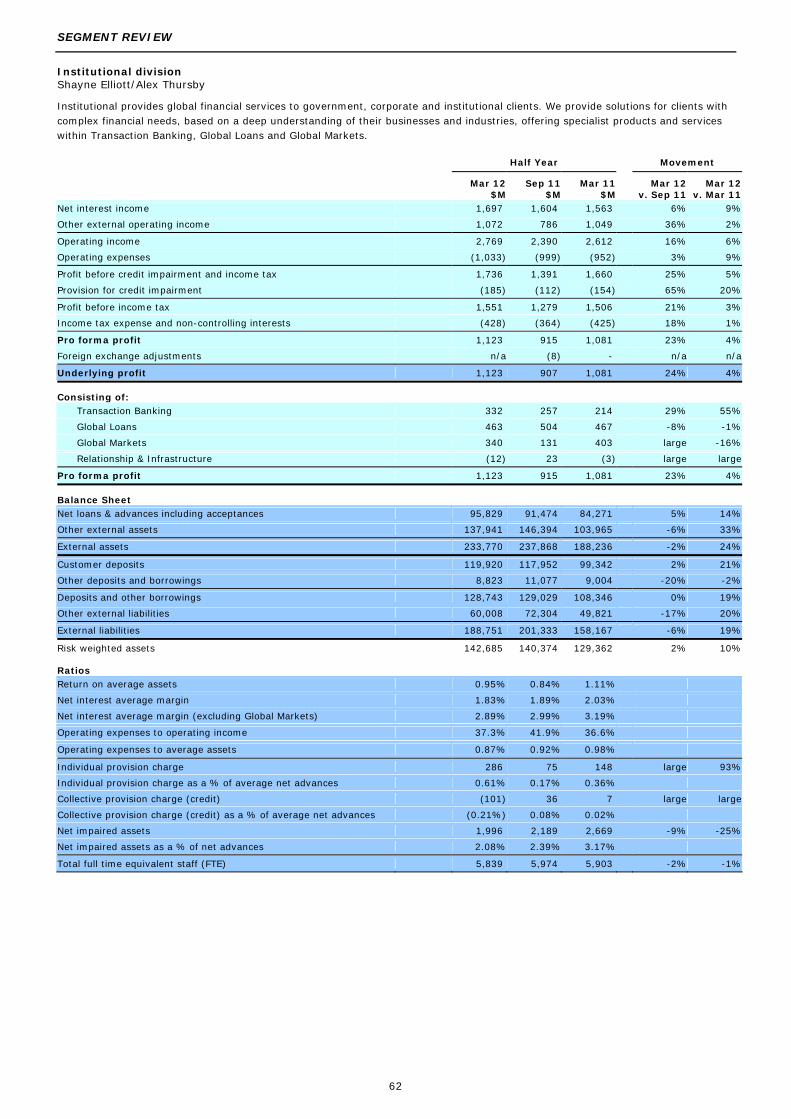
SEGMENT REVIEW
Institutional division Shayne Elliott/Alex Thursby
62
Institutional provides global financial services to government, corporate and institutional clients. We provide solutions for clients with complex financial needs, based on a deep understanding of their businesses and industries, offering specialist products and services within Transaction Banking, Global Loans and Global Markets. Half Year Movement
Mar 12
$M Sep 11
$M Mar 11
$M Mar 12
v. Sep 11 Mar 12
v. Mar 11 Net interest income 1,697 1,604 1,563 6% 9%
Other external operating income 1,072 786 1,049 36% 2%
Operating income 2,769 2,390 2,612 16% 6%
Operating expenses (1,033) (999) (952) 3% 9%
Profit before credit impairment and income tax 1,736 1,391 1,660 25% 5%
Provision for credit impairment (185) (112) (154) 65% 20%
Profit before income tax 1,551 1,279 1,506 21% 3%
Income tax expense and non-controlling interests (428) (364) (425) 18% 1%
Pro forma profit 1,123 915 1,081 23% 4%
Foreign exchange adjustments n/a (8) - n/a n/a
Underlying profit 1,123 907 1,081 24% 4%
Consisting of:
Transaction Banking 332 257 214 29% 55%
Global Loans 463 504 467 -8% -1%
Global Markets 340 131 403 large -16%
Relationship & Infrastructure (12) 23 (3) large large
Pro forma profit 1,123 915 1,081 23% 4%
Balance Sheet
Net loans & advances including acceptances 95,829 91,474 84,271 5% 14%
Other external assets 137,941 146,394 103,965 -6% 33%
External assets 233,770 237,868 188,236 -2% 24%
Customer deposits 119,920 117,952 99,342 2% 21%
Other deposits and borrowings 8,823 11,077 9,004 -20% -2%
Deposits and other borrowings 128,743 129,029 108,346 0% 19%
Other external liabilities 60,008 72,304 49,821 -17% 20%
External liabilities 188,751 201,333 158,167 -6% 19%
Risk weighted assets 142,685 140,374 129,362 2% 10%
Ratios
Return on average assets 0.95% 0.84% 1.11%
Net interest average margin 1.83% 1.89% 2.03%
Net interest average margin (excluding Global Markets) 2.89% 2.99% 3.19%
Operating expenses to operating income 37.3% 41.9% 36.6%
Operating expenses to average assets 0.87% 0.92% 0.98%
Individual provision charge 286 75 148 large 93%
Individual provision charge as a % of average net advances 0.61% 0.17% 0.36%
Collective provision charge (credit) (101) 36 7 large large
Collective provision charge (credit) as a % of average net advances (0.21%) 0.08% 0.02%
Net impaired assets 1,996 2,189 2,669 -9% -25%
Net impaired assets as a % of net advances 2.08% 2.39% 3.17%
Total full time equivalent staff (FTE) 5,839 5,974 5,903 -2% -1%

SEGMENT REVIEW
Institutional division Shayne Elliott/Alex Thursby
63
March 2012 half year compared to September 2011 half year
Pro forma profit increased 23% underpinned by strong earnings growth from our priority products of Foreign Exchange, Capital Markets, Cash & Trade and customer segments of Resources, Utilities & Infrastructure, Agribusiness and Financial Institutions. The result shows our increasingly diversified geographic mix with APEA earnings contribution up 74%. Global revenues increased 16%, buoyed by trading and balance sheet revenues following the particularly difficult market conditions in second half 2011.
APEA revenues grew 29% and now represent 29% of Institutional revenue, with Global markets increasing 45% reflecting the investment in capabilities throughout the region. Australia delivered 13% revenue growth, after the particularly challenging market conditions in the prior half.
Customer revenues increased 7% with Resources up 20% and Financial Institutions growing at 15%. Both Agribusiness and Infrastructure were lower for the half with significant deals booked in the prior half. Over 870 new relationships were acquired during the half year.
Our strategic priority product segments grew by 15%,
• Payments and Cash Management revenues grew 9% on the back of investment in our “Transactive” cash management platforms – with more than 9,660 registered clients and key geographical coverage including Singapore, Hong Kong and Pacific.
• Trade revenues (excluding Guarantees) were up 22% with 45% growth in Asia driven by a sales focus and strong local market demand.
• Markets sales were up 16% and FX revenues increased 14% with FX sales revenues now representing 51% of total Global Markets sales revenues.
• Global Capital Markets revenue is up 38% for the half driven by success in Asia Pacific where ANZ sits 4th on the DCM bond league table (ex-Japan).
Net interest margin (excluding Global Markets) was down 10 basis points with margin compression in the Australia lending book as the credit repricing post GFC runs off and impact of geographic mix with increase in volumes in the lower spread Asia region. Net loans and advances (excluding acceptances) were up $5.0 billion, 5%, with APEA growth of $1.5 billion (5%). Australian lending was up $3.2 billion for the half.
Expenses increased 3% with amortisation and restructuring initiatives the main driver.
Provision for credit impairment increased by 65%, reflecting lower recoveries compared to second half 2011 and a $32 million transfer of derivative credit valuation adjustment recorded in income to the credit impairment provision relating to impaired derivatives. The increase in individual provision also included crystallisation of losses on long standing problem accounts previously covered by collective provisions.
Customer deposit growth continues to be a focus with continued geographic diversification with APEA accounting for 46% of our customer deposit base. March 2012 half year compared to March 2011 half year
Pro forma profit increased 4%, subdued by the strong first half Global Markets results in 2011. Overall total revenue increased 6% with Transaction Banking up 25%, Global Markets up 3% but offset by a fall of 2% in Global Loans.
Our priority product and customer segments continued to deliver strong results:
• Customer revenue increased $225 million (10%) and over 1600 new relationships were acquired. The priority corporate sectors of natural resources, agribusiness and infrastructure grew at 17% and Financial Institutions grew 25%.
• Customer deposit growth was 21%. APEA deposit growth of $14.6 billion reflecting our geographic diversification strategy and $5.2 billion in Australia reducing the funding gap. Deposit raising in Europe and America also leveraging our AA rating made up 47% of the APEA growth.
• Our diversification across the super-region was evidenced by a 31% growth in lending in APEA, with the Asian lending book growing 32% and APEA now representing 35% of the loan portfolio.
• Markets sales as a proportion of Markets revenues were up 8% to 61% with FX revenues increasing by 23%.
• Net interest margin (excluding Markets) declined 30 basis points due to competitive pressures in the domestic market, geographic diversification with growth skewed to lower spread Asian region, and relative growth in shorter dated trade assets.
Expenses grew at 9% with ongoing investment in strategic capability builds including cash management and payments infrastructure as well as restructuring in Australia and New Zealand. Expense growth in Asia reflected the build out of foreign exchange capability and investment in cash platforms.
Provisions for credit impairment increased 20% reflecting higher individual provisions (up by $138 million) arising from several industries including Property, Finance and Manufacturing and settlement of Primebroker Securities, offset by a reduction in collective provision charges (down by $108 million) driven by settlement of legacy issues, some upgrades and exits of high risk customers.

SEGMENT REVIEW
Institutional division Shayne Elliott/Alex Thursby
64
Business operating segments
Half Year Movement
Transaction Banking
Mar 12 $M
Sep 11 $M
Mar 11 $M
Mar 12 v. Sep 11
Mar 12 v. Mar 11
Net interest income 431 356 326 21% 32%
Other external operating income 319 312 275 2% 16%
Operating income 750 668 601 12% 25%
Operating expenses (296) (293) (286) 1% 3%
Profit before credit impairment and income tax 454 375 315 21% 44%
Provision for credit impairment 9 (15) (21) large large
Profit before income tax 463 360 294 29% 57%
Income tax expense and non-controlling interests (131) (103) (80) 27% 64%
Pro forma profit 332 257 214 29% 55%
Foreign exchange adjustments n/a - 1 n/a n/a
Underlying profit 332 257 215 29% 54%
Risk weighted assets 28,169 24,189 21,649 16% 30%
Global Loans
Net interest income 919 933 943 -2% -3%
Other external operating income 97 89 94 9% 3%
Operating income 1,016 1,022 1,037 -1% -2%
Operating expenses (253) (255) (244) -1% 4%
Profit before credit impairment and income tax 763 767 793 -1% -4%
Provision for credit impairment (134) (78) (138) 72% -3%
Profit before income tax 629 689 655 -9% -4%
Income tax expense and non-controlling interests (166) (185) (188) -10% -12%
Pro forma profit 463 504 467 -8% -1%
Foreign exchange adjustments n/a (1) 3 n/a n/a
Underlying profit 463 503 470 -8% -1%
Risk weighted assets 81,985 83,940 78,740 -2% 4%
Global Markets
Net interest income 342 320 293 7% 17%
Other external operating income 642 360 662 78% -3%
Operating income 984 680 955 45% 3%
Operating expenses (453) (460) (411) -2% 10%
Profit before credit impairment and income tax 531 220 544 large -2%
Provision for credit impairment (60) (17) 19 large large
Profit before income tax 471 203 563 large -16%
Income tax expense and non-controlling interests (131) (72) (160) 82% -18%
Pro forma profit 340 131 403 large -16%
Foreign exchange adjustments n/a (6) (4) n/a n/a
Underlying profit 340 125 399 large -15%
Risk weighted assets 32,324 31,951 28,436 1% 14%

SEGMENT REVIEW
Institutional division Shayne Elliott/Alex Thursby
65
Analysis of Global Markets income
Half Year Movement
Composition of Global Markets pro forma income by product class
Mar 12
$M Sep 11
$M Mar 11
$M Mar 12
v. Sep 11 Mar 12
v. Mar 11
Fixed income
411 215 409 91% 0%
Foreign exchange
381 334 309 14% 23%
Capital markets
83 60 74 38% 12%
Other
109 71 163 54% -33%
Pro forma Global Markets income
984 680 955 45% 3%
Half Year Movement
Composition of Global Markets pro forma income by geography
Mar 12
$M Sep 11
$M Mar 11
$M Mar 12
v. Sep 11 Mar 12
v. Mar 11
Australia
472 283 516 67% -9%
Asia Pacific, Europe & America
387 272 322 42% 20%
New Zealand
125 125 117 0% 7%
Pro forma Global Markets income
984 680 955 45% 3%
Half Year Movement
Composition of Global Markets Pro Forma income by activity
Mar 12
$M Sep 11
$M Mar 11
$M Mar 12
v. Sep 11 Mar 12
v. Mar 11
Sales1 604 522 507 16% 19%
Trading2 229 71 259 large -12%
Balance sheet3 151 87 189 74% -20%
Pro forma Global Markets income
984 680 955 45% 3%
Half Year Movement
Composition of Global Markets' Sales pro forma income by geography1
Mar 12 $M
Sep 11 $M
Mar 11 $M
Mar 12 v. Sep 11
Mar 12 v. Mar 11
Australia 297 258 254 15% 17%
Asia Pacific, Europe & America
231 200 196 16% 18%
New Zealand 76 64 57 19% 33%
Pro forma Global Markets' Sales income
604 522 507 16% 19%
Half Year Movement
Composition of Global Markets' Trading and Balance Sheet pro forma income by geography2,3
Mar 12 $M
Sep 11 $M
Mar 11 $M
Mar 12 v. Sep 11
Mar 12 v. Mar 11
Australia 175 25 262 large -33%
Asia Pacific, Europe & America 156 72 126 large 24%
New Zealand 49 61 60 -20% -18%
Pro forma Global Markets' Trading and Balance Sheet income
380 158 448 large -15%
1. Sales represents direct client flow business on core products such as fixed income, FX, commodities and capital markets 2. Trading represents management of the Group’s strategic positions and those taken as part of direct client sales flow 3. Balance sheet represents hedging of interest rate risk on the Group’s loan and deposit books and the management of the Group’s liquidity portfolio

SEGMENT REVIEW
Institutional division Shayne Elliott/Alex Thursby
66
Market risk
Traded market risk
Below are aggregate Value at Risk (VaR) exposures at 97.5% and 99% confidence levels covering both physical and derivatives trading positions for the Bank’s principal trading centres. All figures are in AUD.
97.5% confidence level (1 day holding period) As at High for Low for Avg for As at High for Low for Avg for Mar 12 period period period Sep 11 year year year Mar 12 Mar 12 Mar 12 Sep 11 Sep 11 Sep 11 $M $M $M $M $M $M $M $M Value at Risk at 97.5% confidence
Foreign exchange 3.5 6.9 2.8 4.5 6.0 7.9 0.8 3.1
Interest rate 5.2 6.0 3.5 4.6 4.7 16.1 4.2 9.4
Credit 4.4 5.3 2.7 3.4 3.4 8.5 2.4 5.4
Commodities 2.2 3.2 1.3 2.4 2.0 4.3 1.6 2.6
Equity 1.2 2.9 0.9 1.3 2.5 2.5 0.4 0.9
Diversification benefit (8.4) n/a n/a (8.7) (10.4) n/a n/a (10.3)
Total VaR 8.1 9.2 5.7 7.5 8.2 18.8 5.7 11.1
99% confidence level (1 day holding period)
Value at Risk at 99% confidence
Foreign exchange 4.9 8.9 4.3 6.2 7.8 10.9 1.0 4.2
Interest rate 6.4 8.0 4.7 6.1 7.0 26.4 5.4 13.5
Credit 5.9 7.2 3.6 4.7 4.9 10.5 3.2 6.9
Commodities 3.2 4.8 2.0 3.5 3.2 6.5 2.4 4.1
Equity 1.4 4.0 1.1 1.9 3.4 3.5 0.6 1.3
Diversification benefit (11.9) n/a n/a (12.4) (14.6) n/a n/a (14.2)
Total VaR 9.9 13.6 7.6 10.0 11.7 29.5 8.3 15.8
Non-traded interest rate risk
Non-traded interest rate risk is managed by Global Markets and relates to the potential adverse impact of changes in market interest rates on future net interest income for the Group. Interest rate risk is reported using various techniques including VaR and scenario analysis to a 1% rate shock.
97.5% confidence level (1 day holding period)
As at High for Low for Avg for As at High for Low for Avg for Mar 12 period period period Sep 11 year year year Mar 12 Mar 12 Mar 12 Sep 11 Sep 11 Sep 11 $M $M $M $M $M $M $M $M Value at Risk at 97.5% confidence
Australia 14.5 14.5 9.9 12.7 12.2 20.1 10.5 14.4
New Zealand 12.0 12.0 9.3 10.7 8.1 13.5 7.9 9.3
Asia Pacific, Europe & America 3.8 4.2 3.7 3.9 3.9 5.5 2.3 3.5
Diversification benefit (13.4) n/a n/a (11.4) (9.7) n/a n/a (8.0)
Total VaR 16.9 17.6 13.4 15.9 14.5 26.5 13.2 19.2
Impact of 1% rate shock on the next 12 months’ net interest income1
As at
Mar 12 Sep 11
As at period end
1.87% 1.36%
Maximum exposure
2.40% 1.51%
Minimum exposure
1.28% 0.50%
Average exposure (in absolute terms)
1.81% 1.08%
1. The impact is expressed as a percentage of net interest income. A positive result indicates that a rate increase is positive for net interest income. Conversely, a negative indicates a rate increase is negative for net interest income.

SEGMENT REVIEW
Institutional division Shayne Elliott/Alex Thursby
67
Half Year Movement
Individual provision charge Mar 12
$M Sep 11
$M Mar 11
$M Mar 12
v. Sep 11 Mar 12
v. Mar 11 Australia 245 33 130 large 88%
Asia Pacific, Europe & America 45 47 24 -4% 88%
New Zealand (4) (4) (7) 0% -43%
Pro forma individual provision charge 286 76 147 large 95%
Foreign exchange adjustments n/a 1 1 n/a n/a
Underlying individual provision charge 286 75 148 large 93%
Half Year Movement
Collective provision charge/(release) Mar 12
$M Sep 11
$M Mar 11
$M Mar 12
v. Sep 11 Mar 12
v. Mar 11
Australia (111) 36 7 large large
Asia Pacific, Europe & America 9 9 2 0% large
New Zealand 1 (9) (3) large large
Pro forma collective provision charge/(release) (101) 36 7 large large
Foreign exchange adjustments n/a - - n/a n/a
Underlying collective provision charge/(release) (101) 36 7 large large
As at ($M) Movement
Net loans & advances including acceptances Mar 12 Sep 11 Mar 11 Mar 12
v. Sep 11 Mar 12
v. Mar 11
Australia 57,260 54,559 54,015 5% 6%
Asia Pacific, Europe & America 32,866 31,535 25,055 4% 31%
New Zealand 5,703 5,380 5,201 6% 10%
Underlying net loans & advances including acceptances
95,829 91,474 84,271 5% 14%
As at ($M) Movement
Customer deposits Mar 12 Sep 11 Mar 11 Mar 12
v. Sep 11 Mar 12
v. Mar 11
Australia 55,823 58,753 50,615 -5% 10%
Asia Pacific, Europe & America 54,789 50,018 40,128 10% 37%
New Zealand 9,308 9,181 8,599 1% 8%
Underlying customer deposits 119,920 117,952 99,342 2% 21%

SEGMENT REVIEW
New Zealand David Hisco
68
New Zealand comprises Retail, Commercial and Wealth. Retail provides a full range of banking services to personal customers. Commercial includes Commercial & Agri and Business Banking. Wealth includes Private Banking and OnePath New Zealand.
New Zealand’s results are reported in NZD and therefore are presented on an underlying basis. AUD pro forma results are shown on page 94.
Half Year Movement
Mar 12 NZD M
Sep 11 NZD M
Mar 11 NZD M
Mar 12 v. Sep 11
Mar 12 v. Mar 11
Net interest income 1,162 1,129 1,121 3% 4%
Other external operating income 311 307 301 1% 3%
Operating income 1,473 1,436 1,422 3% 4%
Operating expenses (663) (664) (661) 0% 0%
Profit before credit impairment and income tax 810 772 761 5% 6%
Provision for credit impairment (102) (119) (98) -14% 4%
Profit before income tax 708 653 663 8% 7%
Income tax expense and non-controlling interests (193) (190) (194) 2% -1%
Underlying profit 515 463 469 11% 10%
Consisting of:
Retail 169 143 136 18% 24%
Commercial 305 288 306 6% 0%
Wealth 41 32 27 28% 52%
Underlying profit 515 463 469 11% 10%
Balance Sheet
Net loans & advances including acceptances 86,576 86,766 88,402 0% -2%
Other external assets 2,316 2,670 2,716 -13% -15%
External assets 88,892 89,436 91,118 -1% -2%
Customer deposits
52,287 50,235 51,054 4% 2%
Other deposits and borrowings
4,454 4,783 2,861 -7% 56%
Deposits and other borrowings 56,741 55,018 53,915 3% 5%
Other external liabilities 16,548 16,822 18,157 -2% -9%
External liabilities 73,289 71,840 72,072 2% 2%
Risk weighted assets 47,744 48,743 51,000 -2% -6%
Average net loans and advances including acceptances 86,406 87,583 88,837 -1% -3%
Average deposits and other borrowings 55,183 54,116 55,171 2% 0%
Ratios
Return on average assets 1.16% 1.02% 1.02%
Net interest average margin 2.65% 2.53% 2.49%
Operating expenses to operating income 45.0% 46.3% 46.5%
Operating expenses to average assets 1.49% 1.46% 1.44%
Individual provision charge 136 174 159 -22% -14%
Individual provision charge as a % of average net advances 0.31% 0.40% 0.36%
Collective provision charge (credit) (34) (55) (61) -38% -44%
Collective provision charge (credit) as a % of average net advances (0.08%) (0.13%) (0.14%)
Net impaired assets 1,165 1,298 1,669 -10% -30%
Net impaired assets as a % of net advances 1.34% 1.49% 1.89%
Total full time equivalent staff (FTE) 8,651 8,884 9,022 -3% -4%

SEGMENT REVIEW
New Zealand David Hisco
69
Commentary reflects NZD results March 2012 half year compared to September 2011 half year
Business momentum has been maintained into the first half of 2012 notwithstanding the subdued economic conditions that in New Zealand have been characterised by protracted weakness in credit growth. Financial performance improved despite the moderating impact of flat lending volumes, and good progress has been made in simplifying the business. This is realising cost efficiencies that are contributing to an improving cost to income ratio. The simplification program is also enabling our businesses to deliver an improved customer experience. Following on from last year’s success in winning the Sunday Star-Times Canstar Cannex Bank of the Year Award, our Wealth business through OnePath was recently awarded Morningstar Fund Manager of the Year and Kiwisaver Manager of the Year.
Profit before credit impairment and tax for the March 2012 half year increased 5%, with revenue 3% higher from margin improvement, and costs held flat as we continue to tightly manage expenditure. Underlying profit increased 11%, enhanced by a lower credit impairment charge (NZD12 million after tax), and the tax benefit from a reduction in the corporate tax rate from 30% to 28% (NZD14 million).
Key components of the underlying result were:
• Net interest income increased 3%, with net interest margin stronger at 2.65%. Favourable lending mix has contributed as customers continue to favour variable over fixed rate mortgages. On the liability side our strong funding position has allowed us to focus on improving deposit margins. Lending volumes were flat over the half as households and businesses continued to repay debt and strengthen their financial position, and we maintained our commitment to responsible lending by avoiding mortgage lending above 95% of home value. Customer deposits increased 4%.
• Other external operating income increased 1%, largely reflecting growth in the Wealth insurance business from favourable lapse and claims experience. Retail fees remained constrained in a competitive environment.
• Operating expenses were held flat. We have continued to realise efficiency gains from simplifying the business, and in the current environment we have kept in place constraints on discretionary expenditure. The cost to income ratio improved 130 basis points to 45.0%, maintaining the downward trend over four consecutive halves.
• Provision for credit impairment charge decreased NZD17 million as risk levels continue to reduce. The individual provision charge was NZD38 million lower, with loss rates reducing across all businesses. The commercial result was, in particular, lower as the level of Christchurch earthquake related losses declined. The collective provision result was a credit to profit (release from provision) of NZD34 million, compared with a credit of NZD55 million in the September 2011 half. Excluding a lower credit cycle release (NZD19 million) that reflected the lower level of release required for earthquake related individual provisions, the underlying release was marginally lower (NZD2 million). Credit quality has continued to improve, and there has been some volume roll-off.
March 2012 half year compared to March 2011 half year
Underlying profit increased 10% compared with the same half last year, with good revenue growth (4%) supported by strong management of costs and stabilising credit risk.
Key components of the underlying result were:
• Net interest income increased 4%, reflecting net interest margin improvement of 16 basis points. This was driven by favourable lending mix from an increased proportion of variable rate lending, lower mortgage break costs, and improved deposit margins. Lending volumes declined 2%, with the agri sector in particular still impacted by de-leveraging, although there are signs of this starting to moderate. Customer deposits increased 2%.
• Other external operating income increased 3%, with the Wealth business delivering strong growth in insurance and funds management, partly offset by lower earnings from the real estate business following the sale of management rights during the second half of 2011. Positive revaluations of net policyholder assets also contributed to the Wealth result. Retail fee growth was constrained, with a marginally lower result reflecting a reduction in the Bonus Bonds management fee implemented during the second half of 2011.
• Operating expenses were held flat, with inflationary impacts offset by productivity gains and savings from constraints on discretionary expenditure. The cost to income ratio improved 150 basis points compared with the March 2011 half.
• Provision for credit impairment charge increased NZD4 million, with a NZD23 million lower individual provision charge being offset by a lower release from collective provision. Adjusting for credit cycle releases, the underlying collective provision release was NZD20 million lower than for the March 2011 half as the rate of risk improvement slows from the highs of last year. The total loss rate (total provision charge as a percentage of average lending assets) increased 1 basis point to 0.23%.

SEGMENT REVIEW
New Zealand David Hisco
70
Business operating segments
Half Year Movement
Retail
Mar 12 NZD M
Sep 11 NZD M
Mar 11 NZD M
Mar 12 v. Sep 11
Mar 12 v. Mar 11
Net interest income 463 444 429 4% 8%
Other external operating income 142 143 143 -1% -1%
Operating income 605 587 572 3% 6%
Operating expenses (341) (341) (342) 0% 0%
Profit before credit impairment and income tax 264 246 230 7% 15%
Provision for credit impairment (30) (43) (35) -30% -14%
Profit before income tax 234 203 195 15% 20%
Income tax expense and non-controlling interests (65) (60) (59) 8% 10%
Underlying profit 169 143 136 18% 24%
Risk weighted assets 16,805 16,820 17,109 0% -2%
Commercial
Net interest income 679 673 686 1% -1%
Other external operating income 65 62 65 5% 0%
Operating income 744 735 751 1% -1%
Operating expenses (250) (249) (249) 0% 0%
Profit before credit impairment and income tax 494 486 502 2% -2%
Provision for credit impairment (70) (76) (64) -8% 9%
Profit before income tax 424 410 438 3% -3%
Income tax expense and non-controlling interests (119) (122) (132) -2% -10%
Underlying profit 305 288 306 6% 0%
Risk weighted assets 29,596 30,443 32,457 -3% -9%
Wealth
Net interest income 14 12 6 17% large
Other external operating income 106 102 93 4% 14%
Operating income 120 114 99 5% 21%
Operating expenses (67) (74) (70) -9% -4%
Profit before credit impairment and income tax 53 40 29 33% 83%
Provision for credit impairment (2) - 1 n/a large
Profit before income tax 51 40 30 28% 70%
Income tax expense and non-controlling interests (10) (8) (3) 25% large
Underlying profit 41 32 27 28% 52%
Risk weighted assets 942 894 928 5% 2%

SEGMENT REVIEW
New Zealand David Hisco
71
Half Year Movement
Individual provision charge Mar 12 NZD M
Sep 11 NZD M
Mar 11 NZD M
Mar 12 v. Sep 11
Mar 12 v. Mar 11
Retail 38 40 47 -5% -19%
Commercial 96 134 113 -28% -15%
Commercial & Agri 87 112 103 -22% -16%
Business Banking 9 21 10 -57% -10%
Wealth 2 - (1) n/a large
Underlying individual provision charge 136 174 159 -22% -14%
Half Year Movement
Collective provision charge Mar 12 NZD M
Sep 11 NZD M
Mar 11 NZD M
Mar 12 v. Sep 11
Mar 12 v. Mar 11
Retail (8) 3 (12) large -33%
Commercial (26) (58) (49) -55% -47%
Commercial & Agri (27) (58) (41) -53% -34%
Business Banking 1 - (8) n/a large
Underlying collective provision charge (34) (55) (61) -38% -44%
As at (NZD M) Movement
Net loans & advances including acceptances Mar 12 Sep 11 Mar 11 Mar 12
v. Sep 11 Mar 12
v. Mar 11
Retail 34,754 35,080 35,691 -1% -3%
Commercial 50,604 50,402 51,464 0% -2%
Commercial & Agri 33,620 34,168 35,563 -2% -5%
Business Banking 16,984 16,234 15,901 5% 7%
Wealth 1,218 1,284 1,247 -5% -2%
Underlying net loans & advances including acceptances 86,576 86,766 88,402 0% -2%
As at (NZD M) Movement
Customer deposits Mar 12 Sep 11 Mar 11 Mar 12
v. Sep 11 Mar 12
v. Mar 11
Retail 28,882 27,934 27,830 3% 4%
Commercial 19,087 17,804 18,389 7% 4%
Commercial & Agri 9,538 9,027 9,557 6% 0%
Business Banking 9,549 8,778 8,832 9% 8%
Wealth 4,318 4,497 4,835 -4% -11%
Underlying customer deposits 52,287 50,235 51,054 4% 2%

SEGMENT REVIEW
Group Centre1
72
Half Year Movement
Mar 12
$M Sep 11
$M Mar 11
$M Mar 12
v. Sep 11 Mar 12
v. Mar 11
Net interest income 211 134 62 57% large
Other external operating income (86) (53) (68) 62% 26%
Operating income 125 81 (6) 54% large
Operating expenses (191) (207) (141) -8% 35%
Profit/(Loss) before credit impairment and income tax (66) (126) (147) -48% -55%
Provision for credit impairment - (40) (1) -100% -100%
Profit/(Loss) before income tax (66) (166) (148) -60% -55%
Income tax expense and non-controlling interests 42 73 40 -42% 5%
Pro forma profit/(loss) (24) (93) (108) -74% -78%
Foreign exchange adjustments n/a 29 (1) n/a n/a
Underlying profit/(loss) (24) (64) (109) -63% -78%
Total full time equivalent staff (FTE) 6,781 6,682 6,291 1% 8%
1. Group Centre comprises Technology, Global Services & Operations, Group Human Resources, Group Risk Management, Group Treasury (includes the funding component of Treasury results, with the mismatch component being included in Institutional Division’s Global Markets business), Group Strategy and Marketing, Corporate Affairs, Corporate Communications, Group Financial Management and Shareholder Functions
March 2012 half year compared to September 2011 half year
The underlying loss of $24 million was $40 million lower than the prior half largely as a result of earnings on higher surplus capital and lower credit loss provisions. Significant factors influencing the result were:
• Operating income improved $44 million largely due to higher earnings on central capital partly offset by profit recognised on the sale of our Martin Place headquarters in Sydney of $19 million in the September 2011 half. There were offsetting variances between net interest and other income as a result of elimination entries associated with the consolidation of OnePath Australia.
• Operating expenses reduced $16 million reflecting lower project spend and the impact of productivity initiatives.
• Provision for credit impairment reduced with a $40 million provision booked in the Centre in the September half to provide for emerging issues resulting from the global uncertainty.
March 2012 half year compared to March 2011 half year
The underlying loss of $24 million compared to an underlying loss of $109 million for the March 2011 half. Significant factors influencing the result were:
• Operating income improved $131 million largely as a result of higher earnings on central capital. There were offsetting variances between net interest and other income as a result of elimination entries associated with the consolidation of OnePath Australia.
• Operating expenses increased $50 million with increased project related technology expenditure and increased investment in our Chengdu and Manila Hubs.

GEOGRAPHIC REGION RESULTS
73
CONTENTS Section 5 – Geographic Region Results
Geographic performance
Australia geography
Asia Pacific, Europe & America geography
New Zealand geography

GEOGRAPHIC REGION RESULTS
74
Geographic Performance
Half Year Movement
Profit after tax Mar 12
$M Sep 11
$M Mar 11
$M Mar 12
v. Sep 11 Mar 12
v. Mar 11 Australia 1,995 1,922 1,912 4% 4%
Asia Pacific, Europe & America 449 301 389 49% 15%
New Zealand 475 468 363 1% 31%
2,919 2,691 2,664 8% 10%
Asia Pacific, Europe & America (USD) 463 318 387 46% 20%
New Zealand (NZD) 615 607 478 1% 29%
Half Year Movement
Underlying Profit Mar 12
$M Sep 11
$M Mar 11
$M Mar 12
v. Sep 11 Mar 12
v. Mar 11
Australia 1,991 1,981 1,957 1% 2%
Asia Pacific, Europe & America 455 360 402 26% 13%
New Zealand 527 493 459 7% 15%
2,973 2,834 2,818 5% 6%
Asia Pacific, Europe & America (USD) 469 380 401 23% 17%
New Zealand (NZD) 684 638 605 7% 13%
Half Year Movement
Pro forma profit1 Mar 12
$M Sep 11
$M Mar 11
$M Mar 12
v. Sep 11 Mar 12
v. Mar 11
Australia 1,991 1,950 1,961 2% 2%
Asia Pacific, Europe & America 455 374 396 22% 15%
New Zealand 527 493 466 7% 13%
2,973 2,817 2,823 6% 5%
Asia Pacific, Europe & America (USD) 469 380 401 23% 17%
New Zealand (NZD) 684 638 605 7% 13%
1. Refer page 92 for a reconciliation of divisional to geographic region results
As at ($M) Movement
Net loans & advances including acceptances by region Mar 12 Sep 11 Mar 11 Mar 12
v. Sep 11 Mar 12
v. Mar 11 Australia 297,978 284,951 278,154 5% 7%
Asia Pacific, Europe & America 40,722 38,779 30,946 5% 32%
New Zealand 73,892 73,555 70,260 0% 5%
Underlying net loans & advances including acceptances
412,592 397,285 379,360 4% 9%
Non continuing business 36 22 29 64% 24%
Net loans & advances including acceptances 412,628 397,307 379,389 4% 9%
As at ($M) Movement
Customer deposits by region Mar 12 Sep 11 Mar 11 Mar 12
v. Sep 11 Mar 12
v. Mar 11
Australia 186,974 183,216 168,268 2% 11%
Asia Pacific, Europe & America 70,780 64,827 52,797 9% 34%
New Zealand 50,548 48,710 46,226 4% 9%
Underlying customer deposits 308,302 296,753 267,291 4% 15%
Non continuing business 1 1 4 0% -75%
Customer deposits 308,303 296,754 267,295 4% 15%

GEOGRAPHIC REGION RESULTS
75
Australia geography
Half Year Movement
Mar 12
$M Sep 11
$M Mar 11
$M Mar 12
v. Sep 11 Mar 12
v. Mar 11 Net interest income 4,277 4,280 4,134 0% 3%
Other external operating income 1,666 1,517 1,748 10% -5%
Operating income 5,943 5,797 5,882 3% 1%
Operating expenses (2,651) (2,599) (2,522) 2% 5%
Profit before credit impairment and income tax 3,292 3,198 3,360 3% -2%
Provision for credit impairment (441) (404) (552) 9% -20%
Profit before tax 2,851 2,794 2,808 2% 2%
Income tax expense and non-controlling interests (860) (844) (847) 2% 2%
Pro forma profit 1,991 1,950 1,961 2% 2%
Foreign exchange adjustments n/a 31 (4) n/a n/a
Underlying profit 1,991 1,981 1,957 1% 2%
Adjustments between statutory profit and underlying profit 4 (59) (45) large large
Profit 1,995 1,922 1,912 4% 4%
Balance Sheet
Net loans & advances including acceptances 297,978 284,951 278,154 5% 7%
Other external assets 111,887 122,051 106,148 -8% 5%
External assets 409,865 407,002 384,302 1% 7%
Customer deposits 186,974 183,216 168,268 2% 11%
Other deposits and borrowings 61,903 58,798 55,247 5% 12%
Deposits and other borrowings 248,877 242,014 223,515 3% 11%
Other external liabilities 137,521 142,037 135,157 -3% 2%
External liabilities 386,398 384,051 358,672 1% 8%
Risk weighted assets 173,421 174,209 169,587 0% 2%
Average net loans and advances including acceptances 292,520 280,977 274,498 4% 7%
Average deposits and other borrowings 249,596 232,757 217,891 7% 15%
Ratios
Net interest average margin 2.52% 2.61% 2.59%
Net interest average margin (excluding Global Markets) 2.81% 2.91% 2.90%
Operating expenses to operating income (pro forma) 44.6% 44.8% 42.9%
Operating expenses to operating income 44.6% 44.6% 43.1%
Operating expenses to average assets 1.27% 1.29% 1.30%
Individual provision charge 563 402 428 40% 32%
Individual provision charge as a % of average net advances 0.38% 0.29% 0.31%
Collective provision charge (credit) (122) 2 124 large large
Collective provision charge (credit) as a % of average net advances (0.08%) 0.00% 0.09%
Net impaired assets 2,471 2,630 3,052 -6% -19%
Net impaired assets as a % of net advances 0.83% 0.92% 1.10%
Total full time equivalent staff (FTE) 23,539 24,318 24,475 -3% -4%

GEOGRAPHIC REGION RESULTS
76
Asia Pacific, Europe & America geography
Reported in USD, therefore results are presented on an underlying basis
Half Year Movement
Mar 12 USD M
Sep 11 USD M
Mar 11 USD M
Mar 12 v. Sep 11
Mar 12 v. Mar 11
Net interest income 676 573 531 18% 27%
Other external operating income 742 683 716 9% 4%
Operating income 1,418 1,256 1,247 13% 14%
Operating expenses (803) (758) (703) 6% 14%
Profit before credit impairment and income tax 615 498 544 23% 13%
Provision for credit impairment (49) (70) (43) -30% 14%
Profit before income tax 566 428 501 32% 13%
Income tax expense and non-controlling interests (97) (48) (100) large -3%
Underlying profit 469 380 401 23% 17%
Adjustments between statutory profit and underlying profit (6) (62) (14) -90% -57%
Profit 463 318 387 46% 20%
Geographic segments:
Asia 267 232 252 15% 6%
Pacific 101 88 63 15% 60%
Europe & America 101 60 86 68% 17%
Underlying profit 469 380 401 23% 17%
Balance Sheet
Net loans & advances including acceptances 42,356 37,736 31,977 12% 32%
Other external assets 58,640 48,367 34,095 21% 72%
External assets 100,996 86,103 66,072 17% 53%
Customer deposits 73,616 63,084 54,555 17% 35%
Other deposits and borrowings 7,937 7,283 5,345 9% 48%
Deposits and other borrowings 81,553 70,367 59,900 16% 36%
Other external liabilities 22,407 20,027 14,089 12% 59%
External liabilities 103,960 90,394 73,989 15% 41%
Risk weighted assets 65,776 55,773 49,204 18% 34%
Average net loans and advances including acceptances 40,078 36,173 29,320 11% 37%
Average deposits and other borrowings 74,735 67,080 56,947 11% 31%
Ratios
Net interest average margin 1.46% 1.39% 1.60%
Net interest average margin (excluding Global Markets) 2.36% 2.30% 2.77%
Operating expenses to operating income 56.6% 60.4% 56.4%
Operating expenses to average assets 1.52% 1.64% 1.81%
Individual provision charge 54 80 51 -33% 6%
Individual provision charge as a % of average net advances 0.27% 0.44% 0.35%
Collective provision charge (credit) (5) (10) (8) -50% -38%
Collective provision charge (credit) as a % of average net advances (0.03%) (0.06%) (0.05%)
Net impaired assets 313 276 283 13% 11%
Net impaired assets as a % of net advances 0.74% 0.73% 0.89%
Total full time equivalent staff (FTE) 15,698 15,154 14,546 4% 8%

GEOGRAPHIC REGION RESULTS
77
New Zealand geography
Reported in NZD, therefore results are presented on an underlying basis
Half Year Movement
Mar 12 NZD M
Sep 11 NZD M
Mar 11 NZD M
Mar 12 v. Sep 11
Mar 12 v. Mar 11
Net interest income 1,363 1,313 1,285 4% 6%
Other external operating income 433 428 409 1% 6%
Operating income 1,796 1,741 1,694 3% 6%
Operating expenses (764) (739) (759) 3% 1%
Profit before credit impairment and income tax 1,032 1,002 935 3% 10%
Provision for credit impairment (99) (102) (85) -3% 16%
Profit before income tax 933 900 850 4% 10%
Income tax expense and non-controlling interests (249) (262) (245) -5% 2%
Underlying profit 684 638 605 7% 13%
Adjustments between statutory profit and underlying profit (69) (31) (127) large -46%
Profit 615 607 478 1% 29%
Balance Sheet
Net loans & advances including acceptances 93,817 93,613 95,470 0% -2%
Other external assets 30,545 35,079 27,764 -13% 10%
External assets 124,362 128,692 123,234 -3% 1%
Customer deposits 64,179 61,994 62,812 4% 2%
Other deposits and borrowings 6,735 7,244 5,537 -7% 22%
Deposits and other borrowings 70,914 69,238 68,349 2% 4%
Other external liabilities 29,466 34,779 31,772 -15% -7%
External liabilities 100,380 104,017 100,121 -3% 0%
Risk weighted assets 61,165 61,650 63,904 -1% -4%
Average net loans and advances including acceptances 93,489 94,385 95,540 -1% -2%
Average deposits and other borrowings 69,843 69,186 70,003 1% 0%
Ratios
Net interest average margin 2.50% 2.40% 2.35%
Net interest average margin (excluding Global Markets) 2.67% 2.55% 2.46%
Operating expenses to operating income 42.5% 42.4% 44.8%
Operating expenses to average assets 1.22% 1.18% 1.23%
Individual provision charge 132 168 151 -21% -13%
Individual provision charge as a % of average net advances 0.28% 0.36% 0.32%
Collective provision charge (credit) (33) (66) (66) -50% -50%
Collective provision charge (credit) as a % of average net advances (0.07%) (0.14%) (0.14%)
Net impaired assets 1,169 1,307 1,684 -11% -31%
Net impaired assets as a % of net advances 1.25% 1.40% 1.76%
Total full time equivalent staff (FTE) 8,985 9,270 9,365 -3% -4%

GEOGRAPHIC REGION RESULTS
78
This page has been left blank intentionally

PROFIT RECONCILIATION
79
CONTENTS Section 6 – Profit Reconciliation
Adjustments between statutory profit and underlying profit
Explanation of adjustments between statutory profit and underlying profit
Reconciliation of statutory profit to underlying profit
Underlying profit by division
Asia Pacific, Europe & America division (AUD)
New Zealand (AUD)
Divisional to Geographic region reconciliation matrix

PROFIT RECONCILIATION
80
Adjustments between statutory profit and underlying profit
Profit has been adjusted to exclude certain non-core items to arrive at underlying profit, and has been provided to assist readers to understand the result for the ongoing business activities of the Group. These adjustments have been determined on a consistent basis with those made in prior periods. Underlying profit is not subject to audit review. However, the adjustments made in arriving at underlying earnings are included in statutory profit, and are therefore subject to review within the context of the Group condensed financial statements audit review. The external auditor has informed the Audit Committee that the adjustments are based on the guidelines released by the Australian Institute of Company Directors (AICD) and the Financial Services Institute of Australasia (FINSIA), and are consistent with prior period adjustments.
Half Year Movement
Mar 12
$M Sep 11
$M Mar 11
$M Mar 12
v. Sep 11 Mar 12
v. Mar 11
Statutory profit attributable to shareholders of the Company 2,919 2,691 2,664 8% 10%
Adjustments between statutory profit and underlying profit 54 143 154 -62% -65%
Underlying profit 2,973 2,834 2,818 5% 6%
Half Year Movement
Mar 12
$M Sep 11
$M Mar 11
$M Mar 12
v. Sep 11 Mar 12
v. Mar 11 Adjustments between statutory profit and underlying profit
New Zealand technology integration 46 11 75 large -39%
Acquisition related adjustments 28 54 72 -48% -61%
Treasury shares adjustment 70 (56) 15 large large
Changes in New Zealand tax legislation - 1 (3) -100% -100%
Economic hedging - fair value (gains)/losses 22 3 114 large -81%
Revenue and net investment hedges (gains)/losses (63) 81 (30) large large
NZ managed funds impacts 1 3 (42) -67% large
Non continuing businesses
Credit intermediation trades (46) 41 (45) large 2%
Other (4) 5 (2) large 100%
Total adjustments between statutory profit and underlying profit
54 143 154 -62% -65%
Explanation of adjustments between statutory profit and underlying profit
• New Zealand technology integration
Costs of $46 million after tax ($64 million pre tax) were incurred in the March 2012 half in relation to the implementation of a single core banking system across the ANZ and The National Bank networks in New Zealand. The integration was commenced in 2011 with costs incurred of $11 million after tax and $75 million after tax in the September 2011 half and March 2011 half respectively. It is anticipated that approximately a further $15 million will be incurred in the September 2012 half. This project is expected to result in lower operational and technology costs.
• Acquisition related adjustments
The integration and transaction costs include $6 million ($5 million net of tax) relating to OnePath Australia for delayed project expenditure relating to the integration to ANZ’s Standard Operating Environment and Data Centre, and $6 million ($5 million net of tax) relating to the RBS acquisition for final costs associated with the completion of the Cards integration.
Pre-tax
Net of tax
Half Year Half Year
Mar 12
$M Sep 11
$M Mar 11
$M Mar 12
$M Sep 11
$M Mar 11
$M
AFS reserve write-off recovery1 (5) (3) - (4) (2) -
Integration and transaction costs 12 44 66 10 36 53
Amortisation of acquisition related intangibles 29 28 26 22 20 19
Total 36 69 92 28 54 72
1. Adjusted to reverse recoveries on available-for-sale assets written down through equity by OnePath Australia before obtaining control
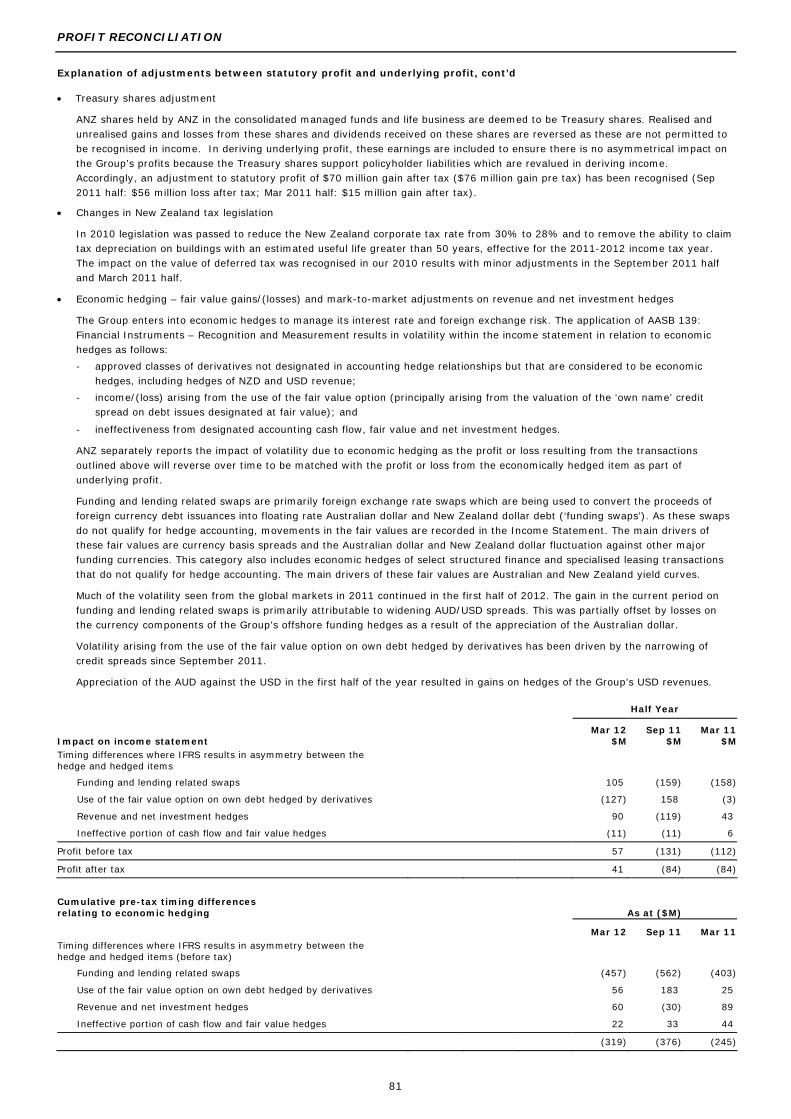
PROFIT RECONCILIATION
81
Explanation of adjustments between statutory profit and underlying profit, cont’d
• Treasury shares adjustment
ANZ shares held by ANZ in the consolidated managed funds and life business are deemed to be Treasury shares. Realised and unrealised gains and losses from these shares and dividends received on these shares are reversed as these are not permitted to be recognised in income. In deriving underlying profit, these earnings are included to ensure there is no asymmetrical impact on the Group’s profits because the Treasury shares support policyholder liabilities which are revalued in deriving income. Accordingly, an adjustment to statutory profit of $70 million gain after tax ($76 million gain pre tax) has been recognised (Sep 2011 half: $56 million loss after tax; Mar 2011 half: $15 million gain after tax).
• Changes in New Zealand tax legislation
In 2010 legislation was passed to reduce the New Zealand corporate tax rate from 30% to 28% and to remove the ability to claim tax depreciation on buildings with an estimated useful life greater than 50 years, effective for the 2011-2012 income tax year. The impact on the value of deferred tax was recognised in our 2010 results with minor adjustments in the September 2011 half and March 2011 half.
• Economic hedging – fair value gains/(losses) and mark-to-market adjustments on revenue and net investment hedges
The Group enters into economic hedges to manage its interest rate and foreign exchange risk. The application of AASB 139: Financial Instruments – Recognition and Measurement results in volatility within the income statement in relation to economic hedges as follows:
- approved classes of derivatives not designated in accounting hedge relationships but that are considered to be economic hedges, including hedges of NZD and USD revenue;
- income/(loss) arising from the use of the fair value option (principally arising from the valuation of the ‘own name’ credit spread on debt issues designated at fair value); and
- ineffectiveness from designated accounting cash flow, fair value and net investment hedges.
ANZ separately reports the impact of volatility due to economic hedging as the profit or loss resulting from the transactions outlined above will reverse over time to be matched with the profit or loss from the economically hedged item as part of underlying profit.
Funding and lending related swaps are primarily foreign exchange rate swaps which are being used to convert the proceeds of foreign currency debt issuances into floating rate Australian dollar and New Zealand dollar debt (‘funding swaps’). As these swaps do not qualify for hedge accounting, movements in the fair values are recorded in the Income Statement. The main drivers of these fair values are currency basis spreads and the Australian dollar and New Zealand dollar fluctuation against other major funding currencies. This category also includes economic hedges of select structured finance and specialised leasing transactions that do not qualify for hedge accounting. The main drivers of these fair values are Australian and New Zealand yield curves.
Much of the volatility seen from the global markets in 2011 continued in the first half of 2012. The gain in the current period on funding and lending related swaps is primarily attributable to widening AUD/USD spreads. This was partially offset by losses on the currency components of the Group’s offshore funding hedges as a result of the appreciation of the Australian dollar.
Volatility arising from the use of the fair value option on own debt hedged by derivatives has been driven by the narrowing of credit spreads since September 2011.
Appreciation of the AUD against the USD in the first half of the year resulted in gains on hedges of the Group’s USD revenues.
Half Year
Impact on income statement
Mar 12 $M
Sep 11 $M
Mar 11 $M
Timing differences where IFRS results in asymmetry between the hedge and hedged items
Funding and lending related swaps
105 (159) (158)
Use of the fair value option on own debt hedged by derivatives
(127) 158 (3)
Revenue and net investment hedges
90 (119) 43
Ineffective portion of cash flow and fair value hedges
(11) (11) 6
Profit before tax
57 (131) (112)
Profit after tax
41 (84) (84)
Cumulative pre-tax timing differences relating to economic hedging As at ($M)
Mar 12 Sep 11 Mar 11 Timing differences where IFRS results in asymmetry between the hedge and hedged items (before tax)
Funding and lending related swaps (457) (562) (403)
Use of the fair value option on own debt hedged by derivatives 56 183 25
Revenue and net investment hedges 60 (30) 89
Ineffective portion of cash flow and fair value hedges 22 33 44
(319) (376) (245)

PROFIT RECONCILIATION
82
Explanation of adjustments between statutory profit and underlying profit, cont’d
• ANZ share of OnePath NZ managed funds impacts
During the March 2011 half year, the collateralised debt obligations held within the Diversified Yield Fund and the Regular Income Fund were sold, resulting in a profit after tax of $42 million ($61 million pre tax). The charge of $3 million after tax during the September 2011 half year comprises the tax liability payable on the final wind up of the Funds.
• Credit risk on impaired derivatives (nil profit after tax impact)
Reclassification of a charge to income for credit valuation adjustments on defaulted and impaired derivative exposures to provision for credit impairment of $32 million (Sep 2011 half: $2 million reversal; Mar 2011 half: $15 million reversal).
• Policyholders Tax Gross up (nil profit after tax impact)
For statutory reporting purposes policyholder income tax and other related taxes paid on behalf of policyholders are included in net income from wealth management and the Group’s income tax expense. The gross up of $88 million (Sep 2011 half: $42 million; Mar 2011 half: $166 million) has been excluded from the underlying results.
• Non continuing businesses
In 2009, Institutional reviewed its existing business portfolio in light of its new strategic and business goals to determine the optimal structure for the division. As a result, new business ceased in several product areas, including the Alternative Assets and Private Equity businesses. The Group’s structured credit intermediation trades are also included within non continuing businesses and will result in the profit/(loss) fluctuating as the credit risk adjustment is impacted by market movements in credit spreads and exchange rate movements. A summary of the impact of non continuing businesses including structured credit intermediation trades follows:
Non continuing businesses Half Year Movement
Mar 12
$M Sep 11
$M Mar 11
$M Mar 12
v. Sep 11 Mar 12
v. Mar 11
Net interest income - (2) - -100% n/a
Other operating income 71 (35) 58 large 22%
Operating income 71 (37) 58 large 22%
Operating expenses (7) (10) (4) -30% 75%
Profit before credit impairment and income tax 64 (47) 54 large 19%
Provision for credit impairment (5) (9) - -44% n/a
Profit before income tax 59 (56) 54 large 9%
Income tax expense (9) 10 (7) large 29%
Profit/(Loss) 50 (46) 47 large 6%

PROFIT RECONCILIATION
83
Structured credit intermediation trades
ANZ entered into a series of structured credit intermediation trades from 2004 to 2007. The underlying structures involve credit default swaps (CDS) over synthetic collateralised debt obligations (CDOs), portfolios of external collateralised loan obligations (CLOs) or specific bonds/floating rate notes (FRNs). ANZ sold protection using credit default swaps over these structures and then to mitigate risk, purchased protection via credit default swaps over the same structures from eight US financial guarantors.
Being derivatives, both the sold protection and purchased protection are marked-to-market. Prior to the commencement of the global credit crisis, movements in valuations of these positions were not significant and largely offset each other in income. Following the onset of the credit crisis, the purchased protection has provided only a partial offset against movements in valuation of the sold protection because:
• one of the counterparties to the purchased protection defaulted and many of the remaining were downgraded; and
• a credit valuation adjustment is applied to the remaining counterparties to the purchased protection reflective of changes to their credit worthiness.
ANZ is actively monitoring this portfolio with a view to reducing the exposure via termination and restructuring of both the bought and sold protection if and when ANZ deems it cost effective relative to the perceived risk associated with a specific trade or counterparty. Costs were incurred in prior periods managing these positions. The notional amount on the outstanding sold trades at March 2012 was US$8.1 billion (Sep 2011: $8.3 billion; Mar 2011: US$8.4 billion).
The cumulative costs include realised losses relating to restructuring of trades in order to reduce risks and realised losses on termination of sold protection trades. It also includes foreign exchange hedging losses.
The credit risk expense on structured credit derivatives remains volatile reflecting the impact of market movements in credit spreads and AUD/USD rates. It is likely there will continue to be volatility in this market value.
The (gain)/loss included in income for these transactions is set out below.
Half Year Movement
Mar 12 $M
Sep 11 $M
Mar 11 $M
Mar 12 v. Sep 11
Mar 12 v. Mar 11
Credit risk on intermediation trades (52) 51 (55) large -5%
As at ($M) Movement
Financial impacts on credit intermediation trades Mar 12 Sep 11 Mar 11 Mar 12
v. Sep 11 Mar 12
v. Mar 11 Mark-to-market exposure to financial guarantors 447 803 443 -44% 1%
Cumulative costs relating to financial guarantors
Credit valuation adjustment for outstanding transactions 139 197 143 -29% -3%
Realised close out and hedge costs 320 314 317 2% 1%
Cumulative life to date costs 459 511 460 -10% 0%
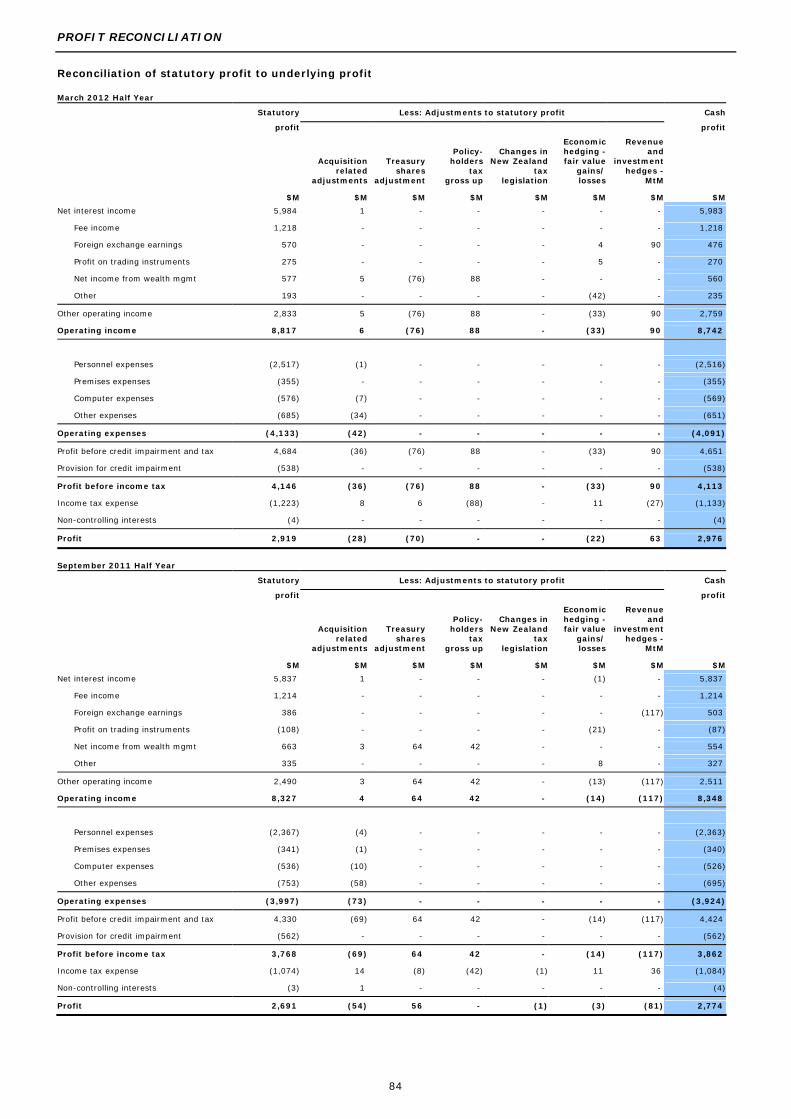
PROFIT RECONCILIATION
84
Reconciliation of statutory profit to underlying profit
March 2012 Half Year
Statutory Less: Adjustments to statutory profit Cash
profit
Acquisition related
adjustments
Treasury shares
adjustment
Policy-holders
tax gross up
Changes in New Zealand
tax legislation
Economic hedging - fair value
gains/ losses
Revenue and
investment hedges -
MtM
profit
$M $M $M $M $M $M $M $M
Net interest income 5,984 1 - - - - - 5,983
Fee income 1,218 - - - - - - 1,218
Foreign exchange earnings 570 - - - - 4 90 476
Profit on trading instruments 275 - - - - 5 - 270
Net income from wealth mgmt 577 5 (76) 88 - - - 560
Other 193 - - - - (42) - 235
Other operating income 2,833 5 (76) 88 - (33) 90 2,759
Operating income 8,817 6 (76) 88 - (33) 90 8,742
Personnel expenses (2,517) (1) - - - - - (2,516)
Premises expenses (355) - - - - - - (355)
Computer expenses (576) (7) - - - - - (569)
Other expenses (685) (34) - - - - - (651)
Operating expenses (4,133) (42) - - - - - (4,091)
Profit before credit impairment and tax 4,684 (36) (76) 88 - (33) 90 4,651
Provision for credit impairment (538) - - - - - - (538)
Profit before income tax 4,146 (36) (76) 88 - (33) 90 4,113
Income tax expense (1,223) 8 6 (88) - 11 (27) (1,133)
Non-controlling interests (4) - - - - - - (4)
Profit 2,919 (28) (70) - - (22) 63 2,976
September 2011 Half Year
Statutory Less: Adjustments to statutory profit Cash
profit
Acquisition related
adjustments
Treasury shares
adjustment
Policy-holders
tax gross up
Changes in New Zealand
tax legislation
Economic hedging - fair value
gains/ losses
Revenue and
investment hedges -
MtM
profit
$M $M $M $M $M $M $M $M
Net interest income 5,837 1 - - - (1) - 5,837
Fee income 1,214 - - - - - - 1,214
Foreign exchange earnings 386 - - - - - (117) 503
Profit on trading instruments (108) - - - - (21) - (87)
Net income from wealth mgmt 663 3 64 42 - - - 554
Other 335 - - - - 8 - 327
Other operating income 2,490 3 64 42 - (13) (117) 2,511
Operating income 8,327 4 64 42 - (14) (117) 8,348
Personnel expenses (2,367) (4) - - - - - (2,363)
Premises expenses (341) (1) - - - - - (340)
Computer expenses (536) (10) - - - - - (526)
Other expenses (753) (58) - - - - - (695)
Operating expenses (3,997) (73) - - - - - (3,924)
Profit before credit impairment and tax 4,330 (69) 64 42 - (14) (117) 4,424
Provision for credit impairment (562) - - - - - - (562)
Profit before income tax 3,768 (69) 64 42 - (14) (117) 3,862
Income tax expense (1,074) 14 (8) (42) (1) 11 36 (1,084)
Non-controlling interests (3) 1 - - - - - (4)
Profit 2,691 (54) 56 - (1) (3) (81) 2,774

PROFIT RECONCILIATION
85
March 2012 Half Year
Less: Adjustments to statutory profit Underlying Pro forma
NZ technology integration
NZ managed funds impacts
Non cont. business -
Credit Intermed'n
Trades
Non cont. business -
Other
Credit risk on
impaired derivatives
Total adjustments to
statutory profits
profit
Foreign exchange
adjustments
profit
$M $M $M $M $M $M $M $M $M
1 (2) - - - - 5,984 n/a 5,984
- - - - - - 1,218 n/a 1,218
- - - - - 94 476 n/a 476
- - 52 - (32) 25 250 n/a 250
- - - - - 17 560 n/a 560
- - - 19 - (23) 216 n/a 216
- - 52 19 (32) 113 2,720 n/a 2,720
1 (2) 52 19 (32) 113 8,704 n/a 8,704
(21) - - (6) - (28) (2,489) n/a (2,489)
- - - - - - (355) n/a (355)
(18) - - - - (25) (551) n/a (551)
(25) - - (1) - (60) (625) n/a (625)
(64) - - (7) - (113) (4,020) n/a (4,020)
(63) (2) 52 12 (32) - 4,684 n/a 4,684
- - - (5) 32 27 (565) n/a (565)
(63) (2) 52 7 - 27 4,119 n/a 4,119
17 1 (6) (3) - (81) (1,142) n/a (1,142)
- - - - - - (4) n/a (4)
(46) (1) 46 4 - (54) 2,973 n/a 2,973
September 2011 Half Year
Less: Adjustments to statutory profit Underlying Pro forma
NZ technology integration
NZ managed funds impacts
Non cont. business -
Credit Intermed'n
Trades
Non cont. business -
Other
Credit risk on
impaired derivatives
Total adjustments to
statutory profits
profit
Foreign exchange
adjustments
profit
$M $M $M $M $M $M $M $M $M
1 (1) - (2) - (2) 5,839 10 5,849
- - - 1 - 1 1,213 3 1,216
- (1) - - - (118) 504 (43) 461
- 2 (51) - 2 (68) (40) 3 (37)
- - - - - 109 554 - 554
- - - 15 - 23 312 4 316
- 1 (51) 16 2 (53) 2,543 (33) 2,510
1 - (51) 14 2 (55) 8,382 (23) 8,359
- - - (9) - (13) (2,354) (3) (2,357)
- - - - - (1) (340) - (340)
- - - - - (10) (526) 2 (524)
(17) - - (1) - (76) (677) (1) (678)
(17) - - (10) - (100) (3,897) (2) (3,899)
(16) - (51) 4 2 (155) 4,485 (25) 4,460
- - - (9) (2) (11) (551) (1) (552)
(16) - (51) (5) - (166) 3,934 (26) 3,908
5 (3) 10 - - 22 (1,096) 9 (1,087)
- - - - - 1 (4) - (4)
(11) (3) (41) (5) - (143) 2,834 (17) 2,817
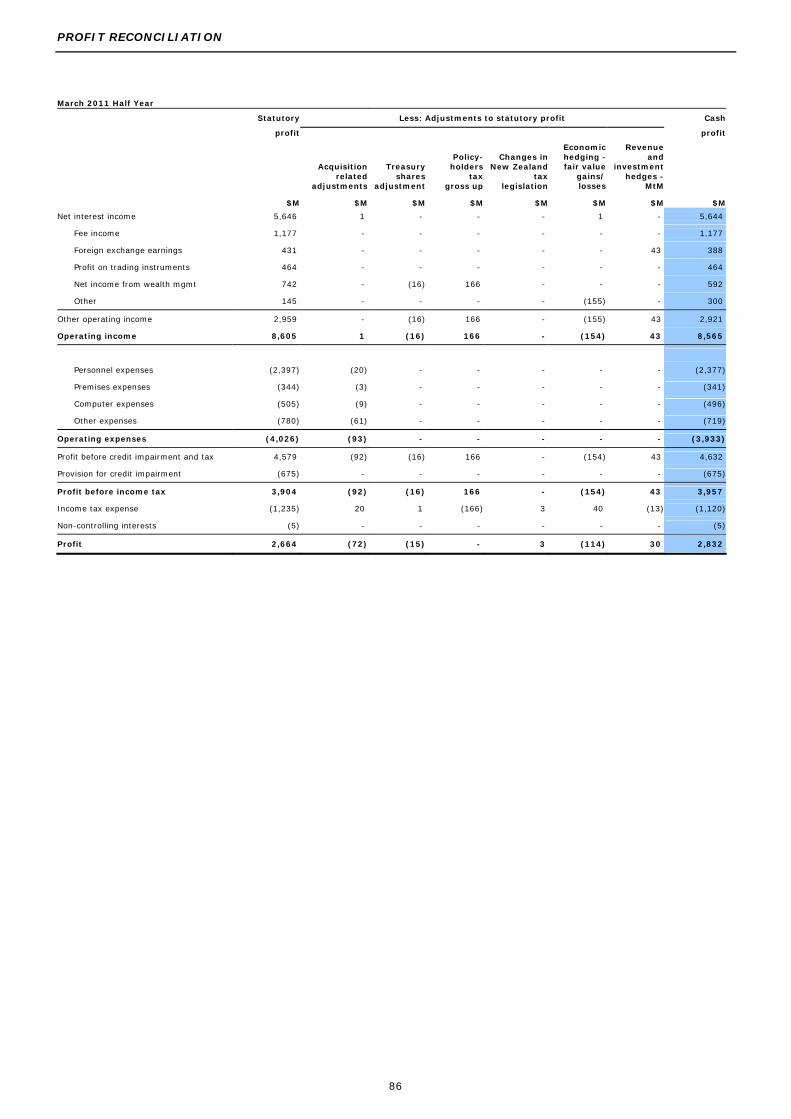
PROFIT RECONCILIATION
86
March 2011 Half Year
Statutory Less: Adjustments to statutory profit Cash
profit
Acquisition related
adjustments
Treasury shares
adjustment
Policy-holders
tax gross up
Changes in New Zealand
tax legislation
Economic hedging - fair value
gains/ losses
Revenue and
investment hedges -
MtM
profit
$M $M $M $M $M $M $M $M
Net interest income 5,646 1 - - - 1 - 5,644
Fee income 1,177 - - - - - - 1,177
Foreign exchange earnings 431 - - - - - 43 388
Profit on trading instruments 464 - - - - - - 464
Net income from wealth mgmt 742 - (16) 166 - - - 592
Other 145 - - - - (155) - 300
Other operating income 2,959 - (16) 166 - (155) 43 2,921
Operating income 8,605 1 (16) 166 - (154) 43 8,565
Personnel expenses (2,397) (20) - - - - - (2,377)
Premises expenses (344) (3) - - - - - (341)
Computer expenses (505) (9) - - - - - (496)
Other expenses (780) (61) - - - - - (719)
Operating expenses (4,026) (93) - - - - - (3,933)
Profit before credit impairment and tax 4,579 (92) (16) 166 - (154) 43 4,632
Provision for credit impairment (675) - - - - - - (675)
Profit before income tax 3,904 (92) (16) 166 - (154) 43 3,957
Income tax expense (1,235) 20 1 (166) 3 40 (13) (1,120)
Non-controlling interests (5) - - - - - - (5)
Profit 2,664 (72) (15) - 3 (114) 30 2,832

PROFIT RECONCILIATION
87
March 2011 Half Year
Less: Adjustments to statutory profit Underlying Pro forma
NZ technology integration
NZ managed funds impacts
Non cont. business -
Credit Intermed'n
Trades
Non cont. business -
Other
Credit risk on
impaired derivatives
Total adjustments to
statutory profits
profit
Foreign exchange
adjustments
profit
$M $M $M $M $M $M $M $M $M
1 1 - - - 4 5,642 5 5,647
- - - 2 - 2 1,175 (4) 1,171
- - - - - 43 388 (4) 384
- 60 55 - 15 130 334 (2) 332
- - - - - 150 592 - 592
- - - 1 - (154) 299 (5) 294
- 60 55 3 15 171 2,788 (15) 2,773
1 61 55 3 15 175 8,430 (10) 8,420
(18) - - (4) - (42) (2,355) 11 (2,344)
- - - - - (3) (341) 2 (339)
- - - - - (9) (496) 4 (492)
(90) - - - - (151) (629) 2 (627)
(108) - - (4) - (205) (3,821) 19 (3,802)
(107) 61 55 (1) 15 (30) 4,609 9 4,618
- - - - (15) (15) (660) 1 (659)
(107) 61 55 (1) - (45) 3,949 10 3,959
32 (19) (10) 3 - (109) (1,126) (5) (1,131)
- - - - - - (5) - (5)
(75) 42 45 2 - (154) 2,818 5 2,823

PROFIT RECONCILIATION
88
Underlying profit by division – Australia March 2012 Half Year
$M Retail Commercial Wealth Other Australia Net interest income 1,688 1,183 37 3 2,911
Other external operating income 451 135 574 - 1,160
Operating income 2,139 1,318 611 3 4,071
Operating expenses (1,002) (451) (356) (4) (1,813)
Profit before credit impairment and income tax 1,137 867 255 (1) 2,258
Provision for credit impairment (199) (110) 2 - (307)
Profit before tax 938 757 257 (1) 1,951
Income tax expense and non-controlling interests (282) (227) (78) 1 (586)
Underlying profit 656 530 179 - 1,365
September 2011 Half Year
$M Retail Commercial Wealth Other Australia
Net interest income 1,749 1,174 46 5 2,974
Other external operating income 468 137 567 (1) 1,171
Operating income 2,217 1,311 613 4 4,145
Operating expenses (980) (433) (340) (5) (1,758)
Profit before credit impairment and income tax 1,237 878 273 (1) 2,387
Provision for credit impairment (195) (107) 6 - (296)
Profit before tax 1,042 771 279 (1) 2,091
Income tax expense and non-controlling interests (312) (233) (83) 1 (627)
Underlying profit 730 538 196 - 1,464
March 2011 Half Year
$M Retail Commercial Wealth Other Australia Net interest income 1,720 1,131 44 5 2,900
Other external operating income 450 131 620 - 1,201
Operating income 2,170 1,262 664 5 4,101
Operating expenses (961) (439) (357) (6) (1,763)
Profit before credit impairment and income tax 1,209 823 307 (1) 2,338
Provision for credit impairment (224) (192) 2 - (414)
Profit before tax 985 631 309 (1) 1,924
Income tax expense and non-controlling interests (293) (189) (91) (1) (574)
Underlying profit 692 442 218 (2) 1,350

PROFIT RECONCILIATION
89
Underlying profit by division – Asia Pacific, Europe & America
March 2012 Half Year
USD M Retail Asia
Partnerships Institutional Relationship & Infrastructure
Asia Pacific, Europe & America
Net interest income 301 (31) 430 5 705
Other external operating income 188 154 393 2 737
Operating income 489 123 823 7 1,442
Operating expenses (397) (4) (361) (84) (846)
Profit before credit impairment and income tax 92 119 462 (77) 596
Provision for credit impairment 4 - (56) 3 (49)
Profit before income tax 96 119 406 (74) 547
Income tax expense and non-controlling interests (29) 6 (90) (2) (115)
Underlying profit 67 125 316 (76) 432
September 2011 Half Year
USD M Retail Asia
Partnerships Institutional Relationship & Infrastructure
Asia Pacific, Europe & America
Net interest income 296 (30) 333 10 609
Other external operating income 176 202 304 4 686
Operating income 472 172 637 14 1,295
Operating expenses (383) (6) (355) (52) (796)
Profit before credit impairment and income tax 89 166 282 (38) 499
Provision for credit impairment (21) - (57) 8 (70)
Profit before income tax 68 166 225 (30) 429
Income tax expense and non-controlling interests (18) 10 (45) (18) (71)
Underlying profit 50 176 180 (48) 358
March 2011 Half Year
USD M Retail Asia
Partnerships Institutional Relationship & Infrastructure
Asia Pacific, Europe & America
Net interest income 278 (28) 306 7 563
Other external operating income 175 191 346 - 712
Operating income 453 163 652 7 1,275
Operating expenses (359) (3) (293) (78) (733)
Profit before credit impairment and income tax 94 160 359 (71) 542
Provision for credit impairment (17) - (27) 1 (43)
Profit before income tax 77 160 332 (70) 499
Income tax expense and non-controlling interests (20) (9) (82) - (111)
Underlying profit 57 151 250 (70) 388

PROFIT RECONCILIATION
90
Underlying profit by division – Institutional March 2012 Half Year
AUD M Transaction
Banking Global Loans
Global Markets
Relationship & Infrastructure Institutional
Net interest income 431 919 342 5 1,697
Other external operating income 319 97 642 14 1,072
Operating income 750 1,016 984 19 2,769
Operating expenses (296) (253) (453) (31) (1,033)
Profit before credit impair't and income tax 454 763 531 (12) 1,736
Provision for credit impairment 9 (134) (60) - (185)
Profit before income tax 463 629 471 (12) 1,551
Income tax expense and non-controlling interests (131) (166) (131) - (428)
Underlying profit 332 463 340 (12) 1,123
September 2011 Half Year
AUD M Transaction
Banking Global Loans
Global Markets
Relationship & Infrastructure Institutional
Net interest income 354 930 320 (5) 1,599
Other external operating income 311 89 350 24 774
Operating income 665 1,019 670 19 2,373
Operating expenses (291) (254) (457) 8 (994)
Profit before credit impair't and income tax 374 765 213 27 1,379
Provision for credit impairment (14) (78) (17) (2) (111)
Profit before income tax 360 687 196 25 1,268
Income tax expense and non-controlling interests (103) (184) (71) (3) (361)
Underlying profit 257 503 125 22 907
March 2011 Half Year
AUD M Transaction
Banking Global Loans
Global Markets
Relationship & Infrastructure Institutional
Net interest income 329 946 293 2 1,570
Other external operating income 277 95 660 17 1,049
Operating income 606 1,041 953 19 2,619
Operating expenses (288) (246) (415) (10) (959)
Profit before credit impair't and income tax 318 795 538 9 1,660
Provision for credit impairment (22) (137) 19 (15) (155)
Profit before income tax 296 658 557 (6) 1,505
Income tax expense and non-controlling interests (81) (188) (158) 3 (424)
Underlying profit 215 470 399 (3) 1,081

PROFIT RECONCILIATION
91
Underlying profit by division – New Zealand
March 2012 Half Year
NZD M Retail Commercial Wealth Operations & Support New Zealand
Net interest income 463 679 14 6 1,162
Other external operating income 142 65 106 (2) 311
Operating income 605 744 120 4 1,473
Operating expenses (341) (250) (67) (5) (663)
Profit before credit impairment and income tax 264 494 53 (1) 810
Provision for credit impairment (30) (70) (2) - (102)
Profit before income tax 234 424 51 (1) 708
Income tax expense and non-controlling interests (65) (119) (10) 1 (193)
Underlying profit 169 305 41 - 515
September 2011 Half Year
NZD M Retail Commercial Wealth Operations & Support New Zealand
Net interest income 444 673 12 - 1,129
Other external operating income 143 62 102 - 307
Operating income 587 735 114 - 1,436
Operating expenses (341) (249) (74) - (664)
Profit before credit impairment and income tax 246 486 40 - 772
Provision for credit impairment (43) (76) - - (119)
Profit before income tax 203 410 40 - 653
Income tax expense and non-controlling interests (60) (122) (8) - (190)
Underlying profit 143 288 32 - 463
March 2011 Half Year
NZD M Retail Commercial Wealth Operations & Support New Zealand
Net interest income 429 686 6 - 1,121
Other external operating income 143 65 93 - 301
Operating income 572 751 99 - 1,422
Operating expenses (342) (249) (70) - (661)
Profit before credit impairment and income tax 230 502 29 - 761
Provision for credit impairment (35) (64) 1 - (98)
Profit before income tax 195 438 30 - 663
Income tax expense and non-controlling interests (59) (132) (3) - (194)
Underlying profit 136 306 27 - 469

PROFIT RECONCILIATION
92
Divisional to Geographic region reconciliation matrix
Geographies
March 2012 Half Year AUD M Australia
Asia Pacific, Europe & America New Zealand Pro forma
Australia 1,362 3 n/a 1,365 Asia Pacific, Europe & America (34) 453 n/a 419 Institutional 682 307 134 1,123 New Zealand n/a n/a 397 397 Group Centre (19) (1) (4) (24)D
ivis
ion
s
Less: Institutional Asia Pacific, Europe & America n/a (307) n/a (307)
Pro forma profit 1,991 455 527 2,973
Foreign exchange adjustments n/a n/a n/a n/a
Underlying profit 1,991 455 527 2,973
Adjustments between statutory profit and underlying profit 4 (6) (52) (54)
Profit 1,995 449 475 2,919
September 2011 Half Year AUD M Australia 1,462 2 n/a 1,464 Asia Pacific, Europe & America (31) 383 n/a 352 Institutional 599 176 140 915 New Zealand n/a n/a 355 355 Group Centre (80) (11) (2) (93)D
ivis
ion
s
Less: Institutional Asia Pacific, Europe & America n/a (176) n/a (176)
Pro forma profit 1,950 374 493 2,817
Foreign exchange adjustments 31 (14) - 17
Underlying profit 1,981 360 493 2,834
Adjustments between statutory profit and underlying profit (59) (59) (25) (143)
Profit 1,922 301 468 2,691
March 2011 Half Year AUD M Australia 1,348 2 n/a 1,350 Asia Pacific, Europe & America (16) 404 n/a 388 Institutional 703 250 128 1,081 New Zealand n/a n/a 362 362 Group Centre (74) (10) (24) (108)D
ivis
ion
s
Less: Institutional Asia Pacific, Europe & America n/a (250) n/a (250)
Pro forma profit 1,961 396 466 2,823
Foreign exchange adjustments (4) 6 (7) (5)
Underlying profit 1,957 402 459 2,818
Adjustments between statutory profit and underlying profit (45) (13) (96) (154)
Profit 1,912 389 363 2,664

PROFIT RECONCILIATION
93
Asia Pacific, Europe & America Alex Thursby Table reflects AUD for the APEA division USD results shown on page 58
Half Year Movement
Mar 12
$M Sep 11
$M Mar 11
$M Mar 12
v. Sep 11 Mar 12
v. Mar 11
Net interest income 684 588 555 16% 23%
Other external operating income 714 667 707 7% 1%
Operating income 1,398 1,255 1,262 11% 11%
Operating expenses (820) (765) (721) 7% 14%
Profit before credit impairment and income tax 578 490 541 18% 7%
Provision for credit impairment (48) (68) (41) -29% 17%
Profit before income tax 530 422 500 26% 6%
Income tax expense and non-controlling interests (111) (70) (112) 59% -1%
Pro forma profit 419 352 388 19% 8%
Foreign exchange adjustments n/a (14) 2 n/a n/a
Underlying profit 419 338 390 24% 7%
Consisting of:
Retail 65 48 59 35% 10%
Asia Partnerships 121 172 149 -30% -19%
Institutional 307 176 250 74% 23%
Relationship & Infrastructure (74) (44) (70) 68% 6%
Pro forma profit 419 352 388 19% 8%
Balance Sheet
Net loans & advances including acceptances
40,723 38,779 30,946 5% 32%
Other external assets
55,931 49,329 33,811 13% 65%
External assets
96,654 88,108 64,757 10% 49%
Customer deposits
70,776 64,824 52,795 9% 34%
Other deposits and borrowings
7,630 7,474 5,170 2% 48%
Deposits and other borrowings
78,406 72,298 57,965 8% 35%
Other external liabilities
21,686 20,730 14,962 5% 45%
External liabilities
100,092 93,028 72,927 8% 37%
Risk weighted assets 63,198 57,234 47,545 10% 33%
Average net loans and advances including acceptances 38,837 34,444 29,443 13% 32%
Average deposits and other borrowings 72,414 63,795 57,195 14% 27%
Ratios
Return on average assets 0.85% 0.80% 1.04%
Net interest average margin 1.58% 1.55% 1.74%
Net interest average margin (excluding Global Markets) 2.60% 2.63% 2.98%
Operating expenses to operating income (pro forma) 58.7% 61.0% 57.1%
Operating expenses to operating income 58.7% 61.5% 57.5%
Operating expenses to average assets 1.66% 1.79% 1.96%
Individual provision charge 52 77 52 -32% 0%
Individual provision charge as a % of average net advances 0.27% 0.44% 0.35%
Collective provision charge (credit) (4) (10) (9) -60% -56%
Collective provision charge (credit) as a % of average net advances (0.03%) (0.06%) (0.05%)
Net impaired assets 301 284 274 6% 10%
Net impaired assets as a % of net advances 0.74% 0.73% 0.89%
Total full time equivalent staff (FTE) 10,726 10,701 10,719 0% 0%

PROFIT RECONCILIATION
94
New Zealand David Hisco Table reflects AUD for New Zealand NZD results shown on page 68
Half Year Movement
Mar 12
$M Sep 11
$M Mar 11
$M Mar 12
v. Sep 11 Mar 12
v. Mar 11
Net interest income 897 870 865 3% 4%
Other external operating income 240 237 231 1% 4%
Operating income 1,137 1,107 1,096 3% 4%
Operating expenses (512) (513) (510) 0% 0%
Profit before credit impairment and income tax 625 594 586 5% 7%
Provision for credit impairment (79) (92) (75) -14% 5%
Profit before income tax 546 502 511 9% 7%
Income tax expense and non-controlling interests (149) (147) (149) 1% 0%
Pro forma profit 397 355 362 12% 10%
Foreign exchange adjustments n/a 2 (5) n/a n/a
Underlying profit 397 357 357 11% 11%
Consisting of:
Retail 130 109 105 19% 24%
Commercial 235 222 236 6% 0%
Wealth 32 24 21 33% 52%
Pro forma profit 397 355 362 12% 10%
Balance Sheet
Net loans & advances including acceptances
68,189 68,174 65,059 0% 5%
Other external assets
1,824 2,099 1,999 -13% -9%
External assets
70,013 70,273 67,058 0% 4%
Customer deposits
41,182 39,471 37,572 4% 10%
Other deposits and borrowings
3,508 3,758 2,106 -7% 67%
Deposits and other borrowings
44,690 43,229 39,678 3% 13%
Other external liabilities
13,034 13,218 13,363 -1% -2%
External liabilities
57,724 56,447 53,041 2% 9%
Risk weighted assets 37,604 38,299 37,533 -2% 0%
Average net loans and advances including acceptances 66,678 67,659 67,516 -1% -1%
Average deposits and other borrowings 42,584 41,807 41,930 2% 2%
Ratios
Return on average assets 1.16% 1.02% 1.02%
Net interest average margin 2.65% 2.53% 2.49%
Operating expenses to operating income 45.0% 46.3% 46.5%
Operating expenses to average assets 1.49% 1.46% 1.44%
Individual provision charge 105 134 121 -22% -13%
Individual provision charge as a % of average net advances 0.31% 0.40% 0.36%
Collective provision charge (credit) (26) (42) (47) -38% -45%
Collective provision charge (credit) as a % of average net advances (0.08%) (0.13%) (0.14%)
Net impaired assets 917 1,019 1,228 -10% -25%
Net impaired assets as a % of net advances 1.34% 1.49% 1.89%
Total full time equivalent staff (FTE) 8,651 8,884 9,022 -3% -4%

95
Australia and New Zealand Banking Group Limited
CONDENSED CONSOLIDATED FINANCIAL STATEMENTS
Half year ended 31 March 2012

CONDENSED CONSOLIDATED FINANCIAL STATEMENTS – TABLE OF CONTENTS
96
CONTENTS PAGE
Directors’ Report 97
Condensed Consolidated Income Statement 98
Condensed Consolidated Statement of Comprehensive Income 99
Condensed Consolidated Balance Sheet 100
Condensed Consolidated Cash Flow Statement 101
Condensed Consolidated Statement of Changes in Equity 102
Notes to Condensed Financial Statements 103
Directors’ Declaration and Responsibility Statement 125
Auditors’ Review Report and Independence Declaration 126

DIRECTORS’ REPORT
97
The Directors present their report on the Condensed Consolidated Financial Statements for the half year ended 31 March 2012. Directors The names of the Directors of the Company who held office during and since the end of the half year are:
Mr JP Morschel Chairman
Mr MRP Smith, OBE – Chief Executive Officer Director and Chief Executive Officer
Dr GJ Clark Director
Ms PJ Dwyer Director (appointment effective 1 April 2012)
Mr PAF Hay Director
Mr Lee Hsien Yang Director
Mr IJ Macfarlane, AC Director
Mr DE Meiklejohn, AM Director
Ms AM Watkins Director Result
The consolidated profit attributable to shareholders of the Company was $2,919 million. Further details are contained in the Review of Operating Results on pages 14 to 44 and in the Condensed Consolidated Financial Statements. Review of operations
A review of the operations of the Group during the half year and the results of those operations are contained in the Review of Operating Results on pages 14 to 44 and those references form part of this report. Lead auditor’s independence declaration
The lead auditor’s independence declaration given under section 307C of the Corporations Act 2001 (as amended) is set out on page 126 and forms part of the Directors’ Report for the half year ended 31 March 2012. Rounding of amounts
The Parent Entity is an entity of the kind referred to in the Australian Securities and Investments Commission class order 98/100 dated 10 July 1998 (as amended). Consequently, amounts in these Condensed Consolidated Financial Statements have been rounded to the nearest million dollars, except where otherwise indicated. Significant event since balance date
There are no significant events from 31 March 2012 to the date of this report. Signed in accordance with a resolution of the Directors.
John Morschel Michael R P Smith Chairman Director 1 May 2012

CONDENSED CONSOLIDATED INCOME STATEMENT
Australia and New Zealand Banking Group Limited
98
Note Half Year Movement
Mar 12
$M Sep 11
$M Mar 11
$M Mar 12
v. Sep 11 Mar 12
v. Mar 11
Interest income 15,411 15,423 14,945 0% 3%
Interest expense (9,427) (9,586) (9,299) -2% 1%
Net interest income 3 5,984 5,837 5,646 3% 6%
Other operating income 3 2,090 1,634 1,974 28% 6%
Net funds management and insurance income 3 577 663 742 -13% -22%
Share of associates' profit 19 166 193 243 -14% -32%
Operating income 8,817 8,327 8,605 6% 2%
Operating expenses 4 (4,133) (3,997) (4,026) 3% 3%
Profit before credit impairment and income tax 4,684 4,330 4,579 8% 2%
Provision for credit impairment 9 (538) (562) (675) -4% -20%
Profit before income tax 4,146 3,768 3,904 10% 6%
Income tax expense 5 (1,223) (1,074) (1,235) 14% -1%
Profit for the period 2,923 2,694 2,669 9% 10%
Comprising:
Profit attributable to non-controlling interests 4 3 5 33% -20%
Profit attributable to shareholders of the Company
2,919 2,691 2,664 8% 10%
Earnings per ordinary share (cents)
Basic 7 110.8 104.0 104.2 7% 6%
Diluted 7 106.2 99.3 101.2 7% 5%
Dividend per ordinary share (cents) 6 66 76 64 -13% 3%
The notes appearing on pages 103 to 124 form an integral part of the Condensed Consolidated Financial Statements

CONDENSED CONSOLIDATED STATEMENT OF COMPREHENSIVE INCOME
Australia and New Zealand Banking Group Limited
99
Half Year Movement
Mar 12
$M Sep 11
$M Mar 11
$M Mar 12
v. Sep 11 Mar 12
v. Mar 11
Profit for the period 2,923 2,694 2,669 9% 10%
Other comprehensive income
Foreign currency translation adjustments
Exchange differences taken to equity (410) 880 (550) large -25%
Available-for-sale assets
Valuation gain/(loss) taken to equity 142 133 (56) 7% large
Cumulative (gain)/loss transferred to the income statement 25 (16) 35 large -29%
Cash flow hedges
Valuation gain/(loss) taken to equity (53) 201 28 large large
Transferred to income statement for the period 7 (2) (7) large large
Share of associates' other comprehensive income (2) (8) (7) -75% -71%
Actuarial gain/(loss) on defined benefit plans (2) (61) 46 -97% large
Income tax on items transferred directly to/from equity
Foreign currency translation reserve (5) 1 (6) large -17%
Available-for-sale reserve (49) (40) 5 23% large
Cash flow hedge reserve 14 (59) (4) large large
Actuarial gain / (loss) on defined benefits plan - 18 (13) -100% -100%
Other comprehensive income net of tax (333) 1,047 (529) large -37%
Total comprehensive income for the period 2,590 3,741 2,140 -31% 21%
Comprising total comprehensive income attributable to:
non-controlling interests 1 3 5 -67% -80%
shareholders of the Company 2,589 3,738 2,135 -31% 21%
The notes appearing on pages 103 to 124 form an integral part of the Condensed Consolidated Financial Statements

CONDENSED CONSOLIDATED BALANCE SHEET
Australia and New Zealand Banking Group Limited
100
As at ($M) Movement
Assets Note Mar 12 Sep 11 Mar 11 Mar 12
v. Sep 11 Mar 12
v. Mar 11
Liquid assets
35,771 24,899 19,298 44% 85%
Due from other financial institutions
10,035 8,824 7,479 14% 34%
Trading securities 32,859 36,074 28,966 -9% 13%
Derivative financial instruments 36,873 54,118 29,646 -32% 24%
Available-for-sale assets 23,125 22,264 18,323 4% 26%
Net loans and advances 8 411,952 396,337 378,812 4% 9%
Customers' liability for acceptances 676 970 577 -30% 17%
Investment in associates 3,424 3,513 3,239 -3% 6%
Current tax assets 116 41 20 large large
Deferred tax assets 484 599 653 -19% -26%
Goodwill and other intangible assets1 7,070 6,964 6,632 2% 7%
Investments backing policy liabilities 30,204 29,859 32,958 1% -8%
Other assets 8,552 7,901 8,685 8% -2%
Premises and equipment 2,095 2,125 2,159 -1% -3%
Total assets 603,236 594,488 537,447 1% 12%
Liabilities
Due to other financial institutions 26,964 23,012 22,014 17% 22%
Deposits and other borrowings 11 383,141 368,729 331,789 4% 15%
Derivative financial instruments 35,119 50,088 29,796 -30% 18%
Liability for acceptances 676 970 577 -30% 17%
Current tax liabilities 648 1,128 750 -43% -14%
Deferred tax liabilities 26 28 40 -7% -35%
Policy liabilities 29,003 27,503 29,718 5% -2%
External unit holder liabilities (life insurance funds) 4,528 5,033 5,501 -10% -18%
Payables and other liabilities 8,742 10,251 10,688 -15% -18%
Provisions 1,234 1,248 1,285 -1% -4%
Bonds and notes 61,107 56,551 58,526 8% 4%
Loan capital 12 12,605 11,993 11,634 5% 8%
Total liabilities 563,793 556,534 502,318 1% 12%
Net assets 39,443 37,954 35,129 4% 12%
Shareholders' equity
Ordinary share capital 13,14 22,195 21,343 20,594 4% 8%
Preference share capital 13,14 871 871 871 0% 0%
Reserves 14 (2,430) (2,095) (3,171) 16% -23%
Retained earnings 14 18,758 17,787 16,766 5% 12%
Share capital and reserves attributable to shareholders of the Company 39,394 37,906 35,060 4% 12%
Non-controlling interests 49 48 69 2% -29%
Total shareholders' equity 39,443 37,954 35,129 4% 12%
1. Excludes notional goodwill in equity accounted associates
The notes appearing on pages 103 to 124 form an integral part of the Condensed Consolidated Financial Statements

CONDENSED CONSOLIDATED CASH FLOW STATEMENT
Australia and New Zealand Banking Group Limited
101
Half Year Mar 12 Sep 11 Mar 11 Inflows Inflows Inflows (Outflows) (Outflows) (Outflows) Note $M $M $M Cash flows from operating activities Interest received 15,241 15,386 14,874 Interest paid (9,902) (9,593) (9,204) Dividends received 19 52 32 Other operating income received 2,011 1,792 2,087 Personnel expenses paid (2,381) (2,298) (2,249) Other operating expenses paid (1,842) (1,110) (1,520) Net cash (paid)/received on derivatives (427) 745 (2,783) Income taxes (paid)/refunds received (1,661) (704) (1,329) Goods and services tax received/(paid) 50 29 21 Net cash flows from funds management and insurance business Premiums and other income received 2,867 3,035 2,823 Investment income and policyholder deposits received (2,171) (2,335) (2,196) Claims and policyholder withdrawals paid 2 (92) 71 Commission expense paid (200) (254) (237)
Cash flows from operating activities before changes in operating assets and liabilities 1,606 4,653 390
Changes in operating assets and liabilities arising from cash flow movements
(Increase)/decrease in operating assets Liquid assets - greater than three months (199) 342 1,251 Due from other financial institutions - greater than three months (1,527) (833) (643) Trading securities 2,718 (5,859) (1,755) Loans and advances (18,395) (13,119) (12,449) Net cash flows from investments backing policyholder liabilities Purchase of insurance assets (4,946) (3,786) (5,341) Proceeds from sale/maturity of insurance assets 5,729 4,521 5,661 Increase/(decrease) in operating liabilities Deposits and other borrowings 18,412 29,864 13,970 Due to other financial institutions 4,728 1,456 (106) Payables and other liabilities (886) (1,160) 1,744
Change in operating assets and liabilities arising from cash flow movements 5,634 11,426 2,332
Net cash provided by/(used in) operating activities 16(a) 7,240 16,079 2,722 Cash flows from investing activities Available-for-sale assets Purchases (26,844) (21,883) (18,774) Proceeds from sale or maturity 25,327 18,734 20,784 Controlled entities and associates Purchased (net of cash acquired) (2) (50) (254) Proceeds from sale (net of cash disposed) 13 32 42 Premises and equipment Purchases (130) (150) (169) Proceeds from sale 20 5 1 Other assets (429) (372) (477) Net cash provided by/(used in) investing activities (2,045) (3,684) 1,153 Cash flows from financing activities Bonds and notes Issue proceeds 15,364 1,223 10,990 Redemptions (7,942) (8,255) (8,938) Loan capital Issue proceeds 2,010 1,341 - Redemptions (1,153) (1,250) (329) Dividends paid (1,191) (972) (1,141) Share capital issues 29 16 27 On market share purchases (55) - (137) Net cash provided by/(used in) financing activities 7,062 (7,897) 472 Net cash provided by/(used in) operating activities 7,240 16,079 2,722 Net cash provided by/(used in) investing activities (2,045) (3,684) 1,153 Net cash provided by/(used in) financing activities 7,062 (7,897) 472 Net increase/(decrease) in cash and cash equivalents 12,257 4,498 4,347 Cash and cash equivalents at beginning of period 30,021 24,648 20,610 Effects of exchange rate changes on cash and cash equivalents (1,677) 875 (309) Cash and cash equivalents at end of period 16(b) 40,601 30,021 24,648
The notes appearing on pages 103 to 124 form an integral part of the Condensed Consolidated Financial Statements

CONDENSED CONSOLIDATED STATEMENT OF CHANGES IN EQUITY
Australia and New Zealand Banking Group Limited
102
Ordinary share
capital Preference
shares Reserves1 Retained earnings
Shareholders' equity
attributable to Equity holders
of the Bank
Non-controlling
interests
Total Shareholders'
equity $M $M $M $M $M $M $M
As at 1 October 2010 19,886 871 (2,587) 15,921 34,091 64 34,155
Profit or loss - - - 2,664 2,664 5 2,669
Other comprehensive income for the period - - (562) 33 (529) - (529)
Total comprehensive income for the period - - (562) 2,697 2,135 5 2,140
Transactions with equity holders in their capacity as equity holders:
Dividends paid - - - (1,866) (1,866) - (1,866) Dividend income on treasury shares held within the Group's life insurance statutory funds
- - - 13 13 - 13
Dividend reinvestment plan 712 - - - 712 - 712
Other equity movements:
Share based payments and exercises - - (21) - (21) - (21)
Group share option scheme 27 - - - 27 - 27 Treasury shares OnePath Australia adjustment
1 - - - 1 - 1
Group employee share acquisition scheme
(32) - - - (32) - (32)
Other changes - - (1) 1 - -
As at 31 March 2011 20,594 871 (3,171) 16,766 35,060 69 35,129
Profit or loss - - - 2,691 2,691 3 2,694
Other comprehensive income for the period - - 1,090 (43) 1,047 - 1,047
Total comprehensive income for the period - - 1,090 2,648 3,738 3 3,741
Transactions with equity holders in their capacity as equity holders:
Dividends paid - - - (1,637) (1,637) - (1,637)
Dividend income on treasury shares held within the Group's life insurance statutory funds
- - - 10 10 - 10
Dividend reinvestment plan 655 - - - 655 - 655
Transactions with non-controlling interests - - (22) - (22) (22) (44)
Other equity movements:
Share based payments and exercises - - 7 - 7 - 7
Group share option scheme 16 - - - 16 - 16 Treasury shares OnePath Australia adjustment
1 - - - 1 - 1
Group employee share acquisition scheme
77 - - - 77 - 77
Other changes - - 1 - 1 (2) (1)
As at 30 September 2011 21,343 871 (2,095) 17,787 37,906 48 37,954
Profit or loss - - - 2,919 2,919 4 2,923
Other comprehensive income for the period - - (328) (2) (330) (3) (333)
Total comprehensive income for the period - - (328) 2,917 2,589 1 2,590
Transactions with equity holders in their capacity as equity holders:
Dividends paid - - - (1,962) (1,962) - (1,962)
Dividend income on treasury shares held within the Group's life insurance statutory funds
- - - 14 14 - 14
Dividend reinvestment plan 757 - - - 757 - 757
Transactions with non-controlling interests - - (1) - (1) - (1)
Other equity movements:
Share based payments and exercises - - (4) - (4) - (4)
Group share option scheme 29 - - - 29 - 29 Treasury shares OnePath Australia adjustment 21 - - - 21 - 21
Group employee share acquisition scheme 45 - - - 45 - 45
Other changes - - (2) 2 - - -
As at 31 March 2012 22,195 871 (2,430) 18,758 39,394 49 39,443
1. Further information on other comprehensive income is disclosed in Note 14
The notes appearing on pages 103 to 124 form an integral part of the Condensed Consolidated Financial Statements

NOTES TO CONDENSED FINANCIAL STATEMENTS
103
1. Basis of preparation
These Condensed Consolidated Financial Statements:
should be read in conjunction with the ANZ Annual Report for the year ended 30 September 2011 and any public announcements made by the Parent Entity and its controlled entities (the Group) for the half year ended 31 March 2012 in accordance with the continuous disclosure obligations under the Corporations Act 2001 and the ASX Listing Rules;
are condensed financial statements as defined in AASB 134 Interim Financial Reporting (“AASB 134”). This report does not include all notes of the type normally included in the annual financial report;
are presented in Australian dollars unless otherwise stated; and
were approved by the Board of Directors on 1 May 2012.
i) Statement of compliance
These Condensed Consolidated Financial Statements have been prepared in accordance with the Corporations Act 2001 and AASB 134 which ensures compliance with IAS 34 Interim Financial Reporting.
ii) Use of estimates and assumptions
The preparation of the financial statements requires the use of management judgement, estimates and assumptions that affect reported amounts and the application of policies. The estimates and associated assumptions are based on historical experience and various other factors that are believed to be reasonable. Actual results may differ from these estimates. Discussion of these critical accounting treatments, which include complex or subjective decisions or assessments, are covered in Note 2. Such estimates may require review in future periods.
iii) Basis of measurement
The financial information has been prepared in accordance with the historical cost basis except that the following assets and liabilities are stated at their fair value:
derivative financial instruments, including in the case of fair value hedging, the fair value of any applicable underlying exposure;
financial assets treated as available-for-sale;
financial instruments held for trading; and
assets and liabilities designated at fair value through profit and loss.
In accordance with AASB 1038 Life Insurance Contracts, life insurance liabilities are measured using the Margin on Services model.
In accordance with AASB 119 Employee Benefits, defined benefit obligations are measured using the Projected Unit Credit method.
iv) Accounting policies
These Condensed Consolidated Financial Statements have been prepared on the basis of accounting policies consistent with those applied in the 30 September 2011 annual financial report. All new Accounting Standards and Interpretations applicable to annual reporting periods beginning on or after 1 October 2011 have been applied to the Group effective from the required date of application. The initial application of these Standards and Interpretations has not had a material impact on the financial position or the financial results of the Group.
There has been no other change in accounting policy during the half year.
v) Rounding
The Parent Entity is an entity of the kind referred to in the Australian Securities and Investments Commission class order 98/100 dated 10 July 1998 (as amended). Consequently, amounts in these Condensed Consolidated Financial Statements have been rounded to the nearest million dollars, except where otherwise indicated.
vi) Comparatives
Certain amounts in the comparative information have been reclassified to conform with current period financial statement presentations.

NOTES TO CONDENSED FINANCIAL STATEMENTS
104
2. Critical estimates and judgements used in applying accounting policies
The Group prepares its consolidated financial information in accordance with policies which are based on Australian Accounting Standards (AASs), other authoritative accounting pronouncements and Interpretations of the AASB and the Corporations Act 2001. This involves the Group making estimates and assumptions that affect the reported amounts within the financial statements. Details of these estimates and judgements are contained in the Group’s financial report for the year ended 30 September 2011, as updated by the information below.
Significant associates
The review of the recoverable amount of all significant associates indicated a potential impairment of the investment in Saigon Securities Incorporated (“SSI”). A value in use calculation was performed resulting in the recognition of an impairment loss of $31 million.

NOTES TO CONDENSED FINANCIAL STATEMENTS
105
3. Income
Half Year Movement
Mar 12
$M Sep 11
$M Mar 11
$M Mar 12
v. Sep 11 Mar 12
v. Mar 11 Interest income 15,411 15,423 14,945 0% 3%
Interest expense (9,427) (9,586) (9,299) -2% 1%
Net interest income 5,984 5,837 5,646 3% 6%
i) Fee and commission income
Lending fees1 341 346 306 -1% 11%
Non-lending fees and commissions 1,048 1,027 1,026 2% 2%
Total fee and commission income 1,389 1,373 1,332 1% 4%
Fee and commission expense2 (171) (159) (155) 8% 10%
Net fee and commission income 1,218 1,214 1,177 0% 3%
ii) Other income
Net foreign exchange earnings 570 386 431 48% 32%
Net gains from trading securities and derivatives 222 (37) 349 large -36%
Credit risk on intermediation trades 52 (51) 55 large -5%
Movement on financial instruments measured at fair value through profit & loss3
(33) (12) (155) large -79%
Brokerage income 23 30 31 -23% -26%
NZ managed funds impacts - 1 60 -100% -100%
Write-down on assets in non continuing businesses - (11) (2) -100% -100%
Gain on sale/(write-down) of investment in Sacombank 10 - (35) n/a large
Write-down of investment in SSI (31) - - n/a n/a
Private equity and infrastructure earnings 22 25 1 -12% large
Profit on sale of property 1 22 2 -95% -50%
Other 36 67 60 -46% -40%
Total other income 872 420 797 large 9%
Other operating income 2,090 1,634 1,974 28% 6%
iii) Net funds management and insurance income
Funds management income 417 426 442 -2% -6%
Investment income 1,912 (1,816) 1,305 large 47%
Insurance premium income 590 652 532 -10% 11%
Commission income (expense) (200) (253) (237) -21% -16%
Claims (309) (285) (263) 8% 17%
Changes in policy liabilities4 (1,757) 1,875 (1,021) large 72%
Elimination of treasury share (gain)/loss (76) 64 (16) large large
Total net funds management and insurance income 577 663 742 -13% -22%
Total other operating income 2,667 2,297 2,716 16% -2%
Share of associates' profit 166 193 243 -14% -32%
Total income5 18,244 17,913 17,904 2% 2%
Profit before income tax as a % of total income 22.72% 21.04% 21.81%
1. Lending fees exclude fees treated as part of the effective yield calculation and included in interest income 2. Includes interchange fees paid 3. Includes fair value movements (excluding realised and accrued interest) on derivatives entered into to manage interest rate and foreign exchange risk on funding
instruments and not designated as accounting hedges, ineffective portions of cashflow hedges, and fair value movements in financial assets and liabilities designated fair value
4. Includes policyholder tax gross up, which represents contribution tax (recovered at 15% on the super contributions made by members) debited to the policyholder account once a year in July when the statement is issued to the members at the end of the 30 June financial year
5. Total income includes external dividend income of $1 million (Sep 2011 half: $3 million; Mar 2011 half: $8 million)

NOTES TO CONDENSED FINANCIAL STATEMENTS
106
4. Operating expenses
Half Year Movement
Mar 12
$M Sep 11
$M Mar 11
$M Mar 12
v. Sep 11 Mar 12
v. Mar 11 Personnel
Employee entitlements and taxes 143 159 147 -10% -3%
Salaries and wages 1,554 1,485 1,475 5% 5%
Superannuation costs - defined benefit plans 5 8 5 -38% 0%
Superannuation costs - defined contribution plans 152 140 147 9% 3%
Equity-settled share-based payments 101 88 78 15% 29%
Temporary staff 112 127 123 -12% -9%
Other 360 354 389 2% -7%
Total personnel expenses 2,427 2,361 2,364 3% 3%
Premises
Depreciation and amortisation 44 45 44 -2% 0%
Rent 205 195 192 5% 7%
Utilities and other outgoings 82 81 84 1% -2%
Other 22 20 24 10% -8%
Total premises expenses 353 341 344 4% 3%
Computer
Computer contractors 82 58 85 41% -4%
Data communications 52 66 59 -21% -12%
Depreciation and amortisation 202 174 174 16% 16%
Rentals and repairs 69 64 56 8% 23%
Software purchased 122 138 112 -12% 9%
Software written-off 1 15 5 -93% -80%
Other 30 20 15 50% 100%
Total computer expenses 558 535 506 4% 10%
Other
Advertising and public relations 105 119 116 -12% -9%
Audit and other fees 8 9 9 -11% -11%
Depreciation of furniture and equipment 50 49 48 2% 4%
Freight and cartage 33 33 32 0% 3%
Loss on sale and write-off of equipment 5 2 2 large large
Non-lending losses 25 29 24 -14% 4%
Postage and stationery 67 66 64 2% 5%
Professional fees 109 133 136 -18% -20%
Telephone 33 36 39 -8% -15%
Travel 82 103 105 -20% -22%
Amortisation and impairment of intangible assets 55 68 54 -19% 2%
Other 85 88 60 -3% 42%
Total other expenses 657 735 689 -11% -5%
Restructuring
New Zealand technology integration 64 17 108 large -41%
Other 74 8 15 large large
Total restructuring expenses 138 25 123 large 12%
Operating expenses 4,133 3,997 4,026 3% 3%

NOTES TO CONDENSED FINANCIAL STATEMENTS
107
5. Income tax expense
Half Year Movement Reconciliation of the prima facie income tax expense on pre-tax
profit with the income tax expense charged in the Income Statement Mar 12
$M Sep 11
$MMar 11
$M Mar 12
v. Sep 11Mar 12
v. Mar 11 Profit before income tax 4,146 3,768 3,904 10% 6%
Prima facie income tax expense at 30% 1,244 1,131 1,171 10% 6%
Tax effect of permanent differences:
Overseas tax rate differential (31) (24) (5) 29% large
Rebateable and non-assessable dividends (2) (3) (2) -33% 0%
Profit from associates (50) (58) (73) -14% -32%
(Gain on sale)/write-down of investment in Sacombank (3) - 11 n/a large
Write-down of investment in SSI 9 - - n/a n/a
Offshore Banking Unit (9) 6 (6) large 50%
OnePath Australia - Policyholder income and contributions tax 62 30 116 large -47%
Tax provisions no longer required (23) (35) (8) -34% large
Interest on Convertible Preference Shares 35 25 25 40% 40%
Other (6) (1) 6 large large
1,226 1,071 1,235 14% -1%
Income tax under/(over) provided in previous years (3) 3 - large n/a
Total income tax expense charged in the income statement
1,223 1,074 1,235 14% -1%
Australia 964 861 984 12% -2%
Overseas 259 213 251 22% 3%
1,223 1,074 1,235 14% -1%
Effective Tax Rate - Group 29.5% 28.5% 31.6%

NOTES TO CONDENSED FINANCIAL STATEMENTS
108
6. Dividends
Half Year Movement
Dividend per ordinary share (cents) Mar 12 Sep 11 Mar 11 Mar 12
v. Sep 11 Mar 12
v. Mar 11 Interim (fully franked) 66 n/a 64 n/a 3%
Final (fully franked) n/a 76 n/a n/a n/a
Total 66 76 64 -13% 3%
Ordinary share dividend $M $M $M % % Interim dividend - 1,662 - n/a n/a
Final dividend
2,002 - 1,895 n/a 6%
Bonus option plan adjustment
(47) (31) (35) 52% 34%
Total1 1,955 1,631 1,860 20% 5%
Ordinary share dividend payout ratio (%)2 60.8% 74.6% 62.5%
1. Dividends payable are not accrued and are recorded when paid 2. Dividend payout ratio calculated using proposed 2012 interim dividend of $1,769 million (not shown in the above table). The proposed 2012 interim dividend of
$1,769 million is based on the forecast number of ordinary shares on issue at the dividend record date. Dividend payout ratios for the September 2011 half year and March 2011 half year calculated using actual dividend paid of $2,002 million and $1,662 million respectively. Dividend payout ratio calculated by adjusting profit attributable to shareholders of the company by the amount of preference shares dividends paid.
Ordinary Shares
The Directors propose that an interim dividend of 66 cents be paid on 2 July 2012 on each eligible fully paid ANZ ordinary share. The proposed 2012 interim dividend will be fully franked for Australian tax purposes.
ANZ has a Dividend Reinvestment Plan (DRP) and a Bonus Option Plan (BOP) that will operate in respect of the 2012 interim dividend. For the 2012 interim dividend, ANZ intends to provide shares under the DRP and BOP through the issue of new shares. The “Acquisition Price” to be used in determining the number of shares to be provided under the DRP and BOP will be calculated by reference to the arithmetic average of the daily volume weighted average sale price of fully paid ANZ ordinary shares sold on the ASX during the seven trading days commencing on 18 May 2012 less a 1.5% discount, and then rounded to the nearest whole cent. Shares provided under the DRP and BOP will rank equally in all respects with existing fully paid ANZ ordinary shares. Election notices from shareholders wanting to commence, cease or vary their participation in the DRP or BOP for the 2012 interim dividend must be received by ANZ's Share Registrar by 5.00 pm (Australian Eastern Standard Time) on 16 May 2012. Subject to receiving effective contrary instructions from the shareholder, dividends payable to shareholders with a registered address in Great Britain (including the Channel Islands and the Isle of Man) or New Zealand will be converted to pounds sterling and New Zealand dollars respectively at an exchange rate calculated at 5.00 pm (Australian Eastern Standard Time) on 18 May 2012. There is no foreign conduit income attributed to the dividend. Preference Shares
Half Year Movement
Mar 12
$M Sep 11
$M Mar 11
$M Mar 12
v. Sep 11 Mar 12
v. Mar 11
Preference share dividend
Euro Trust Securities 7 6 6 17% 17%
Dividend per preference share
Euro Trust Securities €10.80 €10.13 €8.11 7% 33%

NOTES TO CONDENSED FINANCIAL STATEMENTS
109
7. Earnings per share
Half Year Movement
Mar 12 Sep 11 Mar 11
Mar 12 v. Sep 11
Mar 12 v. Mar 11
Number of fully paid ordinary shares on issue (M)1 2,679.5 2,629.0 2,596.4 2% 3%
Basic
Profit attributable to shareholders of the Company ($M) 2,919 2,691 2,664 8% 10%
Less Preference share dividends ($M) (7) (6) (6) 17% 17%
Profit less preference share dividends ($M) 2,912 2,685 2,658 8% 10%
Weighted average number of ordinary shares (M) 2,627.4 2,581.5 2,550.1 2% 3%
Basic earnings per share (cents) 110.8 104.0 104.2 7% 6%
Diluted
Profit less preference share dividends ($M) 2,912 2,685 2,658 8% 10%
Interest on US Stapled Trust Securities ($M)2 14 14 14 0% 0%
Interest on UK Hybrid Securities ($M)3 22 22 24 0% -8%
Interest on Convertible Preference Shares ($M)4 117 84 84 39% 39%
Profit attributable to shareholders of the Company excluding interest on US Trust Securities, UK Hybrid Securities and Convertible Preference Shares ($M)
3,065 2,805 2,780 9% 10%
Weighted average number of shares on issue (M) 2,627.4 2,581.5 2,550.1 2% 3%
Weighted average number of convertible options (M) 4.6 4.1 5.0 12% -8%
Weighted average number of convertible US Trust Securities (M)2 32.6 41.6 32.1 -22% 2%
Weighted average number of convertible UK Hybrid Securities (M)3 31.3 38.9 31.0 -20% 1%
Weighted average number of Convertible Preference Shares (M)4 191.4 158.7 130.1 21% 47%
Adjusted weighted average number of shares - diluted (M)
2,887.3 2,824.8 2,748.3 2% 5%
Diluted earnings per share (cents)
106.2 99.3 101.2 7% 5%
1. Number of fully paid ordinary shares on issue includes Treasury shares of 31.6 million at 31 March 2012 (Sep 2011: 30.3 million; Mar 2011: 31.3 million)
2. The US Stapled Trust securities issued on 27 November 2003 convert to ordinary shares in 2053 at the market price of ANZ ordinary shares less 5% unless redeemed or bought back prior to that date. The US Stapled Trust Security issue can be de-stapled and the investor left with coupon paying preference shares at ANZ’s discretion at any time, or at the investor’s discretion under certain circumstances. AASB 133 requires that potential ordinary shares for which conversion to ordinary share capital is mandatory must be included in the calculation of diluted EPS
3. UK Hybrid (issued on 15 June 2007) is a GBP denominated stapled security that converts to ordinary shares on the fifth anniversary at the market price of ANZ ordinary shares less 5% (subject to certain conversion conditions). AASB 133 requires that potential ordinary shares for which conversion to ordinary share capital is mandatory must be considered in the calculation of diluted EPS
4. There are three “Tranches” of convertible preference shares. The first are convertible preference shares issued on 30 September 2008 and convert to ordinary shares on 16 June 2014 at the market price of ANZ ordinary shares less 2.5% (subject to certain conversion conditions). The second are convertible preference shares issued on 17 December 2009 and convert to ordinary shares on 15 December 2016 at the market price of ANZ ordinary shares less 1.0% (subject to certain conversion conditions). The third are convertible preference shares issued on 28 September 2011 that convert to ordinary shares on 1 September 2019 at the market price of ANZ ordinary shares less 1% (subject to certain conversion conditions). AASB 133 requires that potential ordinary shares for which conversion to ordinary share capital is mandatory must be included in the calculation of diluted EPS

NOTES TO CONDENSED FINANCIAL STATEMENTS
110
8. Net loans and advances
As at ($M) Movement
Mar 12 Sep 11 Mar 11
Mar 12 v. Sep 11
Mar 12 v. Mar 11
Australia
Overdrafts 5,732 6,326 6,169 -9% -7%
Credit card outstandings 9,084 9,062 8,912 0% 2%
Commercial bills outstanding 18,476 17,326 17,371 7% 6%
Term loans - housing 178,486 169,970 165,205 5% 8%
Term loans - non-housing 78,528 74,206 72,777 6% 8%
Lease receivables 1,868 1,769 1,510 6% 24%
Hire purchase 9,498 9,549 9,603 -1% -1%
Other 580 891 981 -35% -41%
302,252 289,099 282,528 5% 7%
Asia Pacific, Europe & America
Overdrafts 786 739 694 6% 13%
Credit card outstandings 964 1,053 1,036 -8% -7%
Commercial bills outstanding 812 1,008 554 -19% 47%
Term loans - housing 3,374 2,850 2,368 18% 42%
Term loans - non-housing 34,768 33,011 26,285 5% 32%
Lease receivables 119 130 144 -8% -17%
Other 168 213 250 -21% -33%
40,991 39,004 31,331 5% 31%
New Zealand
Overdrafts 1,185 1,068 1,179 11% 1%
Credit card outstandings 1,110 1,074 1,020 3% 9%
Term loans - housing 42,681 42,562 40,202 0% 6%
Term loans - non-housing 29,179 29,170 28,247 0% 3%
Lease receivables 168 185 174 -9% -3%
Hire purchase 462 419 378 10% 22%
Other 218 216 211 1% 3%
75,003 74,694 71,411 0% 5%
Total gross loans and advances 418,246 402,797 385,270 4% 9%
Less: Provision for credit impairment (refer note 9) (4,708) (4,873) (4,894) -3% -4%
Less: Unearned income1 (2,283) (2,216) (2,179) 3% 5%
Add: Capitalised brokerage/mortgage origination fees 697 629 615 11% 13%
(6,294) (6,460) (6,458) -3% -3%
Total net loans and advances2 411,952 396,337 378,812 4% 9%
1. Includes fees deferred and amortised using the effective interest method of $425 million (Sep 2011: $414 million; Mar 2011: $398 million) 2. Differs to net loans and advances including acceptances shown on page 11, 12 and page 31 as bill acceptances of $676 million (Sep 2011: $970 million;
Mar 2011: $577 million) are excluded

NOTES TO CONDENSED FINANCIAL STATEMENTS
111
9. Provision for credit impairment
Half Year Movement
Collective provision
Mar 12 $M
Sep 11 $M
Mar 11 $M
Mar 12 v. Sep 11
Mar 12 v. Mar 11
Balance at start of period 3,176 3,177 3,153 0% 1%
Charge/(credit) to income statement (152) (58) 65 large large
Adjustment for exchange rate fluctuations (30) 57 (41) large -27%
Total collective provision1 2,994 3,176 3,177 -6% -6%
Individual provision
Balance at start of period 1,697 1,717 1,875 -1% -9%
New and increased provisions 1,023 1,051 982 -3% 4%
Write-backs (251) (322) (291) -22% -14%
Adjustment for exchange rate fluctuations (29) 51 (43) large -33%
Discount unwind (64) (82) (103) -22% -38%
Bad debts written-off (662) (718) (703) -8% -6%
Total individual provision 1,714 1,697 1,717 1% 0%
Total provision for credit impairment 4,708 4,873 4,894 -3% -4%
1. The collective provision includes amounts for off-balance sheet credit exposures: $545 million at 31 March 2012 (Sep 2011: $572 million; Mar 2011: $579 million). The impact on the income statement for the year ended 31 March 2012 was a $22 million release (Sep 2011 half: $17 million release; Mar 2011 half: $10 million charge)
Half Year Movement
Provision movement analysis Mar 12
$M Sep 11
$M Mar 11
$M Mar 12
v. Sep 11 Mar 12
v. Mar 11 New and increased provisions
Australia 772 694 668 11% 16%
Asia Pacific, Europe & America 61 120 92 -49% -34%
New Zealand 190 237 222 -20% -14%
1,023 1,051 982 -3% 4%
Write-backs (251) (322) (291) -22% -14%
772 729 691 6% 12%
Recoveries of amounts previously written-off (117) (130) (97) -10% 21%
Individual provision charge for loans and advances 655 599 594 9% 10%
Impairment on available-for-sale assets 35 21 16 67% large
Collective provision charge/(credit) to income statement (152) (58) 65 large large
Charge to income statement 538 562 675 -4% -20%
Half Year Movement
Individual provision balance Mar 12
$M Sep 11
$M Mar 11
$M Mar 12
v. Sep 11 Mar 12
v. Mar 11 Australia 985 908 938 8% 5%
Asia Pacific, Europe & America 326 387 373 -16% -13%
New Zealand 403 402 406 0% -1%
Total individual provision 1,714 1,697 1,717 1% 0%
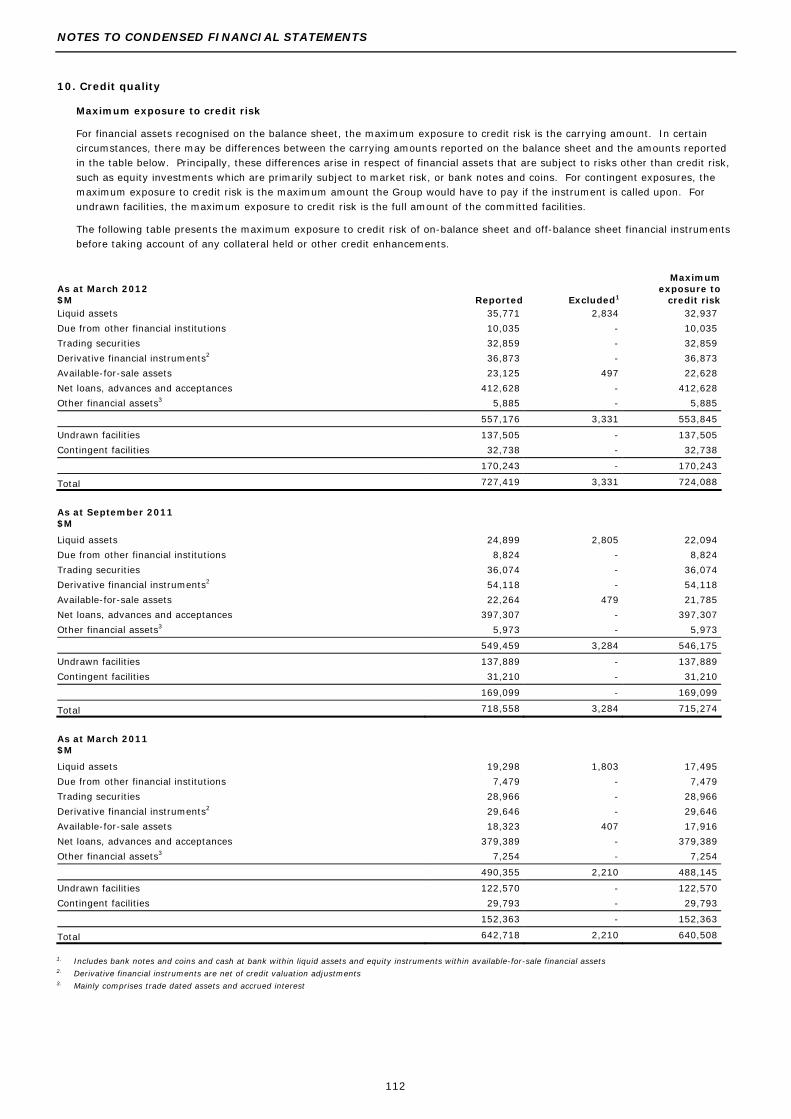
NOTES TO CONDENSED FINANCIAL STATEMENTS
112
10. Credit quality Maximum exposure to credit risk
For financial assets recognised on the balance sheet, the maximum exposure to credit risk is the carrying amount. In certain circumstances, there may be differences between the carrying amounts reported on the balance sheet and the amounts reported in the table below. Principally, these differences arise in respect of financial assets that are subject to risks other than credit risk, such as equity investments which are primarily subject to market risk, or bank notes and coins. For contingent exposures, the maximum exposure to credit risk is the maximum amount the Group would have to pay if the instrument is called upon. For undrawn facilities, the maximum exposure to credit risk is the full amount of the committed facilities.
The following table presents the maximum exposure to credit risk of on-balance sheet and off-balance sheet financial instruments before taking account of any collateral held or other credit enhancements.
As at March 2012 $M Reported Excluded1
Maximum exposure to
credit risk Liquid assets
35,771 2,834 32,937
Due from other financial institutions 10,035 - 10,035
Trading securities 32,859 - 32,859
Derivative financial instruments2 36,873 - 36,873
Available-for-sale assets 23,125 497 22,628
Net loans, advances and acceptances 412,628 - 412,628
Other financial assets3 5,885 - 5,885
557,176 3,331 553,845
Undrawn facilities 137,505 - 137,505
Contingent facilities 32,738 - 32,738
170,243 - 170,243
Total 727,419 3,331 724,088
As at September 2011 $M
Liquid assets 24,899 2,805
22,094
Due from other financial institutions 8,824 -
8,824
Trading securities 36,074 -
36,074
Derivative financial instruments2 54,118 -
54,118
Available-for-sale assets 22,264 479
21,785
Net loans, advances and acceptances 397,307 -
397,307
Other financial assets3 5,973 -
5,973
549,459 3,284
546,175
Undrawn facilities 137,889 -
137,889
Contingent facilities 31,210 -
31,210
169,099 -
169,099
Total 718,558 3,284
715,274
As at March 2011 $M
Liquid assets 19,298 1,803
17,495
Due from other financial institutions 7,479 -
7,479
Trading securities 28,966 -
28,966
Derivative financial instruments2 29,646 -
29,646
Available-for-sale assets 18,323 407
17,916
Net loans, advances and acceptances 379,389 -
379,389
Other financial assets3 7,254 -
7,254
490,355 2,210
488,145
Undrawn facilities 122,570 -
122,570
Contingent facilities 29,793 -
29,793
152,363 -
152,363
Total 642,718 2,210
640,508
1. Includes bank notes and coins and cash at bank within liquid assets and equity instruments within available-for-sale financial assets 2. Derivative financial instruments are net of credit valuation adjustments 3. Mainly comprises trade dated assets and accrued interest
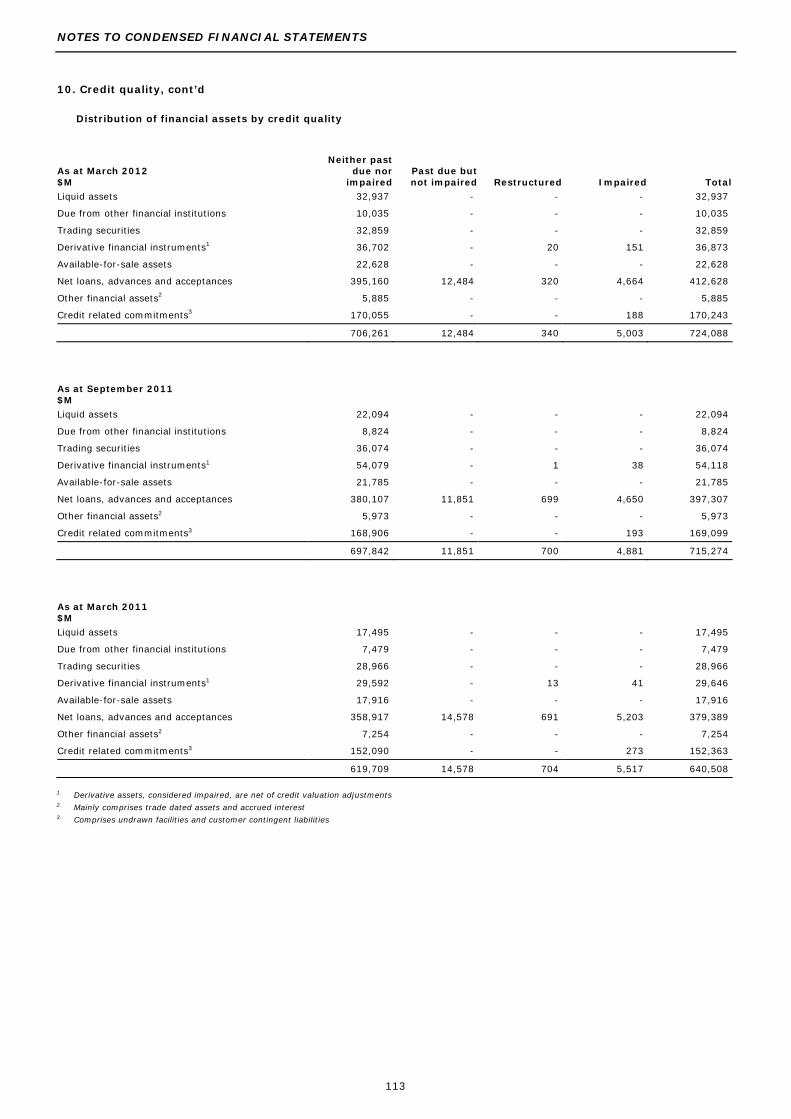
NOTES TO CONDENSED FINANCIAL STATEMENTS
113
10. Credit quality, cont’d
Distribution of financial assets by credit quality
As at March 2012 $M
Neither past due nor
impairedPast due but not impaired Restructured Impaired Total
Liquid assets 32,937 - - - 32,937
Due from other financial institutions 10,035 - - - 10,035
Trading securities 32,859 - - - 32,859
Derivative financial instruments1 36,702 - 20 151 36,873
Available-for-sale assets 22,628 - - - 22,628
Net loans, advances and acceptances 395,160 12,484 320 4,664 412,628
Other financial assets2 5,885 - - - 5,885
Credit related commitments3 170,055 - - 188 170,243
706,261 12,484 340 5,003 724,088
As at September 2011 $M
Liquid assets 22,094 - - - 22,094
Due from other financial institutions 8,824 - - - 8,824
Trading securities 36,074 - - - 36,074
Derivative financial instruments1 54,079 - 1 38 54,118
Available-for-sale assets 21,785 - - - 21,785
Net loans, advances and acceptances 380,107 11,851 699 4,650 397,307
Other financial assets2 5,973 - - - 5,973
Credit related commitments3 168,906 - - 193 169,099
697,842 11,851 700 4,881 715,274
As at March 2011 $M Liquid assets 17,495 - - - 17,495
Due from other financial institutions 7,479 - - - 7,479
Trading securities 28,966 - - - 28,966
Derivative financial instruments1 29,592 - 13 41 29,646
Available-for-sale assets 17,916 - - - 17,916
Net loans, advances and acceptances 358,917 14,578 691 5,203 379,389
Other financial assets2 7,254 - - - 7,254
Credit related commitments3 152,090 - - 273 152,363
619,709 14,578 704 5,517 640,508
1. Derivative assets, considered impaired, are net of credit valuation adjustments 2. Mainly comprises trade dated assets and accrued interest 3. Comprises undrawn facilities and customer contingent liabilities

NOTES TO CONDENSED FINANCIAL STATEMENTS
114
10. Credit quality, cont’d
Credit quality of financial assets neither past due nor impaired
The credit quality of financial assets is managed by the Group using internal ratings based on their current probability of default. The Group’s masterscales are mapped to external rating agency scales, to enable wider comparisons.
As at March 2012 $M
Strong credit profile1
Satisfactory risk2
Sub-standard but not past
due or impaired3 Total
Liquid assets
32,703 201 33 32,937
Due from other financial institutions
8,919 1,103 13 10,035
Trading securities
31,859 1,000 - 32,859
Derivative financial instruments 35,027 1,264 411 36,702
Available-for-sale assets 20,857 1,765 6 22,628
Net loans, advances and acceptances 285,430 91,566 18,164 395,160
Other financial assets4 4,948 851 86 5,885
Credit related commitments5 139,161 28,355 2,539 170,055
558,904 126,105 21,252 706,261
As at September 2011 $M
Liquid assets 21,484 552
58
22,094
Due from other financial institutions 7,617 980
227
8,824
Trading securities 35,528 546
-
36,074
Derivative financial instruments 51,928 1,461
690
54,079
Available-for-sale assets 20,081 1,664
40
21,785
Net loans, advances and acceptances 273,682 86,216
20,209
380,107
Other financial assets4 5,412 431
130
5,973
Credit related commitments5 136,248 29,759
2,899
168,906
551,980 121,609
24,253
697,842
As at March 2011 $M
Liquid assets 17,000 409 86 17,495
Due from other financial institutions 6,536 811 132 7,479
Trading securities 27,775 1,175 16 28,966
Derivative financial instruments 28,263 763 566 29,592
Available-for-sale assets 16,754 1,162 - 17,916
Net loans, advances and acceptances 249,991 88,902 20,024 358,917
Other financial assets4 6,850 330 74 7,254
Credit related commitments5 121,389 27,571 3,130 152,090
474,558 121,123 24,028 619,709
1. Customers that have demonstrated superior stability in their operating and financial performance over the long-term, and whose debt servicing capacity is not significantly vulnerable to foreseeable events. This rating broadly corresponds to ratings “Aaa” to “Baa3” and “AAA” to “BBB-” of Moody’s and Standard & Poor’s respectively
2. Customers that have consistently demonstrated sound operational and financial stability over the medium to long term, even though some may be susceptible to cyclical trends or variability in earnings. This rating broadly corresponds to ratings “Ba2” to “Ba3” and “BB” to “BB-” of Moody’s and Standard & Poor’s respectively
3. Customers that have demonstrated some operational and financial instability, with variability and uncertainty in profitability and liquidity projected to continue over the short and possibly medium term. This rating broadly corresponds to ratings “B1” to “Caa” and “B+” to “CCC” of Moody’s and Standard & Poor’s respectively
4. Mainly comprises trade dated assets and accrued interest 5. Comprises undrawn commitments and customer contingent liabilities

NOTES TO CONDENSED FINANCIAL STATEMENTS
115
10. Credit quality, cont’d
Ageing analysis of financial assets that are past due but not impaired Ageing analysis of past due loans is used by the Group to measure and manage emerging credit risks. Financial assets that are past due but not impaired include those which are assessed, approved and managed on a portfolio basis within a centralised environment (for example credit cards and personal loans), that can be held on a productive basis until they are 180 days past due, as well as those which are managed on an individual basis.
A large portion of retail credit exposures, such as residential mortgages, are generally well secured. That is, the value of associated security is sufficient to cover amounts outstanding.
As at March 2012 $M 1-5 days
6-29 days
30-59 days
60-89 days
> 90 days Total
Liquid assets - - - - - -
Due from other financial institutions - - - - - -
Trading securities - - - - - -
Derivative financial instruments - - - - - -
Available-for-sale assets - - - - - -
Net loans, advances and acceptances 2,847 4,837 1,966 958 1,876 12,484
Other financial assets1 - - - - - -
Credit related commitments2 - - - - - -
2,847 4,837 1,966 958 1,876 12,484
As at September 2011 $M
Liquid assets - - - - - -
Due from other financial institutions - - - - - -
Trading securities - - - - - -
Derivative financial instruments - - - - - -
Available-for-sale assets - - - - - -
Net loans, advances and acceptances 3,028 4,540 1,584 865 1,834 11,851
Other financial assets1 - - - - - -
Credit related commitments2 - - - - - -
3,028 4,540 1,584 865 1,834 11,851
As at March 2011 $M
Liquid assets - - - - - -
Due from other financial institutions - - - - - -
Trading securities - - - - - -
Derivative financial instruments - - - - - -
Available-for-sale assets - - - - - -
Net loans, advances and acceptances 2,583 6,222 2,509 1,309 1,955 14,578
Other financial assets1 - - - - - -
Credit related commitments2 - - - - - -
2,583 6,222 2,509 1,309 1,955 14,578
1. Mainly comprises trade dated assets and accrued interest 2. Comprises undrawn facilities and customer contingent liabilities

NOTES TO CONDENSED FINANCIAL STATEMENTS
116
10. Credit quality, cont’d
Financial assets that are individually impaired
ANZ regularly reviews its portfolio and monitors adherence to contractual terms. When doubt arises as to the collectability of a credit facility, the financial instrument (or ‘the facility’) is classified and reported as individually impaired and an individual provision is allocated against it.
As described in the summary of significant accounting policies in the ANZ 2011 Annual Report, provisions are created for financial instruments that are reported on the balance sheet at amortised cost. For instruments reported at fair value, impairment provisions are treated as part of overall change in fair value and directly reduce the reported carrying amounts.
Impaired instruments Individual provision balances
As at ($M) As at ($M)
Mar 12
$M Sep 11
$M Mar 11
$M Mar 12
$M Sep 11
$M Mar 11
$M
Liquid assets - - - - - -
Due from other financial institutions - - - - - -
Trading securities - - - - - -
Derivative financial instruments1 151 38 41 - - -
Available-for-sale assets - - - - - -
Net loans, advances and acceptances 4,664 4,650 5,203 1,701 1,687 1,700
Other financial assets2 - - - - - -
Credit related commitments3 188 193 273 13 10 17
Total 5,003 4,881 5,517 1,714 1,697 1,717
1. Derivative financial instruments are net of credit valuation adjustments 2. Mainly comprises trade dated assets and accrued interest 3. Comprises undrawn facilities and customer contingent liabilities
As at ($M) Movement
Impaired and Restructured Items by size of exposure
Mar 12 Sep 11 Mar 11
Mar 12 v. Sep 11
Mar 12 v. Mar 11
Less than $10 million
2,468 2,490 2,407 -1% 3%
$10 million to $100 million 1,903 2,123 2,561 -10% -26%
Greater than $100 million 972 968 1,253 0% -22%
Gross impaired assets1 5,343 5,581 6,221 -4% -14%
Less: Individually assessed provisions for impairment (1,714) (1,697) (1,717) 1% 0%
Net impaired assets
3,629 3,884 4,504 -7% -19%
1. Includes $340 million restructured items (Sep 2011: $700 million; Mar 2011: $704 million)

NOTES TO CONDENSED FINANCIAL STATEMENTS
117
11. Deposits and other borrowings
Half Year Movement
Mar 12
$M Sep 11
$M Mar 11
$M Mar 12
v. Sep 11 Mar 12
v. Mar 11 Certificates of deposit 59,603 55,554 51,513 7% 16%
Term deposits 164,439 153,200 142,668 7% 15%
Other deposits bearing interest and other borrowings 131,183 132,812 114,539 -1% 15%
Deposits not bearing interest 11,452 11,334 10,631 1% 8%
Commercial paper 15,084 14,333 10,769 5% 40%
Borrowing corporations' debt 1,380 1,496 1,669 -8% -17%
Total deposits and other borrowings 383,141 368,729 331,789 4% 15%
12. Loan capital
Half Year Movement
Mar 12 $M
Sep 11 $M
Mar 11 $M
Mar 12 v. Sep 11
Mar 12 v. Mar 11
Hybrid loan capital
US Trust Securities1 768 835 785 -8% -2%
UK Stapled Securities2 691 720 699 -4% -1%
ANZ Convertible Preference Shares (ANZ CPS)
ANZ CPS13 1,077 1,075 1,074 0% 0%
ANZ CPS24 1,956 1,954 1,951 0% 0%
ANZ CPS35 1,324 1,322 - 0% n/a
Perpetual subordinated notes 946 964 905 -2% 5%
Subordinated notes 5,843 5,123 6,220 14% -6%
Total Loan Capital 12,605 11,993 11,634 5% 8%
1. On 27 November 2003, ANZ issued USD750 million Trust Securities via ANZ Capital Trust II, each comprising an interest paying unsecured note issued by Samson Funding Limited (a wholly owned New Zealand subsidiary) and a preference share issued by ANZ which are stapled together. Subject to certain conditions, the securities are redeemable by the issuer on 15 December 2013. The instrument converts into ordinary shares of ANZ at a 5% discount (i) at the holder’s request, if ANZ fails to redeem the instrument on 15 December 2013, or (ii) on 15 December 2053 unless redeemed earlier. The securities constitute Tier 1 capital as defined by APRA for capital adequacy purposes.
2. On 15 June 2007, ANZ issued £450 million stapled securities, each comprising an interest paying subordinated note issued by ANZ New York branch and a preference share issued by ANZ which are stapled together. ANZ has elected for ANZ Capital No 1 Pty Ltd (a wholly owned subsidiary and guaranteed by ANZ) to purchase the securities on 15 June 2012, and following the purchase ANZ has agreed to buy-back and cancel the preference shares. Irrevocable notices to affect the purchase were issued on 27 April 2012. The securities constituted Tier 1 capital as defined by APRA for capital adequacy purposes until 27 April 2012.
3. On 30 September 2008, ANZ issued convertible preference shares which will convert into ordinary shares of ANZ on 16 June 2014 at a 2.5% discount (subject to certain conditions being satisfied), unless ANZ elects for a third party to purchase the convertible preference shares or they are exchanged earlier. The securities constitute Tier 1 capital as defined by APRA for capital adequacy purposes.
4. On 17 December 2009, ANZ issued convertible preference shares which will convert into ordinary shares of ANZ on 15 December 2016 at a 1% discount (subject to certain conditions being satisfied), unless ANZ elects for a third party to purchase the convertible preference shares or they are exchanged earlier. The securities constitute Tier 1 capital as defined by APRA for capital adequacy purpose.
5. On 28 September 2011, ANZ issued convertible preference shares which will convert into ordinary shares of ANZ on 1 September 2019 at a 1% discount (subject to certain conditions being satisfied), unless they are exchanged earlier. In addition, if ANZ’s Common Equity Tier 1 capital ratio is equal to or less than 5.125% then the convertible preference shares will immediately convert into ANZ ordinary shares subject to a maximum conversion number. Subject to certain conditions, the convertible preference shares are redeemable by ANZ on and from 1 September 2017. The securities constitute Tier 1 capital as defined by APRA for capital adequacy purposes.
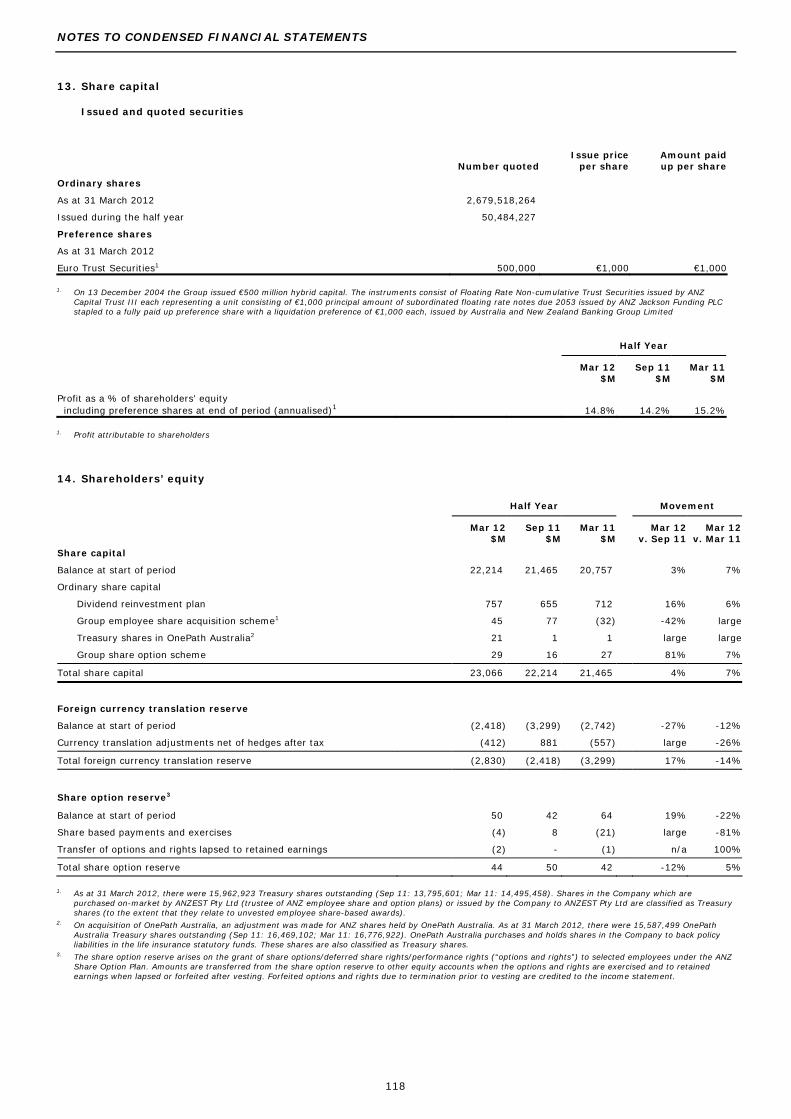
NOTES TO CONDENSED FINANCIAL STATEMENTS
118
13. Share capital Issued and quoted securities
Number quoted
Issue price per share
Amount paid up per share
Ordinary shares
As at 31 March 2012 2,679,518,264
Issued during the half year 50,484,227
Preference shares
As at 31 March 2012
Euro Trust Securities1 500,000 €1,000 €1,000
1. On 13 December 2004 the Group issued €500 million hybrid capital. The instruments consist of Floating Rate Non-cumulative Trust Securities issued by ANZ Capital Trust III each representing a unit consisting of €1,000 principal amount of subordinated floating rate notes due 2053 issued by ANZ Jackson Funding PLC stapled to a fully paid up preference share with a liquidation preference of €1,000 each, issued by Australia and New Zealand Banking Group Limited
Half Year
Mar 12 $M
Sep 11 $M
Mar 11 $M
Profit as a % of shareholders' equity including preference shares at end of period (annualised)1 14.8% 14.2% 15.2%
1. Profit attributable to shareholders
14. Shareholders’ equity
Half Year Movement
Mar 12
$M Sep 11
$M Mar 11
$M Mar 12
v. Sep 11 Mar 12
v. Mar 11
Share capital
Balance at start of period 22,214 21,465 20,757 3% 7%
Ordinary share capital
Dividend reinvestment plan 757 655 712 16% 6%
Group employee share acquisition scheme1 45 77 (32) -42% large
Treasury shares in OnePath Australia2 21 1 1 large large
Group share option scheme 29 16 27 81% 7%
Total share capital 23,066 22,214 21,465 4% 7%
Foreign currency translation reserve
Balance at start of period (2,418) (3,299) (2,742) -27% -12%
Currency translation adjustments net of hedges after tax (412) 881 (557) large -26%
Total foreign currency translation reserve (2,830) (2,418) (3,299) 17% -14%
Share option reserve3
Balance at start of period 50 42 64 19% -22%
Share based payments and exercises (4) 8 (21) large -81%
Transfer of options and rights lapsed to retained earnings (2) - (1) n/a 100%
Total share option reserve 44 50 42 -12% 5%
1. As at 31 March 2012, there were 15,962,923 Treasury shares outstanding (Sep 11: 13,795,601; Mar 11: 14,495,458). Shares in the Company which are purchased on-market by ANZEST Pty Ltd (trustee of ANZ employee share and option plans) or issued by the Company to ANZEST Pty Ltd are classified as Treasury shares (to the extent that they relate to unvested employee share-based awards).
2. On acquisition of OnePath Australia, an adjustment was made for ANZ shares held by OnePath Australia. As at 31 March 2012, there were 15,587,499 OnePath Australia Treasury shares outstanding (Sep 11: 16,469,102; Mar 11: 16,776,922). OnePath Australia purchases and holds shares in the Company to back policy liabilities in the life insurance statutory funds. These shares are also classified as Treasury shares.
3. The share option reserve arises on the grant of share options/deferred share rights/performance rights (“options and rights”) to selected employees under the ANZ Share Option Plan. Amounts are transferred from the share option reserve to other equity accounts when the options and rights are exercised and to retained earnings when lapsed or forfeited after vesting. Forfeited options and rights due to termination prior to vesting are credited to the income statement.

NOTES TO CONDENSED FINANCIAL STATEMENTS
119
14. Shareholders’ equity, cont’d
Half Year Movement
Mar 12 $M
Sep 11 $M
Mar 11 $M
Mar 12 v. Sep 11
Mar 12 v. Mar 11
Available-for-sale revaluation reserve4
Balance at start of period 126 57 80 large 58%
Gain/(loss) recognised after tax 108 83 (53) 30% large
Transferred to income statement 12 (14) 30 large -60%
Total available-for-sale revaluation reserve 246 126 57 95% large
Hedging reserve5
Balance at start of period 169 29 11 large large
Gain/(loss) recognised after tax (41) 142 22 large large
Transferred to income statement 5 (2) (4) large large
Total hedging reserve 133 169 29 -21% large
Transactions with non-controlling interests reserve
Balance at the start of the period (22) - - n/a n/a
Transactions with non-controlling interests (1) (22) - -95% n/a
Total transactions with non-controlling interests reserve (23) (22) - 5% n/a
Total reserves (2,430) (2,095) (3,171) 16% -23%
Retained earnings
Balance at start of period 17,787 16,766 15,921 6% 12%
Profit attributable to shareholders of the Company 2,919 2,691 2,664 8% 10%
Transfer of options lapsed from share option reserve 2 - 1 n/a 100%
Total available for appropriation 20,708 19,457 18,586 6% 11%
Actuarial gain/(loss) on defined benefit plans after tax6 (2) (43) 33 -95% large
Ordinary share dividends paid (1,955) (1,631) (1,860) 20% 5%
Dividend income on Treasury shares held within the Group's life insurance statutory funds
14 10 13 40% 8%
Preference share dividends paid (7) (6) (6) 17% 17%
Retained earnings at end of period 18,758 17,787 16,766 5% 12%
Share capital and reserves attributable to shareholders of the Company
39,394 37,906 35,060 4% 12%
Non-controlling interests 49 48 69 2% -29%
Total shareholders' equity 39,443 37,954 35,129 4% 12%
4. The available-for-sale revaluation reserve arises on the revaluation of available-for-sale financial assets. Where a revalued financial asset is sold, that portion of the reserve which relates to that financial asset is realised and recognised in the income statement. Where a revalued financial asset is impaired, that portion of the reserve which relates to that financial asset is recognised in the income statement
5. The hedging reserve represents hedging gains and losses recognised on the effective portion of cash flow hedges. The cumulative deferred gain or loss on the hedge is recognised in the income statement when the hedged transaction impacts profit or loss, consistent with the applicable accounting policy
6. ANZ has taken the option available under AASB 119 to recognise actuarial gains/losses on defined benefit superannuation plans directly in retained earnings

NOTES TO CONDENSED FINANCIAL STATEMENTS
120
15. Contingent liabilities and contingent assets
There are outstanding court proceedings, claims and possible claims against the Group, the aggregate amount of which cannot readily be quantified. Appropriate legal advice has been obtained and, in the light of such advice, provisions as deemed necessary have been made. In some instances we have not disclosed the estimated financial impact as this may prejudice the interests of the Group.
Refer to Note 44 of the 2011 ANZ Annual Report for a detailed listing of current contingent liabilities and contingent assets.
Exception fees class action
In September 2010, litigation funder IMF (Australia) Ltd commenced a class action against ANZ, which it said was on behalf of 27,000 ANZ customers (which may now be in excess of 30,000) and relating to more than $50 million in exception fees charged to those customers over the previous 6 years. The case is at an early stage. ANZ is defending it. There is a risk that further claims could emerge.
Security recovery actions
Various claims have been made or are anticipated, arising from security recovery actions taken to resolve impaired assets over recent years. ANZ will defend these claims and any future claims and holds appropriate provisions for expected losses.

NOTES TO CONDENSED FINANCIAL STATEMENTS
121
16. Note to the Cash Flow Statement
(a) Reconciliation of profit after income tax to net cash provided by operating activities Half Year
Mar 12 Sep 11 Mar 11
Inflows Inflows Inflows
(Outflows) (Outflows) (Outflows)
$M $M $M
Profit after income tax 2,919 2,691 2,664
Adjustments to reconcile to net cash provided by operating activities
Provision for credit impairment 538 562 675
Credit risk on derivatives (20) 49 (70)
Impairment on available for sale assets transferred to profit and loss 37 37 35
Depreciation and amortisation 351 325 320
(Profit)/Loss on sale of businesses 3 - (6)
Provision for employee entitlements, restructuring and other provisions 315 325 323
Payments from provisions (325) (409) (269)
(Profit)/loss on sale of premises and equipment (1) (19) (1)
(Profit)/loss on sale of available-for-sale securities (30) (72) 4
Amortisation of discounts/premiums included in interest income (2) (4) (9)
Share based payments expense 97 93 74
Changes in policyholder liabilities 1,757 (1,875) 1,021
Net foreign exchange earnings (570) (386) (431)
Net (gains)/losses on trading derivatives (212) 696 (350)
Net derivatives/foreign exchange adjustment 331 (285) 960
(Increase)/decrease in operating assets:
Trading securities 2,718 (5,859) (1,755)
Liquid assets - greater than three months (199) 342 1,251
Due from other banks - greater than three months (1,527) (833) (643)
Net decrease/(increase) in investments backing policyholder liabilities (1,052) 2,300 (981)
Loans and advances (18,395) (13,119) (12,449)
Net derivative financial instruments (427) 745 (2,783)
Interest receivable (118) (5) (40)
Accrued income (24) 26 54
Net tax assets (437) 371 (94)
Increase/(decrease) in operating liabilities:
Deposits and other borrowings 18,412 29,864 13,970
Due to other financial institutions 4,728 1,456 (106)
Payables and other liabilities (886) (1,160) 1,744
Interest payable (104) 113 11
Accrued expenses (528) 234 (213)
Other (109) (124) (184)
Net cash provided by/(used in) operating activities 7,240 16,079 2,722
(b) Reconciliation of cash and cash equivalents
Cash at the end of the period as shown in the cash flow statement is reconciled to the related items in the balance sheet as follows
Liquid assets - less than three months 34,146 23,400 18,414
Due from other financial institutions - less than three months 6,455 6,621 6,234
40,601 30,021 24,648
(c) Non-cash financing activities
Dividends satisfied by share issue 757 655 712
Bonus option plan share issues 47 31 35
804 686 747

NOTES TO CONDENSED FINANCIAL STATEMENTS
122
17. Segment analysis
(i) Description of segments
The Group operates on a divisional structure with Australia, Asia Pacific, Europe & America (APEA), Institutional and New Zealand being the major operating divisions. The Group manages Institutional APEA on a matrix structure. Accordingly, the divisional analysis on the following pages reflects this matrix reporting structure.
In February 2012 the Group announced that it has put in place a new senior management structure and other organisational changes designed to support our super regional aspirations, give focus to areas of growth and opportunity, and to strengthen succession planning within the senior management team. As these changes are implemented it is anticipated that additional reportable segments will be created. The segment disclosures below are unchanged from that reported at 30 September 2011, in line with how the business was managed and reported internally during the reporting period.
(ii) Operating segments
Transactions between business units across segments within ANZ are conducted on an arms length basis.
Half Year Movement
Segment Revenue Mar 12
$M Sep 11
$M Mar 11
$M Mar 12
v. Sep 11 Mar 12
v. Mar 11
Australia 4,071 4,145 4,101 -2% -1%
Asia Pacific, Europe & America 1,398 1,227 1,281 14% 9%
Institutional 2,769 2,373 2,619 17% 6%
New Zealand 1,137 1,109 1,080 3% 5%
Group Centre 125 130 5 -4% large
Less: Institutional Asia Pacific, Europe & America (796) (602) (656) 32% 21%
Subtotal
8,704 8,382 8,430 4% 3%
Other1 113 (55) 175 large -35%
Group total
8,817 8,327 8,605 6% 2%
Half Year Movement
Segment Profit Mar 12
$M Sep 11
$M Mar 11
$M Mar 12
v. Sep 11 Mar 12
v. Mar 11
Australia 1,365 1,464 1,350 -7% 1%
Asia Pacific, Europe & America 419 338 390 24% 7%
Institutional 1,123 907 1,081 24% 4%
New Zealand 397 357 357 11% 11%
Group Centre (24) (64) (109) -63% -78%
Less: Institutional Asia Pacific, Europe & America (307) (168) (251) 83% 22%
Subtotal
2,973 2,834 2,818 5% 6%
Other1 (54) (143) (154) -62% -65%
Group total
2,919 2,691 2,664 8% 10%
Half Year Movement
Segment Assets Mar 12
$M Sep 11
$M Mar 11
$M Mar 12
v. Sep 11 Mar 12
v. Mar 11
Australia 283,987 272,331 268,752 4% 6%
Asia Pacific, Europe & America 96,654 88,108 64,757 10% 49%
Institutional 233,770 237,868 188,236 -2% 24%
New Zealand 70,013 70,273 67,058 0% 4%
Group Centre 1,717 636 1,557 large 10%
Less: Institutional Asia Pacific, Europe & America (82,850) (74,753) (52,984) 11% 56%
Subtotal
603,291 594,463 537,376 1% 12%
Other1 (55) 25 71 large large
Group total
603,236 594,488 537,447 1% 12%
1. In evaluating the performance of the operating segments, certain items are removed from the operating segment results, where they are not considered integral to the ongoing performance of the segment and are evaluated separately. These items and the profit after tax impact are set out in part (iii) of this note

NOTES TO CONDENSED FINANCIAL STATEMENTS
123
17. Segment analysis, cont’d
(iii) Other items
The table below sets out the profit after tax impact of other items.
Half Year
Mar 12
$M Sep 11
$M Mar 11
$M Item Related segment
New Zealand technology integration New Zealand (46) (11) (75)
Changes in New Zealand tax legislation New Zealand and Institutional - (1) 3
Acquisition related adjustments Australia, APEA, Institutional and New Zealand (28) (54) (72)
Treasury shares adjustment Australia (70) 56 (15)
Economic hedging - fair value (gains)/losses APEA, Group Centre and Institutional (22) (3) (114)
Revenue and net investment hedges (gains)/losses Group Centre 63 (81) 30
New Zealand managed funds impacts New Zealand (1) (3) 42
Non continuing businesses Institutional
50 (46) 47
Total profit after tax
(54) (143) (154)
18. Changes in composition of the Group Material controlled entities
There were no material entities acquired or disposed during the half year ended 31 March 2012 or for the year ended 30 September 2011.
19. Associates and investments
Half Year
Mar 12
$M Sep 11
$M Mar 11
$M
Profit after income tax 166 193 243
Contributions to profit1
Contribution to
Group post-tax profit Ownership interest
held by Group
Associates Half Year As at
Mar 12
$M Sep 11
$M Mar 11
$M Mar 12
% Sep 11
% Mar 11
%
P.T. Bank Pan Indonesia 30 29 40 39 39 39
Metrobank Card Corporation Inc 7 6 4 40 40 40
Bank of Tianjin 37 26 28 20 20 20
AMMB Holdings Berhad 53 61 53 24 24 24
Shanghai Rural Commercial Bank 46 71 102 20 20 20
Saigon Securities Inc. (1) (2) 2 18 18 18
Other associates (6) 2 14 n/a n/a n/a
Profit after income tax 166 193 243
1. The results differ from the published results of these entities due to the application of IFRS, Group Accounting Policies and acquisition adjustments. This amounted to $18 million reversal in the March 2012 half (Sep 2011 half $20 million; Mar 2011 half $61 million). Excludes gains or losses on disposal or valuation adjustments
20. Related party disclosure
There have been no significant changes to the arrangements with related parties. Refer to Notes 47 and 48 of the 2011 Annual Report.

NOTES TO CONDENSED FINANCIAL STATEMENTS
124
21. Exchange rates
Major exchange rates used in translation of results of offshore controlled entities and branches and investments in associates and joint venture entities were as follows:
Balance sheet Profit & Loss Average
As at Half Year
Mar 12 Sep 11 Mar 11 Mar 12 Sep 11 Mar 11
Chinese Yuan 6.5530 6.2149 6.7742 6.5376 6.8160 6.5906
Euro 0.7791 0.7194 0.7305 0.7758 0.7403 0.7303
Great British Pound 0.6510 0.6243 0.6415 0.6569 0.6513 0.6258
Indian Rupee 53.414 47.599 46.083 52.143 47.663 44.844
Indonesian Rupiah 9548.1 8573.0 8997.5 9332.8 9075.9 8895.0
Malaysian Ringgit 3.1890 3.1052 3.1266 3.2068 3.1858 3.0679
New Zealand Dollar 1.2697 1.2727 1.3588 1.2959 1.2945 1.3158
Papua New Guinea Kina 2.1579 2.1794 2.6596 2.2124 2.4682 2.6148
United States Dollar 1.0401 0.9731 1.0333 1.0320 1.0544 0.9956
22. Significant events since balance date
There are no significant events from 31 March 2012 to the date of signing of this report.

DIRECTORS’ DECLARATION AND RESPONSIBILITY STATEMENT
125
Directors’ Declaration The Directors of Australia and New Zealand Banking Group Limited declare that:
1. in the Directors’ opinion the Condensed Consolidated Financial Statements and Notes to the Condensed Consolidated Financial Statements are in accordance with the Corporations Act 2001 (as amended), including:
(a) that they comply with the Australian Accounting Standard AASB 134: ‘Interim Financial Reporting’ and the Corporations Regulations 2001; and
(b) that they give a true and fair view of the financial position of the Group as at 31 March 2012 and of its performance for the half year ended on that date; and
2. in the Directors’ opinion at the date of this declaration there are reasonable grounds to believe that the Company will be able to
pay its debts as and when they become due and payable. Signed in accordance with a resolution of the Directors.
John Morschel Michael R P Smith Chairman Director 1 May 2012 Responsibility statement of the directors in accordance with the Disclosure and Transparency Rule 4.2.10(3)(b) of the United Kingdom Financial Services Authority The Directors of Australia and New Zealand Banking Group Limited confirm to the best of their knowledge that:
The Condensed Consolidated Financial Statements and Notes to the Condensed Consolidated Financial Statements for the half year ended 31 March 2012, Directors’ Report (including matters included by reference) and Directors’ Declaration as set out on pages 97 to 125 as well as the additional information on pages 133 to 140 includes a fair review of:
(i) the important events that have occurred during the first six months of the financial year, and their impact on the condensed set of financial statements; and
(ii) a description of the principal risks and uncertainties for the remaining six months of the financial year. Signed in accordance with a resolution of the Directors.
John Morschel Michael R P Smith Chairman Director 1 May 2012

AUDITOR’S REVIEW REPORT AND INDEPENDENCE DECLARATION
126
Independent auditor’s review report to the members of Australia and New Zealand Banking Group Limited Report on the condensed consolidated financial statements
We have reviewed the accompanying half year condensed consolidated financial statements of Australia and New Zealand Banking Group Limited (the “Company”) which comprises the condensed consolidated balance sheet as at 31 March 2012, condensed consolidated income statement and condensed consolidated statement of comprehensive income, condensed consolidated statement of changes in equity and condensed consolidated cash flow statement for the half year ended on that date, notes 1 to 22 comprising a basis of preparation and other explanatory notes, and the directors’ declaration of the Group comprising the Company and the entities it controlled at the half year’s end or from time to time during the half year.
Directors’ responsibility for the half year condensed consolidated financial statements
The directors of the Company are responsible for the preparation of the half year condensed consolidated financial statements that give a true and fair view in accordance with Australian Accounting Standards and the Corporations Act 2001 and for such control as the directors determine is necessary to enable the preparation of the half year condensed consolidated financial statements that are free from material misstatement, whether due to fraud or error.
Auditors’ responsibility
Our responsibility is to express a conclusion on the half year condensed consolidated financial statements based on our review. We conducted our review in accordance with Auditing Standard on Review Engagements ASRE 2410 Review of a Financial Report Performed by the Independent Auditor of the Entity, in order to state whether, on the basis of the procedures described, we have become aware of any matter that makes us believe that the half year condensed consolidated financial statements are not in accordance with the Corporations Act 2001 including: giving a true and fair view of the Group’s financial position as at 31 March 2012 and its performance for the half year ended on that date; and complying with Australian Accounting Standard AASB 134 Interim Financial Reporting and the Corporations Regulations 2001. As auditor of Australia and New Zealand Banking Group Limited, ASRE 2410 requires that we comply with the ethical requirements relevant to the audit of the annual report.
A review of a half year financial report consists of making enquiries, primarily of persons responsible for financial and accounting matters, and applying analytical and other review procedures. A review is substantially less in scope than an audit conducted in accordance with Australian Auditing Standards and consequently does not enable us to obtain assurance that we would become aware of all significant matters that might be identified in an audit. Accordingly, we do not express an audit opinion.
Independence
In conducting our review, we have complied with the independence requirements of the Corporations Act 2001.
Conclusion
Based on our review, which is not an audit, we have not become aware of any matter that makes us believe that the half year condensed consolidated financial statements of Australia and New Zealand Banking Group Limited are not in accordance with the Corporations Act 2001, including:
(a) giving a true and fair view of the Group’s financial position as at 31 March 2012 and of its performance for the half year ended on that date; and
(b) complying with Australian Accounting Standard AASB 134 Interim Financial Reporting and the Corporations Regulations 2001.
KPMG Peter Nash Melbourne Partner 1 May 2012 Lead Auditor’s Independence Declaration under section 307C of the Corporations Act 2001
To: the directors of Australia and New Zealand Banking Group Limited
I declare that, to the best of my knowledge and belief, in relation to the review for the half year ended 31 March 2012, there have been:
(i) no contraventions of the auditor independence requirements as set out in the Corporations Act 2001 in relation to the review; and
(ii) no contraventions of any applicable code of professional conduct in relation to the review.
KPMG Peter Nash Melbourne Partner
1 May 2012

SUPPLEMENTARY INFORMATION
127
Four year summary by half year
Mar 12$M
Sep 11 $M
Mar 11 $M
Sep 10 $M
Mar 10 $M
Sep 09 $M
Mar 09 $M
Sep 08 $M
Income Statement
Net interest income 5,984 5,839 5,642 5,623 5,239 4,988 4,822 4,074
Other operating income 2,720 2,543 2,788 2,592 2,328 2,339 2,218 2,241
Operating expense (4,020) (3,897) (3,821) (3,722) (3,249) (3,124) (2,944) (2,751)
Provision for credit impairment (565) (551) (660) (722) (1,098) (1,621) (1,435) (1,364)
Profit before income tax 4,119 3,934 3,949 3,771 3,220 2,582 2,661 2,200
Income tax expense (1,142) (1,096) (1,126) (1,040) (920) (720) (749) (606)
Non-controlling interests (4) (4) (5) (4) (2) 2 (4) (5)
Underlying profit 2,973 2,834 2,818 2,727 2,298 1,864 1,908 1,589
Adjustments to arrive at statutory profit (54) (143) (154) (151) (373) (338) (491) (233)
Profit attributable to shareholders of the Company 2,919 2,691 2,664 2,576 1,925 1,526 1,417 1,356
Balance Sheet
Assets 603,236 594,488 537,447 531,739 506,708 476,987 502,798 470,293
Net assets 39,443 37,954 35,129 34,155 32,583 32,429 28,367 26,552
Ratios
Return on average ordinary shareholders' equity 15.6% 14.9% 15.8% 15.5% 12.2% 10.3% 10.4% 11.4%
Return on average assets 0.97% 0.93% 0.97% 0.94% 0.76% 0.63% 0.54% 0.61%
Tier 1 capital ratio 11.3% 10.9% 10.5% 10.1% 10.7% 10.6% 8.2% 7.7%
Total capital ratio 12.6% 12.1% 12.1% 11.9% 13.0% 13.7% 11.0% 11.1%
Operating expenses to operating income 46.9% 48.0% 46.8% 46.3% 46.8% 44.5% 47.0% 49.7%
Operating expenses to operating income 46.2% 46.5% 45.3% 45.3% 42.9% 42.6% 41.8% 43.6%
Shareholder value - ordinary shares
Total return to shareholders
(share price movement plus dividends) 23.6% (15.7%) 3.6% (4.5%) 7.9% 58.0% (12.0%) (14.6%)
Market capitalisation 62,325 51,318 61,820 60,614 64,250 61,085 33,990 38,263
Dividend 66 cents 76 cents 64 cents 74 cents 52 cents 56 cents 46 cents 74 cents
Franked portion 100% 100% 100% 100% 100% 100% 100% 100%
Share price
- high $23.68 $24.49 $25.96 $26.23 $25.72 $24.99 $19.63 $24.28
- low $18.60 $17.63 $22.05 $19.95 $20.13 $14.90 $11.83 $15.07
- closing $23.26 $19.52 $23.81 $23.68 $25.36 $24.39 $15.75 $18.75
Share information (per fully paid)
Earnings per share - basic 110.8c 104.0c 104.2c 102.1c 76.8c 64.8c 66.3c 68.3c
Dividend payout ratio 60.8% 74.6% 62.5% 73.7% 68.7% 92.5% 71.3% 113.6%
Net tangible assets per ordinary share $11.74 $11.44 $10.61 $10.38 $9.99 $11.02 $10.94 $10.72
Number of fully paid ordinary shares (M) 2,679.5 2,629.0 2,596.4 2,559.7 2,533.5 2,504.5 2,158.1 2,040.7
Other information
Permanent full time equivalent staff (FTE) 46,138 46,152 45,731 43,992 39,536 36,094 35,415 35,423
Temporary full time equivalent staff (FTE) 2,210 2,947 2,889 3,107 2,608 1,593 1,631 1,502
Total full time equivalent staff (FTE) 48,348 49,099 48,620 47,099 42,144 37,687 37,046 36,925
Number of shareholders 439,811 442,912 424,787 411,692 405,698 396,181 391,052 376,813

SUPPLEMENTARY INFORMATION
128
Average balance sheet and related interest
Averages used in the following tables are predominantly daily averages. Interest income figures are presented on a tax-equivalent basis. Impaired loans are included under the interest earning asset category, ‘loans and advances’. Intra-group interest earning assets and interest bearing liabilities are treated as external assets and liabilities for the geographic segments. Half year Mar 12 Half year Sep 11 Half year Mar 11
Ave bal $M
Int $M
Rate %
Ave bal $M
Int $M
Rate %
Ave bal $M
Int $M
Rate %
Interest earning assets
Due from other financial institutions
Australia 2,588 54 4.2% 1,673 41 4.9% 2,666 60 4.5%
Asia Pacific, Europe & America 8,072 87 2.2% 5,831 66 2.3% 8,679 40 0.9%
New Zealand 754 9 2.4% 734 8 2.2% 575 6 2.1%
Trading and available-for-sale assets
Australia 33,092 704 4.3% 33,664 793 4.7% 31,700 727 4.6%
Asia Pacific, Europe & America 15,267 137 1.8% 11,470 99 1.7% 11,449 93 1.6%
New Zealand 8,127 168 4.1% 7,621 175 4.6% 6,801 161 4.7%
Loans and advances and Acceptances
Australia 295,540 10,877 7.4% 284,053 10,979 7.7% 277,574 10,556 7.6%
Asia Pacific, Europe & America 39,665 850 4.3% 35,340 724 4.1% 30,308 702 4.6%
New Zealand 73,041 2,271 6.2% 73,863 2,288 6.2% 73,609 2,366 6.4%
Other assets
Australia 3,689 90 4.9% 4,664 117 5.0% 4,393 103 4.7%
Asia Pacific, Europe & America 20,048 97 1.0% 15,747 58 0.7% 7,958 55 1.4%
New Zealand 2,255 67 5.9% 2,154 76 7.0% 2,317 76 6.6%
Intragroup assets
Australia 4,920 307 12.5% 3,012 300 19.9% 2,943 274 18.7%
Asia Pacific, Europe & America 6,891 (19) -0.6% 9,057 (2) 0.0% 9,086 11 0.2%
513,949 15,699 488,883 15,722 470,058 15,230
Intragroup elimination (11,811) (288) (12,069) (299) (12,029) (285)
502,138 15,411 6.1% 476,814 15,423 6.5% 458,029 14,945 6.5%
Non-interest earning assets
Derivatives
Australia 33,427 30,192 26,812
Asia Pacific, Europe & America 3,335 3,459 3,503
New Zealand 9,265 8,461 7,494
Premises and equipment 2,101 2,154 2,171
Insurance assets 30,097 32,119 32,780
Other assets 28,189 27,830 25,546
Provisions for credit impairment
Australia (2,987) (3,096) (2,996)
Asia Pacific, Europe & America (828) (849) (906)
New Zealand (895) (949) (998)
101,704 99,321 93,406
Total average assets 603,842 576,135 551,435

SUPPLEMENTARY INFORMATION
129
Half year Mar 12
Half year Sep 11 Half year Mar 11
Ave bal
$M Int $M
Rate %
Ave bal $M
Int $M
Rate %
Ave bal $M
Int $M
Rate %
Interest bearing liabilities
Time deposits
Australia 130,045
3,466 5.3% 126,865 3,534 5.6% 121,281 3,330 5.5%
Asia Pacific, Europe & America 55,915
368 1.3% 47,980 293 1.2% 44,739 256 1.1%
New Zealand 27,774
560 4.0% 29,258 625 4.3% 29,363 681 4.7%
Savings deposits
Australia 21,316
433 4.1% 20,211 417 4.1% 20,006 404 4.0%
Asia Pacific, Europe & America 4,311
12 0.6% 4,354 10 0.5% 5,845 14 0.5%
New Zealand 2,772
40 2.9% 2,075 23 2.2% 1,970 24 2.4%
Other demand deposits
Australia 77,169
1,505 3.9% 68,627 1,411 4.1% 63,464 1,236 3.9%
Asia Pacific, Europe & America 9,872
15 0.3% 9,199 17 0.4% 4,758 11 0.5%
New Zealand 15,111
197 2.6% 14,373 187 2.6% 13,014 192 3.0%
Due to other financial institutions
Australia 5,675
111 3.9% 8,241 187 4.5% 8,383 180 4.3%
Asia Pacific, Europe & America 18,570
81 0.9% 15,204 64 0.8% 14,246 72 1.0%
New Zealand 969
11 2.3% 1,207 14 2.3% 702 8 2.3%
Commercial paper
Australia 13,977
322 4.6% 9,532 240 5.0% 5,597 138 4.9%
New Zealand 3,161
54 3.4% 2,744 43 3.1% 4,028 68 3.4%
Borrowing corporations' debt
Australia 282
9 6.4% 448 13 5.8% 591 21 7.1%
New Zealand 1,094
27 4.9% 1,209 37 6.1% 1,171 31 5.3%
Loan capital, bonds and notes
Australia 62,147
1,769 5.7% 65,532 1,988 6.1% 69,512 2,113 6.1%
Asia Pacific, Europe & America 59
1 3.4% 54 - 0.0% 23 - 0.0%
New Zealand 13,706
333 4.9% 14,780 353 4.8% 15,305 372 4.9%
Other liabilities1
Australia 3,037
139 n/a 3,909 160 n/a 4,615 168 n/a
Asia Pacific, Europe & America 1,197
20 n/a 925 18 n/a 564 10 n/a
New Zealand 218
(46) n/a 231 (47) n/a 50 (30) n/a
Intragroup liabilities
New Zealand 11,811
288 4.9% 12,069 298 4.9% 12,029 285 4.8%
480,188
9,715 459,027 9,885 441,256 9,584
Intragroup elimination (11,811)
(288) (12,069) (299) (12,029) (285)
468,377
9,427 4.0% 446,958 9,586 4.3% 429,227 9,299 4.3%
Non-interest bearing liabilities
Deposits
Australia 5,112
5,018 4,876
Asia Pacific, Europe & America 2,293
2,239 1,828
New Zealand 3,976
3,782 3,653
Derivatives
Australia 26,867
23,302 23,277
Asia Pacific, Europe & America 436
102 (1,661)
New Zealand 8,056
6,840 5,160
Insurance Liabilities 27,968
29,382 29,187
External unit holder liabilities 5,033
5,504 5,447
Other liabilities 17,403
15,973 15,749
97,144
92,142 87,516
Total average liabilities 565,521
539,100 516,743
1. Includes foreign exchange swap costs
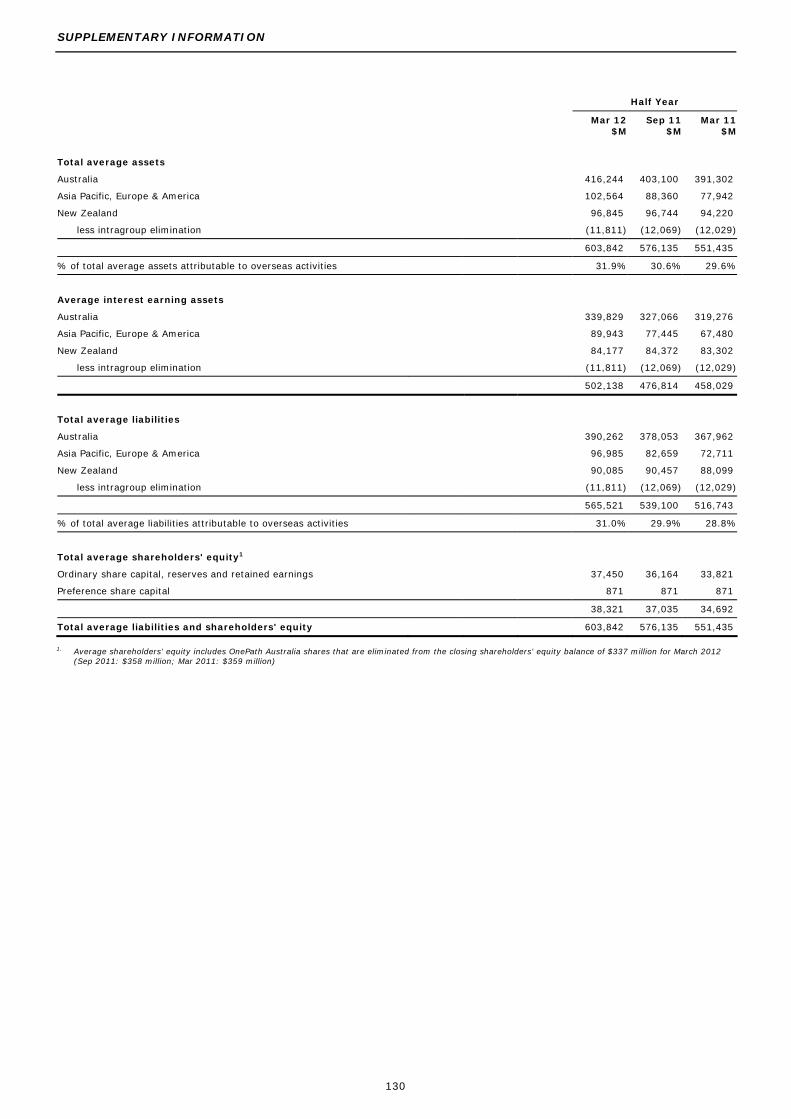
SUPPLEMENTARY INFORMATION
130
Half Year
Mar 12 $M
Sep 11 $M
Mar 11 $M
Total average assets
Australia
416,244 403,100 391,302
Asia Pacific, Europe & America
102,564 88,360 77,942
New Zealand
96,845 96,744 94,220
less intragroup elimination
(11,811) (12,069) (12,029)
603,842 576,135 551,435
% of total average assets attributable to overseas activities
31.9% 30.6% 29.6%
Average interest earning assets
Australia
339,829 327,066 319,276
Asia Pacific, Europe & America
89,943 77,445 67,480
New Zealand
84,177 84,372 83,302
less intragroup elimination
(11,811) (12,069) (12,029)
502,138 476,814 458,029
Total average liabilities
Australia
390,262 378,053 367,962
Asia Pacific, Europe & America
96,985 82,659 72,711
New Zealand
90,085 90,457 88,099
less intragroup elimination
(11,811) (12,069) (12,029)
565,521 539,100 516,743
% of total average liabilities attributable to overseas activities
31.0% 29.9% 28.8%
Total average shareholders' equity1
Ordinary share capital, reserves and retained earnings
37,450 36,164 33,821
Preference share capital
871 871 871
38,321 37,035 34,692
Total average liabilities and shareholders' equity
603,842 576,135 551,435
1. Average shareholders’ equity includes OnePath Australia shares that are eliminated from the closing shareholders’ equity balance of $337 million for March 2012 (Sep 2011: $358 million; Mar 2011: $359 million)

SUPPLEMENTARY INFORMATION
131
Half Year
Mar 12 %
Sep 11 %
Mar 11 %
Gross earnings rate1
Australia
7.08 7.46 7.36
Asia Pacific, Europe & America
2.56 2.43 2.68
New Zealand
5.97 6.02 6.28
Total Group
6.14 6.45 6.54
Interest spread and net interest average margin may be analysed as follows:
Australia
Net interest spread
2.14 2.23 2.17
Interest attributable to net non-interest bearing items
0.38 0.38 0.42
Net interest margin - Australia
2.52 2.61 2.59
Asia Pacific, Europe & America
Net interest spread
1.46 1.39 1.64
Interest attributable to net non-interest bearing items
- - (0.04)
Net interest margin - Asia Pacific, Europe & America
1.46 1.39 1.60
New Zealand
Net interest spread
2.15 2.10 2.06
Interest attributable to net non-interest bearing items
0.35 0.30 0.29
Net interest margin - New Zealand
2.50 2.40 2.35
Group
Net interest spread
2.11 2.17 2.20
Interest attributable to net non-interest bearing items
0.27 0.27 0.27
Net interest margin
2.38 2.44 2.47
Net interest margin (excluding Global Markets)
2.75 2.80 2.81
1. Average interest rate received on average interest earning assets

SUPPLEMENTARY INFORMATION
132
Derivative financial instruments Derivatives
Derivative instruments are contracts whose value is derived from one or more underlying financial instruments or indices. They include swaps, forward rate contracts, futures, options and combinations of these instruments. The use of derivatives and their sale to customers as risk management products is an integral part of the Group’s trading activities. Derivatives are also used to manage the Group’s own exposure to fluctuations in foreign exchange and interest rates as part of its asset and liability management activities. Derivatives are subject to the same types of credit and market risk as other financial instruments, and the Group manages these risks in a consistent manner.
The following table provides an overview of the Group’s exchange rate, interest rate, commodity and credit derivatives. It includes all contracts, both trading and hedging.
Notional principal amount is the face value of the contract and represents the volume of outstanding transactions. Fair value is the net position of contracts with positive market values and negative market values. As at 31 March 2012
As at 30 September 2011
Total fair value Total fair value
Notional Principal amount
Assets Liabilities
Notional Principal amount Assets Liabilities
$M $M $M $M $M $M
Foreign exchange contracts
Spot and forward contracts 353,563 4,010 (4,572) 328,740 10,658 (8,940)
Swap agreements 279,110 8,332 (10,994) 223,074 15,837 (16,148)
Futures contracts 183 53 (45) 886 812 (949)
Options purchased 67,417 1,204 - 57,053 1,318 -
Options sold 68,861 - (1,074) 60,182 - (1,290)
769,134 13,599 (16,685) 669,935 28,625 (27,327)
Commodity contracts
Derivative contracts 22,293 1,019 (884) 25,916 1,885 (1,386)
Interest rate contracts
Forward rate agreements 198,456 18 (18) 155,215 35 (30)
Swap agreements 1,421,995 23,316 (21,948) 1,478,261 25,039 (23,385)
Futures contracts 151,814 279 (284) 86,253 1,032 (1,024)
Options purchased 30,124 638 - 43,926 611 -
Options sold 43,351 - (849) 40,221 - (765)
1,845,740 24,251 (23,099) 1,803,876 26,717 (25,204)
Credit default swaps
Structured credit derivatives purchased1
8,198 309 - 8,976 609 -
Other credit derivatives purchased2
14,064 381 (177) 15,641 781 (29)
Total credit derivatives purchased 22,262 690 (177) 24,617 1,390 (29)
Structured credit derivatives sold1 7,738 - (433) 8,475 - (788)
Other credit derivatives sold2 13,223 38 (93) 14,867 24 (556)
Total credit derivatives sold 20,961 38 (526) 23,342 24 (1,344)
43,223 728 (703) 47,959 1,414 (1,373)
Collateral - (2,724) 6,252 - (4,523) 5,202
Total 2,680,390 36,873 (35,119) 2,547,686 54,118 (50,088)
1. Refer page 83 2. The notional amounts comprise vanilla credit default swap transactions including credit indices such as Itraxx (Europe and Australia) and CDX. In the case of back-
to-back deals, where a risk position from one counterparty is “closed out” with another counterparty, the notional amounts are not netted down in the above table. For example, ANZ may sell credit protection over a particular corporate bond (or reference asset) to a counterparty and simultaneously offset that credit exposure by buying credit protection over the same corporate bond (or reference asset) from another counterparty. Netting may only occur when there is an offsetting deal with the same counterparty. These credit default swap trades are transacted in conjunction with other financial instruments by reference to the traded market risk limit framework which includes VaR, name and rating specific concentration limits, sensitivity limits and stress testing limits. VaR disclosures are set out on page 66

SUPPLEMENTARY INFORMATION
133
Principal risks and uncertainties
Introduction
The Group’s activities are subject to risks that can adversely impact its business, operations and financial condition. The risks and uncertainties described below are not the only ones that the Group may face. Additional risks and uncertainties that the Group is unaware of, or that the Group currently deems to be immaterial, may also become important factors that affect it. If any of the listed or unlisted risks actually occur, the Group’s business, operations, financial condition, or reputation could be materially adversely affected, with the result that the trading price of the Group’s equity or debt securities could decline, and investors could lose all or part of their investment.
Changes in general business and economic conditions, including disruption in regional or global credit and capital markets, may adversely affect the Group’s business, operations and financial condition
The Group’s financial performance is primarily influenced by the economic conditions and the level of business activity in the major countries and regions in which it operates or trades, i.e. Australia, New Zealand, the Asia Pacific Region, Europe and the United States of America. The Group’s business, operations, and financial condition can be negatively affected by changes to these economic and business conditions.
The economic and business conditions that prevail in the Group’s major operating and trading markets are affected by domestic and international economic events, political events, natural disasters and by movements and events that occur in global financial markets.
The global financial crisis (GFC) in 2008 and 2009 saw a sudden and prolonged dislocation in credit and equity capital markets, a contraction in global economic activity and the creation of many challenges for financial services institutions worldwide that still persist in many regions. More recently, sovereign risk (particularly in Europe) and its potential impact on financial institutions in Europe and globally has emerged as a significant risk to the recovery prospects of the global economy. The impact of the GFC and its results (such as heightened sovereign risk) continue to affect global economic activity and capital markets.
The economic effects of the GFC and the more recent European sovereign debt crisis have been widespread and far-reaching with unfavourable ongoing impacts on retail sales, personal and business credit growth, housing credit, and business and consumer confidence. While some of these economic factors have since improved, lasting impacts from the GFC, subsequent volatility in financial markets and the more recent European sovereign debt crisis (and potential contagion from it) suggest ongoing vulnerability and adjustment in these and other areas of consumer and business behaviour. The sovereign debt crisis could have serious implications for the European Union and the euro which, depending on the circumstances in which they take place, could adversely impact the Group’s business operations and financial condition. The New Zealand economy is also vulnerable to more volatile markets and deteriorating funding conditions. Economic conditions in Australia, New Zealand, and some Asia Pacific countries remain difficult, albeit less so than in many European countries and in the US.
Should the difficult economic conditions of these countries persist or worsen, asset values in the housing, commercial or rural property markets could decline, unemployment could rise and corporate and personal incomes could suffer. Also, deterioration in global markets, including equity, property, currency and other asset markets, could impact the Group’s customers and the security the Group holds against loans and other credit exposures, which may impact its ability to recover some loans and other credit exposures.
All or any of these negative economic and business impacts could cause a reduction in demand for the Group’s products and services and/or an increase in loan and other credit defaults and bad debts, which could adversely affect the Group’s business, operations, and financial condition.
The Group’s financial performance could also be adversely affected if it were unable to adapt cost structures, products, pricing or activities in response to a drop in demand or lower than expected revenues. Similarly, higher than expected costs (including credit costs) could be incurred because of adverse changes in the economy, general business conditions or the operating environment in the countries in which it operates.
Other economic and financial factors or events which may adversely affect the Group’s performance and results, include, but are not limited to, the level of and volatility in foreign exchange rates and interest rates, changes in inflation and money supply, fluctuations in both debt and equity capital markets, declining commodity prices due to, for example, reduced demand in Asia, especially north Asia, and decreasing consumer and business confidence.
Geopolitical instability, such as threats of, potential for, or actual conflict, occurring around the world, such as the ongoing unrest and conflicts in the Middle East, may also adversely affect global financial markets, general economic and business conditions and the Group’s ability to continue operating or trading in a country, which in turn may adversely affect the Group’s business, operations, and financial condition.
Natural disasters such as (but not restricted to) cyclones, floods and earthquakes, and the economic and financial market implications of such disasters on domestic and global conditions can adversely impact the Group’s ability to continue operating or trading in the country or countries directly or indirectly affected, which in turn may adversely affect the Group’s business, operations and financial condition. For more specific risks in relation to earthquakes and the recent Christchurch earthquake, see the risk factor entitled “The Group may be exposed to the impact of future climate change, geological events, plant and animal diseases, and other extrinsic events which may adversely affect its business, operations and financial condition”.

SUPPLEMENTARY INFORMATION
134
Changes in exchange rates may adversely affect the Group’s business, operations and financial condition
The recent appreciation in the Australian and New Zealand dollars relative to other currencies has adversely affected, and could continue to have an adverse effect on, certain portions of the Australian and New Zealand economies, including some agricultural exports, international tourism, manufacturers, and import-competing producers. Similarly, a depreciation in the Australian or New Zealand dollars relative to other currencies would increase debt service obligations in Australia or New Zealand dollar terms of unhedged exposures. Appreciation of the Australian dollar against the New Zealand, United States dollar and other currencies has had a negative translation effect, and future appreciation could have a greater negative impact, on the Group’s results from its other non-Australian businesses, particularly its New Zealand and Asian businesses which are largely based on non-Australian dollar revenues. The Group has put in place hedges to partially mitigate the impact of currency appreciation, but notwithstanding this, any appreciation could have an adverse impact upon the Group’s earnings.
Competition may adversely affect the Group’s business, operations and financial condition, especially in Australia, New Zealand and the Asian markets in which it operates
The markets in which the Group operates are highly competitive and could become even more so, particularly in those segments that are considered to provide higher growth prospects or are in greatest demand (for example, customer deposits). Factors that contribute to competition risk include industry regulation, mergers and acquisitions, changes in customers’ needs and preferences, entry of new participants, development of new distribution and service methods, increased diversification of products by competitors, and regulatory changes in the rules governing the operations of banks and non-bank competitors. For example, changes in the financial services sector in Australia and New Zealand have made it possible for non-banks to offer products and services traditionally provided by banks, such as automatic payment systems, mortgages, and credit cards. In addition, banks organised in jurisdictions outside Australia and New Zealand are subject to different levels of regulation and consequently some may have lower cost structures. Increasing competition for customers could also potentially lead to a compression in the Group’s net interest margins, or increased advertising and related expenses to attract and retain customers.
Additionally, the Australian Government announced in late 2010 a set of measures with the stated purpose of promoting a competitive and sustainable banking system in Australia. Any regulatory or behavioural change that occurs in response to this policy shift could have the effect of limiting or reducing the Group’s revenue earned from its banking products or operations. These regulatory changes could also result in higher operating costs. A reduction or limitation in revenue or an increase in operating costs could adversely affect the Group’s profitability.
The effect of competitive market conditions, especially in the Group’s main markets and products, may lead to erosion in the Group’s market share or margins, and adversely affect the Group’s business, operations, and financial condition.
Changes in monetary policies may adversely affect the Group’s business, operations and financial condition
Central monetary authorities (including the Reserve Bank of Australia (RBA) and the Reserve Bank of New Zealand (RBNZ), the U.S. Federal Reserve and the monetary authorities in Asian jurisdictions in which ANZ carries out business) set official interest rates so as to affect the demand for money and credit in their relevant jurisdictions. Their policies can significantly affect the Group’s cost of funds for lending and investing and the return that the Group will earn on those loans and investments. Both these factors impact the Group’s net interest margin and can affect the value of financial instruments it holds, such as debt securities and hedging instruments. The policies of the central monetary authorities can also affect the Group’s borrowers, potentially increasing the risk that they may fail to repay loans. Changes in such policies are difficult to predict.
Sovereign risk may destabilize global financial markets adversely affecting all participants, including the Group
Sovereign risk or the risk that foreign governments will default on their debt obligations, increase borrowings as and when required or be unable to refinance their debts as they fall due or nationalize participants in their economy, has emerged as a risk to the recovery prospects of many economies. This risk is particularly relevant to a number of European countries though it is not limited to these places (and includes the United States). Should one sovereign default, there could be a cascading effect to other markets and countries, the consequences of which, while difficult to predict, may be similar to or worse than that currently being experienced or which was experienced during the GFC. Such an event could destabilise global financial markets adversely affecting all participants, including the Group.
The Group is exposed to liquidity and funding risk, which may adversely affect its business, operations and financial condition
Liquidity risk is the risk that the Group is unable to meet its payment obligations as they fall due, including repaying depositors or maturing wholesale debt, or that the Group has insufficient capacity to fund increases in assets. Liquidity risk is inherent in all banking operations due to the timing mismatch between cash inflows and cash outflows.
Reduced liquidity could lead to an increase in the cost of the Group’s borrowings and possibly constrain the volume of new lending, which could adversely affect the Group’s profitability. A significant deterioration in investor confidence in the Group could materially impact the Group’s cost of borrowing, and the Group’s ongoing operations and funding.
The Group raises funding from a variety of sources including customer deposits and wholesale funding in Australia and offshore markets to ensure that it continues to meet its funding obligations and to maintain or grow its business generally. In times of systemic liquidity stress, in the event of damage to market confidence in the Group or in the event that funding inside or outside of Australia is not available or constrained, the Group’s ability to access sources of funding and liquidity may be constrained and it will be exposed to liquidity risk. In any such cases, ANZ may be forced to seek alternative funding. The availability of such alternative funding, and the terms on which it may be available, will depend upon a variety of factors, including prevailing market conditions and ANZ’s credit ratings. Even if available, the cost of these alternatives may be more expensive or on unfavourable terms.

SUPPLEMENTARY INFORMATION
135
Since the GFC, developments in the US mortgage industry and in the US and European markets more generally, including recent European sovereign debt concerns did adversely affect the liquidity in global capital markets including an increase in funding costs. Future deterioration in these market conditions may limit the Group’s ability to replace maturing liabilities and access funding in a timely and cost-effective manner necessary to fund and grow its business.
The Group is exposed to the risk that its credit ratings could change, which could adversely affect its ability to raise capital and wholesale funding
ANZ’s credit ratings have a significant impact on both its access to, and cost of, capital and wholesale funding. Credit ratings are not a recommendation by the relevant rating agency to invest in securities offered by ANZ. Credit ratings may be withdrawn, subject to qualifiers, revised, or suspended by the relevant credit rating agency at any time and the methodologies by which they are determined may be revised. A downgrade or potential downgrade to ANZ’s credit rating may reduce access to capital and wholesale debt markets, potentially leading to an increase in funding costs, as well as affecting the willingness of counterparties to transact with it. On 18 May, 2011, Moody’s Investor’s Service Pty. downgraded ANZ’s deposit and long term, senior, unsecured debt rating to Aa2/stable. Subsequently, on 2 December, 2011, as part of the implementation of their new global bank ratings criteria, Standard and Poor’s (Australia) Pty. Ltd. downgraded the deposit and long term, senior, unsecured debt ratings of the four major Australian banks, including ANZ, by one notch within the AA band from AA/stable to AA-/stable. We can’t provide any assurance that we won’t be subject to further downgrade in the future.
In addition, the ratings of individual securities (including, but not limited to, Tier 1 Capital and Tier 2 Capital securities) issued by ANZ (and banks globally) could be impacted from time to time by changes in the ratings methodologies used by rating agencies. Ratings agencies may revise their methodologies in response to legal or regulatory changes or other market developments.
The Group may experience challenges in managing its capital base, which could give rise to greater volatility in capital ratios
The Group’s capital base is critical to the management of its businesses and access to funding. The Group is required by regulators including, but not limited to, Australian Prudential Regulation Authority (APRA), RBNZ, the UK Financial Services Authority, US regulators and various Asia Pacific jurisdictions where the Group has operations, to maintain adequate regulatory capital.
Under current regulatory requirements, risk-weighted assets and expected loan losses increase as a counterparty’s risk grade worsens. These additional regulatory capital requirements compound any reduction in capital resulting from increased provisions for loan losses and lower profits in times of stress. As a result, greater volatility in capital ratios may arise and may require the Group to raise additional capital. There can be no certainty that any additional capital required would be available or could be raised on reasonable terms.
Global and domestic regulators have released proposals, including the Basel III proposals, to strengthen, among other things, the liquidity and capital requirements of banks, funds management entities, and insurance entities. These proposals, together with any risks arising from any regulatory changes, are described below in the risk factor entitled “Regulatory changes or a failure to comply with regulatory standards, law or policies may adversely affect the Group’s business, operations or financial condition”.
The Group is exposed to credit risk, which may adversely affect its business, operations and financial condition
As a financial institution, the Group is exposed to the risks associated with extending credit to other parties. Less favourable business or economic conditions, whether generally or in a specific industry sector or geographic region, or natural disasters, could cause customers or counterparties to fail to meet their obligations in accordance with agreed terms. For example, our customers and counterparties in the natural resources sector could be adversely impacted in the event of a prolonged slowdown in the Chinese economy. Also, our customers and counterparties in the tourism and manufacturing industries may have been adversely impacted by the recent appreciation of the Australian dollar relative to other currencies. The Group holds provisions for credit impairment. The amount of these provisions is determined by assessing the extent of impairment inherent within the current lending portfolio, based on current information. This process, which is critical to the Group’s financial condition and results, requires difficult, subjective and complex judgments, including forecasts of how current and future economic conditions might impair the ability of borrowers to repay their loans. However, if the information upon which the assessment is made proves to be inaccurate or if the Group fails to analyse the information correctly, the provisions made for credit impairment may be insufficient, which could have a material adverse effect on the Group’s business, operations and financial condition.
In addition, in assessing whether to extend credit or enter into other transactions with customers, the Group relies on information provided by or on behalf of customers, including financial statements and other financial information. The Group may also rely on representations of customers as to the accuracy and completeness of that information and, with respect to financial statements, on reports of independent auditors. The Group’s financial performance could be negatively impacted to the extent that it relies on information that is inaccurate or materially misleading.
An increase in the failure of third parties to honor their commitments in connection with the Group’s trading, lending, derivatives and other activities may adversely affect its business, operations and financial condition
The Group is exposed to the potential risk of credit-related losses that can occur as a result of a counterparty being unable or unwilling to honour its contractual obligations. As with any financial services organisation, the Group assumes counterparty risk in connection with its lending, trading, derivatives and other businesses where it relies on the ability of a third party to satisfy its financial obligations to the Group on a timely basis. The Group is also subject to the risk that its rights against third parties may not be enforceable in certain circumstances.

SUPPLEMENTARY INFORMATION
136
Credit exposure may also be increased by a number of factors including deterioration in the financial condition of the counterparty, the value of assets the Group holds as collateral, and the market value of the counterparty instruments and obligations it holds. Credit losses can and have resulted in financial services organisations realising significant losses and in some cases failing altogether. Should material unexpected credit losses occur they could have a materially adverse effect on the Group’s business, operations and financial condition.
Weakening of the real estate markets in Australia, New Zealand or other markets where it does business may adversely affect the Group’s business, operations and financial condition
Residential, commercial and rural property lending, together with property finance, including real estate development and investment property finance, constitute important businesses to the Group. Overall, the property market has been variable.
A decrease in property valuations in Australia, New Zealand or other markets where it does business could decrease the amount of new lending the Group is able to write and/or increase the losses that the Group may experience from existing loans, which, in either case, could materially and adversely impact the Group’s financial condition and results of operations. A significant slowdown in the Australian and New Zealand housing markets or in other markets where it does business could adversely affect the Group’s business, operations and financial conditions.
The Group is exposed to market risk which may adversely affect its business, operations and financial condition
The Group is subject to market risk, which is the risk to the Group’s earnings arising from changes in interest rates, foreign exchange rates, credit spreads, equity prices and indices, prices of commodities, debt securities and other financial contracts, including derivatives. Losses arising from these risks may have a material adverse effect on the Group. As the Group conducts business in several different currencies, its businesses may be affected by a change in currency exchange rates. Additionally, the Group’s annual and interim reports are prepared and stated in Australian dollars, any appreciation in the Australian dollar against other currencies in which the Group earns revenues (particularly to the New Zealand dollar and US dollar) may adversely affect the reported earnings.
The profitability of the Group’s funds management and insurance businesses is also affected by changes in investment markets and weaknesses in global securities markets due to credit, liquidity or other problems.
The Group is exposed to the risks associated with credit intermediation and financial guarantors which may adversely affect its business, operations and financial condition
The Group entered into a series of structured credit intermediation trades from 2004 to 2007. The Group sold protection using credit default swaps over these structures and then, to mitigate risk, purchased protection via credit default swaps over the same structures from eight US financial guarantors. The underlying structures involve credit default swaps (CDSs) over synthetic collateralised debt obligations (CDOs), portfolios of external collateralised loan obligations (CLOs) or specific bonds/floating rate notes (FRNs).
Being derivatives, both the sold protection and purchased protection are marked-to-market. Prior to the commencement of the GFC, movements in valuations of these positions were not significant and the credit valuation adjustment (CVA) charge on the protection bought from the non-collateralised financial guarantors was minimal.
During and after the GFC, the market value of the structured credit transactions increased and the financial guarantors were downgraded. The combined impact of this was to increase the CVA charge on the purchased protection from financial guarantors. Volatility in the market value and hence CVA will continue to persist given the volatility in credit spreads and USD/AUD rates.
The Group is exposed to operational risk, which may adversely affect its business, operations and financial condition
Operational Risk is the risk of loss resulting from inadequate or failed internal processes, people and systems or from external events. This definition includes legal risk, and the risk of reputational loss or damage arising from inadequate or failed internal processes, people and systems, but excludes strategic risk.
Loss from operational risk events could adversely affect the Group’s financial results. Such losses can include fines, penalties, loss or theft of funds or assets, legal costs, customer compensation, loss of shareholder value, reputation loss, loss of life or injury to people, and loss of property and / or information.
Operational risk is typically classified into risk event type categories to measure and compare risks on a consistent basis. Examples of operational risk events according to category are as follows:
Internal Fraud: Risk that fraudulent acts are planned, initiated or executed by employees (permanent, temporary or contractors) from inside the bank.
External Fraud: Fraudulent acts or attempts which originate from outside the bank. (E.g. valueless cheques, counterfeit credit cards, loan applications in false names, etc.).
Employment Practices & Workplace Safety: Risk to our employees’ health and safety.
Clients, Products & Business Practices: Risk of market manipulation, product defects, money laundering, misuse of customer information etc.
Business Disruption (including Systems Failures): Risk that our banking operating systems are disrupted or fail. At ANZ, technology risks are key Operational Risks which fall under this category.
Damage to Physical Assets: Risk that a natural disaster, terrorist or vandalism attack damages our buildings or property.
Execution, Delivery & Process Management: Risk that we experience losses as a result of data entry errors, accounting errors or failed mandatory reporting.
Direct or indirect losses that occur as a result of operational failures, breakdowns, omissions or unplanned events could adversely affect the Group’s financial results.

SUPPLEMENTARY INFORMATION
137
Disruption of information technology systems or failure to successfully implement new technology systems could significantly interrupt the Group’s business which may adversely affect its business, operations and financial condition
The Group is highly dependent on information systems and technology and there is a risk that these, or the services the Group uses or is dependent upon, might fail.
Most of the Group’s daily operations are computer-based and information technology systems are essential to maintaining effective communications with customers. The exposure to systems risks includes the complete or partial failure of information technology systems or data centre infrastructure, the inadequacy of internal and third-party information technology systems due to, among other things, failure to keep pace with industry developments and the capacity of the existing systems to effectively accommodate growth and integrate existing and future acquisitions and alliances.
To manage these risks, the Group has disaster recovery and information technology governance practices in place. However, any failure of these systems could result in business interruption, loss of customers, financial compensation, damage to reputation and/or a weakening of the Group’s competitive position, which could adversely impact the Group’s business and have a material adverse effect on the Group’s financial condition and operations.
In addition, the Group must update and implement new information technology systems, in part to assist it to satisfy regulatory demands, ensure information security, enhance computer-based banking services for the Group’s customers and integrate the various segments of its business. The Group may not implement these projects effectively or execute them efficiently, which could lead to increased project costs, delays in the ability to comply with regulatory requirements, failure of the Group’s information security controls or a decrease in the Group’s ability to service its customers.
The Group is exposed to risks associated with information security, which may adversely affect its financial results and reputation
Information security means protecting information and information systems from unauthorised access, use, disclosure, disruption, modification, perusal, inspection, recording or destruction. As a bank, the Group handles a considerable amount of personal and confidential information about its customers and its own internal operations.
The Group employs a team of information security subject matter experts who are responsible for the development and implementation of the Group’s Information Security Policy. The Group is conscious that threats to information security are continuously evolving and as such the Group conducts regular internal and external reviews to ensure new threats are identified, evolving risks are mitigated, policies and procedures are updated, and good practice is maintained. However, there is a risk that information may be inadvertently or inappropriately accessed or distributed or illegally accessed or stolen. Any unauthorised use of confidential information could potentially result in breaches of privacy laws, regulatory sanctions, legal action, and claims for compensation or erosion to the Group’s competitive market position, which could adversely affect the Group’s financial position and reputation.
The Group is exposed to reputation risk, which may adversely impact its business, operations and financial condition
Damage to the Group’s reputation may have wide-ranging impacts, including adverse effects on the Group’s profitability, capacity and cost of sourcing funding, and availability of new business opportunities.
Reputation risk may arise as a result of an external event or the Group’s own actions, and adversely affect perceptions about the Group held by the public (including the Group’s customers), shareholders, investors, regulators or rating agencies. The impact of a risk event on the Group’s reputation may exceed any direct cost of the risk event itself and may adversely impact the Group’s business, operations and financial condition.
The unexpected loss of key staff or inadequate management of human resources may adversely affect the Group’s business, operations and financial condition
The Group’s ability to attract and retain suitably qualified and skilled employees is an important factor in achieving its strategic objectives. The Chief Executive Officer and the management team of the Chief Executive Officer have skills and reputation that are critical to setting the strategic direction, successful management and growth of the Group, and whose unexpected loss due to resignation, retirement, death or illness may adversely affect its operations and financial condition. In addition, the Group may in the future have difficulty attracting highly qualified people to fill important roles, which could adversely affect its business, operations and financial condition.
The Group may be exposed to the impact of future climate change, geological events, plant and animal diseases, and other extrinsic events which may adversely affect its business, operations and financial condition
ANZ is exposed to climate related events (including climate change). These events may include severe storms, drought, fires, cyclones, hurricanes, floods and rising sea levels. The impact of these events may temporarily interrupt or restrict the provision of some Group services, and also adversely affect the Group’s collateral position in relation to credit facilities extended to customers.
ANZ may also be exposed to other events such as geological events (volcanic or seismic activity, tsunamis); plant and animal diseases or a flu pandemic. These may severely disrupt normal business activity and have a negative effect on the Group’s business, operations and financial condition. The most recent example of this would be the major earthquakes in Christchurch New Zealand. Whilst much of the widespread property damage was covered by public (Earthquake Commission) and private insurance, there will potentially be negative impacts on property (and hence security) values and on future levels of insurance and reinsurance coverage across New Zealand.

SUPPLEMENTARY INFORMATION
138
Regulatory changes or a failure to comply with regulatory standards, law or policies may adversely affect the Group’s business, operations or financial condition
The Group is subject to laws, regulations, policies and codes of practice in Australia, New Zealand and in the other countries (including but not limited to the United Kingdom, the United States, Hong Kong, Singapore, Japan, China and other countries within the Asia Pacific region) in which it has operations, trades or raises funds or in respect of which it has some other connection. In particular, the Group’s banking, funds management and insurance activities are subject to extensive regulation, mainly relating to its liquidity levels, capital, solvency, provisioning, and insurance policy terms and conditions.
Regulations vary from country to country but generally are designed to protect depositors, insured parties, customers with other banking products, and the banking and insurance system as a whole.
The Australian Government and its agencies, including APRA, the RBA and other financial industry regulatory bodies including the Australian Securities and Investments Commission (ASIC), have supervisory oversight of the Group. The New Zealand Government and its agencies, including the RBNZ, the Financial Markets Authority and the Commerce Commission, have supervisory oversight of the Group’s operations in New Zealand. To the extent that the Group has operations, trades or raises funds in, or has some other connection with, countries other than Australia or New Zealand, then such activities may be subject to the laws of, and regulation by agencies in, those countries. Such regulatory agencies include, by way of example, the US Federal Reserve Board, the US Department of Treasury, the US Office of the Comptroller of the Currency, the US Office of Foreign Assets Control, the UK’s Financial Services Authority, the Monetary Authority of Singapore, the Hong Kong Monetary Authority, the China Banking Regulatory Commission, the Kanto Local Finance Bureau of Japan, and other financial regulatory bodies in those countries and in other relevant countries. In addition, the Group’s expansion and growth in the Asia Pacific region gives rise to a requirement to comply with a number of different legal and regulatory regimes across that region.
A failure to comply with any standards, laws, regulations or policies in any of those jurisdictions could result in sanctions by these or other regulatory agencies, the exercise of any discretionary powers that the regulators hold or compensatory action by affected persons, which may in turn cause substantial damage to the Group’s reputation. To the extent that these regulatory requirements limit the Group’s operations or flexibility, they could adversely impact the Group’s profitability and prospects.
These regulatory and other governmental agencies (including revenue and tax authorities) frequently review banking and tax laws, regulations, codes of practice and policies. Changes to laws, regulations, codes of practice or policies, including changes in interpretation or implementation of laws, regulations, codes of practice or policies, could affect the Group in substantial and unpredictable ways and may even conflict with each other. These may include increasing required levels of bank liquidity and capital adequacy, limiting the types of financial services and products the Group can offer, and/or increasing the ability of non-banks to offer competing financial services or products, as well as changes to accounting standards, taxation laws and prudential regulatory requirements.
As a result of the GFC, regulators have proposed various amendments to financial regulation that will affect the Group. APRA, the Basel Committee on Banking Supervision (the Basel Committee) and regulators in other jurisdictions where the Group has a presence have released discussion papers and proposals in regards to strengthening the resilience of the banking and insurance sectors, including proposals to strengthen capital and liquidity requirements for the banking sector. In addition, the US passed into law the Dodd-Frank Wall Street Reform and Consumer Protection Act which significantly affects financial institutions and financial activities in the US.
Uncertainty remains as to the final form that the proposed regulatory changes will take in Australia, the US and other countries in which the Group operate and any such changes could adversely affect the Group’s business, operations and financial condition. The changes may lead the Group to, among other things, change its business mix, incur additional costs as a result of increased management attention, raise additional amounts of higher-quality capital (such as ordinary shares) and hold significant levels of additional liquid assets and undertake additional long term wholesale funding to replace short term wholesale funding to more closely match the Group’s asset maturity profile.
Unexpected changes to the Group’s license to operate in any jurisdiction may adversely affect its business, operations and financial condition
The Group is licensed to operate in the various countries, states and territories in which it operates. Unexpected changes in the conditions of the licenses to operate by governments, administrations or regulatory agencies which prohibit or restrict the Group from trading in a manner that was previously permitted may adversely impact the Group’s financial results.
The Group is exposed to insurance risk, which may adversely affect its business, operations and financial condition
Insurance risk is the risk of loss due to unexpected changes in current and future insurance claim rates. In life insurance business, insurance risk arises primarily through mortality (death) and morbidity (illness and injury) risks being greater than expected and, in the case of annuity business, should annuitants live longer than expected. For general insurance business, insurance risk arises mainly through weather-related incidents (including floods and bushfires) and other calamities, such as earthquakes, tsunamis and volcanic activities, as well as adverse variability in home, contents, motor, travel and other insurance claim amounts. For further details on climate and geological events see also the risk factor entitled “The Group may be exposed to the impact of future climate change, geological and other extrinsic events which may adversely affect its business, operations and financial condition”. The Group has exposure to insurance risk in both life insurance and general insurance business, which may adversely affect its business, operations and financial condition.

SUPPLEMENTARY INFORMATION
139
The Group may experience reductions in the valuation of some of its assets, resulting in fair value adjustments that may have a material adverse effect on its earnings
Under Australian Accounting Standards, the Group recognises at fair value:
Generally, in order to financial instruments classified as “held-for-trading“ or “designated as at fair value through profit or loss”;
financial assets classified as “available-for-sale”; and
derivatives;
establish the fair value of these instruments, the Group relies on quoted market prices or, where the market for a financial instrument is not sufficiently active, fair values are based on present value estimates or other accepted valuation techniques. In certain circumstances, the data for individual financial instruments or classes of financial instruments used by such estimates or techniques may not be available or may become unavailable due to changes in market conditions. In these circumstances, the fair value is determined using data derived and extrapolated from market data, and tested against historic transactions and observed market trends.
The valuation models incorporate the impact of factors that would influence the fair value determined by a market participant. Principal inputs used in the determination of the fair value of financial instruments based on valuation techniques include data inputs such as statistical data on delinquency rates, foreclosure rates, actual losses, counterparty credit spreads, recovery rates, implied default probabilities, credit index tranche prices and correlation curves. These assumptions, judgments and estimates need to be updated to reflect changing trends and market conditions. The resulting change in the fair values of the financial instruments could have a material adverse effect on the Group’s earnings.
Changes to accounting policies may adversely affect the Group’s business, operations and financial condition
The accounting policies and methods that the Group applies are fundamental to how it records and reports its financial position and results of operations. Management must exercise judgment in selecting and applying many of these accounting policies and methods so that they not only comply with generally accepted accounting principles but they also reflect the most appropriate manner in which to record and report on the financial position and results of operations. However, these accounting policies may be applied inaccurately, resulting in a misstatement of financial position and results of operations.
In some cases, management must select an accounting policy or method from two or more alternatives, any of which might comply with generally accepted accounting principles and be reasonable under the circumstances, yet might result in reporting materially different outcomes than would have been reported under another alternative.
The Group may be exposed to the risk of impairment to capitalized software, goodwill and other intangible assets that may adversely affect its business, operations and financial condition
In certain circumstances the Group may be exposed to a reduction in the value of intangible assets. At reporting date, the Group carried goodwill principally related to its investments in New Zealand and Australia, intangible assets principally relating to assets recognised on acquisition of subsidiaries, and capitalised software balances.
The Group is required to assess the recoverability of the goodwill balances on at least an annual basis. For this purpose the Group uses either a discounted cash flow or a multiple of earnings calculation. Changes in the assumptions upon which the calculation is based, together with expected changes in future cash flows, could materially impact this assessment, resulting in the potential write-off of a part or all of the goodwill balances.
Capitalised software and other intangible assets (including deferred acquisition costs) are assessed for indicators of impairment at least annually. In the event that an asset is no longer in use, or that the cash flows generated by the asset do not support the carrying value, an impairment may be recorded, adversely impacting the Group’s financial condition.
Litigation and contingent liabilities may adversely affect the Group’s business, operations and financial condition
From time to time, the Group may be subject to material litigation, regulatory actions, legal or arbitration proceedings and other contingent liabilities which, if they crystallise, may adversely affect the Group’s results. Details regarding the Group’s material contingent liabilities are contained in Note 15 of the Condensed Consolidated Financial Statements and Note 44 of the 2011 Annual Report. There is a risk that these contingent liabilities may be larger than anticipated or that additional litigation or other contingent liabilities may arise.
The Group regularly considers acquisition and divestment opportunities, and there is a risk that ANZ may undertake an acquisition or divestment that could result in a material adverse effect on its business, operations and financial condition
The Group regularly examines a range of corporate opportunities, including material acquisitions and divestitures, with a view to determining whether those opportunities will enhance the Group’s financial performance and position. Any corporate opportunity that is pursued could, for a variety of reasons, turn out to have a material adverse effect on the Group.
The successful implementation of the Group’s corporate strategy, including its strategy to expand in the Asia-Pacific region, will depend on a range of factors including potential funding strategies, and challenges associated with integrating and adding value to acquired businesses, as well as new regulatory, market and other risks associated with increasing operations outside of Australia and New Zealand.

SUPPLEMENTARY INFORMATION
140
There can be no assurance that any acquisition would have the anticipated positive results, including results relating to the total cost of integration, the time required to complete the integration, the amount of longer-term cost savings, the overall performance of the combined entity, or an improved price for the Group’s securities. Integration of an acquired business can be complex and costly, sometimes including combining relevant accounting and data processing systems, and management controls, as well as managing relevant relationships with employees, customers, counterparties, suppliers and other business partners. Integration efforts could divert management attention and resources, which could adversely affect the Group’s operations or results. Additionally, there can be no assurance that employees, customers, counterparties, suppliers and other business partners of newly acquired businesses will remain as such post-acquisition, and the loss of employees, customers, counterparties, suppliers and other business partners could adversely affect the Group’s operations or results.
Acquisitions and divestitures may also result in business disruptions that cause the Group to lose customers or cause customers to remove their business from the Group to competing financial institutions. It is possible that the integration process related to acquisitions could result in the disruption of the Group’s ongoing businesses or inconsistencies in standards, controls, procedures and policies that could adversely affect the Group’s ability to maintain relationships with employees, customers, counterparties, suppliers and other business partners, which could adversely affect the Group’s ability to conduct its business successfully. The Group’s operating performance, risk profile or capital structure may also be affected by these corporate opportunities and there is a risk that any of the Group’s credit ratings may be placed on credit watch or downgraded if these opportunities are pursued.

DEFINITIONS
141
AAS - Australian Accounting Standards.
AASB - Australian Accounting Standards Board.
Collective provision is the Provision for credit losses that are inherent in the portfolio but not able to be individually identified. A collective provision may only be recognised when a loss event has already occurred. Losses expected as a result of future events, no matter how likely, are not recognised.
Customer deposits represent term deposits, other deposits bearing interest, deposits not bearing interest and borrowing corporations debt excluding securitisation deposits.
Economic profit is a risk adjusted profit measure. Economic profit is determined by adjusting underlying accounting profit with economic credit costs, the benefit of imputation credits and the cost of capital. This measure is used to evaluate business unit performance and is included in determining the variable component of remuneration packages.
Expected loss is determined based on the expected average annual loss of principal over the economic cycle for the current risk profile of the lending portfolio.
IFRS – International Financial Reporting Standards.
Impaired assets are those financial assets where doubt exists as to whether the full contractual amount will be received in a timely manner, or where concessional terms have been provided because of the financial difficulties of the customer. Financial Assets are impaired if there is objective evidence of impairment as a result of a loss event that occurred prior to the reporting date, and that loss event has had an impact, which can be reliably estimated, on the expected future cash flows of the individual asset or portfolio of assets.
Impaired commitments and contingencies comprises undrawn facilities and contingent facilities where the customer’s status is defined as impaired.
Impaired loans comprises drawn facilities where the customer’s status is defined as impaired.
Individual provision charge is the amount of expected credit losses on financial instruments assessed for impairment on an individual basis (as opposed to on a collective basis). It takes into account expected cash flows over the lives of those financial instruments.
Liquid assets are cash and cash equivalent assets. Cash equivalent assets are highly liquid investments with short periods to maturity, are readily convertible to cash at ANZ’s discretion and are subject to an insignificant risk of material changes in value.
Net advances includes gross loans and advances and acceptances and capitalised brokerage/mortgage origination fees, less unearned income and provisions for credit impairment.
Net interest average margin is net interest income as a percentage of average interest earning assets.
Net tangible assets equals share capital and reserves attributable to shareholders of the Group less preference share capital and unamortised intangible assets (including goodwill and software).
Operating expenses excludes the provision for impairment of loans and advances charge.
Operating income includes net interest and other operating income.
Pro forma results Pro forma results have been adjusted for exchange rate movements. This enhances the comparability of financial information between reporting periods.
Repo discount is a discount applicable on the repurchase by a central bank of an eligible security pursuant to a repurchase agreement.
Restructured items comprise facilities in which the original contractual terms have been modified for reasons related to the financial difficulties of the customer. Restructuring may consist of reduction of interest, principal or other payments legally due, or an extension in maturity materially beyond those typically offered to new facilities with similar risk. Revenue includes net interest income and other operating income.

DEFINITIONS
142
Segment review description:
The Group operates on a divisional structure with Australia, Asia Pacific, Europe & America (APEA), Institutional and New Zealand being the major operating divisions. The Group manages Institutional Asia Pacific, Europe & America on a matrix structure. Accordingly, the results for Institutional Asia Pacific, Europe & America are included in both the APEA division and Institutional divisions.
In February 2012 the Group announced that it has put in place a new senior management structure and other organisational changes designed to support our super regional aspirations, give focus to areas of growth and opportunity, and to strengthen succession planning within the senior management team. As these changes are implemented it is anticipated that additional reportable segments will be created. The segment disclosures below are unchanged from that reported at 30 September 2011 in line with how the business was managed and reported to the Chief Operating decision maker during the reporting period.
Australia
Australia division comprises Retail, Commercial and Wealth segments, along with Operations and Support which includes the central support functions for the division.
• Retail
- Retail Distribution delivers banking solutions to customers via the Australian branch network, ANZ Direct and specialist sales channels.
- Retail Products is responsible for delivering a range of products including mortgages, credit cards, personal loans, transaction banking, savings accounts and deposits, using capabilities in product, analytics, customer research, segmentation, strategy and marketing. It also provide online and electronic payment solutions for businesses.
- Mortgages provides housing finance to consumers in Australia for both owner occupied and investment purposes.
- Cards and Payments provides consumer and commercial credit cards, personal loans and merchant services.
- Deposits provides transaction banking, savings and investment products, such as term deposits and cash management accounts.
• Commercial
- Esanda provides motor vehicle and equipment finance and investment products.
- Regional Commercial Banking provides a full range of banking services to personal customers and to small business and agribusiness customers in rural and regional Australia, and includes the acquisition of loans and deposits from Landmark Financial Services.
- Business Banking provides a full range of banking services, including risk management, to metropolitan based small to medium sized business clients with a turnover of up to A$125 million.
- Small Business Banking provides a full range of banking services for metropolitan-based small businesses in Australia with lending up to A$1 million.
• Wealth
- ANZ Private specialises in assisting individuals and families to manage, grow and preserve their wealth. The businesses within Private Wealth include ANZ Private, ANZ Trustees, E*Trade, Investment Lending & Super Concepts.
- ANZ Funds Management and Insurance includes OnePath Group, ANZ Financial Planning, ANZ General insurance, Lender's Mortgage Insurance and Online Investment Account. OnePath Australia was formerly the INGA JV entity between ANZ and the ING Groep and is now a wholly owned subsidiary of ANZ. It operates as part of ANZ's specialist wealth management and protection business. It provides a comprehensive range of wealth and insurance products available through financial advisers or direct to customers and includes ANZ Financial Planners.
Asia Pacific, Europe & America
Asia Pacific, Europe & America division comprises Retail, Asia Partnerships, Institutional and Relationship & Infrastructure.
• Retail which provides retail and small business banking services to customers in the Asia Pacific region and also includes investment and insurance products and services for Asia Pacific customers.
• Asia Partnerships which is a portfolio of strategic partnerships in Asia. This includes investments in Indonesia with PT Bank Pan Indonesia, in the Philippines with Metrobank Cards Corporation, in China with Bank of Tianjin and Shanghai Rural Commercial Bank, in Malaysia with AMMB Holdings Berhad and in Vietnam with Saigon Thuong Tin Commercial Joint-Stock (Sacombank) and Saigon Securities Incorporation. During the March 2012 half, the investment in Saigon Thuong Tin Commercial Joint-Stock (Sacombank) was sold.
• Relationship & Infrastructure which includes the central support functions for the division.
• Institutional Asia Pacific, Europe & America matrix reports to the APEA and Institutional divisions and is also referred to in the paragraph below entitled “Institutional".

DEFINITIONS
143
Segment review description, continued:
New Zealand
New Zealand comprises Retail, Commercial and Wealth segments, and Operations and Support which includes the central support functions (including Treasury funding).
• Retail
- Provides a full range of banking services to personal customers under the ANZ and National Bank brands in New Zealand.
• Commercial
- Commercial & Agri incorporates the ANZ and National Bank brands and provides financial solutions through a relationship management model for medium-sized businesses, including agri-business, with a turnover of up to NZ$150 million. Asset Finance (including motor vehicle and equipment finance), operating leases and investment products are provided under the UDC brand.
- Business Banking provides a full range of banking services to small enterprises, typically with turnover of less than NZ$5 million.
• Wealth
- Private Banking includes private banking operations under the ANZ and National Bank brands.
- OnePath New Zealand manufactures and distributes investment and insurance products and provides related advice.
Institutional
Institutional provides global financial services to government, corporate and institutional clients with a focus on solutions for clients with complex financial needs, based on a deep understanding of their businesses and industries, with particular expertise in natural resources, agriculture and infrastructure. Institutional delivers transaction banking, specialised and relationship lending and markets solutions in Australia, New Zealand, Asia Pacific, Europe and America.
• Transaction Banking provides working capital solutions including deposit products, cash transaction banking management, trade finance, international payments, and clearing services principally to institutional and corporate customers.
• Global Markets provides risk management services to corporate and institutional clients globally in relation to foreign exchange, interest rates, credit, commodities, debt capital markets, wealth solutions and equity derivatives. Markets provides origination, underwriting, structuring and risk management services, advice and sale of credit and derivative products globally. Markets also manages the Group’s interest rate risk position and liquidity portfolio.
• Global Loans provides term loans, working capital facilities and specialist loan structuring. It provides specialist credit analysis, structuring, execution and ongoing monitoring of strategically significant customer transactions, including project and structured finance, debt structuring and acquisition finance, loan product structuring and management, structured asset and export finance.
• Relationship and infrastructure includes client relationship management teams for global institutional and financial institution and corporate customers in Australia and Asia, corporate advisory and central support functions.
Underlying profit is a measure of profit which is prepared on a basis other than in accordance with accounting standards. Reported profit has been adjusted to exclude certain non-core items to arrive at underlying profit, and has been provided to assist readers to understand the result for the ongoing business activities of the Group. Underlying profit has been derived on a consistent basis to prior periods. Underlying profit is not subject to audit review. However, the adjustments made in arriving at underlying earnings are included in statutory profit, and are therefore subject to review within the context of the Group condensed financial statement audit review. The external auditor has informed the Audit Committee that the adjustments are based on the guidelines released by the AICD and FINSIA, and are consistent with prior period adjustments.

ALPHABETICAL INDEX
144
PAGE
Associates and investments ................................................................................................................................................123
Basis of preparation...........................................................................................................................................................103
Changes in composition of the Group...................................................................................................................................123
Condensed Consolidated Balance Sheet ...............................................................................................................................100
Condensed Consolidated Cash Flow Statement......................................................................................................................101
Condensed Consolidated Income Statement .......................................................................................................................... 98
Condensed Consolidated Statement of Comprehensive Income ................................................................................................ 99
Condensed Statement of Changes in Equity..........................................................................................................................102
Contingent liabilities and contingent assets...........................................................................................................................120
Credit quality....................................................................................................................................................................112
Critical estimates and judgements used in applying Accounting Policies....................................................................................104
Definitions........................................................................................................................................................................141
Deposits and other borrowings............................................................................................................................................117
Dividends .........................................................................................................................................................................108
Earnings per share ............................................................................................................................................................109
Exchange rates .................................................................................................................................................................124
Financial Highlights............................................................................................................................................................... 8
Income ............................................................................................................................................................................105
Income tax expense ..........................................................................................................................................................107
Loan capital......................................................................................................................................................................117
Media Release...................................................................................................................................................................... 1
Net loans and advances .....................................................................................................................................................110
Notes to the cash flow statement ........................................................................................................................................121
Operating expenses...........................................................................................................................................................106
Profit reconciliation............................................................................................................................................................. 80
Provision for credit impairment ...........................................................................................................................................111
Related party disclosure .....................................................................................................................................................123
Review of operating results ................................................................................................................................................. 14
Segment analysis ..............................................................................................................................................................122
Segment review................................................................................................................................................................. 46
Share capital ....................................................................................................................................................................118
Shareholders’ equity..........................................................................................................................................................118
Significant events since balance date...................................................................................................................................124
Supplementary information – Average balance sheet and related interest ................................................................................128
Supplementary information – Derivative financial instruments ................................................................................................132
Supplementary information – Four year summary by half.......................................................................................................127
Supplementary information – Principal risks and uncertainties ................................................................................................133