August Stat Pack
6
MONTHLY STAT PACK Data through August 31, 2012 MONTHLY RESIDENTIAL REVIEW Welcome to the ERA Shields Stat Pack. The intention for providing this infor- mation to you is to educate you on the current local real estate market so you can better make decisions for you and your family. Real estate markets vary from city to city as well as neighborhood to neighborhood. When the national media reports on how the real estate market is doing, it is reporting on national numbers and it is likely very different from how your neighborhood is perform- ing. You will find factual data within The Stat Pack from which you may draw your own conclusions. On the last page you will find a brief summary. QUICK FACTS ⇒ The number of Active Listings continues to be way down, nearly 14% lower than 2011 ⇒ The number of Sales for the month were up 8% ⇒ 19.3% of Sales in the past month were reported as distressed ⇒ The Inventory Level is down 20% from 2011, the 18th consecutive month ⇒ The Average Sales Price is up 6.48% while Median Sales Price is up 10.2% ⇒ 64% of sales in the last 3 months were under $250K ⇒ Foreclosure starts have crept up when compared to 2011 This graph compares the number of homes on the market to the number of sales and determines how many months it would take to sell through the current listing inventory. Most economists consider 6.0 months to be a balanced market. The data found within the ERA Shields Real Estate Stat Pack is based on information from the Pikes Peak REALTOR® Services Corporation (RSC) or its PPMLS. This content is deemed reliable; however RSC, PPMLS and ERA Shields Real Estate do not guarantee its accuracy. Data maintained by RSC does not reflect all real estate activity in the market. Additional sources include the Colorado Springs EDC, El Paso County Assessor, El Paso County Trustee, Colorado Springs HBA, PPAR, The Gazette, The CSBJ and NAR. 0.0 1.0 2.0 3.0 4.0 5.0 6.0 7.0 8.0 9.0 2002 2003 2004 2005 2006 2007 2008 2009 2010 2011 2012 4.4 4.0 3.6 3.3 5.0 7.5 8.1 5.7 8.5 5.4 4.3 Months of Inventory
-
Upload
eric-estrada -
Category
Documents
-
view
221 -
download
5
description
Monthly Statistical Report
Transcript of August Stat Pack
MONTHLY STAT PACK Data through August 31, 2012
MONTHLY RESIDENTIAL REVIEW
Welcome to the ERA Shields Stat Pack. The intention for providing this infor-mation to you is to educate you on the current local real estate market so you can better make decisions for you and your family. Real estate markets vary from city to city as well as neighborhood to neighborhood. When the national media reports on how the real estate market is doing, it is reporting on national numbers and it is likely very different from how your neighborhood is perform-ing. You will find factual data within The Stat Pack from which you may draw your own conclusions. On the last page you will find a brief summary.
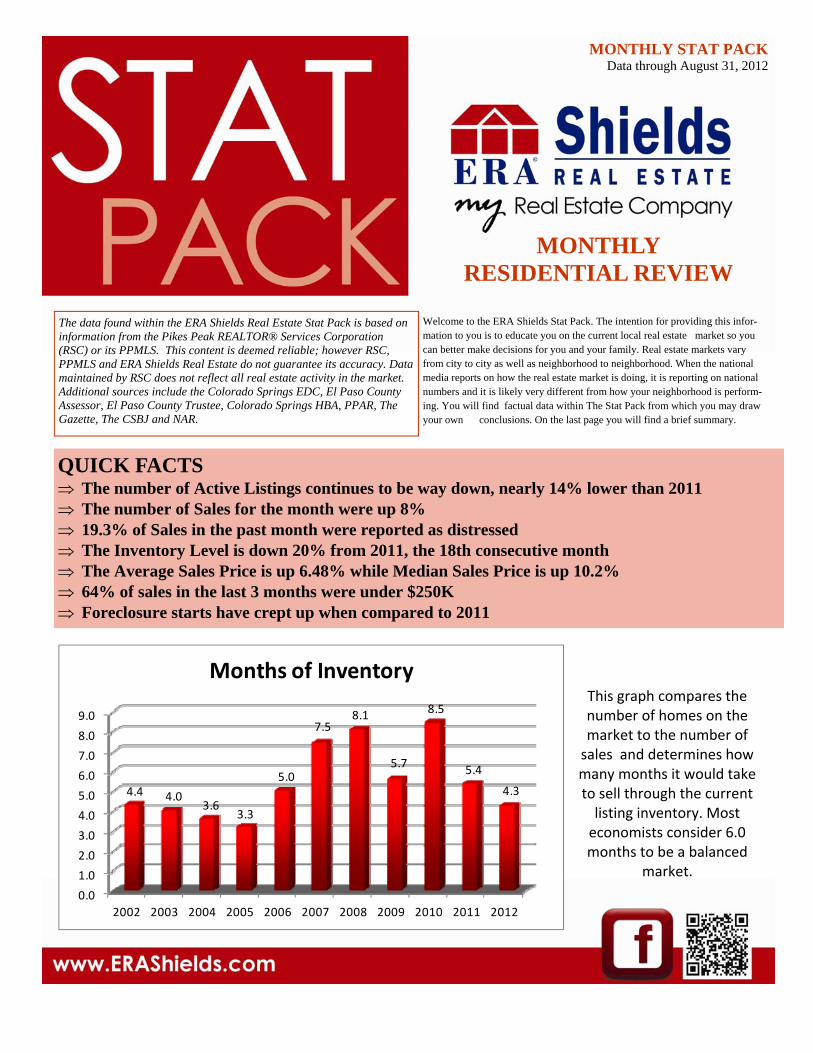
QUICK FACTS ⇒ The number of Active Listings continues to be way down, nearly 14% lower than 2011 ⇒ The number of Sales for the month were up 8% ⇒ 19.3% of Sales in the past month were reported as distressed ⇒ The Inventory Level is down 20% from 2011, the 18th consecutive month ⇒ The Average Sales Price is up 6.48% while Median Sales Price is up 10.2% ⇒ 64% of sales in the last 3 months were under $250K ⇒ Foreclosure starts have crept up when compared to 2011
This graph compares the number of homes on the market to the number of sales and determines how many months it would take to sell through the current listing inventory. Most economists consider 6.0 months to be a balanced
market.
The data found within the ERA Shields Real Estate Stat Pack is based on information from the Pikes Peak REALTOR® Services Corporation (RSC) or its PPMLS. This content is deemed reliable; however RSC, PPMLS and ERA Shields Real Estate do not guarantee its accuracy. Data maintained by RSC does not reflect all real estate activity in the market. Additional sources include the Colorado Springs EDC, El Paso County Assessor, El Paso County Trustee, Colorado Springs HBA, PPAR, The Gazette, The CSBJ and NAR.
0.0
1.0
2.0
3.0
4.0
5.0
6.0
7.0
8.0
9.0
2002 2003 2004 2005 2006 2007 2008 2009 2010 2011 2012
4.4 4.03.6
3.3
5.0
7.58.1
5.7
8.5
5.4
4.3
Months of Inventory

PRICING TOOLS Determine how your neighborhood is performing
3-Month Area Comparisons for Single Family & Patio Homes This chart is ideal for helping you determine how your neighborhood is doing. If you are considering
selling your home, this information is just one tool you can reference to assist you with pricing your home strategically. Call me if you need assistance utilizing this graph.
*Inventory = The number of months it would take to sell through the current active listings at the current sales rate if no other homes came on the market.
**DOM = Days on Market for the homes which actually sold.
For June 1, 2012 - August 31, 2012
Area Listings Solds DOM Inventory Avg List $ Avg Sales $ Black Forest 139 61 142 6.8 $ 583,718 $ 383,207
Briargate 201 198 64 3.0 $ 341,689 $ 297,675
Calhan 29 8 103 10.9 $ 185,722 $ 154,967
Central 226 201 78 3.4 $ 233,910 $ 183,282
Drennan 19 4 91 14.3 $ 136,492 $ 135,000
East 151 164 52 2.8 $ 215,535 $ 175,977 Ellicott 35 13 110 8.1 $ 232,443 $ 102,667 Falcon 58 23 155 7.6 $ 246,965 $ 202,250
Falcon North 179 119 62 4.5 $ 280,800 $ 259,011 Fountain Valley 367 329 69 3.3 $ 200,206 $ 190,961
Manitou 44 20 209 6.6 $ 397,215 $ 237,500
Marksheffel 44 28 66 4.7 $ 260,149 $ 226,568
Midway 13 3 367 13.0 $ 154,108 $ 235,000
Northeast 239 247 54 2.9 $ 272,204 $ 222,255
Northgate 128 97 75 4.0 $ 460,289 $ 364,927
Northwest 110 103 82 3.2 $ 413,821 $ 327,224
Old Colorado 64 44 81 4.4 $ 218,406 $ 203,875
Peyton 35 17 90 6.2 $ 421,755 $ 178,884
Powers 221 285 65 2.3 $ 234,237 $ 203,494
Rock Creek 8 2 102 12.0 $ 623,500 $ 180,800
Southeast 144 141 61 3.1 $ 146,347 $ 126,271
Southwest 274 141 110 5.8 $ 674,096 $ 296,408
Tri Lakes 271 146 84 5.6 $ 479,872 $ 389,824
Ute Pass 31 10 71 9.3 $ 469,139 $ 165,653
West 79 45 61 5.3 $ 478,043 $ 381,391
Divide 70 38 192 5.5 $ 396,471 $ 215,587
Woodland Park 99 47 105 6.3 $ 451,986 $ 297,793

PRICING TOOLS Determine how your neighborhood is performing
3-Month Price Range Comparisons for Single Family & Patio Homes This chart is ideal for helping you determine how your neighborhood is doing. If you are considering selling your home, this information is just one tool you can reference to assist you with pricing your
home strategically. If you have questions on how to properly use this data, call me.
List Price Active Listings Solds Days on Market Inventory
Supply Demand Days to Sell Months
Under $75,000 71 47 92 4.5
$75,000 to $99,999 165 116 110 4.3
$100,000 to $124,999 198 131 100 4.5
$125,000 to $149,999 388 208 89 5.6
$150,000 to $174,999 436 260 84 5.0
$175,000 to $199,999 499 297 88 5.0
$200,000 to $224,999 337 217 84 4.7
$225,000 to $249,999 416 252 96 5.0
$250,000 to $274,999 275 146 107 5.7
$275,000 to $299,999 259 145 111 5.4
$300,000 to $324,999 149 113 129 4.0
$325,000 to $349,999 197 93 106 6.4
$350,000 to $374,999 153 67 110 6.9
$375,000 to $399,999 175 74 102 7.1
$400,000 to $424,999 79 32 108 7.4
$425,000 to $449,999 99 43 134 6.9
$450,000 to $474,999 69 18 86 11.5
$475,000 to $499,999 81 25 139 9.7
$500,000 to $549,999 100 32 122 9.4
$550,000 to $599,999 87 31 119 8.4
$600,000 to $649,999 49 14 186 10.5
$650,000 to $699,999 62 16 158 11.6
$700,000 to $749,999 28 3 114 28.0
$750,000 to $799,999 43 8 101 16.1
$800,000 to $849,999 16 0 n/a n/a
$850,000 to $899,999 24 6 495 12.0
$900,000 to $949,999 7 2 193 10.5
$950,000 to $999,999 11 1 509 33.0
$1 mil to $1.50 mil 58 7 413 24.9
$1.5 mil to $2.0 mil 21 0 n/a n/a
$2.0 mil & above 13 1 641 39.0

ANNUAL DATA COMPARING DATA FOR THE PAST 10 YEARS
This graph shows the total number of Solds for the past 3 months. Comparing 3‐months of data over the past 10 years helps determine what trends are occurring.
Active Listings at the end of the month when compared to the same period the previous 10 years shows remarkable improvement.
0
1000
2000
3000
4000
5000
6000
7000
8000
Aug‐12
Aug‐11
Aug‐10
Aug‐09
Aug‐08
Aug‐07
Aug‐06
Aug‐05
Aug‐04
Aug‐03
Aug‐02
38614484
58395040
63237052
6045
4472445143904231
Active Listings
0
500
1000
1500
2000
2500
3000
3500
4000
4500
2012
2011
2010
2009
2008
2007
2006
2005
2004
2003
2002
27172501
231427102531
3094
37644091
3738
32572982
3 Month Trend For Solds

ANNUAL DATA COMPARING DATA FOR THE PAST 10 YEARS
The Average & Median Sales Prices for the same month over the past 10 years. The “bubble” is rather noticeable in 2004‐2009. 10 years of data helps you better
gauge the current health of the local real estate market.
Another indicator of the health of the overall real estate market is foreclosure starts . The number for 2012 is a forecasted number based on the current pace for the year.
$150,000
$170,000
$190,000
$210,000
$230,000
$250,000
$270,000
$290,000
Jan‐02 Jan‐03 Jan‐04 Jan‐05 Jan‐06 Jan‐07 Jan‐08 Jan‐09 Jan‐10 Jan‐11 Jan‐12
Average
Median
0
1000
2000
3000
4000
5000
6000
20122011201020092008200720062005200420032002
Foreclosure Starts Forecast

August 2012 Summary
There continues to be much good news in the local real estate market; home values increasing, building permits up, inventory levels are low and mortgage rates are incredibly low...all of these point to an improving real estate market. The only items which give us some pause locally are foreclosure starts are inching up and the lack of new jobs to the area. It does seem many homeowners who can afford their monthly mortgage payments and would like to sell (but don’t have to) are either staying put or leasing their home. The outlook for the rest of the year has us cautiously optimistic.