August 2014 - Walters State Community College Performance Funding Points and Dollars Awarded ........
72
Compiled by the Office of Planning, Research and Assessment August 2014
-
Upload
truongthien -
Category
Documents
-
view
218 -
download
2
Transcript of August 2014 - Walters State Community College Performance Funding Points and Dollars Awarded ........

Compiled by the Office of Planning, Research and Assessment
August 2014

Walters State Community College does not discriminate on the basis of race, sex, sexual orientation, gender identity, color, religion, national origin, age, disability or veteran status in provision of educational programs and services or employment opportunities and benefits pursuant to the requirements of Title VI of the Civil Rights Act of 1964, Title IX of the Education Amendments of 1972, Section 504 of the Rehabilitation Act of 1973, the Americans with Disabilities Act (ADA) of 1990 and the Age Discrimination in Employment Act of 1967 (ADEA). Inquiries and charges of violations of any of the above referenced policies should be directed to the Human Resources Office at Walters State, 500 S. Davy Crockett Pkwy., Morristown, TN 37813-6899. Requests for accommodation of a disability should be directed to Office of Disability Services at Walters State, 500 S. Davy Crockett Pkwy., Morristown, TN 37813-6899. (Approved: January 19, 2010)

Institutional Fact Book
Table of Contents 3
Table of Contents
Introduction and Background Information ................................................................................................... 5
Vision ............................................................................................................................................................ 7
Mission ......................................................................................................................................................... 7
Campus Compact .......................................................................................................................................... 8
Tennessee Board of Regents ......................................................................................................................... 9
Unit Organizational Chart ........................................................................................................................... 10
Division of Community Education Profile ................................................................................................. 11 Faculty Profile Full-time Faculty by Age ............................................................................................................................ 14
Full-time Faculty by Rank and Gender ....................................................................................................... 14
Full-time Faculty by Rank and Ethnic Origin ............................................................................................ 15
Full-time Faculty Highest Degree Earned .................................................................................................. 15
Adjunct Faculty by Semester ...................................................................................................................... 16
Adjunct Faculty by Gender and Hours of Instruction ................................................................................. 16 Academic Programs and Outcomes Academic Program Inventory ..................................................................................................................... 18
Accredited Programs and Associated Accrediting Agencies ...................................................................... 19
Average ACT Scores and GPA for First-time Freshmen .......................................................................... 20
ETS Proficiency Profile Scores .................................................................................................................. 20
First Time Freshman Cohort Completion and Transfer Rates ................................................................... 21
Degrees and Certificates Awarded ............................................................................................................. 22
Awards by Major ........................................................................................................................................ 23
Awards by TBR Institution ......................................................................................................................... 25
Student Transfers Within TBR System ...................................................................................................... 26
Annual Placement Report ........................................................................................................................... 27
Employer Follow-Up Trends Summary ..................................................................................................... 28
THEC Retention Summary ......................................................................................................................... 29
Remedial and Developmental/Learning Support Completers .................................................................... 30
THEC Performance Funding Points and Dollars Awarded ........................................................................ 31
THEC Outcomes-Based Formula Data ....................................................................................................... 32
WSCC Primary Indicators .......................................................................................................................... 33
Student Information Headcount by Residency & Citizenship Status .......................................................................................... 35
Headcount and Full-time Equated Enrollment Trends ............................................................................... 36
Enrollment Trends by Gender..................................................................................................................... 37
Enrollment Trends by Age .......................................................................................................................... 38
Enrollment Trends by Student Level .......................................................................................................... 38
Enrollment Trends by Ethnic Origin .......................................................................................................... 39
Enrollment Trends by Primary Location .................................................................................................... 39
Student Credit Hour Production ................................................................................................................. 40
Distance Education Programmatic Enrollment Analysis ............................................................................ 41
Student Financial Aid Awards Summary ................................................................................................... 42
First Generation College Student Data ....................................................................................................... 43
Public High School Graduates Enrolled at WSCC ..................................................................................... 44

Institutional Fact Book
Table of Contents 4
Tennessee and Ten-County Area of Responsibility Educational Attainment of Individuals 25 Years and Older ....................................................................... 46
Population by Gender ................................................................................................................................. 47
Population by Age ...................................................................................................................................... 48
Population by Race ..................................................................................................................................... 49
Per Capita, Median Family, and Median Household Incomes ................................................................... 49
Market Penetration Rate of Community Colleges in Tennessee ................................................................ 50
TN Higher Education County Profiles for Ten-County Area of Responsibility ......................................... 50
County Profiles ........................................................................................................................................... 51
EMSI County Summaries .......................................................................................................................... 61
Additional Resources .................................................................................................................................. 71

Institutional Fact Book
Introduction and Background Information 5
Introduction & Background Information
Walters State is one of 46 institutions in the Tennessee Board of Regents systems, with a combined annual enrollment of over 200,000 students, making it among the nation's largest systems of public higher education. TBR's six state universities, 13 community colleges, and 27 colleges of applied technology offer classes in 90 of Tennessee's 95 counties. The TBR system is a $2.2 billion per year enterprise.
Walters State Community Colleges is accredited by the Southern Association of Colleges and Schools Commission on Colleges to award the associate degree. Contact the Commission on Colleges at 1866 Southern Lane, Decatur, Georgia 30033-4097 or call 404-679-4500 for questions about the accreditation of Walters State.
The Walters State Community College Fact Book is prepared by the office of Planning, Research and Assessment. This Fact Book presents specific information on various aspects of the college as well as select material published in the online 2013-2014 Catalog/Student Handbook at http://catalog.ws.edu and other public institutional documents.
The purpose of the Fact Book is to provide access to information to assist faculty, staff, and students in monitoring institutional trends, changes, and experiences as assessments foster improvement actions. It is also intended to serve informational needs of a variety of college constituencies, accreditation teams, review boards, and governmental authorities. The Fact Book is updated annually or as additional information becomes available. This report may include data from different sources, e.g., internal reports, TBR reports, THEC reports. Small variances may occur due to the use of different databases and programs.
Questions pertaining to information in this document, requests for additional information or copies, and suggestions for improving the publication should be directed to Dr. Debra McCarter.
Office of Planning, Research and Assessment Staff Dr. Debra A. McCarter, Vice President, [email protected] Dr. Deanna E. Garman, Executive Director, [email protected] Ms. Andrea L. Isenberg, Information Processing Specialist/Technical Analyst, [email protected] Ms. Fran O’Connor, Executive Secretary, frances.o’[email protected]
History In 1957, the Pierce-Albright Report on Higher Education in Tennessee was made to the Tennessee Legislative Council. This report reflected the need for additional higher education opportunities to be provided for the average Tennessean. Upper East Tennessee was one of many places where higher education was not readily available to the citizens.
In 1963, the Tennessee General Assembly appropriated $200,000 for use over a two-year period to implement the Pierce-Albright Report. The State Board of Education, under the direction of Commissioner J. Howard Warf, developed plans for the establishment of a group of community colleges to serve these areas without access to higher education. The goal was to have one of these colleges within a 30-40 mile commuting distance of every Tennessean. Admission to these colleges was not to be restrictive to recent high school graduates, but was to be an “open door” opportunity with colleges serving a whole community from ages 18 to 80. Acting upon the recommendations of Governor Frank G. Clement and the State Department of Education, the 1965 Tennessee General Assembly authorized the establishment of the first three of these colleges, one to be located in each of the state’s three Grand Divisions. Columbia, in 1966, became the first operational community college in Tennessee, Cleveland and Jackson opened in 1967. Dyersburg and Tullahoma provided sites for the next two which opened in 1969. Walters State Community College, located in Morristown, was the sixth such college. Its opening date was September 1970.

Institutional Fact Book
Introduction and Background Information 6
In 1969, the General Assembly authorized three more community colleges: Roane State in Harriman, Volunteer State in Gallatin, and Shelby State in Memphis. The nine community colleges and the regional universities were under jurisdiction of the State Board of Education. Chapter 838 of the Public Acts of 1972 authorized establishment of the State University and Community College System of Tennessee, today known as the Tennessee Board of Regents system. The elements of the system include the state universities and state community colleges which had been under the State Board of Education, the Board of Regents, and the Chancellor. The new system of governance became effective on July 1, 1972. Chattanooga State Technical Community College, the 10th community college, was added to the community college system in 1973. Since that time, the state’s technical institutes have been upgraded to community college status and the addition of 27 colleges of applied technology has made the Tennessee Board of Regents System the sixth largest system of higher education in the nation. The Tennessee Board of Regents and the Board of Trustees of the University of Tennessee System are coordinated by the Tennessee Higher Education Commission.
This sixth community college, Walters State Community College, was named for former U.S. Senator Herbert S. Walters who played a key role in the establishment of a community college in Morristown. In 1970 the campus of Walters State was under construction and temporary quarters were used during the first year of operation. The College Center Building was completed in the fall of 1971. It was renamed the Dr. Jack E. Campbell College Center in 2005. The next major addition to the campus was the Career Technology Building which was completed in the winter quarter of 1975. The Career Technology Building was expanded and renovated in 1987 and the new facility was renamed the Technical Education Building. In 2001, this building was renamed the Clifford H. “Bo” Henry Center for Business and Technology. The Life Sciences Building, completed in December 1979, was essential to provide needed classrooms and faculty offices for a rapidly growing student body. This building, which was renamed the Math and Behavioral/Social Sciences Building, was completely renovated during the 2001-02 academic year. It re-opened to students and faculty in the fall of 2002 and was renamed the Doggett Mathematics and Behavioral/Social Sciences Building in 2004. In the summer of 1979 the construction of the Humanities Complex began. The project was completed in the fall of 1980. The Humanities Complex was renamed the Judge William H. Inman Humanities Complex in 2001. In December of 1979, the college added the Plant Operations Building to the physical facilities inventory to handle the functions of maintenance and repair. In 1994 the college began construction of the Campus Development Phase II master plan which includes a new Library, Math and Science Buildings, Public Safety Center, and Administration Building. The new Library opened in May 1997 and was named the R. Jack Fishman Library in 2004. The Natural Science Building was occupied in July 1998 and renamed the McGuffin-Jolley Natural Science Building in 2005. The college’s Great Smoky Mountains Expo Center opened in March 1996 and additional support facilities were added during 1998-99 and 2007.
Walters State has established three additional campus sites; the Sevier County Campus, the Greeneville/Greene County Campus, and the Claiborne County Campus. In 1999, the first building on the new Sevier County Campus was named Maples-Marshall Hall. Two more buildings on the Sevier County Campus, Cates-Cutshaw Hall and the Conner-Short Center, opened in 2008. In 1995, the Greeneville/Greene County Campus moved into the former Laughlin Hospital building in the heart of downtown Greeneville. The college opened the Claiborne County Campus in 1995.
Walters State received initial accreditation by the Southern Association of Colleges and Schools in 1972 and received reaffirmation of accreditation in December 1976. Extensive institutional Self Studies were completed during 1985-87, 1995-97, and 2005-07. Subsequent to the successful Self Studies, Walters State received reaffirmation of accreditation in December 1987, December 1997, and June 2008. The next decennial self-study will occur in 2015-2017.

Institutional Fact Book
Introduction and Background Information 7
Location After Walters State Community College was authorized by the 1967 General Assembly, Hamblen County was chosen by the Tennessee Higher Education Commission as a location. The Tennessee State Board of Education then chose a campus site located on the southeastern edge of the city of Morristown, two miles from the Hamblen County Courthouse. This main campus includes 134 acres of beautiful rolling land that faces east with access roads from the Appalachian Highway. This highway is the connecting link between Interstate 75 in Kentucky and Interstates 81 and 40 into North Carolina and Virginia. The college also occupies modern education facilities in Greeneville, Sevierville, and Tazewell, Tennessee.
Source: WSCC online 2014-15 Catalog and Student Handbook at http://catalog.ws.edu/
Vision (2010-2015)
Walters State will be a premier community college, committed to increasing educational attainment and workforce preparedness through excellence in teaching and service.
Mission (2010-2015)
Walters State is a learning-centered, comprehensive, public community college dedicated to increasing educational attainment and supporting economic development by providing affordable, high quality educational opportunities for the residents of East Tennessee. To accomplish the mission, the college:
1. Offers programs of study that lead to associate degrees or to certificates in programs of study of one year or less.
2. Delivers public service and non-credit programs in support of workforce development and personal enrichment.
3. Employs highly qualified faculty and staff. 4. Fosters and inspires student engagement and success. 5. Provides convenient access through multiple campuses and advanced technology. 6. Partners with other educational institutions to promote access and facilitate articulation and
transfer. 7. Pursues external sources of support and entrepreneurial initiatives. 8. Assesses and responds to community needs. 9. Provides opportunities for promoting diversity and cultural awareness to enhance quality of
life. 10. Pursues resourcefulness, effectiveness and efficiency through comprehensive accountability
and continuous improvement programs.
(Approved by TBR 3/25/11)

Institutional Fact Book
Introduction and Background Information 8
Campus Compact
Walters State Community College: An Educationally Purposeful Community
A place where students, faculty, administrators, and staff share academic goals and work together to strengthen teaching and learning on the campus.
Walters State Community College: An Open Community
A place where freedom of expression is uncompromisingly protected and where civility is powerfully affirmed.
Walters State Community College: A Just Community
A place where the sacredness of the person is honored and where diversity is aggressively pursued.
Walters State Community College: A Disciplined Community
A place where individuals accept their obligations to the group and where well-defined governance procedures guide behavior for the common good.
Walters State Community College: A Caring Community
A place where the well-being of each member is sensitively supported and where service to others is encouraged.
Walters State Community College: A Celebrative Community
One in which the heritage of the institution is remembered and where rituals affirming both tradition and change are widely shared.
Walters State Community College: A Grateful Community
One in which we are forever thankful for all of our generous benefactors and supporters.

Institutional Fact Book
Introduction and Background Information 9
Tennessee Board of Regents
The Tennessee Board of Regents system is governed by 18 board members. The purpose of the board is found in its bylaws. For further information about the board's composition, selection, duties and operations, see the overview. The board meets four times each year at regularly scheduled meetings and the chairman may call additional meetings during the year as needed. The board maintains a strong committee structure through which all policies and other significant considerations are deliberated. Board members, as well as student and faculty representatives from the institutions, serve on these major committees: Academic Policies and Programs, Finance and Business Operations, Personnel, Student Life, Tennessee Technology Centers, Compensation, and Business, Community and Public Affairs. Additional committees are established on an ad hoc basis to address special concerns. Actions taken by the board are shown in minutes from the meetings. All board meetings are open to the public and the press as observers under Tennessee law. Current lists of TBR Board Members and TBR Senior Staff are located at the following links: TBR Board Members TBR Senior Staff
Source: TBR website, 7/2014

Institutional Fact Book
Introduction and Background Information 10
Walters State Community College
Unit Organizational Chart
Source: WSCC Unit Organizational Chart Dec 2013

Institutional Fact Book
Introduction and Background Information 11
Division of Community Education Profile*
Statement of Purpose The Division of Community Education provides workforce development, education, and training for not-for-credit, non‐degree seeking continuing education students. These programs are delivered at Walters State Community College campus sites in Morristown, Sevierville, Tazewell, Greeneville, and the new Greeneville Advanced Manufacturing & Welding Center. Not-for-credit programs do not take the place of classes offered for credit or for degree-seeking students. Workforce development, education, and training courses are offered to teach specific skills to individuals, or employees of companies who need a targeted training program for a specific need. The programs offered are consistent with the mission of Walters State Community College and are designed to meet the needs of individuals, government, industry, and the business community. Continuing Education Units (CEUs) and certificates of achievement are used as a means of recognizing and recording the efforts of individuals who enroll and satisfactorily complete the college's not-for-credit training programs. The recording of CEUs provides a permanent record of an individual's participation in not-for-credit training programs. A transcript can be provided from the Division of Community Education upon request. Non-credit Medical Education The Division of Community Education offers several successful not-for-credit allied health education certificate training programs. These programs are delivered at Walters State Community College campus sites in Morristown, Sevierville, Tazewell, and Greeneville. Courses include:
Certified Nursing Aide (CNA) Registered Dental Assistant (RDA) Clinical Medical Assistant (CMA) Phlebotomy Technician EKG Technician
Community Education Programs General interest, personal development and enrichment classes are offered through the Division of Community Education at all campus locations with the objective of meeting and exceeding the needs and interests of the communities served by Walters State. Courses, workshops, and programs are scheduled for adults and children, as appropriate. Serving students from the surrounding 10‐county areas, the Talented and Gifted Student Program, (T.A.G.) has been offered to students, grades five through eight, since 1983. The T.A.G. Program presents approximately 36 different courses geared for and designed to challenge these students in a wide array of subjects, including, but not limited to: chemistry, biology, physics, astronomy, theater, computers, and foreign languages. Kid’s College is offered during the summer months. In January 2001, the Tennessee Legislature mandated that divorcing couples with minor children are required to attend a parent-education seminar. The Parents, Children, and Divorce class is an approved four‐hour parent education seminar meeting the requirements of this law. This program is offered in Greeneville, Morristown, Tazewell, and Sevierville. Other examples of courses offered by the Division of Community Education are Motorcycle Rider Education, ACT Test Prep, Beginning Driver’s Education, Permit to Carry a Firearm, as well as more than 1,500 e‐learning training programs in a variety of topics. *upon approval by TBR at upcoming board meeting, the name will become Division of Workforce Training

Institutional Fact Book
Introduction and Background Information 12
Customized Corporate Training Programs Reflective of a strong commitment to serving the needs of East Tennessee business and industry with relevant training on state-of-the art equipment, technical assistance, and highly qualified employees, the Division of Community Education coordinates the delivery of educational services packaged to meet the unique and exacting needs of this important constituency. During FY 2013, this division provided 197,866 workforce development training hours for 3,240 students, representing 142 industries in East Tennessee. The Division’s flagship training program, S*T*A*R LEADERSHIP, is the only training program of its kind in East Tennessee. By contracting with companies at convenient times and locations, training packages are customized for traditional classroom, on-site facilitation, or online delivery. Industrial training packages are offered in technical certifications, as well as leadership training, conversational Spanish, mechanical engineering technologies, drafting and design, real estate, and other topics. Consulting and training are available to small business constituents in the areas of start-up, web development, marketing, managing employees, legal issues, and valuing a business. Several certifications and licensing exam preparation programs are offered such as the CPS, CAPS, PHR, SPHR, CBP, CB, Residential Contractors Limited License, and others.
Vocational and Technical Courses Walters State Community College is proud to announce the grand opening of its new Greeneville Advanced Manufacturing & Welding Center. This center will provide new state-of-the-art training equipment to train members of business and industry as well as individuals seeking new career opportunities. Currently a variety of classes and programs are offered in areas of business and office, computer applications, trade and industry, and certificate programs. The offerings include industrial maintenance technician, CNC operator/setup operator, certified welding technician, and residential electricity technician. Certification courses include PHR, CB, CBP, CPS, CAP, MOU, IC3, and A+.
Computer Technology The Division of Community Education offers a complete line of computer training and certification programs available for the general public as well as customized training programs for companies. Popular application software instruction can be delivered in any of the computer training labs located in Morristown, Sevierville, and Greeneville. The instructors can deliver programs designed for certification programs as well as customize instruction to meet the needs of the participants. Some of the application software offered includes Microsoft Word, Excel, PowerPoint, Access, Outlook, Project, and Quick Books. Walters State’s Division of Community Education is a provider of Profiles International Products in the 10-county service area. Profiles offer pre‐employment evaluation and assessment products that meet the requirements of the EEOC and the ADA. Participants can be assessed for hiring, promoting, managing, and on‐going evaluation. A product called the Step‐One Survey offers pre-employment screening indexes for Integrity, Work Ethic, Dependability and Substance Abuse. The Division of Community Education also partners with various Chambers of Commerce to provide new programs of interest to local businesses in their service areas. For more information visit: www.ws.edu/community-ed Source: The Division of Community Education Report on Activities

Institutional Fact Book
Faculty Profile 13
Faculty Profile

Institutional Fact Book
Faculty Profile 14
Percentage of Full-time Faculty by Age
Spring 2014
Source: WSCC Fact Book ARGOS Faculty Report Spring 2014
Full-time Faculty by Rank and Gender
Fall 2013
Source: IPEDS 2013-2014 Human Resources
20-291% 30-39
16%
40-4933%
50-5924%
60-6923%
70 plus3%
Professor Associate Professor Assistant Professor Instructor Total
Female 13 51 20 6 90
Male 9 38 12 12 71
13
51
20
6
90
9
38
12
12
71
Female Male

Institutional Fact Book
Faculty Profile 15
Full-time Faculty by Rank and Ethnic Origin
Fall 2013
Rank White
Black or African
American
American Indian or
Alaska Native
Hispanic/Latino
Two or More Races
Non-resident
Alien Total Professor 19 3 0 0 0 0 22 Associate Professor 83 0 0 2 3 1 89 Assistant Professor 29 1 1 1 0 0 32 Instructor 18 0 0 0 0 0 18
Total 149 4 1 3 3 1 161 Source: Human Resources IPEDS 2013-2014
Full-time Faculty by Highest Degree Earned Fall 2013
Source: WSCC Fact Book ARGOS Report
Associate
1%Bachelor's
6%
Master's
59%
Doctorate
28%
Ed.S.
6%
Associate Bachelors Masters Doctorate Ed. Specialist
Degree Earned Full-time Faculty Certificate or Associate 2 Bachelor’s 10 Master’s 95 Ed.S. 9 Doctorate 45
Total 161

Institutional Fact Book
Faculty Profile 16
Adjunct Faculty Analysis
Number of Adjunct Faculty by Semester 2009-2014
Year
Spring
Summer
Fall
2009 205 46 249
2010 249 61 260
2011 249 72 262
2012 241 58 248
2013 232 46 222
Average 235 47 207
Source: Office of Distance Education
Adjunct Faculty Analysis
Gender and Hours of Instruction Fall 2009-2013
Fall Term Female Male Total Adjunct Credit Hours of Instruction
2009 143 106 249 1,644
2010 153 107 260 1,644
2011 159 103 262 1,684
2012 144 104 248 1,800
2013 123 99 222 1,301
Source: Office of Distance Education

Academic Programs and Outcomes

Institutional Fact Book
Academic Programs and Outcomes 18
Approval Date
Academic Programs Degree 2000 CIP Code¹
Required Semester Hrs
Transfer Programs
08/2006 Teaching A.S.T. 08.13.0101.00 60 05/1970 University Parallel A.A. 16.24.0101.01 60 05/1970 University Parallel A.S. 16.24.0101.01 60 06/2012 Fine Arts A.F.A 30.50.0903.00 61
Technical Degree Programs 10/1978 Production Horticulture A.A.S. 01.01.0603.00 60
Golf Course and Turfgrass Management Greenhouse Management
07/1980 Computer and Information Science A.A.S. 06.11.0101.00 60 Computer Networking Computer Science
01/2007 Information Technology A.A.S. 06.11.0301.00 60 08/2007 Web Technology (ROCC) A.A.S. 06.11.0801.00 60
Web Development 08/2010 Clean Energy Technology A.A.S. 09.15.0503.00 60
Building Technology Electricity Technology Transportation Technology
07/1988 Engineering Technology A.A.S. 09.15.0612.00 60
Biomedical Equipment Technology
Electromechanical Technology
Drafting and Design General Technology Electrical/Electronics Manufacturing
05/1971 Early Childhood Education (WSCC and ROCC) A.A.S. 12.19.0706.00 61 04/2001 Professional Studies (ROCC) A.A.S. 16.24.0102.02 60
Information Technology 08/1992 General Technology A.A.S. 23.32.0111.00 60 06/2012 Criminal Justice (ROCC) A.A.S 27.43.0104.00 60
Corrections Law Enforcement
05/1970 Public Safety A.A.S. 27.43.0107.00 60 Fire Protection Law Enforcement Paramedic Technology
01/1999 Health Information Technology (WSCC and ROCC) A.A.S 31.51.0707.00 66 07/2013 Occupational Therapy Assistant A.A.S. 31.51.0803.00 68 04/1987 Physical Therapist Assistant A.A.S. 31.51.0806.00 69 06/2000 Respiratory Care A.A.S. 31.51.0908.00 73 07/2013 Surgical Technology A.A.S. 31.51.0909.00 60 02/1975 Nursing A.A.S. 31.51.3801.00 65 03/1973 Business A.A.S. 32.52.0201.01 60
Accounting Culinary Arts Administrative Office Assistant Hotel and Restaurant Mgmt. Agriculture Business Paralegal Studies Business Administration
Academic Certificate Programs 08/2011 Pre-Allied Health (embedded AA/AS UP) C.2 31.51.0000.00 23 08/2011 General Education Core (embedded AA/AS UP) C.2 16.24.0101.01 41
Technical Certificate Programs 08/2009 Horticulture (embedded AAS PRTG) C.1 01.01.0601.00 22 08/2009 Landscape Management (embedded AAS PRTG) C.1 01.01.0605.00 21 08/2007 Web Page Authoring ROCC (embedded AAS Web Tech ROCC) C.1 06.11.0801.00 24 06/1997 Culinary Arts (embedded AAS MGMT) C.1 07.12.0503.00 23 08/2010 Clean Energy Core Technology (embedded AAS CETC) C.1 09.15.0503.01 11 08/2010 Clean Energy Transportation Technology (embedded AAS CETC) C.1 09.15.0503.02 23 08/2010 Clean Energy Building Technology (embedded AAS CETC) C.1 09.15.0503.03 23 08/2010 Clean Energy Electricity Technology (embedded AAS CETC) C.1 09.15.0503.04 23 01/2011 Industrial Mechanics (embedded AAS ETEM) C.1 09.15.0612.01 18 01/2011 Operations Management and Quality (embedded AAS ETMF) C.1 09.15.0612.02 17
01/2011 Industrial Electricity (embedded AAS ETEE) C.1 09.15.0612.03 19 01/2011 Industrial Automation (embedded AAS ETMF) C.1 09.15.0612.04 20 03/2012 Early Childhood Education (embedded AAS ECED) C.1 12.19.0706.01 23 12/1994 Basic Law Enforcement Officer Education (embedded AAS PFLE)
C.1 27.43.0107.00 23
10/1998 Medical Coding (embedded AAS HITC) C.1 31.51.0707.00 23 06/1997 Healthcare Documentation Specialist (embedded AAS HITC) C.1 31.51.0708.00 23 12/2000 Medical Insurance Specialist (embedded AAS HITC) C.1 31.51.0713.01 23 06/1996 Pharmacy Technician (free-standing) C.1 31.51.0805.00 23 08/1993 Emergency Medical Technician – Paramedic (embedded AAS PSPA) C.1 31.51.0904.00 38 08/1993 Emergency Medical Technician (embedded AAS PSPA) C.1 31.51.0904.02 16 06/2014 Advanced Emergency Medical Technician C.1 31.51.0908.03 16
¹CIP – Classification of Instructional Programs is a national system for grouping similar programs of study. The middle six digits identify the program on national register while the prefix and suffix digits are added by THEC for state inventory purposes.
Academic Program Inventory – June 2014

Institutional Fact Book
Academic Programs and Outcomes 19
Walters State Community College Accredited or Approved Programs and Associated Agencies
Specific programs are accredited or approved by the following agencies:
Program of Study Agency
Computer & Information Science
Information Technology
Business – All Concentrations
Association of Collegiate Business Schools and Programs (ACBSP)
EMT – Paramedic and Basic EMT Certificates
Public Safety Concentration: Paramedic Technology
Commission on Accreditation of Allied Health Education Programs (CAAHEP) Paramedic Commission on Accreditation of Allied Health Education Programs
Early Childhood Education National Association for the Education of Young Children (NAEYC)
Engineering Technology Association of Technology, Management, and Applied Engineering (ATMAE)
Management Concentration: Culinary Arts
Culinary Arts Certificate
American Culinary Federation (ACF)
Management Concentration: Paralegal Studies
American Bar Association (ABA) - approval only
Nursing Accreditation Commission for Education in Nursing (ACEN)
Pharmacy Technician Certificate American Society of Health-System Pharmacists (ASHP)
Physical Therapist Assistant Commission on Accreditation in Physical Therapy Education (CAPTE)
Respiratory Care Commission on Accreditation for Respiratory Care (CoARC)
Health Information Technology and embedded certificates
Commission on Accreditation for Health Informatics and Information Management Education (CAHIM)
Source: www.ws.edu/about/accreditation

Institutional Fact Book
Academic Programs and Outcomes 20
Average ACT Scores First-time Freshmen Fall 2009 – Fall 2013
Term/Year Average ACT Score
Fall 2009 20.0
Fall 2010 19.6
Fall 2011 19.2
Fall 2012 19.1
Fall 2013 19.4
Source: THEC Factbook
Grade Point Average (GPA) First-time Freshmen
Fall 2009 – Fall 2013
Term/Year Average GPA
Fall 2009 2.96
Fall 2010 2.96
Fall 2011 3.02
Fall 2012 3.07
Fall 2013 3.17
Source: First-time Freshmen Enrollment Reports
Student Achievement: General Education Measure of Academic Proficiency and Progress ETS Proficiency Profile Scores
Academic Years 2009-2010 through 2013-2014
Number of Mean Score Academic Year Students Tested* Institution National
2009-2010 741 442.3 440.6
2010-2011 862 442.7 437.5
2011-2012 774 444.2 437.6
2012-2013 824 444.3 438.3
2013-2014 846 443.0 438.2
*Performance Funding requires all associate degree graduates take the general education exit exam. Students register for exam upon application for graduation.
Source: Performance Funding 2005-2010. Performance Funding 2011-13 Standard 1A: General Education Assessment Data and ETS Proficiency Profile Summary of Scaled Scores

Institutional Fact Book
Academic Programs and Outcomes 21
Full-Time First-Time Freshman Cohort Completion & Transfer Rates 2006-2010
Cohort Year Cohort Count (IPEDs Adjusted)
Completion Rate within 150% of
normal time
Transfer-out Rate within 150% of
normal time
2006 1,052 15% 13%
2007 1,057 16% 12%
2008 1,142 19% 13%
2009 1,553 17% 8%
2010 1,415 15% 10%
Source: IPEDS Graduation Rates Surveys

Institutional Fact Book
Academic Programs and Outcomes 22
Degrees and Certificates Awarded 2009-10 through 2013-14 and Five-year Average
5 Yr 5 Yr Degrees/Certificates 09-10 10-11 11-12 12-13 13-14 Total Average
AA 32 22 23 20 27 124 25
AS 331 321 386 466 487 1,991 398
AST 8 24 30 27 28 117 23
AAS 344 355 352 325 323 1,699 340
Total Degrees 715 722 791 838 865 3,931 786
Academic Certificates N/A N/A 569 792 760 2,121 424
Technical Certificates 314 341 322 311 364 1,652 330
Total Degrees/Certificates 1,029 1,063 1,682 1,941 1,989 7,704 1,540
Degrees and Certificates Awarded 2009-10 through 2013-14
Source: Office of Student Records Degrees Certificates Conferred Reports
Transfer Degrees AAS Academic Certificates Technical Certificates Total Degrees &Certificates
09-10 10-11 11-12 12-13 13-14

Institutional Fact Book
Academic Programs and Outcomes 23
Awards by Major 2009-10 through 2013-14
DEGREE CERT Program Concentration
2009-
2010
2010-
2011
2011-
2012
2012-
2013
2013
- 2014
Division of Technical Education
AAS Production Horticulture - Greenhouse Management (PRGH) 1 1 3 1
1
AAS Production Horticulture - Golf Course & Turfgrass Management (PRTG) 7 2 6 2
8
AAS TOTAL PRODUCTION HORTICULTURE 8 3 9 3 9
AAS Computer Science - Computer & Information Science (CIS) 12 6 5 9 6
AAS Computer Science - Computer Networking (CSNW) 7 7 12 8 5
AAS TOTAL COMPUTER SCIENCE 19 13 17 17 11
AAS Clean Energy Technology - Building (CEBT) 1
AAS Clean Energy Technology - Electricity (CEET) 1
AAS Clean Energy Technology - Transportation (CETT)
AAS TOTAL CLEAN ENERGY TECHNOLOGY 0 0 0 1 1
AAS Engineering Technology - Biomedical Equipment Technology (ETBM) 4 5 4
AAS Engineering Technology - Drafting And Design (ETDR) 6 7 7 4 5
AAS Engineering Technology - Electrical/Electronics (ETEL) 4 5 6 3 3
AAS Engineering Technology - Electromechanical Technology (ETEM) 3 2 2 4 6
AAS Engineering Technology - Manufacturing (ETMF) 3 2 5 2 2
AAS TOTAL ENGINEERING TECHNOLOGY 17 20 25 17 16
AAS Information Technology (CSIN) 2 1 10 2 2
AAS General Technology (GNTC) 2 3 2 1
AAS Professional Studies - Information Technology (PRST) (ROCC) 2 1 1 3
CERT Horticulture (HORT) 4 1 3
CERT Landscape Management (LMGT) 7
CERT Clean Energy Core Technology (CLEC) 3 9
CERT Clean Energy Building Technology (CLEB) 1 1
CERT Clean Energy Electricity Technology (CLEE) 2
CERT Industrial Mechanics (INDM) 1 3 8
CERT Industrial Maintenance 2
CERT Industrial Automation (INDA) 1
CERT Industrial Electricity (INDE) 7 3 5
CERT Industrial Technology (ITC) (Phase out Fall 2012) 1 1
CERT Operations Management & Quality (OPMQ) 2 2
Division of Behavioral & Social Sciences
AAS Early Childhood Education (ECED) 2 2 2 8 14
CERT Early Childhood Education (ECEC) 6 8

Institutional Fact Book
Academic Programs and Outcomes 24
Awards by Major (Continued)
DEGREE CERT Program Concentration
2009-
2010
2010-
2011
2011-
2012
2012-
2013
2013 -
2014
Division of Public Safety
AAS Public Safety - Fire Protection (PSFP) 1 4 4 3 2
AAS Public Safety - Law Enforcement (PSLE) 13 7 5 7 7
AAS Public Safety - Paramedic (PARA) 1 4 8 7 5
AAS TOTAL PUBLIC SAFETY 15 15 17 17 14
CERT Basic Law Enforcement Officer Education (BLEO) 145 148 164 157 145
CERT EMT-Paramedic (PSPM) 16 16 13 13 28
CERT Basic Emergency Medical Technician (BEMT) 68 102 51 39 54
Division of Health Programs
AAS Nursing (NRRN) 112 140 108 108 111
AAS Nursing -Career Mobility (NRCM) 25 24 22 22 23
AAS TOTAL NURSING 137 164 130 130 134
AAS Health And Information Technology (HITC) 5 16 15 14 19
AAS Physical Therapist Assistant (PTHT) 18 18 22 22 22
AAS Respiratory Care (RESP) 15 16 15 14 16
CERT Medical Coding (MDCD) 31 17 28 39 33
CERT Healthcare Documentation Specialist 9 7 8 1 2
CERT Medical Insurance Specialist (MDIS) 10 14 10 12 10
CERT Pharmacy Technician (PHAR) 21 31 26 23 27
Division of Business
AAS Business - Accounting (MACC) 8 9 9 8 10
AAS Business - Administrative Office Assistant (MAOA) 8 7 6 5 5
AAS Business - Agriculture Business (MAGB) 5 10 5 5 3
AAS Business - Business Administration (MBUS) 27 21 25 16 18
AAS Business - Culinary Arts (MCUL) 19 21 19 15 17
AAS Business - Hospitality Management 4 3 4
AAS Business - Restaurant Management (MHRM) 3 3 5
AAS Business - Paralegal Studies (MGPS) 23 11 18 21 11
AAS TOTAL BUSINESS TECHNOLOGY 97 85 86 75 64
CERT Culinary Arts (CLAR) 11 4 5 9 24
Programs without graduates are not shown. For more information see the Academic Inventory of Programs on Page 17. Source: Degrees, Certificates and Options Conferred/Records Department

Institutional Fact Book
Academic Programs and Outcomes 25

Institutional Fact Book
Academic Programs and Outcomes 26
Source: Tennessee Higher Education Fact Book 2013-2014

Institutional Fact Book
Academic Programs and Outcomes 27
Annual Placement
Program of Study 2009 Graduates
Placed
2010 Graduates
Placed
2011 Graduates
Placed
2012 Graduates
Placed
2013 Graduates
Placed
ASSOCIATE OF APPLIED SCIENCE DEGREES
Business 88% 93% 94% 90% 82%
Clean Energy Technology n/a n/a n/a 0% 100%
Computer and Information Science 78% 83% 100% 75% 92%
Early Childhood Education-WSCC & ROCC 100% 100% n/a 100% 87%
Engineering Technology 69% 100% 80% 75% 82%
General Technology n/a 100% 100% 100% 100%
Health Information Technology - WSCC & ROCC 100% 100% 50% 88% 100%
Information Technology n/a 100% 75% 100% 100%
Nursing 99% 99% 97% 98% 96%
Physical Therapist Assistant 100% 100% 100% 100% 95%
Production Horticulture 100% 100% 100% 40% 100%
Public Safety 92% 100% 93% 100% 100%
Respiratory Care n/a 100% 94% 100% 92%
Web Technology - ROCC n/a n/a n/a n/a n/a
CERTIFICATES
Basic Law Enforcement Officer Education 91% 91% 98% 96% 95%
Culinary Arts 100% 100% n/a 100% 100%
Clean Energy Core Technology n/a n/a n/a n/a 67%
Clean Energy Transportation Technology n/a n/a n/a n/a n/a
Clean Energy Building Technology n/a n/a n/a n/a n/a
Clean Energy Electricity Technology n/a n/a n/a n/a n/a
Early Childhood Education n/a n/a n/a n/a n/a
Emergency Medical Technician 84% 88% 91% 87% 90%
Emergency Medical Technician-Paramedic 100% 100% 100% 100% 100%
Horticulture n/a n/a 100% n/a n/a
Industrial Automation n/a n/a n/a n/a n/a
Industrial Electricity n/a n/a n/a 100% 100%
Industrial Mechanics n/a n/a n/a n/a 100%
Industrial Maintenance n/a 100% n/a 100% n/a
Industrial Technology 100% 86% n/a 100% n/a
Landscape Management n/a n/a n/a n/a 100%
Medical Coding 71% 25% 44% 57% 58%
Medical Insurance Specialist 75% 75% 50% 0% 75%
Healthcare Documentation Specialist 86% 67% 0% 33% n/a
Operations Management & Quality n/a n/a n/a n/a n/a
Pharmacy Technician 90% 71% 75% 74% 86%
Web Page Authoring - ROCC n/a n/a n/a n/a n/a
TOTAL 92% 92% 92% 92% 92%
n/a may indicate no graduates in a year or exemptions which eliminated placement requirements. Source: Placement data provided by the office of Student Support Services at Walters State. For program specific detail information go to http://intranet.ws.edu/EBSIIBWeb/TEMPLATES/Walters.ASP?Page=431&Web=32

Institutional Fact Book
Academic Programs and Outcomes 28
.
Employer Follow-Up Summary
Data Trends All Technical Programs
Source: Employer Follow-Up Survey Summary Report For program specific detail information go to http://intranet.ws.edu/EBSIIBWeb/TEMPLATES/Walters.ASP?Page=431&Web=32
Note: Survey not administered to Employers of 2012 graduates
560632 654
690
0
100
200
300
400
500
600
700
800
2008 2009 2010 2011
Graduate Count
92% 92% 92% 92%
0%
20%
40%
60%
80%
100%
2008 2009 2010 2011
Placement Rate*
0%
10%
20%
30%
40%
50%
60%
2008 2009 2010 2011
Overall Satisfaction
excellent
good
fair
needsimprovement
poor
55%
46%47% 48%
40%
42%
44%
46%
48%
50%
52%
54%
56%
2008 2009 2010 2011
Survey Response Rate

Institutional Fact Book
Academic Programs and Outcomes 29
Tennessee Higher Education Commission Retention Summary
Fall 2012 to Fall 2013 by Race

Institutional Fact Book
Academic Programs and Outcomes 30
Remedial and Developmental Completers
Spring, Summer, and Fall 2009-2013
Students Completing: Spring 2009 Spring 2010 Spring 2011 Spring 2012 Spring 2013
English - DSPW 0700, DSPW 0800 179 303 324 206 163 Learning Strategies – DSPS 0800 182 194 230 166 *2 (RODP) Math – DSPM 0700, DSPM 0800, DSPM 0850 744 786 736 578 602 Reading – DSPR 0700, DSPR 0800 121 139 134 145 103
Total 1,226 1,422 1,424 1,095 870
Students Completing: Summer 2009 Summer 2010 Summer 2011 Summer 2012 Summer 2013
English - DSPW 0700, DSPW 0800 76 71 53 33 24 Learning Strategies – DSPS 0800 50 33 6 0 *n/a Math – DSPM 0700, DSPM 0800, DSPM 0850 241 285 193 151 104 Reading – DSPR 0700, DSPR 0800 20 8 10 9 11
Total 387 397 262 193 139
Students Completing: Fall 2009 Fall 2010 Fall 2011 Fall 2012 Fall 2013**
English - DSPW 0700, DSPW 0800 500 455 421 384 - Learning Strategies – DSPS 0800 484 490 434 *2 (RODP) - Math – DSPM 0700, DSPM 0800, DSPM 0850 1,135 1,095 975 802 - Reading – DSPR 0700, DSPR 0800 304 283 297 337 -
Total 2,423 2,323 2,127 1,525 -
Learning Support Completers beginning Fall 2013**
Students Completing: Fall 2013 Spring 2014
ENGL 0801 194 57 ENGL 0802 296 125
English Total Duplicated 490 182 MATH 0801 712 256 MATH 0802 623 227 MATH 0803 573 215 MATH 0804 160 401 MATH 0805 144 363
Math Total Duplicated 2,212 1,462 READ 0801 39 7 READ 0802 304 68
Reading Total Duplicated 343 75
Grad Total Duplicated 3,045 1,719
Source: Banner SYRGPCD Reports. *In preparation for the implementation of TBR Guideline A-100, WSCC ceased offering Learning Strategies 0800 in Fall 2012.
**In accordance with TBR Guideline A-100, WSCC fully implemented the redesigned Learning Support (formerly Developmental Studies) Program beginning Fall 2013.

Institutional Fact Book
Academic Programs and Outcomes 31
Tennessee Higher Education Commission Performance Funding Points and Dollars Awarded
PF 2005-2010 Cycle 2010-2015 Cycle
2010-11 2011-12 2012-13
Institution Avg.
Points Total $
for Cycle Points Dollars Points Dollars Points Dollars
Austin Peay 86.9 10,244,153 90.0 2,387,000 92.0 2,545,000 91.0 4,987,572
East Tennessee 94.2 18,155,745 93.5 3,742,000 95.0 3,850,000 93.5 8,008,938
Middle Tennessee 94.6 31,572,396 92.5 6,359,000 95.0 6,404,,000 98.0 13,029,807
Tennessee State 82.1 10,246,206 81.0 2,185,000 87.0 2,328,000 89.0 5,391,205
Tennessee Tech 95.6 14,496,758 95.0 3,158,000 93.0 3,048,000 97.5 6,182,761
Univ. of Memphis 88.2 33,571,520 89.0 6,785,000 92.0 6,839,000 93.0 14,251,814
Subtotal 118,286,778 24,616,000 25,014,000 51,852,097
UT Chattanooga 92.7 13,505,603 89.0 2,715,000 91.0 2,747,000 96.0 5,892,609
UT Knoxville 91.6 57,526,990 96.0 13,423,000 93.0 13,380,000 96.0 28,220,384
UT Martin 91.3 9,315,055 95.0 2,008,000 88.0 1,830,000 92.0 3,920,247
Subtotal 80,347,648 18,146,000 17,957,000 38,033,240
Chattanooga 90.2 7,257,727 96.0 1,968,000 100.0 2,235,000 97.0 3,386,495
Cleveland 93.4 3,158,784 91.0 719,000 92.0 704,000 89.0 1,017,829
Columbia 91.4 4,230,852 93.0 952,000 91.0 958,000 92.0 1,462,674
Dyersburg 91.6 2,496,144 91.0 576,000 100.0 611,000 95.0 894,792
Jackson 87.8 3,822,068 93.0 928,000 93.0 917,000 98.0 1,399,562
Motlow 94.0 3,833,437 94.0 889,000 99.0 912,000 93.0 1,281,176
Nashville 93.0 5,512,058 97.0 1,248,000 100.0 1,328,000 97.0 1,988,658
Northeast 93.2 4,824,283 94.0 1,096,000 98.0 1,105,000 100.0 1,685,801
Pellissippi 91.2 7,122,129 93.0 1,792,000 88.0 1,677,000 92.0 2,803,835
Roane 94.8 5,759,976 98.0 1,301,000 98.0 1,350,000 98.0 2,202,233
Southwest 78.6 8,944,835 95.0 2,175,000 93.0 1,988,000 96.0 3,055,694
Volunteer 90.3 5,795,229 96.0 1,295,000 98.0 1,313,000 98.0 2,053,589
Walters 94.2 6,224,223 93.0 1,465,000 98.0 1,632,000 100.0 2,623,356
Subtotal 68,981,745 16,404,000 16,730,000 25,855,694
Grand Total 267,616,171 59,166,000 59,701,000 115,741,031
Source: THEC Website

Institutional Fact Book
Academic Programs and Outcomes 32
Tennessee Higher Education Commission 2014-15 Funding Formula Data
Community Colleges
12 CH 24 CH 36 CH Dual Enroll Assoc
1-2 Yr. Certs
<1 Yr. Certs
Job Place
R&D Success Transfers Out
Contract Hours
Awards Per FTE
CHSCC 2012-13 2,318 1,801 1,591 1,253 1,002 229 194 381 2,875 561 149,621 17.8 2011-12 2,351 1,872 1,646 1,155 896 146 105 407 2,849 531 241,977 14.7 2010-11 2,716 1,969 1,647 1,095 842 123 28 429 2,159 440 163,770 13.3
CLSCC 2012-13 1,060 716 605 615 372 29 153 190 1,023 205 7,596 15.9 2011-12 1,164 817 659 627 370 49 166 216 944 236 4,014 15.7 2010-11 1,141 897 744 626 354 39 145 200 836 201 7,276 14.5
COSCC 2012-13 1,538 1,284 1,012 843 599 52 3 212 1,553 413 63,095 18.7 2011-12 1,558 1,304 1,050 791 611 47 2 234 1,465 449 54,072 18.2 2010-11 1,620 1,412 1,140 674 540 51 0 240 1,248 410 67,122 15.3
DSCC 2012-13 959 625 542 887 300 26 17 121 1,198 242 7,114 14.7 2011-12 1,039 780 542 803 280 32 11 101 1,157 218 6,027 13.3 2010-11 1,122 707 530 765 260 15 2 98 857 190 5,909 11.3
JSCC 2012-13 1,127 899 691 800 509 34 41 357 1,435 294 17,853 18.2 2011-12 1,194 921 782 815 554 34 25 284 1,408 280 14,019 17.4 2010-11 1,351 1,010 847 971 576 0 22 279 1,171 288 17,182 15.8
MSCC 2012-13 1,363 1,044 901 859 568 1 22 73 1,620 499 5,493 18.7 2011-12 1,410 1,133 962 854 627 0 45 105 1,692 540 8,803 19.1 2010-11 1,457 1,139 993 787 526 0 28 70 1,440 508 5,513 15.2
NASCC 2012-13 2,338 1,824 1,611 1,119 624 99 233 363 3,152 638 35,965 11.2 2011-12 2,305 1,937 1,717 997 718 113 117 335 3,024 675 39,563 12.7 2010-11 2,375 2,048 1,671 1,092 531 38 107 263 2,491 552 32,948 8.9
NESCC 2012-13 1,664 1,348 1,125 723 720 104 25 275 2,129 379 6,434 18.4 2011-12 1,485 1,326 1,217 585 764 110 10 261 1,855 404 6,558 18.6 2010-11 1,744 1,480 1,262 566 696 132 3 249 1,475 366 5,556 16.7
PSCC 2012-13 2,823 2,346 1,947 1,213 1,258 0 1,152 310 3,140 840 45,598 16.9 2011-12 3,001 2,350 2,012 1,525 1,101 0 190 395 2,760 736 46,118 14.0 2010-11 2,943 2,490 2,092 1,245 932 0 3 189 1,986 614 62,867 12.0
RSCC 2012-13 1,642 1,256 1,111 1,632 787 77 9 389 1,767 445 116,535 20.2 2011-12 1,687 1,269 1,107 1,655 804 91 22 391 1,650 486 82,250 20.0 2010-11 1,784 1,414 1,189 1,372 771 60 31 427 1,342 413 94,910 17.8
STCC 2012-13 2,976 2,446 1,911 407 897 63 344 434 4,740 769 75,009 11.9 2011-12 3,898 3,072 2,360 409 808 49 305 487 4,687 778 74,172 9.0 2010-11 4,127 3,186 2,348 367 841 63 339 366 3,912 675 53,211 9.4
VSCC 2012-13 2,037 1,597 1,365 1,792 787 73 399 448 2,426 585 74,639 16.0 2011-12 2,132 1,684 1,446 1,566 763 88 205 387 2,329 627 95,564 14.7 2010-11 2,469 1,781 1,490 1,519 723 82 310 278 1,966 536 71,174 13.1
WSCC 2012-13 1,927 1,311 1,112 1,407 838 14 226 473 1,846 385 194,026 19.4 2011-12 1,976 1,393 1,173 1,261 791 18 265 544 1,817 479 197,866 17.4 2010-11 1,988 1,474 1,329 1,011 720 16 256 501 1,545 409 129,099 14.8
*Data reflects individual year outcomes, not three-year averages Source: THEC Outcomes Based Funding Formula Models

Institutional Fact Book
Academic Programs and Outcomes 33
Walters State Community College Primary Indicators
2008-2009 Data/2010 Baseline
Source: TBR Academic Affairs Website

Student Information

Institutional Fact Book
Student Information 35
Source: THEC 2013-14 Fact Book
Student Information

Institutional Fact Book
Student Information 36
Duplicated Headcount and Full-time Equated Enrollment Trends
Headcount FTE Fall 2008 5,918 4,082 Spring 2009 5,574 3,843 Summer 2009 2,021 729 Fall 2009 6,853 4,780 Spring 2010 6,157 4,337 Summer 2010 1,979 760 Fall 2010 6,959 4,808 Spring 2011 6,215 4,291 Summer 2011 1,880 731 Fall 2011 6,738 4,574 Spring 2012 5,898 3,949 Summer 2012 1,463 522 Fall 2012 6,554 4,406 Spring 2013 5,891 3,790 Summer 2013 1,523 547 Fall 2013 6,265 4,081 Spring 2014 5,404 3,507 Summer 2014 1,291 420
Source: Banner (SYRHCNT) reports and Argos ODSP Report – TBR_TERM_DEGREE_CREDIT
Unduplicated 12-Month Headcount and Full-time Equated Enrollment Trends
Academic Year Headcount FTE
2009-2010 9,077 4,922
2010-2011 9,093 4,929
2011-2012 8,744 4,616
2012-2013 8,390 4,359
Source: IPEDS 12-Month Enrollment

Institutional Fact Book
Student Information 37
HC and FTE Enrollment Trends Fall 2003-2013
Source: THEC 500L Fall Enrollment Reports
Enrollment Trends by Gender
Fall 2009-2013
Source: WSCC Fall Enrollment Reports and IPEDS Enrollment Surveys
2003 2004 2005 2006 2007 2008 2009 2010 2011 2012 2013
HC 6,214 5,944 5,879 5,738 5,825 5,918 6,853 6,959 6,733 6,554 6,265
FTE 4,067 3,922 3,826 3,872 3,884 4,082 4,780 4,808 4,573 4,406 4,081
0
1,000
2,000
3,000
4,000
5,000
6,000
7,000
8,000
HC FTE
2009 2010 2011 2012 2013
Male 2,636 2,693 2,569 2,540 2,425
Female 4,217 4,266 4,164 4,014 3,840
2,636 2,693 2,569 2,540 2,425
4,217 4,266 4,1644,014
3,840
Enro
llme
nt
Axis Title
Male Female

Institutional Fact Book
Student Information 38
Enrollment Trends by Age Fall 2009-2013
Source: Fall Enrollment Reports and IPEDS Fall Enrollment Surveys
Fall Enrollment Trends by Student Level 2009 - 2013
Source: TBR/ARGOS Degree Credit Report
Under 18 18-19 20-24 25-34 35-64 65 and Over Unknown
Fall 2009 586 1,919 1,925 1,226 1,189 7 1
Fall 2010 623 1,917 1,939 1,271 1,200 8 1
Fall 2011 778 1,891 1,894 1,129 1,029 12 -
Fall 2012 842 2,009 1,805 1,039 855 4 -
Fall 2013 1374 2,004 1,382 817 681 7 -
0
500
1000
1500
2000
2500
Fall 2009 Fall 2010 Fall 2011 Fall 2012 Fall 2013
First TimeFreshmen
ReturingFreshmen
SophomoresUndergraduate
SpecialTotal Enrolled
2009 1,644 1,438 2,318 1,453 6,853
2010 1,545 1,577 2,367 1,470 6,959
2011 1,503 1,410 2,338 1,482 6,733
2012 1,448 1,336 2,192 1,578 6,554
2013 1,364 1,133 1,991 1,777 6,265
-
1,000
2,000
3,000
4,000
5,000
6,000
7,000
Enro
llmen
t

Institutional Fact Book
Student Information 39
Enrollment Trends by Ethnic Origin Fall 2009 – 2013
Race/Ethnicity Fall
2009 Fall
2010 Fall
2011 Fall
2012 Fall
2013
Asian 54 50 52 43 42
American Indian or Alaska Native 23 19 19 16 12
Black or African American 164 167 143 146 130
Hispanic/Latino 145 118 108 135 136
Native Hawaiian or Other Pacific Islander 9 5 4 3 2
Non-resident Alien 13 12 16 14 24
Two or More Races 111 110 104 120 91
Unknown 1 11 5 8 12
White 6,333 6,467 6,282 6,069 5,816
Total 6,853 6,959 6,733 6,554 6,265
NOTE: If an individual self-identifies as Hispanic and another race, he/she is counted only in the Hispanic category.
Source: SIS Fall Enrollment Reports and IPEDS Fall Enrollment Surveys.
Headcount (HC) and Full-time Equated (FTE) by Primary Location - Duplicated Fall 2009-2013
Fall 2009 Fall 2010 Fall 2011 Fall 2012 Fall 2013
Location HC FTE HC FTE HC FTE HC FTE HC FTE Morristown 4,085 2,734 3,998 2,650 3,912 2,534 3,885 2,476 3,524 2,248 Claiborne 399 199 419 212 322 183 353 179 386 196 Greeneville 1,136 628 1,084 632 1,128 638 1,090 600 1,123 581 Sevierville 1,597 941 1,642 1,005 1,567 925 1,443 799 1,277 735 Area High Schools 665 206 768 234 802 241 883 275 920 276 RODP 417 96 318 70 255 56 310 68 214 48
Source: WSCC Duplicated HC and FTE by Campus and Other Locations data from ARGOS (WS_ENRCNT)

Institutional Fact Book
Student Information 40
Student Credit Hour Production by Level
Fall 2009 - Fall 2013
Student Credit Hours
Year Level Regular Remedial* Developmental Total
2009 First Time Freshmen 13,509 987 6,489 20,985
Returning Freshmen 14,014 339 1,983 16,336
Sophomores 24,227 36 423 24,686
Undergrad/Special 9,568 21 102 9,691
Total 61,318 1,383 8,997 71,698
2010 First Time Freshmen 12,105 1,242 6,201 19,548
Returning Freshmen 15,630 327 1,941 17,898
Sophomores 24,799 39 381 25,219
Undergrad/Special 9,327 18 105 9,450
Total 61,861 1,626 8,628 72,115
2011 First Time Freshmen 11,985 678 6,216 18,879
Returning Freshmen 13,306 237 2,067 15,610
Sophomores 24,290 27 330 24647
Undergrad/Special 9,376 27 57 9460
Total 58,957 969 8,670 68,596
2012 First Time Freshmen 12,864 51 5,001 17,916
Returning Freshmen 12,932 39 1,629 14,600
Sophomores 22,848 9 315 23,172
Undergrad/Special 10,285 3 117 10,405
Total 58,929 102 7,062 66,093
2013 First Time Freshmen 12,148 - 5,109 17,257
Returning Freshmen 11,497 - 903 12,400
Sophomores 20,630 - 89 20,719
Undergrad/Special 10,779 - 64 10,843
Total 55,054 - 6,165 61,219
*Discontinued Fall 2013 Source: WSCC SIS 500R and SIS500LB Enrollment Reports

Institutional Fact Book
Student Information 41
Distance Education Programmatic Enrollment Analysis
Duplicated Headcount by Semester Summer 2009 – Spring 2014
Semester/Year Telecourses ITV Dual Enrollment
Web-based
Hybrid*
Desktop Video Course**
Total
Summer 2009 0 228 23 531 - - 782
Fall 2009 22 668 1,006 3,007 - - 4,703
Spring 2010 33 745 784 2,277 - - 3,839
TOTAL 55 1,641 1,813 5,815 - - 9,324
Summer 2010 0 149 41 705 - - 895
Fall 2010 46 667 1,236 2,273 - - 4,222
Spring 2011 0 526 988 2,265 - - 3,779
TOTAL 46 1,342 2,265 5,243 - - 8,896
Summer 2011 0 48 48 399 - - 495
Fall 2011 0 597 1,491 2,092 - - 4,180
Spring 2012 0 591 1,211 2,037 - - 3,839
TOTAL 0 1,236 2,750 4,528 - - 8,514
Summer 2012 0 108 57 587 110 - 862
Fall 2012 0 321 1,678 2,172 515 - 4,686
Spring 2013 0 676 1,427 2,205 39 - 4,347
TOTAL 0 1,105 3,162 4,964 664 - 9,895
Summer 2013 0 97 92 637 85 - 911
Fall 2013 0 659 1,992 2,088 516 - 5,255
Spring 2014 0 618 1,661 2,193 598 6 5,076
TOTAL 0 1,374 3,745 4,918 1,199 6 11,242
*Tracking Began Summer 2012 **Desktop Video Course is a new mode of delivery beginning spring 2014
Source: Evening and Distance Education Programmatic Enrollment Analysis

Institutional Fact Book
Student Information 42
Student Financial Aid Awards Summary Fiscal Years 2010-11, 2011-12, 2012-13
FY 10-11 FY 11-12 FY 12-13
#
Awards Award
Amounts #
Awards Award
Amounts #
Awards Award
Amounts
Federal Programs
Federal Work Study (FWS) 127 175,751 142 141,200 140 149,865 Stafford Loans (Direct) 1,409 3,062,478 1094 3,823,579 1009 3,762,921 Pell Grant 4,042 13,462,028 3771 12,278,444 3509 11,688,902 Student Educational Opp. Grant (FSEOG) 134 89,000 211 130,052 165 106,000 Trade Readjustment Act (TRA/TAA) 92 342,541 115 489,341 71 341,654 Workforce Investment Act (WIA) 154 338,531 105 147,618 94 152,077
Robert Byrd Scholarship 3 3,000 2 3,000 1 1,500 Gear Up 68 40,125 124 146,375 48 42,000
Federal Total 6,029 17,513,454 5,564 17,159,609 5,037 16,244,919
State Programs
Access and Diversity Grants 158 298,292 64 110,972 39 89,695 Dual Enrollment 961 398,201 1,228 612,300 1,369 786,558 Department of Children's Services 13 26,182 12 29,196 15 33,477 Helping Heroes Grant 4 4,500 7 10,500 11 16,000 Ned McWherter Scholars Program 1 3,000 1 3,000 1 3,000 TN Students Assistance Grant (TSAA) 771 729,777 635 635,531 762 788,576 TN Educational Lottery Scholarship (TELS) 1,422 2,989,283 1,461 3,094,051 1,521 3,297,111 TN Minority Teaching Scholar 0 0 1 2,500 Vocational Rehabilitation 127 271,684 88 195,808 49 117,873 Waivers 778 447,567 780 459,140 744 454,175 Out of State Waivers 28 250,098 31 297,695 35 351,072
State Total 4,263 5,418,584 4,307 5,448,193 4,547 5,940,037
Institutional Programs
Athletic Scholarships (Fees, Books, Housing) 70 77,295 42 84,302 51 71,483
Professional Entertainment Scholarships 30 9,952 28 14,145 39 15,866 Academic Service Scholarship (ASA) - - - - 56 164,361 Academic Performance (APS) 245 631,078 215 467,198 143 296,221 Access and Diversity Grants 18 43,105 56 121,024 56 140,761
Other Institutional (SGA, Gallery, Cheerleading) 17 18,400 19 22,750 21 25,050
Institutional Total 380 779,830 360 709,419 366 713,741
Foundation Programs
Foundation Scholarships 140 270,823 126 260,354 121 282,376 Partners in Progress 62 38,618 74 68,890 86 94,794 Jefferson County Community Sch. 12 9,842 25 21,503 8 4,583 Awards 39 6,500 22 8,600 66 12,443
Foundation Total 253 325,783 247 359,346 215 381,752
Private Programs
Agency Scholarships 242 236,068 192 211,217 206 208,878 Edscholar 3 9,000 1 3,000 1 3,000 Knox Achieves 0 0 40 62,166 0 0 tnAchieves - - 0 0 344 384,373 Resticted 26 22,255 43 41,245 29 24,961
Private Total 271 267,323 276 317,628 580 621,212
Total Awards 11,196 24,304,974 10,754 23,994,195 10,745 23,901,661
Source: WSCC Financial Aid Department February 2014

Institutional Fact Book
Student Information 43
Walters State Community College
Self -Reported First Generation College Student Data Academic Years 2009-10 through 2013-14
WSCC Students’ Response to FAFSA Parental Education Level Report 2009-10 2010-11 2011-12 2012-13 2013-14
One or both parents completed only high school or below
5,053 5,060 4,547 4,594 3,968
Both parents unreported 12 11 9 9 6
Education level of both parents unknown 195 182 149 170 129
One or both parents attended college 2,181 2,202 1,998 2,148 1,944
Source: Banner SYRFPED Report

Institutional Fact Book
Student Information 44
Public High School Graduates Enrolled at Walters State - Fall 2011 Through Fall 2013
2011 2012 2013
High School
Banner High
School Code
No. Grads
No. Grads Enrolled at WSCC
No. Grads
No. Grads Enrolled at WSCC
No. Grads
No. Grads
Enrolled at WSCC
Total Claiborne County NA 295 66 295 71 301 71 Claiborne County 432245 47 55 54 Cumberland Gap 430494 19 16 17
Total Cocke County NA 410 94 393 76 399 64 Cocke County 431775 68 58 49 Cosby 430470 26 18 15
Total Grainger County NA 261 62 247 86 266 79 Grainger County 432030 58 73 64 Washburn 432380 4 13 15
Total Greene County NA 562 108 545 143 559 110 Chucky Doak 430003 28 27 25
Greeneville 430815 15 36 28 North Greene 430820 15 18 9 South Greene 430825 18 31 14 West Greene 431590 32 31 34
Total Hamblen County NA 559 145 621 208 568 180
Morristown-East 431585 66 100 85 Morristown-West 431587 79 108 95
Hancock County 432135 71 23 71 27 61 23 Total Hawkins County NA 550 71 559 67 520 55
Cherokee 432016 64 62 47 Clinch 430617 1 1 2
Volunteer 430341 6 4 6 Jefferson County 430525 528 115 501 94 505 114 Total Sevier County NA 943 235 920 209 1,011 228
Gatlinburg-Pittman 430755 19 21 27 Pigeon Forge 432089 28 40 39 Sevier County 432090 81 94 94 Seymour 432107 107 54 68
Union County 431320 179 17 169 20 163 25 Total All Schools NA 4,358 936 4,321 1,001 4,353 949
Source: Tennessee Department of Education/Annual Statistical Report/Table 6/Number of High School Graduates from Public Schools; Argos Banner extract (WS Enrolled Student Search by High School Grad Date)
includes non-degree seeking students, students graduating from high school any time January through July and enrolling in WSCC in subsequent fall term.
*Numbers do not reflect students who withdrew

Tennessee and 10-County Area of Responsibility

Institutional Fact Book
Tennessee and Ten-County Area 46
Educational Attainment of Population 25 Years and Older 5-Year Estimated Numbers (2008-2012)
No High School
Diploma High School Diploma
or GED Some College,
No Degree Associates Degree Bachelor’s or Higher
Population 25 Years and
Older Number Percent Number Percent Number Percent Number Percent Number Percent
TENNESSEE 4,250,890 685,390 16.12% 1,401,231 32.96% 901,089 21.20% 264,506 6.22% 998,674 23.49%
County
Claiborne 22,363 6,127 27.40% 8,940 39.98% 3,188 14.26% 1,150 5.14% 2,958 13.23%
Cocke 25,398 6,250 24.61% 11,732 46.19% 3,907 15.38% 1,315 5.18% 2,194 8.64%
Grainger 15,925 4,729 29.70% 6,538 41.05% 2,354 14.78% 730 4.58% 1,574 9.88%
Greene 48,593 9,749 20.06% 19,783 40.71% 8,942 18.40% 2,506 5.16% 7,613 15.67%
Hamblen 42,825 9,094 21.24% 15,785 36.86% 8,599 20.08% 2,463 5.76% 6,884 16.07%
Hancock 4,816 1,407 29.22% 2,111 43.83% 702 14.58% 121 2.51% 475 9.86%
Hawkins 40,116 8,055 20.08% 16,942 42.23% 7,750 19.32% 2,256 5.62% 5,113 12.75%
Jefferson 35,094 6,995 19.93% 13,595 38.74% 7,805 22.24% 2,234 6.37% 4,465 12.72%
Sevier 62,655 11,547 18.42% 23,875 38.11% 14,064 22.45% 3,997 6.38% 9,172 14.64%
Union 12,989 3,819 29.40% 5,791 44.58% 1,706 13.13% 672 5.17% 1,001 7.71%
Total 10 County Service Area 310,774 67,772 21.81% 125,092 40.25% 59,017 18.99% 17,444 5.61% 41,449 13.34%
Source: U.S. Census Bureau, American Fact Finder, 2008-2012 American Community Survey 5-Year Estimates (Report B15003)

Institutional Fact Book
Tennessee and Ten-County Area 47
Population by Gender 5-Year Estimates (2008-2012)
Population Male Female
TENNESSEE 6,353,226 3,097,568 3,255,658
County
Claiborne 32,025 15,725 16,300
Cocke 35,631 17,310 18,321
Grainger 22,613 11,249 11,364
Greene 68,755 33,752 34,003
Hamblen 62,528 30,268 32,260
Hancock 6,759 3,357 3,402
Hawkins 56,725 27,775 28,950
Jefferson 51,541 25,343 26,198
Sevier 90,218 44,410 45,808
Union 19,179 9,556 9,623
Source: U. S. Census Bureau, American Fact Finder, 2008-2012 American Community Survey 5-Year Estimates (Report B01001)

Institutional Fact Book
Tennessee and Ten-County Area 48
Population by Age
5-Year Estimates (2008-2012)
Total Under 5
Years 5 – 19 Years
20 – 24 Years
25 – 44 Years
45 – 64 Years
65 – 84 Years
85 Years &
Over
TENNESSEE 6,353,226 406,033 1,263,875 432,428 1,684,792 1,704,679 761,832 99,587
County
Claiborne 32,025 1622 5,890 2,150 7,964 9,227 4,714 458
Cocke 35,631 2,012 6,397 1,824 8,655 10,755 5,479 509
Grainger 22,613 1,292 4,220 1,176 5,603 6,698 3,244 380
Greene 68,755 3,670 12,609 3,883 16,525 20,007 11,017 1,044
Hamblen 62,528 3,835 12,259 3,609 16,245 16,512 8,911 1,157
Hancock 6,759 385 1,136 422 1,588 2,073 1,019 136
Hawkins 56,725 3,140 10,677 2,792 14,040 16,512 8,641 923
Jefferson 51,541 2,849 10,241 3,357 12,143 14,527 7,678 746
Sevier 90,218 5,333 16,814 5,416 22,300 26,355 12,843 1,157
Union 19,179 1,215 3,847 1,128 4,710 5,588 2,476 215
Source: U. S. Census Bureau, American Fact Finder, 2008-2012 American Community Survey 5-Year Estimates (Report B01001)

Institutional Fact Book
Tennessee and Ten-County Area 49
2012 Population by Race 5-Year Estimates
Tennessee Claiborne Cocke Grainger Greene Hamblen Hancock Hawkins Jefferson Sevier Union
Total Population 6,353,226 32,025 35,631 22,613 68,755 62,528 6,759 56,725 51,541 90,218 19,179
Race
White 4,982,977 31,068 33,686 21,910 65,771 57,361 6,620 54,790 49,049 86,458 19,043
Black or African American
1,060,494 282 620 115 1,561 2,638 20 773 1,354 622 11
American Indian and Alaska Native
15,991 50 44 2 95 122 8 300 122 259 6
Asian 92,800 214 116 1 272 435 17 273 10 929 11
Native Hawaiian and Other Pacific Islander
2,765 0 0 0 20 59 0 0 0 13 26
Some other race 88,272 4 473 264 362 1,026 0 240 182 801 15
Two or more races 109,927 389 692 321 674 887 94 349 824 1,136 67
Source: U. S. Census Bureau, American Fact Finder, 2008-2012 American Community Survey 5-Year Estimates (Report B02001)
2012 Income per Capita, Median Family, and Median Household 5-Year Estimates
Tennessee Claiborne Cocke Grainger Greene Hamblen Hancock Hawkins Jefferson Sevier Union
Per Capita Income $24,294 $18,591 $16,975 $17,819 $19,772 $21,114 $13,879 $20,432 $19,713 $22,355 $17,137 Median Family Income $54,737 $43,886 $40,026 $39,437 $43,427 $49,670 $30,291 $44,611 $48,168 $50,008 $41,065
Median Household Income $44,140 $33,568 $29,764 $33,185 $35,613 $39,316 $22,205 $36,419 $38,800 $43,300 $33,456
Source: U. S. Census Bureau, American Fact Finder, 2008-2012 American Community Survey 5-Year Estimates (Reports B19301, B19113, & B19013)

Institutional Fact Book
Tennessee and Ten-County Area 50
Market Penetration Rate of Community Colleges in Tennessee

Institutional Fact Book
Tennessee and Ten-County Area 51
Institutional Fact Book
Tennessee and Ten-County Area 52

Institutional Fact Book
Tennessee and Ten-County Area 53

Institutional Fact Book
Tennessee and Ten-County Area 54

Institutional Fact Book
Tennessee and Ten-County Area 55

Institutional Fact Book
Tennessee and Ten-County Area 56

Institutional Fact Book
Tennessee and Ten-County Area 57

Institutional Fact Book
Tennessee and Ten-County Area 58

Institutional Fact Book
Tennessee and Ten-County Area 59

Institutional Fact Book
Tennessee and Ten-County Area 60
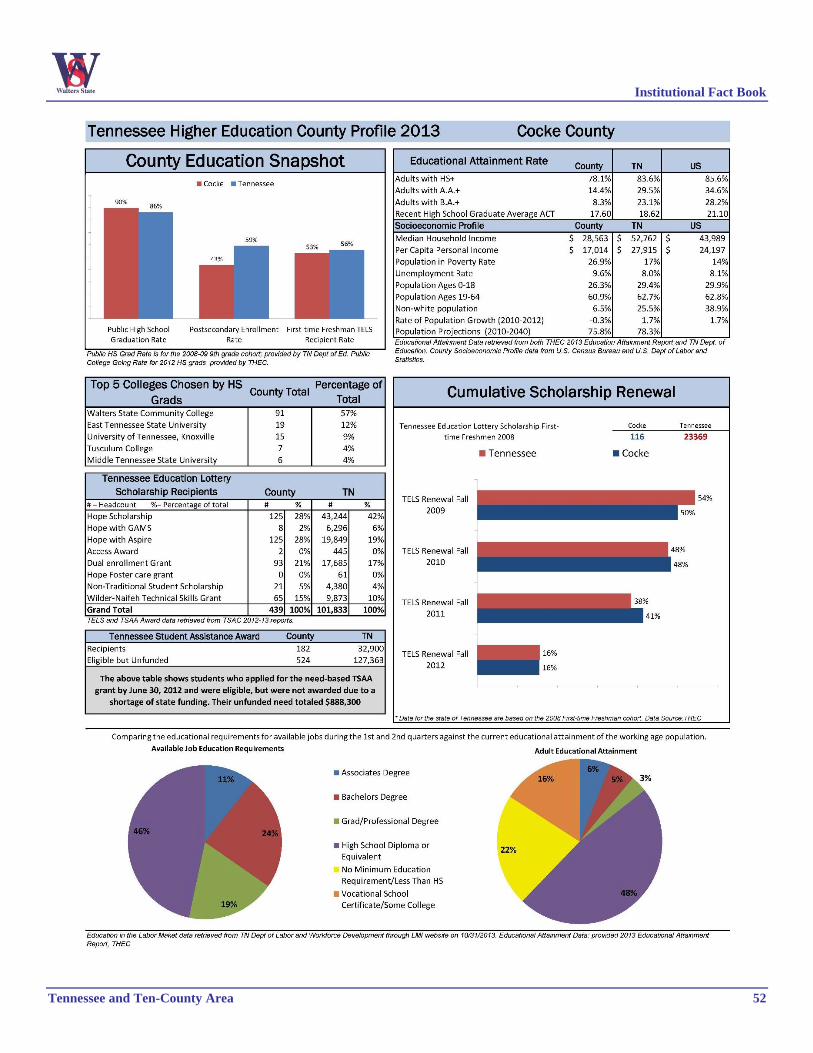
Source: Tennessee Higher Education 2012 Legislative Reports – Higher Education County Profiles

Institutional Fact Book
Tennessee and Ten-County Area 61
Claiborne Co | Population
32,663 1.9%
2014 Population Population Growth for the Last 5 Years
0.5% of State State Growth 4.4%
2014 Age Demographics
Age 2014
Population 2014 Percent
● Under 20 years 7,379 22.6%
● 20 to 39 years 7,967 24.4%
● 40 to 59 years 9,039 27.7%
● 60 to 79 years 7,114 21.8%
● 80 years and over 1,164 3.6%
2014 Educational Attainment
Education Level 2014
Population 2014 Percent
● Less Than 9th Grade 3,079 13.4%
● 9th Grade to 12th Grade 4,115 17.9%
● High School Diploma 9,581 41.7%
● Some College 2,920 12.7%
● Associate's Degree 951 4.1%
● Bachelor's Degree 1,403 6.1%
● Graduate Degree and Higher 942 4.1%
2014 Race Demographics
Race 2014
Population 2014 Percent
● All Other Races 325 1.0%
● White, Hispanic 277 0.8%
● Black, Non-Hispanic 372 1.1%
● Two or More Races, Non-Hispanic 390 1.2%
● White, Non-Hispanic 31,300 95.8%

Institutional Fact Book
Tennessee and Ten-County Area 62
Cocke Co. | Population
35,854 0.1%
2014 Population Population Growth for the Last 5 Years
0.5% of State State Growth 4.4%
2014 Age Demographics
Age 2014
Population 2014 Percent
● Under 20 years 8,223 22.9%
● 20 to 39 years 7,509 20.9%
● 40 to 59 years 10,475 29.2%
● 60 to 79 years 8,289 23.1%
● 80 years and over 1,358 3.8%
2014 Educational Attainment
Education Level 2014
Population 2014 Percent
● Less Than 9th Grade 2,317 9.0%
● 9th Grade to 12th Grade 4,958 19.3%
● High School Diploma 11,086 43.1%
● Some College 4,229 16.4%
● Associate's Degree 1,350 5.2%
● Bachelor's Degree 1,082 4.2%
● Graduate Degree and Higher 729 2.8%
2014 Race Demographics
Race 2014
Population 2014 Percent
● All Other Races 428 1.2%
● Two or More Races, Non-Hispanic 547 1.5%
● White, Hispanic 591 1.6%
● Black, Non-Hispanic 778 2.2%
● White, Non-Hispanic 33,510 93.5%

Institutional Fact Book
Tennessee and Ten-County Area 63
Grainger Co. | Population
23,218 3.1%
2014 Population Population Growth for the Last 5 Years
0.4% of State State Growth 4.4%
2014 Age Demographics
Age 2014
Population 2014 Percent
● Under 20 years 5,494 23.7%
● 20 to 39 years 4,899 21.1%
● 40 to 59 years 6,813 29.3%
● 60 to 79 years 5,256 22.6%
● 80 years and over 756 3.3%
2014 Educational Attainment
● Less Than 9th Grade 1,625 9.9%
● 9th Grade to 12th Grade 3,760 22.9%
● High School Diploma 6,820 41.5%
● Some College 2,341 14.2%
● Associate's Degree 787 4.8%
● Bachelor's Degree 792 4.8%
● Graduate Degree and Higher 321 2.0%
2014 Race Demographics
Race 2014
Population 2014 Percent
● All Other Races 146 0.6%
● Black, Non-Hispanic 177 0.8%
● Two or More Races, Non-Hispanic 235 1.0%
● White, Hispanic 563 2.4%
● White, Non-Hispanic 22,097 95.2%
Race % of Population (2013)

Institutional Fact Book
Tennessee and Ten-County Area 64
Greene Co. | Population
70,626 2.7%
2014 Population Population Growth for the Last 5 Years
1.1% of State State Growth 4.4%
2014 Age Demographics
Age 2014
Population 2014 Percent
● Under 20 years 16,269 23.0%
● 20 to 39 years 15,508 22.0%
● 40 to 59 years 19,943 28.2%
● 60 to 79 years 15,937 22.6%
● 80 years and over 2,969 4.2%
2014 Educational Attainment
Education Level 2014
Population 2014 Percent
● Less Than 9th Grade 3,585 7.1%
● 9th Grade to 12th Grade 7,877 15.7%
● High School Diploma 19,315 38.4%
● Some College 8,900 17.7%
● Associate's Degree 2,273 4.5%
● Bachelor's Degree 4,682 9.3%
● Graduate Degree and Higher 3,646 7.3%
2014 Race Demographics
Race 2014
Population 2014 Percent
● All Other Races 650 0.9%
● Two or More Races, Non-Hispanic 771 1.1%
● Black, Non-Hispanic 1,573 2.2%
● White, Hispanic 1,895 2.7%
● White, Non-Hispanic 65,737 93.1%

Institutional Fact Book
Tennessee and Ten-County Area 65
Hamblen Co. | Population
64,388 3.3%
2014 Population Population Growth for the Last 5 Years
1.0% of State State Growth 4.4%
2014 Age Demographics
Age 2014
Population 2014 Percent
● Under 20 years 16,814 26.1%
● 20 to 39 years 15,172 23.6%
● 40 to 59 years 17,171 26.7%
● 60 to 79 years 12,597 19.6%
● 80 years and over 2,634 4.1%
2014 Educational Attainment
Education Level 2014
Population 2014 Percent
● Less Than 9th Grade 2,643 6.0%
● 9th Grade to 12th Grade 7,988 18.2%
● High School Diploma 15,150 34.5%
● Some College 8,221 18.7%
● Associate's Degree 2,681 6.1%
● Bachelor's Degree 4,234 9.6%
● Graduate Degree and Higher 3,009 6.9%
2014 Race Demographics
Race 2014
Population 2014 Percent
● All Other Races 1,816 2.8%
● Two or More Races, Non-Hispanic 1,080 1.7%
● Black, Non-Hispanic 2,654 4.1%
● White, Hispanic 6,703 10.4%
● White, Non-Hispanic 52,136 81.0%

Institutional Fact Book
Tennessee and Ten-County Area 66
Hancock Co. | Population
6,743 -0.4%
2014 Population Population Growth for the Last 5 Years
0.1% of State State Growth 4.5%
2014 Age Demographics
Age 2014
Population 2014 Percent
● Under 20 years 1,580 23.4%
● 20 to 39 years 1,490 22.1%
● 40 to 59 years 1,854 27.5%
● 60 to 79 years 1,570 23.3%
● 80 years and over 248 3.7%
2014 Educational Attainment
Education Level 2014
Population 2014 Percent
● Less Than 9th Grade 880 18.2%
● 9th Grade to 12th Grade 747 15.5%
● High School Diploma 2,045 42.3%
● Some College 699 14.5%
● Associate's Degree 60 1.3%
● Bachelor's Degree 205 4.2%
● Graduate Degree and Higher 196 4.0%
2014 Race Demographics
Race 2014
Population 2014 Percent
● All Other Races 28 0.4%
● White, Hispanic 27 0.4%
● Black, Non-Hispanic 33 0.5%
● Two or More Races, Non-Hispanic 83 1.2%
● White, Non-Hispanic 6,571 97.5%

Institutional Fact Book
Tennessee and Ten-County Area 67
Hawkins Co. | Population
57,171 0.6%
2014 Population Population Growth for the Last 5 Years
0.9% of State State Growth 4.4%
2014 Age Demographics
Age 2014
Population 2014 Percent
● Under 20 years 13,331 23.3%
● 20 to 39 years 12,109 21.2%
● 40 to 59 years 16,752 29.3%
● 60 to 79 years 12,730 22.3%
● 80 years and over 2,249 3.9%
2014 Educational Attainment
Education Level 2014
Population 2014 Percent
● Less Than 9th Grade 3,021 7.4%
● 9th Grade to 12th Grade 5,571 13.6%
● High School Diploma 16,965 41.4%
● Some College 8,044 19.6%
● Associate's Degree 2,154 5.3%
● Bachelor's Degree 3,640 8.9%
● Graduate Degree and Higher 1,542 3.8%
2014 Race Demographics
Race 2014
Population 2014 Percent
● All Other Races 552 1.0%
● Two or More Races, Non-Hispanic 643 1.1%
● White, Hispanic 704 1.2%
● Black, Non-Hispanic 908 1.6%
● White, Non-Hispanic 54,362 95.1%

Institutional Fact Book
Tennessee and Ten-County Area 68
Jefferson Co. | Population
53,050 3.4%
2014 Population Population Growth for the Last 5 Years
0.8% of State State Growth 4.4%
2014 Age Demographics
Age 2014
Population 2014 Percent
● Under 20 years 12,899 24.3%
● 20 to 39 years 12,031 22.7%
● 40 to 59 years 14,725 27.8%
● 60 to 79 years 11,573 21.8%
● 80 years and over 1,823 3.4%
2014 Educational Attainment
Education Level 2014
Population 2014 Percent
● Less Than 9th Grade 1,934 5.3%
● 9th Grade to 12th Grade 6,555 17.9%
● High School Diploma 12,689 34.7%
● Some College 7,771 21.2%
● Associate's Degree 2,667 7.3%
● Bachelor's Degree 3,235 8.8%
● Graduate Degree and Higher 1,749 4.8%
2014 Race Demographics
Race 2014
Population 2014 Percent
● All Other Races 675 1.3%
● Two or More Races, Non-Hispanic 657 1.2%
● Black, Non-Hispanic 1,252 2.4%
● White, Hispanic 1,751 3.3%
● White, Non-Hispanic 48,714 91.8%

Institutional Fact Book
Tennessee and Ten-County Area 69
Sevier Co. | Population
95,687 7.4%
2014 Population Population Growth for the Last 5 Years
1.5% of State State Growth 4.4%
2014 Age Demographics
Age 2014
Population 2014 Percent
● Under 20 years 22,880 23.9%
● 20 to 39 years 22,469 23.5%
● 40 to 59 years 26,817 28.0%
● 60 to 79 years 20,202 21.1%
● 80 years and over 3,319 3.5%
2014 Educational Attainment
Education Level 2014
Population 2014 Percent
● Less Than 9th Grade 2,328 3.5%
● 9th Grade to 12th Grade 9,323 13.9%
● High School Diploma 25,909 38.6%
● Some College 15,659 23.3%
● Associate's Degree 4,427 6.6%
● Bachelor's Degree 5,363 8.0%
● Graduate Degree and Higher 4,190 6.2%
2014 Race Demographics
Race 2014
Population 2014 Percent
● All Other Races 1,913 2.0%
● Two or More Races, Non-Hispanic 1,041 1.1%
● Black, Non-Hispanic 1,128 1.2%
● White, Hispanic 5,299 5.5%
● White, Non-Hispanic 86,306 90.2%

Institutional Fact Book
Tennessee and Ten-County Area 70
Union Co. | Population
19,360 0.7%
2014 Population Population Growth for the Last 5 Years
0.3% of State State Growth 4.4%
2014 Age Demographics
Age 2014
Population 2014 Percent
● Under 20 years 4,973 25.7%
● 20 to 39 years 4,401 22.7%
● 40 to 59 years 5,552 28.7%
● 60 to 79 years 3,863 20.0%
● 80 years and over 571 2.9%
2014 Educational Attainment
Education Level 2014
Population 2014 Percent
● Less Than 9th Grade 2,175 16.3%
● 9th Grade to 12th Grade 2,830 21.3%
● High School Diploma 5,295 39.8%
● Some College 1,595 12.0%
● Associate's Degree 599 4.5%
● Bachelor's Degree 523 3.9%
● Graduate Degree and Higher 296 2.2%
2014 Race Demographics
Race 2014
Population 2014 Percent
● All Other Races 156 0.8%
● Black, Non-Hispanic 97 0.5%
● White, Hispanic 257 1.3%
● Two or More Races, Non-Hispanic 262 1.4%
● White, Non-Hispanic 18,587 96.0%
Source: EMSI Analyst Economy Overview

Institutional Fact Book
Additional Resources 71
Additional Resources
TBR Website www.tbr.edu Tennessee Colleges of Applied Technology Webpage http://tbr.edu/offices/tennesseetechnologycenters.aspx?id=322
Tennessee’s Community Colleges Webpage http://www.tncommunitycolleges.org/
Tennessee Higher Education Institutions http://www.tn.gov/thec/Index/Community/Community.html
THEC 2013-2014 Fact Book http://www.tn.gov/thec/Legislative/Reports/2014/2013-2014%20FactbookSUPPRESSED.pdf
THEC Articulation & Transfer Report 2013 http://www.tn.gov/thec/Legislative/Reports/2013/Articulation_&_Transfer_Report_2013.pdf THEC Center for Business and Economic Research http://thec.ppr.tn.gov/THECSIS/CBERTHECReports/CBERReports.aspx
THEC Legislative Reports http://www.state.tn.us/thec/Legislative/Reports.html
Office of Planning, Research and Assessment Intranet Page WSCC Policies & Procedures intranet.ws.edu

Institutional Fact Book
Additional Resources 72