August 01, 2014 Institutional Equities ICICI Bank India ...
7
Banking August 01, 2014 ICICI Bank Bloomberg: ICICIBC IN Reuters: ICBK.BO BUY Institutional Equities India Research RESULT REVIEW Recommendation CMP: Rs1,471 Target Price: Rs1,800 Upside (%) 22% Stock Information Market Cap. (Rs bn / US$ mn) 1,701/28,100 52-week High/Low (Rs) 1,593/757 3m ADV (Rs mn /US$ mn) 4,942/81.6 Beta 1.5 Sensex/ Nifty 25,895/7,721 Share outstanding (mn) 1,156 Stock Performance (%) 1M 3M 12M YTD Absolute 3.7 18.3 61.8 33.9 Rel. to Sensex 1.8 2.4 20.9 9.5 Performance Source: Bloomberg Click here to enter text. Analysts Contact Asutosh Kumar Mishra, CFA 022-6184 4329 [email protected] 600 800 1,000 1,200 1,400 1,600 15,500 17,500 19,500 21,500 23,500 25,500 27,500 Aug-13 Sep-13 Oct-13 Nov-13 Jan-14 Feb-14 Mar-14 May-14 Jun-14 Jul-14 Sensex (LHS) ICICI Bank (RHS) Assets quality to improve further ICICI Bank profits stood in line with our estimates primarily on account of higher than expected other income growth along with healthy NII growth. Substantial growth in the bank’s non interest income was on account of repatriation of Rs1.03bn of foreign exchange gain on retained profits from the overseas operations. NIM’s for the bank improved sequentially by 5bps to 3.40% during Q1FY15 as the benefits of the FCNR (B) related business, started to kick in. Cost to income ratio of the bank deteriorated sequentially owing to sharp rise in employee costs primarily on account of one time payouts. Provisioning expenses inched marginally higher on account of relatively high fresh NPL’s. Asset quality remain stable: Asset quality continued to remain stable despite higher fresh NPL’s (at Rs11.95bn v/s Rs12.4bn in Q4FY14 and Rs11.2bn in Q1FY14) as GNPA and NNPA ratio were at 3.05% and 0.99% against 3.10% and 0.97% in Q4FY14. Increases in fresh NPL’s were primarily from the mid- corporate and the SME segments. The bank restructured loans worth Rs13.9bn culminating to gross restructured advances at 3.25% of the loan book. Restructuring pipeline of the bank stood at Rs15bn indicating declining in restructuring volume. Despite the relatively higher NPLs and loan restructuring, bank’s asset quality remained within comfort zone. Management indicated that asset quality would improve going forward led by the improvement in economic sentiments. Outlook & Valuation: ICICI Bank is well placed to capitalise on the expected improvement in the economic cycle. The bank continues to demonstrate robust performance on all major fronts despite the challenging economic environment. Considering the banks’ consistent improvement in operational performance and reasonable valuation, the stock should gain higher traction among investor. We recommend Buy, with a SOTP TP of Rs1800, wherein the standalone bank has been valued at 2x FY16E Adj. BV of Rs814 (Rs1,627/share) and the subsidiaries fetch Rs173/share after deducting holding company discount of 20%. Key Financials (Standalone) Y/E Mar (Rs mn) FY12 FY13 FY14 FY15E FY16E Net Interest Income 107,342 138,664 164,756 193,955 225,872 Other Income 75,028 83,457 104,279 124,095 146,054 Pre-Provision Profit 103,865 131,992 165,946 194,230 227,644 PAT 64,653 83,255 98,105 116,000 140,731 EPS (Rs) 56.09 72.17 84.94 100.43 121.84 ABV (Rs) 516 569 620 692 814 P/E (x) 16.59 20.41 17.34 14.67 12.09 P/ABV (x) 1.83 2.64 2.43 2.17 1.84 Gross NPA (%) 3.73 3.31 3.10 3.02 2.80 Net NPA (%) 0.73 0.77 0.97 1.05 1.01 Avg. ROA (%) 1.44 1.62 1.73 1.83 1.94 Avg. ROE (%) 10.70 12.48 13.40 14.22 14.72 Source: Company, Karvy Institutional Research
Transcript of August 01, 2014 Institutional Equities ICICI Bank India ...
Banking August 01, 2014
ICICI Bank
Bloomberg: ICICIBC IN Reuters: ICBK.BO
BUY
Institutional Equities
India Research
RESULT REVIEW
Recommendation
CMP: Rs1,471
Target Price: Rs1,800
Upside (%) 22%
Stock Information Market Cap. (Rs bn / US$ mn) 1,701/28,100
52-week High/Low (Rs) 1,593/757
3m ADV (Rs mn /US$ mn) 4,942/81.6
Beta 1.5
Sensex/ Nifty 25,895/7,721
Share outstanding (mn) 1,156
Stock Performance (%) 1M 3M 12M YTD
Absolute 3.7 18.3 61.8 33.9
Rel. to Sensex 1.8 2.4 20.9 9.5
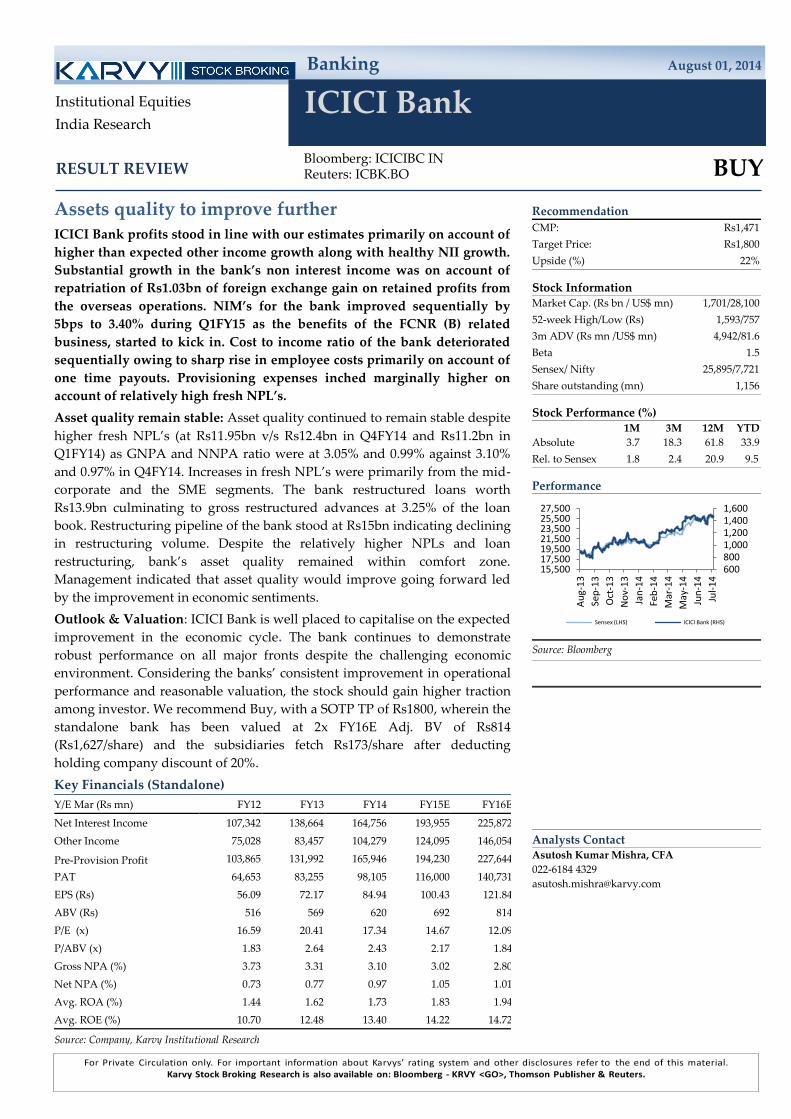
Performance
Source: Bloomberg
Click here to enter text.
Analysts Contact Asutosh Kumar Mishra, CFA
022-6184 4329
600 800 1,000 1,200 1,400 1,600
15,500 17,500 19,500 21,500 23,500 25,500 27,500
Au
g-1
3
Sep
-13
Oct
-13
No
v-1
3
Jan
-14
Feb
-14
Mar
-14
May
-14
Jun
-14
Jul-
14
Sensex (LHS) ICICI Bank (RHS)
Assets quality to improve further ICICI Bank profits stood in line with our estimates primarily on account of
higher than expected other income growth along with healthy NII growth.
Substantial growth in the bank’s non interest income was on account of
repatriation of Rs1.03bn of foreign exchange gain on retained profits from
the overseas operations. NIM’s for the bank improved sequentially by
5bps to 3.40% during Q1FY15 as the benefits of the FCNR (B) related
business, started to kick in. Cost to income ratio of the bank deteriorated
sequentially owing to sharp rise in employee costs primarily on account of
one time payouts. Provisioning expenses inched marginally higher on
account of relatively high fresh NPL’s.
Asset quality remain stable: Asset quality continued to remain stable despite
higher fresh NPL’s (at Rs11.95bn v/s Rs12.4bn in Q4FY14 and Rs11.2bn in
Q1FY14) as GNPA and NNPA ratio were at 3.05% and 0.99% against 3.10%
and 0.97% in Q4FY14. Increases in fresh NPL’s were primarily from the mid-
corporate and the SME segments. The bank restructured loans worth
Rs13.9bn culminating to gross restructured advances at 3.25% of the loan
book. Restructuring pipeline of the bank stood at Rs15bn indicating declining
in restructuring volume. Despite the relatively higher NPLs and loan
restructuring, bank’s asset quality remained within comfort zone.
Management indicated that asset quality would improve going forward led
by the improvement in economic sentiments.
Outlook & Valuation: ICICI Bank is well placed to capitalise on the expected
improvement in the economic cycle. The bank continues to demonstrate
robust performance on all major fronts despite the challenging economic
environment. Considering the banks’ consistent improvement in operational
performance and reasonable valuation, the stock should gain higher traction
among investor. We recommend Buy, with a SOTP TP of Rs1800, wherein the
standalone bank has been valued at 2x FY16E Adj. BV of Rs814
(Rs1,627/share) and the subsidiaries fetch Rs173/share after deducting
holding company discount of 20%.
Key Financials (Standalone)
Y/E Mar (Rs mn) FY12 FY13 FY14 FY15E FY16E
Net Interest Income 107,342 138,664 164,756 193,955 225,872
Other Income 75,028 83,457 104,279 124,095 146,054
Pre-Provision Profit 103,865 131,992 165,946 194,230 227,644
PAT 64,653 83,255 98,105 116,000 140,731
EPS (Rs) 56.09 72.17 84.94 100.43 121.84
ABV (Rs) 516 569 620 692 814
P/E (x) 16.59 20.41 17.34 14.67 12.09
P/ABV (x) 1.83 2.64 2.43 2.17 1.84
Gross NPA (%) 3.73 3.31 3.10 3.02 2.80
Net NPA (%) 0.73 0.77 0.97 1.05 1.01
Avg. ROA (%) 1.44 1.62 1.73 1.83 1.94
Avg. ROE (%) 10.70 12.48 13.40 14.22 14.72
Source: Company, Karvy Institutional Research

2
August 01, 2014
ICICI Bank
Exhibit 1: Income Statement Analysis
(Rs mn) 1Q FY14 2Q FY14 3Q FY14 4Q FY14 1Q FY15 yoy % qoq %
Interest on Advance 71,956 77,369 82,238 82,716 83,922 16.63 1.46
YoA - Calculated (%) 9.73 10.00 10.12 9.86 9.79 6 (7)
Income on Investment 28,846 28,391 29,222 29,112 29,772 3.21 2.27
Interest on Balances 577 470 336 616 493 (14.62) (20.04)
Others Interests 2,827 1,903 2,753 2,449 3,483 23.19 42.22
Interest Earned 104,207 108,133 114,550 114,893 117,669 12.92 2.42
Interest Expended 66,002 67,698 71,999 71,327 72,750 10.22 1.99
CoF - Calculated (%) 5.17 5.18 5.39 5.18 5.21 4 3
Net Interest Income 38,205 40,435 42,551 43,565 44,919 17.57 3.11
NIM - Calculated (%) 3.10 3.23 3.31 3.27 3.30 20 3
NIM - Reported (%) 3.27 3.31 3.32 3.35 3.40 13 5
NII as % of Oper. Income 60.60 65.11 60.30 59.41 61.18 59 177
Core Fee Income 17,930 19,940 19,970 19,740 19,360 7.98 (1.93)
Fee Inc. as % of OI 28.44 32.11 28.30 26.92 26.37 (207) (55)
Non Core Fee Income 6,913 1,725 8,040 10,021 9,138 32.19 (8.81)
Non core fee Inc. as % of OI 10.96 2.78 11.39 13.67 12.45 148 (122)
Total Other Income 24,843 21,665 28,010 29,761 28,498 14.71 (4.24)
Other Inc. as % of OI 39.40 34.89 39.70 40.59 38.82 (59) (177)
Operating Income (OI) 63,048 62,100 70,561 73,326 73,417 16.45 0.12
Core Operating Income 56,135 60,375 62,521 63,305 64,279 14.51 1.54
Employees Expenses 10,894 8,716 9,969 12,623 12,469 14.45 (1.22)
Employees Expn. as % of OI 17.28 14.03 14.13 17.21 16.98 (30) (23)
Other Operating Expenses 14,012 14,506 16,202 16,169 15,781 12.63 (2.40)
Other Opert Exp. as % of OI 22.22 23.36 22.96 22.05 21.50 (73) (55)
Total Operating Expenses 24,906 23,221 26,170 28,791 28,250 13.43 (1.88)
Cost to income Ratio (%) 39.50 37.39 37.09 39.26 38.48 3,926 218
Operating Profit (OP) 38,142 38,879 44,390 44,535 45,167 18.42 1.42
Provisions and Conting. 5,932 6,248 6,946 7,138 7,261 22.40 1.72
Pro Burden as % of OP 15.55 16.07 15.65 16.03 16.08 52 5
Profit Before Tax 32,210 32,631 37,444 37,397 37,906 17.69 1.36
Tax Expenses 9,468 9,110 12,122 10,877 11,353 19.92 4.38
Effective Tax Rate (%) 29.39 27.92 32.37 29.09 29.95 56 87
Net Profit 22,742 23,521 25,322 26,520 26,553 16.76 0.12
EPS 19.71 20.37 21.93 22.96 22.99 16.61 0.12
Source: Company, Karvy Institutional Research
Sturdy profit growth: Reported profits continued to trend higher as the bank yet
again delivers on all operating metrics. PAT for Q1FY15 came in higher at
Rs26.6bn (+16.8% yoy; +0.12% qoq) primarily on account of strong growth in NII
and non-interest income. NII for 1Q was Rs44.9bn (+17.6% yoy; +3.1% qoq) led by
the growth in advances along with improvement in NIM’s to 3.40%. Sequential
growth in non-interest income (at Rs28.5bn, +14.7% yoy and -4.24% qoq) was
primarily driven by the growth in non-core fee income. Non-core fee income was
higher on account of profits from the bank’s treasury operations and repatriation
of income from overseas subsidiaries.
Business growth remains healthy: Business environment for the bank continued
to remain sanguine. Yoy growth in deposits and advances was 15.2% and 15.3%
respectively. The growth in advances was primarily driven by retail business
while that in deposits by CASA deposits. CASA ratio of the bank stood
sequentially flat at 43%.

3
August 01, 2014
ICICI Bank
Exhibit 2: Loan Book Analysis
(Rs bn) 1Q FY14 2Q FY14 3Q FY14 4Q FY14 1Q FY15 yoy % qoq %
Retail 1,084,933 1,150,386 1,220,760 1,320,940 1,374,516 26.7 4.1
Domestic Corporate 979,453 1,035,983 1,047,791 1,019,495 1,055,184 7.7 3.5
SME 138,630 146,182 143,032 149,029 152,724 10.2
Overseas 810,686 845,311 914,738 897,562 888,576 9.6 (1.0)
Source: Company, Karvy Institutional Research
Exhibit 3: Loan Book Analysis (% Break Up)
(%) 1Q FY14 2Q FY14 3Q FY14 4Q FY14 1Q FY15 yoy (bps) qoq (bps)
Retail 36.0 36.2 36.7 39.0 39.6 360 60
Domestic Corporate 32.5 32.6 31.5 30.1 30.4 (210) 30
SME 4.6 4.6 4.3 4.4 4.4 (20) 0
Overseas 26.9 26.6 27.5 26.5 25.6 (130) (90)
Source: Company, Karvy Institutional Research
Exhibit 4: Balance Sheet Analysis
(Rs bn) 1Q FY14 2Q FY14 3Q FY14 4Q FY14 1Q FY15 yoy % qoq %
Net Worth 700.7 731.0 740.5 732.1 758.9 8.30 3.67
Deposit 2,912 3,090 3,170 3,319 3,358 15.31 1.16
Savings Deposits 889 935 957 931 1,027 15.62 10.31
- Current Deposits 370 404 414 432 417 12.70 (3.62)
- CASA Deposit 1,171 1,339 1,372 1,364 1,444 23.28 5.89
- Term Deposit 1,740 1,751 1,798 1,955 1,914 9.95 (2.14)
Investments 1,746 1,688 1,720 1,770 1,702 (2.56) (3.88)
Advances 3,014 3,178 3,326 3,387 3,471 15.16 2.47
Total Business 7,672 7,957 8,216 8,476 8,530 11.18 0.63
Avg Int. Earning Assets
(as per Reported NIM) 4,673 4,886 5,127 5,202 5,285 13.08 1.59
Risk Weighted Assets (Rs mn) 4,811 4,971 5,019 4,986 5,184 7.75 3.97
CAR (%) 17.04 16.50 16.81 17.70 17.00 (4) (70)
Tier I Capital (%) 11.72 11.33 11.53 12.78 12.23 51 (55)
Source: Company, Karvy Institutional Research* as per Basel III
Exhibit 5: Asset Quality Analysis
1Q FY14 2Q FY14 3Q FY14 4Q FY14 1Q FY15 yoy % qoq %
Gross Non Performing Assets 100,094 100,285 103,991 105,058 108,433 8.33 3.21
Fresh Slippages 11,160 11,450 12,300 12,410 11,950 7.08 (3.71)
Net Non Performing Assets 24,628 26,976 31,184 32,980 34,285 39.21 3.96
GNP Ratio (%) 3.23 3.08 3.05 3.10 3.05 (18) (5)
NNP Ratio (%) 0.82 0.85 0.94 0.97 0.99 17 2
NPA Coverage Ratio 75.40 73.10 70.01 68.61 68.38 (701) (23)
Restructured Gross Loans 59,150 68,260 86,320 116,500 112,650 90.45 (3.30)
Restructured Loan as % of Adv. 2.57 2.78 2.60 3.44 3.25 67.65 (19.38)
Source: Company, Karvy Institutional Research

4
August 01, 2014
ICICI Bank
Financials Exhibit 6: Income Statement
Y/E March (Rs mn) FY12 FY13 FY14 FY15E FY16E
Interest Earned 335,427 400,756 441,782 498,869 567,165
Interest Expenditure 228,085 262,092 277,026 304,913 341,293
Net Interest Income 107,342 138,664 164,756 193,955 225,872
Fee Income 54,351 54,617 63,461 80,182 92,457
Non Fee Income 20,676 28,840 40,817 43,913 53,597
Other Income 75,028 83,457 104,279 124,095 146,054
Net Operating Income 182,369 222,121 269,034 318,050 371,926
Core Operating Income 161,693 193,281 228,217 274,138 318,329
Employee Expenses 35,153 38,933 42,201 48,320 55,568
Other Expenses 43,352 51,196 60,888 75,501 88,713
Operating Expenses 78,504 90,129 103,089 123,821 144,281
Operating Profit 103,865 131,992 165,946 194,230 227,644
Provisions and Contingencies 15,830 18,025 26,264 24,886 23,687
Profit Before Tax 88,034 113,967 139,682 169,344 203,958
Taxes 23,382 30,712 41,577 53,343 63,227
Profit After Tax 64,653 83,255 98,105 116,000 140,731
Source: Company, Karvy Institutional Research
Exhibit 7: Balance Sheet
Y/E March (Rs mn) FY12 FY13 FY14 FY15E FY16E
Capital & Liabilities
Capital 11,528 11,536 11,550 11,550 11,550
Reserves Total 592,501 655,478 720,517 804,029 944,759
Net Worth 604,029 667,015 732,068 815,579 956,310
Deposits 2,555,000 2,926,136 3,319,137 3,825,305 4,427,790
Current deposits 349,731 369,255 432,454 497,290 597,752
Saving deposits 760,463 856,507 991,330 1,090,212 1,261,920
Term Deposits 1,444,806 1,700,374 1,895,352 2,237,803 2,568,118
Borrowings 1,401,649 1,453,415 1,547,591 1,677,614 1,821,188
Other Liabilities & Provisions 329,987 321,336 347,555 407,538 545,592
Total Liabilities 4,890,688 5,367,947 5,946,396 6,726,101 7,750,946
Assets
Cash & Cash Equivalents 362,293 414,175 415,296 465,255 531,296
Investments 1,595,600 1,713,936 1,770,218 1,912,102 2,181,764
Advances 2,537,277 2,902,494 3,387,026 3,928,951 4,577,228
Fixed Assets 46,147 46,471 46,781 51,812 54,040
Other Assets 349,371 290,871 327,094 367,981 406,619
Total Assets 4,890,688 5,367,947 5,946,416 6,726,101 7,750,946
Risk Weight Assets 4,414,889 5,018,830 4,986,029 5,929,335 7,034,723
Source: Company, Karvy Institutional Research

5
August 01, 2014
ICICI Bank
Exhibit 8: Key Ratios
FY12 FY13 FY14 FY15E FY16E
Growth Ratio (%)
Net interest Income 19.0 29.2 18.8 17.7 16.5
Other Income 12.9 11.2 24.9 19.0 17.7
Operating Profit 14.8 27.1 25.7 17.0 17.2
Provisions Expense (30.8) 13.9 45.7 (5.2) (4.8)
PAT 25.5 28.8 17.8 18.2 21.3
Deposits 13.3 14.5 13.4 15.3 15.8
Advances 17.3 14.4 16.7 16.0 16.5
Risk Weighted Assets 11.4 13.7 (0.7) 18.9 18.6
Yields / Margins (%)
Cost of Funds (CoF) 5.39 5.46 5.20 5.12 5.05
Yield on Advance 9.42 10.05 9.99 9.95 9.85
Yield on funds 8.28 8.62 8.53 8.61 8.55
Net Interest Margin (NIM) 2.65 2.98 3.18 3.35 3.41
Balance Sheet Ratio
Credit / Deposit Ratio 99.31 99.19 102.05 102.71 103.37
Incremental C/D Ratio 124.96 98.41 123.29 107.06 107.60
Investment-Deposit Ratio 62.45 58.57 53.33 49.99 49.27
CASA Ratio 43.45 41.89 42.90 41.50 42.00
Asset Quality (%)
Gross NPA/Gross Advances 3.73 3.31 3.10 3.02 2.80
Net NPA/Net Advances 0.73 0.77 0.97 1.05 1.01
Provisioning Burden as % of PPP 15.24 13.66 15.83 12.81 10.41
Provisioning Coverage Ratio 80.36 76.78 8/1/2014 65.09 63.88
Slippage ratio (%) 1.38 1.41 1.56 1.50 1.30
Provis. Exp. to Avg. Advance (%) 0.67 0.66 0.84 0.68 0.56
RoA Tree Analysis
NII / Avg. Assets 2.40 2.70 2.91 3.06 3.12
Core Fee / Avg. Assets 1.21 1.06 1.12 1.27 1.28
Core Rev. / Avg. Assets 3.61 3.77 4.03 4.33 4.40
Ope. Exp. / Avg. Assets 1.75 1.76 1.82 1.95 1.99
Cost to Income 43.05 40.58 38.32 38.93 38.79
Emp. cost / Avg. Assets 0.79 0.76 0.75 0.76 0.77
Oprt. Exp. / Avg. Assets 0.97 1.00 1.08 1.19 1.23
Core OP/ Avg. Assets 1.86 2.01 2.21 2.37 2.40
Trading & Ot/ Avg. Assets 0.46 0.56 0.72 0.69 0.74
OP/ Avg. Assets 2.32 2.57 2.93 3.07 3.14
Provisions / Avg. Assets 0.35 0.35 0.46 0.39 0.33
NPA prov. / Avg. Assets 0.22 0.27 0.32 0.30 0.28
PBT / Avg. Assets 1.97 2.22 2.47 2.67 2.82
Tax / Avg. Assets 0.52 0.60 0.73 0.84 0.87
Effective Tax Rate 26.56 26.95 29.77 31.50 31.00
RoA 1.44 1.62 1.73 1.83 1.94
Leverage (x) 8.10 8.05 8.12 8.25 8.11
RoE 10.70 12.48 13.40 14.22 14.72
Capital Adequacy Ratio (%)
Total CAR 19.60 16.81 17.25 16.18 15.50
Tier 1 12.80 11.53 12.34 12.05 12.06
Source: Company, Karvy Institutional Research

Institutional Equities Team Rahul Sharma
Head – Institutional Equities /
Research / Pharma +91-22 61844310/01 [email protected]
Gurdarshan Singh Kharbanda Head - Sales-Trading +91-22 61844368/69 [email protected]
INSTITUTIONAL RESEARCH
Analysts Industry / Sector Desk Phone Email ID
Mitul Shah Automobiles/Auto Ancillary +91-22 61844312 [email protected]
Parikshit Kandpal Infra / Real Estate / Strategy/Consumer +91-22 61844311 [email protected]
Rajesh Kumar Ravi Cement/ Logistics/ Paints +91-22 61844313 [email protected]
Rupesh Sankhe Power/Capital Goods +91-22 61844315 [email protected]
Asutosh Mishra Banking & Finance +91-22-61844329 [email protected]
Varun Chakri Research Associate +91 22 61844326 [email protected]
Vinesh Vala Research Associate +91 22 61844325 [email protected]
INSTITUTIONAL SALES
Celine Dsouza Sales +91 22 61844341 [email protected]
Edelbert Dcosta Sales +91 22 61844344 [email protected]
INSTITUTIONAL SALES TRADING & DEALING
Aashish Parekh Institutional Sales/Trading/ Dealing +91-22 61844361 [email protected]
Prashant Oza Institutional Sales/Trading/ Dealing +91-22 61844370 /71 [email protected]
Pratik Sanghvi Institutional Dealing +91-22 61844366 /67 [email protected]
For further enquiries please contact:
Tel: +91-22-6184 4300
Disclosures Appendix
Analyst certification
The following analyst(s), who is (are) primarily responsible for this report, certify (ies) that the views expressed
herein accurately reflect his (their) personal view(s) about the subject security (ies) and issuer(s) and that no part of
his (their) compensation was, is or will be directly or indirectly related to the specific recommendation(s) or views
contained in this research report.
Disclaimer
The information and views presented in this report are prepared by Karvy Stock Broking Limited. The information
contained herein is based on our analysis and upon sources that we consider reliable. We, however, do not vouch for
the accuracy or the completeness thereof. This material is for personal information and we are not responsible for any
loss incurred based upon it. The investments discussed or recommended in this report may not be suitable for all
investors. Investors must make their own investment decisions based on their specific investment objectives and
financial position and using such independent advice, as they believe necessary. While acting upon any information
or analysis mentioned in this report, investors may please note that neither Karvy nor Karvy Stock Broking nor any
person connected with any associate companies of Karvy accepts any liability arising from the use of this information
and views mentioned in this document.
The author, directors and other employees of Karvy and its affiliates may hold long or short positions in the above
mentioned companies from time to time. Every employee of Karvy and its associate companies are required to
disclose their individual stock holdings and details of trades, if any, that they undertake. The team rendering
corporate analysis and investment recommendations are restricted in purchasing/selling of shares or other securities
till such a time this recommendation has either been displayed or has been forwarded to clients of Karvy. All
employees are further restricted to place orders only through Karvy Stock Broking Ltd. This report is intended for a
restricted audience and we are not soliciting any action based on it. Neither the information nor any opinion
expressed herein constitutes an offer or an invitation to make an offer, to buy or sell any securities, or any options,
futures nor other derivatives related to such securities.
Karvy Stock Broking Limited Institutional Equities
Office No. 701, 7th Floor, Hallmark Business Plaza, Opp.-Gurunanak Hospital, Mumbai 400 051 Regd Off : 46, Road No 4, Street No 1, Banjara Hills, Hyderabad – 500 034.
Karvy Stock Broking Research is also available on: Bloomberg - KRVY <GO>, Thomson Publisher & Reuters.
Stock Ratings Absolute Returns Buy : > 15% Hold : 5 - 15% Sell : < 5%