Augmate Corporation Valuation Report
33
Augmate Corporation Valuation Report Valuation Date as of: January 1, 2016 Prepared For: Augmate Corporation 335 Madison Ave, 16th Floor New York, NY 10017 Prepared By: Greener Equity
Transcript of Augmate Corporation Valuation Report

Augmate Corporation
Valuation Report
Valuation Date as of: January 1, 2016
Prepared For: Augmate Corporation 335 Madison Ave, 16th Floor New York, NY 10017
Prepared By: Greener Equity
A u g m a t e C o r p o r a t i o n 4 0 9 A V a l u a t i o n
Page 1
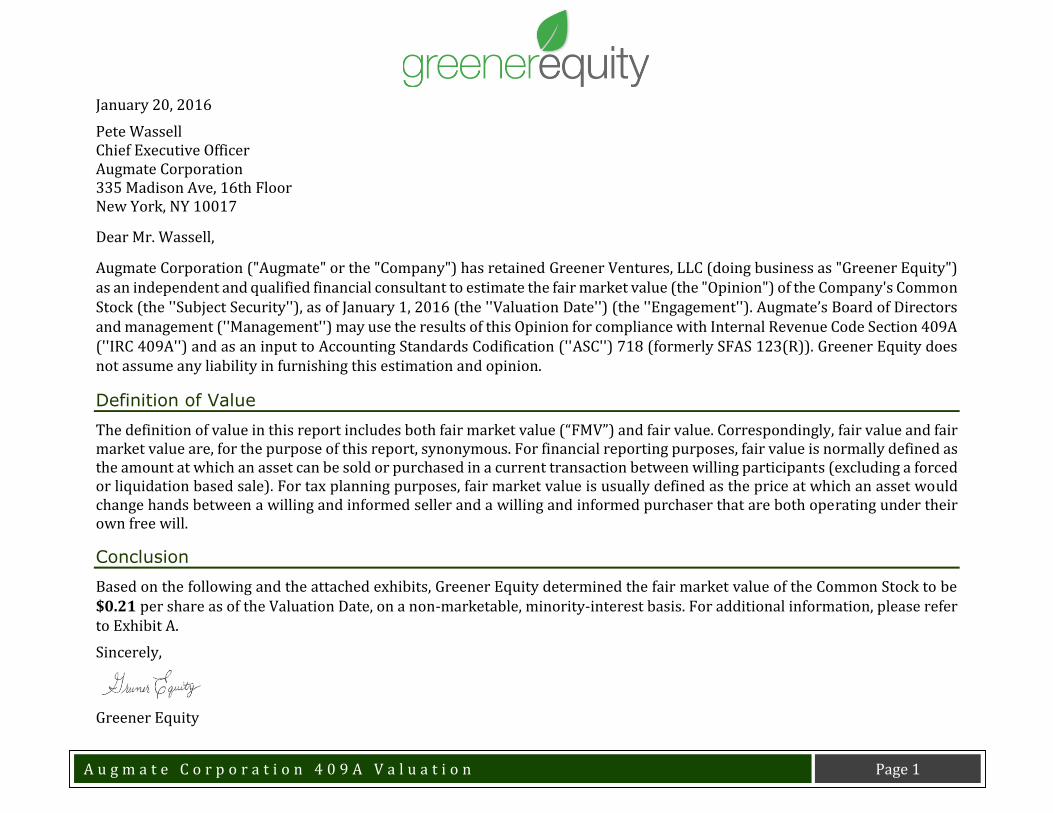
January 20, 2016
Pete Wassell Chief Executive Officer Augmate Corporation 335 Madison Ave, 16th Floor New York, NY 10017
Dear Mr. Wassell,
Augmate Corporation ("Augmate" or the "Company") has retained Greener Ventures, LLC (doing business as "Greener Equity") as an independent and qualified financial consultant to estimate the fair market value (the "Opinion") of the Company's Common Stock (the ''Subject Security''), as of January 1, 2016 (the ''Valuation Date'') (the ''Engagement''). Augmate’s Board of Directors and management (''Management'') may use the results of this Opinion for compliance with Internal Revenue Code Section 409A (''IRC 409A'') and as an input to Accounting Standards Codification (''ASC'') 718 (formerly SFAS 123(R)). Greener Equity does not assume any liability in furnishing this estimation and opinion.
Definition of Value
The definition of value in this report includes both fair market value (“FMV”) and fair value. Correspondingly, fair value and fair market value are, for the purpose of this report, synonymous. For financial reporting purposes, fair value is normally defined as the amount at which an asset can be sold or purchased in a current transaction between willing participants (excluding a forced or liquidation based sale). For tax planning purposes, fair market value is usually defined as the price at which an asset would change hands between a willing and informed seller and a willing and informed purchaser that are both operating under their own free will.
Conclusion
Based on the following and the attached exhibits, Greener Equity determined the fair market value of the Common Stock to be $0.21 per share as of the Valuation Date, on a non-marketable, minority-interest basis. For additional information, please refer to Exhibit A.
Sincerely,
Greener Equity
A u g m a t e C o r p o r a t i o n 4 0 9 A V a l u a t i o n
Page 2
TABLE OF CONTENTS
PART I: EXHIBITS ................................................................................................................... 3
Exhibit A: Probability-weighted Value Conclusion ..................................................................................................................4
Exhibit B: Fair Market Value Summary ..............................................................................................................................5
Exhibit C: Option Pricing Method .....................................................................................................................................6
Exhibit D: Recent Financing Summary ...............................................................................................................................7
Exhibit E: Discount for Lack of Marketability - Differential Put ...................................................................................................8
Exhibit F: Market Comparables - Guideline Public Company Multiples ........................................................................................9
Exhibit G: Market Comparables - Guideline Public Company Financial Analysis ........................................................................... 10
Exhibit H: Capitalization Table ...................................................................................................................................... 11
PART II: NARRATIVE REPORT .................................................................................................... 12
A. COMPANY, INDUSTRY, & ECONOMIC OVERVIEW .................................................................................................................. 13
B. VALUATION METHODOLOGIES AND ASSUMPTIONS ................................................................................................................ 18
C. VALUING THE SUBJECT SECURITY .................................................................................................................................. 22
D. PROFESSIONAL QUALIFICATIONS ................................................................................................................................... 27
E. INFORMATION SOURCES AND LIMITING CONDITIONS .............................................................................................................. 29
F. APPRAISAL CERTIFICATION .......................................................................................................................................... 32

A u g m a t e C o r p o r a t i o n 4 0 9 A V a l u a t i o n
Page 3
PART I: EXHIBITS

A u g m a t e C o r p o r a t i o n 4 0 9 A V a l u a t i o n
Page 4
Exhibit A: Probability-weighted Value Conclusion
Augmate Corporation Exhibit A
Valuation of Augmate Corporation Common Stock
Valuation Date: January 1, 2016
Probability-weighted Value Conclusion
Scenario Description
Concluded Value
Per Share
Probability of
Occurrence¹
Going Concern
The business is successful in developing
and commercializing its product and
continues operating through the stated
term to exit as an on-going business.
$0.57 55.0%
Dissolution
The business continues for a certain
period of time, does not successfully
commercialize its product, discontinues
operations and Common Stockholders
receive no value.
$0.00 45.0%
Probability-Weighted Value Conclusion (Marketable Basis) $0.31
Less: Discount for Lack of Marketability 32.0%
Probability-Weighted Value Conclusion (Non-Marketable Basis) $0.21
Notes
¹ Based on studies by the Kauffman Foundation that seed stage and early stage companies have an average failure rate of
approximately 45.0%

A u g m a t e C o r p o r a t i o n 4 0 9 A V a l u a t i o n
Page 5
Exhibit B––: Fair Market Value Summary
Augmate Corporation Exhibit B
Valuation of Augmate Corporation Common Stock
Valuation Date: January 1, 2016
Fair Market Value Summary
Valuation Approach Valuation Method
Implied Equity
Value Weighting Weighted Value
Market Approach Backsolve Method $12,206,795 100% $12,206,795
Estimated Fair Market Value of Equity $12,206,795
A u g m a t e C o r p o r a t i o n 4 0 9 A V a l u a t i o n
Page 6
Exhibit C: Option Pricing Method
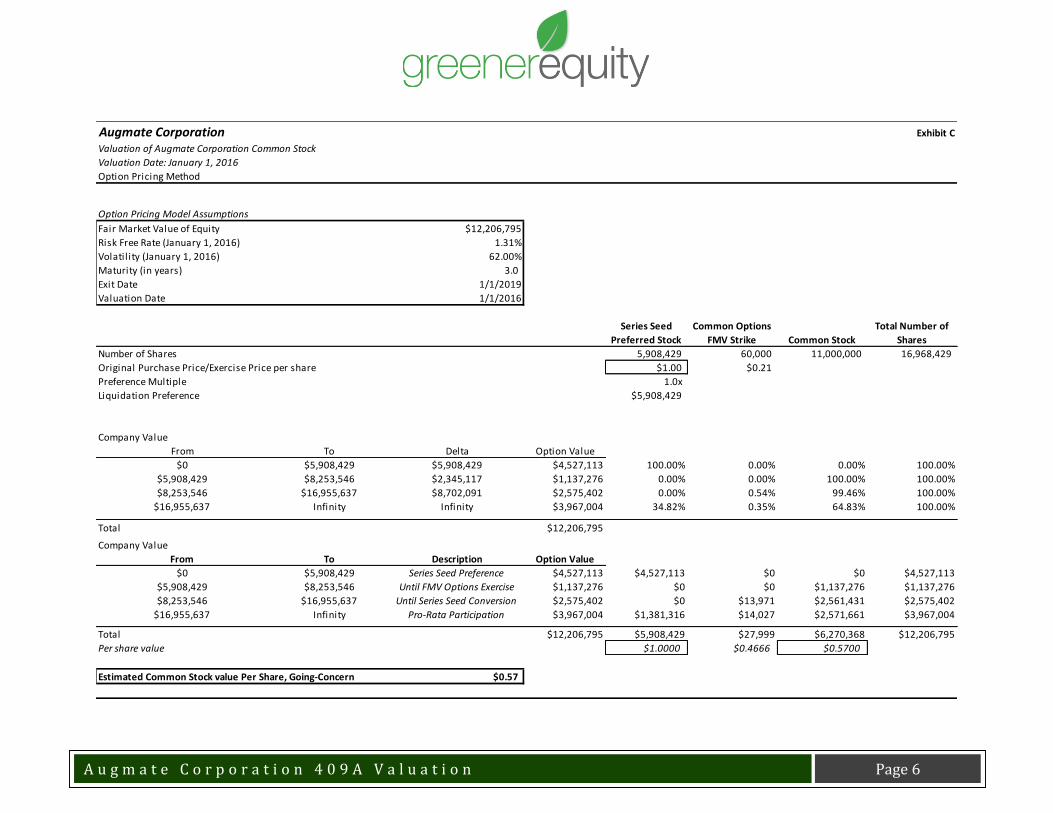
Augmate Corporation Exhibit C
Valuation of Augmate Corporation Common Stock
Valuation Date: January 1, 2016
Option Pricing Method
Option Pricing Model Assumptions
Fair Market Value of Equity $12,206,795
Risk Free Rate (January 1, 2016) 1.31%
Volatil ity (January 1, 2016) 62.00%
Maturity (in years) 3.0
Exit Date 1/1/2019
Valuation Date 1/1/2016
Series Seed
Preferred Stock
Common Options
FMV Strike Common Stock
Total Number of
Shares
Number of Shares 5,908,429 60,000 11,000,000 16,968,429
Original Purchase Price/Exercise Price per share $1.00 $0.21
Preference Multiple 1.0x
Liquidation Preference $5,908,429
Company Value
From To Delta Option Value
$0 $5,908,429 $5,908,429 $4,527,113 100.00% 0.00% 0.00% 100.00%
$5,908,429 $8,253,546 $2,345,117 $1,137,276 0.00% 0.00% 100.00% 100.00%
$8,253,546 $16,955,637 $8,702,091 $2,575,402 0.00% 0.54% 99.46% 100.00%
$16,955,637 Infinity Infinity $3,967,004 34.82% 0.35% 64.83% 100.00%
Total $12,206,795
Company Value
From To Description Option Value
$0 $5,908,429 Series Seed Preference $4,527,113 $4,527,113 $0 $0 $4,527,113
$5,908,429 $8,253,546 Until FMV Options Exercise $1,137,276 $0 $0 $1,137,276 $1,137,276
$8,253,546 $16,955,637 Until Series Seed Conversion $2,575,402 $0 $13,971 $2,561,431 $2,575,402
$16,955,637 Infinity Pro-Rata Participation $3,967,004 $1,381,316 $14,027 $2,571,661 $3,967,004
Total $12,206,795 $5,908,429 $27,999 $6,270,368 $12,206,795
Per share value $1.0000 $0.4666 $0.5700
Estimated Common Stock value Per Share, Going-Concern $0.57

A u g m a t e C o r p o r a t i o n 4 0 9 A V a l u a t i o n
Page 7
Exhibit D: Recent Financing Summary
Augmate Corporation Exhibit D
Valuation of Augmate Corporation Common Stock
Valuation Date: January 1, 2016Recent Financing Summary
Fully Diluted Share Count¹ 16,908,429 (a)
Aggregate Equity Preferences ² $5,908,429 (b)
Series Seed Preferred Stock
As-Converted Share Count 5,908,429 (c)
Ownership Percentage 34.9% (d), c/a
Aggregate Purchase Amount $5,908,429 (e)
Preference Valuation $5,908,429 b
Post-Money Valuation $16,908,429 e/d
Case Method Valuation
Low Preference³ $5,908,429
Expected Backsolve⁴ $12,206,795
High Post-Money⁵ $16,908,429
Selected Method $12,206,795
Notes
¹ Includes all reserved shares or equity plans, as applicable.
² Summation of all priority claims of equity holders. See Exhibit C.
³ The "Preference Method" gives the total equity value under a scenario in
which all preferred shares are equal in value to their respective issue prices
with zero value left over for common stock.
⁴ Please refer to Exhibit C for the Backsolve Method. This method util izes a
Black Scholes option pricing framework to allocate value to each class of
shares. The total equity Value is then derived through an iterative
calculation that finds the total equity value that would justify the price per
share paid by preferred shareholders in a recent round of preferred stock.
⁵ The Post-Money Method uses the simplified assumption that each share of
equity is worth the price paid in the recent preferred round. Given the
differences in economic rights between preferred and common shares, the
actual equity value should in theory be lower than the Post-Money
valuation.
A u g m a t e C o r p o r a t i o n 4 0 9 A V a l u a t i o n
Page 8
Exhibit E: Discount for Lack of Marketability - Differential Put
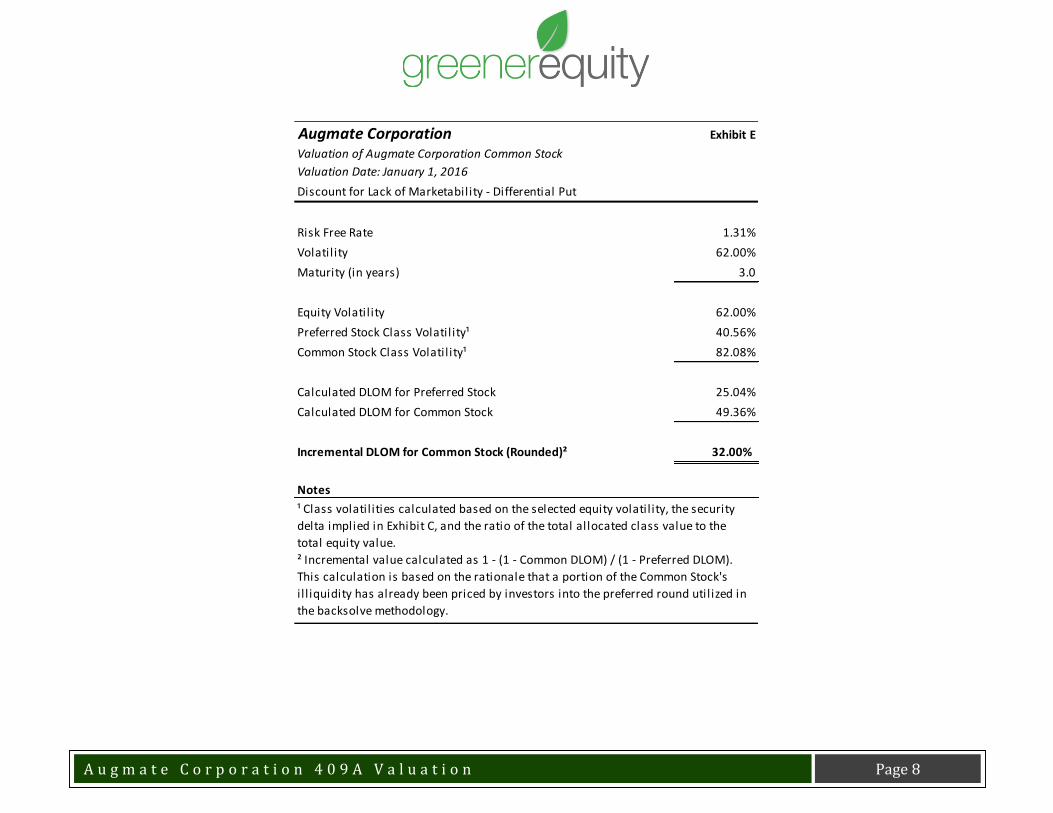
Augmate Corporation Exhibit E
Valuation of Augmate Corporation Common Stock
Valuation Date: January 1, 2016
Discount for Lack of Marketability - Differential Put
Risk Free Rate 1.31%
Volatil ity 62.00%
Maturity (in years) 3.0
Equity Volatil ity 62.00%
Preferred Stock Class Volatil ity¹ 40.56%
Common Stock Class Volatil ity¹ 82.08%
Calculated DLOM for Preferred Stock 25.04%
Calculated DLOM for Common Stock 49.36%
Incremental DLOM for Common Stock (Rounded)² 32.00%
Notes
¹ Class volatil ities calculated based on the selected equity volatil ity, the security
delta implied in Exhibit C, and the ratio of the total allocated class value to the
total equity value.
² Incremental value calculated as 1 - (1 - Common DLOM) / (1 - Preferred DLOM).
This calculation is based on the rationale that a portion of the Common Stock's
i l l iquidity has already been priced by investors into the preferred round util ized in
the backsolve methodology.

A u g m a t e C o r p o r a t i o n 4 0 9 A V a l u a t i o n
Page 9
Exhibit F: Market Comparables - Guideline Public Company Multiples
Augmate Corporation Exhibit F
Valuation of Augmate Corporation Common Stock
Valuation Date: January 1, 2016
Market Comparables - Guideline Public Company Multiples
Public Company Financial Analysis In Mill ions of Dollars
Company Symbol Enterprise Value
Historical
Volatility¹
Fitbit Inc. FIT $6,058 80.50%
Garmin Ltd. GRMN 5,948 24.71%
LogMeIn, Inc. LOGM 1,436 41.03%
IntraLinks Holdings, Inc. IL 550 37.66%
MobileIron, Inc. MOBL 192 55.23%
Vuzix Corporation VUZI 107 NM
Kopin Corporation KOPN 93 41.59%
Low 24.71%
25th Percentile 34.43%
Median 41.31%
Average 46.79%
75th Percentile 61.55%
High 80.50%
Selected 62.00%
Notes
¹ Calculated as 3 years of historical volatil ity or since IPO, ending at the Valuation Date.
Source: Capital IQ.

A u g m a t e C o r p o r a t i o n 4 0 9 A V a l u a t i o n
Page 10
Exhibit G: Market Comparables - Guideline Public Company Financial Analysis
Augmate Corporation Exhibit G
Valuation of Augmate Corporation Common Stock
Valuation Date: January 1, 2016
Market Comparables - Guideline Public Company Financial Analysis
Comparable Companies Financial Analysis Size (USD Millions) Growth Rates Profitability Ratios Leverage Ratios Operational Ratios
Company Symbol
Enterprise
Value TTM Revenue
1-year
Historical
Revenue
Growth %
5-year
Historical
Revenue
CAGR %
TTM Gross
Profit Margin
%
TTM EBITDA
Margin %
Total
Debt/Equity
%
Total
Debt/Capital
%
LT
Debt/Capital
%
Fixed Asset
Turnover
Ratio
A/R
Turnover
Ratio
Inventory
Turnover
Ratio
Current
Ratio Quick Ratio
Net Working
Capital %
TTM Rev.
Capex %
TTM Rev.
Fitbit Inc. FIT $6,058.2 $1,516.6 NA NA 47.7% 21.1% 0.0% 0.0% 0.0% NA NA NA 2.56x 1.78x 9.2% (1.7%)
Garmin Ltd. GRMN 5,948.3 2,842.2 0.5% (0.5%) 54.8% 23.2% 0.0% 0.0% 0.0% 6.53x 6.24x 2.65x 2.49x 1.74x 7.4% (2.5%)
LogMeIn, Inc. LOGM 1,435.9 255.4 23.2% 23.1% 87.1% 11.8% 0.0% 0.0% 0.0% 15.85x 18.96x NA 1.60x 1.52x (55.9%) (5.0%)
IntraLinks Holdings, Inc. IL 549.8 272.3 8.5% 9.7% 72.3% 3.9% 27.4% 21.5% 21.3% 14.33x 5.42x NA 1.34x 1.16x (8.7%) (4.9%)
MobileIron, Inc. MOBL 191.8 144.0 17.3% NA 81.2% (56.1%) 0.0% 0.0% 0.0% 36.64x 4.25x 46.81x 1.94x 1.86x (21.8%) (2.5%)
Vuzix Corporation VUZI 107.1 3.1 9.2% (22.1%) 21.5% NA 6.5% 6.1% 5.8% 5.01x 7.81x 1.69x 15.60x 12.96x 93.6% (18.3%)
Kopin Corporation KOPN 92.8 38.1 42.5% (20.5%) 27.0% (55.6%) 0.0% 0.0% 0.0% 8.66x 12.32x 8.55x 9.02x 7.48x 23.8% (2.5%)
Low $92.8 $3.1 0.5% (22.1%) 21.5% (56.1%) 0.0% 0.0% 0.0% 5.01x 4.25x 1.69x 1.34x 1.16x (55.9%) (18.3%)
25th Percentile 107.1 38.1 6.5% (21.3%) 27.0% (55.7%) 0.0% 0.0% 0.0% 6.15x 5.13x 1.93x 1.60x 1.52x (21.8%) (5.0%)
Median 549.8 255.4 13.2% (0.5%) 54.8% 7.8% 0.0% 0.0% 0.0% 11.49x 7.03x 5.60x 2.49x 1.78x 7.4% (2.5%)
Average 2,054.9 724.5 16.9% (2.1%) 55.9% (8.6%) 4.8% 3.9% 3.9% 14.50x 9.17x 14.92x 4.94x 4.07x 6.8% (5.4%)
75th Percentile 5,948.3 1,516.6 28.1% 16.4% 81.2% 21.6% 6.5% 6.1% 5.8% 21.04x 13.98x 37.24x 9.02x 7.48x 23.8% (2.5%)
High 6,058.2 2,842.2 42.5% 23.1% 87.1% 23.2% 27.4% 21.5% 21.3% 36.64x 18.96x 46.81x 15.60x 12.96x 93.6% (1.7%)
Notes
Source: Capital IQ.

A u g m a t e C o r p o r a t i o n 4 0 9 A V a l u a t i o n
Page 11
Exhibit H: Capitalization Table
Augmate Corporation Exhibit H
Valuation of Augmate Corporation Common Stock
Valuation Date: January 1, 2016
Capitalization Table
Total Shares
Outstanding Options¹
Fully Diluted
Shares
% Owned Fully
Diluted
Series Seed Preferred Stock 5,908,429 - 5,908,429 34.82%
Common Stock 11,000,000 60,000 11,060,000 65.18%
Total Shares (Fully Diluted) 16,908,429 60,000 16,968,429 100.00%
Notes
¹ Per Paragraph 6.35 of the AICPA Practice Guide, only options expected to be issued within the next 12 months should be
included in the analysis. As such, we have included 60,000 to-be-issued options and not the entire compensation pool.

A u g m a t e C o r p o r a t i o n 4 0 9 A V a l u a t i o n
Page 12
PART II: NARRATIVE REPORT

A u g m a t e C o r p o r a t i o n 4 0 9 A V a l u a t i o n
Page 13
A. COMPANY, INDUSTRY, & ECONOMIC OVERVIEW
Company Overview
Augmate is an enterprise software solution that enables organizations to quickly and securely scale thousands of wearable devices across their workforce. These wearable devices, in turn, provide insightful visualized data analytics for customers that allow them to monitor and manage wearables from one central location. The Wearable Environment (WE) Platform is a shift in how business information will be delivered, consumed, and understood. Based on information provided by Management, the Company is aiming to build the future of work through an actionable and quantified workforce that drivers the adoption of hands-free wearable technology. The Company is led by Pete Wassell, the Founder and Chief Executive Officer. Mr. Wassell brings experience from his time as Vice President at Augmented Realty for Enterprise Alliance and at IBM as Program Director.
Augmate was founded in July 2013 and is located in New York City, New York.
Industry Overview1
The Business Analytics and Enterprise Software Publishing industry grew steadily over the past five years, with revenue expanding at an estimated 3.9% annualized rate, to total $31.7 billion in 2015. Although revenue contracted substantially from 2009 to 2011, subsequent growth has buoyed the industry over the five-year period. In 2015, revenue is expected to increase 5.3% as small businesses begin investing and large businesses reinvest in their IT infrastructure and software systems, following years of constrained development.
Despite the increasing demand for industry products, when corporate profit plummeted 16.0% in 2008, a painful period of deleveraging dominated the business climate. Consequently, consumer confidence collapsed in 2009 and 2010 and, given constricted profit, businesses postponed or canceled planned software investment, focusing instead on enduring the tough economic climate. As a result, private investment in computers and software, which typically lags a year behind corporate profit changes as companies often take time to adjust to new financial circumstances, fell 4.5% in 2009. Accordingly, demand for business analytics software publishers also fell.
1 Industry Overview information obtained from IBISWorld Industry Report 51121C - Business Analytics & Enterprise Software Publishing in the US, May 2015.

A u g m a t e C o r p o r a t i o n 4 0 9 A V a l u a t i o n
Page 14
However, corporate profit began recovering in 2009, expanding 8.7% before experiencing strong growth of 25.0% in 2010. Rising corporate profit led to increased business investment in computers and software, and as a result, conditions for industry operators have been steadily improving. During the past five years, the number of broadband internet connections in the United States increased an average of 13.8% annually to 323.1 million. Large businesses use business analytics software to analyze data about their sales patterns, customer preferences and other information vital to their performance. Consequently, the widespread adoption of broadband internet increases the availability of such data. Business analytics and enterprise software packages are closely connected to database software systems, with the same software companies dominating both industries.
Developments
Data mining and predictive analytics are the current buzzwords driving research and development in this industry. Data mining is the process of automatically extracting patterns from large data sets by combining statistics, artificial intelligence and database software. Predictive analytics is an emerging software category that can make inferences and forecasts based on the information gathered through data mining. Software companies are particularly interested in developing predictive analytics to be content-neutral, so the software can analyze any type of data set without significant modification. IBM made a very public debut of its progress with this technology when it fielded the Watson computer system on the TV show Jeopardy in 2011. Watson combined predictive analytics, database mining and natural language processing to interpret questions and find answers within textual data in real time.
Software as a Service (SaaS) and the cloud are the other two catchphrases of the industry. The shift towards software delivered online is expected to revolutionize the industry. Replacing the traditional licensing model, the new pay-as-you-go delivery model of software allows business intelligence applications to be deployed outside the companies' firewalls and accessed by any secure internet connection. Software publishers are moving quickly toward cloud computing whereby storage and computing tasks are handled by networked machines (often servers in a data center owned by the service provider). The increased use of the cloud in business analytics and enterprise software is expected to expand some software capabilities that worked exclusively on powerful platforms to include platforms limited by hardware but not by connection speed, such as mobile phones. Major companies are expected to lose licensing revenue as they shift to the lower-cost cloud model, selling services rather than products. They are, nevertheless, expected to embrace the change in order to retain their corporate customers.
Industry Outlook
Revenue for the Business Analytics and Enterprise Software Publishing industry is expected to increase at an annualized rate of 2.6% to $36.0 billion during the five years to 2020. Continued strength in corporate profit will drive this growth, encouraging investment in information technology (IT) infrastructure and a greater focus on small businesses and underserved customers. Thus far, only large enterprises have gained the substantial benefits of a thorough business analysis and well-organized

A u g m a t e C o r p o r a t i o n 4 0 9 A V a l u a t i o n
Page 15
database. These enterprises had the budgets and manpower needed to pursue these products. Customer relationship management (CRM) software is the only major type of business analytics software that has meaningfully entered the small business market, but this trend will change rapidly over the five years to 2020.
In the next five years, small and midsize businesses in a variety of industries will adopt business analytics software in earnest. The benefits this software can provide to retailers demonstrate its usefulness in other industries. Retailers can connect their computer point-of-service (POS) systems in any location to their database, recording detailed information about transactions. Some examples of the data that a POS can report include the payment method used (e.g. cash, check or credit card), the credit card network, what items were purchased, the quantity of items purchased, the time of the transaction, the day of the week, whether coupons were used and if a promotion was in effect. The use of online payment processing software in brick-and-mortar stores as well as e-commerce is expected to encourage the trend of companies' recording consumer trends, to be later analyzed and used for future sales. At the retailer's headquarters, business analysts can use this data to plan more effective product launches, inventory deliveries or promotions. Similar processes can also be applied to supply chain and customer relationship management.
Steady corporate profit growth throughout the next five years will sustain the growth of private investment in computers and software, a key indicator of demand for industry products. In addition, interest rates will remain exceptionally low for the better part of the next five years, while the threat of inflation remains distant. Many large-scale software investments by businesses are partially debt-financed, so low interest rates decrease the effective cost of these investments, thereby increasing industry demand. As interest rates start climbing in 2015 and onward, growth in industry revenue will slow as a result of the rising effective cost of industry products. However, legislation requiring healthcare and investment companies to invest in more robust record-keeping software will ensure that demand for industry products continues to rise through 2020.
The industry will be entering unknown territory as it quickly approaches the land of cloud computing and the Software as a Service model. Cloud computing entails using a network of remote servers hosted on the internet, rather than a local server or personal computer, to store, manage and process data. Software as a service is a delivery method that provides access to software and its functions remotely as a web-based pay-as-you-use service. Microsoft and IBM have already embraced the shift and are expected to lead the industry into the lower-cost cloud model. Companies are expected to focus their research and development efforts on assuring that information based in the cloud is secure, investing heavily in security software.

A u g m a t e C o r p o r a t i o n 4 0 9 A V a l u a t i o n
Page 16
Economic Overview2
In its December 10, 2015 release, the Federal Reserve Bank of San Francisco (the "FRBSF") stated the following:
Real GDP grew at an annual rate of 2.1% in the third quarter, according to the most recent estimate of the Bureau of Economic Analysis. Over the first three quarters of this year, real GDP has expanded at an average rate of 2¼%. This moderate growth pace reflects solid gains in private domestic final purchases, particularly household spending supported by increases in household income, declines in energy prices, and increases in housing and equity prices. However, overall growth has been partially restrained by weakness in net exports, reflecting the effects of recent dollar appreciation and deterioration in foreign economic conditions.
We expect moderate growth to continue into next year, with real GDP rising at an average rate between 2% and 2¼%. Domestic spending should continue to support overall growth, while the adverse impact of dollar appreciation should wane over time.
Labor market conditions strengthened further. The U.S. economy added 211,000 new jobs in November after gaining 298,000 jobs in October, bringing the 6-month moving average of job gains well over 200,000 per month. Since early 2010, 13.2 million jobs have been created.
The unemployment rate was unchanged in November, remaining at 5.0%. Although the labor force participation rate and the employment-to-population ratio remained low, broader indicators of labor-market slack such as the share of total unemployed plus those workers employed part-time for economic reasons and those marginally attached to the labor force have improved. We expect the unemployment rate to decline further through 2016 before returning to its long-run natural rate of about 5%.
Consumer price inflation as measured by the change in the price index of personal consumption expenditures (PCE) was 0.22% in the 12 months ending in October, reflecting steep declines in energy prices. Excluding the volatile food and energy components, core inflation ran at 1¼% in the 12 months ending in October. Both overall and core inflation rates are well below the Federal Reserve’s 2% target. Going forward, we expect the transitory effects of the dollar appreciation and energy prices to diminish and wage growth to strengthen. As a result, inflation should rise gradually toward the 2% target.
Global uncertainty has increased in the last half of the year. Measures of financial uncertainty based on stock market volatility in both the United States (VIX) and the euro area (VSTOXX) rose in response to recent events including the Greece bailout referendum in July, China’s stock market crash in August, and the Paris terrorist attacks in November. However, the levels of
2 Economic overview information obtained from - http://www.frbsf.org/economic-research/publications/fedviews/2015/december/december-10-2015/
A u g m a t e C o r p o r a t i o n 4 0 9 A V a l u a t i o n
Page 17
uncertainty in both the United States and the euro area remained below their prior peaks during the global financial crisis in 2007-09 and the onset of the European debt crisis in 2011.
Since the end of the global financial crisis, both market-based measures of financial uncertainty and economic policy uncertainty in Europe have been more elevated than in the United States. The relatively greater uncertainty has contributed to the euro area’s economic stagnation in recent years, particularly in investment spending.

A u g m a t e C o r p o r a t i o n 4 0 9 A V a l u a t i o n
Page 18
B. VALUATION METHODOLOGIES AND ASSUMPTIONS
Today, most financial analysts rely on three commonly used methods for estimating the value of a company. These include:
The asset or cost method
The market method
The income method
In addition, some analysts utilize a hybrid methodology that combines more than one of the above methods.
Valuation Strategies - Probability-weighted Scenario Method
To establish an estimated fair market value for Augmate's Common Stock, Greener Equity employed a probability-weighted scenario approach in order to properly assess the likelihood that the business will continue to operate on a going concern basis, noting the possibility that the business may not reach a level at which Common Stockholders receive any value. This methodology was selected based on our understanding that forward-looking models, such as the Black-Scholes option pricing model (described later), specifically account for scenarios in which a company continues to exist through a specified term to exit and may not always account for scenarios in which an early-stage company such as Augmate might not reach the assumed exit term.
The probability-weighted scenario approach assumes the following two scenarios:
1. The Company continues to operate on a going concern basis through the assumed exit term; or
2. The Company operates for a certain amount of time but does not survive through the expected exercise term.
In estimating value under the going concern scenario, Greener Equity utilized the methodologies described below to estimate the fair market value of the Company's total equity value. Then, value was allocated using an option pricing method that incorporated a Black-Scholes option valuation model to allocate the value of the Company’s total equity value to each class of shares. A discount for lack of marketability was then applied to the value of the Common Stock under the going concern scenario. The probability of the Company operating through the term in the option pricing model was then estimated, indicating the value conclusion for one share of Common Stock (see Exhibit A).
The following sections will outline the methodology utilized to estimate value under the going concern scenario:
A u g m a t e C o r p o r a t i o n 4 0 9 A V a l u a t i o n
Page 19
Asset or Cost Method
The asset or cost method estimates the fair market value of a business by modifying the asset and liability balances on their balance sheet to the Company's corresponding fair market value. This method is usually derived by first adding up the individual values of a Company's primary assets. The fair market value is then defined as the sum total of the Company's assets minus the sum total of their corresponding liabilities.
As a practical matter, the net/underlying assets method has numerous variations. By inherently assuming that the Company will continue to operate in the foreseeable future, this method utilizes a replacement cost model as a reasonable measure of value. The method operates under the basic assertion that the value of a business should be consistent with the replacement cost of the Company's assets.
Thus, if a Company’s existing assets deliver fewer benefits than new ones as a consequence of functional obsolescence or wear and tear, the value of these assets can be adjusted accordingly. For these reasons, the net/underlying assets method is typically used when determining the value of capital-intensive businesses or holding companies. Consequently, the net/underlying assets method was considered inappropriate for this analysis.
Market Method
The market method to business valuation is historically rooted in the economic principles of competition that suggests that in a free market, buyers will not pay more for a business, and the sellers will not accept less, than the price of a comparable business enterprise. It is similar, in many respects, to the “comparable sales” method that is commonly utilized in real estate appraisals. In the business valuation arena, the market price of the stocks of publicly traded companies engaged in the same or a similar line of business, whose shares are actively traded in a free and open market, can be used as a valid indicator of value when the transactions in which stocks are traded are sufficiently similar to permit meaningful comparison.
Likewise, indicators of value based on specific financial variables can also be extracted from comparable companies. Using these parameters, appropriate valuation multiples can then be developed and applied to reflect significant differences and divergent levels of risks in contrast to the compared companies. The valuation process is also subject to the specific source of the analyzed data. For example, if the multiples applied are generated from actively traded public companies, the resultant value is defined as a marketable, non-controlling interest value. On the other hand, if the multiples are produced from transactional data, the resulting value is defined as a controlling interest value. The resulting multiples are then applied to the relevant financial metrics of the subject company under the guideline public company and guideline transaction methods.
A u g m a t e C o r p o r a t i o n 4 0 9 A V a l u a t i o n
Page 20
According to AICPA business valuation guidelines, a recent securities transaction is also a relevant input for calculating the company’s equity value. Additionally, for financial reporting purposes, fair value is normally defined as the amount at which an asset can be sold or purchased in a current transaction between willing participants (excluding a forced or liquidation based sale). An investor buying the recent round of preferred stock constitutes a willing buyer and the company issuing it is a willing seller. Therefore, the recent round of Series Seed Preferred Stock financing can be used as an input in determining the value of Augmate under the market approach to valuation. Thus, the Backsolve Method was chosen to evaluate the transaction of Augmate's securities because it is viewed as one of the most reliable indicators of value for privately-held companies.
Greener Equity concluded that a market valuation would be appropriate for this analysis and gave it a 100% weighting in the valuation. For additional information, please refer to Exhibits B & C.
Income Method
The income method of business valuation is an estimate of the present value of the estimated future monetary benefits to the Company. Consequently, this method requires a projection of the cash flows that the business is expected to produce. Using the discounted cash flow method (“DCF”), these cash flows are subsequently converted to their present value using a specific discount rate that factors in the time value of money and any measurable level of risks associated with the business. Lastly, depending upon the actual adjustments that are made to the projected cash flows, the resultant interest value may represent either a controlling value or a non-controlling value.
Greener Equity deemed that the income or DCF valuation methodology would not be appropriate for this analysis.
Market Method - Backsolve Method
In the AICPA practice aid for Valuation of Privately-Held-Company Equity Securities Issued as Compensation, the Backsolve Method is accepted as a method that derives the equity value for the company from a transaction involving the company’s own securities. The rights and preferences of each class of equity, market interest rates, industry sector volatility data, and an estimated time period to expiration are all considered and included in an option pricing model. The model then allows for an isolated analysis of the Company’s most recent round of equity financing. The implied price of the most recent round of preferred stock is set to its original issue price and the implied equity value of the Company is then calculated using the solver function in Excel. As such, the model solves for the per-share value of the security placed in the transaction and consequently produces relative values for other securities in the company’s capital structure. Unlike traditional post-money valuations, the Backsolve Method considers the economic rights and preferences unique to each class of stock. Greener Equity weighted the implied Equity Value from the Backsolve Method at 100% in the valuation. For additional information, please refer to Exhibit C.

A u g m a t e C o r p o r a t i o n 4 0 9 A V a l u a t i o n
Page 21
Determination of Total Equity Value
The Market Valuation Methodology produced an approximate Equity Value of $12.21 million (please refer to Exhibit C). Given that, under valuation methodology, fair value techniques should maximize the use of relevant observable inputs (such as the Backsolve Method) and minimize the use of unobservable inputs, we weighted the Market Valuation Methodology at 100%. As such, we estimated an approximate fair market value of equity of $12.21 million. For additional information, please refer to Exhibit B.

A u g m a t e C o r p o r a t i o n 4 0 9 A V a l u a t i o n
Page 22
C. VALUING THE SUBJECT SECURITY
Option Pricing Methodology
Please refer to Exhibit C for the Option Pricing Methodology. This methodology models the value of the various components of an entity’s capital structure as a succession of call options on the proceeds expected from the sale of the business or the pending liquidation of the Company's assets at some future date. Furthermore, this model also treats the fair market value of a security as a function of the current fair market value of the aggregate equity and debt and assumptions based on the securities’ rights and preferences through the use of an option model, such as the Black-Scholes formula shown here:
C0 = S0N(d1) – Xe -rN(d2)
Where:
d1 (ln(S0/X) + (r + σ2)T)/σ√T and d2 = d1 – σ√T
C0 Current call option value;
S0 Current stock price;
N(d) The probability that a random draw from a standard normal distribution will be less than d;
X Exercise price;
r Risk-free rate;
T Time to maturity of option (years);
σ Standard deviation of the annualized continuously compounded rate of return.
The Black-Scholes model supports the premise that an investment in an underlying security that is financed with debt results in a payoff stream that is equivalent to the payoff stream of an option on the security. If the values for the two positions were different, arbitrage would be possible. Hence, the Black-Scholes model provides a reasonable estimate of the option's value.

A u g m a t e C o r p o r a t i o n 4 0 9 A V a l u a t i o n
Page 23
In addition, the valuation of the Subject Security is rooted in the long-standing tenets of option-pricing theory. In short, the Subject Security is basically a call option on the combined debt and equity of the business with an exercise price equal to the principal due to the debt holders plus the liquidation preferences of the preferred securities.
Option Pricing Method Explanation
Our application of the Black-Scholes Option Pricing Model was designed around the following steps:
1. Determine the different levels of equity value (breakpoints)
This step consists of determining different levels of Equity Value, called breakpoints (also known as “waterfall” distribution). Each consecutive breakpoint represents an incremental claim on Augmate’s Equity Value by a certain class of shareholders/option holders triggered by their respective liquidation, participation, and/or conversion rights.
2. Determine the proportion of incremental equity value to be distributed
After calculating the breakpoints, the proportion in which incremental Equity Value would be distributed between consecutive breakpoints is determined.
3. Determine the incremental equity value of each option
Each consecutive breakpoint is considered a strike price in the call options on the Company’s Equity Value. Using the Black-Scholes Option Pricing model, with other inputs as discussed above, the incremental value of each option is calculated.
4. Distribute the incremental equity value
The incremental value of each call option is distributed among different classes of shareholders based on their respective distribution proportion as calculated in Step 3.
Application to the Subject Security
Using the option-pricing model, several input parameters were used to compute the Subject Security's value. This includes the value of the Company’s underlying assets; the collective liquidation preferences of the preferred equity (in the form of the exercise prices); the volatility of the underlying assets; the risk-free rate; as well as the estimated time until the expiration of the option. As of the Valuation Date, Greener Equity assumed the following values:
Indicated Value of Allocated Capital: Approximately $12.21 million on a marketable, majority-interest basis;
Risk Free Rate: Approximately 1.31%, based on the effective 3-year U.S Treasury bond yield as of the Valuation Date;

A u g m a t e C o r p o r a t i o n 4 0 9 A V a l u a t i o n
Page 24
Time to Expiration: Approximately three years estimated to a liquidation event based on discussions with Management and;
Volatility: Approximately 62.0%, based on the 75th percentile historical volatility of the comparable companies' common stock.
Summary of the Capital Structure
As of the Valuation Date, the Company’s capitalization included the following securities:
Series Seed Preferred Stock
Augmate had approximately 5.91 million outstanding shares of Series Seed Preferred Stock with a liquidation preference of $1.00 per share, plus any declared but unpaid dividends. Shareholders had the same voting rights as Common Stock shareholders on an as-converted basis. As of the Valuation Date, the stock was convertible into Common Stock at a 1:1 ratio.
Common Stock
Augmate had approximately 11.00 million outstanding shares of Common Stock. Shareholders had rights to dividends as declared by the Board of Directors, but not before the full payment of dividends to all Preferred Stock shareholders. Shareholders of the Common Stock had full voting rights.
Options on Common Stock
As of the Valuation Date, Augmate did not have any options outstanding on Common Stock. However, there were approximately 60,000 options on Common Stock to be issued in the near future with a strike price equal to the fair market value of the Subject Security as determined by this report. As per paragraph 6.35 of the AICPA practice aid, such options should be included in the option pricing method.
Liquidation Preferences
In the case of an IPO, the sale of the Company, or any other qualifying liquidation event, the above referenced securities share in the liquidation proceeds in the following manner:
1) Prior and in preference to any other equity security, the holders of the Series Seed Preferred Stock are entitled to receive an amount equal to $1.00 per share plus any declared but unpaid dividends.
2) Upon payment of above, any remaining proceeds would be shared ratably among the holders of the Common Stock. 3) The holders of the Series Seed Preferred Stock could elect to forego their preference payments and convert into Common
Stock if such conversion results in higher proceeds.

A u g m a t e C o r p o r a t i o n 4 0 9 A V a l u a t i o n
Page 25
Adjustments for Lack of Marketability
In general, the value of a Company's equity securities typically requires an adjustment to account for the security’s lack of a readily available market in which it can be sold. In addition, practical evidence suggests that the discount for the lack of marketability (of an unregistered, closely held, non-controlling interest) should take into account financial risks, performance issues, resale restrictions, and other potential liabilities. It should also be noted that the Company’s Common Stock and other equity securities have specific restrictions regarding their sale and transferability. Likewise, the Company’s closely held nature and restrictions on its equity securities could make an investment in the Company somewhat undesirable in contrast to investments in otherwise comparable publicly traded securities. These factors limit the potential market for the Company, thus limiting the liquidity of the securities.
Actual evidence of discounting for lack of marketability can be found in private placements of stock by private companies that afterwards went through an IPO of their stock. As a result, the difference between the price at which the privately placed stock was sold and the price at which the stock was later sold to the public (in the IPO) is commonly used to determine the specific discount for a lack of marketability. As a practical matter, there are two factors that tend to affect the size of the discount to cover a lack of marketability: (1) factors that impact the length of the holding period required to locate a buyer and close a sale and; (2) factors that impact the level of risk faced per unit of time during this holding period. In fact, the risk per unit of time is a commonly used measure of volatility of an investment’s total return (i.e., both dividends and capital appreciation). It's also a common measure of the probability that an investment’s actual return will differ from its expected return.
In general, the studies indicate that the greater the risk that an IPO will not take place or will not take place at an anticipated price the lower the stock price in a pre-IPO transaction. Time is the proxy for risk most extensively tested. Other things being equal, the minimum value for a discount on a pre-IPO transaction is around 25%. The discount increases 15 to 20 basis points for every day that separates a pre-IPO transaction from the IPO. When the anticipated liquidity event is five months away, the discount, other things being equal, is estimated to be about 50% to 55%. Although these studies usually say nothing about what the discount should be if a liquidity event is more than five months away, logically the discount would be greater.
The IRS Valuation Guide for Income, Estate and Gift Taxes, Valuation Training for Appeals Officers acknowledges the relationship between value and marketability, stating: “Investors prefer an asset which is easy to sell, that is, liquid.” Additionally, the AICPA Accounting & Valuation Guide, Valuation of Privately-Held-Company Equity Securities Issued as Compensation, states that “Estimating a discount for lack of marketability is challenging, and (no one method) is completely satisfactory in all respects. All put-based methods share the conceptual shortcoming that purchasing a put is not equivalent to purchasing marketability alone because it also limits the downside risk while leaving the upside potential…The strength of these put-based methods is that they

A u g m a t e C o r p o r a t i o n 4 0 9 A V a l u a t i o n
Page 26
appropriately capture the relationship between the duration of the restriction (time) and risk (volatility), and they have been correlated with the limited observable market data.”
Ultimately, a quantitative analysis was performed to determine the appropriate discount for lack of marketability for the various analyses in this report. We used the 75th percentile volatility of the comparable companies, the same volatility used in the Option Pricing Method to assign equity value to the Subject Security (see Exhibits C & F).
Greener Equity calculated a differential put model, given that the pricing in the Backsolve Method accounts for illiquidity to the Series Seed Preferred Stock. The discount implied by the differential put model represents the incremental level of illiquidity between the Series Seed Preferred Stock shares and Common Stock. For more information, see Exhibit E.
Based on this analysis, we estimated an approximate discount of 32.00% for lack of marketability for Augmate's Common Shares. For additional information, please refer to Exhibit E.
The resulting figure was compared to historical studies of lack of marketability discounts (such as restricted stock studies and pre-IPO studies), and found to be reasonable and consistent.

A u g m a t e C o r p o r a t i o n 4 0 9 A V a l u a t i o n
Page 27
D. PROFESSIONAL QUALIFICATIONS
Internal Revenue Bulletin states: “The final regulations also clarify that significant experience generally means at least five years of relevant experience in business valuation or appraisal, financial accounting, investment banking, private equity, secured lending, or other comparable experience in the line of business or industry in which the service recipient operates.” The signor of this report meets the experiential requirements as outlined by the IRS in the previous sentence.
Bryson Lord
A Managing Director of Greener Equity and has over thirteen years of experience in finance and accounting. He started his career at Arthur Andersen in Washington DC. He then implemented two Sarbanes-Oxley certification programs, one at Nextel Communications and the other at Harcourt Education. Bryson then returned to business school, and upon graduating, worked as an investment banker for Bank of America Merrill Lynch in the U.S. and Latin America financial institutions groups. Most recently, he was a Senior Principal at a boutique advisory firm that assists small and medium sized businesses obtain growth capital. He has raised over $3.7 billion in public and private capital offerings. Bryson received a B.S. in Accounting and an M.B.A., both from BYU. He is also a Certified Public Accountant (CPA) and holds the Accredited in Business Valuation (ABV) designation sponsored by the American Institution of Certified Public Accountants (AICPA).
Trent Read
A Managing Director of Greener Equity, Trent has been a CFO of two private equity-backed companies that ranked on Inc. Magazine’s list of fastest growing companies in the country; which he helped guide from their infancy to full liquidity events. He began his career as an Analyst in investment banking with Deutsche Bank helping many consumer and business services companies with public and private equity and debt capital raises as well as mergers and acquisitions. He was then a Senior Financial Analyst for a $200 million business unit of Honeywell. He then returned to investment banking as an Associate and then Vice President at Wachovia Securities and Sagent Advisors respectively. He worked with media, digital media, telecommunications, software/SaaS, and internet infrastructure companies on transactions that varied from multi-billion dollar LBOs to small growth equity capital raises. He was the CFO of OrangeSoda, an online marketing business, which he led to a sale to Deluxe Corp. and then Goal Zero. Trent received his B.A. and M.B.A. from BYU where he was a Hawes Scholar.

A u g m a t e C o r p o r a t i o n 4 0 9 A V a l u a t i o n
Page 28
Dan Gore
A Senior Analyst of Greener Equity, Daniel joined the firm in August of 2015. Prior to joining Greener Equity, Daniel started his career in valuation with Andersen Tax where he worked in the San Francisco office for two years. Daniel has performed valuations of closely-held companies, common stock, intangible assets, and debt instruments for tax and financial reporting purposes. Daniel received his B.S. in Business Management with an emphasis in Finance Magna Cum Laude from BYU.

A u g m a t e C o r p o r a t i o n 4 0 9 A V a l u a t i o n
Page 29
E. INFORMATION SOURCES AND LIMITING CONDITIONS
Information Sources
During the development of this valuation, Greener Equity relied on information provided by the Company's Management and/or information acquired from publicly available sources. In addition, some of Greener Equity's assumptions and conclusions were based on reasonable projections pertaining to future events and/or future financial performances. Consequently, actual and/or future events or results may differ significantly. The principal information sources used in performing this analysis included:
Discussions and correspondence with the Company Management;
Company historical financials and performance as of the Valuation Date;
Company projections;
The Company's capitalization table (as of the Valuation Date);
Company marketing, investment, and business development related materials;
Industry research and data pertaining to the financial performance, value, and future outlook of the Company;
General market data that could affect the financial performance, value, and future outlook of the Company and;
Publicly available information (including financial data) for existing companies that were regarded, in some useful manner, as comparable to the Company.
Greener Equity inherently depended on the completeness and accuracy of the information described above. While Greener Equity did not conduct an independent verification of any information obtained from the Company or other publicly published sources, the information appears to be consistent with current standards of reliability and completeness.
Furthermore, Greener Equity has inquired of Management as to whether there have been any events ("Post Valuation Events") that have occurred from the Valuation Date to the date this report was issued that would provide useful information to the users of this report. Management has affirmed that there have not been any material Post Valuation Events.

A u g m a t e C o r p o r a t i o n 4 0 9 A V a l u a t i o n
Page 30
Statement of Limiting Conditions
The value conclusions related to the Subject Security specified in our appraisal report (the “Analysis”) are governed by the following limiting conditions:
1. No investigation of the legal description or matters, including title or encumbrances, will be made, and the owner’s claim to the Subject Security is assumed to be valid and marketable. Further, unless otherwise specifically indicated, we have made the following assumptions: (i) the Subject Security is free and clear of any liens or encumbrances; (ii) the Subject Security meets full compliance with all applicable federal, state, and local zoning, as well as use, environmental, and similar laws and regulations; and (iii) all licenses, certificates, consents, or other legislative or administrative authority from any local, state, federal government, or private entity have been or can be obtained or renewed for any use on which the value conclusion is based in the Analysis.
2. Greener Equity, Inc. (“Greener Equity”) has relied upon information furnished by others, which is believed to be reliable. We
have not independently verified the accuracy or completeness of the information. 3. During the course of our analysis, we were provided certain financial information, including estimates of cash flow, by
Management. We have not performed an examination, review, or compilation in accordance with standards prescribed by the American Institute of Certified Public Accountants and, therefore, do not express an opinion or offer any form of assurance on the cash flow data or their underlying assumptions.
4. The value conclusions are not intended to represent values for the Subject Security at any date other than the Valuation Date
in the Analysis. We assume no responsibility for changes in market conditions or physical factors that could affect the value of the Subject Security at a later date, or the inability of the owner to sell the Subject Security at the value specified in the Analysis.
5. The Analysis has been prepared solely for the purpose stated, and should not be used for any other purpose or by any other
person/party than to or for whom it is addressed and prepared. Our value conclusions are not intended to represent investment advice of any kind and do not constitute a recommendation as to the purchase price or sale of the Subject Security.
6. Neither the Analysis nor any portion thereof (including, without limitations, any conclusions as to value, the identity of the
appraiser, or the identity of Greener Equity) shall be disseminated to the public or third parties through advertising, public
A u g m a t e C o r p o r a t i o n 4 0 9 A V a l u a t i o n
Page 31
relations, news, sales, mail, direct transmittal, Securities and Exchange Commission disclosure documents, or any other media without the prior written consent and approval of Greener Equity. Possession of the Analysis, or a copy thereof, does not afford the holder the right to publication. The Analysis may not be used without the prior written consent of Greener Equity and the Company.
7. Our engagement team is not required to give further consultation, testimony, or be in attendance in court with reference to
the Subject Security in question or to update any report, recommendation, analysis, conclusion, or other document related to our services, unless additional arrangements are made.
8. Responsible ownership and competent property/asset management are assumed.

A u g m a t e C o r p o r a t i o n 4 0 9 A V a l u a t i o n
Page 32
F. APPRAISAL CERTIFICATION I certify that, to the best of my knowledge and belief: The statements of fact contained in this report are true and correct.
The reported analyses, opinions, and conclusions are limited only by the assumptions and limiting conditions contained
herein, and are my personal, unbiased professional analyses, opinions, and conclusions.
I have no present or prospective interest in the property that is the subject of this report, and no personal interest or bias with respect to the parties involved. I am not aware of any such interest held by Greener Equity or any of the individuals involved in this appraisal.
Our engagement or compensation is not contingent on an action or event resulting from the analyses, opinions, or
conclusions in, or the use of, this report.
Our analyses, opinions, and conclusions were developed, and the report has been prepared, in conformity with the Uniform Standards of Professional Appraisal Practice.
The conclusion of value is based solely on work performed by us or by individuals working under our direction.
Bryson Lord Managing Director Tax ID: 84-1701739 January 20, 2016